A Practical Guide to Handheld Spectrometer Alignment and Verification for Biomedical Research
This article provides a comprehensive framework for researchers, scientists, and drug development professionals to verify and maintain the alignment of handheld spectrometers.
A Practical Guide to Handheld Spectrometer Alignment and Verification for Biomedical Research
Abstract
This article provides a comprehensive framework for researchers, scientists, and drug development professionals to verify and maintain the alignment of handheld spectrometers. It covers foundational principles of spectrometer optics, step-by-step verification procedures using standard reference materials, common troubleshooting scenarios, and advanced validation techniques including machine learning and MTF analysis. The guide is designed to ensure data integrity, improve measurement accuracy, and support compliance in biomedical and clinical research applications.
Understanding Spectrometer Optics and the Critical Need for Alignment
This guide supports research on handheld spectrometer alignment verification, providing troubleshooting and procedures for researchers and drug development professionals.
Core Components and Functions
The four core optical components work together to ensure light is properly prepared, dispersed, and measured.
- Entrance Slit: Controls the amount of light entering the system and defines the optical resolution. A narrower slit provides better resolution but reduces light throughput [1].
- Collimating Mirror: Takes the diverging light from the slit and creates a parallel (collimated) beam, which is essential for accurate dispersion by the diffraction grating [2].
- Diffraction Grating: Disperses the collimated light into its constituent wavelengths. Groove density and blaze angle determine the system's dispersion and efficiency [2] [1].
- Focusing Mirror: Refocuses the dispersed parallel beams of light onto the detector plane or exit slit, creating a sharp spectrum [2].
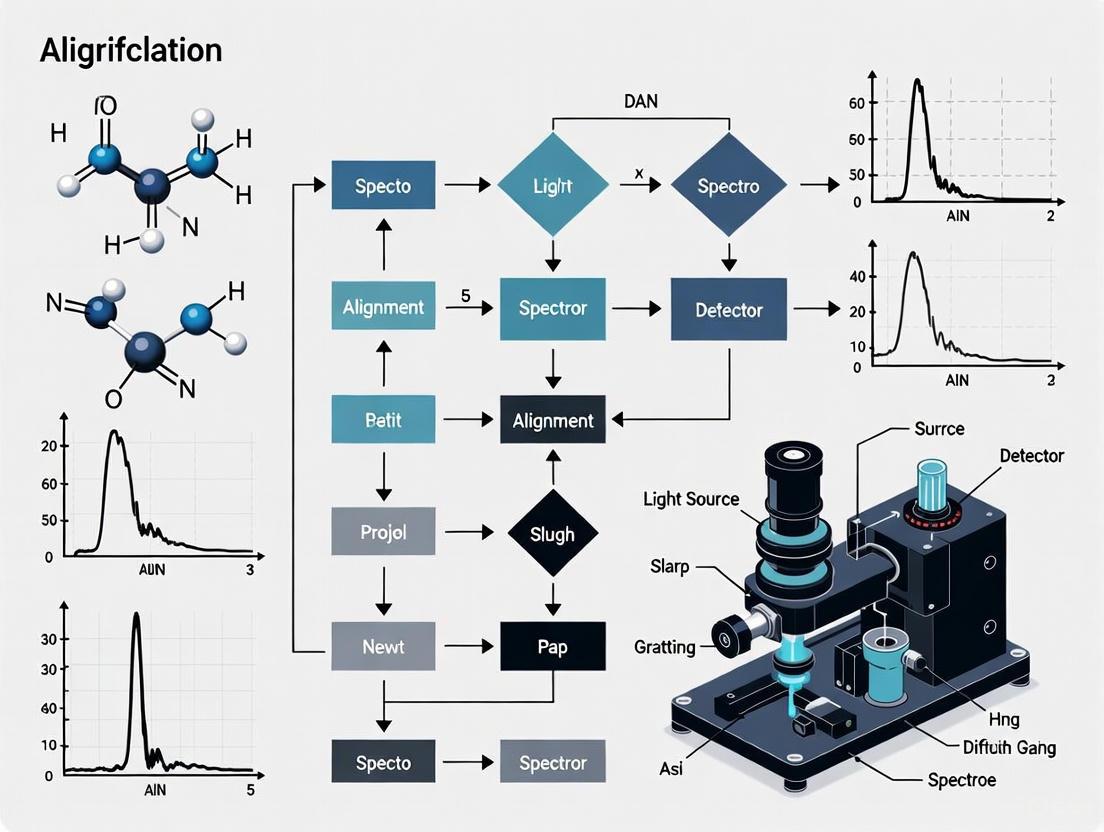
Diagram: Spectrometer Optical Path
Troubleshooting FAQs and Solutions
Q1: My spectrometer shows low signal across all wavelengths. What should I check?
A: Low signal often stems from component misalignment or obstruction.
- Check the Entrance Slit: Ensure it is not mechanically obstructed or dirty. A partially blocked slit severely reduces light intake [3].
- Verify Mirror Alignment: Misaligned collimating or focusing mirrors will not properly handle the light beam. The collimating mirror must perfectly parallelize light toward the grating, and the focusing mirror must correctly image onto the detector [2].
- Inspect the Diffraction Grating: Confirm it is seated correctly in its mount and that the grating is not degraded. Holographic gratings are less susceptible to stray light than ruled gratings [1].
Q2: My spectral resolution has degraded. Which component is most likely at fault?
A: Resolution degradation is frequently linked to the entrance slit or grating.
- Re-verify Slit Width: If the slit mechanism is damaged or has vibrated open, its effective width may have changed, directly impacting resolution [1].
- Assess Grating Performance: Over time or in harsh environments, a grating's efficiency can degrade. Check manufacturer efficiency curves for your model. Consider that ruled gratings typically offer superior efficiency at their blaze wavelength, while holographic gratings produce less stray light [2] [1].
Q3: I observe strange peaks or a high background in my spectrum. What causes this?
A: This is typically a sign of stray light or internal reflections.
- Identify Stray Light Paths: Light may be taking an unintended path due to internal scattering. Baffles within the optical chamber are designed to prevent this. Also, ensure the grating is not being overfilled with light, as this can cause stray light [1].
- Clean Optical Windows: Dirty windows on the fiber optic input or light pipe can cause scattering and poor analysis readings, contributing to a high background. Clean these regularly according to manufacturer guidelines [3].
Experimental Protocol: Alignment Verification
This procedure validates the alignment of a handheld spectrometer's core optical components using a calibrated light source.
Scope
This protocol applies to the alignment verification of handheld spectrometers used for research within a GxP environment, focusing on the slit, collimating mirror, diffraction grating, and focusing mirror [4].
Principle
Alignment is verified by measuring the system's response to reference materials and comparing output against specifications for wavelength accuracy, photometric accuracy, and resolution. This follows an integrated Analytical Instrument Qualification (AIQ) and Computerized System Validation (CSV) approach [4].
Materials and Equipment
- Calibrated Light Source: A tungsten or deuterium lamp with a known, stable spectral output [5].
- Wavelength Standards: Holmium oxide or other NIST-traceable standards for wavelength calibration [5].
- Absorbance Standards: Nickel sulfate solutions for verifying photometric accuracy [5].
- Intralipid Phantoms: Phantoms made from Intralipid solution and methylene blue to simulate tissue scattering and absorption properties for system validation in biomedical applications [6].
Research Reagent Solutions
| Item | Function |
|---|---|
| Holmium Oxide Filter | NIST-traceable standard for validating wavelength accuracy and calibration [5]. |
| Nickel Sulfide Solutions | Used for verifying the photometric accuracy of absorbance measurements [5]. |
| Intralipid 20% Fat Emulsion | Mimics tissue scattering properties; used to validate system performance in biomedical imaging [6]. |
| Methylene Blue Solution | Absorbing agent used with Intralipid to create phantoms simulating a range of tissue optical properties [6]. |
Procedure
Pre-Alignment Setup
- Turn on the spectrometer and light source, allowing a 15-30 minute warm-up for the lamp to stabilize [7].
- Ensure the spectrometer is connected to a stable platform to minimize vibrations [7].
Wavelength Accuracy Verification
- Place the holmium oxide wavelength standard in the light path.
- Acquire a spectrum and identify key emission peaks.
- Compare the measured peak wavelengths to the certified values. The deviation should be within the instrument's specification (e.g., ±1.5 nm) [5].
Resolution and Slit Function Check
- Use a light source with a very narrow emission line (e.g., a low-pressure mercury lamp).
- Measure the Full Width at Half Maximum (FWHM) of the peak. This value, in nanometers, is the instrumental resolution and is primarily controlled by the entrance slit width [5].
Photometric Accuracy Verification
- Using a matched set of cuvettes, measure the absorbance of a series of certified nickel sulfate solutions [5].
- Prepare a proper blank using the same solvent for the blank measurement [7].
- Compare the measured absorbance values to the known standards. The deviation should be within the instrument's specification (e.g., ±5.0%) [5].
Diagram: Alignment Verification Workflow
Performance Specification Tables
Wavelength Accuracy and Resolution Specifications
| Component | Typical Specification | Verification Standard |
|---|---|---|
| Entrance Slit | Resolution (FWHM): < 3.0 nm [5] | FWHM of mercury emission line |
| Diffraction Grating | Wavelength Accuracy: ±1.5 nm [5] | Holmium oxide filter |
| Overall System | Photometric Accuracy: ±5.0% [5] | Nickel sulfate solutions |
Diffraction Grating Selection Guide
| Grating Type | Key Feature | Best Use Case |
|---|---|---|
| Ruled Reflection | Superior efficiency at design (blaze) wavelength [1] | High light throughput applications at specific wavelengths |
| Holographic Reflection | Reduced stray light [1] | Applications requiring high signal-to-noise ratio and low background |
| Echelle | Highest resolving power and dispersion [1] | Demanding applications like atomic resolution and astronomy |
| Transmission | In-line optical path; easier to clean [2] | Simple spectrographs; limited to transmitting spectral regions |
Troubleshooting Guides
Guide 1: Troubleshooting Spectral Accuracy Issues
Problem: Spectrometer is producing inconsistent or inaccurate analysis results on the same sample.
Explanation: Inaccurate results can stem from various alignment and maintenance issues. Misalignment affects the instrument's ability to correctly measure light intensity and wavelength, directly compromising data integrity [3].
Troubleshooting Steps:
- Check for Contaminated Samples: Ensure samples are not contaminated by skin oils, grinding coolants, or other substances. Always use a new grinding pad and avoid touching sample surfaces [3].
- Verify Window Cleanliness: Check and clean the windows in front of the fiber optic and in the direct light pipe. Dirty windows cause instrument drift and poor analysis readings [3].
- Inspect Vacuum Pump (for OES): Monitor for constant low readings for carbon, phosphorus, and sulfur. A malfunctioning vacuum pump can cause these lower-wavelength elements to lose intensity or disappear from the spectrum, leading to incorrect values [3].
- Recalibrate the Instrument: Perform a recalibration using a properly prepared sample. Follow the software's recalibration sequence precisely, without deviation. Analyze the first sample five times in a row; the relative standard deviation (RSD) should not exceed 5 [3].
Guide 2: Addressing Signal and Baseline Problems
Problem: The spectrometer has low signal intensity or an unstable baseline.
Explanation: Low signal and baseline instability are often related to optical misalignment, environmental factors, or component failure. These issues prevent the detector from receiving a stable, strong signal [8].
Troubleshooting Steps:
- Perform Instrument Alignment: Use the software's alignment function. Ensure the system has been powered on for at least one hour for temperature stabilization before aligning [8].
- Check Environmental Conditions: Verify that humidity is within specifications. Check the humidity indicator and replace the desiccant if needed. A stable environment is crucial for a stable baseline [8] [9].
- Inspect Optical Components: Check sample compartment windows for fogging and ensure all accessories are correctly installed and aligned [8].
- Verify Warm-Up and Purge Times: After opening the instrument cover, allow it to purge for 10-15 minutes after closing. For cooled detectors, allow at least 15 minutes for the detector to cool [8].
Frequently Asked Questions (FAQs)
Q1: What are the most critical parameters to control for ensuring spectral accuracy in hyperspectral imaging? A systematic study identified eight key parameters that significantly impact spectral accuracy [10]. Their effects and mitigation strategies are summarized below:
| Parameter | Impact on Spectral Accuracy | Effective Mitigation Strategy |
|---|---|---|
| Ambient Light | Significant spectral distortion | Perform measurements in a dark room; normalization is less effective [10]. |
| Camera Warm-Up Time | Introduces spectral noise | Warm up light sources and cameras for one hour; normalization is less effective [10]. |
| Exposure Time | Low exposure causes spectral noise | Maximize signal without saturating any spectral band [10]. |
| Spatial Averaging | Small region of interest (ROI) increases noise | Use a larger ROI for spatial averaging [10]. |
| Camera Focus | Affects spectral measurement | Ensure the system is in correct focus [10]. |
| Working Distance | Changes spectral response | Keep a fixed, optimized working distance [10]. |
| Illumination Angle | Alters spectral signature | Control and fix the angle of illumination [10]. |
| Target Angle | Alters spectral signature | Keep the target perpendicular to the optical axis (0°) [10]. |
Q2: How does a misaligned lens affect my data? A misaligned lens fails to focus correctly on the light's origin. This means the instrument cannot collect the full intensity of light, leading to highly inaccurate readings because the core measurement is based on light intensity. It is analogous to a camera flash aimed away from the subject, resulting in a dark and unusable photo [3].
Q3: What is the consequence of stray light on my spectrophotometric measurements? Stray light, or "Falschlicht," is light of wavelengths outside the monochromator's bandpass that reaches the detector. It is a critical error, especially at the ends of the instrument's spectral range. Stray light causes significant deviations in transmittance and absorbance readings, leading to false concentration calculations and poor data integrity [11].
Q4: How can I verify the wavelength accuracy of my instrument? Wavelength accuracy is a fundamental spectral characteristic. Verification methods depend on your equipment [11]:
- Using Emission Lines: The most accurate method is to use the known emission lines of a deuterium or other line source.
- Using Absorption Bands & Filters: If an emission source is unavailable, you can use materials with sharp, known absorption bands (e.g., holmium oxide solution or glass) or special interference filters with a certified transmission maximum.
The Scientist's Toolkit: Key Research Reagent Solutions
The following standards and materials are essential for verifying instrument performance and conducting reliable experiments.
| Item | Function & Application |
|---|---|
| Holmium Oxide (HoO) Solution/Glass | Provides sharp, known absorption bands for verifying the wavelength accuracy of a spectrophotometer [11]. |
| Didymium Glass Filter | A traditional, though less precise, filter with wide absorption bands for basic wavelength checks [11]. |
| Neutral Density Absorbing Solid Filters | Used with master instruments to test the photometric linearity and performance of other spectrophotometers [11]. |
| Certified Diffuse Reflectance Targets | Targets with validated reflectance spectra (e.g., White, Red, Erbium Oxide) are critical for characterizing and validating the performance of Hyperspectral Imaging (HSI) systems [10]. |
| Potassium Dichromate & Chromate Solutions | Historically used in inter-laboratory comparisons to test for photometric accuracy and stray light, revealing high coefficients of variation among labs [11]. |
| VB124 | VB124, CAS:2230186-18-0, MF:C23H23ClN2O4, MW:426.9 g/mol |
| GF 15 | GF 15, MF:C23H21ClO6, MW:428.9 g/mol |
Experimental Protocol: Machine Learning-Assisted Spectrometer Alignment
This protocol, adapted from research at the BESSY II beamline, details a method to reduce alignment time from one hour to under five minutes using a surrogate neural network model [12].
Objective: To automate the alignment of a soft X-ray spectrometer by determining the optimal position of its optical components (a Reflection Zone Plate, RZP) relative to the sample and detector.
Workflow: The diagram below illustrates the four-step process, combining offline simulation with real-world optimization.
Detailed Methodology:
Simulation (Offline): An in-house, GPU-accelerated ray-tracing software (RAYX) is used to simulate the spectrometer setup. A large dataset (one million simulations) is generated by systematically varying key parameters within their mechanical limits [12]:
- RZP x, y, z positions (e.g., ±5.0 mm)
- Detector xy-coordinate offsets
- Ratio of Manganese to Oxygen (for fluorescence specificity)
- Data augmentation (applying artificial camera offsets and intensity scaling) is used to bridge the simulation-to-reality gap [12].
Neural Network Training (Offline): A deep neural network is trained exclusively on the simulated dataset. The model learns to map the input parameters (positions, offsets, etc.) to the resulting spectral image [12].
Experimental Data Acquisition (Online at Beamline): With the physical spectrometer, 10-25 reference measurements are collected, covering the expected alignment search space [12].
Optimization (Online): An optimizer is deployed to find the seven key parameters that minimize the average difference between the neural network's predictions and the real measurements. The optimized parameters are [12]:
- Absolute x, y, z coordinates of the RZP
- Camera offsets in x and y
- Manganese-to-oxygen ratio
- An overall intensity scaling factor
This method demonstrates that models trained on simulated data can be effectively applied to real-world instruments, drastically reducing alignment time and conserving valuable beam time [12].
Relationship Between Misalignment Types and Data Integrity
The following diagram categorizes common misalignments and operational failures, tracing their direct consequences on spectral data and the resulting risks to research outcomes.
Frequently Asked Questions (FAQs)
1. Why is wavelength accuracy so critical for both quantitative and qualitative spectroscopic analysis?
Wavelength accuracy is fundamental because all quantitative and qualitative methods assume the x-axis (wavelength or wavenumber) of your spectroscopic data is precisely aligned. Without this, regression models and spectral comparison algorithms are invalid, as they rely on the data channels being perfectly aligned with only the y-axis amplitude changing in relation to analyte concentration [13].
2. What are the symptoms of a spatial misalignment in a spectrometer's optical path?
Spatial misalignment can manifest in several ways. For lens-based systems, improper alignment means the lens does not focus on the source of the light, resulting in the collection of light that is not intense enough for accurate results. This leads to highly inaccurate intensity readings. In more complex systems, such as the submillimeter spectrometer DESHIMA 2.0, misalignment can significantly degrade the aperture efficiency, meaning the instrument fails to effectively couple light from the source to the detector [3] [14].
3. How can I verify the intensity readings from my spectrometer are reliable?
Unreliable intensity readings, such as drift or inconsistent values, can stem from several issues. Common culprits include an aging light source (e.g., a lamp that needs replacement), a need for a longer instrument warm-up time, or dirty optics (e.g., sample cuvettes, windows, or lenses). Regular calibration with certified reference standards is essential to ensure intensity accuracy [15].
4. Are there real-time methods to assess spectrometer alignment?
Yes, advanced methods are being developed. One novel approach uses a low-coherence interferometer to generate sinusoidal patterns on the spectrometer's sensor. By analyzing the modulation transfer function (MTF) of these patterns in real-time, researchers can continuously evaluate the alignment and spectral resolution of the instrument during its alignment phase, allowing for immediate corrections [16].
Troubleshooting Guides
Issue 1: Inaccurate Wavelength Calibration
- Symptom: Peaks in your spectrum appear at incorrect wavelengths, leading to misidentification of compounds or inaccurate quantitative results.
- Required Materials: Certified wavelength reference standard relevant to your spectral region (see Table 1).
- Procedure:
- Measure the reference standard using your spectrometer's standard procedure.
- Record the peak positions from the resulting spectrum.
- Compare the measured peak positions to the certified values provided with the standard.
- If the deviations exceed your method's tolerance, perform a wavelength calibration using the spectrometer's software, using the reference standard to align the x-axis.
Issue 2: Drifting or Unstable Intensity Signals
- Symptom: Baseline instability or inconsistent intensity readings for the same sample.
- Required Materials: Clean, certified reference materials for intensity checks, isopropyl alcohol, lint-free wipes.
- Procedure:
- Check the light source: Ensure the spectrometer has warmed up sufficiently. If instability persists, the lamp may be near the end of its life and require replacement [15].
- Inspect and clean optics: Check the sample cuvette for scratches or residue. Clean it thoroughly. Inspect other accessible optical windows (e.g., in front of the fiber optic or in the direct light pipe) and clean them if dirty [3] [15].
- Perform a baseline correction: Execute a full baseline correction or recalibration using the correct reference solution (e.g., a pure solvent blank) [15].
- Verify the environment: Ensure the instrument is on a stable surface, safe from vibrations and temperature fluctuations.
Issue 3: Poor Spatial Focus or Beam Misalignment
- Symptom: Low signal-to-noise ratio, distorted peaks, or a significant loss in sensitivity and aperture efficiency.
- Required Materials: Alignment tools specified by the manufacturer, a cold background source (e.g., liquid nitrogen), a specialized chopper [14].
- Procedure (Based on a advanced astronomical spectrometer method):
- Utilize a sky chopper: Employ a chopper with a small aperture that couples to a cold source (like cold sky or liquid nitrogen).
- Scan the beam: Use a motor-controlled hexapod or alignment mechanism to scan the instrument's beam across the chopper's entrance aperture.
- Find the null point: The configuration that produces the lowest signal on the detectors indicates that the beam is fully coupled to the cold source and not the warm surroundings, signifying optimal alignment [14].
- For lens-based systems: Ensure operators are trained to perform simple lens alignment checks as part of regular maintenance to ensure the lens is focused on the light source [3].
Key Research Reagents and Materials
The following table lists essential reference materials used for the alignment and verification of spectrometer key parameters.
Table 1: Essential Reference Materials for Spectrometer Alignment
| Material Name | Function | Key Application / Spectral Region |
|---|---|---|
| Holmium Oxide (Liquid or Glass) [13] | Wavelength calibration standard | Ultraviolet-Visible (UV-Vis) |
| NIST SRM 2036 [13] | Reflectance wavelength standard | Visible (Vis) and Near-Infrared (NIR) |
| Polystyrene [13] | Wavelength verification standard | Near-Infrared (NIR) |
| Certified Intensity Reference | Reflectance/Transmittance calibration | Verifying y-axis (intensity) accuracy across wavelengths |
Experimental Protocols for Alignment Verification
Protocol 1: Wavelength Axis Verification using Holmium Oxide
This is a standard method for verifying the wavelength accuracy of UV-Vis spectrometers.
- Objective: To verify and correct the wavelength scale of a UV-Vis spectrometer by measuring a holmium oxide reference standard with known, stable absorption peaks.
- Materials:
- Holmium oxide liquid wavelength standard (traceable to NIST SRM 2034) in a sealed quartz cell, or Holmium oxide glass wavelength standard [13].
- UV-Vis spectrometer.
- Appropriate software for calibration.
- Workflow:
- The spectrometer's light source illuminates the holmium oxide standard.
- Light is passed through a monochromator to isolate individual wavelengths.
- The transmitted light is measured by a detector (transducer).
- The intensity data is converted into an absorbance spectrum.
- The certified peak positions (e.g., at 241.5 nm, 279.4 nm, etc. for holmium oxide) are compared to the measured spectrum.
- Any deviation is used by the software to perform a wavelength calibration, ensuring the x-axis is correctly aligned [13] [17].
The following diagram illustrates the core workflow and logical relationships of this verification protocol.
Protocol 2: Real-Time Spatial Alignment using MTF Measurement
This protocol describes a modern method for assessing the spatial and resolution alignment of a spectrometer in real-time.
- Objective: To assess the modulation transfer function (MTF) of a spectrometer in real-time during the alignment process to ensure optimal spatial focus and spectral resolution.
- Materials:
- Spectrometer under test.
- Low-coherence interferometer (e.g., Michelson interferometer).
- Broadband light source matching the spectrometer's range.
- Workflow:
- A broadband light source is directed into the interferometer.
- The interferometer generates an amplitude-modulated spectrum with a sinusoidal pattern; the spatial frequency of this pattern is adjusted by changing the optical path difference (OPD) in the interferometer.
- This modulated light is coupled into the spectrometer being tested.
- The spectrometer's sensor captures the modulated spectrum.
- The modulation contrast is calculated at different spatial frequencies to determine the MTF.
- The MTF curve provides a quantitative measure of the spectrometer's spectral resolution and spatial alignment. Technicians can then adjust the spectrometer's optics while monitoring the MTF in real-time to achieve optimal performance [16].
The logical flow of this advanced alignment technique is summarized below.
Within the framework of handheld spectrometer alignment verification procedure research, understanding the impact of environmental conditions is paramount. For researchers and drug development professionals, ensuring the integrity of spectroscopic data is a foundational aspect of quality control and material identification. The alignment of a handheld spectrometer is not a static setting but is highly susceptible to changes in its operating environment. Factors such as temperature fluctuations, humidity levels, and mechanical shock can induce subtle yet critical misalignments, leading to inaccurate elemental analysis and compromised data integrity. This guide details the specific effects of these environmental factors and provides targeted troubleshooting protocols to maintain optimal instrument performance [18] [19].
FAQ: Environmental Impacts on Spectrometer Alignment
How do temperature fluctuations affect spectrometer alignment? Temperature changes cause materials within the spectrometer to expand or contract. This can shift the position of critical optical components like lenses, mirrors, and gratings, disrupting the precise path that light must travel. Such shifts can lead to calibration drift and inaccurate analysis results, particularly for elements requiring high precision, such as carbon and phosphorus. Furthermore, electronic components are sensitive to temperature, which can alter their electrical properties and contribute to measurement errors [18] [19].
Why is humidity a concern for optical instruments? High humidity can lead to condensation on optical surfaces, such as lenses and windows, scattering light and reducing signal intensity. Over time, it can also promote corrosion of electronic components and metal surfaces. Conversely, very low humidity can increase the risk of static electricity discharge, which can damage sensitive electronics. Both scenarios can degrade the signal-to-noise ratio and destabilize the instrument's calibration [20] [19].
Can mechanical shock really misalign a handheld spectrometer? Yes. Handheld spectrometers are particularly vulnerable to mechanical shock and vibration from being moved and used in the field. Jarring and impacts can loosen fasteners, shift optical components, and damage computer hardware. This often results in intermittent performance issues, a complete loss of alignment, and inconsistent analytical results. The bright light and loud noise during a metal analysis can be symptoms of poor probe contact resulting from misalignment [20] [18].
What are the symptoms of an environmentally-induced misalignment? Key indicators include:
- Drifting Calibration: The instrument requires frequent recalibration.
- Inconsistent Results: Successive tests on the same homogeneous sample yield significantly different values.
- Low Intensity: The instrument reports low light intensity or signal strength.
- Element-Specific Errors: Consistently low or erratic readings for elements sensitive to atmospheric interference, such as Carbon (C), Phosphorus (P), and Sulfur (S), which can also indicate vacuum pump issues [3] [18].
Troubleshooting Guides
Troubleshooting Temperature-Related Drift
- Problem: Analysis results are inconsistent, and the instrument will not hold a stable calibration, especially in environments with fluctuating temperatures.
- Solution:
- Acclimate: Allow the spectrometer to stabilize in the new environment for a recommended period before use.
- Control the Environment: Perform calibration and critical measurements in a temperature-controlled room, if possible.
- Verify: If drift is suspected, recalibrate the instrument using certified reference materials in a stable environment [19].
Troubleshooting Humidity-Related Issues
- Problem: Condensation is visible on optical windows, or the instrument shows signs of corrosion. Analysis may drift more often.
- Solution:
- Inspect and Clean: Regularly inspect and, if necessary, clean the optical windows using approved materials and procedures.
- Use Desiccants: Store the instrument with desiccant packs in its case to control moisture.
- Control Humidity: Operate the instrument in an environment where humidity is maintained between 40% and 60% [3] [19].
Troubleshooting Vibration and Shock Damage
- Problem: The instrument has been dropped or jarred, and now produces erratic results or will not initiate tests properly.
- Solution:
- Visual Inspection: Check for any visible physical damage.
- Functional Check: Run a test on a certified reference material to verify performance.
- Seek Professional Service: If the instrument fails the performance check, contact a qualified service technician for internal inspection and realignment. Annual or semi-annual preventative maintenance is recommended for handheld units to address loosened components from vibration [18].
The following tables summarize the critical environmental parameters and their measurable effects on spectrometer components and output.
Table 1: Environmental Factor Targets and Limits
| Environmental Factor | Target Operating Range | Observed Negative Impact Beyond Range |
|---|---|---|
| Temperature | Controlled, Stable Ambient | Material expansion/contraction, electronic signal drift [19] |
| Relative Humidity | 40% - 60% | Condensation (optical surfaces), corrosion, static discharge [19] |
| Mechanical Shock | Vibration-Free | Physical misalignment of optics, loose fasteners and connectors [18] |
Table 2: Symptom-Based Diagnostic Guide
| Observed Symptom | Potential Environmental Cause | Key Elements Typically Affected |
|---|---|---|
| Frequent calibration drift | Temperature fluctuations, dirty windows from high humidity/dust | All, especially trace elements [3] [19] |
| Low results for C, P, S | Vacuum pump failure (affected by environment/age), dirty optics | Carbon, Phosphorus, Sulfur, Nitrogen [3] |
| High analysis variability | Contaminated argon, unstable temperature/humidity, mechanical shock | All elements [3] [19] |
| Unusual instrument noise/bright light | Probe misalignment from shock or convex surface contact | N/A (Operational failure) [3] |
Experimental Protocols for Alignment Verification
A core aspect of the broader thesis research involves developing robust verification protocols. The following methodology, adapted from studies on material degradation, provides a framework for systematically quantifying the impact of environmental stress on spectrometer alignment.
Protocol: Simulating and Assessing Shock-Variable Environmental Stress
- Objective: To quantitatively determine the effects of combined temperature and humidity shocks on the mechanical and optical alignment stability of a handheld spectrometer.
- Materials:
- Handheld Optical Emission Spectrometer (OES)
- Environmental chamber (or controlled ovens/freezers)
- Certified reference materials (CRMs) for calibration verification
- Data logging software
- Methodology:
- Baseline Measurement: Perform a full instrument calibration and then conduct a minimum of 10 measurements on a stable CRM. Record the mean and standard deviation for key elements (e.g., C, Mn, P, S) to establish a baseline performance metric.
- Stress Application (One Cycle):
- Humidity Phase: Expose the spectrometer to a high-humidity environment (e.g., >80% RH) at a stable, moderate temperature (e.g., +25°C) for 72 hours [20].
- Freezing Phase: Immediately transfer the instrument to a low-temperature freezer (e.g., -20°C) for 24 hours [20].
- Heating Phase: Immediately transfer the instrument to an elevated temperature (e.g., +70°C) for 72 hours in a dry atmosphere [20].
- Post-Stress Verification: After the cycle, without recalibrating, immediately repeat the measurement process from the baseline step. Conduct another 10 measurements on the same CRM.
- Data Analysis: Compare the pre- and post-stress data. Key metrics include the shift in the mean value for each element (indicating bias) and the change in the standard deviation (indicating loss of precision or instability).
- Interpretation: Significant changes in the mean values or a marked increase in standard deviation after one or more shock cycles provide quantitative evidence of environmentally-induced misalignment or performance degradation [20].
Workflow Visualization
The following diagram illustrates the logical workflow for diagnosing and addressing environmental alignment issues, as outlined in this guide.
The Scientist's Toolkit: Research Reagent Solutions
Table 3: Essential Materials for Alignment and Verification Research
| Item | Function in Research Context |
|---|---|
| Certified Reference Materials (CRMs) | Provides a ground truth with known elemental composition to verify spectrometer accuracy and detect calibration drift caused by environmental stress [3]. |
| Handheld Optical Emission Spectrometer (OES) | The primary instrument under test for evaluating the robustness of alignment verification procedures in field conditions [18]. |
| Environmental Chamber | Allows for precise control and cycling of temperature and humidity to simulate various operating and storage conditions in a controlled laboratory setting [20]. |
| Calibration Standards | A set of certified materials used to establish the initial calibration curve for the spectrometer, against which any deviations can be measured [18]. |
| Vibration Test Equipment | Used to simulate the mechanical shocks and vibrations experienced during transportation and field use, quantifying their impact on alignment [18]. |
| K284-6111 | K284-6111, MF:C30H37N3O4S, MW:535.7 g/mol |
| (E/Z)-Mirin | Z-5-(4-Hydroxybenzylidene)-2-imino-1,3-thiazolidin-4-one (Mirin) |
Step-by-Step Alignment Verification Procedures and Reference Standards
Selecting and Using Certified Reference Materials (CRMs) for Wavelength Verification
FAQs on Wavelength Verification and CRMs
1. What is wavelength verification, and why is it critical for handheld spectrometer data integrity?
Wavelength verification is the process of confirming that your spectrometer accurately measures the wavelength of light. Within the context of handheld spectrometer alignment verification procedure research, it is a fundamental check to ensure the instrument's baseline accuracy. Without proper verification, all subsequent data collected for drug development or material analysis is suspect, as shifts in wavelength alignment can lead to incorrect material identification or quantitative results [21] [22].
2. How often should I perform wavelength verification on my spectrometer?
Verification should be performed regularly. The frequency depends on usage, the criticality of your measurements, and operational changes. It is explicitly required following any hardware maintenance or replacement, such as installing a new flow cell [22]. Furthermore, leading pharmacopoeias like the US Pharmacopeia (USP) and European Pharmacopoeia (EP) mandate periodic instrument qualification, which includes wavelength checks, to maintain compliance in regulated environments [21].
3. My wavelength verification test failed. What are the most common causes?
A verification failure indicates a discrepancy between the instrument's reported wavelength and the certified value of the reference material. Common causes include:
- Recent Hardware Changes: As noted in a Waters support article, a common culprit is replacing a component like the flow cell without performing a subsequent calibration [22].
- Optical Misalignment: Physical shocks or prolonged use can misalign the internal optics [3].
- Deteriorating Light Source: The performance of the instrument's lamp can degrade over time, affecting output [23].
- Use of an Incorrect or Unstable CRM: The reference material may be unsuitable for the verification or may have degraded [24].
4. Are there specific CRMs recommended for verifying wavelength accuracy in the far-UV range?
Yes, while Holmium oxide solutions or filters are the most common CRMs for the 240-650 nm range, verification in the far-UV (below 240 nm) requires different materials. For the far-UV range, a Cerium oxide solution is recommended [24]. Specific qualification kits are available that extend verification down to 200 nm using references like Cerium cells [21].
Troubleshooting Guide: Wavelength Verification Failures
The table below outlines common symptoms, their potential causes, and recommended corrective actions.
| Symptom | Potential Cause | Corrective Action |
|---|---|---|
| Verification fails after flow cell replacement | Detector not calibrated post-maintenance [22] | Execute a full system calibration after any hardware change. Ensure the flow cell is filled with a transparent solvent like methanol or water [22]. |
| Consistent drift in low-wavelength elements (C, P, S) | Malfunctioning vacuum pump in optical emission spectrometers [3] | Check pump for leaks, noise, or overheating. Monitor readings for Carbon and Phosphorus as early indicators [3]. |
| General inaccurate or inconsistent analysis | Dirty optical windows or lenses [3] [23] | Clean the windows located in front of the fiber optic cable and in the direct light pipe according to manufacturer guidelines using approved materials [3]. |
| Poor signal intensity or noisy baseline | Contaminated sample or aging light source [3] [23] | Ensure samples are properly prepared and not contaminated by oils or coatings. Inspect and replace the lamp if it is near the end of its service life [3] [23]. |
Experimental Protocol: Executing a Wavelength Accuracy Verification
This protocol provides a detailed methodology for verifying the wavelength accuracy of a spectrophotometer using a holmium oxide CRM, as required by pharmacopoeial standards [21] [24].
1. Principle The instrument's measured peak wavelengths for a holmium oxide solution are compared against its certified values. The difference between the measured and certified values must fall within the instrument's specified tolerance.
2. Research Reagent Solutions
| Item | Function in Protocol |
|---|---|
| Holmium Oxide CRM (Solution or Filter) | Certified reference material with known absorption peaks used to qualify wavelength accuracy across the UV-Vis range (e.g., 240-650 nm) [21] [24]. |
| Spectrophotometer Cuvettes | High-quality, matched cuvettes for holding the reference solution. |
| Lint-Free Wipes | For handling and cleaning optical components without introducing scratches or contaminants [23]. |
3. Procedure
- Instrument Preparation: Power on the spectrophotometer and allow it to warm up for the time specified by the manufacturer to ensure signal stability.
- Baseline Correction: Perform a baseline correction with a blank solvent in the light path.
- CRM Measurement: Place the holmium oxide CRM (in a cuvette or filter holder) in the sample compartment.
- Spectral Acquisition: Acquire an absorption spectrum across the applicable range (e.g., 240-650 nm).
- Peak Identification: Use the instrument's software to identify the measured wavelength of key holmium oxide peaks (e.g., 241.0 nm, 287.5 nm, 361.5 nm, 536.0 nm, etc.).
- Calculation: For each certified peak, calculate the difference: Δλ = Measured Wavelength - Certified Wavelength.
- Acceptance Criteria: The absolute value of Δλ for each peak must be less than or equal to the tolerance specified for your instrument (e.g., ±0.5 nm for UV/Vis, ±1.0 nm for PDA detectors).
Wavelength Verification Workflow
The following diagram illustrates the logical workflow for diagnosing and resolving a wavelength verification failure, incorporating steps from the troubleshooting guide and experimental protocol.
Holmium Oxide and other NIST-Traceable Standards for UV-Vis Alignment
Why is wavelength calibration critical for handheld spectrometer data integrity?
Accurate wavelength calibration is the foundation of reliable spectroscopic data. For handheld spectrometers used in field and quality control settings, verification ensures that measurements like absorbance peaks are recorded at their true wavelengths, which is vital for material identification, quantification, and meeting regulatory requirements in drug development [25]. Proper calibration directly impacts the validity of your alignment verification procedure.
Troubleshooting FAQs
Q1: My handheld spectrometer's reading for the holmium oxide 241.5 nm peak is consistently offset. What could be wrong?
This is a common issue. First, confirm that your holmium oxide standard is certified for the 241.5 nm band, as some filters have a less distinct or absent peak at this wavelength due to variations in the base glass composition [26]. If the standard is valid, the offset likely originates from your instrument.
- Check Instrument Parameters: Ensure the spectral bandwidth (SBW) of your measurement does not exceed 2 nm. Larger bandwidths can cause errors in locating the minimum transmittance due to band asymmetry [26]. Consult your instrument manual for setting a narrower slit width.
- Environmental Factors: While holmium oxide glass is robust and relatively insensitive to normal temperature and humidity ranges, extreme conditions can potentially affect performance [26]. Allow the instrument and standard to acclimate to the laboratory environment.
- Service Required: If the above steps don't resolve the issue and the offset is consistent across multiple peaks, the wavelength drive of your spectrometer may need mechanical adjustment by a qualified service technician [25].
Q2: How can I achieve NIST-traceable calibration below 230 nm if my holmium oxide standard's lowest certified peak is at 241.5 nm?
You can extend traceability to lower wavelengths by using a combination of standards. One established method involves:
- Primary Calibration with Holmium Oxide: First, calibrate your detector using a holmium oxide standard as per the instructions, typically for wavelengths at 241 nm and above [27].
- Secondary Calibration with Caffeine: Next, use a caffeine solution standard. Determine its wavelength bands at 205 nm and 273 nm [27].
- Establishing Traceability: The caffeine band at 273 nm overlaps with the official NIST range established by the holmium oxide. Once your detector is verified at 273 nm, the 205 nm band becomes NIST-traceable by association, allowing you to qualify your detector down to 205 nm [27].
Q3: What does it mean for a standard to be "NIST-traceable," and who is responsible for this claim?
The International Vocabulary of Metrology defines metrological traceability as the "property of a measurement result whereby the result can be related to a reference through a documented unbroken chain of calibrations, each contributing to the measurement uncertainty" [28].
- NIST's Role: NIST provides calibrations and reference materials that are themselves traceable to national standards. They also provide tools and technical information to support the establishment of traceability [28].
- Your Responsibility: The provider of a measurement result (in this case, your laboratory) is responsible for supporting any claim of traceability. This is done by documenting the unbroken chain of calibrations from your working standard (your holmium oxide filter) back to a NIST standard, often through the certificate provided by your supplier [28] [25]. Assessing the validity of such a claim is the responsibility of the users of your data (e.g., regulators, clients).
Experimental Protocol: Wavelength Accuracy Verification with a Holmium Oxide Glass Filter
This protocol provides a step-by-step methodology for verifying the wavelength scale of a UV-Vis spectrophotometer, including handheld spectrometers, using a holmium oxide glass filter.
Scope and Application
This procedure is applicable to verifying the wavelength accuracy of UV-Vis spectrophotometers over the range of 241 nm to 641 nm. It is a key component of a spectrometer alignment verification procedure [26] [25].
Required Materials and Equipment
- Handheld or benchtop UV-Vis Spectrophotometer
- NIST-Traceable Holmium Oxide Glass Wavelength Standard [25]
- Lint-free cloth and lens cleaning solution
Step-by-Step Procedure
- Instrument Preparation: Turn on the spectrometer and allow it to warm up for the time specified by the manufacturer. Set the instrument parameters to a spectral bandwidth of ≤ 2 nm and a moderate scan speed [26].
- Standard Handling: Using lint-free gloves, carefully remove the holmium oxide glass filter from its protective case. Inspect the glass surfaces for fingerprints or dust; clean gently if necessary.
- Blank Measurement: Perform a baseline correction or blank measurement with an empty compartment (or as recommended for the filter type).
- Sample Measurement: Place the holmium oxide filter squarely in the light path of the spectrometer. Initiate a transmission or absorbance scan from approximately 220 nm to 650 nm.
- Peak Identification: From the resulting spectrum, identify the wavelength value (in nm) at the point of minimum transmittance (absorbance maximum) for each major peak. The workflow for this verification process is outlined below.
Data Analysis and Acceptance Criteria
- Compile Data: Record the measured wavelength for each certified peak from your scan.
- Determine Tolerance: Consult your spectrophotometer's manufacturer manual to find the specified wavelength accuracy tolerance (e.g., ± 0.5 nm). Add this manufacturer's tolerance to the expanded uncertainty (typically 0.2 nm, k=2) of the holmium oxide standard [26] [25].
- Compare Values: For each peak, check that the measured value falls within the combined tolerance range of the certified value. Certified values for holmium oxide glass are listed in the table below.
Table 1: Certified Wavelengths for Holmium Oxide Glass Filter (Spectral Bandwidth ≤ 2 nm) [26]
| Band Number | Certified Wavelength (nm) | Expanded Uncertainty (nm, k=2) |
|---|---|---|
| 1 | 241.5 | ± 0.2 |
| 2 | 279.3 | ± 0.2 |
| 3 | 287.6 | ± 0.2 |
| 4 | 333.8 | ± 0.2 |
| 5 | 360.8 | ± 0.2 |
| 6 | 385.8 | ± 0.2 |
| 7 | 418.5 | ± 0.2 |
| 8 | 453.4 | ± 0.2 |
| 9 | 459.9 | ± 0.2 |
| 10 | 536.4 | ± 0.2 |
| 11 | 637.5 | ± 0.2 |
Interpretation of Results
- Pass: If all measured peaks are within the calculated tolerance, the wavelength scale of your instrument is verified and acceptable for use.
- Fail: If any peaks fall outside the tolerance, consult a qualified service technician to adjust and recalibrate the instrument. Document the out-of-specification result and the subsequent corrective actions [25].
The Scientist's Toolkit: Essential Research Reagents & Materials
Table 2: Key Materials for UV-Vis Spectrophotometer Wavelength Verification
| Item | Function & Description |
|---|---|
| Holmium Oxide Glass Filter | Primary solid wavelength standard. Used to verify wavelength scale accuracy across the UV-Vis range (241-641 nm) via its sharp, stable absorption peaks [26] [25]. |
| Holmium Oxide Solution (in Perchloric Acid) | Liquid primary wavelength standard. Provides similar functionality to the glass filter but may exhibit slightly different band positions; not to be used interchangeably with glass certified values [26]. |
| Caffeine Solution Standard | Secondary standard used in combination with holmium oxide to extend NIST-traceable wavelength calibration down to 205 nm [27]. |
| Neutral Density Filters | Used for calibrating the transmittance (photometric) scale of the spectrophotometer. Note: Holmium oxide standards should not be used for transmittance scale calibration [26]. |
| Hydroquinine | Hydroquinine, CAS:23495-98-9, MF:C20H26N2O2, MW:326.4 g/mol |
| Biacetyl monoxime | Biacetyl monoxime, CAS:17019-25-9, MF:C4H7NO2, MW:101.10 g/mol |
### Safety Precautions
Why are specific safety protocols necessary for this alignment procedure? This procedure involves the use of a Class 3B or Class 4 laser [29] [30]. Laser radiation from these classes is powerful enough to cause serious and permanent eye injury and skin burns [30]. The safety protocols below are mandatory to mitigate these risks.
- Laser Protective Eyewear: All personnel in the lab must wear laser safety goggles that are optical density (OD) rated for the specific wavelength of the alignment laser [29] [30]. Eyewear must be clearly labeled with its wavelength and OD [29].
- Controlled Access: The laser work area must be restricted to authorized, trained personnel only [30].
- Beam Path Management: The laser beam path must be enclosed wherever possible and kept above or below eye level to minimize the risk of direct eye exposure [30].
- Warning Signs: Approved laser warning signs must be posted at all entrances to the lab when the laser is in use [29] [30].
- Training: All users must complete general laser safety training and equipment-specific training provided by the Principal Investigator or an experienced user before operating the laser [29].
### Materials and Equipment
Table: Essential Materials for Laser Alignment Procedure
| Item | Specification/Function |
|---|---|
| Laser Pointer | Low-power, visible wavelength (e.g., 635nm or 650nm red). Used as a collimated visual guide for the optical path. |
| Laser Safety Goggles | Optical Density (OD) rated for the specific wavelength of the laser pointer. Protects eyes from accidental exposure [29] [30]. |
| Beam Stops/Attenuators | Dense, opaque material (e.g., anodized aluminum). Safely blocks and absorbs the laser beam during setup and when not in use [30]. |
| Alignment Targets | Cards or papers with a precise crosshair or pinhole. Aids in visualizing and centering the beam through optical components. |
| Optical Breadboard or Table | A stable, vibration-damped surface. Ensures the optical path remains stable during and after alignment. |
### Step-by-Step Alignment Methodology
1. Preparation and Setup * Verify Safety: Ensure all personnel in the lab are wearing the correct laser safety eyewear [30]. Confirm that laser warning signs are displayed [29]. * Clear Path: Remove all unnecessary tools, reflective objects, and optical components from the anticipated beam path. * Position Laser: Securely mount the laser pointer at the starting point of the intended optical path, which is typically at the entrance slit or the source position of the spectrometer.
2. Initial Beam Path Establishment * Define Optical Axis: Using the alignment targets, project the laser beam to define the primary optical axis of your system. The beam should be parallel to the table and at a standard height. * Align to First Component: Position the first optical component (e.g., a mirror or lens). Adjust the component's mounts until the laser beam's center is aligned with the component's optical center, as verified by a target.
3. Sequential Component Alignment * Iterative Alignment: Move to the next optical component in the path. Use an alignment target to center the beam on this component. * Verify Path: After each component is aligned, verify that the beam continues to propagate along the intended path to the final target point, which is typically the spectrometer's detector slit. * Final Target Verification: The alignment is complete when the laser beam is correctly centered on the final target without any obstructions or misalignments along the entire path.
Workflow Diagram
### Troubleshooting Guide
Problem: The laser beam is not visible or is too dim.
- Potential Cause 1: Low battery in the laser pointer.
- Solution: Replace the laser pointer batteries with new ones.
- Potential Cause 2: Incorrect use of laser safety goggles blocking the specific wavelength.
- Solution: Verify that the laser safety goggles are rated for the correct wavelength and have an appropriate Optical Density (OD). Consult the Laser Safety Officer if unsure [29].
Problem: The beam path is unstable or drifts over time.
- Potential Cause 1: Loose mounting or mechanical instability.
- Solution: Check and tighten all mounts for the laser pointer and optical components. Ensure the system is on a vibration-damped table.
- Potential Cause 2: Thermal expansion in the lab.
- Solution: Allow the laser system to warm up for 15-30 minutes before critical alignment. Monitor lab temperature for significant fluctuations.
Problem: The beam does not reach the final target after sequential alignment.
- Potential Cause 1: Cumulative misalignment from multiple optical components.
- Solution: Work backwards from the point of failure. Re-align the last component where the beam was correct, then proceed forward step-by-step.
- Potential Cause 2: A single component is significantly misaligned.
- Solution: Isolate the problem by checking the beam input and output for each component individually.
Problem: The spectrometer analysis results are inaccurate or unstable after alignment.
- Potential Cause 1: Contaminated optical surfaces (e.g., lenses, windows) [3].
- Solution: Inspect and clean all optical windows in the path, including those on the spectrometer itself, using approved materials and techniques [3].
- Potential Cause 2: Improper probe contact or argon contamination in the spectrometer (for certain spectrometer types) [3].
- Solution: Ensure the spectrometer's probe is making correct contact and that the argon supply is pure, as contaminated argon can lead to unstable results [3].
### Frequently Asked Questions (FAQs)
Q1: Can I use any visible laser pointer for this alignment? A: No. You must use a laser that is approved for your specific lab and application. The laser class (3B or 4) dictates the required safety controls. Always consult your Laser Safety Officer before introducing a new laser into the lab [29].
Q2: What should I do if the laser beam is accidentally exposed to someone's eye? A: Immediately turn off the laser. Seek medical attention without delay, even if no immediate symptoms are present. Report the incident to your supervisor and the Environmental Health & Safety department as required by your institution's emergency response protocol [29].
Q3: How often should I perform this alignment procedure? A: The frequency should be determined by the stability requirements of your experiment and the spectrometer's performance. It is recommended before starting a new series of experiments or if you suspect the optical path has been disturbed. Regular verification ensures data integrity in your research.
Q4: Where can I get laser safety training? A: Contact your institution's Environmental Health & Safety or Radiation Safety office. Laser worker safety training is required for all users of Class 3B and Class 4 lasers [29] [30].
### Compliance and Documentation
This procedure is designed to ensure compliance with the ANSI Z136.1 Standard for the Safe Use of Lasers and other relevant safety standards [29] [30]. All laser use must be registered with the appropriate safety office [29]. Principal Investigators are required to maintain records of laser equipment, safety inspections, and user authorizations [29] [30].
Frequently Asked Questions (FAQs)
1. What does "grating order" mean, and why is verifying it important? The diffraction grating in your spectrometer splits incoming light into its constituent wavelengths, creating multiple replicated spectra known as orders. The "first order" is typically the brightest and most commonly used for analysis. Verifying that the correct order (e.g., the first order) is directed onto the detector array is a critical alignment step [31]. An incorrect grating order will result in a spectrum with the wrong wavelengths being measured, leading to inaccurate data and failed calibrations.
2. What are the symptoms of an improperly focused spectrum on the detector? An out-of-focus spectrum on the detector array manifests through several clear symptoms in your data [32]:
- Very Noisy or Unstable Data: The signal appears erratic, with a poor signal-to-noise ratio.
- Low Signal Intensity: The overall signal is weak, which can cause absorbance readings to appear abnormally high (sometimes stuck at 3.0) or fail calibration altogether [32].
- Broadened or Distorted Peaks: Spectral features lose their sharpness, reducing the effective resolution of your instrument.
3. What tools do I need to perform this verification? A successful verification requires a few key tools [31]:
- A Laser Pointer: Used as a coherent light source for initial rough alignment of the optical path.
- A Known Light Source: For final focusing and calibration. A neon or mercury lamp is ideal, as they emit sharp, well-defined spectral lines [31].
- Allen Wrenches/Drivers: Typically 2mm and 4mm, for making precise adjustments to the mirror and grating mounts [31].
- Power Meter (Optional but helpful): For quantitatively measuring the optical power reaching the detector to find the maximum, a technique used in automated alignment systems [33].
4. My spectrum is focused but the wavelengths are incorrect. Is this a grating order issue? Yes, this is a classic sign of a grating order problem. If the grating is rotated to the wrong angle, it will direct a different spectral order (e.g., the second order instead of the first) onto the detector. This means the light detected at a given pixel corresponds to an entirely different wavelength than expected. You must adjust the grating rotation to select the correct order [31].
Troubleshooting Guide
Problem: The spectrum is not focused on the detector, resulting in a weak and noisy signal.
Solution: Perform a detailed alignment of the focusing mirror.
- Gain Access: Ensure you have clear physical access to the adjustment screws on the focusing mirror mount. You may need to remove a cover or the top half of the spectrometer [31].
- Introduce a Light Source: Use your known light source (e.g., a neon lamp) and observe the live output from the detector array in your software.
- Adjust the Mirror: Using the appropriate tools, gently adjust the screws on the focusing mirror mount. The goal is to center the brightest and sharpest image of the spectrum on the active area of the detector array [31].
- Clockwise or counter-clockwise turns on the screws will translate the beam on the detector. The exact effect depends on your spectrometer's optical layout.
- Make small, incremental adjustments and observe the change in signal intensity and sharpness.
- Verify Focus: The spectrum is correctly focused when the signal intensity is maximized and the spectral lines from your known source are at their narrowest.
Problem: The correct grating order is not hitting the detector.
Solution: Adjust the rotational angle of the diffraction grating.
- Initial Check: With a laser pointer or white light source, observe where the diffracted light lands. You can use a blank piece of paper or the palm of your hand held near the detector port to see the beam [31].
- Locate the Grating Mount: Identify the mechanism that allows the grating to rotate. This may be a manual adjuster or a motorized stage.
- Find the Correct Order: Slowly rotate the grating while monitoring the detector's output. You are looking for the position where the most intense and clear spectrum appears. For a white light source, the correct first order should show a smooth continuum from red to violet [31]. For a laser, you will be looking for a specific, bright spot.
- Secure the Grating: Once the correct order is confirmed, securely fasten the grating in place.
This protocol outlines the manual procedure for verifying and aligning the grating order and focus, a critical step in handheld spectrometer verification research.
Objective: To ensure the desired diffraction order is correctly focused onto the detector array for optimal signal intensity and spectral fidelity.
Materials and Reagents:
- Assembled spectrometer prototype
- Laser pointer (e.g., 5 mW)
- Neon or mercury calibration lamp
- Set of Allen wrenches/drivers (e.g., 2mm, 4mm)
- Computer with spectrometer control and data acquisition software
Methodology:
- Safety First: Put on appropriate laser safety glasses before beginning alignment [31].
- Laser-based Path Verification:
- With the top cover of the spectrometer removed, activate the laser pointer and direct its beam through the entrance slit [31].
- Verify the beam is centered on the collimating mirror. Adjust the collimating mirror's screws to center the resulting horizontal line on the diffraction grating [31].
- Observe the beam's reflection from the grating. The goal is to have the beam (representing the diffraction order) land on the center of the focusing mirror [31].
- Grating Order Selection:
- Observe where the beam reflected from the grating lands. Manually rotate the grating until the beam is directed onto the focusing mirror [31].
- For a more precise check, replace the laser with a known light source and rotate the grating while monitoring the software until a strong, well-defined spectrum appears.
- Final Focusing on the Detector:
- With the known light source active and the correct grating order selected, observe the live spectral output in the software.
- Using the adjustment screws on the focusing mirror mount, direct and focus the spectrum onto the center of the detector array. The adjustment is complete when the signal intensity is maximized and the spectral lines are sharp [31].
- Calibration and Validation:
- Using the known light source, perform a wavelength calibration. The observed peaks should match the known emission lines of the source (e.g., a neon lamp has specific peaks at 540.1 nm, 585.2 nm, etc.) [13].
- Record the final signal-to-noise ratio and resolution for your research records.
Research Reagent Solutions
The following standards are essential for the precise calibration and validation of spectrometer alignment.
| Research Reagent | Function in Alignment Verification |
|---|---|
| Holmium Oxide Solution (4% Ho₂O₃ in 10% HClO₄) [13] | A stable liquid wavelength standard with multiple sharp absorption peaks (e.g., 241.5 nm, 287.5 nm) used to calibrate and verify the wavelength (x-axis) accuracy of UV-Vis spectrometers [13]. |
| Holmium Oxide Glass [13] | A solid glass filter containing holmium oxide, traceable to NIST SRM 2034. Used for the same purpose as the liquid standard, offering convenience and long-term stability for verifying spectrometer alignment [13]. |
| Neon or Mercury Calibration Lamp | Emits light at specific, well-defined wavelengths. These sharp emission lines are used to fine-tune the focus on the detector and perform the final wavelength calibration [31]. |
| NIST SRM 2036 [13] | A reflectance standard glass with certified reflectance bands in the visible and NIR regions. Useful for verifying the alignment and wavelength accuracy of spectrometers configured for diffuse reflectance measurements [13]. |
| Polystyrene Film [13] | A crystalline solid that provides a well-characterized transmission spectrum with specific peaks in the infrared and near-infrared regions, serving as a common wavenumber standard for NIR and IR spectrometers [13]. |
Workflow Visualization
The following diagram illustrates the logical decision-making and action process for troubleshooting grating order and focus issues.
Troubleshooting Grating Order and Focus
Wavelength Calibration Reference Data
The following tables summarize key specifications for common calibration lamps, which are essential for verifying the wavelength accuracy of handheld spectrometers.
| Lamp Model | Lamp Type | Operating Current | Rated Life (Hours) | Power Supply Model (115 VAC) |
|---|---|---|---|---|
| 6032 | Neon | 10 ±4 mA | 250 | 6045 |
| 6035 | Mercury-Argon (Hg(Ar)) | 18 ±5 mA | 5000 | 6047 |
| 6034 | Mercury-Neon (Hg(Ne)) | 18 ±5 mA | 500 | 6047 |
| Lamp Type | Output Range | Optical Power (in 600 µm fiber) | Warm-up Time | Lamp Lifetime |
|---|---|---|---|---|
| Neon (Ne) | 337 - 1084.5 nm | 1.6 µW | 1 minute | 5000 hours |
| Mercury-Argon (HgAr) | 253.6 - 922.5 nm | 1.6 µW | 1 minute | 5000 hours |
Troubleshooting Guides & FAQs
Lamp Operation and Setup
Q: My calibration lamp does not turn on. What should I check? A: First, verify the power supply. Ensure the unit is connected to the correct, compatible power source (e.g., 12 VDC for Mini models [34] or a specific AC power supply for pencil-style lamps [35]). Check all connections, including the SMA-905 fiber optic connector, to ensure they are secure.
Q: How long does a calibration lamp typically last? A: Lamp lifetime varies by model and gas type. For instance, Mercury-Argon lamps can last 5000 hours, whereas Neon lamps may have a rated life of 250 to 5000 hours depending on the specific design and operating current [34] [35]. Always refer to the manufacturer's specifications for your specific model.
Q: Why is warm-up time important for calibration lamps? A: Warm-up time allows the gas vapor inside the lamp to stabilize, ensuring the emission lines are at their characteristic wavelengths and intensities. A typical warm-up time is about one minute for Neon and Mercury-Argon lamps to achieve vapor stabilization [34].
Data Quality and Accuracy
Q: During calibration, my spectrometer is detecting emission lines, but the reported wavelengths are consistently incorrect. What is the likely cause? A: This indicates a wavelength accuracy error in your spectrometer. Your calibration source is functioning, but the spectrometer's internal "ruler" is misaligned. Follow the calibration procedure in your spectrometer's software to map the detected known lines (e.g., from Neon or Mercury-Argon) to their true values. This corrects the instrument's wavelength assignment [36].
Q: The intensity of the calibration lines seems low and unstable. How can I troubleshoot this? A: Unstable readings can often be traced to the sample path, even for calibration sources. First, confirm the instrument and lamp are fully warmed up. Then, inspect and thoroughly clean the windows in front of the fiber optic and in the direct light pipe, as a dirty window can cause drift and poor analysis readings [3]. Also, ensure the fiber optic connection is clean and secure.
Q: After calibration, my analysis results on identical samples are inconsistent. What could be wrong? A: Inconsistent results on the same sample often point to an issue with the calibration itself or the instrument's photometric accuracy. Ensure your calibration standards are clean and not contaminated. We recommend preparing the sample by grinding or machining it flat and following the software's recalibration sequence precisely without deviation. The relative standard deviation (RSD) for repeated analyses should not exceed 5 [3].
Experimental Protocol: Spectrometer Wavelength Calibration
This protocol details the methodology for verifying and calibrating the wavelength axis of a handheld spectrometer using Neon and Mercury-Argon calibration lamps.
Objective: To verify and correct the wavelength accuracy of a handheld spectrometer by aligning detected emission peaks to the known wavelengths of a calibration source.
Principle: Spectrometers assign wavelengths to pixels based on an internal model. This model can drift. By measuring a light source with known, sharp emission lines and performing a linear regression (Peak Detected vs. Peak Known), a correction function can be applied.
Materials:
- Handheld spectrometer with fiber optic input
- Neon or Mercury-Argon calibration light source (e.g., AvaLight-CAL series [34])
- SMA-905 terminated fiber optic cable
- Spectrometer operating software (e.g., software with automatic recalibration procedure [34])
- Computer
Step-by-Step Procedure:
System Setup: Connect the calibration lamp to the spectrometer's fiber optic input using the SMA-905 connector. Power on the calibration lamp and allow it to warm up for at least one minute to ensure vapor stabilization and output stability [34].
Data Acquisition: Initiate data collection in the spectrometer software. Expose the spectrometer to the calibration lamp and acquire a spectrum. Ensure the signal intensity is within the linear range of the detector (not saturated).
Peak Identification: The software will automatically identify the prominent peaks in the captured spectrum. Alternatively, manually identify key peaks. For a Mercury-Argon lamp, primary lines include 253.6 nm, 435.8 nm, and 546.1 nm. For a Neon lamp, primary lines include 540.1 nm, 585.2 nm, and 703.2 nm [34].
Calibration Execution: In the spectrometer software, initiate the "automatic recalibration procedure". The software will map the detected peak positions (in pixels) to the known, standard wavelengths of the lamp and compute a new wavelength calibration function.
Validation: After calibration, measure the calibration lamp again. Verify that the known emission lines now appear at their correct wavelengths within the manufacturer-specified tolerance for your instrument.
Workflow Visualization
The Scientist's Toolkit: Research Reagent Solutions
Table 3: Essential Materials for Wavelength Calibration
| Item | Function & Application | Key Characteristics |
|---|---|---|
| Neon Calibration Lamp | Provides known emission lines for wavelength calibration in the visible to NIR range (e.g., 337-1084.5 nm). Used to verify spectrometer accuracy [34]. | Narrow, discrete emission lines; long lifetime (e.g., 5000 hours); low optical power (e.g., 1.6 µW) [34]. |
| Mercury-Argon (HgAr) Calibration Lamp | Provides a broad set of known emission lines from UV to NIR (e.g., 253.6-922.5 nm). Ideal for wide-range calibration [34]. | Intense UV lines; used for initial and periodic calibration; requires specific power supply [34] [35]. |
| SMA-905 Fiber Optic Cable | Connects the calibration lamp to the spectrometer, guiding the light for analysis. | Standard connector for easy integration; ensures consistent light delivery [34]. |
| NIST-Traceable Calibration Standards | Certified reference materials (like holmium oxide filters) provide an independent verification of wavelength accuracy post-calibration [36]. | Documented, certified values with an unbroken chain of comparisons to national standards; essential for audits [36]. |
| Lint-Free Wipes & Powder-Free Gloves | Used to clean optical components (e.g., spectrometer windows, calibration standards) without introducing contamination [3] [36]. | Prevents scratches and oil contamination that can cause calibration drift and inaccurate analysis [36]. |
| TC AQP1 1 | TC AQP1 1, CAS:23713-86-2, MF:C12H10O4, MW:218.20 g/mol | Chemical Reagent |
| Galanthamine | Galanthamine |
Software-Assisted Calibration and Automated Sequence Protocols
Troubleshooting Guides
Calibration Failures and Error Resolution
Problem: Wavelength Accuracy Check Fails
- Symptoms: The measured peak wavelengths of a certified standard (e.g., holmium oxide filter) do not match the certified values within the specified tolerance [37].
- Potential Causes & Solutions:
- Expired Standard: Verify the calibration certificate of your standard has not expired. Replace if necessary [37].
- Contaminated Standard: Clean the calibration standard thoroughly using lint-free wipes and ensure it is handled with powder-free gloves to avoid oil contamination [37].
- Instrument Drift: Spectrometers naturally drift over time due to environmental effects. Re-run the wavelength calibration procedure to correct for this drift [38].
- Mechanical Fault: If the above steps fail, the instrument may have an internal mechanical issue requiring service by a qualified technician [37].
Problem: Photometric Accuracy Check Fails
- Symptoms: When measuring a certified neutral density filter, the recorded absorbance or reflectance value is outside the acceptable range (e.g., reading 0.515 AU on a 0.500 AU standard) [37].
- Potential Causes & Solutions:
- Contaminated Standard: This is the most common cause. Meticulously clean the photometric standard [37].
- Unstable Readings: Ensure the instrument has been powered on and allowed to warm up for the manufacturer-recommended time. Re-clean the sample and standard, and ensure the operating environment is stable [37].
- Stray Light: Perform a stray light check. Stray light, caused by internal light leaks, can lead to inaccurate photometric readings, especially at high absorbance levels [37].
Problem: Unstable or Drifting Readings During Automated Sequence
- Symptoms: Measurements are not repeatable, and the signal fluctuates over time during a calibration run.
- Potential Causes & Solutions:
- Insufficient Warm-up Time: Confirm the instrument's light source and electronics have stabilized by allowing adequate warm-up time before starting sequences [37].
- Environmental Fluctuations: Check for drafts, temperature swings, or humidity changes near the instrument. Provide a stable operating environment [37].
- Hardware Connection: Inspect cables and connections for looseness or damage as part of routine preventative maintenance [37].
Software and Automation Protocol Issues
Problem: Automated Calibration Sequence Halts or Errors
- Symptoms: The software sequencer stops unexpectedly, fails to send commands to the instrument, or cannot read data.
- Potential Causes & Solutions:
- Communication Failure: Verify the physical connection (e.g., USB, RS-232) between the computer and the instrument. Check the software configuration for the correct COM port, baud rate, parity, data bits, and stop bits [39].
- SCPI Command Error: Review the script for the instrument's Standard Commands for Programmable Instruments (SCPI). Ensure commands are correct and formatted properly for your specific instrument model [39].
- Stabilization Time: The script may not be allowing enough time for the instrument to stabilize at each set point before taking a measurement. Increase the delay between sending a command and taking a reading [39].
Problem: Model Transfer Between Instruments Yields Poor Results
- Symptoms: A calibration model developed on one spectrometer (the "master") performs poorly when applied to data from another spectrometer (the "slave"), even when measuring the same samples [40].
- Potential Causes & Solutions:
- Systematic Bias: Differences in optical components, gratings, or detectors create systematic spectral variations [40].
- Solution: Apply model transfer algorithms like Piecewise Direct Standardization (PDS) or Spectral Space Transformation (SST) to correct for these systematic differences and align the slave instrument's data with the master's model [40].
- Insufficient Transfer Standards: The set of standards used for the transfer may not adequately represent the spectral range or characteristics of your samples. Use a diverse and representative set of transfer standards [40].
Frequently Asked Questions (FAQs)
Q1: How often should I perform a full wavelength and photometric calibration on my handheld spectrometer? A: The frequency depends on your usage rate, operating environment, and regulatory requirements. For high-precision work or high-volume use, weekly or daily verification may be necessary. For general use, a quarterly schedule is a common baseline. Always consult the manufacturer's guide and consider your risk assessment [37].
Q2: What is the benefit of automating calibration sequences? A: Automation significantly improves efficiency, reduces human error, and ensures consistent, reliable calibration data. Automated systems can run multiple calibrations simultaneously and operate continuously, drastically reducing the time required and freeing up personnel for other tasks [41] [39].
Q3: My research involves a novel handheld spectrometer. How can I assess its optical alignment and resolution in real-time during development? A: The Modulation Transfer Function (MTF) is a key metric. A real-time method involves using a low-coherence interferometer to project a sinusoidal pattern with adjustable spatial frequency onto the spectrometer's sensor. By analyzing the contrast of this pattern at different frequencies, you can compute the MTF and assess spectral resolution continuously during the alignment process [16].
Q4: What are the most critical items to have for a proper calibration procedure? A: The essentials are:
- The instrument's operations manual.
- NIST-traceable calibration standards with valid certificates.
- Lint-free wipes and powder-free gloves to handle standards.
- A stable, appropriate operating environment [37].
Q5: What does "NIST-traceable" mean for a calibration standard? A: It means the standard's certified values have a documented, unbroken chain of comparisons back to a national metrology institute's standard (like NIST in the USA), ensuring legitimacy and acceptance in audits [37].
Experimental Protocols & Data
Detailed Protocol: Real-Time Spectrometer Alignment Using MTF
This protocol is designed for evaluating the alignment of a spectrometer during its assembly or maintenance phase [16].
- Objective: To assess the spectral resolution and alignment of a spectrometer in real-time by measuring its Modulation Transfer Function (MTF).
- Principle: A sinusoidal pattern is generated in the spectral domain and projected onto the spectrometer's line sensor. The contrast of this pattern at different spatial frequencies is used to calculate the MTF, which directly relates to the instrument's resolution [16].
- Materials:
- Spectrometer under test.
- Broadband light source (e.g., tungsten halogen lamp).
- Low-coherence interferometer (e.g., Michelson interferometer).
- Beam splitter and mirrors.
- Computer with data acquisition and analysis software.
Workflow for Real-Time Spectrometer Alignment Assessment
- Procedure:
- Setup: Configure the low-coherence interferometer in the path of the broadband light source, directing the output towards the entrance slit of the spectrometer.
- Generation of Sinusoidal Pattern: Adjust the Optical Path Difference (OPD) in the interferometer. This controls the spatial frequency of the interference fringes (sinusoidal pattern) generated on the spectrometer's sensor.
- Data Acquisition: a. Capture the "modulated spectrum" with the interferometer active. b. Capture a "non-modulated spectrum" for calibration (e.g., by blocking one arm of the interferometer). c. Repeat steps a and b for a range of OPD settings to test different spatial frequencies.
- Calculation: a. For each frequency, divide the modulated spectrum by the non-modulated spectrum to obtain a calibrated spectrum. b. Compute the percentage of modulation contrast from the calibrated spectrum. This value is a direct indicator of the MTF at that spatial frequency.
- Alignment Assessment: Observe the MTF values. A well-aligned spectrometer will maintain a high MTF across a range of spatial frequencies. A drop in MTF indicates a misalignment that can be corrected in real-time while monitoring the MTF output [16].
Detailed Protocol: Automated Pressure Controller Calibration
This protocol outlines the use of software sequencers to automate the calibration of pressure sensors, a common ancillary measurement in spectroscopic systems [39].
- Objective: To fully automate the process of setting pressure points and logging sensor readings to calibrate a pressure measurement system.
- Principle: Data acquisition (DAQ) software is used to send commands to a pressure controller and simultaneously read the output from a pressure sensor, automating the entire calibration sequence [39].
Materials:
- Precision pressure controller (e.g., Mensor CPC6050).
- Pressure sensor under test.
- DAQ software with serial communication and sequencer modules (e.g., DewesoftX).
- Computer with RS-232 or RS-485 interface.
Procedure:
- Hardware Configuration: Connect the pressure controller to the computer via a serial (RS-232/RS-485) cable. Connect the output pressure sensor to the DAQ system.
- Software Setup: In the DAQ software: a. Configure the serial port to match the controller's settings (baud rate, parity, etc.). b. Define the SCPI commands that will set the pressure on the controller.
- Sequencer Programming: a. Define the list of pressure set points (e.g., 0, 100, 200, ..., 1000 psi). b. Create a sequence that, for each set point: i. Sends the SCPI command to set the pressure. ii. Waits a predefined time for the pressure to stabilize. iii. Triggers the DAQ system to record a measurement from the pressure sensor. iv. Logs the set point and the measured value with a timestamp. c. Program the sequence to loop through all set points and repeat for multiple cycles if required.
- Execution and Analysis: Run the sequence. The software will automatically execute the steps, and data will be logged for analysis. The results can be viewed in real-time on graphical displays and exported for further analysis [39].
Table 1: Common Calibration Standards and Their Applications
| Standard Type | Primary Function | Example Materials | Key Parameter Verified |
|---|---|---|---|
| Wavelength Standard [37] [38] | Validates the accuracy of the wavelength scale | Holmium oxide filter, rare earth oxide solutions [37] [38] | Wavelength accuracy (e.g., peak position) |
| Photometric Standard [37] | Verifies the accuracy of intensity/absorbance readings | Sealed neutral density filters, certified white tile [37] | Photometric accuracy (Absorbance/Reflectance) |
| Stray Light Standard [37] | Checks for unwanted light reaching the detector | Specialized filters opaque at specific wavelengths [37] | Stray light level |
| Model Transfer Standards [40] | Corrects spectral differences between instruments | Stable, well-characterized samples (e.g., Intralipid phantoms, ceramic tiles) [6] [40] | Spectral consistency across instruments |
Table 2: Error Metrics for System Validation
| Metric | Calculation | Application Context |
|---|---|---|
| Root Mean Square Error (RMSE) [6] | ( \text{RMSE} = \sqrt{\frac{1}{N}\sum{n=1}^{N}(S{i,n}^{exp} - S_{i,n}^{theory})^2} ) | Quantifying the difference between experimental Stokes parameters and theoretical values in polarization spectroscopy [6]. |
| Root Mean Squared Error of Cross-Validation (RMSECV) [42] | ( \text{RMSECV} = \sqrt{\frac{1}{N}\sum{i=1}^{N}(yi - \hat{y}_i)^2} ) | Evaluating the performance and predictive accuracy of multivariate calibration models (e.g., PLS) during development [42]. |
| Modulation Contrast [16] | ( \text{Contrast} = \frac{I{\text{max}} - I{\text{min}}}{I{\text{max}} + I{\text{min}}} ) | Used in real-time MTF measurements to assess the optical resolution of a spectrometer during alignment [16]. |
The Scientist's Toolkit: Research Reagent Solutions
Table 3: Essential Materials for Spectrometer Calibration and Validation
| Item | Function | Example Use Case |
|---|---|---|
| NIST-Traceable Calibration Standards [37] [38] | Provide an unbroken chain of measurement traceability to national standards for verifying instrument accuracy. | Mandatory for all quantitative calibration procedures to ensure data legitimacy and pass audits [37]. |
| Intralipid Phantoms [6] | Mimic the scattering properties of biological tissues, serving as a controlled validation medium. | Validating the performance of imaging systems like polarized hyperspectral imaging (PHSI) in a bio-relevant context [6]. |
| Wave Plates (Quarter/Half) [6] | Precisely manipulate the polarization state of light for system characterization. | Calibrating and evaluating the experimental error of polarization-based spectroscopic systems [6]. |
| Certified Reference Materials (CRMs) | Well-characterized materials used to validate specific analytical methods. | ISO 13084:2025 specifies using CRMs to optimize mass calibration in Time-of-Flight SIMS instruments [43]. |
| Linearity & Stray Light Filters [37] | Assess the instrument's performance at high absorbance and detect internal light leaks. | Advanced instrument validation to ensure accuracy across the entire dynamic range [37]. |
| BLT-1 | BLT-1, MF:C12H23N3S, MW:241.40 g/mol | Chemical Reagent |
| D-Galacturonic Acid | D-Galacturonic Acid, CAS:9046-38-2, MF:C6H10O7, MW:194.14 g/mol | Chemical Reagent |
Diagnosing Common Alignment Issues and Performance Optimization
Troubleshooting FAQ: Resolving Spectrometer Instability
This guide addresses the common yet critical issue of inconsistent readings and signal drift, providing targeted solutions for researchers and scientists, particularly those involved in drug development and handheld spectrometer verification procedures.
Q: My spectrometer readings are inconsistent across multiple runs. What are the most likely causes?
Inconsistent readings often stem from three primary areas: calibration drift, hardware issues, or sample preparation errors [23].
- Calibration Drift: The photometric (Y-axis) and wavelength (X-axis) accuracy of a spectrometer can drift over time due to factors like aging electronic components, temperature fluctuations, and general wear and tear [23] [44] [45]. This is a normal process for all instruments.
- Aging Light Source: The internal lamp (e.g., deuterium or tungsten-halogen in UV-Vis systems) degrades over time. A weak or failing lamp will not provide consistent light intensity, leading to noisy data, failed calibrations, or low signal [23] [46].
- Faulty Electron Multiplier: In mass spectrometers, a failing electron multiplier (EMV) can cause severe and intermittent signal loss, particularly in sensitive MRM modes, even while the instrument passes routine autotunes [47].
- Contaminated or Blocked Light Path: Dirt on optical components, such as the sample cuvette, aperture, or internal lenses and mirrors, can distort or attenuate the signal. Using the wrong type of cuvette (e.g., standard plastic for UV measurements) can also block light [23] [46].
Q: My data is very noisy, and the spectrometer sometimes fails to calibrate. What should I check first?
This symptom typically points to an issue with the amount of light reaching the detector [46]. Follow these steps to isolate the cause:
- Inspect the Light Source: Switch the spectrometer to an uncalibrated or "light source check" mode to observe the raw light output across the spectrum. A flat or unusually low signal in specific regions indicates a weak or failing lamp that needs replacement [46].
- Verify the Sample Concentration: Excessively concentrated samples can block all light, leading to absorbance values that are off-scale (e.g., stuck at 3.0) and extremely noisy data. For reliable results in UV-Vis, ensure absorbance values for your samples are between 0.1 and 1.0 [46].
- Ensure a Clear Light Path:
Q: How can I systematically verify if my instrument's wavelength (X-axis) and photometric (Y-axis) accuracy are within specification?
Regular verification using certified reference materials (CRMs) is essential for maintaining data integrity, especially for long-term research projects [13] [48].
Table 1: Common Wavelength (X-Axis) Verification Standards
| Standard Type | Spectral Region | Key Certified Peaks (examples) | Application |
|---|---|---|---|
| Holmium Oxide (Ho₂O₃) in Perchloric Acid [13] | UV-Vis | 241.5 nm, 279.7 nm, 287.7 nm, 333.9 nm, 360.8 nm [13] | Primary standard for UV-Vis wavelength alignment and verification. |
| Holmium Oxide Glass [13] | UV-Vis | 279.3 nm, 287.4 nm, 333.6 nm, 360.7 nm, 453.4 nm, 536.4 nm [13] | Robust, stable solid standard for routine UV-Vis wavelength checks. |
| Polystyrene [13] | NIR | 1143.2 nm, 1688.8 nm, 2164.8 nm, 2300.8 nm [13] | Common solid standard for verifying NIR spectrophotometer wavelength axis. |
| NIST SRM 2036 [13] | Vis-NIR | 546.0 nm, 643.8 nm, 879.6 nm, 945.0 nm, 1144.8 nm [13] | Reflectance standard for verifying wavelength in Vis and NIR regions. |
Photometric accuracy ensures the intensity of your signal is correct. It can be verified using stable reflectance or transmittance standards, such as Fluorilon R99, and comparing your instrument's readings to the certified values from a reference instrument [48]. Consistency between instruments is critical for building reliable spectral databases [48].
Q: What is a "drift monitor," and how is it used?
A drift monitor is a stable, homogeneous material with a known elemental composition and count rate, used to track the stability of an instrument's response over time, particularly in XRF spectrometry [44] [49].
- Function: It is not a CRM for calibration but a tool for correction. By regularly measuring the drift monitor, you can establish a baseline count rate. Subsequent measurements track intensity variations, and a correction factor is applied to sample data to compensate for the instrument's drift [49].
- Benefit: This practice supports long-term instrument stability, reduces the frequency of full recalibrations, and ensures experimental repeatability [44] [49].
Table 2: Examples of Application-Specific Drift Monitors
| Drift Monitor Type | Primary Application Area |
|---|---|
| Silicates & Cement [44] [49] | Construction materials analysis |
| Iron Ore & Mineral Sands [44] [49] | Mining and raw material analysis |
| Nickel & Sulfides [49] | Metallurgy and metal quality control |
| Bauxite & Rare Earth [49] | Geological and advanced material studies |
Experimental Protocols for Alignment and Verification
Protocol 1: Routine Wavelength Axis Verification using a Holmium Oxide Standard
This protocol is used to verify the accuracy of your spectrometer's wavelength axis [13].
- Preparation: Power on the spectrometer and allow it to warm up for the time specified by the manufacturer to ensure stability.
- Baseline Measurement: Collect a baseline scan with an empty beam or an appropriate solvent blank.
- Standard Measurement: Place a certified holmium oxide glass or liquid standard in the light path and acquire a spectrum with sufficient resolution.
- Peak Identification: Identify the peak positions in the acquired spectrum. For holmium oxide, key peaks include 279.3 nm, 360.7 nm, and 536.4 nm (for glass) [13].
- Comparison: Compare the measured peak positions against the certified values provided with the standard.
- Action: If the measured values deviate from the certified values by more than the instrument's specification (e.g., ±0.5 nm), perform a wavelength calibration as per the manufacturer's instructions.
Protocol 2: Automated Spectrometer Alignment via Machine Learning
Advanced research explores using machine learning (ML) to drastically reduce alignment time for complex spectrometers. The following workflow has been demonstrated to reduce alignment time from approximately one hour to a few minutes [12].
Diagram: Machine learning workflow for automated spectrometer alignment [12].
Methodology:
- Simulation: An extensive dataset (e.g., one million simulations) is generated offline using ray-tracing software (e.g., RAYX), varying parameters like optical component positions and sample composition [12].
- Training: A neural network (surrogate model) is trained exclusively on this simulated data to learn the mapping between instrument parameters and the resulting spectral image [12].
- Optimization: During beamline operation, a small number of real reference measurements (10-25) are acquired. An optimizer is used to find the offset between the simulated model and the real-world setup by minimizing the difference between the real measurements and the neural network's predictions [12].
- Alignment: The calculated offset parameters are applied to align the spectrometer automatically and precisely [12].
The Scientist's Toolkit: Essential Research Reagents & Materials
Table 3: Key Materials for Spectrometer Verification and Maintenance
| Item | Function & Explanation |
|---|---|
| Certified Wavelength Standards (e.g., Holmium Oxide, Polystyrene) [13] | Materials with stable and certified absorption/reflectance peaks used to verify and calibrate the wavelength (X-axis) accuracy of a spectrometer. |
| Certified Photometric Standards (e.g., Fluorilon R99) [48] | Stable materials with certified reflectance or transmittance values used to verify the accuracy of the signal intensity (Y-axis) of a spectrometer. |
| Drift Monitors [44] [49] | Stable, application-specific glass discs or pellets used to track and correct for the gradual change in instrument response over time, common in XRF spectrometry. |
| UV-Compatible Cuvettes (Quartz) [46] | Sample holders that are transparent in the ultraviolet light range. Using standard plastic cuvettes for UV measurements will block light and cause erroneous readings. |
| Lint-Free Wipes & Approved Solvents [23] | Essential for safely cleaning optical components like cuvettes, lenses, and the instrument's aperture without causing scratches or residue. |
| Lobeline hydrochloride | Lobeline hydrochloride, MF:C22H28ClNO2, MW:373.9 g/mol |
| Cyclopiazonic acid | Cyclopiazonic acid, MF:C20H20N2O3, MW:336.4 g/mol |
Preventive Maintenance and Best Practices
- Establish a Calibration Schedule: Calibrate your spectrometer at the start of each job and at least once daily. For instruments in harsh environments, more frequent calibration may be necessary [45].
- Keep the Instrument Clean: Regularly clean the aperture, sample port, and any external optics according to the manufacturer's guidelines. A dirty instrument is a common source of drift [23] [45].
- Annual Certification: For quality-critical work, have your spectrometer factory-certified annually. This provides traceable documentation that the instrument meets its accuracy specifications [45].
- Fleet Verification: If using multiple instruments, use a tool like NetProfiler to validate and harmonize their performance, ensuring consistent measurements across all devices [45].
Quick Diagnosis Guide
If your spectrometer is reporting a low light intensity or signal error, follow these initial checks to diagnose the issue.
| Symptom | Immediate Action | Possible Cause |
|---|---|---|
| Erratic or drifting readings [50] | Check the light source and allow the instrument adequate warm-up time. | Aging lamp, insufficient warm-up. |
| Consistently low values for Carbon, Phosphorus, Sulfur [3] | Inspect the vacuum pump for warning signs like noise or leaks. | Malfunctioning vacuum pump. |
| Frequent need for recalibration, poor analysis readings [3] | Clean the windows in front of the fiber optic and in the direct light pipe. | Dirty optical windows. |
| Inaccurate or no results; bright light escaping from pistol face [3] | Check probe contact with the sample surface; increase argon flow if necessary. | Poor probe-to-sample contact. |
| Low signal even after cleaning | Inspect the optical path for debris and ensure the sample cuvette is aligned correctly [50]. | Misaligned cuvette or debris in the light path. |
Systematic Inspection Workflow
Follow this logical workflow to methodically identify and resolve the root cause of low light intensity or signal errors. This procedure is critical for maintaining data integrity in handheld spectrometer alignment verification research.
Detailed Troubleshooting Procedures
Sample Preparation and Presentation
Inaccurate sample presentation is a primary source of signal error. Proper technique is non-negotiable for reliable data [3].
- Grinding and Cleaning: Use a new grinding pad to remove plating, carbonization, or protective coatings before analysis. Avoid touching the prepared sample surface with your fingers, as oils from skin will contaminate it [3].
- Sample Homogeneity: Ensure the sample is homogeneous. Inhomogeneous samples with varying concentrations or uneven absorption properties will lead to measurement errors and unstable readings [51].
- Probe Contact: For handheld probes, ensure full and flat contact with the sample surface. Poor contact can cause bright light to escape, create loud analysis sounds, and yield incorrect results or software recognition failures [3]. For convex shapes, use seals or consult a technician to custom-build a pistol head [3].
External Optics Inspection
Contamination on optical surfaces is a common cause of signal degradation and calibration drift [3].
- Window Cleaning: Locate and clean the two primary windows: the window in front of the fiber optic and the window in the direct light pipe [3]. Follow manufacturer guidelines for approved cleaning solvents and lint-free wipes.
- Visual Inspection: Check optics for physical damage such as scratches or cracks, which require professional replacement.
Internal Optical Path and Source
Instrumental factors can directly cause low signal intensity [50] [51].
- Light Source: An aging lamp can cause fluctuations and low light output. Replace lamps according to the manufacturer's recommended schedule or when performance degrades [50].
- Cuvette Alignment: Ensure the sample cuvette is positioned correctly in the beam path. Misalignment can drastically reduce the measured light intensity [50].
- Stray Light: Check for debris in the light path. Dust or residue on internal mirrors or lenses will scatter light and reduce signal. This internal cleaning should be performed by a trained technician [18].
Subsystem Diagnostics
Specific spectrometer subsystems are critical for optimal performance, particularly for low-wavelength elements [3] [18].
- Vacuum Pump Check: The vacuum pump purges the optic chamber to allow low-wavelength light (for Carbon, Phosphorus, Sulfur) to pass through. Symptoms of failure include consistently low readings for these elements, and pump indicators like smoke, excessive heat, loud/gurgling noises, or oil leaks [3].
- Argon Purity: Contaminated argon will produce inconsistent or unstable results. A white or milky appearance of the burn is a key indicator of this issue [3].
Experimental Protocol for Signal Verification
This protocol provides a quantitative method to verify signal performance and diagnose error sources during spectrometer alignment studies.
Objective
To quantify signal-to-noise performance and identify the source of signal degradation by systematically measuring a stable reference material.
Materials
- Certified Reference Material (CRM) traceable to national standards [18].
- Appropriate sample cuvette or holder.
- Lint-free wipes and approved cleaning solvents.
Procedure
- Baseline Instrument: Allow the spectrometer to warm up for the manufacturer-specified time (e.g., one hour) to stabilize [52] [50].
- Acquire Reference Scans:
- Record a blank/reference scan with the correct solvent in a clean cuvette [50].
- Place the CRM in the sample holder and acquire ten consecutive transmittance or reflectance spectra without moving the sample (repeatability test) [52].
- Remount and refill the sample between each of another ten scans (reproducibility test) [52].
- Data Analysis:
Data Interpretation
| Metric | Acceptable Outcome | Indicated Problem |
|---|---|---|
| Low Repeatability CV (Consecutive scans) | Stable instrument electronics and light source. | Instrument instability, failing lamp, or insufficient warm-up. |
| High Reproducibility CV (Remounted scans) | Good sample presentation technique. | Poor sample handling, positioning, or contamination. |
| Low Mean Signal | Sufficient light throughput. | Dirty optics, aging source, malfunctioning pump, or misalignment. |
Research Reagent Solutions
The following materials are essential for maintaining spectrometer performance and conducting alignment verification research.
| Item | Function in Research |
|---|---|
| Certified Reference Materials (CRMs) | Provide a metrologically traceable standard with known properties to verify instrument accuracy and perform calibration [18]. |
| Stable Control Samples | Used for daily performance checks (Ongoing Performance Verification) to monitor instrument drift and stability over time [53]. |
| Lint-Free Wipes & Optical Cleaning Solvents | Ensure contamination-free cleaning of external optical windows and sample holders without introducing scratches or fibers [51]. |
| Vacuum Pump Oil | Maintains the integrity of the vacuum system, which is critical for the transmission of low-wavelength UV light for elements like Carbon and Sulfur [3]. |
| High-Purity Argon Gas | Prevents oxidation of the spark spot and ensures a clean, controlled environment for the plasma, leading to stable and accurate analyses [3]. |
FAQs on Optical Contamination
1. What is the most common cause of problems in optical systems like spectrometers? Dirty connections and contaminated optical surfaces are the number one cause of issues. For fiber optics alone, contaminated connectors are responsible for 85% of fiber link failures and can account for 15-50% of all network problems in optical systems [54] [55]. Since the core of a single-mode fiber is only 9 micrometers in diameter, a dust particle invisible to the naked eye can completely block the light path [54].
2. Why can't I determine if an optical surface is clean by looking at it? The critical optical surfaces, such as a single-mode fiber core, are several times smaller than a human hair [54]. Dust or contamination that is microscopic can still be large enough to cause significant signal loss, back reflections, or permanent scratches. Proper inspection requires a microscope with at least 200x magnification [56] [57].
3. What are the typical sources of contamination? Common contaminants include [56] [55] [57]:
- Oils and residues from fingerprints and skin contact
- Dust and airborne particles from the environment
- Packaging materials and debris from the work site
- Static-charged particles from clothing or wiping
- Residue from improper cleaning with solvents
4. Are new, unused optical connectors guaranteed to be clean? No. You should never assume new components are clean [54] [55]. Protective dust caps can themselves be a source of contamination, as they may contain mold release agents and dust from the manufacturing and packaging process. Always inspect and clean every optical component immediately before connection or use [55].
Troubleshooting Guides
Guide 1: Systematic Approach to Signal Loss
| # | Step | Action | Key Tools |
|---|---|---|---|
| 1 | Inspect | Use a microscope to inspect all accessible optical surfaces (connectors, lenses, windows) for contamination, scratches, or damage [55] [57]. | Fiber optic microscope, Video fiberscope |
| 2 | Clean | Perform a dry cleaning procedure. If contamination persists, follow with a wet-to-dry cleaning method [54] [57]. | Lint-free wipes/swabs, Isopropyl alcohol (IPA) |
| 3 | Re-inspect | Verify the cleaning was effective under the microscope. Repeat cleaning if necessary [57]. | Fiber optic microscope |
| 4 | Basic Test | Use an inexpensive tracer or power meter to verify if the signal is restored after cleaning [56]. | Visual Fault Locator (VFL), Power meter |
| 5 | Advanced Diagnostics | If the problem persists, the issue may be internal (e.g., a break or excessive bend). Use advanced equipment to locate the fault [56]. | Optical Time-Domain Reflectometer (OTDR) |
Guide 2: Resolving High Back Reflection
| Symptom | Potential Cause | Solution |
|---|---|---|
| Unstable laser output or high bit error rate | Contamination on the core: A particle blocking the core generates strong back reflections [57]. | Clean and inspect the connector end-faces on both sides of the connection. |
| Signal degradation after a recent connection | Air gap from contamination: Invisible contaminants on the cladding prevent proper physical glass-to-glass contact [56]. | Clean and re-mate the connection. Inspect for permanent damage caused by mating dirty connectors [55]. |
| Persistent high loss and reflectance | Scratches or pitting: Permanent damage caused by mating contaminated connectors [56] [55]. | Replace the damaged connector. |
Experimental Protocols for Alignment Verification
Protocol 1: Visual Inspection and Cleaning of Optical Connections
This protocol is critical for pre-alignment verification of a handheld spectrometer's internal fiber connections or external fiber probes.
Workflow: Inspection and Cleaning
Methodology:
- Safety First: Always ensure all laser sources are powered off before inspection [57].
- Inspection:
- Dry Cleaning (First Attempt):
- Wet-to-Dry Cleaning (For Stubborn Contamination):
- Apply a small, dime-sized spot of high-purity (>99%) isopropyl alcohol to a lint-free wipe [54].
- Lightly draw the connector endface from the solvent area over a dry area of the wipe in one straight line. This dissolves contamination and removes it without leaving residue [54].
- Do not use excessive solvent, as it can flood the ferrule and cause cross-contamination [54].
- Final Verification: Always re-inspect the connector after cleaning to confirm it is clean [57].
Protocol 2: Wavelength Axis Calibration Using Reference Standards
Verifying the wavelength/wavenumber axis alignment is a fundamental step in ensuring spectrometer data validity. This procedure uses stable reference materials with known absorption peaks [13].
Workflow: Wavelength Calibration
Methodology:
- Standard Selection: Choose a reference material suitable for your spectrometer's spectral range.
- Measurement: Place the standard in the spectrometer's sampling compartment and acquire a high-resolution spectrum (e.g., absorbance or reflectance).
- Peak Identification: Identify the observed peak positions (wavelength or wavenumber) in the measured spectrum.
- Alignment Verification: Compare the observed peak positions to the certified values of the standard. The table below lists certified values for a common holmium oxide standard.
- Calibration: If a significant deviation is found, follow the manufacturer's procedure to calibrate the instrument's x-axis using the standard's certified values. Re-measure the standard to confirm proper alignment.
Table: Certified Wavelengths for Holmium Oxide Glass Wavelength Standard (Traceable to NIST SRM 2034) [13]
| Peak Number | Certified Wavelength (nm) |
|---|---|
| 1 | 241.5 |
| 2 | 279.4 |
| 3 | 287.5 |
| 4 | 333.7 |
| 5 | 360.9 |
| 6 | 418.4 |
| 7 | 453.2 |
| 8 | 536.2 |
| 9 | 637.5 |
The Scientist's Toolkit: Essential Materials
Research Reagent Solutions for Optical Maintenance
| Item | Function & Application |
|---|---|
| High-Purity Isopropyl Alcohol (IPA) | Solvent for dissolving oily residues and other contamination during wet cleaning of optical surfaces [55]. Must be high purity (>99%) and stored properly to avoid water absorption and contamination [54]. |
| Lint-Free Wipes/Swabs | Physically remove contamination without adding fibers or residue. Essential for both dry and wet cleaning methods. Clean-room quality is preferred [57]. |
| Fiber Optic Microscope/Fiberscope | Enables visual inspection of optical end-faces at high magnification (200x-400x) to verify cleanliness and identify damage before connection [56] [55]. |
| Cartridge/Pocket Cleaners | Provide a fresh, lint-free cleaning surface for quick, dry cleaning of optical connectors. Often the first line of defense against dust [57]. |
| Wavelength Calibration Standards | Stable materials with known, certified absorption/reflectance peaks (e.g., Holmium oxide, Polystyrene) used to verify and calibrate the x-axis of spectrometers for data validity [13]. |
| Visual Fault Locator (VFL) | A low-cost, pen-sized tool that injects visible light into a fiber. It helps trace fibers and identify major breaks or macro-bends that cause signal loss [56]. |
Optimizing Probe Contact and Sample Preparation for Reliable Results
FAQs on Probe Contact and Sample Preparation
Q1: What are the symptoms of incorrect spectrometer probe contact? You may encounter incorrect probe contact if the sound during metal analysis is louder than usual and a bright light is escaping from the pistol face. This can lead to incorrect results or a complete failure to acquire data. More seriously, if the probe is not fully engaged, it can cause a dangerous high-voltage discharge inside the connector [3].
Q2: How can I troubleshoot poor probe contact on curved surfaces? For convex or irregularly shaped samples, you can:
- Increase the argon flow rate (e.g., from 43 psi to 60 psi) to improve the analysis environment [3].
- Use specialized seals designed for convex shapes to ensure a proper fit [3].
- Consult a technical service provider to custom-build a pistol head that accommodates the specific contours of your sample [3].
Q3: Why is sample preparation so critical for spectroscopic accuracy? Inadequate sample preparation is a primary source of error, responsible for as much as 60% of all analytical errors in spectroscopy. Proper preparation ensures homogeneity, controls particle size, and minimizes contamination, all of which are fundamental for obtaining valid and reproducible data [58].
Q4: How does a dirty sample affect my spectrometer? A contaminated sample will not produce accurate data. Oils from skin contact, residual cooling fluids like oil or water, or other surface coatings can lead to inconsistent, unstable, or entirely incorrect results because the instrument will analyze both the material and the contamination [3].
Q5: What is the best way to prepare solid samples for XRF analysis? Solid samples often require specific preparation to create a homogeneous, flat surface with consistent density. Key techniques include [58]:
- Grinding and Milling: Reduces particle size to typically below 75 μm for XRF, creating a homogeneous sample.
- Pelletizing: Pressing powdered samples with a binder into a solid, uniform disk for analysis.
- Fusion: Melting the sample with a flux to create a homogeneous glass disk, which is excellent for difficult-to-analyze materials.
Troubleshooting Guide: Common Issues and Solutions
The following table summarizes frequent problems related to probe contact and sample preparation, along with targeted solutions.
| Problem | Symptom | Possible Cause | Solution |
|---|---|---|---|
| Unstable Probe Contact | Loud analysis sound, bright light from probe face, inconsistent or no results [3]. | Poor contact with irregular or convex sample surface [3]. | Increase argon flow; use convex seals; consider a custom-built probe head [3]. |
| Contaminated Sample | Inconsistent or unstable analysis results; white, milky-looking burn [3]. | Sample surface has oils (from skin), plating, carbonization, or protective coatings [3]. | Re-grind sample on a new pad; avoid touching samples with bare hands; do not quench samples in oil/water [3]. |
| Weak or Noisy Signal | Weak Raman signal, difficult to obtain reliable spectra, spectral noise [59]. | Low laser power; dirty optics or sampling window; misaligned optics [59]. | Adjust laser power; clean optics with lint-free cloth and optical-grade solution; verify focus and alignment [59]. |
| Inconsistent Readings | High variability between replicate measurements on the same sample [7]. | Improper sample handling (bubbles, inhomogeneity); different cuvette orientation for each reading; sample degradation [7]. | Mix samples thoroughly; remove air bubbles; always use the same cuvette in the same orientation; protect light-sensitive samples [7]. |
| Sample Homogeneity Issues | Non-reproducible results, unrepresentative sampling [58]. | Heterogeneous solid sample without proper grinding or milling [58]. | Use spectroscopic grinding/milling machines to achieve uniform particle size and a homogeneous mixture [58]. |
Experimental Protocols for Alignment Verification and Sample Preparation
Protocol 1: Basic Procedure for Verifying Handheld Spectrometer Probe Alignment
This protocol outlines a method to verify the correct alignment of a handheld spectrometer's probe, which is critical for ensuring the light is collected correctly for accurate results [3].
Principle: Proper lens alignment focuses on the source of the light's origin. Misalignment means the instrument will not collect the required light intensity, leading to highly inaccurate readings [3].
Materials:
- Handheld spectrometer
- Certified reference material (CRM) with a known, stable spectrum
- Lint-free cloth and optical-grade cleaning solution
Methodology:
- Initial Setup: Ensure the spectrometer is warmed up and stabilized according to the manufacturer's instructions [7].
- Cleaning: Clean the probe's sampling window and the surface of the CRM using a lint-free cloth and optical-grade cleaning solution to remove any dust or contaminants [59].
- Baseline Measurement: Take a measurement of the CRM. Record the signal intensity and the obtained spectrum.
- Alignment Check: Compare the measured spectrum against the certified reference spectrum. A significant loss of signal intensity or a distortion in the spectral shape can indicate a potential misalignment [3] [59].
- Verification: Repeat the measurement several times on a flat, clean part of the CRM. High variability between readings (high relative standard deviation) may also suggest a contact or alignment issue [3].
Expected Outcome: A properly aligned probe will produce a spectrum that closely matches the CRM's reference data with stable, high-intensity signals.
Protocol 2: Preparation of Solid Samples for Reliable Elemental Analysis
This protocol describes the preparation of solid metal samples for analysis using techniques like Optical Emission Spectrometry (OES) to ensure reliable and contamination-free results [58] [3].
Principle: Creating a clean, flat, and homogeneous surface is essential to prevent contamination and ensure the probe makes consistent and correct contact with a representative sample area [58] [3].
Materials:
- Spectroscopic grinding machine or milling machine
- Fresh grinding disks or milling tools (specific to the sample material)
- Sample material
- Isopropyl alcohol for cleaning
- Lint-free gloves and cloths
Methodology:
- Selection: Choose between grinding (for harder materials like steels) or milling (for softer materials like aluminum or copper alloys) based on sample hardness [58].
- Preparation:
- Grinding: Use a swing grinding machine with an appropriate abrasive disk. Apply consistent pressure and grinding time to create a flat, uniform surface.
- Milling: Use a spectroscopic milling machine to produce a fine, flat surface with controlled parameters to avoid heat buildup.
- Cleaning: After preparation, clean the sample surface with isopropyl alcohol using a lint-free cloth to remove any residual particles or grease.
- Handling: Always handle the prepared sample with clean, lint-free gloves to avoid contamination from skin oils [3].
Expected Outcome: A perfectly flat, clean, and homogeneous sample surface that allows for ideal probe contact and delivers reproducible and accurate analytical results.
Workflow Diagrams
Sample Preparation and Verification Workflow
Probe Alignment and Contact Verification
Research Reagent and Material Solutions
The following table details key materials and reagents essential for proper sample preparation and probe maintenance in spectroscopic analysis.
| Item | Function | Application Notes |
|---|---|---|
| High-Purity Grinding Disks | To create a flat, contamination-free surface on solid samples [58]. | Select material hardness to match the sample; always use a clean, dedicated disk for different sample types to prevent cross-contamination [58] [3]. |
| Certified Reference Materials (CRMs) | To verify instrument calibration, probe alignment, and analytical method accuracy [59]. | Should have a known composition similar to the sample; used for quality control and troubleshooting [3] [59]. |
| Lint-Free Gloves and Cloths | To handle samples and clean optical components without introducing fibers or contaminants [7] [59]. | Essential for preventing contamination from skin oils during sample preparation and handling [3]. |
| Optical-Grade Cleaning Solution | To effectively clean the probe's sampling window and optics without damaging them or leaving residues [59]. | Used with lint-free cloths to maintain a clear optical path for accurate light collection [59]. |
| Spectroscopic Binders (e.g., Cellulose, Wax) | To mix with powdered samples for forming stable, uniform pellets for XRF analysis [58]. | Ensures the pellet maintains integrity and has consistent density during analysis [58]. |
Troubleshooting Guides
Troubleshooting Guide: Argon Purity and Sample Handling Issues
| Problem Symptom | Possible Cause | Troubleshooting Steps | Preventive Measures |
|---|---|---|---|
| Low or erratic results for Carbon, Phosphorus, Sulfur [3] | Malfunctioning vacuum pump or contaminated argon introducing atmosphere into the optical chamber [3] [60]. | 1. Check vacuum pump for leaks, unusual noise, or heat [3].2. Verify argon purity level (99.999% or higher recommended) [60].3. Inspect argon lines for leaks [3]. | Use high-purity (99.999% or better) argon [60]. Perform regular pump maintenance [3]. |
| White or milky appearance of the spark/burn [3] | Contaminated argon gas [3]. | 1. Replace argon cylinder with a certified high-purity source [3] [60].2. Check all gas fittings and lines for integrity [3]. | Establish a protocol for using only high-purity argon from reputable suppliers [60]. |
| Inconsistent or unstable results on the same sample [3] [51] | 1. Dirty optical windows [3].2. Contaminated sample surface [3] [58].3. Improper probe contact [3]. | 1. Clean the fiber optic and direct light pipe windows [3].2. Re-grind the sample using a new grinding pad [3].3. Ensure flat sample surface and check argon flow rate (e.g., increase to 60 psi) [3]. | Implement strict sample preparation SOPs [58]. Clean optical windows as part of regular maintenance [3]. |
| High analysis drift requiring frequent recalibration [3] [51] | 1. Dirty optical windows [3].2. Instrument misalignment or temperature fluctuations [51]. | 1. Clean the optical windows [3].2. Perform wavelength calibration with certified reference materials [51].3. Conduct measurements in a temperature-stable environment [51]. | Schedule regular, preventive instrument calibration and maintenance [3] [51]. |
Argon Purity Specifications and Impact
| Argon Grade | Purity Level | Typical Impurity Level | Suitable Applications |
|---|---|---|---|
| Grade 5.0 | 99.999% | Impurities ≤ 10 ppm | Standard OES analysis where high sensitivity for trace elements is not critical [60]. |
| Grade 6.0 (UHP) | 99.9999% | Impurities ≤ 1 ppm | Recommended: Trace element analysis, low-level Carbon, Phosphorus, Sulfur detection; essential for high-sensitivity OES [60]. |
Essential Research Reagent Solutions
| Item | Function & Importance | Technical Specifications |
|---|---|---|
| High-Purity Argon | Serves as an inert atmosphere for the spark plasma, preventing sample oxidation and ensuring clear emission spectra for accurate measurements [60]. | Purity: 99.999% (5.0) minimum; 99.9999% (6.0 UHP) for trace analysis. Key impurities to control: Oâ‚‚, Hâ‚‚O, THC at ppb levels [60] [61]. |
| Certified Reference Materials (CRMs) | Used for instrument calibration and verification of analytical results, ensuring data accuracy and traceability [51]. | Matrix-matched to samples. Provide certified concentrations for elements of interest. |
| High-Purity Acids & Reagents | Used for cleaning labware to prevent contamination. Low metal grade acids are essential [62]. | Use trace metal grade nitric acid (e.g., for cleaning). Avoid glass containers; use fluoropolymer (PFA, FEP) or polypropylene labware [62]. |
| Non-Pigmented Plastic Labware | Sample vials and containers must not leach contaminants. Plastic is preferable to glass for acidic samples [62]. | Materials: Polypropylene (PP), low-density polyethylene (LDPE), fluoropolymers (PFA, FEP). Must be acid-rinsed before first use [62]. |
Frequently Asked Questions (FAQs)
1. Why is argon purity so critical in Optical Emission Spectroscopy? Argon creates a stable, inert environment for the spark plasma. Impurities like oxygen, nitrogen, or water vapor can react with the sample, absorb light, or emit their own spectral lines. This interferes with the true emission spectrum from your sample, leading to inaccurate results, especially for sensitive trace elements like Carbon, Phosphorus, and Sulfur [60].
2. What is the visual sign that my argon might be contaminated? A spark that appears white or milky, rather than its normal intense, clear, and blue-ish color, is a primary indicator of contaminated argon [3].
3. How can improper sample preparation lead to contamination? Touching the sample with bare hands transfers skin oils. Quenching samples in water or oil post-machining introduces surface contaminants. Using dirty or contaminated grinding tools can transfer material from previous samples. All these can be detected by the spectrometer, skewing your results [3] [58] [63].
4. What are the best practices for storing and handling high-purity argon? Ensure gas lines and regulators are clean and dedicated for high-purity use. Use stainless steel or other clean, compatible materials for gas lines. Always check for leaks after changing cylinders. Store cylinders properly and use them in a clean environment to minimize the introduction of particulates [60] [61].
5. How often should I clean the optical windows of my spectrometer? The frequency depends on usage, but it should be part of a regular preventive maintenance schedule. A noticeable increase in calibration drift or a general decrease in light intensity are signs that the windows need immediate cleaning [3].
Experimental Workflow and Protocols
Detailed Protocol: Sample Preparation for OES Analysis
- Sample Sectioning: Obtain a representative sample of the material. Use a clean, dedicated saw or cutter to avoid cross-contamination.
- Grinding/Surface Preparation:
- Cleaning: After grinding, use clean, compressed air or a lint-free cloth to remove any residual particles from the sample surface. Do not touch the prepared surface with bare hands [3] [63].
- Analysis: Analyze the sample immediately after preparation to prevent surface oxidation or contamination.
Workflow: Contamination Troubleshooting Path
The following diagram outlines a logical workflow for diagnosing and addressing contamination issues in spectroscopic analysis.
Routine Maintenance Schedule for Sustained Alignment and Performance
Frequently Asked Questions (FAQs)
1. Why is a routine maintenance schedule critical for spectrometer performance? A routine maintenance schedule is essential for ensuring data accuracy, instrument longevity, and operational safety. Regular maintenance prevents issues like calibration drift, optical component degradation, and misalignment, which can lead to inconsistent or inaccurate analytical results [64]. Adhering to a scheduled plan helps maintain the instrument within its factory specifications and can prevent costly emergency repairs [65] [3].
2. How often should I perform specific maintenance tasks on my spectrometer? Maintenance frequency depends on usage and environmental conditions, but a general schedule based on manufacturer recommendations is provided below. Always consult your specific device's manual for precise intervals.
Table: Recommended Spectrometer Maintenance Schedule
| Task | Frequency | Purpose & Notes |
|---|---|---|
| Calibration | Before each job or at least daily [65] | Ensures readings are traceable to original factory standards. |
| Performance Verification (PV) | Regularly, as prompted by software [8] | Confirms the instrument is operating within specified performance parameters. |
| Cleaning Optical Windows | Weekly, or as needed [3] | Prevents analysis drift and poor results due to contaminated optics. |
| Inspecting & Cleaning Fiber Ends | Every time before connection [66] | Maintains optimal light throughput and performance. |
| Full Factory Recertification | Annually [65] [64] | Comprehensive check by certified technicians to validate all functions. |
3. What are the immediate signs that my spectrometer may be misaligned? Software indicators are often the first sign. A yellow or red status icon in the control software can signal a failed diagnostic test or that the instrument requires immediate attention [8]. Physically, misalignment may manifest as consistently low signal intensity, unstable baselines, or unexpected shifts in your data [8].
4. Can I realign the spectrometer myself, or should I contact a specialist? Basic alignment procedures can often be performed by trained users following the manufacturer's instructions, which typically involve removing samples from the compartment and using software tools to adjust optical elements [67] [8]. However, for complex misalignments, persistent failures, or after major component replacement, it is advisable to contact a qualified service technician to avoid causing further issues [64] [8].
Troubleshooting Guides
Issue 1: Low Signal Intensity
Problem: The system scans normally, but the signal intensity is very low.
Possible Causes & Solutions:
- Cause: Instrument Misalignment.
- Solution: Perform an instrument alignment via the software. Ensure the system has been powered on for at least 15 minutes (one hour for best results) to thermally stabilize before aligning [8].
- Cause: Dirty or contaminated optics (windows, fiber ends, lenses).
- Cause: Worn-out or damaged light source.
Issue 2: Unstable or Drifting Baseline
Problem: The spectral baseline is not stable, causing drift in measurements.
Possible Causes & Solutions:
- Cause: Insufficient instrument purge or environmental instability.
- Cause: Moisture in the system.
- Solution: Check the humidity indicator. If it is pink, replace the desiccant and the indicator [8].
- Cause: Recent power cycle or detector cooling.
- Solution: Allow the instrument to stabilize for at least one hour after power-on. If using a cooled detector, allow at least 15 minutes for the detector to cool after filling the dewar [8].
Issue 3: Inaccurate Analysis Results
Problem: Results vary significantly between tests on the same sample.
Possible Causes & Solutions:
- Cause: Improper sample preparation or contamination.
- Solution: Ensure samples are clean, properly ground, and free from coatings or contaminants like oils from skin. Do not quench samples in water or oil before analysis [3].
- Cause: The instrument is out of calibration.
- Cause: Problems with the vacuum pump (for OES spectrometers).
- Solution: Monitor for low readings on carbon, phosphorus, and sulfur. If the pump is noisy, hot, smoking, or leaking oil, it requires immediate service or replacement [3].
Experimental Protocol: Real-Time Alignment Assessment via MTF Measurement
This protocol, derived from recent research, provides a methodology for quantitatively assessing spectrometer alignment during research and development, particularly for handheld devices [16].
Objective
To evaluate the modulation transfer function (MTF) of a spectrometer in real-time to verify optical alignment and spectral resolution without significantly interfering with the internal layout.
Principle
The method uses a low-coherence interferometer (e.g., a Michelson type) to project a sinusoidal intensity pattern onto the spectrometer's line-sensor. By adjusting the optical path difference (OPD) in the interferometer, the spatial frequency of the pattern is changed. The MTF is calculated from the contrast of this pattern at different frequencies, providing a direct measure of the system's resolution and alignment quality [16].
Materials and Equipment
Table: Research Reagent Solutions for MTF Alignment Experiment
| Item | Function |
|---|---|
| Broadband Light Source | Matches the spectral range of the spectrometer under test. |
| Michelson Interferometer | Generates an adjustable interference pattern. |
| Beam Splitter | Splits and recombines the light beams to create interference. |
| Reference Mirror (Fixed) | Provides one arm of the interferometer. |
| Moving Mirror | Its precise movement adjusts the OPD to control fringe frequency. |
| Spectrometer Under Test | The device whose alignment is being assessed. |
| Data Acquisition Software | Records the modulated spectra and calculates the MTF. |
Step-by-Step Workflow
- Setup: Arrange the interferometer so that its output is directly coupled to the entrance slit of the spectrometer under test.
- Generate Pattern: For a selected central wavelength, adjust the moving mirror to introduce a specific OPD, creating a sinusoidal intensity pattern on the spectrometer's sensor.
- Acquire Data: Record the modulated spectrum (
I_modulated) and a reference, non-modulated spectrum (I_non-modulated). - Calibrate Signal: Calculate the modulation amplitude at various spatial frequencies:
Modulation = I_modulated / I_non-modulated. - Calculate MTF: The MTF at a given spatial frequency is the ratio of its modulation contrast to the contrast at a very low (baseline) frequency.
- Analyze: A well-aligned spectrometer will show a higher MTF across all spatial frequencies. A drop in MTF, especially at higher frequencies, indicates misalignment or defocus. This through-focus MTF analysis can pinpoint the optimal alignment point [16].
The following workflow diagram illustrates the experimental process for spectrometer alignment verification.
Advanced Validation Techniques and Comparative Technology Assessment
Validating Spectral Resolution with Modulation Transfer Function (MTF) Measurement
Troubleshooting Guides
Guide 1: Resolving Poor Spectral Resolution During Alignment
Problem: During the alignment of a handheld spectrometer, the measured spectral resolution is consistently lower than the manufacturer's specifications. Peaks that should be distinct appear merged, and the overall signal appears blurred.
Explanation: Suboptimal spectral resolution often stems from optical misalignment, where components like mirrors or gratings are not perfectly positioned. This misalignment degrades the system's ability to distinguish between closely spaced wavelengths, which is quantitatively captured by a decline in the Modulation Transfer Function (MTF). The MTF measures the contrast transfer from the object to the image at different spatial frequencies, which correspond to the ability to resolve fine spectral details [16] [69].
Steps for Resolution:
- Verify the Light Source and Path: Before adjusting alignment, ensure the light source is functioning correctly and the optical path is unobstructed. Check for and clean any dirty windows or lenses that could scatter light [3] [70].
- Perform a Through-Focus MTF Measurement: Utilize an interferometer to project a sinusoidal pattern onto the spectrometer's sensor. Capture the modulated spectrum at various focal positions of the spectrometer's lens [16].
- Calculate MTF Curves: For each focal position, compute the percentage of modulation contrast. Plot these values to generate through-focus MTF curves [16].
- Identify the Optimal Focus: The peak of the through-focus MTF curve indicates the focal position that provides the best possible resolution. Adjust the spectrometer's focus to this point [16].
- Iterate for Different Wavelengths: Repeat the through-focus MTF measurement at multiple wavelengths across the spectrometer's operational range to ensure consistent alignment and performance [16].
Guide 2: Addressing High Noise and Inaccurate Quantitative Results
Problem: Spectral data shows unusually high noise levels, leading to unstable baselines and inaccurate concentration readings, particularly in quantitative analysis for drug development.
Explanation: Inaccurate analysis and high noise can be caused by several factors, including insufficient light reaching the detector, contaminated samples, or incorrect calibration. In the context of MTF, a low signal-to-noise ratio can corrupt the edge spread function measurement, leading to an inaccurate calculation of the line spread function and, consequently, an erroneous MTF [69] [3].
Steps for Resolution:
- Check Sample Preparation: Ensure samples are properly prepared. For solid samples, verify the surface is flat and clean. For liquids, confirm the use of correct cuvettes (e.g., quartz for UV measurements) and that the sample is not overly concentrated, which can block light [70].
- Inspect the Light Source: Switch the spectrometer to an uncalibrated mode and observe the full spectrum. A flat or depressed graph in specific regions may indicate a weak or failing light source that needs replacement [70].
- Verify Argon Purity (for OES): If using an optical emission spectrometer, contaminated argon can cause unstable and inconsistent results. Look for a white or milky burn appearance as an indicator [3].
- Reassess MTF Measurement Technique: If using the slanted-edge method for system-level MTF validation, ensure the edge target is of high quality and precisely aligned. The technique is sensitive to noise and edge quality, which can directly impact the results [16] [69].
- Recalibrate: After troubleshooting, perform a full recalibration of the spectrometer using freshly prepared standards, following the software's sequence precisely [3].
Frequently Asked Questions (FAQs)
FAQ 1: What is the fundamental difference between MTF and a simple resolution limit measurement?
MTF provides a much more comprehensive assessment of resolution than a simple limiting resolution measurement. The traditional method of observing a USAF 1951 chart only determines the highest spatial frequency where bar patterns are visibly distinct, which corresponds to a very low MTF (roughly 10-20%). This "vanishing resolution" is a poor indicator of sharpness because it tells you where the detail disappears. In contrast, MTF is a continuous function that quantifies the contrast ratio between the image and the object across all spatial frequencies. Metrics like MTF50 (the frequency where contrast falls to 50%) are superior for comparing system sharpness as they correlate better with perceived image quality and information capacity [69].
FAQ 2: Why is the slanted-edge method preferred for many MTF measurements?
The slanted-edge method, codified in the ISO 12233 standard, is widely preferred because it is accurate, repeatable, and uses space efficiently. By analyzing a high-contrast edge tilted at a small angle, the software can oversample the edge spread function, which is then differentiated to obtain the line spread function. The Fourier transform of this yields the MTF. This method allows for testing multiple field points concurrently and is more resilient to noise and image artifacts compared to other techniques like the simple knife-edge method [69] [71].
FAQ 3: How does spectrometer MTF validation differ from that of a camera lens?
While the underlying principles of MTF are the same, the application differs. For an imaging system, MTF assesses the ability to resolve spatial details (e.g., lines and edges in a scene). For a spectrometer, the focus shifts to spectral resolution—the ability to distinguish between two closely spaced wavelengths. Instead of a spatial test target, a controlled light source with known spectral features (like a monochromatic source or an interferometer-generated sinusoidal pattern) is used. The resulting "image" is the spectrum itself, and the MTF measurement quantifies how sharply narrow spectral lines can be rendered [16] [72].
FAQ 4: What are the pros and cons of different resolution test methods?
The table below compares common methods for validating spectrometer and lens performance.
| Method | Pros | Cons |
|---|---|---|
| MTF Testing (Bench) | High accuracy and precision; excellent for diagnosing aberrations [71]. | Measures one image point at a time; equipment can be expensive [71]. |
| Slanted-Edge MTF | Tests multiple field points concurrently; uses standard (ISO 12233) methodology; good for system-level testing [69] [71]. | Sensitive to illumination uniformity; target selection can be tricky; system-level error can be high [71]. |
| Reverse Projection (e.g., USAF 1951) | Fast, inexpensive, and tests multiple field points at once [71]. | Qualitative and subjective; poor diagnostic capability; insensitive to contrast levels [71]. |
| Sine Pattern / Interferometric | Directly measures system response to pure frequencies; excellent for real-time alignment assessment [16]. | Can require sophisticated equipment like an interferometer [16]. |
Experimental Protocols
Protocol 1: Real-Time MTF Assessment Using an Adjustable Sinusoidal Pattern
This protocol, adapted from current research, is designed for in-line evaluation of a spectrometer's MTF during the alignment process [16].
Principle: A low-coherence interferometer is used to generate sinusoidal intensity patterns directly onto the spectrometer's sensor. By adjusting the optical path difference (OPD) in the interferometer, the spatial frequency of the pattern is controlled [16].
Workflow: The following diagram illustrates the core workflow for this experimental protocol.
Key Materials:
- Broadband Light Source: Matches the spectrometer's spectral range.
- Michelson Interferometer: Or another low-coherence interferometer setup.
- Spectrometer Under Test: The handheld spectrometer being aligned.
- Data Acquisition Software: To control the OPD, capture spectra, and perform calculations.
Procedure:
- Setup: Configure the interferometer to direct its output beam directly into the entrance slit of the spectrometer under test.
- Data Collection: For a set spatial frequency (set by the OPD): a. Capture the modulated spectrum with the interferometer active. b. Capture a non-modulated reference spectrum (e.g., by blocking one interferometer arm). c. Compute the calibrated spectrum by dividing the modulated spectrum by the reference spectrum. This step removes the inherent spectral profile of the light source and spectrometer [16].
- MTF Calculation: From the calibrated spectrum, calculate the percentage of modulation contrast. This value represents the MTF at that specific spatial frequency [16].
- Iterate: Repeat steps 2-3 for a range of spatial frequencies by adjusting the OPD.
- Analysis: Plot the modulation contrast (MTF) against spatial frequency to generate the MTF curve. The curve's roll-off indicates the spectral resolution limit.
Protocol 2: System-Level Verification Using the Slanted-Edge Method
This protocol uses the slanted-edge method to measure the combined MTF of the entire spectrometer system (including optics, sensor, and processing), which is critical for application-specific validation [69] [71].
Principle: A high-contrast sharp edge, tilted at a small angle (typically 2-5 degrees) relative to the sensor's pixel array, is imaged. The slight angle allows for sub-pixel sampling of the edge spread function (ESF). The derivative of the ESF gives the line spread function (LSF), and the Fourier transform of the LSF yields the MTF [69].
Workflow: The diagram below outlines the data processing steps for the slanted-edge method.
Key Materials:
- Slanted-Edge Target: A high-quality target with a sharp, high-contrast edge (e.g., a razor blade or a precision printed target).
- Uniform Illumination Source: To evenly illuminate the edge target.
- Spectrometer with Imaging Capability: The handheld spectrometer must be able to image the target onto its sensor.
- Analysis Software: Software like Imatest or custom code that implements the ISO 12233 algorithm [69].
Procedure:
- Setup: Place the slanted-edge target in the object plane and illuminate it uniformly. Ensure the target is tilted at a known angle (e.g., 5 degrees) relative to the vertical axis of the sensor.
- Image Capture: Use the spectrometer to capture an image of the slanted edge.
- Edge Spread Function (ESF): The software projects the image pixels onto an axis perpendicular to the edge, creating a supersampled, noisy ESF.
- Line Spread Function (LSF): The ESF is differentiated to obtain the LSF, which represents the system's response to an infinitely narrow line of light.
- MTF Calculation: A Fourier transform is applied to the LSF to generate the system's MTF curve. This curve is then normalized to 100% at the zero frequency [69].
The Scientist's Toolkit: Research Reagent Solutions
This table details essential components for setting up the MTF validation experiments described in this guide.
| Item | Function / Explanation |
|---|---|
| Low-Coherence Interferometer | Core component for the sinusoidal pattern method. It generates precise, frequency-tunable interference patterns to probe the spectrometer's transfer function in real-time [16]. |
| Slanted-Edge Target | A high-contrast, sharp edge target is fundamental for the slanted-edge MTF method. Its quality directly impacts the accuracy of the Edge Spread Function measurement [69] [71]. |
| Modulation Transfer Function (MTF) Analysis Software | Specialized software (e.g., Imatest, or custom algorithms) is required to process the captured edge or sine pattern images, perform the Fourier transform, and generate the final MTF curves [69]. |
| USA 1951 Resolution Target | A traditional target for a quick, qualitative check of limiting resolution. While less comprehensive than MTF, it provides a visual reference for system performance [69] [71]. |
| Broadband Light Source | A stable light source covering the spectrometer's operational wavelength range is necessary for both calibration and measurement phases [16] [70]. |
| Calibrated Reference Materials | Samples with known, stable spectral features (e.g., rare-earth glasses or certified gases) are used to verify the wavelength accuracy and overall performance of the spectrometer after alignment [3]. |
Real-Time Alignment Assessment Using Interferometer-Generated Sine Patterns
Troubleshooting Guides and FAQs
Common Alignment Issues and Solutions
| Problem | Possible Causes | Diagnostic Method | Solution |
|---|---|---|---|
| Low Spectral Signal-to-Noise Ratio (SNR) [73] | Poor motion quality of the moving mirror; Erroneous motion in the drive subsystem [73] | Analyze the 100% line; Compare output spectra from systems with different motion qualities [73] | Improve the mechanical drive components; Optimize the motion system design to follow the ideal path more closely [73] |
| No Interference Fringes [74] | Path length difference exceeds the coherence length of the source; Mirrors are misaligned [74] | Check that the two beams from the beamsplitter are coincident on the viewing screen [74] | Ensure the path length difference is less than the source's coherence length; Adjust the kinematic knobs on the mirrors to align the two beams [74] |
| Fringes Unstable or Blurry [74] | Mechanical vibrations; Loose components; Unstable light source [74] | Visually inspect the fringe pattern for jitter or drift; Check the stability of all mounts and the optical table [74] | Secure all components; Use a vibration-isolated optical table; Ensure the laser source is stable [74] |
| Inaccurate Stokes Parameter Measurement [6] | Angular misalignment of optical axes; Suboptimal LCVR driving voltages; Optical response errors of components [6] | Calibration experiment using waveplates; Compare experimental Stokes values with theoretical calculations [6] | Carefully align the axes of all optical components; Calibrate LCVR driving voltages; Use RMSE analysis to quantify and correct errors [6] |
Frequently Asked Questions (FAQs)
Q1: What does "motion quality" mean in the context of an interferometer, and why is it critical? Motion quality refers to the proximity of the path of the actual motion of the moving mirror to an ideal one. The ideal system has motion in only one degree of freedom. Poor motion quality is a major source of error that can severely limit the spectral SNR of your results [73].
Q2: How can I accurately measure and correct for errors in a polarized hyperspectral imaging system? A two-stage calibration is effective. First, use a spectrometer to measure intensities and calculate Stokes parameters, isolating errors from polarization components. Then, replace the spectrometer with your hyperspectral camera to assess the additional error it introduces. Use half-wave and quarter-wave plates as samples, rotating them through a series of angles to compare your experimental Stokes parameters against theoretical values. The Root Mean Square Error (RMSE) is a useful metric for this quantification [6].
Q3: What is the most reliable way to align the mirrors in a Michelson interferometer to see interference fringes? Align the laser and first mirror opposite each other first. Adjust the mirror to be normal to the beam so it reflects directly back to the laser. Introduce the beamsplitter so that 50% of the light is reflected onto the second mirror at a 90-degree angle. Align the second mirror so that its reflected beam is coincident with the beam from the first mirror on the viewing screen. Fine-tune the mirrors using the kinematic mounts until clear interference fringes are observed [74].
Q4: My interferometer is set up, but the fringes are faint. What should I check? Confirm the output power of your laser is sufficient. Ensure that the beamsplitter is a 50/50 cube for a balanced split of light. Check for dirt on optical surfaces, especially the beamsplitter hypotenuse, and clean components using proper procedures (e.g., with Fingercots). Make sure your viewing screen is placed correctly to catch both overlapping beams [74].
Experimental Data and Protocols
Quantitative Calibration Data for PHSI System Error Analysis
This data is crucial for validating the accuracy of an optical system like a handheld spectrometer.
| Calibration Sample | Retarder Type | Measured Parameter | Root Mean Square Error (RMSE) Source [6] |
|---|---|---|---|
| Waveplate [6] | Half-Wave (λ/2) | Stokes Parameters (Sâ‚€, Sâ‚, Sâ‚‚, S₃) | Errors from angular misalignment and LCVR retardance [6] |
| Waveplate [6] | Quarter-Wave (λ/4) | Stokes Parameters (Sâ‚€, Sâ‚, Sâ‚‚, S₃) | Errors from angular misalignment and LCVR retardance [6] |
| Intralipid Phantom [6] | N/A | Polarization Metrics (DOP, DOLP, DOCP) | System's ability to correlate concentration to polarization intensity [6] |
Detailed Experimental Protocols
Protocol 1: PHSI System Calibration Using Waveplates [6]
Objective: To evaluate the experimental errors introduced by the optical components and the camera in a Polarized Hyperspectral Imaging (PHSI) system.
- Setup:
- Illuminate a linear polarizer (transmissive axis at 45°) with a broadband light source.
- Place the sample (half-wave or quarter-wave plate) after the polarizer.
- Position the PHSI probe (containing the polarization analyzer: LCVR1, LCVR2, and LP2) after the sample.
- Stage 1 - Polarization Component Error:
- Use a high-sensitivity spectrometer as the light detector.
- For each waveplate sample, rotate its fast axis from 0° to 180° in 10° increments.
- At each angle, apply different driving voltages to the LCVRs to acquire a set of four intensity values (IH, IV, I45, ILC).
- Calculate the experimental Stokes parameters from these intensities.
- Stage 2 - Hyperspectral Camera Error:
- Replace the spectrometer with the snapshot hyperspectral camera.
- Repeat the intensity acquisition process for the waveplate rotations.
- Extract intensity values for each of the 16 spectral bands (460–600 nm).
- Data Analysis:
- Calculate the theoretical Stokes parameters for each waveplate at each angle using their Mueller matrices.
- Compute the Root Mean Square Error (RMSE) between the experimental and theoretical Stokes values using the formula:
RMSE = √[ Σ(S_i,exp - S_i,theory)² / N_θ ][6] - Compare the RMSE from Stage 1 and Stage 2 to isolate errors from the camera.
Protocol 2: Validation Using Intralipid Phantoms [6]
Objective: To validate the assembled handheld PHSI probe's ability to detect different levels of light scattering and absorption, simulating tissue.
- Phantom Preparation:
- Prepare an Intralipid 20% fat emulsion as a scattering agent.
- Prepare a Methylene Blue (MB) stock solution at 400 μM as an absorbing agent.
- Create multiple samples with Intralipid concentrations varying from 1% to 12% (v/v) and MB concentrations from 0 to 4 µM.
- Image Acquisition:
- Use the handheld PHSI probe to acquire images of the various phantom samples.
- Operate the software to automatically acquire the four required intensity images and a reference image.
- Data Processing:
- Process the acquired images to calculate the Stokes parameters (S0, S1, S2, S3).
- Derive polarization metrics: Degree of Polarization (DOP), Degree of Linear Polarization (DOLP), and Degree of Circular Polarization (DOCP).
- Validation:
- Analyze the correlation between the concentration of the Intralipid solution and the intensity of the calculated polarization metrics.
The Scientist's Toolkit
Research Reagent Solutions
| Item | Function / Application in Alignment Research |
|---|---|
| Intralipid 20% Fat Emulsion [6] | A standardized scattering agent used to create tissue-simulating phantoms for validating imaging systems like PHSI. |
| Methylene Blue (MB) [6] | An absorbing agent used in conjunction with Intralipid in phantoms to simulate a wide range of tissue optical properties. |
| Half-Wave (λ/2) and Quarter-Wave (λ/4) Plates [6] | Precision optical components used as calibrated samples during system error analysis and Stokes parameter calibration. |
| Cube Beamsplitter, 25mm, 50R/50T [74] | Core component in a Michelson interferometer that splits a single light beam into two paths and recombines them to generate interference. |
| λ/10 Mirror, 25.4mm Diameter [74] | High-quality mirror with minimal surface flatness error, crucial for maintaining wavefront fidelity and generating clean interference patterns. |
| Liquid Crystal Variable Retarders (LCVRs) [6] | Electrically controlled optical components that allow for rapid, non-mechanical modulation of polarization states in advanced imaging systems. |
Workflow and System Diagrams
SCT+ Alignment and Validation Workflow
Handheld PHSI Probe Assembly
Michelson Interferometer Setup
Troubleshooting Guides
FAQ: Addressing Common Operational Challenges
Q1: Our spectra consistently show high noise levels. What are the primary causes and solutions?
High noise can originate from instrumental, environmental, or sample-related issues.
- Instrumental Causes: Aging light sources (FTIR deuterium lamps, Raman lasers), detector malfunction, or incorrect settings (e.g., insufficient laser power in Raman, inadequate scans in FTIR) [75].
- Environmental Causes: Electronic interference from nearby equipment, mechanical vibrations, or fluctuating ambient light [76] [75].
- Solutions:
Q2: Why are expected peaks missing or suppressed in our spectra?
Missing peaks often indicate issues with sensitivity, sample preparation, or instrument calibration.
- FTIR: Can be caused by insufficient sample contact with the ATR crystal, a contaminated crystal, or incorrect background subtraction [76].
- Raman: May result from fluorescence overwhelming the Raman signal, sample degradation from excessive laser power, or detector sensitivity drift [75] [77].
- Solutions:
- (FTIR) Clean the ATR crystal thoroughly and acquire a fresh background spectrum [76].
- (Raman) Employ fluorescence mitigation strategies such as using a near-infrared laser or photobleaching the sample prior to measurement. Adjust laser power to balance signal and sample integrity [75].
- For both techniques, regularly calibrate the wavelength/wavenumber axis using certified standards [77].
Q3: How can we resolve persistent baseline drift or instability?
A drifting baseline suggests an unstable optical or electronic system.
- Primary Causes: FTIR instruments can experience baseline drift due to thermal expansion misaligning the interferometer or inadequate purging, leading to spectral contributions from atmospheric COâ‚‚ and water vapor [75]. In UV-Vis and other systems, a light source that has not reached thermal equilibrium is a common culprit [75].
- Solutions:
Q4: When using dual-technology for verification, the results from FTIR and Raman are conflicting. How should we proceed?
FTIR and Raman are complementary techniques, with different sensitivities to molecular vibrations. "Conflicting" results can reveal complex sample properties.
- Interpretation: FTIR is highly sensitive to polar functional groups and asymmetric vibrations, while Raman excels at detecting non-polar bonds and symmetric vibrations [78]. A substance rich in homo-nuclear bonds (e.g., C=C, S-S) may yield a weak FTIR signal but a strong Raman band, and vice-versa.
- Action Plan:
- Leverage the Discrepancy: Use the combined data to build a more complete molecular fingerprint. The absence of a signal in one technique and its presence in the other is itself valuable information [78].
- Verify Library Matching: Manually search the instrument's library for the declared compound. A failure to match in one technology may be resolved by a confident match in the other [78].
- Escalate Analysis: Utilize manufacturer "reachback" services or advanced software capable of interpreting fused FTIR and Raman data to resolve complex mixtures [78].
Experimental Protocols for Alignment and Performance Verification
Robust alignment is critical for data quality. The following protocols can be integrated into routine verification procedures.
Protocol 1: Real-Time MTF Assessment for Spectrometer Alignment
This methodology allows for in-line evaluation of a spectrometer's modulation transfer function (MTF) during the alignment process, providing a quantitative measure of resolution [16].
- Objective: To assess the field-dependent and through-focus MTF characteristics of a spectrometer in real-time.
- Principle: A sinusoidal pattern with an adjustable spatial frequency is generated on the spectrometer's sensor using a low-coherence interferometer (e.g., Michelson type). The contrast of this pattern is directly related to the MTF [16].
- Materials:
- Broadband light source matching the spectrometer's range
- Michelson interferometer setup
- Spectrometer under test
- Data processing software
- Methodology:
- Direct light from the broadband source into the interferometer.
- Adjust the Optical Path Difference (OPD) in the interferometer to control the spatial frequency of the interference fringes projected onto the spectrometer's detector.
- Capture the modulated spectrum and a corresponding non-modulated spectrum.
- Calculate the percentage of modulation contrast, which is proportional to the MTF, at different spatial frequencies and focal positions.
- Use the decay of modulation contrast with increasing spatial frequency to evaluate spectral resolution and optimal alignment [16].
Workflow for MTF-based Alignment Verification
Protocol 2: System Calibration Using Wave Plates
This procedure quantifies experimental error in a polarized hyperspectral imaging (PHSI) system, which is analogous to validating the polarization-sensitive components in advanced spectrometers [6].
- Objective: To evaluate errors introduced by optical components and the camera in a polarization-sensitive system.
- Materials:
- Linear polarizer
- Half-wave plate and quarter-wave plate
- High-sensitivity spectrometer or the hyperspectral camera itself
- Stable light source
- Methodology:
- Place a linear polarizer (transmissive axis at 45°) after the light source.
- Install a half-wave or quarter-wave plate as the sample.
- Rotate the fast axis of the waveplate from 0° to 180° in 10° increments.
- At each angle, apply different driving voltages to the system's liquid crystal variable retarders (LCVRs) to acquire a set of four intensity values (e.g., IH, IV, I45, ILC).
- Calculate the experimental Stokes parameters from these intensities.
- Compare the experimental Stokes vectors with the theoretical values calculated from the Mueller matrices of the components.
- Compute the Root Mean Square Error (RMSE) as a measure of system error [6].
The Scientist's Toolkit: Key Research Reagent Solutions
The following reagents are essential for the calibration and validation experiments described in the protocols.
Table: Essential Reagents for Spectrometer Verification
| Reagent/Material | Function in Experiment | Key Application |
|---|---|---|
| Intralipid Solution | Acts as a tissue-mimicking phantom that replicates light scattering properties of biological samples [6]. | Validation of system performance in detecting varying levels of light scattering [6]. |
| Methylene Blue | Serves as a controlled absorbing agent in phantom experiments [6]. | Used with Intralipid to simulate a wide range of tissue optical properties [6]. |
| Half/Quarter Wave Plates | Optical components used to precisely control the polarization state of light [6]. | Calibration of polarization-sensitive systems and quantification of experimental errors [6]. |
| Wavenumber Standard (e.g., 4-acetamidophenol) | Provides a reference with a high number of known, sharp peaks across a wavenumber region [77]. | Wavenumber calibration of Raman spectrometers to correct for systematic drifts [77]. |
| Mercury-Argon Lamp | Emits light at specific, known wavelengths [40]. | Spectral calibration of hyperspectral imagers to establish the pixel-to-wavelength relationship [40]. |
Data Presentation: Comparative Analysis
The core of the dual-technology verification lies in understanding the complementary strengths and weaknesses of each technique.
Table: Quantitative Comparison of FTIR and Raman Spectroscopy
| Parameter | FTIR Spectroscopy | Raman Spectroscopy |
|---|---|---|
| Fundamental Principle | Measures absorption of infrared light [76] | Measures inelastic scattering of monochromatic light [77] |
| Sensitivity to Vibrations | Excellent for polar functional groups & asymmetric vibrations (e.g., C=O, O-H, N-H) [78] | Excellent for non-polar bonds & symmetric vibrations (e.g., C=C, S-S, ring breathing) [78] |
| Sample Preparation | Minimal for ATR; may require pressing pellets for transmission mode | Typically minimal; can be analyzed through glass/plastic containers [78] |
| Common Spectral Anomalies | Baseline drift from water vapor/COâ‚‚; contaminated ATR crystal; instrument vibrations [76] [75] | Fluorescence interference; sample burning from laser; cosmic spikes [77] [75] |
| Key Troubleshooting Checks | Check purge gas; clean ATR crystal; acquire fresh background; ensure interferometer integrity [76] [75] | Adjust laser power; employ fluorescence quenching; validate wavelength calibration; check for cosmic spikes [77] [75] |
| Typical Spectral Range | Mid-IR (e.g., 4000 - 400 cmâ»Â¹) | Varies with laser, often 50 - 4000 cmâ»Â¹ relative to laser line |
| Water Compatibility | Strong water absorption can interfere with aqueous samples | Weak water signal, suitable for analyzing aqueous solutions |
Troubleshooting Pathway for Spectral Anomalies
Leveraging Machine Learning and Surrogate Models for Automated Alignment
FAQs: Core Concepts
Q1: What is automated alignment in spectrometry, and why is it a problem? Spectrometer alignment ensures the wavelength (x-axis) and intensity (y-axis) readings are accurate. Misalignment causes incorrect data, impacting all downstream analysis. Traditional manual alignment is slow, prone to human error, and difficult to maintain across numerous devices, especially in handheld units subject to environmental variations and physical shocks [51] [13] [79].
Q2: How can machine learning (ML) and surrogate models address this challenge? ML algorithms can learn the complex, non-linear relationship between a spectrometer's raw signal and its ideal, aligned output. A surrogate model acts as a fast, software-based stand-in for the physical instrument. Once trained, this model can automatically correct raw measurements, compensating for instrumental drift, optical imperfections, and environmental noise in real-time, enabling robust automated alignment [80] [81].
Q3: What are the data requirements for building such a model? Building an effective model requires a dataset that captures the instrument's behavior across its operational range. This includes measurements of known calibration standards (e.g., holmium oxide) at various alignment states. The model learns from the differences between the measured spectra of these standards and their certified, "ground truth" spectra [13] [81].
Q4: My ML-corrected spectra are noisy. What could be wrong? Noise in corrected data often points to issues in the training data or light source problems. Ensure your calibration standards are clean and properly measured. Verify the spectrometer's light source is functioning correctly and that the light path is unobstructed. Noisy input data will lead to a noisy correction model. Also, confirm that sample concentrations are within the instrument's optimal absorbance range (typically 0.1-1.0 AU) to avoid signal saturation [51] [82].
Troubleshooting Guides
Issue 1: Model Fails to Generalize to New Samples
Symptoms: The alignment correction works well on calibration standards but performs poorly on unknown samples.
| Possible Cause | Diagnostic Steps | Solution |
|---|---|---|
| Insufficient Training Variety | Audit training data: does it cover all relevant wavelength ranges and expected signal intensities? | Expand the training set to include a wider variety of reference materials and simulated conditions [81]. |
| Overfitting | Check performance: high accuracy on training data but low on validation/test data. | Simplify the model architecture (e.g., reduce polynomial degree) or increase regularization [81]. |
| Domain Shift | Compare the physical characteristics (e.g., sample type, container) of new samples versus training samples. | Retrain the model with data that better matches the new sample domain or use domain adaptation techniques [83]. |
Issue 2: High Alignment Error After Model Application
Symptoms: The root-mean-square error (RMSE) between the corrected spectrum and the reference remains unacceptably high.
| Possible Cause | Diagnostic Steps | Solution |
|---|---|---|
| Incorrect Ground Truth Data | Re-measure certified reference materials (SRMs) to verify their values. | Source and use traceable, certified reference materials from organizations like NIST (e.g., SRM 2034, SRM 2036) [13]. |
| Underlying Hardware Fault | Perform diagnostic checks: inspect light source output, check for dirty windows/fiber optics, verify argon purity. | Clean optical components, replace faulty parts (e.g., light source, pump), and use high-purity argon [51] [3] [82]. |
| Poor Model Architecture Choice | Benchmark different algorithms (e.g., Polynomial Regression vs. Neural Networks) on a validation set. | Experiment with more complex models like Graph Neural Networks or Transformers, which can better capture non-linear distortions [80] [81]. |
Issue 3: Calibration Failure or Inconsistent Results
Symptoms: The spectrometer won't calibrate, or results vary dramatically between consecutive measurements of the same sample.
| Possible Cause | Diagnostic Steps | Solution |
|---|---|---|
| Insufficient Light | Check the uncalibrated light spectrum for a flatlined or unusually low signal. | Ensure the sample is not over-concentrated, use correct cuvette type (e.g., quartz for UV), and replace a weak/degraded light source [82]. |
| Contaminated Sample or System | Inspect the burn spot; a white, milky appearance suggests contamination. | Regrind samples with a clean pad, avoid touching samples with bare hands, and ensure argon supply is pure [3]. |
| Poor Probe Contact | Listen for unusually loud burning sounds and observe if bright light escapes from the probe. | Increase argon flow pressure, use seals for convex surfaces, or get a custom-built probe head for irregular shapes [3]. |
Experimental Protocols
Protocol 1: Generating a Training Dataset for an Alignment Surrogate Model
This protocol details the creation of a robust dataset for training a machine learning model to correct geometric and spectral distortions in a multi-channel imaging system or spectrometer.
Key Reagent Solutions:
| Material | Function | Example & Specification |
|---|---|---|
| Certified Wavelength Standards | Provides ground truth for x-axis (wavelength/wavenumber) alignment. | Holmium Oxide (Ho₂O₃) solution or glass traceable to NIST SRM 2034 [13]. |
| Polystyrene Film | A stable solid standard with known absorption peaks for verifying NIR spectrometer alignment [13]. | Highly crystalline polystyrene, 1.0 mm thickness [13]. |
| Reflectance Standard | Provides ground truth for alignment in diffuse reflectance mode. | NIST SRM 2036 glass with PTFE backing [13]. |
Methodology:
- Setup: Place the calibration standard (e.g., a grid pattern for image alignment, holmium oxide for spectrometry) in the measurement area. Ensure stable environmental conditions (temperature, humidity) [51] [81].
- Data Acquisition:
- For image alignment, capture images of the grid pattern across all channels of the multi-channel system. Precisely determine the coordinates of the markers in each image [81].
- For spectrometry, collect high-resolution spectra (absorbance/transmittance/reflectance) of the certified reference materials. Perform multiple scans to account for instrument noise.
- Reference Data Generation: For each measurement, the known, certified properties of the standard (e.g., precise peak positions for holmium oxide, ideal grid coordinates) serve as the ground truth or target output for the model [13].
- Feature-Target Pairing: The raw, uncorrected data from the instrument (e.g., measured peak locations, distorted marker coordinates) are the input features. The difference between these raw values and the certified reference values becomes the target variable for the model to learn [81].
- Dataset Splitting: Randomly split the collected data pairs into training (~70%), validation (~15%), and test (~15%) sets to enable proper model training and evaluation.
Protocol 2: Implementing a Hybrid ML Surrogate for a Transportation Agent-Based Model
This protocol applies the surrogate model concept to a transportation policy context, where a slow agent-based simulation is replaced by a fast, accurate ML surrogate.
Methodology:
- Base Simulation: Run a high-fidelity agent-based model (e.g., MATSim) numerous times with varied input parameters (e.g., street capacity reductions, traffic demand) to generate training data. Each run produces a specific outcome (e.g., average traffic flow) [80].
- Graph Construction: Represent the transportation network as a graph where nodes are intersections and edges are road segments. This structure is naturally processed by Graph Neural Networks (GNNs) [80].
- Model Training: Train a hybrid neural network architecture (e.g., combining GNNs and Transformers) on the simulation data. The model learns to predict the simulation's outcome (e.g., traffic flow) directly from the input policy parameters and the network graph [80].
- Validation & Deployment:
- Validate the surrogate by comparing its predictions against held-out runs from the full agent-based model. The surrogate should achieve high accuracy with a significantly lower computational cost [80].
- Once validated, the surrogate model can be used for rapid policy testing and optimization, allowing researchers to explore thousands of scenarios almost instantaneously.
Workflow and Signaling Pathways
Automated Alignment Workflow
ML Surrogate Model Structure
Establishing a QA/QC Program with Control Charts and Periodic CRM Re-checks
This technical support center provides guidance on establishing a robust Quality Assurance and Quality Control (QA/QC) program, specifically for research involving handheld spectrometers. The following guides and FAQs address common issues and provide detailed methodologies to ensure data integrity and instrument reliability.
Troubleshooting Guides
Guide 1: Troubleshooting Weak or Inconsistent Spectrometer Signals
Problem: The Raman or spectral signal is weak, noisy, or inconsistent, making reliable data collection difficult [59].
Solution:
- Check Laser Power: Ensure the laser power is set appropriately for your sample. Low power can result in weak signals [59].
- Clean Optics: Dust, fingerprints, or debris on the sampling window or optics can scatter light. Clean these components regularly with a lint-free cloth and optical-grade cleaning solution [59].
- Verify Focus and Alignment: Ensure the laser beam is correctly focused on the sample and that all optical components are properly aligned. Misalignment is a common source of signal loss. Refer to the instrument’s manual for specific alignment procedures [59].
- Optimize Integration Time: Adjust the integration time to improve the signal-to-noise ratio. Longer times can enhance signal but increase measurement duration [59].
- Minimize Ambient Light: Perform measurements in a darkened environment or use light shielding to reduce interference from ambient light sources [59].
Guide 2: Resolving Control Chart Alarms and Out-of-Control Signals
Problem: Your control chart indicates an "out-of-control" process, suggesting unexpected variation in your measurement system [84] [85].
Solution:
- Identify the Signal: Recognize common out-of-control signals [85]:
- A single data point outside the upper control limit (UCL) or lower control limit (LCL).
- Two out of three successive points on the same side of the centerline and farther than 2σ from it.
- A run of eight or more consecutive points on the same side of the centerline.
- Investigate the Cause: Immediately investigate the specific data point(s) and your process. Document everything you find.
- Check for Sample Mix-ups: If using multiple Certified Reference Materials (CRMs), overlay them on the same control chart. A "failed" point that aligns perfectly with the certified value of a different CRM strongly suggests sample misidentification or swapping during submission [86].
- Inspect Instrumentation: Check for recent calibration drift, weak spectrometer signals (see Guide 1), or changes in environmental conditions (e.g., temperature, humidity) [59].
- Review Procedures: Ensure no deviations from standard operating procedures for sample preparation and measurement occurred.
- Implement Corrective Action: Address the root cause, whether it's re-training staff, re-calibrating the instrument, or improving sample handling protocols.
Guide 3: Addressing Spectrometer Calibration Drift
Problem: Calibration drifts over time, leading to inaccurate wavelength or intensity readings [59].
Solution:
- Regular Calibration: Adhere strictly to the manufacturer's recommended calibration schedule and procedures [59].
- Use Certified Reference Materials (CRMs): Regularly verify instrument performance against CRMs with known spectral signatures. Compare your measured spectra to the reference spectra to identify and quantify drift [59].
- Update Software/Firmware: Ensure your instrument's software and firmware are up-to-date, as updates often include improvements to calibration algorithms [59].
- Control Environmental Conditions: Maintain a stable temperature and humidity in the lab, as environmental factors can impact calibration stability [59].
Frequently Asked Questions (FAQs)
FAQ 1: What is the difference between Quality Assurance (QA) and Quality Control (QC) in a laboratory setting?
Answer: QA and QC are complementary components of a quality management system but have distinct focuses [87] [88].
- Quality Assurance (QA) is process-oriented and proactive. It involves establishing processes, procedures, and standards to prevent defects and ensure quality is built into the workflow from the beginning. Examples include staff training, documentation, and process design [87] [88].
- Quality Control (QC) is product-oriented and reactive. It involves the operational techniques and activities used to fulfill quality requirements and detect defects in the outputs. Examples include testing samples, running CRMs, and analyzing control charts to verify data quality [87] [88].
FAQ 2: How often should we re-check Certified Reference Materials (CRMs) in our QA/QC program?
Answer: The frequency of CRM re-checks depends on your process stability, risk assessment, and sample throughput. A common practice is to include a CRM in every batch of samples analyzed. For continuous processes, a CRM should be analyzed at a predetermined periodic interval (e.g., every 10-20 samples or at the start and end of each shift). The data from these CRM checks should be plotted on your control charts in real-time to continuously monitor performance [86].
FAQ 3: Which control chart should I use for my data?
Answer: The choice of control chart depends on the type of data you are collecting [84].
| Data Type | Description | Recommended Control Chart |
|---|---|---|
| Continuous/Variable | Data that can be measured on a continuous scale (e.g., concentration, intensity, wavelength). | I-MR Chart (Individuals and Moving Range): Best for single observations collected over time [84]. |
| Xbar-R Chart (Average and Range): Used when measurements can be rationally grouped into subgroups [84]. | ||
| Discrete/Attribute | Data that is counted (e.g., pass/fail, number of defects). | p-Chart: For tracking the proportion of defective units [84]. |
| u-Chart: For tracking the number of defects per unit when the sample size can vary [84]. | ||
| c-Chart: For tracking the total count of defects when the sample size is constant [84]. |
FAQ 4: Our control charts are in control, but our measurements are consistently off from the CRM's certified value. What does this mean?
Answer: This situation indicates that your measurement process is precise (stable) but not accurate. Your system is producing consistent results (in control), but there is a consistent bias away from the true value. This is often caused by a systematic error, such as an incorrect calibration, a flaw in the measurement method, or an unaccounted-for matrix effect. Investigation and correction of this bias is required, which may involve re-calibrating your instrument or reviewing your sample preparation methodology.
Experimental Protocols & Data Presentation
Protocol: Handheld Spectrometer Alignment Verification Procedure
This protocol is designed for the periodic verification of a handheld spectrometer's optical alignment, a critical aspect of the broader thesis research on spectrometer verification.
1.0 Objective: To verify the correct optical alignment of a handheld spectrometer using wave plates and ensure minimal system error.
2.0 Materials and Equipment:
- Handheld spectrometer (e.g., polarized hyperspectral imaging system) [6].
- Broadband light source (e.g., xenon light source with fiber guide) [6].
- Linear polarizer.
- Quarter-wave plate and half-wave plate.
- High-sensitivity spectrometer (for initial error assessment) [6].
- Rotation stage.
3.0 Methodology:
- Setup: Align the broadband light source, a linear polarizer (set at 45°), the sample wave plate (on the rotation stage), the spectrometer probe, and the light detector in sequence [6].
- Polarization Analyzer Error Assessment:
- Use a high-resolution spectrometer as the detector.
- Place a half-wave plate as the sample.
- Rotate the fast axis of the waveplate from 0° to 180° in 10° increments.
- At each angle, apply different driving voltages to the liquid crystal variable retarders (LCVRs) in the probe to acquire a set of four intensity values (IH, IV, I45, ILC) [6].
- Repeat the process using a quarter-wave plate.
- Calculate the experimental Stokes parameters (Sexp) from the intensity values.
- Calculate the theoretical Stokes parameters (Stheory) for each angle using the Mueller matrix equations for a half-wave plate (Eq. 1) and quarter-wave plate (Eq. 2) [6].
- Hyperspectral Camera Error Assessment:
- Replace the high-resolution spectrometer with the instrument's snapshot hyperspectral camera.
- Repeat the intensity measurements for both wave plates across the 16 spectral bands (460–600 nm).
- Extract intensity values from the images to calculate Stokes parameters [6].
- Data Analysis:
- For both stages, calculate the Root Mean Square Error (RMSE) between the experimental and theoretical Stokes vectors across all angles (Nθ=19) for each Stokes parameter (i=0,1,2,3) using the formula [6]:
RMSE = √[ Σ(S_i,exp - S_i,theory)² / Nθ ]
- For both stages, calculate the Root Mean Square Error (RMSE) between the experimental and theoretical Stokes vectors across all angles (Nθ=19) for each Stokes parameter (i=0,1,2,3) using the formula [6]:
| Sample Size (n) | d2 | D3 | D4 |
|---|---|---|---|
| 2 | 1.128 | -- | 3.268 |
| 3 | 1.693 | -- | 2.574 |
| 4 | 2.059 | -- | 2.282 |
| 5 | 2.326 | -- | 2.114 |
| 6 | 2.534 | -- | 2.004 |
| 7 | 2.704 | 0.076 | 1.924 |
| 8 | 2.847 | 0.136 | 1.864 |
| Wave Plate Type | RMSE (Polarization Analyzer Only) | RMSE (With Hyperspectral Camera) | Key Performance Insight |
|---|---|---|---|
| Half-Wave Plate | [Insert Experimental Value] | [Insert Experimental Value] | Quantifies error in measuring linear polarization states. |
| Quarter-Wave Plate | [Insert Experimental Value] | [Insert Experimental Value] | Quantifies error in measuring circular and linear polarization states. |
The Scientist's Toolkit: Research Reagent Solutions
| Reagent/Material | Function in QA/QC and Spectrometry |
|---|---|
| Certified Reference Materials (CRMs) | Provides an independent benchmark for assessing the accuracy and long-term stability of analytical measurements. Plotted on control charts to monitor process control [86]. |
| Intralipid Phantom | A stable suspension used to simulate the scattering properties of biological tissues. Validates the performance of imaging systems like handheld spectrometers under controlled conditions [6]. |
| Methylene Blue | Used as an absorbing agent in combination with Intralipid to create tissue-simulating phantoms with controlled scattering and absorption properties [6]. |
| Quarter-Wave & Half-Wave Plates | Optical components used for the calibration and validation of polarization-based spectrometers. They help quantify system errors by providing known polarization states [6]. |
Workflow and Relationship Diagrams
QA/QC Program with Control Charts and CRM Checks
Data Flow for CRM Verification
Performance Benchmarking Against Laboratory-Based Instrumentation
This technical support guide provides researchers and scientists with practical methodologies and troubleshooting advice for verifying the performance of handheld spectrometers against laboratory-based instrumentation.
Frequently Asked Questions
1. How can I quickly verify my handheld spectrometer's calibration in the field? The most reliable method is to use the reference standard supplied with your instrument. This sample was used for factory calibration. Perform at least ten assays on this standard, moving the measurement aperture to different areas. If the average elemental results fall within the specified minimum/maximum range, the device is working properly. If results are off, first clean the sample and the instrument's protective window, and ensure the correct assay type is selected in the software [89].
2. What is a key advantage of industrialized NIRS equipment over laboratory equipment?
A recent comparative study on crop straw analysis found that industrialized Near-Infrared Spectroscopy (NIRS) equipment can outperform laboratory equipment for predicting certain properties, such as Volatile Matter (VM) content. Industrialized devices demonstrated superior performance metrics (R²Pred = 0.96, SEP = 0.41) compared to laboratory devices (R²Pred = 0.93, SEP = 0.51), while also offering advantages in online monitoring capability and stability in harsh industrial environments [90].
3. My spectrometer results are inconsistent. What are the most common causes? Inconsistent readings can stem from several factors. Common issues include an aging or failing light source, a dirty or misaligned sample cuvette, debris in the light path, or an improperly executed blank measurement. Always ensure the instrument has adequate warm-up time, use clean and correctly positioned cuvettes, and perform regular calibration with certified reference standards [91]. For handheld XRF analyzers, variations can also be caused by sample non-uniformity, high humidity, or changes in altitude [89].
4. How can I drastically reduce spectrometer alignment time? A novel machine learning approach can reduce alignment time from approximately one hour to just a few minutes. This method uses a neural network trained on simulated ray-tracing data to determine the optimal positions for optical components. The process involves recording a small number of measurements (10-25) in the search space, which an optimizer then uses to find the best alignment by minimizing the difference between the measured data and the neural network's predictions [12].
5. What is a modern method for assessing spectrometer alignment and resolution? The Modulation Transfer Function (MTF) is a widely used technique. A novel real-time method uses a low-coherence interferometer to project a sinusoidal pattern with adjustable spatial frequency onto the spectrometer's sensor. By analyzing the contrast of this pattern at different frequencies, the MTF can be calculated, providing a quantitative measure of spectral resolution and alignment quality without significantly interfering with the spectrometer's internal layout [16].
Quantitative Benchmarking Data
The following table summarizes key findings from a direct comparison of laboratory and industrialized NIRS equipment for predicting proximate compositions in crop straw, based on a study of 250 samples [90].
Table 1: Performance Comparison of Laboratory vs. Industrialized NIRS Equipment
| Performance Metric | Volatile Matter (VM) Prediction | Ash Content Prediction | ||
|---|---|---|---|---|
| Laboratory Device | Industrialized Device | Laboratory Device | Industrialized Device | |
| Coefficient of Determination (R²Pred) | 0.93 | 0.96 | 0.95 | 0.93 |
| Standard Error of Prediction (SEP) | 0.51 | 0.41 | 0.21 | 0.26 |
| Key Advantage | High signal-to-noise ratio in controlled settings | Superior prediction accuracy & operational stability | High accuracy for ash content | Robust performance, suitable for online use |
Detailed Experimental Protocols
Protocol 1: Real-Time MTF Measurement for Spectrometer Alignment
This protocol assesses spectrometer resolution and alignment by measuring the Modulation Transfer Function (MTF) [16].
- Objective: To evaluate the field-dependent and through-focus MTF characteristics of a spectrometer during its alignment process in real-time.
- Principle: A sinusoidal pattern is generated on the spectrometer's sensor using a low-coherence interferometer (e.g., Michelson type). The frequency of this pattern is controlled by adjusting the Optical Path Difference (OPD) in the interferometer. The MTF is derived from the contrast of this pattern.
- Procedure:
- Setup: Direct a broadband light source into a Michelson interferometer. The output light, which contains an amplitude-modulated spectrum, is then directed into the spectrometer under test.
- Pattern Generation: Adjust the OPD of the interferometer to generate sinusoidal patterns with different spatial frequencies on the spectrometer's line-sensor.
- Data Collection: For each spatial frequency, capture the modulated spectrum and a separate non-modulated spectrum for calibration.
- MTF Calculation: Divide the modulated spectrum by the non-modulated spectrum to obtain a calibrated spectrum. The percentage of modulation contrast within different spectral windows is then computed to determine the MTF.
Workflow for Real-Time MTF Measurement
Protocol 2: Field Verification of Handheld XRF Analyzer Performance
This procedure verifies the proper functioning and calibration of a handheld X-ray fluorescence (XRF) analyzer using a reference standard [89].
- Objective: To confirm that a handheld XRF analyzer is providing accurate and precise results in a field setting.
- Principle: The instrument's current performance is checked against a known reference material that was used to calibrate it at the factory.
- Procedure:
- Preparation: Locate the provided reference standard (e.g., a metal disk like Stainless 2205). Ensure the sample is clean; wipe with isopropyl alcohol if necessary to remove oils or dirt.
- Instrument Check: Inspect the instrument's nose to ensure the protective window is intact, clean, and not punctured. Replace if damaged.
- Assay Acquisition: Take a minimum of ten assays of the reference standard. For a representative sample, move the aperture to different areas on the sample, testing both sides if possible.
- Data Analysis: Calculate the average elemental composition from the assays.
- Verification: Compare the average results to the accepted values for the reference standard. If the results fall within the acceptable Min/Max range, the instrument is calibrated correctly. If they do not, repeat cleaning and inspection, or contact technical support.
The Scientist's Toolkit: Key Research Reagents & Materials
Table 2: Essential Materials for Spectrometer Verification and Benchmarking
| Item | Primary Function | Application Context |
|---|---|---|
| Certified Reference Standards | To provide a ground truth for verifying analytical accuracy and instrument calibration. | Essential for routine performance checks of both handheld and lab-based instruments (e.g., ASTM standards for XRF, NIST traceable standards for UV-Vis) [89]. |
| Intralipid Phantom | To simulate the scattering properties of biological tissue for system validation. | Used to calibrate and validate imaging spectrometers, such as polarized hyperspectral imaging (PHSI) systems, in a controlled manner [6]. |
| Half-Wave & Quarter-Wave Plates | To manipulate the polarization state of light for system calibration. | Critical for evaluating the experimental error and accuracy of polarization-based spectroscopic systems [6]. |
| Variable Selection Algorithms (e.g., VCPA, MCUVE, SPA) | To identify the most informative spectral wavelengths and improve model robustness. | Used in chemometric model development to enhance the prediction accuracy and generalizability of spectroscopic methods, especially for complex samples like crop straw [90]. |
| Miniaturized Interferometer | To generate precise, adjustable sinusoidal patterns for resolution testing. | Enables real-time assessment of a spectrometer's Modulation Transfer Function (MTF) without major disassembly [16]. |
Conclusion
Robust alignment verification is not a one-time task but a fundamental component of quality assurance in spectroscopic analysis. By integrating foundational knowledge, systematic procedural checks, proactive troubleshooting, and advanced validation techniques, researchers can ensure the generation of reliable, high-fidelity data. The adoption of emerging technologies, such as machine learning for automated alignment and dual-technology FTIR-Raman systems, promises to further enhance accuracy and efficiency. For biomedical and clinical research, these rigorous practices are paramount for ensuring the validity of experimental results, supporting regulatory compliance, and accelerating the translation of research from the bench to the bedside.
References
- 1. All About Diffraction Gratings [https://www.edmundoptics.com/knowledge-center/application-notes/optics/all-about-diffraction-gratings/?srsltid=AfmBOoph4w3tFky9RUeYiI7bpYhPxC3evhbCFjNnztPW2PLP_xDVSWi2]
- 2. Diffraction Grating Selection Guide [https://www.newport.com/g/diffraction-grating-selection-guide]
- 3. Troubleshooting Common Spectrometer Issues [https://verichek.net/troubleshooting-common-spectrometer-issues.html]
- 4. Do We Qualify or Validate a Spectrometer? [https://www.spectroscopyonline.com/view/do-we-qualify-or-validate-a-spectrometer-]
- 5. Ocean Optics Spectrometers Troubleshooting and FAQs [https://www.vernier.com/til/1557?srsltid=AfmBOopVwpAWGEVptkYR5N-42BfKBLM7q7EuEaeKEkWulTmEmgESyZHy]
- 6. Validation of a handheld polarized hyperspectral imaging ... [https://pmc.ncbi.nlm.nih.gov/articles/PMC12534897/]
- 7. Spectrophotometer Troubleshooting [https://www.hinotek.com/spectrophotometer-troubleshooting/]
- 8. Troubleshooting - Thermo Fisher Knowledge Base [https://knowledge1.thermofisher.com/Molecular_Spectroscopy/Fourier_Transform_FT_Infrared_IR_and_Near_Infrared_NIR/Nicolet_Spectrometers/Nicolet_Apex_FTIR_Spectrometer/269-3615_01_Rev_A_Nicolet_Apex_FTIR_Spectrometer_User_Guide/Troubleshooting]
- 9. Spectrophotometer Best Practices [https://www.hunterlab.com/blog/spectrophotometer-best-practices/]
- 10. Mitigating Parameters Affecting Spectral Accuracy [https://www.mdpi.com/2079-6374/15/11/738]
- 11. Errors in Spectrophotometry and Calibration Procedures to Avoid Them - PMC [https://pmc.ncbi.nlm.nih.gov/articles/PMC5293527/]
- 12. Automated spectrometer alignment via machine learning - PMC [https://pmc.ncbi.nlm.nih.gov/articles/PMC11226169/]
- 13. Using Reference Materials, Part I: Standards for Aligning the X-Axis [https://www.spectroscopyonline.com/view/using-reference-materials-part-i-standards-aligning-x-axis]
- 14. Alignment and optical verification of DESHIMA 2.0 at ASTE [https://arxiv.org/html/2501.14478v2]
- 15. Spectrophotometer Selection and Troubleshooting [https://sperdirect.com/blogs/news/spectrophotometer-selection-and-troubleshooting-a-practical-guide?srsltid=AfmBOooJm2QqLZQPgNgOZpOTklGbqrOFbVFBjs1x9McVvqtVogA_JaLW]
- 16. Real-time assessment of spectrometer alignment using ... [https://www.sciencedirect.com/science/article/abs/pii/S0143816624000010]
- 17. Spectrometer - an overview | ScienceDirect Topics [https://www.sciencedirect.com/topics/agricultural-and-biological-sciences/spectrometer]
- 18. Why Is It Important to Calibrate a Spectrometer [https://verichek.net/importance-of-calibrating-spectrometer.html]
- 19. The Impact of Environmental Conditions on Calibration [https://ips-us.com/the-impact-of-environmental-conditions-on-calibration/]
- 20. Effect of Shock-Variable Environmental Temperature and ... [https://www.mdpi.com/2073-4360/16/1/1]
- 21. Instrument Qualification Kits [https://www.starna.com/instrument-qualification-kits]
- 22. Wavelength verification test fails - WKB83689 - Waters [https://support.waters.com/KB_Inst/Chromatography/WKB83689_Wavelength_verification_test_failure]
- 23. Troubleshooting Common Spectrometer Issues [https://nelabsystems.com/troubleshooting-common-spectrometer-issues/]
- 24. CRM for Fluorescence spectroscopy - Analytical online [https://analytical-online.com/crm-fluorescence-spectroscopy.html]
- 25. Holmium Glass Reference for Wavelength in the UV/Visible ... [https://www.starnacells.com/d_ref/d_wl/HG.html]
- 26. Holmium Oxide Glass Wavelength Standards - PMC [https://pmc.ncbi.nlm.nih.gov/articles/PMC4655923/]
- 27. How to calibrate UV-vis and HPLC detectors with NIST ... [https://www.mtc-usa.com/kb-article/aa-00398]
- 28. Metrological Traceability: Frequently Asked Questions and ... [https://www.nist.gov/metrology/metrological-traceability]
- 29. Laser Safety [https://www.ehs.washington.edu/radiation/laser-safety]
- 30. Laser Safety Program [https://www.augusta.edu/ehs/ihs/laser-safety.php]
- 31. Spectrometer Alignment | Details [https://hackaday.io/project/1279-ramanpi-raman-spectrometer/log/9812-spectrometer-alignment]
- 32. My Spectrometer is not working properly. It won't calibrate ... [https://www.vernier.com/til/2354?srsltid=AfmBOorQwJyRoCbKLS-XyNW_8GJ4BwbqrP2GzV-z4CkMPmqFU3bjAlnE]
- 33. Auto-alignment for lasers: a smarter way to power ... [https://is-instruments.com/auto-alignment-for-lasers-a-smarter-way-to-power-spectroscopy/]
- 34. AvaLight-CAL (-Mini) [https://www.avantes.com/products/light-sources/calibration-light-sources/avalight-cal-mini/]
- 35. Pencil Style Calibration Lamps [https://www.newport.com/f/pencil-style-calibration-lamps]
- 36. Calibrate a Spectrophotometer: The Complete Guide [https://qualitest.us/blogs/insight/how-to-calibrate-spectrophotometer?srsltid=AfmBOor63O_iNACiPBdT-ByxnFEfsuRUrwPWlUgO2qJM6P3C6u-DL9m9]
- 37. Calibrate a Spectrophotometer: The Complete Guide [https://qualitest.us/blogs/insight/how-to-calibrate-spectrophotometer?srsltid=AfmBOooL-NmnEMT9DAYp2PAs669P3eESn1kTvRUVHodMQiwX7UOuUPXl]
- 38. The Basics of Wavelength Calibration in General ... [https://www.inorganicventures.com/blog/basics-wavelength-calibration-spectroscopy]
- 39. Pressure Controller with DewesoftX | Dewesoft Automating [https://dewesoft.com/blog/automating-pressure-controller]
- 40. Meat species authentication using portable hyperspectral ... [https://www.frontiersin.org/journals/nutrition/articles/10.3389/fnut.2025.1577642/full]
- 41. The Importance of Automated Systems for Electrical... Calibration [https://diversedaily.com/the-importance-of-automated-calibration-systems-for-electrical-measurement-instruments/]
- 42. MINIMIZING ERROR IN CALIBRATING SPECTROMETERS [https://infometrix.com/2025/09/04/minimizing-error-in-calibrating-spectrometers-part-2-method-development-choosing-preprocessing-model-complexity-and-algorithm-selection/]
- 43. ISO 13084:2025 - Surface chemical analysis [https://www.iso.org/standard/90332.html]
- 44. What is the Importance of Drift Monitors in Spectrometer ... [https://www.azom.com/article.aspx?ArticleID=23103]
- 45. Dealing with Color Drift? It Could Be Your Spectrophotometer [https://www.xrite.com/blog/spectrophotometer-color-drift]
- 46. My Spectrometer is not working properly. It won't calibrate ... [https://www.vernier.com/til/2354?srsltid=AfmBOoqDujFKMmSgsc3ql5kU7ekpNRsfkWkwor7c6zGSkMZWza0mgkUd]
- 47. HELP WITH INCONSISTENT AND FLUCTUATING SIGNAL ... [http://www.chromforum.org/viewtopic.php?t=24494]
- 48. Calibration Transfer, Part VI: The Mathematics of ... [https://www.spectroscopyonline.com/view/calibration-transfer-part-vi-mathematics-photometric-standards-used-spectroscopy]
- 49. The Importance of Drift Monitors and XRF Spectrometer ... [https://www.azom.com/article.aspx?ArticleID=17600]
- 50. Spectrophotometer Selection and Troubleshooting [https://sperdirect.com/blogs/news/spectrophotometer-selection-and-troubleshooting-a-practical-guide?srsltid=AfmBOopnie-ayAs1xpXazcv6rnqTA6joh6_IRy3LdX9sje4yHb45VUBZ]
- 51. Spectrophotometer Measurement Errors [https://aelabgroup.com/spectrophotometer-measurement-error/]
- 52. Evaluating Spectral Signals to Identify Spectral Error - PMC [https://pmc.ncbi.nlm.nih.gov/articles/PMC4701180/]
- 53. An Enhanced Approach to Analytical Instrument and ... [https://www.spectroscopyonline.com/view/an-enhanced-approach-to-analytical-instrument-and-system-qualification]
- 54. How To Clean and How Not to Clean Fiber Optic Connectors [https://www.chemtronics.com/how-to-clean-and-how-not-to-clean-fiber-optic-connectors?srsltid=AfmBOooBWxyOUcGAleyyFSehz_TATieQTVE8TCZECIAc61tiRPH3AtAL]
- 55. Visual Inspection and Cleaning Of Connectors [https://www.thefoa.org/tech/ref/testing/test/scope.html]
- 56. Fiber Optics - Troubleshooting Those Dirty Little Fibers [https://blog.zcorum.com/fiber-optics-troubleshooting-those-dirty-little-fibers]
- 57. Inspection and Cleaning Procedures for Fiber-Optic ... [https://www.cisco.com/c/en/us/support/docs/optical/synchronous-digital-hierarchy-sdh/51834-cleanfiber2.html]
- 58. Spectroscopic Sample Preparation: Techniques for ... [https://www.metkon.com/spectroscopic-sample-preparation/]
- 59. Diagnosing & Fixing Performance Issues in Mini Portable ... [https://secuzoan.com/news/1168.html]
- 60. High-Purity Argon in OES Testing [https://verichek.net/high-purity-argon-in-oes-testing.html]
- 61. Choosing UHP Gas Analysis Platforms for Fabs - ASTG [https://astg.com/blogs/news/uhp-gas-analysis-platforms-fabs]
- 62. ICP-MS: Key Steps to Control Contamination and Achieve ... [https://www.spectroscopyonline.com/view/icp-ms-key-steps-to-control-contamination-and-achieve-low-detection-limits]
- 63. How to Reduce Sample Contamination [https://blog.omni-inc.com/blog/how-to-reduce-sample-contamination]
- 64. How do you maintain a UV spectrophotometer? [https://www.yixist.com/applictionsofyx/how-do-you-maintain-a-uv-spectrophotometer-/]
- 65. Caring for Your Device [https://www.xrite.com/page/caring-for-your-device]
- 66. PicoRaman M3 Measurement Probes Cleaning and ... [https://www.timegate.com/resources/blog/measurement-probes-cleaning-and-maintenance-guide]
- 67. How to Optimize Your Spectrometer's Performance [https://www.linkedin.com/advice/0/what-some-tips-optimizing-spectrometers-performance-4nzne]
- 68. Spectrophotometer Selection and Troubleshooting [https://sperdirect.com/blogs/news/spectrophotometer-selection-and-troubleshooting-a-practical-guide?srsltid=AfmBOoo7W6pkNpOvyqCQ-UxpRsB88JFRXcxJjYDzgzf5Lyo0D3kqq7Kc]
- 69. Sharpness [https://www.imatest.com/imaging/sharpness/]
- 70. My Spectrometer is not working properly. It won't calibrate ... [https://www.vernier.com/til/2354?srsltid=AfmBOopTytESgH217oZb7OjIaNKRriYAzuHSkz9CcvvH-1EmDiOMTIbv]
- 71. Resolution and MTF Testing [https://www.edmundoptics.com/knowledge-center/application-notes/imaging/resolution-and-mtf-testing/?srsltid=AfmBOooW1XaR0iqHlfULwQA42ESmdd6LESUxfP2UMOFpteSQTlP8AwfE]
- 72. Reconstructive spectrometers: hardware miniaturization and ... [https://elight.springeropen.com/articles/10.1186/s43593-025-00101-0]
- 73. Interferometer Alignment Errors [https://www.spiedigitallibrary.org/ebook/Download?urlid=10.1117%2F3.523499.ch4&isFullBook=False]
- 74. Michelson Interferometer Lab Setup: Assembly and ... [https://www.edmundoptics.com/knowledge-center/application-notes/optics/michelson-interferometer-lab-setup/?srsltid=AfmBOopoI5zLS1mZHMZxo33DuVZ6bU6vCyFzmELYZjsv669s7mlR97y-]
- 75. How to Troubleshoot a Spectrum That Looks Wrong [https://www.azooptics.com/Article.aspx?ArticleID=2811]
- 76. FT-IR Troubleshooting Guide: How to Solve Common ... [https://www.spectroscopyonline.com/view/ftir-troubleshooting-guide-how-to-solve-common-problems-in-infrared-spectroscopy]
- 77. Errors and Mistakes to Avoid when Analyzing Raman Spectra [https://www.spectroscopyonline.com/view/errors-and-mistakes-to-avoid-when-analyzing-raman-spectra]
- 78. Transforming Customs Enforcement: How Modern ... - WCO [https://mag.wcoomd.org/magazine/wco-news-108-issue-3-2025/modern-spectroscopy-techniques-revenue-protection/]
- 79. Systems and methods for calibration of a handheld ... [https://patents.google.com/patent/US20170153142A1/en]
- 80. Machine learning surrogates for agent-based models in ... [https://www.sciencedirect.com/science/article/pii/S0968090X2500364X]
- 81. The Application of Supervised Machine Learning ... [https://www.mdpi.com/1424-8220/25/2/544]
- 82. My Spectrometer is not working properly. It won't calibrate ... [https://www.vernier.com/til/2354?srsltid=AfmBOoqu16cMNO8z4Gfci52v8irr9gefczXeNoRnzY1Y_RzYzcYjv51n]
- 83. Aligning machine and human visual representations ... [https://www.nature.com/articles/s41586-025-09631-6]
- 84. A Guide to Control Charts [https://www.isixsigma.com/control-charts/a-guide-to-control-charts/]
- 85. Statistical Process Control Charts [https://asq.org/quality-resources/control-chart?srsltid=AfmBOorUu_vpzdS2s7kN_1v3DE5-SIMBRgVW3AcwRcYqrWfjkvkUZ4DD]
- 86. A Tip for Analyzing CRM Results in Your QAQC Program [https://www.linkedin.com/pulse/tip-analyzing-crm-results-your-qaqc-program-mark-wanless-zacmf]
- 87. Quality Assurance & Quality Control - Why You Need Both [https://www.optiproerp.com/blog/quality-assurance-and-quality-control/]
- 88. Quality Assurance vs. Quality Control [https://verpex.com/blog/website-tips/quality-assurance-vs-quality-control]
- 89. Is My Handheld XRF Analyzer Working Correctly? [https://www.bruker.com/en/products-and-solutions/elemental-analyzers/handheld-xrf-spectrometers/is-my-handheld-xrf-analyzer-working.html]
- 90. Comparative study of laboratory and industrialized near- ... [https://www.sciencedirect.com/science/article/abs/pii/S0026265X25020004]
- 91. Spectrophotometer Selection and Troubleshooting [https://sperdirect.com/blogs/news/spectrophotometer-selection-and-troubleshooting-a-practical-guide?srsltid=AfmBOorBaF6tLfHTUmsLGTnmBEYfF7TWMp42x9AKvD7o95eoRkFXOObZ]