Greenness Evaluation in Analytical Science: A Comparative Analysis of Chemometrics vs. Traditional Chromatography
This article provides a comprehensive analysis of greenness evaluation for chemometric techniques and traditional chromatographic methods in pharmaceutical analysis and drug development.
Greenness Evaluation in Analytical Science: A Comparative Analysis of Chemometrics vs. Traditional Chromatography
Abstract
This article provides a comprehensive analysis of greenness evaluation for chemometric techniques and traditional chromatographic methods in pharmaceutical analysis and drug development. It explores the foundational principles of Green Analytical Chemistry (GAC), examines methodological applications of both approaches, discusses optimization strategies using modern assessment tools, and presents validation frameworks for comparative analysis. By integrating insights from current literature and emerging metrics, this review serves as a strategic guide for researchers and scientists seeking to implement sustainable analytical practices while maintaining analytical performance and regulatory compliance.
Principles and Evolution of Green Analytical Chemistry (GAC)
The 12 SIGNIFICANCE Principles of Green Analytical Chemistry
Green Analytical Chemistry (GAC) represents a fundamental shift in how chemical analysis is conducted, emphasizing environmental stewardship, sustainability, and efficiency alongside analytical performance [1]. As environmental regulations tighten and industries increasingly prioritize sustainable practices, GAC has evolved from a niche concern to a central tenet of scientific responsibility [2] [3]. This transformation is guided by a framework of principles specifically adapted for analytical chemistry. Among these, the SIGNIFICANCE mnemonic offers a concise and actionable summary of key green analytical practices [4].
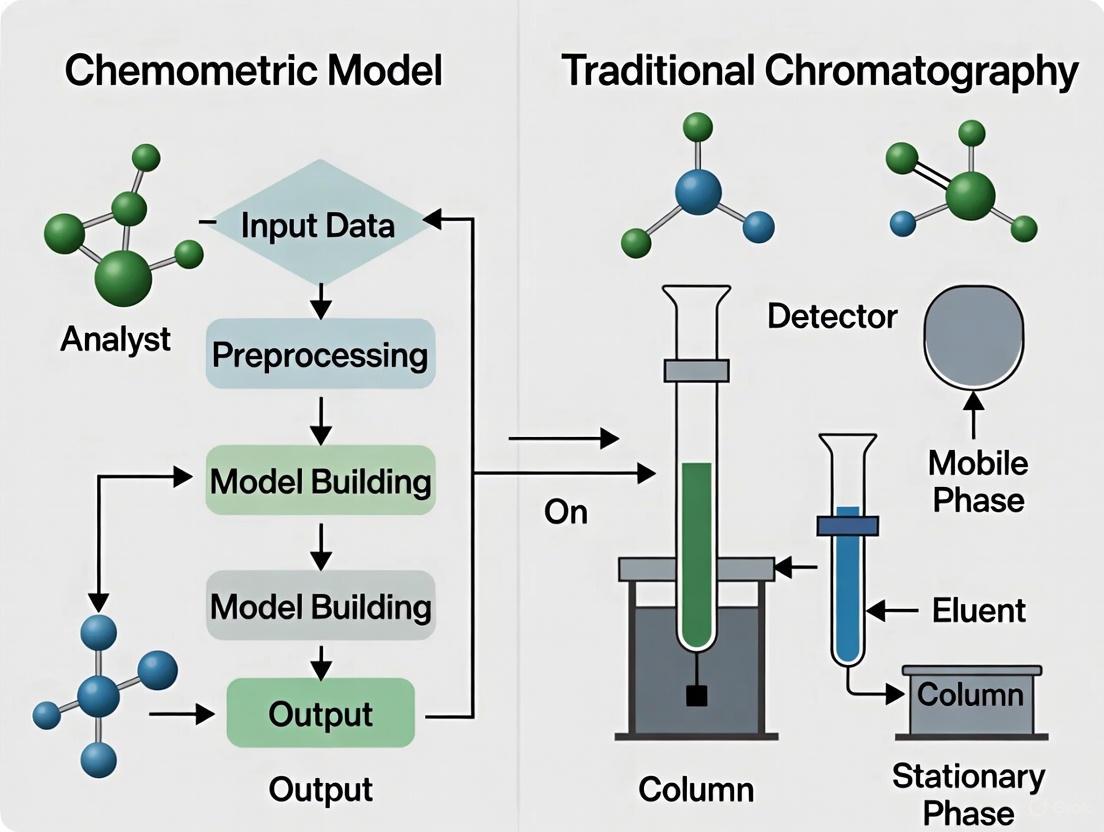
This guide objectively compares the greenness of two analytical approaches: modern chemometrics and traditional chromatography. Chemometrics uses mathematical and statistical methods to extract maximum information from chemical data, often enabling reduced reagent consumption and waste generation. Traditional chromatography, while highly effective, frequently involves larger volumes of solvents and energy-intensive processes. The evaluation is framed within the broader thesis of greenness evaluation, providing researchers and drug development professionals with clear metrics and methodologies for assessing the environmental footprint of their analytical techniques.
The SIGNIFICANCE Mnemonic of Green Analytical Practices
The SIGNIFICANCE mnemonic encapsulates the core objectives of Green Analytical Chemistry, providing a practical framework for greening laboratory practices [4]. Each letter represents a strategic goal as shown in the diagram below:
Greenness Assessment Tools and Metrics
Objective evaluation of analytical methods requires standardized metrics and tools. The following table summarizes the primary greenness assessment tools and key performance indicators used in GAC.
Table 1: Greenness Assessment Tools for Analytical Methods
| Tool/Metric | Primary Function | Output Format | Key Parameters Assessed |
|---|---|---|---|
| NEMI (National Environmental Methods Index) [2] | Initial environmental screening | Pictogram (four quadrants) | Persistence, bioaccumulation, toxicity, corrosiveness |
| GAPI (Green Analytical Procedure Index) [2] | Comprehensive lifecycle assessment | Color-coded pictogram (5 pentagrams) | Reagent toxicity, energy consumption, waste generation, safety hazards |
| AGREE (Analytical GREEnness) [2] | Holistic evaluation based on 12 GAC principles | Circular pictogram with score (0-1) | All 12 GAC principles with weighted scoring |
| Process Mass Intensity (PMI) [5] [6] | Measures material efficiency | Numerical ratio (kg materials/kg product) | All materials used in the process (reactants, solvents, process aids) |
| E-Factor [5] [6] | Quantifies waste generation | Numerical ratio (kg waste/kg product) | Mass of waste produced relative to product |
| Atom Economy [5] [7] [6] | Evaluates synthetic efficiency | Percentage (%) | Formula weight of atoms utilized in final product |
These tools enable researchers to quantitatively compare the environmental performance of different analytical methods. For instance, the AGREE tool provides a comprehensive evaluation based on the 12 principles of GAC, generating a visual output and a numerical score that allows for straightforward comparison between methods [2].
Experimental Protocols for Greenness Evaluation
Methodology for Comparative Analysis
To objectively evaluate the greenness of chemometrics versus traditional chromatography, the following experimental protocol can be employed:
1. Method Selection and Design
- Select a representative analytical problem (e.g., active pharmaceutical ingredient (API) quantification in a drug formulation)
- Develop two methodological approaches:
- Traditional Method: Reversed-Phase High-Performance Liquid Chromatography (RP-HPLC) with sample preparation, organic solvents, and external calibration
- Chemometrics Method: UV-Vis spectroscopy with multivariate calibration
2. Data Collection Parameters
- Traditional Chromatography: Mobile phase: acetonitrile/water (60:40 v/v); Flow rate: 1.0 mL/min; Column: C18 (150 × 4.6 mm, 5 μm); Injection volume: 20 μL; Detection: UV at 254 nm
- Chemometrics Approach: Spectral range: 200-400 nm; Pathlength: 1 cm; Sample volume: 2 mL; Multivariate calibration: Partial Least Squares (PLS) regression
3. Greenness Assessment
- Apply AGREE, GAPI, and NEMI tools to both methods using standardized input parameters
- Calculate Process Mass Intensity (PMI) and E-Factor for both methods
- Record energy consumption using calibrated power meters
4. Validation of Analytical Performance
- Evaluate both methods for accuracy, precision, sensitivity, and robustness using validation standards
- Ensure both methods meet acceptable analytical figures of merit before greenness comparison
The Scientist's Toolkit: Essential Research Reagents and Materials
Table 2: Key Research Reagent Solutions for GAC Experiments
| Reagent/Material | Function in GAC | Traditional Alternative | Green Advantage |
|---|---|---|---|
| Water as solvent [1] [3] | Replacement for organic solvents in extraction and chromatography | Acetonitrile, methanol | Non-toxic, non-flammable, biodegradable |
| Bio-based solvents (e.g., ethanol, ethyl lactate) [1] [3] | Solvent for extraction and analysis | Halogenated solvents (e.g., chloroform, dichloromethane) | Derived from renewable feedstocks, lower toxicity |
| Ionic liquids [1] | Stationary phases in chromatography, extraction solvents | Volatile organic compounds | Non-volatile, reusable, tunable properties |
| Supercritical COâ‚‚ [1] [3] | Extraction and chromatography fluid | Organic solvents in SFE and SFC | Non-toxic, non-flammable, easily removed |
| Solid-phase microextraction (SPME) fibers [1] [3] | Solventless sample preparation | Liquid-liquid extraction | Eliminates solvent use, minimal waste |
| Microfluidic chips [3] | Miniaturized analytical platforms | Conventional bench-scale apparatus | Dramatically reduced reagent and sample consumption |
| L-(+)-Ampicillin-d5 | L-(+)-Ampicillin-d5, MF:C16H19N3O4S, MW:354.4 g/mol | Chemical Reagent | Bench Chemicals |
| Sulfo-QSY21-NHS | Sulfo-QSY21-NHS, MF:C45H39ClN4O13S3, MW:975.5 g/mol | Chemical Reagent | Bench Chemicals |
Quantitative Comparison: Chemometrics vs. Traditional Chromatography
The following table presents a comparative analysis of the greenness performance between chemometrics-assisted spectroscopy and traditional chromatography methods, based on experimental data and literature findings.
Table 3: Greenness Performance Comparison: Chemometrics vs. Traditional Chromatography
| Evaluation Parameter | Traditional HPLC Method | Chemometrics-Assisted Method | Experimental Measurement Protocol |
|---|---|---|---|
| Sample Volume | 1-5 mL | 50-200 μL | Measured using calibrated micropipettes and volumetric flasks |
| Solvent Consumption | 500-1000 mL per run | 2-5 mL per analysis | Quantified by solvent purchase records and waste collection |
| Energy Consumption | 0.8-1.2 kWh per analysis | 0.1-0.3 kWh per analysis | Measured with power meters connected to instruments |
| Analysis Time | 15-30 minutes | 1-5 minutes | Timed from sample introduction to result acquisition |
| Waste Generation | 500-1000 mL organic waste | 2-5 mL primarily aqueous waste | Collected and measured in designated waste containers |
| PMI (Process Mass Intensity) | 50-100 [5] | 5-15 | Calculated as total mass inputs/mass of product [6] |
| E-Factor | 25-100 [6] | 5-20 | Calculated as mass of waste/mass of product [6] |
| AGREE Score | 0.4-0.6 [2] | 0.7-0.9 [2] | Calculated using AGREE software with 12 principle inputs |
| Hazard Profile | Moderate-High (flammable, toxic solvents) | Low (aqueous systems) | Assessed using GAPI pictogram and reagent safety data sheets |
The experimental workflow for this comparative assessment involves multiple stages, from sample introduction to final greenness scoring as shown in the diagram below:
Discussion and Future Perspectives
The experimental data demonstrates that chemometrics approaches generally offer superior greenness profiles compared to traditional chromatography methods. The significant reductions in solvent consumption, waste generation, and analysis time position chemometrics as a valuable strategy for advancing Green Analytical Chemistry principles [2] [1].
However, the adoption of greener methodologies faces challenges, including the need for method validation and initial investment in new equipment and training [3]. The validation process ensures that new eco-friendly analysis methods provide results as accurate and reproducible as established techniques, which is particularly important in regulated industries like pharmaceutical development [3].
Future innovations in GAC will likely focus on further integration of automation, miniaturization, and alternative energy sources [1] [3]. The application of artificial intelligence and machine learning for method optimization and the development of more sustainable materials will continue to push the boundaries of what constitutes green analysis [1]. Furthermore, the incorporation of Life Cycle Assessment (LCA) provides a comprehensive perspective on the environmental impact of analytical methods, considering every stage from raw material sourcing to disposal [1]. This systemic view helps identify areas for improvement and ensures that green alternatives deliver genuine environmental benefits without compromising analytical performance.
For researchers and drug development professionals, the transition to greener analytical methods represents both an ethical responsibility and a practical pathway to greater efficiency, safety, and cost-effectiveness [3]. By applying the SIGNIFICANCE principles and utilizing the assessment tools and protocols outlined in this guide, laboratories can systematically reduce their environmental footprint while maintaining high standards of analytical excellence.
The growing awareness of environmental issues and the detrimental impact of laboratory practices has fundamentally transformed analytical chemistry, leading to the establishment of Green Analytical Chemistry (GAC). GAC represents an environmentally conscious methodology aimed at mitigating the negative effects of analytical techniques on ecosystems and human health [8]. This paradigm shift created an urgent need for standardized ways to evaluate the environmental impact of analytical methods, driving the development of greenness assessment tools [9]. This evolution has progressed from simple, binary evaluations to sophisticated, multi-factorial metrics that provide comprehensive environmental profiling of entire analytical workflows [10] [9].
The initial driver for this development was the recognition that traditional green chemistry metrics like E-Factor or Atom Economy were inadequate for assessing analytical procedures [9]. Analytical methods involve unique considerations including sample preparation, instrument energy consumption, and waste generation per analysis, necessitating specialized evaluation tools. This historical progression from the first simple pictograms to today's advanced digital calculators reflects the analytical community's deepening commitment to integrating environmental responsibility into methodological development and selection [10] [9].
Table 1: Historical Timeline of Major Greenness Assessment Metrics
| Year | Metric Tool | Key Innovation | Assessment Scope |
|---|---|---|---|
| 2002 | NEMI [11] | First standardized pictogram; four criteria | Basic environmental criteria |
| 2012 | Analytical Eco-Scale [9] | Semi-quantitative scoring via penalty points | Reagents, energy, waste |
| 2018 | GAPI [9] | Comprehensive visual workflow assessment | Entire analytical process |
| 2020 | AGREE [12] [9] | 12 GAC principles with weighted score | Holistic evaluation with pictogram and numerical output |
| 2022 | AGREEprep [12] | Specialized sample preparation focus | 10 Green Sample Preparation principles |
| 2023+ | RGB, BAGI, AGSA [13] | Multi-dimensional assessment beyond greenness | Integration with analytical performance and practicality |
The Foundational First Generation: Simple Pictograms and Scoring
The earliest greenness assessment tools emerged as straightforward, visually intuitive systems that provided at-a-glance environmental evaluations. These first-generation metrics established the crucial foundation for all subsequent developments in the field.
National Environmental Methods Index (NEMI)
Introduced in 2002, the National Environmental Methods Index (NEMI) was the pioneering tool for greenness assessment [11]. Its pictogram features a circle divided into four quadrants, each representing a different environmental criterion. A quadrant is colored green only if the method meets that specific requirement [11] [9]. The four criteria are:
- PBT: No chemicals used are persistent, bioaccumulative, and toxic.
- Hazardous Waste: No reagents are listed as hazardous (D, F, P, or U lists).
- Corrosivity: The pH remains between 2 and 12 during analysis.
- Waste Generation: Total waste produced is ≤50 g per sample [11].
While NEMI was widely appreciated for its simplicity and accessibility, its binary structure (green/blank) and limited scope offered insufficient granularity to distinguish between methods of varying environmental performance or assess complete analytical workflows [9].
Analytical Eco-Scale Assessment (AES)
The Analytical Eco-Scale Assessment (AES) introduced a semi-quantitative approach to address NEMI's limitations [9]. It operates on a penalty points system, starting from an ideal baseline score of 100 for a perfectly green analysis. Points are subtracted for hazardous reagents, high energy consumption (>0.1 kWh per sample), and waste generation [11]. The final score provides a more differentiated evaluation:
- >75: Excellent green analysis
- 50-75: Acceptable green analysis
- <50: Insufficiently green analysis [13]
Although AES enabled better method comparison than NEMI, it still relied heavily on expert judgment for penalty assignment and lacked a visual component, limiting its accessibility for non-specialists [9].
The Second Generation: Comprehensive Visual Assessment
As GAC principles gained wider adoption, the need for more detailed evaluation tools led to the development of second-generation metrics that provided comprehensive visualization of environmental impacts across entire analytical workflows.
Green Analytical Procedure Index (GAPI)
The Green Analytical Procedure Index (GAPI) represented a significant advancement by addressing the complete analytical process through a five-part, color-coded pictogram [9]. GAPI evaluates each stage of analysis—from sample collection and preservation through preparation and instrumental determination—using a traffic-light color system (green, yellow, red) to indicate environmental impact levels [14] [9]. This approach allowed researchers to visually identify specific high-impact stages within a method that could be targeted for improvement. Despite its more comprehensive scope, GAPI does not generate an overall greenness score, limiting direct comparability between methods, and its color assignments can involve subjective interpretation [9].
Analytical Greenness (AGREE) Metric
The AGREE metric, developed in 2020, marked a substantial evolution in greenness assessment by incorporating all 12 principles of GAC into a unified evaluation framework [8] [12] [9]. AGREE calculates a weighted score from 0 to 1 for each principle, with the final result displayed in a clock-like pictogram where the central number and color (red to green) provide an immediate overall assessment [12]. The tool is open-source and accessible, enhancing its adoption across the analytical community [12]. AGREE's key strength lies in its comprehensive coverage of GAC principles and user-friendly output format. However, it does not fully account for pre-analytical processes and involves some subjectivity in weighting its evaluation criteria [9].
AGREE Metric Calculation Workflow: The AGREE tool transforms input parameters based on the 12 GAC principles into a comprehensive output featuring a clock-like pictogram, numerical score, and color coding [12] [9].
The Specialized Third Generation: Targeted and Holistic Metrics
Recent developments in greenness assessment have focused on creating specialized tools for specific analytical stages while also expanding beyond purely environmental considerations to embrace more holistic sustainability frameworks.
AGREEprep: Sample Preparation Focus
Recognizing that sample preparation often represents the most environmentally impactful stage of analysis, AGREEprep was introduced in 2022 as the first dedicated metric for evaluating sample preparation techniques [12]. This tool applies the 10 principles of Green Sample Preparation (GSP) and provides both visual and quantitative outputs, with a cumulative score greater than 0.5 indicating an acceptably green method [12]. Studies comparing methodologies have demonstrated that microextraction-based sample preparation techniques consistently achieve higher AGREEprep scores, validating the tool's effectiveness in identifying environmentally superior approaches [12]. However, as a specialized tool, AGREEprep must be used alongside broader metrics like AGREE for complete method evaluation [9].
White Analytical Chemistry (WAC) and the RGB Model
The most recent evolution in assessment frameworks is White Analytical Chemistry (WAC), which expands beyond purely environmental concerns to balance three equally important dimensions [13]:
- Red (Analytical Performance): Sensitivity, selectivity, accuracy, precision
- Green (Environmental Impact): Solvent toxicity, waste generation, energy consumption
- Blue (Practicality & Economics): Cost, time, simplicity, operational factors [13]
The resulting "whiteness" represents the ideal balance where a method demonstrates excellent analytical capabilities, minimal environmental impact, and strong practical utility [13]. This integrated approach addresses the criticism that earlier green metrics sometimes overlooked analytical performance and practical implementation in pursuit of environmental benefits [8] [13].
WAC RGB Model Structure: White Analytical Chemistry integrates three complementary dimensions—red (analytical performance), green (environmental impact), and blue (practicality)—to achieve balanced method assessment [13].
Comparative Analysis of Metric Tools: Experimental Data
The evolution of greenness metrics can be clearly observed through comparative studies that apply multiple assessment tools to the same analytical methods. One such investigation evaluated 10 different chromatographic methods for determining UV filters in cosmetic samples using both AGREE and AGREEprep [12]. The results demonstrated that microextraction methods consistently achieved higher greenness scores in both metrics, with AGREEprep proving particularly effective at highlighting the environmental advantages of miniaturized sample preparation techniques [12].
Table 2: Greenness Score Comparison of UV Filter Analytical Methods [12]
| Method Number | Analytical Technique | Sample Preparation Method | AGREE Score | AGREEprep Score | Overall Greenness Ranking |
|---|---|---|---|---|---|
| 1 | LC-UV | Solvent dissolution | 0.42 | 0.38 | Low |
| 2 | LC-DAD | Solvent extraction | 0.45 | 0.41 | Low |
| 3 | GC-MS | Solvent extraction with derivatization | 0.38 | 0.35 | Lowest |
| 4 | LC-MS/MS | Solid-phase extraction (SPE) | 0.52 | 0.48 | Medium |
| 5 | LC-MS/MS | Pressurized liquid extraction (PLE) | 0.49 | 0.45 | Medium |
| 6 | LC-MS/MS | Microextraction by packed sorbent (MEPS) | 0.65 | 0.62 | High |
| 7 | GC-MS | Micro-MSPD | 0.68 | 0.66 | High |
| 8 | LC-MS/MS | Dispersive solid-phase microextraction | 0.71 | 0.69 | Highest |
| 9 | LC-UV | Ultrasound-assisted DLLME | 0.67 | 0.65 | High |
| 10 | LC-UV | Dynamic HF-LPME | 0.69 | 0.67 | Highest |
A separate comparative study evaluating Fourier-transform infrared spectroscopy (FTIR) and gas chromatography-mass spectrometry (GC-MS) for milk analysis demonstrated how multi-metric assessment provides comprehensive environmental profiling [14]. The research applied NEMI, Analytical Eco-Scale, AGREE, and ComplexGAPI to both techniques, consistently showing FTIR's superior greenness credentials due to its minimal solvent requirements, direct analysis capability, and lower energy consumption [14]. This type of multi-tool evaluation helps validate findings across different metric systems and provides complementary insights into various environmental aspects.
Detailed Experimental Protocols for Greenness Assessment
Protocol for AGREE Assessment of Chromatographic Methods
The following detailed methodology outlines the standardized approach for evaluating the greenness of chromatographic methods using the AGREE metric tool, based on established protocols from comparative studies [12]:
Software Installation: Download the open-source AGREE calculator from the official website: https://mostwiedzy.pl/AGREE [12]
Data Collection for Each Analytical Method:
- Reagent Information: Document all solvents, chemicals, and reagents used in the procedure, including volumes and concentrations. Cross-reference with safety data sheets to determine toxicity classifications.
- Energy Consumption: Calculate total energy usage in kWh per sample, including sample preparation, extraction, and chromatographic separation steps.
- Waste Generation: Quantify total waste produced per analysis (g or mL), considering both organic and inorganic waste streams.
- Instrumentation Parameters: Document instrument type, analysis time, throughput (samples per hour), and any special requirements like derivatization.
- Operator Safety: Identify any requirements for special personal protective equipment or handling procedures for hazardous materials.
Input Parameter Assignment:
- Enter collected data into the 12 input fields corresponding to the GAC principles.
- Apply default weighting factors for initial assessment, with optional adjustment based on method-specific priorities.
- Generate the output pictogram and numerical score.
Result Interpretation:
Protocol for Comparative Multi-Metric Assessment
For comprehensive evaluation, researchers increasingly employ multiple metrics to gain different perspectives on method greenness [14] [9]:
Tool Selection: Choose complementary metrics that assess different aspects (e.g., AGREE for overall greenness, AGREEprep for sample preparation, and RGB model for whiteness assessment).
Standardized Data Collection: Gather consistent data across all methods being compared, including:
- Sample size and preparation time
- Solvent types and volumes
- Energy consumption per analysis
- Waste generation and treatment
- Throughput and analytical performance parameters
Parallel Application:
- Apply each metric tool using the same dataset.
- Document all scoring decisions and weighting factors for reproducibility.
- Generate all relevant pictograms and numerical scores.
Triangulation of Results:
- Compare outcomes across different metrics to identify consistent patterns.
- Resolve discrepancies through careful re-examination of assessment criteria.
- Generate a comprehensive greenness profile that highlights both strengths and weaknesses of each method.
Critical Analysis:
- Identify specific steps in the analytical procedure that contribute most significantly to environmental impact.
- Propose targeted improvements for problematic steps.
- Select the optimal method based on balanced consideration of all assessment results.
Essential Research Reagent Solutions for Green Analytical Chemistry
The implementation of green analytical methods requires specific reagents and materials that minimize environmental impact while maintaining analytical performance. The following table details key solutions used in the development and application of environmentally sustainable analytical methods.
Table 3: Essential Research Reagents and Materials for Green Analytical Chemistry
| Reagent/Material | Function in Green Analysis | Environmental Advantage | Application Examples |
|---|---|---|---|
| Bio-based Solvents (e.g., ethanol, ethyl acetate) | Extraction and separation media | Renewable sources, lower toxicity, biodegradable | Solvent replacement in sample preparation [9] |
| Ionic Liquids | Green extraction solvents | Negligible vapor pressure, recyclable | Miniaturized extraction techniques [12] |
| Magnetic Nanoparticles | Solid-phase extraction sorbents | Enable miniaturization, reduce solvent volume | MSPE, quick analyte separation [13] |
| Molecularly Imprinted Polymers | Selective recognition elements | Reusable, reduce reagent consumption | Solid-phase microextraction [10] |
| Deep Eutectic Solvents | Green solvent systems | Biodegradable, low toxicity, renewable precursors | Liquid-phase microextraction [12] |
| Portable Field Sampling Kits | On-site sample collection and preservation | Eliminate transport, enable direct analysis | In-situ monitoring, reduced storage [9] |
The historical development from NEMI to comprehensive modern metrics represents a remarkable evolution in how the analytical chemistry community evaluates and prioritizes environmental sustainability. The field has progressed from basic binary pictograms to sophisticated multi-dimensional assessment frameworks that balance environmental impact with analytical performance and practical implementation [10] [9] [13]. Current challenges in metric development include minimizing subjectivity in assessments, establishing standardized weighting factors, and incorporating lifecycle considerations beyond immediate laboratory operations [10]. Future directions point toward increased integration of artificial intelligence for automated assessment, development of real-time greenness monitoring systems, and creation of unified platforms that combine multiple metric tools for comprehensive sustainability profiling [10] [9]. As greenness metrics continue to evolve, they will play an increasingly crucial role in guiding analytical chemists toward methodologies that are not only scientifically robust but also environmentally responsible and economically viable, ultimately supporting the broader transition toward sustainable science practices.
Key Drivers for Sustainable Practices in Pharmaceutical Analysis
The pharmaceutical industry faces increasing pressure to align drug development and quality control with environmental sustainability goals. Traditional analytical methods, particularly in chromatography, often involve hazardous solvents, generate significant waste, and consume substantial energy, creating a substantial environmental footprint [9] [15]. In response, Green Analytical Chemistry (GAC) has emerged as a critical discipline focused on minimizing the environmental impact of analytical methods while maintaining scientific robustness [9] [16]. This transformation is driven by regulatory pressures, corporate sustainability initiatives, and a growing recognition that ecological responsibility and analytical excellence are not mutually exclusive [15] [17]. The industry is now evolving beyond GAC toward White Analytical Chemistry (WAC), a holistic framework that balances environmental sustainability (green) with analytical performance (red) and practical applicability (blue) [8] [18]. This comparison guide examines the key drivers propelling this sustainable transformation, objectively evaluating how greenness assessment metrics and emerging technologies are reshaping pharmaceutical analysis.
Greenness Assessment Metrics: Evaluating Environmental Performance
The adoption of sustainable practices requires robust tools to quantify and compare the environmental performance of analytical methods. Numerous greenness assessment metrics have been developed, each with distinct approaches and evaluation criteria.
Evolution of Greenness Assessment Tools
The progression of greenness metrics reflects a shift from basic qualitative evaluations to comprehensive quantitative assessments incorporating multiple environmental factors:
First-Generation Tools: The National Environmental Methods Index (NEMI) introduced a simple pictogram evaluating four basic criteria: persistent/bioaccumulative/toxic substances, hazardous chemicals, corrosiveness, and waste generation [9] [18]. While accessible, its binary (pass/fail) approach lacked granularity for distinguishing between degrees of greenness [9].
Semi-Quantitative Advances: The Analytical Eco-Scale (AES) provided a more nuanced evaluation by assigning penalty points for non-green attributes subtracted from a base score of 100 [9] [18]. Methods scoring ≥75 are classified as "excellent green," 50-74 as "acceptable green," and below 50 as "insufficient greenness" [18].
Comprehensive Metrics: The Green Analytical Procedure Index (GAPI) expanded assessment scope with a color-coded pictogram covering the entire analytical process from sample collection to detection [9] [16]. This enabled identification of high-impact stages within methods.
Modern Quantitative Tools: Analytical Greenness (AGREE) incorporates all 12 GAC principles into a unified evaluation, providing both a visual pictogram and a numerical score from 0-1 [9] [12] [16]. AGREEprep specifically targets sample preparation—often the most waste-intensive step—based on 10 green sample preparation principles [9] [12].
Specialized Innovations: The Carbon Footprint Reduction Index (CaFRI) addresses climate impact by estimating carbon emissions associated with analytical procedures [9]. ChlorTox calculates chemical risk by comparing substance hazards to chloroform as a reference standard [18].
Comparative Analysis of Greenness Assessment Tools
Table 1: Comparison of Major Greenness Assessment Metrics in Pharmaceutical Analysis
| Tool | Assessment Scope | Output Format | Scoring System | Key Advantages | Key Limitations |
|---|---|---|---|---|---|
| NEMI [9] [18] | Basic environmental criteria | 4-quadrant pictogram | Binary (green/white) | Simple, intuitive | Lacks granularity, limited criteria |
| Analytical Eco-Scale [9] [18] | Reagents, energy, waste | Numerical score | 0-100 (higher=greener) | Semi-quantitative, enables comparison | Subjective penalty assignments |
| GAPI [9] [16] | Entire analytical workflow | 5-section color pictogram | Color-coded (green-yellow-red) | Comprehensive scope, visual | No overall score, somewhat subjective |
| AGREE [9] [12] [16] | 12 GAC principles | Circular pictogram + number | 0-1 (higher=greener) | Holistic, quantitative, user-friendly | Does not fully address pre-analytical steps |
| AGREEprep [9] [12] | Sample preparation | Circular pictogram + number | 0-1 (higher=greener) | Focuses on critical step, quantitative | Must be used with broader tools |
| BAGI [16] [18] | Method applicability | Numerical score + pictogram | 0-100 (higher=better) | Assesses practical feasibility | Does not directly address environmental impact |
Experimental Protocol: Applying Multiple Metrics for Comprehensive Assessment
A case study evaluating a sugaring-out liquid-liquid microextraction (SULLME) method for determining antiviral compounds demonstrates how complementary assessment tools provide a multidimensional sustainability profile [9]:
Method Evaluation: The SULLME method was analyzed across its entire workflow, noting consumption of solvents/reagents, energy requirements, waste generation, safety considerations, and operational parameters.
Multi-Tool Assessment:
- Modified GAPI (MoGAPI): Score of 60/100 indicated moderate greenness, with positive contributions from green solvents and microextraction, but drawbacks in specific storage requirements, moderately toxic substances, and vapor emissions [9].
- AGREE: Score of 56/100 reflected a balanced profile, with strengths in miniaturization and semi-automation but weaknesses in toxic solvent use and moderate waste generation [9].
- Analytical Green Star Analysis (AGSA): Score of 58.33/100 highlighted strengths in semi-miniaturization but limitations in manual handling and absence of waste management [9].
- CaFRI: Score of 60/100 indicated moderate climate impact, with low energy consumption (0.1-1.5 kWh/sample) but no renewable energy or COâ‚‚ tracking [9].
Interpretation: The multi-metric approach revealed the method's strengths in miniaturization but consistent weaknesses in waste management and reagent safety, providing clear direction for sustainability improvements [9].
Key Drivers for Adoption of Sustainable Analytical Practices
Regulatory and Stakeholder Pressure
Pharmaceutical companies face increasingly stringent environmental regulations and stakeholder expectations regarding sustainable operations [15] [17]. Regulatory bodies worldwide are implementing stricter requirements for chemical processes and waste management, compelling the industry to adopt greener analytical approaches [15]. Additionally, the Pharmaceutical Supply Chain Initiative has established principles guiding industry expectations for environmental responsibility throughout the supply chain [17]. Leading pharmaceutical companies now publish detailed sustainability reports tracking ESG (Environmental, Social, and Governance) metrics, reflecting growing transparency demands from investors, consumers, and regulatory agencies [17].
Operational Efficiency and Economic Benefits
Sustainable practices in pharmaceutical analysis frequently yield significant economic advantages through reduced resource consumption and waste disposal costs [15]. Atom economy—designing synthetic methods to maximize incorporation of materials into the final product—reduces waste generation while improving process efficiency [15]. For instance, Pfizer achieved a 50% reduction in waste through implementation of green chemistry principles, demonstrating the substantial cost savings possible [15]. Similarly, Merck redesigned the synthesis of sitagliptin (a diabetes drug), reducing waste while simultaneously cutting water and energy usage [15]. These improvements align environmental benefits with enhanced operational efficiency and reduced production costs.
Technological Innovations Enabling Green Transitions
Table 2: Technological Innovations Driving Sustainable Pharmaceutical Analysis
| Innovation Category | Specific Technologies | Sustainable Benefits | Application Examples |
|---|---|---|---|
| Green Solvent Systems [15] [16] | Water, ethanol, supercritical COâ‚‚, bio-based solvents | Reduce toxicity, waste, and environmental impact | Replacing dichloromethane and acetonitrile with safer alternatives |
| Miniaturized Techniques [9] [16] | Micro-extraction, micro-HPLC, lab-on-a-chip | Reduce solvent consumption (often to <10 mL) and waste generation | Liquid-phase microextraction techniques for sample preparation |
| Alternative Energy Sources [19] | Microwave-assisted extraction, ultrasound extraction | Reduce energy consumption and processing time | Accelerated extraction techniques for sample preparation |
| Process Intensification [19] | Continuous flow synthesis, inline monitoring | Enhance atom economy, reduce waste and energy use | Continuous manufacturing of pharmaceutical intermediates |
| Biocatalysis [15] [19] | Enzymatic processes, whole-cell catalysis | Enable milder conditions, reduce hazardous reagents | Enzyme-based synthesis of sitagliptin at Merck |
| Artificial Intelligence [19] | Generative AI, machine learning for reaction optimization | Predict optimal conditions, reduce experimental waste | AI-assisted discovery of green solvents and catalysts |
Experimental Protocol: Greenness Comparison of Chromatographic Methods for UV Filter Analysis
A comparative study of 10 chromatographic methods for determining UV filters in cosmetic samples demonstrates the application of greenness assessment to guide method selection [12]:
Method Selection: Researchers selected 10 literature methods employing various sample preparation techniques: conventional solvent dissolution (Methods 1-2), solvent extraction with derivatization (Method 3), solid-phase extraction (SPE, Method 4), pressurized liquid extraction (PLE, Method 5), and microextraction techniques including MEPS, µ-MSPD, DSPME, US-VA-DLLME, and dynamic HF-LPME (Methods 6-10) [12].
Assessment Protocol: Each method was evaluated using AGREE for the overall procedure and AGREEprep specifically for sample preparation steps. Input parameters included reagent types/volumes, energy consumption, waste generation, throughput, and operational hazards [12].
Results: Microextraction-based methods (particularly Methods 6-10) achieved significantly higher greenness scores in AGREEprep assessment due to minimal solvent consumption, reduced waste generation, and improved safety profiles [12]. Methods employing derivatization (Method 3) and large solvent volumes scored poorest.
Conclusion: The study recommended microextraction techniques coupled with modern chromatographic systems as the most environmentally sustainable approach for routine analysis, demonstrating how greenness metrics can guide laboratory practice toward reduced ecological impact [12].
The Emergence of White Analytical Chemistry: Balancing Sustainability with Performance
The evolution beyond GAC has led to White Analytical Chemistry (WAC), which integrates three complementary dimensions: environmental sustainability (green), analytical performance (red), and practical applicability (blue) [8] [18]. This holistic framework recognizes that unconditional increases in greenness at the expense of functionality are counterproductive for sustainable development [8].
The Blue Applicability Grade Index (BAGI) has emerged as a key metric to assess the practical viability of analytical methods, complementing environmental-focused tools like AGREE [16] [18]. BAGI evaluates ten applicability attributes including analysis type, throughput, reagent availability, automation, and sample preparation complexity, providing both a numerical score and visual output [16]. In pharmaceutical analysis case studies, methods achieving high BAGI scores (e.g., 72.5 for a paclitaxel quantification method) demonstrate strong practical feasibility alongside environmental and performance attributes [18].
Essential Research Reagents and Solutions for Sustainable Analysis
Table 3: Key Research Reagent Solutions for Sustainable Pharmaceutical Analysis
| Reagent/Solution Category | Specific Examples | Function in Analysis | Sustainable Attributes |
|---|---|---|---|
| Green Solvents [15] [16] | Water, ethanol, supercritical COâ‚‚, ethyl acetate | Replacement for hazardous organic solvents | Less toxic, biodegradable, often renewable sources |
| Bio-Based Reagents [15] | Plant-derived precursors, enzymes, biocatalysts | Synthesis, extraction, and analysis | Renewable feedstocks, reduced toxicity, biodegradable |
| Solid Supported Reagents [15] | Polymer-supported catalysts, immobilized enzymes | Enable catalysis and specific reactions | Recyclable, reduce waste, improve separation |
| Renewable Derivatization Agents [15] | Bio-based labeling reagents | Sample preparation for detection | Reduced toxicity from renewable sources |
| Safer Sorbents [12] | Molecularly imprinted polymers, green silica | Sample preparation and extraction | Reduced environmental impact, improved selectivity |
The pharmaceutical industry's transition toward sustainable analytical practices is driven by a powerful convergence of regulatory requirements, economic incentives, technological innovations, and evolving assessment methodologies. Greenness evaluation metrics have progressed from basic checklists to sophisticated tools that provide comprehensive, quantitative environmental assessments of analytical methods. The emergence of White Analytical Chemistry represents a paradigm shift, recognizing that truly sustainable methods must balance environmental responsibility with analytical performance and practical applicability.
For researchers and drug development professionals, this evolution offers a clear framework for selecting, optimizing, and implementing analytical methods that advance both scientific and sustainability goals. The ongoing development of green assessment tools, coupled with technological innovations in solvent systems, miniaturization, and alternative energy sources, provides a robust toolkit for reducing the environmental footprint of pharmaceutical analysis while maintaining the high-quality standards essential for drug development and quality control.
The pursuit of scientific discovery, particularly in fields like pharmaceutical development, relies heavily on two broad categories of methodologies: instrument-intensive (e.g., traditional chromatography) and computational (e.g., chemometrics, AI modeling). These methodologies diverge fundamentally in their environmental impact pathways, resource consumption patterns, and associated carbon footprints. Instrument-intensive techniques, such as High-Performance Liquid Chromatography (HPLC), consume physical resources—solvents, reagents, and materials—leading to direct waste generation and high energy consumption from laboratory equipment [12] [9]. In contrast, computational methods primarily consume electricity for data processing in servers and data centers, creating a significant, but often less visible, carbon footprint influenced by the energy source of the computing infrastructure [20] [21]. Understanding these divergent pathways is crucial for researchers and drug development professionals aiming to align their work with sustainability goals without compromising scientific integrity. This guide provides an objective comparison of these environmental impacts, supported by experimental data and standardized assessment protocols.
Quantitative Comparison of Environmental Footprints
Direct comparisons of environmental impact require a focus on specific, equivalent tasks. The following tables summarize quantitative data from studies comparing computational and traditional physical methods for similar research and development outcomes.
Table 1: Carbon Emission Reductions from Virtualization in Semiconductor R&D A study by Lam Research compared the carbon footprint of traditional physical experiments in semiconductor research to equivalent virtual simulations [22].
| Research and Development Activity | Carbon Emission Reduction with Virtualization |
|---|---|
| General Hardware Prototyping and Process Optimization | ~20% |
| Plasma Ion Simulations | ~80% |
Contextual Note: The study further contextualized that producing one full-loop wafer has a lifetime footprint of approximately 1,500 kg of COâ‚‚. A high-end computer running virtualization tools would need to operate for over three years (27,000 hours) to emit an equivalent amount [22].
Table 2: Carbon Emissions of Creative Tasks: AI vs. Humans A study in Scientific Reports compared the carbon emissions of AI systems and humans performing equivalent writing and illustrating tasks [23].
| Task Performer | COâ‚‚e per Page of Text (Relative to Humans) | COâ‚‚e per Image (Relative to Humans) |
|---|---|---|
| AI Systems | 130 - 1,500 times less | 310 - 2,900 times less |
| Human Counterparts | Baseline | Baseline |
Illustrative Example: The training of the GPT-3 AI model produces an estimated 552 metric tons of COâ‚‚e. When amortized over its many queries, the operational impact of a single ChatGPT query is approximately 2.2 grams of COâ‚‚e [23]. In perspective, this is significantly less than the emissions from streaming one hour of video content, estimated at 34g COâ‚‚e [20].
Methodologies for Environmental Impact Assessment
To ensure objectivity, standardized metrics and protocols are essential for evaluating the environmental impact of analytical and computational methods.
Experimental Protocols for Greenness Assessment in Analytical Chemistry
The evaluation of instrument-intensive methods relies on Green Analytical Chemistry (GAC) principles. The following protocols detail how key greenness assessment tools are applied to analytical methods, such as chromatography [9].
- Tool Application: Researchers select an analytical procedure for evaluation (e.g., an HPLC method for determining cannabinoids in oils [24]). The method is broken down into its constituent steps: sample collection, preparation, transportation, storage, and final analysis by the instrument.
- Data Collection: For each step, data is collected on the type and volume of solvents and reagents used, energy consumption of equipment, amount and hazardousness of waste generated, and the number of procedural steps.
- Scoring with Multiple Metrics: The method is evaluated using several standardized metrics, which may include:
- AGREE (Analytical Greenness Metric): Uses the 12 principles of GAC to generate a score from 0 to 1 and a circular pictogram. A score above 0.5 is generally considered green [12] [9].
- Analytical Eco-Scale: Assigns penalty points to non-green aspects of the method (e.g., hazardous reagents, high energy use). These are subtracted from a base score of 100; a score above 75 represents an excellent green analysis [24].
- GAPI (Green Analytical Procedure Index): Employs a color-coded pictogram to assess the environmental impact of each stage of the analytical process [24].
- Interpretation: The scores and pictograms from the different metrics are compared to identify environmental hotspots within the method and to choose the greenest available option.
Experimental Protocols for Carbon Footprinting in Computational Science
Assessing the environmental impact of computational work involves calculating the carbon dioxide equivalent (COâ‚‚e) emissions associated with a specific calculation or model run [21].
- Goal and Scope Definition: The researcher defines the computational task to be assessed, such as training a machine learning model or running a genome-wide association study (GWAS).
- Resource Inventory Analysis: The primary data collected is the total computational runtime and the specific hardware used (e.g., type and number of Central Processing Units (CPUs) or Graphics Processing Units (GPUs)).
- Carbon Footprint Calculation: The calculation incorporates two key factors [21]:
- Energy Consumption: The runtime and hardware specifications are used to calculate the total electricity consumed, measured in kilowatt-hours (kWh).
- Carbon Intensity of Electricity: The location of the data center determines the mix of energy sources (e.g., coal, natural gas, renewables) used to generate the electricity. This is expressed as grams of COâ‚‚e per kWh.
- Impact Assessment: The total carbon footprint is calculated by multiplying energy consumption by the carbon intensity. Tools like the Green Algorithms Initiative calculator or CodeCarbon can automate this process [21].
- Interpretation and Optimization: The result is a single carbon footprint value (e.g., kgCOâ‚‚e) for the computational task. This allows researchers to compare software tools or optimize code to reduce emissions.
Visualization of Greenness Evaluation Frameworks
The following diagrams illustrate the logical structures of two prominent greenness assessment tools, providing a visual guide to their evaluation criteria.
AGREE Metric Evaluation Framework
AGREE Metric Evaluation Workflow
The AGREE framework provides a comprehensive evaluation of an entire analytical method against the 12 principles of Green Analytical Chemistry (GAC), resulting in a unified score and pictogram [9].
AGREEprep Metric Evaluation Framework
AGREEprep Sample Prep Workflow
The AGREEprep framework is a specialized tool focused exclusively on the sample preparation stage of an analytical method, evaluating it against 10 principles of Green Sample Preparation [12] [9].
Table 3: Core Components for Instrument-Intensive and Computational Methods
| Item | Function/Description | Relevance to Environmental Impact |
|---|---|---|
| HPLC-grade Organic Solvents (e.g., methanol, acetonitrile) | Mobile phase for separating analytes in a chromatographic column [12]. | High volumes contribute to hazardous waste and resource depletion [9]. |
| Derivatization Reagents | Chemicals used to alter analytes for better detection, often in Gas Chromatography (GC) [12]. | Typically hazardous, posing risks to operator health and the environment [9]. |
| Solid-Phase Extraction (SPE) Cartridges | Devices used to concentrate and purify analytes from a sample matrix [12]. | Consumable plastic waste that requires disposal after use. |
| Energy Grid Mix Data | The composition of energy sources (coal, gas, nuclear, renewables) powering a data center. | Determines the carbon intensity (g COâ‚‚e/kWh) of computational work [21]. |
| High-Performance Computing (HPC) Hardware (CPUs/GPUs) | Processors that perform the complex calculations for simulations and data analysis. | Primary driver of energy consumption in computational science; efficiency varies [21]. |
| Software & Algorithms | Code that defines the computational model or analysis (e.g., BOLT-LMM for genomics). | Algorithmic efficiency dramatically impacts energy use; newer versions can be far greener [21]. |
Greenness Assessment in Practice: Tools and Applications for Chromatography and Chemometrics
Green Analytical Chemistry (GAC) has emerged as a critical discipline focused on minimizing the negative environmental impact of analytical procedures while maintaining their efficacy and reliability. The concept of GAC, introduced in 2000, aims to reduce or eliminate the dangerous effects of analytical activities on human safety, health, and the environment [25] [9]. This represents a significant shift in how analytical challenges are approached, with an increased emphasis on environmental benignity. GAC motivates analytical chemists to address health, safety, and environmental issues during analysis by implementing measures such as using solventless extraction techniques, employing less toxic solvents, and miniaturizing devices for sample preparation and detection [25] [9].
The foundation of GAC is built upon frameworks such as the 12 principles of GAC (signified by the mnemonic "SIGNIFICANCE") and the 10 principles of Green Sample Preparation (GSP) [25] [26]. However, due to the varying characteristics and requirements of different analytical procedures, these principles alone are insufficient for comprehensively assessing the greenness of analytical methods. This challenge led to the development of dedicated metric tools designed to evaluate, quantify, and compare the environmental impact of analytical methodologies [25] [27]. The evolution of these metrics has progressed from basic tools to increasingly sophisticated and holistic assessment systems that enable chemists to design, select, and implement methods that are both scientifically robust and ecologically sustainable [9].
This guide provides a comprehensive overview and comparison of six major GAC metrics: the National Environmental Methods Index (NEMI), Analytical Eco-Scale (AES), Green Analytical Procedure Index (GAPI), Analytical Greenness Metric (AGREE), AGREE for sample preparation (AGREEprep), and the recently introduced Greenness Evaluation Metric for Analytical Methods (GEMAM). The objective comparison presented here focuses on their underlying principles, assessment methodologies, applications, and limitations within the context of greenness evaluation for chemometrics and traditional chromatography research, serving the needs of researchers, scientists, and drug development professionals.
Historical Development and Evolution of GAC Metrics
The development of GAC metrics has progressed significantly from simple binary assessments to comprehensive, multi-faceted evaluation tools. This evolution reflects the growing sophistication in understanding and quantifying the environmental impact of analytical methods. The timeline below illustrates key milestones in the development of these assessment tools.
Timeline of Major GAC Metric Development
The National Environmental Methods Index (NEMI), introduced in 2002, was one of the first systematic attempts to assess method greenness [11]. Its simple pictogram-based approach provided a basic yes/no evaluation against four environmental criteria. In 2012, the Analytical Eco-Scale brought a more quantitative approach by assigning penalty points to non-green attributes [11]. The field advanced significantly with the introduction of the Green Analytical Procedure Index (GAPI) in 2018, which offered a more comprehensive visual assessment of the entire analytical process [9] [28].
The development of the Analytical Greenness Metric (AGREE) in 2020 marked a substantial step forward by incorporating all 12 principles of GAC and providing both a numerical score and visual output [29]. This was followed by AGREEprep in 2022, the first tool specifically designed for evaluating sample preparation steps [26]. Most recently, 2024 saw the introduction of GEMAM, which integrates both GAC principles and GSP factors into a unified assessment framework [25]. This progression demonstrates a clear trend toward more specialized, comprehensive, and user-friendly assessment tools that provide both qualitative and quantitative insights into method greenness.
Comprehensive Comparison of Major GAC Metrics
Fundamental Characteristics and Assessment Methodologies
The six major GAC metrics employ distinct approaches, criteria, and output formats for evaluating the environmental impact of analytical methods. The following table provides a systematic comparison of their key characteristics, with a focus on their underlying principles and output formats.
Table 1: Comparison of Fundamental Characteristics of Major GAC Metrics
| Metric | Year Introduced | Assessment Basis | Output Format | Scoring System | Key Focus Areas |
|---|---|---|---|---|---|
| NEMI | 2002 [11] | 4 basic criteria [11] | Quadrant pictogram [11] | Binary (green/uncolored) [11] | PBT chemicals, hazardous solvents, pH, waste amount [11] |
| Analytical Eco-Scale | 2012 [11] | Penalty point system [28] | Numerical score [28] | 0-100 scale (100 = ideal) [11] [28] | Reagents, waste, energy, hazards [11] |
| GAPI | 2018 [9] [28] | 5 stages of analytical process [28] | 5 pentagrams with colored sections [28] | Qualitative (green/yellow/red) [28] | Sample collection to detection [28] |
| AGREE | 2020 [29] | 12 principles of GAC [29] | Circular pictogram with score [29] | 0-1 scale (1 = ideal) [29] | Comprehensive GAC principles [29] |
| AGREEprep | 2022 [26] | 10 principles of GSP [26] | Circular pictogram with score [26] | 0-1 scale (1 = ideal) [26] | Sample preparation specifically [26] |
| GEMAM | 2024 [25] | 12 GAC principles + 10 GSP factors [25] | Hexagonal pictogram with score [25] | 0-10 scale (10 = ideal) [25] | Six aspects: sample, reagent, instrument, method, waste, operator [25] |
Evaluation Criteria and Scope
Each metric varies significantly in its comprehensiveness and the specific aspects of analytical methods it evaluates. The following diagram illustrates the relationships between the different metrics and their primary assessment focus areas.
GAC Metrics and Their Primary Assessment Focus
NEMI employs the simplest approach, evaluating only four basic criteria: whether chemicals used are not on the persistent, bioaccumulative, and toxic (PBT) list; whether solvents are not hazardous; whether pH is between 2-12; and whether waste generated is less than 50 g [11]. The Analytical Eco-Scale expands assessment to include reagent toxicity, energy consumption, and waste generation, assigning penalty points that are subtracted from an ideal score of 100 [11] [28].
GAPI provides a more comprehensive evaluation across five stages of the analytical process, using a color-coded system (green, yellow, red) for each stage but lacks an overall numerical score [28]. AGREE represents a significant advancement by incorporating all 12 principles of GAC into a unified assessment that generates both a visual output and a numerical score between 0 and 1 [29]. AGREEprep specializes exclusively in sample preparation, applying the 10 principles of Green Sample Preparation (GSP) with customizable weighting of criteria [26]. The newest metric, GEMAM, integrates both GAC principles and GSP factors, evaluating six key aspects (sample, reagent, instrument, method, waste, and operator) across 21 criteria and presenting results on a 0-10 scale [25].
Comparative Analysis of Strengths and Limitations
Each GAC metric presents distinct advantages and limitations that determine their suitability for different applications and contexts.
Table 2: Strengths and Limitations of Major GAC Metrics
| Metric | Key Strengths | Major Limitations | Ideal Use Cases |
|---|---|---|---|
| NEMI | Simple, intuitive pictogram; Quick visual assessment [11] | Qualitative only; Limited criteria; Cannot differentiate degree of greenness [9] [11] | Preliminary screening; Educational purposes |
| Analytical Eco-Scale | Quantitative score; Enables direct comparison; Considers reagent amounts [11] [28] | Subjective penalty assignment; No visual component; Does not consider hazard severity [9] [28] | Quick numerical comparison; Complementing visual tools |
| GAPI | Visualizes entire analytical process; Identifies problematic stages [9] [28] | No overall score; Subjective color assignment; Limited comparability [28] | Process optimization; Identifying improvement areas |
| AGREE | Comprehensive (12 principles); Combined visual and numerical output; User-friendly software [29] | Does not fully address pre-analytical processes; Subjective weighting [9] | Holistic method evaluation; Research publications |
| AGREEprep | Specialized for sample preparation; Customizable weights; High specificity [26] | Only covers sample preparation; Must be used with other tools for full assessment [26] | Sample preparation optimization; Microextraction evaluation |
| GEMAM | Integrates GAC + GSP; Flexible weighting; Both qualitative and quantitative output [25] | Newer tool with less established track record; More complex assessment [25] | Comprehensive method development; Latest research studies |
Experimental Protocols and Application Case Studies
Standardized Assessment Methodology for GAC Metrics
To ensure consistent and comparable evaluation of analytical methods using different GAC metrics, researchers should follow a standardized protocol. The workflow below outlines a systematic approach for applying these tools in method assessment and comparison.
Standardized Workflow for GAC Metric Application
Step 1: Method Documentation - Completely detail all aspects of the analytical procedure, including sample collection, storage, preparation, reagents, instrumentation, method parameters, waste generation, and operator safety considerations [25] [12].
Step 2: Data Collection - Quantify all relevant parameters including sample size, solvent types and volumes, reagent amounts and hazards, energy consumption, waste volumes and treatment, analysis time, throughput, and safety measures [12] [11].
Step 3: Metric Selection - Choose appropriate metrics based on assessment goals. AGREE provides comprehensive evaluation, AGREEprep specializes in sample preparation, GAPI offers process-stage visualization, Analytical Eco-Scale enables numerical comparison, and GEMAM provides integrated GAC+GSP assessment [25] [26] [29].
Step 4: Assessment Execution - Utilize available software tools for each metric: AGREE and AGREEprep software (https://mostwiedzy.pl/AGREE), MoGAPI software (bit.ly/MoGAPI), and GEMAM software (https://gitee.com/xtDLUT/Gemam/releases/tag/Gemam-v1) [25] [12] [28].
Step 5: Result Interpretation - Interpret scores according to established thresholds: Analytical Eco-Scale (>75 excellent, 50-75 acceptable); AGREE and AGREEprep (closer to 1 = greener); GEMAM (0-10 scale, higher = greener) [25] [11] [29].
Step 6: Comparative Analysis - Compare multiple methods using the same metric, identify weaknesses for improvement, and select the greenest option that maintains analytical performance [12].
Case Study: Evaluation of Chromatographic Methods for UV Filter Analysis
A recent study compared the greenness of 10 chromatographic methods for determining UV filters in cosmetic samples using AGREE and AGREEprep tools, providing valuable insights into practical application of GAC metrics [12]. The methods evaluated included techniques based on liquid chromatography and gas chromatography with various sample preparation approaches.
Experimental Methods: The assessment included a European standard method (Method 1) and nine literature methods with different sample preparation techniques: solvent dissolution (Methods 1-2), solvent extraction with derivatization (Method 3), solid-phase extraction (SPE, Method 4), pressurized liquid extraction (PLE, Method 5), and five microextraction methods (MEPS, µ-MSPD, DSPME, US-VA-DLLME, and dynamic HF-LPME-HPLC-UV for Methods 6-10) [12].
Assessment Protocol: Each method was evaluated using both AGREE and AGREEprep metrics following the standardized software protocols. The AGREE assessment considered all 12 GAC principles, while AGREEprep focused specifically on the 10 GSP principles for sample preparation steps [12].
Key Findings: The results demonstrated that microextraction methods (Methods 6-10) consistently achieved higher greenness scores in AGREEprep assessment due to their minimal solvent consumption, reduced waste generation, and improved safety profiles [12]. The study also revealed that methods incorporating derivatization steps (Method 3) showed significantly lower greenness scores due to the use of additional hazardous reagents and increased waste generation. The comprehensive assessment enabled clear identification of environmental hotspots in each method and provided guidance for improving their greenness profiles [12].
Case Study: Evaluation of SULLME Method Using Multiple Metrics
A comparative evaluation of a sugaring-out liquid-liquid microextraction (SULLME) method for determining antiviral compounds using multiple GAC metrics (MoGAPI, AGREE, AGREEprep, and AGSA) demonstrated the value of complementary assessment approaches [9].
Method Details: The SULLME method employed microextraction techniques with reduced solvent consumption (<10 mL per sample), semi-automation, and avoided derivatization steps, but used moderately toxic substances and generated >10 mL of waste per sample without specific treatment [9].
Multi-Metric Assessment Results: The method obtained a MoGAPI score of 60/100, AGREE score of 0.56, AGSA score of 58.33, and Carbon Footprint Reduction Index (CaFRI) score of 60 [9]. The convergent results across different metrics confirmed the method's moderate greenness level, with strengths in miniaturization and automation but weaknesses in waste management and reagent safety.
Interpretation: The case study highlighted how different metrics provide complementary insights while generally converging on similar conclusions about overall method greenness. The consistent identification of waste management as a weakness across multiple metrics provided clear direction for method improvement [9].
Essential Research Reagent Solutions for GAC Implementation
Successful implementation of GAC principles and accurate application of greenness metrics requires specific reagents, materials, and tools that enable more sustainable analytical practices.
Table 3: Essential Research Reagent Solutions for Green Analytical Chemistry
| Reagent/Material | Function in GAC | Application Examples | Green Benefits |
|---|---|---|---|
| Natural Deep Eutectic Solvents (NADES) | Alternative green extraction solvents [27] | Microextraction techniques; Liquid-liquid extraction [27] | Biodegradable; Low toxicity; Renewable sourcing [27] |
| Ionic liquids | Designer solvents for selective extraction [27] | Sample preparation; Chromatography | Low volatility; Tunable properties; Reusable [27] |
| Solid-phase microextraction (SPME) fibers | Solventless extraction [12] | Sample preparation for chromatographic analysis [12] | Minimal solvent use; Reusable; Small sample sizes [12] |
| Molecularly imprinted polymers | Selective sorbents for sample preparation [12] | Solid-phase extraction; Microextraction [12] | High selectivity; Reusable; Reduced reagent consumption [12] |
| Bio-based sorbents | Sustainable materials for extraction [25] | Sample clean-up; Pre-concentration | Renewable materials; Reduced environmental impact [25] |
| Water-based mobile phases | Green chromatographic separations [11] | HPLC; UHPLC methods | Reduced organic solvent use; Lower toxicity [11] |
| Energy-efficient instruments | Reduced power consumption [25] | All instrumental analysis | Lower energy requirements; Reduced carbon footprint [25] |
| Automated systems | Improved efficiency and safety [25] | Sample preparation; Analysis | Reduced reagent consumption; Higher throughput; Enhanced operator safety [25] |
The evolution of GAC metrics from simple binary tools like NEMI to comprehensive, multi-faceted assessment systems like AGREE and GEMAM reflects the growing sophistication in evaluating the environmental impact of analytical methods. Currently, no single metric is universally superior; each offers unique strengths for different assessment contexts. NEMI provides quick screening, Analytical Eco-Scale enables numerical comparison, GAPI visualizes process stages, AGREE offers comprehensive GAC principle evaluation, AGREEprep specializes in sample preparation, and GEMAM integrates both GAC and GSP frameworks.
The future development of GAC metrics will likely focus on increased standardization, integration of life-cycle assessment principles, incorporation of carbon footprint calculations, and development of unified platforms that combine multiple evaluation perspectives [9] [30]. Tools like the Carbon Footprint Reduction Index (CaFRI) represent emerging directions that align analytical chemistry with broader climate goals [9]. Additionally, the integration of artificial intelligence for automated assessment and the development of interactive digital dashboards may further simplify and standardize greenness evaluation [30].
For researchers and method developers, selecting the appropriate GAC metric depends on specific assessment needs: AGREE and GEMAM for comprehensive evaluation, AGREEprep for focused sample preparation assessment, and Analytical Eco-Scale for straightforward numerical comparison. Applying multiple complementary metrics provides the most robust evaluation of method greenness, enabling informed decisions that balance analytical performance with environmental sustainability. As GAC continues to evolve, these metrics will play an increasingly vital role in guiding the analytical community toward more sustainable practices without compromising analytical quality.
The field of analytical chemistry is undergoing a fundamental paradigm shift to align with sustainability science, moving away from traditional, resource-intensive practices toward more environmentally responsible methodologies [31]. This transition is particularly relevant for chromatography, a cornerstone technique in pharmaceutical and environmental analysis where high consumption of solvents and energy raises significant environmental concerns [31] [32]. The conventional "take-make-dispose" model of analytical chemistry is increasingly being challenged by frameworks like Circular Analytical Chemistry (CAC) and the principles of Green Analytical Chemistry (GAC) [31].
This comparison guide examines how High-Performance Liquid Chromatography (HPLC) and High-Performance Thin-Layer Chromatography (HPTLC) are adapting to these sustainability demands within pharmaceutical applications. We objectively evaluate both techniques through recent case studies, employing standardized greenness assessment tools to provide researchers, scientists, and drug development professionals with evidence-based comparisons for method selection.
Greenness Evaluation Frameworks: Tools for Objective Assessment
The move toward sustainable analytical chemistry relies on standardized metrics to quantitatively evaluate environmental impact. Several well-established tools now enable objective comparison of method greenness:
AGREE (Analytical GREEnness Metric): This comprehensive tool evaluates methods against all 12 principles of GAC, providing a score from 0 to 1 along with an intuitive circular pictogram [9] [32]. Its holistic approach has made it increasingly popular for overall method assessment.
AGREEprep: A specialized tool focusing specifically on sample preparation, often the most environmentally impactful step in analytical workflows [9]. It evaluates parameters through ten specific criteria.
GAPI (Green Analytical Procedure Index): This semi-quantitative tool uses a color-coded pictogram to represent environmental impact across the entire analytical procedure, from sample collection to final determination [32] [33].
BAGI (Blue Applicability Grade Index): Recently introduced to complement greenness metrics, BAGI assesses practical methodology aspects including throughput, cost, and operational simplicity [32] [33]. This tool is particularly valuable for evaluating real-world laboratory implementation.
NEMI (National Environmental Methods Index): An early and simple tool using a binary pictogram to indicate whether a method meets basic environmental criteria [9].
These tools form the basis for the objective comparisons presented in the following case studies, enabling standardized evaluation across different methodological approaches.
Case Study 1: Simultaneous Quantification of Cardiovascular Drugs and Mutagenic Impurity
Experimental Protocol and Methodologies
A 2025 study directly compared HPTLC-densitometry and a chemometric approach (Firefly Algorithm-optimized partial least squares, FA-PLS) for simultaneously quantifying bisoprolol fumarate (BIP), amlodipine besylate (AML), and 4-hydroxybenzaldehyde (HBZ), a Class 3 mutagenic impurity [34].
HPTLC Method Details:
- Stationary Phase: Silica gel 60 F₂₅₄ plates (10 × 10 cm)
- Mobile Phase: Ethyl acetate–ethanol (7:3, v/v)
- Development: Automated chamber (25 ± 0.5°C, 40 ± 2% RH) with 25-minute saturation
- Detection: Densitometry at 230 nm with 8 × 0.1 mm slit dimension
- Sample Application: 8 mm bands at 10 mm intervals via automated applicator
FA-PLS Spectrophotometry Details:
- Instrumentation: Double-beam UV-Vis spectrophotometer with 1 cm path length quartz cuvettes
- Chemometrics: Firefly Algorithm for variable selection with Hammersley Sequence Sampling validation
- Design: 52-mixture experimental design (25 calibration mixtures)
Performance Comparison and Greenness Assessment
The table below summarizes the analytical performance and sustainability metrics for both methods:
Table 1: Performance and sustainability comparison of HPTLC and chemometric methods for cardiovascular drug analysis
| Parameter | HPTLC-Densitometry | FA-PLS Spectrophotometry |
|---|---|---|
| Linear Range | 50-600 ng/band (BIS), 100-600 ng/band (AML), 10-200 ng/band (HBZ) | 0.5-25.0 μg/mL (BIS), 1.0-30.0 μg/mL (AML), 0.1-10.0 μg/mL (HBZ) |
| Detection Limit | 3.56-20.52 ng/band | 0.011-0.120 μg/mL |
| Precision (RSD) | ≤ 2% | ≤ 2% |
| Correlation Coefficient (r) | ≥ 0.9995 | ≥ 0.9995 |
| AGREE Score | 0.82 | 0.83 |
| GEMAM Index | 7.015 | 7.487 |
| Carbon Footprint | 0.037 kg COâ‚‚/sample | 0.021 kg COâ‚‚/sample |
| NEMI Profile | Perfect | Perfect |
| BAGI Score | 87.50 | 90.00 |
Both methods demonstrated excellent analytical performance with correlation coefficients ≥0.9995 and precision RSD ≤2% [34]. The FA-PLS method showed slightly better sensitivity with detection limits of 0.011-0.120 μg/mL compared to 3.56-20.52 ng/band for HPTLC [34]. Sustainability assessment revealed exceptional environmental profiles for both approaches, with perfect NEMI scores and high AGREE ratings of 0.82 (HPTLC) and 0.83 (FA-PLS) [34].
The carbon footprint analysis favored the FA-PLS method (0.021 kg COâ‚‚/sample) over HPTLC (0.037 kg COâ‚‚/sample), while both methods aligned with multiple UN Sustainable Development Goals, particularly SDG 3 (Good Health and Well-being), SDG 9 (Industry, Innovation and Infrastructure), and SDG 12 (Responsible Consumption and Production) [34].
Case Study 2: Analysis of Veterinary Drugs in Bovine Tissue
Experimental Protocol and Methodologies
A 2025 study developed and validated an HPTLC-densitometric method for simultaneous quantification of florfenicol (FLR) and meloxicam (MEL) in bovine muscle tissue, addressing public health concerns regarding veterinary drug residues [35].
HPTLC Method Details:
- Stationary Phase: Aluminum HPTLC plates (20×20 cm) with 5 μm silica gel 60 F₂₅₄
- Mobile Phase: Glacial acetic acid:methanol:triethylamine:ethyl acetate (0.05:1.00:0.10:9.00, by volume)
- Detection: Densitometry at 230 nm with esomeprazole as internal standard
- Sample Preparation: Tissue homogenization, spiking with standards, addition of EDTA and internal standard, extraction with methanol
- Linearity Range: 0.03-3.00 μg/band (MEL), 0.50-9.00 μg/band (FLR)
Performance Metrics and Greenness Profile
The method demonstrated excellent linearity with correlation coefficients >0.999 for both analytes [35]. Validation according to ICH guidelines confirmed the method's reliability, reproducibility, and selectivity for monitoring regulatory compliance with maximum residue limits (MRLs) set by the European Commission (200 μg/kg for FLR and 20 μg/kg for MEL in bovine muscle) [35].
The environmental impact was evaluated using five greenness assessment tools, confirming its eco-friendly credentials [35]. The method's sustainability derived from several factors: minimal solvent consumption compared to conventional HPLC, reduced sample preparation steps, and the capability to analyze multiple samples simultaneously on a single plate, significantly improving throughput while reducing waste generation.
Case Study 3: Stability-Indicating Assay of Antihistamine/Decongestant Combination
Experimental Protocol and Methodologies
A direct comparison of RP-HPLC and HPTLC methods for estimating phenylephrine hydrochloride (PHE) and doxylamine succinate (DOX) in presence of doxylamine oxidative degradation product (DOX DEG) was conducted in a 2025 study [33].
HPLC Method Details:
- Column: Xterra C18 (100 mm × 4.6 mm, 5 μm)
- Mobile Phase: Ethanol:0.01 M phosphate buffer pH=5.0 (30:70, v/v)
- Flow Rate: 1.0 mL/min
- Detection: DAD at 260 nm
- Injection Volume: 20 μL
- Run Time: 10 minutes
HPTLC Method Details:
- Stationary Phase: TLC aluminum sheets with silica gel 60 Fâ‚‚â‚…â‚„
- Mobile Phase: Ethanol:methylene chloride:ammonia 30% (7:2.5:0.5, v/v/v)
- Detection: UV at 260 nm
- Band Width: 6 mm
Performance Comparison and Greenness Assessment
Table 2: Performance comparison of HPLC and HPTLC methods for antihistamine/decongestant combination
| Parameter | HPLC Method | HPTLC Method |
|---|---|---|
| Linear Range | 5-100 μg/mL (DOX, PHE), 5-30 μg/mL (DOX DEG) | 4-26 μg/band (DOX, PHE), 0.5-10 μg/band (DOX DEG) |
| LOD | 1.44 μg/mL (DOX), 1.59 μg/mL (PHE), 0.84 μg/mL (DOX DEG) | 0.76 μg/band (DOX), 0.65 μg/band (PHE), 0.16 μg/band (DOX DEG) |
| LOQ | 4.32 μg/mL (DOX), 4.77 μg/mL (PHE), 2.52 μg/mL (DOX DEG) | 2.28 μg/band (DOX), 1.95 μg/band (PHE), 0.48 μg/band (DOX DEG) |
| Precision | Complies with ICH guidelines | Complies with ICH guidelines |
| Analysis Time | 10 minutes per sample | Multiple samples simultaneously |
Both methods were validated according to ICH guidelines and proven to be reliable, reproducible, and selective for stability-indicating assays [33]. The HPTLC method demonstrated superior sensitivity with lower LOD and LOQ values, particularly for the degradation product (0.16 μg/band LOD for DOX DEG) compared to HPLC (0.84 μg/mL) [33].
Sustainability assessments using GAPI and AGREE metrics confirmed the green credentials of both methods, with the HPTLC approach showing advantages in solvent consumption and energy use due to its capability for parallel sample processing [33]. The HPLC method utilized ethanol as a greener alternative to acetonitrile, improving its environmental profile compared to traditional reversed-phase methods.
Comparative Analysis: HPLC vs. HPTLC in Sustainable Pharmaceutical Analysis
Strategic Selection Guide
The following diagram illustrates the decision-making workflow for selecting between HPLC and HPTLC based on analytical requirements and sustainability considerations:
Key Sustainability Differentiators
Based on the case studies, several patterns emerge regarding the environmental performance of each technique:
HPTLC Sustainability Advantages:
- Reduced Solvent Consumption: Significantly lower mobile phase volumes (typically 10-20 mL per development chamber for multiple samples) compared to HPLC (1-2 mL/min continuous flow) [34] [33]
- Lower Energy Footprint: No high-pressure pumping systems or column heating, reducing energy consumption [34]
- Higher Throughput: Parallel processing of multiple samples on a single plate improves efficiency and reduces environmental impact per sample [34]
- Miniaturization Potential: Smaller sample sizes and reduced reagent consumption align with green chemistry principles [9]
HPLC Sustainability Advantages:
- Method Sensitivity: Often superior for trace analysis, potentially reducing repeat analyses and associated resource consumption [33]
- Automation Potential: Reduced manual handling and improved reproducibility can minimize method development time and solvent waste [31] [32]
- Established Green Modifications: Capability to use ethanol-based mobile phases, sub-2μm particles for faster analysis, and column heating to reduce solvent viscosity [32] [33]
Practical Implementation Considerations
The Scientist's Toolkit: Essential Research Reagent Solutions
Table 3: Essential reagents and materials for implementing sustainable chromatographic methods
| Item | Function | Green Alternatives |
|---|---|---|
| Silica gel plates | HPTLC stationary phase for separation | F254 for UV detection, minimizing derivatization needs |
| C18 columns | HPLC stationary phase for reversed-phase separation | Longer-lasting columns to reduce waste |
| Ethanol | Solvent for extraction and mobile phase | Replaces more toxic acetonitrile in mobile phases |
| Ethyl acetate | Mobile phase component | Lower toxicity alternative to chlorinated solvents |
| Water purification system | Produces LC-grade water for mobile phases | Reduces bottled water transport footprint |
| Phosphate buffers | Mobile phase modifier for pH control | Proper disposal protocols to minimize environmental impact |
The case studies demonstrate that both HPLC and HPTLC have evolved significantly to address sustainability concerns while maintaining analytical robustness. HPTLC shows distinct advantages in solvent consumption, energy efficiency, and operational cost, making it particularly suitable for high-throughput screening and routine analysis where its sensitivity profile is adequate [34] [35]. HPLC maintains strengths in trace analysis, method sensitivity, and regulatory acceptance, though it requires more strategic approach to minimize environmental impact through solvent substitution and method optimization [32] [33].
The choice between techniques should be guided by specific analytical requirements balanced against sustainability goals. For drug development professionals, this comparative analysis supports evidence-based method selection that aligns with the growing imperative for environmentally responsible analytical practices while meeting rigorous pharmaceutical quality standards.
Future directions point toward increased hybridization of techniques, with HPTLC serving as a rapid screening tool followed by confirmatory HPLC analysis when needed, creating a balanced approach that optimizes both sustainability and analytical performance. As green metrics become increasingly integrated into regulatory frameworks, this balanced evaluation of traditional chromatography techniques will prove essential for advancing sustainable pharmaceutical analysis.
The pharmaceutical industry traditionally relies on chromatographic techniques, particularly high-pressure liquid chromatography (HPLC), for quality control analysis. However, these methods are often characterized by high consumption of hazardous organic solvents, significant energy demands, and the generation of substantial chemical waste [36] [37]. In response to the global push for sustainable scientific practices, green analytical chemistry (GAC) has emerged as a critical discipline, providing a framework for reducing the environmental footprint of analytical procedures [9] [32].
A transformative strategy aligning with GAC principles involves the application of chemometric models to spectroscopic data. These mathematical and statistical approaches enable the direct analysis of complex mixtures, frequently eliminating the need for extensive sample preparation or solvent-intensive separation steps [36] [37]. This guide provides a objective comparison of four prominent chemometric methods—Principal Component Regression (PCR), Partial Least-Squares (PLS), Artificial Neural Networks (ANNs), and Multivariate Curve Resolution-Alternating Least Squares (MCR-ALS)—contrasting their performance with traditional chromatography and evaluating their greenness within a sustainable research framework.
Experimental Protocols & Methodologies
A standardized experimental protocol, derived from published studies comparing these techniques, allows for a direct performance comparison [36] [38].
Materials and Instrumentation
- Analytical Standards: Paracetamol (PARA), Chlorpheniramine maleate (CPM), Caffeine (CAF), and Ascorbic acid (ASC) with certified purity (>99%) [36].
- Pharmaceutical Formulation: Grippostad C capsules (STADA, Germany) [36].
- Solvent: Methanol (HPLC grade) [36].
- Instrumentation: UV-Vis spectrophotometer (e.g., Shimadzu 1605) with 1.00 cm quartz cells [36].
- Software: MATLAB with toolboxes (PLS Toolbox, MCR-ALS Toolbox, Neural Network Toolbox) [36].
Standard Solution Preparation
Stock standard solutions (1.00 mg/mL) of each analyte are prepared in methanol. Working standard solutions (100.00 µg/mL) are then diluted from the stocks [36].
Spectral Acquisition and Dataset Construction
- Spectral Measurement: Absorption spectra of pure components and mixtures are recorded across 200–400 nm [36].
- Experimental Design: A five-level, four-factor calibration design is employed to construct the calibration set. This involves preparing 25 mixtures with varying concentrations of each component (e.g., PARA: 4.00–20.00 µg mL−1, CPM: 1.00–9.00 µg mL−1, etc.) [36] [38].
- Data Preprocessing: Spectral data within the 220–300 nm range (81 data points) are mean-centered before model construction to enhance signal-to-noise ratio and model stability [36].
Chemometric Model Development
The following key parameters are optimized for each model [36]:
- PCR & PLS: The optimal number of Latent Variables (LVs) is determined using leave-one-out cross-validation to minimize the calibration error. Four LVs were found to be optimal for a quaternary mixture [36].
- MCR-ALS: The algorithm is applied with constraints, such as non-negativity (concentrations and spectra must be zero or positive), to obtain physically meaningful solutions [36] [39].
- ANNs: A feed-forward network using the Levenberg-Marquardt backpropagation algorithm is trained. The optimal architecture for a quaternary mixture was found to be four hidden neurons using a purelin-purelin transfer function, with a learning rate of 0.1 and 100 epochs [36].
Greenness Assessment Protocol
The environmental impact of the methods is evaluated using established metrics [36] [9]:
- AGREE (Analytical GREEnness): Uses the 12 principles of GAC to provide a score from 0 (least green) to 1 (most green) and a pictogram [36] [32].
- Analytical Eco-Scale: Assigns penalty points for hazardous reagents, energy consumption, and waste; a score out of 100 (higher is greener) is calculated [36].
Performance Comparison: Chemometrics vs. Traditional Chromatography
Analytical Performance
The following table summarizes the quantitative performance of the four chemometric models in resolving a quaternary pharmaceutical mixture, based on experimental data [36].
Table 1: Analytical Performance of Chemometric Models for a Quaternary Mixture (PARA, CPM, CAF, ASC)
| Model | Key Principle | Correlation Coefficient (R)* | Root Mean Square Error of Prediction (RMSEP)* | Remarks |
|---|---|---|---|---|
| PCR | Dimensionality reduction via principal components | >0.999 | 0.0352 - 0.1767 | Handles multicollinearity well [36] [38]. |
| PLS | Maximizes covariance between spectra and concentration | >0.999 | 0.0352 - 0.1767 | Often more efficient than PCR with fewer components [36] [37]. |
| MCR-ALS | Iterative resolution using constraints | >0.999 | 0.0352 - 0.1767 | Provides pure component spectra and concentrations without prior information [36] [39]. |
| ANNs | Non-linear learning via interconnected nodes | >0.9997 | 0.0352 - 0.1767 | Superior for modeling complex, non-linear relationships; requires more data and tuning [36] [38]. |
| Traditional HPLC | Physical separation of components | N/A | Comparable (No significant variation) | Considered the reference method; requires separation time and solvent consumption [36]. |
*Reported ranges from validation sets in comparable studies [36] [38].
All four chemometric models demonstrated excellent accuracy and precision, with no considerable variations compared to official HPLC methods, making them suitable for standard pharmaceutical analysis [36].
Environmental Impact & Greenness Evaluation
The most significant advantage of chemometric methods lies in their sustainability profile. The following table compares their greenness to a traditional HPLC approach.
Table 2: Greenness Comparison of Analytical Approaches
| Aspect | Traditional HPLC | Chemometric-Spectroscopic Approach |
|---|---|---|
| Solvent Consumption | High (100s of mL/day) [37] | Very Low (< 10 mL for calibration and validation) [36] |
| Energy Demand | High (pumps, ovens, detectors) [32] | Moderate (primarily from spectrophotometer) [36] |
| Chemical Waste | High (requires disposal) [37] | Minimal [36] |
| Analysis Time | Longer (includes separation time) | Rapid (no separation step) [36] |
| Sample Preparation | Often complex | Simplified or direct analysis [36] [37] |
| AGREE Score | Lower (e.g., ~0.5 for a typical method) | 0.77 (Reported for the combined chemometric models) [36] |
| Eco-Scale Score | Lower (e.g., <75 for penalties) | 85 (Reported for the combined chemometric models) [36] |
The chemometric approach achieved an AGREE score of 0.77 and an Eco-Scale score of 85, classifying it as an excellent green alternative [36]. The workflow and greenness assessment are visualized below.
Comparative Analysis Workflow
Greenness Assessment Framework
The Scientist's Toolkit: Essential Research Reagents & Materials
Table 3: Essential Toolkit for Chemometric-Spectroscopic Analysis
| Item | Function / Application Note |
|---|---|
| UV-Vis Spectrophotometer | Must be capable of high-resolution spectral acquisition (e.g., 1 nm intervals). Software for data export is critical [36]. |
| MATLAB Software | The primary platform for algorithm development and computation. PLS Toolbox, MCR-ALS Toolbox, and Neural Network Toolbox are essential add-ons [36] [39]. |
| Chemometric Model Templates | Pre-configured scripts for PCR, PLS, MCR-ALS, and ANN to accelerate method development and ensure reproducibility [36]. |
| Greenness Assessment Software | Open-source tools for AGREE and other metrics to quantitatively evaluate and report the environmental profile of the method [9] [32]. |
| Chemical Standards | High-purity reference materials for all target analytes are non-negotiable for building accurate calibration models [36]. |
| D-Leucine-D10 | D-Leucine-D10, MF:C6H13NO2, MW:141.23 g/mol |
| Cy5-DSPE chloride | Cy5-DSPE chloride, MF:C73H119ClN3O9P, MW:1249.2 g/mol |
This comparison guide demonstrates that chemometric models applied to spectroscopic data are not merely analytical alternatives but are superior to traditional chromatography in terms of environmental sustainability while maintaining comparable analytical performance. The high AGREE and Eco-Scale scores confirm their alignment with the principles of Green Analytical Chemistry. For researchers and drug development professionals, adopting PCR, PLS, MCR-ALS, and ANN approaches represents a significant step toward achieving standard pharmaceutical analysis that is both scientifically rigorous and ecologically responsible, effectively supporting the broader thesis of sustainable research practices.
The evolution of green analytical chemistry (GAC) has led to the development of a more comprehensive framework known as White Analytical Chemistry (WAC), which aims to balance environmental sustainability with the practical demands of analytical science. This triadic model integrates three complementary dimensions: the green component focusing on environmental impact, the red component addressing analytical performance, and the blue component evaluating practical productivity and methodological effectiveness [9]. This holistic approach represents a significant advancement over earlier metrics that assessed greenness in isolation, recognizing that truly sustainable methods must also deliver reliable results and be practically implementable in real-world laboratory settings [40].
The foundation of WAC lies in addressing a critical challenge in analytical chemistry: traditional green chemistry metrics like E-Factor or Atom Economy often prove inadequate for comprehensively assessing analytical methods, which frequently involve multiple steps, specialized equipment, and complex supply chains [9]. The triadic model emerged to provide a balanced evaluation framework that acknowledges the interconnectedness of environmental responsibility, analytical validity, and practical feasibility. This approach aligns with broader sustainability goals in the chemical sciences while maintaining the rigorous standards required for scientific and regulatory applications [40].
Foundational Principles and Assessment Metrics
The Twelve Principles of Green Analytical Chemistry
Green Analytical Chemistry operates according to twelve well-established principles that guide the development of environmentally responsible analytical methods. These principles include the reduction or elimination of hazardous solvents and reagents, miniaturization of analytical devices, automation of methods to reduce human error and exposure, development of direct testing techniques to avoid sample treatment, and implementation of proper waste management procedures [11]. These principles serve as the foundation for the green dimension of the WAC model, providing specific criteria for evaluating the environmental footprint of analytical procedures.
The principles emphasize prevention rather than treatment of waste, designing safer chemicals and products, and using renewable materials where possible [40]. For analytical chemists, this translates to selecting methods that minimize energy consumption, reduce or eliminate dangerous solvents, and incorporate safety considerations from the initial method development stages. The application of these principles has driven innovations such as solvent-free extraction techniques, miniaturized sample processing technologies, and more environmentally friendly detection instruments [11].
Key Assessment Tools for the Triadic Model
Several specialized assessment tools have been developed to evaluate methods within the WAC framework, each addressing different aspects of the triad:
Table 1: Key Assessment Tools for White Analytical Chemistry
| Tool Name | Primary Focus | Output Type | Key Features | Limitations |
|---|---|---|---|---|
| NEMI (National Environmental Methods Index) | Green Component | Pictogram (pass/fail for 4 criteria) | Simple, visual assessment | Binary assessment; lacks granularity [9] [11] |
| Analytical Eco-Scale | Green Component | Numerical score (0-100) | Penalty points for non-green aspects; quantitative comparison | Relies on expert judgment; no visual component [9] |
| GAPI (Green Analytical Procedure Index) | Green Component | Color-coded pictogram (5 parts) | Comprehensive; covers entire analytical process | No overall score; subjective color assignments [9] [11] |
| AGREE (Analytical Greenness) | Green Component | Pictogram + numerical score (0-1) | Based on 12 GAC principles; user-friendly | Doesn't fully address pre-analytical processes [9] |
| RGB Model | All Three Dimensions | Numerical scores (1-100) for each dimension | Evaluates performance (Red), greenness (Green), practicality (Blue) | Potential competition between dimensions [40] |
The RGB additive color model developed by Nowak and Kościelniak provides a particularly relevant tool for WAC implementation, as it explicitly addresses all three dimensions of the triad. This model assigns scores from 1-100 for analytical performance (red), environmental safety and eco-friendliness (green), and productivity and effectiveness (blue) [40]. This quantitative approach enables direct comparison between methods and helps identify whether the three dimensions are competitive or complementary in specific analytical contexts.
Comparative Analysis: Traditional Chromatography vs. Green Chemometric Approaches
Greenness Evaluation of Traditional Chromatographic Methods
Traditional chromatographic techniques present significant sustainability challenges that the WAC framework aims to address. Conventional gas chromatography (GC) typically employs helium as a carrier gas, which poses sustainability concerns due to its status as a non-renewable resource obtained as a byproduct of fossil fuel production [40]. Similarly, high-performance liquid chromatography (HPLC) methods often consume substantial volumes of organic solvents, generating significant waste requiring treatment or disposal [41].
Table 2: Environmental Impact Comparison of Chromatographic Techniques
| Technique | Solvent Consumption | Energy Demand | Waste Generation | Key Greenness Concerns |
|---|---|---|---|---|
| Conventional HPLC | High (>50 mL/sample) | Moderate-High | High (>50 g/sample) | Hazardous solvent use, high waste [11] |
| Conventional GC | Low | Moderate | Low | Helium carrier gas sustainability [40] |
| Microflow LC | Low (<1 mL/sample) | Moderate | Low | Requires specialized equipment [41] |
| SFC (Supercritical Fluid Chromatography) | Very Low (primarily COâ‚‚) | Moderate | Very Low | Limited method compatibility [41] |
| Miniaturized GC | Very Low | Low | Very Low | Reduced application range [40] |
The application of GAC assessment tools to traditional methods reveals significant opportunities for improvement. For instance, when evaluating a sugaring-out liquid-liquid microextraction (SULLME) method using multiple metrics, researchers obtained moderate scores: MoGAPI (60/100), AGREE (0.56/1), and AGSA (58.33/100), highlighting weaknesses in waste management, reagent safety, and energy sourcing despite strengths in miniaturization [9]. This multidimensional assessment exemplifies how the WAC framework provides a more nuanced understanding than single-dimensional greenness metrics.
Green Chemometric Approaches and Their Advantages
Chemometric approaches offer significant sustainability advantages through method optimization and direct analysis techniques. By employing experimental design and multivariate analysis, chemometrics enables method development with dramatically reduced solvent and reagent consumption, minimized waste generation, and lower energy requirements compared to traditional chromatography [11]. These approaches align strongly with multiple GAC principles, particularly those advocating for reduced sample treatment and miniaturization.
The integration of chemometrics with in-line and on-line monitoring systems represents a particularly promising approach within the WAC framework. These direct analysis techniques frequently eliminate extensive sample preparation steps, reducing or eliminating solvent use and shortening analysis times [11]. Furthermore, chemometric modeling of existing chromatographic data can sometimes obviate the need for additional experimental runs, effectively reducing the environmental footprint of method development and validation phases.
Performance Comparison in Pharmaceutical Applications
In drug development contexts, both traditional chromatography and chemometric approaches must meet rigorous performance standards for method validation. When evaluated across the WAC triad, each approach demonstrates distinct profiles:
Traditional chromatography typically excels in the red (performance) dimension, with well-established validation parameters including specificity, accuracy, precision, and robustness [41]. These methods benefit from extensive regulatory acceptance and familiarity among practitioners. However, they often score lower in the green dimension due to solvent consumption, waste generation, and energy use, and may face challenges in the blue (practicality) dimension regarding throughput and operational costs [40].
Chemometric approaches frequently demonstrate advantages in the green and blue dimensions, with significantly reduced environmental impact and potentially higher throughput through rapid analysis and automation capabilities [11]. However, they may face challenges in the red dimension related to regulatory acceptance for certain applications and require specialized expertise for proper implementation and interpretation. The validation of chemometric models presents unique challenges compared to established chromatographic validation protocols.
Experimental Protocols for Greenness Assessment
Comprehensive Method Evaluation Workflow
A standardized workflow for evaluating analytical methods within the WAC framework ensures consistent and comparable assessments across different techniques and laboratories. The following diagram illustrates this comprehensive evaluation process:
Detailed Assessment Protocols
Red Dimension (Analytical Performance) Assessment
The evaluation of analytical performance follows established validation protocols adapted for greenness context:
- Specificity and Selectivity: Demonstrate method capability to accurately measure analyte in presence of potential interferents using statistical comparison of results [41]
- Linearity and Range: Establish by analyzing minimum of 5 concentrations in triplicate across claimed method range; calculate correlation coefficient, y-intercept, and slope of regression line [41]
- Accuracy and Precision: Assess through recovery studies at multiple concentration levels (minimum 3) with repeated analysis (minimum 6 replicates); report percent recovery and relative standard deviation [41]
- Sensitivity: Determine limits of detection (LOD) and quantification (LOQ) using signal-to-noise ratio (3:1 for LOD, 10:1 for LOQ) or standard deviation method [41]
Green Dimension (Environmental Impact) Assessment
The environmental assessment employs multiple complementary metrics:
- AGREE Calculator Implementation: Input data for all 12 GAC principles including reagent toxicity, energy consumption, waste amount and treatment, operator safety, and sample throughput [11]
- GAPI Assessment: Complete five-part assessment covering sample collection, preservation, preparation, transportation, and final analysis using color-coded criteria [9] [11]
- Waste Audit: Quantify total waste generated per sample, categorize by hazard classification, and document disposal methods [9]
- Energy Consumption Measurement: Record instrument power usage throughout analytical cycle including standby modes using calibrated watt meters [40]
Blue Dimension (Practical Productivity) Assessment
Practical implementation factors are evaluated through:
- Throughput Analysis: Calculate samples processed per hour including preparation and analysis time [9]
- Cost Assessment: Document reagent, equipment, and labor costs per sample analysis
- Skill Requirement Evaluation: Rate technical expertise needed for method operation using standardized scales
- Automation Potential: Assess compatibility with automated sample processing and data analysis platforms [42]
Essential Research Reagent Solutions for Green Analytical Chemistry
Implementing the WAC framework requires specific reagents and materials that enable greener analytical approaches while maintaining performance standards:
Table 3: Essential Research Reagent Solutions for Green Analytical Chemistry
| Reagent/Material | Function in Green Analysis | Traditional Alternative | Key Green Advantages |
|---|---|---|---|
| Bio-based Extraction Solvents (e.g., ethanol, ethyl lactate) | Sample preparation and extraction | Petroleum-derived solvents (hexane, dichloromethane) | Renewable sourcing, lower toxicity, biodegradable [40] |
| Solid-phase Microextraction (SPME) Fibers | Solvent-free sample preparation | Liquid-liquid extraction | Minimal solvent use, reusable, easy automation [40] |
| Hydrogen Generators | GC carrier gas supply | Helium gas cylinders | Renewable production potential, superior chromatographic efficiency [40] [41] |
| Supercritical Fluid Chromatography COâ‚‚ Systems | Mobile phase for SFC | Organic solvent mixtures in HPLC | Non-toxic, easily recycled, waste minimization [41] |
| Miniaturized Chromatography Columns (e.g., microfluidic, capillary) | Separation component | Conventional HPLC/GC columns | Reduced mobile phase consumption, lower energy requirements [41] |
| Green Derivatization Reagents | Analyte modification for detection | Hazardous derivatization agents | Reduced toxicity, milder reaction conditions [40] |
The selection of appropriate reagents and materials significantly influences all three dimensions of the WAC model. For example, replacing traditional helium carrier gas in GC with hydrogen or nitrogen addresses the green dimension by improving sustainability, while also potentially enhancing the blue dimension through cost reduction and the red dimension via improved separation efficiency in some applications [40] [41]. Similarly, implementing supercritical fluid chromatography (SFC) with carbon dioxide-based mobile phases dramatically reduces organic solvent consumption while maintaining analytical performance for many applications [41].
The Triadic Relationship: Visualization and Interpretation
The fundamental relationships within the White Analytical Chemistry framework can be visualized through the following conceptual diagram:
The triadic model reveals complex interrelationships between the three dimensions that may be competitive, complementary, or orthogonal depending on the specific analytical context. In some cases, improvements in one dimension may enhance another - for example, miniaturization often simultaneously improves greenness (reduced solvent consumption) and practicality (higher throughput, lower costs) [9] [40]. However, tensions can arise when optimizing one dimension negatively impacts another, such as when implementing complex green alternatives that compromise analytical performance or practical implementation [40].
The optimal balance point within the triad varies based on application requirements. Regulatory methods may prioritize red dimension performance, while high-throughput screening environments might emphasize blue dimension practicality. The WAC framework makes these tradeoffs explicit, enabling more informed method selection and development decisions [9].
The White Analytical Chemistry triadic model represents a significant evolution in how the analytical community conceptualizes and evaluates method sustainability. By integrating greenness with analytical performance and practical productivity, this framework addresses the complex realities of analytical method development and implementation in research and drug development settings. The assessment tools and comparative data presented in this guide provide researchers with a structured approach for evaluating chromatographic and chemometric methods within this comprehensive framework.
As analytical chemistry continues to evolve, the WAC model offers a balanced pathway forward that acknowledges both environmental responsibility and the practical demands of scientific research. Future methodological developments will likely focus on optimizing all three dimensions simultaneously, moving beyond compromise solutions to approaches that genuinely advance analytical science across all aspects of the sustainability triad.
Optimization Strategies for Enhancing Method Greenness
Solvent Selection and Waste Reduction in Chromatographic Methods
The adoption of green principles in chromatographic methods represents a critical evolution in analytical chemistry, driven by increasing environmental concerns and regulatory pressures. Traditional chromatography, particularly high-performance liquid chromatography (HPLC), contributes significantly to laboratory waste streams through substantial consumption of hazardous organic solvents and high energy utilization [43]. The fundamental objectives of green chromatography focus on three key areas: reducing or eliminating hazardous solvents, decreasing energy consumption, and minimizing waste generation [43]. These priorities align with the broader twelve principles of Green Analytical Chemistry (GAC), which provide a structured framework for minimizing the environmental impact of analytical procedures while maintaining scientific robustness [32].
The pharmaceutical industry represents a particularly relevant context for implementing green chromatography principles, as it generates approximately 25-100 kg of waste per kg of active pharmaceutical ingredient (API) produced, with solvents comprising a substantial portion of this waste [44]. This environmental burden has prompted the American Chemical Society Green Chemistry Institute Pharmaceutical Roundtable (ACS-GCIPR) to adopt Process Mass Intensity (PMI) as a benchmark for evaluating process greenness [44]. Within this framework, solvent selection and waste reduction emerge as crucial factors for improving the sustainability profile of chromatographic methods used throughout drug development and quality control.
Green Solvent Selection Frameworks
Established Selection Guides
Several systematic frameworks have been developed to guide solvent selection based on environmental, health, and safety (EHS) criteria. Among these, the CHEM21 Selection Guide has gained prominence as a comprehensive tool developed by a European consortium for promoting sustainable methodologies in the pharmaceutical industry and beyond [45]. This guide classifies solvents into three categories—recommended, problematic, or hazardous—based on safety, health, and environmental impact scores aligned with the Globally Harmonized System (GHS) [45]. The scoring system incorporates multiple parameters including flash point, boiling point, auto-ignition temperature, peroxide formation potential, exposure limits, and environmental toxicity [45].
Other notable solvent selection frameworks include those developed by Pfizer, GSK, Sanofi, AstraZeneca, ETH Zurich, Rowan University, and the ACS Green Chemistry Institute, with the International Council for Harmonization (ICH) Q3C (R8) guidelines providing regulatory perspective [46]. While these guides share common objectives, they may prioritize different criteria, sometimes resulting in varying rankings for specific solvents. This underscores the importance of selecting a framework appropriate for the specific application context and regulatory environment.
Greenness Evaluation of Common Chromatographic Solvents
The following table summarizes the greenness profiles of common chromatographic solvents based on multiple assessment frameworks, particularly the CHEM21 guide:
Table 1: Greenness Assessment of Common Chromatographic Solvents
| Solvent | CHEM21 Category | Safety Concerns | Health Concerns | Environmental Concerns | Typical Green Alternatives |
|---|---|---|---|---|---|
| n-Hexane | Hazardous | Flash point: -22°C, highly flammable | Neurotoxicity, respiratory irritant | High environmental toxicity, H400-H411 | Heptane, cyclopentyl methyl ether |
| Acetonitrile | Problematic | Flash point: 6°C, flammable | Skin/eye irritant, possible reproductive toxicity | H312-H332, environmental toxicity | Ethanol, water-acetone mixtures |
| Dichloromethane | Hazardous | Flash point: none, but suspected carcinogen | Potential carcinogen, liver toxicity | H315-H319-H335-H336, environmental persistence | Ethyl acetate, 2-methyltetrahydrofuran |
| Methanol | Problematic | Flash point: 11°C, flammable | Systemic toxin, visual impairment | Readily biodegradable but toxic to aquatic life | Ethanol, isopropanol |
| Tetrahydrofuran | Problematic | Flash point: -14°C, forms peroxides | Respiratory irritant, central nervous system effects | Readily biodegradable but toxic to aquatic life | 2-Methyltetrahydrofuran, cyclopentyl methyl ether |
| Ethyl Acetate | Recommended | Flash point: -4°C, flammable | Low toxicity, mild irritant | Readily biodegradable, low environmental impact | - |
| Acetone | Recommended | Flash point: -20°C, highly flammable | Low toxicity, mild irritant | Readily biodegradable, low environmental impact | - |
| Ethanol | Recommended | Flash point: 13°C, flammable | Low toxicity at typical exposure levels | Biobased production possible, biodegradable | - |
| Isopropanol | Recommended | Flash point: 12°C, flammable | Low toxicity, more potent than ethanol | Readily biodegradable | - |
| Water | Recommended | Non-flammable, no significant safety issues | No significant health issues | No significant environmental issues | - |
Emerging Green Solvents
Beyond traditional solvents, several emerging alternatives show promise for greener chromatographic applications. Dihydrolevoglucosenone (Cyrene) is a bioderived solvent from cellulosic feedstocks that has demonstrated potential in chromatographic applications despite its problematic ranking in synthesis-oriented guides due to its high boiling point [46]. This characteristic actually becomes advantageous in chromatography where solvent recycling is prioritized. Deep Eutectic Solvents (DES) represent another class of green solvents, consisting of mixtures of hydrogen bond donors and acceptors that form eutectics with melting points lower than their individual components [47]. These customizable, biodegradable solvents are being increasingly applied for extraction processes in analytical chemistry [47]. Additionally, carbon dioxide in supercritical fluid chromatography (SFC) offers a non-toxic, non-flammable alternative to organic solvents with additional advantages of low viscosity and high diffusivity for faster separations [43].
Methodologies for Solvent Reduction and Waste Minimization
Instrumental and Technological Approaches
Multiple technological innovations facilitate significant solvent reduction in chromatographic workflows. Ultrahigh-pressure liquid chromatography (UHPLC) utilizes smaller particle sizes (sub-2μm) and higher operating pressures (≥1000 bar) to achieve superior separation efficiency, enabling shorter analysis times and solvent consumption reductions of 50-90% compared to conventional HPLC [43]. The implementation of miniaturized systems including microfluidic and lab-on-a-chip technologies dramatically reduces solvent volumes to microliter levels while maintaining analytical performance [43]. Centrifugal Partition Chromatography (CPC) offers an alternative approach by operating as a liquid-liquid chromatography technique that eliminates the need for solid supports like silica gel, thereby significantly reducing solvent consumption and solid waste generation [48].
Table 2: Solvent Reduction Technologies in Chromatography
| Technology | Mechanism of Solvent Reduction | Typical Solvent Savings | Implementation Considerations |
|---|---|---|---|
| UHPLC | Higher efficiency separations reduce run times and mobile phase requirements | 50-90% compared to conventional HPLC | Requires compatible instrumentation and columns; higher backpressure |
| SFC | Uses supercritical COâ‚‚ as primary mobile phase with minimal organic modifiers | 50-80% compared to normal-phase HPLC | Limited to non-aqueous applications; requires specialized equipment |
| CPC | Liquid-liquid chromatography without solid stationary phase | 30-70% compared to conventional LC | Limited stationary phase choices; requires method redevelopment |
| Column Miniaturization | Reduced column dimensions (length and internal diameter) | 60-95% compared to standard columns (4.6mm ID) | Potential sensitivity challenges; requires instrumentation with low extra-column volume |
| Microfluidic/Lab-on-a-chip | Ultra-small flow paths and volumes | >90% compared to conventional systems | Limited sample capacity; specialized equipment required |
Solvent Recovery and Recycling Protocols
Implementing solvent recovery processes presents a crucial strategy for waste reduction in analytical laboratories. Multiple techniques demonstrate effectiveness for different chromatographic contexts. Membrane filtration, particularly organic solvent nanofiltration (OSN), can be combined with countercurrent chromatography for cost-effective purification of active pharmaceutical ingredients (APIs), achieving high efficiency in solvent recovery [48]. Dialysis techniques show promise for isolating separated compounds and recycling mobile phase components, with studies demonstrating significant reduction in carbon footprint compared to processes without dialysis implementation [48]. Ultrafiltration achieves substantial solvent recovery in CPC processes, enabling high recovery rates and purity before solvent recycling [48]. Density-based recirculation systems facilitate continuous in-line solvent recycling with readjustment based on density measurements, enhancing process efficiency while yielding high-purity products [48].
A systems-level approach to solvent recovery incorporates multiple sustainability indicators including energy demand, carbon dioxide equivalent (COâ‚‚-eq) emissions, and economic viability [44]. The implementation of such recovery systems aligns with regulatory frameworks like the Resource Conservation and Recovery Act (RCRA), which establishes requirements for hazardous waste management and encourages reuse practices [44]. Beyond environmental benefits, solvent recovery presents economic advantages through reduced purchasing costs for new solvents and decreased waste disposal expenses.
Assessment Tools for Method Greenness
Comparative Analysis of Greenness Metrics
The evaluation of method greenness has evolved from basic assessments to comprehensive multi-parameter tools. The National Environmental Methods Index (NEMI) provides a simple pictogram indicating whether a method meets four basic environmental criteria, but its binary approach lacks granularity for distinguishing degrees of greenness [9]. The Analytical Eco-Scale applies penalty points to non-green attributes subtracted from a base score of 100, facilitating method comparison though somewhat reliant on expert judgment [9] [32]. The Green Analytical Procedure Index (GAPI) offers a more comprehensive visual assessment through a five-part, color-coded pictogram covering the entire analytical process from sample collection to detection [9] [32].
The AGREE (Analytical GREEnness) metric represents a significant advancement by incorporating all 12 GAC principles into a unified evaluation that provides both a numerical score (0-1) and an intuitive circular pictogram [9] [32]. Recent adaptations include AGREEprep specifically designed for sample preparation steps, and Modified GAPI (MoGAPI) which introduces a cumulative scoring system to improve comparability [9]. The emerging concept of White Analytical Chemistry (WAC) expands beyond environmental considerations to balance three dimensions: method greenness (environmental sustainability), method performance (red component), and practical applicability (blue component) [46] [32]. This holistic approach ensures that green methods maintain sufficient analytical performance and practical feasibility for implementation in regulated environments like pharmaceutical quality control.
Table 3: Comparison of Greenness Assessment Tools
| Assessment Tool | Output Type | Parameters Evaluated | Strengths | Limitations |
|---|---|---|---|---|
| NEMI | Binary pictogram | Persistence, toxicity, waste volume, corrosivity | Simple, intuitive | Limited discrimination, no quantitative score |
| Analytical Eco-Scale | Numerical score (0-100) | Reagent toxicity, waste, energy consumption, hazard | Facilitates direct comparison | Subjective penalty assignments |
| GAPI | Color-coded pictogram | Entire analytical workflow stages | Comprehensive visual assessment | No overall score, some subjectivity |
| AGREE | Numerical score (0-1) + pictogram | All 12 GAC principles | Comprehensive, user-friendly software | Limited pre-analytical phase consideration |
| AGREEprep | Numerical score (0-1) + pictogram | 10 sample preparation criteria | Focuses on high-impact step | Must be combined with other tools for full method |
| BAGI | Numerical score + "asteroid" pictogram | 10 practical applicability attributes | Assesses practical feasibility | Does not directly address environmental impact |
Greenness Assessment Workflow
The following diagram illustrates a systematic workflow for assessing and improving the greenness of chromatographic methods:
Experimental Protocols for Green Method Transformation
Systematic Method Transfer Protocol
Transferring conventional chromatographic methods to greener alternatives requires a systematic approach to maintain analytical performance while reducing environmental impact. The following protocol outlines a standardized procedure for method transformation:
Baseline Establishment: Characterize the original method's performance parameters including resolution, peak symmetry, retention factors, and sensitivity. Document current solvent consumption, waste generation, and energy usage to establish baseline environmental metrics.
Solvent Substitution Evaluation:
- Identify the primary organic solvent(s) in the current mobile phase
- Consult CHEM21 or similar guide to classify solvent greenness
- Evaluate potential substitutes with better safety, health, and environmental profiles
- Consider ethanol-water mixtures as alternatives to acetonitrile-water in reversed-phase chromatography
- Assess ethyl acetate or methyl tetrahydrofuran as replacements for dichloromethane or hexane in normal-phase chromatography
Method Modifications:
- Adjust gradient profiles to compensate for solvent strength differences
- Optimize flow rates for alternative viscosity characteristics
- Modify column temperature to fine-tune selectivity with new solvent systems
- Validate performance against original method specifications
Instrumentation Optimization:
- Transition to UHPLC systems with smaller particle columns when possible
- Implement temperature control strategies to reduce backpressure
- Utilize method translation software to scale conventional separations to miniaturized formats
Waste Management Integration:
- Install solvent recycling systems for collected waste streams
- Implement in-line monitoring to optimize solvent consumption
- Establish procedures for segregating and treating different waste types
This protocol should be documented with specific experimental data including chromatographic parameters, system suitability results, and sustainability metrics before and after method modification.
Waste Reduction Hierarchy Implementation
A systematic approach to waste reduction follows a prioritized structure that emphasizes source reduction before implementing recycling or treatment options:
The Researcher's Toolkit: Essential Materials for Green Chromatography
Table 4: Essential Research Reagents and Materials for Green Chromatography
| Material/Reagent | Function | Green Characteristics | Implementation Considerations |
|---|---|---|---|
| Ethanol (bio-based) | Mobile phase component | Renewable feedstock, biodegradable, lower toxicity | Higher viscosity than acetonitrile, may require method adjustment |
| Water | Mobile phase component | Non-toxic, non-flammable, inexpensive | Purification required; may need additives for certain separations |
| Carbon dioxide | Primary mobile phase for SFC | Non-toxic, non-flammable, easily recycled | Requires specialized equipment; limited to non-aqueous applications |
| Ethyl acetate | Normal-phase mobile phase | Biodegradable, low toxicity, renewable production | Higher UV cutoff may limit detection sensitivity |
| Cyrene (dihydrolevoglucosenone) | Specialty solvent for extraction | Bio-based, biodegradable, high boiling point facilitates recycling | Newer solvent with limited application history in chromatography |
| Deep Eutectic Solvents | Extraction media | Tunable properties, biodegradable, low toxicity | Viscosity may challenge pumping systems; method development required |
| Core-shell particle columns | Stationary phase support | Higher efficiency enables shorter columns and reduced solvent consumption | Higher cost than fully porous particles; similar operating pressures to sub-2μm particles |
| Monolithic columns | Stationary phase support | High permeability allows high flow rates with low backpressure | Limited availability for specific applications; different selectivity than particle columns |
| Cellulose-based stationary phases | Chiral separations | Renewable material source, biodegradable disposal | Different selectivity than silica-based phases; may have lower efficiency |
| Secnidazole-d3 | Secnidazole-d3, MF:C7H11N3O3, MW:188.20 g/mol | Chemical Reagent | Bench Chemicals |
| Carbocisteine-d3 | Carbocisteine-d3, MF:C5H9NO4S, MW:182.22 g/mol | Chemical Reagent | Bench Chemicals |
The integration of green solvent selection and waste reduction strategies represents a fundamental shift in chromatographic method development, particularly within the pharmaceutical industry and analytical laboratories. The availability of comprehensive assessment tools like AGREE and CHEM21 provides researchers with structured frameworks for evaluating and improving method sustainability. The ongoing development of greener solvents, improved recycling technologies, and miniaturized instrumentation continues to expand opportunities for reducing the environmental impact of chromatographic analyses.
The successful implementation of green chromatography principles requires balancing environmental objectives with analytical performance requirements, as emphasized by the White Analytical Chemistry framework. As regulatory pressures increase and sustainability becomes increasingly integrated into quality systems, the adoption of green chromatographic practices will likely transition from voluntary improvement to standard requirement. The methodologies and assessment protocols presented in this guide provide researchers with practical approaches for navigating this transition while maintaining the high data quality essential for drug development and scientific research.
Miniaturization and Automation in Sample Preparation
In modern analytical science, particularly within pharmaceutical and biotechnological research, the sample preparation stage remains a critical bottleneck. It is often the most time-consuming, labor-intensive, and environmentally impactful part of the analytical workflow. The dual challenges of increasing analytical throughput and adhering to principles of sustainability have catalyzed a significant shift towards miniaturized and automated sample preparation techniques. This evolution is central to the broader thesis of Green Analytical Chemistry (GAC), which aims to minimize the environmental footprint of analytical methods by reducing or eliminating hazardous solvents, saving energy, and minimizing waste [9].
This guide objectively compares two parallel approaches in this evolving landscape: the adoption of miniaturized hardware (such as functionalized monoliths in micro-extraction) and the application of non-selective analytical techniques (like chemometrics-assisted spectroscopy) that can sometimes bypass extensive sample preparation altogether. By evaluating these alternatives using established greenness metrics, researchers can make informed decisions that align with both their analytical goals and sustainability targets.
Comparative Analysis of Miniaturized vs. Traditional Sample Preparation
The following comparison synthesizes data from recent research to evaluate different sample preparation strategies based on their analytical performance, practicality, and environmental impact.
Table 1: Greenness and Performance Comparison of Sample Preparation Approaches
| Feature | Traditional Solid-Phase Extraction (SPE) | Functionalized Monoliths (Micro-SPE) | FTIR with Chemometrics (Direct Analysis) |
|---|---|---|---|
| Typical Solvent Consumption | High (> 50 mL/sample) [9] | Low (< 10 mL/sample) [49] | Minimal to None [14] |
| Sample Volume | 1-100 mL [9] | < 1 mL [49] | Direct measurement, minimal volume [14] |
| Automation Potential | Moderate (requires coupling) [49] | High (easily coupled online) [49] | High (direct, high-throughput) [14] |
| Analysis Time | Hours | Minutes to Hours [49] | Minutes [14] |
| Selectivity Mechanism | Chemical sorbent (e.g., C18) [49] | High (Antibodies, Aptamers, MIPs) [49] | Spectral fingerprinting & multivariate analysis [14] |
| Primary Greenness Score (AGREE) | ~0.30 (Estimated) | ~0.56 [9] | Outperforms GC-MS [14] |
| Key Advantage | Wide applicability, established protocols | High selectivity, low back pressure, high-throughput [49] | Rapid, non-destructive, and eco-friendly [14] |
| Key Limitation | High solvent waste, matrix effects [49] | Requires synthesis/functionalization [49] | Limited to specific applications, requires model development [14] |
Table 2: Greenness Metric Scores for Evaluated Techniques
This table summarizes the results from applying different greenness assessment tools to the techniques discussed, providing a multidimensional view of their environmental impact. The scores are drawn from case studies in the literature.
| Assessment Metric | SULLME Microextraction [9] | FTIR Spectroscopy [14] | Gas Chromatography-Mass Spectrometry (GC-MS) [14] |
|---|---|---|---|
| AGREE Score | 0.56 | Outperformed GC-MS | Lower than FTIR |
| Analytical Green Star (AGSA) | 58.33 | Information Not Provided | Information Not Provided |
| Carbon Footprint Reduction Index (CaFRI) | 60 | Information Not Provided | Information Not Provided |
| Eco-Scale Assessment | Information Not Provided | Higher | Lower |
| Key Greenness Takeaway | Moderate greenness; strengths in miniaturization offset by waste and reagent safety issues. | Superior greenness and whiteness; suggested as an eco-friendly alternative to chromatography. | Less green than FTIR; involves higher energy and solvent use. |
Experimental Protocols and Workflows
Protocol 1: Automated RNA-Seq Sample Preparation in a High-Throughput Bioreactor System
This protocol demonstrates full automation of a complex molecular biology sample preparation within a liquid handling station, enabling transcriptomic analysis from miniaturized parallel bioreactors [50].
- 1. Cultivation: Batch fermentations of Saccharomyces cerevisiae were carried out in 24 parallel, single-use, stirred-tank bioreactors with a 11 mL working volume. The bioreactor unit was integrated into a liquid handling system (Microlab STAR).
- 2. At-line Sampling: Samples were automatically drawn from the bioreactors by the liquid handling system.
- 3. Cell Disruption: Automated cell lysis was performed using an enzymatic lysis module on the deck of the liquid handling station.
- 4. Total RNA Extraction: Following lysis, total RNA was automatically purified using a standard extraction kit on the deck.
- 5. cDNA Library Preparation: The prepared RNA was automatically processed into sequencing libraries using a Nanopore cDNA-PCR sequencing kit. The deck was equipped with heating, shaking, cooling modules, and an on-deck thermocycler for this purpose.
- 6. Sequencing: The 24 prepared libraries were sequenced off-line using a MinION device (Oxford Nanopore Technologies). This workflow enabled the preparation of 24 cDNA libraries in 11.5 hours, generating 20.97 million classified reads to study the effect of different carbon sources on gene expression [50].
Protocol 2: FTIR and GC-MS Metabolomics for Milk Analysis
This protocol compares a direct spectroscopic method with a traditional chromatographic method for the analysis of primary metabolites in different milk types, within the context of greenness evaluation [14].
- 1. Sample Collection: Thirty-two milk samples (buffalo, cow, goat, camel) were collected from individual farms. Samples were homogenized by stirring for 10 minutes and stored at -20 °C until analysis.
- 2. Direct FTIR Analysis: Milk samples were analyzed directly using Fourier-Transform Infrared spectroscopy (FTIR). The resulting spectra served as a molecular fingerprint for each milk type.
- 3. GC-MS Metabolite Profiling:
- Sample Derivatization: Primary metabolites in the milk samples were chemically derivatized to make them volatile for GC-MS analysis.
- Chromatographic Separation: Derivatized samples were injected into a Gas Chromatograph coupled to a Mass Spectrometer (GC-MS).
- Detection & Identification: Separated compounds were detected and identified based on their mass spectra and retention indices.
- 4. Data Analysis: Metabolite data from GC-MS and spectral data from FTIR were processed using chemometric tools (Principal Component Analysis - PCA, and Orthogonal Partial Least Squares Discriminant Analysis - OPLS-DA) for sample classification and marker identification [14].
- 5. Greenness Assessment: The environmental impact of both the FTIR and GC-MS methods was evaluated using multiple metrics, including the 12 principles of GAC, AGREE, NEMI, and Eco-Scale Assessment [14] [9].
Workflow Diagram: Automated RNA-Seq in Bioprocess Development
The following diagram illustrates the integrated workflow of parallel bioreactor cultivation coupled with automated, at-line RNA-Seq sample preparation, as described in Protocol 3.1.
Workflow Diagram: Greenness Evaluation of Analytical Methods
This diagram outlines the logical process for comparing the environmental impact of different analytical techniques, such as FTIR and GC-MS, using modern greenness assessment tools.
The Scientist's Toolkit: Essential Reagents and Materials
Table 3: Key Research Reagent Solutions for Miniaturized and Automated Sample Preparation
This table details essential reagents, materials, and instruments used in the featured experiments and fields, highlighting their specific function in advancing miniaturization and automation.
| Item | Function & Application | Example from Experimental Protocols |
|---|---|---|
| Functionalized Monoliths | Porous sorbents synthesized in columns or capillaries for micro-SPE; offer high permeability and selectivity when grafted with affinity ligands [49]. | Molecularly Imprinted Polymers (MIPs) for selective cocaine extraction from plasma [49]. |
| Liquid Handling Station (LHS) | Automated robotic platform for precise liquid transfer; enables high-throughput, reproducible sample preparation and integration with bioreactors [50]. | Hamilton Microlab STAR for automated RNA extraction and library prep from parallel bioreactors [50]. |
| Nanopore cDNA Library Prep Kit | Reagent kit for converting purified RNA into sequencing-ready libraries; compatible with automation and long-read sequencing [50]. | ONT cDNA-PCR sequencing kit used in the automated RNA-Seq workflow [50]. |
| Enzymatic Lysis Reagents | Enzymes (e.g., lysozyme, lyticase) for breaking down cell walls in an automated, non-mechanical manner, preventing clogging in miniaturized systems [50]. | Used for at-line yeast cell disruption on the LHS deck [50]. |
| Derivatization Reagents for GC-MS | Chemicals (e.g., MSTFA) that modify metabolites to increase their volatility and stability for gas chromatographic separation [14]. | Used in the profiling of 87 primary metabolites in milk samples [14]. |
| Chemometric Software | Software for multivariate data analysis (e.g., PCA, OPLS-DA); essential for interpreting complex spectral data from FTIR or other non-selective techniques [14]. | Used to classify milk types based on their FTIR spectral fingerprints and GC-MS metabolite data [14]. |
| aspergillin PZ | aspergillin PZ, MF:C24H35NO4, MW:401.5 g/mol | Chemical Reagent |
The comparative data and protocols presented in this guide clearly demonstrate that miniaturization, automation, and strategic method selection are powerful and interconnected strategies for enhancing the sustainability of sample preparation. Techniques like functionalized monoliths in micro-SPE significantly reduce solvent consumption and improve selectivity, while direct spectroscopic methods like FTIR, empowered by chemometrics, can offer a rapid and eco-friendly alternative for suitable applications. The rigorous evaluation of these methods using multi-faceted greenness metrics provides researchers with a objective framework to guide their choices. This empowers scientists in drug development and related fields to advance their research in a manner that is not only analytically robust but also environmentally responsible.
In the pharmaceutical industry, the drive towards sustainability has made the environmental footprint of analytical methods a critical concern. Analytical measurements are fundamental to quality control and regulatory compliance, yet their cumulative environmental cost is significant. A single liquid chromatography (LC) method, when scaled across global manufacturing, can consume thousands of liters of mobile phase annually [51]. This has spurred the development of Green Analytical Chemistry (GAC) and tools to measure the environmental impact of analytical workflows.
A central question in this context is the trade-off between the energy consumed by traditional, instrumentation-heavy techniques (like chromatography) and the computational demand of modern, data-driven chemometric approaches. This guide objectively compares these two paradigms, providing experimental data and methodologies to help researchers make informed, sustainable choices.
Quantitative Comparison of Energy and Resource Profiles
The table below summarizes the typical resource consumption and greenness scores of traditional chromatographic methods versus computational approaches, based on experimental and metric-based evaluations.
Table 1: Comparative Energy and Resource Profile of Analytical Methods
| Feature | Traditional Chromatography | Computational Chemometrics |
|---|---|---|
| Primary Energy Demand | Instrument operation (heating, pumping, cooling); can range from 0.1–1.5 kWh per sample [9]. | Processor (CPU/GPU) computation; server consumption can be 4-7x higher than a laptop for the same algorithm [52]. |
| Key Consumables | Organic solvents (often mL to L per sample), columns, reagents [51]. | Electricity; minimal physical waste. |
| Typical Greenness Score (Example) | AGREE score of 56 for a microextraction method [9]. | Efficiency (η) of fitness/kWh for evolutionary algorithms [52]. |
| Major Environmental Concerns | Solvent production, disposal, toxicity; high energy use per sample [25]. | Associated CO2 emissions from data centers; absolute energy use can be high [52]. |
| Opportunities for Greening | Solvent substitution, miniaturization, method transfer to UHPLC, energy-efficient instruments [51] [9]. | Algorithmic efficiency, parameter tuning (e.g., population size), using less energy-intensive hardware [52]. |
Experimental Protocols for Greenness Evaluation
Evaluating Instrumentation-Based Methods via AMGS
The Analytical Method Greenness Score (AMGS) is a comprehensive metric developed by the ACS Green Chemistry Institute to evaluate chromatographic methods [51].
- Methodology Overview: The AMGS tool provides a holistic assessment based on multiple dimensions, including the energy consumed in the production and disposal of solvents, their safety/toxicity (EHS score), and uniquely, instrument energy consumption [51].
- Data Collection: For a given Liquid Chromatography (LC) method, the following data must be collected:
- Solvent Volume: Total volume of all solvents used in the mobile phase per analysis.
- Solvent EHS Score: Combined environmental, health, and safety score for the solvent mixture.
- Solvent Energy Score: Energy consumed in producing and disposing of the solvents.
- Instrument Energy: kWh consumed by the LC instrument per sample.
- Calculation and Output: The tool aggregates these inputs to generate a final score. This allows scientists to identify hotspots (e.g., high-toxicity solvents or energy-intensive run times) and redevelop methods to improve their sustainability profile, for instance, by switching to greener solvents or shortening the analysis time [51].
Evaluating Computational Demand via Energy-Efficiency Metrics
A 2025 study on evolutionary algorithms (EAs) established a robust protocol for measuring the energy efficiency of computational processes [52].
- Experimental Design: The study employed a full-factorial design, testing four EA frameworks (ParadisEO in C++, ECJ in Java, DEAP and Inspyred in Python) on two hardware architectures (laptop and server) across four benchmark optimization problems [52].
- Energy Consumption Measurement: Energy use was estimated using CodeCarbon software, which interfaces with hardware RAPL (Running Average Power Limit) counters to provide precise measurements of CPU energy draw [52].
- Efficiency Metric: The key metric introduced was algorithmic productivity, defined as η = fitness / kWh. This measures the quality of solution (fitness) obtained per unit of energy consumed, providing a direct way to compare the energy efficiency of different algorithms or configurations [52].
- Key Parameters Tested: The study systematically varied population size and crossover probability, finding that population size is a key factor in balancing solution quality and energy consumption [52].
Visualization of Greenness Evaluation Workflows
The following diagrams illustrate the logical steps involved in evaluating the greenness of both instrumental and computational methods.
Instrumental Method Greenness Assessment with AMGS
Computational Algorithm Energy Efficiency
The Scientist's Toolkit: Key Research Reagents and Solutions
Table 2: Essential Tools for Conducting Energy and Greenness Analysis
| Tool Name | Category | Primary Function |
|---|---|---|
| AMGS (Analytical Method Greenness Score) | Greenness Metric | Evaluates environmental impact of chromatographic methods, integrating solvent toxicity, waste, and instrument energy [51]. |
| AGREE (Analytical GREEnness) | Greenness Metric | Provides a pictogram and score (0-1) based on the 12 principles of GAC, offering a visual assessment of the entire analytical workflow [9]. |
| CodeCarbon | Software Library | Estimates the energy consumption and carbon emissions of computational code by interfacing with hardware power meters [52]. |
| RAPL (Running Average Power Limit) | Hardware Counter | An interface in Intel/AMD CPUs that provides accurate measurements of the energy consumed by the processor during a task [52]. |
| GEMAM (Greenness Evaluation Metric for Analytical Methods) | Greenness Metric | A newer metric that provides a pictogram and quantitative score (0-10) based on GAC principles and green sample preparation factors [25]. |
The choice between instrumental and computational methods is not a simple binary. Traditional chromatography carries a significant, often dominant, environmental burden from solvent consumption and waste generation [51]. In contrast, the environmental impact of computational chemometrics is almost entirely from electricity consumption and the associated CO2 emissions, which can be substantial when run on powerful servers [52].
A holistic greenness evaluation must therefore account for these different profiles. For instrumentation, this means using metrics like AMGS or AGREE to minimize solvent-related impacts and instrument runtimes [51] [9]. For computation, it means optimizing algorithms for efficiency (η), selecting appropriate hardware, and being mindful that more powerful computing does not guarantee sustainability [52]. The most sustainable path forward lies in making informed, quantified choices in both domains, leveraging the standardized metrics and experimental protocols now available to researchers.
Balancing Greenness with Analytical Performance Parameters
The field of analytical chemistry is undergoing a significant transformation, driven by the urgent need to align laboratory practices with the principles of environmental sustainability. This shift has brought to the forefront a critical challenge: balancing the greenness of an analytical method with its analytical performance parameters, such as accuracy, sensitivity, and precision. The traditional mindset, which prioritized performance often at the expense of environmental considerations, is being re-evaluated. Green Analytical Chemistry (GAC) aims to minimize the environmental impact of analytical procedures by reducing energy consumption, hazardous waste, and the use of dangerous solvents and reagents [9]. However, a method cannot be considered sustainable if its green credentials come at the cost of unreliable results, particularly in regulated sectors like pharmaceutical development where patient safety is paramount [51].
This comparison guide explores this balance by objectively evaluating two distinct analytical approaches: modern chemometric models and traditional chromatography. Chemometrics, which applies mathematical and statistical methods to chemical data, offers a pathway to simplify analytical workflows [53] [36]. In contrast, traditional chromatography, while a gold standard for separation and analysis, often involves more resource-intensive processes [51]. The discussion is framed within the emerging holistic framework of White Analytical Chemistry (WAC), which expands the concept of greenness to include analytical performance (the "red" component) and practical/economic aspects (the "blue" component) [54] [16]. A method is considered "white" when it successfully harmonizes all three dimensions, providing a model for truly sustainable and effective analysis [54].
Greenness and Performance Assessment Frameworks
Key Metrics for Evaluating Analytical Methods
To quantitatively compare the environmental and functional performance of analytical methods, several standardized assessment tools have been developed. The table below summarizes the most widely used greenness and whiteness metrics.
Table 1: Key Metrics for Assessing Analytical Method Greenness and Performance
| Metric Name | Primary Focus | Output Type | Performance Consideration | Key Advantage |
|---|---|---|---|---|
| AGREE (Analytical GREEnness) [9] [16] | Environmental impact of the entire analytical procedure | Pictogram & numerical score (0-1) based on 12 GAC principles | Indirectly, via throughput and method robustness | Comprehensive, user-friendly software available |
| AGREEprep [9] [12] | Environmental impact of the sample preparation step | Pictogram & numerical score (0-1) based on 10 sample prep principles | No | First dedicated metric for sample preparation |
| Analytic Eco-Scale [9] [53] | Deviation from ideal green analysis | Penalty points subtracted from a base score of 100 | No | Simple, semi-quantitative scoring |
| GAPI (Green Analytical Procedure Index) [9] [16] | Environmental impact of the entire analytical workflow | Color-coded pictogram (green/yellow/red) for each stage | No | Easy visualization of impact across all steps |
| White Analytical Chemistry (WAC) [54] [55] | Holistic balance of Green (environment), Red (performance), and Blue (practicability) | Overall "whiteness" score and RGB model | Yes, as a core component (Red) | Ensures a balance between sustainability, functionality, and practicality |
The following diagram illustrates the logical relationship between the core principles of Green Analytical Chemistry (GAC) and the more comprehensive White Analytical Chemistry (WAC) model, which integrates performance as a fundamental pillar.
Figure 1: The Evolution from GAC Principles to the Holistic WAC Model
Comparative Experimental Analysis: Chemometrics vs. Chromatography
Experimental Protocols and Methodologies
To provide an objective comparison, this section outlines the experimental protocols for a direct, side-by-side assessment of a chemometrics-based approach and a traditional chromatographic method, as applied to a real-world analysis.
Case Study: Metabolome Analysis of Different Milk Types [55] This study provides a robust experimental framework for comparison, using the analysis of primary metabolites in buffalo, cow, goat, and camel milk.
Table 2: Research Reagent Solutions and Essential Materials
| Item Name | Function/Application in the Experiment |
|---|---|
| Fourier-Transform Infrared (FTIR) Spectrometer | Provides a non-destructive fingerprint of milk samples based on functional group absorption; the core instrument for the green chemometric approach. |
| Gas Chromatography-Mass Spectrometry (GC-MS) System | Provides high-separation efficiency and sensitive quantification of individual milk metabolites; the representative traditional chromatographic technique. |
| Methanol & Solvents | Used for sample preparation and dilution, particularly for GC-MS analysis. The type and volume used directly impact greenness scores. |
| Chemometric Software (e.g., MATLAB, PLS Toolbox) | Hosts algorithms for multivariate data analysis (e.g., PCA, PLS) to extract quantitative information from complex spectral data (FTIR). |
| Standard Reference Metabolites | Pure chemical standards (e.g., sugars, organic acids, vitamins) used to validate and calibrate both the GC-MS and FTIR/chemometric models. |
Protocol for GC-MS Analysis [55]:
- Sample Preparation: Milk samples are typically prepared using solvent extraction. This may involve mixing the milk with solvents like methanol or chloroform to precipitate proteins and extract metabolites, followed by centrifugation and filtration.
- Derivatization: To make metabolites more volatile and suitable for GC-MS, the extract is often derivatized. This is a multi-step process involving reagents like methoxyamine and N-methyl-N-(trimethylsilyl)trifluoroacetamide (MSTFA).
- Chromatographic Separation: The derivatized sample is injected into a GC system equipped with a capillary column. Metabolites are separated based on their interaction with the stationary phase as the oven temperature is programmed to increase.
- Detection & Quantification: Separated metabolites are ionized and detected by a mass spectrometer. Quantification is achieved by integrating peak areas and comparing them to calibration curves of standard compounds.
Protocol for FTIR with Chemometrics Analysis [55]:
- Sample Preparation: Milk samples require minimal preparation. They may be diluted with water or a solvent and analyzed directly, often with no derivatization or complex extraction.
- Spectral Acquisition: A small aliquot of the milk sample is placed in the FTIR spectrometer, and its infrared absorption spectrum is collected in a few seconds. This serves as a unique molecular fingerprint.
- Chemometric Modeling: The collected spectra are processed using multivariate calibration models.
- A calibration set is created using samples with known concentrations of components (e.g., lactose, fats).
- Principal Component Analysis (PCA) or Partial Least Squares (PLS) Regression algorithms are applied to build a model that correlates spectral features with component concentrations.
- Prediction: The validated model is used to predict the concentrations of metabolites in unknown milk samples directly from their FTIR spectra.
Quantitative Performance and Greenness Data
The following tables synthesize the experimental data from the milk metabolomics study and other relevant sources, providing a direct, quantitative comparison of the two techniques across key parameters.
Table 3: Comparative Greenness Scores from Milk Metabolomics Study [55]
| Assessment Metric | FTIR with Chemometrics | Traditional GC-MS |
|---|---|---|
| AGREE Score (0-1) | Higher Score | Lower Score |
| NEMI Pictogram | Full Green | Not Full Green |
| Eco-Scale Assessment | Higher Score (Greener) | Lower Score |
| ComplexGAPI | More Green Sections | More Yellow/Red Sections |
| Whiteness (RGB 12) | Superior Whiteness | Lower Whiteness |
Table 4: Comparison of Analytical Performance and Practicality
| Parameter | FTIR with Chemometrics | Traditional GC-MS |
|---|---|---|
| Sample Throughput | Very High (seconds per sample) | Low (minutes to hours per sample) |
| Sample Preparation | Minimal, no derivatization | Extensive, often requires derivatization |
| Solvent Consumption | Very Low | High (mL per sample) |
| Energy Consumption | Lower | Higher (due to oven and vacuum system) |
| Multi-analyte Capacity | Excellent (simultaneous prediction) | Excellent (sequential separation) |
| Sensitivity & Selectivity | Good for major components; dependent on model | Excellent (high sensitivity and peak resolution) |
| Analytical Precision | Can be comparable to chromatographic methods after robust model validation [36] | High, considered a gold standard |
The workflow below summarizes the key steps and environmental impacts of the two analytical approaches compared in this guide.
Figure 2: Analytical Workflow and Impact Comparison
Discussion: Interpreting the Balance
Strengths, Limitations, and Ideal Applications
The experimental data reveals a clear trade-off. FTIR coupled with chemometrics demonstrates superior greenness and whiteness, characterized by minimal solvent consumption, reduced waste generation, faster analysis times, and lower energy demands [55]. Its performance is sufficient for quantitative analysis of major components in complex matrices, making it an excellent choice for high-throughput screening and routine quality control where speed and eco-efficiency are critical.
However, its limitations become apparent when high sensitivity and peak resolution are required. For quantifying trace contaminants, distinguishing between very similar compounds, or analyzing samples without a robust pre-existing calibration model, traditional chromatography like GC-MS or HPLC remains unmatched [55] [51]. The key is to recognize that "greenness" is not an absolute value and can be improved within chromatographic methods. Strategies such as using miniaturized techniques (e.g., micro-extraction), replacing hazardous solvents with safer alternatives (e.g., ethanol instead of acetonitrile), and automating sample preparation can significantly enhance the green profile of chromatographic methods without sacrificing their analytical power [31] [9] [16].
The "Rebound Effect" and Strategic Implementation
A critical consideration in adopting greener methods is the "rebound effect." This refers to the unintended consequence where the improved efficiency of a green method leads to increased overall resource consumption because analyses become cheaper and easier to perform [31]. For example, a facile microextraction technique might be used so frequently that its total environmental footprint surpasses that of a more resource-intensive method used sparingly. Mitigating this requires a mindful laboratory culture, optimized testing protocols, and smart data management to avoid unnecessary or redundant analyses [31].
The journey toward sustainable analytical chemistry is not about a blanket replacement of all traditional methods with the greenest alternative. Instead, as this guide demonstrates, it requires a strategic and balanced application of the right tool for the right job. Chemometric approaches coupled with direct spectroscopic techniques offer a powerfully green and white alternative for many applications, particularly where high-throughput and profile-based analysis are needed. Traditional chromatography remains an indispensable pillar of analytical science, especially for trace analysis and method validation, but its environmental impact can and should be mitigated through continuous improvement and the adoption of green principles.
The future of sustainable analysis lies in the widespread adoption of the White Analytical Chemistry (WAC) framework, which mandates a simultaneous evaluation of the environmental (green), performance (red), and practical (blue) aspects of any method [54]. By using the comprehensive metrics and experimental data presented here, researchers and drug development professionals can make informed, objective decisions that advance both their scientific goals and the critical objective of environmental stewardship.
Comparative Greenness Assessment and Validation Frameworks
The adoption of Green Analytical Chemistry (GAC) principles has transformed how the scientific community evaluates the environmental impact of analytical methods. Within pharmaceutical research and drug development, where analytical testing is ubiquitous, understanding and minimizing the ecological footprint of these procedures is crucial for achieving sustainability goals [9] [56]. Greenness assessment metrics provide standardized tools to quantify this environmental impact, enabling scientists to make informed decisions during method development and selection. The National Environmental Methods Index (NEMI) was an early pioneer in this field, introducing a simple pictogram to indicate whether a method met four basic environmental criteria [9]. However, its binary nature and limited scope revealed the need for more sophisticated tools that could provide gradations of greenness and evaluate the entire analytical workflow [57].
This evolving landscape has produced three prominent metrics: the Analytical Eco-Scale (AES), the Green Analytical Procedure Index (GAPI), and the Analytical Greenness Metric (AGREE). Each offers a distinct approach to environmental assessment, with varying scoring systems, evaluation criteria, and output formats. The AES employs a penalty-based system that subtracts points for non-green practices from an ideal score of 100 [9] [11]. The GAPI provides a visual representation of environmental impact across five stages of the analytical process using a color-coded pictogram [9] [16]. The AGREE metric incorporates all 12 principles of GAC into a unified algorithm that generates both a numerical score (0-1) and an intuitive circular pictogram [9] [12]. Understanding the relative strengths, limitations, and appropriate applications of these tools is essential for researchers seeking to implement truly sustainable analytical practices in line with the broader thesis of greenness evaluation in analytical chemistry [57].
Metric Comparison: Core Characteristics and Scoring Methodologies
The following table provides a systematic comparison of the three metrics across fundamental characteristics, highlighting their distinct approaches to greenness evaluation.
Table 1: Fundamental Characteristics of AES, GAPI, and AGREE
| Characteristic | Analytical Eco-Scale (AES) | Green Analytical Procedure Index (GAPI) | Analytical Greenness (AGREE) |
|---|---|---|---|
| Assessment Type | Semi-quantitative [57] | Semi-quantitative with visual components [9] [57] | Quantitative with visual components [9] [12] |
| Scoring System | Penalty points subtracted from 100; higher score = greener [11] | Color-coded pictogram (green/yellow/red); no overall score [9] | Score 0-1; circular pictogram with colored segments [9] [12] |
| Key Criteria | Reagent toxicity and quantity, energy consumption, waste generation [11] | Entire workflow from sampling to detection [9] | All 12 principles of GAC [9] [16] |
| Visual Output | No [9] | Yes, a multi-section pictogram [9] [16] | Yes, a circular pictogram [12] |
| Primary Strength | Simple calculation, easy comparison between methods [9] | Comprehensive visual identification of high-impact stages [9] | Holistic assessment based on all GAC principles; user-friendly software [9] [12] |
| Primary Limitation | Relies on expert judgment; lacks visual component [9] | Lacks an overall score; some subjectivity in color assignment [9] [57] | Does not fully account for pre-analytical processes [9] |
A deeper analysis of the scoring methodologies reveals their unique philosophies. The AES tool assigns penalty points for hazardous reagents, energy consumption exceeding 0.1 kWh per sample, and waste generation [11]. The final score offers a direct numerical comparison, where methods scoring above 75 are considered excellent green analysis, and those below 50 are inadequate [11]. In contrast, GAPI evaluates the analytical process through five pentagrams representing sampling, sample preservation, sample preparation, instrumentation, and reagent and compound identification [9]. Each pentagram segment is colored green, yellow, or red based on the environmental impact of that specific step, providing immediate visual cues for improvement but lacking a unified numerical score for easy ranking [9] [57].
The AGREE metric represents a significant advancement by integrating all 12 GAC principles into a weighted algorithm [9]. Each principle is assessed and assigned a score from 0 to 1, with the final result being the average of these scores, visually represented in a clock-like diagram where the color of each segment and the center score indicate overall greenness [12]. A score of 1 represents ideal greenness. A key advantage is its open-source software, which standardizes the assessment process and enhances reproducibility [12]. The following diagram illustrates the logical workflow for selecting and applying these metrics in method evaluation.
Experimental Application: A Comparative Case Study
Experimental Protocols and Methodologies
To illustrate the practical application of these metrics, a case study evaluating a Sugaring-Out Liquid-Liquid Microextraction (SULLME) method for determining antiviral compounds is examined [9]. The analytical procedure involves several critical steps. First, a 1 mL sample is collected and requires specific storage conditions, typically refrigeration. For sample preparation, the SULLME technique is employed, which is a microscale extraction using less than 10 mL of solvent. The process involves inducing a phase separation using a "sugaring-out" agent, which is a less hazardous alternative to traditional salt-based methods. The extraction is semi-automated but does require manual handling of samples. The final analysis is conducted using chromatographic instrumentation, which operates with an energy consumption estimated between 0.1–1.5 kWh per sample. The method does not involve a derivatization step, but it does generate more than 10 mL of waste per sample, for which no specific treatment or recycling procedure is reported [9].
When this protocol was evaluated using the three metrics, each tool provided a different perspective on its environmental performance, yielding both complementary and distinct insights, as summarized in the table below.
Table 2: Greenness Assessment Results for the SULLME Method [9]
| Metric | Score | Key Strengths Identified | Key Weaknesses Identified |
|---|---|---|---|
| AGREE | 0.56 | Miniaturization, semi-automation, no derivatization, small sample volume | Use of toxic/flammable solvents, moderate waste generation, low throughput (2 samples/hour) |
| GAPI (MoGAPI) | 0.60 | Use of green solvents, microextraction (<10 mL solvent), no further sample treatment | Specific storage conditions, moderately toxic substances, vapor emissions, waste >10 mL without treatment |
| AES | Not Reported | N/A | N/A |
The data reveals that while all metrics acknowledged the benefits of miniaturization and the avoidance of derivatization, they consistently flagged issues related to waste management and the use of hazardous substances. The AGREE score of 0.56 and the Modified GAPI (MoGAPI) score of 0.60 both indicate a method with moderate greenness, leaving significant room for improvement. This multi-metric approach provides a more robust and nuanced understanding than any single tool could offer alone. For instance, AGREE specifically highlighted the low throughput, while GAPI drew attention to vapor emissions and storage requirements [9].
Essential Research Reagent Solutions
The implementation and evaluation of green analytical methods rely on specific reagents and tools. The following table details key solutions mentioned in the case study and their functions in sustainable method development.
Table 3: Key Reagents and Tools for Green Analytical Chemistry
| Reagent/Tool | Function/Description | Role in Greenness Assessment |
|---|---|---|
| Sugaring-Out Agents | Induces phase separation in liquid-liquid microextraction [9]. | A greener alternative to traditional salt-based agents; reduces toxicity [9]. |
| Microextraction Solvents | Reduced volume (often <10 mL) of organic solvents for extraction [9]. | Directly minimizes reagent consumption and hazardous waste, evaluated in AES, GAPI, and AGREE [9]. |
| AGREE Software | Free, open-source calculator for the AGREE metric [12]. | Standardizes the greenness evaluation process based on the 12 GAC principles [9] [12]. |
| Biobased Reagents | Solvents or reagents derived from renewable biological sources [9]. | Reduces reliance on petrochemicals, improving scores related to reagent greenness in all metrics [9]. |
| Semi-Automated Systems | Equipment that partially automates sample preparation or analysis [9]. | Reduces manual handling, improves throughput, and minimizes operator risk, scored positively in AGREE and GAPI [9]. |
The comparative analysis demonstrates that AES, GAPI, and AGREE are not mutually exclusive but are complementary tools. The Analytical Eco-Scale is most effective for rapid, straightforward comparisons where a single numerical score is sufficient [9] [11]. The Green Analytical Procedure Index excels in diagnostic applications, as its visual output allows method developers to quickly pinpoint which specific steps in an analytical procedure have the highest environmental impact and require optimization [9] [16]. The Analytical Greenness metric offers the most holistic evaluation by systematically incorporating all 12 GAC principles, and its supporting software enhances objectivity and ease of use [9] [12].
For researchers in chemometrics and drug development, this multi-faceted assessment approach is invaluable. The trend in GAC is moving toward more comprehensive, quantitative, and software-assisted tools like AGREE, as well as specialized derivatives such as AGREEprep for sample preparation and the Carbon Footprint Reduction Index (CaFRI) for climate impact [9] [57]. Furthermore, the paradigm is expanding beyond pure environmental concerns to the broader concept of White Analytical Chemistry (WAC), which balances the green component with analytical performance (red) and practical/economic feasibility (blue) [9] [16]. Tools like the Blue Applicability Grade Index (BAGI) are emerging to address these additional dimensions [16].
In conclusion, a side-by-side comparison confirms that selecting a greenness metric depends on the specific goal. For a final verdict on greenness, AGREE provides the most comprehensive score. For method development and troubleshooting, GAPI offers superior visual diagnostics. For a quick initial screen, AES is efficient. Employing a combination of these metrics, as shown in the SULLME case study, provides the most robust strategy for critically evaluating and improving the sustainability of analytical methods, thereby advancing the core objectives of Green Analytical Chemistry in pharmaceutical research and beyond.
The pharmaceutical industry is increasingly mandated to adopt sustainable practices, extending to the analytical methods used in quality control and drug development. This guide objectively compares the environmental performance and applicability of High-Performance Thin-Layer Chromatography (HPTLC) and chemometric-assisted analytical methods. HPTLC is a planar chromatography technique known for its ability to analyze multiple samples simultaneously with minimal solvent consumption per sample [58]. Chemometric analysis employs mathematical and statistical models to extract chemical information from complex instrumental data, often helping to reduce the need for extensive chemical separation [59]. Framed within a broader thesis on green analytical chemistry, this comparison uses modern assessment tools to evaluate which technique, or combination thereof, offers a more sustainable pathway for analyzing pharmaceutical compounds without compromising data quality.
Experimental Comparison: HPTLC and Chemometrics in Practice
To provide a factual basis for comparison, this section details experimental protocols and outcomes from published studies that have applied these techniques to real pharmaceutical analysis scenarios.
HPTLC Method for Anti-Asthmatic Drugs
A validated HPTLC method was developed for the simultaneous quantification of Hydroxyzine Hydrochloride (HYX), Ephedrine Hydrochloride (EPH), and Theophylline (THP) in a pharmaceutical formulation [60].
- Experimental Protocol: Separation was achieved on silica gel 60 F254 plates using a mobile phase of chloroform-ammonium acetate buffer (pH 6.5, adjusted with ammonia) in a ratio of 9.5:0.5 (v/v). UV detection was performed at 220 nm. The method was validated as per International Conference on Harmonisation (ICH) guidelines [60].
- Key Findings: The method successfully quantified all three drugs in one run with a short analysis time. However, the greenness profile was suboptimal due to the use of environmentally hazardous solvents like chloroform and ammonia [60].
Green HPTLC Method for Caffeine
A reverse-phase HPTLC method was developed specifically with green principles in mind for estimating caffeine in energy drinks and formulations [61].
- Experimental Protocol: Analysis was performed on reverse-phase silica gel plates with a green mobile phase of ethanol-water (55:45, v/v). Detection was carried out at 275 nm [61].
- Key Findings: This method achieved an AGREE greenness score of 0.80, indicating an "excellent greener profile," primarily due to the replacement of traditional solvents with greener alternatives like ethanol and water [61].
Chemometric Analysis of HPTLC Data for Plant Chemotypes
A study on Clusia species combined HPTLC with chemometrics for chemotaxonomic investigation, demonstrating a powerful synergistic approach [59].
- Experimental Protocol: HPTLC fingerprint profiles of plant bark extracts were developed. The resulting chromatographic data (digitized densitometric profiles) were processed using Principal Component Analysis (PCA) and Hierarchical Clustering Heatmaps (HC heatmaps) to identify patterns and classify samples based on their metabolite profiles [59].
- Key Findings: The chemometric analysis of HPTLC data allowed for the clear identification of chemotypes (chemical variants within a species) that were not readily apparent from visual inspection of the chromatograms alone. This shows how chemometrics can unlock deeper information from existing analytical data [59].
Spectrophotometry with Chemometrics for Anti-Migraine Drugs
A study on Aspirin (ASP) and Metoclopramide (MET) compared a direct spectrophotometric method using ratio-based chemometrics with an HPTLC-densitometry method [62].
- Experimental Protocol: For the chemometric method, ratio difference and derivative ratio–zero crossing techniques were applied to the UV spectra of the drugs to resolve their severely overlapped signals. For the HPTLC method, a mobile phase of cyclo-hexane: methanol: methylene chloride (1:4:1, v/v/v) was used [62].
- Key Findings: Greenness assessment using the Analytical Eco-Scale, AGREE, and GAPI tools concluded that the spectrophotometric method with chemometrics was "an excellent green technique" compared to the HPTLC method, which was considered an "acceptable green" one. The direct spectrophotometric approach avoided solvents almost entirely for the analysis step [62].
Table 1: Quantitative Comparison of Featured Analytical Methods
| Analysis Target | Technique Used | Key Solvents/Reagents | Greenness Score (AGREE) | Throughput & Key Advantage |
|---|---|---|---|---|
| Anti-asthmatic drugs (HYX, EPH, THP) [60] | HPTLC-Densitometry | Chloroform, Ammonia | Not specified (profile deemed non-eco-friendly) | High; simultaneous quantification of 3 drugs |
| Caffeine [61] | Green Reverse-Phase HPTLC | Ethanol, Water | 0.80 (Excellent) | High; specific design with green solvents |
| Clusia spp. plant extracts [59] | HPTLC + Chemometrics | Various (for extraction and development) | Not assessed | High; enables classification and pattern recognition |
| Anti-migraine drugs (ASP, MET) [62] | HPTLC-Densitometry | Cyclo-hexane, Methanol, Methylene Chloride | Lower than spectrophotometric method | High; handles challenging 90:1 ratio |
| Anti-migraine drugs (ASP, MET) [62] | Spectrophotometry + Chemometrics | Methanol (for dissolution only) | Higher than HPTLC method | Very High; rapid, minimal solvent use |
Greenness Assessment Tools and Outcomes
Evaluating the "greenness" of an analytical method goes beyond intuition. Several standardized metrics have been developed to provide an objective measure of environmental impact [63].
- AGREE (Analytical GREEnness metric): This is one of the most modern tools, which evaluates a method against all 12 principles of Green Analytical Chemistry (GAC). It provides a score from 0 to 1, where 1 is ideal [63] [61].
- GAPI (Green Analytical Procedure Index): This tool uses a pictogram to represent the environmental impact of various stages of the analytical process, from sample collection to final determination [60] [64].
- Analytical Eco-Scale: This semi-quantitative tool calculates a score by subtracting penalty points for hazardous reagents, energy consumption, and waste from an ideal score of 100. A score above 75 is considered excellent green analysis [62] [63].
- NEMI (National Environmental Methods Index): An older tool that gives a simple pass/fail result based on whether the chemicals used are persistent, toxic, or corrosive, and if the waste is treated [64].
The core challenge in green analysis often lies in solvent selection. Solvents like chloroform, toluene, and n-hexane are considered highly hazardous, while ethanol, water, and ethyl acetate are ranked as greener alternatives [58] [62]. The volume of solvent consumed is also a critical factor, an area where HPTLC holds a distinct advantage over techniques like HPLC, as it consumes significantly less solvent per sample [58].
The Scientist's Toolkit: Essential Research Reagents and Materials
The following table details key materials and reagents commonly used in developing HPTLC and chemometric methods, along with their primary functions.
Table 2: Essential Research Reagents and Materials
| Item Name | Function in Analysis | Greenness & Safety Considerations |
|---|---|---|
| Silica Gel 60 F254 HPTLC Plates | The stationary phase for chromatographic separation. The F254 indicator fluoresces under 254 nm UV light for visualization. | Plates are for single use, eliminating carryover risk but generating solid waste [58]. |
| Ethanol | A green solvent used in mobile phases and for sample preparation. | Preferred green solvent; less toxic and biodegradable compared to petroleum-based solvents [61]. |
| Water | A green solvent used in reverse-phase HPTLC and for sample preparation. | Non-toxic, safe, and the most sustainable solvent available [61]. |
| Chloroform | Traditional organic solvent used in normal-phase mobile phases and for liquid-liquid extraction. | Hazardous; toxic and an environmental pollutant. Its use negatively impacts greenness scores [60] [61]. |
| Methanol | Common solvent for preparing standard and sample solutions. | Less hazardous than chloroform but still requires careful handling and waste management [62]. |
| Chemometric Software | Software for multivariate analysis of chemical data. | Green enabler; reduces the need for repeated experiments and solvent-consuming separation steps [59] [65]. |
Workflow and Strategic Pathway for Green Analysis
The decision between using HPTLC, chemometrics, or a hybrid approach depends on the analytical problem and the goal of minimizing environmental impact. The following diagram illustrates a logical workflow for selecting and integrating these techniques.
This comparison guide demonstrates that the choice between HPTLC and chemometric analysis for pharmaceutical compounds is not a simple binary. Instead, the greenest and most efficient approach is highly context-dependent.
- HPTLC excels as a inherently green chromatographic technique due to its low solvent consumption per sample and high throughput. Its greenness can be significantly enhanced by a deliberate choice of solvents, such as ethanol-water mixtures. For analyses requiring physical separation of multiple components in complex matrices, it is an excellent choice.
- Chemometric Analysis stands out as a supreme green approach when the analytical problem can be solved by processing spectral data without extensive separation, as demonstrated by the spectrophotometric method for anti-migraine drugs. It acts as a powerful green enabler by reducing reagent consumption and waste generation.
- The Hybrid Approach offers a sophisticated and often optimal strategy. Combining HPTLC fingerprinting with chemometric data processing (PCA, HCA) maximizes information yield from a single, solvent-efficient experiment, enabling sample classification, authentication, and quality assessment that neither technique could achieve as effectively alone.
In conclusion, for researchers aiming to align their practices with the principles of green chemistry, the strategic application of HPTLC with green solvents, direct chemometric methods, and particularly their integration, provides a powerful and versatile toolkit for sustainable pharmaceutical analysis.
In the modern pharmaceutical laboratory, two paradigms are reshaping analytical procedure development: the rigorous, well-established framework of ICH validation guidelines and the growing imperative for sustainable, environmentally conscious practices. The International Council for Harmonisation (ICH) guidelines, particularly Q2(R2) on analytical procedure validation and Q14 on analytical procedure development, provide the foundational requirements for ensuring that analytical methods are fit for their intended purpose in pharmaceutical quality control [66] [67]. Simultaneously, Green Analytical Chemistry (GAC) principles are driving a transformation in how these methods are designed and evaluated, with the aim of minimizing their environmental footprint while maintaining regulatory compliance [9].
This guide examines the integration of these two critical aspects, with a specific focus on comparing traditional chromatographic methods with emerging chemometrics-assisted approaches. The evaluation is structured within the framework of white analytical chemistry (WAC), which balances the three dimensions of analytical performance (red), environmental impact (green), and practicality and cost-effectiveness (blue) [9]. As regulatory authorities increasingly emphasize science- and risk-based approaches, understanding how greenness metrics complement traditional validation parameters becomes essential for developing future-ready analytical methods.
ICH Validation Framework: Foundational Requirements
The ICH Q2(R2) guideline outlines the core parameters required for demonstrating that an analytical procedure is suitable for its intended use. These requirements form the non-negotiable foundation for any analytical method in regulated pharmaceutical environments [68] [67].
Table 1: Core Validation Parameters as per ICH Q2(R2)
| Parameter | Definition | Typical Acceptance Criteria |
|---|---|---|
| Specificity | Ability to measure analyte accurately in presence of other components | No interference from impurities, excipients, or matrix |
| Accuracy | Closeness between measured value and true value | Recovery of 98-102% for API assays |
| Precision | Degree of agreement among individual measurements | RSD ≤ 2% for assay methods |
| Linearity | Ability to obtain results proportional to analyte concentration | Correlation coefficient (r) ≥ 0.998 |
| Range | Interval between upper and lower analyte levels with suitable precision, accuracy, and linearity | Dependent on method purpose (e.g., 80-120% of test concentration) |
| Detection Limit (LOD) | Lowest amount detectable but not necessarily quantifiable | Signal-to-noise ratio ≥ 3:1 |
| Quantitation Limit (LOQ) | Lowest amount quantifiable with acceptable precision and accuracy | Signal-to-noise ratio ≥ 10:1 |
| Robustness | Capacity to remain unaffected by small, deliberate variations in method parameters | Consistent system suitability results |
The updated Q2(R2) guideline, effective since June 2024, provides enhanced considerations for modern analytical technologies, including multivariate methods and spectroscopy-based approaches [66] [67]. This expansion is particularly relevant for chemometric methods, which were previously challenging to validate under the older Q2(R1) framework. The companion ICH Q14 guideline introduces concepts such as the Analytical Target Profile (ATP), which defines the required quality of analytical results, and promotes a lifecycle approach to analytical procedures [67].
Greenness Assessment Metrics for Analytical Methods
With the regulatory requirements established, the environmental impact of analytical methods can be systematically evaluated using standardized greenness assessment tools. These metrics have evolved from simple checklists to sophisticated quantitative systems that provide comprehensive environmental profiling [69] [9].
Table 2: Comparison of Major Greenness Assessment Metrics
| Metric Tool | Basis of Assessment | Output Format | Key Advantages | Limitations |
|---|---|---|---|---|
| NEMI (National Environmental Methods Index) | 4 basic environmental criteria | Binary pictogram (pass/fail) | Simple, accessible | Lacks granularity; doesn't assess full workflow |
| Analytical Eco-Scale | Penalty points for non-green attributes | Numerical score (0-100) | Quantitative; allows direct comparison | Relies on expert judgment; no visual component |
| GAPI (Green Analytical Procedure Index) | 5-stage analytical process | Color-coded pictogram | Comprehensive; visual identification of high-impact stages | No overall score; somewhat subjective |
| AGREE (Analytical GREEnness) | 12 principles of GAC | Circular pictogram + numerical score (0-1) | Comprehensive coverage; user-friendly | Limited pre-analytical process consideration |
| AGREEprep | 10 green sample preparation principles | Circular pictogram + numerical score (0-1) | Focuses on sample preparation (often highest impact) | Must be used with broader tools for full method evaluation |
| AGSA (Analytical Green Star Analysis) | Multiple green criteria including toxicity, waste, energy | Star-shaped diagram + numerical score | Intuitive visualization; multidimensional comparison | Relatively new with limited adoption |
The progression of these tools highlights a shift toward more holistic, quantitative assessments that consider the entire analytical workflow [9]. Modern metrics like AGREE and AGREEprep provide both visual and numerical outputs, enabling straightforward comparison between methods and identification of specific areas for environmental improvement [12].
Comparative Analysis: Traditional Chromatography vs. Chemometrics-Assisted Methods
Methodologies and Experimental Protocols
To objectively compare the performance and greenness of traditional versus chemometrics-assisted methods, we examine representative experimental protocols from recent scientific literature:
Traditional HPLC Method for UV Filter Analysis in Cosmetics:
- Sample Preparation: 0.5 g cosmetic sample dissolved in 50 mL methanol with 30-minute ultrasonication [12]
- Chromatographic Conditions: C18 column (250 × 4.6 mm, 5 μm), mobile phase acetonitrile:water (70:30 v/v), flow rate 1.0 mL/min, injection volume 20 μL, UV detection at 310 nm [12]
- Validation Parameters: Specificity, linearity (r ≥ 0.999), accuracy (recovery 98-102%), precision (RSD ≤ 2%), LOD (0.1-0.5 μg/mL), LOQ (0.3-1.5 μg/mL) [12]
Chemometrics-Assisted Spectrophotometric Method for Pharmaceutical Formulation:
- Sample Preparation: Minimal preparation; capsule contents dissolved in methanol and diluted [36]
- Instrumentation: UV-spectrophotometer with 1.00 cm quartz cells, range 200-400 nm [36]
- Chemometric Models: Four multivariate models (PCR, PLS, MCR-ALS, ANN) developed using MATLAB and associated toolboxes [36]
- Validation Approach: Calibration set with 25 mixtures using five-level, four-factor design; models validated with independent set [36]
Quantitative Comparison of Performance and Greenness
Table 3: Direct Comparison of Traditional HPLC vs. Chemometrics-Assisted Methods
| Assessment Criteria | Traditional HPLC Method | Chemometrics-Assisted Method |
|---|---|---|
| Analytical Performance | ||
| Specificity | High (chromatographic separation) | Model-dependent (requires validation) |
| Accuracy | 98-102% recovery | 99.5-101.2% recovery [36] |
| Precision | RSD ≤ 2% | RSD 0.8-1.5% [36] |
| Linear Range | Wide dynamic range | Optimized for specific concentration ranges |
| Greenness Metrics | ||
| AGREE Score | 0.45-0.65 [12] | 0.77 [36] |
| Eco-Scale Score | 65-75 [9] | 85 [36] |
| Solvent Consumption | 50-500 mL per run [12] | < 10 mL per sample [36] |
| Energy Consumption | High (pumps, column oven) | Low (spectrophotometer only) |
| Waste Generation | 50-500 mL organic waste per run | < 10 mL waste per sample |
| Practical Considerations | ||
| Method Development Time | Weeks to months | Days to weeks once models established |
| Equipment Cost | High ($20,000-$50,000) | Moderate ($5,000-$15,000) |
| Operator Skill Requirements | Standard chromatographic training | Advanced statistical/programming skills |
| Regulatory Acceptance | Well-established | Emerging with ICH Q2(R2)/Q14 support |
Greenness Assessment Visualization
The following diagram illustrates the comparative environmental impact of the two approaches across key green chemistry principles:
Greenness Principles Comparison: This diagram illustrates how chemometrics and traditional HPLC methods perform across the 12 principles of Green Analytical Chemistry, showing the former's advantages in waste prevention, solvent safety, energy efficiency, and miniaturization.
Case Studies: Integrated Validation and Greenness Assessment
Pharmaceutical Formulation Analysis Using Multivariate Spectrophotometry
A recent study demonstrates the successful application of chemometric models for analyzing a four-component pharmaceutical formulation containing Paracetamol, Chlorpheniramine maleate, Caffeine, and Ascorbic acid [36]. The researchers developed and validated four multivariate models (PCR, PLS, MCR-ALS, and ANN) that effectively resolved the highly overlapping spectra without chromatographic separation.
Validation Results:
- Accuracy: Recovery percentages ranged from 99.5% to 101.2% across all components and models
- Precision: RSD values between 0.8% and 1.5%, meeting ICH precision requirements
- Specificity: Achieved through mathematical separation via multivariate models
- Greenness Assessment: AGREE score of 0.77 and Eco-Scale score of 85, indicating excellent environmental performance [36]
This case demonstrates that with proper validation, chemometric methods can provide regulatory-compliant results while significantly reducing environmental impact compared to traditional HPLC methods.
SULLME Method Greenness Profile Using Multiple Metrics
A comprehensive assessment of a sugaring-out liquid-liquid microextraction (SULLME) method using multiple greenness metrics provides insights into the multidimensional nature of environmental impact assessment [9]:
- MoGAPI Score: 60/100 indicating moderate greenness, with strengths in green solvents but weaknesses in waste management
- AGREE Score: 56/100 reflecting balanced green profile with benefits from miniaturization but concerns about toxic solvents
- AGSA Score: 58.33/100 showing strengths in semi-miniaturization but limitations in manual handling
- CaFRI Score: 60/100 indicating moderate carbon footprint with low energy consumption but lack of renewable energy sources [9]
This case highlights the importance of using complementary assessment tools to obtain a complete picture of a method's environmental sustainability, as each metric provides different insights into the ecological impact.
The Scientist's Toolkit: Essential Research Reagent Solutions
Implementing green, regulatory-compliant analytical methods requires specific tools and reagents. The following table outlines key solutions for researchers developing sustainable analytical methods:
Table 4: Essential Research Reagent Solutions for Green Analytical Chemistry
| Tool/Reagent | Function | Green Attributes | Application Examples |
|---|---|---|---|
| Multivariate Software (MATLAB, PLS Toolbox) | Chemometric model development | Reduces need for physical separations, minimizes solvent use | Pharmaceutical formulations analysis [36] |
| Green Solvents (Ethanol, Water-based modifiers) | Mobile phase or extraction solvent | Renewable, less toxic alternatives to acetonitrile/methanol | HPLC method development [37] |
| Microextraction Devices | Sample preparation and pre-concentration | Dramatically reduces solvent volumes (μL instead of mL) | UV filters analysis in cosmetics [12] |
| FTIR Spectroscopy | Non-destructive molecular analysis | Minimal sample preparation, no solvents required | Milk composition analysis [14] |
| AGREE/AGREEprep Software | Greenness assessment | Free, open-source tools for environmental impact evaluation | Method development and comparison [12] |
The integration of greenness principles with ICH validation requirements represents the future of pharmaceutical analysis. Traditional chromatography methods provide well-established performance but often at significant environmental cost, while chemometrics-assisted approaches offer substantial sustainability benefits with comparable analytical performance when properly validated.
The key to successful implementation lies in:
- Early integration of greenness assessment during method development rather than as an afterthought
- Strategic selection of methods based on analytical requirements and environmental impact
- Comprehensive validation using both ICH parameters and greenness metrics
- Leveraging modern guidelines (ICH Q2(R2) and Q14) that support innovative approaches
As regulatory frameworks evolve to accommodate sustainable methodologies, pharmaceutical analysts have an unprecedented opportunity to advance both environmental stewardship and product quality through the adoption of green, validated analytical procedures.
The NQS Index and Alignment with UN Sustainable Development Goals
The NQS (Need, Quality, and Sustainability) Index represents an advanced, holistic framework for evaluating analytical procedures that moves beyond traditional greenness assessment to incorporate broader sustainable development considerations [70]. Introduced in 2023, this metric was developed to address the critical intersection between analytical method requirements, performance quality, and environmental sustainability, particularly within the pharmaceutical and chemical analysis sectors [70] [71].
The NQS Index operates as a triangular pyramid model where the height and shape dynamically change based on performance across three core attributes [71] [72]. The "Need" component quantifies the necessity and accessibility of analytical methods, especially in resource-limited settings where simple, cost-effective methods with sufficient accuracy are essential despite budgetary constraints or limited technical expertise [70]. The "Quality" dimension is assessed using the White Analytical Chemistry (WAC) framework, which integrates environmental impact (green), practical and economic aspects (blue), and analytical performance (red) to provide a comprehensive quality score [70] [73]. The "Sustainability" attribute directly aligns analytical procedures with the United Nations Sustainable Development Goals (SDGs), evaluating how methods contribute to global sustainability targets [71] [72].
This innovative index emerges at a critical juncture in analytical science, as the 2025 Sustainable Development Goals Report reveals that despite progress, the current pace of change remains insufficient to fully achieve all SDGs by the 2030 deadline [74]. The NQS Index provides researchers and pharmaceutical professionals with a tangible tool to align their analytical practices with the urgent global call for sustainable development, particularly in methodologies comparing emerging chemometric approaches against traditional chromatography [73] [51].
The United Nations Sustainable Development Goals Framework
The United Nations Sustainable Development Goals (SDGs) constitute a universal call to action adopted by all UN Member States in 2015 to end poverty, protect the planet, and ensure prosperity for all by 2030 [74] [75]. The framework encompasses 17 integrated goals that recognize that development must balance social, economic, and environmental sustainability, addressing challenges ranging from health and education to climate change and environmental protection [75].
According to the Sustainable Development Goals Report 2025, progress toward these goals has been fragile and unequal [74]. While substantial gains have been made in expanding education access, improving maternal and child health, and bridging the digital divide, millions still face extreme poverty, hunger, and lack of basic services [74]. The report identifies six priority areas for accelerated action: food systems, energy access, digital transformation, education, jobs and social protection, and climate and biodiversity [74].
The SDG global indicator framework includes 234 unique indicators that monitor progress across all goals [76]. The official 2025 SDG rankings reveal Finland, Sweden, and Denmark as top-performing countries, with scores of 87.0, 85.7, and 85.3 respectively, while many nations continue to struggle with implementation [77] [75]. This global assessment framework provides the essential foundation against which the NQS Index evaluates the sustainability dimension of analytical methods, creating a direct linkage between laboratory practices and global sustainability priorities [70] [71].
The NQS Index Framework: Components and Calculation
Core Components of the NQS Index
The NQS Index integrates three distinct but interconnected evaluation dimensions, each addressing critical aspects of modern analytical method assessment:
Need Assessment: This component evaluates the practical necessity and accessibility of analytical methods, with particular emphasis on applications in settings with budgetary constraints or limited technical expertise [70]. It recognizes that high-performance instrumental methods, while offering superior accuracy and precision, may not always represent the most appropriate solution when simpler, cost-effective alternatives can provide sufficient analytical performance for the intended purpose [70]. This dimension ensures that analytical development remains aligned with real-world applications and accessibility requirements.
Quality Assessment (White Analytical Chemistry): The quality component employs the White Analytical Chemistry (WAC) framework, which integrates three color-coded dimensions [70] [73]. The red component evaluates analytical performance parameters including accuracy, precision, sensitivity, and linearity. The green component assesses environmental impact based on the 12 principles of Green Analytical Chemistry. The blue component examines practical and economic aspects such as cost-effectiveness, time efficiency, operational simplicity, and health and safety considerations [73] [71]. The combination of these three primary colors theoretically produces "white" light, representing an ideally balanced analytical method [70].
Sustainability Assessment (UN SDG Alignment): This dimension quantitatively evaluates how analytical procedures align with and support specific UN Sustainable Development Goals [71] [72]. It extends beyond traditional green chemistry considerations to encompass broader sustainability impacts, including energy efficiency, resource consumption, waste generation, and social responsibility aspects covered by the SDG framework [70].
Calculation and Visualization
The NQS Index generates a composite score that reflects performance across all three dimensions, represented visually as a triangular pyramid [71]. The pyramid's height and structural distortion provide immediate visual feedback on methodological strengths and weaknesses across the need, quality, and sustainability axes [71]. This innovative visualization technique allows researchers to quickly identify which aspects of their analytical procedures require optimization to achieve better balance and overall performance.
Table: Core Components of the NQS Index Assessment Framework
| Component | Assessment Focus | Evaluation Criteria | Reference Framework |
|---|---|---|---|
| Need | Method necessity & accessibility | Application requirements, cost-effectiveness, technical accessibility | Context-specific user requirements [70] |
| Quality | Analytical performance | Accuracy, precision, sensitivity, linearity, robustness | White Analytical Chemistry (RGB) [70] [73] |
| Sustainability | Environmental & social impact | Resource consumption, waste generation, energy efficiency, safety | UN Sustainable Development Goals [71] [72] |
Experimental Protocols for NQS Assessment
Protocol 1: Spectrophotometric Method with Chemometric Analysis
A comprehensive experimental protocol for implementing NQS assessment was demonstrated in a 2025 study analyzing ternary antihypertensive combinations (Telmisartan, Chlorthalidone, and Amlodipine) using spectrophotometric methods with chemometric analysis [73]:
Instrumentation and Materials: The study utilized a double-beam UV/Vis spectrophotometer (Jasco V-760) with 1.0 cm quartz cells, ethanol (HPLC grade) as green solvent, and pure drug standards [73]. Software included Matlab R2024a with PLS toolbox for multivariate analysis [73].
Experimental Design: Researchers developed both univariate methods (Successive Ratio Subtraction with Constant Multiplication and Successive Derivative Subtraction with Constant Multiplication) and multivariate techniques (Interval-Partial Least Squares and Genetic Algorithm-Partial Least Squares) [73]. This approach allowed direct comparison of method complexity, performance, and sustainability.
Sample Preparation: Stock solutions (500.0 μg/mL) were prepared in ethanol, with working solutions (100.0 μg/mL) obtained through precise dilution [73]. Calibration curves established linearity ranges of 5.0–40.0 μg/mL for Telmisartan, 10.0–100.0 μg/mL for Chlorthalidone, and 5.0–25.0 μg/mL for Amlodipine [73].
NQS Assessment Implementation: The method was evaluated using AGREE for greenness, BAGI for practical applicability, and RGB12 for White Analytical Chemistry assessment before calculating the final NQS index [73]. The study specifically aligned with multiple UN SDGs (Goals 3, 4, 5, 7, 9, 11, 12, 13, 14, 15, and 17) to validate the sustainability dimension [73].
Protocol 2: Chromatographic Method with Green Solvents
A second experimental protocol illustrating NQS assessment was presented in a 2025 study developing an eco-friendly chromatographic method for simultaneous analysis of metronidazole and nicotinamide in topical formulations [72]:
Chromatographic Conditions: The method employed RP-HPLC with an ODS column and gradient elution using ethanol and phosphate buffer (10 mM, pH 3.5) at 1.0 mL/min flow rate [72]. Ethanol was specifically selected as a green alternative to traditional acetonitrile, reducing environmental impact and aligning with SDG targets [72].
Quality by Design Approach: Method development utilized a two-level full factorial design (2³ FFD) for optimization, enhancing method robustness while minimizing experimental runs and resource consumption [72]. This approach directly supports SDG 9 (Industry, Innovation and Infrastructure) and SDG 12 (Responsible Consumption and Production) [72].
Validation and Application: The method was validated per ICH guidelines and applied to in vitro permeation testing using Franz cells [72]. The comprehensive evaluation included hexametric assessment with multiple tools: ChlorTox Scale, Spider tool, AGREE, Hexagon model, RGB12 Algorithm, and NQS Indicator [72].
Table: Research Reagent Solutions for NQS-Assessed Analytical Methods
| Reagent/Material | Function in Analysis | Green/Sustainable Attributes | Application Examples |
|---|---|---|---|
| Ethanol | Extraction solvent, mobile phase component | Renewable sourcing, biodegradability, low toxicity compared to conventional organic solvents [73] [72] | Spectrophotometric analysis of antihypertensives [73], HPLC analysis of topical drugs [72] |
| Natural Reagent Extracts | Alternative to synthetic chemical reagents | Derived from renewable plant sources, reduced hazardous waste [70] | Flow-based determination of iron using plant extracts [70] |
| Celite Sorbent | Extraction material for sample preparation | Reduces solvent consumption through miniaturization [71] | Pipette-tip micro-SPE for perfume analysis [71] |
| Phosphate Buffer | Mobile phase component for chromatographic separation | Aqueous-based, lower environmental impact than organic modifiers [72] | HPLC analysis of metronidazole and nicotinamide [72] |
Comparative Analysis: NQS Index in Action
Case Study: Antihypertensive Drug Analysis
A direct comparison of analytical approaches for antihypertensive drug analysis demonstrates the practical application of the NQS Index in evaluating methodological trade-offs [73]. The study developed both univariate and multivariate spectrophotometric methods alongside traditional chromatography, with comprehensive assessment revealing significant differences in NQS performance:
Methodology Comparison: Univariate methods (Successive Ratio Subtraction and Successive Derivative Subtraction) offered simplicity and cost-effectiveness, while multivariate techniques (iPLS and GA-PLS) provided enhanced resolution for complex mixtures [73]. Traditional chromatography served as the reference method for comparison.
NQS Performance: The spectrophotometric approaches demonstrated superior NQS scores compared to traditional chromatography, with particularly strong performance in the "Need" dimension due to lower equipment costs and technical requirements [73]. The "Sustainability" dimension also favored spectrophotometric methods due to significantly reduced solvent consumption and waste generation [73].
SDG Alignment: The green spectrophotometric methods directly supported multiple UN SDGs, including Goal 3 (Good Health and Well-Being) through improved pharmaceutical quality control, Goal 9 (Industry, Innovation and Infrastructure) via innovative analytical approaches, and Goal 12 (Responsible Consumption and Production) through minimized waste generation [73].
Case Study: Pharmaceutical Quality Control
The 2025 development of a pipette-tip micro-solid-phase extraction (PT-µSPE) method for analyzing water-based perfumes provides additional insights into NQS assessment for innovative techniques [71]:
Miniaturization Benefits: The PT-µSPE method required only 10 mg of sorbent material and 100 μL of elution solvent, dramatically reducing consumption compared to conventional solid-phase extraction [71]. This miniaturization directly enhanced performance across all NQS dimensions, particularly sustainability.
Comparative Assessment: When evaluated against conventional methods, the PT-µSPE approach demonstrated better balance across analytical performance, greenness, and practical efficiency [71]. The NQS Index effectively captured this balanced performance where single-dimensional metrics might have emphasized only environmental benefits.
White Analytical Chemistry Integration: The method excelled in the "Quality" component of NQS by demonstrating that green principles could be integrated without compromising analytical performance or practical utility [71].
Table: NQS Performance Comparison Across Analytical Techniques
| Analytical Technique | Need Score (Accessibility) | Quality Score (WAC) | Sustainability Score (SDG Alignment) | Key Advantages |
|---|---|---|---|---|
| UV-Vis Spectrophotometry with Chemometrics [73] | High (Low equipment cost, simple operation) | High (Good accuracy and precision for intended use) | High (Minimal solvent consumption, ethanol as green solvent) | Excellent balance of performance and sustainability for routine analysis |
| Traditional HPLC [51] | Moderate (Higher equipment and technical requirements) | High (Excellent accuracy, precision, and sensitivity) | Moderate (Substantial solvent consumption and waste generation) | Superior analytical performance for complex separations |
| Micro-SPE Techniques [71] | Moderate (Specialized equipment but minimal reagent use) | High (Good performance with minimal resources) | High (Dramatically reduced solvent consumption and waste) | Outstanding sustainability profile with maintained analytical quality |
Implications for Analytical Method Selection in Pharmaceutical Research
The NQS Index provides pharmaceutical researchers and drug development professionals with a transformative framework for analytical method selection that aligns with both scientific and corporate sustainability objectives:
Strategic Method Development: The NQS framework encourages development of methods that excel across multiple dimensions rather than optimizing single parameters [70] [71]. This holistic approach is particularly valuable in pharmaceutical quality control, where methods must balance regulatory requirements, operational efficiency, and environmental responsibility [51] [72].
Corporate Sustainability Alignment: Pharmaceutical companies increasingly recognize the environmental impact of analytical operations when scaled across global manufacturing networks [51]. A case study of rosuvastatin calcium analysis revealed that approximately 18,000 liters of mobile phase are consumed annually for chromatographic analysis of this single API across global production [51]. The NQS Index provides a metrics-based approach to reduce this impact while maintaining analytical quality.
Regulatory and Compliance Advantages: As regulatory agencies place greater emphasis on environmental considerations, methods with strong NQS performance may benefit from streamlined approvals [72]. The explicit alignment with UN SDGs provides a standardized framework for communicating sustainability benefits to regulators and stakeholders [73] [72].
Resource-Limited Setting Applications: The "Need" dimension of the NQS Index ensures that analytical methods remain accessible in diverse economic contexts, supporting global health equity through appropriate technology selection [70]. This aligns directly with SDG 3 (Good Health and Well-Being) and SDG 10 (Reduced Inequalities) [73].
The integration of the NQS Index into analytical method development represents a paradigm shift toward sustainable pharmaceutical analysis that successfully balances performance requirements with environmental responsibility and practical utility. As the 2030 deadline for the Sustainable Development Goals approaches, this comprehensive assessment framework provides researchers with a critical tool for aligning laboratory practices with global sustainability targets [74].
Conclusion
The comparative analysis reveals that both chemometrics and traditional chromatography offer distinct pathways toward greener analytical practices, with chemometric methods demonstrating advantages in solvent reduction and waste minimization, while modern chromatographic techniques have evolved significantly through solvent substitution and miniaturization. The future of sustainable analytical science lies in the integrated application of comprehensive assessment tools like AGREE, GEMAM, and AGREEprep to guide method selection and development. For biomedical and clinical research, this evolution supports more environmentally responsible drug development while maintaining the high-quality data required for regulatory approval. Emerging directions include the increased integration of lifecycle assessment, carbon footprint calculation through tools like CaFRI, and the development of standardized green validation protocols that complement traditional performance metrics.
References
- 1. Green Analytical Chemistry—Recent Innovations [https://www.mdpi.com/2673-4532/6/1/10]
- 2. Green analytical chemistry: integrating sustainability into ... [https://pmc.ncbi.nlm.nih.gov/articles/PMC11772533/]
- 3. Green Analytical Chemistry: Sustainable Methods and ... [https://www.labmanager.com/green-analytical-chemistry-sustainable-methods-and-practices-34268]
- 4. The 12 principles of green analytical chemistry and the ... [https://hero.epa.gov/hero/index.cfm/reference/details/reference_id/4963899]
- 5. 12 Principles of Green Chemistry [https://www.acs.org/green-chemistry-sustainability/principles/12-principles-of-green-chemistry.html]
- 6. Twelve Principles of Green Chemistry [https://openbooks.lib.msu.edu/orgchemlabmanual/chapter/twelve-principles-of-green-chemistry/]
- 7. Principles of Green Chemistry [https://greenchemistry.yale.edu/about/principles-green-chemistry]
- 8. Green metrics and green analytical applications [https://www.sciencedirect.com/science/article/pii/S2772577424000685]
- 9. Assessing the Environmental Impact of Analytical Methods [https://www.chromatographyonline.com/view/the-green-component-assessing-the-environmental-impact-of-analytical-methods]
- 10. A Perspective on Current and Future Metric Tools - PMC [https://pmc.ncbi.nlm.nih.gov/articles/PMC12590457/]
- 11. Green analytical chemistry metrics for evaluating the ... [https://pmc.ncbi.nlm.nih.gov/articles/PMC11697060/]
- 12. Comparison of the Greenness Assessment ... [https://www.mdpi.com/2673-4532/4/4/32]
- 13. White Analytical Chemistry: Balancing Performance ... [https://www.chromatographyonline.com/view/white-analytical-chemistry-balancing-performance-sustainability-and-practicality-in-modern-methods]
- 14. Gas chromatography-mass spectrometry and Fourier ... [https://pmc.ncbi.nlm.nih.gov/articles/PMC12449862/]
- 15. Principles of green chemistry: Advancing pharma ... [https://instituteofsustainabilitystudies.com/insights/guides/principles-of-green-chemistry-advancing-pharma-sustainability/]
- 16. Green Approaches in High-Performance Liquid ... [https://pmc.ncbi.nlm.nih.gov/articles/PMC12430196/]
- 17. Sustainability Unleashed: Driving Positive Impact in the ... [https://pci.com/resources/driving-positive-sustainability-pharma-industry/]
- 18. greenness assessment of HPLC methods for paclitaxel [https://link.springer.com/article/10.1007/s44371-025-00166-3]
- 19. Sustainable Pharma Labs Using Green Chemistry [https://ispe.org/pharmaceutical-engineering/ispeak/sustainable-pharma-labs-using-green-chemistry]
- 20. Putting the numbers into perspective - Artificial intelligence [https://nationalcentreforai.jiscinvolve.org/wp/2025/05/02/artificial-intelligence-and-the-environment-putting-the-numbers-into-perspective/]
- 21. Will Labs Wake Up to the Environmental Cost of Data ... [https://www.technologynetworks.com/informatics/articles/will-labs-wake-up-to-the-environmental-cost-of-data-crunching-406669]
- 22. Is Virtualization Greener Than Lab Work for Chips? [https://spectrum.ieee.org/semiconductor-manufacturing]
- 23. The carbon emissions of writing and illustrating are lower ... [https://www.nature.com/articles/s41598-024-54271-x]
- 24. Greenness assessment of analytical methods for ... [https://pubmed.ncbi.nlm.nih.gov/39161240/]
- 25. Greenness evaluation metric for analytical methods and ... [https://pmc.ncbi.nlm.nih.gov/articles/PMC12318332/]
- 26. AGREEprep – Analytical greenness metric for sample ... [https://www.sciencedirect.com/science/article/abs/pii/S016599362200036X]
- 27. Greenness metrics for analytical methodologies linked to ... [https://www.sciencedirect.com/science/article/pii/S2772577424000491]
- 28. Modified GAPI (MoGAPI) Tool and Software for the ... [https://www.mdpi.com/2673-4532/5/3/30]
- 29. AGREE—Analytical GREEnness Metric Approach and... [https://www.bohrium.com/paper-details/agree-analytical-greenness-metric-approach-and-software/812600291080798208-100657]
- 30. Emerging Tools for Holistic Evaluation of Analytical Methods [https://www.chromatographyonline.com/view/emerging-tools-for-holistic-evaluation-of-analytical-methods]
- 31. HPLC 2025 Preview: The Road To Sustainable Analytical ... [https://www.chromatographyonline.com/view/hplc-2025-preview-the-road-to-sustainable-analytical-chemistry]
- 32. Green Approaches in High-Performance Liquid ... [https://www.mdpi.com/1420-3049/30/17/3573]
- 33. Two sustainable chromatographic approaches for ... [https://www.nature.com/articles/s41598-025-22295-6]
- 34. Dual-platform integration of HPTLC and firefly algorithm ... [https://bmcchem.biomedcentral.com/articles/10.1186/s13065-025-01598-9]
- 35. FDA validated ecofriendly HPTLC method for quantification ... [https://www.nature.com/articles/s41598-025-18548-z]
- 36. Application of smart chemometric models for spectra ... [https://pmc.ncbi.nlm.nih.gov/articles/PMC10909257/]
- 37. Chemometric Approaches for Sustainable Pharmaceutical ... [https://www.mdpi.com/2624-8549/7/1/11]
- 38. Eco-friendly chemometric analysis: Sustainable ... [https://www.sciencedirect.com/science/article/pii/S2211715624004570]
- 39. — SpectroChemPy v0.8.2.dev20 0.8.2.dev20 documentation MCR ALS [https://www.spectrochempy.fr/userguide/analysis/mcr_als.html]
- 40. Green Chemistry: What is it (and What Is It Not)? ... [https://www.chromatographyonline.com/view/green-chemistry-what-is-it-and-what-is-it-not-and-how-does-it-apply-to-gas-chromatography-gc]
- 41. Green analytical approaches for contaminants: Sustainable ... [https://pubmed.ncbi.nlm.nih.gov/40184798/]
- 42. The Future of Data Analytics: Trends in 7 Industries [2025] [https://www.coherentsolutions.com/insights/the-future-and-current-trends-in-data-analytics-across-industries]
- 43. How Green is the Future of Chromatography? [https://www.chromatographyonline.com/view/how-green-is-the-future-of-chromatography-]
- 44. Systems level roadmap for solvent recovery and reuse in ... [https://pmc.ncbi.nlm.nih.gov/articles/PMC8479785/]
- 45. Solvent Selection from the Green Perspective [https://www.chromatographyonline.com/view/solvent-selection-from-the-green-perspective]
- 46. Enhancing Sustainable Analytical Chemistry in Liquid ... [https://pmc.ncbi.nlm.nih.gov/articles/PMC11243568/]
- 47. Green chemistry: Six key trends to watch [https://www.cas.org/resources/cas-insights/green-chemistry-trends]
- 48. Optimizing Solvent Consumption For Your ... [https://rotachrom.com/optimizing-solvent-consumption-for-your-chromatographic-solution/]
- 49. HPLC 2025 Preview: Functionalized Monoliths as ... [https://www.chromatographyonline.com/view/functionalized-monoliths-as-selective-sample-preparation-materials]
- 50. Automation of RNA-Seq Sample Preparation and ... [https://pmc.ncbi.nlm.nih.gov/articles/PMC12029635/]
- 51. Utilisation of Analytical Method Greenness Score to drive ... [https://pubs.rsc.org/pt-br/content/articlehtml/2025/gc/d5gc01574j]
- 52. A Comparison of Energy Consumption and Quality ... [https://www.mdpi.com/1999-4893/18/9/593]
- 53. How Chemometrics is Impacting Green Chemistry Solutions [https://www.spectroscopyonline.com/view/how-chemometrics-is-impacting-green-chemistry-solutions]
- 54. Green and White Analytical Chemistry [https://pubmed.ncbi.nlm.nih.gov/40998048/]
- 55. Gas chromatography-mass spectrometry and Fourier ... [https://peerj.com/articles/19921/]
- 56. Utilisation of Analytical Method Greenness Score to drive ... [https://pubs.rsc.org/en/content/articlelanding/2025/gc/d5gc01574j]
- 57. A comprehensive review of green, white analytical ... [https://www.sciencedirect.com/science/article/pii/S0026265X25035362]
- 58. Green High-Performance Thin-Layer Chromatography [https://link.springer.com/article/10.1007/s10337-025-04397-5]
- 59. Combining chemometric analysis of HPTLC data and 13 C ... [https://www.sciencedirect.com/science/article/abs/pii/S0021967325006004]
- 60. Assessment of the Method's Greenness and Blueness [https://pubmed.ncbi.nlm.nih.gov/39204107/]
- 61. A Green High-Performance Thin-Layer Chromatography ... [https://pmc.ncbi.nlm.nih.gov/articles/PMC9103461/]
- 62. Sustainable eco-friendly ratio-based spectrophotometric and ... [https://bmcchem.biomedcentral.com/articles/10.1186/s13065-023-01020-2]
- 63. From a critical review towards a proposal using a life cycle ... [https://www.sciencedirect.com/science/article/abs/pii/S0165993622000085]
- 64. Validation and greenness assessment of HPTLC ... [https://www.sciencedirect.com/science/article/abs/pii/S0026265X23003843]
- 65. Oxford ICSB: Digitization of HPTLC chromatograms for ... [https://egrove.olemiss.edu/icsb/2025_ICSB/Schedule/8/]
- 66. ICH publishes Training Materials on Q2(R2) and Q14 [https://www.gmp-compliance.org/gmp-news/ich-publishes-training-materials-on-q2r2-and-q14]
- 67. ICH Guidelines for Analytical Method Validation Explained [https://amsbiopharma.com/ich-guidelines-analytical-method/]
- 68. ICH Q2(R2) Validation of analytical procedures [https://www.ema.europa.eu/en/ich-q2r2-validation-analytical-procedures-scientific-guideline]
- 69. Green analytical chemistry metrics for evaluating the ... [https://www.sciencedirect.com/science/article/pii/S2095177924001102]
- 70. A new need, quality, and sustainability (NQS) index for ... [https://www.sciencedirect.com/science/article/abs/pii/S0026265X23006446]
- 71. Development, validation, and assessment of a reliable and ... [https://link.springer.com/article/10.1007/s00216-025-05889-x]
- 72. Eco-friendly QbD-optimized chromatographic method for ... [https://bmcchem.biomedcentral.com/articles/10.1186/s13065-025-01555-6]
- 73. Univariate and multivariate signal processing ... [https://www.nature.com/articles/s41598-025-22700-0]
- 74. The Sustainable Development Goals Report 2025 - UNSD [https://unstats.un.org/sdgs/report/2025/]
- 75. Sustainable Development Report 2025 [https://dashboards.sdgindex.org/]
- 76. SDG Indicators - UNSD [https://unstats.un.org/sdgs/indicators/indicators-list/]
- 77. Rankings [https://dashboards.sdgindex.org/rankings/]