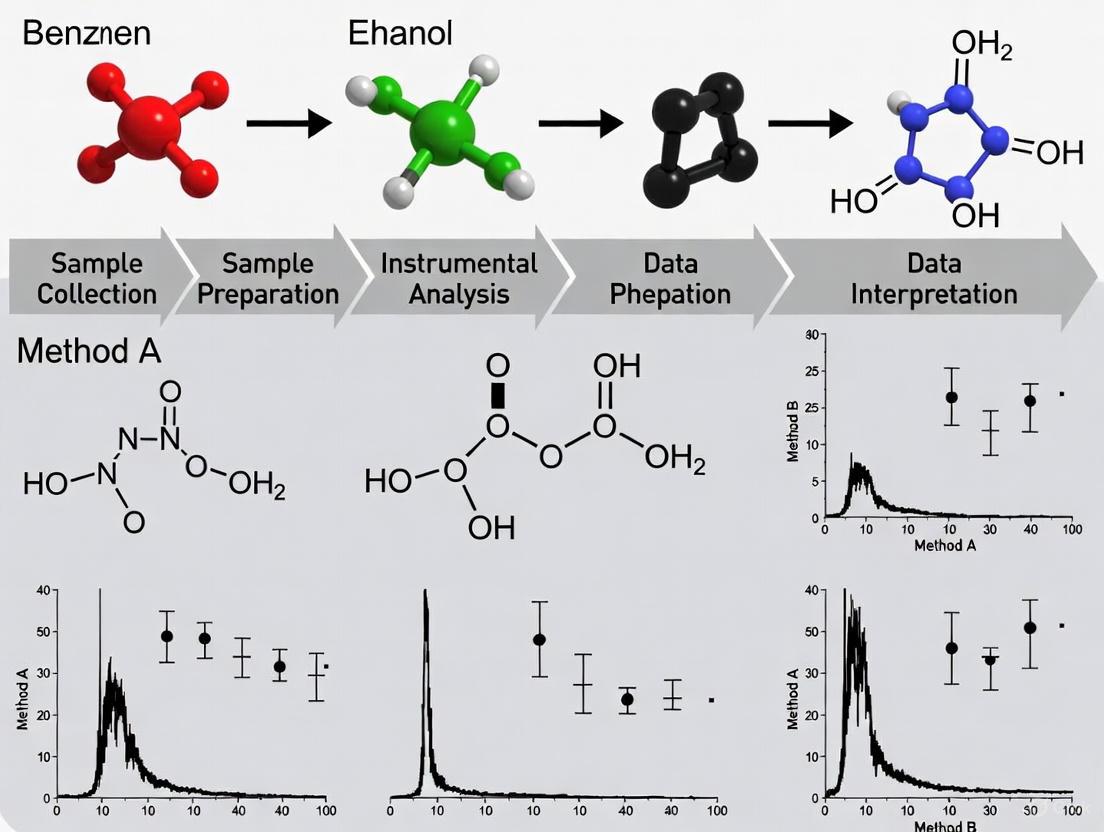
The Unseen Variable: How Sample Preparation Directly Dictates Spectroscopic Data Quality and Reliability
This article provides a comprehensive examination of the critical, yet often underestimated, role of sample preparation in spectroscopic analysis.
The Unseen Variable: How Sample Preparation Directly Dictates Spectroscopic Data Quality and Reliability
Abstract
This article provides a comprehensive examination of the critical, yet often underestimated, role of sample preparation in spectroscopic analysis. Tailored for researchers, scientists, and drug development professionals, we explore the fundamental principles linking preparation to spectral integrity, detail technique-specific methodologies for XRF, ICP-MS, and FT-IR, and present advanced troubleshooting and optimization strategies. Drawing on recent studies and validation protocols, the article synthesizes foundational knowledge with practical applications, offering a systematic framework to minimize analytical errors, enhance reproducibility, and ensure data validity in biomedical and clinical research settings.
The Critical Link: Why Sample Preparation is the Foundation of Reliable Spectroscopy
In the realm of analytical science, the quality of results is fundamentally dictated by the steps taken before instrumentation ever comes into play. Inadequate sample preparation is the startling cause of as much as 60% of all spectroscopic analytical errors [1]. This statistic underscores a critical vulnerability in analytical workflows: unless samples are properly prepared, researchers risk collecting misleading data that can compromise research projects, quality control practices, and analytical conclusions [1]. Sample preparation for spectroscopic proof requires a high degree of care and technique-specific methods, whether employing XRF, ICP-MS, FT-IR, or Raman spectroscopy [1]. The journey from raw material to analyzable specimen directly determines the quality of the final data, making sample preparation not merely a preliminary step, but the foundation upon which analytical accuracy is built.
This technical guide examines the dominant source of error in analytical results through the context of a broader thesis on how sample preparation affects spectroscopic results research. For researchers, scientists, and drug development professionals, understanding these principles is not optional—it is essential for producing valid, reliable, and meaningful analytical data.
The Foundation: Why Sample Preparation Introduces Error
Fundamental Principles of Analytical Error
Sample preparation directly relates to the quality and integrity of spectroscopic data, and not even the most advanced instrumentation can compensate for badly prepared samples [1]. Preparation problems affect results through several fundamental mechanisms that originate from the material's inherent characteristics and its interaction with preparation equipment and processes.
The physical and chemical properties of a sample directly influence how radiation behaves during analysis. Rough surfaces scatter light randomly, while monodisperse particle size ensures uniform interaction with radiation [1]. Furthermore, excessive variation in particle size creates sampling error that compromises quantitative analysis. These issues are compounded by matrix effects, where sample matrix constituents absorb or add to spectral signals, obscuring or enhancing the analyte response [1]. Proper preparation techniques remove such interferences through dilution, extraction, or matrix matching.
Homogeneity is equally crucial for representative sampling. Heterogeneous samples yield non-reproducible results because the examined portion may not represent the whole sample [1]. Grinding, milling, and mixing techniques prepare homogeneous samples that yield reproducible, reliable data. Perhaps most insidiously, contamination introduces unwanted material that generates spurious spectral signals. Cross-contamination between samples or from preparation equipment can render results worthless, making proper cleaning techniques essential throughout the preparation process [1].
Classification of Errors in the Analytical Workflow
Within the complete analytical pathway, errors can be systematically classified according to their nature and origin. The Theory of Sampling (TOS) identifies that sampling errors originate from only three fundamental sources: the material (which is always heterogeneous to some degree), the sampling equipment design, and the sampling process execution [2]. Traditional analytical chemistry further categorizes errors into three major types, as detailed in the table below.
Table: Classification of Analytical Error Types
| Error Type | Effect on Results | Common Sources in Sample Preparation | Corrective Approaches |
|---|---|---|---|
| Systematic (Determinate) Errors | Affect accuracy; cause all results to be consistently too high or too low | Contaminated reagents, incorrect calibration standards, improper dilution techniques, method limitations [2] [3] | Use high-purity reagents, implement matrix-matched calibration, employ internal standardization [3] [4] |
| Random (Indeterminate) Errors | Affect precision; cause scatter around the mean value | Inhomogeneous samples, particle size variations, inconsistent weighing or pipetting, environmental fluctuations [2] | Improve homogenization, control environmental conditions, use appropriate measurement tools, replicate measurements [1] [3] |
| Gross Errors | Large deviations from true value; often obvious outliers | Sample mix-ups, incorrect calculations, complete method failure, transcription errors [2] [3] | Implement rigorous documentation, use automated systems where possible, establish quality control protocols |
A crucial distinction exists between error and uncertainty in the context of sampling. It is not possible to ascertain the representativity status of a specific sample or analytical aliquot from any observable feature of the sample itself [2]. Representativity can only be defined and documented as a characteristic of the sampling process—everything depends on the sampling equipment, how it is designed, used, and maintained [2]. This is where representativity can be forfeited through sampling errors that have not been suitably eliminated or reduced.
Technical Deep Dive: Preparation Techniques and Their Associated Errors
Solid Sample Preparation Techniques
Solid sample preparation remains the foundation for producing repeatable spectroscopic data, as physical characteristics directly influence spectral quality [1]. Several specialized techniques transform raw materials into analyzable specimens, each with specific protocols to minimize associated errors.
Grinding and Milling: Grinding reduces particle size and generates homogeneous samples through mechanical friction, significantly impacting spectral quality through equal interaction with radiation [1]. When selecting grinding equipment, technicians must consider material hardness, final particle size requirements (typically <75μm for XRF), and contamination hazards [1]. Swing grinding machines are particularly effective for tough samples like ceramics and ferrous metals as they use oscillating motion rather than direct pressure, reducing heat formation that might alter sample chemistry [1]. For optimum results, grind every sample set under identical conditions and clean intensively between samples to prevent cross-contamination.
Milling provides more particle size reduction control than grinding, with fine-surface milling machines producing higher surface quality, particularly with non-ferrous materials [1]. The even, flat surfaces from milling enhance spectral quality by minimizing light scattering effects, offering consistent density across the sample surface, and exposing internal material structure for more representative analysis [1]. Modern spectroscopic milling machines feature programmable parameters like rotational speed, feed rate, and cutting depth, with dedicated cooling systems to reduce thermal degradation during processing.
Pelletizing and Fusion: Pelletizing transforms powdered samples into solid disks of uniform surface properties and density for XRF analysis, yielding samples with uniform X-ray absorption properties essential for accurate quantitative analysis [1]. The process typically involves blending the ground sample with a binder (e.g., wax or cellulose), pressing using hydraulic or pneumatic presses (typically 10-30 tons), and producing pellets with flat, smooth surfaces and equal thickness [1]. Proper pellet preparation dramatically affects analytical accuracy through improved sample stability and reduced matrix effects.
Fusion represents the most stringent preparation technique for complete dissolution of refractory materials into homogeneous glass disks, preventing particle size and mineral effects that plague other preparation techniques [1]. The fusion process involves blending the ground sample with a flux (typically lithium tetraborate), melting at temperatures between 950-1200°C in platinum crucibles, and casting the molten charge as a disk for analysis [1]. Fusion is superior for silicate materials, minerals, and ceramics as it totally breaks down crystal structures and standardizes the sample matrix, eliminating effects that slow quantitative analysis.
Liquid and Gas Sample Preparation Techniques
Liquid and gaseous samples present unique analytical challenges that require specialized preparation methods. Their physical state affects everything from container selection to handling protocols, with understanding these nuances being essential for delivering precise, reproducible results across diverse spectroscopic techniques.
Dilution and Filtration for ICP-MS: Inductively Coupled Plasma Mass Spectrometry (ICP-MS) demands stringent liquid sample preparation due to its high sensitivity, where subtle preparation errors can radically skew analytical results [1]. Dilution plots analyte concentrations into the optimal instrument detection range, reduces matrix effects that disrupt accurate measurement, and prevents damage to sensitive instrument components from high salt levels [1]. Samples with dense dissolved solid content generally require greater dilution—sometimes exceeding 1:1000 for highly concentrated solutions.
Filtration subsequently removes suspended material that could contaminate nebulizers or hinder ionization [1]. Filtration using 0.45 μm membrane filters is adequate for most ICP-MS applications, though ultratrace analysis might necessitate 0.2 μm filtration [1]. Technicians must select filter materials that won't introduce contamination or adsorb the analyte of interest, with PTFE membranes typically providing the best balance of chemical resistance and low background. High-purity acidification with nitric acid (typically to 2% v/v) retains metal ions in solution by preventing precipitation and adsorption against vessel walls [1].
Solvent Selection Principles: The choice of solvent significantly influences spectral quality for both UV-Visible and FT-IR spectroscopy [1]. The optimum solvent dissolves the sample completely without being spectroscopically active in the analytical region of interest. For UV-Vis, key solvent properties include cutoff wavelength (below which the solvent absorbs strongly), polarity (affecting solubility of target compounds), and purity grade (with sensitivity-grade solvents minimizing background interference) [1]. For FT-IR, solvent selection is even more critical since solvent absorption bands can overlap with significant analyte features [1].
Table: Sample Preparation Techniques and Associated Error Mitigation Strategies
| Preparation Technique | Primary Applications | Common Errors | Error Mitigation Strategies |
|---|---|---|---|
| Grinding & Milling | XRF, Solid sampling techniques | Contamination from equipment, particle size inconsistencies, heat degradation [1] | Use specialized grinding surfaces, control grinding time and pressure, employ cooling systems, clean thoroughly between samples [1] |
| Pelletizing | XRF analysis | Inhomogeneous binding, inconsistent density, surface irregularities [1] | Use appropriate binders, apply consistent pressure, ensure homogeneous powder mixing [1] |
| Fusion | Refractory materials, minerals, ceramics | Incomplete fusion, flux contamination, loss of volatile elements [1] | Optimize temperature and time, use high-purity flux, employ proper crucible materials [1] |
| SPE (Solid-Phase Extraction) | LC-MS, GC-MS, sample cleanup | Inconsistent sample loading, inadequate washing, incomplete elution [3] [4] | Condition sorbent properly, use internal standards, optimize loading/elution solvents [3] |
| Liquid-Liquid Extraction | Soluble analytes, matrix separation | Incomplete phase separation, emulsion formation, inefficient partitioning [4] | Adjust solvent polarity, use centrifugation, add salts to improve separation [4] |
| Nitrogen Blowdown Evaporation | Sample concentration, solvent exchange | Sample loss, degradation of volatile compounds, contamination [4] | Control temperature (30-40°C), optimize gas flow rate, use appropriate vessels [4] |
Methodologies: Experimental Protocols for Error Reduction
Quantitative Sample Preparation Workflow
The following diagram illustrates the comprehensive workflow for quantitative sample preparation, highlighting critical control points where accuracy must be verified to minimize systematic and random errors.
Internal Standardization Protocol
For precise quantitative analysis, particularly in chromatography-mass spectrometry applications, internal standardization provides a powerful method to compensate for preparation inconsistencies. The following protocol details the optimal approach:
Materials Required:
- High-purity analytical standards (analyte and internal standard)
- Precision micropipettes (calibrated regularly)
- MS-grade solvents
- Appropriate volumetric glassware
Procedure:
- Add a known amount of internal standard to the sample immediately after weighing/volume measurement, ensuring it is present before any extraction steps [3].
- Process the sample through all preparation steps (extraction, cleanup, concentration).
- The internal standard will undergo the same proportional losses as the analyte during preparation.
- Calculate analyte concentration using the response ratio relative to the internal standard, which corrects for preparation inconsistencies [3].
Calculation Formula: When using an internal standard, the concentration can be calculated using the modified formula where the final sample extract volume is not a factor, thereby removing a significant source of potential error [3]:
Where:
- C = Concentration of the analyte
- AS = Area or height count of the sample compound peak
- CIS = Concentration of internal standard
- D = Dilution factor, if applicable
- AIS = Area or height count of the internal standard peak
- RF = Average calibration response factor from the calibration curve
- VS = Total volume of the sample used
This approach significantly improves quantitative accuracy compared to external standardization methods where a 5% error in sample volume leads directly to a 5% change in the calculated amount [3].
The Scientist's Toolkit: Essential Research Reagent Solutions
Proper sample preparation requires specific high-quality materials and reagents to maintain sample integrity and prevent introduction of errors. The following table details essential items for reliable sample preparation workflows.
Table: Essential Research Reagent Solutions for Sample Preparation
| Item | Function | Application Notes |
|---|---|---|
| MS-Grade Solvents | High-purity solvents minimize background interference and contamination [4] | Essential for LC-MS/MS and GC-MS applications; lower UV cutoff for UV-Vis |
| Stable Isotope-Labeled Internal Standards | Correct for matrix effects and preparation inconsistencies [3] [4] | Should be added as early as possible in the preparation process |
| High-Purity Acids (HNO₃, HCl) | Sample digestion and preservation without introducing trace metal contamination [1] | Trace metal grade or better for elemental analysis |
| SPE Cartridges (Various Phases) | Selective extraction and cleanup of samples to remove interfering matrix components [3] [4] | C18 for reversed-phase, silica for normal-phase, specialized for specific compound classes |
| PTFE Membrane Filters (0.2μm, 0.45μm) | Remove particulate matter that could damage instrumentation or cause interference [1] | 0.45μm for general use; 0.2μm for ultratrace analysis or UHPLC applications |
| Inert Sample Vials (Amber Glass) | Prevent sample degradation and adsorption; protect light-sensitive compounds [4] | Amber glass protects against UV light; silanized glass reduces adsorption |
| Certified Reference Materials | Method validation and quality control to ensure accuracy [2] | Should match sample matrix as closely as possible |
| High-Purity Fusion Fluxes (Li₂B₄O₇) | Complete dissolution of refractory materials for XRF analysis [1] | Platinum crucibles required for high-temperature fusion |
The evidence is unequivocal: sample preparation constitutes the dominant source of error in analytical results, accounting for approximately 60% of spectroscopic analytical errors [1]. This technical examination has demonstrated that regardless of the sophistication of analytical instrumentation, proper sample preparation remains non-negotiable for generating valid, reliable data. From solid sample techniques like grinding and fusion to liquid sample preparation through dilution and filtration, each step introduces potential error sources that must be systematically controlled.
The path to superior analytical outcomes requires treating sample preparation with the same rigor as instrumental analysis itself. This includes implementing robust methodologies like internal standardization, using appropriate high-purity reagents, understanding and controlling for matrix effects, and maintaining scrupulous attention to potential contamination sources. For researchers, scientists, and drug development professionals, embracing these principles transforms sample preparation from a mundane preliminary task to a critical scientific process that ultimately determines the validity of analytical results.
The fidelity of spectroscopic data is paramount across scientific disciplines, from pharmaceutical development to environmental analysis. The journey from a raw sample to a reliable spectral reading is fraught with potential variables that can compromise data integrity. This whitepaper delineates the core principles governing how particle size, homogeneity, and matrix effects directly influence spectral outcomes. Framed within a broader thesis on how sample preparation affects spectroscopic results, this guide provides researchers and drug development professionals with the foundational knowledge and practical methodologies needed to mitigate these pervasive challenges. As emphasized in liquid chromatography troubleshooting, developing a solid understanding of matrix effects and mitigation strategies is crucial both during new method development and when troubleshooting existing methods [5].
Fundamental Concepts and Definitions
Particle Size
Particle size refers to the dimensions of the solid particulates within a sample. It is not a mere physical attribute but a critical parameter that governs light interaction. The size of particles relative to the wavelength of incident light fundamentally affects scattering efficiency, absorption depth, and overall spectral intensity. In spectroscopic practice, particle size controls the effective path length and the amount of material sampled, making it a primary variable in quantitative analysis.
Homogeneity
Homogeneity describes the uniformity of a sample's composition and physical properties throughout its volume. A perfectly homogeneous sample exhibits identical spectroscopic properties at any sampled location. In reality, most samples possess some degree of heterogeneity, which introduces sampling variance and reduces the reproducibility of spectral measurements. The goal of sample preparation is often to maximize homogeneity to ensure that a small, analyzed aliquot is representative of the whole.
Matrix Effects
The matrix is defined as all components of a sample other than the analyte of interest [5]. Matrix effects, therefore, refer to the phenomenon where these co-existing components alter the detector's response to the analyte, leading to either signal suppression or enhancement. The fundamental problem is that the matrix the analyte is detected in can interfere with the detection principle itself, compromising quantitative accuracy [5]. These effects are particularly pronounced in complex samples such as biological fluids, environmental extracts, and pharmaceutical formulations, where numerous interfering compounds may co-elute or interact with the analyte.
The Impact of Particle Size on Spectral Data
Mechanisms of Influence
Particle size affects spectral data through multiple physical mechanisms. As particle dimensions change, so do the relative contributions of absorption and scattering. Smaller particles exhibit greater surface area-to-volume ratios, potentially enhancing surface-related spectral features but also increasing opportunities for light scattering. The interplay between particle size and wavelength determines whether scattering dominates (large particles relative to wavelength) or absorption features are emphasized (small particles).
Experimental Evidence Across Techniques
Transmission Low-Frequency Raman Spectroscopy (TLRS): Research on pharmaceutical tablets containing crystalline carbamazepine Form III demonstrated that particle size significantly impacts both signal intensity and reproducibility. Larger particle sizes (>212 μm) yielded higher Raman signal intensities at 37 cm⁻¹ but exhibited greater variability, while smaller particles (≤100 μm) provided more reproducible spectra and improved semi-quantitative accuracy for detecting crystalline content in amorphous matrices [6].
Attenuated Total Reflection Fourier Transform Infrared (ATR FT-IR) Spectroscopy: Systematic studies with mineral powders revealed explicit dependencies between particle size and spectral band characteristics. As particle size increases, the intensity and area of IR bands typically decrease while band width increases [7]. Notably, band positions often shift to higher wavenumbers with decreasing particle size, and the most intensive IR spectra for minerals were observed in the 2-4 μm particle size fraction [7].
Optical Property Measurements: Spectral deconvolution methods applied to multi-wavelength aerosol extinction, absorption, and scattering measurements can extract particle-size-related information, including the fraction of extinction produced by fine-mode particles and their effective radius [8]. This approach validates that particle size distributions directly govern spectral patterns in optical data.
Quantitative Relationships
Table 1: Particle Size Effects on Spectral Parameters Across Techniques
| Analytical Technique | Particle Size Range | Observed Effect on Spectral Features | Quantitative Impact |
|---|---|---|---|
| ATR FT-IR [7] | <2 μm | Decreased band intensity | Underestimation compared to coarser phases |
| ATR FT-IR [7] | 2-4 μm | Maximum band intensity and area | Optimal for quantification |
| ATR FT-IR [7] | >4 μm | Progressive decrease in intensity and area; band broadening | Nonlinear reduction in sensitivity |
| TLRS [6] | ≤100 μm | Lower intensity but high reproducibility | Improved semi-quantitative accuracy |
| TLRS [6] | >212 μm | Higher intensity but greater variability | Reduced quantification reliability |
Homogeneity and Its Spectral Consequences
Defining Spectral Homogeneity
Spectral homogeneity refers to the consistency of spectral features when measuring different aliquots or locations of the same sample. A homogeneous sample produces nearly identical spectra regardless of sampling position, while a heterogeneous sample exhibits significant spectral variations. This property is crucial for ensuring that analytical results are representative and reproducible.
Assessment Through Multivariate Analysis
Principal Component Analysis (PCA) has proven invaluable for objectively assessing sample homogeneity from spectral data. In studies of asteroid Ryugu returned samples, FTIR spectroscopy combined with PCA demonstrated that 97% of individual grains belonged to a single spectral group, indicating high homogeneity [9]. The remaining 3% exhibited unique spectral features, revealing subtle heterogeneity. In this analysis, PC1 (accounting for >99.7% of variance) correlated with reflectance values, while PC2 (0.2% of variance) related to spectral slope, providing a quantitative measure of homogeneity [9].
Practical Implications for Analysis
The transmission low-frequency Raman spectroscopy study further highlighted homogeneity's importance, finding that tablets prepared with smaller particles (≤100 μm) exhibited more distinct clustering in PCA score plots based on crystalline-to-amorphous ratios [6]. This enhanced differentiation stems from increased homogeneity and better spectral averaging in finer powders. When the spectral analysis region was expanded to include multiple features (10-200 cm⁻¹), improved clustering occurred even for larger particle sizes, demonstrating how analytical parameters can partially compensate for heterogeneity [6].
Origins of Matrix Effects
Matrix effects arise from the physical and chemical interactions between analytes and co-existing sample components throughout the analytical process. In liquid chromatography, the "matrix" includes both components of the sample other than the analyte and the mobile phase components [5]. These effects are particularly problematic when matrix components have retention properties similar to the analyte, causing them to co-elute and enter the detector simultaneously [5].
Manifestations Across Detection Techniques
Mass Spectrometric (MS) Detection: The most well-known matrix effects occur in electrospray ionization, where analytes compete with matrix components for available charge during desolvation, leading to ion suppression or enhancement [5].
Fluorescence Detection: Matrix components can affect the quantum yield of the fluorescence process through quenching phenomena, leading to signal suppression [5].
UV/Vis Absorbance Detection: Solvatochromism effects can occur, where the absorptivity of analytes is affected by mobile phase solvents, leading to increases or decreases in observed absorption [5].
Evaporative Light Scattering (ELSD) and Charged Aerosol Detection (CAD): Mobile phase additives can influence aerosol formation processes, resulting in significant response enhancement or suppression [5].
Quantifying Matrix Effects
Matrix effect can be quantified by comparing analyte response in a matrix-matched solution to that in a pure solvent [10]. The calculation is straightforward:
Matrix Effect (%) = (SignalinMatrix / SignalinNeat_Standard) × 100%
For example, if the signal in the matrix solution is 70% of the signal for the neat standard, this indicates 30% signal loss due to matrix effects [10]. A value of 100% indicates no matrix effect, while values below 100% indicate suppression and values above 100% indicate enhancement.
Experimental Protocols for Investigation
Protocol 1: Assessing Particle Size Effects in Transmission Raman Spectroscopy
Objective: To systematically evaluate how particle size influences signal intensity and reproducibility in transmission low-frequency Raman spectroscopy of pharmaceutical tablets.
Materials:
- API (e.g., carbamazepine)
- Excipients for tablet formulation
- Sieve sets for particle size separation (e.g., ≤100 μm, 100-212 μm, >212 μm)
- Tablet press
- Transmission Raman spectrometer
Methodology:
- Prepare sample materials with distinct crystalline/amorphous ratios.
- Sieve powders into defined size fractions (≤100 μm, 100-212 μm, >212 μm).
- Compress tablets at controlled pressures (e.g., 10-30 MPa) using constant mass.
- Acquire transmission Raman spectra with fixed laser power and exposure time.
- Measure peak intensity (e.g., at 37 cm⁻¹ for carbamazepine Form III) and calculate coefficient of variation across replicates.
- Perform principal component analysis on spectral datasets (21-52 cm⁻¹ and 10-200 cm⁻¹ ranges) to assess clustering by composition.
Expected Outcomes: Smaller particles (≤100 μm) will yield lower absolute intensity but superior reproducibility and clearer multivariate clustering, enabling more reliable quantification of crystalline content in amorphous matrices [6].
Protocol 2: Evaluating Matrix Effects in LC-MS
Objective: To quantify matrix-induced suppression/enhancement for analytes in complex samples using liquid chromatography-mass spectrometry.
Materials:
- Blank matrix (e.g., biological fluid, tissue extract)
- Analyte standards
- Appropriate solvents for preparation of neat standards
- LC-MS system with electrospray ionization
Methodology:
- Prepare post-extraction blank matrix samples (n ≥ 6 from different sources).
- Spike blank matrices with target analyte at low, mid, and high concentrations.
- Prepare neat standard solutions in mobile phase at identical concentrations.
- Inject all samples in randomized sequence and record peak areas.
- Calculate matrix effect (ME) for each concentration: ME% = (Mean peak area of post-extraction spiked samples / Mean peak area of neat standards) × 100
- Determine IS-normalized ME if using internal standards.
Expected Outcomes: Signal suppression (ME% < 100%) is commonly observed in electrospray ionization MS due to competition for charge during ionization [5] [10]. High variability in ME across different matrix sources indicates significant matrix effect.
Protocol 3: Investigating Homogeneity via FTIR Spectroscopy
Objective: To assess sample homogeneity using Fourier Transform Infrared spectroscopy with principal component analysis.
Materials:
- Sample set (e.g., multiple grains or powder aliquots)
- FTIR spectrometer with reflectance accessory
- Gold standard background reference material
Methodology:
- Acquire background spectrum using diffuse gold reflectance standard.
- Collect FTIR spectra (e.g., 2.65-4.1 μm range) from multiple sample positions/locations.
- Pre-process spectra (vector normalization, baseline correction).
- Perform principal component analysis on spectral dataset.
- Examine score plots for clustering patterns and identify outliers.
- Calculate percentage of samples falling within main spectral group.
Expected Outcomes: Highly homogeneous samples will cluster tightly in PCA score plots, with PC1 (>99% variance) primarily reflecting reflectance intensity rather than spectral shape differences [9].
Mitigation Strategies and Best Practices
Addressing Particle Size Issues
- Standardized Milling and Sieving: Implement controlled size reduction followed by separation into defined size fractions to ensure batch-to-batch consistency [6].
- Geometric Dilution: For powder mixtures, employ progressive dilution with excipients to enhance homogeneity of low-concentration components.
- Laser Power Optimization: Balance signal intensity against potential sample degradation, particularly for heat-sensitive materials [6].
Enhancing Sample Homogeneity
- Appropriate Mixing Techniques: Utilize Turbula mixing or similar three-dimensional motion that provides gentle but effective blending without particle segregation.
- Multiple Sampling Points: In backscattering Raman measurements, implement multipoint acquisition, rotation, or wide-area sampling to average heterogeneous distributions [6].
- Transmission Mode Selection: For depth penetration in solid formulations, prefer transmission-mode Raman which probes the entire sample volume rather than just surface features [6].
Counteracting Matrix Effects
Table 2: Strategies for Mitigating Matrix Effects in Analytical Separations
| Strategy Category | Specific Approaches | Mechanism of Action | Applicability |
|---|---|---|---|
| Sample Clean-up | Solid-phase extraction (SPE), Liquid-liquid extraction, Protein precipitation | Removes interfering matrix components prior to analysis | Broad applicability across sample types |
| Chromatographic Optimization | Improved separation, Gradient elution, Alternative stationary phases | Increases temporal separation of analyte from matrix interferences | LC-MS, GC-MS |
| Internal Standardization | Stable isotope-labeled analogs, Structural analogues | Compensates for variable ionization efficiency | Primarily MS detection |
| Calibration Approaches | Matrix-matched standards, Standard addition method | Matches calibration environment to sample environment | All detection techniques |
| Ionization Source Selection | Switching ESI to APCI, or vice versa | Alters ionization mechanism to reduce interference | MS detection |
The internal standard method is particularly effective when practical, especially when using stable isotope-labeled internal standards that behave nearly identically to the analyte yet are detectable separately [5]. As with many troubleshooting topics, developing a solid understanding of matrix effects on quantitation and potential mitigation strategies is helpful for both developing new methods and troubleshooting problems with existing methods [5].
The Scientist's Toolkit: Essential Research Reagents and Materials
Table 3: Key Materials for Investigating Spectral Influences
| Item | Primary Function | Application Notes |
|---|---|---|
| Standard Sieve Sets | Particle size separation and classification | Essential for creating defined size fractions; ASTM certified provides best reproducibility |
| Stable Isotope-Labeled Standards | Internal standards for quantification | Ideally (^{13}\text{C}), (^{15}\text{N}), or (^{2}\text{H})-labeled analogs of target analytes for MS applications |
| Matrix-Matched Blank Materials | Preparation of calibration standards | Should be free of target analytes but otherwise compositionally similar to samples |
| Solid-Phase Extraction (SPE) Cartridges | Sample clean-up and concentration | Select chemistries (C18, ion exchange, mixed-mode) based on target analyte properties |
| Reference Standard Materials | Method validation and quality control | Certified reference materials for verifying method accuracy and precision |
| ATR Crystals (Diamond, ZnSe) | FT-IR spectroscopy sampling | Different crystal materials offer varying hardness, chemical resistance, and wavelength ranges |
Particle size, homogeneity, and matrix effects represent three interconnected pillars that fundamentally govern spectral data quality. Particle size dictates light-matter interaction efficiency, homogeneity ensures representative sampling, while matrix effects directly modulate detector response. Through systematic investigation using the described protocols and implementation of appropriate mitigation strategies, researchers can significantly enhance the reliability of their spectroscopic analyses. As analytical challenges grow increasingly complex with novel pharmaceutical formulations and complex biological samples, adherence to these core principles will remain essential for generating meaningful, reproducible spectral data that advances scientific understanding and product development.
The accuracy and reliability of spectroscopic analysis are fundamentally rooted in the steps taken before a sample ever reaches the instrument. Sample preparation represents the most significant source of potential error in quantitative analysis, directly influencing the validity of experimental results and subsequent conclusions [11]. For researchers and drug development professionals, understanding these technique-specific requirements is not merely procedural but foundational to generating scientifically defensible data. This guide details the unique preparation paradigms for X-Ray Fluorescence (XRF), Inductively Coupled Plasma Mass Spectrometry (ICP-MS), and Fourier-Transform Infrared (FT-IR) spectroscopy, framing them within the critical context of how preparation choices directly affect analytical outcomes. The overarching thesis is that inappropriate sample preparation can systematically bias results, leading to inaccurate concentrations, misidentified compounds, and flawed scientific interpretations, whereas rigorous, technique-specific preparation ensures data quality and analytical integrity.
X-Ray Fluorescence (XRF) Spectroscopy
Core Principles and Preparation Philosophy
XRF spectroscopy determines elemental composition by measuring the characteristic X-rays emitted from a sample following excitation by a primary X-ray source. The fundamental premise of XRF sample preparation is achieving a homogeneous, representative, and flat surface to ensure accurate and reproducible results [11] [12]. The intense focus on physical state and surface characteristics stems from the shallow depth of analysis; for light elements like sodium, the effective layer thickness from which 99% of the signal originates is a mere 4 µm, comparable to the thickness of a human hair [11]. Consequently, any lack of homogeneity or surface imperfection disproportionately impacts the analytical signal.
Detailed Experimental Protocols
Pressed Powder Pellet Method
This common approach is ideal for powdered samples like soils, ores, and heterogeneous biological materials [13] [12].
- Grinding: The bulk sample must be ground to a fine, consistent particle size. The optimal grain size is typically <75 µm to minimize particle size effects and ensure homogeneity [12]. A grinding curve analysis can determine the optimal grinding duration [11].
- Mixing with Binder: The powdered sample is mixed with a binder, such as powdered wax or cellulose, at a specified ratio (e.g., 20-30% binder). The binder provides structural integrity to the pellet. Studies show that the binder ratio is a critical parameter, as variations can introduce systematic errors, underestimating light elements (Mg, Al) and overestimating heavier elements (Mn, Fe) [13].
- Pressing: The mixture is poured into a die and pressed under high pressure (typically 15-25 tons) for 60-120 seconds to form a solid, stable pellet [13]. The pellet must have an infinite thickness for the wavelengths of interest, meaning its thickness is sufficient that further increases do not affect the measured intensity [11].
Fusion Method
For achieving the highest accuracy, particularly with complex mineralogical samples, the fusion method is preferred.
- Weighing: A precise amount of powdered sample (e.g., 1.000 g) is weighed.
- Flux Addition: A flux, such as lithium metaborate or tetraborate (e.g., 5.000 g), is added to the sample. The flux acts as a solvent during the melting process.
- Fusion: The sample-flux mixture is heated in a platinum crucible to high temperatures (often above 1000°C) until it completely melts and homogenizes.
- Casting: The molten mixture is poured into a pre-heated mold to create a stable, homogeneous glass bead. This method effectively destroys all original mineral structures, eliminating mineralogical and particle size effects [11].
The Scientist's Toolkit: Essential Reagents for XRF
Table 1: Key Research Reagent Solutions for XRF Sample Preparation.
| Reagent/Material | Function | Technical Notes |
|---|---|---|
| Powdered Wax/Cellulose Binder | Provides structural integrity to pressed powder pellets. | The ratio to sample is critical; higher ratios can cause systematic errors for light and heavy elements [13]. |
| Lithium Metaborate/Tetraborate | High-temperature flux for fusion method. | Creates a homogeneous glass bead, eliminating mineralogical effects [11]. |
| Polyester/Polypropylene Film | Supports loose powders or liquids in sample cups. | Prevents contamination; type must be selected based on the sample (e.g., polyester for oil products) [12]. |
| Grinding Mill & Vials | Reduces particle size for homogeneity. | Achieves optimal particle size of <75 µm; materials (e.g., WC, Cr-steel) must avoid contaminating analytes [12]. |
Impact of Preparation on Analytical Results
The choice of preparation method directly dictates analytical accuracy. The fusion method consistently yields high accuracy and precision by creating a perfectly homogeneous sample, as illustrated by the bull's-eye on the right in Figure 2 of the source material [11]. In contrast, the pressed pellet method, while faster, can yield high precision but poor accuracy if standards and unknowns differ in mineralogy, particle size, or density—a phenomenon known as the "mineralogical effect" [11]. For example, analyzing polymorphs of Al₂SiO₅ (kyanite, sillimanite) using one as a standard for another can result in analysis totals ranging from 75% to 125% despite identical chemical composition [11].
Inductively Coupled Plasma Mass Spectrometry (ICP-MS)
Core Principles and Preparation Philosophy
ICP-MS is a powerful technique for trace and ultra-trace elemental (and isotopic) analysis. Its sample preparation philosophy centers on achieving complete dissolution of the analyte into a stable, liquid form while managing the Total Dissolved Solids (TDS) content and mitigating spectral and non-spectral interferences [14] [15]. The high-temperature plasma (6000-8000°C) efficiently atomizes and ionizes samples, but the sample introduction system (nebulizer, spray chamber) is highly susceptible to clogging from particulates or high dissolved solids [14] [15].
Detailed Experimental Protocols
Acid Digestion of Solid Samples
For solid samples like tissues, soils, or pharmaceuticals, acid digestion is often mandatory.
- Weighing: Accurately weigh 0.1 - 0.5 g of sample into a digestion vessel.
- Acid Addition: Add a suitable acid or acid mixture. Common choices include:
- Nitric Acid (HNO₃): A primary choice for its oxidizing power and low interference in the plasma [15] [16].
- Aqua Regia (3:1 HCl:HNO₃): Effective for dissolving metallic materials and stabilizing mercury and platinum group elements [15].
- Hydrofluoric Acid (HF): Essential for digesting silicates but requires specialized inert sample introduction systems (e.g., fluoropolymer nebulizers) due to its corrosiveness [15] [17].
- Digestion: Heat the vessels using a hot block or, preferably, a closed-vessel microwave digestion system. Microwave digestion allows for higher temperatures and pressures, ensuring complete decomposition while minimizing contamination and the loss of volatile elements [15] [16]. A clear, particle-free solution indicates complete digestion.
Dilution of Liquid Samples
Biological fluids like blood and urine often require simple dilution.
- Aliquot: Pipette a precise aliquot of the liquid sample (e.g., 100 µL of blood).
- Diluent Addition: Add a diluent to a defined volume (e.g., 10 mL total volume for a 1:100 dilution). Common diluents include:
- Dilute Nitric Acid (1-5%): Stabilizes metals but can precipitate proteins in blood [16] [17].
- Alkaline Diluents with Chelators: A solution of Tetramethylammonium Hydroxide (TMAH) and a chelating agent like EDTA or APDC is better tolerated by proteinaceous blood samples, preventing precipitation and stabilizing elements like mercury [14] [17].
- Detergent Addition: Reagents like Triton X-100 are added to solubilize and disperse lipids and membrane proteins, ensuring homogeneity [14] [17].
The Scientist's Toolkit: Essential Reagents for ICP-MS
Table 2: Key Research Reagent Solutions for ICP-MS Sample Preparation.
| Reagent/Material | Function | Technical Notes |
|---|---|---|
| High-Purity Nitric Acid (HNO₃) | Primary oxidant for digestion; dilute diluent for liquids. | Must be high-purity grade to prevent contamination; unsuitable for blood alone due to protein precipitation [15] [17]. |
| Tetramethylammonium Hydroxide (TMAH) | Alkaline diluent for biological fluids. | Solubilizes tissues and is better tolerated by proteinaceous samples than acid [14] [17]. |
| Triton X-100 | Non-ionic surfactant. | Disperses lipids and membrane proteins, preventing nebulizer clogging and ensuring homogeneity [14] [17]. |
| Ammonium Pyrrolidinedithiocarbamate (APDC) | Chelating agent for soft metals. | Forms stable, water-soluble complexes with elements like mercury, eliminating memory effects in the introduction system [17]. |
| Internal Standard Mixture | Corrects for non-spectral matrix effects and instrument drift. | Elements like Sc, Y, In, Tb, or Bi are added online to all samples and standards to monitor and correct signal suppression/enhancement [16]. |
Impact of Preparation on Analytical Results
Inadequate ICP-MS preparation directly causes analytical failures. A TDS content exceeding 0.2 - 0.5% (m/v) can lead to signal drift and suppression from matrix effects and nebulizer blockage [15]. The choice of acid is also critical; sulfuric acid should be avoided as it creates polyatomic interferences and damages Teflon digestion vessels [15]. Furthermore, the aqueous chemistry of the analyte must be considered. For example, uranium in pure water will adhere to the introduction system tubing, yielding a false negative, while acidification with 1% HNO₃ stabilizes it in solution and provides the correct result [17]. Memory effects from elements like thorium and mercury can be mitigated only by using specific chelating agents (e.g., fluoride for Th, APDC for Hg) in the rinse solution [17].
Fourier-Transform Infrared (FT-IR) Spectroscopy
Core Principles and Preparation Philosophy
FT-IR spectroscopy probes molecular structure by measuring the absorption of infrared light by molecular bonds, which vibrate at characteristic frequencies. The resulting spectrum is a "molecular fingerprint." The core preparation philosophy for FT-IR is to present the sample in a form that allows for efficient and reproducible infrared light interaction without introducing artifacts or obscuring the spectral regions of interest [18] [19]. A paramount concern is the elimination of water, as it has strong, broad absorptions that can dominate the spectrum and mask important sample peaks [19].
Detailed Experimental Protocols
Attenuated Total Reflectance (ATR) Sampling
ATR is a nearly universal sampling mode that requires minimal preparation.
- Sample Presentation: For solids, the sample is placed in direct, firm contact with the ATR crystal (e.g., Diamond, ZnSe). For liquids, a few drops are placed on the crystal.
- Applying Pressure: A pressure clamp is used to ensure good optical contact between the sample and the crystal. Intimate contact is critical for a quality spectrum.
- Drying: For biological samples (tissues, cells, biofluids), it is essential to remove all water. This is typically done by air-drying or under a gentle stream of nitrogen gas while monitoring the spectrum until the broad water bands diminish [19].
- Data Collection: The infrared beam is directed into the crystal, where it undergoes total internal reflection, generating an evanescent wave that interacts with the sample in contact with the crystal.
Transmission Sampling
This traditional method is used for samples that can be prepared as thin films or diluted in IR-transparent matrices.
- Solid Preparation (KBr Pellet):
- Grind 1-2 mg of the sample with 100-200 mg of dry potassium bromide (KBr) powder.
- Press the mixture under high vacuum in a die to form a transparent pellet. This method dilutes the sample in an IR-transparent medium.
- Liquid Preparation: The liquid sample is sandwiched between two IR-transparent windows (e.g., KBr, NaCl) separated by a thin spacer to define the pathlength.
Impact of Preparation on Analytical Results
Sample preparation directly affects the quality and interpretability of FT-IR spectra. The choice of sampling mode influences spectral features; for instance, transflection measurements can produce distorted band intensities due to the electric field standing wave effect [19]. For biological tissues, analyzing formalin-fixed paraffin-embedded (FFPE) samples requires a rigorous dewaxing procedure with xylol to remove the paraffin, whose strong IR bands would otherwise obscure the biological signal [19]. Inadequate drying leaves residual water vapor, which contributes sharp, overlapping peaks that complicate baseline correction and data interpretation [19]. Proper preparation is essential for revealing the true "molecular fingerprint" of the sample.
The unique preparation requirements for XRF, ICP-MS, and FT-IR stem from their fundamental physical principles: XRF probes elemental composition via X-ray excitation of a solid surface, ICP-MS requires a liquid solution for atomization/ionization, and FT-IR investigates molecular structure through IR absorption. The experimental workflows for each technique, driven by these principles, are summarized below.
The path from a raw sample to a reliable analytical result is paved with technique-specific preparation. The overarching conclusion is that sample preparation is not a peripheral concern but a foundational component of spectroscopic analysis. The "Golden Rule for Accuracy in XRF"—that standards and unknowns must be nearly identical in physical and mineralogical characteristics—holds true across all techniques [11]. For ICP-MS, it translates to matrix-matching and controlling TDS; for FT-IR, it means ensuring proper physical form and removing interferents like water. Neglecting these specific requirements introduces systematic errors that no advanced instrument or sophisticated software can later correct. Therefore, a deep understanding and meticulous application of these technique-specific foundations are indispensable for any researcher committed to data integrity in scientific and drug development endeavors.
In analytical spectroscopy, the sophistication of modern instrumentation can create an illusion of inherent accuracy. However, even the most advanced spectrometer cannot compensate for a poorly prepared sample. Sample preparation serves as the critical bridge between a raw, complex material and a reliable analytical result, forming the foundation upon which all subsequent data is built. Within the context of a broader thesis on spectroscopic results research, it is evident that the preparation phase is not merely a preliminary step but a pivotal determinant of analytical success. Inadequate preparation is the source of as much as 60% of all spectroscopic analytical errors, embedding inherent weaknesses into the study before data acquisition even begins [1]. This article examines the direct consequences of inadequate sample preparation on both quantitative and qualitative analysis, detailing the mechanisms of failure and providing validated protocols to safeguard data integrity for researchers, scientists, and drug development professionals.
The necessity of rigorous sample preparation stems from several fundamental requirements. Firstly, it aims to remove or reduce matrix effects, where co-eluting components can suppress or enhance the analyte signal, particularly in techniques like mass spectrometry [20]. Secondly, it ensures homogeneity, guaranteeing that the analyzed aliquot is representative of the entire sample, which is crucial for obtaining reproducible results [1]. Thirdly, it brings the analyte concentration within the detectable range of the instrument, often through pre-concentration, thereby improving sensitivity and achieving lower limits of detection (LOD) and quantification (LOQ) [20]. Finally, proper preparation protects costly and sensitive instrumentation from contamination by particulates, salts, or other interfering substances that can cause instrumental drift, clogging, or long-term damage [20].
Consequences of Inadequate Preparation
The pitfalls of inadequate sample preparation manifest across various spectroscopic techniques, directly impacting the validity of both quantitative measurements and qualitative identification. The following sections dissect these consequences, which range from introducing substantial analytical errors to completely misleading the analytical interpretation.
Impacts on Quantitative Analysis
Quantitative analysis relies on the precise correlation between the measured signal and the analyte concentration, most famously described by the Beer-Lambert law in absorption spectroscopy [21]. Inadequate preparation directly undermines the assumptions of this relationship, leading to significant errors in concentration determination as shown in the table below.
Table 1: Impact of Inadequate Sample Preparation on Quantitative Analysis
| Preparation Failure | Consequence on Quantitative Analysis | Underlying Mechanism | Typical Resulting Error |
|---|---|---|---|
| Insufficient Homogenization | Non-representative sampling and high result variance [1]. | Heterogeneous distribution of analyte; measured portion does not reflect the whole. | High standard deviation between replicates; inaccurate mean concentration. |
| Incomplete Digestion/Dissolution | Low analyte recovery and signal suppression [22]. | Analyte trapped in solid matrix or undissolved particles; not available for detection. | Negatively biased results; reported concentration lower than true value. |
| Improper pH Adjustment | Altered extraction efficiency and chemical stability [20]. | Ionizable analytes change form; recovery during extraction is pH-dependent. | Inconsistent and unpredictable recovery, either low or high. |
| Contamination Introduction | Positively biased results and elevated baselines [1]. | Contaminants from equipment or reagents introduce additional signals. | Falsely high concentration readings; impossible to distinguish from true analyte. |
| Inadequate Cleanup (Matrix Effects) | Signal suppression or enhancement in MS and OES [20]. | Co-eluting matrix components interfere with ionization efficiency in the source. | Inaccurate concentration, often not corrected by internal standard. |
For instance, in the quantitative analysis of trace metals in drinking water using ICP-MS, failure to employ filtration and acidification can lead to suspended particulates or microbial growth, producing artificially elevated readings or unstable baselines [20]. Similarly, in pharmaceutical testing, if excipients like binders and fillers are not removed through solid-phase extraction (SPE) or liquid-liquid extraction (LLE), the chromatogram may display overlapping peaks, making reliable quantification of the active pharmaceutical ingredient (API) impossible [20].
Impacts on Qualitative and Structural Analysis
Qualitative analysis depends on the integrity of the spectral "fingerprint" for accurate identification. Compromised sample preparation introduces artefacts and obscures critical spectral features, leading to misidentification and a fundamental failure of the analysis as shown in the table below.
Table 2: Impact of Inadequate Sample Preparation on Qualitative Analysis
| Preparation Failure | Consequence on Qualitative Analysis | Underlying Mechanism | Typical Resulting Error |
|---|---|---|---|
| Particle Size/Surface Irregularity | Increased light scattering and distorted spectral baselines [1]. | Rough surfaces and variable particle size cause non-uniform interaction with radiation. | Obscured absorption bands; incorrect functional group identification (IR/Raman). |
| Contamination Introduction | Appearance of spurious spectral peaks [1]. | Foreign substances from equipment or environment produce their own spectral signals. | False positives; misidentification of contaminants as sample components. |
| Inadequate Sample Form | Incorrect elemental composition results [1]. | XRF analysis requires flat, homogeneous pellets; otherwise, X-ray absorption varies. | Erroneous elemental identification and concentration ratios. |
| Solvent Interference | Masking of analyte peaks [1]. | Solvent absorption bands (e.g., in FT-IR) overlap with critical analyte features. | Key molecular vibrations are hidden, preventing accurate structural elucidation. |
| Sample Degradation | Loss of genuine spectral features and formation of new ones. | Improper storage or harsh preparation alters the native chemical structure. | Identification of degradation products instead of the original analyte. |
A prominent example is found in Surface-Enhanced Raman Spectroscopy (SERS) for environmental analysis. The presence of Natural Organic Matter (NOM), such as humic substances, in water samples can cause a microheterogeneous distribution of the target analytes on the nanoparticle substrate. This matrix effect degrades SERS performance and introduces spectral artefacts, complicating or preventing the accurate identification of pollutants [23]. Furthermore, for techniques like FT-IR, the choice of solvent is critical; an inappropriate solvent with strong absorption bands in the mid-IR region can completely obscure the characteristic peaks of the analyte, rendering the spectrum useless for identification [1].
Experimental Protocols: Optimized Methodologies
To mitigate the consequences described above, the implementation of rigorously optimized and technically robust sample preparation protocols is essential. The following sections detail specific methodologies that have been experimentally validated to ensure data quality.
Central Composite Design for Multi-Residue Analysis in Waters
The optimization of a sample preparation protocol for the determination of 172 emerging contaminants (ECs)—including pharmaceuticals, personal care products, illicit drugs, and flame retardants—in wastewater and tap water serves as a prime example of a systematic approach. The method employed solid-phase extraction (SPE) followed by analysis with liquid chromatography-high-resolution mass spectrometry (LC-Orbitrap MS/MS) [24].
- Objective: To develop a single, generic SPE protocol capable of efficiently extracting a wide range of compounds with diverse physicochemical properties (logP from -3.6 to 10.2).
- Experimental Design: A Central Composite Design (CCD) was used to optimize the critical SPE parameters beyond the traditional one-variable-at-a-time approach. This response surface methodology allowed for the empirical modeling of polynomial relationships between factors and extraction efficiency.
- Factors Optimized:
- Water Sample pH: Tested across a range to account for acidic, neutral, and basic analytes.
- Elution Solvent Composition: Evaluated different ratios and types of organic solvents (e.g., MeOH, Acetonitrile, Ethyl Acetate).
- Elution Volume: Optimized to ensure complete analyte desorption while minimizing dilution.
- Outcome: The CCD approach successfully identified the optimal set of conditions that provided a compromise for the high-throughput analysis of the entire suite of 172 ECs, demonstrating that meticulous, statistically guided optimization is possible even for highly complex sample matrices.
Solid Sample Preparation Workflow for Elemental Analysis
The analysis of solid samples for elemental content requires a dedicated workflow to ensure homogeneity and representative analysis. The following diagram illustrates a robust workflow for solid sample preparation, integrating multiple techniques to achieve an analyzable specimen.
Solid Sample Preparation Workflow
- Grinding and Milling: The initial step involves reducing particle size and creating homogeneity. The choice between grinding (for brittle materials) and milling (for more controlled surface finishing) depends on the sample's hardness and the required final particle size (typically <75 μm for XRF). This step is critical to minimize sampling error and ensure uniform interaction with radiation [1].
- Pelletizing (for XRF): The homogenized powder is mixed with a binder (e.g., wax or cellulose) and pressed under high pressure (10-30 tons) into a solid, flat pellet. This process creates a sample with uniform density and surface properties, which is essential for accurate X-ray fluorescence intensity measurements [1].
- Fusion (for refractory materials): For difficult-to-dissolve materials like silicates and ceramics, fusion is the preferred method. The ground sample is mixed with a flux (e.g., lithium tetraborate) and melted at high temperatures (950-1200°C) to form a homogeneous glass disk. This technique completely destroys the original crystal structure, eliminating mineralogical effects and standardizing the matrix [1].
- Acid Digestion (for ICP-MS): For elemental analysis via ICP-MS, total dissolution of the solid sample is required. This is typically achieved using microwave-assisted acid digestion with a mixture of high-purity acids (e.g., HNO₃, HCl) under controlled temperature and pressure. This process ensures the analyte is brought into solution for subsequent nebulization and ionization in the plasma [22].
The Scientist's Toolkit: Essential Reagents and Materials
The following table details key reagents and materials critical for successful sample preparation in spectroscopic analysis.
Table 3: Essential Research Reagent Solutions for Spectroscopic Sample Preparation
| Item | Function | Key Application Example |
|---|---|---|
| High-Purity Acids (e.g., HNO₃, HCl) | Digest and dissolve samples for elemental analysis; minimize background contamination. | Microwave digestion for ICP-MS analysis of metals in biological tissues [22]. |
| Solid-Phase Extraction (SPE) Cartridges (e.g., Oasis HLB) | Extract, clean up, and pre-concentrate analytes from liquid samples. | Multi-residue extraction of emerging contaminants from water samples for LC-MS analysis [24]. |
| Spectroscopic Grinding/Milling Equipment | Reduce particle size and homogenize solid samples. | Preparing a uniform powder from soil samples prior to pelletizing for XRF [1]. |
| Binders (e.g., Boric Acid, Cellulose) | Provide structural integrity to powdered samples during pellet formation. | Producing mechanically stable pellets for XRF analysis that will not fracture under vacuum [1]. |
| Fluxes (e.g., Lithium Tetraborate) | Dissolve refractory materials at high temperatures to form homogeneous glass disks. | Fusion preparation of mineral ores for accurate and matrix-effect-free XRF analysis [1]. |
| Internal Standards | Correct for variability in sample preparation and instrument response. | Added to all samples and calibrants in ICP-MS to account for signal drift and matrix effects [1]. |
The evidence is unequivocal: inadequate sample preparation is the primary source of error in spectroscopic analysis, with the capacity to invalidate both quantitative and qualitative results. The consequences—from erroneous concentration data and false positives to compromised structural identification and instrumental damage—highlight that preparation is not a mere preliminary step but an integral part of the analytical method itself.
To mitigate these risks, laboratories must adopt a "total workflow" approach [22] [25]. This philosophy looks beyond the core digestion or extraction step to encompass every stage of the process, including: automated reagent dosing for consistency and safety; in-house acid purification to control cost and ensure supply; and automated labware cleaning to prevent cross-contamination and free up technician time. By systematically optimizing the entire workflow, rather than isolated components, laboratories can overcome daily challenges, avoid disruptive reruns, and consistently produce high-quality, reliable spectroscopic data. In doing so, researchers and drug development professionals can ensure that their conclusions are built upon a foundation of analytical integrity, not compromised by preventable preparation failures.
From Solid to Solution: Technique-Specific Preparation Protocols for Accurate Analysis
In modern analytical laboratories, techniques like X-ray Fluorescence (XRF) and Fourier Transform Infrared (FT-IR) spectroscopy are indispensable for determining elemental composition and identifying molecular structures. However, the accuracy and precision of these powerful analytical tools are profoundly dependent on the quality of sample preparation. In fact, inadequate sample preparation accounts for approximately 60% of all spectroscopic analytical errors [1]. This guide details standardized protocols for solid sample preparation, focusing on grinding, milling, and pelletizing methods, to ensure that analytical results are both accurate and reproducible.
The physical state of a sample—including its particle size, homogeneity, and surface characteristics—directly influences how it interacts with electromagnetic radiation [1]. For XRF, improper preparation can lead to effects such as particle size heterogeneity and mineralogical variation, which significantly impact the intensity of the emitted X-rays [11]. For FT-IR, issues like poor contact with crystals or sample thickness can cause scattering, saturation, and ultimately, uninterpretable spectra [26]. Therefore, meticulous sample preparation is not merely a preliminary step but a critical component of the analytical process that validates the entire experimental outcome.
Core Principles of Sample Preparation
The Impact of Preparation on Analytical Results
The primary goal of sample preparation is to present a specimen to the spectrometer that is representative of the entire bulk material. Several fundamental principles must be adhered to for all spectroscopic techniques.
- Homogeneity: The sample must be uniform in composition and particle size throughout. Heterogeneous samples yield non-reproducible results because the analyzed portion may not represent the whole [1].
- Optimal Particle Size: Fine and consistent particle size is crucial. For XRF, the general requirement is a particle size of <75 μm, with <50 μm being ideal for creating high-quality pellets [27] [12]. For FT-IR, fine grinding is essential for making clear KBr pellets that produce spectra with sharp peaks [26].
- Surface Quality: The surface presented for analysis must be flat and clean. For XRF, this ensures consistent X-ray penetration and emission [11]. For FT-IR using Attenuated Total Reflectance (ATR), a flat surface ensures proper contact with the crystal [28].
- Avoidance of Contamination: Cross-contamination from equipment or between samples can introduce spurious signals, rendering results worthless. Proper cleaning of all apparatus between samples is mandatory [1].
Accuracy vs. Precision in Sample Preparation
It is vital to distinguish between accuracy and precision. Precision refers to the closeness of agreement between replicate measurements, while accuracy refers to the closeness of a measured value to the true value [11]. Sample preparation methods can yield highly precise results (repeatable), but if a systematic error like contamination exists, the results will be inaccurate. The choice of preparation method directly influences accuracy; for instance, the fusion method for XRF often provides higher accuracy than pressed powders for complex matrices because it eliminates mineralogical effects [11].
Sample Preparation for X-Ray Fluorescence (XRF) Analysis
Grinding and Milling Protocols for XRF
The initial step for solid XRF samples is particle size reduction to achieve a homogeneous and fine powder.
- Grinding Hard Materials: For hard, brittle materials like ores, ceramics, and cements, use a swing grinding mill with an oscillating motion. This method reduces heat generation, which can alter sample chemistry. Grind for a consistent, predetermined time to achieve the target particle size of <75 μm [1].
- Milling Metallic Alloys: For metals, particularly soft, non-ferrous alloys like aluminum and copper, a milling machine is preferred. Milling provides a controlled, flat surface by using a cutting head to remove the top layer, exposing a fresh, representative surface for analysis. This minimizes light scattering and ensures consistent density [29] [1].
- Contamination Control: Select grinding and milling surfaces that will not contaminate the sample. For example, use tungsten carbide components if iron is an analyte of interest [30]. Clean equipment thoroughly between samples to prevent cross-contamination [27].
Pelletizing / Briquetting Techniques
Transforming the powdered sample into a solid pellet ensures a flat, uniform surface of consistent density, which is critical for quantitative XRF analysis.
Step-by-Step Protocol:
- Grinding: Finely grind the sample to a particle size of <50 μm [27].
- Mixing with Binder: Combine the powdered sample with a binding agent. A typical sample-to-binder ratio is 20-30% binder [27]. Common binders include cellulose, wax, or boric acid. The binder must be homogenized with the sample to ensure the pellet holds together and to reduce matrix effects [1].
- Pressing: Place the mixture into a clean die, typically 32 mm or 40 mm in diameter [30]. Use a hydraulic press to apply a load between 15 and 40 tons, with many samples requiring 25-35 tons for 1-2 minutes. This pressure is sufficient to recrystallize the binder and fully compress the sample without void spaces [27].
- Ejection and Storage: Eject the finished pellet from the die. For protection and ease of handling, the powder can be pressed within a supportive aluminum cap or a metal ring [30] [11].
Table 1: Key Parameters for XRF Pellet Preparation
| Parameter | Recommended Specification | Purpose and Rationale |
|---|---|---|
| Final Particle Size | < 75 μm (optimal < 50 μm) [27] [12] | Ensures homogeneity and minimizes particle size effects on X-ray intensity. |
| Binder Ratio | 20-30% binder to sample [27] | Binds powder for handling; over-dilution affects measured concentrations. |
| Pressing Pressure | 15-40 tons (typical 25-35 tons) [30] [27] | Creates a robust, void-free pellet of consistent density. |
| Pressing Time | 1-2 minutes under full pressure [27] | Allows for binder recrystallization and pellet stabilization. |
Advanced Technique: Fusion Method
For the highest accuracy, particularly with refractory materials or complex mineralogies, the fusion method is the gold standard. It involves:
- Mixing the ground sample with a flux (e.g., lithium tetraborate) [1].
- Melting the mixture in a platinum crucible at high temperatures (950-1200°C) to form a homogeneous glass bead or disk [29] [1].
- Casting and cooling the melt into a solid disk. Fusion completely destroys the original crystal structure of the sample, eliminating mineralogical and particle size effects, thereby providing unparalleled accuracy for quantitative analysis of materials like cement, slags, and minerals [11] [1].
The following workflow illustrates the two primary XRF solid sample preparation paths:
Sample Preparation for FT-IR Analysis
Grinding for Transmission FT-IR (KBr Pellet Method)
The traditional transmission FT-IR method requires the solid sample to be transparent to IR light, achieved by dispersing it in an IR-transparent matrix.
Step-by-Step Protocol (KBr Pellet Method):
- Grinding: Finely grind 1-2 mg of the solid sample using an agate mortar and pestle [26].
- Mixing with Matrix: Mix the ground sample with 100-200 mg of dry, powdered potassium bromide (KBr). KBr is hygroscopic, so working quickly is advised to minimize moisture absorption [26].
- Pressing: Transfer the mixture into a pellet die. Apply pressure using a hydraulic press to form a clear, transparent pellet. The required pressure is typically lower than for XRF pellets.
- Analysis: Place the resulting pellet directly into the FT-IR spectrometer's sample holder for transmission analysis [26].
This method produces high-quality spectra suitable for library matching but requires consistency in preparation for reproducibility [28].
Minimal-Preparation Techniques: ATR and DRIFTS
Modern FT-IR accessories have simplified sample preparation significantly.
Attenuated Total Reflectance (ATR): This is the most common FT-IR technique today due to its ease of use.
- Place the solid sample (powder, film, or bulk) directly onto the ATR crystal.
- Apply pressure to ensure intimate contact between the sample and the crystal.
- Run the analysis directly [26] [28]. ATR requires little to no sample preparation, as fine grinding is often unnecessary. The choice of crystal material (e.g., diamond for robustness, germanium for high refractive index) is important for optimal performance [28].
Diffuse Reflectance (DRIFTS): This technique is suitable for fine powders that are easily ground.
The following workflow will help you select the appropriate FT-IR preparation method:
Quantitative Aspects of FT-IR Preparation
The quality of FT-IR sample preparation directly impacts spectral data. A key study evaluating FT-IR performance found that for well-resolved, non-saturated peaks, the wavenumber accuracy is within 1.1 cm⁻¹ when using spectral resolutions of 4 cm⁻¹ or higher. This high level of precision is critical for identifying subtle spectral shifts that indicate phenomena like crystal polymorphism in pharmaceuticals [31]. The study also demonstrated that instrument-to-instrument variation is minimal, on the order of < 2.2 cm⁻¹ for resolutions of 8 cm⁻¹ or better, which is an order of magnitude better than some historical guidelines suggested [31]. This underscores that proper sample preparation is the dominant factor in achieving accurate results.
Table 2: FT-IR Sample Preparation Methods and Data Quality
| Method | Typical Sample Prep Time | Key Quality Metric | Effect of Poor Preparation |
|---|---|---|---|
| KBr Pellet (Transmission) | Moderate to High | Pellet clarity and thickness | Saturated peaks, scattering, poor reproducibility [26]. |
| ATR | Very Low | Quality of sample-crystal contact | Weak, distorted signals due to poor contact [28]. |
| DRIFTS | Low | Consistency of particle size and mixing | Non-representative spectra, poor reproducibility [28]. |
The Scientist's Toolkit: Essential Materials and Reagents
Successful sample preparation relies on the use of appropriate, high-quality consumables and equipment.
Table 3: Research Reagent Solutions for Spectroscopic Sample Preparation
| Item | Function | Application Notes |
|---|---|---|
| Hydraulic Pellet Press | Applies high pressure (15-40T) to powder samples to form solid pellets. | Essential for XRF pelletizing and FT-IR KBr pellets; available as manual or programmable presses [30] [27]. |
| Cellulose or Wax Binder | Binds powdered samples together to form a coherent pellet for handling and analysis. | Critical for creating robust XRF pellets; typical dilution ratio is 20-30% binder to sample [30] [27]. |
| Potassium Bromide (KBr) | IR-transparent matrix used to dilute and support solid samples for FT-IR analysis. | High-purity, dry KBr is essential for creating clear pellets for transmission FT-IR [26]. |
| Agate Mortar and Pestle | Manually grinds samples to a fine, homogeneous powder. | Used for both XRF and FT-IR preparation; agate is hard and resistant to contamination [26]. |
| Lithium Tetraborate Flux | Fluxing agent that dissolves solid samples at high temperatures to form homogeneous glass disks. | Used in the fusion method for XRF to eliminate mineralogical effects for ultimate accuracy [1]. |
| ATR Crystal (Diamond/ZnSe/Ge) | Enables direct measurement of solids and liquids with minimal sample preparation for FT-IR. | Diamond is robust for most samples; Germanium (Ge) offers a shallow penetration depth for highly absorbent materials [28]. |
The path to reliable and accurate spectroscopic data is paved long before the sample is placed in the spectrometer. As demonstrated, protocols for grinding, milling, and pelletizing are not mere preliminaries but are integral to the analytical methodology itself. For XRF analysis, consistent pelletizing and the strategic use of fusion are paramount for quantitative elemental accuracy. For FT-IR spectroscopy, the choice between traditional KBr pellets and modern ATR techniques dictates the balance between spectral quality and preparation efficiency. By adhering to the detailed protocols and principles outlined in this guide, researchers and scientists can systematically eliminate sample preparation as a major source of error, thereby ensuring that their XRF and FT-IR results truly reflect the composition and structure of the materials under investigation.
In modern analytical science, the accuracy of any spectroscopic result is contingent upon the steps taken before the sample even reaches the instrument. Inadequate sample preparation is the root cause of an estimated 60% of all spectroscopic analytical errors [1]. This guide details the core liquid handling techniques—dilution, filtration, and solvent selection—for two powerful analytical techniques: Inductively Coupled Plasma Mass Spectrometry (ICP-MS) and UV-Visible (UV-Vis) Spectroscopy. The central thesis is that rigorous, technique-specific sample preparation is not a mere preliminary step but a critical determinant of data validity, affecting everything from detection limits and signal stability to the very truth of the analytical conclusion [1].
ICP-MS, known for its exceptional sensitivity in trace element analysis, demands preparation protocols that control matrix effects and prevent instrumental issues [14]. UV-Vis Spectroscopy, used for characterizing molecular optical properties, requires preparation that ensures clear, interpretable spectra free from artifacts [32]. While both techniques analyze liquids, their underlying principles—elemental ionization versus molecular light absorption—dictate fundamentally different approaches to liquid handling. Mastering these protocols is therefore essential for researchers and drug development professionals seeking to generate reliable and meaningful data.
Dilution Strategies for Optimal Analysis
Dilution is a primary step in sample preparation, serving to adjust analyte concentration into the instrument's ideal working range and reduce matrix interferences.
Dilution in ICP-MS
In ICP-MS, dilution is critical for managing the Total Dissolved Solids (TDS) content. A TDS level below ~0.2% is generally recommended to prevent issues such as nebulizer blockage, cone clogging, and plasma instability, which lead to signal drift [33] [14]. The required dilution factor is sample-dependent.
- Biological Fluids: For serum or plasma, a dilution factor between 10 and 50 is typically adequate to reduce the inherent salt matrix to a manageable level while maintaining analytes within detectable limits [14].
- Aqueous Samples: Samples with high inherent TDS may require significant dilution, sometimes exceeding 1:1000 for concentrated solutions [1].
- Organic Liquids: Analyzing organic solvents (e.g., oils, organic extracts) may require specialized setups, such as the addition of oxygen to the plasma to prevent carbon deposition, but dilution with a compatible organic solvent is often the first approach [33].
The diluent itself is crucial. For ICP-MS, a typical matrix consists of 2% nitric acid, as it stabilizes a wide range of metal ions in solution. For certain elements like gold or silver, 0.5% hydrochloric acid may be added to prevent precipitation and ensure stability [33]. The use of high-purity acids and reagents is non-negotiable to avoid introducing contaminant trace metals.
Dilution in UV-Vis Spectroscopy
In UV-Vis, dilution is primarily optimized to adhere to the Beer-Lambert Law, which dictates that absorbance should ideally fall within a range of 0.1 to 1.0 absorbance units for accurate quantitation [32].
- Concentration Optimization: A sample that is too concentrated will allow no light to be transmitted, yielding a maximum absorbance reading with no useful information. A sample that is too dilute will produce a signal indistinguishable from noise [32].
- Path Length Adjustment: If the sample concentration cannot be easily adjusted, using a cuvette with a shorter path length is an effective strategy to reduce absorbance without further dilution, while also conserving valuable sample volume [32].
The diluent for UV-Vis must be spectroscopically transparent in the wavelength region of interest. The choice of solvent is therefore a key consideration, as detailed in Section 4.
Table 1: Dilution and Matrix Guidelines for ICP-MS and UV-Vis
| Parameter | ICP-MS | UV-Vis Spectroscopy |
|---|---|---|
| Primary Goal of Dilution | Reduce TDS (<0.2%) and matrix effects [33] [14] | Achieve ideal absorbance (0.1-1.0 AU) [32] |
| Typical Dilution Factor | 10-50x for biological fluids; can be >1000x for high TDS [1] [14] | Varies widely; determined empirically to fit the linear range |
| Common Diluent | 2% HNO₃ (high purity); with HCl for some elements [33] | Solvent with UV-cutoff below analysis wavelength (e.g., water, methanol, acetonitrile) [32] |
| Critical Consideration | Use of internal standards to correct for drift and matrix effects [33] | Use of a reference cell with pure solvent to blank instrument [32] |
Filtration and Cleanup Protocols
Filtration is a key step for clarifying samples and protecting sensitive instrumentation from particulate matter.
Filtration in ICP-MS
The narrow pathways in ICP-MS nebulizers are highly susceptible to clogging from suspended particles. Filtration is a standard practice to mitigate this risk.
- Membrane Selection: 0.45 μm membrane filters are standard for most ICP-MS applications. For ultratrace analysis or samples with very fine colloids, a 0.2 μm filter is recommended to remove a greater proportion of particulate matter [1].
- Filter Material: It is critical to select filter materials that do not leach contaminants or adsorb the analytes of interest. PTFE (polytetrafluoroethylene) membranes are widely preferred due to their chemical inertness and low background levels of trace metals [1].
- Centrifugation as an Alternative: While not explicitly detailed in the search results, centrifugation is a common alternative to filtration that avoids potential contamination from the filter membrane.
Filtration in UV-Vis Spectroscopy
For UV-Vis, filtration (or centrifugation) is used to ensure the sample solution is optically clear and free of light-scattering particles that can cause erroneous absorbance readings.
- Clarification of Solutions: Samples should be filtered before measurement to remove any contaminants or undissolved material that could scatter light [32].
- Drug Product Analysis: In pharmaceutical analysis of solid dosage forms like tablets, the extraction process is typically followed by filtration. A common protocol is to filter the extract through a 0.45 μm disposable syringe filter, discarding the first 0.5 mL of filtrate to equilibrate the filter [34]. For cloudy extracts, a finer 0.2 μm filter or centrifugation may be necessary [34].
Strategic Solvent Selection
The choice of solvent is a foundational decision that directly impacts the success of the analysis.
Solvent Considerations for ICP-MS
ICP-MS is primarily concerned with the elemental composition, not the molecular nature of the solvent. However, the solvent must facilitate a stable, consistent introduction into the plasma.
- Aqueous Acidic Matrices: As noted, dilute nitric acid is the nearly universal matrix for elemental analysis, providing a stable, oxidizing environment that keeps metals in solution.
- Organic Solvents: The analysis of organic liquids (e.g., oils, organic extracts) is possible but requires instrumental modifications. These include using a smaller injector, platinum-tipped cones, and adding oxygen to the plasma to prevent carbon buildup [33].
Solvent Considerations for UV-Vis and FT-IR
In absorption spectroscopy, the solvent must not only dissolve the sample but also be transparent in the spectral region of interest.
- UV-Cutoff Wavelength: Every solvent has a characteristic UV-cutoff wavelength below which it absorbs strongly and is unsuitable for measurements. Key examples include:
- Solvent Polarity: The solvent should be matched to the polarity of the analyte to ensure complete dissolution and prevent aggregation, which can alter spectral properties [32].
- FT-IR Considerations: Solvent selection is even more critical for FT-IR, as strong absorption bands from the solvent can overlap with analyte signals. Deuterated solvents (e.g., CDCl₃) are often used for their transparency in key regions of the mid-IR spectrum [1].
Table 2: The Scientist's Toolkit: Essential Reagents and Materials
| Item | Function | Technique |
|---|---|---|
| High-Purity Nitric Acid | Primary diluent and digesting acid; stabilizes metal ions in solution. | ICP-MS |
| PTFE Syringe Filters (0.45 μm, 0.2 μm) | Removes suspended particles to protect nebulizers and ensure optical clarity. | ICP-MS, UV-Vis |
| Quartz Cuvettes | Holds liquid sample; quartz is transparent across UV and visible wavelengths. | UV-Vis |
| HPLC-Grade Solvents | High-purity solvents with known UV-cutoff; minimize background interference. | UV-Vis |
| Internal Standard Solution | Added to correct for instrument drift and matrix suppression/enhancement. | ICP-MS |
| Certified Single/Multi-Element Standards | Used for instrument calibration and quality control. | ICP-MS |
Experimental Workflows and Protocols
Detailed Protocol: Preparation of a Liquid Sample for ICP-MS
The following workflow outlines the standard preparation of a liquid sample, such as a digested tissue or water sample, for ICP-MS analysis.
Diagram 1: ICP-MS Liquid Sample Prep
Step-by-Step Procedure:
- Dilution: Precisely pipette an aliquot of the sample into a pre-cleaned vial or volumetric flask. Dilute with high-purity water (e.g., 18 MΩ·cm) to achieve a TDS content of less than 0.2%. The dilution factor should be determined based on the sample's known or estimated solids content [33] [14].
- Internal Standard Addition: Add a known concentration of an internal standard solution (e.g., Indium, Germanium, or other elements not present in the sample) to the diluted sample. This corrects for signal drift and matrix effects during analysis [33].
- Filtration: Using a disposable syringe, draw up the diluted sample and pass it through a 0.45 μm PTFE membrane filter into a clean vial. For challenging matrices, a 0.2 μm filter may be used [1].
- Acidification and Matrix Matching: Ensure the final solution is in a matrix of ~2% high-purity nitric acid. If the dilution did not achieve this, add the requisite volume of concentrated acid. All calibration standards and quality control samples must be prepared in the same acid matrix to ensure accuracy [33].
Detailed Protocol: Preparing a Solution Sample for UV-Vis Spectroscopy
This protocol describes the preparation of a standard solution for UV-Vis absorbance measurement, a common practice for characterizing molecular properties.
Diagram 2: UV-Vis Solution Sample Prep
Step-by-Step Procedure:
- Solvent Selection: Choose a solvent that completely dissolves your sample and has a UV-cutoff wavelength below the lowest wavelength you intend to measure [32].
- Dissolution and Concentration Optimization: Dissolve an accurately weighed amount of sample in the solvent. The concentration should be optimized so that the measured absorbance for the peaks of interest falls between 0.1 and 1.0. This may require iterative testing of different concentrations [32].
- Filtration: Filter the solution through a 0.45 μm or 0.2 μm syringe filter (compatible with the solvent) to remove any undissolved particles that could cause light scattering [32].
- Cuvette Preparation: Rinse a clean quartz cuvette with the pure solvent to be used, then fill it with the filtered sample solution.
- Blank Measurement: Fill a matched quartz cuvette with the pure, filtered solvent. This "blank" cuvette is used to zero the instrument, accounting for any absorbance from the solvent or cuvette itself, ensuring the sample measurement is accurate [32].
The path to precise and accurate spectroscopic data is paved long before a sample is run. For both ICP-MS and UV-Vis, the mastery of liquid handling—through calculated dilution, rigorous filtration, and judicious solvent selection—is not a supplementary skill but a core competency. These procedures directly control key analytical parameters: the stability of the plasma, the signal-to-noise ratio of a mass spectrometer, the adherence to the Beer-Lambert law, and the clarity of a molecular spectrum. By embedding these robust, technique-specific preparation protocols into their standard operating procedures, researchers and analysts can dramatically reduce the high proportion of errors attributed to poor sample preparation, thereby ensuring the integrity of their data and the validity of their scientific and quality control conclusions.
In modern analytical science, the quality of sample preparation is a critical determinant of the reliability, accuracy, and reproducibility of spectroscopic results. This technical guide explores two specialized domains where advanced preparation workflows are transforming data outcomes: automated systems for Clinical Therapeutic Drug Monitoring (TDM) and high-throughput approaches for comprehensive lipid profiling. The fundamental thesis connecting these applications is that sample preparation is not merely a preliminary step but an integral component of the analytical pipeline that directly influences spectroscopic data quality, affecting everything from detection sensitivity and dynamic range to quantitative accuracy and throughput. As spectroscopic technologies continue to evolve toward greater sensitivity and miniaturization, sample preparation methodologies must correspondingly advance to address matrix complexities, minimize interference, and enable the full potential of these analytical platforms [35] [36] [37].
Automated Sample Preparation for Clinical Therapeutic Drug Monitoring
The Integrated Automated Workflow
Clinical Therapeutic Drug Monitoring requires precise quantification of drug concentrations in biological matrices to optimize dosage regimens, particularly for drugs with narrow therapeutic windows. Traditional sample preparation methods for TDM often involve multi-step, offline processes that introduce variability and limit throughput. Recent advancements have focused on developing fully integrated systems that automate the entire workflow from sample to analysis.
A leading example is the integrated miniature Blood Processing and Mass Spectrometry analysis system (imBPMS). This system combines three key components: an automated magnetic solid-phase extraction (MSPE) module for sample pretreatment, a self-aspiration sampling miniature mass spectrometer for detection, and deep learning algorithms for automated quantitative analysis. The system achieves full automation from sample preparation to detection, enabling analysis of serum psychoactive drugs with a 15-second MS acquisition and 8-sample parallel processing within 30 minutes (including pretreatment time) [35].
The magnetic solid-phase extraction utilizes magnetic nanoparticles with specific affinity for target analytes, effectively removing matrix interferences and enriching analytes while minimizing serum matrix effects. Compared to conventional SPE, magnetic particles allow rapid separation and elution via magnetic force, eliminating the need for column packing and facilitating integration into automated systems. When validated for psychoactive drugs including venlafaxine, desvenlafaxine, risperidone, and 9-hydroxyrisperidone, this automated approach demonstrated strong concordance with conventional LC-MS/MS methods [35].
Quantitative Performance of Automated TDM Systems
The implementation of automated sample preparation and analysis systems for TDM has demonstrated significant improvements in analytical performance metrics compared to traditional methods. The table below summarizes key performance data from recent implementations:
Table 1: Performance Metrics of Automated TDM Systems
| Performance Parameter | imBPMS System [35] | Automated LC-MS/MS System [38] | Traditional Manual Methods |
|---|---|---|---|
| Sample Throughput | 8 samples/30 minutes | 24/7 operation with online sample prep | 4-8 hours for similar batch |
| Identification Accuracy | >98% | Not specified | Highly variable |
| Correlation Coefficient (R²) | >0.99 | >0.99 for validated assays | Typically 0.95-0.99 |
| Relative Standard Deviation | <10% | <15% for most analytes | 10-20% |
| Analytical Range | Clinically relevant ranges | 165 analytes simultaneously | Limited multiplexing |
| Peak Area Prediction Deviation | <0.2% | Not specified | Manual integration variable |
The integration of U-net deep learning algorithms for peak area recognition has been particularly impactful, achieving less than 0.2% area prediction deviation while eliminating manual data processing bottlenecks. This automated quantitative analysis showed high correlation coefficients (>0.99) across medically relevant ranges, supported by relative standard deviation <10% and average back-calculated accuracy deviation <3.5% [35].
Commercial implementations of similar principles include the CLAM-2040 clinical laboratory automation module connected to LC-MS/MS systems, enabling fully automated measurement of hundreds of compounds using multiparametric methods. Such systems demonstrate long-term calibration stability and robustness for antibiotics, antiepileptics, antidepressants, antimycotics, and direct oral anticoagulants [38].
High-Throughput Lipid Profiling Workflows
Comprehensive Lipid Extraction and Analysis
Lipidomics presents unique sample preparation challenges due to the extraordinary chemical diversity of lipid species, wide dynamic range of concentrations, and structural complexity. High-throughput lipid profiling requires extraction methods that efficiently recover both polar and non-polar lipid classes while minimizing degradation and artifact formation.
An optimized high-throughput protocol for comprehensive metabolomic and lipidomic profiling of brain tissue exemplifies modern approaches. This workflow employs a single-step extraction using methyl tert-butyl ether (MTBE)/methanol/water solvent system (3:1:1.5 ratio) that simultaneously recovers polar metabolites, lipids, and proteins from minimal tissue input (10 mg). The upper phase contains polar and mid-polar metabolites for GC-MS and LC-qTOF-MS analyses, while the lower lipid-containing phase is dedicated to LC-qTOF-MS lipidomic profiling [37].
The critical innovation in this approach is the application of Design of Experiments (DoE) methodology to systematically optimize multiple extraction parameters rather than using traditional one-variable-at-a-time (OVAT) approaches. This enables researchers to understand interaction effects between factors such as solvent composition, extraction time, temperature, and tissue-to-solvent ratios, leading to more robust and reproducible extraction efficiency across diverse lipid classes [37].
For plant lipid profiling, an effective workflow involves tissue homogenization by cryo-milling with 2-propanol containing 0.01% butylated hydroxy toluene (BHT), followed by incubation at 75°C for 15 minutes. Subsequently, a mixture of chloroform/methanol/water (30:41.5:3.5, v/v/v) is added, and samples are incubated at 25°C for 24 hours with constant shaking. The supernatant is then separated, dried in a vacuum concentrator, and reconstituted in butanol/methanol (1:1, v/v) with 10 mM ammonium acetate for LC-MS analysis [39].
Analytical and Data Processing Workflow
The integration of advanced data acquisition strategies with sophisticated bioinformatics tools represents a critical component of modern high-throughput lipidomics. The typical workflow for untargeted plant lipid profiling demonstrates this integrated approach:
Data-independent acquisition (SWATH) on tripleTOF mass spectrometry systems enables comprehensive lipid coverage by acquiring both MS and MS/MS spectra for all detectable species. Subsequent processing with MS-DIAL software allows for peak detection, alignment, and lipid identification based on accurate mass, retention time, and MS/MS spectral matching against in silico predicted libraries. In a recent study profiling Arabidopsis thaliana tissues, this approach identified 779 molecular lipid species from 16 lipid classes, with 259 features showing significant differences between tissue types (FDR-adjusted p-value <0.05) [39].
Statistical analysis using platforms like MetaboAnalyst provides multivariate analysis including principal component analysis (PCA), heat maps, and dendrograms to visualize lipid profile differences between sample groups. This integrated workflow from extraction to data analysis enables researchers to track developmental lipid changes and tissue-specific differences with high confidence [39].
Critical Considerations in Sample Preparation Strategy
Impact of Preparation Methods on Analytical Results
Sample preparation strategies directly influence spectroscopic outcomes through multiple mechanisms, including extraction efficiency, matrix effects, and analyte stability. Understanding these relationships is essential for developing robust analytical methods.
Recent research on single particle ICP-MS analysis of natural nanoparticles demonstrates how dramatically preparation methods can impact results. Studies showed that common preparation strategies like syringe filtration or ultra-centrifugation led to recovery losses of at least 90% for both naturally formed and synthetic nanoparticles in complex matrices. The addition of surfactants like Triton X-100 improved relative particle recoveries by up to 30% for spiked gold nanoparticles, but extracted iron-containing particles continued to have losses of up to 99% [36]. These findings highlight that conventional sample preparation approaches may introduce substantial quantitative errors in nanoparticle analysis by selectively excluding certain particle populations.
In tissue-based omics studies, the choice of extraction solvent significantly influences metabolome and lipidome coverage. Methodical optimization using DoE approaches has demonstrated that solvent systems with different polarities selectively extract distinct molecular classes. For comprehensive coverage, balanced solvent systems like MTBE/methanol/water provide the broadest coverage of both polar metabolites and non-polar lipids, outperforming single-solvent approaches [37].
Automation Technologies for Enhanced Reproducibility
Automated sample preparation systems address key challenges in both clinical TDM and lipid profiling by improving reproducibility, reducing manual labor, and enabling higher throughput. In proteomics and lipidomics, technologies like the in-StageTip (iST) workflow have reduced preparation time from approximately 48 hours to just 2 hours while processing up to 96 samples per batch with excellent reproducibility [40].
For biofluid analysis, technologies like ENRICH utilize paramagnetic bead-based enrichment to compress the dynamic range of protein concentrations, enabling an 8-fold increase in protein identifications from plasma with median coefficients of variation below 14%. This approach is particularly valuable for biomarker discovery where low-abundance species are often of greatest biological significance but most challenging to detect reproducibly [40].
Fully automated systems such as the CLAM-2040 connected to LC-MS/MS platforms enable 24/7 operation with minimal manual intervention, facilitating the implementation of complex multiparametric methods in routine clinical practice. Such systems demonstrate that integration of automated sample preparation directly with analytical instrumentation significantly enhances overall method robustness and reliability [38].
Essential Research Reagents and Materials
The effectiveness of specialized preparation workflows depends critically on the selection of appropriate reagents and materials. The following table details key components used in the workflows discussed in this guide:
Table 2: Essential Research Reagents for Automated Sample Preparation
| Reagent/Material | Application | Function | Example Specifications |
|---|---|---|---|
| C18 Magnetic Nanoparticles | Automated MSPE for TDM | Selective extraction of target analytes from serum | Specific affinity for psychoactive drugs [35] |
| MTBE/Methanol/Water Solvent System | Lipidomic extraction | Simultaneous extraction of polar metabolites and lipids | 3:1:1.5 ratio for brain tissue [37] |
| Butylated Hydroxy Toluene (BHT) | Plant lipid extraction | Antioxidant to prevent lipid oxidation during processing | 0.01% in 2-propanol for tissue homogenization [39] |
| MSTFA + 1% TMCS | GC-MS metabolomics | Silylation derivatization for volatile compound analysis | 20 µL, 40°C for 60 min [37] |
| Paramagnetic Beads (ENRICH) | Plasma proteomics/lipidomics | Dynamic range compression for enhanced biomarker detection | 8x increase in protein identifications [40] |
| Ammonium Formate | LC-MS mobile phase | Volatile buffer for improved ionization efficiency | 10 mM in butanol/methanol (1:1) [39] |
Specialized workflows for automated sample preparation in Clinical TDM and high-throughput lipid profiling demonstrate how strategic approaches to this critical pre-analytical phase directly enhance spectroscopic data quality. The integration of automation technologies, advanced materials like magnetic nanoparticles, and sophisticated data processing algorithms has transformed sample preparation from a bottleneck to an enabler of high-quality analytical results. As spectroscopic technologies continue to advance toward greater sensitivity, miniaturization, and throughput, corresponding innovations in sample preparation methodologies will remain essential for realizing their full potential in both clinical and research applications. The fundamental principle connecting these diverse applications is that sample preparation is not merely a preliminary step but an integral component of the analytical pipeline that must be carefully optimized and validated for each specific application to ensure data reliability and biological relevance.
Preparation Strategies for Complex Matrices like Humic Substances
The validity of spectroscopic analysis is fundamentally dependent on the integrity of sample preparation. Inadequate sample preparation is, in fact, the cause of approximately 60% of all spectroscopic analytical errors [1]. This is particularly critical when dealing with complex, heterogeneous matrices such as humic substances, where the preparation strategy directly influences the observable chemical structure and properties. The core thesis of this guide is that without meticulous, technique-specific preparation, even the most advanced spectroscopic instrumentation will yield misleading data, compromising research conclusions and undermining the reliability of scientific findings [1]. The physical and chemical manipulations performed during sample preparation—from grinding and extraction to filtration and dilution—directly alter the sample's homogeneity, surface characteristics, and molecular integrity, thereby dictating how it interacts with electromagnetic radiation during analysis [1].
Core Principles: The Link Between Preparation and Analytical Results
Sample preparation exerts its influence on spectroscopic outcomes through several key mechanisms. Firstly, surface and particle characteristics govern how radiation interacts with the sample; rough surfaces scatter light randomly, while uniform particle size ensures consistent interaction [1]. Secondly, matrix effects occur when other sample components absorb or enhance spectral signals, thereby obscuring the target analyte's response. Proper preparation techniques, such as extraction or dilution, are designed to remove these interferences [1]. Finally, homogeneity is a non-negotiable prerequisite for representative sampling. Heterogeneous samples produce non-reproducible results because the analyzed portion may not represent the whole [1]. Grinding and milling are therefore essential for achieving the homogeneity required for reliable data.
The choice of preparation protocol is also an active variable in the experiment. This is powerfully illustrated in humic substance research, where the selection of an alkaline extractant does not merely increase yield, but directly and measurably alters the apparent chemical structure of the extracted humic acids, influencing parameters such as aromaticity and functional group content [41]. Consequently, the preparation strategy must be considered an integral part of the experimental design, not merely a preliminary step.
Experimental Protocols for Humic Substances
Alkaline Extraction and Acid Precipitation of Peat Humic Acids
This protocol, adapted from a 2024 spectroscopic study, details the extraction of humic acids from herbaceous peat using various alkaline extractants, enabling a comparative analysis of their effects on the resulting humic acid structure [41].
Materials and Reagents:
- Herbaceous peat (mechanically powdered to a particle size of 0.15 mm)
- Extractants: 5% (w/v) solutions of NH₃·H₂O, Na₂CO₃, NaHCO₃, and Na₂SO₃
- 5% (w/v) NaOH solution
- 5% (w/v) H₂SO₄ solution
- Humic acid standard (chromatographically pure)
- Potassium dichromate (K₂Cr₂O₇), ferrous ammonium sulfate, phenanthroline indicator
Procedure:
- Sample Preparation: Weigh 20.0000 g of powdered peat into a beaker.
- Alkaline Extraction: Add 80.00 mL of the selected 5% extractant (NH₃·H₂O, Na₂CO₃, NaHCO₃, or Na₂SO₃). Immerse the peat powder for 24 hours.
- Digestion: Add distilled water at a solid-liquid ratio of 1:20 (g/mL). Adjust the pH to 10–12 using 5% NaOH. Stir the mixture for 2 hours at 80°C.
- Separation: Collect the supernatant by centrifugation.
- Acid Precipitation: Adjust the pH of the supernatant to 2 using 5% H₂SO₄. This precipitates the humic acids.
- Collection: Collect the sediment (the precipitated humic acid) and dry it in an oven at 80°C to obtain the final product, denoted as NH₃·H₂O−P, Na₂CO₃−P, etc., based on the extractant used [41].
Quantification of Humic Acid Content and Yield: The content and yield of humic acid are determined via oxidation-titration.
- Dissolve 0.2000 g of the extracted humic acid in 100 mL of 1% NaOH.
- Pipette 5.00 mL of this solution into a conical flask. Add 5.00 mL of 0.4 mol/L potassium dichromate and 15.00 mL of concentrated sulfuric acid.
- Heat the flask in a water bath at 100°C for 30 minutes for oxidation, then cool to room temperature.
- Add three drops of phenanthroline indicator and titrate with standard ferrous ammonium sulfate solution until the color changes from orange to brick red. Conduct a control experiment simultaneously.
- Calculate the humic acid content (A, %) and yield (B, %) using the following equations [41]:
Humic Acid Content, A (%) = { [ (V₀ - V₁) × N × 0.003 × 0.58 ] / (G × (Vb/Va)) } × 100 Where: V₀ = titrant volume for control (mL); V₁ = titrant volume for sample (mL); N = concentration of ferrous ammonium sulfate (mol/L); 0.003 = carbon milligram equivalent (g); 0.58 = PHA carbon ratio conversion factor; G = sample weight (g); Va = total volume of humic acid solution (mL); Vb = volume of solution used in titration (mL).
Humic Acid Yield, B (%) = (m × A) / M Where: m = weight of extracted humic acid (g); A = humic acid content (%); M = weight of original peat sample (g).
Spectroscopic Characterization of Extracted Humic Acids
UV-Vis Spectroscopy:
- Sample Prep: Dissolve 0.0100 g of humic acid in 100 mL of a 100 mg/L NaHCO₃ solution. Adjust the pH to 8 using 1% HCl or 0.1 mol/L NaOH [41].
- Analysis: Scan from 200 to 800 nm using a UV-Vis spectrophotometer (e.g., Agilent Cary 5000). Record absorbances at 265 nm (E₂) and 465 nm (E₄). The E₄/E₆ ratio (A₄₆₅/A₆₆₅) can provide insights into molecular weight and degree of humification [41].
Fourier Transform Infrared (FT-IR) Spectroscopy:
- Sample Prep: Use approximately 1 mg of humic acid for analysis in the FT-IR spectrometer (e.g., PerkinElmer Spectrum 3) [41].
- Analysis: Obtain the infrared spectrum across 4000–400 cm⁻¹. Analyze the peak areas to infer the relative content of functional groups (e.g., carboxylic, aliphatic, aromatic) [41].
Fluorescence Spectroscopy:
- Sample Prep: Use the same solution prepared for UV-Vis analysis.
- Analysis: Place the solution in a fluorescence spectrometer (e.g., PerkinElmer LS55). Set the excitation wavelength to 274 nm and scan the emission range from 275–650 nm. Use a scanning speed of 1000 nm/min, with both excitation and emission slit widths set to 8 nm [41].
Quantitative Data and Comparative Analysis
The following tables consolidate quantitative results from the cited research on humic substances, allowing for direct comparison of the effectiveness of different preparation strategies.
Table 1: Impact of Extractant on Humic Acid Yield and Content from Herbaceous Peat [41]
| Extractant | Humic Acid Yield (%) | Humic Acid Content (%) |
|---|---|---|
| Na₂SO₃ | 43.41 | Not Specified |
| Na₂CO₃ | 32.67 | 66.20 |
| NaHCO₃ | 31.18 | Not Specified |
| NH₃·H₂O | 29.22 | Not Specified |
Table 2: Structural Properties of Humic Acids Isolated with Different Extractants [41]
| Extractant | Aromaticity | Key Functional Group Characteristics |
|---|---|---|
| NH₃·H₂O | Highest | Highest aromaticity among the extractants tested. |
| Na₂CO₃ | Lowest | Highest number of carboxylic acids; lowest degree of aromatic polymerization. |
| NaHCO₃ | Lowest | Highest proportion of aliphatic ethers. |
| Na₂SO₃ | Moderate | Higher number of hydroxyl groups. |
Table 3: Particle Recovery from Sample Preparation for SP ICP-MS Analysis [42]
| Sample Preparation Strategy | Recovery of Spiked Au Nanoparticles | Recovery of Natural Fe-Containing Particles |
|---|---|---|
| Filtration or Centrifugation | <10% (≥90% loss) | <1% (≥99% loss) |
| Addition of Surfactant (Triton X-100) | Up to 30% | ~1% (up to 99% loss) |
Visualization of Workflows
Humic Acid Extraction and Characterization
Preparation Influence on Spectral Data
The Scientist's Toolkit: Essential Research Reagents and Materials
Table 4: Key Reagents and Materials for Humic Substance Preparation and Analysis
| Reagent/Material | Function in Preparation/Analysis |
|---|---|
| Alkaline Extractants (NaOH, Na₂CO₃, NH₃·H₂O) | Solubilize humic substances from solid matrices like peat or soil by deprotonating acidic functional groups [41]. |
| Acids for Precipitation (H₂SO₄, HCl) | Protonate humic acids in the alkaline extract, causing them to precipitate for isolation and purification [41]. |
| FT-IR Grinding Aid (KBr) | Mixed with solid samples to create transparent pellets for transmission Fourier Transform Infrared spectroscopy [1]. |
| Surfactants (Triton X-100) | Added to suspensions to stabilize nanoparticles and improve recovery in techniques like SP ICP-MS by reducing adhesion to surfaces [42]. |
| Syringe Filters (various pore sizes) | Remove large particles from liquid samples to prevent instrument blockages, though they can cause significant loss of nano- and microparticles [42]. |
| Lithium Tetraborate Flux | Used in fusion techniques for XRF to fully dissolve refractory materials into homogeneous glass disks, eliminating mineral and particle size effects [1]. |
The preparation of complex matrices for spectroscopic analysis is a critical determinant of data quality and scientific insight. As demonstrated in the study of humic substances, the choice of extractant directly defines the apparent chemical structure of the isolated material, influencing conclusions about aromaticity, functional groups, and bioactivity [41]. Furthermore, common physical preparation steps like filtration can catastrophically impact particle-based analysis, with losses exceeding 99% for natural Fe-containing particles [42]. Therefore, the preparation protocol must be designed with the same rigor as the analytical measurement itself, as it is an integral and decisive part of the scientific investigation.
Optimizing Your Workflow: Strategies to Overcome Common Preparation Pitfalls
In analytical research, particularly in spectroscopy, the integrity of results is fundamentally determined at the sample preparation stage. Contamination introduced during this phase can systematically skew data, compromise detection limits, and invalidate scientific conclusions. This technical guide examines two critical pillars of contamination control: the implementation of in-house acid purification to ensure reagent purity and the application of automated, in-situ cleaning verification to guarantee surface integrity. Within the context of spectroscopic analysis, where instruments are exceptionally sensitive to trace interferents, controlling these variables is not merely a best practice but a foundational requirement for generating reliable, reproducible data. The protocols and data presented herein provide researchers and drug development professionals with a framework to significantly enhance analytical accuracy by addressing contamination at its source.
The Impact of Sample Preparation on Spectroscopic Data Quality
Sample preparation is the most vulnerable stage in the analytical workflow for introducing errors. Studies indicate that approximately 75% of laboratory errors originate in the pre-analytical phase, often due to improper handling, contamination, or suboptimal sample collection [43]. In spectroscopic applications, these contaminants introduce unwanted variables that interfere with true analytical signals, leading to several critical issues:
- Altered Results: Contaminants can mask the presence of target analytes or produce false positives. This is especially problematic in fields like clinical diagnostics and drug development, where accuracy is paramount [43].
- Reduced Sensitivity: The presence of contaminants can diminish the sensitivity of analytical methods, preventing the detection of target analytes at low concentrations. In trace element analysis using ICP-MS, for instance, even minute amounts of contaminants can overshadow the elements of interest [44].
- Compromised Reproducibility: Contamination introduces uncontrolled variables, making it exceptionally difficult to reproduce results across experimental batches, thereby undermining the reliability of research findings [43].
The relationship between sample preparation and spectroscopic outcomes creates a feedback loop where preparatory purity directly dictates analytical fidelity. For example, in infrared spectroscopy used for cleaning verification, the detection of active pharmaceutical ingredients (APIs) on surfaces is only reliable when the reagents and surfaces used in validation are themselves free of interfering contaminants [45].
In-House Acid Purification Systems
The Critical Need for High-Purity Acids
The use of high-purity acids is non-negotiable for trace metal analysis in techniques such as Inductively Coupled Plasma-Mass Spectrometry (ICP-MS) and Optical Emission Spectrometry (OES). Common laboratory acids often contain trace metal impurities at concentrations that can significantly exceed the levels researchers intend to measure, leading to false positives and elevated baselines.
A primary source of contamination is glass containers. Glass is a poor choice for storing acids used in inorganic analysis because it can leach metals such as sodium, potassium, calcium, boron, and aluminum into the solvent [44]. Murphy, Knapp, and Dulski have historically emphasized the need to avoid glass during sample preparation for accurate trace element analysis [44]. For most metals, this practice is essential; however, mercury is a notable exception. Glass tends to have very low inherent mercury concentrations, making it suitable for storing mercury standards, provided it is the lone analyte [44].
System Design and Implementation
Implementing an in-house acid purification system involves distilling analytical-grade acids to achieve "ultrahigh purity" grades suitable for the most sensitive applications.
- Acid Selection: Purchase acids in fluoropolymer bottles (PFA or FEP) or less expensive intermediate purity grades in polyethylene or polypropylene containers. Acids supplied in glass containers should be avoided entirely for trace metals work [44].
- Distillation Apparatus: Utilize double-distillation systems constructed from PFA or high-purity quartz. These materials prevent the introduction of inorganic contaminants during the purification process. Vendors offer specialized stills designed for this purpose.
- Economic Justification: While requiring capital investment, in-house distillation systems can prove cost-effective. Depending on a laboratory's acid consumption, these stills can pay for themselves through savings on pre-purified ultrahigh purity acids within approximately one year [44].
Table 1: Comparison of Acid Container Materials for Trace Metal Analysis
| Material | Advantages | Disadvantages | Suitability for Trace Metal Analysis |
|---|---|---|---|
| PFA/FEP Fluoropolymer | Extremely low leachability of metals, inert | Higher cost | Excellent |
| Polyethylene/Polypropylene | Lower cost than fluoropolymer, low metal content | May be more permeable than fluoropolymer | Good for intermediate purity |
| Glass | Low mercury content, inexpensive | Leaches many other metal ions | Poor (except for mercury-only analysis) |
Dispensing Purified Acids
The dispensing process is as critical as the purification. Bottle-top dispensers must be selected with care:
- Use dispensers with a fully fluoropolymer liquid path.
- Avoid dispensers with glass parts or platinum-coated valve balls, as the platinum coating can leach multiple metal impurities into the ultra-pure acid [44].
- Always rinse dispensers thoroughly with the purified acid they will be dispensing before use.
Automated and In-Situ Cleaning Verification
Limitations of Traditional Cleaning Methods
In pharmaceutical manufacturing and research, verifying the cleanliness of equipment is mandatory to prevent cross-contamination and adulteration. The traditional method involves:
- Swabbing the equipment surface.
- Extracting the analyte from the swab.
- Analyzing the extract using High-Performance Liquid Chromatography (HPLC).
This process is fraught with drawbacks, including incomplete analyte recovery from the surface, potential cross-contamination during handling, and, most significantly, it can result in up to two days of lost production time [45].
Mid-IR Grazing-Angle Fiber Optics for In-Situ Verification
Fourier Transform-Infrared (FT-IR) spectroscopy with a mid-IR grazing-angle fiber optics probe presents a powerful alternative for automated, in-situ cleaning verification [45].
- Principle of Operation: The probe head is configured to deliver a mid-IR beam to the sample surface at a grazing angle (approximately 80° from normal). This maximizes the distance the IR beam travels through any residual surface layer before returning to a Mercury-Cadmium-Telluride (MCT) detector. This geometry enhances sensitivity by several-fold compared to conventional reflectance methods [45].
- Detection Capabilities: This technique can reliably measure organic contaminants on metal surfaces at loadings below 1 µg/cm². It can quantitatively analyze Active Pharmaceutical Ingredients (APIs), both as neat compounds and in the presence of excipients, with concentrations above 0.3 µg/cm² [45].
- Calibration: The system is calibrated using Partial Least Squares (PLS) regression on spectra collected from metal coupons (e.g., polished stainless steel) spiked with known amounts of the target analyte, typically applied via a spray technique for consistency [45].
Table 2: Quantitative Performance of Mid-IR Cleaning Verification for Select Compounds
| Compound | Matrix | Quantifiable Range (µg/cm²) | Key Performance Metric |
|---|---|---|---|
| Compound 1 | Neat API | > 0.4 | Nearly quantitative recovery above this level [45] |
| Compound A | Neat API | > 0.3 | Quantitative determination possible [45] |
| Compound A | API with Excipients | > 0.3 | Quantitative determination possible [45] |
| Compound AE | Neat API | 0.3 - 1.12 | Predicted values from mid-IR in good agreement with HPLC [45] |
Experimental Protocol: In-Situ Cleaning Verification
Objective: To verify the removal of a specific Active Pharmaceutical Ingredient (API) from manufacturing equipment surfaces using a mid-IR grazing-angle fiber optics probe.
Materials and Equipment:
- FT-IR spectrometer with mid-IR capability.
- Remspec SpotView mid-IR grazing-angle probe and MCT detector.
- Polished stainless steel coupons (e.g., 4" x 4").
- Standard solutions of the target API in methanol.
- Opus 5.0 or similar spectroscopy software with Quant 2 package for PLS regression.
Methodology:
- Background Collection: Collect a background spectrum using a clean, validated metal coupon.
- Calibration Model Development:
- Prepare standard solutions of the API and apply them evenly onto metal coupons using a spray technique to ensure homogeneity.
- Air-dry the coupons.
- Collect spectra from at least six different locations on each coupon at 6 cm⁻¹ resolution using 100 scans.
- Determine the "true" surface concentration via HPLC analysis of washings.
- Use the software's PLS algorithm to build a calibration model correlating spectral features to API surface concentration.
- In-Situ Measurement:
- Bring the calibrated probe to the equipment surface.
- Collect spectra from multiple predetermined locations.
- Use the calibration model to predict the API concentration in real-time.
- Acceptance Criteria: A surface is considered clean when the predicted API concentration is below a pre-defined threshold (e.g., 0.1 - 0.3 µg/cm², based on compound-specific toxicology).
Integrated Workflow for Contamination Control
The following diagram illustrates the logical workflow integrating in-house acid purification and automated cleaning verification to ensure spectroscopic data integrity.
The Researcher's Toolkit: Essential Reagent Solutions
Successful implementation of advanced contamination control strategies requires specific materials and reagents. The following table details key solutions for in-house preparation.
Table 3: Key Research Reagent Solutions for Contamination Control
| Reagent/Material | Function | Key Components / Properties | Application Notes |
|---|---|---|---|
| Ultrahigh Purity Acid | Sample digestion/dilution for trace metal analysis | Double-distilled in PFA/quartz; stored in fluoropolymer bottles | Essential for ICP-MS/OES to prevent false positives [44] |
| Lysis Buffer (for RNA) | Viral RNA purification from complex matrices | 4 M guanidinium thiocyanate, 55 mM Tris-HCl, 25 mM EDTA, 3% Triton X-100 [46] | Component of in-house RNA purification protocol as an alternative to commercial kits |
| Wash Buffer I (for RNA) | Initial column wash | 20% Ethanol, 1 M GITC, 10 mM Tris-HCl pH 7.5 [46] | Removes contaminants while keeping RNA bound to silica matrix |
| Wash Buffer II (for RNA) | Final column wash | 80% Ethanol, 100 mM NaCl, 10 mM Tris-HCl pH 7.5 [46] | Desalting step prior to RNA elution |
| LPA Carrier | Carrier for nucleic acid precipitation | Linearized Polyacrylamide [46] | Inexpensive, effective alternative to commercial carriers (e.g., poly A) |
| PCR Buffer (in-house) | Optimized amplification | Specific composition optimized for Pfu-Sso7d polymerase [47] | Can outperform commercial buffers, reducing costs for high-throughput labs |
| Surface Decontamination Solution | Eliminate residual analytes from surfaces | e.g., DNA Away, 5-10% bleach, 70% ethanol [43] | Critical for maintaining DNA/RNA-free workstations and preventing amplicon contamination |
The pursuit of unimpeachable spectroscopic data demands rigorous control over the entire sample preparation environment. The implementation of in-house acid purification directly addresses the vulnerability of introduced contaminants from reagents, while automated, in-situ cleaning verification with advanced spectroscopic probes ensures the integrity of surfaces and equipment. Together, these strategies form a robust defense against the primary sources of pre-analytical error. By adopting these protocols, researchers and pharmaceutical development professionals can significantly enhance the sensitivity, accuracy, and reproducibility of their analytical results, thereby strengthening the foundation of scientific discovery and product quality assurance.
In the realm of analytical spectroscopy, the interplay between sample preparation and spectroscopic results represents a fundamental principle that directly impacts research validity. Attenuated Total Reflection Fourier Transform Infrared (ATR-FTIR) spectroscopy has emerged as a cornerstone technique in pharmaceutical and materials science due to its rapid analysis capabilities, minimal sample preparation requirements, and non-destructive nature [48] [49]. However, these apparent advantages can be misleading without rigorous standardization, as subtle variations in protocol can introduce significant inter-assay variation that compromises data integrity and reproducibility.
The foundation of reliable spectroscopic research lies in recognizing that every step of the analytical process—from instrument calibration to sample presentation—contributes to the final spectral output. This technical guide provides a comprehensive framework for developing standardized ATR-FTIR protocols specifically designed to minimize inter-assay variation, with particular emphasis on how sample preparation methodologies directly influence spectroscopic outcomes. By establishing robust, reproducible procedures, researchers and drug development professionals can ensure the generation of high-quality, comparable data across experiments, instruments, and laboratories.
Core Mechanism of ATR-FTIR Spectroscopy
ATR-FTIR spectroscopy operates on the principle of generating an evanescent wave that extends beyond the surface of an internal reflection element (IRE) crystal—typically diamond, zinc selenide, or germanium—when infrared radiation undergoes total internal reflection within this crystal. A sample placed in intimate contact with the IRE surface interacts with this evanescent wave, resulting in wavelength-dependent absorption that generates a unique molecular "fingerprint" based on vibrational modes of chemical bonds [50] [49]. The depth of penetration of this evanescent wave, typically between 0.5-2 micrometers, depends on the wavelength of light, the refractive indices of both the crystal and sample, and the angle of incident light [51]. This surface-sensitive nature makes ATR-FTIR particularly susceptible to variations in sample preparation and presentation, as the technique predominantly interrogates the sample region immediately adjacent to the crystal surface.
Multiple technical factors contribute to variability in ATR-FTIR results, each requiring specific control measures:
- Sample-Crystal Contact Quality: Inconsistent pressure application leads to variations in the intimacy of sample-crystal contact, directly affecting spectral intensity and band shapes [51].
- Crystal Contamination: Residual sample materials from previous measurements create interference in background and subsequent sample spectra, manifested as negative peaks or extraneous bands [51].
- Environmental Fluctuations: Variations in laboratory temperature and humidity can affect instrument stability, particularly interferometer alignment, and certain hygroscopic samples [51].
- Spatial Heterogeneity: For non-homogeneous samples, positioning differences between measurements can yield different spectral profiles due to localized chemical variations [51].
- Operator Technique: Inconsistent sample loading, cleaning procedures, and background collection frequency introduce person-to-person and run-to-run variability [51].
- Surface vs. Bulk Composition: For materials with surface migration potential (e.g., plastics with migrating plasticizers), spectra may not represent bulk composition without standardized surface preparation [51].
Standardized Experimental Protocols for Reproducible ATR-FTIR Analysis
Comprehensive Instrument Qualification and Calibration
Robust ATR-FTIR analysis begins with verified instrument performance. Daily validation should include:
- Background Collection: Collect fresh background spectra before each sample session or whenever environmental conditions change, using a thoroughly cleaned and dried ATR crystal [51].
- System Suitability Checks: Analyze a certified reference material (e.g., polystyrene film) to verify wavelength accuracy (±1 cm⁻¹ across mid-IR range) and photometric linearity.
- Signal-to-Noise Assessment: Document the peak-to-peak noise in a designated spectral region (e.g., 2200-2000 cm⁻¹) for a specified number of scans to track detector performance over time.
Table 1: Instrument Qualification Parameters and Acceptance Criteria
| Parameter | Procedure | Frequency | Acceptance Criteria |
|---|---|---|---|
| Wavelength Accuracy | Polystyrene film peak positions | Daily | 1601.8 ± 1 cm⁻¹, 1028.4 ± 1 cm⁻¹ |
| Photometric Linearity | Absorbance response of reference standards | Quarterly | R² > 0.999 for 0-1.5 AU range |
| Signal-to-Noise Ratio | Empty beam, 32 scans, 2000 cm⁻¹ | Daily | >20,000:1 (peak-to-peak) |
| Background Consistency | Consecutive background collections | Each session | Absorbance < 0.001 in fingerprint region |
Optimized Sample Preparation Methodologies
Standardized sample preparation is paramount for reproducible results, with protocols tailored to sample physical state:
- Powdered Solids: Grind samples to consistent particle size (<100 μm) using a standardized milling procedure and sieve through 100-mesh screens [52]. Apply uniform compression force (recommended: 50-70 in-lb for manual pressure cells) for consistent crystal contact.
- Solid Dosage Forms: For tablets, create homogeneous powder by crushing in a mortar and pestle for a fixed duration (e.g., 10 minutes) [48]. For direct tablet analysis, use a torque-limiting device to ensure consistent pressure application.
- Liquids and Semi-Solids: Apply consistent sample volume (typically 20-50 μL) to completely cover the crystal surface without meniscus effects. For viscous samples, use fixed-spacing applicators to control thickness.
- Surface-Sensitive Materials: For samples with potential surface-bulk differences (e.g., polymers with migrating plasticizers), implement standardized surface preparation such as microtoming at fixed thickness [51].
Spectral Acquisition Parameters
Consistent data collection parameters eliminate a significant source of inter-assay variation:
- Spectral Range: 4000-400 cm⁻¹ for comprehensive molecular fingerprinting [48] [52].
- Resolution: 4 cm⁻¹ optimal for most pharmaceutical applications, balancing spectral features and signal-to-noise [52].
- Scan Co-addition: Minimum of 32 scans per spectrum to achieve adequate signal-to-noise ratio while minimizing measurement time [52] [53].
- Apodization Function: Consistent use across all experiments (e.g., Happ-Genzel standard).
- Background Collection: Before each sample or at minimum every 30 minutes, whichever is more frequent [51].
ATR-FTIR Standardized Workflow for Reproducible Analysis
Quantitative Method Validation: Establishing Assay Parameters
For quantitative ATR-FTIR applications, method validation following ICH Q2(R1) guidelines provides the statistical framework for assessing and controlling inter-assay variation [48]. The following parameters should be established for any quantitative method:
Table 2: Method Validation Parameters for Quantitative ATR-FTIR Analysis
| Validation Parameter | Experimental Design | Acceptance Criteria | Exemplary Values from Literature |
|---|---|---|---|
| Linearity | 5-8 concentration levels in triplicate | R² > 0.995 | R² = 0.995 over 30-90% w/w range [48] |
| Accuracy | 9 determinations at 3 concentration levels | Recovery 98-102% | Recovery within 98-102% for LFX tablets [48] |
| Precision | 6 determinations at 3 concentrations | RSD < 2% | Intra-day RSD < 2% for LFX [48] |
| LOD | Based on residual standard deviation | Signal/Noise ~3:1 | 7.616% w/w for LFX quantification [48] |
| LOQ | Based on residual standard deviation | Signal/Noise ~10:1 | 23.079% w/w for LFX quantification [48] |
| Specificity | Analysis of individual components | No interference at analyte peaks | Specific spectral region 1252-1219 cm⁻¹ for LFX [48] |
Advanced Chemometric Approaches for Enhanced Reproducibility
Spectral Preprocessing for Variability Reduction
Strategic spectral preprocessing mitigates residual variation not eliminated through protocol standardization:
- Multiplicative Scatter Correction (MSC): Corrects for scaling effects and baseline shifts resulting from light scattering differences [52].
- Standard Normal Variate (SNV): Normalizes spectral amplitude variations between measurements [52].
- Derivative Spectra: First (1D) and second derivatives (2D) enhance spectral resolution and minimize baseline offsets [54] [52].
- Smoothing Algorithms: Savitzky-Golay filtering (typically 9-15 points) reduces high-frequency noise without significant spectral distortion [52].
Feature Selection and Model Optimization
For multivariate quantitative and classification applications, strategic feature selection improves model robustness:
- Manual Selection: Identification of analyte-specific spectral regions through visual inspection and band assignment [54].
- Semi-Manual Selection: Combination of statistical evaluation (e.g., PCA loadings) with spectral interpretation for variable selection [54].
- Algorithmic Selection: Employing genetic algorithms, successive projections, or interval partial least squares for automated variable selection [54].
Research demonstrates that semi-manual feature selection often produces optimal results, achieving 100% accuracy for mushroom species identification and 86.36% accuracy for geographic origin traceability [54].
The Scientist's Toolkit: Essential Materials for Reproducible ATR-FTIR
Table 3: Essential Research Reagents and Materials for ATR-FTIR Analysis
| Item | Specification | Function | Critical Quality Attributes |
|---|---|---|---|
| ATR Crystals | Diamond, ZnSe, or Ge | Internal reflection element | Refractive index, hardness, chemical resistance |
| Cleaning Solvents | HPLC-grade methanol, acetone, isopropanol | Crystal cleaning between samples | Low residue, appropriate polarity for sample removal |
| Certified Reference Materials | Polystyrene, cyclohexane | Wavelength accuracy verification | Certified peak positions, stability |
| Torque Limiting Device | Adjustable torque applicator | Consistent pressure application | Calibrated torque measurement |
| Mesh Sieves | 100-mesh (150 μm) stainless steel | Particle size standardization | Certified mesh size, non-contaminating |
| Background Quality Standards | Clean crystal validation | Verify system readiness | Absorbance <0.001 in fingerprint region |
| Microspatulas | Non-scrching material (e.g., nylon) | Sample handling and application | Chemically inert, single-use or thoroughly cleanable |
Case Study: Protocol Implementation for Pharmaceutical Quantification
The implementation of standardized ATR-FTIR protocols is exemplified by a validated method for direct quantification of Levofloxacin (LFX) in solid formulations [48]:
Experimental Protocol
- Calibration Standards: Prepared in range of 30%-90% (w/w) LFX in excipient mixture, total mass 300 mg, homogenized by thorough mixing [48].
- Spectral Acquisition: Agilent 630-ATR-FTIR with diamond ATR; 64 scans, 4 cm⁻¹ resolution, 4000-400 cm⁻¹ range [48].
- Quantitative Analysis: Chemometric model developed for specific spectral region (1252-1219 cm⁻¹) following ICH guidelines [48].
- Method Validation: Specificity confirmed through individual component analysis; LOD and LOQ determined as 7.616% w/w and 23.079% w/w respectively; precision demonstrated with <2% RSD [48].
Quantitative ATR-FTIR Method Development and Validation Workflow
Achieving reproducibility in ATR-FTIR spectroscopy requires a systematic approach that acknowledges the profound impact of sample preparation on spectroscopic results. By implementing the standardized protocols outlined in this guide—encompassing instrument qualification, sample preparation, spectral acquisition, and data processing—researchers can significantly reduce inter-assay variation and produce reliably comparable data. The integration of these practices with appropriate chemometric tools and validation frameworks establishes a foundation for spectroscopic research that truly reflects sample chemistry rather than methodological artifacts. As ATR-FTIR continues to expand its applications across pharmaceutical development, food authentication, and biomedical research, commitment to these standardization principles will remain essential for generating scientifically valid and reproducible results.
In analytical science, the accuracy of spectroscopic results is fundamentally dependent on the steps taken before the sample ever reaches the instrument. Inadequate sample preparation accounts for approximately 60% of all spectroscopic analytical errors, making it the most significant variable affecting data quality [1]. Modern laboratories face increasing pressure to deliver faster, more accurate results while managing rising costs and staffing shortages, making the optimization of preparation workflows not merely beneficial but essential for maintaining competitive and reliable operations [55].
Automation of reagent dosing, digestion, and extraction represents a paradigm shift in sample preparation, directly addressing key challenges in spectroscopic analysis. Automated systems enhance reproducibility, minimize human error, and significantly reduce exposure to hazardous materials [56] [57]. For techniques as sensitive as ICP-MS, where complete sample dissolution and precise dilution are critical, or for XRF analysis, which demands perfectly homogeneous pellets, automation provides the consistency that manual protocols struggle to achieve [1]. This technical guide examines how strategically implemented automation technologies transform preparation workflows to produce more reliable, reproducible spectroscopic data.
The Automation Imperative: From Manual Processes to Integrated Systems
Limitations of Manual Sample Preparation
Manual sample preparation is characterized by inherent variability that directly compromises analytical precision. Key issues include:
- Inconsistent reagent dosing: Slight variations in pipetting technique or timing between samples and operators.
- Poor reproducibility: Challenges in exactly replicating digestion times, temperatures, and extraction conditions across multiple batches.
- Contamination risks: Increased handling introduces opportunities for sample cross-contamination or environmental contamination [58].
- Safety hazards: Manual handling of concentrated acids and other hazardous reagents exposes technicians to significant risks [57].
Fundamental Benefits of Automation
Implementing automated solutions addresses these limitations systematically:
- Enhanced Reproducibility: Automated systems perform identical preparation protocols for every sample, critical for achieving the longitudinal consistency required in drug development and quality control environments [56].
- Improved Personnel Safety: Automated reagent dosing systems, such as the easyFILL platform, handle concentrated acids precisely, minimizing technician exposure and enhancing laboratory safety [57].
- Increased Operational Efficiency: Automation frees highly-skilled researchers from repetitive tasks, allowing focus on experimental design and data interpretation [55] [59]. One integrated platform demonstrated capacity for processing up to 192 samples in a single run with minimal hands-on time [56].
Automated Reagent Dosing: Precision and Safety
Technology and Implementation
Automated reagent dosing systems replace error-prone manual pipetting with precise, programmable liquid handling. These systems range from standalone dispensers to integrated components within robotic workcells. For example, the easyFILL automated reagent dosing system is specifically designed for safely and accurately adding acids to digestion vessels and performing post-digestion dilutions [57].
Implementation typically involves:
- System Calibration: Establishing precise volumetric accuracy for each reagent.
- Method Programming: Creating standardized protocols for specific sample types and reagent combinations.
- Integration: Connecting with laboratory information management systems (LIMS) for direct method upload and sample tracking.
Impact on Spectroscopic Data Quality
Consistent reagent dosing is particularly crucial for spectroscopic techniques like ICP-MS and ICP-OES, where slight variations in acid concentration can dramatically affect ionization efficiency and signal stability. Automated dosing ensures identical matrix conditions for all samples and standards, improving calibration linearity and quantitative accuracy [1].
Automated Digestion Protocols: Complete and Reproducible Sample Breakdown
Microwave Digestion Systems
Microwave-assisted digestion has become the gold standard for preparing complex samples for elemental analysis, with automation further enhancing its capabilities. Modern systems like the Milestone ETHOS UP and ultraWAVE platforms offer programmable temperature and pressure control for complete digestion of challenging matrices [57].
Key automated parameters include:
- Temperature Ramping: Controlled heating programs prevent sample volatilization and ensure reproducible reaction conditions.
- Pressure Management: Real-time monitoring prevents vessel failure and maintains safety during high-pressure digestions.
- Cooling Sequences: Standardized post-digestion cooling for safe vessel handling and preparation for the next analytical step.
Method Development and Optimization
A Design of Experiments (DoE) approach is recommended for developing robust, automated digestion methods. Research demonstrates that a single optimal set of extraction conditions for multiple protein markers is difficult to achieve without systematic optimization [60]. For example, a DoE study examining buffer composition, chaotropic reagents, and reducing agents found that while background buffer had minimal impact, chaotropic and reducing reagents significantly benefited protein recovery [60].
Application-Specific Digestion Workflows
Different sample matrices demand tailored digestion strategies:
- Geological Samples: Silicate-rich and refractory materials require single reaction chamber (SRC) technology with HF-containing mixtures for complete dissolution [57].
- Petroleum Products: Automated methods exist specifically for determining metals in organic matrices like petroleum, with official methods developed for SRC systems [57].
- Biological Tissues: Programmed temperature ramping prevents violent reactions while ensuring complete digestion of organic material.
Automated Extraction and Cleanup: Maximizing Recovery and Minimizing Contamination
Solid-Phase Extraction (SPE) and Protein Aggregation Capture (PAC)
Automated extraction systems standardize the critical process of isolating analytes from complex matrices. Recent advances include:
- Protein Aggregation Capture (PAC): An automated protocol using magnetic beads for protein purification, reduction, alkylation, and digestion in a single workflow [56].
- Solid-Phase Extraction (SPE): Automated systems for peptide cleanup and desalting using hydrophilic-lipophilic balanced (HLB) plates with positive pressure processing for consistent flow rates [56].
Impact on Metabolite Corona Studies
In emerging fields like nanomaterial metabolite corona research, automated extraction is vital for reproducibility. Studies show metabolite recovery significantly varies with elution buffer pH, volume, and ionic strength, and optimal conditions must be determined for each nanomaterial type [58]. Automated systems enable systematic optimization and application of these sensitive protocols.
Integrated Workflow: Case Study of an End-to-End Automated Platform
System Architecture
A fully integrated automated sample preparation platform demonstrates how individual automated components unite into a seamless workflow. One documented system centers around a Microlab STAR Plus liquid handling system integrated with third-party devices including a focused ultrasonicator for cell lysis, thermoshakers, and magnetic bead separators [56].
Processing Workflow
The table below outlines the key processing blocks in this integrated platform:
Table 1: Key Processing Blocks in an Automated Sample Preparation Workflow
| Processing Block | Key Functions | Technologies Employed |
|---|---|---|
| Protein Concentration Determination | Sample normalization, BCA assay | Liquid handling, plate reading |
| Protein Aggregation Capture (PAC) | Protein purification, reduction, alkylation, digestion | Magnetic beads, temperature control |
| Peptide Cleanup | Desalting, concentration | Solid-Phase Extraction (SPE) |
| Peptide Concentration Determination | Normalization for LC-MS | Fluorescence measurement |
| LC-MS Preparation | Final sample transfer | Liquid handling |
This workflow visualization illustrates the sequence and relationships between these processing blocks:
Performance Metrics
This integrated approach demonstrates significant advantages over manual processing:
- Throughput: Processes up to 192 samples in a single run [56].
- Reproducibility: Achieves high intra- and interplate reproducibility with longitudinal consistency over several weeks [56].
- Efficiency: Reduces hands-on time by approximately 90% compared to manual protocols.
- Recovery: Optimized extraction conditions improve metabolite recovery from nanomaterials by >80% for some species [58].
Essential Reagents and Materials for Automated Sample Preparation
The successful implementation of automated workflows depends on consistent quality and compatibility of consumables. The following table details key reagents and their functions in automated preparation protocols:
Table 2: Essential Research Reagent Solutions for Automated Sample Preparation
| Reagent/Material | Function | Application Examples |
|---|---|---|
| Chaotropic Reagents(Urea, Guanidine-HCl) | Denature proteins, improve solubility | Protein extraction from food matrices [60] |
| Reducing Agents(DTT, TCEP) | Break disulfide bonds | Protein extraction prior to digestion [60] [56] |
| Alkylating Agents(IAA, CAA) | Cysteine residue alkylation | Preventing reformation of disulfide bonds [56] |
| Digestion Enzymes(Trypsin, Lys-C) | Protein cleavage | Bottom-up proteomics [56] |
| SPE Sorbents(HLB, C18) | Peptide cleanup, desalting | Post-digestion sample purification [56] |
| Magnetic Beads(Carboxylate-modified) | Protein aggregation capture | Automated PAC protocols [56] |
| Acid Digestion Mixtures(HNO₃, HCl, HF) | Matrix decomposition | Microwave digestion of complex samples [57] |
Impact on Analytical Performance and Data Quality
Quantitative Improvements in Spectroscopic Analysis
Automated sample preparation directly enhances key analytical performance metrics:
Table 3: Impact of Automation on Spectroscopic Data Quality
| Performance Metric | Manual Preparation | Automated Preparation |
|---|---|---|
| Reproducibility (CV%) | 15-25% | <10% [56] |
| Sample Contamination | Higher risk | Significantly reduced [58] |
| Protein Recovery | Variable | >80% for optimized protocols [58] |
| Longitudinal Consistency | Operator-dependent | High consistency over weeks [56] |
| Multiplexing Capability | Limited | Simultaneous processing of 96-192 samples [56] |
Correlation with Spectroscopic Outcomes
The precision gained through automation directly translates to more reliable spectroscopic data:
- ICP-MS: Automated digestion and dilution minimize matrix effects and improve ionization stability, yielding better calibration linearity (R² > 0.999) and lower detection limits [1].
- XRF: Automated pellet pressing creates homogeneous samples with uniform density, reducing particle size effects and improving quantitative accuracy [1].
- Bottom-Up Proteomics: Automated processing from sample to MS-ready peptides significantly increases peptide identifications and quantitative precision compared to manual methods [56].
Implementation Considerations for Laboratory Automation
System Selection Criteria
Choosing appropriate automation technology requires evaluating several factors:
- Integration Capabilities: Ability to connect with existing lab instruments and software systems [55].
- Scalability: Platform capacity to adapt to growing workloads and additional users [55].
- Flexibility: Capability to handle diverse sample types and protocols without extensive reconfiguration [56].
- User Interface: Intuitive operation minimizes training requirements and facilitates adoption [55].
Software Solutions for Automation Management
Several software platforms specialize in coordinating automated sample preparation:
- Momentum Workflow Scheduling: Optimizes scheduling for complex, multi-step processes [55].
- LINQ Cloud: Cloud-based platform for real-time data tracking and workflow optimization [55].
- Cellario: Manages dynamic workflows in life sciences applications [55].
- Luma Lab Connect: Integrates laboratory instruments directly to data management systems [55].
Automation of reagent dosing, digestion, and extraction processes represents a fundamental advancement in sample preparation methodology with direct, measurable benefits for spectroscopic analysis. By implementing integrated automated workflows, laboratories achieve unprecedented levels of reproducibility, efficiency, and safety while significantly reducing the primary source of analytical error in spectroscopic measurements. As the field continues to evolve, automated sample preparation will play an increasingly critical role in generating the high-quality, reliable data required for modern drug development, materials science, and clinical research.
The accuracy and precision of any elemental analysis are fundamentally constrained by the sample preparation method that precedes it. Sample preparation transforms a raw material into a form compatible with analytical instrumentation, directly influencing signal intensity, background noise, and the magnitude of matrix effects—phenomena where the sample's composition alters the analytical signal of the analyte [61]. The choice of method is therefore not merely a preliminary step but a decisive factor in the validity of spectroscopic results. This guide provides an in-depth comparison of three principal preparation techniques—fusion, pressing, and direct analysis—to enable researchers to select the optimal protocol for their specific elemental studies, particularly within pharmaceutical and materials research contexts.
Core Principles: Fusion, Pressing, and Direct Analysis
Fusion Bead Method
The fusion bead method involves completely dissolving a finely ground sample in a high-temperature flux of alkali metal borate (typically lithium tetraborate or metaborate) at 800–1200 °C [61] [62]. The molten mixture is cast into a mold to form a homogeneous, glass-like bead. This process effectively destroys the original mineralogical structure of the sample, creating a new, consistent matrix. The primary advantage of fusion is the near-total elimination of particle size and mineralogical effects, along with a dramatic reduction of absorption-enhancement matrix effects due to high dilution [62]. Its main drawbacks are the inability to preserve volatile elements during the high-temperature process, the time and skill required for preparation, and the introduction of a large amount of flux, which dilutes trace elements [61].
Pressed Pellet Method
The pressed pellet method involves mixing a powdered sample with a binder (such as boric acid, cellulose, or wax) and compressing it under high pressure (typically 10–30 tons) into a solid, disk-shaped pellet [61]. This method is significantly faster, simpler, and less expensive than fusion and does not expose the sample to high heat, making it suitable for volatile elements. However, it does not eliminate mineralogical effects and is susceptible to particle heterogeneity and surface roughness, which can affect analytical precision [61]. The pressed pellet method is also subject to more pronounced matrix effects compared to the fusion bead approach.
Direct Analysis
Direct analysis, or "dilute and shoot," involves minimal sample manipulation. For solid samples, this can mean analyzing loose powders or, more commonly, introducing small sample amounts into a stream or plasma after a simple dilution or extraction, as is frequent in single-particle ICP-MS (SP ICP-MS) and combustion analysis [63] [42]. The key advantage is minimal sample preparation, which reduces preparation time, avoids contamination, and allows for the analysis of volatile or labile species. The primary disadvantage is that these methods are highly susceptible to matrix effects and spectral interferences from the complex, untreated sample matrix, which can compromise accuracy without matrix-matched standards [42].
Table 1: Comparison of Core Sample Preparation Method Characteristics
| Characteristic | Fusion Bead | Pressed Pellet | Direct Analysis |
|---|---|---|---|
| Principle | High-temperature dissolution in flux | Mechanical compression with binder | Minimal preparation; direct introduction |
| Homogeneity | Excellent; creates new, uniform glass matrix | Good to moderate; depends on grinding and mixing | Poor to moderate; reflects original sample heterogeneity |
| Matrix Effects | Significantly reduced | Moderate to high | High |
| Suitability for Volatiles | Poor | Good | Excellent |
| Throughput & Cost | Low throughput, high cost per sample | High throughput, low cost per sample | Very high throughput, very low cost per sample |
| Typical Dilution Factor | High (e.g., 1:10 to 1:20) | Low to none | Variable, can be very high |
Quantitative Method Performance and Selection Criteria
Analytical Performance Data
The choice of method directly impacts key analytical figures of merit. A micro-XRF study directly comparing fusion and pressed pellet specimens demonstrated clear performance differences, as summarized in Table 2 [61].
Table 2: Analytical Performance Comparison for Trace Element Determination [61]
| Element & Concentration | Method | Accuracy (%) | Precision (RSD, %) |
|---|---|---|---|
| Sr (100 μg/g) | Fusion Bead | 99.5 | 1.5 |
| Pressed Pellet | 95.2 | 4.8 | |
| Zr (250 μg/g) | Fusion Bead | 101.2 | 1.2 |
| Pressed Pellet | 92.8 | 6.5 | |
| Y (75 μg/g) | Fusion Bead | 98.8 | 2.1 |
| Pressed Pellet | 89.5 | 8.3 |
The data shows that fusion bead preparation consistently provides superior accuracy and precision, particularly for trace elements. The study attributed this to the excellent homogeneity of the bead specimen, which minimizes sampling errors during micro-XRF analysis [61]. In contrast, the pressed pellets exhibited higher relative standard deviations (RSD), indicating greater variability in analyte distribution.
Selection Guide for Sample Types
No single method is optimal for all scenarios. The best choice depends on the sample's physical and chemical properties and the analytical goals.
Table 3: Method Selection Guide Based on Sample Type and Analytical Requirement
| Sample Type / Requirement | Recommended Method | Rationale |
|---|---|---|
| Geological Samples / Major Elements | Fusion Bead | Eliminates mineralogical effects for accurate quantification [61] |
| Geological Samples / Trace Elements | Pressed Pellet | Avoids dilution, improving detection limits [61] |
| Organic Compounds / CHNS/O | Direct Analysis (Combustion) | Directly determines elemental composition without digestion [63] |
| Pharmaceuticals (Volatile API) | Pressed Pellet or Direct Analysis | Prevents thermal degradation of sensitive compounds |
| Nanoparticle Suspensions | Direct Analysis (SP ICP-MS) | Preserves particle integrity for size and number concentration analysis [42] |
| High-Throughput Quality Control | Pressed Pellet | Optimal balance of speed, cost, and sufficient accuracy [64] |
| Refractory Materials (e.g., Ceramics) | Fusion Bead | Ensures complete dissolution of resistant phases [62] |
Detailed Experimental Protocols
- Sample Conditioning: Grind the sample to a particle size of < 100 μm. Dry at 110 ± 5 °C to remove moisture and store in a desiccator. For materials with loss on ignition (LOI), pre-ignite at 1050°C to determine the mass of the stable oxide.
- Flux Selection and Drying:
- Use lithium tetraborate (Li₂B₄O₇) for basic or refractory matrices.
- Use lithium metaborate (LiBO₂) for acidic or silicate-rich samples.
- Dry the flux at 100–120°C before use to remove surface moisture.
- Weighing and Mixing: Use a flux-to-sample ratio of 10:1 or 20:1. Accurately weigh the sample and flux into a platinum-gold (Pt-Au) alloy crucible. Mix thoroughly to ensure homogeneity.
- Fusion and Casting: Place the crucible in a fusion furnace at 1000–1200°C with agitation to facilitate dissolution and remove gas bubbles. Once the melt is clear and homogeneous, pour it into a preheated Pt-Au mold (approx. 800°C) to form a bead. Use a controlled cooling cycle to prevent cracking.
- Additives (Optional): To improve the process, consider:
- Oxidizers (e.g., LiNO₃): Ensure complete oxidation of organic matter and prevent crucible damage.
- Releasing Agents (e.g., LiI): Aid bead release from the mold (may cause spectral interference).
- Modifiers (e.g., LiF): Adjust melt viscosity.
- Grinding and Homogenization: Grind the sample to a fine powder (< 75 μm). For inhomogeneous samples like coal, soil, or plant material, use a mill or mortar and pestle to ensure the sub-sample is representative.
- Drying: Dry the sample at 110 ± 5 °C to remove adsorbed water, which can affect the analysis of hydrogen and overall sample weight.
- Mixing with Binder: Mix the dried powder with a binder like boric acid, cellulose, or wax. A typical binder-to-sample ratio is 1:5 to 1:10. Grind the mixture again in a pestle and mortar to achieve a homogeneous blend.
- Pressing: Load the mixture into a die and press at 15–25 tons of pressure for 30–60 seconds to form a robust, disk-shaped pellet with a smooth surface.
- Dilution: Dilute the sample (e.g., a nanoparticle suspension or soil extract) in a pure aqueous matrix (e.g., Milli-Q water) to a concentration suitable for single-particle detection. The optimal particle number concentration is typically 10⁵–10⁶ particles/mL.
- Stabilization (Optional): To improve nanoparticle recovery, add a surfactant like Triton X-100 (e.g., 0.01% v/v). Note: The effectiveness of surfactants is highly dependent on the particle type, with recoveries for natural particles often remaining low (e.g., <30%) [42].
- Analysis and Data Processing: Introduce the diluted suspension directly into the ICP-MS. Use a short dwell time (e.g., 100 μs) to resolve individual particle events. Process the transient signal to determine particle number concentration, size distribution, and elemental composition.
Workflow Visualization and Laboratory Toolkit
Sample Preparation Decision Workflow
The following diagram outlines a systematic decision-making process for selecting the appropriate sample preparation method based on key sample and analytical requirements.
Essential Research Reagent Solutions
The following table details key reagents and consumables required for implementing the sample preparation methods discussed.
Table 4: Essential Research Reagent Toolkit for Elemental Analysis Sample Preparation
| Reagent / Consumable | Primary Function | Application Notes |
|---|---|---|
| Lithium Tetraborate (Li₂B₄O₇) | High-temperature flux for fusion | Ideal for basic and refractory samples; must be dried before use [62] |
| Lithium Metaborate (LiBO₂) | High-temperature flux for fusion | Preferred for acidic and silicate-rich matrices [62] |
| Pt-Au (95/5) Crucible & Mold | Holds sample and flux during fusion | Resists oxidation and corrosion; 5% gold lowers the melting point and improves durability [62] |
| Cellulose or Boric Acid Binder | Binds powder particles for pressing | Creates cohesive pellets without excessive pressure; chemically pure to avoid contamination [61] [64] |
| Tin Boats / Capsules | Holds sample during combustion analysis | Standard for CHNS analysis of solids; proper wrapping ensures efficient combustion [64] |
| Tungsten(VI) Oxide (WO₃) | Combustion aid | Promotes complete combustion of difficult-to-burn samples like coal and graphite in CHNS analysis [64] |
| Triton X-100 Surfactant | Particle stabilizer | Helps maintain nanoparticle dispersion in direct SP ICP-MS analysis, though recovery may be variable [42] |
The selection between fusion, pressing, and direct analysis is a critical determinant in the success of an elemental study. Fusion bead preparation offers the highest level of homogeneity and accuracy for a wide range of solid samples but at a higher cost and complexity. Pressed pellets provide a robust, cost-effective alternative suitable for high-throughput and trace analysis where some matrix effects can be tolerated or corrected. Direct analysis techniques are indispensable for volatile, liquid, or nanoparticle samples where preservation of the original species is paramount. By aligning the sample properties and analytical objectives with the strengths and limitations of each method—as guided by the protocols, data, and decision workflow provided—researchers can ensure the generation of reliable, high-quality spectroscopic data.
Validating Your Methods: A Comparative Framework for Preparation Technique Selection
The validity of spectroscopic data is fundamentally dependent on the steps taken before analysis begins. Inadequate sample preparation is the root cause of an estimated 60% of all spectroscopic analytical errors [1]. This establishes sample preparation not as a mere preliminary step, but as a critical analytical parameter in its own right. Effective preparation mitigates key issues such as matrix effects, where surrounding components interfere with the analyte's signal; particle heterogeneity, which leads to non-representative sampling; and unanticipated contamination, which can produce spurious results [1]. The core thesis of this guide is that without rigorous, quantitatively benchmarked preparation protocols, even the most advanced spectroscopic instrumentation cannot yield reliable data. For researchers in drug development and other applied sciences, establishing performance criteria for these preparatory methods is therefore not optional—it is essential for ensuring data integrity, reproducibility, and accurate conclusions.
Core Quantitative Criteria for Benchmarking
Evaluating the efficacy of a sample preparation method requires tracking specific, measurable key performance indicators (KPIs). The following criteria provide a framework for objective benchmarking.
Table 1: Core Quantitative Criteria for Evaluating Preparation Method Efficacy
| Criterion | Description | Quantitative Metric | Impact on Analysis |
|---|---|---|---|
| Analyte Recovery | Measure of the target analyte successfully presented for analysis. | Recovery (%) = (Amount detected / Amount present) * 100 [36] | Low recovery causes systematic underestimation of concentration. |
| Precision/Repeatability | Consistency of the preparation method when repeated. | Relative Standard Deviation (RSD) of results from multiple preparations of the same sample. | High RSD indicates poor method control and unreliable data. |
| Sensitivity & Limit of Detection (LOD) | The lowest amount of analyte that can be reliably detected. | LOD, often calculated as 3.3*σ/S (σ=standard deviation of blank, S=calibration curve slope). | Preparation can introduce dilution or contamination, worsening LOD. |
| Particle Size & Homogeneity | Uniformity of the prepared sample's physical properties. | Particle size distribution (e.g., D90 < 75 μm for XRF) [1] and visual/statistical homogeneity tests. | Critical for techniques like XRF; affects scattering and signal uniformity. |
| Extent of Sample Manipulation | Degree of handling, dilution, or addition of reagents. | Number of preparation steps; dilution factor; volume of reagents used. | More manipulation increases error introduction and contamination risk. |
These criteria are not independent; a change in one often affects another. For instance, a filtration step intended to improve homogeneity might inadvertently decrease analyte recovery. Therefore, a holistic view of all criteria is necessary for a true performance benchmark.
Experimental Protocols for Method Evaluation
To illustrate how these quantitative criteria are applied in practice, this section details specific experimental methodologies from recent research.
Protocol: Evaluating Preparation Strategies for Single-Particle ICP-MS
Objective: To assess the impact of common sample preparation strategies (filtration, centrifugation) on the recovery and size distribution of natural and synthetic nanoparticles in complex environmental matrices [36].
Materials:
- Samples: Water extracts of mineral and sediment certified reference materials (CRMs).
- Spiked Nanoparticles: Gold (Au) nanoparticles of a known size and concentration.
- Reagents: Surfactants (e.g., Triton X-100).
- Equipment: Single-particle ICP-MS instrument, syringe filters, ultracentrifugation system.
Methodology:
- Sample Preparation: Spike the water extracts with a known concentration of Au nanoparticles.
- Application of Strategies: Split the spiked sample and subject it to different preparation strategies:
- Syringe Filtration
- Ultra-centrifugation
- Surfactant Addition (e.g., with Triton X-100) followed by filtration or centrifugation.
- Control: No preparation (direct analysis).
- Quantitative Analysis: Analyze all prepared samples using SP ICP-MS.
- Benchmarking Calculation:
- Particle Recovery: Calculate the percentage of detectable particles remaining after each preparation strategy compared to the control.
- Size Distribution: Compare the measured particle size distributions before and after preparation.
Key Findings: This protocol revealed that common preparation strategies can introduce significant error. Filtration and centrifugation caused losses of at least 90% of detectable particles for both spiked Au and natural iron-containing particles. The addition of surfactants improved recovery for synthetic Au particles (up to 30%) but was ineffective for natural particles, which saw losses up to 99% [36]. This highlights that preparation efficacy is highly matrix- and analyte-specific.
Protocol: Comparative Multielemental Analysis of Biological Tissues
Objective: To compare the performance of different spectroscopic techniques (EDXRF, TXRF, ICP-MS/ICP-OES) and their associated sample preparation requirements for the multielemental analysis of hair and nails [65].
Materials:
- Samples: Certified Reference Materials (CRMs) of hair and nails.
- Equipment: EDXRF, TXRF, ICP-MS, and ICP-OES instrumentation.
- Preparation Tools: Grinders, presses, fusion equipment, acid digestion systems.
Methodology:
- Sample Processing: Apply the requisite preparation for each technique:
- EDXRF: Minimal preparation; pressing into pellets for uniform surface.
- TXRF: Homogenization, digestion, and deposition on a carrier.
- ICP-MS/ICP-OES: Complete digestion of solid samples in acid, followed by precise dilution and filtration.
- Analysis: Analyze the prepared CRMs using each technique.
- Benchmarking Calculation: Assess method performance based on:
- Sensitivity: Lowest detectable amount for various elements.
- Precision: RSD of repeated measurements.
- Range of Detectable Elements: Which elements each technique could quantify post-preparation.
- Sample Preparation Extent: A qualitative score of the complexity and destructiveness of the preparation.
Key Findings: The study quantitatively demonstrated the trade-off between preparation rigor and analytical scope. EDXRF, with its minimal preparation, was suitable for rapid, non-destructive determination of light elements (S, Cl, K, Ca) at high concentrations. TXRF could detect more elements but failed for light ones like Phosphorus and Sulfur. The most preparation-intensive techniques, ICP-OES/ICP-MS, were necessary for the most comprehensive analysis, enabling the determination of major, minor, and trace elements (except Cl) [65].
Visualizing the Preparation-to-Analysis Workflow
The relationship between preparation choices, their impact on sample state, and the ultimate analytical outcome can be visualized as a decision pathway. The diagram below maps this critical workflow.
Diagram 1: Sample Preparation Evaluation Workflow
This workflow emphasizes that sample preparation is an iterative optimization process. The choice of method is dictated by the analytical goal, and its success is quantitatively verified against the core criteria before analysis proceeds. A failure to meet benchmarks necessitates a return to the method selection and optimization stage.
The Scientist's Toolkit: Essential Reagents and Materials
The following table details key reagents and materials frequently used in spectroscopic sample preparation, along with their critical functions.
Table 2: Key Research Reagent Solutions for Spectroscopic Sample Preparation
| Reagent/Material | Function | Common Application Techniques |
|---|---|---|
| Lithium Tetraborate | Flux for fusion, dissolving refractory materials to create homogeneous glass disks. | XRF (for cement, minerals, ceramics) [1] |
| m-Nitrobenzyl Alcohol (NBA) | Matrix for FAB mass spectrometry, facilitating soft ionization of the sample. | Fast Atom Bombardment (FAB) MS [66] |
| Triton X-100 | Surfactant used to stabilize nanoparticles in suspension and improve recovery in preparation. | Single-Particle ICP-MS [36] |
| Formic Acid (0.1-1%) | Volatile modifier for LC-MS mobile phases, aiding protonation and ionization. | Electrospray Ionization (ESI) LC-MS [66] |
| α-Cyano-4-hydroxycinnamic Acid (CHCA) | Matrix for MALDI, absorbing laser energy and transferring it to the analyte. | Matrix-Assisted Laser Desorption/Ionization (MALDI) MS [66] |
| Certified Spectral Fluorescence Standards (BAM F007) | Reference material with known emission spectrum for calibrating instrument responsivity. | Fluorescence Spectroscopy [67] |
| Deuterated Chloroform (CDCl₃) | IR-transparent solvent that minimizes interfering absorption bands in the mid-IR region. | FT-IR Spectroscopy [1] |
| High-Purity Nitric Acid | Digestant for dissolving metal-containing samples; acidification agent to prevent adsorption. | ICP-MS, ICP-OES [1] |
| Boric Acid / Cellulose Binders | Binders mixed with powdered samples to form stable, uniform pellets for analysis. | XRF Pelletizing [1] |
| Absolute Ethanol | High-purity solvent for preparing dye solutions for fluorescence standards and extractions. | Fluorescence Spectroscopy, General Use [67] |
In the context of a broader thesis on how sample preparation affects spectroscopic results, this guide establishes that efficacy must be defined quantitatively, not qualitatively. The benchmarked criteria of analyte recovery, precision, sensitivity, homogeneity, and manipulation provide a robust framework for this evaluation. As the cited research demonstrates, a preparation strategy that is optimal for one technique (e.g., pelletizing for XRF) may be wholly unsuitable for another (e.g., digestion for ICP-MS). Furthermore, seemingly benign steps like filtration can catastrophically impact recovery in cutting-edge applications like single-particle analysis. Therefore, the onus is on the researcher to not merely follow a recipe, but to critically validate every preparation method against these quantitative criteria. This disciplined, evidence-based approach to sample preparation is fundamental to transforming spectroscopic data from mere signal into scientifically valid, reliable, and impactful knowledge.
In the realm of analytical chemistry and therapeutic drug monitoring (TDM), the accuracy and reliability of final results are fundamentally dependent on the sample preparation process. Sample preparation represents a critical pre-analytical step that can account for up to 60% of all analytical errors in spectroscopic analysis [1]. This case study examines the validation of a CLAM-LC-MS/MS (Connected Liquid Automation Module-Liquid Chromatography-Tandem Mass Spectrometry) system against conventional immunoassays, framing this comparison within the broader thesis that sample preparation methodologies directly determine the quality of spectroscopic results.
Therapeutic drug monitoring of immunosuppressive drugs like tacrolimus and cyclosporin A presents particular challenges for analytical methods. These drugs bind extensively to red blood cells, requiring a hemolysis process for accurate quantification in whole blood, and have narrow therapeutic windows where precision is clinically crucial [68] [69]. This evaluation prospectively validates whether the CLAM-LC-MS/MS system, which integrates automated sample preparation directly with LC-MS/MS analysis, can overcome the limitations of both conventional immunoassays and manual LC-MS/MS preparation for clinical TDM work.
Background: Analytical Methodologies in Therapeutic Drug Monitoring
Comparative Analytical Platforms
Therapeutic drug monitoring systems typically utilize one of two primary analytical methodologies, each with distinct advantages and limitations:
Immunoassay Methods (e.g., CLIA, ACMIA):
- Advantages: Rapidity, automation capabilities, and extensive technical support from manufacturers [68] [69]
- Disadvantages: Potential for cross-reactions, high cost per sample, inability to simultaneously measure multiple compounds, and inter-laboratory variability [68] [69]
Liquid Chromatography-Tandem Mass Spectrometry (LC-MS/MS):
- Advantages: High sensitivity, high specificity, suitability for multiplexing including metabolites; considered a worldwide gold standard for TDM [68] [69]
- Disadvantages: Unsuitability for direct injection, limited automation, time-consuming manual procedures, requirement for special user training [68] [69]
The Sample Preparation Challenge
The essential challenge in spectroscopic analysis lies in the sample preparation phase, which directly influences data quality through several mechanisms [1]:
- Surface and particle characteristics affect how radiation interacts with samples, with rough surfaces scattering light randomly
- Matrix effects occur when sample constituents obscure or enhance spectral signals
- Homogeneity requirements necessitate representative sampling for reproducible results
- Contamination risks can introduce unwanted materials that generate spurious spectral signals
The CLAM-LC-MS/MS system addresses these challenges by automating the entire sample preparation process, potentially reducing human error and variability while maintaining the specificity advantages of LC-MS/MS technology.
Materials and Experimental Protocols
Equipment and Reagents
Table 1: Key Research Reagent Solutions and Equipment
| Item | Function/Description | Manufacturer/Supplier |
|---|---|---|
| CLAM-2000/CLAM-2040 | Automated sample pretreatment module | Shimadzu Corporation |
| LCMS-8050 CL | Triple quadrupole mass spectrometer | Shimadzu Corporation |
| DOSIMMUNE Kit | Calibrators, QC samples, stable isotope-labeled internal standards | Alsachim, France |
| ARCHITECT Tacrolimus Reagent Kit | Immunoassay reagents for tacrolimus quantification | Abbott, Illinois, U.S.A. |
| Dimension Systems CSA Assay | Immunoassay reagents for cyclosporin A quantification | Siemens, Germany |
| Polytetrafluoroethylene membrane filter | 0.45 μm pore size for sample filtration | N/A |
| EDTA-Na blood collection tubes | Sample collection and preservation | N/A |
Clinical Sample Collection
The validation study employed the following sample population [68] [69] [70]:
- Tacrolimus cohort: 224 whole blood samples from 80 patients (18 inpatients, 62 outpatients)
- Cyclosporin A cohort: 76 whole blood samples from 21 patients (8 inpatients, 13 outpatients)
- Source: Department of Nephrology and Department of Rheumatology, Kanazawa University Hospital
- Collection period: May 2018 to July 2019
- Ethical approval: Medical Ethics Committee of Kanazawa University (protocol no. 2017-195)
- Sample handling: Blood collected in EDTA-Na tubes, with one aliquot stored at -30°C for CLAM-LC-MS/MS and another at 4°C for immunoassay
Methodologies: CLAM-LC-MS/MS System
The CLAM-LC-MS/MS system consists of an automated sample preparation module (CLAM-2000) directly connected to an LC-MS/MS instrument, with all components approved for use as medical equipment [68] [69]. The experimental protocol for the CLAM system included:
Diagram 1: CLAM-LC-MS/MS Automated Workflow
LC-MS/MS Analysis Conditions [69]:
- Analytical columns: DOSIMMUNE trap and analytical columns (Alsachim, France)
- Mass transitions:
- Tacrolimus: m/z 821.5 → 768.3 (quantitation) and 821.5 → 576.2 (reference)
- Cyclosporin A: m/z 1219.8 → 1202.9 (quantitation) and 1219.8 → 1184.6 (reference)
- Internal standards: Stable isotope-labeled compounds ([¹³C,²H₄]-tacrolimus, [²H₁₂]-cyclosporin A)
- Total analysis time: Approximately 10 minutes per sample (6 minutes pretreatment, 2.6 minutes LC-MS/MS analysis, 30 seconds result output)
Methodologies: Immunoassay Protocols
Chemiluminescence Immunoassay (CLIA) for Tacrolimus [68] [69]:
- Platform: Architect system (ARCHITECT i1000SR, Abbott)
- Sample preparation: Whole Blood Precipitation Reagent added to equal volume (200 µL) of blood samples, followed by vortexing and centrifugation
- Analysis: Supernatant transferred to Architect system for automated analysis
Affinity Column-Mediated Immunoassay (ACMIA) for Cyclosporin A [68] [69]:
- Platform: Dimension Xpand Plus (Siemens, Germany)
- Sample preparation: Whole blood samples (250 µL) directly placed in system carousel
- Analysis: Fully automated processing without manual pretreatment
Validation Parameters and Statistical Analysis
The validation study investigated key method performance parameters based on established guidelines for bioanalytical method validation [71] [72]:
- Precision: Intra- and inter-assay precision measured using quality control samples
- Accuracy: Comparison with reference methods and recovery experiments
- Correlation: Spearman rank correlation coefficients between methods
- Statistical methods: Passing and Bablok regression analysis and Bland-Altman plots
- Software: MedCalc statistical software for Windows (Ostend, Belgium)
Maintenance protocols for the CLAM-LC-MS/MS system included regular cleaning every 6 months of the LC flow path, mass spectrometer lens system, and CLAM sample probe, with replacement of capillaries, desolvation lines, and PEEK tubes [68] [69].
Results and Quantitative Comparison
Precision and Correlation Data
Table 2: Method Performance Comparison between CLAM-LC-MS/MS and Immunoassays
| Validation Parameter | Tacrolimus (CLAM-LC-MS/MS vs CLIA) | Cyclosporin A (CLAM-LC-MS/MS vs ACMIA) |
|---|---|---|
| Intra-assay Precision | <7% (quality controls) | <7% (quality controls) |
| Inter-assay Precision | <7% (quality controls) | <7% (quality controls) |
| Correlation (Spearman) | 0.861 (P < 0.00001) | 0.941 (P < 0.00001) |
| Systematic Difference | ~20% lower with CLAM-LC-MS/MS | ~20% lower with CLAM-LC-MS/MS |
| Sample Throughput | ~10 minutes per sample | ~10 minutes per sample |
| Pretreatment Time | 6 minutes (fully automated) | 6 minutes (fully automated) |
Operational Characteristics
Table 3: Operational Comparison of Analytical Platforms
| Characteristic | CLAM-LC-MS/MS | Traditional Immunoassay | Manual LC-MS/MS |
|---|---|---|---|
| Pretreatment Time | 6 minutes (automated) | Minimal for ACMIA; moderate for CLIA | 60-90 minutes (manual) |
| Total Analysis Time | ~10 minutes | Variable | >90 minutes |
| Operator Skill Requirements | Low (minimal technical knowledge) | Low | High (specialized training) |
| Multiplexing Capability | Yes (multiple analytes + metabolites) | No (single analyte) | Yes (multiple analytes + metabolites) |
| Maintenance Frequency | Every 6 months | As per manufacturer | Frequent |
| Interference Resistance | High (chromatographic separation) | Variable (potential cross-reactivity) | High (chromatographic separation) |
Discussion: Implications for Spectroscopic Analysis
Impact of Automated Sample Preparation on Data Quality
The implementation of the CLAM-LC-MS/MS system demonstrates how automated sample preparation directly enhances spectroscopic data quality through several mechanisms:
Enhanced Precision: The significantly lower inter-assay precision values (<7%) with CLAM automation compared to manual pretreatment highlight how automated systems reduce variability introduced by human operators [68] [69]. This aligns with the broader principle in spectroscopic analysis that standardized preparation protocols minimize random errors and improve reproducibility [1].
Elimination of Manual Errors: Automated liquid handling and filtration in the CLAM system reduces pipetting errors and variations in manual techniques that commonly affect spectroscopic results. This is particularly crucial for drugs like tacrolimus and cyclosporin A that require extensive sample preparation including hemolysis, protein precipitation, and filtration [68].
Matrix Effect Management: The consistent ~20% lower drug concentrations measured by CLAM-LC-MS/MS compared to immunoassays likely reflects the elimination of cross-reactivity issues inherent in immunoassays, demonstrating how superior sample preparation combined with specific detection improves analytical accuracy [68] [69] [70].
Workflow Optimization in Analytical Processes
The CLAM-LC-MS/MS system exemplifies several workflow automation best practices that enhance overall analytical efficiency [73]:
- Standardized Processes: Automated pretreatment ensures identical handling for all samples, eliminating individual technique variations
- Continuous Operation: The system enables parallel processing where pretreatment of subsequent samples occurs during LC-MS/MS analysis of previous samples
- Error Reduction: Automated systems minimize manual intervention points where errors typically occur
- Documentation and Traceability: Automated systems inherently generate process data for quality control
Diagram 2: Sample Preparation Impact on Analytical Outcomes
Broader Implications for Spectroscopic Analysis
This case study substantiates several fundamental principles in spectroscopic analysis:
Sample Preparation Dictates Analytical Ceiling: No advanced detection system can compensate for poor sample preparation. The CLAM-LC-MS/MS system's performance demonstrates that integrating robust preparation with sophisticated detection achieves optimal results [1].
Automation Enhances Both Precision and Productivity: While the 6-minute automated pretreatment time represents a significant acceleration compared to manual methods (typically 60-90 minutes), the more substantial benefit lies in the consistency achieved across multiple operators and over extended time periods [68] [69].
Method Selection Balance: The high correlation between CLAM-LC-MS/MS and immunoassay methods (Spearman coefficients: 0.861-0.941) suggests that while differences exist, both can provide clinically useful results. However, the specific advantages of the CLAM-LC-MS/MS system in avoiding interference and providing multiplexing capabilities make it particularly valuable for complex TDM applications [68] [70].
This validation study demonstrates that the CLAM-LC-MS/MS system successfully addresses critical limitations of both conventional immunoassays and manual LC-MS/MS methods for therapeutic drug monitoring of tacrolimus and cyclosporin A in whole blood. The system provides excellent correlation with immunoassay methods while offering the specificity advantages of LC-MS/MS technology.
More significantly, this case study substantiates the broader thesis that sample preparation methodologies fundamentally determine spectroscopic results. The automated sample preparation achieved by the CLAM system directly enhanced data quality through improved precision, reduced variability, and elimination of manual errors, while simultaneously increasing operational efficiency.
For researchers and drug development professionals, this validation underscores the importance of considering sample preparation as an integral component of the analytical system rather than merely a preliminary step. The successful implementation of the CLAM-LC-MS/MS system represents a paradigm shift in how spectroscopic methods can be optimized through integrated automation, providing a template for future developments in analytical science across multiple domains.
Fourier Transform Infrared (FTIR) spectroscopy has established itself as an indispensable analytical technique across scientific disciplines, from material science to biomedical research. The fundamental principle underlying FTIR is that chemical bonds within molecules vibrate at specific frequencies when exposed to infrared light, producing characteristic absorption spectra that serve as molecular fingerprints [74]. However, the reliability of these spectral fingerprints is profoundly influenced by pre-analytical variables, particularly sample preparation methodologies. Within the context of a broader thesis on how sample preparation affects spectroscopic results, this technical guide examines compelling evidence from interlaboratory studies that reveal significant reproducibility differences between solid and solvent-based FTIR preparation techniques.
The precision of FTIR spectroscopy depends on multiple factors, including instrument calibration, environmental conditions, and spectral processing algorithms. Yet, sample preparation remains arguably the most vulnerable stage where errors and variations are introduced [75]. As research institutions and industrial laboratories increasingly rely on FTIR for qualitative and quantitative analysis, establishing standardized, reproducible preparation protocols has become paramount for ensuring comparable results across different laboratories and studies. This whitepaper synthesizes recent round-robin test data to provide drug development professionals and researchers with evidence-based guidance for selecting and optimizing FTIR sample preparation methods.
Key Experimental Findings from Interlaboratory Studies
The RILEM TC 295-FBB Round-Robin Test on Bituminous Binders
A landmark interlaboratory study conducted by the RILEM TC 295-FBB Task Group 1 provides compelling quantitative data on the reproducibility of different FTIR sample preparation methods [76] [77]. This extensive round-robin test involved 21 participating laboratories worldwide that performed six different sample preparation techniques on three distinct bituminous binders in unaged, short-term, and long-term aged states. The study generated and analyzed a total of 6,461 spectra, evaluating their mean, standard deviation, and coefficient of variation (CV) across the spectral region of 1800-600 cm⁻¹ [76].
The research was designed to address the critical challenge in FTIR spectroscopy: while the technique has become increasingly popular for material analysis, comparable results across laboratories remained elusive due to differences in devices, measurement routines, sample preparation procedures, and spectral evaluation methods [76]. The RILEM community recognized that without standardized approaches, FTIR data would remain difficult to compare between institutions, limiting its utility for quality control and regulatory applications. The experimental design thus systematically controlled for variables while testing multiple preparation methods across a diverse set of experienced laboratories.
Reproducibility Outcomes: Solid vs. Solvent Methods
The findings from the RILEM round-robin test revealed striking differences in reproducibility between solid and solvent-based preparation techniques, quantified through statistical analysis of the coefficient of variation (CV) [76].
Table 1: Reproducibility of FTIR Sample Preparation Methods Based on Round-Robin Testing
| Preparation Method | Reproducibility (Coefficient of Variation) | Key Characteristics | Spectral Quality Observations |
|---|---|---|---|
| Solid Sample Methods | Excellent reproducibility (CV < 2%) | Direct application without solvents; "Small Quantity – Heating Plate" method performed best | Minimal differences in slope, baseline, and noise |
| Solvent-Based Method | Significantly higher variation (CV = 7.18%) | Requires dissolution in appropriate solvents | Increased scattering in overall absorption |
The superior performance of solid sample methods highlights their robustness for interlaboratory studies and standardized analytical protocols. The "Small Quantity – Heating Plate" approach emerged as the most consistent among the solid preparation techniques [78]. In contrast, the solvent method demonstrated approximately 3.5 times greater variability, indicating substantial challenges in achieving reproducible results across different laboratories when solvents are employed [76].
The study further categorized outliers with high coefficients of variation into two distinct groups: cases where only one of four samples differed significantly, and cases where all 16 spectra showed slight scattering in the overall absorption [76]. This classification helps laboratories identify the root causes of their reproducibility issues, whether stemming from isolated preparation errors or systematic methodological flaws.
Detailed Experimental Protocols and Methodologies
Solid Sample Preparation Techniques
The RILEM study evaluated several solid sample preparation methods that avoid the use of solvents. These techniques generally involve the direct application of the solid material to the FTIR spectrometer, typically using an Attenuated Total Reflection (ATR) accessory [76]. The specific protocols encompassed:
Small Quantity – Heating Plate Method: This best-performing approach involves heating the sample to an appropriate temperature to render it malleable, then applying a small quantity directly to the ATR crystal and allowing it to form a thin, uniform film upon cooling [78]. Precise control of heating time and temperature is critical, as excessive heat can cause oxidative changes, while insufficient heating may result in inadequate contact with the crystal surface.
Direct Solid Application: For materials that are already sufficiently soft or can be pressed against the ATR crystal with adequate force, direct application without heating may be employed. This method requires homogeneous samples and consistent pressure application to ensure reproducible optical contact.
KBr Pellet Method: Although not specifically mentioned in the RILEM bitumen study, this classical solid preparation technique is widely used for FTIR analysis of powdered solids [79]. It involves grinding approximately 1-2 mg of sample with 100-200 mg of dry potassium bromide (KBr), then compressing the mixture under high pressure (typically 8-10 tons) in a hydraulic press to form a transparent pellet. The method offers excellent spectral quality but has limitations for materials that may undergo polymorphic changes under pressure [79].
Solvent-Based Preparation Techniques
The solvent-based method evaluated in the RILEM study follows a more complex protocol that introduces multiple potential variables [76]:
Solvent Selection: The solid sample is dissolved in a suitable non-aqueous solvent. The ideal solvent should completely dissolve the analyte, have no chemical interaction with the solute, exhibit minimal infrared absorption in the spectral regions of interest, and be sufficiently volatile to allow complete evaporation [79].
Solution Application: A drop of the prepared solution is applied to an alkali metal plate (such as NaCl or KBr) and spread to form a uniform layer.
Solvent Evaporation: The solvent is allowed to evaporate completely, leaving a thin film of the analyte on the plate. This evaporation process must be carefully controlled, as rapid evaporation can cause uneven film formation or solvent trapping, while slow evaporation may permit atmospheric moisture absorption or oxidative changes.
Film Measurement: The plate with the deposited film is mounted in the spectrometer for transmission measurement.
The multiple steps in this procedure introduce numerous variables that contribute to its higher coefficient of variation, including solvent purity, dissolution efficiency, solution concentration, evaporation conditions, and final film homogeneity.
Supporting Evidence from Biomaterials Research
Complementary evidence comes from ASTM interlaboratory studies on ultra-high molecular weight polyethylene (UHMWPE) used in orthopaedic implants [80]. These studies compared different FTIR methodologies for quantifying oxidation indices and found that area-based normalization methods provided significantly better interlaboratory reproducibility than peak-height-based methods. The research demonstrated that through method standardization, oxidation indices could be compared across laboratories with an average relative uncertainty of 17-24% [80].
Table 2: Essential Research Reagent Solutions for FTIR Sample Preparation
| Reagent/Material | Function in FTIR Analysis | Application Notes |
|---|---|---|
| Potassium Bromide (KBr) | Matrix for pellet preparation; transparent to IR radiation | Must be maintained moisture-free; hygroscopic nature can cause fogging [79] |
| Nujol (Mineral Oil) | Mulling agent for suspension of fine powders | Shows absorption bands in IR range; can be mixed with hexachlorobutadiene to reduce interferences [79] |
| Non-Aqueous Solvents (chloroform, CCl₄, cyclohexane) | Dissolution medium for solid samples | Must be free of moisture and have no chemical interaction with analyte [79] |
| Alkali Metal Plates (NaCl, KBr, CsI) | Substrate for film formation from solutions | Susceptible to moisture damage; require careful handling and storage |
Underlying Mechanisms: Why Preparation Methods Affect Spectral Reproducibility
Physical and Chemical Factors Influencing Spectral Quality
The significant disparities in reproducibility between solid and solvent-based methods arise from fundamental physical and chemical principles governing FTIR spectroscopy:
Contact Quality with ATR Crystal: Solid methods, particularly those involving heating, typically achieve more consistent and intimate contact with the ATR crystal, resulting in more reproducible evanescent wave interaction and absorption measurements [76]. The depth of penetration in ATR-FTIR depends on the wavelength, refractive index of the crystal and sample, and the angle of incidence, making consistent contact paramount.
Sample Thickness Variations: Solvent-based methods suffer from inherent difficulties in achieving uniform film thickness across different preparations and laboratories. Even minor variations in deposited solution volume or spreading technique can cause significant differences in absorption band intensities, particularly in transmission mode measurements [81].
Solvent Residues and Incomplete Evaporation: Despite careful evaporation procedures, trace solvent residues can remain in the prepared films, contributing extraneous absorption bands or modifying the spectral baseline [79]. Different evaporation conditions across laboratories exacerbate this issue.
Molecular Orientation and Crystallinity: Preparation methods can induce changes in molecular orientation or crystallinity, particularly for polymeric materials. The solvent casting process may promote different crystalline forms or orientation compared to solid compression methods, potentially altering spectral profiles [79].
Environmental and Handling Considerations
Beyond the core preparation techniques, several ancillary factors further influence reproducibility:
Hydration Effects: FTIR spectra are particularly sensitive to water content, which exhibits strong absorption in key spectral regions. Variations in laboratory humidity during sample preparation and storage can introduce significant spectral changes, especially for hydrophilic materials [82].
Oxidative and Degradative Changes: Thermal processing during some solid sample preparations may accelerate oxidative degradation if not carefully controlled. Studies on bituminous binders recommend rigorous specimen preparation with maximum heating times of 5-10 minutes below 180°C, with precise thermal monitoring and homogenization [76].
Light Exposure: Sample storage conditions significantly impact spectral integrity, as visible light can rapidly oxidize sample surfaces, altering the measured spectrum. Recommendations include storing samples in dark, temperature-controlled environments, covered with non-light-transparent lids, and measuring within one hour after preparation [76].
Visualization of Experimental Workflows and Decision Pathways
FTIR Sample Preparation Decision Pathway
The following diagram outlines the critical decision points for selecting appropriate FTIR sample preparation methods based on material properties and analytical requirements:
Round-Robin Test Experimental Workflow
The methodology employed in the RILEM interlaboratory study provides a template for rigorous validation of FTIR preparation methods:
Implications for Research and Standardization
Practical Recommendations for Different Application Domains
The reproducibility data from round-robin testing yields several field-specific implications:
Pharmaceutical and Drug Development: For drug polymorphism studies where crystalline form identification is critical, solid preparation methods like KBr pellets may be preferred despite being more time-consuming, as they minimize the risk of solvent-induced polymorphic transitions [79]. However, for quality control of formulated products, direct ATR methods offer superior throughput and reproducibility.
Biomedical Research: FTIR analysis of biological tissues reveals that different preparation methods significantly alter spectral information. Studies comparing desiccation drying, ethanol substitution, and formalin fixation show detectable changes in IR absorption band intensities and peak positions, particularly in the protein amide I region [82]. These findings underscore the necessity of standardized protocols for clinical applications.
Polymer Science: Analysis of UHMWPE for orthopaedic implants demonstrates that method standardization dramatically improves interlaboratory reproducibility. The ASTM interlaboratory studies found that area-based oxidation indices provided significantly lower uncertainty than peak-height-based methods [80].
Material Science: The RILEM findings particularly benefit fields like bituminous binder analysis, where the excellent reproducibility of solid sample methods enables more reliable tracking of ageing effects through carbonyl and sulfoxide index calculations [76] [77].
Toward Standardized FTIR Protocols
The collective evidence from interlaboratory studies strongly supports the development and adoption of standardized FTIR protocols with the following key elements:
Preferred Method Selection: Solid sample preparation methods, particularly direct ATR approaches, should be prioritized when developing standardized protocols due to their demonstrated superior reproducibility.
Detailed Procedural Specifications: Standards must explicitly define critical parameters including sample quantity, heating temperatures and durations (for thermoplastics), applied pressure, and measurement timelines relative to preparation.
Environmental Controls: Protocols should specify appropriate storage conditions between preparation and measurement, including protection from light, moisture, and atmospheric oxygen.
Reference Materials and Validation: Implementation of reference materials with known spectral properties to validate preparation technique efficacy across different laboratories.
Data Processing Harmonization: Standardization of spectral processing approaches, as evidence suggests that area-based integration methods generally provide better reproducibility than peak-height measurements [80].
The round-robin revelations presented in this technical guide provide compelling evidence that sample preparation methodology significantly impacts FTIR spectroscopic reproducibility. The quantitative data from large-scale interlaboratory studies demonstrates that solid sample preparation techniques, particularly direct ATR methods, achieve superior reproducibility (CV < 2%) compared to solvent-based approaches (CV > 7%). These findings underscore a fundamental principle within spectroscopic analysis: that pre-analytical variables exert profound influences on analytical outcomes.
For researchers and drug development professionals, these insights justify the investment in developing and validating robust sample preparation protocols tailored to specific material classes and analytical requirements. The ongoing work by standards organizations like RILEM and ASTM to establish harmonized protocols based on empirical reproducibility data represents a crucial step toward realizing the full potential of FTIR spectroscopy as a reliable, quantitative analytical technique. As FTIR continues to expand into new application domains, particularly in regulated industries, the implementation of standardized preparation methods validated through interlaboratory testing will be essential for generating comparable, trustworthy data across the scientific community.
In the realm of elemental analysis, Inductively Coupled Plasma Atomic Emission Spectroscopy (ICP-AES) stands as a powerful technique for multi-element determination. However, the accuracy and reliability of analytical results are profoundly influenced by the sample preparation stage. Sample decomposition, a critical first step, transforms a solid or complex liquid sample into a form suitable for introduction into the plasma. Inadequate preparation can lead to a host of analytical challenges, including signal drift, increased backgrounds, inadequate detection limits, and unexpected interferences [15]. This whitepaper provides a comparative analysis of five distinct sample decomposition techniques, evaluating their efficacy within the context of a broader thesis on how sample preparation fundamentally affects spectroscopic results. The findings are intended to guide researchers, scientists, and drug development professionals in selecting the most appropriate methodology for their specific analytical needs.
Core Principles: Sample Preparation and Its Impact on Spectroscopic Results
The primary goal of sample decomposition for ICP-AES is the complete dissolution of the sample matrix and the liberation of target elements into a stable, homogeneous solution, while simultaneously minimizing interferences. The high temperature of the ICP plasma (6,000–10,000 K) efficiently excites atoms, but the sample introduction system—comprising the nebulizer and spray chamber—is susceptible to clogging from particulates or high dissolved solids content [15] [83]. Furthermore, the chemical composition of the final solution, including the types of acids used and their concentrations, can significantly affect plasma stability, aerosol formation, and ultimately, the excitation and emission of analyte atoms [84].
In essence, the sample preparation method directly controls key parameters that influence the final spectroscopic data:
- Matrix Effects: The sample matrix can alter the emission signal of the analyte by changing plasma conditions (e.g., temperature, electron density) or affecting aerosol transport. A robust sample preparation method minimizes these effects to ensure accuracy [85] [86].
- Spectral Interferences: Incomplete decomposition can leave behind organic molecules or create polyatomic ions that emit light at wavelengths overlapping with analyte lines. Effective digestion destroys these potential interferents [84].
- Accuracy and Precision: The completeness of digestion and the avoidance of contamination or element loss during preparation are foundational for obtaining results that are both accurate and precise [87] [88].
Comparative Analysis of Five Decomposition Techniques
A critical study on coal humic substances (HS) provides a robust framework for comparing five sample-preparation techniques for the quantitative analysis of 31 elements by ICP-AES [88]. The techniques were evaluated from the viewpoints of complete isolation and speciation of elements. The results demonstrated that the analytical outcome significantly depends on the selected method due to the specific features of HS, the simultaneous presence of many inorganic components in wide concentration ranges, and a significant organic matrix fraction.
Table 1: Overview of Five Sample-Preparation Techniques for ICP-AES
| Technique Number | Technique Name | Primary Objective | Brief Description |
|---|---|---|---|
| 1 | Direct Analysis (Aqueous Colloidal Solution) | Bulk Composition / Speciation | Sample is dissolved in water to form a colloidal solution and directly analyzed without decomposition [88]. |
| 2 | Ashing + Fusion | Bulk Composition | Sample is asked and then decomposed by fusion with lithium metaborate (LiBO₂) at high temperature [88]. |
| 3 | Centrifugation of Aqueous Solution | Speciation (Water-Soluble) | Aqueous colloidal solution is centrifuged, and the supernatant is analyzed for water-soluble species [88]. |
| 4 | Boiling Nitric Acid Treatment | Speciation (Acid-Isoleled) | Sample is treated with boiling nitric acid to isolate acid-extractable species [88]. |
| 5 | Microwave-Assisted Acid Digestion | Speciation (Acid-Isoleled) / Bulk Composition | Sample is treated with nitric acid at 250 °C using a microwave autoclave [88]. |
The fundamental difference between these techniques lies in their analytical objective. Techniques 1 and 2 are aimed at determining the total bulk composition, albeit through vastly different approaches. In contrast, Techniques 3, 4, and 5 are used for elemental speciation, providing information on the bioavailability, mobility, and potential toxicity of elements by differentiating their chemical forms or associations within the sample [88].
Table 2: Comparative Merits and Performance of the Five Techniques
| Technique | Key Advantages | Inherent Limitations | Elemental Recovery & Performance Notes |
|---|---|---|---|
| 1. Direct Analysis | Simple, fast, no reagents; preserves original species information. | Limited to soluble/ colloidal fractions; high potential for spectral interferences from organic matrix. | Does not provide total elemental content; results are specific to the soluble fraction. |
| 2. Ashing + Fusion | Potentially complete dissolution of refractory minerals and silicates. | Time-consuming; high risk of contamination from reagents and volatilization loss of elements. | Provides total elemental content but may suffer from losses of volatile elements during ashing. |
| 3. Centrifugation | Simple; provides operational definition of "water-soluble" fraction. | Does not attack the core matrix; limited to freely available elements. | Quantifies the most bioavailable and mobile fraction of elements. |
| 4. Boiling HNO₃ | More aggressive than centrifugation; dissolves more acid-labile phases. | Open-vessel system risk of volatile element loss and contamination. | Recovers a larger fraction of acid-extractable elements compared to water alone. |
| 5. Microwave Digestion | Rapid, efficient, closed-vessel minimizes contamination and volatile loss; high temperature/pressure. | Requires specialized, costly equipment; safety considerations for pressurized vessels. | Considered one of the most effective and reliable methods for complete digestion of organic matrices, providing near-total elemental recovery [87] [15]. |
The selection of an optimal technique is highly sample-dependent. For instance, in the analysis of clarified apple juices, a simple dilution with 2% HNO₃ was found to be a fast and reliable method, as the carbohydrate matrix did not significantly affect the analysis [87]. However, for complex solid matrices like geological samples or humic substances, a combination of a total decomposition method (e.g., Technique 2 or 5) with a speciation technique is often necessary to obtain a complete picture of the sample's mineral composition [89] [88].
Experimental Protocols and Methodologies
Detailed Protocol for Microwave-Assisted Acid Digestion
Microwave-assisted digestion is widely regarded as a high-performance method due to its speed and efficiency [87] [15]. The following protocol is adapted from methodologies used for complex organic matrices:
- Sample Weighing: Accurately weigh 0.25 ± 0.05 g of a homogeneous dried/powdered sample into a dedicated microwave digestion vessel.
- Acid Addition: Add a suitable acid mixture to the vessel. For organic matrices like humic substances or plant materials, this is typically 5–7 mL of concentrated nitric acid (HNO₃). For more resistant matrices, a combination of HNO₃ and hydrochloric acid (HCl) or a small volume of hydrogen peroxide (H₂O₂) may be used [15] [88].
- Digestion Program: Secure the vessels in the microwave rotor and run the digestion program. A typical program involves ramping the temperature to 200–250 °C under controlled pressure and holding for a sufficient time (e.g., 15–20 minutes) to ensure complete oxidation of organic matter [88].
- Cooling and Transfer: After the cycle is complete and the vessels have cooled, carefully vent the containers and quantitatively transfer the digestate to a clean volumetric flask (e.g., 25 mL or 50 mL).
- Dilution: Dilute to volume with high-purity water (18.2 MΩ·cm). The resulting solution should be clear and particle-free. If necessary, further dilution with a 2% HNO₃ solution is performed to match the calibration range and minimize matrix effects [83].
Protocol for Direct Analysis of Liquid Samples
For liquid samples with a simpler matrix, a direct dilution approach is often sufficient and validated [87] [83].
- Filtration/Centrifugation: Remove any suspended particulates by filtering through a 0.45 µm membrane filter or by centrifugation.
- Acidification and Dilution: Dilute an aliquot of the sample with a 2% nitric acid solution. The dilution factor (e.g., 1:2, 1:10, 1:20) is determined by the expected analyte concentrations and the need to match the sample's matrix to that of the calibration standards [87] [83].
- Analysis: The diluted sample is then directly introduced into the ICP-OES. An internal standard (e.g., Scandium or Yttrium) is often added online to correct for signal drift and physical interferences [84].
A Strategic Workflow for Technique Selection
The decision-making process for selecting a sample decomposition technique is multifaceted. The following workflow diagram encapsulates the key considerations and pathways leading to an appropriate choice.
Essential Research Reagents and Materials
The integrity of ICP-AES analysis is contingent upon the purity and appropriateness of the reagents and materials used during sample preparation.
Table 3: The Scientist's Toolkit: Essential Reagents and Materials for Sample Decomposition
| Reagent/Material | Function in Sample Preparation | Key Considerations |
|---|---|---|
| Nitric Acid (HNO₃) | Primary oxidizer for organic matrices; common diluent [15] [83]. | Use high-purity (trace metal grade) to minimize blank contamination. |
| Hydrochloric Acid (HCl) | Dissolves carbonates, oxides, and some metals; used in aqua regia [15]. | Can form volatile chlorides; may create polyatomic interferences in ICP-MS. |
| Hydrofluoric Acid (HF) | Dissolves silicate-based matrices (e.g., soils, rocks) [89]. | Extremely hazardous. Requires specialized HF-resistant labware (e.g., PTFE). |
| Hydrogen Peroxide (H₂O₂) | Strong oxidizer often used with HNO₃ to enhance organic matter digestion [15]. | Improves oxidation efficiency of nitric acid. |
| Lithium Metaborate (LiBO₂) | Flux for fusion digestion of refractory minerals [88]. | Ensures complete dissolution of silicates and other resistant phases. |
| High-Purity Water | Diluent and rinse solution [15] [83]. | Must be 18.2 MΩ·cm resistivity to avoid introducing trace elements. |
| PTFE / Teflon Vessels | Containers for microwave and hotplate digestions [15] [89]. | Inert, withstand high temperatures and pressures. Must be meticulously cleaned. |
| Internal Standards (e.g., Sc, Y, In) | Added to samples and standards to correct for signal drift and matrix effects [89] [84]. | Should not be present in the sample and should exhibit similar behavior to analytes. |
Assessing Data Quality and Analytical Performance
Evaluating the success of a chosen decomposition method is paramount. Several quality control measures are employed:
- Spike Recovery Experiments: A known amount of analyte is added to the sample before decomposition. After processing, the measured concentration is compared to the expected value. Recoveries of 85–115% are typically indicative of an accurate and effective method with minimal interferences [87].
- Analysis of Certified Reference Materials (CRMs): The decomposition and analysis of a CRM with a similar matrix to the unknown samples provides a direct assessment of accuracy. The obtained results should be in agreement with the certified values [89] [88].
- Method Blanks: The preparation and analysis of a blank, containing all reagents but no sample, is essential to identify and correct for any contamination introduced during the preparation process [15].
The selection of a sample decomposition technique for ICP-AES is a critical decision that directly determines the quality and interpretability of spectroscopic results. As this comparative analysis demonstrates, no single method is universally superior. The choice hinges on a clear understanding of the analytical objective (total content vs. speciation), the sample matrix (simple liquid vs. complex solid), and available resources.
For the determination of total elemental content in complex solid matrices, microwave-assisted digestion offers an excellent balance of efficiency, completeness, and minimized contamination. For simpler liquid matrices or specific speciation studies, direct dilution or milder extraction techniques are validated and effective. Ultimately, a well-chosen and correctly executed sample preparation protocol is not merely a preliminary step but the very foundation upon which reliable, high-quality elemental analysis is built, profoundly shaping the outcomes and conclusions of scientific research.
Conclusion
Sample preparation is not a mere preliminary step but a decisive factor that fundamentally controls the quality, reliability, and interpretability of spectroscopic data. A thorough understanding of foundational principles, combined with the rigorous application of technique-specific protocols and continuous optimization, is paramount for success. The future of spectroscopic analysis in biomedical research points toward increased automation, standardized validation frameworks, and integrated sample preparation and detection systems. By adopting a strategic and evidence-based approach to sample preparation, researchers can unlock greater analytical precision, accelerate drug development pipelines, and generate the robust, reproducible data required for clinical decision-making and scientific advancement.
References
- 1. Spectroscopic Sample Preparation: Techniques for ... [https://www.metkon.com/spectroscopic-sample-preparation/]
- 2. WHAT are sampling errors—and WHAT can we do about ... [https://www.spectroscopyeurope.com/sampling/what-are-sampling-errors%E2%80%94and-what-can-we-do-about-them-part-1]
- 3. Quantitative Accuracy and Sample Preparation [https://www.sepscience.com/sample-prep-solutions-4-quantitative-accuracy-and-sample-preparation-pre-preparation-steps-to-improve-results-6909]
- 4. Common Mistakes Preparing Samples for Chromatography ... [https://blog.organomation.com/blog/common-mistakes-preparing-samples-for-chromatography-mass-spectrometry]
- 5. Matrix Effects on Quantitation in Liquid Chromatography [https://www.chromatographyonline.com/view/matrix-effects-on-quantitation-in-liquid-chromatography-sources-and-solutions]
- 6. Implementation-focused evaluation of transmission low-frequency... [https://pubs.rsc.org/en/content/articlehtml/2025/pm/d5pm00214a]
- 7. Effects of Particle Size on the Attenuated Total Reflection ... [https://pubmed.ncbi.nlm.nih.gov/27671141/]
- 8. Using spectral methods to obtain particle size information ... [https://acp.copernicus.org/articles/18/5499/2018/]
- 9. Homogeneity and heterogeneity in near-infrared FTIR spectra ... [https://earth-planets-space.springeropen.com/articles/10.1186/s40623-023-01784-w]
- 10. What is matrix effect and how is it quantified? [https://sciex.com/support/knowledge-base-articles/what-is-matrix-effect-how-to-quantify-it_en_us]
- 11. X-ray Fluorescence Spectroscopy, Part II: Sample ... [https://www.spectroscopyonline.com/view/x-ray-fluorescence-spectroscopy-part-ii-sample-preparation]
- 12. Sample preparation for XRF [https://elvatech.com/sample-preparation-for-xrf/]
- 13. Effect of sample preparation procedure on standardless ... [https://www.sciencedirect.com/science/article/abs/pii/S0584854721002159]
- 14. Inductively Coupled Plasma Mass Spectrometry: Introduction ... [https://pmc.ncbi.nlm.nih.gov/articles/PMC6719745/]
- 15. Key Steps to Create a Sample Preparation Strategy for ... [https://www.spectroscopyonline.com/view/key-steps-to-create-a-sample-preparation-strategy-for-inductively-coupled-plasma-icp-or-icp-mass-spectrometry-icp-ms-analysis]
- 16. Improving methods for sample preparation of biological ... [https://www.sciencedirect.com/science/article/abs/pii/S1387380624001660]
- 17. Sample Preparation Problem Solving for Inductively ... [https://pmc.ncbi.nlm.nih.gov/articles/PMC4550584/]
- 18. Fourier transform infrared spectroscopic technique for analysis ... [https://pubs.rsc.org/en/content/articlehtml/2025/na/d5na00522a]
- 19. Exploring Fourier Transform Infrared (FTIR) spectroscopy ... [https://pmc.ncbi.nlm.nih.gov/articles/PMC11182784/]
- 20. Why is Sample Preparation Critical in Analytical Chemistry [https://www.phenomenex.com/knowledge-center/spe-knowledge-center/sample-preparation-analytical-chemistry?srsltid=AfmBOoqmAF2r4eb1yDkeQW4NZA9fXRSMt8EMqt37KR4k2pEkGePOtwSO]
- 21. Quantitative Analysis in Spectroscopy [https://www.numberanalytics.com/blog/quantitative-analysis-spectroscopy-guide]
- 22. How to Use a “Total Workflow” Sample Prep Approach ... [https://www.spectroscopyonline.com/view/how-to-use-a-total-workflow-sample-prep-approach-to-optimize-elemental-analysis]
- 23. A Brief Review of the Latest Spectroscopic Research in Environmental Analysis [https://www.spectroscopyonline.com/view/a-brief-review-of-the-latest-spectroscopic-research-in-environmental-analysis]
- 24. Sample preparation optimization by central composite ... [https://www.sciencedirect.com/science/article/abs/pii/S0021967321004933]
- 25. How to Optimize Environmental Sample Preparation and ... [https://www.spectroscopyonline.com/view/how-to-optimize-environmental-sample-preparation-and-analysis]
- 26. Sample Preparation for FTIR Analysis [https://www.drawellanalytical.com/sample-preparation-for-ftir-analysis-sample-types-and-prepare-methods/]
- 27. Key Considerations for XRF Pelletising [https://www.xrfscientific.com/key-considerations-for-xrf-pelletising/]
- 28. FTIR Sample Handling Buyer's Guide [https://www.labcompare.com/10-Featured-Articles/579565-FTIR-Sample-Handling-Buyer-s-Guide/]
- 29. Sample preparation for XRF analysis - Metallic materials [https://www.malvernpanalytical.com/en/learn/knowledge-center/insights/sample-preparation-for-xrf-analysis-metallic-materials]
- 30. Checklist for making XRF pellets | Spectroscopy Guides [https://specac.com/theory-articles/checklist-for-making-xrf-pellets-spectroscopy-guides/]
- 31. An evaluation of resolution, accuracy, and precision in FT- ... [https://www.sciencedirect.com/science/article/abs/pii/S138614252400711X]
- 32. Sample Preparation for UV-Vis Spectroscopy [https://www.ossila.com/pages/preparing-samples-uv-vis-spectroscopy]
- 33. - ICP | Thermo Fisher Scientific - US MS Sample Preparation [https://www.thermofisher.com/us/en/home/industrial/spectroscopy-elemental-isotope-analysis/spectroscopy-elemental-isotope-analysis-learning-center/trace-elemental-analysis-tea-information/inductively-coupled-plasma-mass-spectrometry-icp-ms-information/icp-ms-sample-preparation.html]
- 34. Sample Preparation of Drug Substances and Products in ... [https://www.chromatographyonline.com/view/sample-preparation-of-drug-substances-and-products-in-regulated-testing-a-primer]
- 35. Fully Automated Deep Learning Enabled Miniature Mass ... [https://pmc.ncbi.nlm.nih.gov/articles/PMC12407256/]
- 36. Assessing the impact of common sample preparation ... [https://pubs.rsc.org/en/content/articlelanding/2025/ja/d5ja00170f]
- 37. Optimized high-throughput protocols for comprehensive ... [https://www.sciencedirect.com/science/article/abs/pii/S0039914024013328]
- 38. MSACL 2025 [https://www.shimadzu.eu/news-events/2025/MSACL.html]
- 39. High-throughput lipid profiling of plant tissues using ... [https://sciex.com/tech-notes/life-science-research/lipidomics/high-throughput-lipid-profiling-of-plant-tissues]
- 40. Automated Sample Preparation for High-Throughput Drug ... [https://www.preomics.com/blog/automated-sample-preparation-drug-discovery]
- 41. Spectroscopic Analysis of the Effects of Alkaline Extractants ... [https://www.spectroscopyonline.com/view/spectroscopic-analysis-of-the-effects-of-alkaline-extractants-on-humic-acids-isolated-from-herbaceous-peat]
- 42. Assessing the impact of common sample preparation ... [https://pubs.rsc.org/en/content/articlehtml/2025/ja/d5ja00170f]
- 43. How to Reduce Sample Contamination [https://blog.omni-inc.com/blog/how-to-reduce-sample-contamination]
- 44. Contamination Control During Sample Preparation for ... [https://www.spectroscopyonline.com/view/contamination-control-during-sample-preparation-for-trace-element-analysis-of-electronic-cigarette-aerosol-with-inductively-coupled-plasma-mass-spectrometry-part-1]
- 45. An In-Situ Cleaning Verification Process [https://www.spectroscopyonline.com/view/quantification-active-pharmaceutical-ingredients-metal-surfaces-using-mid-ir-grazing-angle-fiber-opt]
- 46. In-house protocol: spin-based viral RNA purification [https://amb-express.springeropen.com/articles/10.1186/s13568-022-01413-x]
- 47. In-house Extraction and Purification of Pfu-Sso7d, a High- ... [https://en.bio-protocol.org/en/bpdetail?id=4967&type=0]
- 48. ATR–FTIR‐Based Direct and Rapid Quantification of ... [https://pmc.ncbi.nlm.nih.gov/articles/PMC12491855/]
- 49. FTIR-ATR: Revolutionizing Raw Material Identification in ... [https://www.apexinstrument.me/ftir-atr-a-game-changer-for-pharma-and-food-raw-material-identification/]
- 50. Advances in ATR-FTIR Spectroscopic Imaging for the ... [https://pmc.ncbi.nlm.nih.gov/articles/PMC10301043/]
- 51. Common Problems with FT-IR Instruments and How to ... [https://www.spectroscopyonline.com/view/common-problems-with-ft-ir-instruments-and-how-to-avoid-them]
- 52. Combination ATR-FTIR with Multiple Classification ... [https://www.mdpi.com/1424-8220/25/1/50]
- 53. Determination of trace amounts with ATR FTIR ... [https://www.sciencedirect.com/science/article/abs/pii/S0039914019305867]
- 54. The method based on ATR‐FTIR spectroscopy combined with ... [https://pmc.ncbi.nlm.nih.gov/articles/PMC11521652/]
- 55. Top 10 Lab Automation Software Solutions [https://www.materials.zone/blog/top-10-lab-automation-software-solutions]
- 56. A Flexible End-to-End Automated Sample Preparation ... [https://pmc.ncbi.nlm.nih.gov/articles/PMC12529477/]
- 57. Microwave Digestion [https://www.milestonesrl.com/greenbooks/126-blog2022/microwave-digestion/index.php]
- 58. Understanding the Significance of Sample Preparation in ... [https://pmc.ncbi.nlm.nih.gov/articles/PMC9204816/]
- 59. Lab Automation Software Unit [https://www.weizmann.ac.il/pcf/units/lab-automation-software-unit/about-the-service]
- 60. An assessment of the impact of extraction and digestion ... [https://pmc.ncbi.nlm.nih.gov/articles/PMC6571087/]
- 61. Quantification and distribution of trace elements in fusion ... [https://www.sciencedirect.com/science/article/abs/pii/S0584854720305024]
- 62. Optimizing Fusion Bead Preparation for High-Precision ... [https://www.xrfscientific.com/optimizing-fusion-bead-preparation-for-high-precision-xrf-analysis/]
- 63. Elemental analysis: operation & applications [https://www.elementar.com/en/elementar-academy/elemental-analysis-precise-determination-of-elemental-concentrations]
- 64. Best practices for sample preparation in elemental analysis [https://www.elementar.com/en-us/blog/best-practices-for-sample-preparation-in-elemental-analysis]
- 65. Evaluation of the Quantitative Performance of Different ... [https://www.sciencedirect.com/science/article/pii/S0946672X25001646]
- 66. Sample Preparation and Submission Guidelines [https://sites.krieger.jhu.edu/mass-spec/sample-preparation-and-submission-guidelines/]
- 67. Extending certified spectral fluorescence standards for the calibration and performance validation of fluorescence instruments to the NIR—closing the gap from 750 to 940 nm with two novel NIR dyes | Analytical and Bioanalytical Chemistry [https://link.springer.com/article/10.1007/s00216-024-05723-w]
- 68. Validation of an automated sample preparation module directly connected to LC-MS/MS (CLAM-LC-MS/MS system) and comparison with conventional immunoassays for quantitation of tacrolimus and cyclosporin A in a clinical setting | Journal of Pharmaceutical Health Care and Sciences | Full Text [https://jphcs.biomedcentral.com/articles/10.1186/s40780-023-00318-6]
- 69. Validation of an automated sample preparation module ... [https://pmc.ncbi.nlm.nih.gov/articles/PMC10773076/]
- 70. Validation of an automated sample preparation module ... [https://pubmed.ncbi.nlm.nih.gov/38191469/]
- 71. A Practical Guide to Immunoassay Method Validation - PMC [https://pmc.ncbi.nlm.nih.gov/articles/PMC4541289/]
- 72. Improving Quality And Speed In Immunoassay Development [https://www.gyrosproteintechnologies.com/spinblog/immunoassay-development-validation]
- 73. Workflow Optimization: How It Works, Best Practices ... - IBML [https://www.ibml.com/blog/6-workflow-automation-best-practices-to-optimize-your-business-processes/]
- 74. Fourier transform infrared spectroscopic technique for analysis of... [https://pmc.ncbi.nlm.nih.gov/articles/PMC12426772/]
- 75. of pre-analytical variables on Raman and Effect spectral content... FTIR [https://pubs.rsc.org/en/content/articlelanding/2023/an/d3an00686g]
- 76. Evaluating the reproducibility and consistency of different ... [https://link.springer.com/article/10.1617/s11527-025-02755-1]
- 77. Evaluating the reproducibility and consistency of different ... [https://research.aalto.fi/en/publications/evaluating-the-reproducibility-and-consistency-of-different-sampl/]
- 78. RILEM Association's Post [https://www.linkedin.com/posts/rilem-association_evaluating-the-reproducibility-and-consistency-activity-7378292495509504001-h_qe]
- 79. Comparison of different Solid Sampling Techniques for FT [https://lab-training.com/comparison-of-different-solid-sampling-techniques-for-ft-ir-spectroscopy/]
- 80. Interlaboratory studies to determine optimal analytical ... [https://www.sciencedirect.com/science/article/abs/pii/S0142961201000333]
- 81. How to Interpret FTIR : A Beginner's Guide Results [https://www.azooptics.com/Article.aspx?ArticleID=2756]
- 82. Importance of Tissue Preparation Methods in FTIR ... | PLOS One [https://journals.plos.org/plosone/article?id=10.1371/journal.pone.0116491]
- 83. ICP Analysis [https://ral.cfans.umn.edu/tests-analysis/icp-analysis]
- 84. How to Address Interference Challenges in ICP-AES for ... [https://www.drawellanalytical.com/how-to-address-interference-challenges-in-icp-aes-for-complex-matrices/]
- 85. ICP-OES Capabilities, Developments, Limitations, and Any ... [https://www.spectroscopyonline.com/view/icp-oes-capabilities-developments-limitations-and-any-potential-challengers]
- 86. Performances in ICP-OES [https://www.horiba.com/usa/scientific/technologies/inductively-coupled-plasma-optical-emission-spectroscopy-icp-oes/performances-in-icp-oes/]
- 87. Comparison of sample preparation methods for the ICP- ... [https://www.sciencedirect.com/science/article/abs/pii/S0026265X11001214]
- 88. Comparative Study of Sample-Preparation Techniques for ... [https://www.mdpi.com/2073-4395/11/12/2453]
- 89. Simultaneous Determination of 50 Elements in Geological ... [https://www.spectroscopyonline.com/view/simultaneous-determination-of-50-elements-in-geological-samples-by-icp-ms-combined-with-icp-oes]