UV-Vis Spectrophotometry in Pharma: A Complete Guide to Instrumentation, Applications, and Compliance
This comprehensive guide explores the essential role of UV-Vis spectrophotometry in the pharmaceutical industry, tailored for researchers, scientists, and drug development professionals.
UV-Vis Spectrophotometry in Pharma: A Complete Guide to Instrumentation, Applications, and Compliance
Abstract
This comprehensive guide explores the essential role of UV-Vis spectrophotometry in the pharmaceutical industry, tailored for researchers, scientists, and drug development professionals. It covers foundational instrument principles and components, details methodological applications from drug discovery to quality control, provides practical troubleshooting and optimization strategies for regulated environments, and examines method validation and comparative analysis with techniques like HPLC. The content aligns with current industry practices and regulatory standards, including USP, EP, and ICH guidelines, to ensure data integrity and compliance in pharmaceutical analysis.
UV-Vis Spectrophotometer Fundamentals: Core Components and Operating Principles for Pharma Analysis
This technical guide explores the fundamental principles and applications of Ultraviolet-Visible (UV-Vis) spectrophotometry within pharmaceutical research and development. Focusing on the core Beer-Lambert Law, this whitepaper details the instrumentation, operational mechanisms, and practical methodologies for quantitative analysis. It further examines the critical role of UV-Vis spectroscopy in ensuring drug quality, safety, and efficacy through applications in identity testing, assay, impurity profiling, and dissolution testing, providing drug development professionals with a foundational understanding of this essential analytical technique.
Ultraviolet-visible (UV-Vis) spectrophotometry is an analytical technique that measures the amount of discrete wavelengths of ultraviolet (UV) or visible (Vis) light absorbed by a substance in solution [1]. The technique operates within the wavelength range of approximately 100-400 nm (ultraviolet) and 400-800 nm (visible) of the electromagnetic spectrum [2]. In the pharmaceutical industry, UV-Vis spectroscopy is a well-established, indispensable tool for the qualitative and quantitative analysis of Active Pharmaceutical Ingredients (APIs), excipients, and finished drug products [3] [4]. Its widespread adoption is driven by its simplicity, reliability, cost-effectiveness, and ability to provide highly accurate measurements for regulatory compliance with pharmacopeial standards such as the United States Pharmacopeia (USP), European Pharmacopoeia (EP), and Japanese Pharmacopoeia (JP) [4].
The fundamental process involves promoting electrons in a molecule from a ground state to a higher energy excited state [2]. For organic molecules, this typically involves transitions of π, n, or σ electrons to π* or σ* anti-bonding orbitals [5]. The specific energy (wavelength) at which a compound absorbs light is characteristic of its molecular structure, particularly the presence of chromophores—functional groups capable of absorbing UV or visible radiation [2]. Conjugated systems, which are common in many drug molecules, often produce strong, characteristic absorption spectra [5].
Fundamental Principles: The Beer-Lambert Law
The quantitative foundation of UV-Vis spectroscopy is the Beer-Lambert Law (also known as Beer's Law). This law establishes a linear relationship between the absorbance of light by a solution and the concentration of the absorbing species within it [6] [7] [8]. It combines the work of Johann Heinrich Lambert, who stated that absorbance is proportional to the path length of light through the medium, and August Beer, who stated that absorbance is proportional to the concentration of the solution [6].
Mathematical Formulation
The Beer-Lambert Law is expressed by the equation: A = εcl Where:
- A is the Absorbance (a dimensionless quantity) [7] [8].
- ε is the Molar Absorptivity (or molar extinction coefficient), with units of Mâ»Â¹cmâ»Â¹ [6] [8].
- c is the Molar Concentration of the absorbing species, with units of M (mol/L) [6] [8].
- l is the Path Length, which is the distance the light travels through the solution, typically measured in cm (standard cuvettes use 1 cm) [6] [8].
Absorbance is defined mathematically as the negative logarithm of Transmittance (T): A = -logâ‚â‚€(T) = logâ‚â‚€(Iâ‚€/I) Where:
- T is the Transmittance (I/Iâ‚€), often expressed as a percentage (%T) [7].
- Iâ‚€ is the Intensity of the incident light [6] [7].
- I is the Intensity of the transmitted light after passing through the sample [6] [7].
The following table illustrates the inverse logarithmic relationship between absorbance and transmittance:
Table 1: Relationship Between Absorbance and Transmittance
| Absorbance (A) | Transmittance (%T) |
|---|---|
| 0 | 100% |
| 1 | 10% |
| 2 | 1% |
| 3 | 0.1% |
| 4 | 0.01% |
| 5 | 0.001% |
Molar Absorptivity and its Significance
The molar absorptivity (ε) is a crucial parameter in the Beer-Lambert Law. It is defined as the absorbance of a 1 Molar solution measured in a cuvette with a 1 cm path length [6]. This value is a physical constant for a given substance at a specific wavelength and under specific conditions of solvent and temperature [6]. It is a measure of how strongly a chemical species absorbs light at a particular wavelength. Absorption bands with ε values above 10â´ Mâ»Â¹cmâ»Â¹ are considered high-intensity, while those below 10³ Mâ»Â¹cmâ»Â¹ are classified as low-intensity [6].
Instrumentation of a UV-Vis Spectrophotometer
A UV-Vis spectrophotometer is designed to measure the absorption of light by a sample across a range of wavelengths. While designs vary (e.g., single-beam, double-beam, array-based), they share several core components that work in sequence.
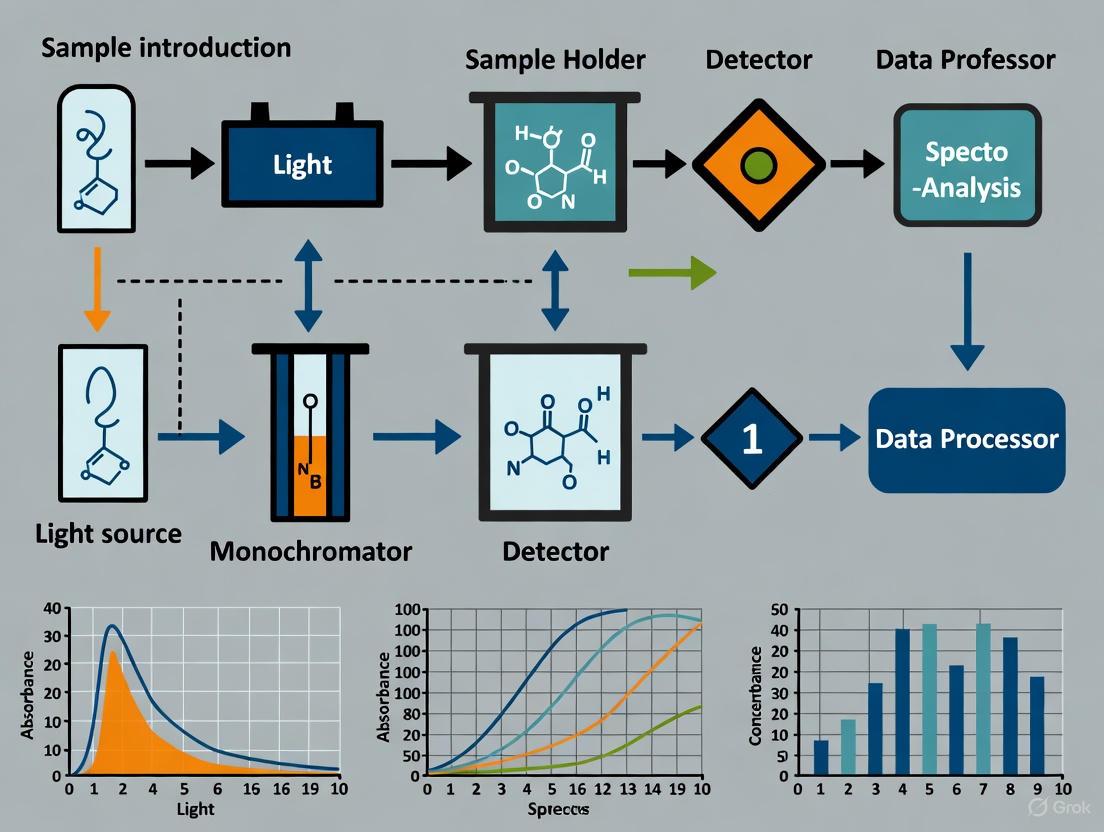
Diagram 1: Core Components and Workflow of a UV-Vis Spectrophotometer [1]
Core Components and Their Function
Table 2: Key Components of a UV-Vis Spectrophotometer
| Component | Function | Common Types & Notes |
|---|---|---|
| Light Source | Provides broad-spectrum UV and visible light. | Tungsten/Halogen lamp (visible), Deuterium lamp (UV), Xenon lamp (both). The instrument switches between lamps around 300-350 nm [1]. |
| Wavelength Selector (Monochromator) | Isolates a narrow band of wavelengths from the broadband source. | Typically a diffraction grating with 1200+ grooves/mm. Filters may be used for further refinement [1]. |
| Sample Holder | Holds the sample solution for analysis. | Cuvettes (typically with 1 cm path length). For UV light, quartz is essential; glass or plastic can be used for visible range only [1] [2]. |
| Detector | Measures the intensity of the transmitted light. | Photomultiplier Tube (PMT), photodiodes, or Charge-Coupled Devices (CCDs). Converts light intensity into an electrical signal [1]. |
| Computer/Readout | Processes the signal from the detector and displays the results. | Outputs an absorbance spectrum (Absorbance vs. Wavelength) or a single absorbance value [1]. |
The Measurement Process and Blank Correction
The measurement process involves a critical step of blank correction. The instrument first measures the intensity of light passing through a reference or blank cuvette containing only the solvent used to prepare the sample [1] [9]. This intensity is registered as Iâ‚€. The sample cuvette, containing the analyte dissolved in the same solvent, is then measured, giving I. The instrument's software then automatically calculates the absorbance using A = logâ‚â‚€(Iâ‚€/I). This process corrects for any absorption or reflection caused by the solvent and the cuvette itself, ensuring that the reported absorbance is due solely to the analyte of interest [1].
Quantitative Analysis and Experimental Protocols
The primary utility of the Beer-Lambert Law in pharmaceutical research is the quantitative determination of analyte concentration. This is typically achieved via the method of calibration curves.
Determining Unknown Concentration
If the molar absorptivity (ε) of a compound is known, its concentration can be directly determined by measuring its absorbance and applying the Beer-Lambert Law rearranged to: c = A / (εl) [9] However, the more common and reliable method, especially for ensuring accuracy under specific experimental conditions, is to use a calibration curve [7].
Experimental Protocol: Creating a Calibration Curve
This protocol outlines the standard method for determining the concentration of an unknown pharmaceutical sample, such as an API.
- Preparation of Standard Solutions: Prepare a series of standard solutions with known, increasing concentrations of the analyte. These should cover a range that includes the expected concentration of the unknown sample [7].
- Selection of Analytical Wavelength: Identify the wavelength of maximum absorption (λ_max) for the analyte, typically by obtaining a full absorption spectrum of one of the standard solutions.
- Measurement of Absorbance: Using the spectrophotometer, measure the absorbance of each standard solution at the λ_max. The blank solution (solvent without analyte) should be measured first to zero the instrument.
- Plotting the Calibration Curve: Plot the measured absorbance (y-axis) against the known concentration (x-axis) for each standard solution. The Beer-Lambert Law predicts a linear relationship, and the data points should be fitted with a straight line (y = mx + b, where m = εl) [7].
- Analysis of the Unknown: Measure the absorbance of the unknown sample at the same λ_max and under the same instrumental conditions. Locate this absorbance value on the y-axis of the calibration curve, trace horizontally to the best-fit line, and then vertically down to the x-axis to determine the corresponding concentration.
Table 3: Example Data for a Rhodamine B Calibration Curve
| Solution | Concentration (M) | Absorbance at λ_max |
|---|---|---|
| Standard 1 | 1.0 x 10â»â¶ | 0.15 |
| Standard 2 | 2.5 x 10â»â¶ | 0.38 |
| Standard 3 | 5.0 x 10â»â¶ | 0.72 |
| Standard 4 | 7.5 x 10â»â¶ | 1.05 |
| Standard 5 | 1.0 x 10â»âµ | 1.45 |
| Unknown Sample | To be determined | 0.89 |
Data adapted from an example in the search results [7].
The Scientist's Toolkit: Essential Research Reagents and Materials
Table 4: Key Materials and Reagents for UV-Vis Analysis in Pharma
| Item | Function / Rationale |
|---|---|
| High-Purity Solvents (e.g., Water, Ethanol, Buffers) | To dissolve the analyte without introducing interfering absorbances. The solvent must be transparent in the spectral region of interest [5]. |
| Quartz Cuvettes (1 cm path length) | Standard sample holders for UV-Vis measurements. Quartz is transparent throughout the UV and visible range, unlike glass or plastic [1]. |
| Volumetric Flasks and Pipettes | For accurate preparation and dilution of standard and sample solutions. High accuracy is critical for reliable calibration curves. |
| Standard Reference Material (API) | A high-purity sample of the analyte of known concentration to prepare accurate standard solutions for calibration. |
| Buffer Solutions | To maintain a constant pH, which can critically affect the absorption spectrum of many pharmaceutical compounds (e.g., tyrosine) [5]. |
| Guvacoline Hydrobromide | Guvacoline Hydrobromide | Acetylcholine Analogue |
| 3-Fluoro-4-Iodopyridine | 3-Fluoro-4-Iodopyridine, CAS:22282-75-3, MF:C5H3FIN, MW:222.99 g/mol |
Applications in Pharmaceutical Research and Development
UV-Vis spectroscopy is deeply embedded in the drug development lifecycle, from initial discovery to final quality control (QC). Its applications directly support regulatory requirements for drug approval [3] [4].
Diagram 2: Key Pharmaceutical Applications of UV-Vis Spectroscopy in the Drug Development Workflow [3] [4]
- Identity Testing: UV-Vis spectroscopy can confirm the identity of a drug substance by verifying that its absorption spectrum (particularly λ_max) matches that of a reference standard, as required by pharmacopeias [3] [4]. For example, the USP and EP include UV-Vis identification tests for drugs like Ibuprofen [4].
- Assay and Potency Testing: This is a direct application of the Beer-Lambert Law to quantify the concentration of the API in a drug substance or finished product, ensuring it matches the labeled amount [3].
- Dissolution Testing: For solid oral dosage forms like tablets, UV-Vis spectrophotometers are routinely used to analyze dissolution testing results, monitoring the rate and extent to which the API dissolves from the dosage form into the dissolution medium [3] [4].
- Impurity and Purity Assessment: The technique can detect and quantify impurities in drug ingredients, especially if the impurities have different absorption characteristics than the API. It is also used to check the purity of biological samples like nucleic acids (DNA/RNA) and proteins [3] [4].
Practical Considerations and Limitations
While robust, the Beer-Lambert Law and UV-Vis spectroscopy have inherent limitations that scientists must recognize to ensure data accuracy.
Deviations from the Beer-Lambert Law
Deviations from linearity between absorbance and concentration can occur due to:
- High Concentration: At high concentrations (>0.01 M), electrostatic interactions between molecules can alter the absorptivity of the analyte [8] [10]. Furthermore, at very high absorbances, the instrument may struggle to detect the small amount of transmitted light.
- Chemical Associations: Equilibrium processes such as dimerization or polymerization can change the nature of the absorbing species [8].
- Instrumental Factors: Stray light (light reaching the detector at wavelengths outside the selected band) is a major cause of negative deviation at high absorbances [5]. A narrow spectral bandwidth is required for monochromatic light and linearity [5].
- Light Scattering: Samples that are turbid or contain particulate matter scatter light, leading to falsely high absorbance readings [2].
Best Practices for Accurate Measurements
- Concentration Range: Analyze samples within the absorbance range where the instrument provides a linear response, typically between 0.1 and 1.0 Absorbance Units (AU). Samples with A > 1 should be diluted [1].
- Wavelength Selection: Perform quantitative measurements at an absorption peak (λ_max) where the rate of change of absorbance with wavelength is lowest, minimizing errors from small inaccuracies in wavelength calibration [5].
- Sample Preparation: Ensure samples are homogeneous and free of bubbles or undissolved solids that could scatter light [2].
UV-Vis spectrophotometry, grounded in the fundamental Beer-Lambert Law, remains a cornerstone analytical technique in pharmaceutical research and quality control. Its ability to provide rapid, accurate, and quantitative data on drug identity, strength, purity, and performance is critical for ensuring the safety and efficacy of pharmaceutical products. A thorough understanding of its principles, instrumentation, applications, and limitations empowers scientists and drug development professionals to effectively leverage this versatile tool in meeting the rigorous demands of the industry and global regulatory standards.
Ultraviolet-Visible (UV-Vis) spectrophotometry serves as an indispensable analytical technique in pharmaceutical research and quality control. This instrumental method provides the foundation for ensuring drug identity, purity, and efficacy from early development through final product release. The reliability of UV-Vis spectroscopy hinges on the integrated performance of its core components, each playing a critical role in generating accurate, reproducible data that complies with stringent regulatory standards. For pharmaceutical scientists, understanding the instrument's inner workings is not merely academic—it is essential for method development, troubleshooting, and validating analytical procedures that satisfy pharmacopeial requirements from the United States Pharmacopeia (USP), European Pharmacopoeia (EP), and Japanese Pharmacopoeia (JP) [4]. This guide deconstructs the UV-Vis spectrophotometer into its fundamental components, examining the principle and operation of each from the light source to the detector.
The Operating Principle: Beer-Lambert Law
The fundamental principle underlying UV-Vis spectroscopy is the Beer-Lambert Law, which states that the absorbance of light by a solution is directly proportional to the concentration of the absorbing species and the path length of the light through the solution [11] [1].
The law is mathematically expressed as: A = εcl Where:
- A is Absorbance (unitless)
- ε is the molar absorptivity (L·molâ»Â¹Â·cmâ»Â¹)
- c is the concentration of the analyte (mol·Lâ»Â¹)
- l is the optical path length of the cell (cm) [11]
This linear relationship is the basis for quantitative analysis, allowing researchers to determine the concentration of an active pharmaceutical ingredient (API) or identify impurities by measuring absorbance at specific wavelengths [3].
Core Components of a UV-Vis Spectrophotometer
A UV-Vis spectrophotometer is an integrated system of optical, mechanical, and electronic modules. The sequential workflow between these components ensures precise measurement of a sample's interaction with light.
Light Source
The light source must provide stable, intense radiation across the entire UV-Vis range (typically 190–800 nm) [11]. No single lamp covers this entire range optimally, so instruments often use multiple sources.
Table 1: Common Light Sources in UV-Vis Spectrophotometry
| Source Type | Spectral Range | Key Characteristics | Pharmaceutical Application Context |
|---|---|---|---|
| Deuterium Lamp | 190–400 nm (UV) [11] [12] | Intense, continuous UV spectrum; often paired with a halogen lamp [11] [1]. | Essential for API quantification and impurity profiling at low UV wavelengths, as required by ICH guidelines [13]. |
| Tungsten-Halogen Lamp | 350–800 nm (Visible) [11] | Stable, smooth output in visible and NIR regions; long-lasting [12]. | Used for dissolution testing of colored tablets and visual purity assessment [3] [4]. |
| Xenon Lamp | 200–1000 nm (UV-Vis) [14] [12] | High-intensity, continuous broad spectrum; more expensive and less stable than dual-lamp systems [11] [1]. | Often found in research-grade instruments for rapid scanning and kinetic studies of drug reactions [4]. |
In instruments with two lamps, an automated switchover occurs between 300 and 350 nm, where the light output from both sources is comparable, ensuring a smooth transition [11] [1].
Wavelength Selector (Monochromator)
The monochromator isolates a narrow band of wavelengths from the broad spectrum emitted by the light source. Its key components include an entrance slit, a diffraction grating, and an exit slit [11] [1]. The grating, which can be rotated, disperses the light, allowing only a specific wavelength to pass through the exit slit and reach the sample. The quality of the monochromator is often defined by its groove frequency (typically 1200 grooves/mm or higher) and its optical resolution, which directly impacts the ability to resolve fine spectral details—a critical factor in identifying and quantifying complex pharmaceutical compounds [1].
Sample Container (Cuvette)
The sample holder is a critical yet sometimes overlooked component. The sample, typically in solution, is held in a transparent container called a cuvette.
Table 2: Common Cuvette Types and Properties
| Cuvette Material | Wavelength Range | Key Characteristics | Suitability for Pharma Analysis |
|---|---|---|---|
| Quartz | 190–2500 nm [12] | Transparent across UV and Vis ranges; chemically inert. | Essential for UV analysis below 350 nm, e.g., for nucleic acid purity checks or protein analysis [1]. |
| Glass | 350–2000 nm | Absorbs UV light below ~350 nm; economical. | Suitable for visible-range analyses only, such as colorimetric assays in dissolution testing [1]. |
| Plastic | ~400–800 nm | Disposable, low-cost; absorbs most UV light. | Limited to educational or specific visible-light QC checks; not suitable for regulated pharmaceutical QC [1]. |
Standard path lengths are 1 cm, but varying this length is a primary method for keeping absorbance within the ideal quantitative range (0.1–1.0 AU) for highly concentrated or absorbing samples [1].
Detector
The detector converts the transmitted light intensity into an electrical signal proportional to the light's intensity. The choice of detector significantly impacts the instrument's sensitivity and signal-to-noise ratio [15] [1].
Table 3: Detector Technologies in UV-Vis Spectrophotometry
| Detector Type | Principle of Operation | Sensitivity & Speed | Use Case in Pharmaceutical Analysis |
|---|---|---|---|
| Photomultiplier Tube (PMT) | Photoelectric effect; ejected electrons are amplified through a series of dynodes [15] [1]. | Very high sensitivity; fast response time [15] [1]. | The workhorse for high-precision QC assays requiring low detection limits, such as quantifying low-level impurities per ICH Q3A [13] [1]. |
| Photodiode Array (PDA) | An array of silicon photodiodes on a chip; measures all wavelengths simultaneously [13] [15]. | Less sensitive than PMT but offers instantaneous spectrum capture [15]. | Ideal for peak purity assessment in HPLC (DAD), method development, and rapid scanning without wavelength lag [13]. |
| Charge-Coupled Device (CCD) | Similar to PDA but uses an array of photo-capacitors (pixels) [15]. | High sensitivity for low-intensity light; low noise [15]. | Used in specialized applications requiring high sensitivity across a wide spectral range, such as advanced research instrumentation [15]. |
Essential Protocols for Pharmaceutical Analysis
The following standard operating procedures (SOPs) are foundational in pharmaceutical analysis and leverage the components described above.
Protocol 1: Verification of Identity and Purity via Absorption Scan
This protocol is used to confirm the identity of a drug substance and check for impurities by comparing its absorption spectrum to a reference standard [3] [4].
- Instrument Calibration: Perform a baseline correction (blanking) using the pure solvent in a matched quartz cuvette.
- Sample Preparation: Dissolve the drug substance to an appropriate concentration in a suitable solvent. A target absorbance below 1.0 AU is ideal for quantitative work [1].
- Data Acquisition: Place the sample in the spectrophotometer. Using a PMT or PDA detector, acquire a full absorption spectrum across a relevant range (e.g., 200–350 nm for many APIs).
- Analysis: Identify the wavelength of maximum absorption (λmax). Compare the sample's λmax and overall spectral shape to a reference standard. The presence of unexpected peaks or shoulder broadening can indicate impurities [3] [11].
Protocol 2: Quantification of an Active Pharmaceutical Ingredient (API)
This method uses the Beer-Lambert law to determine the concentration of an API in a solution, critical for assay and potency tests [3] [4].
- Standard Curve Generation: Prepare a series of standard solutions of the API reference material at known concentrations.
- Absorbance Measurement: Measure the absorbance of each standard at the predetermined λmax using a stable deuterium or tungsten-halogen light source.
- Calibration Plot: Construct a plot of absorbance versus concentration. The plot should be linear, and the slope is equivalent to εl [11].
- Sample Measurement: Measure the absorbance of the unknown sample under identical conditions and use the calibration plot to determine its concentration.
The Scientist's Toolkit: Key Research Reagent Solutions
Table 4: Essential Materials for UV-Vis Analysis in Pharma Research
| Item | Function & Importance |
|---|---|
| High-Purity Quartz Cuvettes (1 cm path length) | The standard container for liquid samples. Quartz is mandatory for UV analysis to ensure transparency at low wavelengths [1]. |
| Reference Standard Material | A highly characterized, pure sample of the analyte used to calibrate the instrument and create the standard curve for quantitative analysis [4]. |
| HPLC-Grade Solvents | High-purity solvents (e.g., water, methanol) minimize background absorbance (especially in the UV range), which can interfere with accurate sample measurement [1]. |
| Neutral Density Filters | Used for performance verification and qualification of the spectrophotometer to ensure adherence to USP/EP/JP requirements for photometric accuracy [4]. |
| Holmium Oxide Filter | A wavelength standard used for verifying the accuracy of the spectrophotometer's wavelength scale, a critical part of instrument qualification in a GLP/GMP environment [4]. |
| Win 45164 | Win 45164, MF:C26H27FN2O2, MW:418.5 g/mol |
| Mct-IN-1 | Mct-IN-1, MF:C19H26N2O3, MW:330.4 g/mol |
The UV-Vis spectrophotometer is a masterpiece of analytical engineering whose whole is greater than the sum of its parts. From the stable emission of the light source and the precise selection of wavelengths by the monochromator to the sensitive conversion of light by the detector, each component must perform optimally to generate reliable data. For professionals in drug development, this deep technical understanding is not optional—it is a prerequisite for developing robust analytical methods, troubleshooting instrumentation, and ultimately generating the high-quality data that underpins regulatory submissions and ensures that every drug product is safe, effective, and of the highest quality.
Within pharmaceutical research, the choice between single-beam and double-beam UV-Visible spectrophotometer configuration is a critical decision that directly impacts data integrity, regulatory compliance, and analytical efficiency. This technical guide provides drug development professionals with a comprehensive comparison of these core instruments, detailing their operational principles, performance characteristics in pharmacopeia-compliant workflows, and selection criteria tailored to modern laboratory environments. By synthesizing current instrumentation standards with practical application scenarios, this document serves as an authoritative resource for optimizing spectrophotometer configuration to support robust analytical methods from drug discovery through quality control.
Ultraviolet-Visible (UV-Vis) spectrophotometry stands as a cornerstone analytical technique in pharmaceutical laboratories, providing indispensable support for quantitative analysis, quality control, and regulatory compliance. This technique operates on the fundamental principle of measuring the absorption of light by molecules in solution, following the Beer-Lambert law which relates absorbance to concentration, path length, and a compound-specific molar absorptivity coefficient [16] [17]. In the highly regulated pharmaceutical environment, the choice of spectrophotometer configuration—single-beam or double-beam—extends beyond mere technical preference to become a strategic decision affecting analytical reliability, method validation, and operational efficiency. The instrument's role spans multiple critical applications including drug substance quantification, dissolution testing, impurity profiling, and verification of compendial methods, each demanding specific performance characteristics that align with either single-beam or double-beam architectures [18].
Core Principles and Instrument Design
Single-Beam Spectrophotometer Architecture
The single-beam spectrophotometer employs a straightforward optical path where light from the source (typically a deuterium lamp for UV and tungsten lamp for visible regions) passes sequentially through a monochromator for wavelength selection, through the sample cuvette, and finally to a single detector [16] [19]. This linear design necessitates a manual measurement sequence: the instrument first measures the intensity of incident light (Iâ‚€) with a blank reference solution, after which the operator replaces the blank with the sample cuvette to measure transmitted light intensity (I) [17] [20]. The absorbance is then calculated as A = logâ‚â‚€(Iâ‚€/I) [16]. This simplified optical pathway offers the advantage of high energy throughput since the light is not divided, potentially increasing sensitivity for specific applications [21].
Double-Beam Spectrophotometer Architecture
In contrast, double-beam instruments incorporate a beamsplitter (typically a rotating mirror or semitransparent optical component) that divides the original light beam into two separate paths after wavelength selection [16] [22]. One beam traverses through the sample cuvette while the other simultaneously passes through a reference cuvette containing the blank solvent [19] [20]. A single detector then alternately measures the intensity of both beams (through rapid switching) or, in some configurations, dual detectors measure each beam simultaneously [16] [22]. The instrument electronics calculate the absorbance based on the ratio of the two beam intensities (A = logâ‚â‚€(Iáµ£/Iâ‚›)), providing continuous real-time comparison between sample and reference [16]. This simultaneous measurement architecture forms the foundation for the enhanced stability and accuracy characteristics of double-beam systems.
Visualization of Optical Pathways
The fundamental difference between these configurations lies in their optical layouts, as illustrated below:
Performance Comparison and Technical Specifications
The architectural differences between single-beam and double-beam instruments translate directly to distinct performance characteristics that determine their suitability for specific pharmaceutical applications. The following comprehensive comparison details how each configuration performs across critical parameters that impact analytical methods and regulatory compliance.
Table 1: Comprehensive Performance Comparison of Single-Beam vs. Double-Beam Spectrophotometers
| Performance Characteristic | Single-Beam Spectrophotometer | Double-Beam Spectrophotometer |
|---|---|---|
| Accuracy | Limited accuracy due to direct impact of source fluctuations and baseline drift; errors increase at absorbance extremes [16] | Superior accuracy through real-time compensation for source intensity changes; consistent across wider absorbance range [16] [20] |
| Precision | Lower precision due to uncorrected baseline drift and noise; precision degrades over time as drift accumulates [16] | Significantly higher precision with reduced baseline drift; excellent reproducibility for repeated measurements [16] [19] |
| Dynamic Range | Limited dynamic range, particularly at high/low absorbance due to potential saturation or detector limitations [16] | Wider dynamic range with accurate measurement of samples with very high or low absorbance [16] |
| Measurement Speed | Faster individual measurements but slower overall process due to manual blank/sample switching [17] | Faster analysis throughput with simultaneous reference and sample measurement; minimal operator intervention [17] [20] |
| Stability | Susceptible to drift from voltage fluctuations, temperature changes, and source aging [21] [19] | High stability with automatic compensation for instrumental and environmental fluctuations [19] [20] |
| Sensitivity | Potentially higher energy throughput as light is not split [21] | Slightly reduced energy due to beam splitting, but advanced detectors mitigate this effect [16] |
| Spectral Acquisition | Suitable for fixed-wavelength quantitative analysis [16] | Ideal for full spectral scanning with stable baseline [16] |
Impact on Pharmaceutical Applications
In regulated pharmaceutical environments, the performance advantages of double-beam systems become particularly valuable for method development and validation activities. The inherent stability and real-time reference correction enable more reliable quantification of active pharmaceutical ingredients (APIs), especially at low concentrations, and more accurate assessment of impurities that may appear as minor spectral features [18]. Single-beam instruments, while capable for specific fixed-wavelength applications, require more frequent calibration and verification to maintain data integrity within acceptable regulatory standards [20].
Selection Guide for Pharmaceutical Applications
Decision Framework
Choosing between single-beam and double-beam configurations requires systematic evaluation of analytical requirements against technical capabilities. The following decision framework provides a structured approach to this selection process:
Application-Specific Recommendations
Table 2: Spectrophotometer Selection Guide for Pharmaceutical Applications
| Application Scenario | Recommended Configuration | Rationale |
|---|---|---|
| Quality Control Labs (Compendial testing, raw material verification) | Double-Beam | Superior accuracy and stability meet regulatory requirements; reduced calibration frequency improves efficiency in high-throughput environments [18] [20] |
| Research & Method Development (API quantification, impurity profiling) | Double-Beam | Excellent precision across spectral range supports method validation; scanning capability enables spectral characterization [16] [20] |
| Teaching/Academic Labs (Training, basic principles) | Single-Beam | Cost-effective for educational budgets; simpler operation reinforces fundamental concepts [16] [17] |
| Stability Studies (Long-term testing, accelerated degradation) | Double-Beam | Superior drift resistance essential for extended measurements; compensates for instrumental variations over time [19] [20] |
| Fixed-Wavelength Analysis (Routine quantification at single wavelength) | Single-Beam | Adequate performance for specific applications where cost and simplicity are prioritized [16] [20] |
| Field Testing (Environmental monitoring, manufacturing floor) | Single-Beam | Compact, portable design; lower sensitivity to rough handling [20] |
Economic Considerations
Beyond technical specifications, the total cost of ownership represents a critical factor in instrument selection. Single-beam systems offer significantly lower initial investment (approximately 30-50% less than comparable double-beam instruments) and generally lower maintenance costs due to simpler optical design [17] [19]. However, double-beam configurations may provide better long-term value in regulated environments through reduced recalibration requirements, lower operator intervention, and minimized repeat analyses due to superior data quality [16] [20]. Pharmaceutical facilities should conduct a comprehensive cost-benefit analysis that considers both capital expenditure and operational efficiency over the instrument's expected lifespan.
Pharmaceutical Standards and Validation Protocols
Regulatory Compliance Framework
In pharmaceutical applications, UV-Vis spectrophotometers must comply with pharmacopeia standards including the United States Pharmacopeia (USP) and European Pharmacopoeia (EP) [18]. These regulatory bodies mandate specific performance verification (PV) tests to ensure instrument suitability for intended analytical methods. The core validation parameters include wavelength accuracy, photometric (absorbance) accuracy, spectral resolution, and stray light characterization [18]. Regular verification against these parameters forms an essential component of quality assurance in drug development and manufacturing.
Essential Validation Reagents and Materials
Table 3: Essential Research Reagent Solutions for Spectrophotometer Validation
| Reagent/Standard | Composition/Type | Function in Validation | Pharmacopeia Reference |
|---|---|---|---|
| Holmium Oxide Filter/Solution | Holmium oxide in perchloric acid solution or glass filter | Wavelength accuracy verification across UV-Vis range (241-641 nm) [18] | USP <857>, EP 2.2.25 |
| Potassium Dichromate Solutions | 60-140 mg/L solutions in sulfuric acid | Photometric accuracy verification in UV region (specifically at 235, 257, 313, 350 nm) [18] | USP <857>, EP 2.2.25 |
| Neutral Density Glass Filters | Certified glass filters with calibrated absorbance values | Photometric accuracy verification in visible region (440, 465, 546.1, 590, 635 nm) [18] | USP <857>, EP 2.2.25 |
| Stray Light Standards | Potassium chloride (KCl), sodium iodide (NaI), sodium nitrite (NaNOâ‚‚) | Stray light verification at specific wavelengths (198, 220, 340 nm) [18] | USP <857>, EP 2.2.25 |
| Resolution Standard | Toluene in hexane (0.02% v/v) | Spectral bandwidth/resolution verification (fine structure evaluation) [18] | USP <857>, EP 2.2.25 |
| Mercury Vapor Lamp | Low-pressure mercury lamp with emission lines | Primary wavelength standard with absolute reference lines [18] | USP <857> |
Performance Verification Protocol
A comprehensive performance verification protocol should be established following a systematic workflow:
For double-beam instruments, this verification protocol typically demonstrates superior performance across all parameters, particularly in photometric accuracy and stray light rejection, directly supporting their application in regulated pharmaceutical environments [18]. Single-beam instruments require more frequent verification to ensure maintained performance, particularly when used in environments with temperature fluctuations or variable power supply conditions.
The selection between single-beam and double-beam spectrophotometer configurations represents a significant decision with far-reaching implications for pharmaceutical research and quality control. Single-beam instruments offer compelling advantages in terms of initial cost, simplicity, and specific sensitivity applications, making them suitable for educational settings, specific quantitative methods, and environments with budget constraints [16] [20]. However, double-beam spectrophotometers provide unequivocal benefits in accuracy, stability, and operational efficiency that align with the rigorous demands of pharmaceutical applications [16] [18].
For drug development professionals operating in regulated environments, the double-beam configuration generally represents the preferred choice due to its inherent compensation for instrumental variations, reduced requirement for frequent recalibration, and robust performance across the diverse analytical methods encountered in modern pharmaceutical laboratories. The investment in double-beam technology returns value through reliable data integrity, reduced method variability, and compliance with pharmacopeia standards that govern drug approval and manufacturing. As spectroscopic technology continues to evolve, both configurations will maintain relevance in the analytical landscape, with selection ultimately determined by aligning technical capabilities with specific application requirements within the framework of quality by design principles.
Ultraviolet-Visible (UV-Vis) spectrophotometry serves as a cornerstone analytical technique in pharmaceutical research, development, and quality control (QC). This technique measures the absorption of light in the ultraviolet (190–400 nm) and visible (400–800 nm) regions of the electromagnetic spectrum, providing critical data for the identification, quantification, and purity assessment of pharmaceutical compounds [4] [23]. The fundamental principle relies on the Beer-Lambert Law, which states that the amount of light absorbed by a sample is directly proportional to the concentration of the absorbing species and the path length of the light through the sample [14]. In the highly regulated pharmaceutical industry, the reliability of analytical data is paramount. Therefore, understanding and specifying the core technical parameters of a UV-Vis spectrophotometer—wavelength range, resolution, and accuracy—is essential for ensuring that the instrument is fit for its intended use and compliant with global pharmacopeial standards [4] [24].
This guide provides an in-depth examination of these technical specifications within the context of pharmaceutical applications. It is designed to assist researchers, scientists, and drug development professionals in selecting, qualifying, and operating UV-Vis instrumentation to generate accurate, precise, and regulatory-compliant data throughout the drug lifecycle, from initial research to final product release.
Core Technical Specifications and Pharmacopeial Standards
The performance of a UV-Vis spectrophotometer is defined by several key technical parameters. These specifications directly impact the instrument's ability to correctly identify and accurately quantify analytes, which is critical for activities like Active Pharmaceutical Ingredient (API) quantification, impurity profiling, and dissolution testing [4] [23]. Regulatory bodies and pharmacopeias, including the United States Pharmacopeia (USP) and European Pharmacopoeia (Ph. Eur.), define specific performance criteria that instruments must meet for use in regulated laboratories [4] [25].
The following table synthesizes the key specifications of common UV-Vis spectrophotometer models used in pharmaceutical analysis, highlighting the variation in performance capabilities across different price and application segments [26].
Table 1: Comparison of UV-Vis Spectrophotometer Models for Pharmaceutical Applications
| Model | Wavelength Range | Resolution | Wavelength Accuracy | Best Use Case in Pharma |
|---|---|---|---|---|
| Jasco V-770 | 175–1100 nm | 0.01 nm | Not specified | Advanced research requiring sub-nanometer precision |
| Thermo Fisher Evolution 300 | 190–1100 nm | 0.1 nm | Not specified | High-precision pharmaceutical and chemical analysis |
| Agilent 8453 | 190–1100 nm | 0.5 nm | Not specified | Versatile routine and research applications |
| PerkinElmer Lambda 35 | 190–1100 nm | 0.5 nm | Not specified | Budget-conscious academic and industrial labs |
| Shimadzu UV-1800 | 190–1100 nm | 1 nm | Not specified | Basic spectroscopy and compact setups |
| PerkinElmer LAMBDA 1050+ | 175–3300 nm | <0.05 nm (UV-Vis) | Better than ±0.08 nm (UV-Vis) | Product quality control across multiple industries |
Detailed Specification Analysis
Wavelength Range: The span of wavelengths over which the instrument can operate is crucial. A standard range of 190–1100 nm covers most pharmaceutical applications, including the analysis of organic compounds and APIs that absorb in the UV region [26] [4]. An extended range down to 175 nm, as seen in the Jasco V-770, can be beneficial for specialized research involving specific functional groups, while extension into the Near-Infrared (NIR) region, as with the PerkinElmer LAMBDA 1050+, expands the utility for material characterization [26] [27].
Spectral Resolution and Bandpass: Resolution defines the instrument's ability to distinguish between two closely spaced absorption peaks. This is critical for identifying compounds with fine spectral features or for analyzing complex mixtures. High-resolution systems (<0.1 nm) are essential for research and method development, whereas a resolution of 1 nm may be sufficient for routine quantitative assays specified in monographs [26]. The monochromator, which separates light into individual wavelengths, is a key determinant of resolution [14].
Wavelength Accuracy: This parameter indicates how close the instrument's displayed wavelength is to the true wavelength. Pharmacopeias like the USP stipulate that deviation should be within ±1 nm for critical analyses [25]. High-performance instruments offer accuracies of ±0.3 nm or better, which is essential for reliable method transfer and regulatory compliance, particularly when comparing spectra against reference libraries [4] [28].
Regulatory Framework and Instrument Qualification
In pharmaceutical laboratories, UV-Vis spectrophotometers are subject to rigorous qualification and validation requirements to ensure data integrity and regulatory compliance. The updated USP general chapter <1058> on "Analytical Instrument and System Qualification" (AISQ) provides a lifecycle framework for establishing and maintaining instrument fitness for intended use [24].
The Integrated Lifecycle Approach
The modern approach to instrument qualification, as outlined in the draft update to USP <1058>, is an integrated, three-phase lifecycle model [24]:
- Specification and Selection: This initial phase involves defining the intended use of the instrument in a User Requirements Specification (URS). The URS must incorporate the operational parameters and acceptance criteria from mandatory pharmacopeial chapters (e.g., USP <857>) to ensure metrological capability and traceability to national or international standards [24].
- Installation, Qualification, and Validation: This phase involves installing the instrument and performing Installation Qualification (IQ), Operational Qualification (OQ), and Performance Qualification (PQ). For UV-Vis systems, this includes testing critical parameters like wavelength accuracy, photometric accuracy, and stray light against defined acceptance criteria [24].
- Ongoing Performance Verification (OPV): This continuous phase ensures the instrument remains in a state of control and within established acceptance limits throughout its operational life. It includes activities like regular calibration, preventive maintenance, and change control [24].
Key Regulatory Guidelines
- USP <857> and Ph. Eur. 2.2.25: These are the mandatory general chapters that define the performance tests and acceptance criteria for UV-Vis spectrophotometers [25] [24].
- ICH Q2(R1): Provides guidance on the validation of analytical procedures, which inherently relies on a properly qualified instrument [23].
- 21 CFR Part 11/211: FDA regulations that enforce strict controls over electronic records and laboratory practices, requiring instrument calibration, proper documentation, and personnel training [23].
Calibration and Performance Verification Protocols
Regular calibration and performance verification are critical components of the Ongoing Performance Verification (OPV) phase. The following protocols, derived from pharmacopeial methods, ensure the instrument continues to perform within specified limits [25].
Table 2: Standard Calibration Protocols for UV-Vis Spectrophotometers
| Parameter | Standard/Reagent Used | Experimental Protocol | Acceptance Criteria |
|---|---|---|---|
| Wavelength Accuracy | Holmium Oxide Filter | Scan the filter and record the characteristic peak wavelengths (e.g., 279.4, 287.5, 333.7, 360.9, 536.2 nm). | Deviation of observed peaks ≤ ±1 nm from certified values [25]. |
| Photometric Accuracy | Potassium Dichromate Solution (in 0.005 M H₂SO₄) | Measure the absorbance of the solution at specific wavelengths (235, 257, 313, 350 nm). | Absorbance deviation ≤ ±0.010 A from reference values [25]. |
| Stray Light | 1.2% w/v Potassium Chloride (KCl) Solution | Measure the absorbance of KCl in a 1 cm pathlength cell at 200 nm. | Absorbance ≥ 2.0 A [25]. |
| Resolution Power | Toluene in Hexane (0.02% v/v) | Scan the solution and identify the peak at 269 nm and the minimum at ~266 nm. Calculate the ratio of Abs269/Abs266. | Ratio ≥ 1.5 [25]. |
| Photometric Linearity | A series of progressively diluted potassium dichromate solutions. | Measure the absorbance of each standard and plot absorbance vs. concentration. | Correlation coefficient (R²) ≥ 0.999 [25]. |
Calibration Frequency
Calibration should be performed [25]:
- Upon initial installation of the instrument.
- After major maintenance, repairs, or lamp replacement.
- At regular periodic intervals, typically every 6 or 12 months, as defined by the laboratory's Standard Operating Procedure (SOP).
- As required by regulatory and data integrity principles.
Pharmaceutical Applications and Workflows
UV-Vis spectroscopy is deeply integrated into various pharmaceutical workflows. Its non-destructive nature, speed, and ease of use make it ideal for both research and high-throughput QC environments [4] [23] [14].
Table 3: Key Pharmaceutical Applications of UV-Vis Spectrophotometry
| Application | Typical Wavelength(s) | Protocol Summary | Relevant Specifications |
|---|---|---|---|
| API Quantification & Content Uniformity | λ_max of the API | A standard curve is constructed using known concentrations of the API. Tablets are dissolved and diluted, and their absorbance is measured to determine concentration [4] [23]. | Wavelength accuracy is critical for correct identification of λ_max. Photometric accuracy and linearity ensure precise and accurate concentration results. |
| Dissolution Testing | Varies by API | Samples are withdrawn from dissolution vessels at set time points, and the absorbance is measured to calculate the percentage of drug released [4]. | High photometric accuracy and low stray light are essential for reliable results across different time points and concentrations. |
| Impurity and Purity Assessment | Multiple wavelengths | The sample spectrum is scanned and compared to a reference standard. The presence of unexpected peaks or shifts can indicate impurities or degradation products [4] [23]. | High resolution is needed to distinguish between closely spaced peaks. A broad wavelength range allows for detection of various impurities. |
| Nucleic Acid & Protein Analysis (Biologics) | 260 nm (DNA/RNA), 280 nm (Protein) | Samples are pipetted directly, and pre-programmed methods calculate concentration and purity ratios (e.g., A260/A280) [4] [14]. | Microvolume capability and software integration are key for efficiency and sample conservation. |
The following diagram illustrates a generalized workflow for quantitative analysis in pharmaceutical QC, highlighting the role of instrument qualification and calibration.
Diagram 1: UV-Vis Instrument Qualification and Use Workflow. OPV = Ongoing Performance Verification.
The Scientist's Toolkit: Essential Reagents and Materials
The following table lists key reagents and materials required for the operation, calibration, and application of UV-Vis spectrophotometers in a pharmaceutical setting [25].
Table 4: Essential Research Reagent Solutions for UV-Vis Spectrophotometry
| Item | Function | Application Example |
|---|---|---|
| Holmium Oxide Filter | Certified wavelength reference standard. | Verification of wavelength accuracy during instrument calibration [25]. |
| Potassium Dichromate | Certified photometric reference standard. | Verification of photometric accuracy and establishment of photometric linearity [25]. |
| Potassium Chloride (KCl) | Stray light verification standard. | Checking for stray light at the lower end of the UV range (200 nm) [25]. |
| High-Purity Solvents (e.g., HPLC-grade water, acids) | Dissolution and dilution medium. | Preparation of sample and standard solutions to avoid interfering absorbances [23]. |
| Matched Quartz Cuvettes | Sample holder for liquid analysis. | Ensuring pathlength accuracy and transparency in the UV range; critical for quantitative accuracy [23]. |
| Neutral Density Filters | Alternative photometric standards. | Used for verifying photometric accuracy at various absorbance levels [25]. |
| Bimax2 | Bimax2, MF:C146H254N64O41, MW:3562.0 g/mol | Chemical Reagent |
| CC15009 | CC15009, MF:C20H21Cl2N5O2, MW:434.3 g/mol | Chemical Reagent |
In the pharmaceutical laboratory, the UV-Vis spectrophotometer stands as a cornerstone instrument for drug development and quality control, enabling critical analyses from identity confirmation to dissolution testing [4] [3]. While often overlooked, the sample holder—the interface between the instrument and the substance being analyzed—is a critical component whose selection directly impacts data integrity. The sample holder and its enclosed cuvette are not merely containers; they define the precise pathlength through which light travels, a fundamental variable in the Beer-Lambert Law (A = εbc), which dictates that absorbance (A) is directly proportional to the concentration (c) and the pathlength (b) [29]. An inappropriate choice can introduce errors in concentration calculations, degrade spectral quality, and ultimately compromise compliance with stringent pharmacopeial standards [4] [3].
This guide details the selection of appropriate sample holders and cuvettes, framing this choice within the broader context of ensuring accurate, reliable, and regulatory-compliant outcomes in pharmaceutical research.
Fundamental Principles of UV-Vis Spectroscopy and the Sample Holder's Role
The Beer-Lambert Law and Pathlength
The foundational principle of quantitative UV-Vis analysis is the Beer-Lambert Law: ( A = \varepsilon b c ) [29]. Here, A is the measured absorbance, ε is the molar absorptivity, b is the pathlength, and c is the concentration. The pathlength (b) is the distance light travels through the sample, a parameter almost exclusively defined by the cuvette itself. Any deviation from the assumed or calibrated pathlength due to cuvette manufacturing tolerances or improper seating in the holder introduces a direct systematic error into the concentration calculation.
Instrument Configuration and Sample Presentation
A UV-Vis spectrophotometer comprises a light source, a monochromator to select wavelengths, a sample holder, and a detector [29] [14]. The sample holder's function is to position the sample reproducibly within the light path. In a single beam instrument, the sample must be placed and removed for referencing, whereas in a double beam system, the beam is split to pass through both the sample and a reference cell simultaneously [29]. The holder ensures that every measurement is taken at the same precise position and pathlength, which is vital for method reproducibility and transferability between labs. Furthermore, holders often include a cover to prevent ambient light from entering, which could scatter into the detector and cause inaccurate absorbance readings [30].
Types of Cuvette Sample Holders
Sample holders are engineered for specific measurement types and sample volumes. Selecting the correct type is the first step in designing a robust analytical method.
Standard Absorption Holders
The most common holder in pharmaceutical analysis is the standard absorption holder, designed for a single light path transmitting directly through the sample. These are used with standard cuvettes, most often with a 10 mm pathlength [30]. To ensure precision, many modern holders feature adjustable ball-detents that accommodate minor variations in cuvette size and ensure repeatable placement for measurement consistency [30]. These holders form the workhorse of routine quality control tests, such as assay and identity verification [3].
Specialized Holder Configurations
For advanced applications, specialized holders are required:
- Fluorescence Holders: Used for quantification of impurities or specific assays, these holders position the detector at a 90-degree angle to the excitation light path. This geometry isolates the emitted light from the excitation beam, enhancing signal-to-noise ratio. Some models include SiO2-coated aluminum mirrors to further enhance the excitation and fluorescence signals [30].
- Temperature-Controlled Holders: Many chemical and physicochemical properties of pharmaceuticals, such as dissolution rate and stability, are temperature-dependent. Water-thermostatted and Peltier cell holders make accurate temperature-controlled measurements possible, which is critical for method robustness and predicting shelf-life [31].
- Microvolume Holders: A key advancement for analyzing precious samples, these holders enable measurements of sample volumes down to 4 μL (on the Cary 60) or even 0.5 μL with specialized pedestal designs [31] [14]. This eliminates the need for diluting concentrated nucleic acid or protein samples, saving time and conserving valuable material.
Table 1: Types of Cuvette Sample Holders and Their Pharmaceutical Applications
| Holder Type | Key Features | Primary Pharmaceutical Applications |
|---|---|---|
| Standard Absorption | Holds standard cuvettes (e.g., 10 mm path); often includes a filter slot and cover [30]. | Routine quantification of APIs, identity testing, purity assessment [4] [3]. |
| Fluorescence | Optical components arranged at a 90° angle; may include signal-enhancing mirrors [30]. | High-sensitivity impurity detection, specific enzymatic assays [30]. |
| Temperature-Controlled | Peltier or water-jacketed for precise temperature regulation [31]. | Dissolution testing, stability studies, reaction kinetics [31] [4]. |
| Microvolume | Requires minimal sample (e.g., 0.5-4 μL); no cuvette needed for some systems [31] [14]. | Analysis of concentrated DNA/RNA samples, proteins in early R&D [14]. |
| Long Pathlength | Accommodates pathlengths up to 10 cm for enhanced sensitivity [31]. | Measuring very dilute samples or weak absorbers. |
Cuvette Selection Based on Material and Design
The cuvette itself is as critical as the holder. Its material dictates the range of wavelengths that can be probed, and its design defines its suitability for different sample types.
Cuvette Material and Optical Properties
The choice of material is governed by the spectral region of interest.
- Glass and Optical Glass: Suitable for the visible light range (approximately 320 - 2500 nm). They are cost-effective for colorimetric assays, such as those used in beverage analysis or some dissolution endpoint tests [4]. However, they are not suitable for UV-range measurements.
- Quartz (Fused Silica): The material of choice for rigorous pharmaceutical analysis. Quartz cuvettes are transparent across both the UV and visible regions (below 200 - 2500 nm), making them essential for full-spectrum analysis as required by many pharmacopeial monographs [30]. They are chemically inert and can withstand high temperatures, which is valuable for cleaning or temperature studies.
- Plastic (PS, PMMA, ABS): Disposable plastic cuvettes are inexpensive and useful for avoiding cross-contamination, particularly in bioassays or when working with sticky samples. However, their optical clarity is inferior, they can be scratched easily, and many types are not transparent in the UV range. Their use is generally limited to educational settings or non-regulated Vis-range applications.
Cuvette Design and Pathlength
Cuvettes are available with different numbers of optical windows and various pathlengths.
- Standard (2-window): Used for routine absorption measurements, where light passes through two opposing windows [30].
- Four-window (Fluorescence): Featuring two additional polished windows, these cuvettes are ideal for fluorescence measurements. They allow excitation light to enter and emitted light to be detected at 90 degrees without sacrificing signal quality. They can also be used for dual-path absorption measurements with specialized holders [30].
- Pathlength Variants: While 10 mm is standard, shorter pathlengths (e.g., 2 mm, 5 mm) are available for measuring highly concentrated samples without the need for excessive dilution, thereby avoiding dilution error. Conversely, longer pathlengths (e.g., 5 cm, 10 cm) are used to enhance sensitivity for very dilute analytes [31].
Table 2: Cuvette Material and Design Selection Guide
| Cuvette Type | Wavelength Range | Pros | Cons | Ideal for Pharma Applications |
|---|---|---|---|---|
| Optical Glass | ~320 - 2500 nm | Low cost, durable. | Opaque in UV range. | Visible range colorimetry (e.g., beverage QC) [4]. |
| Quartz (Fused Silica) | ~180 - 2500 nm | Full UV-Vis transparency, chemically resistant, durable. | Higher cost. | USP/EP/JP monograph methods, API identity/assay, R&D [4] [30]. |
| Polystyrene (PS) | Vis to NIR | Disposable, low cost, good for avoiding cross-contamination. | Easily scratched, can leach organics, often opaque in UV. | Educational labs, non-regulated visible light assays. |
| Four-Window Quartz | ~180 - 2500 nm | Enables high-sensitivity fluorescence and dual-path measurements. | Higher cost than 2-window quartz. | Fluorescence-based impurity testing, high-sensitivity assays [30]. |
A Practical Guide for Pharmaceutical Scientists
Selection Workflow and Application Mapping
Selecting the correct sample holder and cuvette is a systematic process driven by the analytical goal, sample properties, and regulatory context. The following decision pathway provides a structured approach for scientists.
Compliance with Pharmacopeial Standards
Regulatory compliance is non-negotiable in pharmaceutical quality control. Instruments and methods must be performance-verified according to standards in the United States Pharmacopeia (USP), European Pharmacopoeia (EP), and Japanese Pharmacopoeia (JP) [4]. The use of high-quality quartz cuvettes and calibrated holders is implicit in meeting the stringent requirements for tests such as:
- Identity Testing: Confirming the drug substance is as labeled, often by comparing its absorbance spectrum against a standard [3].
- Assay: Precisely quantifying the amount of the Active Pharmaceutical Ingredient (API) [3].
- Impurity and Dissolution Testing: Detecting minor impurities and ensuring the drug product releases the API appropriately [4] [3].
Adherence to 21 CFR Part 11 is also critical for electronic data integrity, which extends to the metadata associated with the analysis, including instrument and accessory configuration [4].
Essential Research Reagent Solutions
The following table catalogues the core materials and tools required for effective sample handling and analysis in a pharmaceutical UV-Vis laboratory.
Table 3: The Scientist's Toolkit: Essential Research Reagent Solutions
| Item | Function/Description | Application in Pharma Analysis |
|---|---|---|
| Quartz Cuvettes (10 mm, 2-window) | Provides high transparency across UV-Vis range; inert. | The default choice for most quantitative analyses (assay, identity) of APIs [30]. |
| Quartz Cuvettes (4-window) | Enables fluorescence detection with minimal signal loss. | High-sensitivity detection of low-level impurities or for specific fluorometric assays [30]. |
| Certified Reference Materials | High-purity analytes with certified concentrations and properties. | Essential for calibrating the spectrophotometer and creating validation-standard calibration curves [29]. |
| High-Purity Solvents | Spectrophotometric grade solvents with low UV absorbance. | Used to prepare sample and standard solutions, minimizing background interference (blank absorbance). |
| Cuvette Cleaning Kit | Brushes, solvents, and mild detergents for proper cuvette cleaning. | Prevents cross-contamination between samples, which is critical for data accuracy and integrity. |
Detailed Experimental Protocol: API Identity Confirmation by UV Spectra
This protocol outlines a standard procedure for confirming the identity of an Active Pharmaceutical Ingredient (API), such as Ibuprofen, according to pharmacopeial guidelines [4].
1. Objective: To confirm the identity of an unknown API sample by comparing its UV absorbance spectrum against a known standard, as per USP/EP monographs.
2. Materials and Reagents: - API Certified Reference Standard - Unknown API test sample - Spectrophotometric grade solvent (as specified in monograph, e.g., methanol) - Two matched quartz cuvettes (10 mm pathlength) - Volumetric flasks, pipettes
3. Instrument and Holder Setup: - Turn on the UV-Vis spectrophotometer and allow the lamp to warm up for the recommended time. - Install the standard absorption cell holder in the instrument compartment. - Select the spectrum mode in the instrument software. Set the wavelength range as specified (e.g., 200-300 nm). - Fill a quartz cuvette with the pure solvent, place it in the holder, and close the cover. Perform a blank correction to zero the instrument.
4. Sample Preparation: - Accurately weigh the reference standard and the test sample to prepare solutions at the concentration specified in the monograph. - Dissolve both in the specified solvent using volumetric flasks to ensure precise concentration.
5. Experimental Procedure: - Empty and rinse the blank cuvette with a small amount of the standard solution. - Fill the cuvette with the standard solution, place it in the holder, and run the spectral scan. Save the spectrum. - Repeat the rinsing process with the unknown test sample solution. - Fill the cuvette with the test sample solution, place it in the holder, and run the spectral scan. Save the spectrum.
6. Data Analysis and Acceptance Criteria: - Overlay the spectrum of the test sample with that of the reference standard. - The test sample is considered to meet the identity requirement if the wavelength of maximum absorbance (λmax) for both spectra correspond within the specified tolerance (e.g., ±2 nm as per pharmacopeia). - The shape of the absorption spectra should be visually identical.
In the highly regulated and precise world of pharmaceutical development, no component of an analytical system can be taken for granted. The sample holder and cuvette are fundamental in transforming a theoretical measurement into a reliable, actionable result. From ensuring the accurate application of the Beer-Lambert Law to enabling compliance with global pharmacopeias, the critical role of these components cannot be overstated. A deliberate, informed selection process—considering the analytical technique, sample properties, and regulatory requirements—is a hallmark of rigorous and successful pharmaceutical science. By treating the interface between the instrument and the sample with the same importance as the instrument itself, scientists safeguard the quality, safety, and efficacy of the medications that reach patients.
Pharmaceutical Applications in Action: From Drug Development to QA/QC Testing
Ultraviolet-Visible (UV-Vis) spectroscopy serves as a fundamental analytical technique in pharmaceutical research and development, providing critical insights into the identity, purity, and concentration of Active Pharmaceutical Ingredients (APIs). This absorption spectroscopy method quantifies the amount of ultraviolet or visible light absorbed by a compound in solution or as a solid, exciting electrons from the ground state to the first singlet excited state [29]. The operational principle relies on the Beer-Lambert Law (A = εbc), where absorbance (A) is proportional to the molar absorptivity (ε), path length (b), and concentration (c) of the analyte [29]. For drug development professionals, UV-Vis spectroscopy offers a rapid, economical, and accurate method for assessing key quality parameters during both development and manufacturing stages, playing a crucial role in stability testing, quality control, and formulation development [32].
Fundamental Principles and Instrumentation
Theoretical Foundations
UV-Vis spectroscopy operates within the electromagnetic spectrum range of 200-800 nm, encompassing both ultraviolet (200-400 nm) and visible (400-800 nm) regions [33]. When sample molecules encounter light energy matching possible electronic transitions, electrons are promoted to higher energy orbitals, resulting in characteristic absorption patterns [33]. The resulting spectrum presents as a graph of absorbance versus wavelength, providing both qualitative and quantitative information about the compound of interest [33] [29]. The molar absorptivity (ε) reflects both chromophore size and the probability that light of a given wavelength will be absorbed, with strongly absorbing chromophores exhibiting values >10,000 [33].
Instrumentation Configuration
UV-Vis spectrophotometers comprise three essential components: a light source (typically deuterium or tungsten lamp), a sample holder, and a detector [29]. Instrument configurations vary based on application requirements:
- Single Beam Instruments: Feature a filter or monochromator between the source and sample to analyze one wavelength at a time [29].
- Double Beam Instruments: Incorporate a beam splitter and mirror system to direct light to both reference and sample simultaneously, allowing for more accurate readings [29].
- Simultaneous Instruments: Utilize a diode array detector to simultaneously detect absorbance at all wavelengths, providing significantly faster analysis [29].
Modern pharmaceutical applications increasingly employ in-line UV-Vis systems integrated directly into manufacturing processes, such as hot melt extrusion, enabling real-time monitoring of critical quality attributes [34].
Experimental Methodologies for API Analysis
Sample Preparation Protocols
Proper sample preparation is critical for obtaining accurate and reproducible UV-Vis results. The following protocols ensure data reliability:
- Solvent Selection: Use high-purity solvents that do not absorb significantly in the spectral region of interest. Common pharmaceutical solvents include water, buffers, methanol, hexanes, and acetonitrile [33] [29].
- Solution Preparation: Prepare solutions using digital pipettes and volumetric flasks rather than graduated cylinders for improved accuracy [29].
- Concentration Optimization: Adjust sample concentration to ensure absorbance values fall within the ideal range of 0.2-1.0 AU, minimizing measurement errors associated with very low or high absorbance [33].
- Blank Measurement: Always run a blank containing pure solvent to zero the instrument before sample analysis [29].
For solid formulations or suspensions, special considerations apply, as suspended particles can scatter light more than absorb it, potentially skewing data [29].
Qualitative Identification of APIs
UV-Vis spectroscopy facilitates API identification through characteristic absorption patterns:
- Spectral Scanning: Collect full spectrum data from 200-800 nm to identify wavelength of maximum absorption (λmax), which serves as a characteristic fingerprint for specific chromophores [33] [29].
- Chromophore Mapping: Identify specific functional groups based on known chromophore absorption characteristics (e.g., carbonyl groups, conjugated systems) [33].
- Excipient Interference Assessment: Compare spectra of pure API versus formulated product to identify potential excipient interactions [34].
The presence of conjugation generally moves absorption maxima to longer wavelengths (bathochromic shift), making conjugation a major structural feature identifiable by this technique [33].
Quantitative Determination of API Concentration
Accurate quantification of API concentration follows a systematic approach:
- Method Development: Select appropriate wavelength (typically λmax) and verify linearity range [29].
- Calibration Curve Construction: Prepare at least five standard solutions spanning the expected concentration range, spaced relatively equally [29].
- Sample Analysis: Measure absorbance of unknown samples under identical conditions [29].
- Concentration Calculation: Determine sample concentration using the linear regression equation from the calibration curve [29].
Table 1: Key Validation Parameters for UV-Vis Quantitative Methods
| Parameter | Target Specification | Experimental Approach |
|---|---|---|
| Linearity | Correlation coefficient ≥0.99 | Analyze minimum of 5 concentrations across specified range |
| Accuracy | Recovery 98-102% | Spike and recovery studies at multiple concentration levels |
| Precision | RSD ≤2% | Repeat analysis of homogeneous samples (n=6) |
| Range | Concentrations yielding absorbance 0.2-1.0 AU | Verify linear response across intended working range |
| Specificity | No interference from excipients | Compare API, placebo, and formulation spectra |
For advanced applications, the Analytical Quality by Design (AQbD) approach establishes an Analytical Target Profile (ATP) prior to method development, defining predefined method performance requirements [34].
Advanced Application: In-line UV-Vis for Process Monitoring
Real-time API Quantification in Hot Melt Extrusion
Recent advancements have demonstrated successful implementation of in-line UV-Vis spectroscopy for real-time API quantification during hot melt extrusion (HME) processes [34]. A validated method for piroxicam content determination in Kollidon VA64 achieved 95% β-expectation tolerance limits within ±5% acceptance limits, demonstrating robustness across screw speed (150-250 rpm) and feed rate (5-9 g/min) variations [34].
The experimental workflow for this application involves:
CIELAB Color Space Analysis
In-line UV-Vis systems can calculate CIELAB color space parameters from transmittance spectra (380-780 nm), providing additional quality attributes [34]:
- Lightness (L*): Indicates potential degradation or color changes
- Green-Red axis (a*): Monitors color shifts toward red or green
- Blue-Yellow axis (b*): Detects yellowing, potentially indicating thermal degradation [34]
These color parameters serve as in-process critical quality attributes linked to the ability to accurately measure API content [34].
The Scientist's Toolkit: Essential Research Reagents and Materials
Table 2: Essential Materials for UV-Vis API Analysis
| Material/Reagent | Function/Application | Technical Specifications |
|---|---|---|
| High-Purity Solvents (HPLC grade) | Sample dissolution and reference measurements | Low UV absorbance; appropriate for API solubility |
| Volumetric Flasks | Precise solution preparation | Class A; appropriate volume for working concentration |
| UV-Compatible Cuvettes | Sample containment during analysis | Quartz for UV range; path length 1 cm standard |
| API Reference Standards | Method development and validation | Certified purity; structural confirmation |
| Placebo Formulation | Specificity assessment | Contains all excipients except API |
| Buffer Salts | pH control for ionizable APIs | High purity; minimal UV absorbance |
| Tak-632 | Tak-632, MF:C27H18F4N4O3S, MW:554.5 g/mol | Chemical Reagent |
| Propyl Gallate | Propyl Gallate, CAS:121-79-9; 56274-95-4, MF:C10H12O5, MW:212.20 g/mol | Chemical Reagent |
Method Validation and Regulatory Considerations
Validation Protocols
Comprehensive validation of UV-Vis methods for pharmaceutical analysis should address these critical parameters, particularly when employed as Process Analytical Technology (PAT) [34]:
- Accuracy Profile Strategy: Based on total error concept (trueness + precision) with β-expectation tolerance limits (e.g., ±5%) [34].
- Robustness Testing: Evaluate effects of minor method parameter variations (e.g., slit width, wavelength variation ±1 nm) [34].
- Forced Degradation Studies: Subject API to stress conditions (light, heat, pH, oxidation) to demonstrate method stability-indicating capability [32].
Pharmaceutical Quality Assessment Applications
UV-Vis spectroscopy supports multiple critical assessments in drug development:
- Stability Testing: Monitor API degradation under forced, accelerated, and real-time aging conditions to establish shelf-life [32].
- Dissolution Testing: Quantify API release from solid dosage forms using continuous flow systems.
- Content Uniformity: Verify consistent API distribution throughout manufactured batches.
- Impurity Profiling: Detect and quantify known impurities based on characteristic absorption.
The technique's sensitivity, simplicity, and rapid analysis time make it invaluable throughout the drug development lifecycle, from early-stage formulation screening to commercial quality control [32] [34].
Ultraviolet-Visible (UV-Vis) spectrophotometry stands as a cornerstone analytical technique in pharmaceutical research and quality control for ensuring product purity. This method measures the absorption of ultraviolet or visible light by chemical substances, providing valuable information about the concentration and characteristics of active pharmaceutical ingredients (APIs) and their impurities [3] [23]. The fundamental principle relies on the Beer-Lambert Law, which states that absorbance is directly proportional to the concentration of the absorbing species and the path length of the sample [35]. In the context of purity analysis, UV-Vis spectroscopy offers distinct advantages including non-destructive analysis, rapid results, cost-effectiveness, and high sensitivity for detecting even trace levels of impurities [35].
Pharmaceutical impurities and degradation products represent critical quality attributes that must be rigorously controlled throughout a drug's lifecycle. These unwanted chemical species can originate from various sources including starting materials, by-products of synthesis, degradation during storage, or interactions with excipients [36]. Regulatory bodies such as the FDA and EMA mandate strict controls over impurity profiles, requiring pharmaceutical manufacturers to identify, quantify, and control impurities to ensure product safety and efficacy [3] [23]. The FDA's Center for Drug Evaluation and Research (CDER) specifically addresses standards for identity, assay, impurities, and dissolution, highlighting the comprehensive approach required for pharmaceutical quality assurance [3].
Fundamental Principles of Impurity Quantification
Spectrophotometric Foundations
The quantitative analysis of impurities and degradation products using UV-Vis spectrophotometry leverages the additive nature of absorbance as described by the Beer-Lambert Law. When multiple chromophores are present in a sample, the total absorbance at any given wavelength equals the sum of individual absorbances from all UV-absorbing compounds [37]. This principle becomes particularly important in pharmaceutical formulations where APIs, impurities, and degradation products may all contribute to the overall absorption spectrum. The electronic transitions in molecules resulting from UV-Vis light absorption provide characteristic spectral patterns that can be used for both identification and quantification purposes [23].
The ability to accurately quantify impurities depends heavily on understanding the specific wavelength maxima (λmax) and molar absorptivity of each component. Different chemical structures exhibit varying absorption characteristics; for instance, in 16-membered macrolides, principle components and minor components have distinct UV maximum absorption wavelengths at 231 nm and 280 nm, which significantly impacts quantification strategies [38]. This variability in chromophoric properties presents both challenges and opportunities for method development in impurity quantification, particularly when dealing with complex mixtures where spectral overlapping occurs [37].
Regulatory Framework and Requirements
Pharmaceutical impurity control operates within a stringent regulatory framework designed to ensure patient safety. The International Council for Harmonisation (ICH) guidelines establish thresholds for identification, qualification, and reporting of impurities in both drug substances and products [23]. UV-Vis methods used for these analyses must demonstrate compliance with ICH Q2(R1) validation parameters, including specificity, accuracy, precision, linearity, and range [35] [23]. Furthermore, the United States Pharmacopeia (USP) provides specific protocols for UV-Vis testing that cover instrument calibration, method validation, sample preparation, and data interpretation to ensure accurate and reproducible results [35].
Regulatory requirements emphasize the importance of stability-indicating methods capable of discriminating between APIs and their degradation products [36]. Forced degradation studies, also known as stress testing, play a crucial role in method development by generating representative impurities under controlled conditions [36]. These studies help validate that analytical methods can adequately detect and quantify degradation products that may form during storage, thus ensuring the method's stability-indicating capability throughout the product's shelf life.
Analytical Methodologies and Approaches
Direct Quantification Methods
Traditional UV-Vis spectrophotometry employs direct quantification approaches based on absorbance measurements at specific wavelengths. This method works effectively for single-component analysis or when the impurity of interest has distinct, non-overlapping absorption features compared to the API [37]. The standard operating procedure involves instrument stabilization, wavelength selection, blank correction, and sample measurement using matched quartz cuvettes to ensure accuracy [39]. Proper sample preparation is crucial, requiring optically clear solutions free from particulate matter to avoid scattering effects that could compromise results [23].
For impurity quantification, direct methods typically employ calibration curves generated from standard solutions of known concentration [23]. The linear range of absorbance (typically 0.1-1.0 AU) must be established during method validation to ensure accurate quantification [23]. When dealing with impurities exhibiting different chromophoric properties, the use of relative response factors may be necessary to correct for varying molar absorptivities at the selected analytical wavelength [38]. This approach becomes particularly important for drugs like leucomycin, where degradation impurities demonstrate significantly different UV absorption characteristics compared to the parent compound [38].
Chemometrics-Assisted Spectrophotometry
The emergence of chemometrics-assisted UV-Vis spectrophotometry has revolutionized the analysis of complex pharmaceutical mixtures where spectral overlapping occurs. Chemometrics applies mathematical and statistical algorithms to extract meaningful information from chemical data, enabling simultaneous quantification of multiple components despite significant spectral overlap [37]. This advanced approach has become invaluable for impurity profiling in multi-component formulations and for stability testing where APIs degrade into multiple products with overlapping absorption bands [37].
Common chemometric techniques applied in UV-Vis impurity analysis include:
- Principal Component Analysis (PCA): Used for pattern recognition and classification of samples based on their impurity profiles.
- Partial Least Squares (PLS) Regression: Builds predictive models correlating spectral data with component concentrations.
- Multivariate Curve Resolution-Alternating Least Squares (MCR-ALS): Resolves complex spectral data into individual component profiles and their concentration estimates [37].
The implementation of chemometric methods requires careful experimental design and model validation to ensure reliability. The model's performance is typically evaluated using parameters such as root mean square error of calibration (RMSEC), root mean square error of prediction (RMSEP), and correlation coefficients [37]. This approach has been successfully applied to various pharmaceutical quality control scenarios, including the simultaneous determination of paracetamol and its degradation products [37], and impurity profiling of norfloxacin and tinidazole in combined dosage forms [37].
Experimental Protocols for Impurity Analysis
Standard Operating Procedure for UV-Vis Analysis
The following procedure outlines the standard operational protocol for pharmaceutical analysis using UV-Vis spectrophotometry [39]:
Instrument Preparation: Switch on the main power and instrument. Allow 15 minutes for stabilization to ensure consistent performance [39].
Wavelength Selection: Set the desired wavelength using the control knob, moving in increasing order. Select the appropriate filter wheel position based on the selected wavelength [39].
Initial Calibration: Place the mode selector at % Transmittance (% T) position. Adjust zero percent transmittance using the set zero control with no cuvette in the holder [39].
Blank Measurement: Rinse both reference and sample cuvettes with blank solution 2-3 times. Fill with blank solution, clean external surfaces with tissue paper, and place in the holder. Adjust to 100% Transmittance using the appropriate control [39].
Sample Analysis: Remove the sample cuvette, drain the blank solution, and rinse 2-3 times with the sample solution. Fill with sample, clean external surfaces, and place in the sample holder. Record the absorbance or % Transmittance reading [39].
Post-Analysis Procedures: Remove and wash both cuvettes with purified water or methanol as required. Document results in the instrument usage log book. Perform monthly calibration and after maintenance activities [39].
Forced Degradation Studies Protocol
Forced degradation studies, also known as stress testing, provide critical information about the intrinsic stability of APIs and help identify likely degradation products [36]. A comprehensive protocol includes:
Solution Stability Studies: Expose API solutions to various pH conditions (typically 0.1 N HCl and 0.1 N NaOH) at controlled temperatures. Assess kinetic equivalence using Arrhenius principles to determine appropriate stress durations [36].
Oxidative Stress Testing: Subject API to oxidative conditions using reagents such as azobisisobutyronitrile (AIBN) or hydrogen peroxide. Newer approaches may include N-methylpyrrolidinone (NMP) to generate a wider range of oxidative products [36].
Photostability Studies: Conduct confirmatory testing according to ICH Q1B guidelines with solid API, followed by extended exposure at 2-5 times ICH recommended light levels. For solution photostability, expose API solutions to light exposure similar to the 3T3 Neutral Red Uptake model to evaluate potential phototoxicity, particularly when API absorption exceeds 1,000 M−1 cm−1 at wavelengths >290 nm [36].
Thermal and Humidity Stress: Expose solid API and drug product to elevated temperatures and humidity conditions (e.g., 40°C/75% RH) to simulate long-term storage [36].
Throughout stress testing, monitor degradation using validated stability-indicating methods. Aim for 5-20% degradation to ensure sufficient impurity levels for characterization while avoiding secondary degradation [36].
Advanced Applications and Case Studies
HPLC-CAD for Variable Chromophore Impurities
While UV-Vis spectrophotometry remains valuable for impurity quantification, advanced techniques have emerged to address specific limitations. High-Performance Liquid Chromatography coupled with Charged Aerosol Detection (HPLC-CAD) represents a significant advancement for quantifying impurities with variable chromophores [38]. This approach addresses a critical limitation of UV detection when analyzing compounds like 16-membered macrolides, where impurities exhibit substantially different UV absorption characteristics [38].
The CAD detector operates by converting the column eluent into droplets, evaporating the solvent to form analyte particles, charging them via a corona charger, and measuring the resulting charge with a sensitive electrometer [38]. This detection mechanism provides an approximately uniform response for non-volatile analytes regardless of their chemical structures, enabling quantification of multiple impurities using a single reference standard [38]. This principle has been successfully applied to the quantification of degradation impurities in josamycin, leucomycin, and meleumycin, where traditional HPLC-UV methods proved inadequate due to widely varying UV absorbance among related compounds [38].
Chemometrics-Assisted UV-Vis for Complex Mixtures
The application of chemometrics to UV-Vis spectroscopy has enabled the resolution of complex pharmaceutical mixtures that were previously challenging to analyze. Representative case studies demonstrate its effectiveness:
- Multi-Component Formulations: Simultaneous determination of paracetamol, diphenhydramine, caffeine, and phenylephrine in tablet dosage forms despite significant spectral overlap [37].
- Stability-Indicating Methods: Monitoring the degradation process of tamoxifen using MCR-ALS to resolve photodegradation profiles without complete chromatographic separation [37].
- Impurity Profiling: Determination of norfloxacin and tinidazole along with tinidazole impurity using PLS and linear support vector regression models, validated against reference methods [37].
These applications highlight how chemometrics expands the capability of UV-Vis spectrophotometry beyond traditional single-component analysis, making it suitable for comprehensive impurity characterization in complex pharmaceutical systems.
Essential Research Reagent Solutions
The following table details key reagents and materials essential for pharmaceutical impurity quantification studies using UV-Vis spectrophotometry:
Table 1: Essential Research Reagent Solutions for UV-Vis Based Impurity Analysis
| Reagent/Material | Function/Application | Technical Considerations |
|---|---|---|
| High-Purity Solvents (e.g., methanol, acetonitrile, water) | Sample dissolution and preparation; mobile phase for HPLC-UV | Must be optically transparent in selected wavelength range; HPLC grade preferred to minimize UV-absorbing impurities [23] |
| Buffer Components (e.g., ammonium acetate, phosphate buffers) | pH control during stress testing and mobile phase modification | Volatile buffers (e.g., ammonium acetate) preferred for HPLC-CAD compatibility; proper pH control critical for degradation studies [38] |
| Acid/Base Reagents (0.1 N HCl, 0.1 N NaOH) | Forced degradation studies under hydrolytic conditions | Controlled concentration and exposure time to achieve 5-20% degradation; may require co-solvents for poorly soluble APIs [36] |
| Oxidative Stress Agents (H2O2, AIBN, NMP) | Generation of oxidative degradation products | AIBN used for radical-mediated oxidation; NMP provides broader range of oxidative products [36] |
| Reference Standards | Calibration curve generation and method validation | Certified purity standards essential for accurate quantification; structural analogs may be used for impurities when authentic standards unavailable [35] |
Workflow Visualization
The following diagram illustrates the comprehensive workflow for impurity quantification and characterization in pharmaceutical development:
Impurity Analysis Workflow
Method Validation and Data Interpretation
Validation Parameters for Regulatory Compliance
UV-Vis methods for impurity quantification must undergo rigorous validation to demonstrate suitability for intended use. Key parameters assessed during method validation include:
- Specificity: Ability to measure analyte response in the presence of potential interferents, confirmed through forced degradation studies [23].
- Linearity: Absorbance response proportional to analyte concentration across specified range, typically evaluated using correlation coefficients [35].
- Accuracy: Agreement between measured and true values, often assessed through spike recovery experiments (typically 98-102%) [35].
- Precision: Degree of scatter in results under normal operating conditions, including repeatability and intermediate precision [23].
- Limit of Detection (LOD) and Quantification (LOQ): Lowest concentrations that can be detected or quantified with acceptable accuracy and precision [23].
Validation documentation must comply with ALCOA+ principles (Attributable, Legible, Contemporaneous, Original, Accurate) to ensure regulatory acceptance during audits [23].
Spectral Interpretation and Data Analysis
Proper interpretation of UV-Vis spectral data requires understanding of chromophoric properties and potential interferences. Key considerations include:
- Wavelength Selection: Identification of appropriate analytical wavelengths that maximize analyte response while minimizing interference [37].
- Baseline Correction: Account for background absorption from solvents, excipients, or matrix components [23].
- Spectral Overlap Resolution: Application of derivative spectroscopy or chemometric algorithms to resolve overlapping peaks [37].
- Impurity Identification: Correlation of spectral features with structural characteristics, such as the presence of conjugated systems, aromatic rings, or specific functional groups [3].
For quantitative analysis, calibration curves must be constructed using appropriate regression models, with verification through quality control samples. When analyzing impurities with different chromophores, response factors must be established to correct for varying molar absorptivities [38].
Comparative Analysis of Quantification Methods
The following table provides a comparative analysis of different methodological approaches for impurity quantification in pharmaceuticals:
Table 2: Comparison of Methodological Approaches for Impurity Quantification
| Method | Key Advantages | Limitations | Ideal Applications |
|---|---|---|---|
| Direct UV-Vis | Simple, rapid, cost-effective, non-destructive | Limited to single components or non-overlapping spectra; requires chromophores | Routine quality control; raw material testing; dissolution profiling [35] [23] |
| Chemometrics-Assisted UV-Vis | Handles complex mixtures; no separation needed; comprehensive data analysis | Requires specialized software and expertise; model validation critical | Multi-component formulations; stability testing; reverse engineering [37] |
| HPLC-UV | High resolution; handles multiple components; well-established | Variable UV response for different chromophores; may need multiple standards | Impurity profiling; stability-indicating methods; reference techniques [38] |
| HPLC-CAD | Uniform response for non-volatiles; minimal standards needed | Not volatile-compatible; lower sensitivity than UV for strong chromophores | Compounds with variable chromophores; impurities without standards; natural products [38] |
UV-Vis spectrophotometry remains an indispensable tool in the pharmaceutical scientist's arsenal for ensuring product purity through quantification of impurities and degradation products. While traditional direct spectrophotometric methods continue to serve well for routine analyses, advanced approaches including chemometrics-assisted spectroscopy and complementary techniques like HPLC-CAD address complex analytical challenges. The successful implementation of these methods requires careful attention to experimental design, method validation, and regulatory requirements throughout the pharmaceutical development process. As analytical technology continues to evolve, the integration of UV-Vis spectroscopy with computational approaches and innovative detection strategies will further enhance our ability to ensure pharmaceutical product quality and patient safety.
Dissolution testing is a critical analytical method used in pharmaceutical development and quality control to evaluate the release rate of an Active Pharmaceutical Ingredient (API) from its solid oral dosage form, such as tablets or capsules, under simulated physiological conditions [40] [41]. This test measures the amount of API dissolved over time in a specified medium under controlled temperature, composition, and hydrodynamic conditions, generating a bulk concentration profile [40]. The resulting dissolution profile provides vital information for formulation design, manufacturing quality control, stability studies, and predicting in vivo performance [40]. For Biopharmaceutical Classification System (BCS) Class II drugs like Ibuprofen, which have low solubility and high permeability, dissolution can be the rate-limiting step in drug absorption, making discriminative dissolution methods essential for predicting bioavailability [42].
Regulatory authorities, including the U.S. Food and Drug Administration (FDA), often require in vitro dissolution testing as part of the approval process for new drug products, particularly for solid oral dosage forms [41]. The testing methodology may be specified in pharmacopeial monographs (e.g., USP, EP) or in specific regulatory guidelines [41]. Beyond quality control, where it ensures uniformity between production batches and verifies drug performance during shelf life, dissolution testing is also indispensable in formulation development and for establishing potential in vitro-in vivo correlations [43].
Fundamentals of UV-Vis Spectroscopy in Dissolution Testing
Basic Principles and Instrumentation
Ultraviolet-visible (UV-Vis) spectroscopy is an analytical technique that measures the amount of discrete wavelengths of UV or visible light absorbed by or transmitted through a sample compared to a reference or blank sample [1]. This property is influenced by the sample composition, providing information on the identity and concentration of the analyte [1]. The fundamental principle underlying quantitative analysis is the Beer-Lambert Law, which states that the amount of light absorbed is directly proportional to the concentration of the sample and the path length [14]. The mathematical expression is A = εlc, where A is absorbance, ε is the molar absorptivity, l is the path length, and c is the concentration [1].
A UV-Vis spectrophotometer consists of several key components that work together to enable accurate measurements [1] [14]:
- Light Source: Typically a xenon lamp for both UV and visible ranges, or dual lamps (tungsten/halogen for visible and deuterium for UV).
- Wavelength Selector: A monochromator containing a diffraction grating to separate light into a narrow band of wavelengths.
- Sample Holder: Typically a quartz cuvette for UV studies, as quartz is transparent to most UV light.
- Detector: Devices such as photomultiplier tubes (PMT), photodiodes, or charge-coupled devices (CCD) that convert light intensity into an electronic signal.
The following diagram illustrates the workflow of a dissolution test analyzed by a UV-Vis spectrophotometer:
Advantages of UV-Vis Spectroscopy for Dissolution Analysis
UV-Vis spectroscopy has long been the pharmaceutical chemist's traditional first option for analyzing dissolution results due to several distinct advantages [43]. It is highly cost-effective compared to HPLC, as users avoid expenses related to organic solvents, their disposal, and higher equipment acquisition and maintenance costs [43]. The technique is notably faster for single-analyte analysis, as a single absorbance value determines the data without need for mobile phase preparation or complex system suitability tests [43]. Modern UV-Vis spectrophotometers with sipper functions enable quick analysis of samples immediately following dissolution experiments, simplifying workflow [43].
UV-Vis spectroscopy also provides exceptional ease of data interpretation for trending or identifying potential sources of laboratory errors, allowing for immediate supervision and resolution of issues [43]. The technique is non-destructive, allowing samples to be studied repeatedly without damage, which is particularly beneficial for quality assurance and quality control purposes [14]. Furthermore, modern instruments offer rapid analysis, providing results within seconds, which significantly improves laboratory productivity [14].
Methodologies and Experimental Protocols
Developing a Dissolution Procedure
Developing and validating a dissolution procedure requires careful consideration of several components, all of which must be optimized to provide a reproducible, robust, and discriminatory method [44].
Dissolution Medium Selection: The choice of medium is based on discriminatory capability, robustness, analyte stability, and relevance to in vivo performance [44]. Common media include dilute hydrochloric acid, buffers in the physiological pH range (1.2-7.5), simulated gastric or intestinal fluids (with or without enzymes), water, and surfactants [44]. A general goal is to have "sink conditions" – a volume of medium at least three times that required to form a saturated solution of the drug substance [44]. Media volumes typically range from 500-1000 mL, with 900 mL being most common [44]. Deaeration is often necessary and can be achieved by heating, filtering, or placing the medium under vacuum [44].
Apparatus Selection: USP chapter 711 defines seven types of dissolution apparatus [44]. For solid oral dosage forms, the most frequently used are:
- Apparatus 1 (Basket): Often used at 100 rpm
- Apparatus 2 (Paddle): Typically used at 50 or 75 rpm [44]
Apparatus 3 (reciprocating cylinder) and Apparatus 4 (flow-through cell) are useful for modified-release dosage forms, poorly soluble drugs, and special dosage forms like bead products or soft gelatin capsules [44].
Study Design and Sampling: For immediate-release dosage forms, testing typically lasts 30-60 minutes, while extended-release forms require multiple time points to characterize the release profile [44]. Sampling can be performed manually or via automated systems, with filtration often necessary to prevent undissolved drug particles or insoluble excipients from interfering with analysis [44]. Acceptance criteria (Q-factors) are usually set at 75-80% dissolved, allowing for assay and content uniformity ranges [44].
Experimental Protocol: Ibuprofen Dissolution Testing
A specific example of dissolution methodology can be illustrated through a study on Ibuprofen suspension and tablets [42]. Ibuprofen, a BCS Class II drug with pKa 4.5 and poor water solubility, presents particular challenges for dissolution testing [42].
Table 1: Dissolution Testing Conditions for Ibuprofen
| Parameter | Specification |
|---|---|
| Apparatus | USP Paddle (Apparatus 2) |
| Agitation Speed | 25 rpm and 50 rpm |
| Media | 0.1 M HCl; Phosphate buffers pH 4.5, 6.8, 7.2 |
| Media Volume | 900 mL |
| Temperature | 37.0 ± 0.5°C |
| Sample Volume | Aliquot with 1:20 dilution in medium |
| Analytical Method | UV-Vis spectrophotometry at λ = 221 nm |
| Sampling Times | 5, 10, 20, 30, 45, 60, 90, 120, 150, 180 min |
Sample Preparation: For suspension formulations, the exact amount introduced into vessels was assessed by weighing a syringe before and after sample introduction, based on previously determined density [42]. Tablets were tested intact according to standard procedures [42].
Analytical Method Validation: The UV spectrophotometric method at 221 nm was rigorously validated for each dissolution medium [42]. Validation included:
- Linearity: Six concentrations (5-30 μg/mL) with correlation coefficients determined
- Precision: Repeatability assessed via response factor and relative standard deviation
- Accuracy: Percentage recovery between 97.0-103.0% of nominal concentration
- Specificity: Evaluated using standard addition method to confirm no interference
- Filter Adsorption: Tested using polyethylene and nylon membrane filters
Results Interpretation: The study found that 50 rpm provided adequate discriminative power between formulations [42]. Ibuprofen release was strongly pH-dependent, with slowest release at pH 1.0 due to the molecular state of the drug, while ionization at higher pH increased solubility and dissolution rate [42].
Advanced UV-Based Technologies in Dissolution Testing
Fiber Optic UV Systems for Continuous Monitoring
The integration of fiber optic technology with UV spectroscopy has significantly advanced dissolution testing capabilities since its introduction in 1988 [40]. Unlike traditional methods that obtain limited data points from discrete sampling, UV fiber optics enable in-situ measurement of the dissolution process with data points collected up to once per second [40]. This generates a more accurate real-time dissolution profile with significantly more detail than discrete sampling [40].
Fiber optic dissolution systems eliminate the need for sampling consumables, reduce costs, simplify testing and data processing, and thereby significantly improve laboratory productivity [40]. The detailed dissolution profiles with frequent data points enable better comparison of dissolution behavior across different batches and formulations, providing enhanced discriminatory power for formulation development and quality control [40].
UV Surface Dissolution Imaging (SDI)
UV Surface Dissolution Imaging represents a more recent advancement, commercially available since 2010, that enables visualization and quantification of API release at the solid-liquid interface [40]. In this system, a sample is compacted into a pellet in a stainless steel sample cup or cored directly from a solid dosage unit [40]. The sample cup is mounted at the bottom of a quartz flow cell with the sample surface in contact with dissolution medium, whose flow is controlled by a programmable syringe pump [40].
A single wavelength of UV light from a pulsed xenon lamp is selected with a band-pass filter to monitor the region at or close to the interface of the sample and dissolution medium [40]. A complementary metal oxide semiconductor (CMOS) array detector collects UV images of the interface, which are analyzed to display the drug concentration gradient and quantify the intrinsic dissolution rate of the drug [40]. Applications of UV SDI include studying API behavior such as single crystal dissolution, intrinsic dissolution of different crystal forms, drug diffusion and release from hydrogels and transdermal patches, and dissolution behaviors of solid oral dosages [40].
Data Analysis, Validation, and Regulatory Considerations
Analytical Method Validation
For dissolution methods using UV-Vis spectroscopy, rigorous validation is essential to ensure reliability, accuracy, and reproducibility. The validation parameters for UV spectrophotometric analysis in dissolution testing include [42]:
- Specificity: Ability to assess unequivocally the analyte in the presence of components that may be expected to be present, typically demonstrated through the standard addition method.
- Linearity: The ability to obtain test results proportional to the concentration of the analyte, usually demonstrated across a range of 5-30 μg/mL for ibuprofen.
- Accuracy: The closeness of agreement between the value accepted as a true value and the value found, with recovery between 97-103% considered acceptable.
- Precision: The degree of agreement among individual test results when the procedure is applied repeatedly to multiple samplings, expressed as relative standard deviation.
- Filter Adsorption Studies: Evaluation of potential drug adsorption to filters used during sampling, comparing filtered versus non-filtered samples.
Table 2: Key Validation Parameters for UV Spectrophotometric Dissolution Analysis
| Validation Parameter | Acceptance Criteria | Experimental Approach |
|---|---|---|
| Specificity | No interference from excipients | Standard addition method |
| Linearity | R² > 0.995 | 6 concentrations in triplicate |
| Range | 5-30 μg/mL | Based on expected dissolution concentrations |
| Accuracy | 97-103% recovery | Spiked samples at multiple levels |
| Precision | RSD < 2% | Multiple measurements of same sample |
| Filter Adsorption | < 2% difference | Filtered vs. non-filtered comparison |
Regulatory Compliance and Quality Control
UV-Vis spectrophotometers used in pharmaceutical dissolution testing must comply with pharmacopeial requirements (USP, EP, JP) and regulatory standards [4]. Regulatory bodies require pharmaceutical companies to provide proof of quality control efforts, with the FDA's Center for Drug Evaluation and Research (CDER) evaluating active pharmaceutical ingredients against established drug standards [3]. These standards address [3]:
- Identity: Ensuring the drug is correctly identified
- Assay: Verifying the drug quantity matches the labeled amount
- Impurities: Confirming absence of unacceptable levels of impurities
- Dissolution: Verifying the ability of active ingredients to dissolve for absorption
Instrument qualification is a critical subset of the validation process that verifies proper module and system performance before the instrument is placed in a regulated environment [44]. Performance verification at installation and at set intervals thereafter is necessary, with specific performance levels defined in national pharmacopeias [4].
The Scientist's Toolkit: Essential Research Reagents and Materials
Table 3: Essential Research Reagent Solutions for Dissolution Testing with UV-Vis Analysis
| Item | Function/Application | Specifications/Considerations |
|---|---|---|
| Dissolution Apparatus | Provides controlled environment for dissolution testing | USP Apparatus 1 (Basket) or 2 (Paddle) most common for solid oral dosages |
| UV-Vis Spectrophotometer | Quantifies API concentration in dissolution media | Must meet USP/EP performance criteria; sipper systems enable automation |
| Quartz Cuvettes | Hold samples for UV spectral analysis | Required for UV range; plastic cuvettes absorb UV light |
| Dissolution Media | Simulates physiological conditions for drug release | 0.1 M HCl, phosphate buffers pH 4.5-7.2; with/without surfactants |
| Membrane Filters | Remove undissolved particles from samples | Polyethylene (1.0 μm) or nylon (0.2 μm); must test for drug adsorption |
| Reference Standards | Validate analytical method accuracy and precision | Certified API standards of known purity and concentration |
| Deaeration Equipment | Remove dissolved gases from dissolution media | Prevents bubble formation that interferes with dissolution and analysis |
| Automated Sampling Systems | Enable frequent, reproducible sampling | Increases throughput; must be validated against manual sampling |
| Lepetegravir | Lepetegravir, CAS:2808219-64-7, MF:C21H19F3N4O4, MW:448.4 g/mol | Chemical Reagent |
| (R)-KT109 | (R)-KT109, CAS:1402612-55-8, MF:C27H26N4O, MW:422.5 g/mol | Chemical Reagent |
Dissolution testing using UV-Vis spectroscopy remains a cornerstone of pharmaceutical development and quality control for solid oral dosage forms. The technique provides a robust, cost-effective, and efficient means of assessing critical quality attributes related to drug release and potential bioavailability. While traditional UV-Vis methods continue to be widely used, technological advancements such as fiber optic systems for continuous monitoring and UV surface dissolution imaging offer enhanced capabilities for understanding dissolution mechanisms and optimizing formulations. Proper development and validation of dissolution procedures, coupled with compliance to regulatory requirements, ensure that these methods generate meaningful data to guide formulation development, demonstrate bioequivalence, and maintain product quality throughout the drug lifecycle. As pharmaceutical formulations grow more complex, the role of UV-Vis spectroscopy in dissolution testing continues to evolve, maintaining its essential position in the pharmaceutical analyst's toolkit.
Ultraviolet-Visible (UV-Vis) spectroscopy is a cornerstone analytical technique in pharmaceutical quality control (QC), providing a reliable means to verify raw material identity and ensure finished products meet stringent quality specifications. This technique measures the amount of discrete wavelengths of UV or visible light that are absorbed by or transmitted through a sample, providing information about the sample's composition and concentration [1]. The fundamental principle underpinning its quantitative use is the Beer-Lambert Law, which states that absorbance (A) is proportional to the concentration (c) of the absorbing species, the path length (L) of the sample, and the molar absorptivity (ε) of the species [1].
In the tightly regulated pharmaceutical industry, the application of UV-Vis spectroscopy spans the entire product lifecycle. It is a well-established technique for testing during both research and quality control stages of drug development [4]. Its widespread adoption is driven by its proven reliability, ease of use, and ability to meet the performance characteristics outlined in various international pharmacopeias such as the United States Pharmacopeia (USP), European Pharmacopoeia (EP), and Japanese Pharmacopoeia (JP) [4].
Fundamental Principles of UV-Vis Spectroscopy
How a UV-Vis Spectrophotometer Works
A UV-Vis spectrophotometer operates by passing a beam of light through a sample and measuring the intensity of light that emerges. The key components of the instrument are [1]:
- Light Source: Typically, a xenon lamp for both UV and visible ranges, or a combination of a deuterium lamp (UV) and a tungsten or halogen lamp (visible).
- Wavelength Selector: A monochromator, often using a diffraction grating, to isolate specific wavelengths of light from the broad spectrum emitted by the source.
- Sample Holder: A cuvette, typically with a path length of 1 cm, made of quartz for UV light (as glass and plastic absorb UV) [1].
- Detector: A device, such as a photomultiplier tube (PMT) or a photodiode, that converts the transmitted light intensity into an electrical signal.
- Computer/Readout: A system that processes the signal and outputs the data, often as a graph of absorbance versus wavelength.
The instrument first measures the intensity of light passing through a reference or blank sample (Iâ‚€). It then measures the intensity passing through the analyte sample (I). Absorbance (A) is calculated as A = logâ‚â‚€(Iâ‚€/I) [1].
Quantitative Analysis with Beer-Lambert Law
For quantitative analysis, the relationship between absorbance and concentration is given by the Beer-Lambert Law: A = ε * c * L Where:
- A is the measured absorbance (no units)
- ε is the molar absorptivity (L·molâ»Â¹Â·cmâ»Â¹)
- c is the concentration of the analyte (mol·Lâ»Â¹)
- L is the path length of the cuvette (cm) [1]
This linear relationship allows for the determination of an unknown concentration by measuring its absorbance, provided the molar absorptivity and path length are known. For accurate results, absorbance values should generally be kept below 1 to remain within the instrument's dynamic range [1].
Raw Material Verification
The Critical Role of Raw Material Identification
Raw material identification and verification (RMID) is a foundational quality process that confirms the quality and identity of the raw materials used in pharmaceutical manufacturing [45]. The specifications for starting materials must be well-defined and documented to ensure that the material received is exactly what was specified and ordered, preventing mix-ups that could have serious consequences for product safety and efficacy [46]. These specifications serve as a minimum standard, and any failure to meet them must result in an Out-of-Specification (OOS) notice and investigation, typically leading to the rejection of the material [46].
UV-Vis Spectroscopy in Raw Material Verification
UV-Vis spectroscopy is extensively used for the chemical identification and confirmation of raw materials, including Active Pharmaceutical Ingredients (APIs) [4]. The technique can confirm chemical identity by comparing the absorption spectrum of a sample with the spectrum of a known reference standard. Each chemical compound has a unique absorption spectrum characterized by specific peak wavelengths and intensities, serving as a "fingerprint" for identification.
A standard protocol for the UV-Vis identification of an API, such as Ibuprofen, according to USP and EP monographs, involves the following steps [4]:
- Preparation of Standard Solution: Accurately weigh and dissolve the primary reference standard of the API in a suitable solvent to prepare a solution of known concentration.
- Preparation of Test Solution: Similarly, prepare a solution of the unknown raw material sample using the same solvent and concentration.
- Spectrum Acquisition: Using a double-beam UV-Vis spectrophotometer, scan both solutions across the relevant UV wavelength range (e.g., 200-400 nm).
- Identification Criteria: The test sample is considered to meet the identification requirement if the spectrum obtained exhibits a similar shape and maxima/minima to the spectrum of the reference standard when measured under the same conditions.
Table 1: Key Research Reagent Solutions for Raw Material Verification
| Reagent/Material | Function | Critical Quality Attribute |
|---|---|---|
| Primary Reference Standard | Authentic substance of high purity used as a benchmark for identification and assay [46]. | Must be obtained from an officially recognized source (e.g., USP, EP) and have its identity and purity thoroughly documented [46]. |
| Spectral Solvent | High-purity solvent to dissolve the sample without interfering absorbances in the spectral region of interest [1]. | UV-Vis grade purity; transparent at the wavelengths used for analysis (e.g., methanol for UV, water for visible). |
| Volumetric Glassware | To ensure accurate and precise preparation of sample and standard solutions. | Class A accuracy; calibrated periodically. |
The following workflow diagram illustrates the logical sequence of raw material verification using UV-Vis spectroscopy:
Diagram 1: Raw Material Verification Workflow
Finished Product Testing
Quality Control Requirements for Finished Products
Specifications for finished pharmaceutical products are typically registered with government regulatory agencies and cannot be changed without prior approval [46]. These specifications provide an exact statement of the active material and include details of all required QC tests, their limits, and references to the official test methods [46]. Failure to meet any aspect of the finished product specification results in an OOS investigation and batch rejection if the OOS is confirmed [46]. Key tests often include identity, assay, impurity profiling, and dissolution, all of which can be supported by UV-Vis spectroscopy.
Key UV-Vis Applications in Finished Product Testing
Assay and Chemical Quantification
UV-Vis is a standard technique for quantifying the amount of active ingredient in a finished drug product. The assay verifies that the drug contains the amount of active ingredient stated on the label [3]. The general methodology involves:
- Sample Preparation: A representative sample of the finished product (e.g., a crushed tablet or an aliquot of a liquid) is dissolved and often diluted to a target concentration within the linear range of the Beer-Lambert Law.
- Calibration Curve: A series of standard solutions of the API at known concentrations are prepared and their absorbances measured to construct a calibration curve of absorbance versus concentration.
- Quantification: The absorbance of the prepared sample solution is measured, and the concentration of the API is determined from the calibration curve.
Dissolution Testing
Dissolution testing is critical for solid oral dosage forms (like tablets) to ensure the drug dissolves properly for the body to absorb [4] [3]. UV-Vis spectroscopy is the standard method for analyzing the dissolved drug collected at specific time points during dissolution testing. The concentration of the drug in the dissolution medium is determined spectrophotometrically, allowing for the calculation of the percentage of drug released over time.
Detection and Quantification of Impurities
UV-Vis is commonly utilized in pharmaceutical monographs for quantifying impurities in drug ingredients and finished products [4]. Some impurities may have different absorption characteristics than the main API. By measuring absorbance at specific wavelengths, the presence and quantity of these impurities can be assessed to ensure they are below the safety thresholds defined in the product specification.
Table 2: Summary of Finished Product Tests Using UV-Vis Spectroscopy
| Test Type | QC Objective | Typical UV-Vis Methodology |
|---|---|---|
| Identity | To confirm the product is correctly labeled and contains the intended API [3]. | Compare the UV spectrum of the sample extract against a reference standard. |
| Assay | To verify the quantity of the API matches the labeled amount [3]. | Use a validated UV method with a calibration curve to determine API concentration. |
| Impurity Content | To confirm specified impurities are not present above acceptable levels [3]. | Measure absorbance at impurity-specific wavelengths; often requires high sensitivity. |
| Dissolution | To verify the release of the API from the dosage form [3]. | Analyze samples from dissolution vessels at set intervals to determine % drug released. |
Analytical Method Validation, Verification, and Workflows
Ensuring Method Reliability: Validation vs. Verification
For UV-Vis methods used in routine QC, demonstrating scientific and regulatory fitness-for-purpose is mandatory.
- Analytical Method Validation is a formal process that demonstrates a method is suitable for its intended use. It is typically required for new methods used in routine QC and involves assessing parameters like accuracy, precision, specificity, linearity, range, and robustness [47].
- Analytical Method Verification is performed when a laboratory adopts a compendial method (e.g., from USP or EP) that has already been validated. It is a confirmation that the method works as expected in the receiving lab's environment with its analysts and equipment. The verification process is less extensive than validation but typically includes a limited assessment of accuracy, precision, and specificity [47].
Integrated QC Workflow for Finished Products
The application of UV-Vis spectroscopy in finished product testing is part of a larger, systematic QC process. The following diagram integrates the testing protocols into an overall workflow from batch sampling to batch release.
Diagram 2: Finished Product Testing Workflow
Regulatory Compliance and Instrument Qualification
Adherence to Pharmacopeial Standards
UV-Vis methods used for pharmaceutical QC must comply with the guidelines set forth in international pharmacopeias. The USP, EP, and JP define specific performance levels for various criteria, and instruments used in regulated laboratories require performance verification at installation and at set intervals thereafter [4]. For example, the USP general chapter <857> outlines the required performance specifications for UV-Vis spectrophotometers, including parameters like wavelength accuracy, stray light, and photometric accuracy.
Data Integrity and Instrument Compliance
In regulated environments, the data generated by UV-Vis systems must be reliable and traceable. Software designed for these instruments, such as Thermo Scientific Insight Pro Security Software, enables 21 CFR Part 11 compliance, which governs electronic records and signatures [4]. This involves features like user access controls, audit trails, and data encryption to ensure the integrity of analytical data throughout its lifecycle.
Within pharmaceutical research, UV-Visible (UV-Vis) spectrophotometry serves as a fundamental analytical tool for quantifying substances and monitoring chemical processes. This technical guide focuses on two advanced applications—microvolume analysis and kinetic studies—that enhance the utility of this core instrumentation. Microvolume analysis addresses the critical need to conserve precious biological samples, while kinetic studies enable researchers to elucidate reaction mechanisms and rates. Framed within the context of a broader thesis on basic UV-Vis instrumentation for pharmaceutical research, this whitepaper provides in-depth methodologies, experimental protocols, and data analysis techniques tailored for scientists and drug development professionals. The integration of these advanced techniques into pharmaceutical workflows supports key objectives in drug discovery, development, and quality control, from initial compound screening to final product validation.
Microvolume Analysis for Precious Samples
Microvolume spectrophotometers are engineered to measure the absorbance of light by biological samples using significantly reduced volumes, typically ranging from 0.3 to 2 µL [48] [49]. This capability is paramount in pharmaceutical research where samples are often limited, expensive, or difficult to produce. The technology eliminates the need for traditional cuvettes by employing specialized pedestals or surfaces where the sample is directly deposited, preserving valuable biological material and reducing consumable costs [49].
The principle of operation relies on the specific absorbance characteristics of molecules. Different biological molecules absorb light at characteristic wavelengths: nucleic acids at 260 nm, proteins at 280 nm, and various contaminants at their own specific wavelengths [49]. By measuring the absorbance at these target wavelengths, researchers can simultaneously determine sample concentration, purity, and integrity from a single, minute sample.
Key Technical Specifications and Advantages
Table 1: Performance Characteristics of a Typical Microvolume Spectrophotometer
| Parameter | Specification | Pharmaceutical Research Benefit |
|---|---|---|
| Sample Volume | 0.3 - 2.0 µL | Preserves precious/expensive samples [48] [49] |
| Path Length | ~0.67 mm (adjustable) | Maintains absorbance within linear dynamic range [48] |
| Scan Range | 200 - 900 nm | Allows analysis of diverse biomolecules and pharmaceuticals [48] [49] |
| Measurement Time | 2.5 - 4 seconds | Enables high-throughput screening [48] |
| Absorbance Range | Up to 10,000 AU (dsDNA) | Accommodates concentrated samples without dilution |
The primary advantage of microvolume systems lies in their ability to analyze highly concentrated samples without requiring dilution. The short path length—automatically adjusted by instruments like the NP80 NanoPhotometer to approximately 0.67 mm—ensures that absorbance values remain within the instrument's linear dynamic range (typically 0.05-1.0 AU), even for concentrated nucleic acid or protein solutions that would otherwise exceed the detection limit in a standard 1 cm cuvette [48] [1]. This feature streamlines workflow by eliminating dilution errors and saving preparation time.
Experimental Protocol: Microvolume Analysis of Levofloxacin in Saliva
The following detailed protocol, adapted from a study on therapeutic drug monitoring (TDM), demonstrates the application of microvolume UV-Vis spectrophotometry for quantifying an antibiotic in a complex biological matrix [48].
Research Reagent Solutions
Table 2: Essential Materials for Levofloxacin Microvolume Analysis
| Item | Function | Specifications/Notes |
|---|---|---|
| Mobile UV-Vis Spectrophotometer | Quantification of analyte | NP80 NanoPhotometer or equivalent; requires 0.3-2 µL sample [48] |
| Levofloxacin Reference Standard | Calibration curve preparation | ≥98% purity; prepare stock solution in appropriate solvent [48] |
| Drug-Free Saliva | Biological matrix | Filter through 0.22 µm polyethersulphone filter to remove particulates [48] |
| Savitsky-Golay Algorithm | Data processing | Enhances selectivity via second-order derivative spectroscopy [48] |
| Lint-Free Tissues & 70% Ethanol | Instrument cleaning | Critical for preventing cross-contamination between samples [48] [49] |
Step-by-Step Methodology
- Sample Preparation: Collect saliva samples using a specialized collection device (e.g., Salivette). Centrifuge if necessary and filter the supernatant through a 0.22 µm syringe filter to remove cellular debris and large proteins [48].
- Calibration Standards: Prepare levofloxacin calibrators in drug-free, filtered saliva across a concentration range of 2.5–50.0 mg/L. This range encompasses therapeutically relevant concentrations for therapeutic drug monitoring [48].
- Instrument Setup: Power on the microvolume spectrophotometer and initialize the associated software. Ensure the sample pedestal is thoroughly cleaned before initiation.
- Blank Measurement: Apply approximately 1 µL of filtered, drug-free saliva to the measurement surface. Perform a blank measurement to establish a baseline, scanning from 200-900 nm [48].
- Sample Measurement: Wipe the pedestal clean. Apply a 1 µL aliquot of each calibrator and unknown sample to the measurement surface. Record the full UV-Vis spectrum for each [48].
- Data Processing: Process the acquired zero-order spectra using the Savitsky-Golay method to generate second-order derivative spectra. This mathematical treatment enhances selectivity by suppressing broad absorbance bands from matrix interferents and emphasizing sharp peaks from the target analyte [48].
- Quantification: Construct a calibration curve by plotting the amplitude of the second-order derivative spectrum between 300-400 nm against the known levofloxacin concentrations. Use linear regression to determine the concentration of unknown samples from the derived calibration function [48].
Method Validation and Data Interpretation
The described method for levofloxacin quantification was rigorously validated. The calibration curve demonstrated excellent linearity with a correlation coefficient of 0.997. Calculated accuracy ranged from -5.2% to 2.4%, and overall precision (expressed as relative standard deviation) ranged from 2.1% to 16.1% [48]. The use of derivative spectroscopy was crucial for mitigating interference from commonly co-administered drugs like rifampicin and pyrazinamide, particularly at the lower limit of quantitation [48].
For nucleic acid and protein samples, purity assessment is performed via absorbance ratios. An A260/A280 ratio of ~1.8 indicates pure DNA, while ~2.0 is typical for pure RNA. Significantly lower ratios suggest protein contamination. The A260/A230 ratio, ideally above 2.0, helps detect contamination from salts or organic compounds [49].
Kinetic Studies Using UV-Vis Spectroscopy
Kinetic studies with UV-Vis spectroscopy involve monitoring the change in concentration of a reactant or product over time by measuring absorbance at a specific wavelength. This application is vital in pharmaceutical research for determining reaction rates, elucidating reaction mechanisms, and calculating kinetic parameters such as rate constants and activation energies [50]. The technique is particularly valuable because it allows for in-situ, non-destructive monitoring of reactions in aqueous solutions under mild conditions, making it both safe and cost-effective for undergraduate instruction and industrial research alike [50].
The fundamental principle relies on the linear relationship between absorbance and concentration, as defined by the Beer-Lambert Law. By tracking absorbance as a function of time, researchers can derive reaction rates and determine the order of the reaction. For many complex reactions, a pseudo-first-order kinetic model is applied where the concentration of one reactant is in large excess, making its concentration effectively constant [50].
Experimental Protocol: Kinetic Study of Fenton Oxidation
The degradation of organic dyes via the Fenton oxidation process serves as an excellent model reaction for teaching and researching reaction kinetics. This protocol details the investigation of Naphthol Blue Black (NBB) degradation [50].
Research Reagent Solutions
Table 3: Essential Materials for Fenton Oxidation Kinetics
| Item | Function | Specifications/Notes |
|---|---|---|
| UV-Vis Spectrophotometer with Cuvette | Absorbance monitoring | Requires quartz cuvette for UV light transmission [50] [1] |
| Naphthol Blue Black (NBB) | Target pollutant/absorbing species | Monitor decay at its λ_max (~618 nm) [50] |
| Hydrogen Peroxide (Hâ‚‚Oâ‚‚) | Primary oxidant | 30% stock solution; handle with care [50] |
| Ferrous Sulfate (FeSO₄·7H₂O) | Fenton reaction catalyst | Source of Fe²⺠ions [50] |
| Sulfuric Acid (Hâ‚‚SOâ‚„) / Sodium Hydroxide (NaOH) | pH adjustment | Maintain reaction at low pH (2-4) [50] |
| Thermostated Water Bath | Temperature control | For activation energy studies [50] |
Step-by-Step Methodology
- Reaction Mixture Preparation: In an Erlenmeyer flask, mix NBB and FeSO₄·7H₂O in ultrapure water. Adjust the pH to the desired value (e.g., 3.0) using 0.5 M H₂SO₄ or NaOH [50].
- Temperature Equilibration: Place the flask in a thermostated water bath to maintain a constant temperature (e.g., 25°C). Allow the mixture to equilibrate [50].
- Baseline Absorbance Measurement: Transfer a portion of the reaction mixture to a quartz cuvette and measure the initial absorbance (ARHâ‚€) at the analytical wavelength (e.g., 618 nm for NBB) [50].
- Reaction Initiation and Monitoring: Add the requisite volume of Hâ‚‚Oâ‚‚ to the flask to initiate the Fenton oxidation. Immediately begin monitoring the absorbance at the chosen wavelength over time. For manual sampling, remove aliquots at regular intervals and measure absorbance. For in-situ monitoring, use a fiber optic probe [50].
- Data Collection: Record absorbance values at consistent time intervals until the reaction is complete (i.e., until the absorbance no longer changes) [50].
Data Analysis and Kinetic Parameter Calculation
The degradation of NBB by hydroxyl radicals (HO•) generated in the Fenton process follows a pseudo-first-order kinetic model. The apparent rate constant ((k_{app})) is determined as follows [50]:
The rate law is: [ \text{Rate} = k{app}[NBB] ] Where (k{app} = k[HO•]), assuming the concentration of HO• radicals is constant.
Integration of this rate law gives: [ \ln\left(\frac{[NBB]t}{[NBB]0}\right) = -k{app}t ] Since absorbance (A) is proportional to concentration, this becomes: [ \ln\left(\frac{At}{A0}\right) = -k{app}t ]
A plot of (\ln(At/A0)) versus time (t) yields a straight line with a slope of (-k_{app}).
To determine the activation energy (Ea), the experiment is repeated at different temperatures. The Arrhenius equation is then applied [50]: [ k{app} = A \exp\left(\frac{-Ea}{RT}\right) ] [ \ln(k{app}) = \ln(A) - \frac{Ea}{R}\left(\frac{1}{T}\right) ] A plot of (\ln(k{app})) versus the reciprocal of the absolute temperature ((1/T)) gives a straight line with a slope of (-Ea/R), from which Ea can be calculated. In the referenced study, the Fenton oxidation of NBB had an activation energy of (56.0 \pm 7 \, \text{kJ mol}^{-1}) [50].
Table 4: Summary of Kinetic Data from a Fenton Oxidation Study of NBB
| Variable Studied | Experimental Condition | Apparent Rate Constant, k_app (minâ»Â¹) | Inference |
|---|---|---|---|
| pH | pH 2.0 | Value X | Optimal rate at low pH |
| pH 3.0 | Value Y (Maximum) | ||
| pH 5.0 | Value Z | Significant rate decrease | |
| [Hâ‚‚Oâ‚‚] | 5 mM | Value A | Rate increases with [Hâ‚‚Oâ‚‚] |
| 10 mM | Value B | ||
| 20 mM | Value C | ||
| [Fe²âº] | 0.1 mM | Value D | Rate increases with [Fe²âº] |
| 0.2 mM | Value E | ||
| 0.5 mM | Value F | ||
| Temperature | 25°C | Value G | Used for Ea calculation |
| 35°C | Value H | ||
| 45°C | Value I |
Microvolume analysis and kinetic studies represent two powerful advanced techniques that extend the capabilities of basic UV-Vis spectrophotometry into the heart of modern pharmaceutical research. The ability to obtain accurate quantitative and kinetic data from microliter-volume samples enables critical decision-making in drug development pipelines, from early-stage discovery to quality control of final formulations. As demonstrated in the detailed protocols, these methods provide robust, reproducible, and cost-effective solutions for analyzing precious biological samples and unraveling complex reaction kinetics. By integrating these techniques into their standard practices, pharmaceutical researchers and scientists can enhance efficiency, deepen mechanistic understanding, and ultimately contribute to the development of safer and more effective therapeutics.
In the global pharmaceutical industry, compliance with pharmacopeial standards is not merely a regulatory formality but a fundamental prerequisite for ensuring the safety, efficacy, and quality of drug products. The United States Pharmacopeia (USP), European Pharmacopoeia (EP), and Japanese Pharmacopoeia (JP) collectively form the cornerstone of quality control for medicines and their ingredients worldwide [51]. These compendia establish legally enforceable standards for identity, strength, purity, and performance of pharmaceutical substances [52]. Within this framework, UV-Visible (UV-Vis) spectrophotometry emerges as an indispensable analytical technique, with applications spanning identity testing, assay content determination, and impurity profiling. The technique's prominence is reflected in the robust market for UV-Vis spectrometers, valued at approximately $2.5 billion globally, with the pharmaceutical industry accounting for roughly 40% of demand [53]. This guide provides pharmaceutical researchers and scientists with a comprehensive technical framework for aligning UV-Vis spectrophotometric practices with the specific requirements of USP, EP, and JP monographs, thereby ensuring regulatory compliance and product quality.
Understanding Pharmacopeia Monographs
Purpose and Legal Status
A pharmacopeial monograph is a detailed document that articulates the quality expectations for a specific medicine or active pharmaceutical ingredient (API). According to the USP, a monograph provides the tests and acceptance criteria to verify identity, strength, quality, and purity [52]. Compliance with these monographs carries significant legal weight. In the United States, USP standards are enforceable by the Food and Drug Administration (FDA), while EP standards are legally binding across its member states, and JP standards are established by Japan's Minister of Health, Labour and Welfare [51]. These standards are dynamic, continually updated to reflect new FDA approvals, advances in technology, and emerging safety data [52]. The development of monographs is a collaborative process involving scientific experts from academia, industry, and regulatory bodies, ensuring they represent current scientific consensus and regulatory expectations [52].
Harmonization Efforts: The Pharmacopeial Discussion Group (PDG)
To mitigate challenges posed by divergent standards across regions, the Pharmacopeial Discussion Group (PDG) works to harmonize general chapters and excipient monographs among USP, EP, and JP. This harmonization process, which can be retrospective for existing documents or prospective for new ones, follows a structured working procedure with stages including preparation of drafts, official inquiry, consensus-building, and regional implementation [54]. The goal is to establish inter-regional acceptance of testing methods, thereby reducing redundant testing for companies marketing products globally. For UV-Vis spectrophotometry, this harmonization is particularly relevant to general chapters dealing with instrumental analysis, which aim to standardize terminology, validation requirements, and procedural aspects across the major pharmacopeias.
Core UV-Vis Spectrophotometer Components and Compliance Considerations
Modern UV-Vis spectrophotometers are sophisticated instruments whose design and performance characteristics directly impact their suitability for pharmacopeial testing. The core components must meet stringent specifications to ensure data integrity and regulatory compliance.
Instrument Components and Specifications
- Light Source: Deuterium lamps (UV) and Tungsten-Halogen lamps (Vis) are most common. Stability and longevity of the source are critical for reproducible results.
- Monochromator: Contains a diffraction grating to disperse light and select specific wavelengths. Spectral bandwidth (SBW) is a key parameter that must be verified per pharmacopeial requirements, often specified as ≤2 nm [55].
- Sample Compartment: Must accommodate standard 10 mm pathlength quartz cuvettes. Thermostatable compartments are needed for assays requiring temperature control.
- Detector: Photomultiplier tubes (PMT) or photodiode arrays (PDA). PDA detectors allow simultaneous multi-wavelength detection and rapid scanning, with this technology segment growing at a 7.76% CAGR [55].
- Optical Configuration: Double-beam systems, which hold 41.45% revenue share, provide superior baseline stability by simultaneously measuring sample and reference pathways, making them ideal for regulated environments [55].
Performance Verification: A Critical Compliance Activity
Regular performance verification is mandatory to ensure instruments remain in a state of control. Key parameters and their typical acceptance criteria, synthesized from general chapters across pharmacopeias, include:
Table 1: Key Performance Parameters for UV-Vis Spectrophotometer Qualification
| Parameter | Typical Acceptance Criteria | Common Verification Method |
|---|---|---|
| Wavelength Accuracy | ±1 nm (UV), ±2 nm (Vis) | Holmium oxide or didymium filters; characteristic peak positions |
| Photometric Accuracy | ±0.5% Abs (at 1 Abs) | Neutral density filters or potassium dichromate solutions |
| Stray Light | <0.1% (at 220 nm and 340 nm) | Aqueous NaI (220 nm) or NaNOâ‚‚ (340 nm) solutions |
| Resolution | Sufficient to resolve fine structure | Toluene in hexane spectrum; measurement of valley between peaks |
| Spectral Bandwidth | Typically ≤2 nm, as monograph specified | Measurement of mercury emission lines or holmium oxide peaks |
Automated verification modules, such as Mettler-Toledo's CertiRef, are increasingly adopted to perform wavelength, photometric, and stray-light checks using certified reference materials, generating electronic audit trails essential for compliance with FDA data-integrity rules [55].
Comparative Analysis of USP, EP, and JP Requirements
While the fundamental principles of UV-Vis spectrophotometry are consistent across pharmacopeias, subtle differences in requirements and phrasing can impact compliance strategies. A detailed comparative analysis reveals both convergence and divergence in monograph expectations.
Quantitative Comparison of General Requirements
The following table synthesizes key requirements from USP, EP, and JP general chapters relevant to UV-Vis spectrophotometry, highlighting critical areas for method development and validation.
Table 2: Comparative Analysis of UV-Vis Requirements in USP, EP, and JP
| Parameter | USP General Chapter <857> | EP General Chapter 2.2.25 | JP General Chapter 2.24 |
|---|---|---|---|
| Wavelength Accuracy | ±1 nm (UV), ±3 nm (Vis) | ±1 nm (UV and Vis) | ±0.5 nm (UV), ±1.5 nm (Vis) |
| Stray Light | Must be specified; typically <0.5-1% | Must be specified; typically <0.5-1% | Must be specified; typically <0.5-1% |
| Photometric Accuracy | ±0.5-1.0% (depending on Abs) | ±0.5-1.0% (depending on Abs) | ±0.5-1.0% (depending on Abs) |
| Resolution | Must be verified | Must be verified; may specify SBW | Must be verified; may specify SBW |
| Validation | Refer to USP <1225> | Refer to EP Chapter 5.2 | Refer to JP General Requirements |
| Reference Standards | USP Reference Standards | EP Chemical Reference Substances | JP Reference Standards |
Operational Implications of Differences
The differences highlighted in Table 2 necessitate careful operational considerations. The stricter wavelength accuracy required by JP, particularly in the UV region, may demand more frequent calibration checks and potentially higher-specification instrumentation for methods transferred between regions. Furthermore, while the numerical limits for stray light appear similar, the specific solutions and concentrations mandated for its verification might differ, requiring laboratories to maintain multiple verification protocols. The most significant practical difference often lies in the reference standards specified in individual monographs. A laboratory testing the same API against USP, EP, and JP monographs must source the appropriate regional reference standard for accurate quantification, as differences in purity values or processing can impact results [51]. Understanding these nuances is essential for managing a global product portfolio and successfully transferring methods between international sites.
Experimental Protocols for Compliant UV-Vis Analysis
Standard Operating Procedure for Identity Testing
Identity testing via UV-Vis spectrophotometry typically involves comparing the sample spectrum against a reference standard.
- Preparation of Reference Solution: Accurately weigh and dissolve the pharmacopeial reference standard in the specified solvent to obtain the concentration indicated in the monograph.
- Preparation of Test Solution: Prepare the sample (API or finished product) as directed in the monograph, ensuring extraction and dilution are performed quantitatively.
- Spectral Acquisition: Using a validated spectrophotometer, scan both solutions across the wavelength range specified (e.g., 200-400 nm). Use matched quartz cuvettes and the same solvent as the blank.
- Acceptance Criteria: The spectrum of the test solution should exhibit maxima and minima at the same wavelengths as the reference standard. The ratio of absorbances at specific wavelengths may also be calculated and must fall within the monograph's specified range.
Detailed Protocol for Assay by Baseline Manipulation Methodology
The baseline manipulation method, a technique applicable to binary mixtures, can be used for simultaneous determination without prior separation [56]. The following protocol, adapted from a published study on drotaverine and etoricoxib, illustrates a compliant approach [56].
Principle: The method involves using a solution of one analyte as the blank to eliminate its spectral contribution, allowing for the direct measurement of the second analyte at an independent wavelength.
Procedure:
- Standard Stock Solutions: Prepare separate standard stock solutions of Analyte A and Analyte B at concentrations of 100 µg/mL in the specified solvent (e.g., methanol).
- Working Standard Solutions: Prepare mixed standard solutions containing both analytes across the linearity range (e.g., 4-20 µg/mL for A and 4.5-22.5 µg/mL for B) by serial dilution.
- Singular Baseline Manipulation:
- Fill the reference cell with a solution of Analyte A at an appropriate concentration (e.g., 20 µg/mL).
- Scan the mixed standard solutions against this blank.
- Measure the instrument response (absorbance) at the selected wavelength for Analyte B (e.g., 351 nm). The contribution of Analyte A is effectively subtracted.
- Prepare a calibration curve of absorbance versus concentration for Analyte B.
- Analysis of Tablet Formulation:
- Weigh and powder not less than 20 tablets.
- Accurately weigh a portion of the powder equivalent to one tablet's drug content into a volumetric flask.
- Add about 80% of the specified solvent, sonicate for 15 minutes, and dilute to volume.
- Filter the solution, discard the first few mL of filtrate, and further dilute the subsequent filtrate appropriately.
- Measure the absorbance of the final test solution using the baseline manipulation procedure described above.
- Calculation: Calculate the content of Analyte B in the tablet using the calibration curve. The content of Analyte A can be determined using a separate procedure or by reversing the baseline manipulation roles.
Method Validation: This method must be validated per ICH guidelines, demonstrating linearity, accuracy, precision, specificity, LOD, LOQ, and robustness [56]. Robustness should be checked by deliberately varying parameters like sonication time (±5 min), wavelength of measurement (±2 nm), and concentration in the reference cell (±2 µg/mL) [56].
The Scientist's Toolkit: Essential Research Reagent Solutions
Successful implementation of UV-Vis methods for pharmacopeial compliance requires not only a well-qualified instrument but also the use of high-quality, traceable reagents and materials. The following table details essential items for the laboratory.
Table 3: Essential Research Reagents and Materials for Compliant UV-Vis Analysis
| Item | Function/Application | Compliance Consideration |
|---|---|---|
| Pharmacopeial Reference Standards | Provides the official benchmark for identity, assay, and impurity tests. | Must be sourced from the relevant pharmacopeia (USP, EP, JP). Certificate of Analysis provides critical purity and storage information. |
| Holmium Oxide Filter | Primary standard for verification of wavelength accuracy across UV-Vis range. | Certified reference material (CRM) with documented traceability to national metrology institute (NMI) is required. |
| Potassium Dichromate | Solution used for verification of photometric accuracy and stray light. | High-purity material (>99.95%) with low UV absorbance, typically dissolved in perchloric acid. |
| Stray Light Verification Solutions | NaI (for 220 nm) and NaNOâ‚‚ (for 340 nm) to check for stray light. | Solutions must be prepared at specified concentrations (e.g., 1.2% w/v NaI) using high-purity water and chemicals. |
| Spectroscopic Grade Solvents | Methanol, acetonitrile, water, etc., for sample and standard preparation. | Must possess low UV absorbance, especially at lower wavelengths (<240 nm). |
| Quartz Cuvettes (Matched Pair) | Hold samples and blanks for measurement in the spectrophotometer. | Must be verified for matched pathlength (typically 10 mm) and absence of defects. |
| Ultrapure Water System | Produces water for preparation of solutions, blanks, and mobile phases. | Systems like the Milli-Q SQ2 series deliver Type I water (18.2 MΩ·cm) with low TOC and particulate matter, essential for trace analysis [57]. |
| Avanafil-d4 | Avanafil-d4, MF:C23H26ClN7O3, MW:488.0 g/mol | Chemical Reagent |
| C188 | C188, MF:C19H15NO7S2, MW:433.5 g/mol | Chemical Reagent |
Navigating the requirements of USP, EP, and JP monographs for UV-Vis spectrophotometry demands a meticulous, science-driven approach grounded in a deep understanding of both instrumental capabilities and regulatory expectations. The convergence of stringent data-integrity rules, escalating demand for biologics quality assurance, and technological advancements in instrumentation underscores the critical role of this technique in modern pharmaceutical analysis [55]. Success hinges on several key practices: rigorous and documented instrument qualification, careful attention to the nuanced differences between pharmacopeias, methodical execution of validated testing protocols, and the consistent use of high-quality, traceable materials. By adhering to these principles, pharmaceutical scientists can leverage UV-Vis spectrophotometry not merely as a compliance exercise, but as a powerful, reliable tool to uphold the highest standards of drug quality and patient safety on a global scale.
Troubleshooting UV-Vis in Regulated Labs: Ensuring Data Accuracy and Instrument Longevity
Ultraviolet-Visible (UV-Vis) spectroscopy is a cornerstone analytical technique in pharmaceutical research, employed for tasks ranging from drug identification and nucleic acid purity checks to quality control and concentration quantification [1]. Despite its widespread use and relative simplicity, the technique is susceptible to a range of errors that can compromise data integrity. For researchers, scientists, and drug development professionals, recognizing and diagnosing these errors is critical for ensuring the reliability of analytical results. This guide provides an in-depth examination of common problems in UV-Vis spectroscopy, categorizing them into sample-related, instrument-related, and methodological errors, and offers detailed protocols for their identification and resolution.
Sample-Related Errors
Errors originating from the sample itself are among the most frequent challenges in pharmaceutical analysis.
Improper Sample Preparation
Incorrect sample preparation can significantly skew absorbance readings [58]. Common pitfalls include:
- Incorrect Concentration: Samples prepared outside the linear dynamic range of the instrument can lead to signal saturation or loss. Absorbance values should ideally be kept below 1 to remain within the instrument's reliable detection range [1].
- Inadequate Mixing or Impurities: Lack of homogeneity or the presence of contaminants can cause inconsistent measurements and inaccurate results.
- Solution: Prepare samples within the validated concentration range, mix thoroughly to ensure uniformity, and filter samples to remove particulates or degas to eliminate bubbles that cause light scattering [58].
Sample Degradation and Solvent Effects
The stability of the analyte and its solvent matrix is paramount for accurate spectroscopy.
- Sample Degradation: Photosensitive samples may degrade when exposed to the powerful light source of a spectrophotometer, leading to drifting absorbance values during measurement [58].
- Solvent Effects: The choice of solvent can influence absorbance due to its own UV-Vis absorption characteristics or through specific interactions with the sample molecules [58]. Using a solvent that absorbs strongly in the spectral region of interest will obscure the sample's signal.
- Solution: Minimize light exposure by using appropriate cuvettes and preparing samples immediately before analysis. Always select a solvent with low absorbance in the region of interest and use the exact same solvent for the blank measurement [58].
Scattering from Particulates or Aggregates
In pharmaceutical applications involving proteins or suspensions, light scattering is a major concern.
- The Challenge: Rayleigh and Mie light scattering from particulates, soluble protein aggregates, or large proteins can lead to significant inaccuracies in concentration measurements via Beer's Law [59]. This scattering manifests as a rising baseline, particularly at lower wavelengths.
- Solution: Employ filtration or centrifugation to clarify solutions. For advanced analysis, curve-fitting baseline subtraction approaches based on fundamental Rayleigh and Mie scattering equations can be applied to correct the spectra [59].
Table 1: Summary of Common Sample-Related Errors and Solutions
| Error Type | Primary Cause | Impact on Spectrum | Corrective Action |
|---|---|---|---|
| Incorrect Concentration | Sample too concentrated or too dilute | Absorbance outside linear range (e.g., >1 AU) | Dilute or concentrate sample; use shorter path length cuvette |
| Sample Degradation | Light-sensitive analyte | Drifting absorbance over time | Limit light exposure; use fresh samples |
| Solvent Interference | Solvent absorbs in measurement region | High background, distorted peaks | Use a spectrally appropriate solvent; match blank to sample solvent |
| Light Scattering | Particulates or aggregates in solution | Elevated baseline, slope at low wavelengths | Filter or centrifuge sample; apply scattering correction algorithms |
Instrument-Related Errors
The performance and condition of the spectrophotometer are critical for obtaining valid data.
Stray Light
Stray light is defined as detected light that is outside the nominal bandwidth selected by the monochromator [60]. It can originate from unwanted reflections, scattering from optical components, or light leakage into the spectrometer [60].
- Impact: Stray light causes a non-linear deviation from the Beer-Lambert law, particularly at high absorbance values (typically >1 AU), leading to lower measured absorbance than the true value [61]. The effect becomes more pronounced as absorbance increases.
- Diagnosis and Solution: Keep the instrument's optics clean and ensure cuvette seals are not damaged [60]. Stray light can be quantified using certified cut-off filters or solutions like sodium iodide (NaI), which do not transmit light at specific wavelengths (e.g., 220 nm) [61]. The stray light percentage is then calculated from the measured transmittance.
Wavelength Inaccuracy
The accuracy of the wavelength scale is fundamental for both qualitative identification and quantitative analysis.
- Impact: An inaccurate wavelength scale will report absorbance at the wrong wavelength, leading to incorrect peak identification and erroneous concentration calculations based on molar absorptivity [62].
- Diagnosis and Solution: Wavelength accuracy is verified by measuring a standard with known, sharp spectral features. Common standards include:
- Emission lines from a deuterium lamp (e.g., at 656.1 nm and 486.0 nm) [61].
- Absorption peaks of holmium oxide (holmia) filters or solutions, which have well-defined peaks at specific wavelengths [62]. The deviation of the measured peak position from the certified value defines the wavelength accuracy.
Photometric Inaccuracy and Drift
This refers to errors in the reported absorbance or transmittance value itself.
- Causes:
- Dark Noise: Thermal effects in the detector generate electron-hole pairs, creating a signal indistinguishable from that generated by photons. This "dark noise" is dependent on integration time and can be reduced by cooling the detector [60].
- Light Source Instability: An aging deuterium or tungsten lamp will lose intensity, leading to low signal, high noise, and photometric drift [63] [61]. A lamp that fails to ignite will prevent the instrument from operating [63].
- Diagnosis and Solution: Regularly allow the instrument to warm up (e.g., 30 minutes) to stabilize. Perform photometric accuracy checks using neutral density filters or standard solutions with known absorbance values. Replace lamps when energy errors occur or as part of preventative maintenance [64].
Table 2: Key Instrument Performance Parameters and Validation Methods
| Performance Parameter | Definition | Validation Standard | Acceptable Criteria Example |
|---|---|---|---|
| Stray Light | Fraction of detected light outside intended bandpass | Sodium Iodide (NaI) solution at 220 nm or Potassium Chloride at 220 nm | < 0.2% T [60] |
| Wavelength Accuracy | Deviation of reported wavelength from true value | Holmium Oxide filter or Deuterium lamp emission lines (656.1 nm) | Deviation ≤ ±0.5 nm [61] |
| Photometric Accuracy | Deviation of reported absorbance from true value | Neutral Density Filter or Potassium Dichromate solution | Deviation ≤ ±0.01 A |
| Noise Level | Short-term fluctuation in absorbance signal | Absorbance at 500 nm (0 Abs) over 1 minute | Peak-to-peak noise < 0.001 A [61] |
Methodology and Data Analysis Errors
Errors in operational procedures and data interpretation can invalidate otherwise sound data.
Baseline and Blanking Errors
The baseline correction is the foundation for all subsequent absorbance measurements.
- Common Pitfalls:
- Solution: Always use a blank that is identical to the sample solvent and matrix. For a sample in an aqueous buffered solution, the blank should be the same aqueous buffered solution without the analyte [1]. Perform baseline correction regularly and ensure the instrument compartment is empty during the procedure.
Path Length and Cuvette Inconsistencies
The path length (b in the Beer-Lambert Law) is a critical factor in calculating concentration.
- Impact: Variations in cuvette path length, or improper alignment in the sample holder, directly affect the measured absorbance and thus the calculated concentration [58]. Using a plastic or glass cuvette for UV measurements below ~300 nm will result in significant light absorption by the cuvette itself.
- Solution: Use high-quality, matched quartz cuvettes for UV work. Ensure all cuvettes are clean, free of scratches, and correctly aligned in the holder with the optical window facing the light path [58].
Overlapping Spectra and Resolution Limits
Pharmaceutical samples often contain multiple absorbing components.
- Challenge: The spectra of different analytes in a mixture can overlap, making it difficult to identify and quantify individual components [58].
- Instrument Limitation: The spectral bandwidth of the instrument determines its ability to resolve fine spectral features. It is often defined as the full-width half-maximum (FWHM) of a peak from a monochromatic light source [60]. A resolution that is too low (e.g., >2.5 nm) may not distinguish peaks that are close together.
- Solution: Employ derivative spectroscopy to resolve overlapping peaks or use advanced software with multi-component analysis (deconvolution) capabilities [58]. For sharp peaks, ensure the instrument's spectral bandwidth is adequate for the application.
Experimental Protocols for Instrument Validation
Routine instrument validation is essential for maintaining data quality and compliance in a regulated pharmaceutical environment.
Stray Light Verification Protocol
Principle: Measure the transmittance of a sample that completely blocks all light at the test wavelength. Any signal detected is classified as stray light [61].
- Standard Preparation: Obtain a certified stray light reference solution, such as an aqueous 1.2% w/v Sodium Iodide (NaI) solution for testing at 220 nm.
- Zero Measurement: Place an opaque shutter or a sealed, empty cuvette in the sample compartment and measure the 0% T baseline.
- Sample Measurement: Fill a matched quartz cuvette with the NaI solution and place it in the sample compartment.
- Measurement and Calculation: Measure the transmittance at 220 nm. The recorded %T value is the instrument's stray light at that wavelength. Compare this value to the manufacturer's specification (e.g., < 0.2% T) [60] [61].
Wavelength Accuracy Verification Protocol
Principle: Compare the measured peak positions of a standard with known, stable peak wavelengths against their certified values.
- Standard Selection: Choose a suitable wavelength standard. Holmium oxide (HoO₃) glass filters are preferred for their sharp, well-defined absorption peaks and ease of use [62].
- Instrument Setup: Ensure the instrument is warmed up and stabilized. Set a slow scan speed and narrow spectral bandwidth for maximum resolution.
- Acquisition: Scan the holmium oxide filter over the appropriate range (e.g., 250-650 nm).
- Analysis: Identify the wavelengths of the absorption maxima. Common holmium oxide peaks include 241.0 nm, 279.4 nm, 287.5 nm, 333.7 nm, 360.9 nm, 418.5 nm, 453.2 nm, 536.2 nm, and 637.5 nm.
- Validation: Calculate the difference between the measured peak wavelengths and the certified values. The maximum deviation should be within the acceptance criteria (e.g., ±0.5 nm for UV-Vis work).
The Scientist's Toolkit: Essential Reagents and Materials for Validation
Table 3: Key Research Reagent Solutions for UV-Vis Spectroscopy Validation and Troubleshooting
| Item | Function / Application | Key Considerations |
|---|---|---|
| Holmium Oxide (HoO₃) Filter | Validates wavelength accuracy using sharp absorption peaks. | Prefer solid filters over solutions for ease of use and stability [62]. |
| Stray Light Reference Solution (e.g., NaI, KCl) | Quantifies the level of heterochromatic stray light in the instrument. | Concentration must be sufficient to provide zero true transmittance at the test wavelength [61]. |
| Neutral Density Filters | Validates photometric (absorbance) accuracy across a range of values. | Certified for specific absorbance values at given wavelengths. |
| Potassium Dichromate | A classic solution standard for verifying photometric linearity and accuracy. | Must be prepared accurately with high-purity material in defined acid conditions. |
| Matched Quartz Cuvettes | Holds liquid samples for measurement; standard pathlength is 1 cm. | Quartz is essential for UV measurements. Cuvettes must be clean, scratch-free, and matched. |
| Fallypride precursor | Fallypride precursor, MF:C27H36N2O6S, MW:516.7 g/mol | Chemical Reagent |
| TM5275 sodium | TM5275 sodium, MF:C28H28ClN3NaO5+, MW:545.0 g/mol | Chemical Reagent |
Integrated Diagnostic Workflow
A systematic approach is the most efficient way to diagnose problems. The following logic diagram outlines a troubleshooting workflow based on observed symptoms.
Robust and reliable UV-Vis spectroscopy in pharmaceutical research hinges on a systematic approach to error diagnosis. By understanding the distinct categories of sample, instrument, and methodological errors, researchers can efficiently troubleshoot issues. Adherence to detailed experimental protocols for instrument validation, coupled with the use of certified standards and reagents, ensures the generation of accurate, reproducible, and compliant data. Integrating these practices into routine laboratory work is fundamental for unlocking the full potential of this versatile analytical technique in drug development.
In pharmaceutical research, the accuracy and reproducibility of Ultraviolet-Visible (UV-Vis) spectrophotometry data are foundational to critical tasks such as drug formulation, quality control (QC), and ensuring regulatory compliance. The instrument's light source is at the heart of this analytical reliability. A degrading or unstable lamp can directly compromise data integrity, leading to inaccurate concentration measurements of Active Pharmaceutical Ingredients (APIs) and potentially costly decision errors during drug development.
This guide provides drug development professionals with a comprehensive framework for managing UV-Vis light sources. We will detail expected lamp lifespans, catalog the definitive signs of performance degradation, and outline proactive replacement and maintenance protocols. Proper lamp management is not merely an instrument upkeep task; it is a vital component of a robust Quality by Design (QbD) framework and essential for maintaining Data Integrity in any GMP or GLP environment.
Understanding UV-Vis Lamps: Types and Lifespans
UV-Vis spectrophotometers typically use a combination of two lamps to cover the full spectral range. Understanding their distinct characteristics and inherent limitations is the first step toward effective management.
Lamp Types and Characteristics
- Deuterium (Dâ‚‚) Lamp: This lamp generates a continuous spectrum in the ultraviolet region, typically from 190 nm to at least 400 nm. Its operation involves an arc discharge through deuterium gas, providing the high-energy light required for electronic transitions of molecules.
- Tungsten-Halogen (WI) Lamp: This lamp covers the visible and near-infrared region, from approximately 320 nm to 1100 nm. It produces light through the incandescence of a tungsten filament, with a halogen cycle that redeposits evaporated tungsten back onto the filament, extending its life.
Quantitative Lifespan Data
Lamp lifespan is not infinite and is most accurately tracked by cumulative lighting hours. The following table summarizes the typical lifespans for these lamps, which can vary based on manufacturer, specific instrument model, and operating conditions [65] [66].
Table 1: Typical Lifespans of UV-Vis Spectrophotometer Lamps
| Lamp Type | Typical Lifespan (Hours) | Primary Spectral Range | Key Degradation Mechanism |
|---|---|---|---|
| Deuterium (D₂) | 1,000 – 3,000 hours [65] | UV (190 – 400 nm) | Gradual depletion of deuterium gas and electrode wear. |
| Tungsten-Halogen (WI) | ~2,000 hours (approx.) [66] | Visible/NIR (320 – 1100 nm) | Gradual thinning of the tungsten filament and blackening of the bulb envelope. |
| Xenon Lamps | ~500 hours [65] | UV-Vis | Electrode wear and other internal degradation. |
It is critical to note that lamp degradation is a continuous process. A lamp does not perform perfectly until the moment it fails. Instead, its light intensity gradually diminishes and noise increases over time, even if it remains capable of emitting visible light [65] [67]. Proactive replacement based on logged hours is therefore far preferable to waiting for catastrophic failure.
Signs and Symptoms of Lamp Degradation
Recognizing the early warning signs of lamp degradation is crucial for preventing the generation of erroneous data. The symptoms often manifest as instability and increasing noise in your analytical readings.
Primary Indicators of Failure
The most common indicators that a lamp is approaching end-of-life include:
- Fluctuating or Noisy Absorbance Readings: Inconsistent or drifting photometric values are a classic symptom of a failing lamp. As the lamp's output becomes unstable, so does the measured absorbance [65].
- Reduced Light Intensity: The instrument may struggle to achieve 0 Absorbance (100% Transmittance) during blank calibration, or may require unusually wide slit widths to obtain sufficient signal.
- Increased Photometric Noise: The baseline signal will show higher levels of noise, directly impacting the signal-to-noise ratio and lowering the detection limit of the instrument [67].
- Failure of Photometric or Wavelength Accuracy Tests: A degrading lamp can cause the instrument to fail routine performance qualification (PQ) tests, which verify photometric accuracy and wavelength precision [65].
Impact on Pharmaceutical Analysis
In a pharmaceutical context, these instrumental symptoms translate directly into analytical risks:
- Inaccurate API Quantification: Unstable baseline or reduced intensity leads to errors in concentration determination via Beer-Lambert's law, affecting drug potency assays.
- Compromised Method Validation: Parameters like linearity, precision, and limit of detection may fail to meet acceptance criteria during method validation or transfer.
- Failed QC Release Testing: Out-of-specification (OOS) results in stability studies or batch release testing can be triggered by instrument drift rather than a product quality issue.
Figure 1: The cascading impact of a degrading UV-Vis lamp on data quality and business outcomes, beginning with initial instrumental symptoms and leading to potential compliance issues.
Proactive Replacement and Maintenance Protocols
A proactive, scheduled replacement strategy is far more effective and reliable than a reactive one. This approach minimizes unplanned downtime and prevents the analysis of samples with a potentially compromised instrument.
Lamp Replacement Procedure
Replacing a UV-Vis lamp requires care to avoid damaging the new lamp or the instrument. The following protocol is a general guide; always consult your instrument's specific user manual.
Table 2: Lamp Replacement Toolkit and Safety Precautions
| Item / Step | Description / Function | Critical Notes |
|---|---|---|
| Replacement Lamps | New Dâ‚‚ and/or WI lamps, OEM recommended. | Ensure correct part number for your instrument model. |
| Protective Gloves | Powder-free lint-free gloves. | Prevents skin oils from contaminating the lamp quartz. |
| Phillips Screwdriver | For removing the light source compartment cover. | Size as specified in the manual. |
| Lint-free Cloth/Paper | For handling or covering adjacent components. | — |
| 1. Power Off & Cool | Turn OFF power, remove plug, and let lamp cool. | Prevents electric shock and severe burns [67]. |
| 2. Access Compartment | Remove cover per manufacturer instructions. | — |
| 3. Deuterium Lamp | Wear gloves. Hold plastic base, align locating lug. | Avoid touching the glass beam port with bare hands [67]. |
| 4. Halogen Lamp | Cover Dâ‚‚ lamp with cloth. Insert new WI lamp into socket. | Pins are non-polarized. Do not force laterally [67]. |
| 5. Reassemble & Reset | Replace cover, power on, reset lamp usage timer. | Resetting the timer is crucial for tracking the next replacement. |
Establishing a Proactive Monitoring Regime
- Log Usage Hours Diligently: Regularly monitor and record the accumulated lighting hours for both lamps in an instrument logbook. Most modern instruments track this electronically [67].
- Set Preemptive Replacement Triggers: Establish a standard operating procedure (SOP) to replace lamps at a set number of hours before they reach their rated end-of-life (e.g., at 90% of the manufacturer's rated lifespan).
- Perform Regular Performance Verification: Incorporate routine checks using UV-Vis calibration kits (e.g., for wavelength accuracy and photometric stability) and certified reference materials (CRMs) into the instrument qualification schedule [65] [68].
- Maintain a Spare Lamp Inventory: Keep a set of sealed, unused spare lamps in a clean, dry, and temperature-controlled environment to avoid emergency procurement delays [65] [66].
The Scientist's Toolkit: Essential Materials for Lamp and Instrument Care
Maintaining optimal instrument performance requires a set of key reagents and tools. The following table details essential items for a lab focused on UV-Vis spectrophotometry in pharmaceutical analysis.
Table 3: Essential Research Reagent Solutions and Materials for UV-Vis Spectrophotometer Maintenance
| Item | Function / Application | Technical Context |
|---|---|---|
| UV-Vis Calibration Kit | Diagnostic tool for verifying wavelength accuracy, photometric accuracy, and baseline stability [65]. | Detects early signs of instrument drift before they significantly impact sample data. |
| Certified Reference Materials (CRMs) | Calibration and performance qualification; provides traceable standards for validating instrument response [68]. | Essential for instrument qualification (IQ/OQ/PQ) and meeting regulatory compliance. |
| Spectrophotometric Cuvettes | High-quality quartz cuvettes for holding liquid samples during analysis. | Scratched or contaminated cuvettes cause significant measurement errors and fluctuations [66]. |
| Lint-free Wipes & Swabs | Cleaning optical components, cuvettes, and the sample compartment without leaving residues. | Prevents scratches and avoids introducing contaminants that scatter or absorb light. |
| Spare Deuterium & Halogen Lamps | Proactive replacement of light sources to maintain signal intensity and stability. | Using OEM parts ensures optimal performance and compatibility [66]. |
| RTI-118 | RTI-118, MF:C26H32N4O3, MW:448.6 g/mol | Chemical Reagent |
For pharmaceutical researchers, the UV-Vis spectrophotometer is more than just an instrument; it is a gateway to reliable analytical data that drives drug development and ensures product quality. The light source is a critical, consumable component of this system. By understanding lamp characteristics, vigilantly monitoring for signs of degradation, and implementing a disciplined, proactive replacement protocol, laboratories can safeguard their data integrity, enhance operational efficiency, and maintain unwavering compliance with regulatory standards.
In pharmaceutical research, the integrity of data generated by UV-Vis spectrophotometry is fundamentally dependent on the quality of sample preparation. Even the most advanced instrumentation cannot compensate for errors introduced during these initial stages. This guide addresses two critical aspects of sample preparation that profoundly impact analytical outcomes: preventing contamination and selecting appropriate cuvettes. Contamination presents a multifaceted challenge, encompassing biological, chemical, and particulate forms that can compromise both the accuracy of absorbance readings and the stability of pharmaceutical products. Similarly, cuvette selection is far from a trivial decision; the material, optical properties, and physical condition of the cuvette directly influence the pathlength and clarity of the light passing through the sample. Within the context of a broader thesis on basic instrumentation of UV-Vis spectrophotometer for pharma research, this document provides researchers, scientists, and drug development professionals with detailed methodologies and best practices to uphold the highest standards of data quality and product safety from the very beginning of the analytical process.
Understanding and Preventing Sample Contamination
Contamination Types and Impact on Pharmaceutical Analysis
In pharmaceutical analysis, contamination is broadly categorized into biological, chemical, and physical types, each with distinct sources and consequences. Microbial contamination, involving bacteria, fungi, and viruses, poses a significant risk to biologics and cell cultures, potentially leading to product degradation, altered efficacy, and safety concerns for patients. The presence of these contaminants not only affects product safety and quality but can also result in product recalls, reputational damage, and economic losses [69]. Chemical contamination occurs when pharmaceutical products encounter residual solvents, cleaning agents, heavy metals, or extractables from packaging and manufacturing equipment. This form of contamination represents the largest segment of contamination detection and can lead to chemical poisoning or undesirable chemical reactions in drug formulations [69] [70]. Physical contamination includes particulate matter such as dust, fibers, or glass fragments that can scatter light during spectrophotometric analysis, leading to inaccurate absorbance readings.
The impact of contamination extends beyond product safety to analytical integrity. Contaminants can introduce unexpected chromophores that absorb in the UV-Vis range, leading to falsely elevated absorbance values, or they can quench fluorescence in assays designed to detect specific analytes. Furthermore, particulate contamination can cause light scattering, increasing the apparent absorbance and compromising the linearity of the Beer-Lambert relationship. Implementing advanced quality control measures, including stringent sanitation procedures, environmental monitoring, and rigorous testing protocols, is essential for pharmaceutical manufacturers to identify and prevent contamination throughout the production process [69].
Strategic Framework for Contamination Control
A proactive and systematic approach to contamination control is mandated by regulatory bodies including the FDA and European Commission, particularly through the implementation of a Contamination Control Strategy (CCS). A CCS provides a holistic framework for identifying, controlling, and scientifically evaluating quality risks designed to reduce contamination and enhance product safety and quality [71]. This strategy encompasses multiple interconnected elements that must work in concert to be effective.
Key pillars of an effective CCS include monitoring controls for personnel, in-process materials, environmental conditions, utilities, and pest management; validation controls for processes, analytical methods, facilities, utilities, and equipment; and direct contamination controls such as personnel training, hygiene and gowning protocols, process design, vendor material management, and cleaning/sanitization procedures [71]. Crucially, the strategy must be underpinned by a robust quality risk management process that systematically identifies potential contamination sources and assesses their impact on product quality. This risk-based approach enables targeted allocation of resources to the most vulnerable areas of the manufacturing and analytical processes [71].
Personnel factors represent a critical component of contamination control. Comprehensive training programs are essential to ensure that researchers and technicians understand and adhere to proper aseptic techniques, gowning requirements, and hygiene practices. Fostering a quality culture where every team member takes ownership of contamination control helps embed these principles into daily operations. As highlighted in EU GMP Annex 1, successful contamination control depends on managing a web of interconnected manufacturing processes, requiring stabilization, standardization, and eventually, data-driven continuous improvement [72] [71].
Cuvette Selection and Handling to Minimize Errors
Material Composition and Optical Properties
The selection of cuvette material is a fundamental decision that directly determines the validity and accuracy of UV-Vis spectrophotometric measurements in pharmaceutical research. The three primary materials—quartz, glass, and plastic—each possess distinct optical and chemical properties that make them suitable for specific applications while presenting limitations for others.
Quartz cuvettes (manufactured from fused silica) represent the gold standard for pharmaceutical UV-Vis applications due to their exceptional UV transparency down to approximately 190 nm, enabling accurate quantification of nucleic acids (260 nm) and proteins (280 nm) [73]. This broad transmission range from deep UV to near-infrared (190-2500 nm), combined with very low autofluorescence, makes quartz indispensable for both UV-Vis absorbance and fluorescence spectroscopy. Additionally, quartz offers superior chemical resistance to most solvents, acids, and organic reagents (with the notable exception of hydrofluoric acid) and exceptional thermal stability, withstanding temperatures up to 150-200°C for fused cuvettes and approximately 1200°C for molded varieties [73].
Glass cuvettes provide adequate performance for visible light measurements (350-2000 nm) but are unsuitable for UV applications as they block most wavelengths below 320 nm. Their moderate autofluorescence can interfere with weak signals in fluorescence assays, and while they offer reasonable chemical resistance, prolonged exposure to strong bases can corrode the surface, reducing transparency [73]. Plastic cuvettes (typically polystyrene or PMMA) are economically advantageous for disposable use but are limited to visible range measurements (400-800 nm) with complete UV blockage. Their high autofluorescence and poor solvent resistance further restrict their application to basic colorimetric assays in educational or low-budget settings [73].
Table 1: Comparative Analysis of Cuvette Materials for Pharmaceutical Applications
| Property | Quartz (Fused Silica) | Optical Glass | Plastic (PS/PMMA) |
|---|---|---|---|
| UV Transmission | Excellent (190–2500 nm) | Limited (>320 nm) | Not supported |
| Visible Transmission | Excellent | Excellent | Good |
| Autofluorescence | Low | Moderate | High |
| Chemical Resistance | High (except HF) | Moderate | Low |
| Max Temperature | 150–1200 °C | ≤90 °C | ≤60 °C |
| Primary Applications | UV-Vis, fluorescence, solvents | Visible-only assays | Teaching, colorimetric assays |
Cuvette Types and Configuration for Specific Applications
Beyond material composition, cuvettes are available in various configurations optimized for specific experimental needs in pharmaceutical research. The standard rectangular cuvette with a 10 mm path length represents the global calibration standard for UV-Vis spectrophotometry, providing an optimal balance between sensitivity and convenience with a typical volume of 3.0-3.5 mL [73]. These cuvettes typically feature two optically polished windows (front and back) with frosted sides for safe handling.
For specialized applications, researchers should select cuvettes with appropriate configurations. Fluorescence spectroscopy requires four-window cuvettes with all sides polished to allow excitation light to enter from one side and emitted fluorescence to be detected at a 90-degree angle [73]. For precious or limited-quantity samples, semi-micro and micro-volume cuvettes maintain the standard 10 mm path length while significantly reducing chamber volume through specialized designs, ensuring data comparability with standard measurements while conserving sample material.
The path length of a cuvette directly influences sensitivity according to the Beer-Lambert law (A = εlc), where absorbance (A) is proportional to the path length (l) and analyte concentration (c) [74]. Researchers can exploit this relationship to enhance detection sensitivity; increasing the path length from 1 cm to 10 cm increases absorbance tenfold, consequently lowering the limit of detection and quantification [74]. This principle is particularly valuable in contamination detection and cleaning verification applications where trace-level analysis is required.
Handling, Cleaning, and Maintenance Protocols
Proper handling and maintenance of cuvettes are essential practices to prevent errors and ensure measurement reproducibility. The following protocols provide detailed methodologies for maintaining cuvette integrity:
General Handling Protocol:
- Always wear powder-free gloves to prevent fingerprint residues and contamination.
- Handle cuvettes by the frosted sides only, avoiding contact with optical surfaces.
- Use cuvette holders or appropriate tools when inserting or removing from instruments.
- Inspect optical windows visually before each use for scratches, cracks, or etching that could scatter light.
- Verify proper orientation in the spectrophotometer cell holder according to manufacturer guidelines.
Comprehensive Cleaning and Validation Protocol:
- Immediate Rinsing: After use, rinse cuvette thoroughly with an appropriate solvent (e.g., water for aqueous solutions, acetone for organic residues).
- Cleaning Solution Immersion: Immerse in a warm (50-60°C) solution of 1% laboratory-grade detergent (e.g., Hellmanex) for 15-30 minutes.
- Mechanical Cleaning: Use soft cuvette brushes with non-abrasive bristles for stubborn residues, avoiding excessive pressure.
- Chemical Cleaning: For persistent contaminants, use sequential rinses with dilute acid (1M HCl) and solvent (methanol or acetone) based on chemical compatibility [73].
- Final Rinsing: Rinse thoroughly with high-purity water (HPLC-grade or Type I) followed by a rinse with the solvent used in the next measurement.
- Drying: Air-dry in a dust-free environment or use a gentle stream of dry, filtered nitrogen gas.
- Validation: Perform a blank measurement with the cleaning solvent to verify no residual absorbance before sample analysis.
Chemical Compatibility Assessment:
- Quartz Cuvettes: Suitable for most strong acids (HCl, HNO₃, H₂SO₄) and short-term exposure to strong bases at room temperature. Incompatible with hydrofluoric acid (HF) and prolonged contact with hot concentrated bases [73].
- Glass Cuvettes: Stable against most strong acids (except HF) but unsuitable for long-term storage or high-temperature use with strong bases.
- Plastic Cuvettes: Avoid with acetone, ethanol, DMSO, and most organic solvents which can deform or dissolve the material.
Essential Reagents and Materials for Contamination-Free Sample Preparation
The following toolkit outlines essential materials and reagents required for implementing robust sample preparation protocols that minimize contamination and cuvette-related errors in pharmaceutical UV-Vis spectrophotometry.
Table 2: Research Reagent Solutions for Sample Preparation and Contamination Control
| Item | Function | Application Notes |
|---|---|---|
| Quartz Cuvettes (10 mm path) | Sample containment for UV-Vis measurement | Essential for UV measurements (<300 nm); 4-window for fluorescence [73] |
| High-Purity Solvents (HPLC grade) | Sample dilution and cuvette rinsing | Minimize background absorbance from solvent impurities |
| Certified Reference Standards | Method calibration and verification | Ensure accuracy and traceability of quantitative measurements |
| Particulate-Free Gloves | Personnel protection and contamination prevention | Powder-free to avoid interference with sensitive measurements |
| Cuvette Cleaning Solutions | Removal of residual analytes between measurements | Specialized detergents (e.g., Hellmanex) for optical surfaces |
| Validated Swabs | Surface sampling for cleaning verification | Low-lint materials for equipment monitoring [75] |
| Solid-Phase Extraction Cartridges | Sample cleanup and contaminant removal | Products like Captiva EMR for matrix removal in complex samples [76] |
| pH Buffers | Sample stabilization and consistency | Maintain analyte integrity and consistent ionization states |
Workflow Integration and Best Practices
Integrated Sample Preparation Workflow
The following diagram illustrates a comprehensive workflow for sample preparation that integrates contamination control and proper cuvette handling to ensure reliable UV-Vis spectrophotometry results in pharmaceutical research.
Cuvette Selection Decision Framework
The decision pathway below provides a systematic approach for selecting the appropriate cuvette material based on specific experimental requirements in pharmaceutical analysis.
Perfecting sample preparation in pharmaceutical UV-Vis spectrophotometry demands meticulous attention to both contamination control and cuvette-related factors. The implementation of a systematic Contamination Control Strategy, as mandated by regulatory standards, provides a comprehensive framework for preventing biological, chemical, and physical contaminants from compromising analytical results. Simultaneously, informed selection of cuvette materials based on optical requirements, chemical compatibility, and experimental conditions ensures that measurements accurately reflect sample properties without instrumentation-derived artifacts. By integrating the protocols, workflows, and decision frameworks presented in this guide, pharmaceutical researchers and drug development professionals can establish robust sample preparation practices that enhance data quality, improve regulatory compliance, and ultimately contribute to the development of safer pharmaceutical products. The consistent application of these fundamental principles forms the foundation upon which reliable spectroscopic analysis is built within the broader context of pharmaceutical research instrumentation.
In the field of pharmaceutical research, the Ultraviolet-Visible (UV-Vis) spectrophotometer is an indispensable tool for the quantitative determination of analytes, from small organic molecules to biological macromolecules [77]. The reliability of data generated by this technique, however, is profoundly influenced by the measurement conditions. Factors such as temperature, solvent polarity, and analyte concentration are not merely environmental variables but active participants that can alter electronic transitions, molecular stability, and spectral output.
The optimization of these parameters is therefore not a preliminary step but a core component of method development, directly impacting the accuracy, reproducibility, and regulatory compliance of pharmaceutical analyses. This guide provides an in-depth examination of how temperature, solvent, and concentration affect UV-Vis spectroscopy, offering technical insights and practical protocols to empower researchers in making informed, data-driven decisions to enhance their analytical workflows.
Core Principles: Environmental Impact on Spectral Data
The foundational principle of UV-Vis spectroscopy involves the promotion of electrons to higher energy states upon light absorption. The surrounding molecular environment directly modulates this process. Understanding the mechanistic influence of each factor is crucial for both interpreting spectra and designing robust methods.
The Critical Role of Solvent Polarity
Solvent polarity affects both the position of absorption bands (λmax) and their intensity. A polar solvent can stabilize the excited state of a polar molecule more effectively than the ground state, resulting in a lower energy requirement for the electronic transition. This manifests as a bathochromic (red) shift, a shift to a longer wavelength [78] [79]. Conversely, interactions such as hydrogen bonding can also cause shifts, as documented in studies on ferulic and sinapic acids [78] [79].
Key mechanisms include:
- Dipole-Dipole Interactions: The reorientation of solvent molecules around the solute dipole in the excited state.
- Hydrogen Bonding: Can stabilize either the ground or excited state, leading to hypsochromic (blue) or bathochromic (red) shifts depending on which state is more stabilized.
The Effect of Temperature
Temperature variations primarily influence spectral data by affecting molecular motion and stability. As temperature increases:
- Molecular Vibration Intensifies: This can lead to broadening of absorption bands and a decrease in absorption intensity (hypochromicity) [78] [79].
- Thermal Degradation Risk Rises: Elevated temperatures can accelerate the degradation of heat-sensitive pharmaceutical compounds, leading to inconsistent and unreliable results [79].
- Solution Properties Change: Temperature affects solvent density, viscosity, and, consequently, the rate of diffusion and molecular collisions.
The Influence of Concentration and Path Length
The fundamental relationship governing UV-Vis is the Beer-Lambert Law: A = εlc, where Absorbance (A) is proportional to the molar absorptivity (ε), path length (l), and concentration (c). This relationship holds true for dilute solutions. At high concentrations, solute molecules can interact with each other, leading to phenomena such as aggregation that can distort the linear relationship and cause deviations from Beer-Lambert behavior.
Quantitative Data on Measurement Conditions
The following tables consolidate empirical and computational findings on the specific effects of solvent and temperature on pharmaceutical-relevant compounds.
Table 1: Impact of Solvent Polarity on the Spectral Properties of Sinapic and Ferulic Acids
| Compound | Solvent (Polarity) | Absorption λmax (nm) | Fluorescence λmax (nm) | HOMO-LUMO Gap (eV) | Dipole Moment (Debye) | Observed Shift & Effect |
|---|---|---|---|---|---|---|
| Sinapic Acid [79] | Gas Phase | 320.18 | 381 | Data Not Specified | Varies with basis set | Baseline for comparison |
| Solvent Phase | 356.26 | 429 | Narrowed | Increased | Redshift in both absorption and emission due to solvation. | |
| Ferulic Acid [78] | Gas Phase | Specific values not provided | Specific values not provided | Data Not Specified | Data Not Specified | Baseline for comparison |
| Aqueous Phase | Specific values not provided | Specific values not provided | Data Not Specified | Data Not Specified | Alterations in molecular structure due to hydrogen bonding and dipole interactions. |
Table 2: Effect of Temperature on Thermodynamic Properties of Phenolic Acids (100-1000 K)
| Compound | Temperature Increase Effect on Heat Capacity (Cp) | Effect on Enthalpy (H) | Effect on Entropy (S) | Molecular Consequence |
|---|---|---|---|---|
| Sinapic Acid [79] | Increase | Increase | Increase | Elevated molecular vibrations leading to degradation and instability. |
| Ferulic Acid [78] | Increase | Increase | Increase | Escalation of molecular vibrational intensities, reducing stability. |
Experimental Protocols for Condition Optimization
This section outlines detailed methodologies for systematically investigating and calibrating the impact of environmental factors on UV-Vis measurements.
Protocol 1: Investigating Solvent Polarity Effects
This protocol is designed to characterize a compound's spectral behavior in different solvents.
- Objective: To determine the λmax and absorbance intensity of a target analyte in solvents of varying polarity indices.
- Materials:
- Stock solution of the analyte.
- A series of HPLC-grade solvents (e.g., n-hexane, chloroform, ethyl acetate, ethanol, methanol, water).
- UV-Vis spectrophotometer with matched quartz cuvettes.
- Volumetric flasks and pipettes.
- Procedure:
- Prepare standard solutions of the analyte at an identical concentration in each solvent. Ensure the concentration is within the linear range of the Beer-Lambert law.
- Scan each solution across the relevant UV-Vis range (e.g., 200-800 nm).
- Record the λmax and the absorbance at λmax for each solvent.
- Plot λmax against the solvent polarity index (e.g., Reichardt's ET(30) parameter). A positive correlation indicates a bathochromic shift with increasing polarity.
- Data Interpretation: The optimal solvent for analysis is one that provides a well-defined, sharp absorption peak at a wavelength with minimal background interference from the solvent itself. This profile is crucial for method sensitivity and specificity.
Protocol 2: Assessing Temperature Influence
This protocol evaluates the thermal stability of a compound and establishes a controlled temperature for measurement.
- Objective: To monitor changes in the absorption spectrum of a compound as a function of temperature.
- Materials:
- Standard solution of the analyte in a selected solvent.
- UV-Vis spectrophotometer equipped with a thermostatted cell holder.
- Temperature controller and thermometer.
- Procedure:
- Place the sample solution in the thermostatted cuvette holder and allow it to equilibrate to the starting temperature (e.g., 15°C).
- Record the full absorption spectrum.
- Incrementally increase the temperature (e.g., in 5°C or 10°C steps) up to a maximum relevant temperature (e.g., 50°C). Allow for equilibration at each new temperature before measurement.
- At each temperature, record the absorbance at the predefined λmax.
- Data Interpretation: Plot absorbance versus temperature. A significant change in absorbance or a shift in λmax indicates temperature sensitivity. The optimal measurement temperature is within a stable plateau where absorbance remains constant.
Protocol 3: Compensating for Multiple Environmental Factors
For applications like water quality testing (e.g., Chemical Oxygen Demand - COD), multiple factors interact. This protocol uses a data fusion approach to improve accuracy [80].
- Objective: To build a predictive model that integrates UV-Vis spectra with pH, temperature, and conductivity data for more accurate COD determination.
- Materials:
- Water samples with varying COD levels.
- UV-Vis spectrometer.
- Multi-parameter meter for pH, temperature, and conductivity.
- Procedure:
- Collect a large set of water samples.
- For each sample, measure the UV-Vis spectrum and the three environmental factors (pH, temperature, conductivity).
- Determine the actual COD value for each sample using a standard method (e.g., spectrophotometric rapid digestion [80]).
- Use multivariate statistical techniques (e.g., Partial Least Squares regression) to create a model that fuses the spectral data at feature wavelengths with the environmental factors to predict COD.
- Data Interpretation: The fused model significantly improves prediction accuracy (e.g., higher R² and lower RMSE) compared to a model based on spectroscopy alone, by compensating for spectral interference from environmental variables [80].
Workflow and Relationship Visualization
The following diagram illustrates the systematic workflow for optimizing UV-Vis measurement conditions, integrating the experimental protocols outlined above.
UV-Vis Method Optimization Workflow
The Scientist's Toolkit: Essential Research Reagents and Materials
Table 3: Key Reagents and Materials for UV-Vis Condition Optimization
| Item | Function / Rationale | Example Application in Protocols |
|---|---|---|
| HPLC-Grade Solvents | High purity minimizes UV-absorbing impurities that cause high background noise. | Protocol 1: Creating a solvent polarity series. |
| Standard Buffer Solutions | Used to adjust and stabilize sample pH, a key environmental factor. | Protocol 3: Controlling pH in multi-factor studies. |
| Thermostatted Cuvette Holder | Precisely controls sample temperature for stability studies and reproducible kinetics. | Protocol 2: Assessing temperature influence. |
| Certified Reference Materials | Provides a known, pure analyte for method development and calibration. | All Protocols: Preparing stock standard solutions. |
| Quartz Cuvettes | Transparent across UV and Vis wavelengths, unlike glass, which absorbs UV light. | All Protocols: Holding samples for measurement. |
| Data Fusion & Chemometrics Software | (e.g., PLS Toolbox). Analyzes complex datasets to model and compensate for interfering factors. | Protocol 3: Building a multi-factor prediction model. |
The path to generating reliable and meaningful data with UV-Vis spectroscopy in pharmaceutical research is paved with meticulous attention to measurement conditions. Solvent polarity dictates the energetic landscape of electronic transitions, temperature governs molecular stability and spectral shape, and concentration must be carefully controlled to maintain a linear response. By adopting the systematic experimental protocols and leveraging the insights into molecular interactions outlined in this guide, scientists can transform their spectrophotometers from mere data collection instruments into powerful, predictable tools for drug development. The resulting optimized methods are not only more accurate but also more robust, ensuring data integrity from early R&D through to quality control.
In the highly regulated landscape of pharmaceutical research and development, the integrity of analytical data is paramount. Ultraviolet-Visible (UV-Vis) spectrophotometry serves as a cornerstone technique for qualitative and quantitative analysis, supporting critical decisions from drug development to quality control. However, the reliability of this powerful analytical tool hinges entirely on a robust system of preventive maintenance and calibration, ensuring the instrument remains fit for its intended purpose [81] [24].
Within Good Laboratory Practice (GLP) and Good Manufacturing Practice (GMP) environments, these activities are not merely recommended best practices but are mandatory requirements [81] [82]. A well-defined program for maintenance and calibration provides a foundation for data integrity, and regulatory compliance, safeguarding product quality and patient safety [81] [83]. This guide outlines a comprehensive, risk-based approach to maintaining and calibrating UV-Vis spectrophotometers, aligned with current regulatory expectations and pharmacopeial standards.
Understanding the Regulatory Landscape and Quality Framework
Adherence to regulatory standards is a fundamental driver for maintenance and calibration activities. Regulatory frameworks emphasize a life-cycle approach to analytical instruments, ensuring they are consistently in a state of control [24].
Key Regulatory Guidelines and Pharmacopeial Standards
- USP General Chapter <1058> on Analytical Instrument Qualification (AIQ): This foundational chapter, recently updated and retitled "Analytical Instrument and System Qualification (AISQ)," provides a structured framework for establishing and maintaining instrument fitness for use. It introduces a three-phase integrated lifecycle: Specification and Selection; Installation, Qualification, and Validation; and Ongoing Performance Verification (OPV) [24].
- USP General Chapters <857> and Ph. Eur. 2.2.25: These mandatory chapters specify the operational parameters and acceptance criteria for UV-Vis spectrophotometer performance, including wavelength accuracy, photometric accuracy, and stray light [81] [25].
- ICH Q2(R2): Provides guidance on the validation of analytical procedures, for which a qualified and well-maintained instrument is a prerequisite [25].
- Quality Management Standards (GxP): Compliance with GLP and GMP requires documented evidence that instruments are suitable for their intended use and are maintained in a calibrated state [82] [24].
The Instrument Life Cycle and Data Integrity
The modern regulatory focus is on an integrated life cycle model. "Fitness for intended use" is demonstrated by ensuring the instrument is metrologically capable, its calibration is traceable to national standards, and its performance is verified on an ongoing basis [24]. This holistic approach directly supports the principles of data integrity by ensuring that the data generated is accurate, complete, and reliable [81].
Core Calibration Parameters and Verification Methodologies
A comprehensive calibration protocol verifies several key performance parameters, each assessing a different aspect of the instrument's optical and electronic systems. The following parameters, methodologies, and acceptance criteria are derived from pharmacopeial standards [81] [25] [84].
Table 1: Core Calibration Parameters and Acceptance Criteria
| Parameter | Objective | Common Reference Materials | Typical Acceptance Criteria (per USP/Ph. Eur.) |
|---|---|---|---|
| Wavelength Accuracy | Verify the monochromator selects the correct wavelength. | Holmium Oxide filter or solution [25] [84]. | Deviation ≤ ±1 nm at characteristic peaks (e.g., 241.15, 361.5 nm) [25] [84]. |
| Photometric Accuracy | Verify the instrument measures absorbance/transmittance correctly. | Potassium Dichromate solution in 0.005M Hâ‚‚SOâ‚„ [25] [84]. | Absorbance value within a specified range of the certified value (e.g., E(1%, 1 cm) 124.5 at 235 nm, tolerance 122.9-126.2) [84]. |
| Stray Light | Measure unwanted light outside the selected bandwidth reaching the detector. | 1.2% w/v Potassium Chloride (KCl) solution for 200 nm check [25] [84]. | Absorbance ≥ 2.0 AU [25] [84]. |
| Resolution Power | Assess the ability to distinguish between closely spaced spectral peaks. | 0.02% v/v Toluene in Hexane [25] [84]. | Ratio of absorbance at max (269 nm) to min (266 nm) ≥ 1.5 [25] [84]. |
| Photometric Linearity | Confirm the detector's response is proportional to analyte concentration. | Neutral density filters or serial dilutions of a standard [81] [85]. | Correlation coefficient (R²) ≥ 0.999 or meets predefined linearity criteria. |
Detailed Experimental Protocols
Protocol for Wavelength Accuracy Verification using Holmium Oxide Solution
- Principle: Holmium perchlorate solution exhibits sharp, characteristic absorption peaks at known wavelengths. The instrument's reported peak wavelengths are compared against certified values [84].
- Procedure:
- Prepare a 4% w/v Holmium Oxide solution in 1.4 M Perchloric acid [84].
- Perform a baseline correction using 1.4 M Perchloric acid in both sample and reference cuvettes.
- Scan the holmium perchlorate solution across the appropriate wavelength range (e.g., 240-550 nm).
- Identify the wavelengths of maximum absorbance for key peaks (e.g., 241.15 nm, 287.15 nm, 361.5 nm, 536.3 nm).
- Record the observed wavelength for each peak. The deviation from the certified value must be within ±1 nm [25] [84].
Protocol for Photometric Accuracy Verification using Potassium Dichromate
- Principle: Potassium dichromate solution has well-defined absorbance values (E1%, 1cm) at specific wavelengths. The measured absorbance is compared to these certified values [84].
- Procedure:
- Dry potassium dichromate to constant weight at 130°C [84].
- Prepare two solutions:
- Using 0.005M Hâ‚‚SOâ‚„ as a blank, measure the absorbance of Solution A at the first four wavelengths and Solution B at 430 nm.
- Calculate the measured E(1%, 1cm) values and compare them to the pharmacopeial acceptance ranges [84].
Preventive Maintenance: Procedures and Schedules
Preventive maintenance (PM) is a proactive strategy to minimize downtime, extend instrument life, and ensure accurate results by addressing component wear and tear before it impacts performance [66] [86].
Key Maintenance Activities and Consumable Parts
The core of a PM program involves the inspection, cleaning, and replacement of key consumable parts.
Table 2: Preventive Maintenance Schedule and Key Components
| Component / Activity | Function | Maintenance Frequency/Rationale | Replacement Parts & Tools |
|---|---|---|---|
| Source Lamps | Provide UV (Deuterium Dâ‚‚) and Visible (Tungsten-Halogen WI) light. | Replace approximately every 2000 hours or per manufacturer SOP; lamps degrade over time, affecting signal intensity [66]. | Deuterium Lamp, Tungsten-Halogen Lamp (OEM recommended) [66]. |
| Optical Components | Mirrors and lenses direct light through the optical path. | Inspect and clean quarterly or during lamp replacement; dust and contamination reduce light throughput and increase stray light [66]. | Source Mirror, lint-free wipes, optical-grade swabs, high-purity solvents [66]. |
| Cuvettes/Sample Holders | Hold liquid samples for analysis. | Clean after each use; inspect regularly for scratches or damage. Scratches cause light scattering and absorbance errors [66] [85]. | Certified Quartz Cuvettes (for UV), lint-free wipes [66]. |
| Performance Verification | Verify key parameters post-maintenance. | Execute full calibration procedure after any major maintenance, especially lamp replacement [25] [85]. | Certified Reference Materials (e.g., Holmium filter, Potassium Dichromate) [85]. |
| Environmental Conditions | Stable environment prevents drift. | Continuous monitoring; place instrument on a stable bench, away from vibrations, dust, and direct sunlight [66]. | - |
Maintenance Workflow and Logical Relationships
The relationship between different maintenance activities, calibration, and instrument qualification follows a logical sequence to ensure instrument fitness. The diagram below outlines this integrated workflow.
The Scientist's Toolkit: Essential Materials and Reagents
The following reagents and certified reference materials (CRMs) are essential for executing the calibration and maintenance procedures described in this guide.
Table 3: Essential Research Reagent Solutions and Materials
| Item | Function / Purpose | Critical Specifications & Notes |
|---|---|---|
| Holmium Oxide (Ho₂O₃) | Wavelength accuracy verification. | Must be of certified analytical grade. Dissolved in 1.4 M Perchloric acid to form holmium perchlorate solution [84]. |
| Potassium Dichromate (K₂Cr₂O₇) | Photometric accuracy verification. | Must be dried to constant weight at 130°C prior to use to ensure accurate concentration [84]. |
| Potassium Chloride (KCl) | Stray light verification at low UV (200 nm). | Must be dried to constant weight at 130°C. A 1.2% w/v aqueous solution is used [84]. |
| NIST-Traceable Neutral Density Filters | Photometric accuracy and linearity checks. | Provides a stable, solid-state standard for verifying absorbance/transmittance readings without preparation variability [81] [85]. |
| Certified Quartz Cuvettes | Sample holder for liquid analysis. | Quartz is transparent down to ~190 nm. Must be kept scrupulously clean and free of scratches [66] [1]. |
| Toluene in Hexane | Resolution power testing. | A 0.02% v/v solution is prepared in UV-grade hexane [25] [84]. |
Implementing a Risk-Based Program: Schedules and Documentation
Determining Calibration and Maintenance Frequency
A risk-based approach should be used to define calibration intervals, considering factors such as instrument criticality, usage frequency, operational environment, and manufacturer recommendations [82] [85].
- High-Risk/High-Use Instruments: May require quarterly or semi-annual calibration. Instruments in non-climate-controlled production areas or those used for high-precision release testing fall into this category [82] [85].
- Low-Risk/Low-Use Instruments: Annual calibration may be sufficient, supported by data from ongoing performance verification [82].
- Fixed and Variable Intervals: Intervals can be based on calendar time or cumulative usage hours (e.g., lamp life). A grace period (e.g., ±10 days for annual calibration) is often allowed to ensure timely completion [82].
Documentation and Record-Keeping
In a GxP environment, the activity is not complete until it is documented. Robust record-keeping is essential for demonstrating compliance during audits [82].
- Standard Operating Procedures (SOPs): Detailed SOPs must be established for calibration and maintenance of each instrument type, covering the process, acceptance criteria, and actions for non-conformance [82] [84].
- Instrument History Log: A master register should be maintained for each instrument, including unique ID, location, calibration schedule, and a complete history of all calibration, maintenance, and repair activities [82].
- Calibration Records: Each calibration event must be documented in a certificate that includes the date, standards used, observed values, acceptance criteria, and the signatures of the analyst and reviewer [25] [84].
A scientifically sound and meticulously documented program of preventive maintenance and calibration is a non-negotiable element of pharmaceutical analysis using UV-Vis spectrophotometry. By adopting the integrated, risk-based life-cycle approach outlined in this guide—encompassing clear procedures, a defined schedule, and comprehensive documentation—research and quality control laboratories can ensure the generation of reliable data, maintain uninterrupted compliance with global regulatory standards, and ultimately uphold their commitment to product quality and patient safety.
In the demanding field of pharmaceutical research, the accuracy and precision of Ultraviolet-Visible (UV-Vis) spectrophotometry are paramount for critical tasks ranging from drug identity confirmation and purity assessments to concentration quantification of active pharmaceutical ingredients (APIs). However, the reliability of this fundamental analytical technique is frequently compromised by instrumental fluctuations and baseline drift, potentially leading to erroneous data interpretation and decisions with significant developmental and financial implications [87] [88]. Fluctuations typically refer to rapid, random variations in the signal, while drift describes a gradual, systematic shift in the baseline absorbance over time [87] [89]. Understanding and diagnosing these issues is not merely a troubleshooting exercise but a core component of ensuring data integrity in a regulated laboratory environment. This guide provides pharmaceutical scientists with a systematic, step-by-step diagnostic framework to identify the root causes of these instabilities, empowering them to restore instrument performance and generate trustworthy analytical results.
Understanding the Root Causes
A methodical diagnosis begins with a thorough understanding of potential failure points within the instrument system. Instabilities can originate from the instrument itself, the sample, or the operational environment and techniques.
Instrumental Factors
The core components of a spectrophotometer are common sources of instability, and their performance typically degrades over time.
- Light Source Degradation: The lamps are consumable components with finite lifespans. A deuterium or xenon lamp used for the UV range is a frequent culprit. Deuterium lamps typically last 1,000 to 3,000 hours, while xenon lamps are often rated for about 500 hours [65]. As a lamp approaches its end-of-life, it can cause significant fluctuations in absorbance readings and increased noise [65] [89].
- Detector and Optical Component Issues: The detector (e.g., photomultiplier tube, photodiode) can degrade or become unstable. Furthermore, dust, condensation, or chemical films accumulating on optical surfaces, such as the monochromator grating, lenses, and mirrors, can scatter light and reduce light throughput, leading to signal loss and drift [87] [88].
- Stray Light and Wavelength Inaccuracy: Stray light, defined as light outside the intended bandwidth that reaches the detector, is a notorious source of photometric error, particularly at high absorbances [62]. Wavelength scale inaccuracy, often resulting from misalignment or mechanical wear in the monochromator, can lead to incorrect absorbance measurements, especially on the slopes of absorption peaks [62].
Sample-Related Factors
The sample itself can be a direct cause of observed instability.
- Light Scattering: Particulates, insoluble aggregates, or bubbles in the sample suspension can scatter light, elevating the apparent absorbance and creating a sloping baseline. This is a common issue when analyzing biological pharmaceuticals like protein solutions [59].
- Sample Temperature and Composition: Temperature fluctuations within the sample compartment can cause changes in the refractive index and reaction equilibria, inducing drift. Additionally, using a solvent that absorbs significantly in the spectral region of interest can lead to a high and unstable baseline if not properly blanked [1] [88].
Environmental and Operational Factors
- Environmental Conditions: Temperature fluctuations and vibrations in the laboratory can affect the instrument's electronic components and optical alignment, leading to baseline drift [87].
- Improper Handling and Cuvettes: Using dirty, scratched, or mismatched cuvettes is a prevalent operational error. Scratches scatter light, while residues from previous samples cause contamination and inaccurate readings [88]. An incorrect or inconsistent path length will also directly impact the absorbance value based on the Beer-Lambert law [88].
Step-by-Step Diagnostic Protocol
Follow this sequential diagnostic protocol to efficiently isolate the cause of fluctuations or drift.
Pre-Diagnostic Preparations
- Gather Materials: Have a known stable reference standard available. A solution of potassium dichromate in dilute perchloric or sulfuric acid is commonly used for photometric accuracy checks [88] [62]. Ensure you have high-purity solvent and optically matched, clean cuvettes.
- Instrument Warm-up: Power on the spectrophotometer and allow it to warm up for at least the manufacturer's recommended time (typically 30 minutes). This stabilizes the electronics and light source [89].
Diagnostic Workflow
The diagnostic logic follows a systematic path from simple observations to more complex component testing, as illustrated below.
Diagram Title: UV-Vis Diagnostic Workflow
Step 1: Perform a Baseline or Blank Scan
- Methodology: Place a matched cuvette containing only the pure solvent or buffer (the blank) in the sample holder. Execute a spectral scan over the entire wavelength range used for your analyses. For a more sensitive test, monitor the absorbance at a single, critical wavelength (e.g., 250 nm for proteins) over 30-60 minutes.
- Interpretation: A flat, stable baseline indicates the instrument itself is likely not the source of the problem. A drifting or noisy baseline in the absence of any sample confirms an instrument-level issue, prompting you to proceed to the next steps [87] [89].
Step 2: Inspect and Clean Cuvettes
- Methodology: Visually inspect the cuvettes for scratches, chips, or residue. Thoroughly clean them using an appropriate solvent, rinse with high-purity water, and dry using a lint-free tissue. Repeat the baseline scan with the cleaned cuvettes.
- Interpretation: If the instability is resolved, the issue was cuvette-related. If the problem persists with all cuvettes, the fault lies within the instrument [88].
Step 3: Measure a Stable Reference Standard
- Methodology: Prepare a standard solution of a stable compound like potassium dichromate at a known concentration. Measure its absorbance at the relevant wavelength(s) repeatedly over time.
- Interpretation: If the readings for the stable standard are consistent, the problem is likely with your specific sample preparation (e.g., bubbles, precipitates, instability). If the standard also shows fluctuations or drift, an instrument fault is confirmed [88] [62].
Step 4: Check Lamp Usage Hours
- Methodology: Consult the instrument's software or usage log to determine the total operational hours of the light source.
- Interpretation: If the lamp hours exceed the manufacturer's recommended lifespan (e.g., >1,000 hours for deuterium), the lamp is the prime suspect and should be replaced [65].
Step 5: Inspect for Optical Contamination
- Methodology: This step may require technical assistance. Following the manufacturer's instructions, visually inspect accessible optical windows in the sample compartment for signs of dust or film. Do not touch optical surfaces directly.
- Interpretation: Contaminated optics require professional cleaning. If optics are clean and the lamp is new, the problem may lie with the detector or internal electronics, necessitating a service call [87] [89].
Quantitative Data and Calibration Procedures
Rigorous calibration and performance verification are essential for quantifying and correcting instrument error.
Critical Performance Parameters and Specifications
Table 1: Key UV-Vis Performance Parameters and Tolerance Limits
| Parameter | Description | Diagnostic Implication | Typical Acceptance Limit |
|---|---|---|---|
| Wavelength Accuracy | Verifies the accuracy of the monochromator's wavelength scale. | Inaccuracy shifts absorption peaks, affecting identification and quantitation. | ±1.0 nm [62] |
| Photometric Accuracy | Verifies the accuracy of the absorbance reading. | Inaccuracy leads to systematic errors in concentration calculations. | ±0.01 A (at 1.0 A) [62] |
| Stray Light | Measures the fraction of light outside the bandwidth reaching the detector. | Causes non-linearity at high absorbances and suppresses peaks. | <0.1% @ 220 nm (NaCl) [62] |
| Baseline Stability | Measures drift in the baseline signal over a specified time. | Directly indicates short-term instrument drift. | <0.001 A/hr @ 250 nm [87] |
| Lamp Lifespan | The operational lifetime of the light source. | Aging lamps cause noise, drift, and signal loss. | 1,000 - 3,000 hours (Deuterium) [65] |
Detailed Experimental Calibration Protocols
Protocol 1: Verification of Wavelength Accuracy
- Principle: Using a holmium oxide filter or solution, which has sharp, characteristic absorption peaks at known wavelengths.
- Procedure: Place the holmium oxide standard in the light path. Perform a slow scan over the range of 240-650 nm. Record the wavelengths of the observed absorption peaks.
- Data Analysis: Compare the measured peak wavelengths (e.g., at 279.4, 360.9, 453.2, 536.2 nm) to the certified values. The deviations should be within the instrument's specified tolerance (e.g., ±1.0 nm) [62].
Protocol 2: Verification of Photometric Accuracy and Linearity
- Principle: Using a series of known concentrations of an absolute standard like potassium dichromate to verify the instrument's adherence to the Beer-Lambert law.
- Procedure: Prepare standard solutions of potassium dichromate in 0.005 M Hâ‚‚SOâ‚„ (e.g., 20, 40, 60, 80, 100 mg/L). Measure the absorbance of each solution at 235, 257, 313, and 350 nm using 0.005 M Hâ‚‚SOâ‚„ as a blank.
- Data Analysis: Plot absorbance versus concentration for each wavelength. The correlation coefficient (R²) for the linear fit should be ≥0.999. The measured absorbance values should match established reference values within a specified tolerance (e.g., ±1%) [88] [62].
Protocol 3: Stray Light Determination
- Principle: Using a solution that completely absorbs light at a target wavelength, so any signal detected must be stray light.
- Procedure: For checking stray light at 220 nm, use a 12 g/L potassium chloride solution in a 1 cm pathlength cuvette. Water is used as the blank. Measure the transmittance at 220 nm.
- Data Analysis: The measured %T represents the stray light level. A reading of 0.1% T corresponds to 0.1% stray light, which is a typical acceptable limit for pharmaceutical work at this wavelength [62].
The Scientist's Toolkit
A well-equipped laboratory has the necessary tools for routine performance verification and troubleshooting.
Table 2: Essential Research Reagents and Materials for Diagnostics
| Item | Function / Application | Key Specification |
|---|---|---|
| Holmium Oxide Filter | Wavelength accuracy verification. | Provides sharp, certified absorption peaks across UV-Vis range. [62] |
| Potassium Dichromate | Photometric accuracy and linearity verification. | An absolute standard with well-characterized absorbance across multiple wavelengths. [88] [62] |
| Potassium Chloride | Stray light determination in the UV region. | A clear, saturated solution that acts as a sharp cutoff filter. [62] |
| Optically Matched Cuvettes | For all sample and standard measurements. | Quartz for UV, pathlength verified (e.g., 1.000 cm). Must be free of scratches and residues. [1] [88] |
| Certified Reference Materials (CRMs) | Ultimate calibration and method validation. | Traceable to national standards (e.g., NIST). [88] |
| Lint-Free Wipes | Cleaning of cuvettes and optical surfaces. | To prevent scratching and lint introduction. [88] |
| High-Purity Solvents | For sample/standard preparation and as blanks. | Spectroscopic grade, low in UV-absorbing impurities. [88] |
Advanced Correction Techniques
When instrumental corrections are insufficient, advanced data processing techniques can be applied.
- Software-Based Baseline Correction: Modern instrument software includes algorithms for baseline correction. This typically involves recording a baseline with the blank, which is then automatically subtracted from all subsequent sample scans, correcting for drift and minor optical imperfections [87].
- Scattering Correction Algorithms: For samples containing particulates or aggregates, advanced mathematical corrections based on Rayleigh and Mie scattering theory can be applied. These methods model the scattering contribution to the absorbance spectrum and subtract it, yielding a more accurate representation of the analyte's true absorbance [59]. These are particularly relevant for protein aggregate analysis in biopharmaceuticals.
In the highly regulated and precise world of pharmaceutical research, a reactive approach to instrument troubleshooting is insufficient. A proactive and systematic diagnostic strategy is a fundamental component of robust analytical practice. This guide provides a clear, sequential framework for diagnosing the most common sources of fluctuation and drift in UV-Vis spectrophotometers. By integrating regular performance verification using the outlined protocols, maintaining meticulous logs of lamp usage and calibration events, and adhering to strict sample handling procedures, scientists can minimize instrumental uncertainty. This disciplined approach ensures the generation of reliable, high-quality data that forms the credible foundation for critical decisions in drug development and quality control.
Method Validation and Comparative Analysis: Ensuring Robustness vs. HPLC and Beyond
In the pharmaceutical development landscape, the ultraviolet-visible (UV-Vis) spectrophotometer serves as an essential tool for identifying and quantifying chromophore-absorbing substances in solution, playing a critical role in both research and manufacturing quality control [90]. This analytical technique measures the amount of discrete wavelengths of UV or visible light that are absorbed by or transmitted through a sample in comparison to a reference or blank sample, providing insights into sample composition and concentration [1]. The reliability of these measurements for making crucial decisions about drug substances and products hinges on a rigorous process known as method validation.
Method validation provides documented evidence that an analytical procedure is suitable for its intended purpose, establishing that the method consistently yields reliable, accurate, and precise results within specified limits. For pharmaceutical analyses, the International Council for Harmonisation (ICH) guidelines provide the foundational framework for this process, outlining specific criteria that must be demonstrated to consider a method validated [91]. Among the various validation parameters, linearity, precision, and accuracy form the core triad that ensures the fundamental reliability of any quantitative analytical method, including those employing UV-Vis spectroscopy.
Fundamental Principles of UV-Vis Spectroscopy
How UV-Vis Spectrophotometry Works
UV-Vis spectroscopy operates on the principle of passing electromagnetic energy through a sample and measuring how much of that energy is absorbed [90]. As light traverses the solution, the substance of interest (analyte) absorbs a portion of the light within a specific wavelength range. The remaining, unabsorbed light is captured by a detector, which generates a unique absorbance spectrum for the sample—a graphical representation of absorbance versus wavelength [1] [90].
The fundamental relationship governing quantitative analysis in UV-Vis is the Beer-Lambert Law, which states that absorbance (A) is proportional to the concentration (c) of the absorbing species, the path length (L) of the sample holder, and the molar absorptivity (ε) of the analyte [1]. This relationship is mathematically expressed as:
A = εLc
The successful application of this law requires a linear relationship between absorbance and concentration, which is precisely why establishing linearity is a critical validation parameter.
Instrumentation Components
A UV-Vis spectrophotometer consists of several key components that work in concert to obtain measurements [1]:
- Light Source: Provides a steady emission across a wide wavelength range (e.g., xenon lamp, or separate deuterium lamp for UV and tungsten/halogen lamp for visible light).
- Wavelength Selector: Monochromators or filters select specific wavelengths from the broad spectrum emitted by the source.
- Sample Holder: Contains the sample solution, typically a cuvette with a standard path length of 1 cm.
- Detector: Converts the transmitted light intensity into an electronic signal (e.g., photomultiplier tube, photodiode, or charge-coupled device).
The proper functioning of each component is essential for obtaining valid results, which is why instrument qualification represents a prerequisite to method validation.
The ICH guidelines Q2(R1) – "Validation of Analytical Procedures" delineates the methodology for validating the characteristics of an analytical procedure. While the guidelines establish the framework, they allow flexibility in implementation, stating that "approaches other than those set forth in this guideline may be applicable and acceptable" and that it is "the responsibility of the applicant to choose the validation procedure and protocol most suitable for their product" [91]. This flexibility necessitates a scientifically rigorous and statistically sound approach to validation.
The guidelines define four common types of analytical procedures, each with specific validation requirements [91]:
- Identification Tests: To verify the identity of an analyte.
- Quantitative Tests for Impurities Content: To accurately quantify impurities.
- Limit Tests for Control of Impurities: To ensure impurities remain below a specified limit.
- Quantitative Tests of Active Moieties: To measure the active component in drug substances or products.
For quantitative tests of active ingredients – a common application of UV-Vis in pharmaceuticals – the key validation characteristics include linearity, range, accuracy, precision (repeatability and intermediate precision), specificity, detection limit, quantitation limit, and robustness [91]. The ICH suggests combining individual validation characteristics in experimental work to minimize total testing while providing "a sound, overall knowledge of the capabilities of the analytical procedure" [91].
Establishing Linearity
Definition and Experimental Protocol
Linearity refers to the ability of an analytical procedure to obtain test results that are directly proportional to the concentration of the analyte in the sample within a given range [91]. This characteristic is fundamental to the application of the Beer-Lambert Law for accurate quantification.
To demonstrate linearity experimentally, researchers should prepare a series of standard solutions at a minimum of five concentration levels across the specified range [91]. Each concentration should be prepared independently and analyzed in triplicate to assess variability. The resulting solutions are scanned using the UV-Vis spectrophotometer, and the absorbance at the predetermined analytical wavelength (λmax) is recorded for each concentration.
An example of this approach is illustrated in a study validating a method for Terbinafine hydrochloride, where linearity was assessed across concentrations of 5–30 μg/mL, with each level prepared and analyzed appropriately [92]. Similarly, a method for Rifampicin quantification demonstrated linearity with a correlation coefficient (r²) of 0.999 [93].
Data Analysis and Acceptance Criteria
The data analysis involves plotting the mean absorbance values against their corresponding concentrations and performing linear regression analysis. The key parameters derived from this analysis include:
- Correlation Coefficient (r): Measures the strength of the linear relationship.
- Coefficient of Determination (r²): Indicates the proportion of variance in absorbance explained by concentration.
- Y-intercept: Should be statistically indistinguishable from zero.
- Slope: Represents the sensitivity of the method.
- Residual Analysis: Helps identify systematic deviations from linearity.
The ICH guidelines recommend a minimum correlation coefficient of 0.999 for UV methods, though some applications may accept slightly lower values with appropriate justification [92] [91]. The following table summarizes linearity data from two validated methods:
Table 1: Linearity Data from Validated UV-Vis Methods
| Analytical Method | Concentration Range | Correlation Coefficient (r²) | Regression Equation |
|---|---|---|---|
| Terbinafine HCl [92] | 5–30 μg/mL | 0.999 | Y = 0.0343X + 0.0294 |
| Rifampicin [93] | Not specified | 0.999 | Not specified |
Figure 1: Experimental workflow for establishing linearity in UV-Vis method validation
Determining Precision
Levels of Precision
Precision expresses the closeness of agreement between a series of measurements obtained from multiple sampling of the same homogeneous sample under prescribed conditions [91]. The ICH guidelines categorize precision into three levels:
- Repeatability (intra-assay precision): Precision under the same operating conditions over a short interval of time, assessed through a minimum of 9 determinations covering the specified range (e.g., 3 concentrations/3 replicates each) or a minimum of 6 determinations at 100% of the test concentration [91].
- Intermediate Precision: Within-laboratory variations due to different days, different analysts, different equipment, etc. The suggested testing consists of a minimum of two analysts on two different days with three replicates at a minimum of three concentrations [91].
- Reproducibility (collaborative studies): Precision between different laboratories, typically assessed during method transfer or standardization.
Experimental Design and Statistical Analysis
A comprehensive precision study should incorporate elements of both repeatability and intermediate precision. A robust experimental design would include two analysts each analyzing the same homogeneous sample at three concentration levels (low, medium, high) in triplicate on two different days. This design allows for the calculation of variance components, which partitions the total variability into its respective sources: analyst-to-analyst, day-to-day, and run-to-run (repeatability) variation [91].
Precision is typically expressed as the % Relative Standard Deviation (%RSD), also known as the coefficient of variation, which is calculated as (Standard Deviation / Mean) × 100. The ICH does not specify universal acceptance criteria for %RSD, as appropriate limits depend on the method's purpose and the analyte's properties. However, for assay of active ingredients in pharmaceuticals, %RSD is generally expected to be less than 2% [92]. The following table exemplifies precision data from a validated method:
Table 2: Precision Data for a Terbinafine Hydrochloride UV-Vis Method [92]
| Precision Level | Concentration (μg/mL) | % RSD | Acceptance Criteria Met? |
|---|---|---|---|
| Repeatability (n=6) | 20 | < 2% | Yes |
| Intra-day (n=3) | 10, 15, 20 | < 2% | Yes |
| Inter-day (over 3 days) | 10, 15, 20 | < 2% | Yes |
| Ruggedness (Two Analysts) | 20 | < 2% | Yes |
Demonstrating Accuracy
Definition and Methodologies
Accuracy refers to the closeness of agreement between the measured value obtained by the analytical method and the value accepted as either a conventional true value or an accepted reference value [91]. In practice, accuracy measures the bias of the method – the difference between the measured mean value and the true value.
The ICH guidelines recommend three primary approaches for determining accuracy [91]:
- Comparison to a Reference Standard: Analyzing a sample of known concentration (e.g., a certified reference material) and comparing the measured value to the true value.
- Spiked Recovery Studies: Adding known quantities of the analyte to a placebo or blank matrix and determining the percentage recovered by the method. This is particularly important for formulations and biological matrices.
- Comparison with a Validated Reference Method: Analyzing the same samples using both the new method and a previously validated reference method.
For pharmaceutical analysis, recovery studies are most commonly employed. The guidelines suggest testing a minimum of three concentrations with three replicates each, resulting in a minimum of 9 determinations [91].
Experimental Protocol for Recovery Studies
To perform a recovery study for a drug substance:
- Prepare a stock solution of the reference standard with known, high purity.
- Spike a placebo or blank solution at three concentration levels (e.g., 80%, 100%, 120% of the target concentration) covering the specified range.
- Analyze each spiked sample using the validated UV-Vis method.
Calculate the percentage recovery for each determination using the formula:
% Recovery = (Measured Concentration / Theoretical Concentration) × 100
Calculate the mean recovery and %RSD for each concentration level.
A study on Rifampicin quantification demonstrated high accuracy, with percentage relative error (%RE) ranging from -11.62% to 14.88% across different media [93]. Similarly, a method for Terbinafine hydrochloride showed recovery rates between 98.54% and 99.98% [92].
Table 3: Accuracy (Recovery) Data for a Terbinafine Hydrochloride Method [92]
| Spike Level | % Recovery | % RSD | Acceptance Criteria Met? |
|---|---|---|---|
| 80% | 98.54 – 99.98% | < 2% | Yes |
| 100% | 98.54 – 99.98% | < 2% | Yes |
| 120% | 98.54 – 99.98% | < 2% | Yes |
Figure 2: Methodology for demonstrating accuracy through recovery studies
The Scientist's Toolkit: Essential Materials for Validation
Table 4: Key Research Reagents and Materials for UV-Vis Method Validation
| Item | Function / Purpose | Technical Considerations |
|---|---|---|
| Reference Standard | Provides the "true value" for accuracy studies; used for calibration. | Should be of known high purity and traceable to a certified source. |
| Appropriate Solvent | Dissolves the analyte without interfering at λmax. | Must be transparent (non-absorbing) at the analytical wavelength. |
| Placebo Matrix | Mimics the formulation without the active ingredient for recovery studies. | Should match the chemical composition of the sample matrix as closely as possible. |
| Volumetric Glassware | Precise preparation of standard and sample solutions. | Use Class A glassware for highest accuracy in quantitative work. |
| Quartz Cuvettes | Holds samples for analysis in the spectrophotometer. | Required for UV range (below 350 nm); glass or plastic may be used for visible only [1]. |
| Buffer Salts | Maintains constant pH for ionizable analytes. | pH can affect λmax and absorbance; buffer should not absorb at analytical wavelength. |
| Filter Membranes | Removes undissolved particles that cause light scattering. | Essential for samples that are not perfectly clear; pore size typically 0.45 μm or smaller [90]. |
Integrated Validation: A Practical Approach
The ICH guidelines encourage an efficient approach to validation where "the appropriate validation characteristics can be considered simultaneously to provide a sound, overall knowledge of the capabilities of the analytical procedure" [91]. For instance, the linearity study can be designed to also provide data on accuracy and precision by having multiple analysts perform replicate measurements at each concentration level across the specified range. This integrated approach minimizes experimental work while still meeting regulatory requirements.
When interpreting validation data, statistical methods should be employed to make objective decisions. For accuracy, confidence intervals can be constructed around the mean recovery to demonstrate that the true value falls within an acceptable range (e.g., 95–105% with 95% confidence) [91]. For precision, variance component analysis helps identify the largest sources of variability, guiding improvement efforts. Statistical software packages facilitate these calculations and provide robust data analysis capabilities.
Successful validation requires careful planning before execution. A pre-defined validation protocol should specify the acceptance criteria for each parameter based on the method's intended use and prior knowledge. Any deviation from these criteria should be investigated and justified. Through this rigorous, systematic approach, UV-Vis spectroscopic methods can be reliably validated to support the demanding requirements of pharmaceutical research and quality control.
This technical guide explores the application of UV-Vis spectroscopy for the simultaneous analysis of multiple Active Pharmaceutical Ingredients (APIs), a growing necessity in modern pharmaceutical development. While traditional UV analysis struggles with spectrally overlapping components, advancements in Multicomponent Analysis (MCA) algorithms and in-line fiber-optic probes have enabled accurate, real-time quantification without chromatographic separation. This whitepaper details the underlying principles, provides a definitive experimental protocol, and validates the methodology within a quality by design (QbD) framework, positioning UV spectroscopy as a robust, efficient Process Analytical Technology (PAT) tool for drug development professionals.
Ultraviolet-Visible (UV-Vis) spectrophotometry is a foundational analytical technique in pharmaceutical research based on a simple principle: molecules containing chromophores can absorb light in the ultraviolet (190–400 nm) and visible (400–800 nm) regions of the electromagnetic spectrum. When this occurs, electrons transition from a ground state to a higher energy excited state [94]. The core quantitative relationship is governed by the Beer-Lambert Law, which states that the absorbance of a solution at a given wavelength is directly proportional to the concentration of the absorbing species and the path length of the light through the solution [95] [94].
The basic instrumentation of a UV-Vis spectrometer includes a light source (e.g., deuterium lamp for UV, tungsten or halogen lamp for visible light), a wavelength selector (monochromator or filters), a sample container (cuvette or in-line probe), and a detector [94]. For pharmaceutical analysis, this technique is prized for its speed, simplicity, and minimal solvent consumption compared to separation techniques like High-Performance Liquid Chromatography (HPLC) [96]. However, the conventional application of UV spectroscopy reaches its limits when faced with formulations containing multiple APIs whose absorption spectra significantly overlap, making quantification of individual components at single wavelengths impossible [95]. The solution to this challenge lies in leveraging full-spectrum data with sophisticated computational analysis.
Theoretical Framework for Simultaneous Analysis
The Challenge of Spectral Overlap
In a formulation with a single API, quantifying the active ingredient is often straightforward, involving measurement of absorbance at a specific wavelength and comparison to a calibration curve. This approach fails for multiple APIs because the total measured absorbance at any wavelength is the sum of the contributions from all absorbing species [95]. As shown in Figure 1 of the search results, the spectra of common APIs like acetaminophen and caffeine exhibit significant overlap, preventing independent quantification at most wavelengths using univariate analysis [95].
Multicomponent Analysis (MCA) Fundamentals
The principle enabling simultaneous API analysis is Multicomponent Analysis (MCA), which uses a full spectral data set rather than single-wavelength measurements. The mathematical foundation is an expansion of the Beer-Lambert Law for multiple components [95].
The absorbance A at a given wavelength λ for a mixture of p components is given by:
Aλ = Eλ1C1 + Eλ2C2 + ... + EλpCp
where:
Eλjis the sensitivity factor (molar absorptivity × path length) of componentjat wavelengthλCjis the concentration of componentjin the mixture [95]
This equation is expanded across all wavelengths and formulated into matrices for computational solution:
A = K · C
Here, A is the matrix of absorbance values, C is the matrix of concentrations, and K is the matrix of sensitivity factors [95].
The Classical Least Squares (CLS) algorithm is then used to solve this equation. A calibration or regression matrix, Kcal, is first determined from the spectra of standard solutions with known concentrations (C_std):
Kcal = A_std · C_std^T · (C_std · C_std^T)^{-1}
Once Kcal is established, the concentrations of an unknown sample (C_unk) are predicted from its absorbance spectrum (A_unk):
C_unk = Kcal · A_unk [95]
This methodology allows for the deconvolution of individual API contributions to the combined spectral signal, enabling accurate quantification without a physical separation step.
Experimental Protocol for a Two-Component System
This section provides a detailed, step-by-step methodology for implementing simultaneous API analysis, using a published analysis of acetaminophen and caffeine as a model [95].
Reagents, Materials, and Instrumentation
The key to this method is the use of a fiber-optic dissolution system, which allows for in-situ, real-time spectral acquisition.
Table 1: Essential Research Reagent Solutions and Materials
| Item | Function/Description |
|---|---|
| API Standards (e.g., Acetaminophen, Caffeine) | High-purity reference materials for creating calibration models. |
| Dissolution Medium (e.g., 0.1M HCl or buffer) | Aqueous solution mimicking physiological conditions for dissolution testing. |
| Fiber-Optic Dissolution Analyzer (e.g., Distek Opt-Diss 410) | Instrument with in-situ UV probes and flow-through cells for real-time monitoring. |
| Multicomponent Analysis (MCA) Software | Software implementing the CLS algorithm for concentration prediction. |
| Volumetric Flasks & Pipettes | For accurate preparation of standard and sample solutions. |
Instrumentation: A fiber-optic UV dissolution system (e.g., Distek Opt-Diss 410) is used. This system is equipped with immersion probes connected via optical fibers to a spectrophotometer. Data collection frequency can be set high (e.g., every 10 seconds) to capture rapid dissolution events [95].
Step-by-Step Procedure
- Preparation of Standard Solutions: Prepare a series of at least five standard mixtures spanning the expected concentration range for both acetaminophen and caffeine. For example, prepare mixtures with varying ratios of the two APIs (e.g., 80%/20%, 50%/50%, 20%/80% of target concentration) [95].
- Spectral Acquisition of Standards: Place each standard mixture in the dissolution vessel or flow cell. Collect the full UV-Vis transmittance or absorbance spectrum for each standard (e.g., from 230 to 400 nm) [34] [95].
- Construction of Calibration Model: Input the known concentrations of all standard solutions and their corresponding full spectra into the MCA software. The software will use this "training set" to calculate the calibration matrix,
Kcal, which encapsulates the spectral sensitivity of each component [95]. - Sample Analysis: Introduce the test sample (e.g., a tablet in a dissolution vessel). The system automatically collects in-line spectra at a set frequency (e.g., every 10 seconds) throughout the test duration [95].
- Real-Time Concentration Prediction: The MCA software applies the
Kcalmatrix to each measured sample spectrum in real-time, solving for the concentration of each API using the equationC_unk = Kcal · A_unk. This generates simultaneous, time-resolved concentration profiles for both actives [95].
The following workflow diagram illustrates this experimental process:
Data Presentation and Validation
Representative Quantitative Results
The following table summarizes typical results obtained from the analysis of known standard mixtures of acetaminophen and caffeine, demonstrating the accuracy of the MCA method.
Table 2: Measured vs. Actual Percentage Values of Acetaminophen and Caffeine in Standard Mixtures [95]
| Mixture | Actual Acetaminophen (%) | Measured Acetaminophen (%) | Actual Caffeine (%) | Measured Caffeine (%) |
|---|---|---|---|---|
| 1 | 80.0 | 80.2 | 20.0 | 19.8 |
| 2 | 60.0 | 59.7 | 40.0 | 40.3 |
| 3 | 50.0 | 50.1 | 50.0 | 49.9 |
| 4 | 40.0 | 40.2 | 60.0 | 59.8 |
| 5 | 20.0 | 19.9 | 80.0 | 80.1 |
The data shows that the method quantitates the amounts of both APIs in mixtures with an error well below 2%, confirming its suitability for quantitative analysis [95].
Application to Real-World Dissolution Testing
The methodology was successfully applied to monitor the dissolution of a commercial tablet containing 400 mg of aspirin and 32 mg of caffeine. The MCA software, using a calibration model built from standard mixtures, was able to resolve the distinct dissolution profiles of the two APIs simultaneously. The results clearly showed caffeine's very fast release rate compared to aspirin's slower release, all without drawing a single sample or using HPLC [95].
Method Validation within a QbD Framework
Robustness of analytical methods for pharmaceutical applications is critical. The Analytical Quality by Design (AQbD) approach provides a systematic framework for development and validation [34]. Key steps and validation criteria include:
- Establishing an Analytical Target Profile (ATP): The ATP pre-defines the method's performance requirements, such as accuracy and precision for the intended application [34].
- Risk Assessment: Tools like Failure Mode and Effect Analysis (FMEA) are used to identify and mitigate risks to the analytical procedure [34].
- Validation using Accuracy Profiles: This approach, advocated by the Société Française des Sciences et Techniques Pharmaceutiques (SFSTP), uses total error (trueness + precision) to validate quantitative methods. The method is considered valid if the 95% β-expectation tolerance limits of the accuracy profile fall within predefined acceptance limits (e.g., ±5%) across the entire concentration range [34] [97]. This strategy has been successfully applied to in-line UV-Vis spectroscopy for API quantification [34].
- For a Single API, a typical validated method exhibits performance characteristics as shown in the table below, based on the development of a method for Ciprofloxacin:
Table 3: Example Validation Parameters for a UV Spectrophotometric Method (Ciprofloxacin) [96]
| Validation Parameter | Result / Criterion |
|---|---|
| Wavelength (λmax) | 277 nm |
| Linear Range | 2.5 - 15 µg/ml |
| Regression Equation | Y = 0.1104x |
| Correlation Coefficient (R²) | 0.999 |
| Precision (RSD) | < 2% |
| Accuracy (Recovery) | 98.36 - 100.83% |
| LOD / LOQ | 0.44 µg/ml / 1.46 µg/ml |
Advantages and Applicability as a PAT Tool
The integration of UV-Vis spectroscopy with MCA and fiber-optic probes transforms it into a powerful Process Analytical Technology (PAT) tool. The key benefits are:
- Real-Time Monitoring: In-situ probes provide instantaneous data, enabling near real-time analysis of dissolution or manufacturing processes without manual sampling [95] [97].
- Efficiency & Cost-Effectiveness: It eliminates the need for lengthy HPLC runs, saving time, labor, and costly solvents [95] [96].
- Suitability for Continuous Manufacturing: In-line UV-Vis probes can be integrated into unit operations like Hot-Melt Extrusion (HME) to monitor API concentration as a Critical Quality Attribute (CQA) in real-time, supporting Real-Time Release Testing (RTRT) strategies [34].
- High Sensitivity: UV-Vis is capable of quantifying very low API concentrations (e.g., <0.01%), making it applicable to low-dose formulations [97].
The following diagram illustrates the logical integration of this analytical method within a PAT and QbD framework:
Simultaneous API analysis using UV-Vis spectrophotometry, once considered unfeasible, is now a robust and reliable analytical technique. By moving beyond single-wavelength measurements and harnessing full-spectrum data processed with Multicomponent Analysis (MCA) algorithms, this method accurately quantifies individual components in complex mixtures. When combined with in-line fiber-optic probes, it becomes a powerful PAT tool that provides real-time, actionable data for pharmaceutical development and quality control. Framed within an Analytical Quality by Design (AQbD) approach, the method meets rigorous regulatory validation standards, offering a faster, more efficient, and cost-effective alternative to chromatography for a wide range of applications, from dissolution testing to monitoring continuous manufacturing processes.
Ultraviolet-Visible (UV-Vis) spectroscopy and Reversed-Phase High-Performance Liquid Chromatography (RP-HPLC) represent two foundational analytical techniques in pharmaceutical research. Within a quality control or drug development laboratory, the selection between these methods hinges on a clear understanding of their respective capabilities and limitations in sensitivity, selectivity, and throughput. This whitepaper provides a structured comparison of these techniques, framing them within the context of basic pharmaceutical instrumentation. It aims to equip researchers and scientists with the data necessary to select the appropriate method for their specific analytical challenge, whether it involves simple quantification of a pure active ingredient or the complex separation and analysis of multi-component mixtures.
Fundamental Principles and Instrumentation
UV-Vis Spectrophotometry
UV-Vis spectroscopy is an analytical technique that measures the amount of discrete wavelengths of UV or visible light absorbed by a sample in comparison to a reference or blank sample [1]. The fundamental principle is based on the Beer-Lambert law, which states that absorbance (A) is proportional to the concentration (c) of the absorbing species, its molar absorptivity (ε), and the path length (L) of the sample: A = εcL [1]. This linear relationship is the cornerstone of quantitative analysis with UV-Vis.
A typical UV-Vis spectrophotometer consists of several key components: a light source (often a deuterium lamp for UV and a tungsten/halogen lamp for visible light), a wavelength selector (such as a monochromator with a diffraction grating), a sample compartment, and a detector (e.g., a photomultiplier tube or photodiode) to convert the light signal into an electrical signal [1]. The result is an absorption spectrum, a plot of absorbance versus wavelength, which can be used for identification and quantification [1].
Reversed-Phase High-Performance Liquid Chromatography (RP-HPLC)
RP-HPLC is a separation technique where the analytical challenge involves resolving a mixture into its individual components. Separation is based on the differential partitioning of analytes between a non-polar stationary phase (typically a C8 or C18 hydrocarbon chain bonded to a silica particle) and a polar mobile phase (e.g., a mixture of water and an organic solvent like acetonitrile or methanol) [98]. Analytes with higher hydrophobicity interact more strongly with the stationary phase and are retained longer in the column.
A basic HPLC system comprises a pump for delivering the mobile phase at high pressure, an injector for introducing the sample, a column where the separation occurs, and a detector [13]. The most common detector in pharmaceutical analysis is the UV detector, which can be a Variable Wavelength Detector (VWD) or a Diode Array Detector (DAD). The DAD is particularly powerful as it captures the entire UV-Vis spectrum of the eluting analyte, providing spectral data for peak identification and purity assessment [13]. The output is a chromatogram, a plot of detector response versus time, where each peak corresponds to a separated component.
Critical Comparison: Sensitivity, Selectivity, and Throughput
Selectivity and Specificity
Selectivity is the ability of a method to distinguish the analyte from other components in the sample.
- UV-Vis: Offers limited selectivity as it measures the total absorbance of all chromophoric compounds in the sample at a chosen wavelength. It cannot distinguish between the analyte and other absorbing substances, such as excipients, impurities, or degradation products, making it prone to interferences in complex matrices [99]. Its specificity is primarily dependent on the analyte having a characteristic absorption profile.
- RP-HPLC: Provides high selectivity due to its powerful separation capability. Components of a mixture are physically separated by the column based on their chemical properties before detection. This allows for the specific quantification of the target analyte even in the presence of interferences. The photodiode array detector (DAD) further enhances specificity by allowing peak purity assessment through spectral comparison [13] [99].
Sensitivity: Detection and Quantification Limits
Sensitivity refers to the ability of a method to detect or quantify low amounts of an analyte, typically defined by the Limit of Detection (LOD) and Limit of Quantification (LOQ).
Table 1: Comparison of Sensitivity from Validation Studies
| Analytical Technique | Analyte | Linear Range (μg/mL) | LOD (μg/mL) | LOQ (μg/mL) | Citation |
|---|---|---|---|---|---|
| RP-HPLC | Metformin HCl | 2.5 - 40 | 0.156 | 0.625 | [100] |
| UV-Vis | Metformin HCl | 2.5 - 40 | - | - | [100] |
| RP-HPLC | Levofloxacin | 0.05 - 300 | - | - | [101] |
| UV-Vis | Levofloxacin | 0.05 - 300 | - | - | [101] |
| RP-HPLC (UHPLC) | Gabapentin & Methylcobalamin | 3 - 50 | 0.60 - 0.80 | 2.00 - 2.50 | [98] |
The data demonstrates that RP-HPLC generally offers superior sensitivity, with lower LOD and LOQ values, making it suitable for detecting trace-level impurities [100] [98]. While UV-Vis can be highly sensitive for compounds with high molar absorptivity, its sensitivity in complex samples is compromised by a lack of separation, as the signal represents the total absorbance [99].
Analysis Time and Throughput
Throughput relates to the number of analyses that can be performed in a given time.
- UV-Vis: Excels in throughput. Analysis is rapid, often taking seconds to minutes per sample with minimal sample preparation. This makes it ideal for high-volume, routine quality control checks of pure substances, such as concentration verification or dissolution testing of formulated products [4] [99].
- RP-HPLC: Has inherently lower throughput. A single chromatographic run can take from 5 to 30 minutes or more to adequately separate all components [98] [99]. While autosamplers can allow for unattended operation, the overall time from sample injection to result is significantly longer than for UV-Vis.
Table 2: Overall Comparative Analysis of UV-Vis and RP-HPLC
| Aspect | UV-Vis Spectroscopy | RP-HPLC |
|---|---|---|
| Principle | Absorption of light by chromophores | Separation followed by detection |
| Selectivity | Low; measures total absorbance | High; resolves mixture components |
| Sensitivity | Good for pure compounds | Superior; detects trace impurities |
| Analysis Speed | Fast (seconds-minutes) | Slow (minutes-tens of minutes) |
| Sample Preparation | Minimal | Often required and complex |
| Cost | Low equipment and operational cost | High equipment, maintenance, and solvent cost |
| Best Use Cases | Routine QC of simple/pure APIs, dissolution testing, bacterial culturing [4] [1] | Complex formulations, impurity profiling, stability-indicating methods [99] |
| Key Limitations | Prone to interferences, requires chromophore | Costly, requires skilled operation, high solvent consumption [99] |
Experimental Protocols and Methodologies
Detailed Protocol: Quantification of Levofloxacin by RP-HPLC
The following methodology, adapted from a comparative study, outlines the steps for quantifying Levofloxacin in a composite scaffold, demonstrating the rigor of an HPLC method [101].
Chromatographic Conditions:
- Column: Sepax BR-C18 (250 x 4.6 mm, 5 μm particle size).
- Mobile Phase: A mixture of 0.01 mol/L KHâ‚‚POâ‚„, methanol, and 0.5 mol/L tetrabutylammonium hydrogen sulphate in a ratio of 75:25:4.
- Flow Rate: 1.0 mL/min.
- Column Temperature: 40°C.
- Detection Wavelength: 290 nm.
- Injection Volume: 10 μL for assay determination.
Sample Preparation:
- Precisely weigh 30.00 mg of Levofloxacin reference standard.
- Dissolve in Simulated Body Fluid (SBF) and transfer to a 10 mL volumetric flask. Dilute to volume with SBF to obtain a 3 mg/mL stock standard solution.
- Prepare a series of calibration standards by diluting the stock solution with SBF to concentrations within the range of 0.05–300 μg/mL.
- For the sample, extract the drug from the composite scaffold into SBF.
Analysis Procedure:
- Condition the HPLC system with the mobile phase until a stable baseline is achieved.
- Inject the calibration standards and the sample solutions.
- Construct a calibration curve by plotting the peak area of Levofloxacin against concentration. The study reported a regression equation of y=0.033x + 0.010 with R² = 0.9991 [101].
- Calculate the concentration of Levofloxacin in the unknown sample from the calibration curve.
Detailed Protocol: Quantification of Levofloxacin by UV-Vis
This parallel protocol for UV-Vis analysis highlights its simplicity but also its potential limitations in complex systems [101].
Instrument Conditions:
- Instrument: UV-Vis Spectrophotometer.
- Wavelength Selection: Scan the standard solution to identify the maximum absorption wavelength (λmax). The study used a wavelength of 290 nm for Levofloxacin [101].
Sample Preparation:
- Prepare the stock standard solution (3 mg/mL) identically to the HPLC method.
- Prepare calibration standards in SBF over the same concentration range (0.05–300 μg/mL).
Analysis Procedure:
- Zero (blank) the instrument using SBF.
- Measure the absorbance of each calibration standard and the sample solution.
- Construct a calibration curve of absorbance versus concentration. The study reported a regression equation of y=0.065x + 0.017 with R² = 0.9999 [101].
- Determine the concentration of the unknown from the calibration curve.
Critical Comparative Insight: While both methods showed excellent linearity, the recovery study results were telling. For Levofloxacin released from a composite scaffold, HPLC provided more accurate recovery rates (96.37% - 110.96%) compared to UV-Vis (96.00% - 99.50%), indicating that UV-Vis can be less accurate in complex matrices due to potential interference from other scaffold components [101].
The Scientist's Toolkit: Essential Research Reagent Solutions
Table 3: Key Reagents and Materials for UV-Vis and RP-HPLC Experiments
| Item | Function / Purpose | Example from Protocols |
|---|---|---|
| C18 or C8 Chromatography Column | The stationary phase for reversed-phase separation of analytes. | Sepax BR-C18 column [101]; Zorbax Eclipse C8 column [98]. |
| HPLC-Grade Solvents | Used to prepare the mobile phase; high purity is critical to reduce baseline noise and avoid column damage. | Methanol, Acetonitrile [101] [98]. |
| Buffer Salts | Used to control the pH of the mobile phase, which critically affects the retention and separation of ionizable analytes. | Potassium Phosphate [98], Tetrabutylammonium hydrogen sulphate [101]. |
| Reference Standards | Highly pure characterized material used to prepare calibration curves for accurate quantification. | Levofloxacin National Institute standard [101]. |
| Volumetric Glassware | For precise preparation and dilution of standard and sample solutions. | 10 mL volumetric flasks [101]. |
| UV-Transparent Cuvettes / Flow Cell | Sample holders that do not absorb UV light, allowing for accurate absorbance measurement. | Quartz cuvettes (for UV), HPLC flow cell with quartz windows [1] [13]. |
| Simulated Body Fluid (SBF) | A solution that mimics ion composition of human blood plasma, used in drug release studies. | Dissolution medium for Levofloxacin release testing [101]. |
UV-Vis spectroscopy and RP-HPLC are complementary, not competing, techniques in the pharmaceutical scientist's analytical arsenal. The choice between them is dictated by the specific requirements of the analysis.
- UV-Vis Spectrophotometry is the tool of choice for high-throughput analysis of relatively simple and pure samples where the target analyte possesses a chromophore and is present in a matrix free of interfering absorbing substances. Its strengths are speed, simplicity, and low cost [4] [99].
- RP-HPLC is indispensable when high selectivity and sensitivity are required. It is the definitive method for analyzing complex mixtures, performing impurity profiling, and developing stability-indicating methods as per ICH guidelines [13] [99]. Its ability to separate components before detection overcomes the primary limitation of UV-Vis.
In practice, the techniques are often used in tandem. UV-Vis serves as a rapid screening tool, while RP-HPLC provides confirmatory analysis. Furthermore, RP-HPLC incorporates a UV-Vis detector as its sensing element, perfectly illustrating their synergistic relationship in ensuring the identity, purity, potency, and safety of pharmaceutical products.
In pharmaceutical research, the validation of analytical methods is paramount to ensure the reliability, accuracy, and precision of data. This whitepaper, framed within the context of Ultraviolet-Visible (UV-Vis) spectrophotometry, provides an in-depth technical guide on two fundamental statistical tools used for method comparison: Analysis of Variance (ANOVA) and Percentage Relative Standard Deviation (%RSD). The application of these statistical techniques is demonstrated through validated methodologies for drug quantification, underscoring their critical role in drug development and quality control.
Ultraviolet-Visible (UV-Vis) spectrophotometry is a cornerstone analytical technique in pharmaceutical laboratories due to its simplicity, cost-effectiveness, and robustness. The principle is based on measuring the amount of ultraviolet or visible light absorbed by a sample, which follows the Beer-Lambert Law [1]. This law establishes a linear relationship between absorbance (A) and the concentration (c) of an analyte in solution, expressed as A = εcl, where ε is the molar absorptivity and l is the path length of the cuvette [1]. This relationship is the foundation for quantifying active pharmaceutical ingredients (APIs) in bulk materials and formulated products.
A typical UV-Vis spectrophotometer comprises several key components: a light source (e.g., deuterium lamp for UV, tungsten or halogen lamp for visible light), a wavelength selector (such as a monochromator with a diffraction grating), a sample holder (cuvette), and a detector (like a photomultiplier tube or photodiode) to convert light into an electrical signal [1]. For method validation, the output of primary importance is the absorption spectrum, from which absorbance values at specific wavelengths are used for subsequent statistical analysis to confirm the method's suitability [102] [92].
Core Statistical Concepts for Method Validation
Method validation, as mandated by the International Conference on Harmonisation (ICH) guidelines, requires demonstrating that an analytical procedure is suitable for its intended purpose. Key validation parameters include precision, accuracy, linearity, and robustness [102] [56] [92]. Statistical analysis is indispensable for objectively evaluating these parameters, with %RSD and ANOVA being central to assessing precision.
Percentage Relative Standard Deviation (%RSD)
The Relative Standard Deviation (RSD), also expressed as a percentage (%RSD), is a measure of the precision of an analytical method. It describes the dispersion of a set of data points relative to its mean, normalized to the mean itself. This normalization allows for the comparison of variability across data sets with different units or widely different means.
- Calculation: %RSD = (Standard Deviation / Mean) × 100%
- Application in Precision: Precision is evaluated as intra-day (repeatability) and inter-day (intermediate precision) variability. A lower %RSD value indicates higher precision and greater reliability of the method. For UV-Vis methods in pharmaceutical analysis, a %RSD of less than 2% is generally considered acceptable, as demonstrated in studies analyzing drugs like xanthohumol and terbinafine hydrochloride [102] [92].
Analysis of Variance (ANOVA)
Analysis of Variance (ANOVA) is a statistical hypothesis-testing procedure used to compare the means of two or more groups. In analytical method comparison, it helps determine if the differences between multiple data sets (e.g., results from different analysts, different days, or different instruments) are statistically significant or merely due to random variation.
- Principle: ANOVA partitions the total variability in a data set into components attributable to different sources of variation (e.g., between-group variation and within-group variation).
- Key Outputs:
- F-statistic: The ratio of between-group variance to within-group variance. A larger F-value suggests that the between-group differences are substantial.
- p-value: The probability that the observed differences between group means occurred by random chance. A p-value of less than 0.05 is typically considered statistically significant, indicating that there is a real difference between the groups being compared [102].
- Application in Method Validation: ANOVA is used to rigorously assess intermediate precision (or ruggedness), such as confirming that no significant difference exists between results obtained by different analysts or on different days [56].
The following diagram illustrates the logical workflow for applying these statistical tools within a method validation protocol.
Experimental Protocols: Statistical Evaluation in Practice
This section details a standard operating procedure for validating a UV-Vis spectrophotometric method, incorporating %RSD and ANOVA calculations at critical stages.
Method Development and Linear Range Establishment
- Procedure:
- Prepare a stock solution of the reference standard analyte at a known concentration (e.g., 1000 µg/mL) [102].
- Serially dilute the stock solution to obtain a series of standard solutions covering a suitable range (e.g., 2-12 µg/mL for xanthohumol or 5-30 µg/mL for terbinafine HCl) [102] [92].
- Measure the absorbance of each standard solution at the predetermined absorption maximum (λmax).
- Plot a calibration curve of absorbance versus concentration.
- Perform linear regression analysis to obtain the correlation coefficient (R²), slope, and intercept. An R² value greater than 0.995 is typically required to demonstrate linearity [102] [92].
Precision and Repeatability Assessment (Using %RSD)
- Objective: To determine the intra-day and inter-day precision of the method.
- Procedure:
- Prepare multiple samples (n=6) of the same concentration from a homogeneous source (e.g., a tablet powder solution or a standard solution) [56] [92].
- Analyze all samples on the same day under identical conditions (for intra-day precision) and on three different days (for inter-day precision).
- Calculate the mean concentration and standard deviation for each data set.
- Compute the %RSD for each set.
- Acceptance Criterion: The %RSD should be less than 2%, indicating good repeatability and intermediate precision [102] [92].
Intermediate Precision/ Ruggedness Assessment (Using ANOVA)
- Objective: To determine if variations introduced by different analysts or instruments cause a statistically significant bias in the results.
- Procedure:
- Two analysts (or two instruments) analyze the same set of samples at multiple concentration levels (e.g., low, medium, high) in replicate.
- The resulting concentration data is organized into groups corresponding to each analyst.
- A one-way ANOVA is performed on these grouped data sets.
- The F-statistic and p-value are examined from the ANOVA output [102] [56].
- Acceptance Criterion: A p-value greater than 0.05 suggests that there is no statistically significant difference between the results obtained by the two analysts, thus demonstrating the method's ruggedness.
Calculation of Limits of Detection and Quantification
- Objective: To determine the sensitivity of the method.
- Procedure: LOD and LOQ can be calculated based on the standard deviation of the response (σ) and the slope (S) of the calibration curve [102] [56] [92].
- LOD = 3.3 × σ / S
- LOQ = 10 × σ / S
The following experimental workflow provides a visual summary of this validation process.
The quantitative results from method validation studies are systematically summarized in tables for clear presentation and comparison. The following tables consolidate typical data from UV-Vis method validation as per ICH guidelines.
Table 1: Summary of Key Validation Parameters from Cited Studies
| Drug Analyzed | Validation Parameter | Results Obtained | Acceptance Criteria Met | Reference |
|---|---|---|---|---|
| Xanthohumol (XH) | Linearity (Range: 2-12 µg/mL) | R² = 0.9981 | R² > 0.995 | [102] |
| Precision (%RSD) | %RSD < 2 | %RSD < 2 | [102] | |
| Accuracy (% Recovery) | 99.3 - 100.1% | 98-102% | [102] | |
| Terbinafine HCl | Linearity (Range: 5-30 µg/mL) | R² = 0.999 | R² > 0.995 | [92] |
| Precision (%RSD) | %RSD < 2 | %RSD < 2 | [92] | |
| Accuracy (% Recovery) | 98.54 - 99.98% | 98-102% | [92] | |
| Drotaverine (DRT) & Etoricoxib (ETR) | Precision (Inter-day %RSD) | %RSD < 2 for both drugs | %RSD < 2 | [56] |
Table 2: Example ANOVA Table for Intermediate Precision Assessment (Ruggedness)
| Source of Variation | Degrees of Freedom (df) | Sum of Squares (SS) | Mean Square (MS) | F-value | p-value |
|---|---|---|---|---|---|
| Between Analysts | 1 | 0.045 | 0.045 | 1.25 | 0.28 |
| Residual (Within Groups) | 16 | 0.576 | 0.036 | ||
| Total | 17 | 0.621 | |||
| Conclusion: | Since p-value (0.28) > 0.05, there is no significant difference between the results from the two analysts at the 95% confidence level. The method is considered rugged. |
The Scientist's Toolkit: Essential Research Reagent Solutions
The development and validation of a robust UV-Vis method relies on high-quality reagents and materials. The following table lists essential items and their functions in the analytical process.
Table 3: Essential Materials and Reagents for UV-Vis Spectrophotometric Analysis
| Item | Function / Role in Analysis | Example from Literature |
|---|---|---|
| High-Purity Reference Standard | Serves as the benchmark for quantifying the API; its purity directly impacts accuracy. | Xanthohumol from Steiner Hopfen GmbH [102]; Drotaverine and Etoricoxib from Alkem/Mapro [56]. |
| Spectroscopic Grade Solvent | Dissolves the analyte without introducing interfering absorbance in the UV-Vis range. | Methanol of UV grade used for Xanthohumol and Terbinafine HCl [102] [92]. |
| Volumetric Flasks & Pipettes | Ensure precise and accurate preparation of stock solutions, standard dilutions, and sample solutions. | Used in all referenced studies for preparing standard and sample solutions [102] [56] [92]. |
| Quartz Cuvettes | Provide a transparent window for light passage in the UV range; glass or plastic cuvettes are only suitable for visible light. | Essential for UV measurements as they are transparent down to ~200 nm [1]. |
| Solid-Phase Excipients (for formulations) | Inert components of drug formulations; the method must be specific enough to avoid interference from them. | Lipids (Compritol E) and surfactants (Pluronic F-68) used in XH nanoformulations [102]. |
| Buffer Salts | Maintain a constant pH for analytes that are pH-sensitive, ensuring consistent absorbance and method robustness. | Phosphate buffer used for dissolving hemoglobin [1]. |
| Filters (Whatmann filter paper) | Clarify sample solutions derived from tablet powders or complex matrices by removing particulate matter. | Used during the preparation of tablet sample solutions for Drotaverine/Etoricoxib analysis [56]. |
The rigorous statistical evaluation of analytical methods is non-negotiable in pharmaceutical research. ANOVA and %RSD are powerful, complementary tools that provide objective evidence of a method's precision and ruggedness. When applied within the framework of ICH guidelines to robust techniques like UV-Vis spectrophotometry, they ensure that the data generated for drug development and quality control is reliable, reproducible, and fit for purpose. Mastering these statistical concepts empowers scientists to not only validate their methods but also to critically troubleshoot and optimize their analytical procedures, thereby upholding the highest standards of pharmaceutical quality.
Within pharmaceutical research, the selection of an appropriate analytical technique is pivotal for generating reliable data across the drug development pipeline. This whitepaper provides a structured framework for researchers and drug development professionals to decide between the versatile, cost-effective Ultraviolet-Visible (UV-Vis) spectrophotometer and more powerful, high-end techniques like Ultra-High-Resolution Mass Spectrometry (UHRMS). By comparing technical capabilities, applications, and practical considerations, this guide aims to inform strategic instrumentation choices that align with specific analytical goals, from routine quality control to complex structural elucidation.
The basic instrumentation of a UV-Vis spectrophotometer is a cornerstone in pharmaceutical laboratories due to its operational simplicity and reliability. The technique measures the amount of discrete wavelengths of ultraviolet or visible light absorbed by a sample, providing critical information about analyte identity and concentration through the Beer-Lambert law [1]. Its widespread adoption is driven by several inherent strengths, including ease of use, rapid analysis, and non-destructive testing, making it suitable for a wide range of applications from bacterial culturing to nucleic acid purity checks [1] [103].
However, as pharmaceutical research delves into more complex matrices and requires definitive molecular characterization, the limitations of UV-Vis become apparent. For such challenges, higher-end techniques like Ultra-High-Resolution Mass Spectrometry (UHRMS)—including Orbitrap and Fourier Transform Ion Cyclotron Resonance (FTICR) instruments—offer unparalleled capabilities. These techniques provide exceptional resolving power and mass accuracy, enabling the unambiguous identification of compounds in highly complex mixtures, a task often beyond the scope of UV-Vis [104]. This guide explores the operational boundaries of each technique to empower scientists in selecting the optimal tool for their research context.
Principles and Instrumentation of UV-Vis Spectrophotometry
How UV-Vis Spectrophotometry Works
A UV-Vis spectrophotometer operates by passing a beam of light through a sample and measuring the intensity of light that is transmitted. The core measurement is absorbance, which is calculated as A = logâ‚â‚€(Iâ‚€/I), where Iâ‚€ is the intensity of the incident light, and I is the intensity of the light after passing through the sample [1]. This relationship is quantitatively linked to the sample's properties via the Beer-Lambert Law: A = ε * c * L, where 'ε' is the molar absorptivity (a molecule-specific constant), 'c' is the concentration, and 'L' is the path length of the light through the sample [1]. This principle is the foundation for both qualitative identification (via absorption spectra) and quantitative analysis (via concentration determination).
Key Instrument Components and Workflow
The fundamental components of a UV-Vis spectrophotometer create a specific workflow to measure absorbance [1].
Diagram 1: UV-Vis Instrument Workflow
- Light Source: Provides broad-wavelength light. Instruments often use a combination of a deuterium lamp (for UV) and a tungsten or halogen lamp (for visible) to cover the full spectrum [1].
- Wavelength Selector: Typically a monochromator containing a diffraction grating, this component selects a specific, narrow band of wavelengths to shine upon the sample. The grating's groove frequency (e.g., >1200 grooves per mm) determines the optical resolution [1].
- Sample Analysis: The selected wavelength of light passes through the sample, which is held in a cuvette. For UV light, quartz cuvettes are essential, as glass and plastic absorb UV radiation. A "blank" reference sample (pure solvent) is measured to establish a baseline [1].
- Detection: A detector, such as a photomultiplier tube (PMT) or photodiode, converts the transmitted light intensity into an electrical signal. The instrument then computes and outputs the absorbance value [1].
Strengths, Limitations, and Pharmaceutical Applications of UV-Vis
UV-Vis spectrophotometry occupies a vital niche in pharmaceutical analysis due to a compelling combination of operational advantages and well-understood limitations.
Advantages and Strengths
- Fast and Efficient Analysis: The technique provides results almost immediately, making it ideal for high-throughput environments like quality control in drug substance and product testing [103].
- Ease of Use and Reliability: UV-Vis instruments are known for their user-friendly design and intuitive interfaces, which reduce training time and ensure consistent, reproducible results [105].
- Cost-Effectiveness: With a relatively low initial investment and minimal operational expenses, UV-Vis is one of the most accessible analytical techniques, offering excellent value over its lifetime [105] [103].
- Non-Destructive Testing: The analysis does not consume or alter the sample, allowing for repeated measurements on the same, often precious, material [103].
- High Sensitivity and Accuracy: For targeted quantitative analyses, UV-Vis can detect minute changes in absorbance, providing precise concentration measurements for a wide range of analytes [105].
Limitations and Constraints
- Stray Light Issues: Imperfections in optical components can allow stray light to reach the detector, distorting spectra and reducing accuracy, particularly at high absorbance values [103].
- Limited to Absorption Measurements: UV-Vis provides no direct information on molecular structure or identity beyond the characteristic absorption bands of chromophores [103].
- Struggles with Complex Mixtures: Samples with multiple absorbing compounds often have overlapping absorption bands, making it difficult or impossible to discern individual components without prior separation [103].
- Dependence on Sample Preparation: The sample must be prepared in a suitable solvent and be free of turbidity or particulates that scatter light, or else results can be significantly compromised [103].
Detailed Experimental Protocol: Drug Purity and Concentration Assay
A primary application of UV-Vis in pharma is quantifying the concentration and checking the purity of a drug compound.
1. Principle: The concentration of an analyte in solution is determined by measuring its absorbance at a specific wavelength (λ_max) and applying the Beer-Lambert law. Purity can be assessed by examining the overall absorption spectrum for unexpected peaks.
2. Materials and Research Reagent Solutions:
| Reagent/Material | Function in the Protocol |
|---|---|
| Drug Substance (Analyte) | The active pharmaceutical ingredient (API) to be quantified. |
| High-Purity Solvent (e.g., Buffer) | Dissolves the analyte without interfering with its absorption spectrum. |
| Volumetric Flasks | For precise preparation and dilution of standard and sample solutions. |
| Quartz Cuvettes | Holds the sample solution; quartz is transparent to UV light. |
| UV-Vis Spectrophotometer | Instrument used to measure the absorbance of the solutions. |
3. Methodology:
- Step 1: Preparation of Standard Solutions. Accurately prepare a series of standard solutions with known, increasing concentrations of the drug substance using the high-purity solvent.
- Step 2: Spectral Scan. Perform a preliminary scan (e.g., from 200 nm to 400 nm) of an intermediate standard solution to identify the wavelength of maximum absorption (λ_max).
- Step 3: Calibration Curve. Measure the absorbance of each standard solution at the predetermined λ_max. Plot absorbance versus concentration to create a calibration curve, which should be linear.
- Step 4: Sample Measurement. Prepare the unknown sample solution and measure its absorbance at the same λ_max.
- Step 5: Quantification and Purity Check. Calculate the concentration of the unknown sample from the calibration curve. Examine the full spectrum of the sample solution and compare it to a standard spectrum to check for the presence of absorbing impurities [1] [103].
The Role of Higher-End Techniques like UHRMS
When analytical requirements exceed the capabilities of UV-Vis, Ultra-High-Resolution Mass Spectrometry (UHRMS) becomes indispensable. These techniques are characterized by a resolving power (RP) > 100,000, which is the ability to distinguish between two ions with slightly different mass-to-charge ratios (m/z) [104].
Key UHRMS Technologies and Principles
Two primary technologies dominate the UHRMS field, each with distinct operating principles [104]:
1. Orbitrap Mass Analyzer: Ions are trapped in an electrostatic field where they orbit a central electrode and oscillate axially. The frequency of this oscillation (ω) is inversely proportional to the square root of m/z (ω = √(k/(m/z))). The image current of these oscillations is Fourier-transformed to produce a mass spectrum. Its resolving power increases with longer acquisition times [104].
2. Fourier Transform Ion Cyclotron Resonance (FTICR) Mass Analyzer: Ions are trapped in a powerful magnetic field, causing them to move in a cyclotron motion. The cyclotron frequency (ωc) is inversely proportional to m/z (ωc = B * (q/m)), where B is the magnetic field strength. This technology offers the highest commercially available resolving power and mass accuracy [104].
Detailed Experimental Protocol: Structural Elucidation of a Drug Metabolite
1. Principle: UHRMS is used to determine the exact mass of a molecule and its fragments with extreme precision (often to within a few parts-per-billion). This allows for the confident assignment of elemental compositions and the interpretation of molecular structure.
2. Materials and Research Reagent Solutions:
| Reagent/Material | Function in the Protocol |
|---|---|
| LC-MS Grade Solvents | For high-performance liquid chromatography (HPLC) separation prior to MS to remove matrix interference. |
| Drug Metabolite Sample | The compound of unknown structure, often isolated from a biological matrix. |
| Lock-mass Compound | A reference compound with a known mass, used for internal calibration to achieve ultra-high mass accuracy. |
| UHRMS System (e.g., Orbitrap) | The instrument performing the high-resolution mass analysis and fragmentation. |
3. Methodology:
- Step 1: Sample Introduction and Separation. The complex sample (e.g., blood plasma) is introduced, typically via liquid chromatography (LC), to separate the metabolite of interest from the biological matrix.
- Step 2: High-Resolution Mass Analysis. The effluent from the LC is introduced into the UHRMS, which records the exact mass of the intact molecular ion ([M+H]⺠or [M-H]â»).
- Step 3: Data-Dependent Fragmentation (MS/MS). The molecular ion is isolated and fragmented (e.g., using Higher Energy Collisional Dissociation, HCD). The UHRMS then records the exact masses of the resulting product ions.
- Step 4: Data Interpretation. The exact mass of the molecular ion is used to calculate potential elemental formulas. The exact masses of the product ions are then pieced together like a puzzle to propose a chemical structure for the metabolite, often by comparison to the fragmentation pattern of the parent drug [104].
Decision Framework: UV-Vis vs. Higher-End Techniques
The choice between UV-Vis and a higher-end technique is not a question of which is "better," but which is fit-for-purpose. The following table provides a direct comparison to guide this critical decision.
Technical and Application Comparison
| Parameter | UV-Vis Spectrophotometry | Ultra-High-Resolution MS (Orbitrap/FTICR) |
|---|---|---|
| Analytical Principle | Light absorption | Mass-to-charge (m/z) ratio of ions |
| Primary Information | Absorbance spectrum, concentration | Molecular mass, elemental formula, structure |
| Resolving Power | N/A (spectral bandwidth) | > 100,000 [104] |
| Mass Accuracy | N/A | < 1 ppm (sub-ppm achievable) [104] |
| Quantitative Analysis | Excellent (for single analytes) | Excellent (broad dynamic range) |
| Qualitative Analysis | Limited (chromophore identity) | Superior (definitive formula/ID) |
| Sample Complexity | Low to moderate (can struggle with mixtures) | Very high (especially when coupled with LC) |
| Pharma App: Potency/Purity | Ideal for pure API quantification | Overkill for this specific task |
| Pharma App: Impurity ID | Limited | Ideal for structural elucidation of unknowns |
| Pharma App: Metabolite ID | Not applicable | The gold standard technique |
| Speed of Analysis | Very fast (seconds) | Slower (minutes to hours, including LC) |
| Ease of Use | High | Requires significant expertise |
| Cost | Low initial and operational cost | Very high initial and operational cost [103] |
Strategic Selection Workflow
The following decision pathway synthesizes the comparison above into a logical flow for scientists.
Diagram 2: Analytical Technique Selection Workflow
Within the rigorous and multi-stage process of pharmaceutical research, both UV-Vis spectrophotometry and higher-end techniques like UHRMS have distinct and vital roles. The UV-Vis spectrophotometer, with its fundamental principles of light absorption, remains an indispensable tool for routine quantitative analysis and quality control due to its speed, ease of use, and cost-effectiveness. Its position in the basic instrumentation of any pharmaceutical laboratory is secure.
However, when analytical challenges involve complex mixtures, unknown impurities, or the need for definitive structural information, the superior resolving power and mass accuracy of UHRMS techniques are unmatched. The strategic approach for modern drug development professionals is not to view these techniques as competitors, but as complementary tools. A well-equipped laboratory leverages the efficiency of UV-Vis for high-volume, well-defined tasks and reserves the power of UHRMS for the deep, complex analytical problems that are central to innovation and ensuring drug safety and efficacy.
System Suitability Testing (SST) serves as a critical verification step within the pharmaceutical quality framework, ensuring that analytical methods perform as intended each time they are used. For researchers and scientists utilizing UV-Vis spectrophotometry and other analytical techniques, SST provides demonstrable evidence that the entire analytical system—comprising instruments, reagents, columns, operators, and samples—functions within established parameters for a specific analytical run [106] [107]. This ongoing verification is distinct from, yet complementary to, the one-time process of method validation, which establishes the fundamental performance characteristics of an analytical procedure [107]. Within the context of a basic UV-Vis spectrophotometer for pharmaceutical research, SST confirms the instrument's fitness for a specific purpose on the day of analysis, providing assurance that the reliability of data generated for drug development, release, and stability testing is maintained [106].
The regulatory foundation for SST is robust. Major pharmacopeias, including the United States Pharmacopeia (USP) and the European Pharmacopoeia (Ph. Eur.), contain strong recommendations for its performance [106]. Furthermore, regulatory bodies like the FDA emphasize SST's role in ensuring data integrity, and failure to meet SST acceptance criteria can result in the entire analytical run being discarded [106] [107]. For UV-Vis spectroscopy, recent revisions to USP Chapter <857> underscore the principle of "fitness for purpose," requiring that instrument qualification and SST be representative of the actual operating conditions used for analysis [108].
Core Principles: Differentiating SST from Validation and Qualification
A clear understanding of System Suitability Testing requires distinguishing it from two other foundational quality processes: Analytical Method Validation and Analytical Instrument Qualification. These three elements form a hierarchical structure that collectively guarantees data quality.
Analytical Method Validation is a comprehensive, one-time process conducted to prove that an analytical method is suitable for its intended application. It establishes the performance characteristics of the method itself, such as its accuracy, precision, specificity, and linearity, through defined laboratory studies [109] [107] [110].
Analytical Instrument Qualification (AIQ) is the process of ensuring that an instrument is properly installed, functions correctly, and performs according to its specifications. AIQ, structured around Design Qualification (DQ), Installation Qualification (IQ), Operational Qualification (OQ), and Performance Qualification (PQ), is focused on the instrument and forms the foundation for reliable analytical results [106] [110].
System Suitability Testing (SST) is an ongoing, method-specific check performed at the time of analysis. It verifies that the validated method, when run on the qualified instrument, performs acceptably for that specific analytical run [106] [107]. As stated in USP Chapter <1058>, SST "verify(s) that the system will perform in accordance with the criteria set forth in the procedure... at the time of the test" [106].
The relationship between these processes is sequential and interdependent. A qualified instrument (AIQ) is the platform upon which a validated method (Method Validation) is executed, and SST provides the final, real-time assurance that the entire system is operating correctly [110]. The following diagram illustrates this logical relationship and the core purpose of SST.
Key SST Parameters and Acceptance Criteria for UV-Vis Spectrophotometry
For UV-Vis spectrophotometry in pharmaceutical research, System Suitability Testing focuses on parameters that confirm the instrument's photometric and wavelength performance is adequate for the specific method at the time of analysis. The acceptance criteria must be pre-defined and established during method validation [106].
The following table summarizes the core SST parameters, their definitions, and typical acceptance criteria for UV-Vis methods.
Table 1: Key SST Parameters and Acceptance Criteria for UV-Vis Spectrophotometry
| Parameter | Definition & Purpose | Typical Acceptance Criteria |
|---|---|---|
| Absorbance Accuracy | Verifies that the instrument reports the correct absorbance value for a known standard. Ensures quantitative reliability. | Mean of replicate measurements of a Certified Reference Material (CRM) must be within ±0.005 A (for A<1.0) or ±0.005 x A (for A>1.0) of the certified value [111]. |
| Precision/Repeatability | Measures the consistency of replicate measurements of the same standard. Confirms system stability. | Standard deviation of 6 replicate measurements must not exceed 0.5% RSD [111]. |
| Wavelength Accuracy | Confirms that the instrument's wavelength scale is correct. Critical for method specificity. | Measured wavelength of a holmium oxide or other CRM peak does not deviate from certified value by more than ±1 nm [108]. |
| Stray Light | Checks for unwanted light outside the nominal wavelength reaching the detector. Affects absorbance linearity at high values. | Absorbance of a suitable cutoff filter (e.g., KCl solution at 198 nm) exceeds a specified value (e.g., >2.0 A) [108]. |
| Signal-to-Noise Ratio (S/N) | Assesses the sensitivity of the system by comparing the analyte signal to the background noise. | Typically ≥10:1 for quantitation purposes to ensure precise measurement [107]. |
The selection of acceptance criteria must be based on the requirements of the analytical method. For instance, a method quantifying a low-concentration impurity would require stricter S/N criteria than a method for a high-concentration active ingredient [107].
Establishing SST Protocols: Methodologies and Experimental Design
Implementing a robust SST protocol requires careful planning, from selecting appropriate materials to defining the exact testing sequence. The following workflow outlines the key steps involved in establishing and executing SST for a UV-Vis analytical method.
Detailed Experimental Protocol for UV-Vis SST
The following protocol provides a detailed methodology for executing System Suitability Testing on a UV-Vis spectrophotometer, as might be used for the analysis of a drug substance.
Objective: To verify the suitability of the UV-Vis spectrophotometric system immediately prior to the analysis of pharmaceutical samples. Materials and Reagents:
- Certified Reference Material (CRM) for wavelength verification (e.g., Holmium Oxide filter solution).
- Certified Reference Material for absorbance accuracy (e.g., potassium dichromate or neutral density filters traceable to NIST) [108].
- Reference standard of the analyte of interest.
- Appropriate solvents (HPLC grade or better) and mobile phase if applicable.
- Volumetric flasks, pipettes, and cuvettes (quartz for UV).
Procedure:
- System Setup and Stabilization: Power on the UV-Vis spectrophotometer and allow the lamp to warm up for the time specified by the manufacturer (typically 30 minutes). Ensure the instrument has a current and valid Qualification (OQ/PQ) status.
- Wavelength Accuracy Verification:
- Scan the holmium oxide CRM over the required wavelength range (e.g., 240-350 nm).
- Record the observed peak maxima for characteristic peaks (e.g., 241.0 nm, 287.5 nm, 361.5 nm).
- Calculation: Determine the difference between the observed wavelength and the certified value for each peak. All deviations must be within ±1 nm [108].
- Absorbance Accuracy Verification:
- Measure the absorbance of the absorbance CRM at its specified wavelength (e.g., potassium dichromate at 235 nm, 257 nm, 313 nm, and 350 nm).
- Repeat this measurement six (6) times without replacing the cuvette.
- Calculation: Calculate the mean absorbance of the six replicates. The mean must be within the certified value ± the combined uncertainty of the CRM and the instrument's specification [111] [108].
- Method-Specific SST (Precision and S/N):
- Prepare a solution of the reference standard at the concentration specified in the analytical method.
- Measure the absorbance of this solution six (6) times.
- Calculation:
- Calculate the Relative Standard Deviation (RSD%) of the six absorbance values. The RSD must not exceed the pre-defined limit (e.g., 1.0-2.0%).
- From a single absorbance measurement, select a blank region of the baseline and calculate the Signal-to-Noise Ratio (S/N). The S/N for the standard must meet or exceed the required limit (e.g., ≥10:1).
- Documentation and Acceptance: Record all raw data, calculations, and results. The system is deemed suitable only if all parameters meet their pre-defined acceptance criteria. If any parameter fails, sample analysis must not proceed until the root cause is investigated and resolved [106] [107].
The Scientist's Toolkit: Essential Reagents and Materials
Successful and compliant SST relies on the use of properly characterized materials. The following table details key research reagent solutions and their functions in system suitability.
Table 2: Essential Reagents and Materials for SST
| Item | Function in SST | Critical Attributes & Notes |
|---|---|---|
| Certified Reference Materials (CRMs) | To provide traceable, unambiguous verification of wavelength and absorbance accuracy with a known uncertainty budget. | Must be obtained from an accredited source (e.g., ISO 17034) [108]. CRMs are preferred over lab-prepared solutions for regulatory compliance [108]. |
| Primary Reference Standard | The highly pure, characterized substance used to prepare the method-specific SST solution for precision testing. | Must be qualified against a pharmacopeial standard if available. Should not originate from the same batch as test samples [106]. |
| High-Purity Solvents | To dissolve reference standards and samples without introducing interference or contamination. | Must be of appropriate grade (e.g., HPLC grade) and be transparent in the spectral region of interest. |
| Quartz Cuvettes | To hold samples and standards for analysis in the UV range. | Plastic and glass cuvettes are not suitable for UV measurements due to their inherent absorbance [1]. Pathlength must be known and appropriate (e.g., 1 cm). |
Regulatory Framework and Compliance
Adherence to regulatory guidelines is paramount in pharmaceutical analysis. System Suitability Testing is explicitly required by major pharmacopeias and regulatory bodies.
- USP (United States Pharmacopeia): General chapter <621> provides requirements for chromatographic systems, and the principles apply broadly. USP <1058> on Analytical Instrument Qualification defines SST's role in the quality system [106] [110]. USP <857> provides updated, mandatory procedures for UV-Vis spectroscopy, emphasizing "fitness for purpose" and the use of CRMs [108].
- ICH (International Council for Harmonisation): ICH Q2(R1) guideline, "Validation of Analytical Procedures," is the international standard for method validation, which provides the foundation upon which SST is built [109].
- FDA (Food and Drug Administration): FDA warning letters have been issued for failures related to SST, underscoring its importance. The FDA requires data-based proof of identity, potency, quality, and purity, which SST helps to ensure [106] [109].
A critical compliance aspect is data integrity. Documentation of SST results must be complete and contemporaneous, including instrument identification, timestamps, analyst information, and all raw data supporting the pass/fail decision [107]. Any deviation from acceptance criteria must be investigated, and no results from failed runs should be reported other than the failure itself [106].
System Suitability Testing is a non-negotiable element of the pharmaceutical quality system, acting as the final guardian of data reliability for each analytical run. For scientists using UV-Vis spectrophotometry, implementing well-defined SST protocols based on method-specific parameters and rigorous acceptance criteria is essential. By systematically verifying absorbance accuracy, precision, wavelength accuracy, and other critical parameters before sample analysis, SST provides the real-time assurance that both the instrument and the method remain fit for their intended purpose. This practice, grounded in regulatory guidance and supported by traceable reference materials, is fundamental to ensuring the safety, efficacy, and quality of pharmaceutical products, from early research through to commercial release.
Conclusion
UV-Vis spectrophotometry remains an indispensable, cost-effective, and versatile tool in the pharmaceutical scientist's arsenal, vital for everything from early-stage API development to final product quality control. Mastering its instrumentation, from foundational principles to advanced troubleshooting, is key to generating reliable, compliant data. As the industry evolves, the integration of UV-Vis with automation, sophisticated software, and cloud-based data management will further enhance its utility. Its validated role, even when compared to more complex techniques like HPLC, ensures that UV-Vis spectrophotometry will continue to be a cornerstone of efficient and rigorous pharmaceutical analysis, directly supporting the delivery of safe and effective medicines to patients.
References
- 1. UV-Vis Spectroscopy: Principle, Strengths and Limitations ... [https://www.technologynetworks.com/analysis/articles/uv-vis-spectroscopy-principle-strengths-and-limitations-and-applications-349865]
- 2. Visible Spectroscopy: UV , Methods & Applications Principles [https://www.vedantu.com/chemistry/uv-visible-spectroscopy]
- 3. UV Spectrophotometry as a Pharmaceutical Testing Solution [https://www.hunterlab.com/blog/uv-spectrophotometry-as-a-pharmaceutical-testing-solution/]
- 4. UV-Vis Spectrophotometer Applications [https://www.thermofisher.com/us/en/home/industrial/spectroscopy-elemental-isotope-analysis/molecular-spectroscopy/uv-vis-spectrophotometry/applications.html]
- 5. –visible spectroscopy - Wikipedia Ultraviolet [https://en.wikipedia.org/wiki/Ultraviolet%E2%80%93visible_spectroscopy]
- 6. Video: UV – Vis Spectroscopy: Beer – Lambert Law [https://www.jove.com/science-education/v/12290/uvvis-spectroscopy-beerlambert-law]
- 7. Beer-Lambert Law | Transmittance & Absorbance [https://www.edinst.com/resource/the-beer-lambert-law/]
- 8. The Beer-Lambert Law [https://chem.libretexts.org/Bookshelves/Physical_and_Theoretical_Chemistry_Textbook_Maps/Supplemental_Modules_(Physical_and_Theoretical_Chemistry)/Spectroscopy/Electronic_Spectroscopy/Electronic_Spectroscopy_Basics/The_Beer-Lambert_Law]
- 9. - UV Spectroscopy | Algor Cards Vis [https://cards.algoreducation.com/en/content/QNDfva9p/uv-vis-spectroscopy-beer-lambert-law]
- 10. Understanding the Limits of the Bouguer-Beer-Lambert Law [https://www.spectroscopyonline.com/view/understanding-the-limits-of-the-bouguer-beer-lambert-law]
- 11. UV-Vis Spectroscopy: Principle, Parts, Uses, Limitations [https://microbenotes.com/uv-vis-spectroscopy/]
- 12. å„å¼å…‰æº-ä½ä¿¡ç§‘技ProTrusTech [https://www.protrustech.com.tw/uv-visible-led-1562119581.html]
- 13. Ultraviolet Detectors: Perspectives, Principles, and Practices [https://www.chromatographyonline.com/view/ultraviolet-detectors-perspectives-principles-and-practices]
- 14. What is a UV-Vis Spectrophotometer? [https://www.denovix.com/what-is-a-uv-vis-spectrophotometer/]
- 15. Characteristics of UV-VIS Spectrophotometric detectors [https://lab-training.com/characteristics-of-uv-vis-spectrophotometric-detectors/]
- 16. single and double-beam UV-Visible spectrophotometers. ... [https://www.drawellanalytical.com/the-difference-between-single-and-double-beam-uv-visible-spectrophotometers/]
- 17. Single Beam and Double Beam Spectrophotometers [https://www.drawellanalytical.com/single-beam-and-double-beam-spectrophotometers-how-to-choose/]
- 18. Pharmaceutical Standards for UV-Vis Spectrophotometers [https://www.azom.com/article.aspx?ArticleID=19393]
- 19. What's the Difference Between Single and Dual Beam ... [https://sperdirect.com/blogs/news/whats-the-difference-between-single-and-dual-beam-spectrophotometers?srsltid=AfmBOorCux-E3mIvj4w_wBJUxYbUQsHvjH285ExqN2TucTHAHjIvHrGb]
- 20. Single vs Double Beam Spectrophotometers: Key Differences [https://aelabgroup.com/single-vs-double-beam-spectrophotometers-key-differences/]
- 21. Single Beam vs. Double Beam Spectrophotometer [https://www.hunterlab.com/blog/single-beam-vs-double-beam-spectrophotometer/]
- 22. Spectroscopy Applications Selection Guide [https://www.coleparmer.com/tech-article/spectroscopy-selection-guide]
- 23. Spectroscopic Methods in Pharma QA/QC: UV-Vis, IR, and ... [https://www.labmanager.com/spectroscopic-methods-in-pharma-qa-qc-uv-vis-ir-and-nmr-applications-34005]
- 24. An Enhanced Approach to Analytical Instrument and ... [https://www.spectroscopyonline.com/view/an-enhanced-approach-to-analytical-instrument-and-system-qualification]
- 25. Calibration of UV / Visible Spectrophotometer [https://pharmatimesofficial.com/project/calibration-of-uv-visible-spectrophotometer/]
- 26. Best UV-Vis Spectrophotometer for Precision Lab Analysis ... [https://www.accio.com/business/best-uv-vis-spectrophotometer]
- 27. UV/Vis/NIR Spectrophotometer [https://mcpf.hkust-gz.edu.cn/2025/03/06/uv-vis-nir-spectrophotometer/]
- 28. UV Spectrophotometer [https://www.labcompare.com/Spectroscopy/108-UV-Spectrophotometer/]
- 29. 4.4: UV-Visible Spectroscopy [https://chem.libretexts.org/Bookshelves/Analytical_Chemistry/Physical_Methods_in_Chemistry_and_Nano_Science_(Barron)/04%3A_Chemical_Speciation/4.04%3A_UV-Visible_Spectroscopy]
- 30. Cuvette Sample Holders [https://www.avantes.com/products/accessories/cuvette-sample-holders/]
- 31. Liquid Cell Holders for UV-Vis & UV-Vis-NIR [https://www.agilent.com/en/product/molecular-spectroscopy/uv-vis-uv-vis-nir-spectroscopy/uv-vis-uv-vis-nir-accessories/uv-vis-nir-liquid-cell-holders?srsltid=AfmBOopFgcb8tYJynycW7S3Qjc86vf3SHo_2LZCMjDmxU8SFyYzbO9d-]
- 32. Using UV-Vis Spectrophotometry In Drug Stability Testing ... [https://www.hunterlab.com/blog/using-uv-vis-spectrophotometry-in-drug-stability-testing-can-predict-commercial-viability/]
- 33. UV-Visible Spectroscopy [https://www2.chemistry.msu.edu/faculty/reusch/virttxtjml/spectrpy/uv-vis/spectrum.htm]
- 34. Development and Validation of an in-line API ... [https://pmc.ncbi.nlm.nih.gov/articles/PMC7076712/]
- 35. USP-Compliant UV-Vis Drug Purity Testing [https://eureka.patsnap.com/article/pharmaceutical-qa-usp-compliant-uv-vis-drug-purity-testing]
- 36. Predicting Degradation Related Impurities and ... [https://pmc.ncbi.nlm.nih.gov/articles/PMC3909161/]
- 37. Chemometrics-Assisted UV-Vis Spectrophotometry for ... [https://journal.ugm.ac.id/ijc/article/view/74329/0]
- 38. Universal quantification method of degradation impurities ... [https://www.sciencedirect.com/science/article/abs/pii/S0731708519331644]
- 39. SOP for Analysis on UV- Visible Spectrophotometer [https://www.pharmaguideline.com/2011/01/sop-for-operation-of-uv-visible.html]
- 40. From Detection to Imaging: UV Spectroscopy for Dissolution in Pharmaceutical Development | American Pharmaceutical Review - The Review of American Pharmaceutical Business & Technology [https://www.americanpharmaceuticalreview.com/Featured-Articles/177714-From-Detection-to-Imaging-UV-Spectroscopy-for-Dissolution-in-Pharmaceutical-Development/]
- 41. What is dissolution testing? [https://www.pion-inc.com/blog/what-is-in-vitro-dissolution-testing]
- 42. Comparative Studies on the Dissolution Profiles of Oral Ibuprofen Suspension and Commercial Tablets using Biopharmaceutical Classification System Criteria - PMC [https://pmc.ncbi.nlm.nih.gov/articles/PMC3630726/]
- 43. UV Spectroscopy Gains Use in Dissolution Testing | Pharmaceutical Technology [https://www.pharmtech.com/view/uv-spectroscopy-gains-use-dissolution-testing]
- 44. Developing and Validating Dissolution Procedures | LCGC International [https://www.chromatographyonline.com/view/developing-and-validating-dissolution-procedures-0]
- 45. Raw material identification and verification simplified. [https://www.chemicalindustryjournal.co.uk/raw-material-identification-and-verification-simplified]
- 46. Quality Control Testing Requirements of Finished Products [https://www.gmpsop.com/quality-control-testing-requirements-of-finished-products/]
- 47. Analytical Methodology: Validation, Verification, or ... [https://vicihealthsciences.com/analytical-methodology-validation-verification-qualification/]
- 48. A mobile microvolume UV/visible light spectrophotometer for ... [https://pmc.ncbi.nlm.nih.gov/articles/PMC7816168/]
- 49. How to Use Microvolume Spectrophotometers for Efficient ... [https://www.drawellanalytical.com/how-to-use-microvolume-spectrophotometers-for-efficient-biological-sample-analysis/]
- 50. Kinetic Studies of Fenton Oxidation Reaction by UV-VIS ... [http://article.sapub.org/10.5923.j.jlce.20180605.01.html]
- 51. Pharmacopeia: EP, USP and JP [https://apg-pharma.com/knowledge-base/guidelines/pharmacopeia-ep-usp-and-jp]
- 52. What is a USP Monograph [https://www.usp.org/about/public-policy/overview-of-monographs]
- 53. UV-Vis Spectrometer (Spectrophotometer) [https://www.archivemarketresearch.com/reports/uv-vis-spectrometer-spectrophotometer-433255]
- 54. Pharmacopeial Discussion Group (PDG) Working ... [https://www.usp.org/harmonized-standards/pdg-working-procedures]
- 55. UV Spectroscopy Market Size & Share Analysis [https://www.mordorintelligence.com/industry-reports/uv-spectroscopy-market]
- 56. Development and validation of UV-Visible ... [https://pmc.ncbi.nlm.nih.gov/articles/PMC3658078/]
- 57. 2025 Review of Spectroscopic Instrumentation [https://www.spectroscopyonline.com/view/2025-review-of-spectroscopic-instrumentation]
- 58. Common Challenges in UV-Vis Spectroscopy and How to ... [https://www.herald-dispatch.com/sponsored/common-challenges-in-uv-vis-spectroscopy-and-how-to-overcome-them/article_8d766c72-da65-11ef-a1f7-4ff0689d93a1.html]
- 59. Correcting Ultraviolet-Visible Spectra for Baseline Artifacts [https://www.sciencedirect.com/science/article/pii/S0022354923003350]
- 60. Sources of Error in UV-Vis Spectroscopy [https://www.ossila.com/pages/sources-of-error-uv-vis-spectroscopy]
- 61. Instrument Validation and Inspection Methods [https://www.ssi.shimadzu.com/service-support/technical-support/analysis-basics/fundamentals-uv/validation.html]
- 62. Errors in Spectrophotometry and Calibration Procedures to ... [https://pmc.ncbi.nlm.nih.gov/articles/PMC5293527/]
- 63. 20 Common Problems for Spectrophotometers [https://www.hinotek.com/20-common-problems-and-solutions-for-uv-vis-spectrophotometers/]
- 64. Spectrophotometer Selection and Troubleshooting [https://sperdirect.com/blogs/news/spectrophotometer-selection-and-troubleshooting-a-practical-guide?srsltid=AfmBOop4dYnMzlIyjp5kf-P3sQH5nlYmhju1tYK748kUePVCMgt5L3MT]
- 65. Fluctuations in readings when using the UV-Vis Calibration ... [https://www.mtc-usa.com/kb-article/aa-01360]
- 66. Maintenance of UV-VIS Spectrophotometer & PM Kit [https://nexusanalyticals.com/maintenance-of-uv-vis-spectrophotometer-pm-kit/]
- 67. (UV) Replacing the Light Source - UV-1800/1900 series [https://shimadzu5270.zendesk.com/hc/en-gb/articles/11143360950813--UV-Replacing-the-Light-Source-UV-1800-1900-series]
- 68. Spectrophotometer Measurement Errors [https://aelabgroup.com/spectrophotometer-measurement-error/]
- 69. Contamination Detection in Pharma Products Market 2025 ... [https://www.towardshealthcare.com/insights/contamination-detection-in-pharma-products-market-sizing]
- 70. Contamination Detection in Pharmaceutical Products Market [https://www.globenewswire.com/news-release/2025/10/30/3177319/0/en/Contamination-Detection-in-Pharmaceutical-Products-Market-In-Depth-Insights-from-Towards-Healthcare.html]
- 71. Effectively Using Contamination Control Strategies [https://www.pharmtech.com/view/effectively-using-contamination-control-strategies]
- 72. EU GMP Annex 1: Best Practices in Contamination Control [https://www.westpharma.com/blog/2025/june/eu-gmp-annex-1-contamination-control-guidelines?srsltid=AfmBOoqEAyvc4BPLgGZ2pVKsx_hBGwthLMhlmRHhRX49Nz-f-srOFibg]
- 73. Quartz Cuvette: Complete & Essential Guide for ... [https://qvarz.com/quartz-cuvette/?srsltid=AfmBOor6v5CT4gv75LQfM-q3N5V24MHrtLIwDozD5r7ETD4gZ3zavzjg]
- 74. In-line UV Spectrometry Monitoring in Cleaning Validation [https://www.pharmtech.com/view/in-line-uv-spectrometry-monitoring-in-cleaning-validation]
- 75. Improvements in deep UV fluorescence devices for ... [https://www.europeanpharmaceuticalreview.com/article/136362/recent-improvements-in-deep-ultra-violet-fluorescence-devices-for-cleaning-verification/]
- 76. New Sample Preparation Products and Accessories for ... [https://www.chromatographyonline.com/view/new-sample-preparation-products-and-accessories-for-2024-2025]
- 77. Ultraviolet-Visible Spectroscopy Global Market Report 2025 [https://www.thebusinessresearchcompany.com/report/ultravioletvisible-spectroscopy-global-market-report]
- 78. Effects of temperature and solvent polarity on the ... [https://www.sciencedirect.com/science/article/abs/pii/S0167732224012315]
- 79. Investigating the effects of solvent polarity and temperature ... [https://pmc.ncbi.nlm.nih.gov/articles/PMC11267253/]
- 80. The Influence and Compensation of Environmental Factors ... [https://www.mdpi.com/2076-3417/15/4/1694]
- 81. How to Calibrate a Spectrophotometer: A Step-by-Step Guide [https://www.hinotek.com/how-to-calibrate-a-spectrophotometer-a-step-by-step-guide-for-accurate-scientific-measurements/]
- 82. Instrument calibration procedure for pharmaceutical industry [https://www.gmpsop.com/instrument-calibration-procedure/]
- 83. How Annual Calibration Saves Money & Prevents Downtime [https://www.pteinc.com/annual-calibration-saves-money-prevents-downtime/]
- 84. SOP for Calibration of UV-Vis Spectrophotometer [https://www.pharmaguideline.com/2011/02/sop-for-calibration-of-uv-vis.html]
- 85. Calibrate a Spectrophotometer: The Complete Guide [https://qualitest.us/blogs/insight/how-to-calibrate-spectrophotometer?srsltid=AfmBOorMbNWxwhcQqE3MRWKASEQ1kMvKxSyV18jmNnmjqvS6Porzs5Hu]
- 86. Preventative Maintenance Contracts [https://www.spectro.com/support/why-spectro/maintenance-contracts]
- 87. Correcting Baseline Drift in UV-Vis Spectrophotometers [https://eureka.patsnap.com/article/correcting-baseline-drift-in-uv-vis-spectrophotometers]
- 88. Top 10 Mistakes to Avoid in UV-Vis Spectrophotometry [https://labindia-analytical.com/Blog_detail/view/Top-10-Mistakes-to-Avoid-in-UV-Vis-Spectrophotometry?srsltid=AfmBOoqoGx-UvYn7K9wKc9CRqnhq_VtcN9cMrn0FTtPdjicgNoLLYrOH]
- 89. Spectrophotometer Selection and Troubleshooting [https://sperdirect.com/blogs/news/spectrophotometer-selection-and-troubleshooting-a-practical-guide?srsltid=AfmBOop2bmfasuoGY2--MJ2Q9NdytjnDkJfPYq0YcHsZ0dVu0vZCZ4o2]
- 90. UV-Vis Spectrophotometer: Essential Tool [https://www.pion-inc.com/blog/what-is-a-uv-vis-spectrophotometer]
- 91. Analytical Methods: A Statistical Perspective on the ICH ... [https://www.biopharminternational.com/view/analytical-methods-statistical-perspective-ich-q2a-and-q2b-guidelines-validation-analytical-methods]
- 92. Development and validation of the UV-spectrophotometric ... [https://pmc.ncbi.nlm.nih.gov/articles/PMC3658052/]
- 93. Validation of UV-Vis spectrophotometric colorimetric ... [https://pubmed.ncbi.nlm.nih.gov/40366746/]
- 94. What Is the Principle of UV-Vis Spectroscopy and Why It ... [https://connect.ssllc.com/learning-center/principle-of-uv-vis-spectroscopy/]
- 95. Analysis of Two Active Pharmaceutical Ingredients (API) ... [https://www.americanpharmaceuticalreview.com/Featured-Articles/239784-Analysis-of-Two-Active-Pharmaceutical-Ingredients-API-Products-Using-UV-Spectrophotometry-with-Multi-Component-Analysis-and-a-Fiber-Optic-Dissolution-Analyzer/]
- 96. The development and validation of an UV-Vis ... [https://www.orapuh.org/ojs/index.php/orapj/article/view/e1213]
- 97. In-line UV spectroscopy for the quantification of low-dose ... [https://www.sciencedirect.com/science/article/abs/pii/S000326701830196X]
- 98. Green and white analytical approach for parallel ... [https://www.nature.com/articles/s41598-025-07056-9]
- 99. Comparative Study of UV And HPLC Methods for ... [https://www.ijsrtjournal.com/article/Comparative-Study-of-UV-And-HPLC-Methods-for-Estimation-of-Drug]
- 100. Comparative performance of liquid chromatography and ... [https://www.sciencedirect.com/science/article/pii/S2405844024085827]
- 101. Comparison of high-performance liquid chromatography ... [https://pmc.ncbi.nlm.nih.gov/articles/PMC6425260/]
- 102. Analytical Quality by Design Driven Development and ... [https://pmc.ncbi.nlm.nih.gov/articles/PMC10337025/]
- 103. Advantages of UV-Vis Spectrophotometers [https://www.acttr.com/en/en-faq/en-faq-uv-vis/134-en-faq-uv-vis-advantage-disadvantage.html]
- 104. Advances in Ultra-High-Resolution Mass Spectrometry for ... [https://pmc.ncbi.nlm.nih.gov/articles/PMC10003995/]
- 105. Advantages and Applications of UV-Vis Analysis [https://www.richmondscientific.com/advantages-and-applications-of-uv-vis-analysis?srsltid=AfmBOorr4atmHSPmVUTkhW8BntYZ7oIav00SymUKp78aK4CTX-y86RQv]
- 106. What are system suitability tests (SST) of analytical methods? [https://mpl.loesungsfabrik.de/en/english-blog/method-validation/sst]
- 107. What Is System Suitability in Method Validation? [https://altabrisagroup.com/system-suitability-in-method-validation/]
- 108. Is Your Spectrophotometer Still “Pharma Compliant� A ... [https://www.spectroscopyonline.com/view/your-spectrophotometer-still-pharma-compliant-review-latest-usp-chapter]
- 109. Best Practices For Successful Method Validation [https://lgmpharma.com/blog/best-practices-for-successful-method-validation/]
- 110. Analytical Method Validation: Back to Basics, Part I [https://www.chromatographyonline.com/view/analytical-method-validation-back-basics-part-i]
- 111. Specifying accuracy and precision criteria for ultraviolet ... [https://www.spectroscopyeurope.com/quality/specifying-accuracy-and-precision-criteria-ultraviolet-spectrometers]