Advanced ICP-MS Methods for Trace Elemental Analysis in Water: From Fundamentals to Cutting-Edge Applications in Biomedical Research
This comprehensive article details the application of Inductively Coupled Plasma Mass Spectrometry (ICP-MS) for trace elemental analysis in diverse water matrices, from drinking to seawater.
Advanced ICP-MS Methods for Trace Elemental Analysis in Water: From Fundamentals to Cutting-Edge Applications in Biomedical Research
Abstract
This comprehensive article details the application of Inductively Coupled Plasma Mass Spectrometry (ICP-MS) for trace elemental analysis in diverse water matrices, from drinking to seawater. It explores foundational principles, advanced methodologies for complex samples like seawater and nanoparticles, and robust troubleshooting for matrix effects and spectral interferences. Aimed at researchers and drug development professionals, the content also covers rigorous method validation and comparative technique analysis, providing a complete guide for ensuring data quality in regulatory and research settings.
Core Principles and Scope: Understanding ICP-MS for Water Analysis
Inductively Coupled Plasma Mass Spectrometry (ICP-MS) has become a dominant technique for ultra-trace elemental analysis, with single quadrupole systems comprising approximately 80% of the market [1]. This analytical technique combines exceptional detection limits with high sample throughput and the ability to measure elements across a wide concentration range, making it particularly valuable for environmental monitoring [1] [2]. In water research, identifying contamination sources and understanding associated health risks requires precise measurement of toxic metals, isotopes, and metal species at increasingly lower detection limits [3]. The technique's relevance continues to grow as regulations become stricter, requiring parts-per-trillion detection capabilities for contaminants in various water matrices [1].
Fundamental Principles and Instrumentation
The fundamental principle of ICP-MS involves using a high-temperature argon plasma to atomize and ionize a sample, then separating and detecting these ions based on their mass-to-charge ratio (m/z) [2]. This process occurs through six fundamental compartments: the sample introduction system, inductively coupled plasma, interface, ion optics, mass analyser, and detector [2].
Table 1: Key ICP-MS Instrumentation Market Segments and Applications in Environmental Analysis [1]
| Market Segment | Primary Application Focus | Performance Requirements |
|---|---|---|
| Environmental Monitoring | Drinking water, groundwater, wastewater analysis | Low ppt detection limits, high throughput |
| Geochemical | Water-rock interactions, aquifer characterization | Isotopic analysis, multi-element capability |
| Pharmaceutical | Process water, product purity | Regulatory compliance, robust validation |
| Research & Academic | Emerging contaminants, method development | Versatility, advanced interference removal |
The commercial ICP-MS landscape has evolved significantly since the technique was first introduced in 1983, with current installations including single quadrupole systems, triple/multi quads, time-of-flight (TOF), and magnetic sector instruments [1]. This diversity of instrumentation allows researchers to select the most appropriate technology for their specific water analysis needs, whether for routine compliance monitoring or advanced research into elemental speciation and isotopic fingerprints.
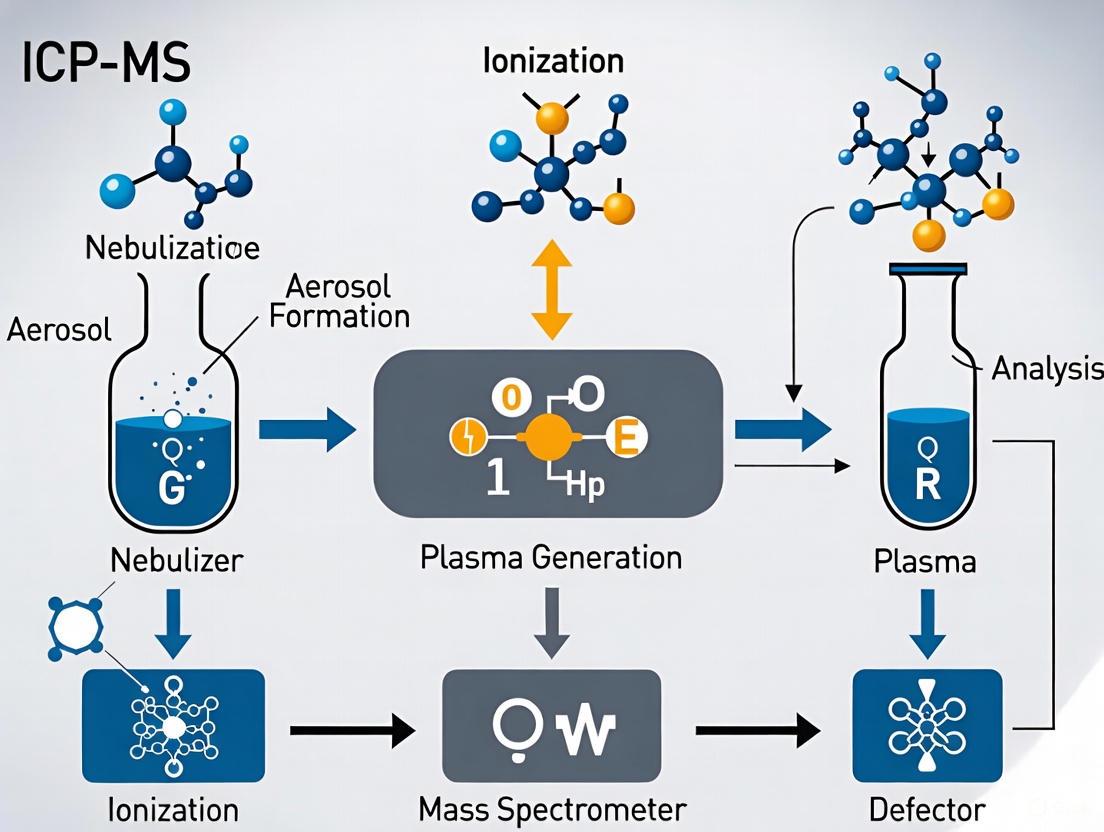
The ICP-MS Workflow: From Sample to Signal
The analytical process in ICP-MS follows a defined pathway that transforms liquid samples into quantitative elemental data. The diagram below illustrates this complete workflow:
Liquid samples are first converted into a fine aerosol by a nebulizer [2]. Pneumatic nebulizers are most common for routine water analysis, with different designs offering specific advantages:
- Concentric nebulizers: Ideal for clean water matrices with low total dissolved solids (<0.2% recommended) [2]
- Cross-flow and V-groove nebulizers: More rugged designs that tolerate higher matrix samples and offer better clogging resistance [1]
The aerosol generated by the nebulizer is then transported to the plasma via a spray chamber that removes larger droplets, ensuring only the finest aerosol reaches the plasma for efficient ionization [2].
Inductively Coupled Plasma and Interface
The argon plasma, sustained by a radiofrequency (RF) electromagnetic field, reaches temperatures of approximately 6000-10000 K—hot enough to atomize and ionize most elements in the periodic table with high efficiency [2]. The interface region consists of consecutive cones (sampler and skimmer) that extract ions from the high-temperature plasma environment into the high-vacuum mass spectrometer region while maintaining robust plasma stability [2].
Key Research Reagent Solutions for Water Analysis
Table 2: Essential Reagents and Materials for ICP-MS Water Analysis
| Reagent/Material | Function | Specification Guidelines |
|---|---|---|
| Nitric Acid (HNO₃) | Sample preservation and digestion | Ultrapure grade (e.g., NORMATOM), typically 1-2% final concentration [4] |
| Certified Reference Materials | Quality control and method validation | Traceable to NIST, appropriate for water matrix (e.g., SLRS-6 River Water) |
| Single-element Stock Solutions | Calibration standards | 1000 mg/L traceable stocks, diluted daily as needed |
| Internal Standard Mix | Correction for matrix effects and instrument drift | Elements not present in samples (e.g., Sc, Ge, In, Lu, Bi) |
| Tuning Solutions | Instrument performance optimization | Contains key elements at 1-10 ppb (e.g., Li, Y, Ce, Tl) |
| Ammonium Hydroxide (NH₄OH) | Alternative diluent for specific elements | Ultrapure grade, useful for elements unstable in acidic conditions [2] |
Advanced Interference Management Strategies
Spectral interferences present significant challenges in ICP-MS analysis of complex water matrices. Common interferences include:
- Polyatomic ions: ArO⁺ on ⁵⁶Fe, ArCl⁺ on ⁷⁵As, which form in the plasma
- Isobaric overlaps: Direct overlap of different isotopes at same m/z (e.g., ⁴⁰Ar on ⁴⁰Ca)
- Doubly charged ions: Especially prevalent with rare earth elements [4]
Collision/Reaction Cell Technology
Modern ICP-MS instruments employ collision-reaction cells (CRCs) to remove interferences before they reach the detector:
- Helium collision mode: Effectively removes many polyatomic interferences through kinetic energy discrimination [4]
- Reaction mode: Uses specific gases (O₂, H₂, NH₃) that react selectively with analyte or interference ions [4]
Table 3: Common Reaction Gases and Their Applications in Water Analysis
| Reaction Gas | Primary Applications | Reaction Mechanism |
|---|---|---|
| Oxygen (O₂) | Analysis of rare earth elements, transition metals | Mass shift to oxide ions (M⁺ + O₂ → MO⁺ + O) [4] |
| Hydrogen (H₂) | Interference removal for As, Se, Fe | Charge transfer or atom transfer reactions [4] |
| Ammonia (NH₃) | Selective removal of various interferences | Cluster ion formation or charge transfer [4] |
The development of triple quadrupole ICP-MS (ICP-MS/MS) in 2012 represented a significant advancement in interference control [4]. By adding a mass filter before the collision-reaction cell, ICP-MS/MS controls which ions can enter the cell, making reaction processes predictable and consistent regardless of sample matrix [4].
Method Development with ICP-MS/MS
For complex water matrices containing multiple potential interferences, product ion scanning provides a systematic approach to method development [4]. This involves:
- Setting the first quadrupole (Q1) to the target analyte mass with 1 u resolution
- Scanning the second quadrupole (Q2) across potential product ion masses
- Comparing spectra from single-element standards versus sample matrix
- Identifying product ions free from spectral overlaps [4]
Experimental Protocol: Trace Element Analysis in Water Matrices
Sample Collection and Preservation
- Collect water samples in pre-cleaned low-density polyethylene or polypropylene containers
- Acidify immediately to pH <2 with ultrapure nitric acid (1-2% final concentration)
- Store at 4°C until analysis, typically within 28 days for most trace elements
Sample Preparation Protocol
- Allow samples to reach room temperature and mix thoroughly by inversion
- Dilute samples 1:10 with 2% HNO₃ containing internal standards (Sc, Ge, In, Lu, Bi at 100 ppb)
- For saline or high-TDS waters, additional dilution (1:20 to 1:50) may be necessary to maintain TDS <0.2%
- Include quality control samples with each batch:
- Method blank (2% HNO₃ with internal standards)
- Continuing calibration verification standard
- Certified reference material (when available)
Instrument Operating Conditions
Table 4: Typical ICP-MS Operating Conditions for Water Analysis
| Parameter | Setting | Purpose/Notes |
|---|---|---|
| RF Power | 1500-1600 W | Plasma stability and efficient ionization |
| Sample Depth | 8-10 mm | Optimizes signal while minimizing interferences |
| Carrier Gas Flow | 0.9-1.1 L/min | Aerosol transport and plasma stability |
| Nebulizer Type | Concentric PFA | For clean water matrices with low TDS |
| Spray Chamber | Quartz double-pass | Removes larger droplets, improves stability |
| Acquisition Mode | Spectrum (peak hopping) | 3 points per peak, 1-3 replicates per sample |
| Dwell Time | 50-100 ms per isotope | Balance between precision and analysis time |
Data Quality Assurance
- Instrument calibration: 5-point curve (0.1, 0.5, 1, 5, 10 ppb) covering expected concentration range
- Internal standard correction: Monitor for signal suppression/enhancement (acceptance: 70-125% recovery)
- Continuing calibration verification: Analyze every 10 samples (acceptance: ±10% of true value)
- Method blanks: Confirm absence of contamination
- Duplicate analysis: Assess precision (acceptance: ±15% RSD)
Application to Water Research
ICP-MS has become indispensable for comprehensive water quality assessment, enabling:
- Regulatory compliance monitoring of toxic elements (Pb, Cd, Hg, As) at increasingly stringent limits [1]
- Source apportionment studies using isotopic fingerprinting techniques [1]
- Speciation analysis when coupled with separation techniques like HPLC, particularly important for elements where toxicity depends on chemical form (e.g., As³⁺ vs. As⁵⁺, Cr³⁺ vs. Cr⁶⁺) [3]
- Emerging contaminant tracking in groundwater and surface water systems [3]
The technique's multi-element capability, combined with low detection limits and high sample throughput, makes it uniquely positioned to address the evolving challenges in water resource management, particularly as regulations require lower detection limits and laboratories face increasing sample volumes [1].
The analysis of trace elements in water is critical for environmental monitoring, public health, and regulatory compliance. However, water matrices present significant analytical challenges due to their complex and variable composition. Complex water matrices such as seawater, groundwater, and industrial effluents contain high levels of dissolved solids, salts, and organic matter that can interfere with accurate trace element detection. Inductively Coupled Plasma Mass Spectrometry (ICP-MS) has emerged as a powerful technique for this application, capable of detecting contaminants at ultra-trace levels (parts per trillion) despite these challenging matrices [5]. This application note details the specific challenges posed by various water matrices and provides optimized ICP-MS protocols to navigate them effectively.
Understanding Water Matrix Complexity
Water samples vary significantly in their composition, which directly impacts the choice of analytical methodology. The key challenges stem from the matrix-induced effects that can compromise analytical accuracy.
Types of Complex Water Matrices
- High-Salinity Water: Seawater and coastal water contain high total dissolved solids (TDS), primarily sodium chloride, which causes severe spectral interferences and signal suppression [6].
- Drinking Water & Bottled Water: While relatively clean, these require exceptional sensitivity to detect regulated heavy metals like lead (Pb) and mercury (Hg) at levels far below regulatory limits [7].
- Groundwater & Geothermal Water: Their composition is heavily influenced by bedrock geology, residence time, and aquifer depth, leading to variable elemental backgrounds [3].
- Industrial & Wastewater: These effluents may contain unpredictable mixes of toxic metals, organic contaminants, and high acid content from sample preservation [1].
Analytical Challenges in Water Analysis
Spectral Interferences
Spectral interferences are a primary concern in ICP-MS analysis of water samples [8].
- Polyatomic Interferences: Argon from the plasma combines with elements from the sample and acids (O, H, N, Cl, S) to form interfering polyatomic ions. For example, (^{40})Ar(^{35})Cl(^+) interferes with the determination of (^{75})As(^+) [8].
- Doubly Charged Ions: Elements with low second ionization potentials (e.g., Barium) form M(^{++}) ions, which interfere with singly charged ions at half their mass [8].
- Isobaric Overlaps: Different elements sharing isotopes of the same mass (e.g., (^{114})Sn and (^{114})Cd) require high-resolution separation or mathematical correction [8].
Non-Spectral Interferences
- Matrix-Induced Signal Suppression: High dissolved solid content can physically suppress analyte signal transmission through space-charge effects, where heavier matrix ions displace analyte ions in the beam [1].
- Instrumental Drift: Long analysis sequences of high-matrix samples can lead to signal drift due to cone orifice deposition and erosion [6].
- Sample Introduction Challenges: Nebulizers and torches are susceptible to clogging when analyzing water with particulates or high salt levels, requiring robust introduction systems [1].
ICP-MS Techniques and Methodologies
ICP-MS Configuration Selection
Different ICP-MS configurations offer specific advantages for overcoming water analysis challenges.
Table 1: ICP-MS Techniques for Water Analysis
| Technique | Key Feature | Best Suited for Water Analysis Challenges |
|---|---|---|
| Single Quadrupole (with CRC) | Collision/Reaction Cell (CRC) | Routine multi-element analysis; interference removal via kinetic energy discrimination (KED) [1] |
| Triple Quadrupole (ICP-MS/MS) | Two mass filters with reaction cell | Highest interference removal for regulated elements (e.g., As, Se) in complex matrices; uses reactive gases [8] |
| Time-of-Flight (ICP-TOF-MS) | Simultaneous full-spectrum acquisition | Analysis of short transient signals (e.g., single particles); untargeted screening [9] |
| Magnetic Sector (HR-ICP-MS) | High mass resolution | Resolving polyatomic overlaps without cell gases; isotope ratio analysis [3] |
Key Methodological Approaches
- Direct Analysis: For clean freshwater, a simple "dilute-and-shoot" approach with internal standardization suffices [10]. Ethanol addition (5% v/v) can enhance sensitivity and stability in some matrices [10].
- Matrix Separation & Pre-concentration: For open-ocean seawater with ultra-trace metal levels, offline chelation and pre-concentration are often necessary to remove the salt matrix and enhance detectability [6].
- Automated In-line Dilution: Systems like the High Throughput System (HTS) enable direct analysis of high-salinity samples (e.g., coastal seawater) by automated dilution, reducing matrix load and minimizing sample preparation [6].
- Laser Ablation (LA-ICP-MS): For suspended particles in water, LA-ICP-MS allows for direct solid analysis, providing information on the elemental composition of individual particles [11].
Experimental Protocols
Protocol 1: Direct Analysis of Coastal Seawater by ICP-MS
This protocol is adapted from a webinar detailing the use of the NexION 2200 ICP-MS for high-salinity matrices [6].
1. Sample Preparation:
- Filter water samples through a 0.45 µm membrane filter to remove suspended particulates.
- Acidify the filtrate to a final concentration of 0.5% (v/v) with ultrapure nitric acid (HNO₃) to stabilize trace metals.
- Internal Standard Addition: Add a mixed internal standard solution (e.g., Sc, Ge, Rh, Ir) to all samples, blanks, and calibrants to a final concentration of 50-100 ppt to correct for instrument drift and matrix suppression.
2. Instrumental Setup:
- ICP-MS System: Configure with an All Matrix Solution (AMS) kit or a high-solids nebulizer and spray chamber.
- Nebulizer: Use a PFA nebulizer resistant to high salt content.
- Operating Parameters:
- RF Power: 1550-1600 W
- Nebulizer Gas Flow: Optimized for robustness (~0.9-1.0 L/min)
- Sample Uptake Rate: ~0.3 mL/min (using a peristaltic pump)
- Data Acquisition: Use the standard (STD) mode for lighter elements (e.g., Li, Al, V, Cr, Mn, Co, Ni, Cu, Zn) and the Collision (KED) mode with He for heavier elements (As, Se, Cd, Pb) to control polyatomic interferences.
3. Calibration and Quality Control:
- Prepare a calibration curve (e.g., 0, 0.1, 0.5, 1, 5, 10 ppt) in a matrix-matching solution (e.g., 0.5% HNO₃ with matching NaCl content).
- Include a continuing calibration verification (CCV) standard every 10-15 samples to ensure calibration stability over a 12-hour run [6].
Protocol 2: Dilute-and-Shoot Analysis of Ready-to-Drink Tea as a Model for Organic-Rich Water
This protocol, based on a study of ready-to-drink tea, is applicable to organic-rich water samples [10].
1. Sample Preparation:
- Dilute the water sample 20-fold with a diluent containing 1.5% (v/v) HNO₃, 0.5% (v/v) HCl, and 5% (v/v) ethanol.
- The ethanol serves to enhance carbon tolerance and signal stability.
2. Matrix Effect Correction:
- Use Matrix Overcompensation Calibration (MOC): Construct a single calibration curve from a standard series prepared in the same diluent and with a similar matrix composition.
- This method was validated against microwave-assisted digestion and standard addition, showing cost and productivity advantages while maintaining accuracy [10].
Workflow Visualization
The following diagram illustrates the general decision-making workflow for selecting the appropriate sample preparation and ICP-MS method based on the water matrix type.
The Scientist's Toolkit: Key Reagent Solutions
Table 2: Essential Research Reagents and Materials for ICP-MS Water Analysis
| Item | Function | Application Notes |
|---|---|---|
| Ultrapure HNO₃ & HCl | Sample acidification; digesting organics | Essential for stabilizing metals and preparing blank/gradient solutions. Purity is critical for low blanks [10]. |
| Internal Standard Mix | Correction for signal drift & matrix effects | A mix of non-interfering, non-sample elements (e.g., Sc, Ge, Y, In, Tb, Bi) covering the mass range [6]. |
| Tune Solution | Instrument performance optimization | Contains key elements (e.g., Li, Mg, Y, Ce, Tl) for optimizing sensitivity, oxide, and doubly charged ion levels [8]. |
| Certified Reference Materials (CRMs) | Method validation & quality control | Estuarine water, river water, or drinking water CRMs are vital for verifying analytical accuracy [12]. |
| Collision/Reaction Gases | Spectral interference removal | High-purity He (for KED), O₂, and H₂ (for reaction modes) are used in collision/reaction cells [8] [5]. |
| Ethanol (Ultrapure) | Matrix modifier | Added (e.g., 5% v/v) to enhance signal stability in organic-rich water matrices [10]. |
Navigating the complex matrices encountered in water analysis requires a strategic combination of sample preparation, modern ICP-MS technology, and robust methodology. The challenges of high salinity, organic content, and ultra-trace detection limits can be effectively managed through techniques such as direct analysis with automated dilution, advanced interference removal using triple quadrupole technology, and rigorous quality control. The protocols and tools outlined herein provide a framework for generating accurate, reliable data essential for environmental monitoring, regulatory compliance, and advancing water research. As the application landscape evolves, the adoption of these best practices will be crucial for laboratories aiming to meet the increasing demands for sensitivity and accuracy in water analysis.
Inductively Coupled Plasma Mass Spectrometry (ICP-MS) has established itself as a cornerstone technique for trace and ultratrace elemental analysis due to its exceptional sensitivity, low detection limits, and capability to handle complex matrices. In the context of water research—encompassing environmental monitoring, public health, and pharmaceutical development—the reliability of data hinges on a robust understanding of three fundamental Key Performance Indicators (KPIs): Sensitivity, Detection Limits, and Selectivity [13] [14]. These KPIs are not independent; they are intrinsically linked parameters that collectively define the performance, reliability, and applicability of an ICP-MS method [13]. This application note provides a detailed examination of these KPIs, supported by experimental protocols and data from water-based research, to guide researchers in developing and validating robust analytical methods.
Theoretical Foundations of KPIs in ICP-MS
The Interplay of Sensitivity and Detection Limits
Sensitivity in ICP-MS is formally defined as the ratio of the net signal (in counts per second, cps) to the concentration of the analyte [13]. In practical terms, it is a measure of the instrument's response to a given amount of an element. Higher sensitivity directly enables the detection of lower analyte concentrations.
The practical limit of this detection is formally expressed as the Limit of Detection (LOD). For ICP-MS, the LOD is most commonly derived as a "3 sigma" value, calculated using the formula: Detection limit = (3 × σbl) / Sensitivity where σbl is the standard deviation of the blank signal (in cps) [13].
This equation clearly demonstrates the direct dependence of the LOD on sensitivity. A higher sensitivity value drives a lower LOD, provided background noise is controlled. The background noise itself (σbl) is a combination of source flicker noise and fundamental counting statistics noise (σcs = √(average number of counts)) [13]. Consequently, maximizing sensitivity and minimizing background are both critical for achieving the lowest possible detection limits.
The Role of Selectivity
Selectivity is the ability of an analytical method to distinguish and quantify the analyte in the presence of interferences. In ICP-MS, interferences are primarily spectral, arising from:
- Isobaric overlaps: Different isotopes of elements sharing the same mass-to-charge ratio (e.g., ⁴⁰Ar on ⁴⁰Ca).
- Polyatomic ions: ions formed from combinations of plasma gases (Ar), sample matrix, and solvents (e.g., ArO⁺ on ⁵⁶Fe, or ClO⁺ on ⁵¹V) [14] [15].
The presence of interferences can artificially inflate the signal at a given mass, leading to inaccurate quantification and effectively degrading method performance, even if sensitivity is high and nominal LODs are low. Therefore, effective interference management is a prerequisite for achieving true selectivity.
Quantitative Performance Data
The following tables summarize typical performance metrics for ICP-MS in trace element analysis, derived from recent research and technical data.
Table 1: Reported ICP-MS Performance in Water and Related Matrices
| Application Context | Analyte | Sensitivity (Mcps/ppm) | Limit of Detection (LOD) | Limit of Quantification (LOQ) | Key Matrix Challenge |
|---|---|---|---|---|---|
| Lebanese Aquatic Environment [16] | Platinum (Pt) | Not Specified | 0.56 ng L⁻¹ | 2.35 ng L⁻¹ | Low environmental concentrations |
| Ultratrace Analysis [17] | Various Metals | Not Specified | Low ppt range (ng L⁻¹) | Not Specified | High-purity water & acids |
| Caustic Potash Analysis [15] | Various Metals | Not Specified | Element-dependent, ppt to ppb | Not Specified | High alkalinity & total dissolved solids |
Table 2: Factors Influencing Isotope-Specific Sensitivity [13]
| Factor | Impact on Sensitivity | Example |
|---|---|---|
| Natural Isotopic Abundance | Directly proportional to signal | ²³²Th (100% abundance) has ~3x higher sensitivity than ¹⁹⁴Pt (32.9% abundance) |
| Ionization Efficiency | Dependent on element's first ionization energy | ²³²Th (~100% ionized) has ~1.6x higher sensitivity than ¹⁹⁴Pt (~62% ionized) |
| Mass Spectrometer Transmission | Typically optimized for mid-mass range; can decrease at extreme masses | Sensitivity may drop for very low (< Li) or very high (> U) masses |
Experimental Protocols for KPI Assessment
This section outlines a detailed methodology for determining Pt in water samples, demonstrating the practical assessment of KPIs.
Method: Determination of Total Platinum in Water
4.1.1 Principle Water samples are filtered and acidified directly. The introduction of the aqueous solution into the ICP-MS plasma results in atomization and ionization of platinum. The ions are separated based on their mass-to-charge ratio, and ¹⁹⁵Pt is monitored to quantify the concentration against a calibrated curve, using an internal standard (e.g., Rhenium, Re) to correct for instrumental drift and matrix effects [16].
4.1.2 Research Reagent Solutions and Materials
Table 3: Essential Reagents and Materials for ICP-MS Analysis of Platinum in Water
| Item | Function / Specification | Critical Notes |
|---|---|---|
| Platinum Standard | Certified single-element solution, 1000 mg L⁻¹ in 2% HNO₃ | Used for calibration curve preparation. |
| Internal Standard (Rhenium) | Certified single-element solution, 1000 mg L⁻¹ | Corrects for signal drift and matrix suppression/enhancement [16]. |
| Nitric Acid (HNO₃) | Trace metal grade, high purity (e.g., ≥65%) | For sample preservation and preparation; minimizes contamination. |
| Ultrapure Water | Resistivity 18.2 MΩ·cm at 25°C, 0.22 µm filtered | Used for all dilutions to prevent contamination [16]. |
| ICP-MS Instrument | e.g., Agilent 7700x Series | Equipped with a collision/reaction cell for interference management. |
| Sample Introduction System | Includes nebulizer, spray chamber, torch | Consumables; regular maintenance is required for stable sensitivity. |
4.1.3 Sample Preparation
- Collection: Collect water samples in pre-cleaned polyethylene or polypropylene bottles.
- Filtration: Filter samples through a 0.45 µm membrane filter to remove suspended particulates.
- Acidification: Acidify the filtered sample with trace metal grade HNO₃ to a final concentration of 2% (v/v) to stabilize the metals and prevent adsorption to container walls.
- Internal Standard Addition: Spike all samples, blanks, and calibration standards with the internal standard (e.g., 1 ng mL⁻¹ Rhenium) [16].
4.1.4 Instrumental Configuration and Data Acquisition An Agilent 7700x ICP-MS was used with the operating parameters summarized below. The instrument was optimized for maximum sensitivity and stability for the high mass range, while monitoring and minimizing oxide formation (CeO⁺/Ce⁺ < 1.5%) [16].
Table 4: Exemplary ICP-MS Operating Conditions [16]
| Parameter | Setting |
|---|---|
| RF Power | 1550 W |
| Plasma Gas Flow | 15 L min⁻¹ |
| Carrier Gas Flow | 0.9 L min⁻¹ |
| Nebulizer | MicroMist |
| Spray Chamber | Peltier-cooled (2°C) |
| Sampling Cone / Skimmer Cone | Ni / Ni |
| Data Acquisition Mode | Spectrum (3 points per peak) |
| Isotopes Monitored | ¹⁹⁵Pt, ¹⁸⁵Re (Internal Standard) |
KPI Validation Procedures
4.2.1 Sensitivity Assessment
- Procedure: Calculate the sensitivity (analytical sensitivity) as the slope of the calibration curve (cps vs. concentration) for platinum in the working range (e.g., 0.01 - 10 ng mL⁻¹) [16]. A typical modern instrument can achieve sensitivities from 10 to 1000 Mcps/ppm in this mass range [13].
4.2.2 Detection and Quantification Limit Determination
- Procedure: According to ICH guidelines, analyze at least 10 independent replicates of a blank solution (2% HNO₃). The LOD and LOQ are calculated as:
4.2.3 Selectivity and Interference Management
- Procedure:
- Spectral Interference Identification: Theoretically identify potential interferences on ¹⁹⁵Pt (e.g., HfO⁺, WO⁺) [16].
- Collision/Reaction Cell (CRC) Technology: Use He gas in the CRC to kinetically energy-discriminate and reduce polyatomic interferences [13] [15].
- Method Specificity: Analyze a spiked sample and a certified reference material (if available) to demonstrate that the measured concentration matches the expected value, confirming the method is free from significant interferences.
Workflow and Logical Relationships
The following diagram illustrates the logical workflow for developing and validating an ICP-MS method, highlighting the interconnected roles of the three KPIs.
ICP-MS Method Development Workflow
This workflow shows that sensitivity is an initial optimization target, which directly feeds into LOD calculations. Selectivity, achieved through interference evaluation, is a parallel and critical process that safeguards the accuracy of the measurements upon which both sensitivity and LOD depend.
Application in Water Research: Case Study
The validated protocol was applied to assess platinum levels in the Lebanese aquatic environment, marking the first such study in the region. The research analyzed rivers, wastewater treatment plants (WWTPs), and untreated sewage outfalls [16].
- Findings: Total platinum concentrations ranged between 22.44 and 53.32 ng L⁻¹. These levels, while low, were all above the baseline concentration indicated by the WHO and are consistent with findings from studies in other countries, suggesting an anthropogenic source [16].
- Role of KPIs: The low LOD (0.56 ng L⁻¹) achieved by the high-sensitivity method was critical for accurately quantifying these low environmental concentrations. The selectivity ensured that the measured signal was unequivocally from platinum and not from spectral overlaps, providing confidence in the reported contamination levels.
Sensitivity, Detection Limits, and Selectivity are interdependent KPIs that form the foundation of any reliable ICP-MS method for trace elemental analysis. As demonstrated in the water research case study, a method that excels in all three areas is capable of producing accurate, precise, and meaningful data at ultratrace concentrations. A rigorous approach to method development and validation, as outlined in this note, is essential for generating data that can inform environmental monitoring, regulatory decisions, and pharmaceutical development.
Advanced Techniques and Real-World Applications in Water Testing
The direct analysis of high-matrix waters, such as seawater and wastewater, for trace elements presents significant analytical challenges for researchers and scientists. These complex matrices contain high levels of dissolved salts and organic matter that can cause severe spectral interferences and physical damage to analytical instrumentation. Inductively Coupled Plasma Mass Spectrometry (ICP-MS) has emerged as a powerful technique for trace metal analysis due to its exceptional sensitivity, selectivity, and multi-element capabilities. However, the accurate determination of trace elements in high-matrix waters requires specialized approaches to overcome matrix effects and interferences.
This application note details robust methodologies for the direct analysis of seawater and wastewater samples using ICP-MS, with a focus on overcoming spectral interferences, managing high total dissolved solids (TDS), and achieving precise quantification at ultratrace levels. The protocols outlined herein provide laboratory professionals with practical solutions for challenging analytical scenarios in environmental monitoring, regulatory compliance, and research applications.
Analytical Challenges in High-Matrix Water Analysis
Spectral Interferences
The complex composition of seawater and wastewater gives rise to numerous polyatomic interferences that overlap with analyte masses of interest. Major matrix elements including chloride, sulfate, sodium, magnesium, and calcium combine with argon, oxygen, nitrogen, and hydrogen from the plasma to form interfering species [18] [19]. Notable examples include:
- 40Ar35Cl+ interference on 75As+
- 23Na40Ar+ interference on 63Cu+
- 23Na35Cl+ interference on 58Ni+
- 16O2+ interference on 32S+
- 14N16O1H+ interference on 31P+
Additionally, isobaric overlaps occur when different elements share the same nominal mass, such as 48Ca on 48Ti and 204Hg on 204Pb [18]. Doubly charged ions from rare earth elements can also cause significant interferences, such as 150Nd2+ and 150Sm2+ overlapping with 75As+ [18].
Physical Instrumentation Effects
High TDS content in seawater and wastewater leads to salt deposition on instrumental components, particularly the sampler and skimmer cones. This deposition narrows orifice diameters, resulting in progressive sensitivity loss and instability [19]. The matrix also causes suppressive effects on analyte ionization in the plasma, reducing sensitivity regardless of spectral interferences. These effects persist even with sample dilution, necessitating specialized matrix management approaches [19].
Low Analyte Concentrations
Trace elements in open-ocean seawater exist at exceptionally low concentrations (often ng L-1 or pg L-1), frequently below the detection limits of conventional ICP-MS methods [6]. This necessitates either pre-concentration strategies or highly sensitive instrumentation with optimized detection capabilities.
Methodological Approaches
ICP-MS/MS with Reaction Cell Gases
The tandem ICP-MS (ICP-MS/MS) configuration provides powerful interference removal capabilities through controlled reaction chemistry in the collision/reaction cell (CRC) [18]. This approach offers significant advantages over single quadrupole instruments:
- Unprecedented interference resolution using controlled reaction chemistry
- Improved separation of adjacent mass overlaps due to two mass filtering steps
- Enhanced detection limits through higher sensitivity and lower backgrounds
Table 1: Comparison of Interference Reduction Modes in ICP-MS/MS
| Mode | Mechanism | Applications | Advantages |
|---|---|---|---|
| Helium Collision Mode (KED) | Kinetic energy discrimination separates polyatomic ions (lower energy) from analyte ions (higher energy) | Default for most analytes; effective for polyatomic interferences like 40Ar35Cl+ on 75As+ | Simple method development; universal for multiple elements; consistent across sample types [18] |
| Reaction Gas Modes | Chemical reactions with cell gas (e.g., O2, NH3, H2) convert analytes or interferences to different masses | Resolving intense spectral overlaps (14N2 on 28Si); isobaric overlaps (48Ca on 48Ti); doubly charged ion interferences [18] | Superior interference removal for specific challenging applications; enables ultratrace analysis |
| Double Mass Selection (MS/MS) | Q1 filters target mass before CRC; Q2 filters product mass after CRC | Peak tail overlaps from adjacent major elements (e.g., trace Mn next to major Fe) | Excellent abundance sensitivity; removes both spectral and matrix-based interferences [18] |
On-Line Pre-concentration and Matrix Elimination
For ultratrace analysis in seawater, on-line pre-concentration systems effectively separate the analytes from the saline matrix while simultaneously concentrating the elements of interest [20] [19]. These systems typically employ chelating resins such as Chelex-100 or Toyopearl AF-Chelate 650M packed into micro-columns incorporated into the sample introduction system.
The general workflow involves:
- Sample loading at controlled pH (typically 5.5-6.5) where trace metals bind to the chelating resin
- Matrix removal by rinsing with ammonium acetate buffer to eliminate seawater matrix elements
- Analyte elution using dilute nitric acid which is then introduced to the ICP-MS for measurement
This approach enables accurate determination of V, Mn, Co, Ni, Cu, Zn, Cd, and Pb in seawater at ng L-1 levels without manual pre-treatment steps [20]. The method has been validated through international laboratory intercomparison programs (QUASIMEME) with excellent accuracy [20].
Direct Analysis with Specialized Instrumentation
Recent instrumental advancements enable more direct analysis of high-matrix waters with minimal sample preparation. Systems such as the NexION 2200 ICP-MS incorporate specialized features including:
- All Matrix Solution (AMS) technology to handle high TDS samples
- High Throughput System (HTS) for improved sample introduction efficiency
- Extended Dynamic Range (EDR) for measuring major and trace elements simultaneously
These systems maintain long-term stability in saltwater matrices and provide ppt-level detection limits without labor-intensive pre-concentration steps [6].
Experimental Protocols
ICP-MS/MS Method Development for Wastewater Analysis
The following six-step procedure provides a systematic approach to method development for ICP-MS/MS analysis of wastewater samples [18]:
Step 1: Fundamental Method Setup
- Optimize plasma conditions to achieve CeO+/Ce+ < 1.5% to ensure efficient matrix decomposition
- Determine appropriate sample dilution factor to manage matrix effects
- Define analyte list and concentration ranges
Step 2: Identify Critical Method Needs
- Review sample composition variability
- Identify analytes affected by spectral overlaps specific to wastewater matrix
- Establish required detection limits based on regulatory or research needs
Step 3: Apply Helium Collision Mode
- Use He collision mode with kinetic energy discrimination as the default for most analytes
- This approach resolves most common polyatomic interferences and supports multi-element analysis
Step 4: Address Remaining Interferences
- For interferences not resolved by He mode (isobaric overlaps, intense spectral interferences), implement reaction gas methods
- Use MS/MS mode for peak tail overlaps from adjacent major elements
Step 5: Select Reaction Gas Conditions
- Consult manufacturer's application notes and published literature for established reaction gas methods
- Utilize method development tools (product ion scans, precursor ion scans) to optimize cell conditions
Step 6: Verify Control of Reaction Products
- Confirm that product ions formed in the CRC do not create new interferences
- Use mass or energy discrimination to prevent transmission of interfering reaction products
On-Line Pre-concentration for Seawater Analysis
This protocol details the determination of trace elements (V, Mn, Co, Ni, Cu, Zn, Cd, Pb) in seawater using on-line pre-concentration with Chelex-100 resin [20]:
Materials and Reagents:
- Chelex-100 resin (100-200 mesh, sodium form)
- High-purity nitric acid (trace metal grade)
- Ammonium acetate buffer (2 M, pH 7.0, purified with Chelex-100)
- Internal standard solution (72Ge, 103Rh, 193Ir)
- Certified seawater reference material (NASS-5 or equivalent) for quality control
Column Preparation:
- Clean Chelex-100 resin by soaking in 5 M HCl overnight, then rinse with 2 M HNO3 and Milli-Q water
- Prepare slurry of 1 g resin in 1 M NH4OH
- Pack borosilicate glass column (50 mm × 3 mm i.d.) with resin slurry using a syringe
- Place glass wool plugs at both ends of the column
- Condition column with 1 M ammonium acetate buffer (pH 7.0)
Instrumental Conditions:
- ICP-MS: Agilent 7500ce with Babington nebulizer
- Sample introduction: Peristaltic pump with standard Tygon PVC tubing
- Column position: Between peristaltic pump and nebulizer
- Two instrumental methods: Pre-concentration and Elution
Table 2: ICP-MS Operating Conditions for On-Line Pre-concentration
| Parameter | Pre-concentration Mode | Elution Mode |
|---|---|---|
| RF Power | 1550 W | 1550 W |
| Nebulizer Gas Flow | 0 L min-1 | ~1.25 L min-1 |
| Makeup Gas Flow | 0.30 L min-1 | ~0.15 L min-1 |
| Collision Gas (He) Flow | 0 L min-1 | ~3.5 L min-1 |
| Integration Time | 0.1 s (193Ir only) | 0.1 s (all analytes) |
Analytical Procedure:
- Mix seawater sample 1:1 with purified 2 M ammonium acetate buffer (final pH 6.1-6.3)
- Load sample onto column for 150 s at 0.8 mL min-1 (pre-concentration mode)
- Rinse column with 0.05 M ammonium acetate for 30 s to remove residual matrix
- Switch to elution mode and elute analytes with 5% HNO3 for 325 s while measuring
- Rinse column with 5% HNO3 for 120 s
- Recondition column with 0.05 M ammonium acetate for 30 s
- Total analysis time: 655 s (11 min) per sample
Calibration and Quantification:
- Prepare standards in certified seawater reference material (NASS-5) with additions of 0, 0.2, 0.5, 1, 2, 5, and 10 μg L-1 of target elements
- Use internal standards (72Ge, 103Rh, 193Ir) to correct for variations
- Calculate concentrations from integrated elution peak areas compared to calibration curve
Direct Analysis of Coastal Seawater
For direct analysis of coastal seawater using the NexION 2200 ICP-MS [6]:
Sample Preparation:
- Filter seawater through 0.45 μm membrane filter
- Acidify to pH 1.8-2.0 with high-purity nitric acid
- Internal standards (Sc, Ge, Rh, Ir, Bi) added on-line
Instrumental Conditions:
- Utilize All Matrix Solution (AMS) to handle high salt content
- Optimize nebulizer gas flows to minimize oxide formation (CeO+/Ce+ < 3%)
- Employ He collision mode to reduce polyatomic interferences
- Set sample depth to ~10 mm for robust plasma conditions
Quality Control:
- Analyze certified reference materials (CASS-6, NASS-7) with each batch
- Monitor internal standard recoveries throughout analysis
- Run continuing calibration verification standards every 10-15 samples
Applications and Case Studies
Platinum Determination in Lebanese Aquatic Environments
A validated ICP-MS method was developed for determining platinum levels in Lebanese rivers, wastewater treatment plants, and coastal sewage outfalls [16]:
Method Validation Parameters:
- Linear range: 0.01-10 ng mL-1
- Limit of detection: 0.56 ng L-1
- Limit of quantification: 2.35 ng L-1
- Precision: <10% RSD
- Accuracy: 85-115% recovery
Sample Analysis:
- 22 water samples collected from various locations
- Total platinum concentrations ranged between 22.44-53.32 ng L-1
- All concentrations exceeded WHO baseline levels for tap water
- Demonstrates applicability for monitoring emerging contaminants in wastewater
Multi-element Determination in Seawater
The on-line pre-concentration method has been successfully applied to determine multiple trace elements in various seawater matrices [20] [19]:
Table 3: Typical Performance Characteristics for Seawater Analysis by On-Line Pre-concentration ICP-MS
| Element | Isotope | LOD (ng L-1) | Recovery (%) | Remarks |
|---|---|---|---|---|
| Vanadium | 51V | 20 | 85-95 | Requires pH optimization |
| Manganese | 55Mn | 5 | 90-100 | |
| Cobalt | 59Co | 3 | 85-95 | |
| Nickel | 60Ni | 10 | 90-100 | |
| Copper | 63Cu | 15 | 85-95 | Often high in coastal seawater |
| Zinc | 66Zn | 20 | 80-90 | Potential contamination issues |
| Cadmium | 111Cd | 2 | 90-100 | |
| Lead | 208Pb | 5 | 85-95 |
The Scientist's Toolkit
Research Reagent Solutions
Table 4: Essential Reagents and Materials for High-Matrix Water Analysis by ICP-MS
| Item | Function | Application Notes |
|---|---|---|
| High-Purity HNO3 | Sample preservation and acidification; elution of metals from chelating resins | Trace metal grade; sub-boiling distilled preferred; essential for low blanks [16] [20] |
| Chelex-100 Resin | Chelating resin for on-line pre-concentration of trace metals | 100-200 mesh size; requires thorough cleaning and conditioning; effective for transition metals [20] |
| Ammonium Acetate Buffer | pH adjustment and matrix removal during pre-concentration | Must be purified with Chelex-100 before use; typically 0.05-2 M, pH 5.5-7.0 [20] |
| Internal Standard Mix | Correction for instrumental drift and matrix effects | Should include elements covering mass range (e.g., Ge, Rh, Ir); added on-line for consistency [20] |
| Certified Reference Materials | Method validation and quality control | Seawaserence materials (NASS, CASS) and wastewater CRMs for accuracy verification [20] |
Workflow Diagrams
Figure 1. Method selection workflow for the analysis of high-matrix waters by ICP-MS, showing the decision pathway based on analytical requirements and sample characteristics.
Figure 2. Operational workflow for online pre-concentration of seawater samples using Chelex-100 resin, showing the sequence of conditioning, sample loading, matrix removal, and analyte elution steps.
The direct analysis of high-matrix waters by ICP-MS requires careful consideration of analytical objectives and sample characteristics to select the most appropriate methodology. ICP-MS/MS with reaction cell gases provides unparalleled interference removal for complex wastewater matrices, while on-line pre-concentration techniques enable ultratrace determination of metals in seawater. The protocols outlined in this application note provide researchers and laboratory professionals with robust methods for challenging analytical scenarios in environmental monitoring and regulatory compliance. Proper method validation using certified reference materials and implementation of quality control measures are essential for generating reliable data at trace concentration levels in these demanding matrices.
Single-Particle ICP-MS (spICP-MS) for Nanoparticle Characterization
Single-particle inductively coupled plasma mass spectrometry (spICP-MS) has emerged as a powerful analytical technique for the characterization of metallic and metal-containing nanoparticles (NPs) in environmental and biological matrices. Within the context of trace elemental analysis in water research, spICP-MS enables the simultaneous determination of nanoparticle size, size distribution, particle number concentration, and dissolved element concentration at environmentally relevant levels. This application note details the fundamental principles, key methodologies, and advanced applications of spICP-MS, with particular emphasis on water quality monitoring and nanoparticle fate assessment in aquatic systems. We present optimized protocols for sample preparation, instrumental analysis, and data interpretation to support researchers in implementing this technique for comprehensive nanoparticle characterization.
The expanding use of engineered nanoparticles in consumer and biomedical products has raised significant concerns regarding their potential accumulation, transformation, and toxicity in aquatic systems [21]. Accurate analytical methods are essential to detect, characterize, and quantify NPs in complex environmental matrices. Inductively coupled plasma mass spectrometry operated in single-particle mode (spICP-MS) has emerged as a leading technique due to its high sensitivity, elemental selectivity, and quantitative capabilities for nanoparticle analysis [21] [22].
The fundamental principle of spICP-MS involves introducing a highly diluted nanoparticle suspension into the plasma discharge, where each particle is atomized and ionized individually. The resulting transient ion signals, or "pulses," correspond to individual particles, with the intensity of each pulse being proportional to the mass of the NP, and the frequency of these pulses being directly related to the particle concentration [21]. By calibrating with defined NP standards and optimizing parameters like sample uptake, transport efficiency, and analysis time, spICP-MS allows for the determination of NP core size (assuming particle composition, density, and shape), size distribution, and particle number concentration [21].
Recent advancements have positioned spICP-MS as an invaluable tool for monitoring inorganic nanoparticles in environmental samples, with particular relevance for water quality assessment [22]. The technique's capability to distinguish between particulate and dissolved metal forms provides crucial information for understanding nanoparticle behavior, transport, and transformation in aquatic environments.
Applications in Water Research and Analysis
spICP-MS has demonstrated significant utility across multiple domains of water research, enabling sophisticated characterization of nanoparticles in complex aqueous matrices.
River Water Monitoring and Microplastic Detection
Automated high-temporal-resolution monitoring of elements in river water represents a breakthrough in understanding element dynamics and detecting pollution events. Recent developments enable fully automated atline ICP-MS measurements of up to 56 elements in river water at high time resolution (e.g., one mixed sample per hour), providing comprehensive datasets for water management and machine learning training [23]. This approach captures fluctuations and sudden changes in concentration, revealing short-term trends and immediate responses to external triggers that would be missed with conventional low-frequency sampling.
For the challenging analysis of microplastics in river waters, spICP-MS methodology has been optimized through sample pre-treatment with 10% nitric acid for 24 hours at room temperature. This treatment effectively removes dissolved and particulate carbonate species, oxidizes natural organic matter and microorganisms, thereby decreasing the high carbon background and improving the accuracy of spICP-MS results for microplastic detection [22].
Analysis of Complex Matrices and Nanoparticle Transformations
The application of spICP-MS extends to characterizing nanoparticle behavior in biologically relevant environments. Studies on food-grade titanium dioxide (E 171) using spICP-MS have revealed that NPs with sizes capable of being adsorbed by the human small intestine can be released into systemic circulation during gastrointestinal digestion [22]. Similarly, the technique has been employed to understand the formation of bimetallic nanoparticle systems, such as platinum-palladium NP clusters, offering rapid and orthogonal characterization of size and size distribution in complex systems [22].
Table 1: Key Applications of spICP-MS in Water and Environmental Research
| Application Area | Analytical Focus | Key Findings | Reference |
|---|---|---|---|
| River Water Monitoring | Multi-element analysis (56 elements) | Automated hourly sampling reveals short-term pollution events and element dynamics | [23] |
| Microplastic Detection | Carbon-based nanoparticles | Acid pre-treatment reduces background signals, enabling microplastic detection | [22] |
| Food & Consumer Safety | Titanium dioxide nanoparticles | NPs bioaccessible during human digestion can enter systemic circulation | [22] |
| Bimetallic NP Systems | Platinum-palladium clusters | Provides rapid characterization of size and distribution in complex alloys | [22] |
| Cosmetic Products | Screening of undeclared NPs | NPs <100 nm found in all facial cosmetics analyzed, not disclosed on labels | [24] |
Experimental Protocols
Sample Preparation for Water Analysis
Proper sample preparation is critical for accurate spICP-MS analysis of water samples. The following protocol is adapted from methods for environmental and consumer product analysis:
Filtration and Pre-treatment:
- Pass water samples through 0.45 μm or 0.22 μm membrane filters to remove large particulates while retaining nanoparticles of interest.
- For carbon-containing nanoparticles (e.g., microplastics), implement a pre-treatment step using 10% nitric acid for 24 hours at room temperature to reduce carbon background signals [22].
- Optimize dilution factors to ensure a particle count rate of 500-5000 particles per minute, preventing particle coincidence (typically 100- to 1000-fold dilution for environmental samples) [21] [24].
Stabilization:
- Add surfactants such as Triton X-100 (final concentration 0.01-0.05%) to prevent nanoparticle agglomeration during analysis [24].
- For biological matrices like urine or blood, utilize a clinical diluent mixture (ammonia, EDTA, 2-propanol, Triton X100, and purified water) to maintain nanoparticle stability [25].
spICP-MS Instrumental Analysis
Instrument Setup and Calibration:
- Utilize triple quadrupole ICP-MS (ICP-QQQ-MS) instruments when possible for their superior interference removal capabilities, though single quadrupole instruments remain viable for many applications [26].
- Optimize instrument parameters as detailed in Table 2. Pay particular attention to dwell time (typically 100 μs) to ensure adequate detection of transient nanoparticle signals.
- Perform size calibration using well-characterized nanoparticle standards (e.g., gold, silver, or platinum NPs) of known size and concentration [24].
- Establish transport efficiency using either particle frequency-based or size-based methods with reference nanomaterials.
Table 2: Typical spICP-MS Operating Conditions Based on Current Literature
| Parameter | Setting | Notes |
|---|---|---|
| RF Power | 1550 W | Optimize for maximum signal-to-noise |
| Nebulizer Gas Flow | 1.0-1.1 L/min | Adjust for stable aerosol generation |
| Dwell Time | 100 μs | Critical for capturing particle events |
| Sample Uptake Rate | 0.3-0.4 mL/min | Ensure consistent flow |
| Data Acquisition Time | 60-100 s | Sufficient for statistical significance |
| Quadrupole Mode | No Gas, He, or O2 | O2 for Ti analysis to address interferences [26] |
| Transport Efficiency | 2-8% | Determine empirically using reference materials |
Data Acquisition and Processing:
- Acquire data in time-resolved analysis mode with minimal dwell time to resolve individual nanoparticle events.
- Set threshold levels (typically 3-5σ above background) to distinguish nanoparticle pulses from background signal.
- Process data using specialized software algorithms that convert pulse intensity to particle mass and diameter based on calibration curves.
- For multi-element nanoparticles, employ time-of-flight (TOF) mass analyzers when available to provide simultaneous detection of multiple elements from individual particles [21] [22].
Quality Control and Validation
Reference Materials:
- Include certified nanoparticle reference materials (e.g., NIST gold nanoparticles) in each analytical batch to verify size and concentration measurements.
- Use internal standards (e.g., platinum NPs) in bandpass mode to correct for matrix effects and instrument drift, particularly for complex samples [22].
Method Validation:
- Determine limits of detection for size (LODsize) and particle number concentration through analysis of procedural blanks.
- Assess accuracy through comparison with orthogonal techniques such as transmission electron microscopy (TEM) or dynamic light scattering (DLS) [26].
- Evaluate precision via replicate analyses and calculate relative standard deviations for size and concentration measurements.
Workflow Visualization
The Scientist's Toolkit: Essential Research Reagents and Materials
Table 3: Essential Research Reagents and Materials for spICP-MS Analysis
| Reagent/Material | Function | Application Notes |
|---|---|---|
| Mixed Cellulose Ester (MCE) Filters | Nanoparticle collection from air/water | Completely soluble during microwave-assisted extraction, improving recovery [26] |
| Gold Nanoparticle Standards | Size and concentration calibration | Available in various sizes (10-100 nm); exceptional stability and minimal interferences [25] |
| Triton X-100 Surfactant | Preventing nanoparticle agglomeration | Used at 0.01-0.05% concentration in sample diluent [24] |
| Nitric Acid (Trace Metal Grade) | Sample preservation and digestion | Essential for carbon background reduction in microplastic analysis [22] |
| Clinical Diluent | Biological sample stabilization | Mixture of ammonia, EDTA, 2-propanol, Triton X100 for blood/urine [25] |
| Sodium Hydroxide | Alkaline extraction medium | Used in microwave-assisted extraction from filters [26] |
| Enzyme Cocktails (Proteinase K, Lipase) | Biological tissue digestion | Enables nanoparticle extraction from complex biological matrices [21] |
Advanced Methodologies and Future Perspectives
The continuing evolution of spICP-MS technology promises enhanced capabilities for nanoparticle characterization in water research. Several advanced methodologies represent the cutting edge of this technique:
Hyphenated Techniques: The combination of spICP-MS with separation methods such as field-flow fractionation (FFF-ICP-MS), hydrodynamic chromatography (HDC-ICP-MS), and capillary electrophoresis (CE-ICP-MS) addresses limitations of standalone spICP-MS for complex samples [21]. These hyphenated approaches provide enhanced insight into particle size distributions, aggregation behavior, and interactions with complex sample matrices.
Laser Ablation spICP-MS: The development of laser ablation spICP-MS (spLA-ICP-MS) enables in situ characterization of nanoparticles in various biological and environmental samples without altering the nature of NPs, opening new possibilities for spatial resolution and minimal sample preparation [21].
Single-Cell ICP-MS: The conceptual extension of spICP-MS to single-cell analysis (SC-ICP-MS) enables detection and quantification of metal content within individual cells, with recent protocols expanding this capability to single cell suspensions from solid tissues [22].
The integration of these advanced methodologies with automated monitoring systems, as demonstrated in river water applications [23], positions spICP-MS as an increasingly powerful tool for understanding nanoparticle fate and transport in aquatic systems, contributing essential data for environmental risk assessment and regulatory decision-making.
The determination of total elemental concentration, while fundamental, is often insufficient for a comprehensive environmental risk assessment of water resources. The toxicity, bioavailability, and environmental mobility of an element are critically dependent on its specific chemical form, or species [27] [28]. For instance, inorganic arsenic (As(III)) is significantly more toxic than its organic forms, and within inorganic species, As(III) is about 60 times more toxic than As(V) [27]. Similarly, the toxicity of chromium depends entirely on its oxidation state, with Cr(VI) being a potent carcinogen and Cr(III) being relatively benign and an essential nutrient.
Hyphenated techniques, which couple high-resolution separation methods with highly sensitive detection, have emerged as the most viable solution for (ultra-)trace elemental speciation analysis [28]. Among these, the coupling of liquid chromatography (LC) or gas chromatography (GC) with inductively coupled plasma mass spectrometry (ICP-MS) has become a cornerstone of modern environmental analysis [29]. This combination leverages the exceptional separation power of chromatography with the unparalleled sensitivity, elemental selectivity, and wide linear dynamic range of ICP-MS, enabling the identification and quantification of individual elemental species in complex matrices like water at trace and ultra-trace levels [30] [31] [29]. This application note details the methodologies and protocols for applying these powerful hyphenated techniques within the context of trace elemental analysis in water research.
ICP-MS as an Element-Selective Detector
Inductively Coupled Plasma Mass Spectrometry (ICP-MS) is a powerful analytical technique in its own right, capable of detecting most elements in the periodic table at trace (parts-per-billion, ppb) and ultra-trace (parts-per-trillion, ppt) concentrations [2] [29]. In an ICP-MS instrument, a liquid sample is nebulized into a fine aerosol and transported into a high-temperature argon plasma (6000–10,000 K), where it is completely atomized and ionized. These resulting ions are then separated and quantified based on their mass-to-charge ratio (m/z) by a mass spectrometer [2] [31].
When used as a chromatographic detector, ICP-MS provides element-specific detection for the eluting species. The high temperature of the plasma breaks down all molecular bonds within the chromatographic effluent, meaning the signal detected for a specific m/z value is directly proportional to the concentration of that element in the eluting species, regardless of its original molecular structure [30] [28]. This feature allows for quantification even without authentic species standards, though standards are required for definitive identification. The technique offers extremely low detection limits, a wide linear dynamic range, and the capability for multi-element monitoring of specific isotopes [30] [29].
Coupling with Separation Techniques
The core principle of hyphenation involves interfacing a separation technique that resolves different chemical species with ICP-MS that detects the element of interest. The choice of separation mechanism depends on the physicochemical properties of the target species.
Liquid Chromatography (LC) with ICP-MS
Liquid Chromatography is the most versatile and widely used separation technique coupled to ICP-MS for elemental speciation, particularly for non-volatile and polar species in water samples [30] [29]. The different modes of LC offer solutions for a broad range of analytes.
- Ion Chromatography (IC): This is the most frequent approach for separating ionic species, such as arsenite (As(III)), arsenate (As(V)), dimethylarsinic acid (DMA), and monomethylarsonic acid (MMA), or different forms of chromium (Cr(III) and Cr(VI)) [29]. Separation is based on the differential electrostatic interaction between the ionic analytes and the charged stationary phase.
- Reversed-Phase Chromatography (RPC): This mode is suitable for less polar, organometallic species. It can be used for the separation of species like tributyltin (TBT) or selenoamino acids by exploiting their hydrophobicity [30] [29]. Ion-pairing agents are often added to the mobile phase to facilitate the retention of ionic species on the non-polar stationary phase.
- Size-Exclusion Chromatography (SEC): SEC separates species based on their molecular size or hydrodynamic volume. It is particularly useful for studying the distribution of elements associated with large biomolecules or humic substances in natural water systems [30].
The interface between LC and ICP-MS is relatively straightforward, typically involving a short piece of capillary tubing that connects the LC column's outlet directly to the ICP-MS nebulizer. A key consideration is ensuring compatibility between the LC mobile phase (flow rate, organic solvent content, buffer composition) and the stable operation of the plasma [30]. High organic solvent loads can destabilize the plasma or lead to carbon deposition on the interface cones, requiring adjustments such as oxygen addition to the plasma gas or the use of a membrane desolvation system [30].
Gas Chromatography (GC) with ICP-MS
Gas Chromatography is the preferred separation technique for volatile species or for compounds that can be derivatized into volatile forms [29]. GC-ICP-MS offers superior chromatographic resolution and high sample introduction efficiency, as the entire analyte is transported to the plasma in a narrow band, leading to exceptional sensitivity [29].
Common applications in water analysis include the determination of:
- Organolead compounds (e.g., trimethyllead)
- Organotin compounds (e.g., monobutyltin, dibutyltin, tributyltin)
- Organomercury compounds (e.g., methylmercury)
- Volatile metal(loid) species (e.g., hydride-forming elements like Se, Sb, As)
For non-volatile species, a derivatization step (e.g., hydride generation, alkylation with sodium tetraethylborate) is required prior to analysis [29]. The interface for GC-ICP-MS typically involves a heated transfer line to prevent the condensation of analytes and is designed to efficiently introduce the gaseous GC effluent into the central channel of the ICP [29].
Other Hyphenated Techniques
- Capillary Electrophoresis (CE) with ICP-MS: CE provides extremely high separation efficiency for ionic species based on their charge-to-size ratio with very low sample consumption. While more challenging to interface due to low flow rates and sample volumes, CE-ICP-MS is a powerful tool for separating charged metal species and metalloproteins [21].
- Field-Flow Fractionation (FFF) with ICP-MS: FFF is an elution-based technique for separating and characterizing macromolecules, colloids, and nanoparticles in the size range of 1 nm to over 1 µm. Coupling with ICP-MS (FFF-ICP-MS) is invaluable for studying the size distribution and elemental composition of natural colloids and engineered nanoparticles in water samples [21].
The following workflow illustrates the logical process for conducting speciation analysis in water samples using hyphenated ICP-MS, from sample collection to data analysis.
Experimental Protocols for Water Analysis
Protocol: Speciation of Arsenic in Drinking Water using IC-ICP-MS
1. Scope and Application: This method is applicable to the determination of arsenite [As(III)], arsenate [As(V)], monomethylarsonic acid (MMA), and dimethylarsinic acid (DMA) in filtered drinking and surface water.
2. Reagents and Standards:
- Mobile Phase: Prepare a carbonate/bicarbonate buffer (e.g., 2.5 mM Na₂CO₃ / 2.5 mM NaHCO₃) using high-purity water (18.2 MΩ·cm). Filter through a 0.45 µm membrane and degass.
- Stock Standard Solutions: 1000 mg/L of As(III), As(V), MMA, and DMA.
- Calibration Standards: Prepare working standards by serial dilution of stock solutions in the mobile phase to cover a concentration range of 0.1 - 10 µg/L.
3. Instrumentation:
- IC System: Equipped with an anion-exchange column (e.g., Dionex IonPac AS7 or equivalent).
- ICP-MS: Equipped with a concentric nebulizer and a Peltier-cooled spray chamber.
4. Procedure: 1. Sample Preparation: Filter water samples through a 0.45 µm syringe filter. Acidification is not recommended as it may alter species distribution. 2. Chromatographic Conditions: * Column: Anion-exchange column (250 x 4 mm) * Mobile Phase: 2.5 mM Na₂CO₃ / 2.5 mM NaHCO₃ * Flow Rate: 1.0 mL/min * Injection Volume: 100 µL 3. ICP-MS Conditions: * Monitored Isotope: ⁷⁵As * RF Power: 1550 W * Carrier Gas Flow: 0.95 L/min * Make-up Gas Flow: 0.15 L/min (optional, to optimize signal stability) 4. Analysis: Inject calibration standards, quality control samples, and unknown water samples.
5. Data Analysis: Quantify species by comparing peak areas of samples to the external calibration curve. Identify species by matching retention times with certified standards.
Protocol: Determination of Methylmercury in Water using GC-ICP-MS
1. Scope and Application: This method describes the determination of low ng/L levels of methylmercury (MeHg⁺) in water samples after derivatization and purge-and-trap pre-concentration.
2. Reagents and Standards:
- Derivatization Reagent: Sodium tetraethylborate (NaBEt₄), 1% (w/v) in water, prepared fresh.
- Acetate Buffer: 2 M, pH 4.5.
- Internal Standard: e.g., enriched ²⁰²Hg-labeled methylmercury for isotope dilution.
- Purge Gas: High-purity helium.
3. Instrumentation:
- GC System: Capillary GC with a programmable temperature vaporization (PTV) injector or a purge-and-trap system.
- ICP-MS: Equipped with a heated transfer line from the GC oven.
- Column: Non-polar or mid-polar capillary GC column (e.g., DB-5, 30 m x 0.25 mm i.d., 0.25 µm film thickness).
4. Procedure: 1. Derivatization: Transfer 100 mL of filtered water sample into a purging vessel. Add acetate buffer to adjust to pH ~4.5. Add 1 mL of 1% NaBEt₄ solution. The reaction: CH₃Hg⁺ + NaBEt₄ → CH₃HgEt + Na⁺. 2. Purge-and-Trap: Purge the vessel with He for 10-15 minutes. The volatile ethylated derivatives are trapped on a Tenax trap at room temperature. 3. Thermal Desorption and GC Analysis: Heat the trap rapidly to transfer the analytes onto the head of the GC column. Use a temperature program to separate the species. 4. ICP-MS Detection: * Monitored Isotope: ⁸²Se (or ⁷⁷Se, ⁷⁸Se with interference correction) * Transfer Line Temperature: 250°C * Dwell Time: 100 ms per isotope
5. Data Analysis: Quantify methylmercury by standard addition or, optimally, by species-specific isotope dilution analysis using the internal standard for highest accuracy [29].
Essential Research Reagent Solutions
The table below lists key reagents and materials essential for successful speciation analysis using hyphenated ICP-MS techniques.
Table 1: Key Research Reagent Solutions for Hyphenated ICP-MS Analysis
| Reagent/Material | Function/Application | Critical Considerations |
|---|---|---|
| High-Purity Acids (HNO₃, HCl) | Sample preservation, mobile phase pH adjustment, cleaning. | Use trace metal grade to minimize blank signals. |
| Chromatography Buffers (Carbonate, phosphate, ammonium nitrate) | Mobile phase for ion-exchange and ion-pair chromatography. | Must be free of target analytes; compatibility with ICP-MS (low salt). |
| Ion-Pairing Reagents (e.g., Tetraalkylammonium salts) | Enable retention of ionic species on reversed-phase columns. | Can contribute to carbon buildup in plasma; may require oxygen addition. |
| Derivatization Reagents (NaBH₄, NaBEt₄) | Convert non-volatile species into volatile hydrides or alkylated derivatives for GC-ICP-MS. | Purity is critical; prepare solutions fresh; reaction conditions (pH) are species-specific. |
| Certified Species Standards | Qualitative and quantitative analysis. | Required for peak identification and calibration; isotope-enriched standards enable isotope dilution. |
| Solid Phase Extraction (SPE) Cartridges | Pre-concentration and matrix clean-up. | Select sorbent chemistry based on target species (e.g., C18, ion-exchange). |
| Anion/Cation Exchange Columns | Separation of ionic species (As, Cr, Se species). | Column selectivity and capacity are key method development parameters. |
Application in Water Research
Hyphenated ICP-MS techniques are fundamental for addressing complex challenges in water research and complying with evolving regulations. The World Health Organization (WHO) has progressively lowered the permissible limit for arsenic in drinking water from 50 µg/L to the current 10 µg/L, underscoring the need for accurate measurement that considers species-specific toxicity [27]. The European Water Framework Directive also explicitly requires the control of specific species of metals like cadmium, lead, mercury, and nickel in water [28].
Key application areas include:
- Toxicity and Risk Assessment: Differentiating between highly toxic inorganic arsenic and less toxic organic forms provides a realistic assessment of health risks, which total elemental analysis would overestimate [27] [28].
- Biogeochemical Cycling: Studying the transformation of elements between species (e.g., methylation of mercury or oxidation of arsenite) is crucial for understanding their environmental fate and behavior in aquatic systems [29].
- Monitoring Regulatory Compliance: Ensuring that water meets safety standards for specific hazardous species, such as Cr(VI) and tributyltin (TBT) [28].
- Nanoparticle Characterization: Techniques like single-particle ICP-MS (spICP-MS) and FFF-ICP-MS are used to detect, size, and quantify engineered nanoparticles in environmental waters, addressing a emerging contaminant of concern [21].
The following table summarizes the applicability of different hyphenated techniques to key elemental species in water research.
Table 2: Hyphenated Technique Selection Guide for Elemental Speciation in Water
| Target Element/Species | Recommended Hyphenated Technique | Key Application in Water Research |
|---|---|---|
| Arsenic (As(III), As(V), MMA, DMA) | IC-ICP-MS | Drinking water risk assessment; study of microbial methylation. |
| Chromium (Cr(III), Cr(VI)) | IC-ICP-MS | Monitoring industrial discharge; assessing corrosion by-products. |
| Selenium (Selenite, Selenate, Selenomethionine) | IC-ICP-MS | Evaluating nutritional vs. toxic levels in agricultural runoff. |
| Mercury (Methylmercury, Inorganic Hg) | GC-ICP-MS / LC-ICP-MS | Studying bioaccumulation of methylmercury in aquatic food webs. |
| Organotin Compounds (MBT, DBT, TBT) | GC-ICP-MS | Monitoring legacy antifouling paint contamination in harbors. |
| Metallic Nanoparticles (Ag, Au, TiO₂ NPs) | spICP-MS / FFF-ICP-MS | Tracking the release and fate of engineered nanomaterials. |
Inductively Coupled Plasma Mass Spectrometry (ICP-MS) has become a cornerstone technique for trace elemental analysis due to its exceptional sensitivity, wide dynamic range, and multi-element capabilities. This application note details specialized ICP-MS method development for two critical matrices: drinking water and human biofluids. The protocols outlined support a broader research thesis on advancing trace elemental analysis in water and related biological systems. For drinking water, the focus is on regulatory compliance and high-throughput analysis, while for complex biofluids like serum, the emphasis shifts to overcoming matrix effects and preserving native metal-biomolecule interactions for speciation studies.
ICP-MS Analysis of Drinking Water
Regulatory Context and Analytical Workflow
Monitoring trace elements in drinking water is essential for public health, guided by regulations such as the U.S. EPA Method 200.8 [32]. The analytical challenge lies in achieving reliable, high-throughput analysis that meets stringent detection limits while maintaining robustness for varying water matrices (e.g., surface, ground, and tap water).
A robust workflow using the Thermo Scientific iCAP MSX ICP-MS has demonstrated compliance with EPA Method 200.8, Revision 5.4 [32]. Key to this workflow is the use of Argon Gas Dilution (AGD), which automatically and reproducibly dilutes the sample aerosol online. This enhances instrument robustness by reducing matrix deposition on the interface cones, enabling the analysis of samples with high total dissolved solids (TDS) with minimal downtime [32]. Internal standardization is employed to correct for signal drift and matrix effects.
Key Performance Data for Drinking Water Analysis
The method was validated for 21 target analytes. Calibration curves were established using six standards and a blank, with correlation coefficients (R²) exceeding 0.999 for all elements [32]. Method Detection Limits (MDLs) were calculated according to EPA guidelines and were found to be well below the mandated Maximum Contaminant Levels (MCLs) [32]. The table below summarizes the achieved MDLs for a selection of key elements.
Table 1: Example Method Detection Limits (MDLs) for Selected Elements in Drinking Water by EPA Method 200.8 [32]
| Element | m/z | MDL (μg/L) | Element | m/z | MDL (μg/L) |
|---|---|---|---|---|---|
| Aluminum | 27 | 0.228 | Copper | 63 | 0.061 |
| Arsenic | 75 | 0.046 | Lead | 206+207+208 | 0.018 |
| Barium | 137 | 0.025 | Mercury | 202 | 0.009 |
| Cadmium | 111 | 0.022 | Selenium | 82 | 0.086 |
| Chromium | 52 | 0.045 |
High throughput is another critical requirement. Systems like the PlasmaQuant MS can analyze 60 to 82 drinking water samples per hour while maintaining a high degree of precision, with standard deviations of 1.5% and 2.2%, respectively [33]. This efficiency, combined with reduced argon consumption, significantly lowers the cost per sample for routine analysis [33].
Automated High-Resolution River Water Monitoring
Beyond compliance, novel approaches enable automated, high-temporal-resolution monitoring of river water. A recent study developed an atline system using a self-cleaning autosampler (CAT) coupled to an ICP-MS to quantitatively measure 56 elements in Rhine River water every hour for one month [23]. This approach captures short-term pollution events and diurnal variations that traditional low-frequency sampling would miss, representing a significant advance in understanding dynamic element behaviors in aquatic systems [23].
caption: Workflow for automated high-temporal-resolution multi-element river water monitoring using an atline ICP-MS system [23].
ICP-MS Analysis of Serum and Biofluids
Direct Dilution for High-Throughput Biomonitoring
The analysis of biofluids like serum and urine presents the challenge of a complex matrix. A direct dilution method has been developed for the simultaneous determination of 40 metal and non-metallic elements in paired human urine and serum samples within a 6-minute analysis time [34]. Sample preparation is minimal, involving a 1:10 (v/v) dilution with 1% nitric acid for urine and a 1:4 dilution for serum [34].
This method uses a calibration curve with a simulated matrix (synthetic urine or serum) instead of external standards in pure nitric acid, which significantly reduces matrix effects and improves accuracy [34]. The method was rigorously validated, showing good linearity (R² ≥ 0.999), recovery rates of 81.92–108.66%, and relative standard deviations (RSD) below 15% [34]. The Limits of Detection (LOD) were as low as 2 ng/L in urine and 20 ng/L in serum for many elements [34]. This approach facilitates high-throughput, comprehensive biomonitoring for exposure assessment and health studies.
SEC-ICP-MS for Metallobiomolecule Speciation
To understand the role of metals in biology, it is often necessary to analyze them in their native biomolecular complexes, a field known as speciation analysis. Size-Exclusion Chromatography coupled to ICP-MS (SEC-ICP-MS) is a powerful platform for this purpose [35].
A key challenge is preserving labile metal-biomolecule interactions during analysis. A developed SEC-ICP-MS method for human serum enables the simultaneous profiling of ten metals and metalloids (Co, Mg, Ca, Cu, Zn, Fe, Mn, Pb, Se, Hg) in a single run [35]. The platform incorporates several advanced features:
- Post-column flow injection: For element calibration, total element determination, and instrument sensitivity monitoring [35].
- On-column EDTA injection: This strategy effectively mitigates unwanted metal interactions with the chromatographic stationary phase, enhancing column recovery for elements like Co and Zn and preventing cross-contamination [35].
The method was validated using a human serum reference material (Seronorm Trace Elements Level 2), with element recoveries exceeding 80% for most analytes, confirming its robustness and accuracy [35]. This provides novel insights into the distribution of elements across different molecular weight biomolecules.
caption: Integrated SEC-ICP-MS platform for multielement metallobiomolecule profiling in serum [35].
The Scientist's Toolkit: Essential Research Reagents and Materials
The following table details key reagents and consumables critical for the successful implementation of the described ICP-MS methods.
Table 2: Key Research Reagent Solutions for ICP-MS Method Development
| Item | Function | Application Note |
|---|---|---|
| Multi-element Isotopic Standard (e.g., IES-WAK) | Serves as both a calibration standard for multi-isotopic elements and an online internal standard for mono-isotopic ones in isotope dilution analysis [36]. | On-line IDA |
| Nitric Acid (TracePur Grade) | Used for sample acidification and dilution to stabilize elements and minimize matrix interferences; high purity is essential to avoid contamination [32] [34]. | Universal |
| Certified Reference Materials (e.g., Seronorm Level 2, SLRS-5) | Essential for method validation and verifying analytical accuracy against a certified matrix [35] [32]. | Universal |
| Ammonium EDTA | Added post-column or to the mobile phase to chelate metals, mitigating their non-specific interaction with the SEC stationary phase and improving recovery [35]. | SEC-ICP-MS |
| Internal Standard Mix (e.g., Li, Sc, Y, Tb, Bi) | Added online to correct for signal drift, matrix suppression/enhancement, and physical interferences during sample introduction [32]. | Universal |
| Simulated Biofluid Matrix (e.g., Synthetic Urine) | Used for preparing matrix-matched calibration standards, which compensates for interferences and provides more accurate quantification than external calibration in acid [34]. | Biofluid Analysis |
This application note outlines robust and advanced ICP-MS methodologies tailored for the analysis of drinking water and biological fluids. For regulatory water testing, the combination of AGD, adherence to EPA protocols, and automated systems ensures high-throughput, precise, and compliant analysis. For complex biofluids, two powerful approaches are presented: a rapid direct dilution method for total elemental quantification in biomonitoring, and a sophisticated SEC-ICP-MS platform for metallobiomolecule speciation. The use of matrix-matched calibration, post-column reagent addition, and online dilution strategies are critical for achieving accurate and reliable results. These protocols provide researchers with a solid foundation for trace elemental analysis, supporting a wide range of applications from environmental monitoring and public health to biomedical research.
Solving Analytical Challenges: A Practical Guide to ICP-MS Optimization
Accurate trace elemental analysis in water research using Inductively Coupled Plasma Mass Spectrometry (ICP-MS) is fundamentally challenged by spectral interferences. These interferences, primarily from polyatomic ions and isobaric overlap, can cause significant inaccuracies in quantification by obscuring target isotopes. Polyatomic interferences arise from combinations of atoms from the plasma gas, matrix components, or solvents, while isobaric overlaps occur when different elements share isotopes with identical mass-to-charge ratios (m/z). Overcoming these challenges is critical for obtaining reliable data in environmental monitoring, regulatory compliance, and drug development research. This application note details the mechanisms of these interferences and provides validated protocols for their mitigation in water analysis, aligning with methodologies such as EPA Method 200.7 [37].
Mechanisms and Challenges in Water Analysis
Polyatomic Interferences
Polyatomic ions are formed in the plasma through recombination processes involving argon (the plasma gas), as well as elements from the water sample itself (e.g., hydrogen, oxygen, carbon, nitrogen, chlorine) and acids used in sample preparation (e.g., Cl from HCl, S from H₂SO₄) [38]. The Normalised Argon Index (NAI) is a key metric for quantifying plasma conditions that influence the formation of these interfering species [39].
Table 1: Common Polyatomic Interferences in Water Analysis
| Target Isotope | Polyatomic Interference | Common Source in Water Samples |
|---|---|---|
| ⁵²Cr | ⁴⁰Ar¹²C⁺ | Organic carbon, dissolved CO₂ |
| ⁵⁵Mn | ⁴⁰Ar¹⁵N⁺ | Dissolved nitrates, ammonium |
| ⁵⁶Fe | ⁴⁰Ar¹⁶O⁺ | Water matrix (H₂O) |
| ⁷⁵As | ⁴⁰Ar³⁵Cl⁺ | Chloride in saline water, HCl acid |
| ⁸⁰Se | ⁴⁰Ar⁴⁰Ar⁺ | Argon plasma gas |
| ³²S | ¹⁶O¹⁶O⁺ | Sulfates in water |
Isobaric Overlap
Isobaric overlap is a fundamental atomic-level interference where an isotope of the target element shares the same nominal mass with an isotope of a different element.
Table 2: Common Isobaric Interferences
| Target Isotope | Interfering Isotope |
|---|---|
| ⁵⁸Ni | ⁵⁸Fe |
| ¹¹²Cd | ¹¹²Sn |
| ²⁰⁸Pb | ²⁰⁸Hg |
Methodologies for Overcoming Spectral Interferences
Optimization of Plasma Operating Conditions
A primary method for mitigating polyatomic interferences involves carefully tuning the ICP-MS plasma conditions. Research has demonstrated that optimizing parameters such as radiofrequency (RF) power and gas flows can significantly suppress the formation of interfering ions without requiring complex hardware. A key outcome of this optimization is a measurable reduction in the Normalised Argon Index (NAI). Operating at a lower NAI indicates a "cooler" or "softer" plasma, which reduces the energy available for the formation of argon-based polyatomic ions like ArCl⁺. This approach has been successfully applied for the accurate measurement of sulfur isotopes (³²S, ³³S, ³⁴S), allowing analysis in low-resolution mode and providing an approximately threefold increase in sensitivity compared to conventional high-resolution methods [39].
Collision/Reaction Cell Technology (CCT/RCT)
Modern ICP-MS instruments are often equipped with collision/reaction cells (e.g., QCell) placed after the ion optics to remove interferences before the mass analyzer [38]. These cells use specific gas mixtures to selectively interact with interfering ions.
- Collision Mode: An inert gas (e.g., He) is used. Polyatomic interferences, being larger and often having a higher collision cross-section, are slowed down or scattered more than the smaller analyte ions, which are then transmitted to the detector.
- Reaction Mode: A reactive gas (e.g., H₂, O₂, NH₃, CH₃F) is used. The gas undergoes a chemical reaction with the interference, either converting it into a different mass (e.g., H₂ with Ar⁺ to form ArH⁺) or with the analyte ion, thereby shifting it away from the interference.
High-Resolution Mass Spectrometry
An alternative to chemical resolution in a reaction cell is physical resolution using a high-resolution magnetic sector mass spectrometer. This technique separates ions based on small mass differences, which is sufficient to resolve many polyatomic interferences from analyte ions [39]. For instance, the interference of ( ^{40}Ar^{16}O^{+} ) on ( ^{56}Fe^{+} ) requires a resolution of approximately 2,500 to separate. While effective, this mode typically results in a significant reduction in analyte sensitivity [39].
Experimental Protocol: Direct Analysis of Trace Metals in Coastal Seawater
This protocol outlines the analysis of trace metals in a high-salinity matrix (coastal seawater) using ICP-MS with a collision/reaction cell, based on established approaches for challenging water matrices [40] [37].
Reagents and Materials
Table 3: Research Reagent Solutions and Essential Materials
| Item | Function/Description |
|---|---|
| High-Purity Acids (HNO₃, HCl) | Sample preservation and digestion. Must be trace metal grade to minimize blanks. |
| Multi-Element Calibration Standards | Preparation of calibration curves. Should include all analytes of interest. |
| Internal Standard Solution (e.g., Sc, Ge, In, Bi, Re) | Corrects for instrument drift and matrix suppression/enhancement. |
| Collision/Reaction Cell Gases (He, H₂) | Introduction into the cell for spectral interference removal. |
| Certified Reference Material (CRM) | e.g., NIST 1640a (Natural Water) for method validation [38]. |
| High-Purity Deionized Water (>18 MΩ·cm) | For all dilutions and sample preparation steps. |
Sample Preparation
- Collection: Collect seawater samples in pre-cleaned (soaked in 10% v/v HNO₃ for 24 hours, rinsed with high-purity water) polyethylene or polypropylene bottles.
- Acidification: Immediately acidify the samples to pH < 2 with high-purity nitric acid to preserve trace metal content and prevent adsorption to container walls.
- Filtration (Optional): Filter samples through a 0.45 μm membrane filter if dissolved metals are the target analytes.
- Internal Standard Addition: Add the internal standard mix to all samples, blanks, and calibration standards to achieve a final concentration of 5-10 μg/L for each internal standard element.
Instrumental Setup and Analysis
ICP-MS Instrument Setup:
- Nebulizer: Use a PFA micro-flow nebulizer or one designed for high solids.
- Spray Chamber: Peltier-cooled spray chamber (e.g., ~2-3 °C) to reduce solvent load [38].
- Torch & Injector: Standard quartz torch; injector tube diameter should be selected based on total dissolved solids (e.g., 2.0 mm for higher matrix) [38].
- RF Power: Optimize (~1550 W) to ensure robust plasma conditions for the saline matrix.
- Gas Flows: Adjust carrier gas flow to maximize signal-to-noise ratio while minimizing oxide formation (CeO⁺/Ce⁺ < 1.5%).
Interference Mitigation with CCT/RCT:
- For the analysis of ( ^{75}As^{+} ) in the presence of ( ^{40}Ar^{35}Cl^{+} ), use the reaction cell with H₂ as the cell gas. H₂ reacts with ( ^{40}Ar^{35}Cl^{+} ), forming ( ^{40}Ar^{35}ClH^{+} ) which has a different m/z (76), while ( ^{75}As^{+} ) is largely unreactive.
- For ( ^{80}Se^{+} ) (interfered by ( ^{40}Ar^{40}Ar^{+} )), use a reaction gas like CH₃F or operate in He collision mode with Kinetic Energy Discrimination (KED).
Data Acquisition:
- Use standard-sample bracketing with a known CRM for mass bias correction if performing isotope ratio analysis [39].
- Acquire data in spectrum or peak hopping mode with sufficient integration time per mass to ensure good counting statistics.
Data Processing and Quality Control
- Blank Subtraction: Subtract the average procedural blank value from all sample results.
- Internal Standard Correction: Use the internal standards to correct for signal drift and matrix effects.
- Recovery Validation: Analyze a certified reference material (CRM) with each batch of samples. Acceptable recovery should be within 85-115% for most elements.
- Detection Limits: Calculate Method Detection Limits (MDLs) based on the standard deviation of multiple blank measurements.
Workflow and Signaling Pathways
The following diagram illustrates the logical workflow and decision-making process for selecting the appropriate interference removal strategy in ICP-MS analysis.
Effective management of spectral interferences is paramount for the accuracy of trace elemental analysis in water research using ICP-MS. A multi-faceted approach is most effective, combining instrumental optimization (plasma conditions and collision/reaction cell technology) with robust methodological practices (sample preparation, internal standardization, and CRM validation). By implementing the protocols and strategies outlined in this application note, researchers can generate reliable, high-quality data essential for environmental monitoring, regulatory compliance, and advanced drug development.
Mitigating Matrix Effects and Signal Suppression
Matrix effects and signal suppression present significant challenges in inductively coupled plasma-mass spectrometry (ICP-MS), particularly in the trace elemental analysis of environmental water samples. These phenomena occur when the sample matrix influences analyte signal intensity, potentially leading to inaccurate quantification. Matrix effects can manifest as suppression or enhancement of the signal, primarily caused by space-charge effects in the interface region, where heavier or more abundant matrix ions can deflect analyte ions of lower mass away from the ion path [1]. In water research, common matrices such as high dissolved solids, organic carbon, and saline content can severely compromise data accuracy and precision, making effective mitigation strategies essential for regulatory compliance and scientific validity [41] [42] [43].
This application note details standardized protocols and innovative methodologies for identifying and correcting matrix effects, ensuring reliable performance in trace elemental analysis for water quality assessment, geochemical tracing, and contamination studies.
Methodologies and Experimental Protocols
Online Dilution for Hypersaline Matrices
The analysis of halophilic organisms in hypersaline media (up to 200 g L⁻¹ total dissolved solids) represents an extreme case of matrix effects. The following protocol, optimized for instruments like the ICP-TOFMS, effectively mitigates these challenges [41].
- Reagents: High-purity nitric acid (Trace Metals Grade); High-efficiency nebulizer (e.g., PFA concentric); Double-pass spray chamber; Haloferax mediterranei culture in hypersaline medium.
- Protocol:
- Sample Introduction Setup: Configure the ICP-MS with a high-efficiency nebulizer and a double-pass spray chamber. This combination provides high sensitivity while reducing the overall matrix load introduced into the plasma.
- On-line Dilution: Implement an on-line dilution system using a T-connector to mix the sample with a diluent (e.g., 2% HNO₃) at a fixed ratio. A 1:103 dilution ratio is recommended to sufficiently reduce matrix concentration while maintaining analyte detectability.
- Aerosol Dilution: Utilize an aerosol dilution accessory if available. This step further reduces the matrix load and minimizes osmotic stress on intact cells during single-cell analysis.
- Instrument Optimization: Carefully optimize plasma conditions (RF power, nebulizer gas flow) and lens settings with the diluted sample introduction system active to maximize signal-to-noise ratio for target analytes like lead and selenium.
- Analysis: Introduce samples and acquire data in time-resolved analysis (TRA) mode to monitor transient signals, enabling the detection of individual biogenic nanoparticles or single-cell events.
Matrix Overcompensation Calibration (MOC) for Organic Matrices
Carbon-based matrix effects are prevalent in the analysis of food and environmental samples with high organic content. The MOC strategy effectively corrects these effects without extensive sample preparation [44].
- Reagents: OmniTrace-grade nitric acid (67–70%); PlasmaPURE Plus-grade hydrochloric acid (32–35%); USP-grade ethanol (200 proof); Mixed-element standard solutions (As, Se, Cd, Pb).
- Protocol:
- Sample Preparation: Dilute the water or liquid sample (e.g., fruit juice as a model for dissolved organic carbon) at a 1:50 ratio with a matrix markup solution, specifically 1% (v/v) HNO₃ + 0.5% (v/v) HCl + 5% (v/v) ethanol.
- Calibration Standard Preparation: Prepare the calibration standard series in the same matrix markup solution used for sample dilution (1% HNO₃−0.5% HCl−5% ethanol). This creates a consistent, carbon-enhanced environment for both standards and samples.
- ICP-MS Analysis:
- Use a standard ICP-Q-MS configuration with a quartz double-pass spray chamber cooled at 2°C.
- Introduce the prepared samples and calibration standards.
- Monitor analytes such as ⁷⁵As, ⁷⁷Se, ¹¹¹Cd, and ²⁰⁸Pb.
- Use internal standardization (e.g., ⁷²Ge, ¹¹⁵In, ¹⁹³Ir) to correct for instrumental drift.
- Quantification: Quantify analytes using the single external calibration curve established in step 2. The overcompensation of the carbon effect ensures that both standards and samples experience a similar, dominant matrix influence, thereby correcting for variations in the original sample carbon content.
Chromatographic Separation for Speciation and Interference Removal
Hyphenated techniques effectively separate analytes from the matrix before introduction to the ICP-MS, mitigating both spectroscopic and non-spectroscopic interferences. This HPIC-ICP-MS protocol is designed for analyzing gadolinium-based contrast agents in surface waters [45].
- Reagents: Anion-exchange column (e.g., Dionex IonPac AS7, 2 x 250 mm); Gd-based contrast agent standards (Gd-DOTA, Gd-BT-DO3A, etc.); Ammonium nitrate eluent; LC-MS grade methanol; Ultrapure water (18.2 MΩ·cm).
- Protocol:
- Chromatographic Setup:
- Configure an HPIC system with an anion-exchange column.
- Use a mobile phase of 150 mM ammonium nitrate with only 2% methanol (pH adjusted to 6.8) at a flow rate of 450 μL min⁻¹.
- Set the injection volume to 25 μL.
- ICP-MS Coupling: Connect the HPLC column outlet directly to the ICP nebulizer using a 40 cm PEEK capillary (125 μm i.d.).
- ICP-MS Operation:
- Operate the ICP-MS with He collision gas in kinetic energy discrimination (KED) mode to minimize polyatomic interferences.
- Monitor the isotope ¹⁵⁸Gd for its high abundance and reduced interference.
- Maintain RF power at 1550 W and a nebulizer gas flow of about 1.12 L min⁻¹.
- Analysis and Quantification: Separate the charged GBCAs within a 15-minute runtime. Quantify species by integrating peak areas and comparing against a calibration curve of standard GBCAs processed under identical conditions.
- Chromatographic Setup:
Chemical Modification of the Plasma
Introducing carbon dioxide directly into the plasma provides a robust and cost-effective method for stabilizing the ionization of hard-to-ionize elements like As and Se, correcting for carbon-induced signal fluctuations [42].
- Reagents: Food-grade carbon dioxide (CO₂) gas; High-purity argon.
- Protocol:
- Gas Delivery System Setup: Install a CO₂ gas cylinder with a regulator, connected to the instrument's optional gas inlet line. A ballast tank is recommended for consistent gas mixing.
- Plasma Modification: Mix CO₂ with the argon plasma gas via the mass flow controller. For an Agilent 8900 ICP-QQQ, this can be done using the existing fifth plasma gas control line. A final carbon content of ~1.2% within the plasma (achieved with ~8% CO₂ in Ar in the ballast tank) is optimal.
- Analysis: Introduce samples and acquire data. The presence of carbon ions facilitates more complete ionization of elements with ionization potentials between 9 and 11 eV (As: 9.82 eV, Se: 9.75 eV), enhancing their signals and improving stability in varying sample matrices.
Workflow Visualization
The following diagram illustrates the logical decision process for selecting the appropriate mitigation strategy based on the primary characteristics of the sample matrix.
The Scientist's Toolkit: Key Reagents and Materials
The following table details essential reagents and materials referenced in the protocols, along with their critical functions in mitigating matrix effects.
Table 1: Key Research Reagent Solutions for Mitigating ICP-MS Matrix Effects
| Item | Function/Application | Protocol |
|---|---|---|
| High-Efficiency Nebulizer | Generates a fine aerosol for high-sensitivity introduction while reducing matrix load to the plasma. | Online Dilution [41] |
| Double-Pass Spray Chamber | Further reduces the matrix load by selectively removing larger, solvent-laden aerosol droplets. | Online Dilution [41] |
| Ethanol (USP Grade) | Serves as the "Matrix Markup" reagent in MOC, creating a dominant, consistent carbon environment to correct for variable carbon effects. | Matrix Overcompensation Calibration [44] |
| Anion Exchange Column (e.g., IonPac AS7) | Separates ionic analytes (e.g., Gd-complexes) from the sample matrix and from each other, eliminating interferences pre-detection. | Chromatographic Separation [45] |
| Carbon Dioxide (CO₂) Gas | A cost-effective source of carbon for plasma modification, enhancing signals of hard-to-ionize elements like As and Se. | Chemical Plasma Modification [42] |
| Helium Collision Gas | Used in collision/reaction cell (CRC) ICP-MS to minimize polyatomic interferences through kinetic energy discrimination. | Chromatographic Separation [45] |
Performance Data and Validation
The methodologies described have been rigorously validated in their respective applications. The table below summarizes key quantitative performance metrics.
Table 2: Analytical Performance of Featured Mitigation Strategies
| Mitigation Strategy | Target Analytes/Sample | Key Performance Metric | Result | Reference |
|---|---|---|---|---|
| Online Dilution | Pb, SeNPs in Hypersaline Media | Single-cell LOD for Pb | 15 ag cell⁻¹ | [41] |
| LOD for SeNP size | 42 nm | [41] | ||
| Matrix Overcompensation Calibration (MOC) | As, Se, Cd, Pb in Fruit Juice | Agreement with MAD-SAC | Good agreement demonstrated | [44] |
| Sample Prep Time | Significantly reduced vs. digestion | [44] | ||
| HPIC-ICP-MS | Gd-based Agents in Surface Water | Detection Limits (Gd) | 2 - 5 ng L⁻¹ | [45] |
| Chromatographic Run Time | < 15 minutes | [45] | ||
| Organic Solvent Use | Only 2% Methanol | [45] | ||
| CO₂ Addition to Plasma | As, Se in Food/Grains | Signal Enhancement for As | Up to 8-fold | [42] |
| Optimal CO₂ in Ar | ~8% (1.2% C in plasma) | [42] |
Matrix effects are an inherent challenge in ICP-MS analysis of complex water matrices, but they can be effectively managed through strategic methodological choices. The protocols detailed herein—ranging from physical dilution and chemical calibration to chromatographic separation and plasma modification—provide researchers with a comprehensive toolkit. The selection of an appropriate strategy, guided by the sample matrix and analytical goals, is paramount for achieving accurate, reliable, and reproducible trace element data in water research. As the application landscape of ICP-MS continues to evolve, these best practices will remain fundamental to ensuring data integrity in environmental monitoring and public health protection.
Inductively Coupled Plasma Mass Spectrometry (ICP-MS) has become a dominant technique for ultra-trace elemental analysis in water research, capable of detecting metals and non-metals at concentrations as low as one part per trillion [1] [46]. The technique's exceptional sensitivity and multi-element capabilities make it invaluable for environmental monitoring, including assessing water quality and understanding geochemical cycles [23]. However, achieving optimal performance requires careful optimization of two critical components: the sample introduction system, which transports the liquid sample into the instrument, and the plasma conditions, which control the ionization process [47] [8]. This application note provides detailed protocols and best practices for researchers and scientists to optimize these systems for trace elemental analysis in water samples, ensuring high-quality data with minimal interferences.
The sample introduction system is a frequent source of error in ICP-MS analysis and is critical for achieving accurate, reproducible results for water samples [47] [48]. This system transforms the liquid sample into a fine aerosol and transports it into the plasma for ionization.
Core Components and Selection Criteria
Table 1: Guide to Nebulizer Selection for Water Analysis
| Nebulizer Type | Typical Sample Uptake Rate (mL/min) | Recommended Application for Water Analysis | Key Advantages | Limitations |
|---|---|---|---|---|
| Concentric [47] [49] | 0.01 - 1.0 | Low TDS waters, standard solutions | Excellent precision and detection limits, fine aerosol | Prone to clogging with high solids or particulates |
| Micro-Concentric [47] | 0.01 - 0.1 | Sample-limited analysis (e.g., <1 mL) | Low sample consumption | May require reduced sample flow rates |
| Cross-Flow [47] | ~1.0 | Waters with moderate dissolved solids | More robust than concentric for higher solids | Generally lower sensitivity than concentric designs |
| V-Groove / High Solids [47] | Varies | Challenging matrices (e.g., brines, wastewater with suspended solids) | High resistance to clogging and salting | May require higher gas pressure; moderate detection limits |
Spray Chambers facilitate the selection of fine aerosol droplets (typically <8 µm in diameter) while allowing larger droplets to drain, which is crucial for plasma stability [47]. The two primary designs are:
- Cyclonic Spray Chambers: Offer faster wash-in and wash-out times, reducing memory effects and improving throughput [47].
- Scott (Double-Pass) Spray Chambers: Provide a longer aerosol pathway for more stringent droplet selection, potentially leading to slightly better stability but longer washout times [47].
For high-throughput laboratories analyzing diverse water matrices, automated sample introduction systems like the FAST system can improve sample throughput by up to 300% [50]. These systems use a high-speed vacuum for sample loading and a multi-port valve to minimize sample cross-contamination and enhance data quality by maintaining a stable peristaltic pump speed [50].
Maintenance and Troubleshooting Protocols
Routine maintenance of the introduction system is essential for reliable operation. The following protocol outlines a systematic approach to troubleshooting common issues.
Figure 1: Troubleshooting workflow for ICP-MS sample introduction systems, based on common issues and solutions [47] [49] [48].
Detailed Procedures for Key Troubleshooting Steps:
- Connection Integrity Check: Ensure all connections from the sipper tube to the nebulizer are airtight. Visually inspect PTFE tubing for small air bubbles, which indicate a leak [47] [49].
- Spray Chamber Drain Test: Using a wash bottle, add water to the spray chamber (with plasma off) and verify it drains smoothly and completely without leaks. Poor drainage can cause pressure fluctuations and poor precision [49].
- Nebulizer Free-Flow Test: Disconnect the nebulizer from the spray chamber. With the peristaltic pump released, water should flow freely from the sample tube and produce a fine, steady mist. A coarse or spitting spray indicates a partially blocked nebulizer or incorrect gas pressure [49].
- Preventative Cleaning Protocol:
- Spray Chamber & Torch: Clean daily. Use leaching with 1:1 nitric acid/water or other appropriate acid solutions. An ultrasonic bath can be used for spray chambers and torches but must never be used for concentric glass nebulizers as it will destroy the delicate capillary [49] [48].
- Nebulizers: Clean by leaching with an appropriate acid. Use a backpressure of water to dislodge particles. Never use a wire or ultrasonic bath [49].
- Cones: Regularly sonicate sampler and skimmer cones in a weak acid solution to remove impurities [48].
Plasma Condition Optimization
The plasma serves as the ionization source in ICP-MS. Optimizing its conditions is critical for maximizing sensitivity, minimizing interferences, and ensuring stable operation across varying water matrices.
Plasma Tuning and Interference Management
Table 2: Optimizing Plasma Conditions for Key Analytical Challenges in Water Analysis
| Analytical Challenge | Plasma Tuning Strategy | Reactive Gas Strategy (MS/MS) | Target Performance Metrics |
|---|---|---|---|
| Elements with High IP (e.g., As, Se, Hg) [8] [51] | Hot Plasma: Higher RF power and reduced coolant gas flow to increase plasma temperature and ionization efficiency. | O₂/H₂ Mode: Mass shifting to resolve interferences (e.g., O₂ reaction for Se, H₂ reaction for Hg) [51]. | Maximize signal for high IP elements; Oxide rate < 3% [8]. |
| Minimizing Doubly Charged Ions (e.g., Ba++, Ce++) [8] | Cool Plasma: Lower RF power to reduce plasma temperature and double charge formation. | Often used with NH₃ to resolve interferences for elements like V, Cr, Fe in cool plasma mode [51]. | Double charged ratio (e.g., Ba++/Ba+) < 3.0% [8]. |
| Robust Plasma for Matrix Tolerance (e.g., high TDS, saline waters) [1] [8] | Balanced "robust" conditions: Moderate RF power and optimized gas flows for high matrix stability. | CRC with He collision gas (KED) or reaction gases to remove polyatomic interferences from Cl, Na, S, Ca [8]. | Stable signal over long runs; CeO/Ce < 2.0% [8]. |
Plasma temperature, primarily controlled by the RF power and gas flows, directly impacts ionization efficiency. Elements have different ionization potentials (IP), and the plasma temperature must be optimized accordingly [8]. The theoretical degree of ionization at a typical plasma temperature of 8,000 K can be estimated using the Saha-Langmuir equation [8]. Key indicators for monitoring plasma performance include the CeO⁺/Ce⁺ ratio (oxide rate, ideally <2%) and the Ba²⁺/Ba⁺ ratio (doubly charged ion rate, ideally <3%) [8].
Protocol for Automated Plasma Tuning and Interference Control
The following workflow is recommended for developing a robust ICP-MS method for multi-element water analysis.
Figure 2: A systematic protocol for optimizing plasma conditions and managing interferences in ICP-MS analysis of water samples [8] [51].
Application in High-Resolution Water Monitoring
The optimization of sample introduction and plasma conditions enables advanced applications such as fully automated, high-temporal-resolution monitoring of river water. A recent study demonstrated an atline system that autonomously collected and analyzed 56 elements in Rhine River water every hour for one month [23]. This system utilized a self-cleaning autosampler coupled with an ICP-MS controlled by a Python script, capturing short-term pollution events and diurnal variations that would be missed by traditional low-frequency (e.g., weekly) sampling [23]. For such demanding applications, a robust and well-optimized sample introduction system and stable plasma are prerequisites for unattended operation and reliable data.
The Scientist's Toolkit
Table 3: Essential Research Reagent and Material Solutions for ICP-MS Water Analysis
| Item | Function | Application Note |
|---|---|---|
| High-Purity Acids (HNO₃, HCl) | Sample preservation and digestion; cleaning components. | Essential for achieving low procedural blanks in ultra-trace analysis [1]. |
| Multi-Element Tuning Solution (e.g., containing Li, Ce, Ba) | Monitoring and optimizing plasma performance (sensitivity, oxide, double charge levels). | Used during daily instrument optimization [8]. |
| Certified Reference Materials (CRMs) | Quality control and method validation. | e.g., SLRS-6 (River Water) or NIST 1640a (Natural Water) [23]. |
| Internal Standard Mix | Correcting for instrument drift and matrix suppression/enhancement. | Typically includes Sc, Ge, Rh, In, Tb, Lu/Bi at a concentration relevant to the analyte range [8]. |
| Reactive Gases (e.g., O₂, H₂, NH₃, He) | Selectively removing spectral interferences in the collision/reaction cell (CRC). | Required for ICP-MS/MS applications; gas choice is analyte-specific [8] [51]. |
| Peristaltic Pump Tubing | Moving sample and drainage solutions. | Chemical-compatible tubing; a common source of instability if worn [47] [48]. |
Instrument Maintenance and Calibration for Long-Term Stability
Within the framework of trace elemental analysis in water research, maintaining the long-term stability of an Inductively Coupled Plasma Mass Spectrometer (ICP-MS) is a critical determinant of data quality and reliability. Achieving low nanogram-per-liter detection limits for trace metals, as required by regulations such as the Safe Drinking Water Act, depends directly on a robust program of instrument maintenance and calibration [43]. This application note details a comprehensive set of protocols designed to ensure analytical precision and accuracy over extended periods, which is essential for both routine environmental monitoring and advanced research into biogeochemical cycles in aquatic systems [52].
Essential Research Reagents and Materials
The following table catalogs key consumables and reagents crucial for maintaining the performance and stability of an ICP-MS system in a water research laboratory.
Table 1: Key Research Reagent Solutions for ICP-MS Maintenance and Calibration
| Item | Function in Maintenance & Calibration |
|---|---|
| Trace Metal Grade Acids (e.g., Nitric, Hydrochloric) | Used for sample preservation, preparation of calibration standards, and routine system passivation to minimize background contamination from elemental impurities [43]. |
| Multi-Element Calibration Standards | Used for establishing calibration curves, performing initial calibration verification (ICV), and continuing calibration verification (CCV) to ensure analytical accuracy [43]. |
| Internal Standard Mix (e.g., Sc, Y, In, Tb, Bi) | Added online to all samples and standards to correct for instrument drift and matrix-induced suppression or enhancement of the signal [43]. |
| Tuning Solutions (e.g., containing Li, Co, Y, Ce, Tl) | Used to optimize instrument parameters (e.g., ion lenses, plasma conditions) for sensitivity, oxide formation (CeO/Ce), and doubly charged ion levels (Ba++/Ba+) [8]. |
| Gold (Au) Stock Solution | Added to samples and wash solutions to stabilize volatile mercury (Hg) through redox chemistry, preventing memory effects and loss of signal [43]. |
Instrument Maintenance Protocols for Long-Term Stability
A proactive and scheduled maintenance regimen is the first line of defense against signal drift and performance degradation.
Routine Daily and Weekly Maintenance
- Sample Introduction System Cleaning: Inspect and clean the nebulizer and spray chamber daily after use. Soak the nebulizer in a mild (e.g., 2%) acid bath to dissolve any precipitated salts [52]. Rinse the spray chamber with dilute acid and deionized water to remove residual matrix.
- Torch and Injector Tube Inspection: Regularly inspect the quartz torch and injector tube for carbon buildup or salt deposits. If contamination is visible, clean with a suitable acid solution or replace the components to maintain optimal plasma stability and temperature [8].
- Pump Tubing: Check peristaltic pump tubing for signs of wear or cracking and replace it regularly to ensure a consistent and stable sample flow, which is critical for signal stability [52].
Periodic Maintenance Based on Sample Load
- Cone Maintenance: Sampling and skimmer cones are consumable items. Nickel cones should be cleaned regularly with a non-abrasive slurry and replaced when orifice deformation is observed or when sensitivity drops significantly [52]. High-salinity matrices, common in environmental waters, accelerate cone wear.
- Vacuum System Components: Monitor the pressure and pump oil condition in the mechanical pumps. Change the oil and clean the pump inlet filter as recommended by the manufacturer to maintain the required vacuum for ion transmission.
Calibration and Quality Control Framework
A rigorous calibration and quality control protocol is essential for generating defensible data.
Initial Calibration and Verification
- Calibration Curve: A multi-point calibration (e.g., blank and at least 3-4 standards) is recommended for ICP-MS due to its wide dynamic range [43]. The curve should be linear over the concentration range of 0.01 to 100 μg/L for most trace elements in water analysis [52].
- Initial Calibration Verification (ICV): Analyze an independently prepared calibration standard, different from the source of the calibration standards, immediately after calibration. Recovery should be within 90-110% to verify the accuracy of the initial calibration [43].
Ongoing Quality Control During Analysis
- Continuing Calibration Verification (CCV): Analyze a calibration standard at a mid-range concentration after every 10-20 samples and at the end of the analytical batch. This monitors instrument drift over time [43].
- Internal Standard (IS) Monitoring: The response of the internal standards (e.g., (^6)Li, Sc, In, Tb, Bi) is monitored in every sample. Significant deviation (e.g., > 50%) from the expected response indicates matrix effects or instrument drift, and the sample may need to be re-analyzed after dilution or other corrective action [43].
- Method Blanks: Analyze a reagent blank with each batch to monitor and correct for any background contamination introduced during sample preparation [52].
Table 2: Key Quality Control Parameters and Their Acceptance Criteria
| Parameter | Description & Purpose | Typical Acceptance Criterion |
|---|---|---|
| Initial Calibration Verification (ICV) | Verifies the accuracy of the initial calibration curve. | 90 - 110% Recovery |
| Continuing Calibration Verification (CCV) | Monitors instrument stability and drift during a run. | 90 - 110% Recovery |
| Internal Standard Recovery | Corrects for signal drift and matrix effects in each sample. | 70 - 125% Recovery |
| Method Blank | Ensures the analytical process is free from contamination. | Analyte signal < Limit of Detection (LOD) |
| Oxide Ratio (CeO+/Ce+) | Indicator of plasma conditions and potential for polyatomic interferences. | < 2% [8] |
| Doubly Charged Ion Ratio (Ba++/Ba+) | Indicator of plasma robustness and potential for isobaric interferences. | < 3% [8] |
Workflow for Maintaining ICP-MS Stability
The following diagram summarizes the integrated workflow for maintaining long-term ICP-MS stability, from sample preparation to data acquisition.
Troubleshooting Common Stability Issues
Even with preventative maintenance, issues can arise. Systematic troubleshooting is key.
- Signal Drift: A consistent decrease in sensitivity across all analytes and internal standards is often caused by cone orifice clogging. Inspect and clean the sampler and skimmer cones. If the drift is analyte-specific, check for specific interferences or contamination in the sample introduction system [52].
- High Background or Contamination: Elevated signals in method blanks can originate from contaminated labware, impure reagents, or the instrument itself. Use high-purity acids and specifically selected, acid-washed plastic materials to prevent leaching of contaminants like Sb, Zn, Mn, Fe, and Ba [52].
- Managing Spectral Interferences: Polyatomic interferences (e.g., ArCl(^+) on As(^+)) are a major challenge in water analysis [43]. Modern ICP-MS/MS instruments can use reaction gases like oxygen or ammonia in a triple quadrupole system to remove these interferences mass-shift or on-mass methods, ensuring accurate results [4].
Ensuring Data Integrity: Method Validation and Technique Comparison
The accurate determination of trace elements in water is a critical requirement in environmental monitoring, regulatory compliance, and public health protection. Inductively Coupled Plasma Mass Spectrometry (ICP-MS) has emerged as a dominant technique for ultra-trace elemental analysis due to its exceptional sensitivity, wide linear dynamic range, and multi-element capabilities [1]. As regulatory requirements for metals in drinking water become increasingly stringent, with detection limits needed in the parts-per-trillion (ppt) range, robust method validation has become indispensable for ensuring data reliability [53].
This application note provides a comprehensive framework for validating ICP-MS methods in water research, focusing on four fundamental parameters: linearity, limits of detection and quantification (LOD/LOQ), precision, and trueness. The protocols outlined are aligned with EPA Method 200.8, which governs the determination of trace elements in waters and wastes by ICP-MS [53]. By establishing rigorous validation criteria, researchers can ensure their analytical methods produce accurate, precise, and legally defensible results for water quality assessment.
Theoretical Background
Method validation establishes documented evidence that an analytical procedure is suitable for its intended purpose. For ICP-MS analysis of trace elements in water, this process verifies that the method can consistently detect and quantify target analytes at relevant regulatory levels despite challenges such as complex matrices and spectral interferences.
Water analysis presents unique challenges for ICP-MS, including matrix effects from high total dissolved solids, spectral interferences from polyatomic ions, and instrumental drift during extended analysis periods [40] [53]. These factors must be accounted for during method validation to ensure accurate quantification across diverse water samples—from pristine groundwater to complex wastewater matrices.
Regulatory context plays a significant role in validation requirements. EPA Method 200.8 specifies procedures for measuring 21 trace elements in drinking, surface, and ground waters, with the technique's 1000-fold lower detection limits compared to ICP-OES making it essential for meeting contemporary regulatory standards [53].
Validation Parameters and Experimental Protocols
Linearity
Linearity demonstrates the method's ability to produce results directly proportional to analyte concentration within a specified range. For trace element analysis in water, the calibration range should encompass from below the reporting limit to above expected environmental concentrations.
Experimental Protocol:
- Prepare calibration standards at a minimum of five concentration levels plus blank
- Include internal standards (e.g., Sc, Ir, Rh) to correct for instrument drift and matrix effects [54] [55]
- Analyze standards in random order to avoid sequence-related bias
- Plot analyte response against concentration and perform regression analysis
- Calculate correlation coefficient (r), slope, and y-intercept
Acceptance Criteria: Correlation coefficient (r) ≥ 0.995 for all analytes [56].
Table 1: Exemplary Linearity Data for Selected Elements in Water Analysis
| Element | Calibration Range (μg/L) | Correlation Coefficient (r) | Slope | Y-Intercept |
|---|---|---|---|---|
| Chromium | 0.05 - 50 | 0.999 | 14520 | 85 |
| Lead | 0.02 - 20 | 0.998 | 8925 | 42 |
| Arsenic | 0.1 - 50 | 0.997 | 5630 | 120 |
| Cadmium | 0.01 - 10 | 0.999 | 12540 | 15 |
Limits of Detection (LOD) and Quantification (LOQ)
LOD and LOQ define the lowest concentration that can be detected and reliably quantified, respectively. These parameters are crucial for water research where elements often occur at ultra-trace levels.
Experimental Protocol:
- Prepare and analyze at least seven replicate blank solutions
- Calculate standard deviation (σ) of blank responses
- LOD = 3.3 × σ/slope of calibration curve
- LOQ = 10 × σ/slope of calibration curve
- Verify calculated LOQ by analyzing standard at LOQ concentration (≤20% RSD)
Acceptance Criteria: LOQ must be at or below regulatory limits. For chromium in drinking water, LOQ of 0.053 μg/L has been achieved using ICP-MS [55].
Table 2: LOD and LOQ Values for Regulated Elements in Water
| Element | LOD (μg/L) | LOQ (μg/L) | Regulatory Limit (μg/L) | Technique |
|---|---|---|---|---|
| Cr (total) | 0.016 | 0.053 | 50-100 [55] | ICP-MS [55] |
| Cr (VI) | 0.036 | 0.12 | 20-70 [55] | IC-ICP-MS [55] |
| Al | - | - | - | ICP-MS [53] |
| As | - | - | 10 | ICP-MS [53] |
| Pb | - | - | 15 | ICP-MS [53] |
| Na | 0.011 [56] | - | - | ICP-MS [56] |
| K | 0.0017 [56] | - | - | ICP-MS [56] |
Precision
Precision measures the random variation in repeated measurements and is typically expressed as percent relative standard deviation (%RSD). Both repeatability (intra-day) and intermediate precision (inter-day, inter-operator) should be assessed.
Experimental Protocol:
- Prepare quality control samples at low, medium, and high concentrations
- Analyze a minimum of six replicates at each level within a single run (repeatability)
- Analyze QC samples over at least three different days (intermediate precision)
- Calculate mean, standard deviation, and %RSD for each concentration level
Acceptance Criteria: %RSD ≤ 15% for most elements, with ≤20% acceptable near LOQ [54] [56].
Table 3: Precision Data for ICP-MS Analysis of Water Samples
| Element | Concentration (μg/L) | Repeatability (%RSD) | Intermediate Precision (%RSD) |
|---|---|---|---|
| Cr (total) | 0.5 | 5.2 | 7.8 |
| Cr (total) | 25 | 2.1 | 3.5 |
| Cu (serum) | - | <15 [54] | - |
| Se (serum) | - | <15 [54] | - |
| Na | 23.0 μg/mL [56] | 1.55 [56] | - |
| K | 3.90 μg/mL [56] | 1.62 [56] | - |
Trueness
Trueness reflects the closeness of agreement between the average value obtained from a large series of test results and an accepted reference value. Recovery studies using certified reference materials (CRMs) are the preferred approach.
Experimental Protocol:
- Obtain appropriate CRMs with matrices similar to samples (e.g., fortified water, sediment)
- Analyze CRMs using the validated method at least in triplicate
- Calculate percent recovery: (measured concentration/certified value) × 100
- Spiked recovery studies may supplement CRM analysis
Acceptance Criteria: Recovery rates of 80-130% for most elements, with tighter limits (90-110%) for well-established analytes [54] [56].
Table 4: Trueness Assessment Using Certified Reference Materials
| Element | CRM Matrix | Certified Value (μg/L) | Measured Value (μg/L) | Recovery (%) |
|---|---|---|---|---|
| Cr | Fortified lake water [55] | 19.4 | 18.9 | 97.4 |
| Cr | Hard drinking water [55] | 48.8 | 50.2 | 102.9 |
| Na | Human albumin [56] | 23.0 μg/mL | 23.2 μg/mL | 100.5-101.5 [56] |
| K | Human albumin [56] | 3.90 μg/mL | 3.68 μg/mL | 93.9-95.9 [56] |
Analytical Workflow
The following diagram illustrates the complete ICP-MS method validation workflow for water analysis:
ICP-MS Method Validation Workflow
The Scientist's Toolkit: Essential Research Reagents and Materials
Table 5: Essential Research Reagent Solutions for ICP-MS Water Analysis
| Item | Function | Application Example |
|---|---|---|
| TraceCERT Multielement Standard [55] | Calibration and quality control | Preparation of calibration standards for Cr, As, Cd, Pb analysis |
| Ultrapure HNO₃ (67%) [55] | Sample preservation and acidification | Acidification of water samples to pH <2 for metal stability |
| Internal Standard Mix (Sc, Ir, Rh) [54] [55] | Correction for instrument drift and matrix effects | Addition to all samples and standards for signal normalization |
| Certified Reference Materials [55] | Method validation and trueness assessment | TMDA 64.3 fortified lake water for verifying method accuracy |
| IonPac AG-7 Guard Column [55] | Chromium speciation analysis | Separation of Cr(III) and Cr(VI) in IC-ICP-MS applications |
| High-Purity Argon Gas [1] | Plasma generation and aerosol transport | Sustaining stable plasma for efficient atomization and ionization |
Comprehensive validation of linearity, LOD/LOQ, precision, and trueness establishes the foundation for reliable ICP-MS analysis of trace elements in water matrices. The protocols outlined in this application note provide researchers with a systematic approach to demonstrating method suitability for its intended purpose, particularly within the framework of EPA Method 200.8 [53].
As regulatory requirements continue to evolve toward lower detection limits and additional elemental contaminants, rigorous method validation becomes increasingly critical. The strategies presented here—incorporating appropriate internal standards, utilizing certified reference materials, and implementing robust quality control measures—enable scientists to generate data of known quality that supports sound decision-making in water resource management and public health protection.
Use of Certified Reference Materials for Accuracy Assessment
Within the framework of advanced research employing Inductively Coupled Plasma Mass Spectrometry (ICP-MS) for trace elemental analysis in water, the verification of data accuracy is paramount. Certified Reference Materials (CRMs) provide the metrological foundation for this task, establishing a direct link to the International System of Units (SI) and enabling researchers to quantify and control analytical uncertainty [57]. CRMs are homogeneous, stable materials with one or more property values certified by a procedure that establishes metrological traceability, making them essential tools for method validation, instrument calibration, and quality control during routine analysis [58] [59]. Their use is critical for producing data that is not only precise but also accurate, reliable, and defensible, especially when measuring trace elements at or near regulatory limits in complex aqueous matrices [60] [7].
The Role of CRMs in the ICP-MS Workflow
Incorporating CRMs into the analytical workflow mitigates various sources of error inherent to ICP-MS analysis. Even with its excellent sensitivity and multi-element capabilities, ICP-MS is susceptible to spectral interferences, matrix effects, and instrumental drift [8]. For instance, polyatomic interferences from argon ions or sample matrix components can bias results for key analytes like arsenic [8]. Furthermore, in automated high-temporal-resolution monitoring, where systems operate with minimal human intervention, continuous quality verification via CRMs becomes even more critical to ensure the validity of the large datasets produced [23].
The following diagram outlines a logical workflow for integrating CRMs into key stages of an ICP-MS method for water analysis.
Experimental Protocols for Accuracy Assessment
Protocol 1: Initial Method Validation and Recovery Assessment
This protocol is performed when establishing a new ICP-MS method or when applying an existing method to a new type of water matrix.
- CRM Selection: Select a CRM that closely matches the sample matrix (e.g., drinking water, river water) and contains certified values for the target analytes at relevant concentrations [60] [61]. Examples include NIST 1643f (Trace Elements in Water) [61].
- Sample Preparation: Process the CRM according to the certificate's instructions. For many water CRMs, this may involve no preparation (direct analysis) or a simple acidification to preserve the elements in solution [61].
- Analysis: Analyze the CRM alongside method blanks and calibration standards using the developed ICP-MS method. The analysis should be replicated multiple times (n ≥ 3) to assess precision [57].
- Data Analysis and Acceptance:
- Calculate the percent recovery for each analyte:
Recovery (%) = (Measured Concentration / Certified Value) × 100. - Compare the recovery to predefined acceptance criteria, typically 80-120% for trace elements [7].
- Evaluate precision via the relative standard deviation (RSD) of the replicate measurements.
- Calculate the percent recovery for each analyte:
Protocol 2: Exact-Matching Isotope Dilution Mass Spectrometry (IDMS)
Isotope Dilution MS is a primary method of measurement known for its high accuracy and is often used to certify reference materials or for highly definitive analyses [57].
- Spiking: Precisely add a known amount of an enriched isotopic spike (e.g.,
⁶¹Nifor nickel analysis) to a known mass of the sample (e.g., drinking water) [57]. - Equilibration: Thoroughly mix to achieve isotopic homogeneity between the added spike and the native analyte in the sample.
- Analysis: Measure the altered isotope ratio in the spiked sample using ICP-MS.
- Calculation: Calculate the analyte concentration in the original sample using the measured isotope ratio, the known amount of spike added, and the natural isotopic abundances. This method is highly accurate because the isotope ratio is immune to signal drift and sample loss post-spiking [57]. The use of exact-matching IDMS for drinking water analysis has achieved expanded uncertainties of less than 2% (k = 2) for toxic metals like Ni, Cd, and Pb [57].
Application in Current Water Research
The critical role of CRMs is evident across modern ICP-MS applications, from regulatory compliance to cutting-edge environmental monitoring.
Table 1: Summary of CRM Applications in Recent ICP-MS Water Research
| Research Context | CRM Application | Quantitative Outcome / Performance | Source |
|---|---|---|---|
| Bottled Water Quality | Used to validate method for 21 trace/heavy metals; ensured accuracy against WHO limits. | Recovery ranged from 80 to 120%; LODs between 0.0003–1.86 µg/L. [7] | |
| High-Accuracy Drinking Water Analysis | Employed exact-matching IDMS traceable to NIST for Ni, Cd, Pb. | Achieved expanded uncertainty < 2% (k=2), enabling high-accuracy result verification. [57] | |
| Automated River Monitoring | Required for validation of a fully automated, high-temporal-resolution (hourly) method for 56 elements. | Essential for ensuring data quality in continuous, unattended operation over one month. [23] | |
| Soil Analysis (Comparative) | CRM's used to compare ICP-MS vs. XRF; highlighted ICP-MS's superior sensitivity for trace elements. | Underlined the necessity of CRMs for accurate contamination assessment in complex matrices. [62] |
Case Study: Automated River Water Monitoring
A seminal 2025 study demonstrated a fully automated "atline" ICP-MS system for hourly multi-element (56 elements) monitoring of the Rhine River [23]. In this setup, a self-cleaning autosampler continuously collected filtered river water and presented it to an ICP-MS controlled by a Python script [23]. The workflow for such an automated system is illustrated below.
In this application, CRMs were analyzed periodically to validate the system's performance without human intervention, ensuring that the high-temporal-resolution data (one mixed sample per hour over a month) was quantitatively accurate and could reliably capture short-term pollution events and natural variations [23].
The Scientist's Toolkit: Essential Research Reagent Solutions
Table 2: Key Reagents and Materials for ICP-MS Trace Element Analysis of Water
| Item | Function | Critical Features & Examples |
|---|---|---|
| Single-Element CRMs | Used for preparing primary calibration standards and for method development for specific analytes. | High-purity materials; traceable to NIST [58]. E.g., TraceCERT for AAS/ICP-MS. |
| Multi-Element CRMs | Used for routine calibration, quality control, and performance checks across a wide range of elements. | Certified for a suite of elements; available as tuning solutions or custom mixtures [58]. |
| Matrix-Matched CRMs | Used for method validation and accuracy assessment; mimics the sample's chemical composition. | Closely matches the sample matrix (e.g., drinking water, river water) to correct for matrix effects [60] [61]. E.g., NIST 1643f. |
| Isotopic Spikes | Used for Isotope Dilution MS, a primary method for achieving the highest accuracy and traceability. | Enriched in a specific isotope; used for exact-matching IDMS [57]. |
| High-Purity Acids & Reagents | Used for sample preservation, digestion, and dilution to prevent contamination. | Low trace metal background; e.g., HNO₃ for sample acidification [61]. |
Certified Reference Materials are the cornerstone of accuracy in ICP-MS-based trace element analysis in water research. Their rigorous application—from initial method validation using exact-matching isotope dilution techniques to ensuring the reliability of fully automated, high-frequency environmental monitoring—provides the scientific confidence necessary for understanding geochemical cycles, complying with regulations, and protecting water resources. As ICP-MS technology evolves toward greater automation and sensitivity, the role of CRMs as unchanging benchmarks for quality and accuracy will only become more critical.
Within environmental sciences, the accurate determination of trace elements in water is paramount for assessing water quality, understanding biogeochemical cycles, and ensuring regulatory compliance. The selection of an appropriate analytical technique is a critical decision that influences data quality, operational efficiency, and research outcomes. This application note provides a detailed comparative analysis of two cornerstone techniques for trace elemental analysis: Inductively Coupled Plasma Mass Spectrometry (ICP-MS) and Inductively Coupled Plasma Optical Emission Spectrometry (ICP-OES). The content is framed within the context of water research, offering structured data and validated protocols to guide researchers and method developers in selecting and implementing the most suitable analytical approach for their specific applications.
Fundamental Principles and Technical Comparison
Operational Mechanisms
ICP-MS (Inductively Coupled Plasma Mass Spectrometry): This technique measures the mass-to-charge ratio (m/z) of ions generated from the sample in a high-temperature argon plasma [63]. The ions are separated by a mass spectrometer (typically a quadrupole) and detected, allowing for identification and quantification of elements [64]. The sample passes through a vacuum interface and a collision cell, often pressurized with helium, to remove polyatomic interferences before reaching the detector [52].
ICP-OES (Inductively Coupled Plasma Optical Emission Spectrometry): In contrast, ICP-OES relies on the measurement of the intensity of light emitted by excited atoms or ions in the plasma [63]. Each element emits characteristic wavelengths when returning to its ground state from an excited state. This emitted light is dispersed and detected by an optical spectrometer to identify and quantify the elements present [65].
Comparative Performance Parameters
The choice between ICP-MS and ICP-OES is primarily governed by required sensitivity, elemental coverage, and sample matrix. Table 1 summarizes the key technical and operational differences between these two techniques, providing a basis for initial method selection.
Table 1: Comparative Performance of ICP-MS and ICP-OES
| Parameter | ICP-MS | ICP-OES |
|---|---|---|
| Detection Method | Mass-to-charge ratio (m/z) of ions [63] | Intensity of emitted light [63] |
| Typical Detection Limits | Parts per trillion (ppt) [64] [65] | Parts per billion (ppb) [64] [65] |
| Linear Dynamic Range | Up to 8-9 orders of magnitude [63] | Up to 6 orders of magnitude [63] |
| Elemental Coverage | Up to 82 elements; isotopic information [63] | Up to 73 elements; no isotopic information [63] |
| Sample Throughput | High (often <1 minute per sample) [63] | High (1-60 elements per minute) [63] |
| Tolerance for Total Dissolved Solids (TDS) | Low (~0.2%); often requires dilution [65] [63] | High (up to ~30%); more robust [65] |
| Primary Interferences | Isobaric (polyatomic) [63] | Spectral (overlapping emission lines) [63] |
| Capital and Operational Cost | High [63] | Lower [63] |
Positioning Among Alternative Techniques
While ICP-MS and ICP-OES are workhorses for liquid analysis, other techniques offer complementary capabilities. X-Ray Fluorescence (XRF) is a non-destructive technique with minimal sample preparation, but its detection limits are typically in the parts-per-million range, making it unsuitable for ultra-trace analysis in water [64]. For direct solid sample analysis, Laser Ablation Laser Ionization Time-of-Flight Mass Spectrometry (LALI-TOF-MS) represents an advancement, eliminating the need for digestion with detection limits in the parts-per-billion range [66]. When hyphenated with separation techniques like Size-Exclusion Chromatography (SEC-ICP-MS), ICP-MS can perform metallobiomolecule profiling, quantifying metal distributions in complex biological fluids [67].
The following workflow diagram illustrates the decision-making process for selecting an appropriate elemental analysis technique based on key application requirements.
Application-Focused Protocol: ICP-MS Analysis of Trace Elements in Diverse Water Matrices
This protocol is validated for the determination of trace elements in water samples with varying salinity, including freshwater, wastewater, and coastal seawater, based on established methodologies [65] [52].
Research Reagent Solutions and Essential Materials
Table 2: Key Reagents and Consumables for ICP-MS Water Analysis
| Item | Function/Use | Critical Notes |
|---|---|---|
| High-Purity Nitric Acid | Sample preservation and digestion; preparation of calibration standards. | Essential to minimize background contamination. Use trace metal grade [52]. |
| Internal Standard Mix | Correction for signal drift and matrix effects. | A mix of Sc, Ge, Rh, In, Tb, Lu, or Bi is recommended, added online or to all samples and standards [68]. |
| Multi-Element Calibration Standards | Instrument calibration for target analytes. | Commercially available certified reference materials. Prepare in same acid matrix as samples. |
| High-Purity Helium (He) Gas | Cell gas for Collision Mode. | Efficiently removes polyatomic interferences (e.g., ClO⁺ on V⁺, Cr⁺, As⁺) [68] [52]. |
| Hydrochloric Acid (HCl) | Added to stabilize certain elements. | 0.5-1.0% HCl helps stabilize Hg, As, Se, Mo, Tl, and Ag, but can cause Cl-based interferences [68]. |
| Acid-Washed Labware | Sample collection and storage. | All vials, pipette tips, and containers must be acid-washed to prevent leaching of contaminants like Sb, Zn, Mn, Fe, and Ba [52]. |
Detailed Step-by-Step Methodology
Step 1: Sample Collection and Preservation
- Collect water samples in pre-cleaned, acid-washed polyethylene or polypropylene bottles [52].
- Immediately after collection, acidify samples to pH < 2 using high-purity nitric acid for metal preservation.
- For high-salinity samples (>3% NaCl), note that dilution will be required in a subsequent step [52].
Step 2: Sample Preparation
- For low-TDS waters (e.g., drinking water): Analyze directly after acidification and the addition of internal standard.
- For high-TDS or high-salinity waters (e.g., seawater, wastewater): Perform a necessary dilution (e.g., 1:50) with 2% high-purity nitric acid to reduce total dissolved solids to below 0.2%, minimizing matrix effects and cone blockage [65] [52]. The dilution factor should be optimized to ensure analyte concentrations remain above the method detection limits.
Step 3: Instrument Setup and Tuning
- Use an Agilent 7900 ICP-MS or equivalent instrument.
- Instrument Conditions: Establish plasma with robust conditions. Measure the CeO+/Ce+ ratio to assess plasma robustness; a ratio of 1.0-1.5% indicates a robust plasma suitable for high-matrix samples [68].
- Collision Cell: Operate the collision/reaction cell in He-mode only for universal interference removal, unless specific methods require reactive gases [68].
- Autosampler: Utilize a large-capacity autosampler and a discrete sampling system (e.g., Agilent ISIS) for high throughput, enabling sample-to-sample times of less than 60 seconds [68].
Step 4: Calibration and Quality Control
- Prepare a blank and a series of multi-element calibration standards (e.g., 0.01, 0.1, 1, 10, 100 µg/L) in a matrix matching the diluted samples [52].
- Establish a quality control protocol including:
- Initial Calibration Verification (ICV): Analyze a certified reference material (CRM) at the beginning and end of the run.
- Continuing Calibration Verification (CCV): Analyze a mid-range standard every 10-20 samples.
- Internal Standard Recovery: Monitor internal standard signals for every sample to correct for drift and suppression/enhancement.
Step 5: Data Analysis
- Quantify element concentrations against the calibration curve.
- Apply the dilution factor to report final concentrations in the original sample.
- Report results for regulatory compliance under appropriate methods (e.g., EPA 200.8 for drinking water) [65].
The experimental workflow for this protocol, from sample to result, is summarized below.
The comparative analysis reveals that ICP-MS is the unequivocal choice for ultra-trace analysis in water research, offering part-per-trillion detection limits and isotopic capabilities, which are essential for compliance monitoring of toxic elements like arsenic and mercury in drinking water [65]. Its wide dynamic range is also advantageous for samples with analytes of vastly different concentrations. However, its operational complexity and higher sensitivity to matrix effects necessitate more skilled personnel and stringent sample preparation [63]. Conversely, ICP-OES presents a more robust and cost-effective solution for routine analysis of wastewater and other high-TDS matrices where regulatory limits are at parts-per-billion levels [65]. Its simpler operation and lower running costs make it ideal for high-throughput laboratories where ultimate sensitivity is not required.
Concluding Recommendations for Water Researchers
For a water research laboratory, the choice between ICP-MS and ICP-OES is not a matter of superiority but of fitness for purpose. Researchers should base their decision on the following key questions:
- What are the required detection limits? For pristine water systems or stringent regulatory limits, ICP-MS is necessary.
- What is the sample matrix? For complex, high-salinity, or wastewater, ICP-OES is more robust, though ICP-MS with advanced matrix introduction systems can be used [68].
- What is the analytical scope? If isotopic information or hyphenated speciation (e.g., SEC-ICP-MS) is planned, ICP-MS is the only viable option [67].
- What are the resource constraints? Budget, available expertise, and sample throughput must be balanced against technical requirements.
In conclusion, a thorough understanding of the capabilities and limitations of both ICP-MS and ICP-OES, as detailed in this application note, empowers researchers to make an informed selection. This ensures the generation of reliable, high-quality data that is fundamental to advancing water research and safeguarding water resources.
Implementing Quality Control and Assurance Protocols
Quality control (QC) and quality assurance (QA) are fundamental pillars of analytical chemistry, ensuring the reliability, accuracy, and traceability of data generated in environmental research. For trace elemental analysis in water using Inductively Coupled Plasma Mass Spectrometry (ICP-MS), implementing robust QC/QA protocols is particularly critical due to the technique's extreme sensitivity and the complex, challenging nature of water matrices, especially seawater. These protocols safeguard against false positives/negatives, control for matrix effects and instrument drift, and provide the rigorous validation required for regulatory compliance and scientific publication. This document outlines comprehensive QC/QA protocols within the context of a broader thesis on developing and validating ICP-MS methods for trace elemental analysis in water research.
Essential Quality Control Materials and Procedures
A robust QC framework for ICP-MS analysis relies on a suite of certified materials and standardized procedures designed to monitor analytical performance throughout a sequence. The selection of appropriate QC materials is paramount for method validation and ongoing verification.
Table 1: Essential Quality Control Materials for ICP-MS Analysis of Water
| QC Material | Description | Primary Function in QC/QA | Application Example |
|---|---|---|---|
| Certified Reference Materials (CRMs) | Materials with certified concentrations of analytes, often in a matrix similar to the sample. | Assess method accuracy and trueness; validate the entire analytical procedure. | IAEA-443 Seawater CRM used to validate a method for Cd, Co, Pb, and others, yielding recoveries of 104%–118% [69]. |
| Internal Standards (IS) | A solution of non-analyte elements (e.g., Rh, Ir, Sc) added to all samples, blanks, and standards. | Correct for signal drift and matrix-induced suppression or enhancement (matrix effects). | Rhodium-103 (103Rh) and Iridium-193 (193Ir) were used as ISs in the direct analysis of seawater to ensure stable performance over 12 hours [69]. |
| Calibration Standards | A series of solutions with known analyte concentrations, used to construct the calibration curve. | Establish the quantitative relationship between instrument response and analyte concentration. | A series of standards prepared from a TraceCERT multi-element standard solution for the calibration of ICP-OES and ICP-MS [55]. |
| Method Blanks | A volume of ultra-pure water (e.g., 18.2 MΩ·cm) that undergoes the same preparation procedure as samples. | Identify and quantify contamination introduced from reagents, labware, or the environment. | The use of Milli-Q grade water for preparing blanks and dilutions is essential to confirm the absence of background contamination [69] [55]. |
| Continuing Calibration Verification (CCV) | A standard, analyzed after every certain number of samples (e.g., every 10-20 samples). | Verify the continued accuracy of the initial calibration throughout the analytical run. | Stable CCV recoveries over a 12-hour analysis demonstrate a system's robustness for high-salt matrices [6]. |
Key QC Procedures
Initial Calibration: Establish a calibration curve using at least three standard solutions (excluding the blank) covering the expected concentration range. The coefficient of determination (R²) should typically be ≥ 0.995.
Detection and Quantification Limits: The Limit of Detection (LOD) and Limit of Quantification (LOQ) should be determined empirically. The LOD is calculated as a multiple of the standard deviation of blank measurements [70]. For a FI-ICP-MS method, LoDs for eight trace elements ranged from 0.003 to 0.2 µg/L [69].
Analysis of CRMs and Spikes: Analyze a CRM or a spiked sample with every batch (e.g., ≤ 20 samples). Recovery of the certified value or spike should be within acceptable limits (e.g., 85-115%), demonstrating accuracy. One study considered recoveries of 104%–118% for a seawater CRM acceptable [69].
Detailed Methodologies for Key Experiments
Protocol 1: Direct Analysis of Coastal Seawater Using ICP-MS
This protocol is adapted from a webinar detailing a robust method for analyzing trace elements in high-salinity matrices without pre-concentration, using a PerkinElmer NexION 2200 ICP-MS [6].
1. Sample Preparation:
- Collect seawater samples in pre-cleaned (e.g., acid-washed) low-density polyethylene or fluorinated bottles.
- Filter samples immediately after collection through a 0.45 µm pore-size membrane filter (e.g., PVDF syringe filter) to remove suspended particulates [69].
- Acidify the filtered sample to a final concentration of 0.05% HNO₃ using high-purity nitric acid to stabilize the trace metals and prevent adsorption to container walls [69].
2. Instrumental Setup:
- ICP-MS Instrument: PerkinElmer NexION 2200 or equivalent.
- Sample Introduction System: Equip with an All Matrix Solution (AMS) system to handle high TDS and minimize matrix deposition. A high-throughput system (HTS) is recommended for efficient sample introduction.
- Internal Standards: Prepare a solution containing Rh (103) and Ir (193) in 0.05% HNO₃. This solution is added online to all samples and standards to correct for signal drift and matrix effects [69].
- Nebulizer: An ultrasonic nebulizer is recommended to enhance sensitivity and reduce the salt load on the plasma torch [69].
3. Quality Control Measures:
- Method Blank: Use ultra-pure water (18.2 MΩ·cm) acidified to 0.05% HNO₃.
- Calibration Verification (CCV): Analyze a mid-level calibration standard after every 10-15 samples. Acceptance criterion: recovery within ±10% of the true value.
- Internal Standard Recovery: Monitor IS responses throughout the run. A significant deviation (> ±20%) may indicate a problem with the sample matrix or instrument stability.
4. Data Analysis:
- Use the internal standard-corrected analyte signals for quantification against the calibration curve.
- Apply a post-analysis correction if necessary based on the recovery of the CRM analyzed with the batch.
Protocol 2: Flow Injection ICP-MS with Ultrasonic Nebulization for Seawater
This method, developed for the direct quantification of Cd, Co, Pb, Mn, Mo, Sn, U, and V in seawater, uses a flow injection (FI) system to manage the sample matrix effectively [69].
1. System Configuration:
- ICP-MS: PerkinElmer NexION-300D.
- Nebulizer: Teledyne Cetac U6000AT+ Ultrasonic Nebulizer.
- Flow Injection (FI) System: A custom FI system with a 6-port switching valve and a 200 µL PEEK sample loop.
- Eluent: 0.05% HNO₃ containing the internal standards (103Rh and 193Ir).
- Flow Rate: 0.70 mL/min.
2. Operational Workflow:
- The FI system's switching valve directs the flow between the eluent (for washing) and the sample.
- In the "load" position, the sample loop is filled with the filtered seawater sample.
- In the "inject" position, the eluent stream carries the sample from the loop to the ultrasonic nebulizer and into the plasma.
- Between analyses, the system is washed with 1% HNO₃ via a peristaltic pump to minimize carryover and salt buildup [69].
3. Method Validation:
- Linearity: The calibration curve was linear across the tested range for all elements.
- LOD and LOQ: Procedural LODs ranged from 0.003 to 0.2 µg/L, and LOQs from 0.01 to 0.7 µg/L.
- Precision: Instrumental repeatability (RSD%) was between 1.2% and 6.6%.
- Accuracy: Determined using the IAEA-443 seawater CRM, with recoveries reported between 104% and 118% [69].
The Scientist's Toolkit: Key Research Reagent Solutions
Successful implementation of ICP-MS QC/QA protocols requires the use of specific, high-purity reagents and materials. The following table details essential items for trace element analysis in water.
Table 2: Essential Reagents and Materials for ICP-MS Water Analysis
| Item | Function / Purpose | Specifications / Examples |
|---|---|---|
| High-Purity Acids | Sample preservation, digestion, and preparation of eluents/standards. Essential to minimize background contamination. | Ultrapure Nitric Acid (HNO₃), e.g., NORMATOM Ultrapure or equivalent. Fuming HNO₃ (100%) for preparing stock solutions [69] [55]. |
| Ultra-Pure Water | Diluent for standards, preparation of blanks, and rinsing. Low elemental background is critical. | Resistivity of 18.2 MΩ·cm, produced by systems like Millipore Synergy or Merck Millipore Direct-Q [69] [55]. |
| Certified Reference Materials (CRMs) | Method validation and verification of analytical accuracy. | IAEA-443 (Seawater for Trace Elements) [69]. TMDA 64.3 (Fortified Lake Water) and Hard Drinking Water (LGC Standards) [55]. |
| Multi-Element & Single-Element Standard Solutions | Preparation of calibration curves, CCVs, and spiking solutions. | TraceCERT multi-element standards (e.g., 10 mg/L) [55]. AccuTrace Reference Standards (1.000 g/L) [69]. |
| Internal Standard Solution | Correcting for instrumental drift and matrix effects; added to all samples and standards. | A mixture of non-analyte elements not expected in the sample. Common choices: 45Sc, 103Rh, 193Ir, 115In [69] [55]. |
| Purified Sodium Chloride (NaCl) | Preparing matrix-matched standards and blanks for seawater analysis. | High-purity NaCl (e.g., 99%, J.T. Baker) purified by recrystallization to remove trace metal contaminants [69]. |
Workflow Visualization of QC/QA Protocol
The following diagram illustrates the logical workflow of a full QC/QA protocol for an ICP-MS analytical run, from initial preparation to final data reporting and acceptance.
Diagram 1: A QC/QA workflow for ICP-MS trace element analysis in water. This flowchart outlines the critical steps, decision points, and feedback loops necessary to ensure data integrity. The process emphasizes the importance of verifying calibration stability and CRM recovery before and during sample analysis [6] [69].
Conclusion
ICP-MS stands as an indispensable, highly sensitive technique for trace elemental analysis in water, capable of tackling complex matrices from coastal seawater to biological fluids. Mastering advanced methods like direct analysis, spICP-MS, and hyphenated techniques is crucial for expanding application horizons, particularly in nanomedicine and biomedical research. Success hinges on robust method development, proactive troubleshooting of interferences, and rigorous validation to ensure data integrity. Future directions will likely focus on increasing multi-element capabilities for transient signals, further automating interference removal, and developing standardized protocols for nanoparticle analysis in biological systems, thereby solidifying ICP-MS's role in advancing public health and clinical diagnostics.
References
- 1. Best Practices for Optimizing ICP-MS Analytical Methodology [https://www.spectroscopyonline.com/view/best-practices-for-optimizing-icp-ms-analytical-methodology-impact-of-the-evolving-application-landscape]
- 2. Inductively Coupled Plasma Mass Spectrometry: Introduction ... [https://pmc.ncbi.nlm.nih.gov/articles/PMC6719745/]
- 3. Pollution of water resources and application of ICP-MS ... [https://www.sciencedirect.com/science/article/pii/S277288382300033X]
- 4. Method Development with ICP-MS/MS: Tools and ... [https://www.spectroscopyonline.com/view/method-development-icp-msms-tools-and-techniques-ensure-accurate-results-reaction-mode]
- 5. ICP-MS in Environmental Monitoring: Detecting ... [https://conquerscientific.com/icp-ms-in-environmental-monitoring-detecting-contaminants-at-ultra-trace-levels/]
- 6. Direct Analysis of Coastal Seawater for Trace Elements ... [https://www.spectroscopyonline.com/view/direct-analysis-of-coastal-seawater-for-trace-elements-using-icp-ms]
- 7. Determination of trace and heavy metals in bottled drinking ... [https://www.sciencedirect.com/science/article/pii/S2211715624002546]
- 8. How To Optimize ICP-MS for Trace Element Analysis [https://www.technologynetworks.com/analysis/how-to-guides/how-to-optimize-icp-ms-for-trace-element-analysis-404382]
- 9. Performance of ICP-TOF-MS for ultra-trace element ... [https://pubs.rsc.org/en/content/articlelanding/2025/ja/d5ja00286a]
- 10. Publication : USDA ARS [https://www.ars.usda.gov/research/publications/publication/?seqNo115=421289]
- 11. An improved protocol for LA-MC-ICP-MS isotope ratio ... [https://pubs.rsc.org/en/content/articlehtml/2025/ja/d5ja00015g]
- 12. Evaluating the Impact of ICP-MS and LIBS on ... [https://www.spectroscopyonline.com/view/evaluating-the-impact-of-icp-ms-and-libs-on-environmental-monitoring]
- 13. ICP-MS: When Sensitivity Does Matter [https://www.spectroscopyonline.com/view/icp-ms-when-sensitivity-does-matter]
- 14. Inductively coupled plasma mass spectrometry - Wikipedia [https://en.wikipedia.org/wiki/Inductively_coupled_plasma_mass_spectrometry]
- 15. ICP-MS method development and validation for ... [https://www.sciencedirect.com/science/article/abs/pii/S1387380619304865]
- 16. Development and Validation of an ICP-MS Method for the ... [https://www.mdpi.com/2073-4441/14/17/2631]
- 17. Ultratrace Analysis [https://www.csp.fraunhofer.de/en/areas-of-research/material-analytics/ultratrace-analysis.html]
- 18. Key Steps in Method Development for Inductively Coupled ... [https://www.spectroscopyonline.com/view/key-steps-in-method-development-for-inductively-coupled-plasma-tandem-mass-spectrometry-icp-ms-ms-]
- 19. Trace element determination in seawater by ICP-MS using ... [https://www.sciencedirect.com/science/article/abs/pii/S0026265X12001506]
- 20. Trace elements determination in seawater by ICP-MS with ... [https://pmc.ncbi.nlm.nih.gov/articles/PMC4522618/]
- 21. Advances in ICP‐MS‐Based Nanoparticle Characterization [https://pmc.ncbi.nlm.nih.gov/articles/PMC12423364/]
- 22. ICP-MS-Based Characterization and Quantification of Nano [https://pmc.ncbi.nlm.nih.gov/articles/PMC11013940/]
- 23. Automated high-temporal-resolution multi-element river water ... [https://enveurope.springeropen.com/articles/10.1186/s12302-025-01131-8]
- 24. Single-Particle ICP-MS/MS Application for Routine ... [https://pmc.ncbi.nlm.nih.gov/articles/PMC10574118/]
- 25. Single particle ICP-MS: a tool for the characterization of ... [https://xlink.rsc.org/?DOI=D4JA00141A]
- 26. Determination of metal oxide and metallic nanoparticles in ... [https://link.springer.com/article/10.1007/s00604-025-07139-4]
- 27. Trace element determination using mass spectrometry ... [https://www.sciencedirect.com/science/article/abs/pii/S2214158824000333]
- 28. Hyphenated ICP-MS Techniques for Speciation Analysis [https://www.spectroscopyonline.com/view/hyphenated-icp-ms-techniques-speciation-analysis]
- 29. Environmental application of elemental speciation analysis ... [https://www.sciencedirect.com/science/article/abs/pii/S0003267010004927]
- 30. The coupling of LC to ICP-MS in element speciation [https://www.sciencedirect.com/science/article/abs/pii/S0165993601001467]
- 31. Hyphenated Techniques: LC-MS, GC-MS, and ICP-MS [https://www.labmanager.com/hyphenated-techniques-lc-ms-gc-ms-and-icp-ms-34245]
- 32. Reliable Water Analysis With ICP-MS [https://www.technologynetworks.com/applied-sciences/application-notes/reliable-water-analysis-with-icp-ms-397412]
- 33. ICP-MS for high-precision drinking water analysis with ... [https://www.selectscience.net/article/icp-ms-for-high-precision-drinking-water-analysis-with-the-lowest-possible-cost-per-sample]
- 34. Development of a direct dilution method for the ... [https://www.sciencedirect.com/science/article/abs/pii/S0039914025002553]
- 35. Development of a SEC-ICP-MS platform for multielement ... [https://pubs.rsc.org/en/content/articlehtml/2025/ja/d5ja00182j?page=search]
- 36. Trace element determination in water samples by on-line ... [https://www.sciencedirect.com/science/article/abs/pii/S0026265X13002543]
- 37. Method 200.7: Determination of Metals and Trace ... [https://www.epa.gov/esam/method-2007-determination-metals-and-trace-elements-water-and-wastes-inductively-coupled]
- 38. ICP/MS comparison | PPTX [https://www.slideshare.net/slideshow/icp-icpms-comparison/76819661]
- 39. Overcoming polyatomic interferences in sulfur isotope ... [https://research-portal.st-andrews.ac.uk/en/publications/overcoming-polyatomic-interferences-in-sulfur-isotope-analysis-us]
- 40. Direct Analysis of Coastal Seawater for Trace Elements ... [https://www.spectroscopyonline.com/view/executive-summary-direct-analysis-of-coastal-seawater-for-trace-elements-using-icp-ms]
- 41. Expanding time-resolved ICP-MS capabilities for ... [https://pubmed.ncbi.nlm.nih.gov/41167893/]
- 42. Overcome ICP-MS signal enhancement in food analysis [https://www.agilent.com/en/product/atomic-spectroscopy/inductively-coupled-plasma-mass-spectrometry-icp-ms/overcoming-icp-ms-signal-enhancement-in-food-analysis-by-addition-of-carbon-dioxide?srsltid=AfmBOoqXSCoDD_qA9Yck5h_nRzV-KGp4xVoD8AeQYj9ko0s1m0sfsrdd]
- 43. ICP Source Spectrometry Techniques in Regulated Water ... [https://www.spectroscopyonline.com/view/icp-source-spectrometry-techniques-regulated-water-analysis]
- 44. A new strategy to correct matrix effects of carbon origin in ... [https://www.sciencedirect.com/science/article/abs/pii/S0003267024004768]
- 45. Development of a HPIC-ICP-MS method for the quantification ... [https://pubs.rsc.org/en/content/articlehtml/2025/ja/d5ja00203f]
- 46. Optimization of ICP-MS Detection Using Improved Plasma ... [https://eureka.patsnap.com/report-optimization-of-icp-ms-detection-using-improved-plasma-control]
- 47. Sample Introduction for ICP-MS and ICP-OES [https://www.spectroscopyonline.com/view/sample-introduction-icp-ms-and-icp-oes]
- 48. Best Practices for ICP-MS Sample Introduction [https://www.sepscience.com/best-practices-for-icp-ms-sample-introduction-6527]
- 49. Sample Introduction Systems [https://www.inorganicventures.com/icp-guide/sample-introduction-systems]
- 50. FAST Sample Introduction Systems | ESI [https://www.icpms.com/products/fast-sample-intro-systems/]
- 51. Minimizing interferences in ICP-MS/MS analysis of 16 ... [https://pubmed.ncbi.nlm.nih.gov/40549159/]
- 52. Standard Operating Procedure for the determination of trace elements in hydrothermal fluids by Inductively Coupled Plasma Mass Spectrometry (ICP-MS) - PMC [https://pmc.ncbi.nlm.nih.gov/articles/PMC11316169/]
- 53. Analyzing Trace Elements With EPA Method 200.8 [https://www.thermofisher.com/us/en/home/industrial/environmental/environmental-learning-center/environmental-resource-library/us-epa-methods/analyzing-trace-elements-epa-method-200-8.html]
- 54. - ICP trace element analysis in serum and whole blood | PLOS One MS [https://journals.plos.org/plosone/article?id=10.1371/journal.pone.0233357]
- 55. Method validation and geochemical modelling of chromium ... [https://www.nature.com/articles/s41598-024-77425-3]
- 56. - ICP Method for Simultaneous Determination of Aluminum, Sodium... MS [https://pmc.ncbi.nlm.nih.gov/articles/PMC11867715/]
- 57. High accuracy measurements of trace elements in drinking ... [https://www.sciencedirect.com/science/article/abs/pii/S1387380612001753]
- 58. ICP & AAS standards [https://www.sigmaaldrich.com/US/en/products/analytical-chemistry/reference-materials/icp-and-aas-standards?srsltid=AfmBOorQUyWDsqWCQa1z96VhmJ3OiOVcpPVIe-OjotTb4sEe1w01jJPR]
- 59. Inorganic Standards | CRMs | Manufacturer [https://www.inorganicventures.com/inorganic-standards]
- 60. Determination of Trace Elements in Waters and Wastes by ... [https://www.epa.gov/esam/epa-method-2008-determination-trace-elements-waters-and-wastes-inductively-coupled-plasma-mass]
- 61. ICP-MS Metals and Strontium Isotope Facility - CMES Earth [https://earth.utah.edu/research_facilities/earth-core-facility/icp-ms.php]
- 62. Comparative Evaluation of Inductively Coupled Plasma Mass ... [https://pmc.ncbi.nlm.nih.gov/articles/PMC12030935/]
- 63. ICP-MS or ICP-OES: What's the difference? [https://gentechscientific.com/icp-ms-vs-icp-oes/]
- 64. Comparing ICP-MS, ICP-OES and XRF techniques for ... [https://www.malvernpanalytical.com/en/learn/knowledge-center/insights/comparing-icp-ms-icp-oes-xrf-elemental-impurity-testing-pharmaceuticals]
- 65. Comparison of ICP-OES and ICP-MS for Trace Element ... [https://www.thermofisher.com/us/en/home/industrial/environmental/environmental-learning-center/contaminant-analysis-information/metal-analysis/comparison-icp-oes-icp-ms-trace-element-analysis.html]
- 66. Mass Spectrometry for Quantifying Trace Elements [https://www.azom.com/article.aspx?ArticleID=24488]
- 67. Development of a SEC-ICP-MS platform for multielement ... [https://pubs.rsc.org/en/content/articlelanding/2025/ja/d5ja00182j]
- 68. Parameters to Consider When Evaluating ICP-MS ... [https://www.spectroscopyonline.com/view/parameters-consider-when-evaluating-icp-ms-configurations-and-performance]
- 69. Flow Injection Inductively Coupled Plasma‐Mass ... [https://pmc.ncbi.nlm.nih.gov/articles/PMC12272814/]
- 70. ICP Analysis [https://ral.cfans.umn.edu/tests-analysis/icp-analysis]