Beyond the Basics: Mastering the Beer-Lambert Law for Robust Quantitative Spectroscopy in Biomedical Research
This article provides a comprehensive guide to the Beer-Lambert Law, a cornerstone of quantitative spectroscopy, tailored for researchers and drug development professionals.
Beyond the Basics: Mastering the Beer-Lambert Law for Robust Quantitative Spectroscopy in Biomedical Research
Abstract
This article provides a comprehensive guide to the Beer-Lambert Law, a cornerstone of quantitative spectroscopy, tailored for researchers and drug development professionals. It moves from foundational principles to advanced applications, covering the law's mathematical formulation, its critical use in concentration determination via calibration curves, and common pitfalls like chemical and instrumental deviations. Crucially, it delves into modern modifications for complex matrices like biological tissues and validates the law's application through pharmaceutical case studies and comparisons with advanced techniques, empowering scientists to achieve accurate, reliable analytical results.
The Core Principles: Deconstructing the Beer-Lambert Law and Its Spectroscopic Foundation
The Beer-Lambert law, more accurately referred to as the Bouguer-Beer-Lambert law, is an empirical relationship that forms the cornerstone of optical spectroscopy and quantitative chemical analysis [1] [2]. It describes how the intensity of light diminishes exponentially as it passes through an absorbing medium, with the absorbance being proportional to the path length through the medium and the concentration of the absorbing species [1]. This fundamental principle is indispensable across diverse scientific disciplines and industries, including analytical chemistry, pharmaceutical development, atmospheric physics, and biomedical sensing [3] [2]. The law's elegant mathematical formulation and straightforward functionality have enabled the quantitative interpretation of spectroscopic data for over a century. However, the complete historical context of its development—spanning the separate contributions of Pierre Bouguer, Johann Heinrich Lambert, and August Beer over more than a century—is often overlooked. This whitepaper traces the precise historical trajectory of this fundamental scientific law, detailing its experimental underpinnings, mathematical formalization, and the critical limitations that modern researchers must acknowledge for accurate spectroscopic analysis in drug development and quantitative spectroscopy research.
Historical Development and Key Contributions
The development of the absorption law was not a singular event but an evolutionary process spanning more than a century, with each scientist building upon their predecessor's work.
Table 1: Historical Contributions to the Beer-Lambert Law
| Scientist | Year | Key Contribution | Mathematical Formulation | Experimental Context |
|---|---|---|---|---|
| Pierre Bouguer | 1729 | Established that light intensity decays exponentially with path length [1]. | Geometric progression of intensity decay [1]. | Atmospheric extinction of starlight [1] [4]. |
| Johann Heinrich Lambert | 1760 | Popularized and mathematically formalized the exponential decay law [1]. | ( -\mathrm{d}I = \mu I \mathrm{d}x ) leading to ( I = I_0 e^{-\mu d} ) [1]. | Propagation of light within a homogeneous, absorbing medium [1] [2]. |
| August Beer | 1852 | Demonstrated the dependence of absorption on the concentration of the solute [1] [5]. | Constant transmittance if the product of concentration and path length is constant [2]. | Colored solutions, correcting for reflection losses [1] [2]. |
| Robert Luther & Andreas Nikolopulos | 1913 | Provided the first modern formulation merging the laws into the familiar absorbance equation [1]. | ( A = \epsilon c l ) [1] [2]. | N/A |
Foundational Work by Bouguer and Lambert
The earliest work towards the law began with Pierre Bouguer's astronomical investigations published in 1729. While studying the attenuation of starlight by the Earth's atmosphere, Bouguer discovered that light intensity decreased in a geometric progression with the distance traveled through the atmosphere [1]. This seminal observation established the exponential nature of radiative extinction, though it lacked a rigorous mathematical description.
Johann Heinrich Lambert later popularized and generalized this finding in his 1760 work, Photometria [1] [5]. He expressed the law in a mathematical form strikingly similar to its modern version. Lambert began by assuming that the decrease in light intensity ((-dI)) when passing through an infinitesimally thin layer of a medium is proportional to the original intensity ((I)) and the thickness of the layer ((dx)). This led to the differential equation ( -\mathrm{d}I = \mu I \mathrm{d}x ), which, upon integration, yields the exponential decay formula ( I = I_0 e^{-\mu d} ), where (\mu) is the attenuation coefficient [1]. Critically, both Bouguer and Lambert studied systems where light propagated within the absorbing medium (the atmosphere), meaning reflection losses at interfaces were negligible—an important distinction for later applications [4] [2].
Beer's Critical Advancement
In 1852, August Beer extended the work to the realm of solutions [1] [5]. He discovered that for colored solutions, the transmittance remained constant so long as the product of the volume fraction of the solute ((\phi)) and the path length ((d)) was constant [2]. In his experiments, Beer took the crucial step of correcting for reflection losses at the cuvette interfaces before concluding on the absorption properties of the solution itself [2]. Although Beer was aware of Bouguer and Lambert's work, his analysis focused on a physically distinct context: homogeneous solutions where absorption dominates over scattering, unlike the atmospheric context which could involve significant scattering [1]. Beer conceptualized his result in terms of a geometric progression of opacity for increasing thickness [1].
Unification into the Modern Law
The separate laws of Bouguer-Lambert (path length dependence) and Beer (concentration dependence) were not immediately combined. August Beer did not introduce the molar concentration ((c)) nor the quantity we now call absorbance [2]. The modern formulation, which merges these concepts into the equation ( A = \epsilon c l ), where (A) is absorbance and (\epsilon) is the molar absorptivity, was not solidified until the early 20th century. An early, and possibly the first, modern formulation was given by Robert Luther and Andreas Nikolopulos in 1913 [1] [2].
Mathematical Formalisms and Derivations
The Beer-Lambert law can be derived from first principles, considering the attenuation of light through a homogeneous medium.
Fundamental Differential Equation
The derivation starts with Lambert's key assumption: for monochromatic light passing through an infinitesimal layer of thickness (dx), the fractional decrease in light intensity, (-\frac{dI}{I}), is proportional to (dx) [1] [6] [5]. Introducing the proportionality constant (\mu) (the Napierian attenuation coefficient) gives the fundamental differential equation for extinction: [ -\frac{dI}{I} = \mu \, dx ] This equation can be rearranged to: [ \frac{dI}{dx} = -\mu I ] This means the rate of decrease of intensity with distance is proportional to the intensity itself at that point [5].
Integration to the Final Form
To find the total attenuation over a finite path length (l), the differential equation is integrated. The left side is integrated from the initial intensity (I0) to the transmitted intensity (It), and the right side from path length 0 to (l) [1] [6]: [ \int{I0}^{It} \frac{dI}{I} = -\mu \int{0}^{l} dx ] [ \ln(It) - \ln(I0) = -\mu l ] [ \ln\left(\frac{It}{I0}\right) = -\mu l ] This is the Napierian form of the Bouguer-Lambert law. Converting to decadic logarithms (base 10) is standard practice in analytical chemistry: [ \log{10}\left(\frac{I0}{It}\right) = \frac{\mu}{2.303} \, l ] The absorbance (A) is defined as ( \log{10}(I0/It) ). Beer's contribution is incorporated by recognizing that the attenuation coefficient (\mu) is proportional to the concentration (c) of the absorbing species, giving (\mu / 2.303 = \epsilon c), where (\epsilon) is the molar absorptivity. This leads to the familiar combined Beer-Lambert law [1] [7] [8]: [ A = \log{10}\left(\frac{I0}{I_t}\right) = \epsilon \, c \, l ]
Diagram 1: Logical derivation workflow of the Beer-Lambert Law.
Limitations and Modern Theoretical Corrections
Despite its widespread utility, the Beer-Lambert law is an approximation with several well-documented limitations that can lead to significant deviations from ideal behavior, especially in high-precision research or complex matrices like biological tissues [4] [2].
Fundamental Limitations of the Classical Law
The classical derivation of the law relies on assumptions that are often not fully met in practical experimental settings.
- Fundamental (Real) Deviations: At high concentrations, the distance between absorbing molecules decreases, leading to intermolecular interactions that can alter the molecules' absorptive properties [3] [4]. Furthermore, the refractive index of the solution changes with concentration, a factor neglected in the classical derivation. This becomes significant at high concentrations, making the molar absorptivity (\epsilon) no longer constant and breaking the linear relationship between absorbance and concentration [3] [9].
- Chemical Deviations: Changes in the chemical environment of the analyte—such as variations in pH, temperature, or solvent composition—can shift the chemical equilibrium. This may cause a change in the absorption spectrum, including shifts in peak positions or the emergence of new peaks, violating the law's assumptions [3].
- Instrumental Deviations: The use of non-monochromatic light or the presence of stray light in a spectrophotometer can lead to deviations. The law assumes perfectly monochromatic light, but practical instruments have a finite spectral bandwidth [3] [4].
- Scattering and Optical Effects: The generic law does not account for light scattering. This is a critical limitation when analyzing turbid solutions, suspensions, or biological tissues. In such media, light is both absorbed and scattered, increasing the effective path length and causing non-linear deviations [1] [5]. Additionally, when light passes through a cuvette with parallel interfaces, wave optics effects like interference from multiple internal reflections can occur, which are not described by the classical exponential law [4] [2].
Table 2: Key Limitations of the Classical Beer-Lambert Law
| Limitation Type | Primary Cause | Impact on Absorbance Measurement |
|---|---|---|
| Fundamental/Real | High concentration, changing refractive index, intermolecular interactions [3] [9]. | Non-linearity between A and c; molar absorptivity (ε) is not constant. |
| Chemical | Shift in chemical equilibrium (e.g., pH, association) [3]. | Changes in absorption spectrum (peak shift/intensity). |
| Instrumental | Polychromatic light, stray radiation [3]. | Negative deviation from linearity. |
| Scattering | Presence of particulates or turbidity [1] [5]. | Positive deviation; increased apparent absorbance. |
| Optical Interference | Wave nature of light in thin films or with coherent sources [4] [2]. | Non-exponential decay; fringes in spectrum. |
Advanced Modifications and Unified Electromagnetic Framework
To address these limitations, particularly the fundamental deviations, researchers have developed advanced modifications based on electromagnetic theory.
The Modified Beer-Lambert Law (for Scattering Media): In biomedical optics, a common modification accounts for scattering in turbid media like tissues [5]. It introduces a Differential Pathlength Factor (DPF) and a scattering-dependent offset (G): [ A = \epsilon \, c \, d \cdot DPF + G ] Here, (d) is the physical source-detector separation, and the optical pathlength is (l = d \cdot DPF) (where DPF > 1). The factor (G) accounts for signal loss due to scattering [5]. This formulation is crucial for techniques like near-infrared spectroscopy (NIRS) and photoplethysmography (PPG).
Unified Electromagnetic Framework: A recent unified model tackles fundamental deviations at high concentrations by considering the complex refractive index (\hat{n} = n + ik), where the imaginary part (k) is related to absorption [3]. The model expands the refractive index as a function of concentration, (n \approx 1 + c\frac{NA \alpha'}{2 \in0}), and incorporates higher-order terms for concentrated solutions, leading to: [ k \approx \beta c + \gamma c^2 + \delta c^3 ] Substituting this into the absorption relation yields an extended Beer-Lambert law: [ A = \frac{ 4\pi \nu }{\text{ln}10 } (\beta c + \gamma c^2 + \delta c^3) d ] where (\beta), (\gamma), and (\delta) are refractive index coefficients. This model has demonstrated superior performance with a root mean square error (RMSE) of less than 0.06 for concentrated organic and inorganic solutions, significantly outperforming the classical law [3].
Practical Applications and Experimental Protocols
The Beer-Lambert law is a foundational tool in quantitative spectroscopy, enabling researchers to determine the concentration of unknown analytes.
The Scientist's Toolkit: Essential Research Reagents and Materials
The following table details key materials and reagents required for a standard UV-Vis absorption spectroscopy experiment, as used in foundational and modern research [3] [10].
Table 3: Research Reagent Solutions and Essential Materials
| Item | Function / Rationale | Example / Specification |
|---|---|---|
| Analytical Grade Solute | The absorbing species of interest under investigation. | Potassium permanganate, crystal violet, Rhodamine B [3] [10]. |
| High-Purity Solvent | Dissolves solute without interfering absorbance in the spectral range of interest. | Distilled or deionized water, spectral-grade organic solvents [3]. |
| Volumetric Flasks | Precise preparation and dilution of standard solutions. | Class A glassware [3]. |
| Cuvettes | Holds the sample solution in the fixed, known path length of the light beam. | Standard path lengths of 1 cm; material (e.g., quartz, glass) must be transparent at the wavelength used [3] [8] [10]. |
| UV-Vis Spectrophotometer | Measures the intensity of light before (I₀) and after (I) it passes through the sample. | Instrument capable of emitting monochromatic light and detecting transmitted intensity [3] [10]. Must be calibrated for wavelength accuracy [3]. |
| Holmium Glass Filter | Validates the wavelength accuracy of the spectrophotometer, critical for avoiding instrumental errors [3]. | Filter with known, sharp absorption peaks (e.g., at 361 nm, 445 nm) [3]. |
Standard Experimental Protocol for Quantitative Analysis
This protocol outlines the critical steps for creating a calibration curve and determining the concentration of an unknown sample, a fundamental task in drug development and analytical research [10].
Wavelength Selection and Instrument Calibration:
- Obtain an absorption spectrum of the target analyte by scanning over a range of wavelengths (e.g., 200-800 nm) using a standard solution.
- Identify the wavelength of maximum absorption ((\lambda_{max})) [10].
- Perform a wavelength accuracy test using a holmium glass filter to ensure the spectrophotometer is free from instrumental errors. The measured absorption peaks must align with known values within a specified tolerance (e.g., ±0.01) [3].
Preparation of Standard Solutions:
- Prepare a series of standard solutions with known concentrations, typically spanning from very dilute to the expected solubility limit. The concentrations should cover the range over which the analyte is expected to obey Beer's Law [3] [10].
- For example, a series for potassium permanganate might range from 0.0001 M to 2 M [3]. Maintain a constant temperature and chemically inert environment throughout the experiment.
Measurement and Calibration Curve Generation:
- Measure the absorbance of each standard solution at the predetermined (\lambda_{max}) [10].
- Plot the measured absorbance (A) versus the known concentration (c) for each standard to generate a Beer's Law (calibration) plot. A linear fit of the data gives the relationship (A = \epsilon l c), where the slope is the product (\epsilon l) [8] [10].
Analysis of Unknown Sample:
Diagram 2: Standard workflow for quantitative concentration analysis.
The journey from the individual discoveries of Bouguer, Lambert, and Beer to the unified Beer-Lambert law exemplifies the collaborative and cumulative nature of scientific progress. While this law provides an indispensable foundation for quantitative spectroscopy, modern researchers must be acutely aware of its constraints. Fundamental deviations at high concentrations, chemical equilibria, and the pervasive effects of light scattering in biological samples necessitate a sophisticated understanding that goes beyond the classical equation. The development of modified laws, particularly those grounded in electromagnetic theory, provides a more robust framework for accurate quantitative analysis in complex real-world applications, from pharmaceutical development to biomedical sensing. As such, the historical context is not merely a lesson in the past but a critical guide for the accurate application and future evolution of spectroscopic techniques in research and industry.
The Beer-Lambert law, also known simply as Beer's law, is a fundamental principle in optical spectroscopy that provides a quantitative relationship between the absorption of light and the properties of the material through which the light is traveling [7]. This law forms the theoretical foundation for quantitative analysis across numerous scientific disciplines, enabling researchers to determine the concentration of analytes in solutions across various fields including pharmaceutical development, clinical diagnostics, and environmental monitoring [11] [12]. The Beer-Lambert law's significance stems from its ability to transform spectroscopic measurements from mere qualitative identification to precise quantitative determination, making it an indispensable tool in analytical chemistry and related fields. In pharmaceutical research specifically, understanding and proper application of this law is critical for drug analysis, ensuring that products meet stringent safety and efficacy standards through accurate assessment of chemical composition, purity, and stability [13].
The Core Equation and Its Components
The Beer-Lambert law is mathematically expressed through a deceptively simple equation that belies its profound analytical utility:
A = εbc
Where:
- A is the measured Absorbance (unitless)
- ε is the molar Absorptivity (L·mol⁻¹·cm⁻¹)
- b is the path Length (cm)
- c is the analyte Concentration (mol/L)
Table 1: Components of the Beer-Lambert Equation
| Symbol | Term | Definition | Typical Units |
|---|---|---|---|
| A | Absorbance | Logarithm of the ratio of incident to transmitted light intensity | Unitless |
| ε | Molar Absorptivity | Measure of how strongly a chemical species absorbs light at a specific wavelength | L·mol⁻¹·cm⁻¹ |
| b | Path Length | Distance light travels through the absorbing medium | cm |
| c | Concentration | Amount of absorbing species in the solution | mol/L |
This relationship establishes that absorbance (A) is directly proportional to both the concentration (c) of the absorbing species and the path length (b) of the light through the sample, with the molar absorptivity (ε) serving as the proportionality constant that is unique to each chemical substance at a given wavelength [7] [14]. The linear relationship postulated by this equation enables the use of optical spectroscopy for quantitative analytical applications across diverse fields ranging from pharmaceutical sciences to clinical diagnostics [12].
Detailed Component Analysis
Absorbance (A)
Absorbance is defined via the incident intensity (I₀) and transmitted intensity (I) by the logarithmic relationship: A = log₁₀(I₀/I) [7]. This logarithmic transformation converts the exponential attenuation of light through an absorbing medium into a linear relationship with concentration, which is the fundamental insight that makes quantitative spectroscopy possible. An absorbance value of 0 indicates that no light of that particular wavelength has been absorbed, meaning the intensities of the sample and reference beam are equal (I₀/I = 1). An absorbance of 1 corresponds to a situation where 90% of the light at that wavelength has been absorbed, resulting in a transmitted intensity that is 10% of the incident intensity [7].
Molar Absorptivity (ε)
Molar absorptivity, also known as the extinction coefficient, is a unique physical constant of a chemical substance that relates to its ability to absorb light at a specific wavelength [14]. In essence, molar absorptivity represents "a measure of the amount of light absorbed per unit of concentration" at a defined wavelength [14]. Compounds with high molar absorptivity values are very effective at absorbing light, making them detectable at lower concentrations, which significantly enhances analytical sensitivity in quantitative applications such as pharmaceutical analysis where detecting trace components is often critical [13] [14].
Path Length (b)
The path length represents the distance that light travels through the absorbing sample, typically corresponding to the width of the cuvette or sample container used in spectroscopic measurements [15]. In conventional spectrophotometers, this is usually 1 cm, though various path lengths are available for different applications, particularly when analyzing highly absorbing samples where shorter path lengths are necessary to maintain absorbance values within the optimal measurable range.
Concentration (c)
Concentration represents the amount of the absorbing chemical species present in the solution, typically expressed in moles per liter (mol/L) [7]. According to the Beer-Lambert law, absorbance is directly proportional to concentration, which forms the basis for quantitative analysis - by measuring absorbance and knowing the molar absorptivity and path length, one can calculate the unknown concentration of an analyte [7] [15].
Experimental Validation and Methodologies
Fundamental Validation Protocol
The experimental validation of the Beer-Lambert law follows a systematic approach to verify the linear relationship between absorbance and concentration [15]. The general methodology involves preparing a series of standard solutions with known concentrations of the analyte, measuring their absorbance values at a specific wavelength, and analyzing the resulting data to establish a calibration curve.
Table 2: Standard Experimental Protocol for Beer-Lambert Law Validation
| Step | Procedure | Purpose | Critical Parameters |
|---|---|---|---|
| 1. Solution Preparation | Prepare standard solutions of known concentrations | Establish reference points for calibration | Purity of standards, precise dilution techniques |
| 2. Instrument Setup | Select appropriate wavelength, zero instrument with blank | Ensure accurate baseline measurement | Proper wavelength selection, use of matched cuvettes |
| 3. Absorbance Measurement | Measure absorbance of each standard solution | Generate data for calibration curve | Consistent temperature, stable instrument conditions |
| 4. Data Analysis | Plot absorbance vs. concentration, perform linear regression | Verify linear relationship and determine ε | Correlation coefficient (R²), residual analysis |
The fundamental principle states that "the absorbance or transmittance value of any solution is directly correlated (proportional) with both the concentration of the absorbing substance within the solution and the distance light travels through it" [15]. This relationship is extensively employed in UV/Vis spectroscopy, where a fixed path length (typically the length of a cuvette) allows for precise determination of absorber concentration [15].
Advanced Validation in Complex Matrices
In practical applications, especially in pharmaceutical research, validation often extends to more complex matrices. Recent investigations have empirically examined potential deviations from the Beer-Lambert law in scenarios involving high analyte concentrations and scattering biological matrices such as human serum and whole blood [12]. These studies typically involve comparing the performance of linear regression models based on the Beer-Lambert law with nonlinear machine learning models to detect and quantify deviations from linearity [12]. Such rigorous validation is particularly important in pharmaceutical analysis where complex drug formulations may present challenges including polymorphism, crystalline-amorphous transitions, and excipient interference that can impact accurate quantification [13].
Limitations and Systematic Deviations
Despite its fundamental importance, the Beer-Lambert law represents an idealization that is subject to specific limitations and systematic deviations in practical applications. Understanding these limitations is crucial for proper implementation in quantitative spectroscopy research, particularly in pharmaceutical development where analytical accuracy directly impacts product quality and patient safety [13] [11].
Table 3: Systematic Deviations from the Beer-Lambert Law
| Deviation Source | Impact on Linearity | Typical Magnitude | Corrective Approaches |
|---|---|---|---|
| Polychromatic Radiation | Negative deviation (reduced apparent ε) | Up to ~4% [11] | Use narrower slit widths, monochromators |
| High Analyte Concentration | Negative deviation due to electrostatic interactions | Concentration-dependent [12] | Dilute samples, use shorter path lengths |
| Scattering Media (e.g., blood, suspensions) | Positive or negative deviation depending on geometry | Matrix-dependent [12] | Scatter correction algorithms, specialized sampling |
| Chemical Associations (e.g., dimerization) | Positive or negative deviation | Chemical equilibrium-dependent | Control pH, ionic strength, temperature |
| Stray Light | Negative deviation, especially at high absorbance | Instrument-dependent | Use high-quality optics, filters |
The most significant systematic errors arise when using polychromatic radiation sources, which are common in conventional laboratory spectrophotometers [11]. This deviation occurs because "each component of the radiation beam is attenuated by the molecular decay constant of that frequency, the distribution of decay constants yields nonexponential power decay over the medium" [11]. The magnitude of this error has been modeled as a function of spectral width (Γ), analyte concentration, and properties of the molecular extinction coefficient, with systematic errors potentially reaching up to approximately 4% in practical applications [11].
Additional deviations occur in highly scattering media such as biological samples (serum, whole blood) and complex pharmaceutical formulations, where the assumption of uniform attenuation no longer holds strictly true [12]. Empirical investigations have demonstrated that while nonlinearities due to high concentrations alone may be minimal, "nonlinearities may be present in scattering media, justifying the use of complex, nonlinear models" in certain analytical scenarios [12].
The Scientist's Toolkit: Essential Research Reagents and Materials
Successful application of the Beer-Lambert law in quantitative pharmaceutical research requires specific reagents and materials to ensure accurate and reproducible results. The following table details essential components of the analytical toolkit.
Table 4: Essential Research Reagents and Materials for Beer-Lambert Applications
| Item | Specifications | Function in Experimental Protocol |
|---|---|---|
| High-Purity Analytical Standards | ≥99.5% purity, certified reference materials | Provides known concentration values for calibration curve establishment |
| Spectrophotometric Grade Solvents | Low UV absorbance, high transparency | Serves as blank medium and sample solvent without interfering absorbance |
| Matched Quartz Cuvettes | Various path lengths (typically 1.0 cm), paired absorbance | Maintains consistent path length (b) for all measurements |
| Buffer Systems | Appropriate pH control, minimal interference | Maintains chemical environment consistent with analyte stability |
| Precision Volumetric Equipment | Class A glassware, calibrated micropipettes | Ensures accurate solution preparation and dilution |
| UV-Vis Spectrophotometer | Defined spectral bandwidth, monochromator system | Provides accurate absorbance measurements at specific wavelengths |
Relationship to Advanced Analytical Techniques
While the Beer-Lambert law finds its most direct application in conventional UV-Vis spectroscopy, its fundamental principles extend to numerous advanced analytical techniques used in pharmaceutical research and drug development.
Spectroscopic Techniques
In quantitative solid-state NMR (qSSNMR) spectroscopy, a technique increasingly important for analyzing solid drug formulations, the relationship between signal intensity and analyte concentration follows principles analogous to the Beer-Lambert law [13]. The evolution of qSSNMR has established it as "a robust, reliable, and quantitative tool for analyzing pharmaceutical materials," with the area under NMR peaks directly informing both chemical identity and quantity [13]. Similarly, quantitative NMR (qNMR) spectroscopy leverages the direct proportionality between signal intensity and the number of nuclei generating the signal, expressed as I = kₛ·N, where kₛ is a spectrometer constant and N is the number of nuclei [16]. This relationship enables qNMR to serve as a primary method of measurement according to the Comité Consultatif pour la Quantité de Matière (CCQM), particularly valuable for quality assessment of drugs, determination of multicomponent composition, and impurity profiling [16].
Raman spectroscopy also exhibits quantitative capabilities under certain conditions, extending the utility of light-matter interaction principles to complementary analytical domains [17]. The development of these correlated quantitative approaches provides researchers with orthogonal verification methods that enhance the reliability of analytical results in pharmaceutical applications.
Multivariate Calibration Methods
In complex analytical scenarios where deviations from ideal Beer-Lambert behavior occur, researchers often employ multivariate statistical methods to maintain quantitative accuracy. Techniques such as Principal Component Regression (PCR) and Partial Least Squares (PLS) leverage the fundamental linearity assumption while accounting for interfering factors through dimensional reduction [12] [18]. These approaches are particularly valuable when analyzing complex mixtures with overlapping spectral features or in scattering media where traditional univariate calibration becomes problematic [12].
The functional Data Explorer (FDE) platform represents an advanced implementation of these principles, specifically designed for functional data like spectra, enabling researchers to build multivariate calibration models that can predict constituent proportions from spectral data [18]. Such inverse multivariate calibration models exemplify how the core principles of the Beer-Lambert law can be extended through statistical methods to address challenging analytical problems in pharmaceutical research and complex mixture analysis.
The Beer-Lambert law, encapsulated in the deceptively simple equation A = εbc, remains a cornerstone of quantitative spectroscopy with profound implications for pharmaceutical research and analytical sciences. Its components—absorbance (A), molar absorptivity (ε), path length (b), and concentration (c)—together establish a fundamental relationship that enables precise quantitative analysis across diverse applications from drug development to clinical diagnostics. While the law provides an idealization that is subject to specific limitations and deviations in complex matrices, understanding these constraints allows researchers to implement appropriate corrective strategies and advanced calibration methods. As analytical technologies continue to evolve, the core principles embodied in this equation continue to inform the development of increasingly sophisticated quantitative methods, ensuring the Beer-Lambert law's enduring relevance in scientific research and industrial applications.
Understanding Absorbance, Transmittance, and Molar Absorptivity
In the realm of quantitative spectroscopy research, the Beer-Lambert law stands as a foundational principle, enabling researchers to decipher the interaction between light and matter. This in-depth technical guide explores the core concepts of absorbance (A) and transmittance (T), and the material-specific property of molar absorptivity (ε). For scientists and drug development professionals, a rigorous understanding of these parameters is indispensable for applications ranging from determining solute concentrations in solution to monitoring reaction kinetics and ensuring quality control of pharmaceutical compounds. The relationship defined by the Beer-Lambert law provides the theoretical basis for modern spectrophotometric analysis, forming an essential toolkit for quantitative analysis in research and development [8] [7].
Fundamental Concepts: Transmittance and Absorbance
When monochromatic light passes through a sample solution, its intensity is attenuated. The fundamental quantities describing this attenuation are transmittance and absorbance.
Transmittance (T)
Transmittance is defined as the fraction of incident light that passes through a sample [8] [7] [19]. It is calculated as the ratio of the transmitted light intensity ((I)) to the incident light intensity ((I_0)):
[ T = \frac{I}{I_0} ]
Transmittance is a dimensionless quantity ranging from 0 to 1 and is often expressed as a percentage (%T), where ( \%T = T \times 100\%) [8] [20]. A (T = 1) (or 100% %T) indicates the sample is completely transparent, while (T = 0) indicates complete absorption [19] [21].
Absorbance (A)
Absorbance is a logarithmic measure of the amount of light absorbed by a sample [8]. It is mathematically defined as the negative logarithm of transmittance:
[ A = -\log{10}(T) = \log{10}\left(\frac{I_0}{I}\right) ]
This logarithmic relationship means that absorbance increases as transmittance decreases. Absorbance is a dimensionless quantity, typically reported in Absorbance Units (AU), though these are considered redundant [8]. The term optical density (OD) is historically synonymous with absorbance but its use is discouraged by IUPAC [8] [21].
Table 1: Relationship Between Absorbance and Percent Transmittance
| Absorbance (A) | Percent Transmittance (%T) |
|---|---|
| 0 | 100% |
| 0.3 | 50% |
| 1 | 10% |
| 2 | 1% |
| 3 | 0.1% |
| 4 | 0.01% |
Data adapted from Edinst [8]
As illustrated in Table 1, an absorbance of 1 corresponds to 10% transmittance, meaning 90% of the incident light has been absorbed [8] [7]. This inverse logarithmic relationship is central to quantitative spectroscopy.
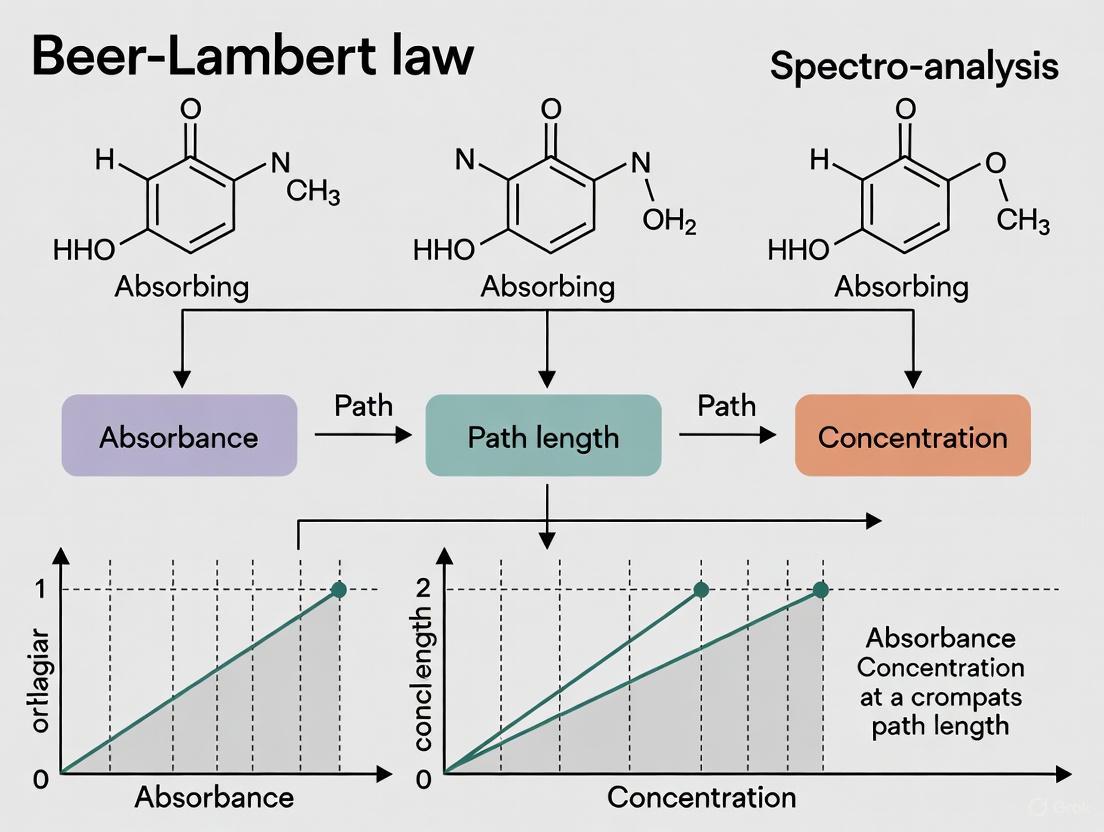
The Beer-Lambert Law
The Beer-Lambert law (also known as Beer's law) establishes a linear relationship between the absorbance of light by a substance and its concentration in a solution of fixed path length [8] [7] [1]. This law is the cornerstone of quantitative absorption spectroscopy.
Mathematical Formulation
The Beer-Lambert law is expressed as:
[ A = \epsilon l c ]
Where:
- (A) is the measured absorbance (dimensionless) [22] [19].
- (\epsilon) is the molar absorptivity or molar absorption coefficient (units: M⁻¹cm⁻¹) [7] [20].
- (l) is the optical path length through the sample (units: cm) [8] [20].
- (c) is the concentration of the absorbing species (units: M, mol/L) [8] [19].
The law demonstrates that absorbance is directly proportional to both the concentration of the absorbing species and the path length of the light through the sample [7]. The proportionality constant, molar absorptivity ((\epsilon)), is a substance-specific property that indicates how strongly a chemical species absorbs light at a particular wavelength [8] [19].
Derivation and Theoretical Basis
The law can be derived by considering the attenuation of light through a homogeneous medium. For a thin slice of the sample of thickness (dz), the decrease in radiant flux ((d\Phie)) is proportional to the incident flux ((\Phie)) and the thickness (dz) [1]:
[ d\Phie(z) = -\mu(z)\Phie(z)dz ]
Here, (\mu(z)) is the attenuation coefficient. Integrating this differential equation across the total path length (l) yields an exponential decay of intensity [1]:
[ I = I_0 e^{-\mu l} ]
Expressing this in base-10 logarithms gives the familiar form of the Beer-Lambert law, where the absorbance (A) is directly proportional to (l) and (c) [1]. For systems with multiple absorbing species, the individual absorbances are additive [1]:
[ A{total} = l \sumi \epsiloni ci ]
Molar Absorptivity (ε)
Molar absorptivity ((\epsilon)) is a fundamental molecular property that measures the probability of an electronic transition occurring when a molecule absorbs light of a specific wavelength [7] [19].
Definition and Significance
- Physical Meaning: Molar absorptivity indicates how effectively a chemical species absorbs photons at a given wavelength. A high (\epsilon) value signifies a high probability for the transition, resulting in strong absorption [7] [19].
- Units: Typically expressed in M⁻¹cm⁻¹ [20] [19].
- Dependence: The value of (\epsilon) is dependent on the chemical identity of the absorbing species, the solvent, and the wavelength of light [7]. Its value is maximal at the absorption peak wavelength ((\lambda_{max})) [8].
Determining Molar Absorptivity
Molar absorptivity is determined experimentally by measuring the absorbance of a solution of known concentration in a cuvette of known path length and applying the Beer-Lambert law:
[ \epsilon = \frac{A}{l c} ]
A calibration curve of absorbance versus concentration for standard solutions is first constructed. The slope of this linear plot is equal to (\epsilon l), from which (\epsilon) can be calculated given the path length (l) [8] [20]. An example calibration curve for Rhodamine B is shown in Figure 1 [8].
Experimental Protocols in UV-Vis Spectroscopy
Accurate spectrophotometric measurement requires adherence to standardized protocols.
Instrumentation and Workflow
A spectrophotometer operates by [21]:
- Light Source: Emitting light across a broad spectrum (e.g., deuterium or tungsten-halogen lamps for UV-Vis) [19].
- Monochromator: Isolating a specific wavelength of light to be passed through the sample.
- Sample Compartment: Holding the sample, typically contained within a cuvette of standard path length (e.g., 1 cm) [8].
- Detector: Measuring the intensity of the transmitted light ((I)).
- Calculation: Comparing (I) to the incident intensity ((I_0), measured using a blank) to compute transmittance and absorbance [7] [21].
Figure 1: Schematic workflow of a spectrophotometer for measuring absorbance.
Detailed Experimental Methodology for Concentration Determination
The following protocol outlines the steps for using the Beer-Lambert law to determine the concentration of an unknown sample [20]:
Preparation of Standard Solutions:
- Prepare a series of standard solutions with known, precise concentrations of the analyte.
- Ensure the concentration range is within the linear response range of the instrument and the analyte.
- Prepare a blank solution containing the solvent only.
Spectrophotometer Calibration:
- Turn on the spectrophotometer and allow it to warm up for the manufacturer-specified time.
- Select the appropriate wavelength for the analysis, typically the absorption maximum (λ_max) of the analyte.
- Using a cuvette of known path length (e.g., 1.00 cm), measure the blank solution to set the 0.000 AU (100% T) baseline.
Measurement of Standard Curve:
- For each standard solution, measure and record the absorbance.
- Rinse the cuvette with the next solution to be measured to prevent cross-contamination.
- Repeat for all standard solutions.
Construction of Calibration Curve:
- Plot the measured absorbance (y-axis) against the known concentration (x-axis) for the standard solutions.
- Perform a linear regression analysis to obtain the equation of the best-fit line ((y = mx + b)). According to Beer's Law, the y-intercept ((b)) should be forced through zero, or be very close to it.
Analysis of Unknown Sample:
- Measure the absorbance of the unknown sample using the same instrumental conditions.
- Use the equation of the calibration curve to calculate the concentration of the unknown: (c{unknown} = \frac{A{unknown}}{m}), where (m) is the slope of the calibration curve (equal to (\epsilon l)).
Limitations and Deviations from Beer's Law
The linear relationship of Beer's law holds under specific conditions. Deviations can occur due to [19] [21]:
- High Analyte Concentrations: At high concentrations (typically >0.01 M), electrostatic interactions between molecules can alter the absorptivity. This is a chemical deviation [20] [21].
- Stray Light: Imperfections in the monochromator can allow light outside the target wavelength to reach the detector, leading to inaccurate absorbance readings, especially at high absorbance values [19].
- Chemical Reactions: The analyte may undergo association, dissociation, or reaction with the solvent, changing the nature of the absorbing species and its concentration [20].
- Instrumental Non-Linearity: The detector response may not be linear with intensity over a very wide range.
The Scientist's Toolkit: Research Reagent Solutions
Successful and accurate spectrophotometric analysis relies on the use of specific materials and reagents. The following table details key components of the research toolkit.
Table 2: Essential Materials and Reagents for Spectrophotometric Analysis
| Item | Function & Importance |
|---|---|
| Spectrophotometer | Instrument that measures the intensity of light as a function of wavelength. It is used to quantify the absorption of light by a sample. [21] |
| Cuvette | A container, typically with a standard path length of 1 cm, used to hold liquid samples for analysis. It must be made of material transparent to the wavelength range of interest (e.g., quartz for UV, glass/plastic for visible light). [8] [19] |
| Standard (Reference) Materials | High-purity compounds of known identity and concentration used to prepare calibration standards for constructing the calibration curve. [20] |
| High-Purity Solvent | A solvent that does not absorb significantly in the spectral region of interest, used to dissolve the analyte and prepare the blank solution. [20] |
| Monochromator/Filter | A critical component within the spectrophotometer that selects a specific, narrow wavelength of light to pass through the sample, ensuring monochromatic light. [21] |
The concepts of absorbance, transmittance, and molar absorptivity, governed by the Beer-Lambert law, form the bedrock of quantitative spectrophotometry. For researchers and drug development professionals, a rigorous understanding of these principles—including their mathematical foundations, practical measurement protocols, and inherent limitations—is essential for obtaining reliable and meaningful analytical data. The ability to accurately determine concentration via this relationship remains a powerful and ubiquitous technique in modern scientific research.
The Electromagnetic Spectrum and Electronic Transitions
This technical guide explores the fundamental relationship between the electromagnetic spectrum and molecular electronic transitions, framing this interaction within the context of quantitative spectroscopy research governed by the Beer-Lambert Law. We detail the core principles that enable researchers to correlate measured light attenuation with molecular concentration and identity, providing the theoretical foundation for a wide array of analytical techniques in drug development and material science. The document includes structured data presentations, detailed experimental protocols, and essential resource toolkits to support the practical application of these principles in a research setting.
Electromagnetic radiation is a form of energy characterized by its propagation as oscillating electric and magnetic fields, traveling at a constant velocity of approximately 2.99792 × 10^8 m/s in a vacuum [23]. This radiation exhibits properties of both waves and particles, with its wave-like nature explaining phenomena such as refraction and its particle-like nature, described as photons, accounting for absorption and emission. The energy of a single photon is directly proportional to its frequency, as described by the equation E = hν, where E is energy, h is Planck's constant, and ν is frequency [23] [24]. This relationship is foundational to spectroscopy, as the energy of a photon determines the type of molecular transition it can induce.
Molecules possess discrete, quantized energy levels corresponding to their electronic, vibrational, and rotational states [24]. The electromagnetic spectrum is divided into regions based on the energy of the radiation and the corresponding molecular transitions it can effect, as shown in Table 1. When a molecule absorbs a photon, it undergoes a transition from a lower energy level to a higher one, but only if the energy of the photon exactly matches the energy difference between these quantized states [25] [24]. The measurement and interpretation of these absorption events form the basis of absorption spectroscopy and are quantitatively described by the Beer-Lambert Law, which links the extent of light absorption to the properties of the absorbing medium [8] [7].
The Electromagnetic Spectrum and Corresponding Molecular Transitions
The electromagnetic spectrum encompasses all possible frequencies of electromagnetic radiation, from low-energy radio waves to high-energy gamma rays [23] [24]. For researchers, the critical regions are those that interact with the valence electrons of molecules, primarily the ultraviolet (UV), visible, and near-infrared regions. The interaction between light and matter is probed by spectroscopy, which provides information about molecular structure, identity, and concentration by analyzing which wavelengths of light are absorbed [20].
The following diagram illustrates the logical relationship between the energy of incident light, the resulting molecular electronic transition, and the measurable absorbance governed by the Beer-Lambert Law.
The quantized energy levels in molecules originate from the allowed solutions to the Schrödinger equation for the molecular system and are characterized by quantum numbers that describe the electronic, vibrational, and rotational states [24]. The energy differences between these levels determine the wavelengths of light a molecule can absorb. Table 1 summarizes the regions of the electromagnetic spectrum most relevant to electronic spectroscopy and the associated transitions [24] [20].
Table 1: Regions of the Electromagnetic Spectrum and Associated Molecular Transitions
| Spectral Region | Wavelength Range | Molecular Transition | Typical Energy Range (per photon) | Information Obtained |
|---|---|---|---|---|
| Ultraviolet (UV) | 10 - 400 nm | Electronic (Valence Electrons) | High | Electronic Structure, Conjugation |
| Visible | 400 - 700 nm | Electronic (Valence Electrons) | Medium | Color, Electronic Structure in Complexes |
| Near Infrared (NIR) | 700 nm - 1 µm | Overtone Vibrational | Low | Functional Groups (e.g., O-H, C-H) |
| Infrared (IR) | 1 µm - 1 mm | Fundamental Vibrational | Low | Functional Groups, Molecular Fingerprinting |
| Microwave | 1 mm - 1 m | Rotational | Very Low | Molecular Geometry, Bond Lengths |
Fundamental Principles of Electronic Transitions
Electronic transitions involve the promotion of an electron from a lower-energy molecular orbital to a higher-energy one [25] [26]. The most common transitions in organic molecules involve the excitation of electrons from σ-bonding, π-bonding, or non-bonding (n) orbitals into their corresponding antibonding (σ* or π*) orbitals.
Types of Electronic Transitions
The primary types of electronic transitions observed in UV-Vis spectroscopy are [25] [26]:
- σ → σ* Transitions: These require the highest energy and occur in saturated hydrocarbons (e.g., the transition in molecular hydrogen, H₂, at 111 nm). They are typically outside the range of standard UV-Vis spectrophotometers [25].
- π → π* Transitions: These occur in molecules with unsaturation, such as alkenes and alkynes. In isolated double bonds (e.g., ethene), this transition is at about 165 nm. In conjugated π systems, the energy gap decreases as conjugation length increases, shifting the absorption to longer wavelengths (e.g., 1,3-butadiene at 217 nm and 1,3,5-hexatriene at 258 nm) [25].
- n → σ* Transitions: These involve the promotion of a non-bonding electron (e.g., on oxygen, nitrogen, or halogen atoms) to a σ* orbital. They are typically observed in the far-UV to early-UV region (e.g., in water at 167 nm) [26].
- n → π* Transitions: These involve the promotion of a non-bonding electron to a π* orbital, commonly found in molecules with carbonyl groups. These are lower energy than π → π* transitions and are often referred to as "forbidden" bands, resulting in weaker absorption (e.g., in 4-methyl-3-penten-2-one at 314 nm) [25].
Chromophores and Absorption Properties
A chromophore is any part of a molecule that absorbs light strongly in the UV or visible region [25]. The specific structure of a chromophore determines its molar absorptivity (ε), a measure of how strongly it absorbs light at a given wavelength, and the wavelength of maximum absorption (λ_max). For instance, beta-carotene, with its system of 11 conjugated double bonds, absorbs light in the blue region (~470 nm) of the visible spectrum, transmitting red-yellow light and making carrots appear orange [25]. The energy of the absorbed photons is directly related to the HOMO-LUMO (Highest Occupied Molecular Orbital - Lowest Unoccupied Molecular Orbital) energy gap of the molecule [25].
The Beer-Lambert Law in Quantitative Spectroscopy
The Beer-Lambert Law (also known as Beer's Law) is a fundamental principle that provides a quantitative relationship between the absorption of light and the properties of the material through which the light is traveling [8] [7]. It is the cornerstone of quantitative spectrophotometric analysis.
Mathematical Formulation and Definitions
The law is formally expressed as: A = εlc
Where:
- A is the Absorbance (also known as optical density), a dimensionless quantity defined as A = log₁₀(I₀/I) [8] [7] [20].
- I₀ is the intensity of the incident light [8] [7].
- I is the intensity of the transmitted light [8] [7].
- ε is the Molar Absorptivity (or molar extinction coefficient), with typical units of M⁻¹cm⁻¹. This is a substance-specific constant that indicates how strongly a chemical species absorbs light at a particular wavelength [8] [7] [27].
- l is the Path Length, the distance the light travels through the sample, usually measured in centimeters (cm) [8] [7] [27].
- c is the Concentration of the absorbing species in the solution, measured in moles per liter (M) [8] [7] [27].
The relationship between transmittance (T = I/I₀) and absorbance is logarithmic. Table 2 shows how absorbance values correspond to the percentage of light transmitted and absorbed [8].
Table 2: Relationship Between Absorbance and Transmittance
| Absorbance (A) | Transmittance (%T) | Fraction of Light Transmitted (I/I₀) | Fraction of Light Absorbed |
|---|---|---|---|
| 0 | 100% | 1.000 | 0.000 |
| 0.3 | 50% | 0.501 | 0.499 |
| 1 | 10% | 0.100 | 0.900 |
| 2 | 1% | 0.010 | 0.990 |
| 3 | 0.1% | 0.001 | 0.999 |
Utility and Limitations in Research
The primary utility of the Beer-Lambert Law in research is its ability to determine the concentration of an unknown sample. By measuring the absorbance of several standard solutions of known concentration, a calibration curve of Absorbance vs. Concentration can be created, which should be a straight line with a slope of εl [8] [20]. The concentration of an unknown can then be interpolated from this curve.
However, the law has limitations and can show deviations under certain conditions [2] [27]:
- High Concentrations: At high concentrations (typically >0.01 M), electrostatic interactions between molecules can alter the absorptivity of the analyte, leading to non-linearity [27].
- Chemical Effects: Changes in pH, solvent, or the presence of other reactive species can affect the molar absorptivity by altering the chemical form of the analyte [27].
- Instrumental Deviations: Stray light, improper slit width, or detector non-linearity can cause the measured absorbance to deviate from the theoretical value [2].
- Electromagnetic Theory: The BBL law is a simplification that does not always align perfectly with a rigorous electromagnetic theory based on Maxwell's equations, particularly for strongly absorbing samples or when reflection losses are significant [2].
Experimental Protocols for UV-Vis Spectrophotometry
This section provides a detailed methodology for a fundamental experiment in quantitative spectroscopy: determining the concentration of an unknown sample using the Beer-Lambert Law. The example uses Rhodamine B, but the protocol is adaptable to any analyte with a known absorption band.
Detailed Methodology: Determination of an Unknown Concentration
Objective: To create a calibration curve using standard solutions of known concentration and use it to determine the concentration of an unknown Rhodamine B solution [8] [20].
Principle: The absorbance of a solution at a specific wavelength (λ_max) is directly proportional to the concentration of the colored solute, as per A = εlc. With a fixed path length, a plot of A vs. c for standards yields a straight line from which the unknown concentration can be found [8] [20].
Procedure:
- Preparation of Standard Solutions: Prepare a series of Rhodamine B standard solutions via serial dilution. For example, prepare 50 mL each of 1.00 µM, 2.00 µM, 5.00 µM, 10.00 µM, and 20.00 µM solutions from a concentrated stock solution using volumetric flasks and precise pipetting [8] [20].
- Spectrometer Setup and Blank Measurement:
- Power on the UV-Vis spectrophotometer and allow it to warm up for 15-30 minutes.
- Set the wavelength to the λ_max of Rhodamine B (e.g., ~554 nm based on literature or an initial scan).
- Fill a clean cuvette with the solvent (e.g., deionized water) and use it to zero the instrument (this is the blank). This corrects for any absorption from the solvent or cuvette [20].
- Measurement of Standard Solutions:
- Rinse a clean cuvette with a small portion of the first standard solution.
- Fill the cuvette with the standard, wipe the outside with a lint-free tissue, and place it in the sample holder.
- Record the absorbance value. Repeat this process for each standard solution [20].
- Measurement of Unknown Solution:
- Rinse and fill the cuvette with the unknown Rhodamine B solution.
- Measure and record its absorbance at the same wavelength [20].
- Data Analysis:
- Plot a graph of Absorbance (y-axis) vs. Concentration (x-axis) for the standard solutions.
- Perform a linear regression to obtain the equation of the best-fit line (y = mx + b, where the slope m = εl).
- Substitute the absorbance of the unknown (y) into the equation and solve for its concentration (x) [8] [20].
The workflow for this quantitative analysis is outlined below.
The Scientist's Toolkit: Essential Research Reagents and Materials
The following table details key materials and equipment required for performing UV-Vis spectrophotometry based on the Beer-Lambert Law [8] [20] [27].
Table 3: Essential Research Reagents and Materials for UV-Vis Spectrophotometry
| Item | Function / Rationale | Typical Specifications |
|---|---|---|
| UV-Vis Spectrophotometer | Instrument that provides a source of monochromatic light and measures the intensity of light before (I₀) and after (I) it passes through the sample. | Double-beam design preferred for stability; wavelength range of 190-1100 nm. |
| Cuvettes | Containers that hold the liquid sample in the light path. | Path length of 1.00 cm; optical clarity (glass/quartz for UV, plastic/glass for visible). |
| Volumetric Flasks | Used for precise preparation and dilution of standard and sample solutions. | Class A glassware; various sizes (e.g., 10 mL, 50 mL, 100 mL). |
| Analytical Balance | Precisely weighs solid solutes for preparing stock solutions of known concentration. | Sensitivity to 0.1 mg. |
| Micropipettes | Accurately transfers specific, small volumes of liquid for serial dilutions. | Variable volume, calibrated regularly. |
| High-Purity Solvent | Dissolves the analyte without contributing significant absorption in the wavelength range of interest. | Spectrophotometric grade (e.g., HPLC-grade water, ethanol). |
| Analyte Standard | A pure form of the substance being analyzed, used to create calibration curves of known concentration. | Certified reference material with known purity (e.g., >99%). |
Ideal Conditions and Fundamental Assumptions of the Law
The Beer-Lambert Law (BLL), also referred to as the Bouguer-Beer-Lambert Law, is a fundamental principle in optical spectroscopy that establishes a quantitative relationship between the attenuation of light and the properties of the material through which the light is traveling [7] [1]. This law forms the cornerstone of modern spectrophotometric analysis and is indispensable for chemical analysis and quantitative measurements across diverse scientific disciplines and industries [3]. Its mathematical formulation provides an elegantly simple linear relationship that enables researchers to determine unknown concentrations of absorbing species in solution, making it particularly valuable in pharmaceutical research, environmental monitoring, and biochemical analysis [27].
The historical development of the law spans nearly three centuries, beginning with Pierre Bouguer's 1729 work on atmospheric light attenuation, followed by Johann Heinrich Lambert's mathematical formulation of the absorption pathlength dependence in 1760 [1]. August Beer later extended this work in 1852 by establishing the relationship with solution concentration, completing the foundational principles [1]. The modern formulation, which merges these contributions into the logarithmic absorbance relationship familiar to today's scientists, was first presented by Robert Luther and Andreas Nikolopulos in 1913 [1]. Understanding the ideal conditions and fundamental assumptions underlying this law is crucial for researchers, especially in drug development, where accurate quantitative analysis is essential for method validation, quality control, and regulatory compliance.
Mathematical Formulation
The Beer-Lambert Law is most commonly expressed in its decadic form as:
A = ε · c · l
Where:
- A represents absorbance (a dimensionless quantity)
- ε is the molar absorptivity or molar extinction coefficient (typically in L·mol⁻¹·cm⁻¹)
- c is the concentration of the absorbing species (in mol/L or M)
- l is the optical path length through the sample (in cm) [7] [8] [20]
The absorbance is defined through the relationship between the incident light intensity (I₀) and the transmitted light intensity (I):
This logarithmic relationship means that absorbance values have a specific correspondence to transmittance values, as detailed in Table 1.
Table 1: Relationship Between Absorbance and Transmittance
| Absorbance (A) | Transmittance (T) | Percent Transmittance (%T) |
|---|---|---|
| 0 | 1 | 100% |
| 0.1 | 0.79 | 79% |
| 0.5 | 0.32 | 32% |
| 1 | 0.1 | 10% |
| 2 | 0.01 | 1% |
| 3 | 0.001 | 0.1% |
For multi-component systems with several absorbing species, the law follows the principle of additivity, where the total absorbance equals the sum of individual absorbances [1] [28]:
Atotal = l · Σ(εi · c_i)
This additive property enables the quantitative analysis of complex mixtures, which is particularly valuable in pharmaceutical applications where multiple active components or impurities may be present in a sample.
Fundamental Assumptions
The Beer-Lambert Law derives its simple linear form from several fundamental assumptions about the physical system and the nature of light-matter interactions. When these assumptions are violated, deviations from the expected linear behavior occur, potentially compromising analytical accuracy [2] [4].
Monochromatic Incident Light
The law assumes that the incident light consists of a single wavelength where the molar absorptivity (ε) remains constant [4]. In practice, spectrophotometers have finite spectral bandwidths, and the use of polychromatic light can lead to deviations, particularly if the molar absorptivity changes significantly across the bandwidth [2].
Low Concentration of Absorbing Species
The linear relationship between absorbance and concentration assumes minimal interaction between absorbing molecules [7] [3]. At high concentrations (typically >10 mM, depending on the compound), intermolecular distances decrease, leading to solute-solute interactions that can alter the absorption characteristics [3]. These interactions may cause changes in refractive index that further contribute to deviations from ideal behavior [3].
Homogeneous and Non-Scattering Medium
The law presumes the sample is a homogeneous solution where attenuation occurs solely through absorption, not scattering [1] [4]. In scattering media such as colloidal suspensions or biological tissues, light is lost through both absorption and scattering processes, necessitating modifications to the basic law [28] [4].
No Chemical Interactions or Equilibrium Shifts
The model assumes that the absorbing species does not undergo chemical changes, associations, or dissociations that would alter its absorption characteristics [3] [4]. Factors such as pH, temperature, or solvent composition can affect chemical equilibrium, potentially leading to spectral shifts or the appearance of new absorption peaks [3].
Uniform Pathlength and Parallel Light Beam
The law assumes a well-defined, constant pathlength with a collimated light beam traveling parallel through the sample [1]. In practice, imperfections in cuvette geometry, misalignment, or divergent light beams can introduce errors in the assumed pathlength [20].
Ideal Experimental Conditions
To ensure accurate application of the Beer-Lambert Law, specific experimental conditions must be established and maintained throughout the analytical procedure.
Instrumental Considerations
- Wavelength Selection: Measurements should be performed at the absorption maximum (λ_max) where the analyte exhibits peak absorptivity and where the absorbance change per unit concentration is greatest [8] [27]. Modern spectrophotometers should be calibrated regularly using certified reference materials to verify wavelength accuracy [3].
- Spectral Bandwidth: The instrument's spectral bandwidth should be narrow compared to the natural bandwidth of the absorption peak to ensure effective monochromaticity [4]. A common rule of thumb is that the instrumental bandwidth should not exceed 10% of the natural bandwidth of the absorption band [20].
- Stray Light Control: The instrument should have minimal stray light (light outside the nominal wavelength band), which can significantly affect absorbance measurements, particularly at high absorbance values [3] [4].
- Detector Linear Response: The detection system must demonstrate linear response across the measured absorbance range to accurately relate transmitted light intensity to concentration [2].
Sample Preparation and Presentation
- Appropriate Concentration Range: Analyte concentrations should be adjusted to maintain absorbance values typically between 0.1 and 1.0 AU, where the law exhibits maximum linearity and measurement error is minimized [8] [20]. For highly absorbing samples, dilution may be necessary to bring measurements into this optimal range.
- Solvent Selection: The solvent should not absorb significantly at the measurement wavelength and should not chemically interact with the analyte in ways that modify its absorption properties [4]. Solvent refractive index should remain relatively constant with concentration changes [3].
- Pathlength Control: High-quality matched cuvettes with precisely known and uniform pathlengths should be used [8] [20]. Even minor variations in pathlength can introduce significant errors in concentration determinations.
- Temperature Control: Chemical solutions should be maintained at constant temperature, as temperature fluctuations can affect equilibrium constants, reaction rates, and solvent refractive index, all potentially impacting absorbance measurements [3].
Common Deviations and Limitations
Despite its widespread utility, the Beer-Lambert Law is subject to several limitations and deviation mechanisms that researchers must recognize and address in quantitative work.
Fundamental Deviations
Fundamental or "real" deviations arise from inherent limitations in the law itself, particularly at high concentrations where the underlying assumptions break down [3] [2]. At high concentrations, several phenomena occur:
- Electromagnetic interactions between closely spaced molecules alter their absorption characteristics [3] [2]
- Refractive index changes become significant, affecting the light propagation through the medium [3]
- Polarizability effects lead to changes in the effective molar absorptivity [3] [4]
Recent research has demonstrated that these fundamental deviations can be addressed through electromagnetic theory extensions that incorporate polarizability, electric displacement, and refractive index effects [3]. These advanced models include higher-order concentration terms to better describe the nonlinear behavior observed at high concentrations:
k = βc + γc² + δc³
Where k is the imaginary part of the complex refractive index related to absorption, and β, γ, and δ are refractive index coefficients [3].
Chemical Deviations
Chemical deviations occur when the analytical species participates in equilibrium processes that alter its concentration or absorption properties [3]. Common causes include:
- Association/dissociation equilibria that change the molecular identity of the absorber
- pH-dependent speciation in acidic or basic functional groups
- Complex formation with other solution components
- Solvent effects that modify the electronic transition energies
These deviations are particularly relevant in pharmaceutical analysis where APIs may exist in multiple ionization states or form complexes with excipients [27].
Instrumental Deviations
Instrumental limitations represent a practical source of deviation from ideal Beer-Lambert behavior [3] [2]:
- Polychromatic light sources in inexpensive spectrophotometers
- Stray light reaching the detector without passing through the sample
- Detector nonlinearity at high or low light intensities
- Fluorescence of the sample emitting light at the detection wavelength
- Light scattering by particulates or bubbles in the sample
Visualization of Deviation Mechanisms from the Beer-Lambert Law
Experimental Protocols for Validation
Calibration Curve Method
The most common approach for validating Beer-Lambert Law applicability involves constructing a calibration curve using standard solutions of known concentrations.
Protocol:
- Prepare a series of standard solutions covering the expected concentration range of the analyte
- Measure absorbance values for each standard at the predetermined λ_max
- Plot absorbance versus concentration and perform linear regression analysis
- Evaluate linearity through the correlation coefficient (R²), which should typically exceed 0.995 for quantitative work
- Verify the y-intercept is not significantly different from zero (within statistical confidence)
Table 2: Example Calibration Data for Potassium Permanganate (at 550 nm)
| Concentration (M) | Theoretical Absorbance | Practical Considerations |
|---|---|---|
| 0.0001 | 0.025 | Near detection limit |
| 0.001 | 0.25 | Lower quantitation limit |
| 0.01 | 2.5 | Beyond ideal range; requires dilution |
| 0.1 | 25 | Significantly deviates from linearity |
Pathlength Verification Protocol
Accurate pathlength determination is essential for valid concentration measurements.
Protocol:
- Use a reference material with known molar absorptivity (e.g., potassium dichromate in acid)
- Measure absorbance at specified wavelengths
- Calculate effective pathlength: l = A / (ε · c)
- Compare calculated pathlength to manufacturer specification
- Document any discrepancies for future correction factors
Wavelength Accuracy Test
Regular verification of spectrophotometer wavelength accuracy ensures valid measurements.
Protocol:
- Use certified wavelength standards (e.g., holmium oxide glass or holmium glass filter)
- Scan through known absorption peaks (e.g., 361 nm, 445 nm, 460 nm for holmium glass)
- Compare measured peak positions to certified values
- Accept instrument if measured peaks are within ±1 nm of certified values [3]
- Document performance for quality assurance records
Experimental Workflow for Beer-Lambert Law Validation
Research Reagent Solutions and Materials
Successful application of the Beer-Lambert Law in quantitative analysis requires appropriate selection of reagents and materials. The following table outlines essential components for spectrophotometric experiments.
Table 3: Essential Research Reagents and Materials for Spectrophotometric Analysis
| Item | Function/Purpose | Specification Guidelines |
|---|---|---|
| Spectrophotometer | Measures light absorption across specific wavelengths | UV-Vis capability; spectral bandwidth ≤2 nm; wavelength accuracy ±1 nm [3] |
| Cuvettes | Sample containers with defined pathlength | Matched pairs; pathlength tolerance ±0.01 mm; material compatible with wavelength range (glass, quartz, plastic) [20] |
| Holmium Glass Filter | Wavelength calibration standard | Certified absorption peaks at specific wavelengths (e.g., 361 nm, 445 nm, 460 nm) [3] |
| Reference Materials | Verification of molar absorptivity and method accuracy | Certified standards (e.g., potassium dichromate in acid, potassium permanganate) [3] |
| High-Purity Solvents | Dissolve analytes without interfering absorption | Spectroscopic grade; low UV cut-off; minimal impurity content [4] |
| Buffer Systems | Maintain constant pH for chemical stability | Appropriate pKa for target pH; minimal absorption in measurement range [3] |
| Volumetric Glassware | Precise solution preparation | Class A tolerance; calibrated to deliver specified volumes accurately [20] |
Advanced Applications and Modifications
Modified Beer-Lambert Law for Biological Tissues
In biomedical applications such as near-infrared spectroscopy (NIRS) of tissues, the traditional Beer-Lambert Law requires modification to account for significant light scattering [28]. The Modified Beer-Lambert Law (MBLL) incorporates additional parameters:
Aλ = (εHHbλ · cHHb + εHbO2λ · c_HbO2) · d · DPF + G
Where:
- d represents the physical source-detector distance
- DPF is the differential pathlength factor accounting for increased pathlength due to scattering
- G is a geometric factor related to tissue scattering properties [28]
This modification enables quantitative pulse oximetry and tissue oxygenation monitoring, demonstrating the adaptability of the fundamental principle to complex biological matrices [28] [27].
Multi-Component Analysis
The additive property of the Beer-Lambert Law facilitates simultaneous quantification of multiple analytes in mixture analysis [1] [28]. By measuring absorbance at multiple wavelengths and solving simultaneous equations, researchers can determine individual concentrations without physical separation:
Aλ1 = (εXλ1 · cX + εYλ1 · cY) · l Aλ2 = (εXλ2 · cX + εYλ2 · cY) · l
This approach is particularly valuable in pharmaceutical analysis for quantifying drug compounds in the presence of metabolites or excipients [27].
Recent Research Developments
Contemporary research continues to extend the Beer-Lambert Law beyond its traditional boundaries:
- Electromagnetic framework extensions incorporating polarizability and electric displacement for more accurate modeling of high-concentration behavior [3]
- Integration with machine learning algorithms to model non-linearities and complex matrix effects [27]
- Microfluidic adaptations enabling on-chip spectrophotometric analysis with miniaturized pathlengths [27]
- Generalized models using Lambert-W function for light propagation in thick biological tissues [29]
These advancements demonstrate the continued relevance of the Beer-Lambert principle while addressing its limitations through sophisticated mathematical and instrumental approaches.
The Beer-Lambert Law remains a cornerstone of quantitative spectroscopic analysis, providing an elegantly simple relationship between light absorption and analyte concentration. Its proper application requires strict adherence to fundamental assumptions regarding monochromatic light, low concentrations, non-scattering media, and absence of chemical interactions. When these conditions are met, the law provides robust quantitative data essential for pharmaceutical research, environmental monitoring, and clinical diagnostics.
Understanding the limitations and potential deviations from ideal behavior is equally important for researchers seeking accurate analytical results. Fundamental deviations at high concentrations, chemical deviations from equilibrium shifts, and instrumental deviations from non-ideal measurement conditions must be recognized and addressed through appropriate experimental design and validation protocols. Recent advances extending the law through electromagnetic theory, modified formulations for scattering media, and integration with computational methods ensure its continued utility in addressing complex analytical challenges across scientific disciplines.
For drug development professionals and researchers, rigorous validation of Beer-Lambert Law applicability through calibration curves, instrument verification, and method qualification represents an essential component of quality assurance in quantitative analysis. When properly applied with awareness of its assumptions and limitations, this fundamental principle continues to serve as an indispensable tool in the scientific toolkit for quantitative spectroscopy.
From Theory to Bench: Practical Protocols for Quantitative Analysis
Selecting the Optimal Wavelength (λ_max) for Analysis
The accurate determination of the optimal wavelength of maximum absorption (λmax) is a foundational step in ultraviolet-visible (UV-Vis) quantitative analysis based on the Beer-Lambert law. This technical guide examines the theoretical principles, experimental methodologies, and practical considerations for selecting λmax, providing researchers and drug development professionals with a comprehensive framework for spectroscopic method development. The selection of λmax directly impacts key analytical parameters, including sensitivity, linearity, and adherence to the Beer-Lambert law, which states that absorbance is directly proportional to the concentration of the absorbing species [30] [8]. Within pharmaceutical analysis, where high precision and accuracy are mandated by regulatory guidelines, rigorous λmax selection becomes indispensable for method validation and content uniformity testing [31] [32].
Theoretical Foundations: Beer-Lambert Law and Light Absorption
Fundamental Principles of the Beer-Lambert Law
The Beer-Lambert law provides the mathematical relationship between light absorption and analyte properties, serving as the cornerstone for quantitative UV-Vis spectroscopy. The law is expressed as:
A = ε × b × c
Where:
- A is the measured absorbance (unitless)
- ε is the molar absorptivity (L·mol⁻¹·cm⁻¹)
- b is the path length of the cuvette (cm)
- c is the concentration of the analyte (mol·L⁻¹) [33] [8] [34]
This relationship establishes the linear dependence between absorbance and concentration that enables quantitative analysis. The molar absorptivity (ε) is a substance-specific constant that varies with wavelength and reaches its maximum at λ_max, making this wavelength optimal for analysis [35].
Molecular Basis of Light Absorption
Light absorption in the UV-Vis region occurs when photons promote electrons from ground states to excited states. For organic molecules, several electronic transitions contribute to absorption characteristics:
- π→π* transitions in conjugated systems
- n→π* transitions involving non-bonding electrons
- σ→σ* transitions in single bonds
- n→σ* transitions in saturated compounds with heteroatoms [34]
The specific energy required for these transitions determines the wavelength of absorption, with more extensively conjugated systems absorbing at longer wavelengths due to decreased energy gaps between molecular orbitals [30] [34].
Absorbance and Transmittance Relationship
Absorbance exhibits a logarithmic relationship with transmittance, defined as:
A = log₁₀(I₀/I) = -log₁₀(T)
Where:
- I₀ is the incident light intensity
- I is the transmitted light intensity
- T is the transmittance (I/I₀) [30] [8]
This logarithmic relationship converts the exponential attenuation of light through a medium into a linear function compatible with quantitative analysis, with absorbance values at λ_max providing the greatest sensitivity for concentration measurements [30].
Table 1: Relationship Between Absorbance and Transmittance
| Absorbance (A) | Percent Transmittance (%T) | Transmittance (T) |
|---|---|---|
| 0.0 | 100% | 1.0 |
| 0.3 | 50% | 0.5 |
| 1.0 | 10% | 0.1 |
| 2.0 | 1% | 0.01 |
| 3.0 | 0.1% | 0.001 |
Methodologies for λ_max Determination
Full Spectrum Scanning Protocol
Experimental Procedure:
- Instrument Calibration: Perform baseline correction with the blank solution containing all components except the analyte [36].
- Sample Preparation: Prepare a standard solution of the target analyte within the expected concentration range (typically 0.00005M - 0.01M for Beer-Lambert law compliance) [36].
- Spectral Acquisition: Scan the sample across the relevant UV-Vis range (typically 200-800 nm) using a spectrophotometer with narrow spectral bandwidth (1-2 nm) for enhanced resolution [34].
- Peak Identification: Identify the wavelength(s) exhibiting maximum absorbance, confirmed by repeating the scan with independent standard preparations [35] [36].
Data Interpretation: The characteristic λ_max appears as the peak apex in the absorption spectrum. For potassium permanganate, this occurs at approximately 524 nm, while for complex organic molecules like chlorphenoxamine HCl, multiple maxima may be present across different spectral windows [31] [36].
Advanced Resolution Techniques for Complex Mixtures
For pharmaceutical formulations containing multiple absorbing compounds with overlapping spectra, advanced resolution techniques enable precise λ_max determination:
- Absorbance Resolution Method: Utilizes dual wavelengths where the interferent shows identical absorbance but the analyte exhibits significant difference [31]
- Factorized Derivative Method: Applies first-order derivative transformations (Δλ = 4 nm, scaling factor = 10) to resolve overlapping peaks [31]
- Factorized Ratio Difference Method: Processes ratio spectra to isolate component-specific absorption characteristics [31]
These techniques leverage sophisticated algorithms to deconvolute composite spectra, enabling accurate λ_max identification for individual components in complex matrices like combined dosage forms containing chlorphenoxamine HCl and caffeine [31].
Diagram 1: λ_max Determination Workflow (Max Width: 760px)
Critical Experimental Considerations
Instrumental Parameters Affecting λ_max Determination
Spectral Bandwidth: The range of wavelengths transmitted by the spectrophotometer significantly impacts resolution. Narrow bandwidth (1-2 nm) provides higher resolution for identifying precise λ_max, particularly for compounds with sharp absorption peaks [34].
Stray Light: Non-monochromatic light reaching the detector causes deviations from the Beer-Lambert law, particularly at high absorbances (>2 AU). Double monochromator instruments reduce stray light, extending the linear dynamic range [34].
Wavelength Accuracy: Instrument calibration ensures reported wavelengths match actual measurements. Regular verification with holmium oxide or didymium filters maintains wavelength precision [34].
Solvent and Matrix Effects
Solvent polarity significantly influences absorption characteristics by stabilizing ground and excited states differently. For example, π→π* transitions typically shift to shorter wavelengths (hypsochromic shift) with increasing solvent polarity, while n→π* transitions often shift to longer wavelengths (bathochromic shift) [34]. pH modifications can dramatically alter absorption profiles of ionizable compounds, as demonstrated by tyrosine showing increased absorption maxima when pH increases from 6 to 13 [34].
Table 2: Factors Influencing λ_max Selection and Measurement
| Factor | Impact on λ_max | Mitigation Strategy |
|---|---|---|
| Spectral Bandwidth | Broad bandwidth obscures true λ_max, reduces peak height | Use 1-2 nm bandwidth for scanning; match bandwidth to peak width |
| Solvent Polarity | Causes bathochromic or hypsochromic shifts | Use consistent solvent for standards and samples; document solvent composition |
| pH Variation | Alters ionization state, changing electronic transitions | Buffer solutions to appropriate pH; verify stability over analysis time |
| Stray Light | Reduces apparent absorbance at high values, distorts spectrum | Ensure instrument maintenance; use appropriate absorbance range (<2 AU) |
| Temperature Fluctuation | Modifies vibrational fine structure, peak shape | Use temperature-controlled cell holders; allow thermal equilibration |
Validation and Verification of Selected λ_max
Calibration Curve Methodology
Experimental Protocol:
- Prepare a series of standard solutions spanning the expected concentration range, typically 5-7 concentration levels [36].
- Measure absorbance at the proposed λ_max for each standard using identical instrument parameters.
- Plot absorbance versus concentration and perform linear regression analysis.
- Evaluate linearity through correlation coefficient (R² > 0.998 expected for quality methods) and residual analysis [36].
A valid λ_max produces a calibration curve with strong linear correlation across the analytical range, as demonstrated by Rhodamine B and potassium permanganate examples where R² values exceeded 0.9989 [8] [36].
Specificity and Peak Purity Assessment
For diode array detectors (DAD) in HPLC applications, peak purity algorithms compare spectra across the chromatographic peak. A pure compound exhibits consistent spectra at the upslope, apex, and downslope of the peak, confirming the selected λ_max is specific to the target analyte [32]. In complex formulations, advanced spectrophotometric methods demonstrate specificity by accurately quantifying chlorphenoxamine HCl (3-45.0 μg/mL) and caffeine (3-35.0 μg/mL) without interference, validating the selected wavelengths for analysis [31].
Research Reagent Solutions and Materials
Table 3: Essential Research Materials for λ_max Determination and Spectrophotometric Analysis
| Reagent/Material | Specifications | Function in Analysis |
|---|---|---|
| Spectrophotometer | UV-Vis with scanning capability, spectral bandwidth ≤2 nm, deuterium/tungsten source | Primary instrument for absorbance measurement and spectral scanning |
| Cuvettes/Cells | Quartz for UV range (190-350 nm), optical path length 1.0 cm, specified volume | Sample containment with defined path length for absorbance measurement |
| Reference Standards | Certified purity (>98%), analyte-matched, solubility-appropriate | Preparation of calibration standards for quantitative reference |
| HPLC-grade Solvents | Low UV absorbance, specified purity (e.g., HPLC-grade water, acetonitrile, methanol) | Sample dissolution and dilution without introducing interfering absorbances |
| Buffer Components | Analytical grade, pH stability in UV range, appropriate pKa for target pH | Maintain consistent pH environment to stabilize analyte absorption properties |
| Validation Standards | Independent source from calibration standards, certified reference materials | Verify accuracy of λ_max selection and calibration model performance |
Applications in Pharmaceutical Research and Development
Content Uniformity Testing
The United States Pharmacopoeia (USP) mandates content uniformity testing to ensure consistent dosage in pharmaceutical formulations. Accurate λ_max selection enables precise spectrophotometric determination of active ingredients without separation, as demonstrated in methods for chlorphenoxamine HCl and caffeine combinations that comply with regulatory requirements [31].
Method Validation Parameters
According to International Council for Harmonisation (ICH) guidelines, validated analytical methods must demonstrate:
- Specificity: Confirmed by peak purity assessment or interference testing
- Linearity: Established through calibration curves at the selected λ_max
- Accuracy: Recovery studies using spiked samples
- Precision: Repeated measurements of homogeneous samples [31]
Proper λ_max selection directly enhances these validation parameters, with advanced spectrophotometric methods achieving precision RSD values <1.5% in pharmaceutical applications [31].
The selection of the optimal wavelength (λmax) represents a critical methodological decision in Beer-Lambert law-based quantitative spectroscopy. Through systematic full-spectrum scanning, verification of Beer-Lambert law compliance, and application of advanced resolution techniques for complex mixtures, researchers can establish robust analytical methods with enhanced sensitivity and specificity. The rigorous approach outlined in this technical guide provides a framework for reliable λmax determination that meets the exacting requirements of pharmaceutical research and drug development, where precision, accuracy, and regulatory compliance are paramount.
Step-by-Step Guide to Building a Calibration Curve
This guide provides a comprehensive protocol for constructing a calibration curve, a fundamental analytical technique in quantitative spectroscopy. Framed within the broader context of the Beer-Lambert law, this whitepaper details the procedure for researchers and drug development professionals to accurately determine the concentration of unknown analytes in solution. The calibration curve establishes a linear relationship between the measured absorbance of a set of standard solutions and their known concentrations, serving as a critical quantitative tool in fields from pharmaceutical analysis to environmental monitoring [8] [30]. This document covers the underlying theory, detailed experimental methodology, data analysis techniques, and practical applications to ensure reliable and precise concentration measurements.
Theoretical Foundations: The Beer-Lambert Law
The Beer-Lambert Law (also known as Beer's Law) is the fundamental principle governing quantitative absorption spectroscopy. It states that the absorbance of light by a solution is directly proportional to the concentration of the absorbing species (the analyte) and the path length the light travels through the solution [20] [37].
The law is mathematically expressed as: A = ɛbc Where:
- A is the measured Absorbance (a dimensionless quantity) [8] [30].
- ɛ is the Molar Absorptivity (or molar absorption coefficient), a constant for a given substance at a specific wavelength (units: L·mol⁻¹·cm⁻¹) [37].
- b is the Path Length, the internal width of the sample container, or cuvette (units: cm) [20].
- c is the Concentration of the analyte in the solution (units: mol/L, or M) [20].
This linear relationship is the cornerstone of the calibration curve. By measuring the absorbance of solutions with known concentrations, one can create a plot of absorbance versus concentration, the slope of which yields the product ɛb [20]. This calibration curve then allows for the determination of an unknown concentration by measuring its absorbance and solving for c.
Absorbance (A) itself is defined as the negative base-10 logarithm of the transmittance (T) [20] [30]: A = -log₁₀(T) = log₁₀(I₀/I) Where:
- T is the Transmittance, the fraction of incident light that passes through the sample (T = I/I₀) [8].
- I₀ is the intensity of the incident light [8].
- I is the intensity of the transmitted light [8].
The following table illustrates the inverse logarithmic relationship between absorbance and transmittance, which is why absorbance is the preferred metric for quantitative work [30].
Table 1: Absorbance and Transmittance Values
| Absorbance (A) | Percent Transmittance (%T) | Transmittance (T) |
|---|---|---|
| 0.0 | 100% | 1.0 |
| 0.301 | 50% | 0.5 |
| 1.0 | 10% | 0.1 |
| 2.0 | 1% | 0.01 |
| 3.0 | 0.1% | 0.001 |
| 4.0 | 0.01% | 0.0001 |
Experimental Protocol
The Scientist's Toolkit: Essential Materials and Reagents
A successful experiment requires specific instruments and high-quality materials. The following table details the essential items and their functions.
Table 2: Research Reagent Solutions and Essential Materials
| Item | Function & Specification |
|---|---|
| Spectrophotometer | Instrument that measures the intensity of light transmitted through a sample, enabling the calculation of absorbance at specific wavelengths [30]. |
| Cuvettes | High-quality, matched containers (typically with a 1 cm path length) that hold the sample and standard solutions for analysis. Must be transparent in the spectral region of interest [30]. |
| Analytical Balance | Precision instrument required for accurately weighing solid analyte to prepare stock solutions of known concentration. |
| Volumetric Glassware | Class A flasks (e.g., 100 mL, 50 mL, 25 mL) and pipettes for precise dilution and preparation of standard solutions, ensuring high accuracy in concentration. |
| Pure Analyte | The compound of interest, of known purity, used to prepare the stock and standard solutions. |
| Solvent | A high-purity solvent (e.g., water, buffer) in which the analyte is dissolved. It should not absorb light at the wavelengths used for analysis. |
Step-by-Step Procedure
Step 1: Preparation of a Stock Solution
Accurately weigh a precise mass of the pure, dry analyte using an analytical balance. Quantitatively transfer this analyte into a volumetric flask (e.g., 100 mL) and dissolve it in the solvent to the mark, creating a stock solution of known, relatively high concentration (e.g., 1.0 x 10⁻³ M). This solution must be prepared with high accuracy, as it is the foundation for all subsequent dilutions [37].
Step 2: Determination of Wavelength of Maximum Absorbance (λ_max)
Dilute a small aliquot of the stock solution to create a concentration that gives an absorbance reading below 1.0. Using a spectrophotometer, scan this solution over a range of wavelengths to generate an absorption spectrum. Identify the wavelength at which the absorbance is highest (λ_max). This wavelength will be used for all subsequent measurements because it provides the greatest sensitivity and minimizes the relative error in concentration determination [8].
Step 3: Preparation of Standard Solutions
Using precise volumetric pipettes and flasks, perform a serial dilution of the stock solution to prepare at least five standard solutions spanning a range of concentrations. A minimum of five standards is required to establish a reliable linear trend and calculate a meaningful correlation coefficient (R²). For example, prepare standards at 20%, 40%, 60%, 80%, and 100% of the concentration of the most concentrated standard. The exact concentrations should cover the range expected for the unknown samples [8].
Table 3: Example Preparation of Standard Solutions from a 1.0 x 10⁻³ M Stock
| Standard Solution | Stock Volume (mL) | Final Volume (mL) | Final Concentration (M) |
|---|---|---|---|
| 1 | 2.0 | 100.0 | 2.0 x 10⁻⁵ |
| 2 | 4.0 | 100.0 | 4.0 x 10⁻⁵ |
| 3 | 6.0 | 100.0 | 6.0 x 10⁻⁵ |
| 4 | 8.0 | 100.0 | 8.0 x 10⁻⁵ |
| 5 | 10.0 | 100.0 | 1.0 x 10⁻⁴ |
Step 4: Spectrophotometric Measurement
- Blank Measurement: Fill a cuvette with the pure solvent (or the blank solution) and place it in the spectrophotometer. Set the absorbance to zero at your chosen λ_max. This corrects for any light absorption by the solvent or the cuvette itself [30].
- Measure Standards: Using the same cuvette (or a matched set), measure the absorbance of each standard solution in sequence. Ensure the cuvette is properly cleaned and oriented in the same way for each reading. Record the absorbance value for each known concentration.
Step 5: Construction of the Calibration Curve
Plot the recorded data with absorbance on the y-axis and concentration on the x-axis [8]. Use statistical software to perform a linear regression analysis on the data points. The goal is to obtain a best-fit line with the equation: y = mx + c Where:
- y is the absorbance (A).
- m is the slope of the line (equal to ɛb).
- x is the concentration (c).
- c is the y-intercept, which should theoretically be zero, but in practice may have a small positive or negative value.
The coefficient of determination (R²) should be calculated to verify the linearity of the relationship. An R² value ≥ 0.990 is generally considered acceptable for a reliable calibration, with values closer to 1.000 indicating excellent linearity [8].
Data Analysis and Application
Analyzing the Calibration Curve
The linear regression performed in Step 5 provides the equation needed for quantitative analysis. The slope (m) of the line is critical, as it represents the sensitivity of the method. A steeper slope indicates a greater change in absorbance for a given change in concentration, which translates to higher sensitivity [8].
The linear range of the calibration curve must be noted. At very high concentrations, the Beer-Lambert law may break down due to chemical or instrumental factors, leading to non-linearity (curvature in the plot). All unknown samples must have absorbance values that fall within the linear range of the calibration curve, preferably near the center.
Determining the Concentration of an Unknown Sample
Following the same procedure used for the standards, measure the absorbance of the prepared unknown sample at the same λ_max. Using the equation of the calibration curve, solve for the unknown concentration (x): x = (y - c) / m Where:
- y is the measured absorbance of the unknown.
- m and c are the slope and intercept from the calibration equation.
This calculation yields the concentration of the unknown analyte in the solution [37].
Validation and Quality Control
To ensure ongoing accuracy, several quality control measures should be implemented:
- Quality Control (QC) Samples: Periodically analyze independently prepared standard solutions of known concentration as "unknowns" to verify the accuracy of the calibration.
- Method Precision: Replicate measurements of the same sample should be performed to establish the repeatability (standard deviation and relative standard deviation) of the method.
- Calibration Verification: The calibration curve should be re-established regularly, especially when a new stock solution is prepared, the instrument lamp is changed, or a significant time period has elapsed.
The calibration curve is an indispensable tool in modern quantitative analysis, directly enabled by the Beer-Lambert law. By adhering to this detailed, step-by-step protocol—from careful preparation of standard solutions to rigorous data analysis—researchers and drug development professionals can generate reliable, high-quality data. A well-constructed calibration curve ensures traceability, accuracy, and precision in determining analyte concentrations, forming the bedrock of valid results in pharmaceutical research, clinical diagnostics, and environmental monitoring. Mastery of this technique is fundamental for any scientist employing spectrophotometric methods.
Calculating Unknown Concentrations from Absorbance Data
The Beer-Lambert Law stands as a fundamental principle in quantitative spectroscopy, providing the theoretical foundation for determining solute concentrations in solution through light absorption measurements [8]. This technical guide examines the rigorous application of this law in research settings, detailing the mathematical framework, experimental protocols, and critical considerations for accurate concentration determination in pharmaceutical development and scientific research. We present comprehensive methodologies for calibration curve establishment, address the law's limitations under various experimental conditions, and provide advanced techniques to overcome common challenges encountered in spectroscopic analysis.
The Beer-Lambert Law (also known as Beer's Law) describes a linear relationship between the absorbance of light by a substance and its concentration in solution [8]. This principle enables researchers to quantify analyte concentrations by measuring light attenuation, forming the cornerstone of modern spectrophotometric analysis across chemical, biological, and pharmaceutical disciplines.
Mathematically, the Beer-Lambert Law is expressed as:
Where:
- A is the measured absorbance (a unitless quantity) [8] [7]
- ε is the molar absorptivity or molar extinction coefficient (typically in L·mol⁻¹·cm⁻¹) [7] [39]
- c is the concentration of the absorbing species (in mol/L) [8] [7]
- l is the optical path length through the sample (in cm) [8] [7]
Absorbance (A) itself is defined through the relationship between incident light intensity (I₀) and transmitted light intensity (I):
Transmittance (T), the fraction of incident light that passes through the sample, relates to absorbance as:
T = I/I₀ and %T = 100 × T [8] [38] [39]
The logarithmic relationship between absorbance and transmittance means that each unit increase in absorbance corresponds to a tenfold decrease in transmittance [8]. This relationship reveals why absorbance provides a more practical measurement for quantitative analysis than direct transmittance readings.
Table 1: Relationship Between Absorbance and Percent Transmittance
| Absorbance (A) | Percent Transmittance (%T) |
|---|---|
| 0 | 100% |
| 0.3 | 50% |
| 1.0 | 10% |
| 2.0 | 1% |
| 3.0 | 0.1% |
| 4.0 | 0.01% |
Theoretical Foundation
Fundamental Principles of Light Absorption
When monochromatic light passes through a solution containing absorbing species, photons interact with molecules, promoting electrons to higher energy states [8]. The probability of these interactions depends on the molecular structure of the solute and the energy (wavelength) of the incident light [7]. The molar absorptivity (ε) quantifies this probability, representing the inherent absorption strength of a particular substance at a specific wavelength [8] [7].
The Beer-Lambert law demonstrates that absorbance depends linearly on both concentration and path length [7]. This additive property enables the application of the law to systems containing multiple absorbers, where the total absorbance equals the sum of individual contributions [28]:
Aₜₒₜₐₗ = Σ(εᵢ × cᵢ × l) [28]
This principle is particularly valuable in biological systems where multiple chromophores may be present simultaneously, such as in the measurement of hemoglobin derivatives in blood [28].
The Modified Beer-Lambert Law for Complex Systems
In scattering media like biological tissues, the original Beer-Lambert law requires modification to account for light path lengthening due to scattering. The Modified Beer-Lambert Law incorporates a differential pathlength factor (DPF) to address this phenomenon:
Aλ = [εᴍʜʙ(λ) × cᴍʜʙ + εᴍʙᴏ₂(λ) × cᴍʙᴏ₂] × d × DPF + G [28]
Here, d represents the physical separation between light source and detector, DPF accounts for the increased pathlength due to scattering, and G represents light loss attributable to scattering [28]. This formulation has proven essential for applications such as near-infrared spectroscopy (NIRS) in biomedical contexts [28].
Experimental Design and Protocols
Research Reagent Solutions and Essential Materials
Table 2: Essential Materials for Absorbance-Based Concentration Determination
| Item | Function/Specification |
|---|---|
| Spectrophotometer | Instrument for measuring light absorption at specific wavelengths; should cover UV-visible range (190-1100 nm) for general applications [38]. |
| Cuvettes | Sample containers with defined path length (typically 1 cm); must be transparent at measurement wavelengths (quartz for UV, glass/plastic for visible) [8]. |
| Microplates | High-throughput alternative to cuvettes; 96-, 384-, or 1536-well formats for multiple simultaneous measurements [38]. |
| Standard Solutions | Precisely prepared solutions of known concentration for calibration curve generation; purity should be verified [8]. |
| Dilution Solvents | High-purity solvents (water, buffers, organic solvents) matching the sample solvent; must be transparent at measurement wavelengths [4]. |
| Blank Solution | Solution containing all components except the analyte of interest; used to zero the instrument [4]. |
Calibration Curve Generation Protocol
Stock Solution Preparation: Prepare a concentrated stock solution of the analyte with precisely known concentration. For organic dyes like Rhodamine B, concentrations in the millimolar range are typical [8].
Standard Solution Dilution Series: Create a series of standard solutions covering the expected concentration range of unknowns. Use serial dilution techniques with precise volumetric equipment:
- Example: For Rhodamine B, prepare 5-8 standards covering 0-20 μM [8]
- Ensure all standards are prepared in identical solvent/matrix conditions
Spectrophotometer Setup:
Absorbance Measurement:
- Measure absorbance of each standard solution in triplicate
- Record average values for each concentration
- For quality control, ensure replicate measurements have low variance (<5% RSD)
Calibration Curve Construction:
- Plot average absorbance (y-axis) versus concentration (x-axis)
- Perform linear regression to obtain the equation: A = (εl) × c + intercept
- The slope equals the product of molar absorptivity and path length (εl)
Figure 1: Workflow for generating a spectroscopic calibration curve following established protocols [8].
Sample Analysis Protocol
Sample Preparation: Process unknown samples using the same method as standards. For complex matrices, additional purification may be necessary.
Absorbance Measurement: Measure sample absorbance under identical conditions to standards. If absorbance exceeds linear range (typically >1.5), dilute and remeasure [38].
Concentration Calculation: Use the calibration curve equation to calculate unknown concentration:
cunknown = (Aunknown - intercept) / slope
Result Validation: Measure quality control samples with known concentrations to verify accuracy. Include blanks periodically to detect contamination.
Data Analysis and Interpretation
Quantitative Data Treatment
Table 3: Troubleshooting Common Data Analysis Issues
| Issue | Potential Causes | Solutions |
|---|---|---|
| Non-linear Calibration Curve | - Excessive concentration [38]- Chemical interactions [4]- Instrument limitations | - Dilute samples- Use weaker absorption bands [4]- Verify instrument linearity |
| High Background Signal | - Impurities in solvent- Contaminated cuvettes- Light scattering | - Use higher purity solvents- Thoroughly clean equipment- Use appropriate blank |
| Poor Replicate Agreement | - Incomplete mixing- Pipetting errors- Sample degradation | - Ensure homogeneous solutions- Calibrate pipettes- Protect light-sensitive samples |
| Absorbance Outside Optimal Range | - Incorrect dilution- Wrong path length | - Dilute or concentrate samples- Use appropriate cuvette |
Calculation Examples
For a Rhodamine B calibration curve with the equation: A = 0.045 × c (μM) + 0.002
If an unknown sample produces A = 0.352:
- c = (0.352 - 0.002) / 0.045 = 7.78 μM
If this sample was diluted 5-fold before measurement:
- c_original = 7.78 × 5 = 38.9 μM
For substances with known molar absorptivity, concentration can be calculated directly:
- c = A / (ε × l)
For example, for NADH (ε₃₄₀ = 6220 M⁻¹cm⁻¹) with A = 0.285 in a 1 cm pathlength:
- c = 0.285 / (6220 × 1) = 4.58 × 10⁻⁵ M = 45.8 μM [38]
Limitations and Practical Considerations
Fundamental Limitations of the Beer-Lambert Law
The Beer-Lambert law provides an excellent approximation for ideal systems but has recognized limitations that researchers must acknowledge:
Chemical Deviations occur when concentration changes alter the chemical environment of chromophores. Molecular interactions at higher concentrations can shift absorption spectra or change molar absorptivity [4]. Electrolyte equilibrium shifts with dilution may also modify absorption characteristics.
Instrumental Deviations arise from the use of polychromatic light in real instruments versus the theoretical requirement for monochromatic light [4]. Stray light reaching the detector without passing through the sample creates positive deviations from ideal behavior.
Optical Effects including light scattering, fluorescence, and optical interference can significantly impact measurements [4]. Particularly in heterogeneous samples or thin films, interference effects from reflected light waves can create fluctuations in measured intensity that do not follow Beer-Lambert predictions [4].
Optimal Measurement Range and Linearity
For reliable quantitative measurements, absorbance should generally fall between 0.1 and 1.0 AU, corresponding to 80% to 10% transmittance [38]. Within this range, the relative error in concentration determination is minimized. Measurements with absorbance exceeding 1.5-2.0 AU typically show significant deviation from linearity and increased error [38].
Table 4: Recommended Absorbance Ranges for Quantitative Analysis
| Absorbance Range (AU) | Transmittance Range (%) | Suitability for Quantitation |
|---|---|---|
| < 0.1 | > 80% | Poor (low signal-to-noise) |
| 0.1 - 1.0 | 80% - 10% | Excellent (optimal range) |
| 1.0 - 1.5 | 10% - 3% | Acceptable (with caution) |
| 1.5 - 3.0 | 3% - 0.1% | Marginal (significant error) |
| > 3.0 | < 0.1% | Unsuitable for quantitation |
When sample absorbance exceeds the optimal range, dilution is recommended to bring measurements into the 0.1-1.0 AU range [38]. The dilution factor must be incorporated into final concentration calculations.
Path Length Considerations
In traditional cuvette-based spectroscopy, path length remains fixed (typically 1 cm). However, in microplate-based measurements, path length varies with well volume and must be accounted for [38]. Modern microplate readers often incorporate automatic path length correction using water absorption peaks or geometric calculations [38].
For light-scattering samples like microbial cultures (OD₆₀₀ measurements), volume-based path length correction is recommended over water peak-based methods, as scattering interferes with the reference measurements [38].
Advanced Applications and Modifications
Multi-Component Analysis
The additive property of absorbance enables quantification of multiple analytes in mixture. For a system with n components, absorbance at any wavelength equals:
A(λ) = Σ(εᵢ(λ) × cᵢ × l) for i = 1 to n [28]
By measuring absorbance at multiple wavelengths and solving simultaneous equations, individual concentrations can be determined. This approach requires knowing each component's molar absorptivity at all measurement wavelengths.
Time-Domain Applications
In specialized applications like radioisotope gauging, a time-domain form of the Lambert-Beer law has been developed:
Tₓ = T₀ × exp(μ × l × Nᵣ) [40]
Where Tₓ represents the time needed to register a fixed number of photons, replacing traditional intensity measurements. This approach improves temporal resolution in dynamic systems without requiring stronger radiation sources [40].
The Beer-Lambert law provides an essential foundation for quantitative absorption spectroscopy in research and drug development. While its basic formulation enables straightforward concentration determination through calibration curves, researchers must recognize its limitations and appropriate application boundaries. Optimal results require careful experimental design, including proper blank correction, concentration ranges within linear response, and awareness of potential chemical and instrumental deviations. Advanced modifications extend its utility to complex systems including scattering media and multi-component mixtures. When applied with appropriate rigor and validation, absorbance-based concentration determination remains a powerful, versatile technique across scientific disciplines.
In the development of modern pharmaceuticals, the precise determination of Active Pharmaceutical Ingredient (API) concentration and rigorous quality control (QC) are foundational to ensuring drug safety, efficacy, and consistency. These processes are critical from early development through commercial manufacturing, directly impacting patient dosing and therapeutic outcomes [41]. The quality of a biopharmaceutical product and its analytical readout serve as the cornerstone of the entire development process, underpinning process development, manufacturing, and eventual regulatory approval [41].
This guide explores the key technical applications, focusing on the role of spectroscopic techniques, particularly those based on the Beer-Lambert Law, in the quantitative analysis of APIs. Furthermore, it examines the integrated QC systems that ensure pharmaceuticals meet stringent regulatory standards throughout their lifecycle.
Theoretical Foundation: The Beer-Lambert Law in Spectroscopy
Fundamental Principles
The Beer-Lambert Law (also known as Beer's Law) is a fundamental relationship in optical spectroscopy that forms the basis for the quantitative analysis of solutions [8]. It describes the logarithmic relationship between the attenuation of light passing through a substance and the properties of that substance. Consider monochromatic light with an incident intensity ((I_0)) passing through a sample solution and emerging with a transmitted intensity ((I)).
Transmittance ((T)) is defined as the ratio of the transmitted to incident light intensity: [ T = \frac{I}{I_0} ] This is more commonly expressed as percentage transmittance (\%T) [20].
Absorbance ((A)), the quantity most directly used in quantitative analysis, has a logarithmic relationship to transmittance: [ A = -\log{10}T = \log{10}\left(\frac{I_0}{I}\right) ] An absorbance of 0 corresponds to 100\% transmittance, while an absorbance of 1 corresponds to 10\% transmittance [8].
The Beer-Lambert Law establishes a direct proportional relationship between absorbance and concentration: [ A = \epsilon b c ] where:
- (A) is the measured absorbance (dimensionless)
- (\epsilon) is the molar absorptivity (M⁻¹cm⁻¹), a compound-specific property
- (b) is the optical path length (cm) of the cell containing the solution
- (c) is the concentration of the absorbing species (M) [20]
This linear relationship enables the determination of unknown concentrations by measuring absorbance, making it indispensable for pharmaceutical analysis [20].
Practical Considerations and Limitations
While the Beer-Lambert Law is unquestionably the most important law in optical spectroscopy, users must be aware of its limitations and potential pitfalls [2]. The law provides an accurate description of light-matter interaction only under specific conditions. Factors that can cause deviations include:
- Chemical interactions between absorbing species
- Wave optics-based effects arising from the wave nature of light
- Instrumental errors such as insufficient resolution or detector nonlinearity
- High concentrations that may lead to molecular interactions
- Reflection losses at cell interfaces, which are often not accounted for in simple formulations [2]
For the BBL law to hold, the sample must be homogeneous, the light must be monochromatic, and the absorbing species must not undergo chemical changes at different concentrations. Understanding these limitations is essential for the correct interpretation of spectroscopic data in pharmaceutical applications [2].
Analytical Techniques for API Concentration Determination
Spectroscopic Methods
UV Absorbance Spectroscopy is one of the most commonly applied techniques for determining protein concentration in biopharmaceuticals [41]. The method leverages the inherent absorbance of proteins in the UV range, primarily due to aromatic amino acids. The selection of appropriate dilution factors and pathlengths is crucial for accurate measurements, especially for high-concentration monoclonal antibody formulations where a one- or two-step gravimetric dilution combined with medium or narrow pathlength represents a promising approach [41].
Table 1: UV Methods for Different Expected Protein Concentrations
| Expected Concentration Range | Recommended Pathlength | Dilution Strategy |
|---|---|---|
| High (e.g., mAbs) | Medium or narrow | One- or two-step gravimetric dilution |
| Medium | 1 cm (standard) | Single dilution as needed |
| Low | Extended pathlength | Minimal or no dilution |
Other spectroscopic techniques include:
- Near-Infrared (NIR) Spectroscopy: Based on absorption of light by asymmetric polar bonds; useful for fast, non-destructive analysis [42]
- Raman Spectroscopy: Arises from inelastic scattering of light by symmetric nonpolar bonds; provides complementary information to NIR [42]
- Chemiluminescence: Based on the relationship between chemiluminescence intensity and analyte concentration; offers high sensitivity for specific applications [43]
Separation and Other Analytical Methods
Chromatographic techniques play a predominant role in pharmaceutical QC, particularly for complex samples and impurity profiling [42].
- Liquid Chromatography (HPLC/UHPLC): The most prevalent technique for QC analysis, often coupled with mass spectrometry (MS) for enhanced sensitivity and specificity [42]
- Supercritical Fluid Chromatography (SFC): An emerging technique with advantages in reduced solvent use and faster analysis times [42]
- Multi-dimensional Chromatography: Used for complex separation challenges beyond the capabilities of single-dimension chromatography [42]
Other relevant methods include:
- Gravimetric Analysis: Involves separation and weighing of the component of interest; provides high accuracy but is time-consuming [43]
- Acid-Base Titration: Measures content based on volume of standard solution consumed; used for raw materials and finished products [43]
- Electrophoresis: Particularly valuable for biotechnology products and biochemical drugs; offers high sensitivity and reproducibility [43]
Table 2: Comparison of Major Analytical Techniques for API Concentration
| Technique | Primary Application | Sensitivity | Precision | Speed |
|---|---|---|---|---|
| UV Spectroscopy | Protein concentration | Moderate | High | Fast |
| HPLC-MS | Impurity profiling, quantification | High | High | Moderate |
| Gravimetric Analysis | Raw material quantification | Low | Very High | Slow |
| NIR Spectroscopy | Process monitoring | Moderate | Moderate | Very Fast |
| Titration | Raw material assay | Low | High | Moderate |
Quality Control in Pharmaceutical Development
The Quality Control Framework
Pharmaceutical Quality Control encompasses all steps of pharmaceutical manufacturing, from the control of raw materials (drug substances and excipients) to the release of the final drug product [42]. The primary objectives of QC are to:
- Identify and quantify the active substance(s)
- Track and control impurities
- Ensure product consistency and compliance with specifications
- Provide data for regulatory submissions [42]
QC operates within the broader framework of Good Manufacturing Practices (GMP), with regulatory agencies worldwide providing guidelines and requirements to ensure drug quality, efficacy, and safety [42]. The landscape of pharmaceutical QC is continuously evolving, with emerging analytical technologies helping to address a wide range of analytical challenges from fast in-situ API quantitation to complex impurities profiling [42].
Emerging Techniques in Pharmaceutical QC
The field of pharmaceutical analysis is witnessing significant innovation, with several emerging technologies gaining prominence:
- Portable NIR Instruments: Enable fast in-situ API quantitation and real-time release testing [42]
- Advanced Chromatographic Techniques: SFC and multi-dimensional chromatography offer improved separations with reduced solvent consumption [42]
- Vibrational Spectroscopic Techniques: NIR and Raman spectroscopies are increasingly used for routine analysis due to their non-destructive nature and minimal sample preparation [42]
These innovations are driven by the need for faster, greener, less expensive, and more efficient analytical tools that can meet increasingly stringent regulatory requirements while maintaining the high standards necessary for pharmaceutical quality assurance [42].
Experimental Protocols and Methodologies
API Concentration Measurement by UV Spectroscopy
Protocol for Protein Concentration Determination in Biopharmaceuticals
This protocol outlines the development of an accurate, precise, and robust method for determining the protein content of biopharmaceutical therapeutics using UV spectroscopy [41].
Materials and Equipment:
- UV/Vis spectrophotometer with wavelength selection capability
- Quartz cuvettes with appropriate pathlengths (e.g., 1 cm, 0.1 cm for high concentrations)
- Precision micropipettes and volumetric glassware
- Analytical balance for gravimetric dilutions
- Reference buffer matching the formulation excipients
- Protein standard solutions for method qualification
Method Development Steps:
Preliminary Analysis:
- Determine approximate concentration range and sample viscosity
- Select appropriate pathlength based on expected concentration (refer to Table 1)
- Establish dilution scheme if needed to maintain absorbance within linear range (0.1-1.0 AU)
Method Optimization:
- Confirm wavelength of maximum absorbance (typically 280 nm for proteins)
- Establish dilution protocol ensuring target absorbance range
- Validate dilution solvent matches formulation buffer to avoid artifacts
Qualification/Validation:
- Establish linearity across working concentration range (R² > 0.995)
- Determine precision (repeatability and intermediate precision)
- Assess accuracy through spike-recovery experiments
- Evaluate robustness to minor method parameter variations
Sample Analysis:
- Perform appropriate dilutions gravimetrically or volumetrically
- Measure absorbance against reference buffer blank
- Calculate concentration using established calibration curve or known molar absorptivity
Critical Considerations:
- The determined protein content directly impacts several other critical quality attributes, including potency and bioassay results [41]
- Method robustness significantly affects development workload, timeline, and costs
- For high-concentration monoclonal antibodies, gravimetric dilution with adjusted pathlength is often necessary [41]
Validation of Analytical Methods
The validation of analytical methods is essential for regulatory compliance and ensuring data reliability. Key validation parameters include:
- Accuracy: The closeness of test results to the true value, typically established through spike-recovery experiments
- Precision: The degree of agreement among individual test results, including repeatability and intermediate precision
- Linearity: The ability to obtain test results proportional to analyte concentration within a given range
- Range: The interval between upper and lower concentration levels with demonstrated precision, accuracy, and linearity
- Specificity: The ability to assess unequivocally the analyte in the presence of expected components
- Robustness: The capacity to remain unaffected by small, deliberate variations in method parameters
The validation approach should follow established guidelines such as the SFSTP proposal on validation of quantitative analytical procedures [42].
Regulatory Considerations and Industry Perspectives
Current Regulatory Landscape
Regulatory agencies worldwide maintain stringent requirements for pharmaceutical quality control, with continuous updates to guidance documents. Recent developments include:
- FDA Guidance on Alternative Tools for Assessing Drug Manufacturing Facilities (September 2025) [44]
- ICH Q1 Stability Testing of Drug Substances and Drug Products (Draft, June 2025) [44]
- FDA Guidance on Control of Nitrosamine Impurities in Human Drugs (Final, September 2024) [44]
- ICH M13A Bioequivalence for Immediate-Release Solid Oral Dosage Forms (Final, October 2024) [44]
These regulatory documents emphasize the importance of robust analytical methods, comprehensive impurity profiling, and lifecycle management of quality control procedures.
Industry Trends and Consortium Approaches
The pharmaceutical industry is increasingly adopting collaborative approaches to harmonize development practices. The European Pharma Oligonucleotide Consortium (EPOC) exemplifies this trend, bringing together multiple companies to share chemistry, manufacturing, and control knowledge with the aim of establishing science-based recommendations for oligonucleotide development [45]. Similar collaborative models are emerging for other therapeutic modalities, promoting standardization and efficiency in pharmaceutical development.
The industry is also witnessing a shift toward more integrated approaches to API and drug product manufacturing. For oligonucleotides, for example, there is growing interest in moving directly from API solution to drug product manufacturing, eliminating the lyophilization step and potentially improving manufacturing efficiency [45]. Such approaches require careful evaluation of relative advantages and disadvantages for each specific product.
Visualizing Analytical Workflows
API Concentration Analysis Workflow
Pharmaceutical Quality Control System
The Scientist's Toolkit: Essential Research Reagents and Materials
Table 3: Essential Materials for API Concentration and Quality Control Analysis
| Item | Function | Application Notes |
|---|---|---|
| UV-Transparent Cuvettes | Contain samples for spectrophotometric analysis | Quartz for UV range; various pathlengths for different concentration ranges |
| Reference Standards | Calibration and method validation | Certified reference materials with known purity and concentration |
| HPLC/UHPLC Columns | Separation of analytes in complex mixtures | Different selectivities (reverse phase, ion exchange, size exclusion) |
| Mobile Phase Solvents | Liquid chromatography eluents | HPLC-grade purity with appropriate modifiers (buffers, ion-pair reagents) |
| Buffer Components | Sample preparation and mobile phases | Control pH and ionic strength; high-purity reagents |
| Filtration Apparatus | Sample clarification | Remove particulates that could interfere with analysis; compatible membranes |
| Precision Pipettes | Accurate liquid handling | Regular calibration critical for volumetric accuracy |
| Analytical Balance | Gravimetric measurements | Essential for preparation of standard solutions and exact dilutions |
The accurate determination of API concentration and implementation of robust quality control systems are critical components of pharmaceutical development. The Beer-Lambert Law continues to serve as a fundamental principle underpinning many spectroscopic methods used for quantitative analysis, while emerging technologies offer new capabilities for faster, more efficient quality assessment.
As the pharmaceutical landscape evolves with increasingly complex modalities, including oligonucleotides, biologics, and advanced delivery systems, the analytical toolbox must similarly advance. A thorough understanding of both established and emerging technologies, coupled with knowledge of regulatory expectations, enables scientists to develop fit-for-purpose methods that ensure drug quality, patient safety, and therapeutic efficacy throughout the product lifecycle.
Quantitative spectroscopy serves as a critical analytical foundation across diverse fields, from clinical medicine to environmental science. The Beer-Lambert Law provides the fundamental theoretical framework that enables the precise measurement of analyte concentrations in both settings. This law establishes a direct, linear relationship between the absorption of light and the properties of an absorbing medium, formally stated as A = εcl, where A is the measured absorbance, ε is the molar absorptivity (a compound-specific constant), c is the concentration of the analyte, and l is the path length the light travels through the sample [46] [47].
In medical monitoring, this principle allows for the non-invasive determination of blood oxygen saturation through pulse oximetry. In environmental sensing, it facilitates the detection and quantification of specific air pollutants. This guide explores the technical implementation of the Beer-Lambert law in these two distinct domains, providing researchers with a unified perspective on spectroscopic quantification, detailed methodologies, and essential experimental tools.
Theoretical Foundation: Beer-Lambert Law in Quantitative Analysis
The Beer-Lambert law synthesizes two historical observations: Lambert's law, which states that absorbance is proportional to the path length of light (A ∝ l), and Beer's law, which states it is proportional to the concentration of the absorbing species (A ∝ c) [46]. The combined derivation proceeds from the differential form of the law.
Mathematical Derivation
The step-by-step derivation of the Beer-Lambert Law is as follows [46]:
- Differential Form: The decrease in light intensity (
-dI) as it passes through an infinitesimally thin layer of sample (dx) is proportional to the incident intensity (I) and the thickness of the layer. This is expressed as-dI/dx = aI, whereais the absorption coefficient. - Integration: This differential equation is integrated:
∫(dI/I) = -a ∫dx, yieldingln(I) = -a x + C, whereCis the constant of integration. - Apply Boundary Conditions: At the point where the light enters the sample (
x = 0), the intensity is the initial intensityI₀. Thus,ln(I₀) = C. Substituting givesln(I) = -a x + ln(I₀). - Rearrange and Convert Logarithm Base: This simplifies to
ln(I₀/I) = a x. Converting the natural logarithm to base-10 giveslog₁₀(I₀/I) = (a / 2.303) x. - Introduce Concentration: For solutions, the absorption coefficient
ais proportional to the concentrationc, soa = εc, whereεis the molar absorptivity. - Final Form: Substituting yields
log₁₀(I₀/I) = ε c l, wherelis the total path length. The termlog₁₀(I₀/I)is defined as Absorbance (A), resulting in the familiar form: A = ε c l.
Conditions and Limitations
For accurate application of the Beer-Lambert law, specific conditions must be met [46]:
- The incident light should be monochromatic.
- The absorbing medium must be homogeneous.
- The absorbing species should not undergo chemical changes (e.g., association or dissociation) with concentration.
- The light should be parallel and traverse identical path lengths.
- The sample must not exhibit scattering or fluorescence.
Deviations from linearity occur at high concentrations (>0.01 M) due to molecular interactions and changes in refractive index [46].
Spectroscopic Application I: Blood Oxygen Saturation Monitoring
Pulse oximetry is a non-invasive medical technique that leverages the Beer-Lambert law to determine the oxygen saturation of arterial blood (SpO₂) [48].
Fundamental Principles and Instrumentation
The underlying principle is the differential absorption of red and infrared light by oxygenated hemoglobin (HbO₂) and deoxygenated hemoglobin (Hb). HbO₂ absorbs more infrared light (940 nm), while Hb absorbs more red light (660 nm) [48]. A pulse oximeter probe contains two light-emitting diodes (LEDs) at these wavelengths and a single photodetector [48].
The device does not measure a simple absorption through a static sample. Instead, it uses the pulsatile component of the absorption signal—caused by the influx of arterial blood with each heartbeat—to isolate the absorption due to arterial blood from that of venous blood, tissue, and bone [48]. The proprietary algorithm in the pulse oximeter then computes the ratio of absorbed red and infrared light from this pulsatile signal to display the SpO₂ value [48].
Quantitative Parameters and Clinical Interpretation
The following table summarizes the key quantitative parameters and their clinical significance in pulse oximetry.
Table 1: Quantitative Parameters and Clinical Interpretation in Pulse Oximetry
| Parameter | Normal Range | Critical Finding | Clinical Significance & Notes |
|---|---|---|---|
| Oxygen Saturation (SpO₂) | 95% - 100% [49] [50] | <90% (Hypoxemia) [48] | At sea level. For those with chronic lung disease, "normal" may be lower [50]. |
| Perfusion Index (PI) | Varies; measures peripheral perfusion strength [48] | Low value indicates poor perfusion | Used to assess success of sympathectomy; inversely related to pain stimuli [48]. |
| Pulse Rate | 60-100 bpm (Adults) [49] | Context-dependent | Displayed by most pulse oximeters [49]. |
Experimental Protocol for Pulse Oximetry
Objective: To non-invasively monitor arterial oxygen saturation and pulse rate.
Materials:
- Hospital-grade or FDA-cleared pulse oximeter [48]
- Appropriate probe (single-use adhesive or reusable clip) [48]
- Alcohol swab (if needed)
Methodology:
- Patient Preparation: Ensure the patient is relaxed and motionless. Remove any dark nail polish or artificial nails from the measurement site (typically a fingertip or earlobe), as these can interfere with light transmission [48] [49].
- Probe Placement: Clip the probe securely onto the chosen site, ensuring the light emitters and detector are aligned across the tissue bed (e.g., directly opposite each other on the fingernail and finger pad) [48].
- Signal Acquisition: Instruct the patient to remain still to minimize motion artifact. The device will emit light and the detector will capture the transmitted light intensity over several pulse cycles.
- Data Processing: The device's internal algorithm isolates the pulsatile (AC) signal from the non-pulsatile (DC) component at both 660 nm and 940 nm. It calculates the ratio (R) of the AC/DC for red light to the AC/DC for infrared light.
- Result Calculation: The device uses an empirically calibrated lookup table to convert the ratio
Rinto an SpO₂ percentage, which is displayed along with the pulse rate [48].
Troubleshooting and Factors Affecting Accuracy:
- Poor Perfusion: Low blood pressure, hypothermia, or vasoconstriction can weaken the signal [48] [49].
- Motion Artifact: Shivering or patient movement can cause erroneous readings [50].
- Skin Pigmentation: Dark skin tone can lead to an overestimation of SpO₂ by ~2%, potentially increasing the rate of unrecognized hypoxemia [48] [50].
- Ambient Light: Strong external light can interfere with the sensor; the probe should be covered if necessary [48].
- Dyshemoglobinemias: Elevated levels of carboxyhemoglobin (e.g., from carbon monoxide poisoning) or methemoglobin can cause falsely high or low readings, respectively. Confirmation requires a co-oximeter [48] [49].
Spectroscopic Application II: Indoor Air Pollutant Detection
The same principles of absorption spectroscopy are applied to environmental monitoring, particularly for detecting gases listed as priority pollutants by the World Health Organization (WHO) [51].
Fundamental Principles and Instrumentation
Metal Oxide Semiconductor (MOS) gas sensors are a common technology for indoor air quality (IAQ) monitoring. Unlike the direct transmission measurement in pulse oximetry, most MOS sensors operate on a chemiresistive principle [51]. When a target gas (e.g., CO, NO₂, VOCs) interacts with the heated surface of the metal oxide (e.g., SnO₂, ZnO), it causes a change in the electrical resistance of the material. This resistance change is proportional to the gas concentration.
While the core measurement is resistive, the underlying interaction is spectroscopic. The gas molecules adsorb onto the sensor surface and undergo oxidation/reduction reactions, which change the electron depletion layer and thus the resistance. This process is fundamentally driven by the molecule's ability to interact with specific energy levels, analogous to light absorption. Advanced spectroscopic techniques like Non-Dispersive Infrared (NDIR) spectroscopy also directly use the Beer-Lambert law for gas quantification by measuring the absorption of specific IR wavelengths characteristic of the target gas [52].
Quantitative Parameters for Priority Pollutants
The following table outlines key pollutants and the spectroscopic approach to their detection.
Table 2: Key Indoor Air Pollutants and Detection Methods
| Pollutant | Typical Detection Method | Key Spectral Feature / Mechanism | Notes on Quantification |
|---|---|---|---|
| Carbon Monoxide (CO) | MOS, NDIR [51] | Fundamental IR absorption bands [52] | MOS sensors can suffer from cross-sensitivity with other gases (e.g., VOCs, H₂) [51]. |
| Nitrogen Dioxide (NO₂) | MOS [51] | -NO₂ stretching vibration in IR/Raman [52] | Highly reactive; requires stable sensing material. |
| Volatile Organic Compounds (VOCs) | MOS, NIR [51] [52] | C-H stretching overtones in NIR; molecular vibration fingerprints [52] | MOS sensors provide a total VOC (TVOC) estimate; GC-MS is needed for speciation. |
| Ozone (O₃) | UV Spectroscopy [52] | Strong absorption in the UV region (e.g., 254 nm) [52] | Direct application of Beer-Lambert law with UV light. |
Experimental Protocol for Indoor Air Quality Monitoring
Objective: To quantitatively monitor the concentration of a specific gas (e.g., Carbon Monoxide) in indoor air using a spectroscopic/chemiresistive sensor.
Materials:
- Calibrated MOS or NDIR gas sensor module
- Data acquisition system (e.g., microcontroller, computer interface)
- Standard gas for calibration (e.g., known concentration of CO in balanced air)
- Environmental chamber or controlled test atmosphere
Methodology:
- Sensor Preparation and Calibration:
- Power the sensor and allow it to stabilize (pre-heat) as per manufacturer specifications.
- Expose the sensor to a zero gas (clean, dry air) and record the baseline resistance/voltage output.
- Expose the sensor to a standard gas with a known concentration of the target analyte. Record the sensor's response.
- Perform a multi-point calibration to establish a dose-response curve (Resistance/Voltage vs. Concentration).
- Sample Measurement:
- Deploy the calibrated sensor in the sampling environment.
- The sensor continuously samples the ambient air. The target gas molecules adsorb onto the metal oxide surface.
- The change in electrical resistance (for MOS) or the attenuation of IR light (for NDIR) is measured by the instrument's electronics.
- Data Processing and Quantification:
- For MOS sensors, the change in resistance (ΔR) is converted to a gas concentration using the pre-established calibration curve. The relationship is often not perfectly linear and may require fitting to a logarithmic or power-law model.
- For NDIR sensors, the Beer-Lambert law is applied directly. The absorbance
Aat a specific IR wavelength is measured, and the concentrationcis calculated asc = A / (ε l), whereεis the known absorptivity of the gas andlis the fixed path length of the sampling cell.
Troubleshooting and Factors Affecting Accuracy:
- Cross-Sensitivity: MOS sensors often respond to multiple gases, leading to false positives. Sensor arrays and machine learning algorithms are used to improve selectivity [51].
- Environmental Conditions: Temperature and humidity significantly affect MOS sensor resistance and must be controlled or compensated for [51].
- Sensor Drift: The sensitivity of MOS sensors can change over time, requiring periodic re-calibration.
- Limited Detection Range: Sensors may saturate at high concentrations or lack sensitivity at very low (ppb) levels.
The Scientist's Toolkit: Essential Research Reagents and Materials
The following table details key materials and their functions for the spectroscopic techniques discussed.
Table 3: Essential Reagents and Materials for Spectroscopic Monitoring
| Item / Reagent | Function / Application | Technical Notes |
|---|---|---|
| Pulse Oximeter Probe | Non-invasive measurement of SpO₂ and pulse rate. | Available as single-use adhesive or reusable clips; site-specific probes (finger, earlobe, forehead) optimize signal [48]. |
| Metal Oxide (SnO₂, ZnO) | Chemiresistive sensing element for gases like CO, NO₂, VOCs [51]. | Sensing performance is tuned by doping with catalytic metals (e.g., Pt, Pd) and operating at specific heated temperatures [51]. |
| Standard Gas Mixtures | Calibration of gas sensors for accurate quantification. | Contains a precise, certified concentration of the target analyte (e.g., 50 ppm CO in N₂) in a balanced gas. Essential for establishing a calibration curve. |
| NIST-Traceable Neutral Density Filters | Verification and calibration of spectrophotometer/optoelectronic system linearity. | Used to ensure the accuracy of light intensity measurements across the device's operating range. |
Advanced Frontiers: Machine Learning and Multi-Omics Data Integration
The field of quantitative spectroscopy is being revolutionized by computational approaches.
Machine Learning in Spectroscopy: ML algorithms, particularly supervised learning, are being applied to predict spectroscopic properties and interpret complex spectral data [53]. For experimental data, ML models can be trained to identify patterns and correlate spectral features with sample properties (e.g., identifying protein structural changes in a corona around nanoparticles from UV Resonance Raman spectra) [54]. This is crucial for handling overlapping signals in complex mixtures, a common challenge in both environmental and biological samples [53].
Data Visualization in Comparative Analysis: In integrated "omics" studies (e.g., proteomics, metabolomics), Venn diagrams are a primary tool for visualizing the overlap and uniqueness of molecular lists across different experimental conditions [55]. For example, they can show which metabolites are uniquely altered by a pollutant exposure versus those shared with a control group, helping to generate hypotheses about specific biomarkers [55]. Best practices for generating these diagrams include rigorous data preprocessing, unified identifier systems, and limiting comparisons to 2-4 groups for clarity [55].
Navigating Limitations and Deviations for Accurate Results
Recognizing and Correcting for Non-Linearities at High Concentrations
The Beer-Lambert Law (BLL) is a cornerstone of quantitative spectroscopy, providing the fundamental relationship between the absorbance of light and the properties of a material through which the light is traveling. It is formally expressed as ( A = \epsilon l c ), where ( A ) is the measured absorbance, ( \epsilon ) is the molar absorptivity, ( l ) is the optical path length, and ( c ) is the concentration of the analyte [7] [8]. This law predicts a direct, linear relationship between absorbance and concentration, forming the basis for concentration measurements in a vast array of scientific fields, from drug development to environmental monitoring.
However, under real-world conditions, particularly at high concentrations, this linear relationship often breaks down, leading to non-linear deviations [56] [4]. Recognizing and correcting for these deviations is critical for maintaining accuracy in quantitative research. These non-linearities can stem from a variety of physicochemical and instrumental factors, which, if unaddressed, can lead to significant inaccuracies in concentration measurements, compromised calibration models, and ultimately, flawed scientific conclusions [56] [57]. This guide provides an in-depth examination of the sources of these non-linearities and details robust methodologies for their identification and correction within the context of modern spectroscopic research.
Fundamental Causes of Non-Linear Deviation
Deviations from the Beer-Lambert law are not merely experimental errors but are often inherent to the system being studied. Understanding these root causes is the first step in developing effective correction strategies.
Physicochemical Factors
High Analyte Concentration: At high concentrations, the average distance between analyte molecules decreases significantly. This proximity leads to electrostatic interactions between molecules, which can alter the electronic structure of the analyte and, consequently, its absorption properties [4]. The molar absorptivity (( \epsilon )) is no longer a constant but becomes dependent on concentration. Furthermore, the assumption that molecules absorb independently of their neighbors becomes invalid, a phenomenon sometimes mischaracterized as "molecular shadowing," though the true cause is more accurately attributed to changes in the local electromagnetic environment [4].
Changes in Refractive Index: The BLL, in its classic form, does not fully account for the effects of a medium's refractive index. In highly concentrated solutions, the refractive index can differ substantially from that of the pure solvent. This difference affects how light is refracted and reflected at the cuvette interfaces, leading to apparent deviations in absorbance due to interference effects and changes in the effective path length [4]. These effects are particularly pronounced in thin films or samples with well-defined, parallel interfaces.
Chemical Equilibria and Molecular Aggregation: At elevated concentrations, analytes may participate in equilibrium reactions such as dimerization or polymerization. These newly formed aggregates often possess distinct absorption spectra compared to the monomeric analyte. The measured absorbance then represents a composite signal from multiple species, violating the fundamental requirement of the BLL that the absorbing species remains unchanged [56].
Instrumental and Matrix-Related Factors
Stray Light and Detector Non-Linearity: Instrumental limitations are a major source of deviation. Stray light, defined as any light reaching the detector that does not pass through the sample, becomes a significant problem at high absorbances. Its effect causes a negative deviation from the BLL, as the measured transmitted intensity (( I )) is higher than it should be [58]. Additionally, all detectors have a finite linear dynamic range. At very high light intensities (corresponding to very low absorbance) or very low light intensities (very high absorbance), the detector response can become non-linear [59].
Light Scattering: In biological or complex sample matrices, the presence of particulates, soluble protein aggregates, or large molecules can cause Rayleigh and Mie scattering [60]. This scattering attenuates the light beam not through absorption, but by redirecting it away from the detector. This leads to a positive deviation in the measured absorbance, as the total attenuation is overestimated [60]. This is a common challenge in the spectroscopic analysis of proteins and nanoparticles in drug development.
Polychromatic Light: The BLL is strictly valid for monochromatic light. While modern spectrophotometers use monochromators, the exiting light beam has a finite, albeit narrow, bandwidth. If the molar absorptivity (( \epsilon )) changes significantly across this bandwidth, a deviation from linearity will occur because the different wavelengths of light are being absorbed with different efficiencies [56].
The following table summarizes these primary causes and their observable effects.
Table 1: Fundamental Causes of Non-Linear Deviation from the Beer-Lambert Law
| Category | Specific Cause | Nature of Deviation | Common Occurrence |
|---|---|---|---|
| Physicochemical | High Concentration (Molecular Interactions) | Positive or Negative | All concentrated solutions |
| Changes in Refractive Index | Positive or Negative | Thin films, high-concentration solutions | |
| Chemical Equilibria (Dimerization) | Positive | Aqueous solutions of dyes, organic compounds | |
| Instrumental | Stray Light | Negative | High absorbance measurements (>2 AU) |
| Detector Non-Linearity | Negative or Positive | Signal extremes (very high or low light) | |
| Polychromatic Light | Negative | Broad absorption bands | |
| Matrix Effects | Light Scattering (Particulates) | Positive | Protein aggregates, nanoparticle suspensions |
| Background Absorption | Positive | Complex biological matrices |
Methodologies for Correction and Compensation
Several advanced methodologies have been developed to correct for non-linearities, ranging from mathematical post-processing to novel instrumental techniques.
Mathematical and Computational Approaches
Adaptive Absorption Spectroscopy (A-AS): This innovative method employs a moving window technique to dynamically select the optimal wavelength region for analysis across a characteristic absorption band [56]. For different concentration ranges, different wavebands may provide the most linear response. The A-AS algorithm traverses the absorption band, calculates estimated coefficients for each sub-region, and selects the optimal coefficient (( k_{best} )) based on predefined constraints for linearity and residual error. This approach has been shown to effectively suppress non-linear effects and expand the dynamic range of concentration measurements, as demonstrated in SO2 detection experiments [56].
Non-Linear Regression and Local Modeling: When global linear models fail, non-linear regression methods can be employed to build the calibration model. Techniques such as artificial neural networks (ANNs), support vector machines (SVMs), and locally weighted regression can model complex, non-linear relationships between spectral data and concentration [57]. Local methods, in particular, work by developing a specific calibration model for each unknown sample based only on the most similar samples from a large spectral library, thereby effectively handling local non-linearities [57].
Singular Value Decomposition (SVD) for Detector Correction: In cases of complex, signal-dependent non-linearities from area detectors (such as pixel crosstalk), a robust correction can be achieved by isolating the systematic behavior. The non-linear response is parametrized relative to a calibration dataset of known intensities, and a correction function is derived, often using a polynomial approximation, to linearize the signal [59].
Physical and Experimental Corrections
Baseline Correction for Scattering Artifacts: A curve-fitting baseline subtraction approach based on fundamental Rayleigh and Mie scattering equations can effectively correct for artifacts caused by particulates and aggregates [60]. This method involves fitting a scattering baseline to regions of the spectrum where the analyte does not absorb and subtracting this contribution from the total signal. The optimal baseline correction wavelength (e.g., 340 nm for UV, 750 nm for Vis-NIR) should be empirically determined to ensure no analyte or buffer absorption occurs at that wavelength [60] [61].
Background Correction with a Continuum Source: A common method to correct for broad background absorption and scattering in atomic spectroscopy involves using a deuterium (D2) lamp as a continuum source [58]. The absorbance measured from the D2 lamp reflects only the broad background (as its narrow emission lines are not absorbed by the analyte), while the absorbance from the primary line source (e.g., a hollow cathode lamp) includes both analyte and background. Subtracting the former from the latter yields a background-corrected absorbance [58].
Table 2: Comparison of Non-Linearity Correction Methodologies
| Methodology | Underlying Principle | Primary Advantage | Key Limitation |
|---|---|---|---|
| Adaptive Absorption (A-AS) | Dynamic wavelength band selection | Expands measurement range; improves accuracy | Requires a characteristic absorption band |
| Non-Linear Regression (ANN, SVM) | Machine learning for model fitting | Can model highly complex non-linearities | Requires large, representative training datasets |
| Local Calibration | Neighbor-based local modeling | Handles local non-linearities without global model | Dependent on the density of the spectral library |
| Baseline/Rayleigh-Mie Fit | Physical model of scattering | Corrects a specific, common physical artifact | Requires knowledge of scattering properties |
| Continuum Source Correction | Spectral discrimination of background | Effective for broad spectral interferences | Assumes background is constant over wavelength range |
Experimental Protocols for Validation
Protocol for Validating Linearity and Applying A-AS
This protocol outlines the steps to assess the linear dynamic range of an assay and apply the Adaptive Absorption Spectroscopy method to correct for non-linearities.
Diagram 1: A-AS Correction Workflow
Materials:
- High-precision spectrophotometer (e.g., DeNovix DS-11 Series or equivalent)
- Certified cuvette with known path length (e.g., 1 cm)
- Analytical balance
- Stock solution of the analyte of known concentration
- Appropriate solvent for serial dilution
Procedure:
- Preparation of Standard Series: Prepare a series of standard solutions covering a wide concentration range, from well below the expected linear range to significantly above it. For example, for a protein assay, this might range from 0.1 mg/mL to 100 mg/mL.
- Spectrum Acquisition: Measure the full UV-Vis absorption spectrum (e.g., 220-350 nm for proteins) for each standard solution, the blank (pure solvent), and a reagent blank if applicable. Record the intensity values (( I )) and the incident intensity (( I_0 )) from the blank [7] [8].
- Absorbance Calculation: Compute the absorbance ( A = \log{10} \left( \frac{I0}{I} \right) ) for each wavelength and standard [7].
- Linearity Assessment: Plot the absorbance at the wavelength of maximum absorption (( \lambda_{max} )) against the known concentration. Perform a linear regression and assess the goodness-of-fit (R²). A significant drop in R² or a systematic pattern in the residuals indicates the onset of non-linearity.
- Application of A-AS Correction: a. Define the characteristic absorption band of the analyte (e.g., 210-230 nm for SO₂) [56]. b. Using a script or software, slide a moving window of adjustable width across this band. c. For each window position, use a multi-wavelength least squares fit to calculate an estimated coefficient (( k )) and invert the concentration. d. Apply constraints (e.g., minimal residual error, maximal R²) to screen all calculated coefficients and select the optimal one (( k{best} )) [56]. e. Use ( k{best} ) to calculate the corrected concentration for samples with unknown concentration.
- Validation: Validate the corrected concentrations using a reference method (e.g., LC-MS, gravimetric analysis) to confirm improved accuracy.
Protocol for Scattering Correction using Rayleigh-Mie Fit
This protocol is essential for correcting measurements in samples containing particulates, such as protein aggregates or nanoparticle formulations.
Materials:
- Spectrophotometer with scanning capability
- Centrifuge and filtration equipment (optional, for comparison)
- Sample containing the analyte and potential scatterers (e.g., protein solution with aggregates)
Procedure:
- Sample Preparation: If possible, prepare a sample aliquot that is clarified by centrifugation or filtration to serve as a scattering-minimized control.
- Spectral Acquisition: Measure the absorption spectrum of both the test sample and the clarified control over a sufficiently broad range.
- Identify Non-Absorbing Regions: Identify spectral regions where the analyte of interest has negligible absorption. These regions will be used to fit the scattering baseline.
- Model Fitting: Fit the scattering contribution in the test sample's spectrum using a power-law function derived from Rayleigh (( \lambda^{-4} )) and Mie (( \lambda^{-n} ), where n is variable) scattering theory to the absorbance in the non-absorbing regions [60].
- Baseline Subtraction: Subtract the fitted scattering baseline from the entire measured spectrum of the test sample.
- Concentration Determination: Use the corrected absorbance at the analytical wavelength (e.g., 280 nm for proteins) to calculate concentration via Beer's Law. The result should more closely match the concentration derived from the clarified control.
The Scientist's Toolkit: Essential Reagents and Materials
Table 3: Key Research Reagent Solutions for Non-Linearity Studies
| Item | Function/Description | Application Note |
|---|---|---|
| High-Purity Solvents | To prepare standard solutions and blanks; minimizes interfering background absorption. | Essential for establishing a reliable I₀ measurement [7]. |
| Certified Reference Materials | Provides analyte of known concentration and purity for calibration. | Critical for generating a truthful standard curve [62]. |
| Stable Dye Solutions | Model compounds for studying non-linearities (e.g., Rhodamine B). | Exhibit predictable aggregation and concentration effects [8]. |
| Attenuator Blades | Precisely controls the intensity of light incident on the sample. | Used for calibrating detector non-linearity [59]. |
| Cuvettes of Varying Path Lengths | Allows for investigation of path length dependence in Beer's Law. | Short path lengths (e.g., 1 mm) are useful for high-concentration samples. |
| Baseline Correction Solutions | Solutions with known scattering properties (e.g., polystyrene nanospheres). | Used to validate scattering correction algorithms [60]. |
The Beer-Lambert law remains a powerful tool for quantitative spectroscopy, but its uncritical application at high concentrations is a recipe for inaccuracy. Non-linearities arising from physicochemical interactions, instrumental limitations, and matrix effects are common and must be proactively addressed. As detailed in this guide, researchers now have a robust toolkit for combating these deviations, ranging from physical corrections for scattering based on Rayleigh-Mie theory to sophisticated computational approaches like Adaptive Absorption Spectroscopy and non-linear regression. By systematically validating linearity, understanding the source of deviations, and applying the appropriate correction methodology, scientists and drug development professionals can ensure the accuracy and reliability of their quantitative analyses, even in challenging high-concentration regimes.
The Beer-Lambert Law (A = εcl) is a foundational principle in quantitative spectroscopy, establishing a linear relationship between the absorbance (A) of a solution and the concentration (c) of the absorbing species [8] [63]. However, this linearity holds true only under specific conditions, and deviations frequently occur in practice. Chemical deviations represent a significant class of non-linearity arising from the intrinsic properties of the analyte or its interactions with the chemical environment [64] [3]. These deviations are not due to instrument error or measurement technique, but rather from shifts in chemical equilibria, changes in pH, and alterations in solute-solvent interactions [65]. When the chemical environment changes the nature of the absorbing species itself, the fundamental assumption of a constant molar absorptivity (ε) is violated, leading to a breakdown in the absorbance-concentration linearity essential for accurate quantitation [3]. This guide examines the core mechanisms of chemical deviations, providing researchers with the theoretical framework and experimental protocols to identify, mitigate, and correct for these phenomena to ensure data integrity in spectroscopic analysis.
Core Mechanisms of Chemical Deviations
Chemical deviations occur when the chemical identity or molecular environment of the chromophore—the light-absorbing species—is altered. The molar absorptivity (ε) is a characteristic of a specific molecular structure at a given wavelength; any chemical process modifying this structure will change ε and cause a deviation from Beer's Law [65]. The primary mechanisms are shifts in chemical equilibria, changes in pH, and solvent effects.
Shifts in Chemical Equilibria
Many analytes exist in solution as an equilibrium between two or more forms, which often have distinct absorption spectra. A classic example is the equilibrium between chromate (CrO₄²⁻) and dichromate (Cr₂O₇²⁻) ions [65]:
Cr₂O₇²⁻ + H₂O ⇌ 2H⁺ + 2CrO₄²⁻
In this system, the yellow chromate and orange dichromate ions have different absorption profiles. As the concentration of the total chromium species increases, the equilibrium shifts, changing the relative proportions of the two colored species. Because each species has a different molar absorptivity, the overall absorbance is no longer directly proportional to the total analyte concentration [64] [65]. This represents a fundamental chemical deviation where the effective ε for the total solute changes with concentration. Similar effects are ubiquitous in systems involving complexation, dimerization, or polymerization.
pH and Acid-Base Equilibria
pH-induced deviations are a prevalent form of chemical deviation, particularly for analytes that are weak acids or bases. The protonated and deprotonated forms of these molecules frequently exhibit dramatically different absorption spectra. The position of the acid-base equilibrium, and thus the ratio of the two forms, is governed by the solution pH and the analyte's pKa [3] [65].
A canonical example is that of pH indicators such as methyl orange or phenolphthalein [64]. The color of these compounds changes over a specific pH range because the conjugate acid and base forms are different colors. When performing a spectroscopic analysis of such a compound, if the pH is not carefully controlled and buffered, a change in concentration might inadvertently shift the local pH, thereby altering the equilibrium population of the two forms. This results in a non-linear absorbance-concentration relationship, as the effective chromophore's concentration does not scale linearly with the total analytical concentration.
Table 1: Characteristics of pH-Dependent Acid-Base Indicators
| Indicator | Acid Form Color | Base Form Color | pH Range | pKa |
|---|---|---|---|---|
| Methyl Orange | Red | Yellow | 3.1 - 4.4 | ~3.4 |
| Bromocresol Green | Yellow | Blue | 3.8 - 5.4 | ~4.7 |
| Bromothymol Blue | Yellow | Blue | 6.0 - 7.6 | ~7.1 |
| Phenolphthalein | Colorless | Pink/Fuchsia | 8.3 - 10.0 | ~9.6 |
Solvent and Refractive Index Effects
The solvent matrix is not an inert bystander but actively influences the spectroscopic properties of the solute. Solvent effects can manifest through several mechanisms [3]:
- Polarity and Hydrogen Bonding: The energy of electronic transitions is sensitive to the polarity of the solvent. A change in solvent can shift the absorption maximum (λmax) and alter the value of ε. Hydrogen bonding between the solute and solvent can similarly stabilize either the ground or excited state, leading to spectral shifts.
- Refractive Index: At high analyte concentrations (>0.01 M), the refractive index of the solution can change significantly with concentration [3] [65]. This effect alters the light path and the effective polarizability of the medium, leading to a positive deviation from the Beer-Lambert law. The classical law assumes a constant refractive index, an assumption that breaks down at high concentrations where solute-solute interactions become non-negligible [3].
- Chemical Inertness: The solvent must not react chemically with the analyte. If a reaction occurs, it could create a new, non-absorbing species or alter the chromophore, leading to a decrease or unpredictable change in absorbance [65].
Experimental Protocols for Identification and Mitigation
A systematic experimental approach is required to diagnose chemical deviations and implement robust analytical methods.
Protocol for Investigating pH-Induced Deviations
This protocol is designed to characterize the impact of pH on an analyte's absorption and identify optimal conditions for analysis.
Materials:
- UV-Vis spectrophotometer with matched cuvettes
- Analyte stock solution
- Buffer solutions covering a wide pH range (e.g., pH 2, 4, 7, 9, 11)
- Dilution solvent (e.g., deionized water, HPLC-grade methanol)
- Volumetric flasks and precision pipettes
Procedure:
- Prepare Buffered Analyte Solutions: Dilute the analyte stock solution to a fixed, moderate concentration (e.g., 10⁻⁴ M) using each of the different pH buffers. Ensure the ionic strength is similar where possible.
- Record Absorption Spectra: Scan the absorption spectrum of each buffered solution from a wavelength below to above the expected λmax.
- Analyze Spectral Shifts: Identify the wavelength of maximum absorption (λmax) and the absorbance value at λmax for each pH condition.
- Plot Absorbance vs. pH: At the identified λmax, plot the absorbance as a function of pH. This will reveal the pH range over which the absorbance is stable.
- Select Analytical pH: Choose a pH for quantitative work that lies within a stable plateau of the absorbance-pH plot, ensuring minimal sensitivity to small, uncontrolled pH variations.
Protocol for Verifying Beer-Lambert Law Linearity
Once optimal pH and solvent conditions are identified, this protocol validates the linear dynamic range of the assay.
Procedure:
- Prepare Standard Solutions: From a certified stock solution, prepare a series of at least 5 standard solutions across the expected concentration range (e.g., from 10⁻⁶ M to 10⁻⁴ M) using the selected buffered solvent.
- Measure Absorbance: Measure the absorbance of each standard at the predetermined λmax.
- Construct a Calibration Curve: Plot the measured absorbance (A) versus the concentration (c) of the standards.
- Perform Linear Regression: Fit a linear model (A = εcl + b) to the data and calculate the regression coefficient (R²). A value of R² > 0.995 typically indicates acceptable linearity.
- Define the Linear Range: The upper limit of linearity is the concentration at which the curve shows a consistent negative or positive deviation from the fitted line. Samples should be diluted to fall within this verified linear range.
Table 2: Essential Research Reagent Solutions for Mitigating Chemical Deviations
| Reagent / Material | Function & Rationale |
|---|---|
| High-Purity Buffers | Maintains a constant pH to stabilize acid-base equilibria and prevent spectral shifts of the analyte [65]. |
| Spectroscopic-Grade Solvents | Minimizes unwanted solvent-solute interactions and UV absorption background; ensures chemical inertness. |
| Certified Reference Standards | Provides a known concentration and purity for accurate calibration curve generation [8]. |
| Matched Quartz Cuvettes | Ensures consistent path length (l) across all measurements, a critical parameter in Beer's Law [64]. |
| Holmium Oxide Filter | Validates the wavelength accuracy of the spectrophotometer, ruling out instrumental deviations [3]. |
Advanced Topics and Recent Research
The pursuit of overcoming the limitations of the Beer-Lambert law remains an active area of research. Recent studies have focused on developing unified models based on electromagnetic theory to address fundamental deviations, particularly at high concentrations.
A 2025 study proposed an extension of the law by incorporating the complex refractive index and its dependence on concentration [3]. The model introduces higher-order concentration terms to account for changes in polarizability and electric displacement at high concentrations, where solute-solute interactions become significant. The modified equation takes the form:
A = [4πν / ln10] (βc + γc² + δc³) d
where β, γ, and δ are refractive index coefficients derived from electromagnetic theory [3]. This model was validated using solutions of potassium permanganate, potassium dichromate, and methyl orange, achieving a root mean square error (RMSE) of less than 0.06 for all tested materials, demonstrating remarkable performance beyond the classical Beer-Lambert law [3].
Furthermore, research into instrumental factors shows that the additivity of polychromatic light intensity is a key theoretical basis for linear deviation [66]. Studies on sulfur dioxide absorption have confirmed that linear deviation increases with total column concentration and is also influenced by the spectral resolution of the instrument [66]. This underscores that in practice, observed deviations often result from a combination of chemical and instrumental factors.
Chemical deviations from the Beer-Lambert law, driven by equilibrium dynamics, pH, and solvent effects, present significant challenges in quantitative spectroscopic research and development. Addressing these deviations is not merely an academic exercise but a practical necessity for ensuring the accuracy and reliability of concentration measurements in fields from drug development to environmental monitoring. The strategies outlined—systematic investigation of pH dependence, rigorous verification of linearity, careful control of the solvent environment, and the application of buffered systems—constitute a foundational toolkit for the practicing scientist. Furthermore, emerging models based on electromagnetic theory offer promising pathways for extending the usable concentration range of absorption spectroscopy. By rigorously understanding and controlling for these chemical factors, researchers and drug development professionals can transform the Beer-Lambert law from a simple ideal into a robust and powerful tool for quantitative analysis.
The Beer-Lambert Law (BLL) is a foundational principle in quantitative spectroscopy, establishing a linear relationship between the absorbance of a solution and the concentration of the absorbing species [3] [7]. Expressed as (A = \epsilon c l ), where (A) is absorbance, (\epsilon) is the molar absorptivity, (c) is concentration, and (l) is the path length, it is indispensable for chemical analysis across diverse scientific and industrial fields [3] [67]. However, the law's elegant simplicity relies on ideal assumptions, including the use of monochromatic light and the absence of extraneous radiation. In practice, instrumental imperfections, chiefly stray light and finite spectral bandwidth, violate these assumptions and introduce significant deviations, undermining the accuracy of quantitative measurements [68] [4] [11]. This guide details the origins and effects of these instrumental errors and provides researchers with robust methodologies for their identification and mitigation, thereby ensuring the reliability of spectroscopic data within the critical context of quantitative research and drug development.
Stray Light: Origins, Impact, and Quantification
Stray light is defined as any light reaching the detector that lies outside the wavelength band selected by the monochromator [68]. It arises from light scatter, diffraction by optical components, imperfections within the instrument, or even from the sample itself [68].
The Fundamental Impact on Absorbance
The presence of stray light causes a negative deviation from the Beer-Lambert law, particularly severe at high absorbances. This occurs because stray light ((I{ST})), a non-absorbable component, adds to the desired signal. The measured transmittance ((Tm)) and absorbance ((Am)) thus become: [ Tm = \frac{I + I{ST}}{I0 + I{ST}} \quad \text{and} \quad Am = \log{10}\left(\frac{1}{Tm}\right) ] As the true absorbance increases (i.e., (I) approaches zero), (Tm) is dominated by (I{ST}/I_0), causing the measured absorbance to plateau and leading to a loss of linearity [68]. This effect is critical in the UV region where source energy throughput is often lower, making stray light a larger relative component of the total signal [68].
Experimental Protocol for Stray Light Monitoring
Standardized procedures using cut-off filters are employed to quantify stray light.
ASTM Procedure: This method measures stray light transmittance at specific wavelengths using sealed cuvettes filled with solutions that have a sharp cut-off [68].
- 10 g/L Sodium Iodide: Used for monitoring at 220 nm. This solution transmits light at higher wavelengths but absorbs all light below its cut-off; any signal detected at 220 nm is, therefore, stray light.
- 50 g/L Sodium Nitrite: Used for monitoring at 340 nm and 370 nm via the same principle.
Pharmacopoeial Procedure: The European Pharmacopoeia recommends using a 12 g/L potassium chloride solution and measuring its absorbance at 198 nm. The absorbance reading should be greater than 2 AU to confirm minimal stray light interference [68].
The diagram below illustrates the logical workflow for identifying and troubleshooting stray light in a spectrophotometer.
Finite Spectral Bandwidth: A Polychromatic Deviation
The Beer-Lambert law assumes strictly monochromatic light. In reality, all spectrophotometers use a beam of nonzero spectral width (bandpass or bandwidth, ( \Gamma )) [11] [69]. When the spectral bandwidth of the instrument is a significant fraction of the natural width of the analyte's absorption band, deviations from linearity occur.
Mechanism of the Deviation
This error arises because the extinction coefficient (( \epsilon )) is not constant across the wavelength range of the polychromatic beam [11]. The effective absorbance measured is an average over the source's bandwidth. If the extinction coefficient has a significant slope ((d\epsilon/d\omega \neq 0)) across this bandwidth, the measured absorbance will be less than the true absorbance at the central wavelength, leading to a negative deviation from linearity, especially at high concentrations [11] [69]. The error has been shown to be a function of ( \Delta\epsilon/\Gamma ) (the change in extinction coefficient over the bandwidth) and the difference between the sample and standard concentrations [11].
Quantitative Modeling of Bandwidth Error
The systematic error due to polychromatic radiation can be modeled. For a Gaussian slit function with a full width at half maximum (FWHM) of ( \Gamma ), the percent recovery of the analyte is decreased, with the error magnitude increasing with the term ( |c{SAMPLE} - c{STANDARD}| ) and the ratio ( \Delta\epsilon/\Gamma ) [11]. Studies have shown that to keep errors in the calculated extinction coefficient below 1%, the laser's spectral bandwidth should be less than 10% of the full width at half maximum (FWHM) of the sample's absorption band [69]. The error becomes most critical for low-concentration species and when the source bandwidth is comparable to the absorption bandwidth of the target species [69].
A Unified Experimental Toolkit for Error Mitigation
Successful quantitative spectroscopy requires a systematic approach to manage instrumental errors. The following table summarizes key research reagents and materials essential for this purpose.
Table 1: Research Reagent Solutions for Instrumental Error Monitoring
| Item | Function/Application | Experimental Context |
|---|---|---|
| Holmium Glass Filter | Wavelength accuracy verification [3] | Confirm spectrophotometer calibration at known peaks (e.g., 361, 445, 460 nm) before experiments. |
| Potassium Chloride (KCl) | Stray light quantification [68] | Prepare 12 g/L solution for Pharmacopoeial test; absorbance at 198 nm should be >2 AU. |
| Sodium Iodide (NaI) | Stray light quantification [68] | Prepare 10 g/L solution for ASTM test at 220 nm. |
| Sodium Nitrite (NaNO₂) | Stray light quantification [68] | Prepare 50 g/L solution for ASTM test at 340 nm and 370 nm. |
| Cut-off Filters (Liquid/Solid) | Stray light monitoring [68] | Sealed cuvettes or solid filters that absorb all light below a specific wavelength, transmitting higher wavelengths. |
The following workflow integrates protocols for mitigating both stray light and bandwidth errors to ensure data integrity.
Advanced mitigation strategies involve more sophisticated physical models. For fundamental deviations at high concentrations, an electromagnetic framework extending the BBL has been proposed, incorporating the complex refractive index and polarizability to account for changes in the refractive index and intermolecular interactions [3]. This model, which includes terms for concentration ((c, c^2, c^3)), has demonstrated superior performance with a root mean square error (RMSE) of less than 0.06 for various solutions like potassium permanganate and methyl orange [3]. For diffuse and scattering media like biological tissues, a Modified Beer-Lambert Law (MBLL) is used, which incorporates a differential pathlength factor (DPF) to account for the increased pathlength of scattered photons: ( OD = DPF \cdot \mua \cdot d{io} + G ) [70].
The uncritical application of the Beer-Lambert law is a significant source of error in quantitative spectroscopic research. Stray light and finite spectral bandwidth are two pervasive instrumental limitations that systematically compromise data, particularly at the high absorbances and precise quantitation levels required in drug development. By understanding the physical origins of these deviations and implementing the detailed experimental protocols and mitigation strategies outlined herein—ranging from routine checks with standard solutions to the application of advanced electromagnetic models—researchers can significantly enhance the accuracy and reliability of their analytical results, solidifying the foundation of their scientific conclusions.
The Beer-Lambert Law (BLL), also referred to as the Beer-Lambert-Bouguer law or simply Beer's law, represents a cornerstone principle in optical spectroscopy. Formally, it states that the absorbance (A) of a light beam passing through a medium is directly proportional to the pathlength (d) and the concentration (c) of the absorbing species: A = ε·d·c, where ε is the molar absorption coefficient [70] [1]. This simple linear relationship makes the BLL an attractive tool for quantitative analysis, allowing researchers to determine unknown concentrations from measured absorbance values. Its historical development spans centuries, beginning with Bouguer's observations in 1729 on atmospheric light attenuation, mathematically formalized by Lambert in 1760, and extended by Beer in 1852 to incorporate concentration dependence of solutions [70] [4] [1].
Despite its widespread application, the BLL rests upon several idealized assumptions that are routinely violated in biological environments. The law assumes that the incident radiation is monochromatic and collimated, the absorbing species act independently at the molecular level, the medium is homogeneous and does not scatter radiation, and no secondary optical phenomena like fluorescence or dichroism occur [70]. In the complex, heterogeneous environment of living tissues, these conditions are almost never met. Biological tissues are intrinsically turbid media, characterized by extensive light scattering that fundamentally alters the simple absorption-dominated relationship described by the classic law [70] [71]. This scattering challenge necessitates significant modifications to the BLL for accurate quantitative spectroscopy in biomedical research, drug development, and clinical diagnostics.
Core Mechanisms: How Tissue Scattering Disrupts the Beer-Lambert Law
The Fundamental Problem of Light Scattering in Tissues
In biological tissues, light propagation is dominated not merely by absorption but by a complex interplay of absorption and scattering. The reduced scattering coefficient (μs') becomes a critical parameter, often surpassing absorption in its influence on light transport [71]. Unlike the ideal solutions for which the BLL was derived, where photons travel in straight lines, tissues contain numerous subcellular and cellular structures that repeatedly deflect photons from their original paths. These scattering centers include organelles such as mitochondria and nuclei, with sizes and refractive indices that create a distribution of scatterer sizes equivalent to spheres with diameters ranging from approximately 0.4 to 2.0 μm [72].
This pervasive scattering has two profound effects on optical measurements. First, it increases the effective pathlength that photons travel through the medium. A photon that undergoes multiple scattering events before reaching the detector will have traversed a much longer distance than the physical thickness of the sample, leading to an overestimation of absorption and consequently, the calculated concentration of chromophores [70]. Second, scattering causes photon loss from the detection system, as not all scattered photons will be collected, especially in configurations with limited numerical aperture. This loss manifests as additional, non-absorbance-related attenuation that the classical BLL misattributes solely to absorption [70] [71]. The combination of these effects means that applying the standard BLL to tissues without correction yields quantitatively inaccurate and often misleading results.
Key Scattering Structures in Biological Tissues
The table below summarizes the primary cellular and subcellular structures responsible for light scattering in biological tissues, along with their respective roles in disrupting the Beer-Lambert Law.
Table 1: Key Light-Scattering Structures in Biological Tissues
| Scattering Structure | Size Range | Primary Scattering Contribution | Impact on BLL Assumptions |
|---|---|---|---|
| Mitochondria | ~0.4 - 1.0 μm | Large-angle scattering [72] | Increases effective pathlength, violates non-scattering medium assumption |
| Other similarly-sized organelles (e.g., lysosomes, peroxisomes) | ~0.5 - 1.0 μm | Large-angle scattering [72] | Contributes to turbidity, causes photon loss from detection |
| Cell Nuclei | ~5 - 10 μm (diameter) | Small-angle scattering [72] | Dominates near-forward scattering, alters photon path distribution |
| Plasma Membranes | ~5 - 10 nm (thickness) | Interface scattering due to refractive index mismatch [71] | Creates multiple scattering events, violates homogeneity assumption |
| Red Blood Cells | ~6 - 8 μm (diameter) | Significant absorption & scattering; shielding effect in large vessels [70] | Combines absorption with strong scattering, requires specialized models |
Modified Beer-Lambert Law: Theoretical Frameworks for Turbid Media
The Modified Beer-Lambert Law (MBLL)
To address the scattering challenge, the Modified Beer-Lambert Law (MBLL) has been developed specifically for tissue spectroscopy. The MBLL introduces additional parameters to account for the effects of scattering on photon migration. A common form of the MBLL for diffuse reflectance measurements is expressed as:
OD = -log(I/I₀) = DPF · μₐ · d + G [70]
Where:
- OD is the optical density (replacing absorbance, accounting for both absorption and scattering)
- I₀ and I are the incident and detected light intensities, respectively
- DPF is the Differential Pathlength Factor, which accounts for the increased pathlength due to scattering
- μₐ is the absorption coefficient of the medium
- d is the physical separation (inter-optode distance) between light source and detector
- G is a geometry-dependent factor accounting for light loss due to scattering [70]
The Differential Pathlength Factor (DPF) is a critical correction parameter, representing the multiplier effect of scattering on the actual distance photons travel compared to the direct source-detector separation. For biological tissues, DPF values typically range from 3 for muscle to 6 for the adult head [70]. This indicates that photons travel 3 to 6 times farther than the physical thickness of the tissue sample, dramatically affecting quantification.
Advanced Theoretical Models for Specific Tissue Conditions
Beyond the general MBLL framework, more specialized models have been developed for particular tissue types and measurement conditions. For blood, which presents unique challenges as both a strong absorber and scatterer, Twersky developed a formulation that explicitly incorporates scattering from red blood cells:
OD = log(I₀/I) = εcd - log(10^(-sH(1-H)d + qαq(1-10^(-sH(1-H)d))) [70]
Where 's' is a factor depending on wavelength, particle size, and orientation, 'H' is hematocrit, and 'q' is a factor depending on light detection efficiency [70]. This model helps address the non-linear relationship between absorption and concentration that emerges in scattering-dominated regimes, where at low extinction coefficients (ε), scattering dominates and OD exhibits parabolic concentration dependency rather than the linear relationship predicted by the classic BLL [70].
Another significant consideration in blood-containing tissues is the shielding effect in larger blood vessels, where effective light absorption is reduced because light penetrates less effectively into the inner regions of these vessels, resulting in higher than expected reflection [70]. This effect is less pronounced in tissues with smaller blood vessels, further illustrating how tissue microstructure directly impacts optical quantification.
Experimental Protocols for Quantitative Spectroscopy in Tissues
Diffuse Reflectance Spectroscopy (DRS) for Tissue Characterization
Diffuse Reflectance Spectroscopy (DRS) has emerged as a primary method for quantifying chromophore concentrations in turbid biological tissues. The experimental protocol typically involves the following steps:
Instrument Setup: A broadband light source (e.g., tungsten-halogen or xenon arc lamp) is coupled into a multimode illumination fiber. The distal end of this fiber is placed in contact with the tissue sample. One or more collection fibers, positioned at a fixed distance (typically 1-5 mm) from the illumination fiber, collect diffusely reflected light and guide it to a spectrometer [71].
Spectral Acquisition: The collected light is dispersed using a diffraction grating and detected with a multichannel detector (e.g., CCD array). Measurements are typically referenced against a reflectance standard with known optical properties to calibrate the system.
Data Analysis: The acquired spectrum is processed using an appropriate model to extract optical properties and chromophore concentrations. Common approaches include:
- Inverse Monte Carlo Modeling: A library of Monte Carlo simulations is generated for various combinations of absorption (μₐ) and reduced scattering (μs') coefficients. The measured spectrum is compared against this library to find the best-fitting parameters [71] [73].
- Analytical Model Fitting: The spectrum is fitted to analytical solutions of the radiative transport equation (e.g., diffusion approximation) to extract μₐ and μs' [71]. The absorption coefficient is then decomposed into contributions from individual chromophores: μₐ(λ) = Σ εᵢ(λ)cᵢ, where εᵢ(λ) and cᵢ are the extinction spectrum and concentration of the i-th chromophore, respectively.
Validation: Results are validated using phantoms with known optical properties before application to biological tissues [73].
Polarization-Gated Light Scattering Spectroscopy (LSS)
For specifically probing superficial tissue layers with minimal contribution from deeper, multiply-scattered light, Polarization-Gated Light Scattering Spectroscopy (LSS) provides an effective protocol:
Polarization Control: Linearly polarized light from a broadband source is directed onto the tissue surface. Scattered light is collected through an analyzer that can be switched between parallel (I∥) and perpendicular (I⟂) orientations relative to the incident polarization [71].
Spectral Subtraction: The depolarized component (I⟂) is subtracted from the coplanar component (I∥) to yield ΔI = I∥ - I⟂. This polarization subtraction preferentially selects photons that have undergone minimal scattering events (primarily single scattering from epithelial cell nuclei), effectively isolating them from the diffusely scattered background [71].
Mie Theory Analysis: The resulting spectrum (ΔI) is fitted to Mie theory calculations to extract morphological parameters such as nuclear size distribution, population density, and refractive index relative to the cytoplasm [71]. These parameters serve as biomarkers for conditions like dysplasia, where nuclear enlargement and crowding occur.
Clinical Application: This technique has demonstrated high diagnostic sensitivity (92-96%) and specificity (96-97%) for detecting dysplasia in Barrett's esophagus and has been applied to pancreatic cystic lesion characterization during endoscopic procedures [71].
Figure 1: Polarization-Gated LSS Workflow
Quantitative Spectroscopic Techniques Beyond Traditional Absorption
Stimulated Raman Scattering (SRS) Microscopy for Quantitative Chemical Imaging
Stimulated Raman Scattering (SRS) microscopy has emerged as a powerful label-free technique for quantitative chemical imaging in biological samples. Unlike traditional Raman scattering, SRS provides a signal that is directly proportional to molecular concentration, making it particularly valuable for quantitative analysis [74]. The fundamental relationship governing SRS signal is:
SSRS ∝ C × Vfocal × σmolecule × Ipump × I_Stokes [74]
Where C is the concentration of the target molecule, Vfocal is the focal volume, σmolecule is the differential Raman cross-section, and Ipump and IStokes are the intensities of the pump and Stokes beams, respectively [74].
For quantitative concentration measurements, the protocol typically involves:
- System Calibration: Creating a calibration curve of SRS intensity versus concentration for standard solutions of known concentration, measured under identical imaging conditions.
- Unknown Sample Measurement: Imaging the biological sample under the same experimental conditions used for calibration.
- Concentration Calculation: Determining unknown concentration using: Cunknown = (Sunknown/S₀) × C₀, where S_unknown is the signal from the unknown sample, and S₀ and C₀ are the signal and concentration of the calibration standard, respectively [74].
Despite its quantitative advantages, SRS microscopy faces challenges in turbid tissues, particularly light scattering that reduces both excitation intensity reaching the focus and signal collection efficiency. These effects complicate direct quantification unless appropriate internal standards or reference channels are used [74].
Surface-Enhanced Raman Scattering (SERS) for Ultrasensitive Detection
Surface-Enhanced Raman Scattering (SERS) significantly enhances the inherently weak Raman signal by several orders of magnitude, enabling single-molecule detection and highly quantitative analysis in complex biological environments [75]. Two primary methodologies have been developed for absolute quantification with SERS:
Table 2: Quantitative SERS Methodologies for Absolute Quantification
| Method | Principle | Protocol Steps | Advantages |
|---|---|---|---|
| Isotope Dilution SERS (IDSERS) | Uses stable isotopologues (e.g., deuterated analogs) as internal standards [75] | 1. Spike sample with deuterated standard2. Acquire SERS spectrum3. Measure ratio of natural isotope to deuterated peak areas4. Calculate concentration from calibration curve | Compensates for competitive adsorption, laser fluctuations, and extraction variances |
| Standard Addition Method (SAM) | Incremental addition of analyte standard to the sample [75] | 1. Acquire SERS spectrum of unspiked sample2. Spike with known analyte concentrations3. Acquire spectra after each addition4. Plot peak area vs. spike concentration and extrapolate | Accounts for matrix effects, provides high accuracy in complex biofluids |
These quantitative SERS approaches have found application in therapeutic drug monitoring, detection of novel psychoactive substances in biofluids, and more recently, in rapid diagnostic tests for pathogens [75]. The ability to provide absolute quantification (in μM or ng/mL) makes SERS particularly valuable for clinical diagnostics and pharmaceutical development.
The Scientist's Toolkit: Essential Reagents and Materials
Table 3: Essential Research Reagents and Materials for Tissue Spectroscopy
| Item | Function/Application | Specific Examples |
|---|---|---|
| Tissue-Mimicking Phantoms | Validation and calibration of spectroscopic systems [73] | Intralipid (scattering), India Ink (absorption), glass microspheres, ICG, methylene blue |
| Referenced Analytical Models | Solving inverse problems to extract optical properties | Diffusion approximation, Monte Carlo simulations, Inverse Adding-Doubling algorithms [71] |
| Calibration Standards | Quantitative reference for concentration measurements | Rhodamine 6G (SERS), deuterated compounds (IDSERS), analyte-specific calibration curves [74] [75] |
| Specialized Fiber Optic Probes | Delivery and collection of light in contact measurements | Multimode illumination fibers, spatially separated collection fibers, polarization-maintaining fibers [71] |
| Stable Isotope Labels | Internal standards for quantitative SERS | Deuterated (²H) analogs of target analytes for IDSERS [75] |
The Beer-Lambert Law, while foundational in principle, requires significant modification for accurate quantitative spectroscopy in biological tissues. The pervasive effects of light scattering, arising from tissue heterogeneity and subcellular structures, fundamentally alter photon pathlengths and detection probabilities. Through modified theoretical frameworks like the MBLL, and advanced techniques including diffuse reflectance spectroscopy, polarized LSS, and quantitative SRS/SERS, researchers can overcome these challenges to extract reliable quantitative data from turbid biological samples. As optical technologies continue to advance, these approaches will play an increasingly critical role in drug development, clinical diagnostics, and fundamental biological research, enabling precise quantitative analysis in environments where the classic law alone falls short.
Electromagnetic and Interference Effects in Thin Films and Solid Samples
The Beer-Lambert Law (BLL) serves as the foundational principle for quantitative absorption spectroscopy across numerous scientific disciplines, from analytical chemistry to pharmaceutical development. This law establishes a linear relationship between the absorbance (A) of a sample, its concentration (c), and the path length (d) of the light through it, expressed as A = εcd, where ε is the molar absorptivity [20] [30]. However, when applied to thin films and solid samples, this relationship frequently breaks down due to electromagnetic and interference effects that the classical BLL does not account for [4] [2].
The BLL was developed under specific conditions—primarily for dilute solutions in cuvettes—where the sample can be considered optically homogeneous and where interfacial reflections are either negligible or cancel out in the measurement [4] [2]. In thin films and many solid samples, these conditions are not met. The wave nature of light leads to interference between light waves reflected from different interfaces of the film, causing measured absorbance to fluctuate in a way that depends not just on concentration, but on film thickness, refractive indices, and wavelength [76] [77]. For researchers relying on spectroscopy for quantitative analysis, such as in drug development where accurate concentration measurements are critical, understanding and correcting for these effects is paramount. This guide examines the origins of these deviations, provides methodologies for their identification and correction, and outlines experimental protocols for reliable quantitative analysis in the presence of interference effects.
Fundamental Theory: The Conflict Between the BLL and Electromagnetic Theory
The Beer-Lambert Law and Its inherent Assumptions
The Beer-Lambert Law has its origins in the 18th and 19th centuries, combining the work of Pierre Bouguer, Johann Heinrich Lambert, and August Beer [30] [2]. Its derivation begins with a simple, powerful assumption: for monochromatic light traveling through an infinitesimally thin layer of a homogeneous medium, the decrease in light intensity (dI) is proportional to the incident intensity (I), the concentration of the absorber (c), and the thickness of the layer (dx). This leads to the differential equation dI = -αI dx, whose integration yields the familiar exponential decay of light intensity through the medium: I = I₀e^(-αcd), which is equivalently expressed as A = log₁₀(I₀/I) = εcd [2].
This formulation relies on several critical, often unstated, assumptions [4] [2]:
- No Light Scattering: The sample is assumed to be optically homogeneous, with no scattering of the light beam.
- No Reflection Losses: The model originally pertained to light propagating within a medium (e.g., the atmosphere), not through a sample bounded by different materials. Thus, reflections at interfaces are ignored.
- Purely Absorptive Process: Light interaction is treated as an absorptive phenomenon only, neglecting the wave nature of light and the accompanying effects like interference and dispersion.
- Low Concentration of Absorbers: At high concentrations, electrostatic interactions between molecules can alter their absorptive properties, making the molar absorptivity (ε) no longer constant.
The Origin of Interference Effects in Thin Films
When a sample is configured as a thin film on a substrate, the simplified model of the BLL is no longer sufficient. Light must be treated as an electromagnetic wave. Upon incidence, it is partially reflected and partially transmitted at each interface (e.g., air/film and film/substrate) [76] [77].
The key phenomenon is thin-film interference. The light wave reflected from the top surface of the film and the wave that enters the film and is reflected from the bottom surface travel paths of different lengths. When these two reflected waves recombine, they are out of phase by an amount determined by the optical path difference (OPD). The OPD is given by 2n₂d cos(θ₂), where n₂ is the refractive index of the film, d is its physical thickness, and θ₂ is the angle of refraction within the film [77].
- Constructive Interference occurs when the OPD is an integer multiple of the wavelength (mλ), leading to an increase in the measured reflectance and a corresponding, non-BLL decrease in transmittance.
- Destructive Interference occurs when the OPD is a half-integer multiple of the wavelength ( (m - ½)λ ), leading to a decrease in reflectance and an increase in transmittance [76] [77].
Furthermore, a phase shift of 180° (or π radians) is introduced upon reflection when light reflects from a boundary with a medium of higher refractive index [76]. This phase shift must be included to correctly determine whether interference is constructive or destructive. For a soap bubble (air/soap/air), for instance, destructive interference occurs for OPD = mλ, because both reflected rays undergo a 180° phase shift [77].
These interference effects mean that the measured absorbance of a thin film will oscillate as a function of both the film thickness and the wavelength of light, a behavior that is completely outside the predictive capacity of the classical BLL [4].
Quantitative Impact on Spectroscopic Measurements
The following table summarizes how interference effects manifest in different types of samples and their impact on quantitative analysis based on the BLL.
Table 1: Manifestation of Interference Effects in Different Sample Types
| Sample Type | Typical Structure | Primary Interference Effect | Impact on BLL Quantification |
|---|---|---|---|
| Thin Film on IR-Transparent Substrate (e.g., polymer on Si, ZnSe) [4] | Absorbing film on a transparent, reflective substrate | Multiple reflections within the film causing constructive/destructive interference. | Absorbance bands show distorted intensities and shapes; non-linear relationship with concentration or thickness. |
| Thin Film on Metal Substrate [4] | Absorbing film on a highly reflective, opaque substrate | Strong interference between light reflected from the metal and the top of the film. | Reflectance spectra resemble absorption spectra; bands can appear in non-absorbing regions. |
| Free-Standing Liquid Sheet (for VUV spectroscopy) [78] | Ultrathin (20-50 nm) liquid sheet in vacuum | Interference between reflections from the front and back interfaces of the liquid. | Measured extinction contains significant interference component; must be deconvoluted to obtain true absorption coefficient. |
| Anti-Reflection Coating [76] [77] | Thin dielectric layer on glass (n~1.38 on n~1.52) | Designed destructive interference for reflected light at a specific wavelength. | Demonstrates the controlled application of interference to minimize reflection losses, maximizing transmitted light. |
The consequence of these effects is that the measured absorbance (Aₘ) is not the true absorbance (Aₜ) related to concentration by the BLL. Instead, it is a composite signal: Aₘ = Aₜ + Aᵢ, where Aᵢ is an "interference absorbance" that can be positive or negative. Attempting to use Aₘ in the BLL for quantification without correction will lead to significant errors in calculated concentration [78] [2].
Experimental Protocols and Methodologies
Protocol 1: Measuring VUV Absorption in Ultrathin Liquid Sheets
This protocol, adapted from Knurr et al. (2025), details the procedure for measuring true absorption coefficients in the vacuum ultraviolet (VUV) range using free-flowing liquid sheets, where interference effects are prominent [78].
1. Objective: To record the absorption spectrum of liquid water in the 7-13 eV range and extract accurate absorption cross-sections by accounting for thin-film interference.
2. Materials and Reagents:
- Liquid Sample: Ultrapure water, degassed to prevent bubble formation.
- Gas-Squeezed Liquid Jet Nozzle: A microfluidic nozzle system (e.g., from Micronit) capable of generating sheet thicknesses of 20-50 nm.
- Squeezing Gas: High-purity helium.
- VUV Light Source: Synchrotron beamline (e.g., Swiss Light Source) with a monochromator (5-30 eV range).
- Gas Filter: A differentially pumped chamber filled with rare gas (Ne/Ar/Kr mix) to suppress high-harmonic radiation from the grating.
- Detection System: Photon detector suitable for VUV intensities.
- Characterization Microscope: A long-distance microscope (e.g., Navitar) with ~16 μm resolution for monitoring the sheet.
3. Procedure: Step 1: Sheet Generation and Stabilization
- Mount the gas-squeezed liquid jet nozzle in the vacuum chamber.
- Initiate a constant liquid flow rate (e.g., 0.15 mL/min).
- Gradually introduce helium gas flow (120-160 sccm) to form a stable, thin sheet. Monitor for "breathing" (pulsations) and flash freezing, adjusting flows to achieve stability.
Step 2: In-Situ Thickness Characterization via Interference
- Illuminate the liquid sheet with a monochromatic light source (e.g., 520 nm LED).
- Use the long-distance microscope to capture the interference fringe pattern (Newton's rings) on the sheet.
- Fit the fringe pattern to a model for thin-film interference to generate a thickness profile, d(r), where
ris the distance from the nozzle. The thickness is typically modeled as d(r) = K/(r - r₀)ᵐ + c [78].
Step 3: VUV Transmission Measurement
- Align the monochromatic VUV beam to the characterized, stable region of the liquid sheet.
- Scan the photon energy from 7 to 13 eV.
- For each energy, measure the incident intensity (I₀) without the sheet and the transmitted intensity (I) with the sheet.
- Calculate the measured extinction as Aₘ = -log(I/I₀).
Step 4: Data Analysis and Deconvolution
- The measured extinction (Aₘ) contains contributions from both true absorption (Aₜ) and interference (Aᵢ).
- Employ a Fresnel propagation model to simulate the interference effects. This model requires the precisely measured thickness (d), the angle of incidence, and the complex refractive index of the liquid, ñ(E) = n(E) + ik(E), where k is the extinction coefficient.
- Use an iterative Kramers-Kronig-consistent fitting procedure to find the values of n(E) and k(E) such that the output of the Fresnel model matches the experimentally measured Aₘ(E).
- The final, true absorption coefficient μ(E) is derived from the optimized k(E), free from interference artifacts [78].
Protocol 2: Correcting for Interference in Solid Thin Films on Substrates
This protocol outlines a general method for obtaining accurate absorbance spectra from solid thin films on IR-transparent substrates (e.g., CaF₂, ZnSe, Si), where interference fringes are commonly observed [4].
1. Objective: To obtain the pure chemical absorbance spectrum of a polymer thin film, removing the contribution of interference fringes.
2. Materials and Reagents:
- Sample: Polymer film coated uniformly on a double-side polished infrared substrate (e.g., Si).
- Reference: A pristine, identical substrate.
- Instrument: Fourier Transform Infrared (FTIR) Spectrometer.
3. Procedure: Step 1: Spectral Acquisition
- Collect a single-beam background spectrum (SB_R) of the reference substrate.
- Collect a single-beam sample spectrum (SB_S) of the polymer film on the substrate.
- Compute the raw transmittance spectrum: T = SBS / SBR.
Step 2: Initial Assessment and Modeling
- Observe the transmittance spectrum for the presence of interference fringes (sinusoidal oscillations in the baseline).
- Rather than applying cosmetic fringe-removal filters, adopt a wave-optics approach.
- Model the sample as a three-layer system: air / polymer film / substrate.
- The key parameters for the model are the film thickness (d), its complex refractive index ñ(ν) = n(ν) + ik(ν), and the substrate's refractive index.
Step 3: Thickness Determination
- If the thickness is unknown, it can be determined from the fringe period. The relationship between the wavenumber (ν) of consecutive maxima (or minima) is: Δν = 1 / (2 n d) [4]. By measuring Δν and estimating an average n, the thickness
dcan be calculated.
Step 4: Optical Constant Fitting
- Use an iterative algorithm to simultaneously fit the thickness (d) and the optical constants (n(ν) and k(ν)) of the film.
- The algorithm calculates the expected transmittance of the three-layer system using the Fresnel equations for each iteration.
- It minimizes the difference between the calculated transmittance and the measured transmittance (T) across the entire spectrum.
- The real part of the refractive index, n(ν), is linked to the imaginary part, k(ν) (which defines the absorption), via Kramers-Kronig relations to ensure physical meaningfulness.
Step 5: Extraction of Pure Absorbance
- Once the fit is optimized, the pure chemical absorbance spectrum of the film, devoid of interference effects, is given by A(ν) = (4πk(ν)νd) / ln(10). This absorbance can then be used for quantitative analysis according to the BLL, provided the concentration is known and constant [4].
Visualization of Core Concepts and Workflows
Diagram: Interference in a Thin Film and its Impact on Spectroscopy
The following diagram illustrates the physics of thin-film interference and how it leads to deviations from the Beer-Lambert Law.
Diagram: Workflow for Correcting Interference Effects
This workflow diagram outlines the systematic procedure for obtaining true absorbance from samples prone to interference.
The Scientist's Toolkit: Essential Research Reagents and Materials
Successful experimentation in this field requires specific materials to generate and characterize thin films. The following table details key items and their functions.
Table 2: Essential Materials for Thin-Film Spectroscopy Research
| Item Name | Specifications / Examples | Critical Function in Research |
|---|---|---|
| Gas-Squeezed Liquid Jet Nozzle [78] | Microfluidic nozzle system (e.g., Micronit). | Generates stable, free-flowing liquid sheets with tunable thickness in the 20 nm - 1 μm range, enabling transmission measurements of highly absorbing liquids in VUV. |
| IR-Transparent Substrates [4] | CaF₂, ZnSe, Si, BaF₂. | Serve as mechanically stable, optically transparent windows for supporting thin film samples in IR spectroscopy. Each material has a specific transmission range. |
| Precision Cuvettes with Defined Path Length [20] | Quartz (UV-Vis), Glass (Vis), with path lengths from 0.1 mm to 10 cm. | Provide a controlled, reproducible path length for liquid samples, helping to average out interference effects through thickness inhomogeneities when used with appropriate solvents. |
| Optical Flats / Reference Substrates [77] | Fused silica, Si wafers with known thickness and refractive index. | Used as reference materials in spectrophotometers and for characterizing the flatness and thickness of deposited films via Newton's rings or ellipsometry. |
| Anti-Reflection Coated Optics [76] [77] | Lenses, beamsplitters, or detectors with MgF₂ or multilayer coatings. | Demonstrate the controlled application of destructive interference to minimize reflective losses, thereby maximizing light throughput in the instrument. |
| Spectral Calibration Standards | Holmium oxide, Didymium glass filters. | Provide known absorption peaks for verifying the wavelength accuracy of the spectrophotometer, a prerequisite for any quantitative analysis. |
The uncritical application of the Beer-Lambert Law to thin films and solid samples is a significant source of error in quantitative spectroscopy. The law's failure in these contexts is not a flaw in the law itself, but a consequence of its inherent simplifications, which ignore the wave nature of light. As demonstrated, interference effects arising from multiple reflections at film interfaces can drastically alter measured absorbance, leading to inaccurate determinations of concentration and material properties.
For researchers, particularly in fields like drug development where formulations may involve thin films or layered structures, moving beyond the BLL is essential. The methodologies outlined herein—specifically, the use of in-situ thickness characterization and Fresnel-based electromagnetic models—provide a robust framework for accurately interpreting spectroscopic data. By acknowledging and correcting for these electromagnetic effects, scientists can ensure the reliability of their quantitative analyses, turning a potential source of error into a source of rich, physically meaningful information about their samples.
Ensuring Accuracy: Validation, Modifications, and Advanced Techniques
The Beer-Lambert Law stands as the fundamental principle underpinning quantitative optical spectroscopy, forming the scientific basis for potency analysis throughout pharmaceutical development and manufacturing. This foundational law establishes a linear relationship between the absorbance of light by a solution and the concentration of the light-absorbing species within it [8]. In practice, this relationship enables scientists to determine drug concentration—and therefore potency—by measuring how much light a sample absorbs at a specific wavelength [79]. The law's mathematical expression, A = εcl, defines absorbance (A) as the product of the molar absorptivity (ε), concentration (c), and path length (l) [8] [1]. For drug development professionals, this equation provides the theoretical framework for quantifying active pharmaceutical ingredients (APIs) in everything from raw materials to final dosage forms, making it indispensable for ensuring product quality, safety, and efficacy.
The pharmaceutical industry increasingly relies on spectroscopic techniques rooted in the Beer-Lambert Law for potency analysis, particularly through high-performance liquid chromatography with ultraviolet-visible (HPLC-UV/Vis) detection and, more recently, direct infrared spectroscopy methods [79]. These applications demonstrate the law's critical importance in validating that medications contain precisely labeled amounts of active ingredients. This case study explores how the Beer-Lambert Law facilitates robust drug potency validation and formulation error detection, while also examining its practical limitations and advanced applications in modern pharmaceutical analytics.
Theoretical Foundations: Principles of the Beer-Lambert Law
Fundamental Relationships and Mathematical Formalism
The Beer-Lambert Law describes the logarithmic relationship between the transmission of light through a substance and the properties of that substance. For monochromatic light passing through a solution, the transmittance (T) is defined as the ratio of transmitted intensity (I) to incident intensity (I₀) [8]:
[ T = \frac{I}{I_0} ]
Absorbance (A) relates to transmittance through a logarithmic function:
[ A = \log{10}\left(\frac{I0}{I}\right) = -\log_{10}(T) ]
This relationship means that absorbance increases as transmittance decreases. An absorbance of 0 corresponds to 100% transmittance, while an absorbance of 1 indicates 10% transmittance [8]. The complete Beer-Lambert Law combines these optical parameters with material properties:
[ A = \varepsilon c l ]
Where:
- A is the measured absorbance (unitless)
- ε is the molar absorptivity or extinction coefficient (typically in L·mol⁻¹·cm⁻¹)
- c is the concentration of the absorbing species (in mol/L)
- l is the optical path length through the sample (in cm) [8] [1]
This linear relationship between absorbance and concentration forms the basis for quantitative spectroscopic analysis in pharmaceutical applications.
Historical Context and Development
The Beer-Lambert Law emerged from centuries of scientific inquiry into light-matter interactions. Pierre Bouguer initiated this work in 1729 through astronomical observations, noting how light intensity diminished exponentially when passing through Earth's atmosphere [1]. Johann Heinrich Lambert later formalized this exponential relationship in his 1760 work Photometria, establishing the mathematical foundation for how light attenuates when traveling through an absorbing medium [1] [2].
In 1852, August Beer extended these principles to colored solutions, demonstrating that the concentration of dissolved particles affected light absorption in a predictable manner [1] [2]. Beer's critical insight was recognizing that concentration and path length had equivalent effects on absorption—a concept that now bears his name alongside his predecessors. The modern formulation combining all three contributions only emerged in the early 20th century, when Robert Luther and Andreas Nikolopulos presented the logarithmic relationship using decadic logarithms and molar concentration [1].
Figure 1: Fundamental components of Beer-Lambert Law measurement. Path length (l), concentration (c), and molar absorptivity (ε) collectively determine light attenuation through a sample.
Limitations and Practical Considerations
While exceptionally valuable for quantitative analysis, the Beer-Lambert Law operates under specific assumptions that can limit its accuracy in real-world pharmaceutical applications. The law assumes monochromatic light, non-interacting absorbing species, uniform distribution of absorbers, and a non-scattering medium [2]. In practice, deviations from these ideal conditions frequently occur, particularly in complex pharmaceutical formulations.
Fundamental deviations occur at high concentrations where intermolecular interactions become significant, altering the analyte's absorption characteristics and refractive index [3]. Chemical deviations arise from changes in the chemical environment (pH, temperature, equilibrium shifts) that modify the absorption spectrum [3]. Instrumental deviations stem from equipment limitations, including polychromatic light sources, stray radiation, and detector nonlinearities [3]. Recent research has attempted to address these limitations through electromagnetic theory extensions that incorporate effects of polarizability, electric displacement, and refractive index, particularly for high-concentration solutions where traditional Beer-Lambert relationships break down [3].
Table 1: Absorbance and Transmittance Relationships [8]
| Absorbance | % Transmittance | Fraction Transmitted |
|---|---|---|
| 0 | 100% | 1.00 |
| 0.3 | 50% | 0.50 |
| 1.0 | 10% | 0.10 |
| 2.0 | 1% | 0.01 |
| 3.0 | 0.1% | 0.001 |
| 4.0 | 0.01% | 0.0001 |
Experimental Design: Spectroscopic Approaches for Potency Analysis
Sample Preparation Techniques
Proper sample preparation is arguably the most critical factor in obtaining accurate spectroscopic results, with inadequate preparation accounting for approximately 60% of all analytical errors in spectroscopy [80]. The specific preparation methodology varies significantly depending on the spectroscopic technique and sample matrix.
For HPLC-UV/Vis analysis, sample preparation typically involves extracting the active pharmaceutical ingredient from its matrix into a suitable solvent, followed by filtration to remove particulate matter that could interfere with analysis or damage instrumentation [79] [80]. The solvent must be transparent in the analytical region of interest—typically using high-purity water, methanol, or acetonitrile for UV-Vis applications, with cutoff wavelengths below the analyte's absorption band [80].
For direct infrared spectroscopy, samples are often analyzed in their native matrix without extraction, requiring different preparation approaches. Solid samples may require grinding with KBr to create pellets, while liquids need appropriate solvent selection and path length control [80]. The key considerations include achieving uniform particle size for reproducible scattering characteristics, ensuring sample homogeneity for representative analysis, and preventing contamination that could introduce spurious spectral signals [80].
Calibration Curve Development
The practical application of Beer-Lambert Law for potency analysis requires constructing calibration curves that relate absorbance measurements to known analyte concentrations. This process begins with preparing standard solutions of precisely known concentrations, typically using certified reference materials for HPLC applications or matrix reference materials with concentrations determined by chromatography for direct spectroscopic methods [79].
The step-by-step calibration process involves:
- Preparing standard solutions covering the expected concentration range
- Measuring absorbance values at the optimal analytical wavelength
- Plotting absorbance versus concentration to create a calibration curve
- Determining the line of best fit and its equation [79]
The resulting calibration curve follows the form of a straight line: ( A = (\varepsilon l)c + b ), where the slope contains the molar absorptivity (ε) and path length (l) terms, enabling quantitative determination of unknown concentrations through interpolation [79]. Regular verification using quality control samples ensures ongoing calibration validity throughout an analytical run.
Table 2: Research Reagent Solutions for Spectroscopic Potency Analysis
| Reagent/Equipment | Function in Analysis | Application Notes |
|---|---|---|
| Certified Reference Standards | Calibration curve generation | Provide known analyte concentrations for HPLC and spectroscopic methods [79] |
| High-Purity Solvents | Sample dissolution and dilution | Must have appropriate UV cutoff; common choices: water, methanol, acetonitrile [80] |
| KBr (Potassium Bromide) | IR pellet preparation | Creates transparent matrix for FT-IR analysis of solids [80] |
| Holmium Glass Filter | Wavelength accuracy verification | Validates spectrophotometer performance at specific wavelengths (e.g., 361, 445, 460 nm) [3] |
| Membrane Filters (0.45 μm, 0.2 μm) | Particulate removal | Prevents nebulizer clogging in HPLC; reduces light scattering in spectroscopy [80] |
Advanced Applications: Beyond Traditional Beer-Lambert Limitations
Modified Beer-Lambert Law for Complex Matrices
In complex biological and pharmaceutical matrices where scattering effects become significant, the traditional Beer-Lambert Law requires modification to maintain accuracy. The Modified Beer-Lambert Law incorporates additional parameters to account for light scattering in turbid media:
[ A\lambda = (\varepsilon{HHb}(\lambda)C{HHb} + \varepsilon{HbO2}(\lambda)C_{HbO2}) \cdot d \cdot DPF + G ]
Where:
- d represents the physical distance between light source and detector
- DPF (Differential Pathlength Factor) accounts for increased pathlength due to scattering
- G represents light loss due to scattering [28]
This modified approach finds particular utility in near-infrared spectroscopy (NIRS) for biological tissues and opaque pharmaceutical formulations, where scattering dominates over absorption [28]. Similar principles apply to analyzing semi-solid dosage forms (creams, ointments) and suspensions where traditional transmission measurements prove problematic.
Raman Spectroscopy Enhancement
While Raman spectroscopy operates on different principles than absorption spectroscopy, it frequently complements Beer-Lambert-based approaches in pharmaceutical analysis. Recent advances have demonstrated Raman spectroscopy's capability for rapid, non-destructive identification of active ingredients in complex multi-component formulations without extensive sample preparation [81].
Advanced algorithmic processing, including the adaptive iteratively reweighted penalized least squares (airPLS) algorithm and hybrid peak-valley interpolation techniques, enables effective management of fluorescence interference and baseline drift that often complicate Raman analysis of pharmaceutical products [81]. These approaches can detect components like antipyrine, paracetamol, and lidocaine in as little as 4 seconds per test, making them valuable for high-throughput quality control applications [81]. Density functional theory (DFT) modeling further enhances these methods by providing theoretical Raman spectra for comparison with experimental results, validating detection accuracy [81].
Figure 2: Drug potency validation workflow integrating Beer-Lambert Law principles at critical analytical stages.
Regulatory Framework and Validation Requirements
Analytical Procedure Validation
Pharmaceutical potency methods requiring regulatory approval must undergo comprehensive validation following established guidelines such as ICH Q2(R2) [82]. This validation characterizes multiple method attributes to ensure reliability for intended applications. Key validation parameters include:
- System and Sample Suitability: Verification that the analytical system operates correctly for specific samples [83]
- Specificity: Ability to unequivocally assess the analyte despite potential interferences [83] [82]
- Linearity: Demonstration of proportional response to analyte concentration across specified range [83] [82]
- Precision: Degree of agreement among individual test results under prescribed conditions [83]
- Relative Accuracy: Agreement between measured value and accepted reference value [83]
- Range: Interval between upper and lower concentration levels with suitable precision, accuracy, and linearity [83] [82]
- Robustness: Capacity to remain unaffected by small, deliberate variations in method parameters [83]
For biological products like voretigene neparvovec-rzyl (Luxturna), validation includes cell-based relative potency assays that demonstrate biological activity rather than merely chemical concentration [83]. These assays typically require demonstrating acceptable precision (e.g., 50-150% of reference standard potency) for lot-to-lot consistency, stability studies, and manufacturing comparability assessments [83].
Case Study: Potency Validation Protocol
A practical example of potency validation illustrates how Beer-Lambert principles integrate into regulatory-compliant testing. For a hypothetical small molecule drug product, a typical validation protocol would include:
Linearity and Range Assessment:
- Prepare standard solutions at five concentrations spanning 50-150% of target potency
- Measure absorbance at λmax for each standard
- Plot absorbance versus concentration and determine correlation coefficient (R² > 0.995 typically required)
- Verify relative standard deviation of response factors < 2.0%
Precision Evaluation:
- Analyze six independent sample preparations at 100% target concentration
- Calculate relative standard deviation for repeatability (typically < 2.0%)
- Conduct intermediate precision using different analysts, instruments, or days
Accuracy Determination:
- Prepare placebo samples spiked with known quantities of API at three levels (80%, 100%, 120%)
- Calculate recovery for each level (typically 98-102% required)
- Assess bias and confidence intervals for recovery values
This systematic approach ensures that spectroscopic potency methods based on Beer-Lambert principles generate reliable, defensible data for regulatory submissions and quality control.
Table 3: Experimental Parameters for Absorbance-Concentration Behavior Analysis [3]
| Parameter | Specification | Purpose |
|---|---|---|
| Concentration Range | 0.0001-2 M | Evaluates Beer-Lambert linearity from dilute to concentrated solutions |
| Wavelength Accuracy | Verified with Holmium filter (241-640 nm) | Ensures instrument free from instrumental deviations |
| Temperature Control | 20°C maintained | Prevents chemical deviations from temperature fluctuations |
| Path Length | Typically 1 cm (standard cuvette) | Provides consistent optical path for absorbance measurements |
| Chemical Environment | Chemically inert atmosphere | Prevents oxidation/degradation during analysis |
The Beer-Lambert Law remains foundational to pharmaceutical potency analysis, providing the theoretical basis for quantitative spectroscopic methods used throughout drug development and quality control. While the core principles established centuries ago continue to guide modern analysis, contemporary applications increasingly address the law's limitations through modified approaches for complex matrices, advanced algorithmic processing for spectroscopic data, and electromagnetic theory extensions that improve accuracy at high concentrations.
Future developments will likely focus on real-time potency monitoring using Raman and NIR spectroscopy integrated directly into manufacturing processes, leveraging the Beer-Lambert relationship for continuous quality verification. Additionally, computational methods combining first-principles spectroscopy with machine learning offer promising avenues for extracting more information from optical measurements, potentially detecting formulation errors and potency variations with greater sensitivity and speed than current approaches. As these technologies mature, the fundamental relationship between light absorption and analyte concentration discovered by Beer, Lambert, and Bouguer will continue to form the cornerstone of pharmaceutical analytical science, ensuring that medications meet their specified quality attributes for safety and efficacy.
The Modified Beer-Lambert Law (MBLL) for Turbid Media
The Beer-Lambert Law (BLL), also referred to as the Beer-Lambert-Bouguer law, is a fundamental principle in optical spectroscopy that describes the attenuation of light as it passes through a homogeneous, non-scattering medium [70] [1]. Its classic form states that absorbance ((A)) is linearly proportional to the concentration of the absorbing substance ((c)) and the path length of light through the medium ((d)), expressed as (A = \varepsilon \cdot d \cdot c), where (\varepsilon) is the molar extinction coefficient [70] [1]. However, this elegant linear relationship breaks down in turbid media like biological tissues, where scattering effects dominate over absorption [70] [84]. This limitation is particularly problematic for biomedical applications such as tissue oximetry and drug development research, where accurate quantification of chromophore concentrations (e.g., hemoglobin, bilirubin) is essential [70].
The Modified Beer-Lambert Law (MBLL) was developed to address these limitations by explicitly accounting for the significant influence of light scattering in turbid media [70] [85] [84]. In scattering-dominated samples, photons do not travel in straight lines; instead, they undergo random walks, resulting in an actual mean path length that considerably exceeds the direct geometric distance between the light source and detector [85] [84]. The MBLL incorporates this effect through a Differential Pathlength Factor (DPF), transforming the original law into a practical tool for quantitative spectroscopy in biological tissues and other turbid samples [70] [84]. This guide explores the theoretical foundations, practical applications, and methodological considerations of the MBLL, framing it within the broader context of advancing quantitative optical spectroscopy for biomedical research.
Theoretical Foundations of the MBLL
From BBL to MBLL: Core Mathematical Formulations
The transition from the classical Beer-Lambert law to the Modified Beer-Lambert law centers on addressing the discrepancy between the geometric source-detector separation and the actual distance light travels in a scattering medium.
The fundamental formulation of the MBLL for a homogeneous turbid medium is given by [84]:
[ OD = -\log\left(\frac{I}{I_0}\right) = \varepsilon \cdot c \cdot d \cdot DPF + G ]
In this equation:
- (OD) is the optical density (a measure of total light attenuation).
- (I) and (I_0) are the detected and incident light intensities, respectively.
- (\varepsilon) is the molar extinction coefficient of the chromophore.
- (c) is the chromophore concentration.
- (d) is the inter-optode distance (the geometric distance between the light source and the detector on the sample surface).
- (DPF) is the Differential Pathlength Factor, which accounts for the increased pathlength due to multiple scattering. It is defined as the ratio of the mean pathlength of detected photons to the inter-optode distance [84].
- (G) is a geometry-dependent factor that accounts for losses due to scattering and the specific measurement setup [84].
For many quantitative applications, particularly when measuring changes in concentration from a known baseline, the differential form of the MBLL is used. This form eliminates the need to know the absolute value of (G), which is often difficult to determine [85] [84]:
[ \Delta OD = -\log\left(\frac{I}{I_0}\right) = \varepsilon \cdot \Delta c \cdot d \cdot DPF ]
Here, (\Delta OD) is the change in optical density, and (\Delta c) is the change in chromophore concentration relative to a baseline state [85] [84]. The DPF is crucial for accurate quantification. Its value depends on the optical properties of the medium (both absorption, (\mua), and reduced scattering coefficient, (\mus')) as well as the source-detector separation [70]. For typical biological tissues, the DPF ranges from 3 to 6, meaning the actual average photon pathlength is 3 to 6 times longer than the simple geometric separation [70].
Light Propagation in Turbid Media: The Role of Scattering
Understanding the MBLL requires a conceptual shift from ballistic photon transport to a diffusive model. The following diagram illustrates the fundamental difference in how light travels through a clear medium versus a turbid one, and how this is mathematically addressed in the MBLL.
Diagram 1: Photon Pathlengths in Clear vs. Turbid Media. In a clear medium, light follows a straight path. In a turbid medium, photons undergo random walks due to scattering, resulting in a much longer mean pathlength, which is quantified by the DPF in the MBLL.
In turbid media, the probability of a photon being scattered is much higher than that of it being absorbed. Each scattering event redirects the photon, leading to a protracted, random-walk path between the source and detector [85]. This phenomenon is formally described by the photon path distribution (PPD), which represents the statistical spread of pathlengths that photons take through the medium [86]. The MBLL effectively simplifies this complex distribution by utilizing the mean pathlength (( \langle L \rangle )), which is related to the DPF by ( \langle L \rangle = d \cdot DPF ) [85] [84]. This mean pathlength provides a natural constant of proportionality between the measured differential intensity and the sample’s differential absorption, making the problem of concentration quantification tractable [85].
Key Applications in Biomedical Research and Drug Development
Tissue Oximetry and Hemoglobin Concentration Measurement
A primary application of the MBLL is in near-infrared spectroscopy (NIRS) for non-invasive tissue oximetry. This technique leverages the MBLL to quantify the concentration of oxygenated hemoglobin (HbO₂) and deoxygenated hemoglobin (Hb) in biological tissues, such as the brain and muscle [70] [87].
The process involves measuring optical density changes at multiple wavelengths (typically at least two). The changes in absorption at these wavelengths are related to the concentration changes of the hemoglobin species through a system of linear equations derived from the MBLL [84]:
[ \begin{bmatrix} \Delta OD{\lambda1} \ \Delta OD{\lambda2}
\end{bmatrix}
d \cdot DPF \begin{bmatrix} \varepsilon{HbO2, \lambda1} & \varepsilon{Hb, \lambda1} \ \varepsilon{HbO2, \lambda2} & \varepsilon{Hb, \lambda2} \end{bmatrix} \begin{bmatrix} \Delta c{HbO2} \ \Delta c_{Hb} \end{bmatrix} ]
By solving this system, researchers can calculate absolute changes in HbO₂ and Hb concentrations, enabling the determination of critical physiological parameters like total hemoglobin concentration (HbT = HbO₂ + Hb) and tissue oxygen saturation (StO₂ = HbO₂ / HbT) [87]. The ability to perform these measurements non-invasively is invaluable for monitoring cerebral oxygenation in patients with traumatic brain injury, during surgical procedures, and for assessing tissue viability in drug development studies [70] [87].
Monitoring Blood Flow with Diffuse Correlation Spectroscopy
An advanced extension of the MBLL framework has been developed for Diffuse Correlation Spectroscopy (DCS), a technique that measures microvascular blood flow [85] [88]. While traditional NIRS-MBLL quantifies absorption changes, DCS utilizes the temporal fluctuations of scattered coherent light to infer the movement of scatterers, primarily red blood cells.
In DCS, a DCS optical density ((OD{DCS})) is defined as (OD{DCS} \equiv -\log(g2(\tau) - 1)), where (g2(\tau)) is the normalized intensity autocorrelation function measured at a delay-time (\tau) [88]. The Modified Beer-Lambert law for blood flow then linearly relates changes in this (OD{DCS}) to variations in tissue blood flow ((F)), tissue scattering ((\mus')), and tissue absorption ((\mu_a)) [85] [88]. This formulation, while paralleling the traditional MBLL, has different weighting factors and has been validated in both homogeneous and two-layer tissue models, providing a powerful tool for monitoring conditions like stroke, brain injury, and tumor response to therapy [85] [88].
Experimental Protocols and Methodologies
Standard Protocol for Cerebral Oximetry Using MBLL
The following workflow outlines a standard experimental protocol for non-invasive cerebral oximetry using multi-distance NIRS and the MBLL, suitable for application in human subjects or animal models.
Diagram 2: Experimental Workflow for Cerebral Oximetry. This protocol uses multi-distance, frequency-domain NIRS to measure optical properties and apply the MBLL for absolute quantification of hemoglobin concentrations [87].
Step-by-Step Procedure:
- Instrument Setup: Utilize a frequency-domain or continuous-wave NIRS system capable of measurements at multiple source-detector distances. Calibrate the instrument using a phantom with known optical properties [87].
- Sensor Placement: Affix the optical probe to the region of interest (e.g., the forehead for cerebral monitoring). Ensure good skin contact and shield the setup from ambient light.
- Baseline Data Acquisition: Collect diffuse reflectance data at a minimum of two source-detector separations. The "far" detector samples deeper tissue (e.g., brain), while the "near" detector primarily samples superficial tissue (e.g., scalp, skull) [87].
- Data Processing: Calculate the optical density ((OD)) from the measured light intensities. For absolute oximetry, use the multi-distance data to simultaneously determine the absorption ((\mua)) and reduced scattering ((\mus')) coefficients, often by fitting the data to a photon diffusion model in a layered geometry [87].
- MBLL Application: The absorption coefficient is a linear combination of contributions from all chromophores: (\mua(\lambda) = \varepsilon{HbO2}(\lambda) \cdot c{HbO2} + \varepsilon{Hb}(\lambda) \cdot c{Hb} + B), where (B) is a constant background absorption. By measuring (\mua) at two or more wavelengths, one can solve the resulting system of equations for the absolute concentrations (c{HbO2}) and (c_{Hb}) [70] [87].
Protocol for Validating MBLL in Tissue-Like Phantoms
Validating the accuracy of MBLL measurements is a critical step before clinical or preclinical application. This is typically done using tissue-like phantoms with known optical properties and chromophore concentrations.
Materials and Preparation:
- Phantom Matrix: A scattering base material, such as silicone, epoxy, or aqueous suspensions of Lipofid, which mimics the reduced scattering coefficient of biological tissue ((\mu_s' \approx 5-10\text{cm}^{-1})) [85].
- Absorbers: Chemical chromophores with known absorption spectra, such as India ink for a broad background absorption or nitrated hemoglobin for specific validation of blood flow measurements [85].
- Flow Models: For DCS-MBLL validation, phantoms often incorporate dynamic scatterers, like intralipid solutions with suspended polystyrene microspheres, to simulate blood flow. The flow speed can be controlled to validate the linear relationship between (OD_{DCS}) and blood flow index ((F)) [85] [88].
Validation Procedure:
- Characterization: Precisely measure the phantom's absorption and scattering coefficients using a gold-standard technique, such as time-resolved or frequency-domain spectroscopy [87].
- MBLL Measurement: Perform NIRS or DCS measurements on the phantom using the intended protocol and MBLL analysis.
- Comparison and Calibration: Compare the chromophore concentrations or blood flow indices derived from the MBLL against the known values of the phantom. This allows for the calibration of key parameters like the DPF and the quantification of systematic errors [85] [87].
The Scientist's Toolkit: Essential Reagents and Materials
Table 1: Key Research Reagent Solutions for MBLL Experiments
| Category | Item/Reagent | Function in MBLL Research |
|---|---|---|
| Chromophores | Oxy-/Deoxy-Hemoglobin | Primary absorbers of interest in biological tissues; used for calibration and phantom studies [70] [85]. |
| India Ink | Provides a stable, broadband absorbing material for calibrating instruments and creating tissue phantoms [85]. | |
| Scattering Agents | Intralipid / Lipofid | Lipid emulsions that provide controlled, biologically-relevant scattering in liquid tissue-simulating phantoms [85]. |
| Polystyrene Microspheres | Monodisperse particles used as static or dynamic scatterers in flow phantoms for DCS and NIRS validation [85]. | |
| Phantom Materials | Silicone & Epoxy | Solid or semi-solid polymers used as a base for creating stable, durable solid phantoms with customizable optical properties [85]. |
| Instrumentation | NIRS/DCS System | Combined hard/software for measuring diffuse light reflectance (NIRS) and temporal intensity autocorrelations (DCS) [85] [88]. |
| Multi-Distance Optodes | Optical fibers or probes arranged at fixed distances (e.g., 2 cm, 3 cm) to enable depth resolution and layered media analysis [87]. |
Advanced Considerations and Limitations
Addressing Tissue Inhomogeneity with Layered Models
Biological tissues are inherently inhomogeneous and often have a layered structure. A key challenge in cerebral oximetry, for example, is discriminating the hemodynamic signals from the brain (cerebral layer) from those originating in the overlying scalp and skull (extracerebral layer) [87]. Assuming a homogeneous medium can lead to significant errors in calculated chromophore concentrations.
Advanced MBLL approaches address this by using multi-distance measurements and fitting the data to a two-layer model [87]. In this model, the top layer represents extracerebral tissue, and the bottom layer represents cerebral tissue. The inversion procedure, often based on algorithms like Levenberg-Marquardt, allows for the simultaneous recovery of the optical properties of both layers and the thickness of the top layer, leading to more accurate absolute measurements of cerebral hemoglobin concentration and saturation [87]. Monte Carlo simulations and phantom validations have shown that this method can recover parameters with deviations typically less than 10% [87].
Critical Limitations and Assumptions of the MBLL
Despite its utility, the MBLL has inherent limitations that researchers must acknowledge.
Table 2: Key Limitations and Assumptions of the Modified Beer-Lambert Law
| Limitation/Assumption | Impact on Measurement | Potential Mitigation Strategy |
|---|---|---|
| Constant Scattering | The standard MBLL assumes scattering properties ((\mus')) remain constant during measurement. Changes in (\mus') can be misinterpreted as absorption changes [85] [84]. | Use the expanded MBLL form: (\Delta OD \approx \langle L \rangle \Delta \mua + (\frac{\mua^0}{\mus'^0}) \langle L \rangle \Delta \mus') [85]. |
| Spatial Inhomogeneity | The homogeneous model fails in layered or otherwise heterogeneous tissues, violating the model's core assumption [70] [87]. | Implement multi-distance measurements and fit data to a two-layer or more complex geometric model [87]. |
| DPF Wavelength Dependence | The DPF is not perfectly constant across different wavelengths, which can introduce errors in multi-wavelength calculations [84]. | Use wavelength-specific DPF values obtained from literature or calibrated for the specific tissue and setup. |
| Unknown Background Absorption | The presence of unknown or varying background absorbers (e.g., water, lipids) adds uncertainty to the calculation of specific chromophore concentrations [70]. | Measure at more wavelengths to account for additional chromophores or use prior knowledge of their concentrations. |
| High Absorber Concentration | The linear relationship between absorption and concentration can break down at high concentrations due to effects like the "shielding effect" in larger blood vessels [70]. | Ensure measurements are within the dynamic range where the relationship remains linear or apply non-linear corrections. |
The Modified Beer-Lambert Law represents a critical evolution of a classic spectroscopic principle, transforming it into a powerful tool for quantitative analysis in complex, scattering environments. By incorporating the Differential Pathlength Factor and moving to a differential measurement paradigm, the MBLL provides a robust, though not infallible, framework for non-invasively quantifying chromophore concentrations and blood flow in biological tissues. Its successful application, particularly in biomedical research and drug development, hinges on a thorough understanding of its theoretical underpinnings, a careful experimental setup, and a clear acknowledgment of its limitations. Future advancements will likely involve more sophisticated, multi-layered light propagation models and the integration of MBLL with other modalities, further solidifying its role as a cornerstone of quantitative spectroscopy in turbid media.
Incorporating the Differential Pathlength Factor (DPF) for Tissues
The Beer-Lambert law (BLL) serves as a fundamental principle in quantitative spectroscopy, establishing a linear relationship between light attenuation and the concentration of absorbing species within a medium. However, its direct application to biological tissues is significantly limited by intense light scattering. The Modified Beer-Lambert Law (MBLL) addresses this limitation by incorporating the Differential Pathlength Factor (DPF), a critical parameter that accounts for the increased distance light travels due to scattering. This technical guide provides an in-depth examination of the DPF, detailing its theoretical foundation, quantitative relationships, measurement methodologies, and practical implications for spectroscopic research in biomedical applications, including drug development.
The classical Beer-Lambert law describes the attenuation of a collimated light beam passing through a homogeneous, non-scattering medium, stating that absorbance is directly proportional to the concentration of the absorbing chromophores and the pathlength through the medium [70] [1]. In its fundamental form for a single absorber, it is expressed as: [ A = \epsilon \cdot c \cdot l ] where (A) is absorbance, (\epsilon) is the molar extinction coefficient (( \text{cm}^{-1}\text{M}^{-1} )), (c) is the molar concentration (M), and (l) is the geometric pathlength (cm) [70] [1].
Biological tissues, however, are highly scattering media, causing photons to travel a much longer, tortuous path between source and detector compared to the straight-line geometric separation [89]. This scattering invalidates the core assumptions of the classical BLL. The Modified Beer-Lambert Law (MBLL) was developed to address this discrepancy, introducing two key parameters [70] [84]: [ OD = -\ln\left(\frac{I}{I0}\right) = \epsilon \cdot c \cdot d \cdot \text{DPF} + G ] Here, (OD) is the optical density (attenuation), (I) and (I0) are the detected and incident light intensities, (d) is the source-detector separation, and (G) is a geometry-dependent factor accounting for light loss due to scattering [70] [84]. The Differential Pathlength Factor (DPF) is a dimensionless multiplier defined as the ratio of the mean effective optical pathlength travelled by photons to the geometric source-detector distance (d) [90]. The DPF quantifies the effect of scattering, enabling accurate estimation of chromophore concentrations from measured light attenuation in tissue [89] [90].
Theoretical Foundations of the Differential Pathlength Factor
Physical Meaning and Significance
The DPF is a cornerstone of quantitative diffuse optical spectroscopy. Its incorporation into the MBLL transforms the equation from a simple proportionality into a practical tool for investigating biological tissues. The primary physical meaning of the DPF is that it quantifies the effective increase in the pathlength of light due to multiple scattering events. In tissues, the actual distance photons travel before being detected is typically several times the straight-line source-detector distance [89] [90]. For instance, DPF values for biological tissues generally range from 3 to 6 for the adult head, meaning the actual light path is 3 to 6 times longer than the physical separation between the light source and the detector [70] [90].
The critical importance of the DPF becomes evident when quantifying concentrations of key tissue chromophores like oxyhemoglobin (O₂Hb) and deoxyhemoglobin (HHb). An error in the assumed DPF value does not merely scale the calculated concentration changes; an error in the spectral dependence of DPF across wavelengths induces cross-talk between the calculated O₂Hb and HHb concentrations [89]. This cross-talk is particularly detrimental in functional studies, such as brain or muscle activation mapping, where O₂Hb and HHb typically exhibit antagonistic behaviors [89]. Therefore, an accurate, wavelength-specific DPF is essential for isolating the physiological signals of interest.
Mathematical Relationship to Tissue Optical Properties
In a semi-infinite, homogeneous scattering medium, the DPF can be analytically related to the fundamental optical properties of the tissue: the absorption coefficient ((\mua)) and the reduced scattering coefficient ((\mus')) [90] [91]. This relationship is derived from diffusion theory: [ \text{DPF}(\lambda) \approx \frac{1}{2} \sqrt{\frac{3\mus'(\lambda)}{\mua(\lambda)}} \left[ 1 - \frac{1}{1 + \rho \sqrt{3\mua(\lambda)\mus'(\lambda)}} \right] ] This equation demonstrates that the DPF at a given wavelength (\lambda) is approximately proportional to the square root of the ratio of scattering to absorption, (\sqrt{\mus' / \mua}) [90] [91]. Consequently:
- The DPF increases as scattering increases, because more scattering events force photons into a more tortuous, longer path.
- The DPF decreases as absorption increases, because photons traveling very long paths are more likely to be absorbed and never reach the detector, reducing the average pathlength of the detected light [90].
Table 1: DPF Dependence on Tissue Optical Properties and Geometry
| Factor | Effect on DPF | Physical Rationale |
|---|---|---|
| Increased Scattering ((\mu_s')) | Increase | More scattering events force a longer, more tortuous photon path. |
| Increased Absorption ((\mu_a)) | Decrease | High absorption probability preferentially removes photons on longer paths, reducing the mean pathlength. |
| Increased Source-Detector Distance ((\rho)) | Mild Increase | The relationship is non-linear, with dependence diminishing at distances greater than ~2.5 cm [91]. |
| Increased Adipose Tissue Thickness (ATT) | Increase | A thicker, highly scattering over-layer increases the overall pathlength [90]. |
Quantitative DPF Values and Dependencies
Understanding the typical values and variabilities of the DPF is crucial for designing experiments and selecting appropriate literature values when direct measurement is not feasible.
Typical DPF Values Across Tissues
Reported DPF values vary significantly between different tissue types due to their distinct compositions and optical properties. The vastus lateralis and biceps brachii muscles, for example, show high inter-subject and inter-muscle variability, influenced heavily by the overlying subcutaneous adipose tissue (ATT) [90]. The values below represent general ranges for common tissues.
Table 2: Typical DPF Ranges in Different Biological Tissues
| Tissue Type | Typical DPF Range | Key Influencing Factors |
|---|---|---|
| Adult Head (Brain) | 4 - 6 [70] | Age, head region, wavelength. |
| Skeletal Muscle | Variable, subject-specific [90] | Muscle type, Adipose Tissue Thickness (ATT), oxygenation level. |
| Neonatal Head | Higher than adult [90] | Lower scattering and absorption in infant brain. |
Key Factors Influencing DPF
The DPF is not a universal constant but is influenced by several physiological and experimental factors [90]:
- Wavelength ((\lambda)): The DPF is wavelength-dependent because both absorption ((\mua)) and scattering ((\mus')) vary with wavelength. The absorption spectra of hemoglobin, water, and lipids create a complex spectral dependence for the DPF [89].
- Tissue Layer Structure: Tissues are layered structures. A key finding is that DPF increases with subcutaneous Adipose Tissue Thickness (ATT) [90] [91]. A thicker adipose layer, which is highly scattering, increases the overall photon pathlength.
- Source-Detector Separation ((\rho)): The DPF shows a dependence on distance, particularly for short separations (e.g., below ~25 mm). This dependence becomes negligible for larger distances typically used in adult brain studies [91].
- Physiological State: Changes in tissue absorption due to hemodynamics (e.g., during muscle exercise or brain activation) or changes in scattering (e.g., from cell swelling) can cause dynamic, time-varying changes in the DPF.
Experimental Protocols for DPF Estimation
Accurate determination of the DPF requires specialized techniques that move beyond simple continuous-wave (CW) attenuation measurements.
Time-Domain and Frequency-Domain Methods
The gold-standard methods for DPF estimation are time-domain (TD) and frequency-domain (FD) near-infrared spectroscopy, as they directly measure the photons' time-of-flight.
Time-Domain (TD) NIRS Protocol [90]:
- Instrumentation: A pulsed laser source and a time-correlated single-photon counting (TCSPC) system are used.
- Data Acquisition: The laser injects short pulses of light into the tissue. The detected light is a temporally broadened distribution of time-of-flight (DTOF) due to scattering.
- DPF Calculation: The DPF is calculated directly from the mean time-of-flight (\langle t \rangle) of the DTOF: [ \text{DPF}(\lambda) = \frac{1}{\rho} \cdot \frac{c}{n(\lambda)} \langle t(\lambda) \rangle ] where (c) is the speed of light in vacuum and (n) is the tissue refractive index [90]. This provides a direct, empirical measurement of the mean photon pathlength.
Frequency-Domain (FD) NIRS Protocol [89]:
- Instrumentation: A light source whose intensity is sinusoidally modulated at radio frequencies (e.g., 100-1000 MHz) is used.
- Data Acquisition: The light intensity attenuates and its phase shifts as it propagates through the tissue.
- DPF Calculation: The phase shift ((\phi)) is related to the mean time-of-flight, allowing DPF estimation. FD systems often use multi-distance (FDMD) measurements to calibrate and extract absolute DPF values [89].
Advanced CW-NIRS Estimation Using the Effective Attenuation Coefficient
Since TD and FD systems are complex and expensive, methods to estimate DPF using more common Continuous-Wave (CW) systems have been developed, particularly with high-density (HD) arrays [89].
- High-Density CW-NIRS Protocol for DPF Spectral Dependence [89]:
- Setup: A high-density fNIRS cap with multiple sources and detectors creating a dense grid of measurement channels is placed on the subject.
- Intensity Measurement: The CW light intensity is measured for all source-detector pairs (channels) across multiple distances.
- Effective Attenuation Coefficient (EAC) Estimation: The slope of the logarithm of light intensity versus source-detector distance is calculated via linear regression. This slope is the EAC ((\mu{\text{eff}})), which is proportional to the geometric mean of absorption and scattering: (\mu{\text{eff}} \propto \sqrt{\mua \mus'}) [89].
- DPF Calculation: Since DPF depends on the ratio (\mus'/\mua), it can be expressed as (\text{DPF} \propto \mus' / \mu{\text{eff}}). By estimating (\mu_{\text{eff}}) empirically and assuming a spectral shape for the scattering coefficient (e.g., a simple linear decay with wavelength), the spectral dependence of DPF can be derived, significantly reducing cross-talk [89].
The following workflow diagram illustrates the key steps in this advanced CW-NIRS approach:
Diagram 1: CW-NIRS DPF Estimation Workflow
The Scientist's Toolkit: Essential Reagents and Materials
Successful implementation of DPF-corrected spectroscopy requires specific instrumentation and analytical tools.
Table 3: Key Research Reagent Solutions for DPF Studies
| Item / Solution | Function / Application |
|---|---|
| Time-Domain (TD) NIRS System | Gold-standard for direct DPF measurement via photon time-of-flight. |
| Frequency-Domain (FD) NIRS System | Provides phase-shift data for DPF estimation using modulated light. |
| High-Density (HD) CW-fNIRS System | Enables EAC-based DPF estimation using multi-distance measurements. |
| Solid Tissue Phantoms | Calibration and validation of systems with known optical properties. |
| Extinction Coefficient Data | Published spectra of HbO₂ and HHb for converting OD to concentration. |
The incorporation of the Differential Pathlength Factor is a critical advancement that enables the transition of the Beer-Lambert law from a principle for clear solutions to a quantitative tool for turbid biological tissues. A thorough understanding of its theoretical basis, its dependence on tissue composition and architecture, and the methodologies for its accurate estimation is fundamental for researchers and drug development professionals relying on spectroscopic data. Employing subject-specific and wavelength-resolved DPF values, rather than population averages, is essential for minimizing cross-talk and enhancing the sensitivity and specificity of optical measurements in brain, muscle, and other tissues, thereby yielding more reliable and interpretable physiological data.
The accurate quantification of light propagation through various media is a cornerstone of spectroscopic research, with profound implications for drug development, diagnostic assays, and material characterization. For decades, the Beer-Lambert Law (BLL) has served as the foundational principle in quantitative spectroscopy, providing a straightforward linear relationship between absorbance, concentration, and path length [3] [27]. Its elegant simplicity, expressed as ( A = \epsilon c l ), where ( A ) is absorbance, ( \epsilon ) is the molar absorptivity, ( c ) is concentration, and ( l ) is path length, has made it indispensable for chemical analysis in transparent, dilute solutions [3] [29].
However, the fundamental assumptions of the BLL—monochromatic light, a non-scattering medium, and non-interacting absorbers—are frequently violated in complex real-world samples, particularly in biological tissues and concentrated formulations [70] [29]. These limitations have driven the development and adoption of more sophisticated models, primarily Diffusion Theory and Monte Carlo (MC) Simulations, which explicitly account for the significant effects of light scattering [70] [92].
This technical guide provides a comparative analysis of these three pivotal methodologies, contextualized within the ongoing evolution of quantitative spectroscopy research. We evaluate their theoretical foundations, domains of applicability, and performance through experimental data, providing researchers with a structured framework for selecting the optimal model for their specific application.
Theoretical Foundations and Limitations
Beer-Lambert Law
The BLL posits a direct, linear relationship between the absorbance of light and the concentration of an absorbing species within a non-scattering medium [3]. Its formulation assumes a collimated, monochromatic light beam and a homogeneous solution where molecules absorb light independently.
Despite its utility, the BLL suffers from several well-documented deviations:
- Fundamental/Real Deviations: At high concentrations, intermolecular distances decrease, leading to solute-solute interactions that alter the analyte's absorptivity and refractive index, breaking the linear relationship [3].
- Chemical Deviations: Shifts in chemical equilibrium due to changes in pH, temperature, or solvent can cause changes in absorption spectra [3].
- Scattering Deviations: The presence of particulates or turbidity, common in biological samples and formulations, introduces significant attenuation not due to absorption, which the classical BLL cannot distinguish [70] [93].
Diffusion Theory
Diffusion theory approaches light propagation in turbid media as a diffusive process, applicable when scattering dominates over absorption (( \mus' >> \mua )) [70]. It is derived as an approximation to the Radiative Transfer Equation (RTE).
A key application is the Modified Beer-Lambert Law (MBLL) for tissue diagnostics, which incorporates a Differential Pathlength Factor (DPF) to account for the increased distance photons travel due to scattering [70] [88]: [ OD = -\log\left(\frac{I}{I0}\right) = DPF \cdot \mua \cdot d + G ] where ( G ) is a geometry-dependent factor. The MBLL is highly effective for monitoring changes in chromophore concentrations, such as in near-infrared spectroscopy (NIRS) for measuring blood oxygenation [70] [88].
Limitations: The diffusion approximation loses accuracy in low-scattering media, in regions close to the light source, and in strongly absorbing media [92].
Monte Carlo Simulations
Monte Carlo (MC) methods are stochastic numerical techniques that model light transport by simulating the random walks of millions of individual photons as they are scattered and absorbed in a medium [94] [92]. The trajectory of each photon is determined by probabilities derived from the medium's absorption (( \mua )) and scattering (( \mus )) coefficients, as well as the scattering anisotropy (( g )).
MC simulations are often considered the "gold standard" for accuracy in complex geometries [92]. They provide no analytical solution but generate statistically robust results by tracking photon fate (absorption, transmission, reflection).
Limitations: The primary drawback is high computational cost, often requiring hours or days of computation time for a single accurate simulation [92].
Quantitative Comparative Analysis
Table 1: Comparative analysis of the core characteristics of the three models.
| Feature | Beer-Lambert Law | Diffusion Theory | Monte Carlo Simulations |
|---|---|---|---|
| Theoretical Basis | Empirical law | Approximation of RTE | Stochastic numerical method |
| Scattering Handling | Neglects scattering | Explicitly models multiple scattering | Explicitly models each scattering event |
| Computational Demand | Low (analytical equation) | Moderate (solving PDEs) | Very High (millions of photons) |
| Typical Accuracy | High for clear, dilute solutions | Good for thick, scattering-dominated media (<5-10% error) [92] | High ("gold standard") [92] |
| Best-Suited Applications | UV-Vis spectroscopy of solutions; concentration determination | NIRS for tissue oximetry; photon density in thick tissues | Validation of other models; complex geometries; research |
| Key Limitations | Fails in scattering media; deviations at high concentrations [3] | Fails in low-scattering/air interfaces; low accuracy near sources [70] | Computationally intensive; not suitable for real-time analysis [92] |
Table 2: Performance comparison in practical experimental scenarios.
| Experiment Context | Beer-Lambert Law Performance | Diffusion/Monte Carlo Performance |
|---|---|---|
| UV-Vis of KMnO₄ (Low Conc.) | Linear fit (R² >0.99) up to ~10mM; RMSE <0.06 [3] | Not required |
| UV-Vis of Tomato Juice (High Conc.) | Deviations from linearity >25% concentration due to scattering [93] | MC or Diffusion needed to model scattering effects |
| Gamma Shielding (PMMA-HgO) | Not applicable (scattering dominant) | MCNP6/GEANT4 MC simulations matched experiment with <5% error [94] |
| Tightly Scattering Tissue | Highly inaccurate | DAE model showed superior fit to experimental thermal damage vs. BLL-based model [92] |
| Blood Oxygen Saturation | Inaccurate without modification | MBLL enabled accurate remote tracking of Hb/HbO₂ [70] |
Experimental Protocols and Methodologies
Protocol 1: Validating and Demonstrating BLL Deviations using Tomato Juice
This protocol, adapted from a 2025 educational study, provides a simple method to confirm the BLL and observe its limitations using everyday materials [93].
Research Reagent Solutions:
- Tomato Juice: Contains lycopene, a strong chromophore with an absorption peak at 480-520 nm [93].
- Tap Water: Serves as a safe, accessible solvent for dilution.
Procedure:
- Sample Preparation: Prepare a dilution series of tomato juice in tap water (e.g., 0%, 2.5%, 5%, 10%, 25%, 50%, and 100% v/v) in 1 cm path length cuvettes.
- Data Acquisition: Use a halogen lamp as a broadband visible light source and a spectrometer to record the transmission spectrum ( I(\lambda) ) for each sample. Use a cuvette with tap water as the reference ( I_0(\lambda) ).
- Data Analysis: Convert transmission to absorbance: ( A(\lambda) = -\log{10}(I/I0) ).
- Plotting: Plot absorbance versus concentration at the lycopene peak (~500 nm). A linear relationship will be observed at low concentrations (<25%), confirming the BLL. Systematic positive deviations will be evident at higher concentrations due to scattering from particulates [93].
Protocol 2: Evaluating Gamma Shielding with Monte Carlo Simulations
This protocol, based on a 2025 study, details the evaluation of a polymer composite for gamma radiation shielding using MC simulations, validated against experiment [94].
Research Reagent Solutions:
- PMMA (Poly(Methyl Methacrylate)): A transparent polymer matrix.
- HgO (Mercury Oxide) Powder: A high atomic number (Z) filler to enhance gamma photon attenuation.
Procedure:
- Composite Fabrication: Disperse HgO powder (e.g., 2.5-10 wt%) in a dissolved PMMA matrix. Cast the mixture into a mold to create a homogeneous shielding sample [94].
- Experimental Measurement: Irradiate the samples with a gamma source (e.g., ¹³⁷Cs, 662 keV). Use a detector to measure the transmitted intensity. Calculate the experimental linear attenuation coefficient (LAC) [94].
- Monte Carlo Simulation:
- Platforms: Use simulation codes like MCNP6 or GEANT4.
- Geometry Modeling: Recreate the exact experimental setup: source energy, sample dimensions, and detector position.
- Physics Setup: Define the material composition (density, elemental composition) and physics processes (photoelectric effect, Compton scattering).
- Execution: Simulate the trajectory of a large number of particles (e.g., 1 × 10⁶) to achieve a low statistical error (<2%) [94].
- Validation: Compare the simulated LAC, half-value layer (HVL), and other parameters with the experimental results. Discrepancies under 5% validate the model's reliability [94].
Decision Framework and Visual Workflows
The following diagram illustrates the logical decision process for selecting an appropriate model for a given spectroscopic application.
Figure 1: Model selection workflow for spectroscopic analysis.
Table 3: Essential research reagents and materials for experiments in quantitative spectroscopy of complex media.
| Item | Function/Application | Example Use Case |
|---|---|---|
| Potassium Permanganate (KMnO₄) | Strong, predictable chromophore for UV-Vis; validating BLL in aqueous solution [3]. | Testing fundamental BLL linearity and its electromagnetic extensions [3]. |
| Polymer Matrix (e.g., PMMA) | Transparent base for creating custom scattering composites with embedded absorbers/scatterers [94]. | Fabricating phantoms for calibration and validation of Diffusion and MC models [94]. |
| High-Z Fillers (e.g., HgO, Bi₂O₃) | Increase photon absorption and scattering cross-section in a polymer matrix [94]. | Enhancing gamma/X-ray shielding; creating well-defined turbid samples for simulation validation [94]. |
| Holmium Glass Filter | Reference material with sharp, known absorption peaks for spectrophotometer wavelength calibration [3]. | Ensuring instrument accuracy and eliminating instrumental deviations in validation studies [3]. |
The Beer-Lambert Law remains an essential tool for quantitative analysis in ideal, non-scattering conditions. However, the complexities inherent in modern spectroscopic applications, especially within biological and materials science research, necessitate more advanced models. Diffusion Theory provides a practical and computationally efficient framework for probing deep into scattering-dominated media like human tissue. For the most complex scenarios or where supreme accuracy is critical, Monte Carlo simulations offer an unparalleled, albeit computationally expensive, solution.
The future of quantitative spectroscopy lies in the intelligent application of this hierarchical toolkit—using the BLL where valid, leveraging the efficiency of Diffusion Theory for specific inverse problems, and relying on the benchmark accuracy of Monte Carlo simulations to validate new methods and explore complex phenomena. Emerging trends, such as the integration of machine learning with these physical models and the development of real-time approximation algorithms, promise to further enhance the power and accessibility of optical quantification in research and drug development.
The Beer-Lambert Law (BLL) represents a foundational principle in optical spectroscopy, establishing a linear relationship between a substance's concentration and its absorbance of light at a specific wavelength [8] [27]. For generations, this law has served as the cornerstone for quantitative analysis across chemistry, biology, and materials science. The BLL is mathematically expressed as ( A = \epsilon \cdot c \cdot l ), where ( A ) is the measured absorbance, ( \epsilon ) is the molar absorptivity (( \text{L·mol}^{-1}\text{·cm}^{-1} )), ( c ) is the concentration (mol/L), and ( l ) is the optical path length (cm) [27]. This equation enables the determination of unknown concentrations via calibration curves, making it indispensable for analytical applications ranging from clinical diagnostics to environmental monitoring [8] [27].
However, the classical BLL framework possesses significant limitations that restrict its utility in modern analytical challenges. It assumes linearity that breaks down at high concentrations due to molecular interactions and electrostatic effects [2] [95]. Furthermore, it cannot adequately handle complex mixtures where spectral profiles extensively overlap, nor does it account for interference effects arising from the wave nature of light, such as band shifts and intensity changes caused by optical conditions and substrate effects [2] [96]. These fundamental constraints necessitate advanced methodologies that can transcend the classical BLL framework while preserving its quantitative rigor.
This technical guide explores two transformative paradigms extending the Beer-Lambert Law: Multi-Component Quantitative Analysis (MCQA) for complex systems and integration with machine learning (ML) to overcome fundamental physicochemical limitations. By synthesizing recent research advances, we provide researchers and drug development professionals with both theoretical foundations and practical protocols for implementing these advanced spectroscopic techniques.
Theoretical Foundations: From Beer-Lambert to Advanced Frameworks
Fundamental Deviations from the Beer-Lambert Law
The Bouguer-Beer-Lambert Law, while empirically useful, is only remotely compatible with electromagnetic theory [2]. Deviations arise because the law does not fully account for the wave nature of light, leading to spectral artifacts that cannot be explained by chemical interactions alone. These electromagnetic effects include non-linear thickness dependence, where absorbance does not scale linearly with path length due to interference phenomena, and the influence of the substrate and sample form on the measured absorption [2]. Recognizing these inherent limitations is crucial for developing more robust quantitative frameworks.
The Molar Mass Coefficient Method for Multi-Component Analysis
For complex systems containing multiple analytes with similar chromophores, the Molar Mass Coefficient (MMC) method presents a novel approach that addresses limitations of both external standard and single-standard multi-component methods [96]. This method operates on the principle that UV-Vis absorption is characterized by the absorbing system—consisting of a chromophore group and its auxochromes—rather than the entire molecular structure [96]. The MMC method utilizes the formula: [ A = \varepsilon \cdot \frac{m}{M} \cdot \frac{l}{V} ] where ( m ) is the mass of the compound, ( M ) is its molar mass, and ( V ) is the volume of the solution [96]. This reformulation enables quantification of multiple components using a single reference substance that shares the same chromophore system, significantly reducing the need for multiple reference standards while maintaining analytical rigor [96].
Machine Learning Integration to Surpass Beer-Lambert Limitations
ML-Enhanced Concentration Quantification
Machine learning offers a powerful approach to overcome Beer-Lambert Law limitations, particularly the deviation from linearity at high concentrations and the challenges of quantifying intensely colored compounds. Recent research demonstrates that ridge regression models trained on digital images of solutions can accurately predict chemical concentrations without relying on traditional absorbance-concentration relationships [95]. This approach effectively bypasses the linearity constraints of the BBL, enabling accurate quantification even where the classical law fails.
Experimental validation with K₂Cr₂O₇ and KMnO₄ solutions demonstrated that while the Beer-Lambert relationship deviates from linearity above approximately 3.0 × 10⁻⁴ M, the ML model maintains prediction accuracy across a wide concentration range [95]. The model achieved impressive performance metrics with a mean absolute error (MAE) of 1.4 × 10⁻⁵, mean squared error (MSE) of 3.4 × 10⁻¹⁰, and root mean squared error (RMSE) of 1.0 × 10⁻⁵ when trained on 210 images [95]. This approach depends solely on color intensity without requiring detailed molecular interaction knowledge, making it particularly valuable for complex systems where traditional spectroscopic quantification proves challenging.
Dimensionality Reduction for Design Optimization
In optoelectronic device design, machine learning—particularly dimensionality reduction techniques like principal component analysis (PCA)—has demonstrated significant advantages over classical optimization strategies [97]. This approach accelerates design discovery and enhances understanding of complex optical phenomena by identifying the most compact representation of high-dimensional design spaces with minimal information loss [97].
For the design of ten-junction photonic power converters, this ML-enhanced method yielded over twenty times as many optimal designs with greater variability compared to classical optimization, while simultaneously reducing computational cost by 15% [97]. The reduced-dimensionality subspace also provides an intuitive interpretation of optical phenomena, facilitating knowledge discovery in complex photonic systems [97]. This methodology is broadly applicable to any system that can be numerically modeled, offering potential for accelerated innovation across multiple spectroscopic and photonic applications.
ML-Augmented Spectroscopic Imaging
The integration of machine learning with spectroscopic imaging has transformed biomedical research by enabling precise, label-free imaging of biomolecules with unprecedented sensitivity and specificity [98]. ML algorithms excel at identifying essential features in massive spectroscopic datasets, extracting meaningful biological information from complex, multi-layered data where conventional multivariate statistical methods fall short [98]. Applications span image segmentation, denoising, classification, and clinical diagnosis, particularly in coherent Raman scattering (CRS) imaging [98] [99]. These advancements demonstrate how ML integration can enhance not only quantitative analysis but also spatial mapping of chemical components in complex biological systems.
Experimental Protocols and Methodologies
Ridge Regression Model for Concentration Prediction
Objective: To develop a machine learning model for accurate chemical concentration prediction surpassing Beer-Lambert Law limitations.
Materials and Equipment:
- Chemical compounds (e.g., K₂Cr₂O₇, KMnO₄)
- Double-distilled water
- Test tubes (1.2 cm diameter)
- Smartphone with camera or dedicated imaging system
- White background setup
- Computer with Python environment (scikit-learn)
Procedure:
- Sample Preparation: Prepare stock solutions (e.g., 1.0 × 10⁻² M K₂Cr₂O₇ by dissolving 0.74 g in 250 mL distilled water). Dilute to desired concentrations using molarity equation [95].
- Image Acquisition: Place test tubes containing 3 mL solution in holder with white background. Capture images from fixed distance (30 cm) with constant camera magnification (×5) and dimensions (3000 × 3000 pixels) [95].
- Image Preprocessing: Convert high-resolution images to 20 × 20 pixel format using bulk image cropping tool. Convert RGB images to grayscale using code:
np.dot(rgb[...,:3], [0.2989, 0.5870, 0.1140])[95]. - Dataset Construction: Flatten 2D grayscale arrays into feature vectors. Divide dataset into training (80%) and testing (20%) sets using
train_test_splitfunction [95]. - Model Training: Implement ridge regression with L2 regularization. Optimize hyperparameters to prevent overfitting. Validate model using k-fold cross-validation.
- Performance Evaluation: Calculate MAE, MSE, and RMSE metrics to quantify prediction accuracy against known concentrations.
Molar Mass Coefficient Method for Multi-Component Analysis
Objective: To simultaneously quantify multiple components in complex mixtures using a single reference standard.
Materials and Equipment:
- Standard reference compounds (e.g., complanatoside, rutin, baicalin)
- HPLC system with UV-Vis detector
- Appropriate mobile phases and columns
- Sample solutions of unknown concentration
Procedure:
- System Suitability: Confirm that target components share the same chromophore group. Verify using UV spectra [96].
- Reference Standard Preparation: Prepare calibration solutions of the reference substance across concentration range of interest.
- MMC Calculation: For each target component, calculate the Molar Mass Coefficient using the formula derived from BLL principles [96].
- Chromatographic Analysis: Perform HPLC separation under optimized conditions. Ensure baseline resolution of target peaks.
- Quantification: Apply the established MMC values to quantify all target components based on their peak areas using the single reference standard.
- Method Validation: Verify accuracy, precision, robustness, and comparison with external standard method [96].
Dimensionality Reduction for Spectral Optimization
Objective: To accelerate design optimization in complex photonic systems using dimensionality reduction.
Materials and Equipment:
- Numerical simulation capability (e.g., Synopsys Sentaurus TCAD, S4 RCWA solver)
- Python environment with scikit-learn
- Dataset of design parameters and corresponding performance metrics
Procedure:
- Parametric Modeling: Generate comprehensive dataset of design variations and corresponding performance characteristics through simulation [97].
- Feature Reduction: Apply Principal Component Analysis (PCA) to identify the most significant dimensions in the design space [97].
- Subspace Mapping: Project high-dimensional design space onto reduced-dimensionality subspace capturing essential patterns [97].
- Optimization in Reduced Space: Perform efficient parameter sweeps and multi-objective optimization in the reduced-dimensionality space [97].
- Validation: Verify optimized designs using full physical simulations. Compare results with classical optimization approaches.
Data Presentation and Analysis
Quantitative Performance Comparison
Table 1: Performance Metrics of Machine Learning versus Traditional Beer-Lambert Law Approaches
| Method | Application | Performance Metrics | Linearity Range | Key Advantages |
|---|---|---|---|---|
| Ridge Regression ML Model [95] | K₂Cr₂O₇ Solution Concentration | MAE: 1.4×10⁻⁵, MSE: 3.4×10⁻¹⁰, RMSE: 1.0×10⁻⁵ | Extended beyond BLL deviation point | Overcomes BLL linearity limits; minimal expertise required |
| Traditional BLL Calibration [95] | K₂Cr₂O₇ Solution Concentration | Deviation from linearity >3.0×10⁻⁴ M | Limited to lower concentrations | Established methodology; simple implementation |
| MMC Method [96] | Flavonoid Multicomponent Analysis | Accuracy comparable to external standard method | Maintains linearity comparable to BLL | Single reference standard for multiple components; reduced cost |
| Dimensionality Reduction Optimization [97] | Photonic Power Converter Design | 20× more optimal designs; 15% reduced computational cost | Not applicable | Design space insight; accelerated discovery |
Research Reagent Solutions and Essential Materials
Table 2: Key Research Reagents and Materials for Advanced Spectroscopic Methods
| Reagent/Material | Specification | Function | Application Examples |
|---|---|---|---|
| K₂Cr₂O₇ (Potassium Dichromate) [95] | Analytical Grade, Crystalline | Model compound for ML concentration prediction | Testing ML model performance against BLL |
| KMnO₄ (Potassium Permanganate) [95] | Analytical Grade, Crystalline | Additional validation compound | Confirming model generalizability |
| Flavonoid Standards [96] | High Purity (≥98%) | Reference compounds for MMC method | Multi-component analysis of complex mixtures |
| Scutellariae Radix Extract [96] | Authenticated Source | Complex real-world sample | Validation of MMC method in herbal medicine |
| HPLC-UV System [96] | Standard Configuration | Separation and detection | Multi-component quantitative analysis |
| Smartphone Imaging System [95] | Fixed Distance (30 cm), White Background | Data acquisition for ML | Digital image-based concentration prediction |
| Python/scikit-learn [97] [95] | Current Version | ML algorithm implementation | Ridge regression, dimensionality reduction |
Workflow Visualization
Machine Learning Concentration Prediction
Molar Mass Coefficient Analysis
The integration of machine learning with spectroscopic analysis represents a paradigm shift in quantitative spectroscopy, offering solutions to fundamental limitations of the Beer-Lambert Law. Current research demonstrates that ML approaches can extend concentration quantification beyond traditional linearity limits, enable multi-component analysis with reduced reference standards, and accelerate design optimization in complex photonic systems [97] [95] [96].
Future developments will likely focus on several key areas: (1) creating standardized benchmark datasets to address current data scarcity issues; (2) developing ML frameworks that achieve high performance with minimal training data; (3) enhancing model interpretability for clinical and regulatory applications; and (4) integrating these advanced analytical capabilities into portable, field-deployable devices [98]. The continued synergy between spectroscopy, machine learning, and nanotechnology will further refine diagnostic accuracy and open new avenues for research and application [99].
In conclusion, while the Beer-Lambert Law remains foundational to understanding light-matter interactions, its advanced extensions through multi-component analysis and machine learning integration are expanding the boundaries of quantitative spectroscopy. These methodologies provide researchers and drug development professionals with powerful tools to address increasingly complex analytical challenges, from intricate biological systems to advanced materials design, ushering in a new era of spectroscopic analysis characterized by enhanced accuracy, efficiency, and insight.
Conclusion
The Beer-Lambert Law remains an indispensable, yet nuanced, tool in the analytical scientist's arsenal. A deep understanding of its foundational principles, combined with a rigorous approach to methodological application and a critical awareness of its limitations, is paramount for generating valid data in drug development and clinical research. The future of quantitative spectroscopy lies in the intelligent application of modified laws for complex biological systems and the integration of computational methods like machine learning to model non-ideal behaviors, thereby extending the utility of this classic law to solve tomorrow's analytical challenges.
References
- 1. Beer–Lambert law [https://en.wikipedia.org/wiki/Beer%E2%80%93Lambert_law]
- 2. The Bouguer‐Beer‐Lambert Law: Shining Light on the ... [https://pmc.ncbi.nlm.nih.gov/articles/PMC7540309/]
- 3. beyond the Bouguer–Beer–Lambert law | Discover Chemistry [https://link.springer.com/article/10.1007/s44371-025-00214-y]
- 4. Understanding the Limits of the Bouguer-Beer-Lambert Law [https://www.spectroscopyonline.com/view/understanding-the-limits-of-the-bouguer-beer-lambert-law]
- 5. Lambert Law - an overview [https://www.sciencedirect.com/topics/engineering/lambert-law]
- 6. Derivation of Beer Lambert Law [https://byjus.com/physics/derivation-of-beer-lambert-law/]
- 7. The Beer-Lambert Law [https://chem.libretexts.org/Bookshelves/Physical_and_Theoretical_Chemistry_Textbook_Maps/Supplemental_Modules_(Physical_and_Theoretical_Chemistry)/Spectroscopy/Electronic_Spectroscopy/Electronic_Spectroscopy_Basics/The_Beer-Lambert_Law]
- 8. Beer-Lambert Law | Transmittance & Absorbance [https://www.edinst.com/resource/the-beer-lambert-law/]
- 9. Derivation of Beer-Lambert Law [https://www.geeksforgeeks.org/physics/derivation-of-beer-lambert-law/]
- 10. 5.2: Beer's Law and Integrated Rate Law Lab [https://chem.libretexts.org/Courses/University_of_Arkansas_Little_Rock/000%3AChem_1403L_General_Chemistry_Lab/05%3A_kinetics_-_Integrated_Rate_Laws/5.2%3A_Beer's_Law_and_Integrated_Rate_Law_Lab]
- 11. Modeling systematic errors: polychromatic sources of Beer ... [https://www.sciencedirect.com/science/article/abs/pii/S0731708501003429]
- 12. An empirical investigation of deviations from the Beer ... [https://www.nature.com/articles/s41598-021-92850-4]
- 13. Quantitative Solid-State NMR Spectroscopy (qSSNMR) in ... [https://pmc.ncbi.nlm.nih.gov/articles/PMC12379110/]
- 14. What is “molar absorptivity”? [https://www.ssi.shimadzu.com/service-support/faq/uv-vis/light-and-theory/9/index.html]
- 15. Experimental validation of lambert-beer's law: Principles ... [https://deepscienceresearch.com/dsr/catalog/book/107/chapter/408]
- 16. Quantitative NMR spectroscopy in pharmaceutical ... [https://www.sciencedirect.com/science/article/abs/pii/S0079656510000506]
- 17. Quantitative Analysis Using Raman Spectroscopy in ... [https://www.horiba.com/usa/scientific/applications/pharmaceutical/pages/quantitative-analysis-using-raman-spectroscopy-in-pharmaceutical-applications/]
- 18. Multivariate methods and advanced pre-processing [https://community.jmp.com/t5/JMP-Blog/Analyzing-spectral-data-Multivariate-methods-and-advanced-pre/ba-p/390296]
- 19. Absorbance and Transmittance [https://www.sarspec.com/spectroscopy-techniques/absorbance-and-transmittance]
- 20. Quantitative Spectrophotometry and Beer's Law (Experiment) [https://chem.libretexts.org/Courses/University_of_California_Davis/Chem_4A_Lab%3A_General_Chemistry_for_Majors_I/Chem_4A%3A_Laboratory_Manual/10_7%3A_Quantitative_Spectrophotometry_and_Beer's_Law_(Experiment)]
- 21. OD, Absorbance & Transmittance: Key Concepts in ... [https://byonoy.com/journal/understanding-od-absorbance-transmittance-spectrophotometry/]
- 22. IR Spectrum | Table of IR Spectroscopy Values [https://chemistrytalk.org/ir-spectrum-values/]
- 23. 13.1: The Electromagnetic Spectrum [https://chem.libretexts.org/Courses/Pacific_Union_College/Quantum_Chemistry/13%3A_Molecular_Spectroscopy/13.01%3A_The_Electromagnetic_Spectrum]
- 24. 7.1 Electromagnetic spectrum and molecular energy levels [https://fiveable.me/molecular-physics/unit-7/electromagnetic-spectrum-molecular-energy-levels/study-guide/8Mf5KpZUPq8vd0H8]
- 25. 13.18: The Beer-Lambert Law [https://chem.libretexts.org/Bookshelves/Organic_Chemistry/Map%3A_Organic_Chemistry_(Bruice)/13%3A_Mass_Spectrometry_Infrared_Spectroscopy_and_Ultraviolet_Visible_Spectroscopy/13.18%3A_The_Beer-Lambert_Law]
- 26. Molecular electronic transition [https://en.wikipedia.org/wiki/Molecular_electronic_transition]
- 27. Beer-Lambert's Law: Principles and Applications in Daily Life [https://www.findlight.net/blog/beer-lamberts-law-explained-applications/]
- 28. Beer-Lambert Law - an overview [https://www.sciencedirect.com/topics/engineering/beer-lambert-law]
- 29. Insight into the Bouguer-Beer-Lambert Law: A review [https://www.semanticscholar.org/paper/cec9983b225175355cb51ab650ddebec245a3409]
- 30. Beer-Lambert Law Spectrophotometer [https://www.hinotek.com/an-in-depth-analysis-of-the-beer-lambert-law-spectrophotometer/]
- 31. Smart green spectrophotometric estimation and content ... [https://www.nature.com/articles/s41598-025-92166-7]
- 32. Ultraviolet Detectors: Perspectives, Principles, and Practices [https://www.chromatographyonline.com/view/ultraviolet-detectors-perspectives-principles-and-practices]
- 33. 3.13 Beer-Lambert Law - AP Chem [https://fiveable.me/ap-chem/unit-3/beer-lambert-law/study-guide/smCHzraorVz6qlWW1oeB]
- 34. Ultraviolet–visible spectroscopy [https://en.wikipedia.org/wiki/Ultraviolet%E2%80%93visible_spectroscopy]
- 35. Using UV-visible Absorption Spectroscopy [https://chem.libretexts.org/Bookshelves/Physical_and_Theoretical_Chemistry_Textbook_Maps/Supplemental_Modules_(Physical_and_Theoretical_Chemistry)/Spectroscopy/Electronic_Spectroscopy/Electronic_Spectroscopy_Basics/Using_UV-visible_Absorption_Spectroscopy]
- 36. The Beer-Lambert Law and Spectrophotometric Analysis [https://stevesopenlab.org/the-beer-lambert-law-and-spectrophotometric-analysis/]
- 37. Beer Lambert Calculator [https://www.alfa-chemistry.com/resources/beer-lambert-calculator.html]
- 38. Optical density and absorbance measurements [https://www.bmglabtech.com/en/blog/optical-density-for-absorbance-assays/]
- 39. What is Absorbance, Absorbance Measurement and Assays [https://www.moleculardevices.com/technology/absorbance]
- 40. The Lambert-Beer law in time domain form and its application [https://www.sciencedirect.com/science/article/abs/pii/S0969804317300878]
- 41. Protein concentration of the active pharmaceutical ingredient ( API ) [https://www.manufacturingchemist.com/news/article_page/Protein_concentration_of_the_active_pharmaceutical_ingredient_API/171294]
- 42. Emerging analytical techniques for pharmaceutical quality ... [https://www.sciencedirect.com/science/article/pii/S0731708522004927]
- 43. Common Methods of Drug Analysis [https://www.bocsci.com/blog/common-methods-of-drug-analysis/?srsltid=AfmBOor1Mec-Ekina7fG9xOAYMc-yEiLgQSrKZzBVnijyBOp7tAV5SeY]
- 44. Newly Added Guidance Documents [https://www.fda.gov/drugs/guidances-drugs/newly-added-guidance-documents]
- 45. Technical Considerations for Use of Oligonucleotide Solution API - PMC [https://pmc.ncbi.nlm.nih.gov/articles/PMC7415879/]
- 46. - Beer Derivation, Formula & Lambert Explained Law Applications [https://www.vedantu.com/physics/derivation-of-beer-lambert-law]
- 47. ’s Beer | Definition, Equation, & Facts | Britannica law [https://www.britannica.com/science/Beers-law]
- 48. Pulse Oximetry - StatPearls - NCBI Bookshelf - NIH [https://www.ncbi.nlm.nih.gov/books/NBK470348/]
- 49. Pulse Oximetry: Function, Method & Readings [https://my.clevelandclinic.org/health/diagnostics/pulse-oximetry]
- 50. Pulse Oximetry | Fact Sheets [https://www.yalemedicine.org/conditions/pulse-oximetry]
- 51. A critical review of the analytical performance of the most ... [https://www.sciencedirect.com/science/article/pii/S0165993624002966]
- 52. The Essentials of Analytical Spectroscopy: Theory and ... [https://www.spectroscopyonline.com/view/the-essentials-of-analytical-spectroscopy-theory-and-applications]
- 53. Machine learning spectroscopy to advance computation ... [https://pmc.ncbi.nlm.nih.gov/articles/PMC12590498/]
- 54. A machine learning tool to analyse spectroscopic changes ... [https://www.sciencedirect.com/science/article/pii/S0141813025086520]
- 55. How to Use Venn Diagrams in Omics: Interpretation, Tools, ... [https://www.creative-proteomics.com/blog/venn-diagrams-in-omics-analysis.htm]
- 56. An adaptive absorption spectroscopy with adjustable ... [https://www.sciencedirect.com/science/article/abs/pii/S1386142523002354]
- 57. Non-linear regression methods in NIRS quantitative analysis [https://www.sciencedirect.com/science/article/abs/pii/S0039914006007119]
- 58. 9.3: Interferences in Absorption Spectroscopy [https://chem.libretexts.org/Bookshelves/Analytical_Chemistry/Instrumental_Analysis_(LibreTexts)/09%3A_Atomic_Absorption_and_Atomic_Fluorescence_Spectrometry/9.03%3A_Interferences_in_Absorption_Spectroscopy]
- 59. Correction of complex nonlinear signal response from a ... [https://pmc.ncbi.nlm.nih.gov/articles/PMC4416674/]
- 60. Correcting Ultraviolet-Visible Spectra for Baseline Artifacts [https://www.sciencedirect.com/science/article/pii/S0022354923003350]
- 61. Baseline Correction | Technical Note 119 [https://www.denovix.com/tn-119-baseline-correction/]
- 62. 1.2: Beer's Law [https://chem.libretexts.org/Bookshelves/Analytical_Chemistry/Molecular_and_Atomic_Spectroscopy_(Wenzel)/1%3A_General_Background_on_Molecular_Spectroscopy/1.2%3A_Beers_Law]
- 63. Beer Lambert Law [https://www.ossila.com/pages/beer-lambert-law]
- 64. Deviations from Beers law | PPTX [https://www.slideshare.net/slideshow/deviations-from-beers-law/250170623]
- 65. Beer Law - an overview [https://www.sciencedirect.com/topics/earth-and-planetary-sciences/beer-law]
- 66. Study on the origin of linear deviation with the Beer ... [https://www.sciencedirect.com/science/article/abs/pii/S1386142522003419]
- 67. Exploring spectrophotometer applications [https://www.rdworldonline.com/spectrophotometer-applications-in-research-and-development/]
- 68. What is Stray light and how it is monitored? [https://lab-training.com/what-is-stray-light-and-how-it-is-monitored/]
- 69. Quantifying the effect of finite spectral bandwidth on ... [https://www.sciencedirect.com/science/article/abs/pii/S002228521630251X]
- 70. Beer–Lambert law for optical tissue diagnostics [https://pmc.ncbi.nlm.nih.gov/articles/PMC8553265/]
- 71. Light scattering methods for tissue diagnosis - PMC [https://pmc.ncbi.nlm.nih.gov/articles/PMC7544148/]
- 72. Mechanisms of light scattering from biological cells ... [https://opg.optica.org/abstract.cfm?uri=ao-37-16-3586]
- 73. Optical Tomography and Spectroscopy of Tissue XVI | (2025) [https://www.spie.org/Publications/Proceedings/Volume/13314]
- 74. Quantitative Stimulated Raman Scattering Microscopy [https://pmc.ncbi.nlm.nih.gov/articles/PMC10083020/]
- 75. Quantitative Analysis Using Surface-enhanced Raman ... [https://www.spectroscopyonline.com/view/quantitative-analysis-using-surface-enhanced-raman-scattering-sers-roy-goodacre-the-2021-winner-of-the-charles-mann-award-for-applied-raman-spectroscopy]
- 76. 3.4 Interference in Thin Films - University Physics Volume 3 [https://openstax.org/books/university-physics-volume-3/pages/3-4-interference-in-thin-films]
- 77. Thin-film interference [https://en.wikipedia.org/wiki/Thin-film_interference]
- 78. Ultrathin liquid sheets: water gets in shape for VUV ... [https://pubs.rsc.org/en/content/articlehtml/2025/cp/d4cp04619f]
- 79. The Most Important Equation in Potency Analysis is Beer's ... [https://www.cannabissciencetech.com/view/the-most-important-equation-in-potency-analysis-is-beers-law-an-introduction]
- 80. Spectroscopic Sample Preparation: Techniques for ... [https://www.metkon.com/spectroscopic-sample-preparation/]
- 81. New Raman Spectroscopy Method Boosts Drug ... [https://www.spectroscopyonline.com/view/new-raman-spectroscopy-method-boosts-drug-component-detection-accuracy-and-speed]
- 82. ICH Q2(R2) Validation of analytical procedures [https://www.ema.europa.eu/en/ich-q2r2-validation-analytical-procedures-scientific-guideline]
- 83. Validation of a quantitative cell-based relative potency ... [https://www.sciencedirect.com/science/article/pii/S232905012500018X]
- 84. Modified Beer-Lambert Law [https://openfnirs.org/2024/01/01/modified-beer-lambert-law/]
- 85. Modified Beer-Lambert law for blood flow - PMC [https://pmc.ncbi.nlm.nih.gov/articles/PMC4242038/]
- 86. Photon path distribution in inhomogeneous turbid media [https://opg.optica.org/abstract.cfm?uri=josaa-19-7-1383]
- 87. Optical Characterization of Two-Layered Turbid Media for Non ... [https://journals.plos.org/plosone/article?id=10.1371/journal.pone.0064095]
- 88. Modified Beer-Lambert law for blood flow [https://opg.optica.org/boe/abstract.cfm?uri=boe-5-11-4053]
- 89. Differential pathlength factor in continuous wave functional ... [https://pmc.ncbi.nlm.nih.gov/articles/PMC6689143/]
- 90. Effect of adipose tissue thickness and tissue optical ... [https://pmc.ncbi.nlm.nih.gov/articles/PMC7899498/]
- 91. Effect of adipose tissue thickness and tissue optical ... [https://opg.optica.org/boe/abstract.cfm?uri=boe-12-1-571]
- 92. Investigation and comparison on the interaction of laser ... [https://www.frontiersin.org/journals/physics/articles/10.3389/fphy.2024.1407471/full]
- 93. Verification of the Beer-Lambert Law Using Diluted Tomato ... [https://arxiv.org/html/2509.04163v1]
- 94. Comparative analysis of Monte Carlo simulations and ... [https://www.nature.com/articles/s41598-025-14223-5]
- 95. Machine Learning Approaches to Surpass the Limitations ... [https://pmc.ncbi.nlm.nih.gov/articles/PMC12044575/]
- 96. An accurate and robust multicomponent quantitative ... [https://www.sciencedirect.com/science/article/abs/pii/S0021967324010173]
- 97. Machine learning enhanced design and knowledge ... [https://www.nature.com/articles/s41598-025-16408-4]
- 98. Machine Learning Advances Spectroscopic Imaging in ... [https://www.spectroscopyonline.com/view/machine-learning-advances-spectroscopic-imaging-in-biomedical-research]
- 99. Recent research progress in the integration of Raman ... [https://www.sciopen.com/article/10.26599/NR.2025.94907834]