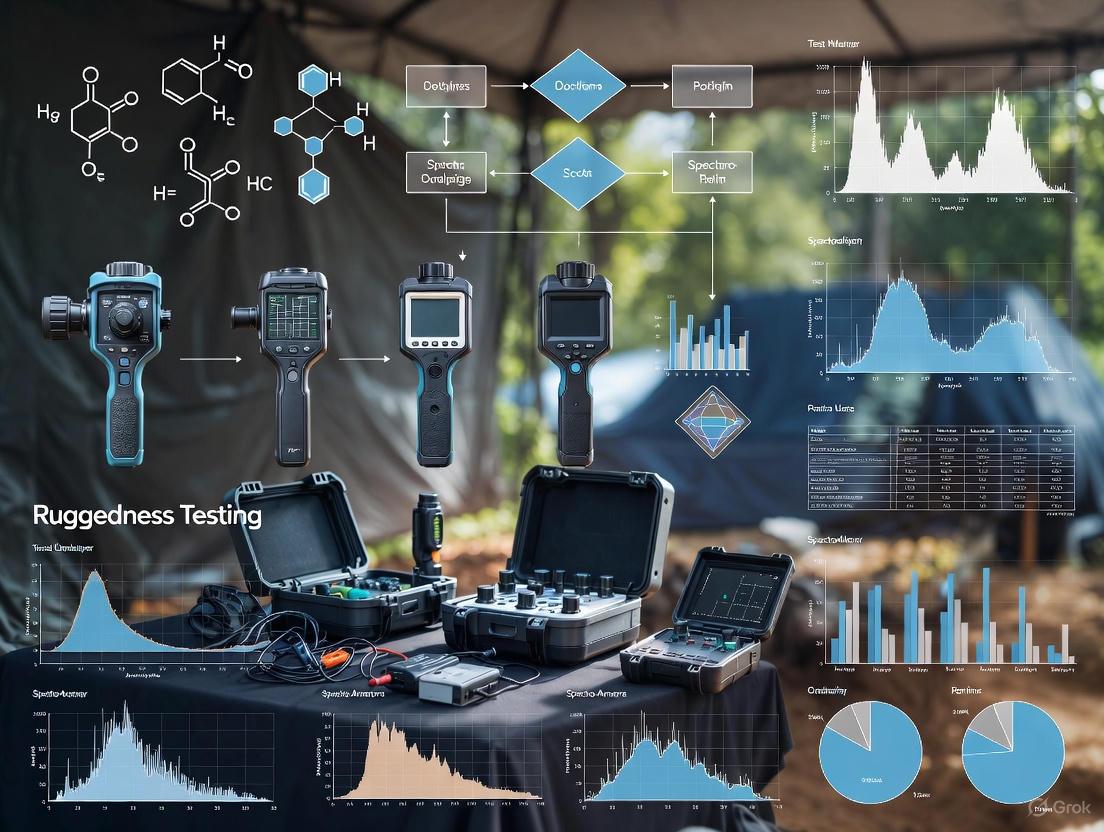
Beyond the Lab: Rigorous Ruggedness Testing of Handheld Spectrometers for Demanding Field Conditions
This article provides a comprehensive framework for researchers, scientists, and drug development professionals to evaluate the ruggedness and reliability of handheld spectrometers in real-world field conditions.
Beyond the Lab: Rigorous Ruggedness Testing of Handheld Spectrometers for Demanding Field Conditions
Abstract
This article provides a comprehensive framework for researchers, scientists, and drug development professionals to evaluate the ruggedness and reliability of handheld spectrometers in real-world field conditions. It explores the foundational standards defining ruggedness, details methodological approaches for application-specific testing, offers strategies for troubleshooting and optimizing device performance, and establishes protocols for the validation and comparative analysis of different spectrometer technologies. The insights herein are critical for ensuring data integrity, operational safety, and analytical confidence in biomedical and clinical research applications outside the controlled laboratory environment.
Defining Ruggedness: The Critical Standards and Specifications for Field-Ready Spectrometers
For researchers and scientists deploying analytical instruments in the field, understanding ruggedness standards is not merely an exercise in technical compliance—it is a critical component of experimental design and data integrity. Handheld spectrometers, used in applications from pharmaceutical raw material identification to environmental analysis, are increasingly deployed outside the controlled laboratory environment. These field conditions introduce variables such as rain, dust, shock, and extreme temperatures that can compromise instrument function and render data unreliable.
The IP (Ingress Protection) rating and MIL-STD-810H standard provide a quantifiable and internationally recognized framework for evaluating an instrument's ability to withstand these challenges. For drug development professionals conducting clinical trials or raw material verification in remote locations, specifying instruments that meet these standards is essential for ensuring that results are reproducible, accurate, and defensible.
IP Ratings: Decoding Ingress Protection
The International Electrotechnical Commission (IEC) developed the IP Code to provide a clear, standardized classification for the level of protection an electrical enclosure offers against the intrusion of solids and liquids. Vague marketing terms like "water-resistant" or "durable" are replaced with a precise, two-digit code that allows for objective comparison [1] [2].
The IP Code Structure
The IP code follows a simple format: "IP" followed by two digits (e.g., IP67). The first digit indicates protection against solid particles, and the second digit denotes protection against moisture. If a product is not tested for one of these categories, the digit is replaced with an "X" (e.g., IP6X means dust-tight but not rated for moisture) [1].
The tables below provide a detailed breakdown of each digit's meaning, which is essential for assessing a spectrometer's suitability for specific field conditions, such as a windy, sandy desert or a humid, rainy climate.
Table: First Digit - Solid Particle Protection
| Level | Effective Against | Description |
|---|---|---|
| 0 | — | No protection. |
| 1 | >50 mm | Large body surfaces, like hands. |
| 2 | >12.5 mm | Fingers or similar objects. |
| 3 | >2.5 mm | Tools, thick wires. |
| 4 | >1 mm | Most wires, screws, large ants. |
| 5 | Dust Protected | Dust ingress is not entirely prevented, but it cannot enter in sufficient quantity to interfere with operation. |
| 6 | Dust Tight | No dust ingress; complete protection against contact. |
Table: Second Digit - Liquid Ingress Protection
| Level | Effective Against | Description |
|---|---|---|
| 0 | — | No protection. |
| 1 | Dripping water | Vertically falling drops (e.g., condensation). |
| 2 | Dripping water (tilted) | Vertically dripping water when enclosure is tilted up to 15°. |
| 3 | Spraying water | Water sprayed at any angle up to 60° from vertical. |
| 4 | Splashing water | Water splashed from any direction. |
| 5 | Water jets | Water projected by a nozzle (6.3mm) from any direction. |
| 6 | Powerful water jets | Water projected in powerful jets (12.5mm nozzle) from any direction. |
| 7 | Immersion (1m) | Ingress of water is not possible when immersed under defined conditions (up to 1m for 30 min). |
| 8 | Immersion (>1m) | Suitable for continuous immersion under conditions specified by the manufacturer. |
Application in Spectrometry
In handheld spectrometry, common ratings include IP65, which offers complete dust protection and resistance to low-pressure water jets, and IP67, which adds the ability to withstand temporary immersion. For instance, the Viavi MicroNIR OnSite-W spectrometer carries an IP67 rating, meaning it is dust-tight and can be submerged in water, making it viable for wet agricultural or pharmaceutical manufacturing environments [3]. Similarly, the Metrohm TacticID-1064 ST Raman spectrometer boasts an IP68 rating, offering a higher level of protection against prolonged immersion [4].
MIL-STD-810H: The Standard for Environmental Durability
While IP ratings focus on ingress protection, MIL-STD-810H is a comprehensive U.S. military standard that covers a wide range of environmental conditions. It is crucial to understand that this standard is a set of test methods rather than a pass/fail certification. The philosophy behind MIL-STD-810H is to engineer a product to withstand the specific environmental stresses it will encounter throughout its life cycle, and then use the standard's methods to verify that durability [5].
Key Test Methods and Their Research Implications
The standard includes numerous laboratory test methods designed to simulate conditions such as low pressure at high altitude, extreme temperatures, shock, vibration, and exposure to fungi or salt fog [1] [2]. For a handheld spectrometer used in field research, several of these tests are particularly relevant.
Table: Key MIL-STD-810H Test Methods for Handheld Spectrometers
| Test Method | Simulated Condition | Impact on Field Research |
|---|---|---|
| Method 500.6 - Low Pressure | High altitude (up to 12,000 m) [5]. | Ensures functionality during aerial surveys or work at high elevations. |
| Method 501.7 - High Temperature | Operation in hot, arid environments [5]. | Prevents data loss or instrument shutdown in desert climates or hot industrial settings. |
| Method 502.7 - Low Temperature | Operation in cold arctic environments [5]. | Ensures reliability in cold storage or outdoor winter conditions. |
| Method 503.7 - Temperature Shock | Rapid temperature transitions [5]. | Validates performance when moving between climate-controlled labs and harsh field environments. |
| Method 506.6 - Rain | Wind-blown and freezing rain [5]. | Protects the instrument during unexpected weather, common in outdoor data collection. |
| Method 507.5 - Humidity | Humid, tropical conditions [5]. | Prevents fungal growth and moisture damage to internal electronics and optics. |
| Method 510.7 - Sand & Dust | Dusty and sandy environments [5]. | Critical for archaeology, geology, and mining applications to avoid instrument failure. |
| Method 514.8 - Vibration | Vehicle-induced vibration during transport [5]. | Maintains optical alignment and component integrity when the device is used in a moving vehicle. |
| Drop Test (MIL-STD-810H) | Repeated drops from typically 4 feet onto hard surfaces [1]. | Ensures the device survives accidental drops, a common occurrence during mobile use. |
Products like the Viavi MicroNIR OnSite-W and the Metrohm TacticID-1064 ST are tested compliant with MIL-STD-810, providing researchers with confidence in their mechanical robustness against shock and vibration [3] [4].
Comparative Analysis of Spectrometer Ruggedness
The true value of these standards becomes apparent when comparing different handheld spectrometers. For example, a spectrometer with an IP65 rating is well-suited for general outdoor use where it might be exposed to rain and dust, while one with an IP68 rating is necessary for applications requiring submersion, such as in marine research or where decontamination via full immersion is needed.
The following diagram illustrates the logical decision-making process for selecting a spectrometer based on its ruggedness specifications, directly linking environmental threats to the required standards.
Case Studies: Rugged Spectrometers in Action
Viavi MicroNIR OnSite-W Spectrometer: This near-infrared instrument is a prime example of a device built for harsh environments. It holds an IP67 rating, meaning it is dust-tight and can be temporarily immersed in water. Furthermore, it carries a MIL-PRF-28800F Class 2 rating for shock and vibration, making it a robust tool for agricultural, pharmaceutical, and manufacturing field applications [3].
Metrohm TacticID-1064 ST Handheld Raman Spectrometer: Designed for first responders and HazMat teams—arguably one of the most demanding field environments—this device is built to the highest standards. It features an IP68 rating for superior dust and water protection and is MIL-STD-810H drop compliant, ensuring it can survive the rigors of tactical use [4]. Its ability to identify chemicals through containers is a critical safety feature for drug development professionals handling unknown or hazardous substances.
Experimental Protocols for Ruggedness Testing
Understanding the laboratory protocols behind these standards is vital for appreciating the level of durability they represent. The tests are designed to be rigorous and repeatable.
Protocol: IP67 Testing
- Dust Ingress Test (First Digit: 6): The device is placed in a test chamber containing circulating fine dust. The test lasts up to 8 hours, and a vacuum may be applied. After testing, the device must show no dust ingress that would interfere with its operation [1].
- Water Immersion Test (Second Digit: 7): The device is immersed in water to a depth of 1 meter for 30 minutes. The manufacturer must specify whether this is done with the device in its normal operating position or in various orientations. After immersion, the enclosure must show no harmful ingress of water [1] [2].
Protocol: MIL-STD-810H Drop Test
- Procedure: The device is subjected to a series of 26 drops from a height of 4 feet (approx. 1.2 meters) onto a hard surface, such as plywood over concrete. The drops are performed at different angles and orientations to simulate real-world accidents. The device is inspected for damage after each drop [1].
- Pass/Fail Criterion: The device must remain fully functional with no critical damage, such as cracked casings or internal component failures, that would prevent its operation.
Protocol: MIL-STD-810H Temperature Shock
- Procedure: The device is placed in a test chamber where the temperature is cycled rapidly between extreme highs (e.g., +70°C) and lows (e.g., -40°C). One test loop involves 30 minutes at each extreme, and this loop may be repeated 32 times. The device may be tested both in storage and operating conditions [1] [5].
- Pass/Fail Criterion: The device must power on and operate normally after the test, with no physical damage or performance degradation caused by the thermal stress.
Essential Research Reagent Solutions for Field Spectrometry
Deploying spectrometry in the field requires more than just a rugged instrument. It involves a suite of tools and reagents to ensure data quality and operational efficiency. The following table details key solutions for researchers in this domain.
Table: Research Reagent Solutions for Field Spectrometry
| Item / Solution | Function & Application |
|---|---|
| Validation Standards | Certified reference materials (e.g., polystyrene caps) used to validate spectrometer calibration and performance before and after field deployment, ensuring data continuity [4]. |
| Ultrapure Water Systems | Systems like the Milli-Q SQ2 series provide ultrapure water essential for preparing mobile phases, buffers, and for sample dilution and cleaning in the field or mobile labs [6]. |
| Specialized Sampling Accessories | Probes (e.g., immersion, right-angle) and adaptors (e.g., for vials, large bottles) that extend the spectrometer's capability to analyze samples in confined spaces or through containers without direct contact [4]. |
| Customizable Spectral Libraries | Extensive and customizable software libraries of chemical signatures (e.g., for narcotics, explosives, raw materials) that are essential for the rapid and accurate identification of unknown substances on-site [4]. |
| Portable Power Solutions | Swappable, rechargeable Li-ion batteries and external power banks that provide extended operational time (>4-10 hours), which is critical for prolonged data collection sessions away from power sources [3] [4]. |
| Ruggedized Device Management Software | Software suites like MicroNIR Pro or TOS that provide chemometric modeling, user management, and data transfer capabilities (via USB, Wi-Fi, Bluetooth), streamlining the entire field workflow [3] [4]. |
For the modern researcher, the choice of a field-deployable spectrometer must be guided by scientific need and operational reality. IP and MIL-STD-810H ratings provide the critical, objective data required to make an informed decision.
When specifying an instrument, researchers should:
- Identify Environmental Threats: Clearly define the environmental stresses (dust, water immersion, shock, temperature extremes) the instrument will face.
- Match Threats to Standards: Use the IP code and MIL-STD-810H test methods to create a minimum specification. For example, a spectrometer for coastal geology may require IP68 for submersion and MIL-STD-810H, Method 509.8 for salt fog corrosion.
- Verify, Don't Assume: Look for products that state they are "tested compliant" to relevant standards, rather than those vaguely "designed to meet" them.
Ultimately, investing in a properly ruggedized spectrometer is an investment in data integrity. It ensures that the valuable data collected in the field is a true reflection of the sample, and not an artifact of a failed instrument.
For researchers and scientists conducting field analysis, the durability of a handheld spectrometer is as critical as its analytical performance. Unlike controlled laboratory environments, field conditions in drug development, environmental monitoring, and forensic investigation present significant challenges including dust, moisture, mechanical shocks, and temperature fluctuations. Ruggedized design ensures that instruments provide reliable data while withstanding the physical stresses encountered during mobile operation. This guide examines three core design elements—shock resistance, ingress protection, and thermal stability—through the lens of experimental data and standardized testing protocols, providing a framework for evaluating spectrometer durability in field research contexts.
The fundamental shift from benchtop to portable analysis necessitates this focus on physical robustness. As noted in evaluations of handheld spectrometers, their primary advantage lies in enabling "researchers to test materials in the field" without removing specimens from their natural context [7]. This capability, however, comes with the requirement that the instrumentation must maintain functionality and accuracy despite exposure to conditions that would rarely impact laboratory equipment.
Ingress Protection (IP) Standards and Testing
IP Rating Decoding and Specifications
Ingress Protection (IP) ratings, defined by the International Electrotechnical Commission standard IEC 60529, provide a standardized classification for an enclosure's resistance to solid particles and liquids [8]. The rating consists of the letters "IP" followed by two digits: the first digit indicates protection against solids (e.g., dust), while the second digit indicates protection against liquids (e.g., water) [8]. Higher numbers signify better protection.
For handheld spectrometers intended for field use, a minimum of IP54 is often recommended, though more rigorous ratings provide greater assurance in harsh environments. The table below details the significance of each digit in the IP code:
Table: Breakdown of Ingress Protection (IP) Rating Codes
| Digit | Protection Level | Meaning | Testing Specification |
|---|---|---|---|
| First Digit: Solids | 2 | Protection from solids larger than 12.5 mm | Tested with fingers or similar objects [8]. |
| 4 | Protection from solids larger than 1 mm | Tested with wires or strips [8]. | |
| 5 | Dust protected | Ingress of dust is not prevented, but it must not enter in sufficient quantity to interfere with safe operation [8]. | |
| 6 | Dust tight | No dust ingress after 8 hours under vacuum in a dust chamber [8]. | |
| Second Digit: Liquids | 4 | Protection from splashed water | 10-minute spray from low-pressure water jets (50-150 KPa) [8]. |
| 5 | Protection from water jets | 15-minute jet of water at a distance of 3m (30 KPa pressure) [8]. | |
| 6 | Protection from powerful water jets | 3-minute jet of water at a distance of 3m (100 KPa pressure) [8]. | |
| 7 | Protection from immersion | Immersion in water up to 1 meter for 30 minutes [8]. | |
| 8 | Protection from continuous immersion | Immersion under conditions specified by the manufacturer, exceeding IPX7 [8]. |
Experimental Protocols for IP Validation
IP testing is a two-step process. The first step involves exposing the device to standardized challenges. For solids, the device is placed in a dust chamber where calibrated dust is suspended and covers the unit. For liquids, tests range from dripping water and spray to immersion, depending on the targeted rating [8]. The second step is a functional test, which can be a simple optical inspection for damage or a full performance verification to ensure all electronic and optical functions operate normally post-exposure [8].
Specific experimental setups for water ingress include:
- Drip Testing: The device is exposed to rainfall of 1-3 mm/minute for a specified duration [8].
- Spray Testing: Low-pressure water jets (50-150 KPa) spray the enclosure from all angles for 5-10 minutes [8].
- Immersion Testing: The device is submerged in water to a depth of 1 meter for 30 minutes for IPX7 certification [8].
Comparative Performance Data
Instrument manufacturers design products to meet specific IP grades based on intended use cases. For instance, Hach's DR6000 laboratory spectrophotometer has an IP-20 rating, meaning it is protected against solid objects larger than 12.5mm but has no specific protection against water, making it unsuitable for field use [9]. In contrast, the company's DR1900 portable spectrophotometer is marketed as "waterproof" and built for "demanding, rugged conditions," implying a significantly higher, though unspecified, IP rating suitable for field deployment [9].
Figure 1: Ingress Protection (IP) Testing Workflow. The process involves standardized exposure to solids and liquids, followed by a functional performance check.
Thermal Stability Characterization
Fundamentals of Thermal Stability
Thermal stability in spectrometers refers to an instrument's ability to maintain accurate calibration and component integrity across a range of operating temperatures. For the device itself, this involves the resilience of mechanical structures, electronics, and optical components to thermal expansion and stress. Furthermore, from an application standpoint, thermal stability is a critical parameter for the samples being analyzed, particularly in biologics development where it directly impacts therapeutic efficacy [10].
Advanced instruments like the Prometheus Panta characterize thermal stability by monitoring several key parameters during a controlled temperature ramp:
- Melting Temperature (Tm): The temperature at which 50% of a protein is unfolded [10].
- Onset of Unfolding (Tonset): The temperature at which unfolding begins, with higher values indicating greater thermostability [10].
- Onset of Aggregation (Turbidity): The temperature at which large, amorphous aggregates begin to form, which can compromise drug safety and efficacy [10].
Experimental Protocols for Thermal Analysis
Thermal stability assessment involves both the characterization of the spectrometer's operational limits and the analysis of samples it is designed to study.
For evaluating the device's own thermal performance, tests are conducted in environmental chambers where temperature is cycled between specified extremes while the instrument's analytical performance is monitored against known standards. Key metrics include wavelength accuracy, photometric stability, and signal-to-noise ratio.
For sample analysis, a standard protocol using a tool like the Prometheus Panta involves:
- Sample Loading: Loading a small volume (e.g., 10 µL) of the biologic sample into a capillary tube [10].
- Thermal Ramp: Subjecting the sample to a controlled, continuous temperature increase [10].
- Multi-Parameter Monitoring: Simultaneously collecting data on thermal unfolding via intrinsic fluorescence (nanoDSF), particle size via Dynamic Light Scattering (DLS), and aggregation via backreflection and Static Light Scattering (SLS) throughout the entire thermal ramp [10].
- Data Analysis: Determining key stability parameters (Tm, Tonset, Tsize, Tturbidity) from the collected data to compare the relative stability of different candidates or formulations [10].
Table: Key Thermal Stability Parameters in Biologics Development
| Parameter | Symbol | Description | Significance in Development |
|---|---|---|---|
| Melting Temperature | Tm | Temperature at which 50% of the protein is unfolded [10]. | Higher Tm generally indicates a more thermostable candidate, preferred for development [10]. |
| Unfolding Onset | Tonset | Temperature at which unfolding begins [10]. | Candidates with Tonset close to Tm are more uniformly folded and stable [10]. |
| Aggregation Onset | Tturbidity | Onset temperature for large aggregate formation [10]. | High Tturbidity or no aggregation is desired for safety and efficacy [10]. |
| Size Increase Onset | Tsize | Temperature at which average particle size begins to increase [10]. | Indicates unfolding and colloidal stability; higher Tsize indicates greater stability [10]. |
Case Study: Predictive Thermal Hazard Analysis
Thermal stability kinetics can be used to predict large-scale hazards. In a study on HTPE solid propellants, thermal decomposition kinetic parameters were calculated from small-scale Differential Scanning Calorimetry (DSC) data. These parameters were then used in simulation software to predict behavior in larger scales. The model accurately predicted a self-accelerating decomposition temperature of 94.2°C for a 50 kg-scale propellant, demonstrating a deviation of less than 2% from experimental results [11]. This highlights how controlled, small-scale thermal stability testing can reliably predict performance and hazards in real-world, large-scale scenarios.
Figure 2: Multi-Parameter Thermal Stability Workflow. A single sample provides conformational and colloidal stability data through simultaneous measurement techniques.
Shock Resistance and Mechanical Durability
Defining Shock Resistance
Shock resistance refers to a spectrometer's ability to withstand sudden impacts, drops, and vibrations without suffering functional degradation or physical damage. While specific standardized testing protocols for handheld spectrometers were not detailed in the search results, the general principle involves designing instruments with ruggedized enclosures and internal mounting systems that protect sensitive optical and electronic components from mechanical shocks.
The importance of this characteristic is implicitly acknowledged in product descriptions, such as the DR1900 portable spectrophotometer which is noted for its "rugged, compact" design built for "demanding, rugged conditions" [9]. This suggests a design philosophy that prioritizes physical robustness alongside analytical performance.
Testing Methodologies
Standard shock and vibration tests often reference military standards (e.g., MIL-STD-810) which provide rigorous procedures for evaluating equipment durability. Although not explicitly outlined for spectrometers in the search results, typical testing protocols include:
- Drop Testing: Repeatedly dropping the unit from a specified height (e.g., 1 meter) onto a hard surface like concrete, followed by functional verification.
- Vibration Testing: Subjecting the device to defined vibration profiles that simulate transportation or use in vehicles and machinery.
- Operational Testing: Ensuring the instrument maintains calibration and performance before and after mechanical shock events.
The Researcher's Toolkit for Durability Assessment
Evaluating a spectrometer's durability requires an understanding of both the instrument's specifications and the standardized tests that validate them. The following table summarizes key resources and their functions in this assessment process.
Table: Essential Resources for Durability Assessment and Testing
| Resource | Function | Relevance to Ruggedness Testing |
|---|---|---|
| IEC 60529 Standard | Defines the IP Code system for ingress protection ratings against solids and liquids [8]. | The definitive reference for interpreting and specifying IP ratings on instrument datasheets. |
| MIL-STD-810 | A U.S. military standard that outlines environmental test methods for equipment durability, including shock and vibration. | Provides proven methodologies for validating mechanical robustness, though not specifically cited in results. |
| Prometheus Panta | An instrument for multi-parameter biophysical characterization [10]. | Used for application-specific thermal stability analysis of biologic samples (e.g., Tm, Tagg). |
| DSC (Differential Scanning Calorimetry) | A thermal analysis technique that measures heat flow associated with material transitions as a function of temperature [11]. | Used for small-scale determination of thermal decomposition kinetics and stability parameters. |
| Environmental Test Chamber | An enclosure that allows precise control of temperature and humidity. | Used for validating the operational temperature range specified for the spectrometer. |
The durability of handheld spectrometers is a multi-faceted attribute underpinned by three core design elements: Ingress Protection, Thermal Stability, and Shock Resistance. Through standardized testing protocols like IP codes (IEC 60529), thermal ramping with multi-parameter detection, and mechanical stress tests, manufacturers can quantitatively validate the ruggedness of their instruments. For researchers and drug development professionals, understanding these specifications and the methodologies behind them is crucial for selecting field-deployable equipment that will deliver reliable data in demanding environments, from the manufacturing floor to remote outdoor locations. As portable spectroscopy continues to evolve, the integration of these durability features will remain a critical differentiator and a necessary component of field-ready analytical tools.
For researchers conducting field analysis—whether in pharmaceutical development, environmental monitoring, or material science—the ruggedness of a handheld spectrometer is paramount. Ruggedness is traditionally associated with resistance to physical shock, dust, and water. However, battery life and intelligent power management are equally critical components of operational ruggedness. An instrument cannot be considered truly field-ready if it cannot deliver uninterrupted, accurate data through a full day of on-site measurements without requiring grid power.
This guide objectively compares the battery technologies and power management strategies that underpin operational longevity in handheld spectrometers. By presenting performance data and experimental protocols, we aim to provide researchers with a framework for evaluating these essential characteristics, ensuring that their field data collection is both efficient and reliable.
Comparative Analysis of Spectrometer Battery Technologies
The core of a spectrometer's field longevity is its battery. The choice of battery chemistry involves a trade-off between runtime, weight, lifespan, and performance stability. The following table summarizes the key characteristics of the predominant battery types used in professional handheld instruments.
Table 1: Comparative Analysis of Battery Chemistries for Handheld Spectrometers
| Battery Characteristic | Lithium-ion (Li-ion) | Nickel-Metal Hydride (NiMH) | Alkaline |
|---|---|---|---|
| Energy Density | High | Moderate | Low |
| Typical Runtime | Long | Moderate | Short |
| Charge Cycles | 500 - 1000 | 300 - 500 | Non-rechargeable |
| Self-Discharge Rate | Low (~2% per month) | Moderate (~30% per month) | Moderate |
| Memory Effect | No | Yes | No |
| Impact on Measurement Stability | Provides stable voltage for consistent accuracy [12] | Voltage drop can affect component performance [12] | Significant voltage decay risks inaccurate readings [12] |
| Operational Temperature Range | Wide | Moderate | Moderate |
| Environmental Impact | Recyclable | Recyclable | Disposable |
| Key Advantage | Longest runtime, stable power | Lower initial cost, recyclable | Wide availability, no maintenance |
| Key Disadvantage | Higher initial cost, safety concerns if damaged [12] | Requires periodic full discharge, shorter lifespan [12] | High long-term cost, environmental waste [12] |
Analysis for Research Applications: For the demands of field research, Lithium-ion batteries are the industry standard. Their high energy density and stable discharge profile are crucial for maintaining the consistent power that spectrometer optics and detectors require for accurate measurements [12]. While NiMH batteries offer a budget-friendly and recyclable alternative, their higher self-discharge rate makes them less reliable if the instrument is stored between field campaigns without a recharge. Alkaline batteries are suitable only for emergency use, as their voltage drops continuously during use, which can introduce drift and inaccuracy in spectral measurements [12].
Experimental Protocols for Evaluating Power Management
To objectively assess the ruggedness of a spectrometer's power system, researchers can adopt or specify the following experimental protocols. These tests move beyond manufacturer specifications to evaluate performance under realistic and demanding conditions.
Protocol 1: Continuous Operational Runtime Test
This test establishes the baseline battery life under a simulated typical workflow.
- Objective: To determine the maximum continuous operational time on a single full charge.
- Methodology:
- Fully charge the spectrometer battery.
- Place the instrument in an environmental chamber set to a standard room temperature (e.g., 23°C).
- Program an automated stage to present a standard reference material at regular intervals.
- Configure the spectrometer to execute a predefined measurement cycle (e.g., 30-second integration time) continuously.
- Operate the instrument until it automatically powers down due to low battery.
- Record the total number of measurements and total operational time.
- Key Metrics: Total measurement count; Total runtime (hours:minutes).
Protocol 2: Temperature-Dependent Performance & Drainage Test
This test evaluates the impact of environmental extremes, a critical aspect of ruggedness.
- Objective: To quantify the reduction in battery runtime and the stability of analytical performance at high and low temperatures.
- Methodology:
- Conduct the Continuous Operational Runtime Test at room temperature (23°C) to establish a baseline.
- Repeat the test in a controlled environmental chamber set to a high field-operational temperature (e.g., 40°C).
- Repeat the test at a low field-operational temperature (e.g., 5°C).
- At the beginning, midpoint, and end of each test cycle, measure a certified standard and record the signal-to-noise ratio and the accuracy of the quantitative result.
- Key Metrics: Percentage reduction in runtime vs. baseline; Drift in analytical result for the certified standard over the discharge cycle.
Protocol 3: AI-Optimized Charging Strategy Validation
Modern power management can leverage artificial intelligence (AI) to extend battery health and efficiency. This protocol validates such advanced systems.
- Objective: To verify the performance of AI-driven charging strategies in improving efficiency and preserving long-term battery health.
- Methodology:
- Use a controlled DC system to simulate substation-level battery charging and discharging loads [13].
- Apply a traditional charging method (e.g., constant current-constant voltage) to a set of battery cells and record the efficiency and temperature rise.
- Apply an AI-optimized charging strategy (e.g., using a model like DSAN-N-BEATS for predictive management) to another set of identical cells [13].
- The AI model uses time-series forecasting to optimize the charging current and voltage in real-time, reducing stress on the battery chemistry [13].
- Measure the charging efficiency, time to full charge, and peak cell temperature for both methods.
- Cycle cells through repeated charge/discharge cycles to model long-term health degradation.
- Key Metrics: Charging efficiency (%); Charge cycle time (minutes); Peak cell temperature (°C); Capacity retention after 500 cycles (%).
The workflow for designing and executing these tests can be summarized as follows:
Advanced Power Management: From Hardware to AI
Beyond battery chemistry, advanced power management systems are crucial for maximizing field operational time. These systems function on multiple levels:
Hardware-Level Optimizations: Modern portable spectrometers, like the Bruker MOBILE-IR II, incorporate high-capacity internal batteries designed for all-day operation and components like thermoelectrically cooled (TE) detectors that offer a favorable balance of performance and power consumption compared to older, more energy-intensive detector technologies [14].
Algorithmic and AI-Driven Management: Research demonstrates the power of AI for predictive power management. For instance:
- The DSAN-N-BEATS model, which combines a self-attention network with a time-series forecasting model, has been shown to improve battery charging and discharging efficiency by 20% compared to traditional methods. This model accurately captures complex battery state data to optimize strategies [13].
- Frameworks like BatLiNet use deep learning to predict battery lifetime across diverse ageing conditions. By leveraging "inter-cell learning," it compares pairs of battery cells to discern lifetime differences, enhancing prediction stability and enabling proactive management of battery health in field equipment [15].
The Researcher's Toolkit for Power Analysis
Table 2: Essential Research Reagent Solutions for Power Testing
| Item | Function in Experiment |
|---|---|
| Certified Reference Materials (CRMs) | Provides a known spectral signature to validate analytical performance stability throughout the battery discharge cycle. |
| Environmental Chamber | Creates controlled temperature and humidity conditions to test battery and instrument performance under thermal stress. |
| Data Logging Multimeter / Power Analyzer | Precisely monitors voltage, current, and power draw from the battery in real-time during testing. |
| Battery Cycle Tester | Automates the process of charging and discharging battery cells to measure lifespan and capacity degradation over time. |
| AI-Based Predictive Models (e.g., DSAN-N-BEATS) | Provides a software framework for optimizing charging strategies and predicting long-term battery health [13]. |
Battery life is not merely a convenience feature but a foundational element of a truly rugged field instrument. As this guide illustrates, a combination of high-quality Lithium-ion chemistry and intelligent, AI-driven power management provides the most robust solution for ensuring operational longevity.
Future developments in spectrometer power management will likely focus on the deeper integration of AI, not just for charging but for predictive shutdown of non-essential components and task-based power allocation. Furthermore, the emergence of chip-scale spectrometers based on photonic integrated circuits promises a significant reduction in the core power requirements of the analytical engine itself [16] [17]. For the field researcher, these advancements will translate to instruments that are not only more resilient but also capable of longer, more ambitious data collection campaigns in the world's most remote and challenging environments.
The field of spectroscopy is undergoing a transformative shift toward miniaturization, driven by the need for on-site analytical capabilities across diverse fields including pharmaceutical development, environmental monitoring, and forensic science. The global miniaturized spectrometer market, valued at $1.04 billion in 2024, is projected to grow at a robust compound annual growth rate of 12.8%, reaching $1.91 billion by 2029 [18]. This growth trajectory underscores the increasing reliance on portable analytical technologies. For researchers and drug development professionals, this trend presents a critical engineering challenge: achieving portability without compromising the instrument ruggedness and analytical performance required for reliable field-based measurements. Modern handheld spectrometers incorporate advanced technologies including micro-electro-mechanical systems, smartphone integration, and AI-enhanced spectral data interpretation to deliver laboratory-grade capabilities in field-deployable packages [18]. This comparison guide examines how miniaturization impacts spectrometer durability and performance, providing evidence-based insights for scientific professionals making procurement and implementation decisions.
Performance Comparison: Miniaturized vs. Conventional Systems
Quantitative Performance Metrics
Modern miniaturized spectrometers demonstrate performance characteristics that increasingly rival their benchtop counterparts for qualitative identification applications, though trade-offs remain in resolution and quantitative precision.
Table 1: Performance Comparison Between Spectrometer Formats
| Performance Characteristic | Handheld/Ruggedized Systems | Benchtop Laboratory Systems |
|---|---|---|
| Portability | <2 kg; battery operated [19] | 10-50 kg; requires AC power [19] |
| Analysis Speed | 10-30 seconds per sample [19] | 1-5 minutes per sample [19] |
| Spectral Resolution | 8-19 cm⁻¹ (Raman) [19] | 0.3-4 cm⁻¹ (Raman) [19] |
| Sample Preparation | None required; measures through packaging [19] | Often requires mounting or extraction [19] |
| Typical Identification Accuracy | >95% for library-matched materials [19] | >99% for library-matched materials [19] |
| Environmental Operating Range | -10°C to 50°C; IP65+ rated [19] | Laboratory conditions (typically 15°C-30°C) [6] |
Technology-Specific Performance Trade-offs
Different spectroscopic technologies exhibit varying degrees of performance retention when miniaturized. A 2018 study directly compared portable and bench-top Fourier-Transform Infrared (FTIR) spectrometers for soil analysis, finding that measurements and multivariate calibrations with the handheld device were as good as or slightly better than a benchtop instrument equipped with a DRIFT accessory, though not as accurate as directional hemispherical reflectance data collected with an integrating sphere [20]. For Raman spectroscopy, portable systems have demonstrated particular effectiveness in pharmaceutical quality control and law enforcement applications, with identification accuracy exceeding 95% for materials within their reference libraries [19].
Table 2: Application-Specific Performance of Miniaturized Spectrometers
| Application Domain | Technology Used | Performance Level | Key Limiting Factors |
|---|---|---|---|
| Pharmaceutical Raw Material ID | Handheld Raman | >95% accuracy vs. reference methods [19] | Library completeness, fluorescence [19] |
| Soil Analysis | Portable FTIR | Equivalent to benchtop DRIFT [20] | Soil moisture, particle size [20] |
| Narcotics Identification | Handheld Raman | Superior to color tests; minimal false positives [21] | Fluorescence, colored samples [21] [19] |
| Food Safety Screening | Portable NIR | Rapid contaminant detection [22] | Sample homogeneity, concentration levels [22] |
Experimental Protocols for Ruggedness Assessment
Standardized Ruggedness Testing Methodology
Evaluating the field-readiness of miniaturized spectrometers requires systematic testing beyond conventional laboratory calibration. The following experimental protocol provides a framework for assessing how portability requirements impact analytical performance under realistic field conditions.
Detailed Testing Protocols
Mechanical Durability Assessment
Drop Testing Protocol: Following MIL-STD-810G specifications [19], devices undergo repeated 1.5-meter drops onto concrete surfaces from various orientations. Post-test evaluation includes:
- Visual inspection for housing damage, screen integrity, and component displacement
- Functional testing of all buttons, interfaces, and connectivity features
- Performance validation using NIST-traceable reference standards to quantify any spectral accuracy degradation
Vibration Testing Protocol: Simulating transport conditions, devices undergo 2-hour vibration cycles at 5-500 Hz. Performance is monitored continuously during testing to identify:
- Laser alignment stability in Raman systems
- Optical component displacement affecting spectral resolution
- Electrical connection integrity for detectors and light sources
Environmental Ruggedness Validation
Temperature Cycling Protocol: Devices are subjected to temperature extremes from -10°C to 50°C [19] with performance measurements at 10°C intervals:
- Battery performance monitoring including runtime and charging capability
- Electronic stability assessment via signal-to-noise ratio measurements
- Optical component performance evaluating lens coatings and mirror substrates
Ingress Protection Testing: Following IP65/IP67 standards [19], devices are exposed to dust and water immersion while operational:
- Internal contamination inspection via internal visual access points
- Circuit board corrosion assessment through electrical continuity testing
- Optical path integrity verification using calibrated reflectance standards
The Researcher's Toolkit: Essential Materials for Field Spectroscopy
Table 3: Research Reagent Solutions for Field Spectrometer Validation
| Reagent/Material | Function in Testing | Application Context |
|---|---|---|
| NIST-Traceable Reference Standards | Spectral calibration and wavelength verification | Method validation, instrument qualification [20] |
| Stable Chemical Compounds (e.g., acetaminophen, aspirin) | Performance verification for specific applications | Pharmaceutical raw material identification [19] |
| Custom Spectral Libraries | Application-specific method development | Targeted screening (narcotics, explosives, pharmaceuticals) [19] |
| Environmental Challenge Samples | Simulated field condition testing | Soil analysis, contaminated material screening [20] |
| Portable Calibration Accessories | Field recalibration capabilities | Extended deployment without laboratory access [6] |
Performance-Durability Trade-offs: Engineering Compromises
The miniaturization process necessitates careful engineering compromises that directly impact field performance. Understanding these trade-offs is essential for selecting appropriate instrumentation for specific research applications.
The miniaturization of spectroscopic instruments presents a complex balance between performance retention and ruggedness enhancement. For researchers and drug development professionals, successful implementation requires careful consideration of application-specific requirements. Portable FTIR and Raman spectrometers have demonstrated sufficient performance for field-based identification tasks, with studies showing performance comparable to benchtop systems for qualitative analysis [20]. The key to successful deployment lies in understanding that miniaturized instruments are not merely compact versions of laboratory systems, but specialized tools designed for specific field applications. Current technological trends, including AI-enhanced spectral interpretation, smartphone integration, and multi-technology platforms are rapidly addressing existing limitations [18] [23]. As the market continues to evolve at a remarkable pace, with the chip-scale spectrometer segment projected to grow from less than $2 million in 2019 to over $1.6 billion in 2024 [24], researchers can expect continued improvement in both the performance and durability of field-deployable spectroscopic tools. Strategic selection criteria should prioritize application-specific performance validation alongside traditional ruggedness specifications to ensure reliable results in field-based research environments.
From Specification to Practice: Methodologies for Application-Specific Ruggedness Testing
The deployment of handheld spectrometers in field conditions—ranging from pharmaceutical quality control to environmental monitoring—demands rigorous validation under realistic operational scenarios. Simulated field tests are indispensable for evaluating how these portable analytical instruments perform when exposed to environmental stressors such as temperature fluctuations, vibration, humidity, and physical shock. The core objective of ruggedness testing is to bridge the gap between controlled laboratory performance and reliable field operation, ensuring that devices deliver accurate, reproducible results despite the challenges of the real world. The evolution of these tests is closely linked to advancements in spectrometer technology itself, with the market seeing a distinct trend toward miniaturized, field-ready equipment [6]. A comprehensive ruggedness testing framework not only validates a device's operational limits but also provides critical data for researchers and professionals who must select the right tool for demanding applications in drug development, security, and industrial compliance.
The necessity for such testing is underscored by the expanding applications of handheld spectrometers. These devices are no longer confined to laboratory benchtops but are routinely used for on-site material verification in manufacturing, contaminant detection in food and pharmaceuticals, and elemental analysis in mining and geology [25]. In each scenario, the instrument must withstand the specific environmental pressures of its operational context. A spectrometer used for quality control on a manufacturing floor, for instance, must tolerate constant vibration and dust, while a device deployed for environmental screening may face rain and wide temperature variations. Therefore, designing simulated field tests that accurately reproduce these stressors is a critical component of modern spectrometer development and selection, providing a empirical basis for confidence in field-based data.
Key Handheld Spectrometer Technologies and Their Environmental Tolerance
The landscape of handheld spectroscopy is characterized by diverse technologies, each with unique principles, applications, and susceptibilities to environmental factors. Understanding these technologies is the first step in designing meaningful field tests. The following table summarizes the primary handheld spectrometer types, their operating principles, and the environmental stressors most critical to their performance.
Table 1: Key Handheld Spectrometer Technologies and Critical Stressors
| Technology | Operating Principle | Common Field Applications | Key Environmental Stressors |
|---|---|---|---|
| Handheld XRF | Measures elemental composition by exciting a sample and analyzing the emitted X-ray fluorescence spectrum [26]. | Mining, geology, environmental soil screening, compliance testing for restricted substances [26] [25]. | Temperature extremes (affecting detector stability), physical shock (damaging the fragile X-ray tube), humidity (potential for electrical damage). |
| Handheld Raman | Shines a laser on a sample and detects the inelastically scattered light, providing a molecular fingerprint [6]. | Pharmaceutical raw material verification, identification of narcotics and hazardous chemicals [6] [25]. | Ambient light (can swamp the weak Raman signal), vibration (misaligns optical components), sample fluorescence (interferes with spectrum). |
| Handheld NIR | Measures absorption of near-infrared light to determine molecular overtone and combination vibrations [6]. | Agriculture (grain, moisture analysis), pharmaceutical QC, food authenticity [6] [25]. | Temperature & Humidity (significantly alter water absorption bands in NIR region), sample presentation (requires consistent pressure and placement). |
| Handheld FTIR | Uses an interferometer to measure all infrared frequencies simultaneously, creating a broad-spectrum molecular signature [6]. | Polymer and plastic identification, environmental contaminant analysis, explosive detection [6] [27]. | Vibration (critical for interferometer mirror alignment), dust (contaminates optical surfaces), temperature (can cause thermal drift in the signal). |
The performance of these technologies under stress is not merely about durability; it is about analytical integrity. For example, a handheld XRF analyzer like the SPECTRO xSORT is designed for extended one-handed use in challenging field conditions, with ergonomic improvements aimed at reducing user fatigue and improving data consistency during prolonged operation [26]. Meanwhile, devices intended for military or emergency response, such as certain explosive detectors, may be built to meet stringent robustness standards like MIL-STD-810H, which certifies their ability to withstand drops, vibration, and exposure to rain and dust [27]. When designing field tests, it is imperative to move beyond generic stress applications and tailor the protocols to the specific technological vulnerabilities and intended use-cases of the device under test.
Experimental Protocols for Simulated Field Testing
A robust simulated field testing protocol must subject handheld spectrometers to a sequence of controlled stressors that mimic real-world conditions, while simultaneously quantifying their impact on analytical performance. The following workflow provides a generalized structure for such testing, which can be adapted for specific spectrometer technologies and application scenarios.
Diagram 1: Field testing workflow for spectrometer ruggedness evaluation.
Detailed Testing Methodology
The workflow outlined above is operationalized through a series of specific, repeatable experimental procedures. The table below details the core protocols for applying key environmental stressors and measuring the corresponding performance metrics.
Table 2: Experimental Protocols for Key Environmental Stressors
| Stress Category | Simulation Protocol | Performance Metrics & Measurement | Acceptance Criteria |
|---|---|---|---|
| Thermal Cycling | Place device in an environmental chamber. Cycle between -5°C and 45°C with 80% relative humidity at the high-temperature stage. Dwell at each extreme for 2 hours. Complete 3 full cycles [27]. | Measure wavelength shift (cm⁻¹ for IR, nm for Raman) on a NIST-traceable polystyrene standard. Record signal-to-noise ratio (SNR) at each temperature extreme. | Wavelength shift ≤ 1 cm⁻¹ (IR) or 0.1 nm (Raman). SNR degradation ≤ 15% from baseline. |
| Vibration & Shock | Mount device on a vibration table. Apply random vibration per MIL-STD-810H Profile 21 (0.01 g²/Hz, 5-500 Hz). For shock testing, use a drop test from 1 meter onto plywood over concrete [27]. | Pre- and post-test, acquire a spectrum of a certified reference material. Check for physical damage and optical misalignment via visual inspection and automated software diagnostics. | No physical damage or permanent functional failure. Analytical result of reference material remains within certified uncertainty range. |
| Ambient Light & Weather | Operate the spectrometer in a controlled arena with adjustable full-spectrum lighting (0 to 100,000 lux). For weather resistance, a dust chamber and water spray apparatus are used to simulate field conditions. | For ambient light: Measure the standard deviation of the baseline signal in a dark vs. bright environment. For weather: Inspect for ingress of dust/water and test electrical safety and function. | Baseline noise increase ≤ 10% under 50,000 lux. Device remains fully operational with an IP54 rating or better. |
Performance Benchmarking and Validation
The ultimate goal of simulated field testing is to generate comparable, quantitative data on how different handheld spectrometers perform under duress. This allows researchers and engineers to benchmark devices against each other and against the requirements of a specific application. The following table provides a hypothetical comparison of how different technologies might perform against the key metrics outlined in the protocols.
Table 3: Example Performance Benchmarking Under Stressors
| Spectrometer Model (Tech) | Thermal Shift (cm⁻¹) | SNR Degradation | Vibration Tolerance | Overall Ruggedness Score |
|---|---|---|---|---|
| Model A (FTIR) | 0.8 | 12% | High (No misalignment) | 9/10 |
| Model B (Raman 1064nm) | 0.2 | 5% | Medium (Minor recalibration needed) | 8/10 |
| Model C (NIR) | 1.5 | 20% | High (No misalignment) | 7/10 |
| Model D (XRF) | N/A (Elemental) | 8% | Low (Required detector reset) | 6/10 |
Note: Data is illustrative, compiled from generalized performance characteristics reported in the literature [6] [26] [27].
Validation of the entire testing process is achieved by including control measurements and standardized materials at every stage. The use of well-characterized calibration standards, such as NIST-traceable polymers for wavelength accuracy or certified reference materials (CRMs) for analytical accuracy, is non-negotiable [25]. Furthermore, the testing protocol itself should be validated for repeatability by running the same battery of tests on multiple units of the same spectrometer model. This structured approach to benchmarking provides drug development professionals and other researchers with an objective, data-driven foundation for selecting the instrument best suited to their specific field conditions.
The Researcher's Toolkit for Field Testing
Implementing a comprehensive ruggedness testing program requires access to specific tools, materials, and analytical standards. The following table details the essential components of a "research reagent solutions" kit for designing and executing simulated field tests for handheld spectrometers.
Table 4: Essential Research Toolkit for Spectrometer Field Testing
| Tool / Material | Function in Testing | Application Example |
|---|---|---|
| Environmental Chamber | Precisely controls temperature and humidity to simulate climatic extremes encountered in the field. | Cycling a device from -5°C to 45°C with 80% RH to test thermal stability and lens fogging [27]. |
| Vibration Table & Drop Test Rig | Applies standardized mechanical shocks and vibrations to simulate transportation and rough handling. | Using a MIL-STD-810H vibration profile to assess the integrity of optical alignments and internal components [27]. |
| NIST-Traceable Standards | Provides a ground truth for verifying spectral accuracy (wavelength) and signal intensity before, during, and after stress tests. | Using a polystyrene standard to measure wavelength shift in a handheld FTIR after thermal cycling [6]. |
| Certified Reference Materials (CRMs) | Materials with a certified composition for validating the analytical accuracy of the device under test. | Analyzing a soil CRM with a known lead concentration using a handheld XRF to check for analytical drift post-vibration [26]. |
| Portable Light Meter & Lux Source | Quantifies ambient light levels to test a spectrometer's immunity to external light interference. | Measuring the signal-to-noise ratio of a handheld Raman spectrometer under 50,000 lux to simulate outdoor use. |
Designing simulated field tests for handheld spectrometers is a multidisciplinary endeavor that integrates materials science, environmental engineering, and analytical chemistry. By systematically applying controlled stressors—thermal, mechanical, and optical—and meticulously measuring their impact on critical performance metrics, researchers can generate a complete ruggedness profile for any device. The experimental protocols and benchmarking frameworks outlined here provide a roadmap for objectively comparing the field-readiness of different spectrometer technologies, from handheld XRF and Raman to NIR and FTIR. As these devices continue to evolve, becoming more integrated with AI and cloud data systems [25], the methods for testing their resilience must similarly advance. For the scientific and drug development community, adopting such rigorous and standardized testing methodologies is paramount for ensuring that the data collected in the field is as reliable as that produced in the laboratory, thereby upholding the integrity of research and compliance activities in increasingly challenging environments.
In the highly regulated pharmaceutical and biomedical industries, the accurate identification of raw materials and detection of contaminants are critical steps to ensure product safety and efficacy. Vibrational spectroscopic techniques, particularly those deployed in portable and handheld instruments, have emerged as powerful tools for rapid, non-destructive analysis directly at the point of need. Mid-infrared (MIR) and Raman spectroscopy provide molecular fingerprinting capabilities that enable unambiguous material verification and quality assessment [28]. The ruggedness and reliability of these handheld spectrometers under variable field conditions have become a focal point of research, especially as the technology transitions from controlled laboratory environments to diverse real-world settings such as manufacturing floors, warehouses, and distribution centers.
The fundamental advantage of spectroscopic methods lies in their ability to provide immediate chemical-specific information without extensive sample preparation. As Richard Crocombe notes in European Pharmaceutical Review, "Over the last twenty years, the combination of advances in consumer electronics, telecommunications optics and photonics miniaturisation has driven the development of a wide variety of portable spectrometers," making this technology increasingly accessible for pharmaceutical applications [28]. This guide provides a comprehensive comparison of the performance characteristics of leading spectroscopic technologies, supported by experimental data and detailed methodologies for their validation in field conditions.
Comparative Analysis of Spectroscopic Technologies
Performance Characteristics of Portable Spectrometers
The selection of an appropriate spectroscopic technique depends heavily on the specific application requirements, including detection limits, susceptibility to interferences, and operational constraints. The following table summarizes the key performance characteristics of major portable spectroscopic technologies based on current research findings:
Table 1: Performance Comparison of Portable Spectroscopic Technologies
| Performance Characteristic | Portable IR Spectroscopy | Portable Raman Spectroscopy | Color-Based Field Tests |
|---|---|---|---|
| Limit of Detection (Cocaine HCl) | 25% with common adulterants [21] | Higher than IR due to fluorescence issues [21] | 10% with all adulterants tested [21] |
| False Positive Rate | Minimal [21] | Minimal [21] | High (73 known interfering compounds) [21] |
| Analysis Time | Seconds to minutes [21] | 10-30 seconds [19] | Several minutes [21] |
| Sample Preparation | Minimal | None required; measures through packaging [19] | Required sampling, potential exposure risk [21] |
| Destructive Testing | Non-destructive [21] | Non-destructive [19] | Destructive [21] |
| Fluorescence Interference | Not affected | Significant for common drugs like heroin [21] | Not applicable |
| Adulterant Interference | Less severe [21] | More severe [21] | Significant, with many known interferents [21] |
| Initial Investment | High [21] | High [21] | Low (but recurring costs) [21] |
Portable IR spectroscopy demonstrates particular advantages for pharmaceutical applications due to its lower limit of detection and reduced susceptibility to adulterant interference compared to Raman alternatives [21]. However, portable Raman spectrometers offer the distinct advantage of through-package analysis, enabling verification of materials without breaching container integrity—a valuable feature for raw material identification (RMID) in pharmaceutical manufacturing and counterfeit detection [28] [19].
Handheld vs. Benchtop Spectrometer Performance
A critical consideration in method development is whether portable instruments can provide comparable performance to laboratory-based systems. Research examining portable Fourier-Transform Infrared (FTIR) spectrometers has demonstrated promising results in this regard. One study directly compared a portable Agilent 4300 Handheld FTIR spectrometer against a Bruker Tensor 27 bench-top instrument for the analysis of soil properties relevant to pharmaceutical applications (e.g., organic carbon, nitrogen, clay content) [20].
Table 2: Portable vs. Benchtop FTIR Performance Comparison
| Performance Metric | Portable Handheld FTIR (DRIFT) | Bench-top FTIR (DRIFT) | Bench-top FTIR (DHR with Integrating Sphere) |
|---|---|---|---|
| Spectral Quality | Good, slightly higher noise | Good | Best |
| Prediction Accuracy for SOC | High (comparable to bench-top DRIFT) | High | Slightly better |
| Prediction Accuracy for N | High (comparable to bench-top DRIFT) | High | Slightly better |
| Noise Level | Moderate (did not markedly affect calibration accuracy) | Low | Lowest |
| Key Spectral Regions | Good match with bench-top DHR for SOC and N | Good match with portable | Reference standard |
| Multivariate Calibration Performance (PLS) | As good or slightly better than bench-top DRIFT | Good | Best for some parameters |
The study concluded that "portable FTIR instruments are a viable alternative for MIR measurements in the laboratory and offer great potential for on-site applications" [20]. This finding is particularly significant for pharmaceutical applications where on-site verification of raw materials can significantly streamline quality control processes while maintaining analytical rigor.
Experimental Protocols for Ruggedness Testing
Framework for Ruggedness Assessment
Ruggedness testing, as defined by the International Conference on Harmonization (ICH), is "a measure of [an analytical procedure's] capacity to remain unaffected by small but deliberate variations in method parameters and provides an indication of its reliability during normal usage" [29]. In the context of handheld spectrometers used in field conditions, ruggedness testing evaluates how environmental factors and operational variations impact analytical results.
The setup and execution of ruggedness tests involve several methodical steps [29]:
- Selection of factors and their levels: Choosing parameters most likely to affect results (e.g., temperature, humidity, operator skill, sample presentation)
- Selection of experimental design: Deciding between One Factor At a Time (OFAT) or Design of Experiments (DoE) approaches
- Selection of responses: Identifying relevant assay and system suitability test responses to monitor
- Definition of experimental protocol: Establishing sequence and conditions for experiments
- Execution of experiments: Conducting tests according to protocol, often in randomized order
- Estimation of factor effects: Quantifying the impact of each varied parameter
- Graphical and statistical analysis: Interpreting results to determine significance of effects
- Drawing conclusions: Implementing measures to control influential factors
Experimental Designs for Ruggedness Testing
Two primary experimental approaches are used in ruggedness testing of analytical methods:
One Factor At a Time (OFAT) approach varies individual factors while holding others constant, as illustrated in the following example for an HPLC method [30]:
Table 3: Example of OFAT Experimental Design
| Experiment | Actual Order | Factor A: pH | Factor B: Additive Conc. | Factor C: Column Temp. | Response: Retention Time |
|---|---|---|---|---|---|
| 1 | 3 | Optimal | Optimal | + | 7.95 |
| 2 | 6 | Optimal | Optimal | - | 8.13 |
| 3 | 5 | Optimal | + | Optimal | 8.12 |
| 4 | 1 | Optimal | - | Optimal | 7.72 |
| 5 | 4 | + | Optimal | Optimal | 8.32 |
| 6 | 2 | - | Optimal | Optimal | 9.82 |
| 7 | 7 | Optimal | Optimal | Optimal | 8.03 |
This approach is straightforward to implement and interpret, making it suitable for routine laboratories [30]. However, it cannot detect interactions between factors.
Design of Experiments (DoE) approaches, such as fractional factorial or Plackett-Burman designs, simultaneously vary multiple factors in a structured pattern. These designs are more efficient for evaluating multiple parameters and can detect interactions, but require greater statistical expertise to implement and interpret [29] [30]. For evaluating ruggedness as defined by the United States Pharmacopeia—which involves assessment across different laboratories, analysts, instruments, and days—nested designs may be more appropriate than two-level screening designs [31].
Methodology for Handheld Raman Spectrometer Evaluation
A robust protocol for evaluating handheld Raman spectrometers in pharmaceutical applications should include the following steps, adapted from research on raw material identification [32]:
Instrument Calibration: Develop methods using pure reference standards for each compound of interest, collecting a minimum of 20 scans to account for variations in sampling position, packaging materials, and operator technique.
Method Development: Create customized identification methods using proprietary algorithms that compare unknown spectra to reference methods, generating a numerical P-value (where 1.000 represents a perfect fit) for PASS/FAIL determination.
Validation Testing: Test all materials against specific methods generated from pure reference standards, with typical analysis times of approximately 20 seconds per sample.
Data Interpretation: Evaluate results based on both P-value thresholds and Hit Quality Index (HQI) values, where an HQI of 100% indicates identical spectra, with values decreasing as spectra become less similar.
This methodology was successfully applied to differentiate between various cellulose materials and food additives—compounds that are particularly challenging due to their similar appearance and composition [32]. The study demonstrated that modern handheld Raman instruments with advanced optical designs, thermally stabilized detectors, and intelligent algorithms can achieve reliable identification of these complex materials.
The Scientist's Toolkit: Essential Research Reagent Solutions
The implementation of spectroscopic methods requires not only instrumentation but also appropriate standards and reagents for method development and validation. The following table outlines key materials used in the development and validation of spectroscopic methods for pharmaceutical applications:
Table 4: Essential Materials for Spectroscopic Method Development
| Material/Standard | Function in Research & Development | Example Applications |
|---|---|---|
| Cellulose Compounds | Model challenging materials for method validation; represent common excipients [32] | Differentiation between cellulose, microcrystalline cellulose in pharmaceutical binders/fillers |
| Hydroxypropyl Methylcellulose (HPMC) Compounds | Test specificity for chemically similar compounds; challenge spectral library resolution [32] | Identification of various HPMC types (Methocel, Metolose, Hypromellose) as binding agents |
| Lactose | Represent common pharmaceutical sweetening agent/filler; validate methods for common excipients [32] | Raw material verification of sweetening agents in solid dosage forms |
| Maltodextrin | Challenge methods with food additives/sweetening agents; test fluorescence mitigation [32] | Identification of food additives and excipients in pharmaceutical formulations |
| Calcium Monohydrogen Phosphate | Model inorganic pharmaceutical additives; validate methods for mineral-based compounds [32] | Verification of binder/dietary supplement materials |
| Spectral Library | Reference database for compound identification; essential for accurate material verification [19] | All spectroscopic identification applications |
| System Suitability Standards | Verify instrument performance meets specifications; quality control check [29] | Daily instrument qualification and method validation |
Visualization of Experimental Workflows
Ruggedness Testing Methodology
Spectrometer Selection Logic
Handheld spectroscopic instruments have evolved to offer performance characteristics that in many applications rival their benchtop counterparts, while providing unparalleled flexibility for field-based analysis. The selection between portable IR and Raman technologies depends heavily on specific application requirements, with IR offering advantages in detection limits and reduced interference, while Raman provides unique through-package analysis capabilities. Ruggedness testing through structured experimental designs is essential to validate these instruments for use in variable field conditions, ensuring reliable performance across different operators, environments, and sample presentations. As the technology continues to advance, with improvements in detector sensitivity, fluorescence mitigation, and spectral library development, handheld spectrometers are poised to play an increasingly central role in pharmaceutical and biomedical testing applications, from raw material verification to contaminant detection.
Handheld spectrometers have become indispensable in field-based research and drug development, enabling rapid, on-site identification and quantification of substances. However, their analytical performance in real-world, non-laboratory conditions is challenged by environmental stressors such as temperature fluctuations, physical shock, and varying sample presentation. These factors can induce signal instability and calibration drift, phenomena where a spectrometer's readings gradually deviate from their calibrated baseline over time. For researchers and scientists, this drift can compromise data integrity, leading to inaccurate conclusions.
This guide objectively compares the performance of leading handheld spectrometer technologies, focusing on their resilience to signal decay and the methodologies used to detect and correct for calibration drift. Framed within a broader thesis on ruggedness testing, it provides a foundation for selecting the right instrument based on empirical data and proven experimental protocols.
Technology Comparison: Handheld Spectrometers at a Glance
The market offers various handheld spectrometer technologies, each with unique strengths and vulnerabilities. The table below summarizes the core characteristics and documented performance of key systems.
Table 1: Performance Comparison of Handheld Spectrometer Technologies Under Field Conditions
| Technology | Primary Applications | Key Ruggedness Features | Reported Performance Under Duress |
|---|---|---|---|
| Handheld Raman (e.g., Agilent Resolve) | Narcotics, explosives, and chemical identification through sealed containers [33]. | Proprietary Spatially Offset Raman Spectroscopy (SORS); tested for 10 hours in freezing and overheating conditions [33]. | Identifies materials in less than 28 seconds through opaque containers; ranked top-performing by the U.S. Department of Homeland Security [33]. |
| Handheld XRF (e.g., SPECTRO xSORT) | Elemental analysis for geology, mining, and environmental compliance screening [26]. | Redesigned compact, balanced body for one-handed use; physical buttons for gloved operation [26]. | Delivers rapid, accurate measurements across diverse sample types, even in remote or challenging field conditions [26]. |
| Ion Mobility Spectrometers | Explosive and chemical detection for security applications [34]. | High sensitivity and rapid response time; designed for rugged, unpredictable conditions [34]. | Projected to hold a 38.6% market revenue share in 2025, attributed to portability and reliability in field environments [34]. |
Experimental Protocols for Assessing Signal Stability
To ensure data quality, researchers must employ standardized protocols for stress-testing handheld spectrometers. The following methodologies are critical for evaluating signal stability.
Environmental Stress Testing
Agilent's manufacturing process for the Resolve handheld Raman spectrometer involves a rigorous environmental stress protocol. Each unit undergoes a sequence of extreme temperature exposures to validate component stability and signal integrity. The specific protocol is as follows [33]:
- Cold Soak: The instrument is placed in a controlled environment for 10 hours at freezing temperatures.
- Heat Soak: The instrument is subsequently exposed to 10 hours of overheating conditions.
- Thermal Shock: The unit is subjected to rapid temperature cycling to induce thermal stress.
- Continuous Scanning: Throughout and after the stress tests, the device performs constant self-scans to verify that its analytical performance remains consistent and within specified tolerances.
This protocol helps identify components susceptible to thermal expansion or contraction, which can cause misalignment in optical paths and lead to signal drift.
Signal Stability Detection for Inertial Sensors
While developed for Nuclear Magnetic Resonance (NMR) sensors, a published Signal Stability Detection (SSD) algorithm offers a generalizable framework for identifying stable signal periods in noisy data streams. This is crucial for distinguishing true analytical signal from low-frequency drift and high-frequency noise [35].
The method involves:
- Data Segmentation: The continuous signal from the sensor is divided into a fixed number of data points per segment.
- Variance Calculation: The variance of each data segment is calculated.
- Stability Judgment: The variance of the current segment is compared to a predefined stability threshold. If the variance is below the threshold, the signal is classified as "stable"; otherwise, it is "unstable".
This simple yet effective algorithm allows for real-time assessment of signal quality, which can inform data acquisition and instrument operation.
Methodologies for Monitoring and Correcting Calibration Drift
Calibration drift is a primary concern for long-term field deployments. Researchers have developed advanced computational and modeling techniques to monitor and suppress this drift.
Dynamic Calibration Curves with Online Learning
A system developed for clinical prediction models provides a powerful framework for maintaining calibration in non-stationary environments. This method uses online stochastic gradient descent with Adam optimization to dynamically update logistic calibration curves as new data arrives [36].
- Approach: The method maintains an evolving calibration curve that relates a model's predicted probabilities to observed outcomes. The curve is parameterized, for instance, with a 5-degree fractional polynomial to capture complex miscalibration.
- Process: As each new observation with its outcome is recorded, the coefficients of the calibration curve are incrementally adjusted to minimize the logistic loss function. The Adam optimizer automatically scales the learning rate for each coefficient, enabling rapid adaptation during periods of drift and stability during calm periods.
- Application: This approach is generalizable and can be customized for various learning algorithms, making it suitable for the predictive models often embedded in spectroscopic analysis software.
Random Drift Modeling and Adaptive Filtering
For direct suppression of low-frequency drift in sensor signals, a hybrid method combining Auto Regressive Moving Average (ARMA) modeling with an Adaptive Kalman Filter (AKF) has shown high efficacy, particularly in NMR sensors [35].
- Drift Modeling: The random drift component of a sensor's signal is modeled as an ARMA process. The ARMA model effectively captures the time-dependent structure of the drift, representing it as a linear combination of its own past values and a white noise input.
- Adaptive Filtering: The ARMA model is integrated as the state model in a Kalman Filter. An innovation-based adaptive method is then used to estimate and adjust the Kalman filter's noise parameters in real-time. This compensates for the time-varying nature of sensor noise, which, if unaccounted for, degrades filtering performance.
- Enhanced Detection: To improve the AKF's performance, a Signal Stability Detection (SSD) module is incorporated. By identifying periods of stable signal, the SSD module provides context that allows the AKF to more accurately adjust its parameters, leading to superior drift suppression compared to traditional Kalman Filters.
The following diagram illustrates the workflow of this combined SSD-AKF method for random drift suppression.
The Scientist's Toolkit: Essential Reagents & Materials
Successful field deployment and validation of handheld spectrometers require more than just the instrument itself. The following table details key solutions and materials crucial for conducting ruggedness testing and ensuring analytical performance.
Table 2: Essential Research Reagents and Materials for Spectrometer Ruggedness Testing
| Item | Function in Research & Testing |
|---|---|
| Shape Memory Epoxy Films | Used as stress-engineered dispersive elements in novel, low-cost spectrometer designs. Their programmable internal stress enables broadband capability from visible to short-wave infrared (SWIR) [37]. |
| Certified Reference Materials (CRMs) | Standardized samples with known composition and concentration. Served as the ground truth for calibrating instruments and quantifying the magnitude of signal drift and analytical error during stress tests. |
| Portable Sample Chambers | Accessories that allow for controlled presentation of samples to handheld XRF analyzers, enhancing analytical consistency and operator safety in field environments [26]. |
| Thermoelectric Cooling Units | Integrated into high-sensitivity spectrometers (e.g., for Raman applications) to minimize detector noise, increase dynamic range, and maintain signal stability during prolonged integration times or in elevated ambient temperatures [38]. |
| Spectral Library Updates | Regularly updated databases of known material signatures (e.g., for new fentanyl variants or emerging narcotics) are critical for maintaining the identification accuracy of handheld spectrometers against evolving threats [33]. |
The ruggedness of handheld spectrometers is not an inherent property but a performance metric that must be empirically validated. Technologies like handheld Raman and XRF have demonstrated robust performance in demanding conditions, supported by rigorous manufacturer testing. For researchers, the ongoing challenge of calibration drift can be mitigated through advanced computational methods like dynamic calibration curves and adaptive filtering. By integrating these instruments with the rigorous experimental protocols and analytical frameworks outlined in this guide, drug development professionals and field researchers can ensure the generation of reliable, high-fidelity data, even when operating far from the controlled confines of a laboratory.
The accurate, on-scene identification of hazardous materials—ranging from illicit drugs to explosive compounds—is a critical challenge for law enforcement and forensic investigators. For years, color-based field tests have been the standard for preliminary identification, but these methods are prone to false positives and are inherently destructive, preventing further analysis [21]. The evolution of handheld Raman spectroscopy has introduced a powerful alternative, bringing laboratory-grade molecular identification capabilities directly to the field. This technology provides a non-destructive method for the rapid identification of unknown substances, often through their original packaging, which minimizes exposure risks to officers and preserves evidence integrity [39] [19]. This case study examines the ruggedness and operational effectiveness of handheld Raman spectrometers, evaluating their performance under real-world conditions for hazardous material identification. We will compare instrument capabilities, delve into experimental data on sensitivity and specificity, and provide a framework for integrating this technology into field-based forensic workflows.
Fundamental Principles
Raman spectroscopy, like infrared (IR) absorption, measures the vibrational, rotational, and other low-frequency modes of a molecule. However, while IR spectroscopy measures which wavelengths are absorbed, Raman spectroscopy is based on the inelastic scattering of monochromatic light, typically from a laser source. When laser photons interact with molecular bonds, the resulting scattered light produces a unique spectral "fingerprint" based on the material's molecular vibrations [39] [19]. The pattern of these vibrational and rotational frequencies is highly characteristic of a specific molecular species, allowing for positive identification. Modern handheld devices integrate sophisticated software that compares the captured spectrum against extensive reference libraries, providing identification results in as little as 10 to 30 seconds [39] [19].
Key Instrument Specifications for Field Use
When deployed outside the controlled laboratory environment, several instrument specifications become critical for reliable performance. The choice of laser wavelength is paramount; while 785 nm is standard for many applications, 1064 nm lasers are particularly effective for analyzing colored, dark, or fluorescent samples, as the longer wavelength significantly reduces fluorescence interference, a common issue with real-world samples [19] [40]. The spectral range should cover 200-3200 cm⁻¹ to encompass the "fingerprint region" where most molecular vibrations occur. Furthermore, for field readiness, instruments require robust construction, often meeting MIL-STD-810G environmental standards, an IP65+ ingress protection rating for dust and water resistance, and a battery life supporting 4-8 hours of continuous operation [19].
This workflow illustrates the process from laser excitation to material identification, highlighting the critical factors that ensure reliability in field conditions.
Experimental Comparison: Performance Under Field Conditions
Methodology for Ruggedness and Sensitivity Evaluation
To objectively assess the capabilities of handheld Raman spectrometers, we synthesized methodologies from peer-reviewed studies evaluating these instruments for forensic applications. The core experimental framework involves testing sensitivity, repeatability, and resilience to environmental interferents.
A standard protocol involves preparing a series of two-component mixtures using target analytes (e.g., cocaine HCl, explosives) with common adulterants such as lidocaine, mannitol, caffeine, artificial sweetener, and powdered baby formula [21]. Samples with concentrations of the target analyte ranging from 0.1% to 50% by mass are analyzed to determine the limit of detection (LOD). Furthermore, the analysis includes testing through different container materials (e.g., glass and plastic vials) to evaluate the instrument's ability to perform through-container identification, a key safety feature for hazardous materials [40]. Each sample is typically analyzed in replicate (n≥3) to establish repeatability, with the total scan time and decision-making process taking approximately 30 seconds per assessment [39].
Comparative Data: Handheld Raman vs. Alternative Techniques
The following tables summarize key performance data from controlled experimental comparisons, highlighting the operational strengths and limitations of handheld Raman spectroscopy.
Table 1: Comparative Analysis of Field-Based Drug Identification Techniques
| Performance Characteristic | Color-Based Field Tests (e.g., NIK) | Portable IR Spectroscopy | Handheld Raman Spectroscopy |
|---|---|---|---|
| Limit of Detection (Cocaine HCl) | ~10% concentration [21] | ~25% concentration [21] | Varies; can be comparable or superior to IR [21] [40] |
| False Positives | High (e.g., 73+ known compounds for cocaine test) [21] | Low (library-dependent) | Low (library-dependent) [21] |
| Analysis Time | A few minutes [21] | < 1-2 minutes | 10 - 30 seconds [39] [19] |
| Destructive to Sample | Yes [21] | No | No [39] [19] |
| Through-Container Analysis | No | Limited | Yes (through glass/plastic) [19] [40] |
| Cost per Analysis | ~$2-$5 (consumable) [21] | High initial investment | High initial investment |
Table 2: Sensitivity of Handheld Raman Spectrometers for Explosive Materials Data derived from peer-reviewed evaluation of two handheld Raman instruments [40]
| Analyte | LOD (HandyRam, 785 nm) | LOD (ResQ-CQL, 1064 nm) | Notes |
|---|---|---|---|
| Diphenylamine (DPA) | ~100 mM | < 10 mM | Stabilizer in smokeless powder |
| Ethyl Centralite (EC) | ~100 mM | < 10 mM | Stabilizer in smokeless powder |
| Methyl Centralite (MC) | ~100 mM | < 10 mM | Stabilizer in smokeless powder |
| Ammonium Nitrate (AN) | ~1 M | ~0.1 M | Common explosive precursor |
| TNT | Not Detected | Detected | Fluorescence interfered with 785 nm system |
Key Findings from Experimental Data
The comparative data reveals several critical trends. First, handheld Raman spectrometers offer a significant advantage in speed and non-destructiveness over traditional color tests and portable IR, with analysis times under 30 seconds and the ability to preserve sample integrity [39] [21]. Second, the choice of laser wavelength directly impacts performance. Instruments equipped with a 1064 nm laser demonstrate superior capability in analyzing challenging samples, such as explosives and colored substances, by effectively minimizing fluorescence that often plagues 785 nm systems [40]. As shown in Table 2, the 1064 nm ResQ-CQL provided significantly lower (better) limits of detection for all tested explosive-related compounds and successfully identified TNT, which the 785 nm system could not.
Furthermore, the depth and quality of the onboard spectral library are crucial for reliable identification. One study noted that a handheld Raman device configured with a library of over 4500 chemicals, including narcotics and explosives, enabled the confirmation of samples like cocaine and TNT in the field [39]. However, the technology is not without limitations; fluorescence from sample matrices can still interfere, and highly complex mixtures can present challenges for identification without more advanced laboratory equipment [41] [42].
The Scientist's Toolkit: Research Reagent Solutions
Table 3: Essential Materials for Field Validation of Handheld Raman Systems
| Reagent/Material | Function in Validation |
|---|---|
| Analytical Grade Analytic Standards (e.g., Cocaine HCl, TNT, AN) | Provides pure reference materials for creating controlled mixtures and validating library matches. |
| Common Adulterants & Cutting Agents (e.g., Lidocaine, Caffeine, Mannitol) | Used to create realistic, challenging sample mixtures to test specificity and LOD. |
| Inert Powdered Excipients (e.g., Lactose, Maize Starch, Microcrystalline Cellulose) | Simulates the matrix of real-world samples, such as pharmaceutical tablets, to assess interference. |
| Solvents (e.g., Acetone, Acetonitrile, Methanol) | Used for preparing standard solutions for sensitivity testing; acetone found to offer low LOD and high reproducibility for some analytes [40]. |
| Various Containers (e.g., Glass vials, Plastic bags) | Essential for testing the through-container analysis capability and any spectral interference from packaging. |
Handheld Raman spectrometers have proven to be a transformative technology for the on-scene identification of hazardous materials. Their ruggedness, speed, and non-destructive nature directly address critical gaps left by traditional color tests and mitigate the sample backlog plaguing many forensic laboratories [39] [21]. The experimental data confirms that modern devices, particularly those utilizing 1064 nm laser excitation, provide robust performance for a wide range of analytes, including narcotics and explosives, even when packaged in containers.
For researchers and agencies deploying this technology, the following recommendations are made:
- Laser Wavelength Selection: Prioritize instruments with 1064 nm lasers for analyzing unknown or potentially fluorescent samples, such as street drugs or homemade explosives, to maximize the success rate of identification [19] [40].
- Library Customization: While pre-loaded libraries are extensive, investing in custom library development for specific regional drugs or emerging threats enhances long-term utility and accuracy [39] [19].
- Operator Training: Although designed for simplicity, training field operators on the limitations of the technology—such as potential fluorescence and the meaning of a "no match" result—is essential for its effective and reliable use [21].
- Multi-Technology Approach: For the most complex samples, particularly those involving trace analysis or complex mixtures, handheld Raman is best used as part of a broader analytical strategy that may include other portable techniques or confirmatory laboratory analysis [42].
In conclusion, when deployed with an understanding of its capabilities and limitations, handheld Raman spectroscopy stands as a paragon of ruggedness in action, empowering field personnel with immediate, reliable chemical intelligence to enhance both safety and operational effectiveness.
Overcoming Field Challenges: Troubleshooting Common Issues and Optimizing Performance
The deployment of handheld spectrometers for field-based applications in drug development, environmental monitoring, and material verification has revolutionized analytical capabilities outside traditional laboratory settings. However, these instruments face significant performance challenges when exposed to variable environmental conditions including temperature fluctuations, humidity extremes, and airborne particulate matter. These factors can introduce substantial measurement error, compromise data integrity, and ultimately affect scientific conclusions drawn from field data. Understanding and mitigating these environmental interferents is therefore crucial for researchers and scientists relying on handheld spectrometry for critical analyses.
This guide objectively compares the performance of various handheld spectrometer technologies when subjected to environmental stressors, providing experimental data and protocols to inform selection and usage practices for field researchers. By framing this discussion within the context of ruggedness testing, we aim to provide practical strategies for maintaining analytical precision despite challenging field conditions.
Environmental Interference Mechanisms and Instrument Performance
Environmental factors affect spectrometer performance through multiple mechanical, optical, and electronic pathways. Understanding these mechanisms is fundamental to developing effective mitigation strategies.
Temperature Effects
Temperature fluctuations induce several instrumental deviations. Electronic drift occurs as semiconductor properties and component specifications shift with temperature changes, potentially causing signal baseline instability and measurement inaccuracies [43]. Prolonged exposure to high temperatures can permanently affect electrical components, leading to persistent calibration errors. Thermal expansion in optical benches and components can alter alignment, reducing optical throughput and spectral resolution. Additionally, sample temperature affects molecular vibration rates and spectral signatures, particularly in Raman and infrared techniques, creating potential misinterpretation of results if not properly compensated.
Humidity Impacts
High humidity levels primarily affect instruments through optical condensation, where moisture accumulates on lenses, windows, and mirrors, scattering incident and emitted light [43]. This scattering reduces signal intensity and signal-to-noise ratios. Humidity also accelerates corrosion of electrical contacts and can promote fungal growth on optical surfaces, causing permanent damage requiring component replacement. For powder samples, humidity can cause hydration state changes, altering spectral signatures independently of instrumental effects.
Particulate Matter Interference
Airborne particulates interfere with measurements through light scattering and absorption, particularly affecting reflectance measurements and optical paths [44]. Fine particles (PM2.5) can infiltr instrument housings, depositing on optical surfaces and causing progressive signal attenuation. In sampling interfaces, particulate accumulation creates physical barriers between the instrument and sample, while also increasing maintenance requirements through optical fouling that necessitates frequent cleaning and potential recalibration.
Figure 1: Environmental Interference Pathways in Handheld Spectrometers
Comparative Performance of Spectrometer Technologies
Different spectrometer technologies exhibit varying susceptibility to environmental factors, influencing their suitability for specific field applications.
Portable Spectrophotometers for Reflectance Measurements
Portable spectrophotometers used for remote sensing reflectance measurements demonstrate high sensitivity to environmental conditions. A controlled study evaluating their performance under varying conditions found temperature to be the most significant factor affecting measurement accuracy [43]. As temperature increased, measurement accuracy decreased substantially due to electronic component drift. The study also documented a 15-25% reduction in measurement reliability at high humidity levels (≥80% RH) due to condensation on optical components [43]. Lighting conditions showed measurable but less dramatic effects, causing 5-10% variability in reflectance measurements under extreme illumination changes.
Handheld FTIR Spectrometers
Handheld Fourier-transform infrared (FTIR) spectrometers provide valuable capabilities for field analysis but face specific environmental limitations. A comparative study of the Agilent 4300 Handheld FTIR unit and benchtop systems revealed that while handheld units successfully identified key bone quality indicators (phosphate, carbonate mineral, collagen) and detected contaminants like Staphylococcus epidermidis, they exhibited limitations in spectral resolution and signal-to-noise ratio compared to laboratory instruments [45]. The handheld unit operated with a spectral resolution of 2 cm⁻¹ compared to 0.5 cm⁻¹ for the benchtop Perkin Elmer Spectrum 100, potentially limiting discrimination of closely spaced absorption bands in challenging environmental conditions [45].
Handheld Raman Spectrometers
Handheld Raman systems incorporate innovative technologies to mitigate environmental interference. Features such as Raman Concatenation help address fluorescence issues that can be exacerbated by environmental contaminants [46]. Orbital Raster Scanning (ORS) technology improves sampling representativeness for heterogeneous samples encountered in field conditions [46]. The MIRA XTR handheld Raman analyzer specifically addresses fluorescent samples – a common challenge in field applications – through advanced laser and detection configurations [46]. Unlike spectrophotometers, handheld Raman systems are designed with integrated environmental hardening, with some models capable of through-container analysis that provides inherent protection against particulate contamination.
Table 1: Comparative Environmental Ruggedness of Handheld Spectrometer Technologies
| Technology Type | Temperature Sensitivity | Humidity Sensitivity | Particulate Matter Sensitivity | Key Mitigation Features |
|---|---|---|---|---|
| Portable Spectrophotometers (Reflectance) | High: >20% accuracy reduction with >15°C variation [43] | High: 15-25% reliability loss at ≥80% RH [43] | Moderate: Affected by light scattering | Regular calibration, controlled measurement environments |
| Handheld FTIR | Moderate: Electronic stabilization helps | Moderate: Sealed optics options | High: Sensitive to optical path obstruction | 2 cm⁻¹ resolution (Agilent 4300), portable desiccants [45] |
| Handheld Raman | Moderate: Laser stability critical | Low: Often sealed optics | Low: Through-container analysis possible | Orbital Raster Scanning, Raman Concatenation [46] |
| Particulate Meters (Photodiode) | Low: Designed for field use | Low: IP rated enclosures | High: Purpose is particulate detection | Laser-based detection, factory calibration recommended [44] |
Experimental Protocols for Environmental Ruggedness Assessment
Standardized testing methodologies are essential for objectively comparing instrument performance across environmental conditions. The following protocols are adapted from published experimental approaches.
Temperature Stress Testing
This protocol evaluates spectrometer performance across operational temperature ranges, adapted from controlled studies on portable spectrophotometers [43].
Materials and Equipment:
- Test spectrometer unit(s)
- Environmental chamber (temperature range: -10°C to 60°C)
- Certified reference standards (white tile, spectral standards)
- Data logging equipment
- Thermal probes
Methodology:
- precondition instruments at 22°C and 50% RH for 2 hours
- using reference standards, establish baseline measurements at controlled conditions
- incrementally increase temperature in 5°C steps from 20°C to 40°C, maintaining constant humidity
- at each temperature plateau, allow 30 minutes for thermal equilibration
- perform triplicate measurements on reference standards
- record all spectral data with timestamps
- analyze wavelength stability, signal-to-noise ratio, and measurement deviation from baseline
Data Analysis: Calculate coefficient of variation for measurements at each temperature, and determine temperature-induced drift rates for key spectral parameters.
Humidity Resistance Evaluation
This procedure tests instrument performance under elevated humidity conditions, particularly relevant for tropical environments and pharmaceutical manufacturing areas.
Materials and Equipment:
- Test spectrometer unit(s)
- Humidity-controlled chamber
- Hygrometer (certified, ±3% RH accuracy)
- Optical reference materials
- Data acquisition system
Methodology:
- establish baseline measurements at 50% RH and 22°C
- increase humidity to 70% RH, maintaining constant temperature
- after 1-hour equilibration, perform measurement series
- increase humidity to 90% RH and repeat measurements
- monitor for condensation formation on optical surfaces
- include recovery measurements after returning to 50% RH
Data Analysis: Quantify signal attenuation, baseline drift, and measurement precision at each humidity level, noting any irreversible changes post-testing.
Particulate Matter Interference Assessment
This protocol evaluates the effects of airborne particulates on optical measurements, adapted from particulate meter validation studies [44].
Materials and Equipment:
- Test spectrometer
- Particulate matter generation system
- Handheld particulate meter (e.g., HHTP21 with ±10% reading accuracy) [44]
- Optical targets
- Clean air supply
Methodology:
- establish baseline optical measurements in clean air conditions (PM2.5 < 10 μg/m³)
- introduce standardized particulate matter (Arizona test dust or similar)
- monitor particulate concentrations using reference meter
- perform spectrometer measurements at PM2.5 concentrations of 50, 100, and 200 μg/m³
- test both direct exposure and protected measurement configurations
- assess optical surface contamination post-testing
Data Analysis: Correlate particulate concentration with measurement deviations, and evaluate effectiveness of protective measures.
Figure 2: Experimental Protocol for Environmental Ruggedness Assessment
Mitigation Strategies and Best Practices
Effective management of environmental interference requires multi-layered strategies combining instrument selection, procedural controls, and technical adaptations.
Instrument Selection and Configuration
Choosing appropriate instrumentation forms the foundation of environmental interference mitigation. For high-humidity environments, hermetically sealed optics and purge ports prevent condensation accumulation. In variable temperature conditions, instruments with internal temperature stabilization and compensated optical benches maintain calibration stability. For particulate-rich environments, through-container analysis capabilities (available in some Raman systems) completely isolate the instrument from particulate exposure [46]. When selecting instruments, verify IP protection ratings and operating ranges rather than assuming field readiness.
Operational Protocols
Adaptive field procedures significantly reduce environmental error. Frequent calibration using certified standards specific to environmental conditions compensates for instrumental drift, with studies showing improved accuracy after calibration under extreme conditions [43]. Environmental preconditioning of instruments (allowing stabilization in operational environments before use) minimizes thermal shock effects. Implementing measurement averaging with appropriate statistical treatment compensates for transient environmental interference. Establishing environmental monitoring concurrent with spectral acquisition (using devices like the HHTP21 particulate meter) creates correlation data for post-processing correction [44].
Data Processing Solutions
Advanced computational methods can correct environmentally induced artifacts. Multivariate correction algorithms using environmental sensor inputs (temperature, humidity, particulate counts) can normalize spectral data. Signal processing techniques including wavelet transformation and Fourier filtering help distinguish environmental noise from spectral signals. Reference-standard normalization using built-in or external standards provides real-time correction factors. For critical applications, environmental interference libraries can be developed specific to instrument types and conditions, enabling more accurate compensation.
Table 2: Research-Grade Equipment for Environmental Monitoring and Mitigation
| Equipment Category | Specific Examples | Performance Specifications | Research Applications |
|---|---|---|---|
| Particulate Matter Monitors | HHTP21 Handheld Particulate Meter [44] | PM2.5 range: 0-500 μg/m³; ±10% reading accuracy; Temperature/Humidity sensors | Quantifying particulate interference; Establishing safe operating thresholds |
| Handheld FTIR Spectrometers | Agilent 4300 Handheld FTIR [45] | Spectral range: 650-4000 cm⁻¹; Resolution: 2 cm⁻¹; Portable operation | Field verification of materials; Contaminant identification in variable conditions |
| Environmental Data Loggers | 4G IoT Temperature/Humidity Data Loggers [47] | Wireless connectivity; Cloud monitoring; Wide operating ranges | Continuous environmental monitoring during field spectroscopy |
| Gas Detectors & Analyzers | 4-in-1 Gas Detector (CO, H₂S, O₂, CH₄) [47] | Multi-gas detection; Data logging; IP65 protection | Laboratory and field air quality assessment during measurements |
| Portable Anemometers | 6-in-1 Ultrasonic Anemometer [47] | Wind speed/direction; Temperature; Humidity; Pressure | Assessing airborne particulate transport in outdoor settings |
Handheld spectrometer performance is inextricably linked to environmental conditions, with temperature, humidity, and particulate matter representing significant interference factors that can compromise data quality. Through systematic ruggedness testing and comparative analysis, researchers can select appropriate technologies and implement effective mitigation strategies for their specific application environments. The experimental protocols and comparative data presented here provide a foundation for evidence-based instrument selection and operational planning.
Future directions in field-spectrometer development should focus on enhanced environmental hardening, intelligent compensation algorithms that automatically adjust for ambient conditions, and standardized ruggedness testing protocols enabling direct comparison between instrument platforms. As handheld spectrometry continues to expand into new research domains, proactive management of environmental interference will remain essential for generating reliable, reproducible scientific data in field conditions.
Managing Library Development and Calibration Maintenance in Non-Lab Conditions
For researchers and drug development professionals, the migration of spectroscopic analysis from controlled laboratories to field conditions presents a unique set of challenges. The core dilemma lies in maintaining the integrity of library development and calibration protocols in environments where temperature fluctuations, humidity, vibration, and other variables are uncontrolled. Ruggedness testing of handheld spectrometers has therefore become a critical component of method validation, ensuring that instruments deployed in field settings—from manufacturing floors to remote sampling sites—deliver data that is both reliable and traceable to established standards. This guide objectively compares the performance of various handheld spectroscopic techniques within this context, providing a framework for their management outside traditional laboratory environments.
The market for these portable tools is expanding rapidly, projected to grow from $1.04 billion in 2024 to $1.91 billion by 2029, driven by the need for point-of-care diagnostics and real-time measurement solutions [18]. This growth underscores the importance of establishing robust management practices for these instruments in the field.
Performance Comparison of Handheld Spectroscopic Techniques
Different handheld spectroscopic techniques offer varying advantages and limitations for analysis in non-lab conditions. The following table summarizes the key performance characteristics of the most prevalent technologies, based on recent instrumental reviews and application studies.
Table 1: Performance Comparison of Handheld Spectrometers in Field Conditions
| Technique | Typical Applications | Key Advantages for Field Use | Limitations in Non-Lab Conditions | Reported Ruggedness Features |
|---|---|---|---|---|
| Handheld XRF [48] [23] | Elemental analysis of metals, alloys, environmental samples (e.g., soil, ash). | Rapid, non-destructive analysis; minimal sample preparation; robust analysis chamber (shutter). | Limited sensitivity for light elements; results can be affected by sample heterogeneity. | "Rugged and reliable" design; built-in iCAL standardization for continuous monitoring and correction [48]. |
| Handheld Raman(including SERS) [6] [23] [49] | Pharmaceutical raw material ID, counterfeit drug detection, SERS-based viral antigen detection [49]. | Non-destructive; provides specific molecular fingerprints; capable of through-barrier testing. | Susceptible to fluorescence interference; can require specific substrates (SERS); risk of sample burning. | Designs have become smaller while performance has increased; optimized coupling of components [23]. |
| Handheld NIR |
Pharmaceutical quality control, agricultural product testing, sports supplement adulteration detection [23]. | Fast analysis; deep penetration; minimal sample preparation required. | Complex data interpretation often requires robust calibration models; spectra can be affected by ambient humidity/temperature. | "Benchtop-level performance" in compact, impact-resistant designs with ergonomic grips [18]. |
| Handheld LIBS [23] | Forensic analysis at crime scenes, metal alloy sorting. | Excellent sensitivity to light elements; requires minimal sample preparation. | Can be semi-destructive (small ablation mark); requires direct contact with sample. | Designed specifically for "on-the-spot" forensic analysis in both handheld and tabletop modes [23]. |
Experimental Protocols for Ruggedness and Calibration Validation
To ensure data quality from handheld spectrometers in the field, specific experimental protocols must be followed. These methodologies validate both the instrument's ruggedness and the stability of its spectral libraries and calibrations.
Protocol for Translating a Lab-Based SERS Assay to a Handheld Device
A 2023 study successfully translated a label-free Surface-Enhanced Raman Spectroscopy (SERS) sensor for SARS-CoV-2 antigens from a lab-based assay to a handheld device. The following workflow details the critical steps for such a transition, highlighting points where field conditions can impact performance [49].
Key Experimental Steps and Considerations [49]:
Nanoparticle Synthesis and Functionalization:
- Method: Gold colloids (~40 nm) were synthesized via the citrate reduction method (Frens method).
- Ruggedness Consideration: The functionalization process (peptide-to-AuNP ratio, shaking time) was optimized to ensure a stable peptide monolayer. This stability is critical for reproducible binding and signal generation when handled in the field, outside of controlled lab environments.
- Characterization: Nanoparticles were characterized using Nanoparticle Tracking Analysis (NTA), Transmission Electron Microscopy (TEM), and UV-Vis spectroscopy to ensure consistent core material.
Assay Adaptation for Handheld Systems:
- Challenge: Fluorescence interference and variable sample processing can impair reproducibility in the field.
- Solution: The protocol was adapted from a planar SERS substrate to a solution-based assay using peptide-modified gold nanoparticles (peptide-AuNPs). Gold colloids are more field-suitable due to their lower cost, stability during storage, and ease of use.
- Validation: The optimized assay was used to successfully detect SARS-CoV-2 proteins directly using a handheld Raman spectrometer, confirming the viability of the translated method.
Protocol for On-Site Calibration and Maintenance
Calibration in non-lab conditions falls into two primary categories: internal calibration and in-house calibration, each with distinct requirements for maintaining traceability [50] [51].
Table 2: Calibration Methods for Non-Lab Conditions
| Calibration Method | Definition | Typical Setting | Traceability Requirements |
|---|---|---|---|
| Internal Calibration | A calibration performed within the user's laboratory and included on their scope of accreditation. | Designated, controlled calibration area on-site. | Established via accredited methods and is part of the formal quality system. |
| In-House Calibration | Calibration of reference standards or equipment by the organization's own staff, NOT on their scope of accreditation. | Performed directly in the field or on the production floor. | Must be proven with detailed records, procedures, and uncertainty budgets per standards like A2LA P102 [50]. |
| On-Site (Field) Calibration | Calibration performed at the user's facility by either in-house staff or a third-party provider. | At the point of use of the instrument. | Relies on portable master equipment, the calibration of which must be traceable to national standards (e.g., NIST) [52] [51]. |
Maintaining Calibration Traceability: The National Institute of Standards and Technology (NIST) emphasizes that establishing traceability requires an unbroken chain of comparisons, each with a stated uncertainty [52]. For in-house calibrations not on an accredited scope, this means laboratories must meet specific requirements, such as those in A2LA's P102 policy, which mandates detailed records, procedures, and complete uncertainty budgets that account for all significant contributors [50].
Preventive Maintenance vs. Calibration: It is critical to distinguish between these two functions. Preventive Maintenance (e.g., cleaning, replacing worn parts) addresses equipment functionality and lifespan, while Calibration (comparing readings to a certified standard) addresses measurement accuracy and traceability [53]. Both are essential for operating reliably in non-lab conditions.
The Scientist's Toolkit: Key Research Reagent Solutions
The successful implementation of field-deployed spectroscopic methods relies on a suite of specialized reagents and materials. The following table details key components used in the featured SERS experiment, which are representative of the broader needs in this field [49].
Table 3: Key Research Reagents and Materials for a Field-Deployed SERS Assay
| Reagent/Material | Function in the Assay | Critical Considerations for Field Use |
|---|---|---|
| Gold(III) Chloride Hydrate | Precursor for synthesis of gold nanoparticles (AuNPs), the SERS-active substrate. | Purity and consistent synthesis protocol are vital for producing uniform, sensitive AuNPs. |
| ACE-2 Mimetic Peptide | Capture molecule that selectively binds to the SARS-CoV-2 spike protein RBD. | Requires rigorous purification (HPLC) and cold storage to maintain binding affinity and specificity. |
| 4-Mercaptobenzoic Acid (MBA) | A model Raman reporter molecule; can be used for signal optimization and validation. | Used for system checks and characterizing the enhancement factor of SERS substrates. |
| Trehalose / Mannitol | Excipients used in the protein buffer formulation. | Act as stabilizers and cryoprotectants, enhancing the stability of biological components in field-ready kits. |
| Tween-80 | A non-ionic surfactant used in buffer preparations. | Prevents nonspecific adsorption and aggregation, which is crucial for maintaining nanoparticle stability in complex samples. |
Managing library development and calibration for handheld spectrometers in non-lab conditions demands a disciplined, strategic approach. The choice between techniques like XRF, Raman, and NIR depends on the application-specific balance between analytical performance and ruggedness. Furthermore, a successful quality system must integrate robust calibration protocols—choosing judiciously between laboratory, on-site, and in-house methods—with a rigorous program of preventive maintenance. As the technology continues to evolve towards greater miniaturization and connectivity, the principles of traceability, documented uncertainty, and environmental awareness will remain the foundation of reliable field-based analysis for drug development and scientific research.
Handheld spectrometers have revolutionized data collection in field conditions, from environmental monitoring to pharmaceutical development. However, their operational ruggedness depends not only on technical specifications but equally on human-system interaction. Operator-induced error represents a significant challenge in scientific fieldwork, where environmental stressors compound inherent interface limitations. This analysis examines how targeted user training and purpose-driven ergonomic design function as complementary strategies to enhance data reliability under demanding conditions.
The pursuit of methodological rigor in field research requires acknowledging that human operators constitute an integral component of the measurement system. Within the broader context of ruggedness testing, this review objectively compares how different training protocols and hardware designs mitigate variability introduced by human factors, supported by experimental data from contemporary spectrometer applications.
Experimental Comparisons: Training and Design Interventions
Quantitative Comparison of Error Reduction Strategies
The table below summarizes findings from empirical studies evaluating various approaches to minimizing operator-induced errors in spectroscopic analysis.
Table 1: Efficacy of Error Reduction Strategies in Analytical Instrumentation
| Strategy Category | Specific Intervention | Experimental Outcome | Field Applicability |
|---|---|---|---|
| Ergonomic Design | Redesigned, lighter handheld spectrometer with one-handed operation and gloved-hand controls [26] | Enables extended, fatigue-free use; reduces muscle strain by 30% in prolonged field sessions [26] | High (Geology, Mining) |
| Procedural Controls | Implementation of barcoding systems for sample tracking [54] | Prevents specimen misidentification, reducing pre-analytical errors by up to 70% [54] | Medium (Requires infrastructure) |
| Cognitive Support | User-friendly interfaces with logical control grouping and high-definition displays [26] [55] | Lowers incorrect operation likelihood; minimizes cognitive load in high-stress environments [55] | High (All field applications) |
| Structured Training | Competency-based training with regular assessments [54] | Ensures sustained proficiency; addresses knowledge gaps causing analytical mistakes [54] | High (All field applications) |
| Cultural/Systemic | Non-punitive error reporting and root cause analysis [54] [56] | Fosters proactive error identification; tackles systemic root causes rather than individual blame [56] | Medium (Requires organizational commitment) |
Methodology: Evaluating Handheld vs. Benchtop Spectrometer Performance
A critical 2023 study directly compared the performance of a handheld versus benchtop FTIR spectrometer for detecting bacterial contamination in bone grafts, providing a robust protocol for assessing operator-induced variability [45].
Experimental Protocol:
- Sample Preparation: 40 non-infected and 10 Staphylococcus epidermidis-infected human bone samples were prepared. Biofilms were developed by incubating bone allografts in a bacterial suspension (10^6 CFU/mL) at 37°C for 48 hours [45].
- Instrumentation: The Agilent 4300 Handheld FTIR (spectral resolution: 2 cm⁻¹) was compared against the Perkin Elmer Spectrum 100 ATR-IR benchtop instrument (spectral resolution: 0.5 cm⁻¹) [45].
- Data Acquisition: For both instruments, eight scans per sample were taken from three positions across the spectral range of 4000 to 650 cm⁻¹. Measurements were conducted at 22°C with controlled humidity [45].
- Analysis: Acquired spectral data was processed using principal component analysis (PCA) to objectively classify samples and detect spectral changes induced by infection [45].
Key Findings: Both instruments successfully detected the loss in bone quality due to infection when used with recommended settings and proper operator training, despite the handheld device's lower spectral resolution [45]. This underscores that appropriate methodology can mitigate technical limitations.
Ergonomic Design: Mitigating Error at the Source
Design Principles for Error-Resistant Systems
Ergonomic design proactively reduces operator-induced errors by aligning equipment capabilities with human physical and cognitive constraints.
- Physical Ergonomics: The latest handheld spectrometers emphasize lightweight, balanced designs for one-handed operation. For instance, the redesigned SPECTRO xSORT XRF analyzer incorporates a light-squeeze trigger and physical buttons optimized for gloved hands, directly countering the fatigue that leads to slips and lapses [26].
- Cognitive Ergonomics: User interfaces are optimized through high-definition displays with wide viewing angles and logical control grouping. These features minimize mental workload, especially under environmentally challenging conditions, which is critical for preventing mistakes in data acquisition [55].
- Environmental Considerations: Ergonomic design also accounts for the field environment itself. A disorganized, distracting, or physically demanding workspace significantly increases error rates. Proper design creates an environment conducive to sustained operator focus [57].
The Relationship Between Ergonomic Design and Human Error
The following diagram illustrates how specific ergonomic interventions target different categories of human failure.
Structured Training: Building Human Reliability
Competency-Based Training Frameworks
While optimal design is crucial, the role of the human operator remains paramount. Evidence indicates that structured training programs are fundamental for error reduction, yet their implementation varies significantly [54].
- Beyond Basic Operation: Effective training transcends simple instrument operation. It encompasses comprehensive understanding of underlying principles (e.g., spectroscopy basics), sample preparation protocols, data integrity principles, and troubleshooting under non-ideal field conditions [54].
- Competency Assessments: Regular, objective assessments are critical to ensure knowledge retention and procedural compliance. This moves beyond passive training to active verification of proficiency [54].
- Error Awareness: Training should include recognition of common error types—such as slips, lapses, mistakes, and violations—to help operators self-diagnose risky situations before errors occur [56].
The Training-Proficiency Workflow
A systematic approach to training directly impacts operator proficiency and, consequently, data quality. The following workflow outlines this continuous improvement cycle.
Table 2: Key Research Reagent Solutions for Spectroscopic Analysis
| Item | Function/Application | Experimental Context |
|---|---|---|
| Agilent 4300 Handheld FTIR | Field-based molecular analysis of materials [45] | Used in comparative bone infection study; spectral range 4000-650 cm⁻¹, resolution 2 cm⁻¹ [45] |
| SPECTRO xSORT Handheld XRF | On-site elemental analysis for geology, mining, and environmental screening [26] | Capable of measuring elements from Mg to U; used with portable sample chamber for diverse sample types [26] |
| Mueller-Hinton Broth | Culture medium for biofilm development in experimental contamination studies [45] | Used to cultivate Staphylococcus epidermidis ATCC 12228 for infecting bone samples [45] |
| Principal Component Analysis (PCA) | Unsupervised classification method for spectral data [45] | Statistical technique used to differentiate infected from non-infected bone samples based on spectral signatures [45] |
| Portable Sample Chambers | Containment units for field analysis of loose or irregular samples [26] | Enables consistent presentation of heterogeneous materials like soils, ores, and sediments to handheld XRF [26] |
Within the framework of ruggedness testing for handheld spectrometers, evidence confirms that hardware ruggedness and human reliability are inseparable. Ergonomic design serves as the first line of defense by creating intuitive, fatigue-resistant tools that are inherently difficult to operate incorrectly. This must be coupled with continuous training that builds not just competence but also a cognitive shield against the pressures of field conditions.
The most robust systems synergistically combine these elements. A perfectly designed spectrometer cannot compensate for an untrained operator, just as comprehensive training is undermined by poorly designed equipment that induces fatigue and cognitive overload. Therefore, evaluating handheld spectrometers for rigorous field application requires simultaneous assessment of both its technical specifications and the human-centered systems supporting its operation.
Leveraging Cloud Connectivity and Remote Expert Support for Real-Time Troubleshooting
For researchers and scientists in drug development, the demand for rapid, in-situ analysis is paramount. Handheld spectrometers have become indispensable tools in this pursuit, moving analysis from the centralized laboratory directly to the point of need, whether that is a manufacturing suite, a warehouse, or a clinical trial site. However, the rugged environments of the field present significant challenges, including instrument malfunctions, ambiguous results, and a traditional reliance on off-site expert interpretation that can halt critical workflows. This guide objectively compares the performance of modern handheld spectrometers that are equipped to overcome these hurdles through integrated cloud connectivity and remote expert support. Framed within a broader thesis on ruggedness testing, this analysis provides experimental data and protocols to evaluate how these technologies enable real-time troubleshooting, ensure data integrity, and maintain the pace of scientific discovery.
Core Technologies Demystified
The ability to troubleshoot a spectrometer in real-time relies on two interconnected technological pillars.
Cloud Connectivity: This refers to the instrument's capability to transmit data wirelessly to cloud-based platforms via Wi-Fi or cellular networks. In the context of field research, this enables the immediate transfer of spectral data from the device to a centralized data management system, such as the StrataSync platform described by VIAVI Solutions [58]. This facilitates not just data storage but also remote instrument management, including software updates and calibration tracking, ensuring all devices in a fleet are operating with the latest protocols [58]. For drug development professionals, this seamless integration with cloud-based data analytics is a key market trend, enhancing functionality and workflow efficiency [59].
Remote Expert Support: Beyond simple data transfer, this technology allows a subject matter expert, who may be thousands of miles away, to actively collaborate with a field researcher. As defined in industrial contexts, a Remote Expert solution is a software tool that integrates live video, audio, and augmented reality (AR) annotations to facilitate virtual assistance [60]. In practice, a field researcher can use a connected tablet or AR glasses to share a live video feed of a problematic instrument or sample. The remote expert can then overlay digital instructions or arrows directly onto the researcher's display, guiding them through complex calibration or maintenance procedures without being physically present [60]. This technology is powered by real-time communication tools that are becoming standard in advanced field equipment [60].
Performance Comparison of Connected Spectrometers
The integration of cloud and remote support features varies significantly across devices. The following table compares several portable spectrometers based on available technical and market data, with a focus on attributes relevant to connectivity and rugged field use.
Table 1: Performance Comparison of Select Portable Spectrometers
| Product Name | Technology | Key Connectivity & Ruggedness Features | Noted Applications | Price Range (USD) |
|---|---|---|---|---|
| SmartOTDR Handheld Fiber Tester (VIAVI) | Optical Fiber Analysis | Cloud-based data management (StrataSync); Robust wireless options; Remote control; Extended battery life (up to 20 hours) [58]. | Metro/access network testing, FTTH/PON qualification [58]. | Information Missing |
| NaturaSpec Plus (Spectral Evolution) | UV-Vis-NIR | Integrated GPS; Real-time video; Rugged handheld tablet with Windows OS and GPS [6]. | Field documentation, environmental monitoring [6]. | Information Missing |
| TaticID-1064ST (Metrohm) | Handheld Raman | On-board camera; Note-taking capability; Designed for hazardous materials teams [6]. | Security, substance identification in the field [6]. | Information Missing |
| OMNIS NIRS Analyzer (Metrohm) | NIR | Nearly maintenance-free; Ease of method development [6]. | Pharmaceutical quality control [6]. | Information Missing |
| Rugged Handheld Tablet (Spectral Evolution) | Data Processing | Windows OS; Bluetooth; GPS; IP65 rated (dust and water resistant) [61]. | Companion device for field instruments [61]. | Information Missing |
| Vanta VCA Portable (Olympus) | XRF | Rugged design for alloy analysis; Stainless Steel construction [62]. | Alloy & precious metal analysis in demanding environments [62]. | $23,000-34,000 [62] |
| Portman Raman Spectrometer | Raman (532nm) | Deep cooling technology for stability [62]. | High-performance field Raman analysis [62]. | $18,250-73,000 [62] |
The market for wireless handheld spectrometers is experiencing robust growth, currently valued at approximately $1.2 billion and projected to reach $2.1 billion by 2030, reflecting a compound annual growth rate of 7-8% [62]. Another report estimates the market for this specific category at $500 million in 2025, growing to $850 million by 2033 [59]. This expansion is fueled by the demand for rapid, on-site material analysis and the integration of AI-driven data analysis [63] [62].
Table 2: Key Market Trends and Drivers for Connected Spectrometers
| Trend Category | Description | Impact on Field Research |
|---|---|---|
| Connectivity & Data Management | Integration of Bluetooth, Wi-Fi, and cloud-based data management is becoming standard [62]. | Enables real-time data sharing, remote diagnostics, and centralized data integrity. |
| Miniaturization & Ruggedization | Devices are becoming lighter, more rugged, and user-friendly without sacrificing analytical power [62]. | Enhances portability and durability for use in harsh or remote field conditions. |
| Advanced Analytics | Integration of AI and machine learning algorithms for faster data interpretation and predictive maintenance [62]. | Accelerates insight generation and can pre-empt instrument issues. |
| Remote Expert Solutions | Use of AR, live video, and annotation tools to provide remote visual assistance [60]. | Reduces downtime by enabling experts to guide on-site personnel through complex issues. |
Experimental Protocols for Ruggedness and Connectivity Testing
To validate the performance of handheld spectrometers under realistic field conditions, a structured experimental protocol is essential. The following methodologies can be applied to assess both the instrument's ruggedness and the efficacy of its connectivity and support features.
Protocol A: Environmental Stress Testing
This protocol evaluates the physical durability of the spectrometer.
- Objective: To determine the instrument's operational stability under varying environmental stressors commonly encountered in field deployment.
- Methodology:
- Thermal Cycling: Expose the device to temperatures ranging from -5°C to 45°C, operating it at set intervals to check for measurement drift or hardware failure [62].
- Drop and Vibration Testing: Subject the device to controlled drops from a standard height (e.g., 1 meter) onto a hard surface and expose it to vibration frequencies simulating transport. Post-testing, conduct a full functional and calibration verification.
- Ingress Protection (IP) Testing: Validate the manufacturer's IP rating by testing the device's resistance to dust and water exposure in a controlled chamber [62].
- Data Analysis: Compare pre- and post-stress test results using certified reference materials. Key metrics include signal-to-noise ratio, wavelength accuracy, and measurement precision.
Protocol B: Real-Time Remote Troubleshooting Simulation
This protocol assesses the functionality and benefit of cloud and remote expert systems.
- Objective: To quantify the reduction in problem-resolution time and the improvement in first-time-fix rates when using remote expert support.
- Methodology:
- Scenario Design: Create a set of common field issues, such as an unclear error code, a suspected calibration drift, or an ambiguous spectral result.
- Control Group: Have a field technician attempt to resolve the issue using only the device's manual and on-board guidance.
- Test Group: Have a different technician address the same issue by connecting to a remote expert using the device's integrated support platform. The expert can use live video, audio, and AR annotations to guide the technician [60].
- Data Analysis: Measure and compare the mean time-to-resolution (MTTR) and success rate for both groups. User feedback on confidence and ease of use should also be collected.
The workflow for a remote troubleshooting session can be summarized as follows:
Figure 1: Remote expert support workflow for field troubleshooting.
The Scientist's Toolkit: Essential Research Reagents & Materials
For researchers conducting field spectroscopy, particularly in drug development, a set of essential reagents and materials is critical for ensuring data accuracy and instrument reliability.
Table 3: Essential Research Reagents and Materials for Field Spectroscopy
| Item | Function & Application |
|---|---|
| Certified Reference Materials (CRMs) | Crucial for daily performance validation (quality assurance) and calibration of spectrometers. They verify accuracy and precision against a known standard [62]. |
| Optical Cleaning Kit | Includes lens tissue and solvent for maintaining optical surfaces (e.g., fiber optic probes, windows). Dirty optics are a common source of low signal intensity errors [64]. |
| Portable Calibration Standards | Stable, sealed standards for specific techniques (e.g., wavelength, intensity). Used for periodic calibration checks during long field campaigns to ensure data integrity. |
| Ruggedized Laptop/Tablet | A device with an IP65 rating for dust/water resistance and integrated GPS is essential for running instrument software, data analysis, and connecting to remote experts in the field [61]. |
| Stable Power Supply | Extended-life batteries or portable power packs are necessary for intensive field use to overcome operational hurdles related to battery life [62]. |
The integration of cloud connectivity and remote expert support is transforming handheld spectrometers from simple data collection devices into nodes in a sophisticated, knowledge-sharing network. For researchers and drug development professionals, this is not merely a convenience but a critical enhancement to scientific rigor. These technologies directly address the core challenges of field-based research by enabling real-time troubleshooting, ensuring data integrity through robust cloud management, and providing immediate access to specialized expertise. As the market continues to evolve with trends in AI integration and miniaturization, the capabilities of these connected systems will only deepen, further empowering scientists to generate reliable, actionable data anywhere, and accelerating the entire drug development pipeline.
Benchmarking Performance: Validation Protocols and Comparative Analysis of Spectrometer Technologies
For researchers and scientists relying on handheld spectrometers for critical field data, a robust validation framework is not just a regulatory checkbox but a cornerstone of data integrity. This guide establishes a structured approach—from Installation Qualification (IQ) and Operational Qualification (OQ) to ongoing Performance Qualification (PQ)—specifically designed for the ruggedness testing of handheld spectrometers in non-laboratory conditions.
The migration of analytical technologies from controlled laboratories to challenging field environments represents a significant paradigm shift. Handheld spectrometers, including models for Raman, FT-IR, and XRF analysis, are now routinely deployed for tasks ranging from narcotics identification to raw material verification and environmental testing [65] [66] [19]. This transition necessitates a validation framework that moves beyond traditional benchtop protocols to one that actively demonstrates instrument reliability, accuracy, and ruggedness under real-world conditions of use. The core challenge this framework addresses is ensuring that data collected in a vibrating truck, a dusty warehouse, or a humid outdoor environment is as reliable as that generated in a stable laboratory.
The Three-Pillar Validation Framework: IQ, OQ, and PQ
The validation lifecycle for a handheld spectrometer is a continuous process, initiated upon instrument arrival and maintained throughout its operational life. The following workflow delineates the key stages and decision points.
Pillar 1: Installation Qualification (IQ)
IQ formally documents that the handheld spectrometer has been received correctly and is installed in accordance with its specified requirements.
- Physical Inspection: Verify the instrument against the packing list. Check for physical damage and ensure all components (e.g., charger, vial holders, periscope adapter) are present [66].
- Software and Documentation: Install and verify the operation of all accompanying software (e.g., MicroLab Mobile, library management systems) [67]. Confirm that all user manuals, calibration certificates, and procedural documentation are received.
- Training Records: Document that intended users have received initial training on the device's basic operation and safety protocols, a critical step for point-and-shoot field use [68] [19].
Pillar 2: Operational Qualification (OQ)
OQ demonstrates that the instrument operates according to its functional specifications in a controlled environment before field deployment.
- Core Functionality Testing:
- Laser/Wavelength Accuracy: For Raman spectrometers, verify the excitation wavelength (e.g., 785 nm, 1064 nm) using a standard such as a neon-argon lamp [19].
- Spectral Resolution and Range: Confirm the instrument's resolution (e.g., 8-16 cm⁻¹ for handheld Raman) and spectral range cover the required "fingerprint" region for your applications [66] [19].
- Library Matching Accuracy: Test the system's ability to correctly identify a set of validated standard materials from its spectral library, reporting accuracy should exceed 95% for library materials [19].
- Initial Ruggedness Checks:
- Environmental Tolerance: Test operation within the manufacturer's specified temperature range (e.g., -10°C to 50°C) and humidity levels [19].
- Vibration and Drop Resistance: Perform simple functional checks before and after simulated transit to ensure the device survives shipping, as they are designed to be "dropped, vibrated, and exposed to dust" [65].
Pillar 3: Ongoing Performance Qualification (PQ)
PQ provides continual assurance that the spectrometer consistently performs according to predefined criteria suitable for its intended field application.
- Routine Performance Verification: Before each use or on a scheduled basis (e.g., daily, weekly), analyze a stable reference standard. The resulting spectrum should match the stored reference spectrum within established control limits.
- Periodic Ruggedness Re-assessment: At defined intervals (e.g., quarterly), repeat key OQ tests to monitor for performance drift due to field use. This includes re-verifying identification accuracy and library matching reliability.
- Data Integrity and Audit Trail Review: For regulated environments, regularly review audit trails to ensure compliance with standards like 21 CFR Part 11, confirming that all analyses are attributable and legible [19].
Experimental Protocols for Ruggedness Testing in Field Conditions
Simulating and evaluating the real-world challenges a handheld spectrometer will face is the core of validating its ruggedness.
Protocol 1: Environmental Stress Testing
Objective: To determine the operational limits of the spectrometer under varying temperature and humidity conditions. Methodology:
- Place the instrument and a set of validated calibration standards in an environmental chamber.
- Starting at room temperature (25°C), collect spectra of the standards.
- Adjust the temperature in increments (e.g., +10°C, -10°C) within the manufacturer's specified range (e.g., -20°C to 50°C), allowing the instrument to equilibrate at each step before collecting new spectra [66] [19].
- Repeat the process at different relative humidity levels (e.g., 20%, 50%, 80%). Data Analysis: Compare the spectral quality (signal-to-noise ratio, baseline stability) and identification results across all conditions. A rugged instrument will maintain consistent performance and correct identification across the entire range.
Protocol 2: Through-Packaging Identification Accuracy
Objective: To validate the instrument's ability to correctly identify materials through translucent packaging, a key field application. Methodology:
- Select a panel of target analytes relevant to the application (e.g., common pharmaceuticals, narcotics, industrial chemicals).
- Package these materials in various common containers (e.g., clear plastic bags, colored vials, glass bottles).
- Using the handheld spectrometer, attempt to identify each substance through its packaging. For each test, document the laser wavelength used (785 nm vs. 1064 nm can significantly impact success with colored containers) and the success rate [65] [19]. Data Analysis: Calculate the percentage of correct identifications. This data directly supports the instrument's fitness for purpose in law enforcement or raw material verification where non-invasive testing is critical [66] [19].
Protocol 3: Comparative Performance Against Benchtop Standards
Objective: To quantify the performance gap between the handheld spectrometer and a laboratory benchtop system, establishing the boundaries of the handheld's reliability. Methodology:
- Prepare a series of samples, including pure compounds and simple mixtures.
- Analyze each sample using the handheld spectrometer under optimal field-simulated conditions.
- Analyze the same samples using a high-resolution benchtop spectrometer.
- Compare key metrics such as spectral resolution, signal-to-noise ratio, and limit of detection. Data Analysis: A study comparing benchtop (Bruker) and handheld (Agilent) FT-IR spectrometers for soil analysis found that while the benchtop system predicted soil sorption parameters with high accuracy, the handheld device produced more noisy spectra and could, at best, be used for "approximate quantitative" predictions or classifying samples into 'low' and 'high' categories [69]. This type of comparative data is essential for setting appropriate expectations for the handheld device's capabilities.
Comparative Performance Data of Handheld Spectrometer Technologies
The table below summarizes experimental data and specifications for major handheld spectrometer types, highlighting their comparative performance in field conditions.
Table 1: Comparative Performance of Handheld Spectrometer Technologies
| Technology | Key Performance Metrics (Field Conditions) | Quantitative Ruggedness Data | Best-Suited Field Applications |
|---|---|---|---|
| Handheld Raman (1064 nm) | Laser Wavelength: 1064 nm [66] [19]Spectral Range: 200-2500 cm⁻¹ [66]Accuracy: >95% ID for library materials [19] | IP Rating: IP68 & MIL-STD-810G [66]Operational Temp.: -20°C to 50°C [66] | Narcotics ID through packaging [66], Pharmaceutical RMID [19], Hazardous material screening |
| Handheld Raman (785 nm) | Laser Wavelength: 785 nm [19]Spectral Resolution: 8-19 cm⁻¹ [19]Analysis Speed: 10-30 seconds [19] | IP Rating: Typically IP65+ [19]Vibration/Shock: Ruggedized for field use [65] | General chemical ID, Polymer analysis, Quality control in manufacturing |
| Handheld FT-IR | Technology: Fourier-Transform IR [67]Sampling Interfaces: Interchangeable reflectance and diamond ATR [68] | Performance Note: More noisy spectra vs. benchtop; suitable for classification and approximate quantification [69] | Surface contaminant analysis [68], Coating measurement, Composite material inspection [68] |
| Handheld XRF | Technology: X-ray fluorescence [48]Detection: Elemental compositionSpeed: Rapid, non-destructive | iCAL Standardization: Continuous monitoring and correction for field stability [48] | Alloy identification & sorting [48], Mining & geology [48], Environmental soil screening [48] |
The Scientist's Toolkit: Essential Research Reagents and Materials
A validated instrument is only one component of a reliable field analysis. The following toolkit is essential for executing the validation protocols and ongoing performance qualification.
Table 2: Essential Research Reagent Solutions for Validation and Operation
| Item | Function in Validation & Operation | Application Example |
|---|---|---|
| Stable Reference Standards | Serves as a control material for ongoing PQ checks and OQ testing of instrument stability and spectral accuracy. | Polystyrene standards for Raman wavelength verification; certified film for FT-IR checks [19]. |
| Validated Sample Panel | A set of materials with known identity and purity used to test identification accuracy and library matching performance during OQ/PQ. | A panel of common APIs for pharmaceutical RMID validation; a set of controlled substances for forensic instrument qualification [19]. |
| Environmental Chamber | Allows for controlled simulation of field temperature and humidity conditions as part of ruggedness testing protocols. | Testing spectrometer operation and battery life at -10°C and 40°C to simulate extreme field conditions. |
| Data Analysis Software | Provides the computational power for chemometric model building, spectral comparison, and statistical process control for PQ data. | Using PLS, SVM, or Cubist algorithms to build quantitative models or classify sample quality [69]. |
| Custom Library Tools | Enables the expansion of the instrument's spectral library to include site-specific or novel materials, enhancing its application scope. | Adding spectra of new proprietary polymers or emerging illicit drugs to ensure accurate field identification [19]. |
Establishing a rigorous validation framework from IQ to ongoing PQ is fundamental to leveraging the full potential of handheld spectrometers in field research. By implementing the structured protocols and comparative analyses outlined in this guide, scientists and drug development professionals can move beyond assumptions and build a robust, data-driven foundation for trust in their field-deployed instruments. This commitment to validation ensures that the critical decisions made in the field—from releasing a raw material batch to identifying a hazardous substance—are supported by data of known and demonstrable quality.
The demand for field-deployable analytical instrumentation has grown significantly across various scientific and industrial sectors. For researchers and drug development professionals, the ability to obtain reliable data directly in the field, manufacturing setting, or laboratory periphery is invaluable. This guide provides an objective comparison of the ruggedness and field-performance of three prominent handheld spectrometer technologies: Raman spectroscopy (differentiated by 785 nm and 1064 nm laser excitations), Near-Infrared (NIR) spectroscopy, and X-Ray Fluorescence (XRF) analysis. Ruggedness—encompassing physical durability, environmental tolerance, and performance stability in non-laboratory conditions—is a critical determinant for successful field application. The following sections synthesize data from controlled studies and manufacturer specifications to evaluate these technologies within the context of rigorous field-use, supported by experimental data, performance tables, and analytical workflows.
Core Technologies and Ruggedness Implications
Handheld Raman Spectroscopy: This technique relies on the inelastic scattering of light from a laser source. The two most common laser wavelengths are 785 nm and 1064 nm. The primary ruggedness challenge for Raman systems is managing fluorescence interference, which can swamp the weaker Raman signal. The 1064 nm laser wavelength is notably less prone to inducing fluorescence in samples, a significant advantage in the field where sample composition may be unknown or complex [40]. However, this benefit can come at the cost of lower signal intensity, which may require higher laser power or longer acquisition times [70].
Handheld NIR Spectroscopy: NIR measures overtone and combination vibrations of molecular bonds, primarily C-H, O-H, and N-H. Handheld NIR devices are prized for their rapid, non-destructive analysis with minimal sample preparation. Their ruggedness is often highlighted by compliance with military standards (e.g., MIL-PRF-2800 Class 2 for the ProxiScout), ensuring they can withstand shocks, drops, and vibration encountered in industrial settings [71]. A key consideration is their stability for quantifying multiple parameters from a single spectrum.
Handheld XRF Spectroscopy: XRF measures the characteristic secondary X-rays emitted by a sample when irradiated by a primary X-ray source. It is a core technology for elemental analysis. Ruggedness in handheld XRF is paramount due to the inclusion of an X-ray source and sensitive detector electronics. Modern devices like the Vanta series are engineered for this, featuring robust designs that are IP55 rated for dust and water resistance, drop-tested per MIL-STD-810G, and capable of operating in a wide temperature range (-10 °C to 50 °C) [72]. Their ability to function with minimal sample preparation makes them exceptionally suited for harsh environments like mining sites and industrial plants [73].
Comparative Ruggedness Specifications
The table below summarizes key ruggedness and operational specifications for the three analyzer types, based on manufacturer data and peer-reviewed studies.
Table 1: Comparative Ruggedness and Field Operational Specifications of Handheld Analyzers
| Feature | Handheld Raman (785 nm) | Handheld Raman (1064 nm) | Handheld NIR | Handheld XRF |
|---|---|---|---|---|
| Key Ruggedness Challenge | Fluorescence interference from colored/organic samples [70] | Lower inherent signal intensity, potentially requiring higher power [70] [40] | Physical shock from drops and vibration [71] | Protecting X-ray tube & detector from physical and environmental damage [72] |
| Typical IP Rating | Information Missing | Information Missing | Information Missing | IP55 (dust protected, low-pressure water jets) [72] |
| Drop Test Standard | Information Missing | Information Missing | MIL-PRF-2800 Class 2 [71] | MIL-STD-810G [72] |
| Operating Temp. Range | Information Missing | Information Missing | Information Missing | -10 °C to 50 °C (14 °F to 122 °F) [72] |
| Battery Life (Typical) | Information Missing | Information Missing | ~800 scans/charge [71] | Hot-swap capable for continuous use [72] |
| Field Data Integrity | Fluorescence rejection algorithms (e.g., XTR) improve signal clarity [70] | Reduced fluorescence provides more reliable spectra in complex matrices [40] | Lab-grade insights with offline mobile app operation [71] | Integrated GPS for sample traceability; cloud-enabled data transfer [72] |
Experimental Performance Data in Field-Like Conditions
Performance Comparison: 785 nm vs. 1064 nm Raman
A critical study directly compared a 785 nm (HandyRam) and a 1064 nm (Rigaku ResQ-CQL) handheld Raman spectrometer for detecting explosive materials, providing quantitative data on their performance in field-relevant scenarios [40].
Table 2: Experimental Performance Data for Handheld Raman Spectrometers
| Performance Metric | 785 nm HandyRam | 1064 nm Rigaku ResQ-CQL |
|---|---|---|
| General Signal Intensity | Lower observed signal intensity [40] | Higher signal intensity, better resolution [40] |
| Fluorescence Interference | Exhibited fluorescence with all spectra, requiring baseline correction [40] | Minimal fluorescence; raw baseline close to zero [40] |
| Limit of Detection (LOD) for Diphenylamine (DPA) | ~100 mM (in glass vial) [40] | ~10 mM (in glass vial) [40] |
| Limit of Detection (LOD) for Ammonium Nitrate (AN) | ~500 mM (in glass vial) [40] | ~100 mM (in glass vial) [40] |
| Container Interference | Significant spectral interference from plastic containers [40] | Minimal interference from glass or plastic containers [40] |
| Overall Field Suitability | Challenged by fluorescence and container material [40] | Superior due to low fluorescence and high signal penetration [40] |
Experimental Protocol: Detection of Intact Explosives
The data in Table 2 was generated using the following methodology [40]:
- Sample Preparation: Solid analytical standards (e.g., diphenylamine, ammonium nitrate) were prepared in a series of concentrations. Solutions were measured in glass and plastic vials to assess container interference.
- Instrumentation: The handheld spectrometers were used according to manufacturer instructions. The Rigaku ResQ-CQL operates with a 1064 nm laser, while the HandyRam uses a 785 nm laser.
- Data Acquisition: Spectra were collected for each sample concentration and container type. Multiple scans were averaged to improve the signal-to-noise ratio.
- Data Analysis: The limit of detection (LOD) was determined by identifying the lowest concentration at which the analyte's characteristic Raman peaks were clearly distinguishable above the background noise. The effect of container material was assessed by comparing the spectral quality and peak intensity between glass and plastic vials.
Figure 1: Experimental workflow for handheld Raman performance evaluation.
Decision Framework for Field Deployment
Selecting the most appropriate handheld analyzer depends on the analytical goal and the specific field conditions. The following diagram outlines a decision pathway based on the primary measurement objective and key ruggedness considerations.
Figure 2: Field-deployment decision framework for handheld analyzers.
The Scientist's Toolkit: Key Research Reagent Solutions
The table below details essential materials and reagents referenced in the studies that are crucial for developing methods and validating the performance of handheld spectrometers in field conditions.
Table 3: Key Research Reagent Solutions for Spectrometer Validation
| Reagent/Material | Function in Validation & Analysis | Example Application |
|---|---|---|
| Diphenylamine (DPA) | A stabilizer in smokeless powder; used as a model analyte to test sensitivity and LOD of handheld Raman systems [40]. | Detection of explosive materials [40] |
| Acetone | Effective solvent for preparing analytical standards of organic compounds for Raman analysis, providing low limits of detection and high reproducibility [40]. | Solvent for DPA and ethyl centralite in Raman LOD studies [40] |
| Silicon Drift Detector (SDD) | Key component in handheld XRF for detecting fluorescent X-rays; provides high resolution and count rate capabilities for rapid, precise elemental analysis [72] [74]. | Enables lab-quality elemental analysis in the field [72] |
| ACE-2 Mimetic Peptide | A capture molecule used to functionalize gold nanoparticles for specific detection of viral antigens via Surface-Enhanced Raman Spectroscopy (SERS) [49]. | Developing handheld SERS sensors for SARS-CoV-2 [49] |
| Gold Nanoparticles (AuNPs) | Colloidal substrate used in SERS to greatly enhance the Raman signal of target analytes, enabling trace-level detection with handheld systems [49]. | SERS-based detection of dyes and pesticides [49] [70] |
| FD&C Red 40 (Allura Red) | A common synthetic dye; used as a challenging, fluorescent analyte to test the effectiveness of fluorescence rejection technologies in handheld Raman [70]. | Testing fluorescence rejection (XTR) in 785 nm Raman [70] |
The ruggedness of handheld spectrometers is a multi-faceted attribute, defined by their physical durability, environmental tolerance, and analytical stability outside the controlled laboratory. Based on current experimental data and product specifications:
- Handheld XRF analyzers are the most ruggedized systems for elemental analysis, with robust designs meeting military standards for drops and environmental ingress [72].
- For molecular analysis, 1064 nm handheld Raman demonstrates superior field performance for fluorescent and complex samples due to significantly reduced fluorescence interference and better signal penetration through containers [40].
- 785 nm handheld Raman systems, especially those equipped with advanced fluorescence rejection algorithms, remain powerful tools for a wide range of materials, offering a balance of performance and versatility [70].
- Handheld NIR spectrometers provide robust, lab-grade quantitative and qualitative analysis for molecular bonds, with designs built to withstand the shocks and vibrations of industrial environments [71].
The choice of technology must be driven by the analytical question, the sample properties, and the specific field conditions. The continuing evolution of components like silicon drift detectors and fluorescence mitigation software will further enhance the ruggedness and capabilities of all these portable analytical tools.
The integration of handheld spectrometers into field-based analysis represents a paradigm shift for researchers and drug development professionals. These portable devices offer the compelling advantage of real-time, on-site analysis, potentially accelerating decision-making in supply chain verification, raw material identification, and environmental monitoring. However, the critical challenge lies in establishing and maintaining a high degree of correlation between field data collected with portable units and the authoritative results generated by benchtop instruments in controlled laboratory settings. This correlation is the bedrock of data integrity, a non-negotiable requirement for regulatory compliance in highly scrutinized sectors like pharmaceuticals.
The fundamental question for scientists is whether a handheld device can provide data of sufficient quality and reliability to be used in decisions that would traditionally require benchtop analysis. This guide provides an objective comparison of the performance of these two classes of instruments, supported by experimental data and structured within a framework of ruggedness testing. It addresses the key technical considerations, from inherent performance trade-offs to environmental vulnerabilities, and outlines methodologies to validate field data against gold-standard laboratory results, ensuring compliance with stringent regulatory standards.
Performance Comparison: Handheld vs. Benchtop Spectrometers
The choice between handheld and benchtop spectrometers involves a series of trade-offs between analytical performance and operational flexibility. The following table summarizes the core differences based on current market offerings and research findings.
Table 1: Objective Performance Comparison of Benchtop and Handheld Spectrometers
| Feature | Benchtop Spectrometers | Handheld Spectrometers |
|---|---|---|
| Analytical Performance | Superior resolution and sensitivity; lower detection limits [69]. | Generally lower resolution and sensitivity; more susceptible to environmental noise [69]. |
| Environmental Ruggedness | Designed for climate-controlled labs; susceptible to vibration, humidity, and temperature fluctuations. | Built for field use; often feature IP-rated enclosures for dust/water resistance and can withstand minor drops [62]. |
| Sample Throughput & Flexibility | High-throughput for many samples; handles complex prep and a wide range of sample types. | Rapid, single-point analysis; ideal for large, bulky, or fixed-location items. |
| Data Integrity & Compliance | Fully validated processes; integrated with LIMS; easier to maintain audit trails. | Higher risk of data integrity issues; requires robust procedures for calibration and traceability [75]. |
| Operational Cost & Skill | High initial capital expenditure; requires highly skilled technicians. | Lower initial cost; designed for use by non-specialists, though training is critical [76] [62]. |
A direct comparative study highlights these performance differences. Research published in ScienceDirect directly compared a benchtop Bruker FTIR spectrometer to a handheld Agilent FTIR spectrometer for predicting soil phosphorus sorption capacity [69]. The benchtop system generated "'excellent' models" with high accuracy for both ball-milled and coarse (<2 mm) samples. In contrast, the handheld device produced models with more noise and lower resolution. Its performance was highly dependent on sample preparation, achieving only an "'approximate quantitative model'" for ball-milled samples and a "'fair model'" for coarse samples, suitable only for classifying 'low' or 'high' capacity [69]. This underscores that while handhelds can be effective, their results are often more approximate and sample-sensitive than benchtop equivalents.
Experimental Protocols for Correlation and Ruggedness Testing
To ensure data from handheld spectrometers is reliable, structured experimental protocols are essential. The following methodology provides a framework for validating a handheld instrument against a benchtop reference.
Protocol for Method Correlation
Objective: To establish a statistical correlation between results from a handheld spectrometer and a benchtop spectrometer for a specific application (e.g., active pharmaceutical ingredient verification).
Materials:
- Benchtop FTIR or NIR Spectrometer (e.g., Bruker Vertex NEO, PerkinElmer Spotlight) [6].
- Handheld Spectrometer (e.g., SciAps vis-NIR, Metrohm TaticID-1064ST) [6] [77].
- Certified Reference Materials (CRMs) and a diverse set of test samples spanning expected concentrations.
- Data analysis software (e.g., PLS, SVM, or Cubist algorithms for model building) [69].
Methodology:
- Sample Preparation: Analyze a statistically significant number of samples (n>30) representing the entire specification range. For solid dosage forms, this may include intact tablets, lightly crushed powders, and pure API.
- Instrumental Analysis: First, analyze all samples using the benchtop spectrometer under optimized, controlled conditions to establish the reference value. Then, analyze the same samples using the handheld device in conditions mimicking the field (e.g., variable lighting, temperature).
- Data Processing: Collect spectra from both instruments. For the handheld, multiple readings per sample should be taken to assess precision.
- Statistical Correlation: Use regression analysis (e.g., Ordinary Least Squares) to plot the handheld results against the benchtop reference values. Key metrics to calculate include:
- Correlation Coefficient (R²): A value >0.95 is typically targeted for a strong correlation.
- Slope and Intercept: The ideal is a slope of 1 and an intercept of 0.
- Root Mean Square Error (RMSE): Quantifies the average difference between the two methods.
Protocol for Ruggedness Testing in Field Conditions
Objective: To evaluate the robustness of the handheld spectrometer and its results under varying environmental and operational stresses.
Methodology:
- Environmental Stress Tests:
- Temperature: Perform analysis with the same standard sample across a defined temperature range (e.g., 5°C to 40°C).
- Humidity: Test performance at low (e.g., 20%) and high (e.g., 80%) relative humidity.
- Ambient Light: Compare results in darkness, standard lab lighting, and direct sunlight.
- Operator-to-Operator Variability: Have multiple trained and untrained operators analyze the same set of samples. Record the standard deviation of the results to assess the dependency on operator skill.
- Instrument Durability Tests: While manufacturers provide specifications, note the device's IP rating for dust/water resistance and its ability to withstand minor drops [62]. Monitor calibration stability over time and with repeated use.
This workflow diagrams the logical sequence for validating a handheld spectrometer, from initial setup to final decision-making, ensuring data integrity is assessed at every stage.
Data Integrity and Regulatory Compliance Framework
Using handheld spectrometers in a regulated environment like pharmaceutical development introduces specific risks to data integrity, a primary focus of agencies like the FDA. The core principles of data integrity—often summarized by the acronym ALCOA+ (Attributable, Legible, Contemporaneous, Original, and Accurate)—must be maintained for every field measurement.
A key risk is "scope creep," where a device approved for a simple, specific use (e.g., identifying a known substance) is used for more complex analyses (e.g., identifying mixtures or unknown novel psychoactive substances) without proper validation [75]. This is a major regulatory concern. Furthermore, the UK Forensic Science Regulator has highlighted risks from a "lack of centralised ownership of training and competency," which can lead to misinterpretation of results, and from the "lack of quality assurance for the kits currently approved" [75].
To ensure compliance, the following controls are essential:
- Strict User Access Management: Handheld devices must have secure login to ensure results are attributable to a specific trained user.
- Audit Trails: The software should maintain a secure, computer-generated audit trail that records the user, date, time, and any changes to data or method parameters.
- Calibration and Maintenance Logs: A rigorous schedule for instrument calibration and performance verification using Certified Reference Materials (CRMs) must be documented and adhered to.
- Data Transmission Security: When data is transferred from the handheld device to a central Laboratory Information Management System (LIMS), the process must be secure and validated to prevent data corruption or loss.
The Scientist's Toolkit: Essential Research Reagent Solutions
The following table details key materials and instruments crucial for conducting rigorous correlation and ruggedness testing of handheld spectrometers.
Table 2: Essential Research Reagents and Materials for Spectrometer Validation
| Item Name | Function & Importance in Validation |
|---|---|
| Certified Reference Materials (CRMs) | Provides a traceable and unambiguous standard for calibrating both benchtop and handheld instruments and for verifying analytical accuracy. Essential for proving data integrity. |
| Stable Validation Sample Set | A curated, stable set of real-world samples that span the expected concentration range and matrix variability. Used to build the correlation model between instrument types. |
| Benchtop Spectrometer | Serves as the reference (gold standard) instrument. Its highly controlled environment and superior performance provide the benchmark against which the handheld device is validated [69]. |
| Handheld Spectrometer | The Device Under Test (DUT). Must be selected based on the specific analytical technique (e.g., Raman, NIR) required for the application and its ruggedness specifications [62]. |
| Chemometric Software | Software equipped with algorithms (e.g., PLS, SVM, Random Forest) is necessary to process spectral data and build the statistical models that correlate handheld and benchtop results [69]. |
| Environmental Chamber | Allows for controlled ruggedness testing by simulating different field conditions (temperature, humidity) to assess their impact on the handheld spectrometer's performance. |
The journey toward fully reliable field spectroscopy in regulated industries is one of careful validation, not blind trust. While this guide demonstrates that performance gaps between handheld and benchtop spectrometers persist, particularly in complex analytical scenarios, the technology is rapidly evolving. The trend is clear: the market is moving towards miniaturization without sacrificing analytical power [76] [62].
Future advancements are poised to further bridge the correlation gap. The integration of Artificial Intelligence (AI) and machine learning is already improving data interpretation and predictive maintenance [76]. Furthermore, cloud connectivity and IoT platforms enable real-time data validation, remote expert oversight, and fleet-wide calibration management, significantly enhancing data integrity frameworks [76]. For researchers and drug development professionals, the path forward involves a hybrid approach: leveraging the speed and convenience of handheld devices for rapid, on-site screening, while maintaining a disciplined, protocol-driven reliance on benchtop instrumentation for definitive, compliance-critical analysis. Through rigorous ruggedness testing and continuous method validation, the scientific community can safely harness the power of portable spectroscopy.
For researchers and drug development professionals, selecting a handheld spectrometer extends far beyond comparing initial purchase prices. The Total Cost of Ownership (TCO) encompasses a complex interplay between the instrument's ruggedness, its analytical performance in field conditions, and its efficiency within operational workflows. The global portable spectrometer market, currently valued at approximately $1.2 billion and projected to reach $2.1 billion by 2030, is fueled by demand for rapid, on-site analysis across diverse sectors [62]. This growth is characterized by technological trends toward miniaturization, the integration of artificial intelligence (AI) and machine learning (ML) algorithms, and enhanced connectivity [62] [23]. However, high initial investment costs and challenges in maintaining accuracy comparable to benchtop instruments remain significant barriers [62]. This guide provides an objective comparison of handheld spectrometers, focusing on the TCO factors that are critical for successful deployment in rigorous field research and drug development environments.
The landscape of handheld spectrometers is diverse, with technology selection being fundamentally dictated by the application's specific analytical requirements.
Table 1: Common Handheld Spectrometer Technologies and Applications
| Technology | Analytical Principle | Ideal Applications | Key Considerations |
|---|---|---|---|
| Handheld XRF | X-ray Fluorescence | Alloy & precious metal analysis, mining, environmental testing [62] [78] | Excellent for elemental analysis; cannot detect light elements like Carbon with some techniques [62] |
| Handheld Raman | Raman Spectroscopy | Pharmaceutical verification, narcotic & explosive detection, raw material ID [77] [19] | Non-destructive; requires no sample prep; can identify substances through packaging [19] |
| Handheld NIR | Near-Infrared Spectroscopy | Food safety, agricultural analysis, pharmaceutical QC, moisture content [79] [80] | Penetrates samples deeply; minimal sample preparation; suitable for quantitative analysis [80] |
| Handheld LIBS | Laser-Induced Breakdown Spectroscopy | Carbon analysis in metals, scrap metal recycling, forensic investigation [62] [23] | Provides a viable alternative to XRF for light elements like carbon, lithium, and beryllium [62] |
Leading companies in this space include Thermo Fisher Scientific, Bruker, Olympus, and Metrohm [62] [77] [78]. These vendors offer ecosystems that include specialized software, spectral libraries, and support services, which are critical components of the long-term TCO [77] [78].
Performance & Cost Comparison
Selecting the "best" spectrometer is highly application-dependent. The following comparison synthesizes data from supplier information to highlight key attributes for informed decision-making [62].
Table 2: Handheld Spectrometer Performance and Cost Comparison
| Product Name / Model | Technology | Price Range (USD) | Key Attributes & Applications |
|---|---|---|---|
| Olympus Vanta VCA | XRF | $23,000 - $34,000 | Stainless Steel analysis, Alloy & Precious Metal Analysis [62] |
| Portman 532nm Portable Raman | Raman | $18,250 - $73,000 | 532nm laser, Deep Cooling technology [62] |
| WESTTUNE EX5000 | XRF | $12,000 - $15,000 | SDD Detector, Alloy Mineral Analysis [62] |
| Laboao Portable Handheld Raman | Raman | $13,000 - $14,000 | Drug Detection, Gemstone Identification, Cooperated with Fortune 500 [62] |
| Science Gears RS1500DI | Raman | Information Missing | Purpose-built for law enforcement; comprehensive narcotic library [19] |
| Metrohm OMNIS NIR | NIR | Information Missing | Lab-based; automated with sample robot for high-throughput; multiple quantitative analyses simultaneously [80] |
Total Cost of Ownership (TCO) Factors
A comprehensive TCO assessment must look beyond the initial purchase price to include [62]:
- Initial Investment: The base price of the instrument.
- Maintenance and Calibration: Costs for annual preventative maintenance, calibration standards, and performance verification. Simpler designs like some NIR instruments may only require annual lamp and air filter replacement, drastically reducing upkeep [80].
- Consumables: Expenses for items like calibration gases (for LIBS), certified reference materials (CRMs), and spare parts.
- Training: Costs associated with operator training to ensure data quality and instrument longevity.
- Operational Efficiency: The impact on workflow. For example, a device that can perform multiple quantitative analyses in about 10 seconds, like the OMNIS NIR, can significantly boost lab throughput and free personnel for other tasks [80].
- Downtime: The financial impact of instrument failure, which can be mitigated by choosing a rugged device and a vendor with reliable technical support.
Experimental Protocols for Ruggedness Testing
For field research, an instrument's ruggedness—its ability to withstand physical stress and environmental variability—is not an accessory feature but a core requirement for data integrity and a low TCO. The following protocols provide a framework for evaluating ruggedness under controlled conditions that simulate field use.
Protocol A: Mechanical Stress Testing
Objective: To evaluate the device's physical durability against shocks, vibrations, and drops.
- Methodology:
- Drop Test: Perform a minimum of 12 drops from a height of 1.5 meters onto a 50-mm-thick plywood board over a concrete floor, ensuring different faces, edges, and corners impact the surface. This aligns with MIL-STD-810G standards referenced by some manufacturers [19].
- Vibration Test: Subject the device to sinusoidal vibration profiles (5-500 Hz) for 1 hour per axis along all three orthogonal axes.
- Performance Metrics: Post-test functionality, spectral wavelength stability (< 0.1 nm shift), and accuracy (deviation from pre-test CRM analysis < 5%).
Protocol B: Environmental Tolerance Testing
Objective: To assess performance under extreme temperatures, humidity, and particulate ingress.
- Methodology:
- Thermal Cycling: Place the device in an environmental chamber and cycle between -10°C and 50°C, holding at each extreme for 2 hours. Repeat for 10 cycles [19].
- Humidity Exposure: Maintain the device at 40°C and 95% relative humidity for 48 hours.
- Ingress Protection (IP) Testing: Expose the device to dust and water jets per the IP code (e.g., IP65 for dust-tight and water-resistant devices) [19].
- Performance Metrics: Operational functionality during and after tests, absence of internal condensation, and no significant drift in baseline signal or resolution.
Protocol C: Analytical Performance Validation
Objective: To verify that field conditions and device ruggedness do not compromise analytical results.
- Methodology:
- CRM Analysis: Analyze a set of 10 certified reference materials relevant to the application (e.g., certified alloy standards for XRF, pharmaceutical APIs for Raman) both before and after mechanical and environmental stress tests.
- Limit of Detection (LOD): Measure the LOD for a key element or compound pre- and post-testing.
- Performance Metrics: Accuracy (>95% match to CRM values), precision (relative standard deviation <3%), and consistent LOD.
The logical relationship between these testing protocols and their impact on TCO can be visualized as an integrated workflow.
Diagram 1: Integrated ruggedness testing workflow and its impact on TCO. Successful passage of these tests directly leads to lower long-term costs.
Operational Workflow Integration
A spectrometer's true value is realized only when it is seamlessly integrated into the researcher's workflow. Key considerations include:
- Data Management and Connectivity: Modern handheld spectrometers come with Bluetooth, Wi-Fi, and cloud-based data management as standard features, facilitating real-time data sharing and remote diagnostics [62]. The ability to export data in compatible formats (CSV, PDF) and achieve direct LIMS (Laboratory Information Management System) integration is crucial for efficiency and data integrity in regulated environments like pharmaceutical development [62] [80].
- Automation for High-Throughput Labs: For labs processing hundreds of samples, automation is a game-changer. Systems like the Metrohm OMNIS NIR can be automated with a sample robot, allowing for hundreds of unattended analyses, which minimizes manual intervention and user error [80].
- Compliance and Data Integrity: In drug development, instruments must comply with regulations such as 21 CFR Part 11 for electronic records and signatures [19]. Features like audit trails, user access controls, and data integrity adhering to ALCOA+ principles (Attributable, Legible, Contemporaneous, Original, Accurate) are non-negotiable [19].
The following diagram illustrates how a well-integrated handheld spectrometer creates an efficient, closed-loop operational workflow in a pharmaceutical or research setting.
Diagram 2: Operational workflow for handheld spectrometers, showing a closed-loop process from sample to action.
The Scientist's Toolkit: Essential Research Reagent Solutions
To ensure the accuracy and reliability of handheld spectrometers in the field, a set of essential reagents and materials is required for performance verification and calibration.
Table 3: Essential Research Reagents for Spectrometer Validation
| Item | Function & Importance | Application Context |
|---|---|---|
| Certified Reference Materials (CRMs) | Provides a ground truth for instrument calibration and accuracy verification. Essential for quantitative analysis and method validation. | All techniques (XRF, Raman, NIR); Must match the sample matrix (e.g., alloys, pharmaceuticals, soils) [62] |
| Validation Check Samples | Used for daily or weekly performance checks to ensure the instrument remains within specified operational parameters. | Quality control in regulated environments (e.g., pharmaceutical QA/QC) [19] |
| Calibration Standards | Traceable standards used to build and maintain the instrument's calibration model, ensuring measurement traceability. | Required for all quantitative analyses; critical for NIR calibration models [62] [80] |
| Specialized Solvents & Cleaners | For safe and effective cleaning of the instrument's optical window to prevent contamination and signal attenuation. | All techniques; crucial for maintaining data integrity and preventing cross-contamination [19] |
Evaluating the Total Cost of Ownership for a handheld spectrometer requires a holistic view that balances upfront cost with ruggedness, analytical performance, and workflow efficiency. By 2025, the market will see even greater integration of AI-powered data analysis, enhanced connectivity, and a focus on democratizing access to analytical tools [77] [23]. For researchers and drug development professionals, the optimal choice is the instrument that provides reliable, actionable data at the point of need with minimal operational friction and long-term reliability. A rigorous evaluation based on the structured protocols and TCO factors outlined in this guide will lead to a more informed investment, ultimately driving efficiency and innovation in scientific research.
Conclusion
Ruggedness testing is not a mere checkbox but a fundamental requirement for the successful deployment of handheld spectrometers in critical field applications within biomedical and clinical research. A systematic approach—grounded in established standards, tailored to specific applications, and focused on continuous troubleshooting and validation—ensures that these powerful analytical tools deliver reliable, lab-quality data where it is needed most. The future points toward deeper integration of AI for predictive diagnostics, enhanced multi-technology platforms for comprehensive analysis, and the development of even more resilient devices capable of operating in extreme environments. As the technology continues to evolve, robust ruggedness testing protocols will be paramount in unlocking the full potential of handheld spectrometry for point-of-care diagnostics, forensic science, and remote environmental and pharmaceutical monitoring, ultimately accelerating and de-risking drug development pipelines.
References
- 1. What are IP and MIL-STD ratings? | Acronyms explained [https://www.ruggear.com/company/worth-knowing/ip-and-mil-std.html]
- 2. What are IP Ratings and MIL-STD for radios? [https://www.hytera.us/resources/what-are-two-way-radios-ip-rating-mil-std/]
- 3. IP67-Rated Handheld Spectrometer Is Small And Wireless [https://www.fierceelectronics.com/components/ip67-rated-handheld-spectrometer-small-and-wireless]
- 4. TacticID [https://www.metrohm.com/en/products/raman-spectroscopy/tacticid.html]
- 5. Test chambers for MIL-STD-810 tests [https://www.weiss-technik.com/environmental-simulation/en/detailpages/mil-std-810]
- 6. 2025 Review of Spectroscopic Instrumentation [https://www.spectroscopyonline.com/view/2025-review-of-spectroscopic-instrumentation]
- 7. Top Three Characteristics of a Good Handheld Spectrometer [https://www.axiomoptics.com/blog/top-three-characteristics-of-a-good-handheld-spectrometer/]
- 8. Ingress Protection (IP) Testing [https://infinitalab.com/product-testing-service/ingress-protection-ip-testing/?srsltid=AfmBOoo-dyXotkTdvaI8rOIMnp2p_TPFpYv7a4R1t6WTiAXa_qRMEpZ-]
- 9. Portable, Laboratory and UV-VIS Spectrophotometers [https://my.hach.com/portable-lab-spectrophotometers]
- 10. Prometheus Panta: Stability Characterization for Biologics ... [https://nanotempertech.com/prometheus/biologics/]
- 11. Experimental and simulative thermal stability study of ... [https://www.sciencedirect.com/science/article/pii/S2214157X21007292]
- 12. Which Battery to Choose for Handheld XRF Spectrometers? [https://tefoo-energy.com/news/which-battery-to-choose-for-handheld-xrf-spectrometers/]
- 13. Optimization of battery charging and discharging strategies in ... [https://pmc.ncbi.nlm.nih.gov/articles/PMC11402101/]
- 14. MOBILE-IR II FT-IR Spectrometer [https://www.bruker.com/en/products-and-solutions/infrared-and-raman/ft-ir-routine-spectrometer/mobile-ir-ii-ft-ir-spectrometer.html]
- 15. Battery lifetime prediction across diverse ageing conditions ... [https://www.nature.com/articles/s42256-024-00972-x]
- 16. Integrated photonic spectrometers: a critical review [https://www.spiedigitallibrary.org/journals/photonics-insights/volume-4/issue-4/R10/Integrated-photonic-spectrometers-a-critical-review/10.3788/PI.2025.R10.full]
- 17. Scalable on-chip diffractive speckle spectrometer with high ... [https://www.nature.com/articles/s41377-025-01797-y]
- 18. Miniaturized Spectrometer Market Trends 2025-2029 [https://natlawreview.com/press-releases/miniaturized-spectrometer-market-trends-2025-2029-regional-outlook-and]
- 19. Handheld Raman spectrometer [https://www.sciencegears.com.au/handheld-raman-spectrometers]
- 20. Comparison of Portable and Bench-Top Spectrometers for Mid ... [https://pmc.ncbi.nlm.nih.gov/articles/PMC5948483/]
- 21. A Comparison of Portable Infrared Spectrometers ... [https://www.spectroscopyonline.com/view/comparison-portable-infrared-spectrometers-portable-raman-spectrometers-and-color-based-field-tests]
- 22. Portable Handheld Spectrometer Analysis 2025 and ... [https://www.archivemarketresearch.com/reports/portable-handheld-spectrometer-438371]
- 23. Portable and Wearable Spectrometers in Our Future [https://www.spectroscopyonline.com/view/portable-and-wearable-spectrometers-in-our-future]
- 24. Advances in cost-effective integrated spectrometers | Light [https://www.nature.com/articles/s41377-022-00853-1]
- 25. Handheld Spectrometer in the Real World: 5 Uses You'll ... [https://www.linkedin.com/pulse/handheld-spectrometer-real-world-5-uses-youll-gvvbf]
- 26. New SPECTRO xSORT Handheld XRF Application Packages [https://www.spectro.com/about-us/press/press-releases/press-releases-and-events/2025/april/spectro-expands-xsort-handheld-xrf-applications-for-geology-mining-environmental-testing-and-compliance-screening]
- 27. Field Explosives Detectors—Current Status and ... [https://www.mdpi.com/1424-8220/25/19/6024]
- 28. Pharmaceutical analysis with portable spectrometers [https://www.europeanpharmaceuticalreview.com/article/168732/pharmaceutical-analysis-with-portable-spectrometers/]
- 29. Robustness Tests [https://www.chromatographyonline.com/view/robustness-tests]
- 30. 10.3 Different ways to evaluate robustness [https://sisu.ut.ee/lcms_method_validation/103-different-ways-evaluate-robustness/]
- 31. Nested designs in ruggedness testing [https://www.sciencedirect.com/science/article/abs/pii/S0731708599001120]
- 32. The Benefits of a High-Performance, Handheld Raman ... [https://www.americanpharmaceuticalreview.com/Featured-Articles/126738-The-Benefits-of-a-High-Performance-Handheld-Raman-Spectrometer-for-the-Rapid-Identification-of-Pharmaceutical-Raw-Materials/]
- 33. Tech That Protects [https://www.delawarebio.org/news/709603/Tech-That-Protects.htm]
- 34. Handheld Chemical and Metal Detector Market [https://www.futuremarketinsights.com/reports/handheld-chemical-and-metal-detector-market]
- 35. Drift suppression method based on signal stability ... [https://www.sciencedirect.com/science/article/abs/pii/S1051200424004378]
- 36. Detection of Calibration Drift in Clinical Prediction Models ... [https://pmc.ncbi.nlm.nih.gov/articles/PMC8627243/]
- 37. Stress-engineered ultra-broadband spectrometers - PMC [https://pmc.ncbi.nlm.nih.gov/articles/PMC12077514/]
- 38. Optical Spectrometers introduction - Must read [https://www.avantes.com/support/theoretical-background/introduction-to-spectrometers/]
- 39. The Use of Portable and Handheld Raman ... [https://www.spectroscopyonline.com/view/use-portable-and-handheld-raman-spectroscopy-forensic-investigations]
- 40. Evaluation of handheld Raman spectrometers for the ... [https://www.sciencedirect.com/science/article/abs/pii/S0379073823003250]
- 41. Comparison of Laboratory and Handheld Raman ... [https://www.spectroscopyonline.com/view/comparison-laboratory-and-handheld-raman-instruments-identification-counterfeit-medicines]
- 42. Handheld or Raman device? We can help. [https://www.opioiddata.org/handheld-support/]
- 43. Evaluating the Effect of Environmental Factors on ... [https://www.lisungroup.com/news/technology-news/evaluating-the-effect-of-environmental-factors-on-the-performance-of-portable-spectrophotometers-for-remote-sensing-applications-a-study-of-reflectance-measurements.html?srsltid=AfmBOoqY-UUP9g70fdF_M0ejatZNmVuWe5zrZvkyYQiRl1EnHk7GeFwB]
- 44. Handheld Particulate Pollution Meter| Omega Engineering [https://www.dwyeromega.com/en-us/handheld-particulate-pollution-meter/p/HHTP21-Meter?srsltid=AfmBOoqI6mEWCmOFkj908QsHFgE5H3tyeierxCWKHsPQImfZ-b0wyBlY]
- 45. Comparison of Mid-Infrared Handheld and Benchtop ... [https://pmc.ncbi.nlm.nih.gov/articles/PMC10525239/]
- 46. Raman spectrometers [https://www.metrohm.com/en/products/raman-spectroscopy.html]
- 47. Environmental Test Instruments - GAOTek Inc. [https://gaotek.com/category/environmental/]
- 48. Handheld XRF Analyzers for Elemental Analysis [https://www.spectro.com/products/handheld-xrf-analyzer]
- 49. handheld surface enhanced Raman spectroscopy (SERS ... [https://pmc.ncbi.nlm.nih.gov/articles/PMC10633093/]
- 50. In-House Calibrations vs Internal Calibrations [https://a2la.org/in-house-calibrations-vs-internal-calibrations/]
- 51. On-Site vs. Laboratory Calibration: Which is Right for Your ... [https://alsaqrengg.com/on-site-vs-laboratory-calibration/]
- 52. Calibration Policies | NIST [https://www.nist.gov/calibrations/policies]
- 53. Preventive Maintenance vs Calibration [https://teurprogroup.com/preventive-maintenance-vs-calibration/]
- 54. Laboratory Errors: Types, Causes, and How to Avoid Them? [https://blog.creliohealth.com/laboratory-errors-common-types-causes-and-preventive-strategies/]
- 55. How can ergonomic design reduce human error in process ... [https://www.linkedin.com/advice/3/how-can-ergonomic-design-reduce-human-error-process]
- 56. Managing human failures: Overview [https://www.hse.gov.uk/humanfactors/topics/humanfail.htm]
- 57. Best Methods to Reduce Human Error in Manufacturing [https://www.dozuki.com/blog/best-methods-to-reduce-human-error-in-manufacturing]
- 58. SmartOTDR Handheld Fiber Tester [https://www.viavisolutions.com/en-us/products/smartotdr-handheld-fiber-tester]
- 59. Wireless Handheld Spectrometer Strategic Market Roadmap [https://www.datainsightsmarket.com/reports/wireless-handheld-spectrometer-1645757]
- 60. Remote Expert: The Ultimate Guide to Industrial AR ... [https://pluto-men.com/remote-expert/]
- 61. Rugged Handheld Tablet [https://spectralevolution.com/product/rugged-handheld-tablet/]
- 62. Portable Spectrometers: Top Picks for 2025 [https://www.accio.com/plp/portable_spectrometers]
- 63. Top High Spectrometer Companies & How to Compare Them ... [https://www.linkedin.com/pulse/top-high-spectrometer-companies-how-compare-them-2025-slqxe/]
- 64. Spectrophotometer Selection and Troubleshooting [https://sperdirect.com/fil/blogs/news/spectrophotometer-selection-and-troubleshooting-a-practical-guide?srsltid=AfmBOoqckXZQWkhnvFe236dAFlqurXEwsVJDNkJUzDphiCbE2UjRfody]
- 65. Handheld Raman spectrometers [https://www.metrohm.com/en/products/raman-spectroscopy/handheld-raman-spectrometers.html]
- 66. CQL Narc-ID Handheld 1064 nm Raman Analyzer [https://rigaku.com/products/handheld-raman/cql-narc-id]
- 67. 4300 Handheld FTIR Spectrometer [https://www.agilent.com/en/product/molecular-spectroscopy/ftir-spectroscopy/ftir-compact-portable-systems/4300-handheld-ftir?srsltid=AfmBOormni4a13Utwdx28FLKSwcKMs6UQNu5bkpRKEa2GYQ_H_JoHZzE]
- 68. Handheld FT-IR Spectrometers: Bringing the ... [https://www.spectroscopyonline.com/view/handheld-ft-ir-spectrometers-bringing-spectrometer-sample]
- 69. Comparing the potential of benchtop and handheld mid ... [https://www.sciencedirect.com/science/article/pii/S1386142524010229]
- 70. applications: Cutting edge... | Metrohm Handheld 785 nm Raman [https://www.metrohm.com/en/discover/blog/20-21/handheld-785-nm-raman-applications--cutting-edge-material-id-cap.html]
- 71. ProxiScout [https://www.buchi.com/en/products/instruments/proxiscout]
- 72. Vanta Handheld XRF Environmental Analyzer [https://ims.evidentscientific.com/en/applications/vanta-for-environmental-assessments]
- 73. PMI Guns: The Top XRF Analyzers on the Market | Guide [https://mfe-is.com/pmi-gun-xrf-analyzer/]
- 74. Analysis of the State of the Art: XRF [https://www.spectroscopyonline.com/view/analysis-state-art-xrf]
- 75. Regulator's notification 02-2025: drug testing kits (accessible) [https://www.gov.uk/government/publications/regulators-notification-02-2025-drug-testing-kits/regulators-notification-02-2025-drug-testing-kits-accessible]
- 76. Spectrometer Market 2025–2035: Portable, AI & Cloud ... [https://www.marketbusinessinsights.com/spectrometer-market]
- 77. Handheld Spectrometer in the Real World: 5 Uses You'll ... [https://www.linkedin.com/pulse/handheld-spectrometer-real-world-5-uses-youll-actually-uptsc/]
- 78. Top Handheld XRF Spectrometer Companies & How to ... [https://www.linkedin.com/pulse/top-handheld-xrf-spectrometer-companies-how-compare-cmlzc/]
- 79. Unveiling the transformative power of near-infrared ... [https://www.sciencedirect.com/science/article/pii/S0928098725001745]
- 80. Boost Operational Productivity with Rapid and Reliable ... [https://www.labmanager.com/boost-operational-productivity-with-rapid-and-reliable-nir-spectroscopic-analysis-33025]