Beyond the Spectrum: Advanced AI and Machine Learning for Complex Spectral Data Analysis
This article provides a comprehensive overview of cutting-edge data analysis techniques transforming the interpretation of complex spectral data.
Beyond the Spectrum: Advanced AI and Machine Learning for Complex Spectral Data Analysis
Abstract
This article provides a comprehensive overview of cutting-edge data analysis techniques transforming the interpretation of complex spectral data. Tailored for researchers and drug development professionals, it explores the evolution from classical chemometrics to modern artificial intelligence (AI) and machine learning (ML). We cover foundational concepts, delve into specific methodological applications—including real-world case studies in pharmaceutical analysis and remote sensing—and address critical troubleshooting and optimization strategies. The content also provides a comparative analysis of model validation techniques, offering a practical guide for selecting the right tools to enhance accuracy, efficiency, and reliability in biomedical and clinical research.
The New Landscape of Spectral Analysis: From Classical Chemometrics to Modern AI
Troubleshooting Guides
Guide: Correcting Spillover and Unmixing Errors in Spectral Flow Cytometry
Problem: Incorrect spillover identification in spectral flow cytometry leads to skewed data and artificial correlations or anti-correlations between channels [1].
Diagnostic Symptoms:
- Skewed Signals: Populations appear to "lean" into an adjacent channel [1].
- Hyper-negative Events: Events appear below zero on the axis, which is biologically impossible and indicates an artifact [1] [2].
- Correlation/Anti-correlation: An unexpected strong correlation between two channels, especially those with overlapping emission spectra [1].
Protocol for Resolution:
- Inspect Single-Color Controls: Verify that the controls are correctly compensated or unmixed. Check for automated gating errors that may have misidentified positive and negative populations [1] [2].
- Compare Brightness: Ensure the fluorescence intensity in your single-color control is as bright or brighter than in your fully stained experimental samples [2].
- Validate Reagents and Treatment: Confirm that the exact same fluorophore was used in controls and samples, and that both were treated identically (e.g., same fixation protocol) [2].
- Check for Tandem Dye Breakdown: If a tandem dye (e.g., PE-Cy7) breaks down, its emission spectrum can shift, causing spillover errors not present in the control. This requires new staining with fresh reagents [1].
- Re-make Controls if Necessary: If controls are flawed (e.g., made with beads instead of cells, or are contaminated), new controls must be prepared that perfectly match the experimental samples [1] [2].
Guide: Avoiding Common Errors in Raman Spectral Analysis
Problem: A flawed data analysis pipeline leads to an overestimated and unreliable model performance [3].
Diagnostic Symptoms:
- Model performance is perfect or near-perfect on a small dataset.
- Fluorescence background dominates the Raman signal.
- The model fails when applied to new data from a different day.
Protocol for Resolution:
- Wavenumber Calibration: Regularly measure a wavenumber standard (e.g., 4-acetamidophenol) to create a stable, common wavenumber axis for all measurements. Skipping this causes systematic drifts [3].
- Correct Preprocessing Order: Always perform baseline correction to remove fluorescence background before applying spectral normalization. Reversing this order biases the data [3].
- Prevent Over-fitting: Use a grid search to optimize preprocessing parameters (e.g., for baseline correction) based on spectral markers, not the final model performance [3].
- Ensure Independent Validation: During model evaluation, ensure that all replicates from a single biological sample or patient are placed in the same training or test subset. Splitting them causes information leakage and severely inflates performance estimates [3].
- Select Appropriate Models: Use low-parameterized models (e.g., linear models) for small datasets and reserve complex models (e.g., deep learning) for large, independent datasets [3].
Frequently Asked Questions (FAQs)
Q1: Why is there a strong negative correlation between my material-specific images in spectral CT? In two-material decomposition (2-MD) spectral CT, the noise correlation coefficient between the two material-specific images approaches -1. This is a fundamental property of the decomposition mathematics. In more complex multi-material decomposition (m-MD, with m ≥ 3), the noise correlation between different material pairs can alternate between positive and negative values [4].
Q2: How can I fix a spillover error that is only present in my fully stained samples but not in the single-color controls? This indicates that your single-color controls did not accurately represent your experimental samples. The most common reasons are [2]:
- The control was less bright than the sample.
- A different reagent was used in the control (e.g., FITC control for a GFP sample, or compensation beads instead of cells).
- The sample and control were treated differently (e.g., one was fixed and the other was not). The solution is to create new, properly matched controls.
Q3: What is the most critical mistake to avoid in Raman spectral preprocessing? The most critical mistake is performing spectral normalization before baseline correction. The intense fluorescence background becomes encoded in the normalization constant, creating a significant bias in all subsequent analysis. Always correct the baseline first [3].
Q4: Can I manually edit a compensation matrix to fix spillover errors? Manually editing a compensation matrix is generally not recommended. While it might make one plot look better, spillover errors propagate through multiple data dimensions. A manual adjustment in one channel can introduce unseen errors in other channels. It is safer to recalculate the matrix using improved controls or a specialized algorithm [1].
Data Presentation
Table 1: Common Spectral Artifacts and Their Signatures
| Artifact Type | Field | Key Diagnostic Signature | Primary Cause |
|---|---|---|---|
| Noise Correlation | Spectral CT | Correlation coefficient of ~ -1 in 2-MD images [4] | Fundamental property of material decomposition algorithms [4]. |
| Spillover/Unmixing Error | Flow Cytometry | Skewed populations & hyper-negative events [1] [2] | Incorrect control samples or spectral reference [1] [2]. |
| Fluorescence Background | Raman Spectroscopy | Intense, broad background underlying sharper Raman peaks [3] | Natural overlap of Raman effect with sample fluorescence [3]. |
| Wavenumber Drift | Raman Spectroscopy | Systematic shift in peak positions across measurements [3] | Lack of or improper wavelength/wavenumber calibration [3]. |
| Cosmic Spike | Spectroscopy | Sharp, single-pixel spike in intensity [3] | High-energy cosmic particles striking the detector [3]. |
| Tandem Dye Breakdown | Flow Cytometry | Spillover error in full stain but not control [1] | Degradation of the tandem dye conjugate in the sample [1]. |
Table 2: Essential Research Reagent Solutions for Spectral Experiments
| Reagent / Material | Function in Experiment |
|---|---|
| Single-Color Control Samples | Used to generate the spectral library or compensation matrix for unmixing; must be biologically and chemically identical to test samples [1] [2]. |
| Wavenumber Standard (e.g., 4-acetamidophenol) | Provides known reference peaks for calibrating the wavenumber axis of a spectrometer, ensuring consistency across measurements [3]. |
| Polymer Stain Buffer | Prevents fluorophore aggregation and sticking when multiple polymer dyes (e.g., Brilliant Violet dyes) are used in a single panel [2]. |
| FMO (Fluorescence Minus One) Control | Helps distinguish true positive signals from spillover spread and aids in setting positive gates, especially for problematic markers [1]. |
Experimental Protocols
Detailed Protocol: Investigating Noise Correlation in Photon-Counting CT
This protocol is derived from simulation studies on the performance of spectral imaging based on multi-material decomposition (m-MD) [4].
1. System Configuration:
- X-ray Technique: Set to 140 keV tube voltage and 1000 mA tube current.
- Gantry Rotation: 1 rotation per second.
- Spectral Channelization: Define energy thresholds based on the number of materials (m) to be decomposed.
- For 2-MD: Use two bins, [1–58, 59–140] keV.
- For 3-MD: Use three bins, [1–51, 52–68, 69–140] keV.
- For 4-MD: Use four bins, [1–43, 44–58, 59–72, 73–140] keV [4].
2. Data Acquisition Modeling:
- Model the detected signals in each spectral channel ( k ) using the equation: ( Ik(L) = Poisson \left( \int{E{min}}^{E{max}} Dk(E) N0(E) \exp\left( -\sum{p=1}^P Ap(L) \mup(E) \right) dE \right) ) where ( Dk(E) ) is the spectral response, ( N0(E) ) is the source spectrum, ( Ap(L) ) is the line integral of basis material ( p ), and ( \mu_p(E) ) is its attenuation coefficient [4].
3. Material Decomposition:
- Solve the set of integral equations for ( A_p(L) ) using an iterative numerical method like the Newton-Raphson algorithm. Initial conditions are obtained through system calibration [4].
4. Noise Correlation Analysis:
- Calculate the noise correlation coefficients between all pairs of the resulting material-specific (basis) images.
- The expected result is a correlation coefficient approaching -1 for 2-MD. For m-MD (m ≥ 3), coefficients will alternate between +1 and -1 for different material pairs [4].
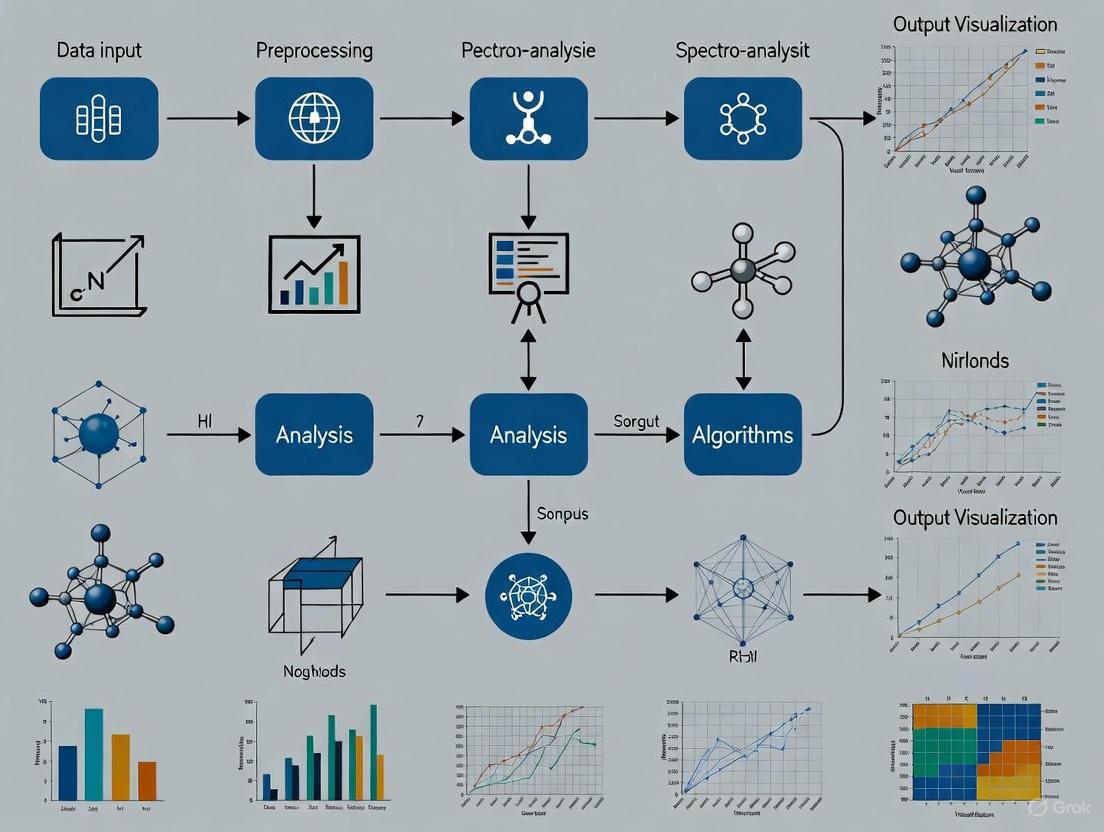
Workflow Visualization
Diagram: Spectral Data Analysis Pipeline
Welcome to the Technical Support Center for Classical Chemometrics. This resource is designed for researchers and scientists working with complex spectral data, providing foundational troubleshooting guides and FAQs. While modern artificial intelligence (AI) and machine learning (ML) frameworks offer advanced capabilities, classical chemometric methods like Principal Component Analysis (PCA), Partial Least Squares (PLS) regression, and Soft Independent Modeling of Class Analogy (SIMCA) remain vital for multivariate data analysis [5] [6]. This guide helps you navigate common challenges in applying these robust, interpretable techniques, ensuring reliable data analysis and a solid foundation for exploring advanced AI integrations.
Troubleshooting Guides & FAQs
Frequently Asked Questions
Q1: What is the fundamental difference between PCA and PLS? A1: PCA is an unsupervised technique primarily used for exploratory data analysis, dimensionality reduction, and outlier detection. It finds combinations of variables (principal components) that describe the greatest variance in your X-data (e.g., spectral intensities) without using prior knowledge of sample classes [6] [7]. In contrast, PLS is a supervised technique used for regression or classification. It finds components in the X-data that are most predictive of the Y-variables (e.g., analyte concentrations or class labels), maximizing the covariance between X and Y [5] [6].
Q2: My PCA model is unstable, and the scores plot changes dramatically with small changes in my data. What could be wrong? A2: This often indicates that your model is highly sensitive to noise and outliers. Classical methods can be susceptible to these issues [5].
- Solution: Ensure your data is properly pre-processed (e.g., scaling, normalization). Use the outlier detection capabilities inherent in PCA and other chemometric methods. Techniques like SIMCA are specifically designed to assess the analogy of a sample to a class model, which includes checking for outliers [5].
Q3: When should I use SIMCA over other classification methods? A3: SIMCA is particularly useful when you have well-defined classes and want to build a separate PCA model for each class. It is ideal for class modeling problems, where the question is "Does this sample belong to this specific class?" rather than "Which of these classes does this sample belong to?" [5] [7]. It allows a sample to be assigned to one, multiple, or no classes.
Common Experimental Issues & Solutions
The table below outlines specific problems you might encounter during chemometric analysis of spectral data, their potential causes, and recommended solutions.
| Problem Description | Root Cause | Solution & Preventive Measures |
|---|---|---|
| Noisy or Unreliable PCA/SIMCA Model | High influence of noise and undetected outliers in the spectral data [5]. | Leverage the built-in noise and outlier reduction features of your chemometric software. Re-scan samples if necessary to ensure data quality [5]. |
| Poor PLS Regression Predictions | Model is overfit or built on irrelevant spectral regions; non-linear relationships not captured by classical PLS [6]. | Ensure proper variable selection and model validation (e.g., cross-validation). For complex non-linearities, consider complementing your work with AI techniques like Support Vector Machines (SVM) or Random Forest [6]. |
| Incorrect Classification in SIMCA | Poorly defined class boundaries or samples that are not well-represented by the training set [7]. | Review the quality and representativeness of your training set for each class. Validate the model with a robust test set and adjust the confidence level for class assignment [7]. |
| Strange or Negative Peaks in Spectral Baseline | Underlying spectral issues from the instrument, such as a dirty ATR crystal or instrument vibrations [8]. | Perform routine instrument maintenance. Clean the ATR crystal and take a fresh background scan. Ensure the spectrometer is on a stable, vibration-free surface [8]. |
Experimental Protocols & Workflows
Protocol 1: Developing a PCA Model for Spectral Data Exploration
Objective: To explore a spectral dataset, identify natural groupings, and detect outliers.
Materials:
- Spectral data (e.g., NIR, IR, Raman)
- Software with PCA capability (e.g., Mnova Advanced Chemometrics plugin) [5]
Methodology:
- Data Pre-processing: Load your spectral matrix. Apply necessary pre-processing steps such as Standard Normal Variate (SNV), detrending, or derivatives to minimize scattering effects and baseline shifts.
- Model Building: Execute PCA. The software will calculate the principal components (PCs) that capture the maximum variance.
- Visualization & Interpretation:
- Examine the Scores Plot (e.g., PC1 vs. PC2) to visualize sample clustering and identify potential outliers.
- Examine the Loadings Plot to interpret which spectral variables (wavelengths) are responsible for the patterns seen in the scores plot.
- Validation: Use statistical metrics like Q-residuals and Hotelling's T² to quantitatively identify outliers that do not fit the model well [5].
Protocol 2: Building a PLS Regression Model for Quantification
Objective: To develop a predictive model that correlates spectral data (X-matrix) with a quantitative property, such as analyte concentration (Y-matrix).
Materials:
- Spectral data with known reference values for the property of interest
- Software with PLS regression capability [5]
Methodology:
- Data Preparation: Split your data into a calibration (training) set and a validation (test) set.
- Model Training: Build the PLS model on the calibration set. The algorithm will find latent variables in X that best predict Y.
- Model Diagnostics: Evaluate the model performance using the Root Mean Square Error of Calibration (RMSEC) and the coefficient of determination (R²) for the calibration set.
- Model Validation: Apply the model to the independent validation set. Use Root Mean Square Error of Prediction (RMSEP) and R² for prediction to assess the model's predictive accuracy and avoid overfitting.
- Prediction: Use the validated model to predict the property Y in new, unknown samples.
Workflow Visualization: Chemometric Analysis Pathway
The diagram below outlines a logical workflow for applying classical chemometrics to spectral data, from data acquisition to model deployment and the potential transition to advanced AI techniques.
The Scientist's Toolkit: Essential Research Reagents & Materials
The following table details key software tools and algorithmic approaches that form the essential "research reagents" in the field of classical chemometrics.
| Item Name | Function & Application |
|---|---|
| Principal Component Analysis (PCA) | An unsupervised algorithm for exploratory data analysis, dimensionality reduction, and outlier detection. It is fundamental for visualizing inherent data structure [5] [6] [7]. |
| Partial Least Squares (PLS) Regression | A supervised algorithm for building predictive models. It correlates spectral data (X) with quantitative properties (Y), such as analyte concentration, and is a cornerstone of multivariate calibration [5] [6]. |
| Soft Independent Modeling of Class Analogy (SIMCA) | A supervised classification method that builds a separate PCA model for each class. It is used for sample classification and authenticity testing [5] [7]. |
| Multivariate Curve Resolution (MCR) | An algorithm used for peak purity assessment in complex data like LC-MS, helping to resolve the contribution of individual components in a mixture [5]. |
Troubleshooting Guides
FAQ 1: How do I correct for baseline drift and scattering effects in my spectroscopic data?
Issue: Spectroscopic data (e.g., from NIR, IR, Raman) often contain non-chemical artifacts from baseline drifts and multiplicative scatter, which obscure the true analyte signal and hinder accurate quantitative analysis [9]. These distortions arise from physical phenomena like particle size variation, sample packing, instrumental drift, or, in Raman spectroscopy, fluorescence [9] [10] [11].
Solution: Apply established correction methods designed to isolate and remove these physical effects.
- For Multiplicative Scatter Correction (MSC): This method assumes the measured spectrum is a linear transformation of an ideal reference spectrum (often the mean spectrum of the dataset). It corrects for both additive and multiplicative effects commonly found in diffuse reflectance spectra [9] [12].
- For Standard Normal Variate (SNV): This is a spectrum-specific transformation. It centers and scales each spectrum individually, making it particularly useful for heterogeneous samples where a common reference spectrum is not appropriate [9] [12].
- For Extended Multiplicative Scatter Correction (EMSC): This is a more powerful extension of MSC. It can model and remove not only scatter effects but also polynomial baseline trends and other known spectral interferents simultaneously [9] [13]. Recent studies have successfully used EMSC to suppress instrumental variations in long-term Raman measurement data [13].
Experimental Protocol: Applying MSC
- Calculate the mean spectrum from your entire calibration dataset to use as the reference spectrum.
- For each individual spectrum, perform a linear regression (e.g., using least squares) of the sample spectrum against the reference spectrum.
- The corrected spectrum is obtained by subtracting the estimated additive effect and then dividing by the estimated multiplicative coefficient [9].
FAQ 2: What are the modern approaches for complex, nonlinear baseline problems?
Issue: Traditional polynomial fitting methods may fail or require extensive manual parameter tuning for complex, nonlinear baselines, especially in techniques like Raman spectroscopy where fluorescence can create a strong, varying background [10] [11].
Solution: Implement advanced baseline estimation techniques or leverage deep learning.
- Asymmetric Least Squares (AsLS): This method estimates the baseline by solving an optimization problem that penalizes positive residuals (the peaks) more heavily than negative residuals (the baseline), resulting in a smooth function that fits the baseline without fitting the analyte peaks [9].
- Deep Learning-Based Correction: Convolutional Neural Networks (CNNs) can be trained to learn the complex patterns of baseline distortions directly from data. For example, a Triangular Deep Convolutional Network has been shown to outperform traditional methods by achieving superior correction accuracy, reducing computation time, and better preserving peak intensity and shape [10]. These methods offer greater adaptability and enhance automation by eliminating manual parameter tuning for different datasets [10].
Experimental Protocol: AsLS Baseline Correction
- Define the asymmetry parameter (e.g., 0.001-0.1 for most spectra) and the smoothness parameter.
- Solve the optimization problem to estimate the baseline, which is a smooth curve that lies below the spectral peaks.
- Subtract the estimated baseline from the original spectrum to obtain the baseline-corrected spectrum [9].
FAQ 3: How should I normalize my multi-omics data for a time-course study?
Issue: In mass spectrometry-based multi-omics (e.g., metabolomics, lipidomics, proteomics), data normalization is crucial to remove systematic errors without masking true biological variation, which is especially critical in time-course experiments where temporal differentiation must be preserved [14].
Solution: Select a normalization method that is robust and preserves the biological variance of interest.
- Probabilistic Quotient Normalization (PQN): This method has been identified as optimal for metabolomics and lipidomics data in temporal multi-omics studies. It works by assuming that the majority of peaks have a constant ratio between samples. It calculates a most probable dilution factor by comparing the quotients of all variables to a reference spectrum (often the median spectrum) [14].
- LOESS Normalization: Locally Estimated Scatterplot Smoothing (LOESS) is another top-performing method for metabolomics, lipidomics, and proteomics. It fits a smooth curve to the data points in a scatterplot, which is effective for correcting intensity-dependent biases [14].
- Median Normalization: For proteomics data, median normalization is a robust and simple method. It scales the data so that the median intensity is the same across all samples [14].
Important Consideration: A study evaluating normalization for multi-omics datasets from the same cell lysate found that while machine learning methods like SERRF can outperform others in some cases, they can also inadvertently mask treatment-related variance in others. Therefore, the choice of method should be validated for your specific dataset [14].
Performance Comparison of Key Techniques
Table 1: Comparison of Scattering and Baseline Correction Methods
| Method | Core Mechanism | Primary Application Context | Key Advantages | Key Disadvantages |
|---|---|---|---|---|
| Multiplicative Scatter Correction (MSC) [9] | Linear transformation relative to a reference spectrum. | Diffuse reflectance spectra (NIR) with additive/multiplicative effects. | Interpretable, computationally efficient. | Requires a representative reference spectrum. |
| Standard Normal Variate (SNV) [9] | Centers and scales each spectrum individually. | Heterogeneous samples without a common reference. | No reference needed; useful for particle size effects. | Assumes scatter effect is constant across the spectrum. |
| Extended MSC (EMSC) [9] [13] | Models scatter, polynomial baselines, and interferents. | Complex distortions in multi-center or long-term studies. | Handles multiple interference types simultaneously. | More complex model requiring more parameters. |
| Asymmetric Least Squares (AsLS) [9] | Optimization with asymmetric penalties on residuals. | Nonlinear baseline drift in various spectroscopies. | Flexible adaptation to nonlinear baselines. | Requires tuning of asymmetry and smoothness parameters. |
| Deep Learning (CNN) [10] | Trained convolutional filters learn to remove baselines. | Complex baselines (e.g., Raman fluorescence) requiring automation. | High accuracy, fast computation, preserves peak shape. | Requires a large, diverse training dataset. |
Table 2: Evaluation of Normalization Methods for Multi-Omics Datasets [14]
| Normalization Method | Metabolomics | Lipidomics | Proteomics | Considerations for Time-Course Studies |
|---|---|---|---|---|
| Probabilistic Quotient (PQN) | Optimal | Optimal | Excellent | Preserves time-related variance; robust. |
| LOESS | Optimal | Optimal | Excellent | Effective for intensity-dependent bias. |
| Median | Good | Good | Excellent | Simple and robust for proteomics. |
| SERRF (Machine Learning) | Variable Performance | Not Assessed | Not Assessed | Can outperform but may mask biological variance. |
The Scientist's Toolkit: Essential Research Reagents & Materials
Table 3: Key Quality Control Standards for Raman Spectroscopy [13]
| Reagent / Material | Function in Spectral Preprocessing & Analysis |
|---|---|
| Cyclohexane | A standard reference material used for precise wavenumber calibration of the spectrometer. |
| Paracetamol | A stable solid substance used for wavenumber calibration and stability benchmarking. |
| Polystyrene | A polymer with well-defined Raman bands, used as a standard for wavenumber calibration. |
| Silicon | Used to calibrate the exposure time and ensure consistent intensity of its characteristic 520 cm⁻¹ Raman band. |
| Squalene | A stable lipid used to evaluate instrumental performance and stability over time. |
Technical Support Center: AI for Spectral Data Analysis
This support center provides troubleshooting guides and FAQs for researchers, scientists, and drug development professionals integrating AI and Machine Learning into their work with complex spectral data.
Frequently Asked Questions (FAQs)
1. How is AI transforming the analysis of spectral data in research? AI and machine learning are revolutionizing spectral analysis by enabling the detection of subtle, complex patterns that are often imperceptible to the human eye. Spectroscopy techniques are prone to interference from environmental noise, instrumental artifacts, and sample impurities. Machine learning algorithms can overcome these challenges by learning to identify and correct for these perturbations, significantly enhancing measurement accuracy and feature extraction. This allows for unprecedented detection sensitivity, achieving sub-ppm levels while maintaining >99% classification accuracy in applications like pharmaceutical quality control and environmental monitoring [15].
2. What is data-centric AI and why is it important for spectral analysis? Data-centric AI is a paradigm that shifts the focus from solely refining models to systematically improving the quality of the datasets used for training. This is crucial for spectral data because even the most advanced model will underperform if trained on poor-quality data. The core idea is that increasing dataset quality—by correcting mislabeled entries, removing anomalous inputs, or increasing dataset size—is often far more effective at improving a model's final output than increasing model complexity or training time. Initiatives like DataPerf provide benchmarks for this data-centric approach [16].
3. My AI model performs well on training data but poorly on new spectral data. What is wrong? This is a classic sign of data leakage or overfitting [17]. It means your model has memorized patterns from your training set that do not generalize to new data.
- Solution: Ensure there is absolutely no overlap between the data used for training and the data used for testing or validation. All data preprocessing steps (like normalization) should be fit on the training data and then applied to the test data, preventing the model from gaining any unfair knowledge about the test set beforehand [17].
4. What are the common machine learning mistakes to avoid with spectral data? The table below summarizes key pitfalls and their solutions.
| Mistake | Consequence | Solution |
|---|---|---|
| Insufficient Data Preprocessing [17] | Model captures noise and artifacts instead of real spectral signatures, leading to inaccurate predictions. | Implement a robust preprocessing pipeline: handle missing values, perform baseline correction, apply scattering correction, and use spectral derivatives [15]. |
| Ignoring Data Analysis [17] | Biases in raw data lead to biased models, undermining prediction accuracy and causing unfair outcomes. | Perform thorough Exploratory Data Analysis (EDA). Use visualization and statistical techniques to understand data distribution, detect anomalies, and audit for biases before training [17]. |
| Choosing the Wrong Algorithm [17] | Poor model performance and an inability to capture the relevant patterns in the spectral data. | Start with simpler, interpretable models (e.g., PCA-LDA) [18]. Understand your data and problem; not every task requires a complex neural network [17]. |
| Insufficient Model Evaluation [17] | Poor generalization to new data, wasted resources, and false confidence in the model's capabilities. | Go beyond a single accuracy score. Use rigorous evaluation practices like cross-validation and multiple metrics. Regularly update and re-evaluate models post-deployment [17]. |
| Lack of Domain Knowledge [17] | Models may use irrelevant features or make predictions that are chemically or biologically implausible. | Collaborate closely with domain experts (e.g., spectroscopists, biologists) to identify meaningful features and validate model findings [17] [18]. |
Troubleshooting Guides
Problem: Poor Classification Accuracy with Raman Spectroscopy Data
This guide addresses low accuracy when classifying spectral data, such as exosomes from different cancer cell lines.
Experimental Protocol & Methodology
The following workflow, based on a study achieving 93.3% classification accuracy, outlines a proven methodology for analyzing Raman spectral data [18].
- Step 1: Data Acquisition. Collect Raman spectra from your samples. In the referenced study, exosomes were isolated from colon (COLO205), skin (A375), and prostate (LNCaP) cancer cell lines [18].
- Step 2: Spectral Preprocessing. Process raw spectra to remove noise and artifacts. Key steps include:
- Step 3: Feature Extraction. Use Principal Component Analysis (PCA) to reduce the dimensionality of the spectral data. PCA identifies the most significant wavenumber regions that contribute to variance (e.g., 700–900 cm⁻¹ for lipids, 2800–3000 cm⁻¹ for CH-stretching modes), transforming the data into a set of principal components (PCs) that are easier for classifiers to process [18].
- Step 4: Model Training and Classification. Train a classifier, such as Linear Discriminant Analysis (LDA), on the extracted principal components. LDA finds a linear combination of features that best separates the different classes (e.g., cancer types) [18].
- Step 5: Validation. Evaluate model performance using a separate, held-out test dataset. Report overall accuracy and per-class metrics like F1 scores to ensure balanced performance across all categories [18].
The Scientist's Toolkit: Research Reagent Solutions
The table below details essential components for a spectral data analysis project.
| Item | Function in the Experiment |
|---|---|
| Cancer Cell Lines (e.g., COLO205, A375, LNCaP) [18] | Serve as the biological source of exosomes; different lines provide distinct spectral signatures for model training and classification. |
| Raman Spectrometer [18] | The core instrument for generating label-free, chemically specific vibrational spectra from samples. |
| Principal Component Analysis (PCA) [18] | A dimensionality reduction algorithm critical for extracting chemically significant features from complex, high-dimensional spectral data. |
| Linear Discriminant Analysis (LDA) [18] | A classification algorithm that models differences between classes based on the extracted features, enabling categorical prediction. |
| Surface-Enhanced Raman Spectroscopy (SERS) Substrates [18] | Nanostructured metallic surfaces that can be used to significantly amplify weak Raman signals, improving detection sensitivity for low-concentration analytes. |
Problem: AI Model Fails to Generalize from Preclinical Data
Challenge: An AI model trained on preclinical data (e.g., from cell lines or animal models) performs poorly when applied to human clinical data due to differences in data distribution and complexity.
Solution Guide:
- Leverage Digital Twins: Create computational models of a biological system (e.g., an organ) trained on multi-modal data. These "digital twins" can act as personalized control arms, providing a more robust basis for predicting human response and reducing the translatability gap seen in conventional models [19].
- Use Context-Aware and Physics-Constrained Models: Move beyond generic models. Employ adaptive processing techniques that account for specific experimental conditions and incorporate known physical laws or biological constraints into the AI model. This improves the realism and generalizability of predictions [15].
- Ensure Regulatory Preparedness: For drug development, be aware of the evolving regulatory landscape. The FDA advocates for a risk-based framework. Prepare for scrutiny on how the AI model’s behavior impacts the final drug product's quality, safety, and efficacy. Maintain rigorous audit trails and controls to prevent issues like data hallucination [20].
Frequently Asked Questions (FAQs)
Q1: Why is preprocessing raw spectral data so critical for machine learning and multivariate analysis? Raw spectral signals are weak and inherently contaminated by noise from various sources, including the instrument, environment, and sample itself. These perturbations—such as baseline drift, cosmic rays, and scattering effects—degrade measurement accuracy and can severely bias the feature extraction process of machine learning models like Principal Component Analysis (PCA) and convolutional neural networks. Proper preprocessing is essential to remove these artifacts, thereby ensuring the analytical robustness and reliability of subsequent models [ [15] [11]].
Q2: What are the common signs of a poorly corrected baseline, and how can it affect my quantification? A poorly corrected baseline is often visually identifiable as a persistent low-frequency drift or tilt underlying the true spectral peaks. This can manifest as a non-zero baseline in peak-free regions or an uneven baseline that distorts the true shape and intensity of peaks. Quantitatively, this leads to systematic errors in concentration estimates, as the baseline contributes inaccurately to the measured peak intensities, violating the assumptions of techniques like the Beer-Lambert law [ [21] [11]].
Q3: My extracted spectrum has unexpected spikes. What is the most likely cause, and how can I remove them? Sharp, narrow spikes in a spectrum are typically caused by cosmic rays striking the detector. This is a common issue in techniques like Raman and gamma-ray spectroscopy. Several removal techniques exist, ranging from simple moving average filters that detect and replace outliers to more advanced methods like the Multistage Spike Recognition (MSR) algorithm, which uses forward differences and dynamic thresholds to identify and correct these artifacts, especially in time-resolved data comprising multiple scans [ [11]].
Q4: How does the choice of normalization technique impact the interpretation of my spectral data? Normalization controls for unwanted systematic variations in absolute signal intensity, which may arise from factors like sample thickness or instrument responsivity, and not the underlying chemistry. The choice of technique is crucial:
- Misapplied Normalization: Can suppress real, meaningful biological or chemical variance, rendering important differences undetectable.
- Appropriate Normalization: Allows for valid comparisons between samples by preserving the relative shapes of the spectra and the chemically relevant variance [ [21]].
Q5: What should I do if my pipeline fails to extract a spectrum for a faint source? Automatic spectral extraction pipelines can fail for faint sources, particularly when they are near much brighter objects, as the software may only detect and extract the bright source. In such cases, manual intervention is required. This typically involves reprocessing the data and manually defining the extraction parameters, such as the position and width of the extraction window, to ensure the faint source is included [ [22]].
Troubleshooting Guides
Issue 1: High Noise Levels Obscuring Spectral Features
Problem: The signal-to-noise ratio (SNR) in your spectra is too low, making it difficult to distinguish genuine peaks from background noise.
Diagnosis and Solution Protocol: This issue requires a multi-step approach to isolate and reduce noise. The following workflow outlines a systematic protocol for diagnosis and resolution.
Inspect Raw Data and Acquisition Parameters:
- Examine the raw, unprocessed signal to confirm the noise is not an artifact of incorrect processing.
- Verify that fundamental acquisition parameters are optimal. For NMR, this includes ensuring an adequate number of transients (scans) and proper receiver gain. Increasing the acquisition time or scan count is the most direct way to improve SNR [ [21]].
Apply Digital Filtering and Smoothing:
- Use algorithms like the Savitzky-Golay filter to smooth the data. This filter preserves the shape and width of spectral peaks better than a simple moving average [ [11]].
Utilize Spectral Derivatives:
- Calculate the first or second derivative of your spectrum. This advanced technique can help resolve overlapping peaks and suppress broad, low-frequency baseline contributions, thereby enhancing the visibility of sharp, informative features [ [11]].
Issue 2: Persistent Baseline Drift or Tilt
Problem: The spectrum exhibits a significant low-frequency curvature, making accurate peak integration and quantification difficult.
Diagnosis and Solution Protocol: Baseline correction is a critical step. The choice of algorithm depends on the nature of the drift and the spectral features.
Table 1: Common Baseline Correction Methods
| Method | Core Mechanism | Best For | Advantages | Disadvantages |
|---|---|---|---|---|
| Piecewise Polynomial Fitting (PPF) [ [11]] | Fits a low-order polynomial (e.g., cubic) to user-selected, peak-free regions of the spectrum. | Spectra with complex, non-linear baselines. | Intuitive and offers user control. | Sensitive to the manual selection of baseline points. |
| Morphological Operations (MOM) [ [11]] | Uses erosion/dilation operations (like image processing) with a structural element to estimate the baseline. | Spectra with many narrow peaks, common in pharmaceutical analysis. | Automatic and preserves peak shapes well. | Requires tuning the width of the structural element. |
| Two-Side Exponential (ATEB) [ [11]] | Applies bidirectional exponential smoothing with adaptive weights. | High-throughput data with smooth to moderate baselines. | Fast, automatic, and requires no manual peak tuning. | Less effective for spectra with sharp baseline fluctuations. |
Issue 3: Inconsistent Compound Identification Across Samples
Problem: The same compound appears at slightly different wavelengths or chemical shifts in different samples, leading to misidentification.
Diagnosis and Solution Protocol: This is typically a problem of spectral alignment (warping) and referencing.
Chemical Shift Referencing:
- For NMR spectra, always use an internal chemical shift standard. We strongly recommend DSS over TSP, as TSP is pH-sensitive and can lead to referencing errors, especially in poorly buffered samples like urine [ [21]].
Spectral Alignment (Warping):
- Apply alignment algorithms to correct for small, non-linear shifts between spectra. These algorithms stretch and compress spectral segments to match a reference spectrum, ensuring peaks from the same compound align perfectly across all samples [ [21]].
Statistical Validation:
- After alignment, use multivariate tools like Principal Components Analysis (PCA). Successful alignment will result in tighter clustering of replicate samples in the PCA scores plot, indicating reduced technical variance [ [23]].
The Scientist's Toolkit: Essential Preprocessing Techniques & Materials
Table 2: Key Spectral Preprocessing Techniques and Their Functions
| Technique | Primary Function | Key Considerations |
|---|---|---|
| Cosmic Ray Removal [ [11]] | Identifies and removes sharp, spurious spikes caused by high-energy particles. | Choose an algorithm (e.g., Moving Average, Nearest Neighbor Comparison) suited to your data's SNR and whether you have replicate scans. |
| Scattering Correction [ [15]] | Compensates for light scattering effects in turbid or powdered samples (e.g., Extended Multiplicative Signal Correction). | Critical for recovering pure absorbance/reflectance information in NIR analysis of biological powders or mixtures. |
| Normalization [ [21]] | Removes unwanted variations in absolute intensity to enable sample comparison. | Choose a method (e.g., Total Area, Probabilistic Quotient) based on what source of variance you wish to correct. Misapplication can remove biological signal. |
| Spectral Binning [ [21]] | Reduces data dimensionality and improves SNR by integrating intensities over small spectral regions (bins). | Increases SNR at the cost of spectral resolution. Optimal bin size depends on the information density of your spectrum. |
Advanced Workflow: From Raw Data to Multivariate Model
For researchers aiming to build predictive models from spectral data, the pipeline extends beyond basic preprocessing. The following diagram and protocol detail the steps for a robust multivariate analysis workflow, such as developing a calibration model to predict constituent concentrations.
Experimental Protocol for Multivariate Calibration:
Preprocessing Pipeline: Apply the necessary preprocessing steps (baseline correction, normalization, etc.) determined through the troubleshooting guides above. Consistency across all training and future prediction samples is paramount [ [15] [11]].
Outlier Detection:
- Use the Model Driven Multivariate Control Chart (MDMCC) or similar tools to identify spectral outliers.
- Charts for T² (distance from data center in model plane) and SPE (distance from model plane) are used to flag spectra that are atypical or poor fits to the initial model. These outliers should be investigated and potentially excluded before model building [ [23]].
Exploratory Analysis:
Multivariate Calibration:
- For functional data like spectra, use specialized tools like the Functional Data Explorer (FDE) in JMP Pro. FDE performs a functional PCA, which can lead to more efficient models [ [23]].
- The Functional DOE Profiler can then be used to build a calibration model that predicts the spectral shape or the concentration of constituents (inverse calibration) at combinations not explicitly measured in the original experiment [ [23]].
Model Validation:
- Never rely solely on model performance from the training data. Always validate the final model using a completely independent set of samples that was not used in any step of the training or preprocessing optimization process. This provides an unbiased estimate of the model's predictive performance on new data.
Advanced Methods in Action: Machine Learning and Deep Learning Applications
In the analysis of complex spectral data, selecting and correctly applying the appropriate machine learning algorithm is paramount to the success of a research project. Techniques like Laser-Induced Breakdown Spectroscopy (LIBS), Fourier-Transform Infrared (FTIR) spectroscopy, and Raman spectroscopy generate high-dimensional datasets where the differences between classes can be exceptionally subtle. Within this domain, three methods have established themselves as foundational tools: Partial Least Squares Discriminant Analysis (PLS-DA), Linear Discriminant Analysis (LDA), and Random Forest (RF). This guide addresses the most common challenges researchers face when implementing these algorithms, providing targeted troubleshooting advice and experimental protocols to ensure robust and interpretable results in applications ranging from drug discovery to food authentication and biomedical diagnostics.
Frequently Asked Questions (FAQs)
1. Q: Under what conditions should I choose PLS-DA over LDA for my spectral data?
- A: Your choice should be guided by the specific characteristics of your dataset. Opt for PLS-DA when your data has a high number of features (e.g., thousands of spectral wavelengths) and a relatively small sample size. PLS-DA is explicitly designed to handle multicollinearity, which is common in spectral data, by projecting the variables into a latent space that maximizes covariance with the class labels [24] [25]. In contrast, LDA requires the within-class scatter matrix to be invertible, a condition that fails when the number of features exceeds the number of samples or when features are perfectly correlated [25]. Therefore, for high-dimensional spectral data, PLS-DA is generally the more robust and applicable choice.
2. Q: How can I improve the performance of LDA on my high-dimensional spectral dataset?
- A: A common and effective strategy is to combine LDA with a prior dimensionality reduction step. You can apply Principal Component Analysis (PCA) to your spectral data first and then perform LDA on the PCA scores. This PCA-LDA hybrid approach overcomes the mathematical limitations of standard LDA by working in a reduced, orthogonal feature space [24]. Studies have successfully used this method to classify FTIR spectra of cancer cells and vibrational spectra of biological materials with accuracies exceeding 90% [24].
3. Q: Random Forest is often called a "black box." How can I interpret which spectral regions are most important for the classification?
- A: Random Forest provides an inherent feature importance metric, which is a key to its interpretability. The algorithm calculates the mean decrease in Gini impurity or the mean increase in accuracy for each feature (e.g., wavenumber or wavelength) when it is used to split nodes across all the trees in the forest. By examining these importance scores, you can identify the specific spectral regions or peaks that are the most discriminative for your classification task [26] [27]. For instance, this approach has been used to pinpoint spectral biomarkers in blood plasma for multiple sclerosis diagnosis [27].
Troubleshooting Guide
Table 1: Common Algorithm Issues and Proposed Solutions
| Problem | Likely Cause | Solution | Example from Literature |
|---|---|---|---|
| Poor LDA performance on spectral data | High dimensionality and multicollinearity causing singular within-class scatter matrix [25]. | Use PCA-LDA or switch to PLS-DA [24] [25]. | A study on apple origin authentication found PLS-DA more suitable than LDA for ICP-MS data with strong multicollinearity [25]. |
| PLS-DA model is overfitting | Too many Latent Variables (LVs) are used, modeling noise instead of signal. | Optimize the number of LVs using cross-validation. Use a separate test set for final validation [25]. | Research classifying nephrites achieved a testing accuracy of 95.9% with RF, demonstrating generalizability by validating on a hold-out set [28]. |
| Random Forest has high accuracy but low interpretability | The model is complex, and key features are not being communicated. | Extract and plot feature importance scores. Relate important features back to known biochemical compounds [26] [27]. | In a food study, RF's feature importance was used to identify key wavenumbers for discriminating gluten-free and gluten-containing bread, adding chemical validity [26]. |
| Class imbalance leading to biased models | One class has many more samples than another, skewing the classifier. | Apply algorithmic adjustment like balanced sub-sampling in RF, adjust class weights in PLS-DA and LDA, or use SMOTE [29]. | A voting ensemble classifier was designed with specific weights to mitigate misclassification and achieve balanced accuracy for nephrite origins [28]. |
Detailed Experimental Protocols
Protocol 1: Comparing Classifier Performance for Spectral Discrimination
This protocol outlines a standardized workflow for evaluating and comparing PLS-DA, LDA, and Random Forest on vibrational spectral data, based on established methodologies [28] [24] [26].
1. Sample Preparation and Spectral Acquisition:
- Samples: Use a well-defined set of samples with confirmed class labels (e.g., healthy vs. diseased tissue, authentic vs. adulterated food).
- Spectroscopy: Acquire vibrational spectra (e.g., FTIR, Raman, NIR) using standardized instrumental parameters.
- Replicates: Collect multiple technical replicates per sample to account for instrumental noise.
2. Data Preprocessing:
- Perform preprocessing to remove artifacts and enhance spectral features. Common steps include:
3. Data Splitting:
- Split the dataset into a training/calibration set (typically 70-80%) and a test set (20-30%). Use algorithms like Kennard-Stone to ensure the test set is representative of the spectral space [26].
4. Model Training and Optimization:
- PLS-DA: Use the training set to build a PLS-DA model. Determine the optimal number of Latent Variables (LVs) through k-fold cross-validation to avoid overfitting.
- LDA/PCA-LDA: First, apply PCA to the training spectra to obtain scores. Then, use these scores to build an LDA model. Select the number of Principal Components (PCs) that capture the majority of the variance.
- Random Forest: Train a forest of decision trees. Use cross-validation to optimize key hyperparameters such as the number of trees, the maximum depth of trees, and the number of features to consider at each split.
5. Model Evaluation:
- Apply the trained models to the held-out test set.
- Evaluate performance using metrics such as Accuracy, Sensitivity, Specificity, and Balanced Accuracy.
- For RF, additionally generate and analyze feature importance plots to identify discriminative spectral regions.
Protocol 2: Developing a Diagnostic Model with ATR-FTIR Spectroscopy of Blood Plasma
This protocol is adapted from a study that successfully discriminated between Multiple Sclerosis (MS) patients and healthy controls using ATR-FTIR and a linear predictor [27].
1. Biological Sample Collection and Ethical Approval:
- Obtain ethical approval and informed consent from all participants.
- Collect blood plasma from confirmed patient and healthy control groups. Ensure groups are matched for age and gender where possible.
2. Spectral Acquisition:
- Acquire ATR-FTIR spectra from dried plasma samples.
- Focus on key spectral regions: the high-frequency region (3050–2800 cm⁻¹) for lipid and fatty acid C-H stretches, and the fingerprint region (1800–900 cm⁻¹) for proteins, nucleic acids, and carbohydrates.
- Collect and average multiple replicates per sample.
3. Extraction of Spectral Biomarkers:
- Instead of using full spectra, calculate specific spectral biomarkers (absorbance ratios) based on biological relevance. Examples include:
A_{HR} / A_{amide I + amide II}(Lipid-to-Protein ratio)A_{C=O} / A_{HR}(Ester carbonyl band relative to lipids)A_{CH2 asym} / A_{CH2 sym + CH2 asym}(Lipid acyl chain packing order) [27].
4. Construction of a Linear Predictor:
- Use logistic regression (a generalized linear model) to construct a predictive model.
- The model combines the selected spectral biomarkers into a single score that predicts the probability of a sample belonging to the patient group.
- The equation takes the form:
Logit(Probability) = β₀ + β₁*Biomarker₁ + β₂*Biomarker₂ + ...[27].
5. Model Validation:
- Validate the model using a separate cohort of samples not used in the model building.
- Report Sensitivity and Specificity to demonstrate clinical utility.
Essential Workflow Visualizations
Research Reagent Solutions
Table 2: Essential Tools for Spectral Data Analysis
| Tool / Reagent | Function / Purpose | Example Application |
|---|---|---|
| LIBS (Laser-Induced Breakdown Spectroscopy) | Provides elemental composition data by analyzing plasma emission from laser-ablated material. | Discrimination of nephrite jade geographical origins [28]. |
| ATR-FTIR Spectrometer | Measures infrared absorption to provide a biochemical "fingerprint" of a sample with minimal preparation. | Diagnosing Multiple Sclerosis from blood plasma [27]. |
| Raman Spectrometer | Measures inelastic scattering of light to provide information on molecular vibrations, effective in aqueous solutions. | Differentiating malignant and non-malignant breast cancer cells [24]. |
| NIR Spectrometer | Measures overtones and combinations of molecular vibrations; rapid and non-invasive. | Analyzing protein and moisture content in bread samples [26]. |
| ICP-MS (Inductively Coupled Plasma Mass Spectrometry) | Provides ultra-trace elemental and isotopic quantification. | Authenticating the geographical origin of apples [25]. |
| Python with Scikit-learn & XGBoost | Open-source libraries providing implementations of PLS-DA, LDA, Random Forest, and hyperparameter optimization tools. | Building and comparing classification models for food discrimination [26]. |
Troubleshooting Guides and FAQs
FAQ: Core Concepts and Architecture
Q1: Why is a specialized CNN architecture necessary for hyperspectral data, as opposed to standard 2D CNNs used for RGB images?
Hyperspectral images (HSIs) contain rich information in both the spatial domain (like a traditional image) and the spectral domain (dozens or hundreds of contiguous narrow wavelength bands) [30]. Standard 2D CNNs are primarily designed to extract spatial features and do not fully leverage the unique, information-rich spectral signature of each pixel. Specialized architectures are required to effectively fuse these spectral and spatial features [31] [32]. For instance, a two-branch CNN (2B-CNN) uses a 1D convolutional branch to extract spectral features and a 2D convolutional branch to extract spatial features, subsequently combining them for a more powerful representation [31] [33].
Q2: What are the primary causes of overfitting when working with limited hyperspectral data, and how can it be mitigated?
Overfitting is a significant challenge in HSI analysis due to the high dimensionality of the data and often limited labeled training samples (the p ≫ n problem, where variables exceed samples) [31]. Key strategies to mitigate this include:
- Network Design: Employing a fully convolutional structure without fully-connected layers, using dropout layers, and incorporating batch normalization [31].
- Data Augmentation: Artificially expanding the training set through techniques like rotation, mirroring, and scaling [34].
- Regularization: Using methods like L2 regularization (weight decay) but ensuring the regularization strength is not overwhelming other components of the loss function [34].
- Simpler Models: Starting with a simpler, shallower network architecture can be beneficial when training data is scarce [35].
Q3: How can I identify which spectral wavelengths are most important for my classification task using a CNN?
A key advantage of some CNN architectures is their ability to assist in effective wavelengths selection without additional re-training. In a two-branch CNN (2B-CNN), the weights learned by the first convolutional layer of the 2D spatial branch can be used as an indicator of important wavelengths [31] [33]. These weights comprehensively consider the discriminative power in both the spectral and spatial domains, providing a data-driven way to identify spectral regions that are critical for the classification task, which can help in reducing equipment cost and computational load [31].
Troubleshooting Common Experimental Issues
Q1: My model's training loss is not decreasing. What could be wrong?
This issue often stems from an incorrectly configured training process or model architecture. Follow this systematic approach:
- Verify Input Data: Ensure your data is correctly normalized (e.g., subtracting the mean and dividing by the standard deviation) and that pre-processing steps like image correction have been applied properly [35]. Incorrect input is a common source of bugs.
- Inspect the Loss Function: Confirm that the loss function matches the network's output. For example, using a loss function that expects logits (raw outputs) with a softmax output layer will lead to incorrect gradients [35].
- Check Learning Rate: An excessively high learning rate can cause gradient oscillations, while a very low one leads to slow progress. The optimal learning rate is close to the maximum rate before the training error increases [34]. Try a learning rate schedule that starts with a larger value and decreases over time [30].
- Overfit a Single Batch: A highly effective debugging heuristic is to try and overfit a single, small batch of data (e.g., as few as 5-10 samples). If the model cannot drive the training loss on this batch close to zero, it indicates a likely implementation bug, such as an incorrect loss function or gradient computation [35].
Q2: The model trains but performance is significantly lower than reported in literature. How should I proceed?
Discrepancies in performance can arise from multiple factors. A structured debugging strategy is crucial [35].
- Start Simple: Begin with a simple architecture, such as a LeNet-like model for spatial data or a shallow 1D CNN for spectral data, to establish a baseline [35]. Use sensible defaults: ReLU activation, normalized inputs, and no regularization initially [35].
- Compare to a Known Result: Reproduce the results of a reference paper on the same dataset, if possible. Line-by-line comparison of your code with an official implementation can help identify subtle bugs in data pipeline, model architecture, or training recipe [35].
- Evaluate Data and Model Fit: Ensure your dataset construction is correct. Check for issues like noisy labels, imbalanced classes, or a mismatch between the training and test set distributions [35]. Your dataset may simply be more varied or smaller than the one used in the reference paper, leading to different results [36].
- Hyperparameter Tuning: Perform a thorough search of hyperparameters such as learning rate, batch size, and network depth [34]. Deep learning models are often very sensitive to these choices [35].
Q3: I am encountering "NaN" or "inf" values during training. How can I resolve this?
Numerical instability, leading to NaN (Not a Number) or inf (infinity) values, is a common bug [35].
- Gradient Explosion: This is a frequent cause. Implement gradient clipping to limit the size of the gradients during backpropagation [30].
- Custom Operations: If you are using custom layers or operations, perform gradient checks to ensure the forward and backward passes are implemented correctly [34].
- Activation Functions: Check for operations that can produce large or undefined values, such as exponents, logarithms, or divisions, especially in relation to the activation functions used [35].
Experimental Protocols and Performance Data
The table below summarizes several advanced CNN architectures for HSI classification, highlighting their core approaches and relative robustness as evaluated in a recent critical study.
Table 1: Comparison of CNN Architectures for Hyperspectral Image Classification
| Model Name | Core Architectural Idea | Reported Strengths | Relative Robustness Score* |
|---|---|---|---|
| 2B-CNN [31] [33] | Two-branch network for separate spectral (1D-CNN) and spatial (2D-CNN) feature extraction and fusion. | Effective spectral-spatial fusion; enables wavelength selection. | Information not provided in search results. |
| FDSSC [32] | Fast Dense Spectral-Spatial Convolution using dense connections. | High robustness; stable performance with few training samples. | High |
| Tri-CNN [32] | Uses different scales of 3D-CNN to extract and fuse features, leveraging inter-band correlations. | High robustness against distortions. | High |
| HybridSN [32] | Hybrid 2D and 3D convolutional network. | Good performance on standard benchmarks. | Medium |
| MCNN [32] | Integrates mixed convolutions with covariance pooling. | Enhanced discriminative features with limited samples. | Medium |
| 3D-CNN [32] | Uses 3D convolutions to jointly process spatial and spectral dimensions. | Fundamental approach for joint spectral-spatial learning. | Low to Medium |
| FC3DCNN [32] | A compact and computationally efficient fully convolutional 3D CNN. | Suitable for real-time applications. | Low to Medium |
Robustness scores (High, Medium, Low) are based on mutation testing results from a 2024 study that evaluated model performance in the presence of various input and model distortions [32].
Quantitative Performance Comparison
The following table provides example performance metrics for various models on different HSI classification tasks, illustrating the performance gains of spectral-spatial methods.
Table 2: Example Classification Accuracies (%) of Different Models on Hyperspectral Datasets
| Model | Herbal Medicine Dataset [31] | Coffee Bean Dataset [31] | Strawberry Dataset [31] | Indian Pines Dataset [30] |
|---|---|---|---|---|
| Support Vector Machine (SVM) | 92.60% (average) | 92.60% (average) | 92.60% (average) | - |
| 1D-CNN | 92.58% (average) | 92.58% (average) | 92.58% (average) | - |
| GLCM-SVM | 93.83% (average) | 93.83% (average) | 93.83% (average) | - |
| 2B-CNN | 96.72% (average) | 96.72% (average) | 96.72% (average) | - |
| CSCNN (Custom Spectral CNN) | - | - | - | 99.8% |
Workflow Diagram: Spectral-Spatial HSI Classification with 2B-CNN
The following diagram illustrates the end-to-end workflow for hyperspectral image classification using a two-branch CNN architecture.
Troubleshooting Workflow for Low Performance
Adopt a systematic approach when your model underperforms, as outlined in the decision tree below.
Table 3: Key Resources for Developing CNN-based HSI Classifiers
| Item / Resource | Function / Purpose | Example / Note |
|---|---|---|
| Hyperspectral Datasets | Benchmark data for training and evaluating models. | Indian Pines, Herbal Medicine, Coffee Bean, Strawberry datasets [31] [30]. |
| Deep Learning Frameworks | Provides environment for model definition, training, and evaluation. | PyTorch, TensorFlow [30] [37]. |
| Hardware Accelerators | Dedicated processors to drastically speed up CNN inference. | AI microcontrollers (e.g., MAX78000) for low-power edge deployment [37]. |
| Data Augmentation Tools | Functions to artificially expand training datasets and reduce overfitting. | Built-in functions in frameworks for mirroring, rotation, cropping, random scaling [34]. |
| Architecture Modules | Pre-defined, tested components for building complex networks. | PyTorch modules (e.g., nn.Conv1d, nn.Conv2d, nn.BatchNorm2d, nn.Dropout) [36]. |
| Sensitivity Analysis Frameworks | Tools to evaluate model robustness against distortions and mutations. | Mutation testing frameworks like MuDL for HSI classifiers [32]. |
FAQs: Addressing Common Experimental Challenges
1. My multimodal model performs worse than my unimodal one. What is the root cause?
This is often caused by using an inappropriate fusion strategy that fails to effectively capture complementary information. The performance of different fusion techniques is highly dependent on your data characteristics and task.
- Solution: Systematically evaluate early, intermediate, and late fusion strategies. If your modalities are well-aligned and you have a robust dataset, early fusion (concatenating raw features) allows the model to learn complex cross-modal interactions. If modalities are asynchronous or have different sampling rates, late fusion (combining model decisions) is more flexible. Intermediate fusion often provides a good balance, using joint representations learned in middle layers of a neural network [38] [39].
2. How can I handle missing data for one modality in my multimodal pipeline?
This is a common challenge in real-world experiments. Advanced techniques can impute the missing information rather than discarding the entire sample.
- Solution: Consider algorithms like Full Information Linked ICA (FI-LICA), which is designed to recover missing latent information during fusion by utilizing all available data from complete cases [40]. Another approach is to use model architectures trained with modality dropout, which learn to make robust predictions even when one data stream is unavailable [38] [41].
3. My spectral and spatial data are difficult to align. What preprocessing is essential?
Effective fusion requires meticulous synchronization. The core issues are often temporal and spatial misalignment.
- Solution: Implement a preprocessing pipeline with two key steps:
- Temporal Alignment: Use timestamp matching or interpolation techniques to synchronize data streams collected at different frequencies [38] [41].
- Spatial Registration: For imaging data, employ keypoint detection and scene segmentation algorithms to ensure pixels across modalities correspond to the same physical location [38]. For spectral-spatial cubes, ensure precise pixel-level registration [42].
4. How can I interpret which features from each modality are driving my model's predictions?
Model interpretability is critical for scientific validation. Use post-hoc analysis tools designed for complex models.
- Solution: Integrate SHapley Additive exPlanations (SHAP) analysis into your workflow. This technique pinpoints the contribution of individual input features (e.g., specific wavelengths in a spectrum) to the final prediction, providing both global and local interpretability. This has been successfully used, for instance, to identify that wavelengths in the 2000–2500 nm region were critical for predicting resistant starch content in rice [43].
5. I have limited labeled samples for a complex multimodal task. How can I improve accuracy?
With limited samples, the focus should be on extracting the most informative features from your data.
- Solution: Explore frequency-domain enhancement techniques. Methods like the Spatial-Spectral-Frequency interaction network (S2Fin) use high-frequency sparse enhancement to amplify critical details such as edges and textures in images, which are essential for discrimination. This reduces reliance on massive labeled datasets by creating more discriminative features [42].
Troubleshooting Guides
Issue: Poor Model Generalization and Overfitting
Symptoms: High accuracy on training data but poor performance on validation/test sets.
| Potential Cause | Diagnostic Steps | Corrective Actions |
|---|---|---|
| Insufficient Training Data | - Check dataset size vs. model complexity (e.g., number of parameters).- Perform learning curve analysis. | - Apply data augmentation (e.g., spectral noise injection, image transformations) [43].- Use generative AI to create synthetic spectral or image data [6]. |
| Modality Noise | - Evaluate the performance of each modality independently.- Analyze the signal-to-noise ratio of raw data streams. | - Apply modality-specific filtering and preprocessing.- Implement fusion strategies (e.g., late fusion) that are more robust to noisy modalities [38] [39]. |
| High Model Complexity | - Compare training vs. validation loss over epochs. | - Increase regularization (e.g., L1/L2, dropout).- Simplify the model architecture.- Use Random Forest or XGBoost, which are less prone to overfitting with tabular features [6]. |
Issue: Suboptimal Fusion Strategy Selection
Symptoms: Fusion does not yield expected performance gains, or model is unstable.
| Potential Cause | Diagnostic Steps | Corrective Actions |
|---|---|---|
| Mismatched Fusion Strategy | - Train and evaluate unimodal baselines.- Test all three fusion types on a validation set. | Follow the decision criteria in the diagram below to select the optimal technique [38] [39]. |
| Poor Cross-Modal Interaction | - Visualize attention maps or intermediate features.- Check if model uses information from all inputs. | - Implement attention mechanisms or transformer architectures to dynamically weight the importance of features from different modalities [38] [42].- Use intermediate fusion with dedicated cross-talk layers. |
Decision Framework for Fusion Strategy Selection
Issue: Computational Bottlenecks in Processing
Symptoms: Extremely long training times, inability to load large datasets into memory.
| Potential Cause | Diagnostic Steps | Corrective Actions |
|---|---|---|
| High-Dimensional Data | - Profile memory usage by data type.- Check dimensions of input tensors. | - Apply dimensionality reduction (e.g., PCA on spectral data) [44] [6].- Use model quantization or mixed-precision training.- Process data in smaller batches. |
| Inefficient Architecture | - Monitor GPU/CPU utilization during training. | - For spectral sequences, use RNNs or Mamba architectures, which are efficient for long sequences [42] [45].- For images, use optimized CNN backbones like ResNet or SqueezeNet [46]. |
Experimental Protocols & Methodologies
Protocol 1: Building a Baseline Multimodal Classification Pipeline
This protocol outlines the steps to construct and evaluate a core multimodal model, suitable for tasks like material classification using spectral and spatial data.
1. Data Preprocessing & Alignment
- Spectral Data (e.g., NIR, HSI): Apply Savitzky-Golay smoothing and Standard Normal Variate (SNV) normalization to reduce scatter effects [43]. Mean-center the data.
- Spatial Data (e.g., RGB, LiDAR): Resize images to a uniform resolution. Normalize pixel values. For LiDAR point clouds, voxelize or create height maps.
- Alignment: Spatially co-register spectral and image data to a common grid. Use timestamp alignment for temporal data [41].
2. Unimodal Feature Extraction
- Spectral: Extract features using a 1D Convolutional Neural Network (CNN) or simply use the preprocessed spectra.
- Spatial/Image: Extract features using a pre-trained 2D CNN (e.g., ResNet).
- Tabular/Other: Pass through a fully connected neural network layer.
3. Fusion & Model Training
- Implement the three primary fusion strategies in separate experiments:
- Early Fusion: Concatenate the feature vectors from step 2 and feed into a final classifier.
- Intermediate Fusion: Combine features from intermediate layers of the unimodal networks, then classify.
- Late Fusion: Train separate classifiers on each unimodal feature set, then average or weight their prediction scores.
- Use a consistent validation strategy (e.g., 5-fold cross-validation) to fairly compare performance.
4. Evaluation & Interpretation
- Compare the accuracy, F1-score, and other relevant metrics of all fusion methods against unimodal baselines.
- Apply SHAP analysis to the best-performing model to identify which spectral bands and image regions were most influential [43].
Protocol 2: Integrating Frequency-Domain Features for Enhanced Detail
This advanced protocol is for scenarios with limited labeled data or where fine-grained details (edges, textures) are critical for discrimination [42].
1. Frequency Domain Transformation
- For Spectral Data: Apply a 1D Fast Fourier Transform (FFT) to each spectral signature to decompose it into its frequency components.
- For Spatial Data: Apply a 2D FFT to image patches to obtain frequency representations.
2. High-Frequency Enhancement
- Design a filter to amplify the high-frequency components of the signal, which correspond to sharp edges, textures, and fine details in the data.
- Techniques like the High-Frequency Sparse Enhancement Transformer (HFSET) can be used to optimize filter parameters and focus on the most discriminative spectral-spatial features [42].
3. Feature Fusion and Classification
- Fuse the enhanced frequency-domain features with the original spatial-spectral features.
- Use an adaptive fusion module to balance the contribution of low-frequency (global structure) and high-frequency (local details) information.
- Train a final classifier on the combined feature set.
The Scientist's Toolkit: Research Reagent Solutions
Table: Essential Computational Tools for Multimodal Data Fusion
| Tool / Technique | Function & Application | Key Considerations |
|---|---|---|
| Convolutional Neural Network (CNN) | Extracts spatial and spectral features from images and spectral data cubes [43] [46]. | Ideal for grid-like data; requires significant data for training; pre-trained models available. |
| SHAP (SHapley Additive exPlanations) | Provides model interpretability by quantifying feature contribution to predictions [43]. | Critical for validating models; computationally expensive for large datasets. |
| SpecimINSIGHT Software | A commercial tool for hyperspectral data analysis and classification model building without coding [44]. | Reduces need for programming expertise; specific to hyperspectral imaging applications. |
| Linked ICA & FI-LICA | Statistical methods for fusing multimodal datasets and handling missing data [40]. | Particularly useful for neuroimaging and other data with natural group structure. |
| Spatial-Spectral-Frequency Network (S2Fin) | A specialized architecture for fusing remote sensing data by interacting spatial, spectral, and frequency domains [42]. | State-of-the-art for limited labeled data; enhances high-frequency details. |
| Random Forest / XGBoost | Traditional machine learning models robust to overfitting, effective for tabular-like feature sets [6]. | Good performance with smaller datasets; provides native feature importance scores. |
This technical support center is established as a resource for researchers and scientists working at the intersection of Surface-Enhanced Raman Spectroscopy (SERS) and machine learning for analytical applications, particularly in the domain of rapid drug abuse detection. The guidance provided herein is framed within a broader thesis on advanced data analysis techniques for complex spectral data research, focusing on the practical experimental challenges encountered when translating theoretical models into reliable laboratory results. The following sections provide detailed troubleshooting guides and frequently asked questions (FAQs) to address specific issues you might encounter during experimental workflows.
Troubleshooting Guides for SERS Experiments
Guide: Addressing Low or Irreproducible SERS Signal
A lack of consistent and strong SERS signal is one of the most frequently reported issues. The following workflow provides a systematic approach for diagnosing and resolving this problem.
Step-by-Step Instructions:
Check Analyte-Surface Interaction: The SERS effect is a short-range enhancement that decays within a few nanometers. If your molecule is not adsorbing to the metal surface, the enhancement will be weak or non-existent [47].
- Action: Modify the chemical environment to promote adsorption. For example, adjust the pH of the solution to change the surface charge of the nanoparticles and the protonation state of your analyte. A molecule and surface with opposite charges will have stronger affinity [48].
- Verification: A successful interaction can sometimes be inferred from a color change in the colloidal solution or by observing new peaks in the SERS spectrum that indicate surface binding.
Verify Nanoparticle Aggregation: The largest SERS enhancements originate from "hotspots"—nanometer-scale gaps between metal nanoparticles [47]. Controlling the creation of these hotspots is critical.
- Action: Systematically optimize the concentration of an aggregating agent (e.g., NaCl, KNO3, or HCl). Use a design of experiments (DoE) approach to find the optimal balance, as too little agent provides no hotspots, and too much causes full precipitation and signal loss [48] [49].
- Verification: Monitor the UV-Vis absorption spectrum; successful aggregation for spherical nanoparticles often shifts the plasmon band to longer wavelengths and broadens it.
Confirm Hotspot Formation: Small changes in the number of molecules in hotspots cause large intensity variations, leading to perceived irreproducibility [47].
- Action: Ensure your substrate fabrication or colloidal aggregation protocol is consistent. For quantitative work, consider using internal standards (e.g., a co-adsorbed molecule or a deuterated variant of your analyte) to correct for variance in hotspot occupancy [47].
- Verification: Use techniques like scanning electron microscopy (SEM) to visualize the nanostructures and confirm the presence of nanogaps.
Optimize Laser Wavelength: The SERS enhancement is strongest when the laser excitation is in resonance with the localized surface plasmon of the metallic nanostructure [50] [51].
- Action: Characterize the plasmon resonance of your substrate (e.g., via UV-Vis spectroscopy) and select a laser wavelength that matches it. For example, citrate-reduced silver colloids have a plasmon peak near 400 nm, while gold is around 520 nm [48].
- Verification: Test different laser wavelengths available on your instrument to find the one that yields the strongest signal for your specific substrate-analyte combination.
Guide: Managing Fluorescence Interference in SERS Spectra
Fluorescence from the analyte or contaminants can swamp the weaker Raman signal.
Step-by-Step Instructions:
- Switch Excitation Wavelength: Use a laser in the near-infrared (NIR) range, such as 785 nm or 1064 nm. This reduces the energy of the incident photons, making it less likely to excite electronic transitions that lead to fluorescence [48].
- Employ SERS Quenching: The metal nanostructure itself can sometimes quench fluorescence. Ensure your analyte is directly adsorbed to the surface, as the enhancement is highly distance-dependent [50] [47].
- Photobleaching: As a last resort, expose the sample to the laser for a short period before measurement. This can sometimes bleach fluorescent impurities, but caution is needed to avoid damaging the analyte or substrate.
Frequently Asked Questions (FAQs)
FAQ 1: Why are the peak positions or relative intensities in my SERS spectrum different from those in a normal Raman spectrum of the same molecule?
Answer: Differences between SERS and conventional Raman spectra are common and can be attributed to several factors:
- Surface Selection Rules: The intense electromagnetic field at the metal surface selectively enhances vibrational modes that are perpendicular to that surface, changing the relative peak intensities [51].
- Formation of New Complexes: The molecule may form a chemical bond with the metal surface (e.g., through amine or thiol groups), creating a new species with a distinct vibrational fingerprint [47].
- Surface-Induced Reactions: Plasmon-driven chemistry can occur, where hot electrons from the metal catalyze a reaction on the surface. A classic example is the photodimerization of para-aminothiophenol to dimercaptoazobenzene, which produces a completely different spectrum [47].
FAQ 2: My SERS signal is strong but my quantitative model is inaccurate. How can I improve it?
Answer: Quantitative SERS is challenging due to signal heterogeneity. Key strategies include:
- Internal Standards: Add a known quantity of a reference molecule (one that provides a strong, distinct SERS signal and has similar surface affinity to your analyte) to your sample. The ratio of the analyte peak to the reference peak corrects for variations in hotspot enhancement and laser focus [47].
- Advanced Data Analysis: Combine SERS with machine learning algorithms that are robust to spectral variations. Models like Random Forest (RF) or Partial Least Squares Discriminant Analysis (PLS-DA) can handle complex, non-linear relationships in the data [52] [43].
- Control Aggregation: As highlighted in the troubleshooting guide, using a Design of Experiments (DoE) approach to control nanoparticle aggregation is essential for developing a robust and reproducible quantitative model [49].
FAQ 3: Which machine learning algorithm is best for classifying SERS spectra from drug detection experiments?
Answer: There is no single "best" algorithm; the choice depends on your dataset and goal. The table below summarizes the performance of different algorithms in a relevant case study for drug detection [52].
Table 1: Performance of ML Algorithms in a SERS-based Drug Detection Study
| Algorithm | Full Name | Accuracy | AUC | Best For |
|---|---|---|---|---|
| LDA | Linear Discriminant Analysis | >90% | 0.9821-0.9911 | Linear separations, lower computational cost |
| PLS-DA | Partial Least Squares Discriminant Analysis | >90% | 0.9821-0.9911 | High-dimensional, collinear data |
| RF | Random Forest | >90% | 0.9821-0.9911 | Non-linear relationships, robust to noise |
| CNN | Convolutional Neural Network | (Often higher) [43] | N/A | Very large datasets, automated feature extraction |
In a study detecting ephedrine (EPH) in tears via SERS, LDA, PLS-DA, and RF all achieved over 90% accuracy in distinguishing between EPH-injected and non-injected subjects [52]. For more complex spectral data, deep learning approaches like Convolutional Neural Networks (CNNs) can automatically extract features and may achieve superior performance, though they require more data and computing resources [43].
FAQ 4: What are the essential reagents and materials needed to set up a SERS experiment for drug detection?
Answer: The core materials can be categorized as follows:
Table 2: Essential Research Reagent Solutions for SERS-based Drug Detection
| Item Category | Specific Examples | Function/Purpose |
|---|---|---|
| SERS Substrate | Silver or Gold Nanoparticles (colloidal or on solid support) [52] [49] | Provides the plasmonic surface for signal enhancement. |
| Aggregating Agent | NaCl, HCl, KNO3 [48] [49] | Controls nanoparticle clustering to create SERS "hotspots". |
| Chemical Modifiers | HCl, NaOH, Citric Acid [48] | Adjusts pH to optimize analyte adsorption to the metal surface. |
| Internal Standard | Deuterated analyte variant, 4-mercaptobenzoic acid [47] | Adds a reference signal for quantitative correction and normalization. |
| ML Analysis Tools | Python (Scikit-learn), R [52] | Provides algorithms (LDA, PLS-DA, RF) for spectral classification and quantification. |
Advanced Data Analysis Workflow
Integrating SERS with machine learning involves a defined pipeline. The following diagram outlines the key steps from sample preparation to model deployment, which is central to a thesis on advanced spectral data analysis.
Key Steps Explained:
- Sample Preparation & SERS Acquisition: Follow the protocols and troubleshooting guides in Section 2 to collect high-quality, reproducible spectral data. For instance, the DCD-SERS method involves depositing a micro-volume of sample (e.g., tear fluid) onto a SERS substrate and allowing the solvent to evaporate, preconcentrating the analyte for trace detection [52].
- Spectral Preprocessing: Raw SERS spectra require preprocessing to remove artifacts like fluorescence baseline and variations in signal intensity. Common techniques include polynomial fitting for baseline correction and vector normalization [52].
- Feature Engineering: This step reduces the dimensionality of the data. It can involve selecting specific Raman peaks or using algorithms like Principal Component Analysis (PCA) to transform the data into a set of linearly uncorrelated variables, which makes the subsequent ML modeling more efficient and robust.
- ML Model Training & Validation: As shown in Table 1, various algorithms like LDA, PLS-DA, and RF are trained on a labeled dataset to classify spectra (e.g., "drug-present" vs "drug-absent"). It is critical to validate the model's performance on a separate, unseen test set using metrics like accuracy and AUC [52].
- Model Interpretation: For the results to be scientifically valid, understanding the model's decision is crucial. Explainable AI (XAI) techniques like SHAP (SHapley Additive exPlanations) can be used to identify which wavelengths (Raman shifts) were most important for the prediction, linking the ML output back to chemical intuition [43].
Nuclear Magnetic Resonance (NMR) spectroscopy serves as a pivotal technique for characterizing peptide therapeutics, providing unparalleled insights into their structural identity, purity, and conformational dynamics. For pharmaceutical researchers and developers, NMR delivers critical data on molecular structure, stereochemistry, and interactions under near-native conditions, making it indispensable for ensuring the safety and efficacy of peptide-based drugs [53] [54]. Unlike techniques that require crystallization, NMR analyzes peptides in solution, capturing their dynamic behavior and residual structure, which is particularly valuable for intrinsically disordered peptides (IDPs) [55] [53]. This case study explores practical troubleshooting guides, FAQs, and methodologies for leveraging NMR in peptide therapeutic development, framed within advanced spectral data analysis research.
Troubleshooting Guides: Common Experimental Challenges
Guide 1: Addressing Sample-Related Issues
Problem: Low Signal-to-Noise Ratio in NMR Spectra
- Potential Cause: Low peptide concentration or solubility issues.
- Solution:
- Concentrate Sample: Use centrifugal concentrators to increase peptide concentration. For NMR, typically 0.1–1 mM concentrations are required [55].
- Improve Solubility: Change solvent systems. For hydrophobic peptides, use deuterated DMSO (DMSO-d6) instead of D2O. Add small amounts of acetonitrile or isopropanol to improve dissolution [56].
- Verify Purity: Check for soluble aggregates that may broaden signals. Use HPLC purification prior to NMR analysis [56].
Problem: Excessive Signal Broadening
- Potential Cause: Aggregation or conformational exchange on an intermediate NMR timescale.
- Solution:
- Adjust Temperature: Record spectra at higher temperatures (e.g., 25–50°C) to disrupt weak aggregates and average conformations [55].
- Modify pH: Adjust pH to 2–4 or 7–9 to alter charge states and reduce self-association. Use minimal TFA which can cause pH artifacts [57].
- Use Chaotropes: Add low concentrations of urea (1–2 M) or guanidinium HCl to disrupt aggregation without denaturing structure [55].
Guide 2: Managing Data Collection and Interpretation
Problem: Severe Spectral Overlap in 1D 1H NMR
- Potential Cause: Many similar amino acid residues in large peptides (>20 residues).
- Solution:
- Employ 2D NMR: Utilize 2D experiments such as 1H-13C HSQC to disperse signals into a second dimension. For IDPs, CON experiments are superior to HSQC [55].
- Use Higher Field Spectrometers: Access instruments with ≥600 MHz fields for increased dispersion [53].
- Apply HiFSA: Implement 1H Iterative Full Spin Analysis to deconvolute overlapping signals through quantum mechanical modeling [57].
Problem: Difficulty in Detecting Low-Level Impurities
- Potential Cause: Impurities below 1% abundance or isomeric contaminants.
- Solution:
- Optimize Acquisition Parameters: Increase number of scans (64–256) and use relaxation delays of 3–5×T1 for quantitative accuracy [57].
- Apply qNMR: Use quantitative NMR with internal standards (e.g., DSS) to quantify impurities down to 0.1% [56] [57].
- Leverage Orthogonal Techniques: Combine with LC-MS to identify impurities that may not ionize well but are NMR-visible [53].
FAQs: NMR Analysis of Peptide Therapeutics
FAQ 1: What are the key advantages of NMR over other techniques like MS for peptide characterization? NMR provides comprehensive structural information that MS cannot, including full molecular framework, stereochemistry, atomic-level dynamics, and the ability to detect isomeric impurities and structurally similar degradants without ionization. While MS excels at molecular weight determination and fragmentation patterns, NMR reveals 3D structure, conformation, and interactions in solution [53].
FAQ 2: How can NMR detect and quantify minor impurities in peptide APIs? Advanced NMR techniques, particularly quantitative NMR (qNMR) and HiFSA profiling, can detect impurities at levels as low as 0.1%. This exceptional sensitivity stems from NMR's ability to resolve compounds based on their chemical environments rather than just mass, making it particularly effective for identifying positional isomers, tautomers, and non-ionizable compounds that LC-MS might miss [56] [57].
FAQ 3: What specific challenges do cyclic peptides present for NMR characterization? Cyclic peptides introduce several analytical challenges including complex fragmentation patterns, restricted conformational flexibility, and potential signal overlap due to symmetric elements. These issues require modified characterization approaches such as multi-dimensional HPLC coupled with high-resolution MS/MS, ion exchange chromatography, and specialized 2D NMR experiments including NOESY/ROESY to determine spatial proximity in constrained structures [56].
FAQ 4: Can NMR determine the stereochemistry of amino acids in therapeutic peptides? Yes, NMR is one of the most powerful techniques for analyzing chiral centers and stereochemistry. Through advanced 2D experiments including NOESY/ROESY (which provide nuclear Overhauser effect data about spatial proximity between atoms) and analysis of coupling constants, NMR can determine the absolute configuration of chiral centers and resolve complex stereochemical questions in peptide therapeutics [53].
FAQ 5: What are the optimal NMR experiments for studying intrinsically disordered peptides? For intrinsically disordered proteins (IDPs), the standard 15N-Heteronuclear Single Quantum Coherence (15N-HSQC) experiment is commonly used as an initial screening tool. However, the CON series of experiments (through-bond correlations) often proves superior for disordered proteins because they overcome the limitations of HSQC in addressing signal overlap and the unique structural features of IDPs [55].
Experimental Protocols for Key NMR Experiments
Protocol 1: HiFSA Peptide Sequencing and Purity Analysis
Principle: 1H iterative Full Spin Analysis (HiFSA) treats peptides as sequences of amino acids with negligible homonuclear spin coupling between them, allowing deconvolution of complex spectra into individual amino acid contributions [57].
Sample Preparation:
- Dissolve 2–5 mg of peptide in 600 μL of deuterated solvent (D2O or DMSO-d6).
- Add 0.1 mM DSS (sodium trimethylsilylpropanesulfonate) as internal chemical shift reference.
- Transfer to 5 mm NMR tube.
Data Acquisition:
- Temperature: 25–37°C
- 1D 1H NMR Parameters:
- Spectral width: 14 ppm
- Number of scans: 16–64
- Relaxation delay: 3 seconds
- Acquisition time: 3 seconds
- Suppress water signal using presaturation or WATERGATE pulse sequences.
Data Processing and HiFSA Workflow:
- Process FID with exponential line broadening (0.3–1 Hz).
- Reference spectrum to DSS (0 ppm).
- Input experimental spectrum to HiFSA software (e.g., PERCH NMR software).
- Iteratively refine spin parameters (δ, J, ν1/2) until simulated spectrum matches experimental data.
- Validate model by comparing integrated areas to known standard for quantification.
Application: Enables simultaneous identity verification and purity assessment, detecting conformer populations and impurities down to 0.1% [57].
Protocol 2: 2D NMR for Structural Confirmation
Sample Preparation: Uniformly 13C/15N-labeled peptide required. Express in E. coli using M9 minimal media with 13C-glucose and 15N-ammonium chloride [55].
Experiment Suite:
- 1H-13C HSQC:
- Scan number: 8–16
- Evolution period: 128–256 increments
- Sets up direct 1H-13C correlations for each amino acid.
- HMBC:
- Scan number: 32–64
- Evolution period: 200–400 increments
- Detects long-range 1H-13C couplings (2–3 bonds) through peptide backbone.
- NOESY:
- Mixing time: 200–500 ms
- Scan number: 16–32
- Evolution period: 300–400 increments
- Identifies protons in spatial proximity (<5 Å) for tertiary structure.
Data Interpretation Workflow:
- Assign backbone signals sequentially using through-bond correlations.
- Identify side chain environments from HSQC and TOCSY.
- Determine 3D structure constraints from NOE patterns.
- Calculate ensemble structures using restrained molecular dynamics.
Application: Complete structural elucidation of peptide therapeutics, including folding, dynamics, and binding epitopes [53].
Quantitative Data and Spectral Parameters
Table 1: NMR Spectral Properties of Common Amino Acids in Peptides
| Amino Acid | 1H Chemical Shift Range (ppm) | Characteristic Coupling Constants (J, Hz) | Notable Spectral Features |
|---|---|---|---|
| Glycine | 3.5–4.0 | - | Singlet; no beta protons |
| Alanine | 1.2–1.5 (βH) | 3Jαβ = 7.2 | Doublet from α-proton coupling |
| Valine | 0.9–1.0 (γH) | 3Jαβ = 6.8 | Doublet of doublets pattern |
| Leucine | 0.8–0.9 (δH) | 3Jαβ = 6.3 | Complex methyl region |
| Phenylalanine | 7.1–7.4 (aromatic H) | 3Jαβ = 5.9 | Characteristic aromatic signals |
| Proline | 1.8–2.2 (βH) | - | No amide proton |
Data derived from HiFSA analysis of common amino acids in D2O [57]
Table 2: Comparison of NMR Techniques for Peptide Analysis
| Technique | Structural Information Provided | Sample Requirements | Analysis Time | Detection Limits |
|---|---|---|---|---|
| 1D 1H NMR | Chemical environment, purity | 0.1–1 mM, unlabeled | 2–10 min | Impurities >1% |
| 1H HiFSA | Full spin parameters, quantification | 0.5–2 mM, unlabeled | 1–2 days | Impurities 0.1% |
| 1H-13C HSQC | Backbone and sidechain assignments | 0.5–1 mM, 13C-labeled | 30–60 min | - |
| HMBC | Long-range connectivity | 0.5–1 mM, 13C-labeled | 2–4 hours | - |
| NOESY | 3D structure, conformational info | 1–2 mM, unlabeled | 4–12 hours | Spatial proximity <5Å |
Data compiled from multiple sources on NMR peptide characterization [56] [53] [57]
Visual Workflows and Signaling Pathways
NMR Structure Determination Workflow
The Scientist's Toolkit: Essential Research Reagents and Materials
Table 3: Essential Research Reagents for NMR Peptide Characterization
| Reagent/Material | Function | Application Notes |
|---|---|---|
| Deuterated Solvents (D2O, DMSO-d6) | NMR-active solvent for lock signal | D2O for soluble peptides; DMSO-d6 for hydrophobic peptides |
| DSS (Sodium trimethylsilylpropanesulfonate) | Chemical shift reference | Internal standard at 0 ppm for 1H NMR |
| 13C-Glucose | Isotopic labeling | Carbon source for 13C-labeling in M9 media |
| 15N-Ammonium Chloride | Isotopic labeling | Nitrogen source for 15N-labeling in M9 media |
| Protease Inhibitors | Prevent peptide degradation | Essential for intrinsically disordered peptides |
| Reducing Agents (DTT, TCEP) | Maintain cysteine reduction | Prevent disulfide formation during analysis |
Essential materials compiled from peptide NMR methodologies [55] [57]
Experimental Protocols & Workflows
Protocol: Onboard AI Processing for Disaster Monitoring
This protocol outlines the operational workflow for using onboard AI to process hyperspectral data for real-time disaster monitoring, based on implementations from missions like Φ-Sat and Ciseres [58] [59].
- Objective: To enable autonomous, in-orbit detection of environmental hazards and reduce data downlink latency and volume.
- Procedure:
- Data Acquisition: Satellite sensors (e.g., hyperspectral imagers) capture raw imagery data.
- Onboard Pre-processing: Apply radiometric correction and basic georeferencing to the raw data. A cloud detection algorithm (e.g., a lightweight CNN) is executed to identify and mask pixels contaminated by clouds [58].
- AI-Based Hazard Detection: Execute specialized AI models on the pre-processed data. For example:
- Data Prioritization & Compression: A prioritization module assigns urgency scores to analyzed image segments. Irrelevant or low-priority data is discarded. Relevant data is highly compressed for transmission, achieving bandwidth reduction of up to 80% [59].
- Data Downlink: Transmit only the critical, processed insights (e.g., geographic coordinates of the flood, classification maps) and selected compressed imagery to ground stations.
Protocol: Lightweight Hyperspectral Super-Resolution
This protocol describes the methodology for performing real-time, single-image super-resolution of hyperspectral data using a Deep Pushbroom Super-Resolution (DPSR) network [60].
- Objective: To enhance the spatial resolution of hyperspectral images directly onboard a satellite to improve downstream analysis, while adhering to strict power and memory constraints.
- Procedure:
- Data Stream Acquisition: The hyperspectral sensor operates in a pushbroom mode, acquiring one image line (with all spectral channels) at a time.
- Line-by-Line Processing: The DPSR network processes each incoming line sequentially in the along-track direction.
- Causal Memory Exploitation: A memory mechanism based on Selective State Space Models (SSMs) retains relevant features from previously processed lines to inform the super-resolution of the current line. This avoids the need to load the entire image into memory [60].
- Real-Time Output: The network super-resolves the current line (e.g., by a 2x or 4x factor) within the acquisition time of the next line (e.g., 4.25 ms per line for PRISMA VNIR data), enabling real-time performance on low-power hardware [60].
- Output: A continuous stream of super-resolved hyperspectral lines, which are then passed to other onboard analysis modules or prepared for downlinking.
Troubleshooting Guides & FAQs
Frequently Asked Questions
Q1: Our onboard deep learning model performs well on ground-tested data but suffers significant accuracy loss in orbit. What could be the cause? A1: This is a common challenge. The primary causes and solutions are:
- Domain Shift: The model was trained on data that is not representative of the actual in-orbit conditions (e.g., different atmospheric conditions, seasonal variations, or sun angles). Solution: Implement robust data augmentation during training that simulates orbital variability. Where possible, leverage self-supervised learning techniques that can adapt to unlabeled in-orbit data [61].
- Insufficient Labeled Data: A lack of high-quality, labeled hyperspectral data for training. Solution: Utilize Generative Adversarial Networks (GANs) for data augmentation to create realistic synthetic training data. Also, explore few-shot or transfer learning approaches [61].
- Data Degradation: Noisy or corrupted data from sensor artifacts or cosmic radiation. Solution: Integrate spectral preprocessing steps into your onboard pipeline, such as filtering, smoothing, and cosmic ray removal algorithms, to clean the data before inference [15].
Q2: The volume of raw hyperspectral data is overwhelming our satellite's downlink capacity. How can we reduce it? A2: Several onboard data reduction strategies can be employed:
- Intelligent Compression: Use AI-driven compression instead of just simple quantization. For instance, Generative Adversarial Networks (GANs) can be used for both noise reduction and data compression [61].
- Band Selection: Not all spectral bands are equally useful. Analyze your specific application (e.g., vegetation monitoring, mineralogy) to identify and retain only the most informative spectral bands. Research has shown that a 50% reduction in channels can have a negligible effect on classifier accuracy for some applications [62].
- Feature Extraction & Filtering: Process data to downlink only high-level information. Instead of sending raw pixels, run AI models onboard to detect targets or classify scenes, and then transmit only the resulting parametric information (e.g., location of ships, classification maps of land cover) [58]. This can reduce data volume by up to 80% [59].
Q3: What are the key hardware considerations for running deep learning models on a satellite? A3: The choice of hardware is critical for success in a resource-constrained space environment.
- Processing Unit: Select specialized, low-power hardware accelerators designed for edge computing. Prominent options include:
- Field-Programmable Gate Arrays (FPGAs): Offer high performance per watt and can be reconfigured post-launch [61] [58].
- Vision Processing Units (VPUs): Such as the Intel Movidius Myriad 2, which provides efficient deep learning inference for compact CubeSats [59].
- Hybrid Architectures: Platforms like the NVIDIA Jetson or STAR.VISION's String platform combine CPUs, GPUs, and FPGAs to balance different workloads [58] [59].
- Radiation Hardening: Ensure the selected processor is either radiation-hardened or has adequate fault-tolerant designs to operate reliably in the harsh space environment [59].
- Memory and Power: The model must fit within the satellite's limited memory and power budget. This necessitates the use of lightweight neural network architectures like 1D-CNNs or specially designed models like DPSR [61] [60].
Troubleshooting Common Technical Issues
| Issue | Possible Cause | Solution |
|---|---|---|
| High Latency in Onboard Processing | Model is too computationally complex for the hardware. | Optimize and prune the neural network. Use lightweight architectures (e.g., 1D-CNNs, DPSR) designed for edge devices [61] [60]. |
| Model Cannot Be Updated Post-Launch | Lack of a software-defined, reconfigurable payload. | Utilize FPGAs or processors that support remote reprogramming. Missions like Φ-Sat-2 and Open Cosmos's platform demonstrate the ability to update AI models in orbit [59]. |
| Poor Generalization to New Geographic Areas | Overfitting to the training dataset's geographic features. | Incorporate a wider variety of geographic and seasonal data during training. Employ domain adaptation techniques as part of the machine learning pipeline [61]. |
| Excessive Memory Usage During Inference | Processing full image tiles instead of streams. | Adopt a sequential processing approach that matches the sensor's data acquisition method (e.g., pushbroom). The DPSR network processes data line-by-line, drastically reducing memory footprint [60]. |
Performance Data & Visualization
Quantitative Performance of Onboard AI Models
Table 1: Comparison of computational requirements for different HSI super-resolution methods.
| Model | Super-Resolution Factor | FLOPs per Pixel | Memory for PRISMA VNIR frame | Real-Time Performance |
|---|---|---|---|---|
| DPSR [60] | 4x | 31 K | < 1 GB | Yes (4.25 ms/line) |
| MSDformer [60] | 4x | 714 K | > 24 GB | No |
| CST [60] | 4x | 245 K | > 24 GB | No |
| EUNet [60] | 2x | 37 K | Not Specified | No |
Table 2: Data reduction and performance metrics from operational AI-enabled satellite missions.
| Mission / Application | Key AI Function | Performance / Benefit |
|---|---|---|
| Φ-Sat-1 [61] | Cloud detection & filtering | Reduced data downlink by filtering out cloudy images. |
| STAR.VISION Platform [59] | Multiple (flood, fire, ship detection) | Reduced bandwidth usage by up to 80%. |
| Hyperspectral Band Selection [62] | Dimensionality reduction | 50% channel reduction with negligible accuracy loss for classifiers. |
| Onboard Processing (General) [59] | Disaster monitoring | Reduced insight delivery time from hours/days to minutes. |
Workflow and Architecture Diagrams
Onboard AI Processing Workflow
Pushbroom Super-Resolution
The Scientist's Toolkit: Research Reagent Solutions
Table 3: Essential hardware and software for developing onboard HSI AI solutions.
| Item | Category | Function |
|---|---|---|
| Lightweight CNN | Algorithm | A compact neural network architecture for efficient pixel-wise classification and target detection in resource-limited satellite environments [61]. |
| Deep Pushbroom Super-Resolution (DPSR) | Algorithm | A neural network designed for real-time, line-by-line hyperspectral image super-resolution, matching the pushbroom sensor acquisition to minimize memory use [60]. |
| Generative Adversarial Network (GAN) | Algorithm | Used for data augmentation (creating synthetic training data) and for tasks like noise reduction and data compression onboard the satellite [61]. |
| FPGA (e.g., Xilinx Space-Grade) | Hardware | A reconfigurable processor that provides high-performance, low-power computation for AI inference and can be updated post-launch [61] [59]. |
| VPU (e.g., Intel Movidius Myriad 2) | Hardware | A vision processing unit that provides efficient, specialized computation for running deep learning models on small satellites like CubeSats [59]. |
| Hybrid AI Platform (e.g., STAR.VISION String) | Hardware | An integrated computing unit combining CPU, GPU, and FPGA to handle complex, simultaneous AI workloads and data processing in orbit [59]. |
| Principal Component Analysis (PCA) | Algorithm | A classic dimensionality reduction technique to compress hyperspectral data by transforming it into a set of linearly uncorrelated principal components [62]. |
| Spectral Preprocessing Algorithms | Algorithm | A suite of techniques (e.g., cosmic ray removal, baseline correction, scattering correction) to clean and prepare raw spectral data for accurate analysis [15]. |
Optimizing Your Workflow: Tackling Data and Model Challenges
Frequently Asked Questions (FAQs)
1. What is the fundamental difference between feature selection and feature extraction? Feature selection chooses a subset of the most relevant original features from your dataset without altering them. Methods include filter, wrapper, and embedded techniques. In contrast, feature extraction creates new, synthetic features by combining or transforming the original features, effectively projecting the data into a lower-dimensional space. Principal Component Analysis (PCA) is a classic example of feature extraction [63] [64].
2. My t-SNE visualization shows different results every time I run it. Is this normal? Yes, this is a common point of confusion. t-SNE is a non-deterministic algorithm, meaning its results can vary between runs due to its random initialization and stochastic nature. To ensure robust and reproducible results, it is crucial to set a random seed before execution. Furthermore, the algorithm is sensitive to its hyperparameters (like perplexity and learning rate), which should be tuned and reported for consistency [65] [66] [64].
3. How do I decide how many dimensions to keep after using PCA? A standard approach is to use a Scree Plot, which visualizes the variance explained by each principal component. You then select the number of components that cumulatively explain a sufficient amount of your data's total variance (e.g., 95% or 99%). This provides a data-driven balance between compression and information retention [63] [66] [67].
4. When should I use UMAP over t-SNE for visualizing high-dimensional data? UMAP often outperforms t-SNE in preserving the global structure of the data (the large-scale relationships between clusters) and is generally faster, especially on large datasets. t-SNE is exceptionally good at preserving local structures (the fine-grained relationships within a cluster). A 2025 benchmarking study on transcriptomic data confirmed that UMAP and t-SNE are top performers, with UMAP offering advantages in computational efficiency [65] [67].
5. Can dimensionality reduction lead to overfitting or data loss? Yes, these are key disadvantages. If the reduction process is too aggressive, it can remove important information, leading to a drop in model accuracy. Conversely, if the reduced features are tuned too closely to the training data's noise, it can cause overfitting, harming the model's performance on new, unseen data. Careful validation is essential [63].
Troubleshooting Guides
Issue 1: Poor Clustering Results After Dimensionality Reduction
Problem: After applying dimensionality reduction (DR), the clusters in your lower-dimensional space are not well-separated or do not align with known labels.
| Potential Cause | Diagnostic Steps | Solution |
|---|---|---|
| Incorrect DR Method | The chosen method may not preserve the data structure needed for clustering. | Switch from a linear method (like PCA) to a non-linear method (like UMAP or t-SNE) that better captures complex manifolds. A 2025 study found PaCMAP, TRIMAP, t-SNE, and UMAP superior for preserving biological similarity in transcriptome data [65]. |
| Wrong Number of Components | Keeping too few dimensions discards meaningful variance; too many can retain noise. | Plot the explained variance (for PCA) or use intrinsic dimensionality estimators. Re-run DR, retaining more dimensions (e.g., 50 instead of 2) for clustering tasks [63] [67]. |
| Hyperparameter Sensitivity | Non-linear methods like t-SNE and UMAP are sensitive to their settings. | Systematically tune key parameters. For UMAP, adjust n_neighbors (larger values preserve more global structure). For t-SNE, adjust perplexity [65] [67]. |
Experimental Protocol: Benchmarking DR Methods for Clustering
- Prepare Data: Standardize your dataset (center to mean=0, scale to variance=1) [68].
- Apply Multiple DR Methods: Generate embeddings using several algorithms (e.g., PCA, t-SNE, UMAP, PaCMAP) with consistent dimensions.
- Cluster: Apply a clustering algorithm like hierarchical clustering to each embedding.
- Validate: Use external validation metrics like Normalized Mutual Information (NMI) or Adjusted Rand Index (ARI) to compare clustering results against ground-truth labels [65].
Issue 2: Handling the "Curse of Dimensionality" in Predictive Modeling
Problem: A model trained on high-dimensional data (e.g., thousands of genes or spectral features) is slow to train, performs poorly, or is overfitting.
| Potential Cause | Diagnostic Steps | Solution |
|---|---|---|
| Data Sparsity | In high-dimensional space, data points are scattered, making it hard to find patterns. | Apply DR as a preprocessing step before model training. This reduces the feature space, improving computation speed and model generalizability by mitigating overfitting [63] [64]. |
| Multicollinearity | Many features are highly correlated, introducing redundancy and instability. | Use DR techniques like PCA, which creates new, uncorrelated variables (principal components). Alternatively, use feature selection methods to remove redundant variables [63] [64]. |
Experimental Protocol: DR for Model Optimization
- Split Data: Partition your data into training and testing sets.
- Fit DR on Training Set: Apply PCA (or another method) only to the training data and learn the transformation.
- Transform Both Sets: Use the learned transformation to apply DR to both the training and testing sets. This prevents data leakage.
- Train and Evaluate: Train your model on the reduced training set and evaluate its performance on the reduced testing set. Compare metrics against the model trained on raw data.
Issue 3: Choosing the Right Dimensionality Reduction Algorithm
Problem: With many DR techniques available, selecting the most appropriate one for a specific data type and goal is challenging.
The following workflow diagram outlines a logical decision process for selecting a DR method based on your primary goal and data structure:
The table below provides a quantitative comparison of common DR methods based on a 2025 benchmark study for biological data [65] [67].
Table 1: Comparison of Key Dimensionality Reduction Techniques
| Method | Type | Key Strengths | Key Limitations | Best for Spectral Data? |
|---|---|---|---|---|
| PCA | Linear | Fast, interpretable, preserves global variance. | Fails to capture nonlinear relationships. | Excellent for initial exploration and noise reduction. |
| t-SNE | Nonlinear | Excellent at preserving local cluster structure. | Slow, stochastic (results vary), poor at preserving global structure. | Ideal for visualizing complex, clustered spectral patterns. |
| UMAP | Nonlinear | Preserves more global structure than t-SNE, faster. | Sensitive to hyperparameters, can be less stable than PCA. | Excellent alternative to t-SNE for visualizing and analyzing spectral manifolds. |
| LDA | Linear (Supervised) | Maximizes separation between known classes. | Requires class labels, assumes Gaussian data. | Use when you have predefined sample groups/classes to separate. |
| Autoencoders | Nonlinear (Neural) | Very flexible, can model complex nonlinearities. | Computationally intensive, requires tuning, "black box." [67] | Powerful for learning compressed representations of highly complex spectral signatures. |
The Scientist's Toolkit: Research Reagent Solutions
Table 2: Essential Computational Tools for Dimensionality Reduction
| Item | Function | Example Use in Spectral Research |
|---|---|---|
| Scikit-learn (Python) | A comprehensive library featuring PCA, LDA, Kernel PCA, and many other DR algorithms. | The primary tool for implementing standard DR methods and preprocessing (e.g., scaling) of spectral data [69]. |
| UMAP (Python/R) | A specialized library for the UMAP algorithm, optimized for performance and scalability. | Creating stable, high-quality 2D/3D visualizations of high-dimensional spectral datasets for exploratory analysis [65]. |
| TensorFlow/PyTorch | Deep learning frameworks used to build and train custom autoencoder architectures. | Designing neural networks to learn non-linear, compressed latent representations of raw spectral data [66] [69]. |
| Pheatmap (R) / Seaborn (Python) | Libraries for creating annotated heatmaps, often combined with hierarchical clustering. | Visualizing the entire high-dimensional spectral matrix, revealing patterns and sample relationships before DR [68]. |
| StandardScaler | A preprocessing function that centers and scales data (mean=0, variance=1). | Critical step: Normalizes spectral intensities so that DR algorithms are not skewed by arbitrary measurement units [68]. |
In the realm of advanced spectral data analysis, the journey from raw, distorted measurements to chemically meaningful information is complex. Spectral techniques are indispensable for material characterization, yet their weak signals remain highly prone to interference from environmental noise, instrumental artifacts, sample impurities, and scattering effects [15] [11]. These perturbations not only degrade measurement accuracy but also critically impair machine learning–based spectral analysis by introducing artifacts and biasing feature extraction [11]. The field is now undergoing a transformative shift from rigid, one-size-fits-all preprocessing toward intelligent, context-aware adaptive processing [15]. This technical support guide, framed within a broader thesis on advanced data analysis, provides researchers and drug development professionals with targeted troubleshooting and methodological frameworks to navigate this shift, ensuring their preprocessing strategies enhance rather than undermine analytical robustness.
Troubleshooting Guides and FAQs
Frequently Asked Questions
Q1: My FT-IR spectrum shows a drifting baseline. What is the likely cause and how can I correct it?
A drifting baseline, appearing as a continuous upward or downward trend, introduces systematic errors in peak integration and intensity measurements [70]. This is commonly caused by:
- Instrumental Factors: Deuterium or tungsten lamps failing to reach thermal equilibrium in UV-Vis, or thermal expansion/mechanical disturbances misaligning the interferometer in FT-IR spectrometers [70].
- Environmental Influences: Air conditioning cycles or mechanical vibrations from adjacent equipment disturbing optical components [70].
- Diagnostic Step: Record a fresh blank spectrum under identical conditions. If the blank exhibits similar drift, the issue is likely instrumental. If the blank is stable, the problem is sample-related, such as matrix effects or contamination [70]. For correction, algorithms like Piecewise Polynomial Fitting or Two-Side Exponential (ATEB) smoothing are highly effective at suppressing this low-frequency drift [11].
Q2: I am missing expected peaks in my Raman spectrum. What should I investigate?
The absence of expected peaks can result from several factors:
- Insufficient Signal: This can be due to detector malfunction or aging, inconsistent sample preparation (e.g., low concentration, lack of homogeneity), or insufficient laser power in Raman spectroscopy [70].
- Signal Obscuration: Minor drifts in instrument sensitivity can degrade the signal-to-noise ratio, making weak peaks indistinguishable from noise [70].
- Troubleshooting Protocol: Verify detector sensitivity and laser power settings. Ensure consistent and correct sample preparation. Employ spectral derivatives to enhance resolution and separate overlapping peaks that might be obscuring your target signal [11] [71].
Q3: How can I remove cosmic ray spikes from my single-scan Raman data without blurring genuine spectral features?
Cosmic ray artifacts are high-frequency, sharp spikes that can be mistaken for real peaks. For real-time single-scan correction, several advanced methods exist:
- Missing-Point Polynomial Filter (MPF): Explicitly excludes the central outlier point and fits a quadratic polynomial via least squares, preserving local feature fidelity for uniformly sampled data [11].
- Nearest Neighbor Comparison (NNC): Uses normalized covariance similarity and dual-threshold noise estimation, making it suitable for real-time hyperspectral imaging under low signal-to-noise conditions [11].
- Wavelet Transform (DWT+K-means): Employs multi-scale wavelet analysis to preserve spectral details while automatically removing high-frequency artifacts, ideal for single-scan correction [11].
Q4: What is the most effective way to preprocess hyperspectral medical imaging data to correct for glare and sample height variations?
Glare adds a wavelength-independent offset, while height variations cause a multiplicative scaling of the spectrum [72]. Preprocessing aims to remove these non-chemical variations while retaining contrast from tissue composition.
- Standard Normal Variate (SNV) and Multiplicative Scatter Correction (MSC) are specifically designed to correct for multiplicative scaling and additive effects [71] [72].
- Normalization techniques like Min-Max, Area Under the Curve (AUC), and Single Wavelength Normalization are also highly effective. The optimal choice among these four depends on the specific type of contrast between the tissue types being analyzed [72].
Q5: My chemometric model is performing poorly. Could data preprocessing be the issue?
Yes, neglecting proper data preprocessing is a common reason for model failure. Without it, algorithms like PCA or PLS may misinterpret irrelevant variations (e.g., baseline drifts, scattering) as chemical information [71]. To address this:
- Systematic Pipeline: Test a combination of methods. A common effective strategy involves applying Standard Normal Variate (SNV) followed by a Second-Derivative transformation to remove baseline effects and enhance resolution [71] [12].
- Avoid Defaults: Do not over-rely on standard methods without validating their suitability for your specific dataset [71].
Common Spectral Anomalies and Diagnostic Framework
The table below summarizes common spectral patterns, their causes, and corrective actions.
Table 1: Troubleshooting Common Spectral Anomalies
| Visual Symptom | Primary Causes | Corrective Preprocessing & Actions |
|---|---|---|
| Baseline Drift/Curvature [70] | Instrument not stabilized; environmental fluctuations; scattering effects [11] [70] | Apply Baseline Correction (e.g., Polynomial Fitting, B-Spline, Morphological Operations) [11] [71]. Ensure instrument warm-up and check for vibrations. |
| High-Frequency Noise [70] | Electronic interference; detector instability; low light throughput [70] | Apply Filtering and Smoothing (e.g., Savitzky-Golay, Moving Average) [11]. Increase integration time or signal averaging. |
| Cosmic Ray Spikes [11] | High-energy particle interaction with detector [15] [11] | Use Cosmic Ray Removal algorithms (e.g., MPF, NNC, Wavelet Transform) designed for single-scan or sequential data [11]. |
| Multiplicative Effects & Pathlength Differences [72] | Particle size variations; surface roughness; differences in sample thickness or optical path [71] [72] | Apply Scatter Correction (e.g., Multiplicative Scatter Correction - MSC, Standard Normal Variate - SNV) or Normalization [71] [72]. |
| Overlapping Peaks [71] | Spectral congestion from multiple analytes; low resolution [71] | Use Spectral Derivatives (First or Second Derivative) to enhance resolution and separate overlapping features [11] [71]. |
The following diagram outlines a systematic troubleshooting workflow to diagnose and resolve spectral issues based on the observed anomalies.
Quantitative Comparison of Preprocessing Techniques
Selecting the right preprocessing method is crucial and depends on the type of spectral distortion and the analytical goal. The tables below provide a comparative overview of advanced techniques.
Table 2: Comparison of Advanced Preprocessing Methods
| Method Category | Example Algorithm | Core Mechanism | Advantages | Disadvantages | Primary Application Context |
|---|---|---|---|---|---|
| Cosmic Ray Removal | Nearest Neighbor Comparison (NNC) [11] | Uses normalized covariance similarity and dual-threshold noise estimation. | Works on single-scan; avoids read noise; auto-dual thresholds optimize sensitivity. | Assumes spectral similarity; smoothing affects low-SNR regions. | Real-time hyperspectral imaging under low SNR. |
| Baseline Correction | B-Spline Fitting (BSF) [11] | Local polynomial control via "knots" and recursive basis functions. | Local control avoids overfitting; high sensitivity (3.7x boost for gases). | Scaling poor for large datasets; knot tuning is critical. | Trace gas analysis; resolving overlapping peaks & irregular baselines. |
| Scattering Correction | Multiplicative Scatter Correction (MSC) [12] | Removes ideal linear scattering and its effects by fitting a reference spectrum. | Effectively removes multiplicative scaling and additive effects. | Over-reliance without validation can be problematic. | Correcting for particle size effects in powdered samples. |
| Normalization | Standard Normal Variate (SNV) [12] | Centers and scales each spectrum to unit variance. | Removes deviations caused by particle size and scattering. | Sensitive to the presence of large, dominant peaks. | Standardizing spectra for multivariate modeling. |
| Feature Enhancement | Spectral Derivatives [11] [71] | Calculates first or second derivative of the spectrum. | Removes baseline effects and enhances resolution of overlapping peaks. | Amplifies high-frequency noise. | Separating overlapping peaks in complex mixtures. |
Table 3: Suitability of Normalization Techniques for Hyperspectral Medical Imaging [72]
| Preprocessing Algorithm | Ability to Reduce Glare & Height Variations | Contrast Retention Based on Optical Properties | Key Consideration |
|---|---|---|---|
| Standard Normal Variate (SNV) | High | High | Generally suitable for various contrast types. |
| Min-Max Normalization | High | High | Performance depends on the type of contrast between tissues. |
| Area Under the Curve (AUC) | High | High | Performance depends on the type of contrast between tissues. |
| Single Wavelength Normalization | High | High | Performance depends on the type of contrast between tissues. |
| Multiplicative Scatter Correction (MSC) | High | Medium | Effective, but contrast retention may be less optimal than top methods. |
| First Derivative (FD) | Medium | Medium | Also helps resolve overlapping peaks. |
| Second Derivative (SD) | Medium | Medium | Also helps resolve overlapping peaks and remove linear baselines. |
| Mean Centering (MC) | Low | Low | Primarily used in conjunction with other methods before modeling. |
Experimental Protocols and Workflows
Protocol 1: Building a Robust Preprocessing Pipeline for FT-IR ATR Analysis
This protocol is adapted from best practices in forensic and food science analysis [71].
1. Principle: Convert raw, distorted FT-IR ATR spectra into reliable inputs for chemometric modeling by minimizing noise, baseline shifts, and scattering effects [71].
2. Reagents and Equipment:
- FT-IR Spectrometer with ATR accessory
- Suitable cleaning solvents for the ATR crystal (e.g., methanol, isopropanol)
- Software capable of performing preprocessing (e.g., Python with SciPy, MATLAB, commercial chemometrics software)
3. Procedure:
- Step 1: Data Acquisition. Ensure the ATR crystal is clean and perform a fresh background scan. Collect sample spectra, ensuring consistent pressure application on the crystal.
- Step 2: Baseline Correction. Apply a baseline correction algorithm (e.g., polynomial fitting or "rubber-band" method) to remove any upward or downward drift in the spectra [71].
- Step 3: Scatter Correction. Apply Standard Normal Variate (SNV) or Multiplicative Scatter Correction (MSC) to correct for multiplicative effects caused by particle size or surface roughness [71] [12].
- Step 4: Feature Enhancement (Optional). Apply a second-derivative transformation (e.g., using Savitzky-Golay filters) to remove residual baseline effects and enhance the resolution of overlapping peaks [71] [12]. Be aware that this amplifies noise.
- Step 5: Normalization/Centering. If building a multivariate model, mean-centering is often applied to the preprocessed data before Principal Component Analysis (PCA) or Partial Least Squares (PLS) regression [71].
4. Analysis: Evaluate the effectiveness of the preprocessing pipeline by inspecting the corrected spectra and assessing the performance and clustering in subsequent PCA or PLS models [71].
Protocol 2: Implementing Context-Aware Adaptive Processing for Single-Scan Spectra
This protocol leverages intelligent algorithms that adapt to spectral content, a key innovation in the field [15] [11].
1. Principle: Utilize algorithms that automatically adjust their parameters based on local spectral features to remove artifacts like cosmic rays while preserving delicate chemical information.
2. Procedure:
- Step 1: Cosmic Ray Removal with MPF. For single-scan Raman or IR spectra with uniform sampling, use the Missing-Point Polynomial Filter (MPF). This algorithm explicitly excludes the central point in a window (treating it as an outlier) and fits a quadratic polynomial via least squares to the remaining points for correction, thus preserving local feature fidelity [11].
- Step 2: Adaptive Baseline Correction with MOM. Apply a baseline correction method based on Morphological Operations (MOM). This technique uses erosion and dilation with a structural element to estimate the baseline, effectively maintaining the geometric integrity of spectral peaks and troughs, making it highly suitable for pharmaceutical classification workflows [11].
- Step 3: Validation. Always compare the preprocessed spectrum to the raw data to ensure genuine peaks have not been distorted or removed. Domain knowledge of expected absorption bands is critical for this validation [71].
The following diagram illustrates the logical workflow for an adaptive preprocessing pipeline, integrating both standard and intelligent correction steps.
The Scientist's Toolkit: Key Preprocessing Algorithms and Their Functions
The table below details essential preprocessing techniques that form the core "toolkit" for researchers working with complex spectral data.
Table 4: Essential Preprocessing Techniques for Spectral Data
| Technique | Primary Function | Key Application Note |
|---|---|---|
| Standard Normal Variate (SNV) [71] [12] | Corrects for multiplicative scaling and additive effects caused by light scattering and particle size differences. | Standardizes each spectrum, making it a vital step before multivariate analysis of heterogeneous samples. |
| Multiplicative Scatter Correction (MSC) [71] [12] | Similar to SNV, it removes scattering effects by fitting each spectrum to a reference (often the mean spectrum). | Particularly useful for powdered samples or solid mixtures with variable physical properties. |
| Savitzky-Golay Filter [11] | A digital filter that can be used for smoothing and calculating derivatives in a single step. | Provides a good trade-off between noise reduction and preservation of spectral shape (e.g., peak width and height). |
| Second Derivative [71] [12] | Removes baseline offsets and slopes while enhancing the resolution of overlapping peaks. | Amplifies high-frequency noise, so it is often applied after initial smoothing. |
| B-Spline Fitting [11] | A flexible baseline correction method that uses local polynomial control points ("knots") to model complex, irregular baselines. | Excellent for trace gas analysis and other applications with highly variable backgrounds. |
| Orthogonal Signal Correction (OSC) [12] | Removes signals from the spectral data that are orthogonal (unrelated) to the response variable of interest. | Strengthens the prediction ability of calibration models by reducing the number of principal components needed. |
FAQs: Lightweight Models and Hardware Acceleration for Spectral Data
FAQ: What are the main strategies for making deep learning models lightweight enough for resource-constrained environments like satellite onboard processing or portable devices?
Several core strategies have proven effective:
- Architectural Efficiency: Using depthwise separable convolutions, which significantly reduce parameters and computational cost compared to standard convolutions [73] [74].
- Spectral Domain Processing: Executing Convolutional Neural Networks (CNNs) in the spectral (Fourier) domain, where complex spatial convolutions become simple point-wise multiplications, drastically cutting computational workload [75].
- Model Compression: Techniques like quantization (reducing the precision of model weights) and pruning (removing non-critical weights) are widely used to shrink model size and accelerate inference [61] [75].
- Hardware-Codesign: Designing neural networks in tandem with specialized low-power processors, such as FPGAs (Field-Programmable Gate Arrays), to achieve high-throughput analysis while minimizing energy consumption [61].
FAQ: My spectral data is noisy. How can I improve my model's robustness without making it computationally heavy?
Integrating noise robustness directly into the model architecture and training process is key. For inertial sensor data, using a Squeeze-and-Excitation (SE) block allows the model to adaptively recalibrate channel-wise feature responses, improving focus on meaningful signals over noise [74]. Furthermore, employing stochastic depth during training, where some network layers are randomly skipped, enhances the model's robustness and ability to generalize, making it less sensitive to variations and noise in the input data [73]. Generative models, such as Generative Adversarial Networks (GANs), can also be used for data augmentation and noise reduction, strengthening models when training data is limited [61].
FAQ: Are there lightweight alternatives to complex vision models like CNNs for purely spectral (non-imaging) data?
Yes, one-dimensional CNNs (1D-CNNs) are a highly effective and lightweight alternative for processing sequential spectral data [61]. Unlike 2D-CNNs designed for images, 1D-CNNs apply convolutional filters across the spectral dimension, making them ideal for capturing patterns in spectra while being far less computationally intensive. This has made them a preferred architecture for onboard satellite processing of hyperspectral data [61].
FAQ: How can I understand the decisions made by a complex, lightweight deep learning model to ensure it's learning the correct spectral features?
Model interpretability is crucial. Techniques like Gradient-weighted Class Activation Mapping (Grad-CAM) can be adapted for 1D signals to generate a visual heatmap highlighting which parts of the input spectrum (e.g., specific wavelengths) were most influential in the model's prediction [74]. Another method is LIME (Local Interpretable Model-agnostic Explanations), which approximates the complex model locally with an interpretable one to explain individual predictions [74].
Troubleshooting Guides
Problem: Model is Too Large for On-Device Deployment
Symptoms: Inability to load model on mobile/edge device, unacceptably slow inference speed, high memory or battery consumption.
Diagnosis and Solutions:
| Diagnostic Step | Solution | Reference |
|---|---|---|
| Check model size and parameter count. | Implement depthwise separable convolutions to reduce parameters and computational load. | [73] [74] |
| Profile computational workload. | Transition model operations to the spectral domain to replace convolutions with efficient point-wise multiplication. | [75] |
| Model is insufficiently compressed. | Apply post-training quantization (e.g., converting FP32 weights to INT8) to shrink model size. | [75] |
Workflow: Model Lightweighting
Problem: Poor Performance on Small or Spectrally Weak Targets
Symptoms: The model fails to detect small targets in infrared remote sensing or misses subtle spectral features in complex mixtures.
Diagnosis and Solutions:
| Diagnostic Step | Solution | Reference |
|---|---|---|
| Check feature fusion strategy. | Integrate a Cross-Channel Feature Attention Network (CFAN) to suppress invalid background channels and enhance small-target features. | [73] |
| Assess multi-scale feature extraction. | Develop a Scale-Wise Feature Network (SWN) using multi-scale feature extraction to capture targets of different sizes. | [73] |
| Evaluate edge and detail preservation. | Build a Texture/Detail Capture Network (TCN) to capture edge details and prevent blurring of small targets. | [73] |
Workflow: Enhancing Small Target Detection
Table: Essential Components for Lightweight Spectral Model Development
| Item | Function | Example in Context |
|---|---|---|
| Depthwise Separable Convolution | Drastically reduces computational parameters by splitting a standard convolution into a depthwise (per-channel) and a pointwise (1x1) convolution. | Used in LiteFallNet for efficient feature extraction from sensor data [74]. |
| Squeeze-and-Excitation (SE) Block | Recalibrates channel-wise feature responses by modeling interdependencies between channels, improving feature quality without high cost. | Integrated into LiteFallNet to enhance focus on informative sensor signals [74]. |
| Gated Recurrent Unit (GRU) | A type of RNN that efficiently models short-term temporal dependencies in sequential data (e.g., spectral series, sensor data). | LiteFallNet uses a GRU layer for temporal modeling of motion signals [74]. |
| Spectral CNN (SpCNN) | A CNN variant that operates in the Fourier domain, replacing spatial convolutions with computationally efficient element-wise multiplications. | Achieved orders of magnitude reduction in computational workload for character recognition [75]. |
| Transformer with Self-Attention | Weights the importance of different parts of input data (e.g., wavelengths in a spectrum) relative to each other, capturing long-range dependencies. | Identified as a transformative architecture for handling complex, high-dimensional chemometric datasets [76]. |
| Field-Programmable Gate Array (FPGA) | A hardware accelerator that can be reprogrammed for specific algorithms, enabling high-speed, low-power inference of neural networks on-edge. | Cited as a key tool for onboard deep learning inference in satellite hyperspectral imaging [61]. |
Experimental Protocol: Benchmarking a Lightweight Spectral Model
Objective: To validate the performance and efficiency gains of a lightweight spectral model (e.g., a Spectral CNN) against a baseline spatial model for a classification task.
Materials/Datasets:
- Custom 94-class ASCII Dataset: A complex dataset containing lowercase/uppercase letters, numbers, and symbols across various fonts, suitable for real-world OCR tasks [75].
- Standard MNIST Dataset: For baseline comparison with existing literature [75].
- Hardware: Standard CPU/GPU for training; resource-constrained device (e.g., mobile phone, Raspberry Pi) for inference testing.
Methodology:
- Model Implementation:
- Implement a baseline spatial CNN model (e.g., a VGG7 or LeNet5 architecture).
- Implement the proposed Spectral CNN (SpCNN) model. This involves:
- Adding a layer to transform input features into the spectral domain using FFT.
- Replacing spatial convolution layers with point-wise multiplication operations in the spectral domain.
- Using spectral-compatible activation functions and pooling.
- Training: Train both models on the chosen dataset (e.g., the 94-class ASCII dataset) using identical training protocols, optimizers, and loss functions.
- Evaluation Metrics: Compare models on the following metrics:
- Accuracy: Overall classification correctness.
- Precision & Recall: Quality and completeness of predictions.
- Computational Workload: Number of floating-point operations (FLOPs).
- Model Size: Disk footprint in Megabytes (MB).
- Inference Speed: Frames-per-second (FPS) or processing time per sample on the target edge device.
Expected Outcome: The experiment should demonstrate that the SpCNN model achieves comparable accuracy to the spatial model but with a significantly reduced computational workload, smaller model size, and faster inference speed, making it more suitable for edge deployment [75].
Frequently Asked Questions (FAQs)
1. What are the most common failure modes when training GANs on small datasets? The most common failure modes are mode collapse and vanishing gradients [77] [78]. Mode collapse occurs when the generator produces a limited variety of outputs, often just one or a few similar samples, because it finds a single output that reliably fools the discriminator [77]. Vanishing gradients happen when the discriminator becomes too good and can perfectly distinguish real from fake data; this prevents the generator from receiving meaningful gradients to learn and improve [77] [78].
2. How can Self-Supervised Learning (SSL) help when I have lots of data but no labels? SSL allows you to pretrain a model on a large volume of unlabeled data by inventing a "pretext task" that does not require human annotations [79] [80] [81]. The model learns powerful and general data representations from this task. These learned representations can then be fine-tuned on your specific downstream task (e.g., classification or segmentation) with a much smaller set of labeled data, leading to better performance and faster convergence [79] [80].
3. Can GANs and SSL be combined? Yes. One powerful approach is to use a GAN, particularly its discriminator network, in a self-supervised pretraining phase [80] [81] [82]. The GAN is trained on unlabeled data to learn the underlying data distribution. The features learned by its discriminator can then be used as a powerful feature extractor for other supervised tasks, a method sometimes referred to as GAN-DL (Discriminator Learner) [81].
4. What is a simple pretext task for Self-Supervised Learning? A common and effective pretext task is rotation prediction [82]. The model is presented with images that have been rotated by a fixed set of degrees (e.g., 0°, 90°, 180°, 270°) and is trained to predict the rotation that was applied. This forces the model to learn meaningful semantic features about the object's structure and orientation [82].
Troubleshooting Guides
Problem: Mode Collapse in GANs
Observation: The generator is producing the same or a very small set of outputs repeatedly.
Solutions:
- Use Wasserstein Loss (WGAN): This loss function helps alleviate mode collapse by providing more stable gradients, even when the discriminator is trained to optimality. This prevents the generator from getting stuck on a single output [83] [77].
- Implement Unrolled GANs: This technique modifies the generator's loss function to incorporate the outputs of future versions of the discriminator. This prevents the generator from over-optimizing for a single, static discriminator and encourages diversity [77].
Problem: Vanishing Gradients
Observation: The generator's loss does not improve over time, as the discriminator becomes too powerful.
Solutions:
- Modify the Loss Function: Replace the standard minimax loss with a Wasserstein loss or the modified minimax loss from the original GAN paper to ensure the generator continues to receive useful gradients [77].
- Adjust Discriminator Training: Do not overtrain the discriminator. A common practice is to train the discriminator for a fixed number of steps (e.g., one) for every step the generator is trained [78].
Problem: GAN Training Failure to Converge
Observation: The model losses are unstable and do not converge, resulting in poor output quality.
Solutions:
- Apply Regularization:
- Use Appropriate Optimizers: Use optimizers like Adam, but with carefully tuned parameters. A common starting point is a learning rate of 0.0002 for both generator and discriminator, with betas of (0.5, 0.999) [84] [78].
Experimental Protocols & Data
The following table summarizes key quantitative findings from research on self-supervised learning in data-scarce scenarios.
| Application Domain | Key Metric | Performance Finding | Citation |
|---|---|---|---|
| Fatigue Damage Prognostics (RUL Estimation) | Prediction Performance | SSL pre-training on unlabeled data enhances subsequent supervised RUL prediction, especially with scarce labeled data. Performance improves with more unlabeled pre-training samples. | [79] |
| Electron Microscopy (e.g., Segmentation, Denoising) | Model Performance & Convergence | After SSL pre-training, simpler, smaller models can match or outperform larger models with random initialization. Leads to faster convergence and better performance on downstream tasks. | [80] |
| Biological Image Analysis (COVID-19 Drug Screening) | Classification Accuracy | A GAN-based SSL method (GAN-DL) was comparable to a supervised transfer learning baseline in classifying active/inactive compounds, without using task-specific labels during pre-training. | [81] |
| Near-Field Radiative Heat Transfer (Spectral Data) | Model Performance | Using a Conditional WGAN (CWGAN) to augment a small dataset significantly enhanced the performance of a simple feed-forward neural network. | [83] |
Detailed Methodology: GAN-based SSL for Biological Images
This protocol is adapted from the GAN-DL study for assessing biological images without annotations [81].
- Model Selection: Employ a StyleGAN2 architecture as the backbone. Models from the Wasserstein GAN family are recommended for their resistance to mode collapse [81].
- Pretext Task - Unsupervised Training: Train the GAN on your large, unlabeled dataset. The objective is for the generator to learn to produce realistic synthetic images, while the discriminator learns to distinguish real from fake. No image annotations are used in this phase [81].
- Feature Extraction: After training, discard the generator. The discriminator network is retained and used as a feature extractor for downstream tasks [81].
- Downstream Task Fine-tuning: Use the features from the pretrained discriminator to train a simpler model (e.g., a classifier) on your small, labeled dataset for a specific task like compound activity classification [81].
Detailed Methodology: Self-Supervised Learning for Prognostics
This protocol is based on applying SSL to a fatigue damage prognostics problem [79].
- Data Preparation:
- Unlabeled Dataset: A large set of sensor data (e.g., strain gauges) from systems that have not reached failure.
- Labeled Dataset: A smaller set of sensor data from systems that were run to failure, with their corresponding Remaining Useful Life (RUL) labels.
- Pretext Task - Self-Supervised Pre-training:
- A deep learning model (e.g., LSTM, Transformer) is trained on the unlabeled data.
- The goal of the pretext task is not to predict RUL, but to perform a self-supervised task such as predicting a missing part of the sensor signal or context prediction, which forces the model to learn meaningful representations of the system's degradation process [79].
- Downstream Task - Supervised Fine-tuning:
- The pretrained model is taken and its final layers may be replaced or adapted.
- This model is then fine-tuned on the small, labeled dataset to perform the actual prognostic task of RUL estimation [79].
The Researcher's Toolkit
Research Reagent Solutions
| Item | Function in Experiment |
|---|---|
| StyleGAN2 | A state-of-the-art GAN architecture used for high-quality image generation and as a backbone for self-supervised feature learning (GAN-DL) [81]. |
| Wasserstein GAN (WGAN) | A GAN variant that uses Wasserstein loss to combat mode collapse and vanishing gradients, leading to more stable training [83] [77]. |
| Conditional WGAN (CWGAN) | A WGAN that can generate data conditioned on a label, crucial for targeted data augmentation in scientific applications [83]. |
| Transformer / LSTM Models | Deep learning architectures used for sequential data (e.g., sensor readings). Can be pretrained on unlabeled sequences via SSL for prognostics [79]. |
| Pix2Pix | An image-to-image translation GAN model, which can be used for self-supervised pretraining for tasks like segmentation and denoising in electron microscopy [80]. |
Workflow Diagrams
General Self-Supervised Learning Workflow
GAN-Based Self-Supervised Learning (GAN-DL)
Troubleshooting GAN Training
QUASAR Technical Support Center: FAQs & Troubleshooting
Frequently Asked Questions (FAQs)
Q1: What is QUASAR and what are its primary applications in scientific research? QUASAR is an open-source project, a collection of data analysis toolboxes that extend the Orange machine learning and data visualization suite. It is designed to empower researchers from various fields to gain better insight into their data through interactive data visualization, powerful machine learning methods, and combining different datasets in easy-to-understand visual workflows. Its primary application, especially through the Orange Spectroscopy toolbox, is in the analysis of (hyper)spectral data, enabling spectral processing and multivariate analysis for techniques like pharmaceutical quality control and environmental monitoring [85] [86] [15].
Q2: How does QUASAR support multimodal data analysis? QUASAR intends to add file readers, processing tools, and visualizations for multiple measurement techniques. This allows researchers to combine different types of experimental data, or modalities, within a single visual workflow. This multimodal approach allows for the discovery of new scientific insights by analyzing datasets from different techniques together, where the whole is more than the sum of its parts [85].
Q3: What are some common spectral preprocessing techniques available in QUASAR? QUASAR includes a range of spectral processing routines to prepare raw data for analysis. These techniques are critical for improving measurement accuracy and the performance of subsequent machine learning analysis. Key methods include [86] [15]:
- Baseline subtraction
- Normalization
- Fast Fourier Transform (FFT)
- Extended Multiplicative Signal Correction (EMSC)
- Peak analysis
- Differentiation and smoothing
Q4: Can I integrate custom Python code into a QUASAR workflow? Yes. Built on the power of the scientific Python community, advanced users can easily add custom code or figures into a workflow. This saves time by avoiding the need to re-implement standard data loading, processing, and plotting routines [86].
Troubleshooting Guides
Issue 1: Operation Timed Out During Connection
- Symptom: Connection attempts fail with an error:
at qdb_connect: The operation timed out[87]. - Diagnosis and Resolution:
This error indicates a network-level connectivity problem. Follow these steps to diagnose and resolve it:
- Check Network Configuration: Verify basic connectivity by pinging the QuasarDB server from the client machine. Ensure that firewalls or network security groups are not blocking the required ports [87].
- Investigate Session Exhaustion: Sporadic timeouts can be caused by the server running out of available sessions. Check the server metrics for
network.sessions.available_countandnetwork.sessions.unavailable_count. If sessions are exhausted, increase thetotal_sessionsparameter in the QuasarDB configuration file and review application code to ensure sessions are closed promptly after use [87]. - Verify Cluster Topology: In peer-to-peer clusters, ensure that the IP address the client uses to connect is the same one that the server nodes advertise internally. Misconfiguration of Network Address Translation (NAT) or firewall rules can lead to this issue [87].
Issue 2: Client and Server Version Mismatch
- Symptom: Connection fails with the error:
at qdb_connect: The remote host and Client API versions mismatch[87]. - Diagnosis and Resolution:
This error occurs when the version of the client library is incompatible with the version of the QuasarDB daemon.
- Check Versions: Determine the versions of both the client and server. For the client, run
qdbsh --version. On the server, runqdbd --version[87]. - Apply Versioning Rules: QuasarDB supports backward compatibility, meaning older clients can connect to newer servers. The reverse is not always true. Ensure your client version is older than or equal to the server version. If not, downgrade the client or upgrade the server to achieve compatibility [87].
- Check Versions: Determine the versions of both the client and server. For the client, run
Issue 3: Slow Query Performance
- Symptom: Queries execute noticeably slower than expected [87].
- Diagnosis and Resolution:
Slow performance can originate from the client, the server, or the network.
- Isolate the Bottleneck:
- Client-Side: Check if the client's CPU is highly utilized during the query. This often happens when transforming large native data buffers into the client's language runtime (e.g., Python). Test the same query in
qdbsh; if it's faster, the issue is likely client-side data conversion. UsingLIMITclauses can help identify if the slowness is in processing the full result set [87]. - Server-Side: If the bottleneck is on the server, use performance tracing (e.g.,
enable_perf_traceinqdbsh) to confirm. Server-side issues are typically I/O-bound (waiting for data from storage) or CPU-bound (complex calculations) [87].
- Client-Side: Check if the client's CPU is highly utilized during the query. This often happens when transforming large native data buffers into the client's language runtime (e.g., Python). Test the same query in
- Apply Fixes:
- For I/O Issues: If using S3 backend, increase the size of the local SSD disk cache or add more memory. For direct storage, increasing system memory improves caching [87].
- For CPU Issues: If server CPUs are saturated, consider scaling up the CPU capacity. If there is available CPU headroom, adjusting the client-side
connection_per_address_soft_limitmay allow for more parallel processing [87].
- Isolate the Bottleneck:
Experimental Protocols & Workflows
Detailed Methodology: Spectral Data Analysis Workflow
The following protocol outlines a standard workflow for analyzing complex spectral data, such as from mid-infrared spectromicroscopy, within the QUASAR environment [86] [15].
1. Data Loading and Unification
- Action: Use the appropriate file reader widget to load your spectral dataset (e.g., hyperspectral maps). For multimodal studies, load datasets from different measurement techniques into the same workflow [85] [86].
- Purpose: To import raw spectral data and, if applicable, unite it with other experimental data (e.g., concentration, growth conditions) for a comprehensive analysis [85].
2. Spectral Preprocessing
- Action: Pass the raw data through a series of preprocessing widgets in sequence. Standard methods include:
- Cosmic Ray Removal: Eliminate sharp, spurious spikes from the spectra [15].
- Baseline Correction/Subtraction: Remove unwanted background signals (e.g., fluorescence, scattering effects) to isolate the analyte's spectral features [86] [15].
- Scattering Correction: Apply techniques like EMSC to correct for light scattering variations [15].
- Normalization: Scale spectra to a common standard (e.g., unit vector, peak height) to correct for path length or concentration differences [86] [15].
- Smoothing: Apply filters (e.g., Savitzky-Golay) to reduce high-frequency noise [86] [15].
- Purpose: To enhance the signal-to-noise ratio and remove non-informative variances, thereby improving the accuracy and reliability of all downstream analyses [15].
3. Feature Engineering and Multivariate Analysis
- Action: Connect the preprocessed data to various analysis widgets.
- Peak Analysis: Identify and quantify characteristic peaks [86].
- Spectral Derivatives: Calculate first or second derivatives to resolve overlapping peaks and emphasize subtle spectral features [15].
- Principal Component Analysis (PCA): Use an unsupervised learning method to reduce dimensionality, identify patterns, and detect outliers [86].
- Hierarchical Cluster Analysis (HCA): Group similar spectra or samples together based on their spectral characteristics [86].
- Purpose: To extract meaningful features from the spectral data and explore underlying structures and relationships within the dataset [86].
4. Regression, Classification, and Model Building
- Action: For predictive tasks, use machine learning widgets.
- Regression Models: Build models (e.g., PLS-R) to predict continuous variables like concentration or physical properties from spectral data.
- Classification Models: Train classifiers (e.g., Support Vector Machines) to categorize spectra into predefined classes.
- Purpose: To develop predictive models that can automate the analysis of new, unknown samples, enabling high-throughput screening and quality control [86] [88].
5. Visualization and Interpretation
- Action: Utilize visualization widgets throughout the workflow to inspect data at every stage. This can include viewing raw spectra, preprocessed spectra, PCA score plots, cluster dendrograms, and model performance plots [85] [86].
- Purpose: To gain intuitive insight into the data, validate processing steps, and interpret the results of multivariate and machine learning models [85].
Workflow Visualization
The diagram below illustrates the logical flow of the spectral data analysis protocol within QUASAR.
The Scientist's Toolkit: Research Reagent Solutions
The following table details key computational and methodological "reagents" essential for success in spectral data analysis using platforms like QUASAR.
Table 1: Essential Tools for Spectral Data Analysis
| Item Name | Type/Function | Brief Explanation of Role |
|---|---|---|
| Baseline Correction | Spectral Preprocessing Algorithm | Removes low-frequency background signals (e.g., fluorescence) that obscure the true spectral features of the analyte, critical for accurate peak analysis and quantification [86] [15]. |
| EMSC | Advanced Preprocessing Technique | Corrects for both additive and multiplicative effects (e.g., scattering, path length variations) in spectroscopic data, significantly improving model performance and analytical accuracy [15]. |
| Principal Component Analysis (PCA) | Multivariate Analysis Method | An unsupervised learning technique for dimensionality reduction. It identifies the main sources of variance in a dataset, allowing researchers to visualize patterns, cluster samples, and detect outliers [86]. |
| Machine Learning Classifiers | Predictive Modeling Tool | Algorithms (e.g., SVM) that learn from labeled spectral data to classify new, unknown samples into predefined categories. Essential for automated, high-throughput diagnostic and quality control applications [86] [88]. |
| Normalization | Data Standardization Technique | Scales individual spectra to a common standard, mitigating variances due to sample concentration or thickness and allowing for valid comparative analysis between samples [86] [15]. |
| Spectral Derivatives | Feature Enhancement Method | Calculates the first or second derivative of a spectrum, which helps resolve overlapping peaks, remove baseline offsets, and amplify small, structurally significant spectral features [15]. |
Data Presentation: Spectral Preprocessing Techniques
The table below summarizes common spectral preprocessing techniques, their primary functions, and key performance trade-offs, aiding researchers in selecting the appropriate methods for their data.
Table 2: Comparison of Key Spectral Preprocessing Methods
| Preprocessing Technique | Primary Function | Key Performance Trade-offs & Optimal Scenarios |
|---|---|---|
| Cosmic Ray Removal | Identifies and removes sharp, random spikes caused by high-energy particles [15]. | Trade-off: Overly sensitive algorithms may distort valid sharp peaks. Scenario: Essential for all Raman and fluorescence spectra with long acquisition times [15]. |
| Baseline Correction | Models and subtracts low-frequency background signals from the spectrum [86] [15]. | Trade-off: Incorrect baseline anchor points can introduce artifacts. Scenario: Critical for quantitative analysis in IR and Raman spectroscopy where fluorescence background is present [15]. |
| Normalization | Scales spectra to a common standard (e.g., total area, unit vector) to enable comparison [86] [15]. | Trade-off: Can suppress concentration-related information if not chosen carefully. Scenario: Standard Normal Variate (SNV) is effective for scatter correction; area normalization is good for relative compositional analysis [15]. |
| Smoothing | Reduces high-frequency noise to improve the signal-to-noise ratio [86] [15]. | Trade-off: Excessive smoothing can lead to loss of spectral resolution and blurring of fine features. Scenario: Savitzky-Golay filter is preferred as it preserves higher-order moments of the spectrum better than moving average filters [15]. |
| Spectral Derivatives | Emphasizes subtle spectral features and resolves overlapping peaks [15]. | Trade-off: Inherently amplifies high-frequency noise. Scenario: Should always be applied after a smoothing step. Ideal for highlighting small shifts and shoulders on larger peaks [15]. |
Benchmarking Performance: Model Validation and Comparative Analysis
Troubleshooting Guides
Guide: Addressing Overfitting During Model Validation
Problem: Your model performs excellently on your training data but shows a significant drop in performance on validation folds or new data, indicating overfitting.
Solution:
- Increase k in k-Fold CV: Use a higher value for
k(e.g., 10 instead of 5) to provide more robust performance estimates. A lowerkcan lead to more pessimistic bias [89] [90]. - Repeat the Cross-Validation: Perform multiple rounds of k-fold cross-validation with new random splits and average the results. This reduces variance and provides a more stable performance estimate [90].
- Ensure a Separate Test Set: Always hold out a final, separate test set for a final evaluation after you have completed all model tuning and selection using cross-validation. This prevents overfitting to your validation data [90] [91].
Guide: Handling Information Leakage in Preprocessing
Problem: Preprocessing steps (like normalization or feature selection) are applied to the entire dataset before splitting, causing the model to have prior knowledge of the test set's distribution.
Solution:
- Integrate Preprocessing into the CV Pipeline: Use
scikit-learn'sPipelineandColumnTransformerto ensure all data transformations are fitted only on the training folds within each cross-validation split. This prevents information from the test fold from leaking into the training process [90] [91]. - Double-Check Feature Selection: Any step that uses the target variable to rank or select features (e.g., correlation analysis) must be performed after the data is split and within the cross-validation loop [90].
Guide: Validating Models on Imbalanced or Structured Data
Problem: Standard k-fold cross-validation leads to misleading performance metrics because your dataset has imbalanced classes, inherent groups, or is a time series.
Solution:
- For Imbalanced Classification: Use Stratified k-Fold Cross-Validation. This technique ensures that each fold has the same (or similar) percentage of samples of each target class as the complete dataset [89] [90] [92].
- For Data with Groups: Use StratifiedGroup K-Fold Cross-Validation. This is vital when your data has natural groupings (e.g., multiple samples from the same patient, or measurements from the same batch). It ensures that all samples from a group are in either the training or test set, and it also tries to preserve the class distribution [90].
- For Time Series Data: Use Time Series Splits (e.g.,
TimeSeriesSplitin scikit-learn). Standard random splits can tear apart temporal dependencies. Time series splits respect the data's time order, using past data to train and future data to test [90] [92].
Frequently Asked Questions (FAQs)
Q1: Why shouldn't I just use a simple train/test split instead of cross-validation? A: A single train/test split is simple and fast but can be unreliable. Its results depend heavily on which data points end up in the training and test sets. If the split is not representative of the overall data distribution, your performance estimate will be biased. Cross-validation, by testing the model on multiple different data splits, provides a more stable and trustworthy estimate of how your model will generalize to new, unseen data [89] [91].
Q2: How do I choose the right value of 'k' for k-fold cross-validation?
A: The choice of k involves a bias-variance trade-off. Common values are 5 or 10. A higher k (e.g., 10) leads to a less biased estimate of performance but is more computationally expensive and can have higher variance. A lower k is faster but may be more pessimistic. As a starting point, you can choose k such that it is a divisor of your sample size and test different configurations to analyze the effect on performance, bias, and variance [89] [90]. For very small datasets, Leave-One-Out Cross-Validation (LOOCV) may be appropriate [89].
Q3: Should I use the training error or the validation error from cross-validation to select my final model? A: You should always use the validation error (the error on the test folds) for final model selection. The training error is used internally during model training and can be misleadingly low, especially for overfit models. The validation error is a better indicator of a model's performance on unseen data [93].
Q4: How can I generate confidence intervals for my model's predictions after cross-validation? A: One practical method is to calculate prediction intervals using the residuals (differences between actual and predicted values) obtained from cross-validation. By analyzing the spread of these residuals, you can estimate a range where a true value is likely to fall for a new prediction. For example, you can generate a 95% prediction interval to communicate the uncertainty in your predictions [91].
Performance Metrics and Methodologies
Quantitative Comparison of Cross-Validation Techniques
The table below summarizes key characteristics of different cross-validation methods to help you select the most appropriate one for your experimental setup.
| Technique | Best Use Case | Key Advantage | Key Disadvantage |
|---|---|---|---|
| Hold-Out [89] [92] | Very large datasets, quick evaluation. | Simple and fast; only one training cycle. | High variance; performance depends on a single, potentially non-representative split. |
| K-Fold [89] [92] | Small to medium-sized datasets where accurate estimation is important. | Lower bias than hold-out; more reliable performance estimate. | Computationally more expensive than hold-out; model must be trained k times. |
| Stratified K-Fold [89] [90] | Classification tasks with imbalanced classes. | Preserves the percentage of samples for each class in every fold. | Does not account for other data structures like groups. |
| Leave-One-Out (LOOCV) [89] [92] | Very small datasets where maximizing training data is critical. | Uses almost all data for training; low bias. | Computationally very expensive for large datasets; high variance on individual test points. |
| Time Series Split [90] [92] | Time-ordered data (e.g., forecasting, longitudinal studies). | Respects temporal ordering of data, preventing data leakage from the future. | Not suitable for non-time-dependent data. |
Experimental Protocol: Implementing k-Fold Cross-Validation
This protocol provides a detailed methodology for implementing k-fold cross-validation in Python using scikit-learn, which is a cornerstone of a robust validation framework [89] [91].
1. Import Necessary Libraries
2. Load and Prepare Dataset
3. Define Model and Preprocessing Pipeline
4. Configure Cross-Validation
5. Execute Cross-Validation and Compute Metrics
Workflow Visualizations
K-Fold Cross-Validation Logic
Correct Data Splitting to Prevent Leakage
The Scientist's Toolkit: Research Reagent Solutions
The following table details key software tools and libraries essential for building robust validation frameworks in Python, particularly in the context of spectral data analysis and pharmaceutical research.
| Tool / Library | Function | Application in Spectral Data Research |
|---|---|---|
| Scikit-learn [89] [91] | Provides implementations for machine learning models, cross-validation splitters, and metrics. | The primary library for creating ML pipelines, performing k-fold CV, and calculating performance metrics for models trained on spectral data. |
| Pipeline & ColumnTransformer [90] [91] | Combines preprocessing steps and model training into a single, leak-proof object. | Crucial for integrating spectral preprocessing (e.g., scaling, baseline correction) with model training within the cross-validation loop. |
| Adaptive iteratively reweighted Penalized Least Squares (airPLS) [94] | Algorithm for effective baseline correction and noise reduction in spectral data. | Used to smooth out background noise and clarify Raman signatures in complex pharmaceutical formulations, improving downstream model accuracy [94]. |
| Interpolation Peak-Valley Method [94] | A technique for resolving strong fluorescence interference in Raman spectra. | Combined with airPLS in a dual-algorithm approach to eliminate baseline drift and preserve characteristic peaks for accurate compound identification [94]. |
In the fields of analytical chemistry, biopharmaceuticals, and omics research, scientists increasingly rely on advanced techniques to interpret complex, high-dimensional data. Spectral data from methods like Raman spectroscopy, Near-Infrared (NIR) spectroscopy, and Nuclear Magnetic Resonance (NMR) present unique challenges due to their highly correlated nature [95] [23]. This technical support center guide provides a comparative analysis of three powerful statistical approaches—Principal Component Analysis (PCA), Partial Least Squares (PLS), and Functional Data Analysis (FDA)—to help researchers select and implement the optimal method for their specific analytical challenges.
Key Concepts and Definitions
What is Principal Component Analysis (PCA)?
PCA is an unsupervised dimensionality reduction technique that identifies new axes (principal components) capturing the greatest variance within a dataset without using sample group information [96]. It works by diagonalizing the variance-covariance matrix to yield eigenvectors (principal modes) that contribute to overall fluctuation, sorted by their eigenvalues (contribution size) [97].
What is Partial Least Squares (PLS)?
PLS is a supervised method that incorporates known class labels to maximize separation between predefined groups [96]. It identifies latent variables that capture the covariance between predictors (e.g., metabolite concentrations) and the response variable (group labels) [97] [96]. PLS-DA (Discriminant Analysis) is a common variant used for classification tasks.
What is Functional Data Analysis (FDA)?
FDA is a statistical approach for analyzing data that vary continuously over a continuum (e.g., time, wavelength, frequency) [98]. Instead of treating observations as discrete points, FDA models entire curves or functions, treating each spectrum as a single entity rather than a sequence of individual measurements [99] [100]. Functional Principal Component Analysis (FPCA) is the functional counterpart to PCA [99].
Comparative Analysis Tables
Table 1: Fundamental Method Characteristics
| Feature | PCA | PLS/PLS-DA | FDA/FPCA |
|---|---|---|---|
| Supervision | Unsupervised [96] | Supervised [96] | Can be both |
| Use of Group Information | No [96] | Yes [96] | Optional |
| Primary Objective | Capture overall variance [96] | Maximize class separation [96] | Model curve shape and patterns [98] |
| Data Structure | Discrete points [99] | Discrete points | Functions/curves [99] [100] |
| Best Suited For | Exploratory analysis, outlier detection [96] | Classification, biomarker discovery [96] | Dynamic data where shape matters [98] |
Table 2: Performance and Application Considerations
| Consideration | PCA | PLS/PLS-DA | FDA/FPCA |
|---|---|---|---|
| Risk of Overfitting | Low [96] | Moderate to High [96] | Moderate (controlled via basis functions) |
| Noise Handling | Moderate | Moderate | Excellent (via smoothing) [98] |
| Sparse/Irregular Data | Poor | Poor | Excellent [98] |
| Interpretability | Moderate | High (via VIP scores) [96] | High (functional components) |
| Dimensionality Reduction | Yes | Yes | Yes (simplifies high-dimensional data) [98] |
Table 3: Spectral Data Applications
| Application | PCA | PLS/PLS-DA | FDA/FPCA |
|---|---|---|---|
| Raman Spectroscopy | Good for initial exploration | Better for classification when SNR is high [99] | Superior for low SNR and small peak shifts [99] |
| NMR Spectroscopy | Identifying structural trends | Classifying samples based on spectral features | Detailed HOS (Higher-Order Structure) assessment [101] |
| NIR Spectroscopy | Detecting outliers in powder mixtures [23] | Predicting constituent proportions [23] | Multivariate calibration modeling [23] |
| Therapeutic Antibody Analysis | Initial data overview | Group discrimination | Detecting conformational changes under stress [101] |
Method Selection Workflow
Troubleshooting Guides & FAQs
FAQ 1: When should I choose PLS-DA over PCA?
Question: My PCA plot isn't showing good separation between my predefined sample groups. What should I do?
Answer: Choose PLS-DA when your study involves predefined groups and you need to maximize separation for classification or biomarker identification [96]. PCA is unsupervised and ignores group labels, so even with clear predefined classes, it may not separate them effectively. PLS-DA leverages class information to find latent variables that specifically capture between-group covariance.
Troubleshooting Steps:
- Start with PCA to assess overall data structure and identify potential outliers [96]
- If group separation appears promising but not optimal, proceed to PLS-DA
- Validate your PLS-DA model using cross-validation and permutation tests to prevent overfitting [96]
- Use VIP (Variable Importance in Projection) scores to identify features most responsible for group separation [96]
FAQ 2: Can FDA handle my noisy spectral data?
Question: My spectral data has significant noise. Will FDA still be effective?
Answer: Yes. FDA includes smoothing techniques that can reduce noise while preserving important patterns [98]. The functional approximation process using basis functions (like B-splines) inherently separates signal from noise [99] [100]. For Raman spectral data with low signal-to-noise ratios, FPCA has demonstrated superior performance compared to traditional PCA, especially for detecting small peak shifts [99].
Experimental Protocol for Noisy Spectral Data:
- Convert discrete measurements to functional data using B-spline basis expansion
- Select optimal number of basis functions to balance smoothing and feature preservation
- Apply FPCA to identify major modes of variation in the functional data
- Use the resulting functional principal components for subsequent analysis or modeling
FAQ 3: How do I prevent overfitting in PLS-DA?
Question: My PLS-DA model shows perfect separation in my training data but performs poorly on new samples. What's wrong?
Answer: This indicates overfitting, a common issue with PLS-DA in high-dimensional data [96]. To ensure model robustness:
Validation Protocol:
- Use cross-validation to evaluate model performance (metrics: R²Y and Q²)
- Perform permutation tests (typically 200+ permutations) to assess statistical significance [96]
- Monitor the gap between R²Y and Q² - large differences indicate potential overfitting
- Consider a valid model when Q² > 0.5, with Q² > 0.9 indicating outstanding predictive ability [96]
FAQ 4: When is FDA particularly advantageous?
Question: In what specific scenarios does FDA provide the most benefit over traditional methods?
Answer: FDA is particularly advantageous when:
- The overall shape of your data matters more than individual points [98]
- You have sparse or unevenly spaced measurements [98]
- You need to analyze derivatives or rates of change in your spectra
- Measurements aren't taken at the same points (e.g., different wavelength sampling) [100]
- You're working with naturally functional data like growth curves, spectroscopic profiles, or sensor data over time [98]
FAQ 5: What are the key differences in interpretation between PCA and FPCA?
Question: I'm familiar with interpreting PCA loadings and scores. How does this differ for FPCA?
Answer: While both methods identify major variation patterns, key interpretation differences exist:
PCA Interpretation:
- Components are vectors in the original variable space
- Loadings indicate variable contributions to each component
- Scores represent sample positions along components
FPCA Interpretation:
- Functional principal components are curves/functions [100]
- Eigenfunctions show how the functional form varies from the mean curve [100]
- fPC scores indicate how much each sample's curve matches each eigenfunction pattern
- Positive fPC scores indicate shape similarity to eigenfunction; negative scores indicate reverse pattern [23]
Essential Research Reagent Solutions
Table 4: Key Materials for Spectral Data Analysis
| Reagent/Resource | Function/Purpose | Application Context |
|---|---|---|
| B-spline Basis Functions | Approximate underlying functions from discrete spectral measurements [99] [100] | FDA pre-processing for spectral data |
| Fourier Basis | Alternative basis for periodic functional data | FDA for seasonal or cyclical patterns |
| VIP Scores | Identify features most important for group separation in PLS-DA [96] | Biomarker discovery in omics studies |
| PROFILE NMR Method | Enhance spectral resolution for intact mAbs in formulation buffers [101] | HOS assessment of therapeutic proteins |
| 2D 1H-13C HMQC NMR | Provide higher resolution spectral maps for protein characterization [101] | Detailed HOS comparability assessments |
| Cross-Validation Subsets | Assess model predictive power and prevent overfitting [97] [96] | Essential for PLS-DA model validation |
| Permutation Testing | Evaluate statistical significance of supervised models [96] | PLS-DA model robustness assessment |
Selecting the appropriate analytical method for spectral data depends largely on your research objectives. PCA remains invaluable for initial exploratory analysis and outlier detection. PLS-DA excels in classification tasks and biomarker discovery when group labels are known. FDA provides the most natural framework for analyzing spectral data by treating it as continuous functions, often revealing patterns that discrete methods miss. By understanding the strengths and limitations of each approach, researchers can make informed decisions that lead to more accurate interpretations and robust predictive models in their spectral data analysis workflows.
Troubleshooting Guide: Frequently Asked Questions
Q1: For my classification task, when should I choose a traditional ML model over a deep learning model?
The choice hinges on your data characteristics and resource constraints. The decision can be broken down by key project factors [102] [103]:
- Data Volume: Traditional ML algorithms perform well with small to medium-sized datasets (e.g., from 1,000 to 100,000 samples). Deep learning requires large volumes of data, often needing hundreds of thousands or millions of samples to perform well and avoid overfitting [102] [103].
- Data Structure: If your data is structured and tabular (like rows and columns in a spreadsheet or extracted features), traditional ML is often the superior and more efficient choice. Deep learning excels with unstructured data like images, audio, video, and raw text [102].
- Resources and Timelines: Traditional ML trains faster and can run on standard computers (CPUs). If you have limited computational power, time, or budget, it is the more practical option. Deep learning requires specialized hardware like GPUs or TPUs and can take days or weeks to train, incurring higher costs [102] [103].
- Need for Interpretability: In high-stakes fields like healthcare or finance, understanding why a model made a decision is crucial. Traditional ML models like decision trees or logistic regression are generally more interpretable. Deep learning models are often considered "black boxes," making it difficult to explain their predictions [102] [104].
Table: Decision Matrix for Model Selection
| Factor | Traditional Machine Learning | Deep Learning |
|---|---|---|
| Data Volume | Small to medium datasets [102] | Large to very large datasets [102] |
| Data Type | Structured, tabular data [102] | Unstructured data (images, text, audio) [102] |
| Hardware Needs | Standard CPUs [102] | Specialized GPUs/TPUs [102] |
| Training Time | Hours to days [103] | Days to weeks [103] |
| Interpretability | High; models are more transparent [102] [104] | Low; "black box" models [102] [104] |
| Feature Engineering | Manual feature extraction required [102] | Automatic feature extraction from raw data [102] |
Q2: I am working with highly imbalanced datasets, a common issue in my research. What strategies can I use to improve classification accuracy?
Class imbalance, where one class has far fewer samples than others (e.g., in fraud detection or medical diagnosis), is a major challenge. Here are proven methodologies to mitigate its effects:
Data-Level Techniques: Resampling The Synthetic Minority Over-sampling Technique (SMOTE) is a widely used algorithm to balance datasets. It generates synthetic examples from the minority class instead of simply duplicating existing instances, which helps the model learn better decision boundaries [105]. One study on credit card fraud detection successfully applied SMOTE to address the fact that fraudulent transactions represented only 0.17% of the data, significantly improving model performance [105].
Algorithm-Level Techniques: Cost-Sensitive Learning For deep learning models, a powerful approach is to use custom loss functions. Focal Loss is designed to address class imbalance by down-weighting the loss from easy-to-classify examples and focusing training on hard-to-classify examples, which often belong to the minority class. This technique has been shown to enhance the detection of fraudulent transactions in deep learning models [105].
Evaluation Metrics When dealing with imbalanced data, accuracy can be a misleading metric. A model that simply predicts the majority class all the time will have high accuracy but is useless. Instead, rely on a suite of metrics [105]:
- Precision: Of all the transactions predicted as fraud, how many are actually fraud?
- Recall: Of all the actual fraudulent transactions, how many did we manage to catch?
- F1-Score: The harmonic mean of precision and recall, providing a single balanced metric.
- ROC-AUC: Measures the model's ability to distinguish between classes.
Table: Experimental Results with Imbalanced Credit Card Data [105]
| Model | Accuracy | Precision | Recall | F1-Score | ROC-AUC |
|---|---|---|---|---|---|
| Random Forest | 99.95% | 0.8421 | 0.8095 | 0.8256 | 0.9759 |
| Logistic Regression | 99.91% | 0.7619 | 0.7273 | 0.7442 | 0.9714 |
| Decision Tree | 99.87% | 0.6667 | 0.6667 | 0.6667 | 0.9619 |
| Deep Learning (Focal Loss) | Information missing | 0.8571 | 0.7500 | 0.8000 | Information missing |
Q3: My spectral data is high-dimensional and suffers from the "curse of dimensionality." What preprocessing and modeling techniques are most effective?
Hyperspectral and other spectral data are inherently high-dimensional, leading to challenges like increased computational load and the "Hughes phenomenon," where model performance decreases as dimensionality grows without a sufficient increase in samples [106]. The following workflow is effective for managing these challenges.
Diagram Title: Spectral Data Analysis Workflow
1. Data Preprocessing: Before modeling, raw spectral data must be cleaned. Key steps include [107]:
- Cosmic Ray Removal: Eliminates sharp, random spikes caused by high-energy particles.
- Baseline Correction: Removes slow, varying background signals to isolate the spectral features of interest.
- Normalization: Scales spectra to a common range to account for intensity variations.
2. Dimensionality Reduction (DR): This is critical for making the problem tractable. DR techniques fall into two categories:
- Band Selection: This method selects a subset of the original spectral bands, preserving the physical interpretability of the data. A highly effective and simple technique is Standard Deviation (STD)-based selection, which identifies and keeps bands with the highest variance, as these often contain the most discriminative information. One study achieved 97.21% classification accuracy on organ tissues using only 2.7% of the original bands selected by STD, compared to 99.30% using the full spectrum [108].
- Feature Extraction: This method creates new, lower-dimensional features from the original bands. Principal Component Analysis (PCA) is a classic linear technique. For more complex non-linear relationships, Deep Autoencoders can learn compact, highly informative representations of the spectral data [108].
3. Model Selection:
- Traditional ML: After DR, algorithms like Support Vector Machines (SVM) and Random Forests are very effective and computationally efficient for classification [106] [108].
- Deep Learning: Convolutional Neural Networks (CNNs) can be applied directly to the reduced data or even to the raw spectral signature treated as a 1D vector. CNNs excel at automatically learning complex spatial-spectral features [109].
Q4: How critical is data preprocessing for the final performance of my model?
Extremely critical. Preprocessing is not an optional step but a foundational one for building robust and accurate models, especially with complex data like spectra. The principle of "garbage in, garbage out" holds true.
- Impact on Performance: Preprocessing techniques are designed to remove instrumental artifacts, environmental noise, and other perturbations that can "significantly degrade measurement accuracy" and "impair machine learning-based spectral analysis by introducing artifacts and biasing feature extraction" [107]. A clean, well-preprocessed dataset allows the model to learn the true underlying patterns rather than fitting to noise.
- Handling Skewness: In a study on IoT botnet detection, applying a Quantile Uniform transformation was a crucial preprocessing step to reduce feature skewness. This approach achieved a near-zero skewness of 0.0003, far superior to a log transformation (1.8642), which directly contributed to the model's 100% accuracy on the BOT-IOT dataset by preserving critical attack signatures in the data [110].
The Scientist's Toolkit: Research Reagent Solutions
Table: Essential Materials and Techniques for ML-based Spectral Analysis
| Item / Technique | Function / Explanation | Application Context |
|---|---|---|
| SMOTE | Algorithm to generate synthetic samples for the minority class to mitigate class imbalance. | Essential for fraud detection, medical diagnosis, and any domain with rare events. [105] |
| Focal Loss | A loss function for deep learning that focuses learning on hard-to-classify examples by down-weighting easy examples. | Used in deep learning models to improve performance on imbalanced datasets without changing the data. [105] |
| Standard Deviation (STD) Band Selection | A simple, statistical method for dimensionality reduction that selects the most informative spectral bands based on variance. | Rapidly reduces HSI data size by >97% while maintaining high classification accuracy. [108] |
| Quantile Uniform Transformation | A preprocessing technique to reduce skewness in feature distributions while preserving critical information and data integrity. | Used to normalize features in network security data, improving model robustness. [110] |
| Convolutional Neural Network (CNN) | A deep learning architecture designed to process data with a grid-like topology (e.g., images, 1D spectra) by learning hierarchical features. | State-of-the-art for image-based classification and 1D spectroscopic data analysis. [102] [109] |
| Synthetic Datasets | Computer-generated data that mimics experimental measurements, used for validation and benchmarking of models. | Allows for robust testing of model performance against controlled challenges like overlapping peaks. [109] |
Technical Support Center
Troubleshooting Guides
Q1: My AI model for spectral classification has high accuracy, but the predictions seem inconsistent on similar samples. How can I diagnose the issue?
A: This often indicates that the model is confused in specific regions of the data space. A recommended diagnostic methodology is to use topological data analysis (TDA) to map the relationships your model has inferred [111].
Experimental Protocol:
- Data Preparation: Use your entire spectral dataset (e.g., the 1.3 million images from ImageNet or your repository of spectra) that was used to train the model [111].
- Model Inference: Run the pre-trained neural network on the entire dataset to obtain the probability outputs for each classification [111].
- Identify Ambiguity: Use a specialized tool to split and overlap classifications, identifying samples or spectral signatures that have a high probability of belonging to more than one category [111].
- Generate Topological Map: Apply techniques from topological data analysis to create a map where each dot represents a group of spectra the model finds similar. Dots are color-coded by classification. Overlapping dots of different colors reveal regions of model confusion [111].
- Analysis: Zoom into these overlapping regions to investigate the specific spectra. For example, a model might misclassify a spectrum because it is overly focusing on a minor, non-indicative peak shared between classes [111].
Expected Outcome: This process helps you move from just observing incorrect predictions to understanding the underlying relationships in the data that cause the model to fail, thereby forecasting how it will behave with new inputs [111].
Q2: The convolutional neural network (CNN) I use for classifying FT-IR spectra is behaving like a "black box." How can I identify which spectral regions are most important for its decisions?
A: CNNs are capable of identifying important features without rigorous pre-processing. You can utilize a shallow CNN architecture to determine the decisive spectral regions [112].
Experimental Protocol:
- Model Design: Implement a CNN with a single convolutional layer (a "shallow" network) [112].
- Comparative Training: Train this CNN on both pre-processed and non-preprocessed spectral data [112].
- Performance Benchmarking: Compare the classification accuracy of the CNN against standard algorithms like Partial Least Squares (PLS) regression. Research has shown CNNs achieving 86% accuracy versus 62% for PLS on non-preprocessed data, and 96% vs 89% on preprocessed data [112].
- Feature Interpretation: Analyze the convolutional layer's filters to identify which wavelengths or spectral features the model deems most significant for classification. This allows for qualitative interpretation of the results [112].
Expected Outcome: You will gain insight into the key spectral regions the model uses, reducing the dependency on heavy pre-processing and providing a rationale for the model's predictions.
Q3: How can I validate that my AI system's interpretation of Raman spectral data is chemically and clinically meaningful for diagnostic purposes?
A: Validation requires integrating AI with established chemometric techniques and rigorous statistical testing, as demonstrated in biomedical studies [112].
Experimental Protocol:
- Data Collection: Collect Raman spectra from well-characterized samples (e.g., breast cancer tissue microarrays classified into known subtypes) [112].
- AI-Driven Pre-processing: Implement an AI system that automates noise filtering (via a fuzzy controller), fluorescence background correction, and baseline optimization (using genetic algorithms) [112].
- Multivariate Analysis: Use the AI system to perform Principal Component Analysis (PCA) and Linear Discriminant Analysis (LDA) on the pre-processed spectral data. The chemical information in the spectra (e.g., lipid, collagen, nucleic acid content) should form the basis for this analysis [112].
- Model Validation: Assess the classification accuracy for known sample types. In one study, this approach yielded accuracies of 70% to 100% for different cancer subtypes [112].
- Statistical Significance: Use Receiver Operating Characteristic (ROC) curves to evaluate the model's performance. The Area Under the Curve (AUC) is a key metric; adding AI improved accuracy from 80.0% (AUC 0.864) to 93.1% in a skin inflammation model [112].
Expected Outcome: This protocol ensures that the AI's output is grounded in the biochemistry of the samples, providing a transparent and statistically validated link between spectral features and diagnostic outcomes.
Frequently Asked Questions (FAQs)
Q: What are the minimum contrast ratio requirements for data visualizations in publications to ensure accessibility for all readers? A: The Web Content Accessibility Guidelines (WCAG) specify minimum contrast ratios [113]:
- Text smaller than 18 point or 14 point bold: Requires a contrast ratio of at least 4.5:1 with the background [113].
- Text 18 point or 14 point bold or larger: Requires a contrast ratio of at least 3:1 with the background [113].
- Non-text elements (graphs, UI components, chart elements): Require a contrast ratio of at least 3:1 against adjacent colors [113].
Q: How can I programmatically determine the best text color (white or black) for a given background color in a visualization?
A: You can calculate the relative luminance of the background color. The simplified method is to check if (red*0.299 + green*0.587 + blue*0.114) > 186. If true, use black (#000000), otherwise use white (#ffffff) [114]. For strict W3C compliance, calculate luminance (L) and use black if L > 0.179, otherwise white [114].
Q: My model is accurate on training data but fails on new, real-world spectral data. What could be wrong? A: This is often due to a domain shift or the model learning spurious correlations in the training data. Use the topological mapping tool to check if your new data falls into regions the model found confusing during training [111]. Also, audit your training data for labeling errors, as the tool can help identify mislabeled samples that poisoned the learning process [111].
Q: Are there specific AI techniques better suited for analyzing vibrational spectroscopy data? A: Yes. Convolutional Neural Networks (CNNs) have shown excellent performance for classifying vibrational spectroscopy data (FT-IR, Raman), often outperforming standard algorithms like PLS, even with minimal pre-processing [112]. Their ability to identify important spectral regions is a significant advantage.
Data Presentation
Table 1: Performance Comparison of AI Models in Spectral Classification
| Model Type | Data Preprocessing | Reported Classification Accuracy | Key Advantage |
|---|---|---|---|
| Convolutional Neural Network (CNN) [112] | Non-preprocessed | 86% | Reduces need for rigorous pre-processing |
| Convolutional Neural Network (CNN) [112] | Preprocessed | 96% | Identifies important spectral regions |
| Partial Least Squares (PLS) [112] | Non-preprocessed | 62% | Standard baseline method |
| Partial Least Squares (PLS) [112] | Preprocessed | 89% | Standard baseline method |
| AI System (PCA/LDA) on Raman Spectra [112] | AI-driven pre-processing | 70% - 100% (varies by subtype) | Links spectral data to clinical diagnosis |
Table 2: Essential Color Palette for Accessible Scientific Visualizations
| Color Name | Hex Code | Recommended Use |
|---|---|---|
| Google Blue | #4285F4 |
Primary data series, links |
| Google Red | #EA4335 |
Highlighting, negative trends |
| Google Yellow | #FBBC05 |
Warnings, secondary data series |
| Google Green | #34A853 |
Positive trends, success states |
| White | #FFFFFF |
Background (with dark text) |
| Light Grey | #F1F3F4 |
Chart background, subtle elements |
| Dark Grey | #5F6368 |
Axes, secondary text |
| Almost Black | #202124 |
Primary text, main axes |
The Scientist's Toolkit
Table 3: Research Reagent Solutions for AI-Driven Spectral Analysis
| Item | Function in Experiment |
|---|---|
| Relational-Graph Convolutional Neural Network (R-GCN) [115] | A model architecture used to fix accessibility issues in GUIs; conceptually useful for understanding graph-based data relationships in complex systems. |
| Topological Data Analysis (TDA) Tool [111] | Software for creating maps of high-dimensional data relationships, helping to diagnose model confusion and identify prediction borders. |
| Shallow Convolutional Neural Network [112] | A CNN with a single convolutional layer, effective for spectral classification and identifying significant spectral regions with less pre-processing. |
| Fuzzy Logic Controller [112] | An AI component used within an automated system for intelligent noise filtering of spectral data. |
| Genetic Algorithm [112] | An optimization technique used for baseline correction and other parameter optimization tasks in spectral pre-processing. |
Mandatory Visualization
Troubleshooting Guide & FAQs
This technical support center provides targeted guidance for researchers working at the intersection of high-sensitivity detection and robust machine learning classification, particularly with complex spectral data.
FAQ 1: My model has >99% accuracy on training data, but performance drops on the test set. Is this overfitting, and how can I address it?
A high accuracy on the training set that does not generalize to the test set can be a sign of overfitting. A difference of 3% (e.g., 99% train vs. 96% test) may not indicate severe overfitting, especially if the problem is not very complex, but it should be investigated [116]. To diagnose and address this:
- Investigate Class Balance: Check if your dataset is imbalanced. A model can achieve high accuracy by always predicting the majority class, which is misleading. In such cases, accuracy is not a good performance metric [117] [118].
- Use Different Metrics: For imbalanced datasets, use metrics like Sensitivity (Recall), Precision, and F1-score [117] [118]. The table below summarizes these key metrics.
Table 1: Key Classification Metrics for Model Evaluation
| Metric | Formula | When to Use |
|---|---|---|
| Accuracy | (TP+TN)/(TP+TN+FP+FN) | Use as a rough indicator for balanced datasets. Avoid for imbalanced datasets [118]. |
| Recall (Sensitivity) | TP/(TP+FN) | Use when false negatives are more costly than false positives (e.g., disease prediction, fraud detection) [118]. |
| Precision | TP/(TP+FP) | Use when it's critical that your positive predictions are accurate [118]. |
| F1 Score | 2 * (Precision * Recall)/(Precision + Recall) | The harmonic mean of precision and recall; preferable to accuracy for imbalanced datasets [118]. |
- Apply Techniques to Handle Imbalance: If your data is imbalanced, apply techniques to the training set to balance the classes [117].
- Simplify the Model: Use regularization or reduce model complexity (e.g., shallower tree depth in a Random Forest) to make it less prone to learning noise [116].
FAQ 2: I am struggling to achieve reliable sub-ppm detection for gaseous analytes like limonene. What sensor materials and experimental configurations are recommended?
Achieving sub-ppm detection requires careful selection of sensing materials and operating parameters. Metal-oxide (MOX) chemoresistive sensors are a promising option due to their sensitivity, low cost, and durability [119].
Table 2: Research Reagent Solutions for Sub-ppm Gas Detection
| Material/Reagent | Function in Experiment |
|---|---|
| Tungsten Trioxide (WO₃) | The functional sensing material in the chemoresistive sensor. It exhibits high sensitivity to R-(+)-limonene at sub-ppm concentrations [119]. |
| Alumina Substrate | A ceramic base that provides mechanical support for the sensor. It is equipped with interdigitated gold electrodes and a platinum heater on the back [119]. |
| Gold (Au) Electrodes | Provide electrical contacts for measuring the conductance changes of the WO₃ sensing layer [119]. |
| Platinum (Pt) Heater | Thermally activates the WO₃ sensing layer to its optimal working temperature, which is crucial for sensitivity and selectivity [119]. |
| α-terpineol & Ethyl Cellulose | Organic solvents used to form a homogeneous paste with the WO₃ powder for precise deposition onto the substrate via screen-printing [119]. |
Experimental Protocol for WO₃-based Limonene Detection:
- Sensor Fabrication: Synthesize WO₃ powder and mix it with organic solvents (α-terpineol, ethyl cellulose) and a small amount of silica to form a paste. This paste is then screen-printed onto an alumina substrate pre-fitted with gold electrodes and a platinum heater [119].
- Sintering: The printed sensor is sintered in air at 650°C for 2 hours. This critical step increases grain interconnectivity for electronic conductance and improves the thermal stability of the sensing layer [119].
- Sensor Operation: The sensor is operated at a temperature of 200°C, which was identified as optimal for R-(+)-limonene detection. The electrical resistance of the sensor is monitored in real-time [119].
- Gas Exposure & Measurement: The sensor is exposed to air containing trace amounts of R-(+)-limonene (e.g., starting at 100 ppb). The change in electrical resistance upon exposure is recorded as the sensor's response. A response of 2.5 to 100 ppb of limonene has been demonstrated [119].
The following workflow diagram outlines the key steps for developing a system that integrates high-sensitivity detection with a high-accuracy classifier.
Workflow for Integrated Detection and Classification
FAQ 3: How do I choose the right metric to evaluate my classification model when working with spectral data for drug development?
The choice of metric should be driven by the clinical or experimental consequence of a wrong prediction.
- Optimize for Recall (Sensitivity) if your goal is to ensure that no positive case is missed. This is crucial in scenarios like identifying a rare but critical spectral signature associated with a dangerous contaminant or a specific biological activity. In this case, having some false alarms (false positives) is preferable to missing a real event (false negative) [118].
- Optimize for Precision if it is paramount that when your model predicts a positive, it is highly likely to be correct. This is important when the follow-up action on a positive prediction is expensive, time-consuming, or risky [118].
- Use the F1 Score when you need to balance the concerns of both Precision and Recall, which is often the case in practice [118].
Conclusion
The integration of advanced data analysis techniques, particularly AI and machine learning, is fundamentally reshaping the field of spectral analysis. The journey from foundational preprocessing to sophisticated deep learning models enables researchers to unlock deeper, more accurate insights from complex spectral data than ever before. The key takeaways highlight the superiority of multimodal deep learning for robust feature extraction, the critical importance of optimized preprocessing and workflow management, and the demonstrated efficacy of these methods in high-stakes applications from pharmaceutical quality control to clinical diagnostics. Future directions point toward more autonomous, intelligent, and accessible systems. This includes the expansion of self-supervised learning to overcome data scarcity, the development of more interpretable AI to build trust in clinical settings, and the push towards universal, interoperable spectral libraries. For biomedical and clinical research, these advancements promise to accelerate drug discovery, enhance diagnostic precision, and usher in a new era of data-driven scientific discovery.
References
- 1. Identifying and fixing errors in flow data [https://www.colibri-cytometry.com/post/identifying-and-fixing-errors-in-flow-data]
- 2. How to Fix Flow Cytometry Compensation Errors (and ... [https://voices.uchicago.edu/ucflow/2021/08/09/how-to-fix-compensation-errors-and-unmixing-errors-bad-data-part-4/]
- 3. Errors and Mistakes to Avoid when Analyzing Raman Spectra [https://www.spectroscopyonline.com/view/errors-and-mistakes-to-avoid-when-analyzing-raman-spectra]
- 4. Noise correlation and its impact on the performance of ... [https://pmc.ncbi.nlm.nih.gov/articles/PMC9860003/]
- 5. Advanced Chemometrics for Enhanced Data Analysis [https://mestrelab.com/main-product/advanced-chemometrics]
- 6. Recent Research in Chemometrics and AI for ... [https://www.spectroscopyonline.com/view/recent-research-in-chemometrics-and-ai-for-spectroscopy-part-i-foundations-definitions-and-the-integration-of-artificial-intelligence-in-chemometric-analysis]
- 7. Classification Analysis of Spectral Data Using Chemometrics [https://www.sepscience.com/classification-analysis-of-spectral-data-using-chemometrics-7405]
- 8. FT-IR Troubleshooting Guide: How to Solve Common ... [https://www.spectroscopyonline.com/view/ftir-troubleshooting-guide-how-to-solve-common-problems-in-infrared-spectroscopy]
- 9. Baseline and Scatter: Correcting the Spectral Chameleons [https://www.spectroscopyonline.com/view/baseline-and-scatter-correcting-the-spectral-chameleons]
- 10. Baseline correction of Raman spectral data using ... [https://pubs.rsc.org/en/content/articlelanding/2025/an/d5an00253b]
- 11. A review on spectral data preprocessing techniques for ... [https://pmc.ncbi.nlm.nih.gov/articles/PMC12221524/]
- 12. 2.5. Spectral Data Preprocessing [https://bio-protocol.org/exchange/minidetail?id=8418542&type=30]
- 13. Long-term device stability for Raman spectroscopy [https://pubs.rsc.org/en/content/articlehtml/2025/an/d5an00255a]
- 14. Evaluation of normalization strategies for mass ... [https://pubmed.ncbi.nlm.nih.gov/40593232/]
- 15. A review on spectral data preprocessing techniques for ... [https://www.sciencedirect.com/science/article/pii/S258900422501020X]
- 16. AI Papers to Read in 2025 [https://towardsdatascience.com/ai-papers-to-read-in-2025/]
- 17. Top 10 Common Machine Learning Mistakes and How to ... [https://www.geeksforgeeks.org/blogs/common-machine-learning-mistakes/]
- 18. An Interview with 2025 Emerging Leader in Molecular ... [https://www.spectroscopyonline.com/view/harnessing-raman-spectroscopy-and-machine-learning-for-liquid-biopsy-classification-an-interview-with-2025-emerging-leader-in-molecular-spectroscopy-award-winner-lingyan-shi]
- 19. FAQ: Key AI Applications in Drug Development [https://www.pharmtech.com/view/faq-key-ai-applications-in-drug-development]
- 20. Artificial Intelligence for Drug Development [https://www.fda.gov/about-fda/center-drug-evaluation-and-research-cder/artificial-intelligence-drug-development]
- 21. Recommended strategies for spectral processing and post- ... [https://pmc.ncbi.nlm.nih.gov/articles/PMC5809546/]
- 22. Goodman Live Data Pipeline | NOIRLab Science [http://noirlab.edu/science/observing-noirlab/observing-ctio/observing-soar/aeon/goodman-live-data-pipeline]
- 23. Multivariate methods and advanced pre-processing [https://community.jmp.com/t5/JMP-Blog/Analyzing-spectral-data-Multivariate-methods-and-advanced-pre/ba-p/390296]
- 24. A Comparison of PCA-LDA and PLS-DA Techniques for ... [https://www.mdpi.com/2076-3417/12/11/5345]
- 25. Evaluating LDA and PLS-DA Algorithms for Food ... [https://www.mdpi.com/1999-4893/18/12/733]
- 26. A comparison of decision tree-based algorithms for food ... [https://www.sciencedirect.com/science/article/abs/pii/S0308814625021600]
- 27. A Linear Predictor Based on FTIR Spectral Biomarkers ... [https://pmc.ncbi.nlm.nih.gov/articles/PMC10672539/]
- 28. Comparative analysis of LDA, PLS-DA, SVM, RF, and ... [https://pubs.rsc.org/en/content/articlelanding/2024/ja/d3ja00464c]
- 29. Predicting drug-target interactions using Lasso with ... [https://www.sciencedirect.com/science/article/pii/S088875431830466X]
- 30. Classify Hyperspectral Images Using Deep Learning [https://www.mathworks.com/help/images/hyperspectral-image-classification-using-deep-learning.html]
- 31. Convolutional neural network for hyperspectral data ... [https://www.sciencedirect.com/science/article/pii/S0003267019309675]
- 32. Deep Learning for Hyperspectral Image Classification [https://www.mdpi.com/2072-4292/16/24/4695]
- 33. Convolutional neural network for hyperspectral data ... [https://pubmed.ncbi.nlm.nih.gov/31561793/]
- 34. Troubleshooting Convolution Neural Networks for Enhanced ... [https://blog.krybot.com/t/troubleshooting-convolution-neural-networks-for-enhanced-performance/31671]
- 35. Lecture 7: Troubleshooting Deep Neural Networks [https://fullstackdeeplearning.com/spring2021/lecture-7/]
- 36. Need Help Troubleshooting CNN Implementation - vision [https://discuss.pytorch.org/t/need-help-troubleshooting-cnn-implementation/80419]
- 37. Hardware Conversion of Convolutional Neural Networks [https://www.analog.com/en/resources/analog-dialogue/articles/hardware-conversion-of-cnns-what-is-machine-learning-part-3.html]
- 38. Multimodal Data Fusion: Key Techniques, Challenges & ... [https://www.sapien.io/blog/mastering-multimodal-data-fusion]
- 39. Effective Techniques for Multimodal Data Fusion [https://www.mdpi.com/1424-8220/23/5/2381]
- 40. addressing missing data problem in multimodal fusion [https://arxiv.org/abs/2406.18829]
- 41. What is Multimodal Data? Types, Examples, Applications & ... [https://www.tiledb.com/multimodal-data]
- 42. A Spatial - Spectral -Frequency Interactive Network for Multimodal ... [https://arxiv.org/html/2510.04628v1]
- 43. Advanced data-driven interpretable analysis for predicting ... [https://www.sciencedirect.com/science/article/abs/pii/S0308814625015626]
- 44. Discover the Next Generation of Hyperspectral Data Analysis ... [https://qd-uki.co.uk/next-gen-hyperspectral-data-analysis-with-speciminsight-1-4/]
- 45. Machine learning spectroscopy to advance computation ... [https://pmc.ncbi.nlm.nih.gov/articles/PMC12590498/]
- 46. Harnessing multimodal data integration to advance precision ... [https://pmc.ncbi.nlm.nih.gov/articles/PMC8810682/]
- 47. A Newcomer's Guide to Using Surface Enhanced Raman ... [https://www.spectroscopyonline.com/view/demystifying-sers-newcomer-s-guide-using-surface-enhanced-raman-scattering]
- 48. Achieving optimal SERS through enhanced experimental design [https://pmc.ncbi.nlm.nih.gov/articles/PMC4984853/]
- 49. Optimization of experimental conditions by surface ... [https://www.sciencedirect.com/science/article/abs/pii/S1386142521012051]
- 50. A Review on Surface-Enhanced Raman Scattering - PMC [https://pmc.ncbi.nlm.nih.gov/articles/PMC6627380/]
- 51. Surface-enhanced Raman spectroscopy [https://en.wikipedia.org/wiki/Surface-enhanced_Raman_spectroscopy]
- 52. Rapid detection of drug abuse via tear analysis using ... [https://www.nature.com/articles/s41598-025-85451-y]
- 53. 2025 Pharma Trends: Structure elucidation services by NMR [https://resolvemass.ca/structure-elucidation-services-by-nmr/]
- 54. Exploring the Frontiers of Computational NMR: Methods ... [https://pmc.ncbi.nlm.nih.gov/articles/PMC12530207/]
- 55. Troubleshooting Guide to Expressing Intrinsically ... [https://www.frontiersin.org/journals/molecular-biosciences/articles/10.3389/fmolb.2018.00118/full]
- 56. Peptide Characterization Techniques: FAQs Answered by ... [https://resolvemass.ca/peptide-characterization-techniques-faqs/]
- 57. Quality Control of Therapeutic Peptides by 1H NMR HiFSA ... [https://pmc.ncbi.nlm.nih.gov/articles/PMC6452441/]
- 58. Onboard Data Processing [https://www.eoportal.org/other-space-activities/onboard-data-processing]
- 59. AI-Enabled Onboard Edge Computing for Satellite ... [https://www.un-spider.org/news-and-events/news/ai-enabled-onboard-edge-computing-satellite-intelligence-disaster-management%C2%A0]
- 60. Onboard Hyperspectral Super-Resolution with Deep ... [https://arxiv.org/html/2507.20765v2]
- 61. AI Deep Learning Advances Hyperspectral Imaging for ... [https://www.spectroscopyonline.com/view/ai-deep-learning-advances-hyperspectral-imaging-for-earth-observation]
- 62. Why Isn't Hyperspectral Imaging Widely Implemented and ... [https://www.netguru.com/blog/hyperspectral-imaging-applications]
- 63. Introduction to Dimensionality Reduction [https://www.geeksforgeeks.org/machine-learning/dimensionality-reduction/]
- 64. What is Dimensionality Reduction? [https://www.ibm.com/think/topics/dimensionality-reduction]
- 65. Benchmarking of dimensionality reduction methods to ... [https://www.nature.com/articles/s41598-025-12021-7]
- 66. Dimensionality Reduction: Key Techniques & Uses [https://www.acte.in/introduction-to-dimensionality-reduction]
- 67. Comprehensive review of dimensionality reduction algorithms [https://pmc.ncbi.nlm.nih.gov/articles/PMC12453773/]
- 68. Chapter 5 High dimensional visualizations | Data Analysis and ... [https://gagneurlab.github.io/dataviz/high-dimensional-visualizations.html]
- 69. Applications of machine learning in drug discovery and ... [https://pmc.ncbi.nlm.nih.gov/articles/PMC6552674/]
- 70. How to Troubleshoot a Spectrum That Looks Wrong [https://www.azooptics.com/Article.aspx?ArticleID=2811]
- 71. Mini-Tutorial: Cleaning Up the Spectrum Using ... [https://www.spectroscopyonline.com/view/mini-tutorial-cleaning-up-the-spectrum-using-preprocessing-strategies-for-ft-ir-atr-analysis]
- 72. Comparison of preprocessing techniques to reduce ... [https://pmc.ncbi.nlm.nih.gov/articles/PMC9541333/]
- 73. A lightweight infrared remote sensing architecture for ... [https://www.nature.com/articles/s41598-025-22273-y]
- 74. LiteFallNet: A lightweight deep learning model for efficient ... [https://pmc.ncbi.nlm.nih.gov/articles/PMC12515292/]
- 75. Lightweight and high-precision spectral convolutional ... [https://link.springer.com/article/10.1007/s00521-025-11376-2]
- 76. From Classical Regression to AI and Beyond [https://www.spectroscopyonline.com/view/from-classical-regression-to-ai-and-beyond-the-chronicles-of-calibration-in-spectroscopy-part-ii]
- 77. Common Problems | Machine Learning [https://developers.google.com/machine-learning/gan/problems]
- 78. GANs Failure Modes: How to Identify and Monitor Them [https://neptune.ai/blog/gan-failure-modes]
- 79. Self-Supervised Learning for data scarcity in a fatigue ... [https://www.sciencedirect.com/science/article/abs/pii/S0952197623000210]
- 80. Self-Supervised Learning with Generative Adversarial ... [https://arxiv.org/html/2402.18286v2]
- 81. Exploiting generative self-supervised learning for the ... [https://bmcbioinformatics.biomedcentral.com/articles/10.1186/s12859-022-04845-1]
- 82. GANs in computer vision - self-supervised adversarial ... [https://theaisummer.com/gan-computer-vision-style-gan/]
- 83. Generative adversarial networks for data-scarce spectral ... [https://arxiv.org/abs/2307.07454]
- 84. The Complete Guide to GANs: From Basics ... [https://medium.com/@aniket.py/anigan-exploring-face-generation-through-deep-learning-0dabc3c6b9ff]
- 85. Quasar – Free your data [https://quasar.codes/]
- 86. Quasar [https://midir.lightsource.ca/quasar/]
- 87. 5.9. Troubleshooting Guide - Quasar documentation [https://doc.quasar.ai/master/administration/observability/troubleshooting.html]
- 88. What is Advanced Analytics? | IBM [https://www.ibm.com/think/topics/advanced-analytics]
- 89. Cross Validation in Machine Learning [https://www.geeksforgeeks.org/machine-learning/cross-validation-machine-learning/]
- 90. Solving 9 Common Cross-Validation Mistakes [https://medium.com/@jan_marcel_kezmann/solving-9-common-cross-validation-mistakes-ac8a6a6944e7]
- 91. Robust Model Validation | CodeSignal Learn [https://codesignal.com/learn/courses/predicthealths-advanced-pricing-system-1/lessons/robust-model-validation]
- 92. Cross-Validation in Machine Learning: How to Do It Right [https://neptune.ai/blog/cross-validation-in-machine-learning-how-to-do-it-right]
- 93. machine learning - Cross validation train and test error [https://stats.stackexchange.com/questions/425503/cross-validation-train-and-test-error]
- 94. Advanced Raman Spectroscopy Method Boosts Precision ... [https://www.spectroscopyonline.com/view/advanced-raman-spectroscopy-method-boosts-precision-in-drug-component-detection]
- 95. The Best and Least Confusing Ways to Analyze Spectral Data [https://scix2025.eventscribe.net/ajaxcalls/PresentationInfo.asp?PresentationID=1669901]
- 96. PLS-DA vs PCA: Key Differences and Use Cases in Omics ... [https://www.metwarebio.com/pca-vs-pls-da-omics-data-analysis-guide/]
- 97. Partial Least-Squares Functional Mode Analysis: Application ... [https://pmc.ncbi.nlm.nih.gov/articles/PMC3443789/]
- 98. The ultimate guide to functional data analysis (FDA) for ... [https://www.jmp.com/en/analytics-in-practice/functional-data-analysis]
- 99. Comparison of functional and discrete data analysis ... [https://pmc.ncbi.nlm.nih.gov/articles/PMC8410698/]
- 100. Functional Principal Component Analysis and ... [https://towardsdatascience.com/functional-principal-component-analysis-and-functional-data-91d21261ab7f/]
- 101. NMR-based structural integrity analysis of therapeutic ... [https://pmc.ncbi.nlm.nih.gov/articles/PMC12427497/]
- 102. Deep Learning vs. Traditional Machine Learning: Which is ... [https://www.alliancetek.com/blog/post/2025/03/11/deep-learning-vs-traditional-ml.aspx]
- 103. ML vs Deep Learning: Understanding Excellent AI's Core ... [https://hblabgroup.com/ml-vs-deep-learning/]
- 104. Interpretability and accuracy of machine learning ... [https://www.sciencedirect.com/science/article/pii/S1746809425006640]
- 105. Enhancing credit card fraud detection using traditional and ... [https://www.frontiersin.org/journals/artificial-intelligence/articles/10.3389/frai.2025.1643292/full]
- 106. Hyperspectral Image Classification: Potentials, Challenges ... [https://pmc.ncbi.nlm.nih.gov/articles/PMC9071975/]
- 107. A review on spectral data preprocessing techniques for ... [https://pubmed.ncbi.nlm.nih.gov/40606754/]
- 108. Dimensionality reduction in hyperspectral imaging using ... [https://www.nature.com/articles/s41598-025-21738-4]
- 109. Validating neural networks for spectroscopic classification ... [https://www.nature.com/articles/s41524-023-01055-y]
- 110. Comparative analysis of deep learning and traditional ... [https://www.nature.com/articles/s41598-025-16553-w]
- 111. Error-Detection Tool Makes AI Mistakes Easy to Spot [https://spectrum.ieee.org/ai-mistakes]
- 112. Artificial Intelligence in Analytical Spectroscopy, Part II [https://www.spectroscopyonline.com/view/artificial-intelligence-in-analytical-spectroscopy-part-ii-examples-in-spectroscopy]
- 113. Color contrast accessibility requirements explained [https://blog.pope.tech/2022/11/08/color-contrast-accessibility-requirements-explained/]
- 114. How to decide font color in white or black depending on ... [https://stackoverflow.com/questions/3942878/how-to-decide-font-color-in-white-or-black-depending-on-background-color]
- 115. AccessFixer: Enhancing GUI Accessibility for Low Vision ... [https://arxiv.org/html/2502.15142v1]
- 116. 99% accuracy in train and 96% in test is too much overfitting? [https://datascience.stackexchange.com/questions/117337/99-accuracy-in-train-and-96-in-test-is-too-much-overfitting]
- 117. 99% Accuracy! Great…right?. Creating Better Models ... [https://medium.com/low-code-for-advanced-data-science/99-accuracy-great-right-18eba5c7564d]
- 118. Classification: Accuracy, recall, precision, and related metrics [https://developers.google.com/machine-learning/crash-course/classification/accuracy-precision-recall]
- 119. New Approach for the Detection of Sub-ppm Limonene [https://pmc.ncbi.nlm.nih.gov/articles/PMC10383529/]