Control Strategies in Flow Cytometry: A Comprehensive Guide to Conventional Compensation vs. Spectral Unmixing
This article provides a detailed comparative analysis of control methodologies in conventional and spectral flow cytometry, tailored for researchers and drug development professionals.
Control Strategies in Flow Cytometry: A Comprehensive Guide to Conventional Compensation vs. Spectral Unmixing
Abstract
This article provides a detailed comparative analysis of control methodologies in conventional and spectral flow cytometry, tailored for researchers and drug development professionals. It explores the foundational principles of compensation and spectral unmixing, outlines step-by-step methodological workflows for both techniques, addresses common troubleshooting and optimization challenges, and presents validation strategies to ensure data accuracy and reproducibility. By synthesizing current practices and emerging trends, this guide serves as an essential resource for designing robust, high-parameter flow cytometry experiments and advancing biomedical research.
Core Principles: Understanding Compensation and Spectral Unmixing
In the analysis of complex biological systems, the ability to accurately resolve multiple simultaneous signals is paramount. Discrete bandpass filtering and full-spectrum capture represent two fundamentally different approaches to optical signal processing, each with distinct advantages and limitations. Discrete bandpass filtering, the conventional method used in flow cytometry for decades, employs optical filters to isolate specific, narrow wavelength bands for detection, following a "one-detector, one-fluorophore" principle [1]. In contrast, full-spectrum capture, utilized in spectral flow cytometry, collects the entire emission spectrum across a broad wavelength range for each fluorophore, leveraging mathematical unmixing to distinguish between different signals [2] [3]. This fundamental difference in signal acquisition methodology creates ripple effects throughout experimental design, system complexity, and data analysis, making the choice between them critical for researchers, particularly those engaged in high-parameter single-cell analysis for drug development and immunophenotyping.
Table 1: Core Conceptual Differences Between the Two Approaches
| Feature | Discrete Bandpass Filtering | Full-Spectrum Capture |
|---|---|---|
| Primary Principle | "One-detector, one-fluorophore" [1] | "All-detectors, all-fluorophores" [4] |
| Signal Processing | Compensation to subtract spillover [1] | Spectral unmixing based on reference signatures [2] [4] |
| Data Collected | Intensity at a narrow band near emission peak [2] | Full emission spectrum (~350-900 nm) [2] [3] |
| Key Hardware | Complex system of dichroic mirrors and bandpass filters [3] | Dispersive optics (prism/grating) and detector arrays [3] [5] |
Underlying Technological Architectures
The technological implementation of these two paradigms diverges significantly, primarily within the optical detection system. While both systems may share similar fluidics and laser components, the path a photon takes after being emitted by a fluorophore is radically different.
The Discrete Bandpass Filtering System
In a conventional flow cytometer, emitted light is first separated by wavelength using dichroic mirrors—optical elements that direct specific wavelength bands toward different paths [3]. The light is then further refined through bandpass filters, which only allow a narrow window of wavelengths (typically 20-50 nm) to pass through to a single-point detector, usually a photomultiplier tube (PMT) [3] [5]. This setup requires a dedicated optical filter and detector for each fluorescent parameter being measured. Consequently, increasing the number of parameters necessitates a proportionally more complex optical system, often involving dozens of optical filters, which increases cost and complexity [3].
The Full-Spectrum Capture System
Spectral flow cytometers replace the filter-based system with a dispersive optical element, such as a prism or diffraction grating [3] [5]. This element spreads the full emission light from a cell into its constituent wavelengths, projecting a continuous spectrum onto a dense array of detectors (e.g., 32-64 channels) [3]. This detector array, which can be a multianode PMT or a CCD, captures the intensity of light at each small wavelength increment [5]. This design is optically simpler as it eliminates the need for a complex filter cube assembly, but it demands more sophisticated data acquisition electronics and computational power to process the spectral data from the detector array [3].
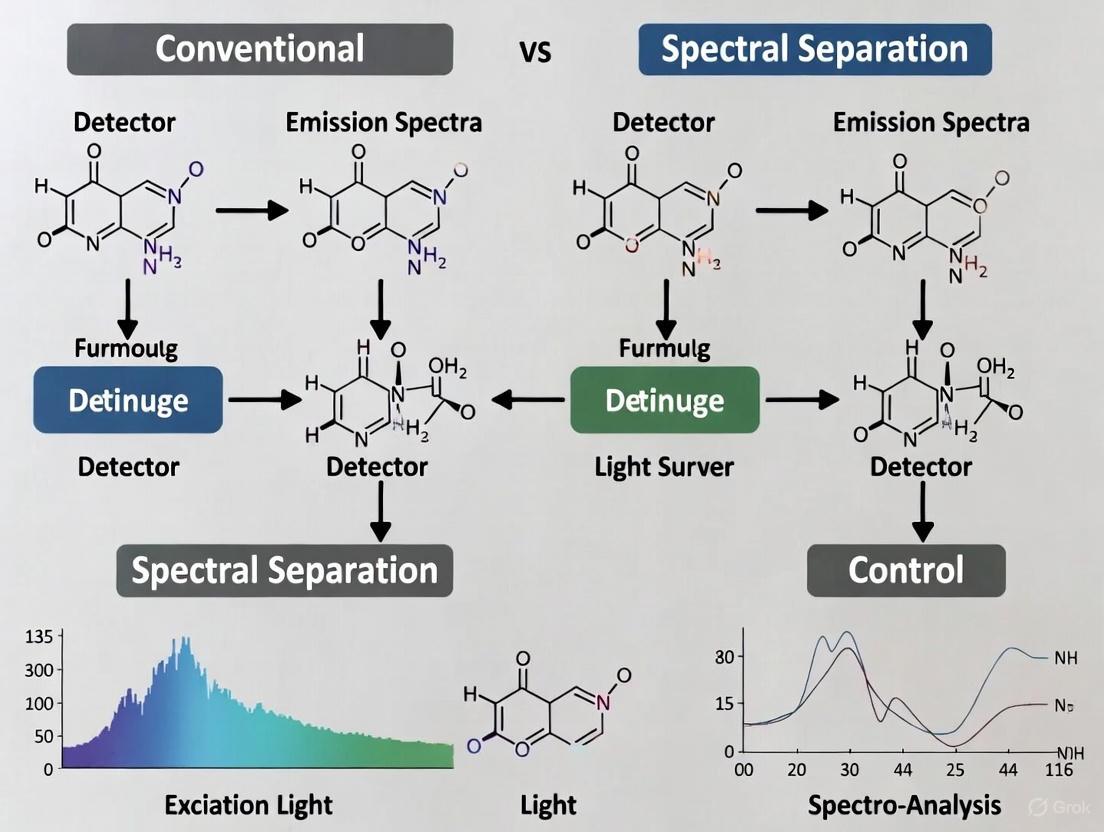
Figure 1: Signal Processing Workflows. Conventional flow uses filters to physically separate light for dedicated detectors, followed by compensation. Spectral flow captures the entire spectrum and uses software algorithms for unmixing.
Experimental Protocols and Data Processing
The methodological approach from panel design to data analysis differs substantially between the two technologies, impacting experimental workflow and required controls.
Panel Design and Fluorophore Selection
In conventional flow cytometry, panel design is constrained by the fixed optical configuration of the instrument. Fluorophores must be chosen so that their emission peaks align with the available bandpass filters, and combinations with significant spectral overlap must be avoided to minimize spillover, which complicates compensation [1]. Bright fluorophores are typically paired with lowly expressed antigens and vice-versa [4].
Spectral flow cytometry offers greater flexibility. Because it uses the entire spectral signature, it can distinguish fluorophores with very similar or even identical peak emissions but different off-peak spectral shapes [2] [4]. The primary metric for panel design becomes the Similarity Index, a computational tool that quantifies the overlap between the full spectra of two fluorophores [4]. A lower index is critical for markers that are co-expressed on the same cells.
Reference Controls and Spillover Management
Both methods require single-color reference controls for proper signal separation, but they are used for different purposes [4].
- Discrete Bandpass: Compensation Controls: In conventional flow, single-stained controls are used to calculate a spillover matrix (compensation). This matrix mathematically subtracts the proportion of a fluorophore's signal that "spills over" into another detector [1].
- Full-Spectrum: Unmixing Controls: In spectral flow, single-stained controls are used to create a reference spectral signature library for each fluorophore [4]. During acquisition, the signal from a multicolor sample is decomposed into its individual components by comparing the captured full spectrum against this library in a process called "unmixing" [2] [4]. It is critical that the antibody batches used for controls and the actual experiment are identical, especially for tandem dyes which can show batch-to-batch variation [4].
A significant advantage of full-spectrum capture is autofluorescence extraction. Cellular autofluorescence has its own broad spectral signature, which spectral software can learn from an unstained control and then subtract from the total signal, dramatically improving resolution for dim markers [2] [4].
Table 2: Experimental and Data Processing Comparison
| Aspect | Discrete Bandpass Filtering | Full-Spectrum Capture |
|---|---|---|
| Panel Design Constraint | Filter availability and minimal peak emission overlap [1] | Fluorophore spectral signature uniqueness (Similarity Index) [4] |
| Spillover Correction | Compensation (mathematical subtraction) [1] | Spectral Unmixing (mixture modeling) [1] [3] |
| Key Control | Single-stained compensation controls [1] | Single-stained controls for reference library [4] |
| Autofluorescence Handling | Contributes to background, cannot be separated [2] | Can be extracted and removed as a separate component [2] [4] |
| Typical Max Panel Size | 15-20 colors [1] | 40+ colors [2] [3] |
Performance and Application Analysis
The technical differences between discrete and full-spectrum systems translate directly into distinct performance profiles, making each better suited for different research applications.
Resolution and Multiplexing Capacity
The ability of full-spectrum systems to resolve fluorophores with highly overlapping emissions and to extract autofluorescence provides superior resolution in high-parameter panels [2]. While conventional cytometers are typically limited to panels of 15-20 colors, spectral cytometers routinely support panels of 30-40 colors, with some configurations capable of more than 50 [2] [3]. This high multiplexing capacity is invaluable for deep immunophenotyping, where researchers need to dissect complex immune systems into fine subpopulations, such as in cancer immunology or autoimmune disease research [3].
Data Analysis and Computational Workflows
The data output from these systems necessitates different analytical approaches. Conventional flow data is typically analyzed through a sequence of two-dimensional plots (gating hierarchy) [6]. While this is feasible for panels of lower complexity, it becomes subjective and time-consuming for high-parameter data.
The high-dimensional nature of spectral flow data benefits greatly from computational analysis tools [6]. Dimensionality reduction techniques like t-SNE (t-Distributed Stochastic Neighbor Embedding) and UMAP (Uniform Manifold Approximation and Projection) are commonly used to visualize all cell populations in a two-dimensional map, revealing relationships and rare populations that might be missed by manual gating [6]. Furthermore, unsupervised clustering algorithms (e.g., FlowSOM, PhenoGraph) can automatically identify cell populations based on their marker expression profiles without prior bias [6].
The Scientist's Toolkit: Essential Research Reagents and Materials
Success in both conventional and spectral flow cytometry hinges on the thoughtful selection and use of key reagents and controls.
Table 3: Essential Research Reagent Solutions
| Item | Function | Critical Considerations |
|---|---|---|
| Single-Stain Controls | To generate a compensation matrix (conventional) or a reference spectral library (spectral). | Must be stained with the same antibody-fluorophore conjugate batch as the experimental sample [4]. |
| Compensation Beads | As an alternative to cells for acquiring single-stain controls. | Can provide a strong, clean signal but may sometimes distort the fluorescent signature compared to cells [4]. |
| Viability Dye | To exclude dead cells from analysis, improving data quality. | Should be chosen to avoid spectral overlap with key markers in the panel. |
| Bright Fluorophores (e.g., PE, APC) | Used for detecting lowly expressed antigens. | In conventional flow, their broad emission can cause significant spillover [1]. |
| Tandem Dyes (e.g., PE-Cy7, PE-Cy5) | Combine a donor fluorophore and an acceptor to create new emission profiles, expanding the panel. | Prone to batch-to-batch variation and degradation; require stringent batch matching for controls [4]. |
| Ultraviolet (UV) Laser | Expands excitation possibilities. | In spectral systems, a UV laser can excite many fluorophores outside their peak, contributing valuable data for unmixing [3]. |
The choice between discrete bandpass filtering and full-spectrum capture is not a matter of one technology being universally superior, but rather of selecting the right tool for the scientific question at hand. Discrete bandpass flow cytometry remains a powerful, cost-effective, and straightforward technology for panels of low to moderate complexity (e.g., under 20 parameters) [1]. Its well-established workflows and analysis pipelines make it an excellent workhorse for many routine applications.
Full-spectrum flow cytometry is a transformative advancement for high-complexity research. Its ability to resolve more parameters, distinguish highly similar dyes, and remove autofluorescence makes it the technology of choice for deep immunophenotyping, systems immunology, and any research requiring maximal information from a single sample [2] [3]. The primary trade-offs are the need for more sophisticated panel design, careful control of reagent batches, and a reliance on computational tools for data analysis. As the demand for high-dimensional single-cell analysis continues to grow in drug development and biomarker discovery, full-spectrum capture is poised to become the central technology for pushing the boundaries of what is measurable in cellular analysis.
In both conventional and spectral flow cytometry, the accurate measurement of multiple fluorescent labels simultaneously is complicated by the phenomenon of spectral overlap. Fluorophores emit light across a broad range of wavelengths, causing the signal from one fluorophore to be detected in channels dedicated to others [7]. This signal mixing necessitates mathematical correction to determine the true abundance of each fluorophore on individual cells. The fundamental linear mixture model representing this phenomenon is expressed as r = Mα + e, where r is the vector of observed detector readings, M is the spectral-signature matrix, α is the vector of true fluorophore abundances, and e represents measurement noise [8]. While both conventional and spectral flow cytometry address this same core problem, their mathematical approaches to solution differ significantly. Conventional flow cytometry employs compensation matrices using square inversion techniques, while spectral flow cytometry utilizes least-squares unmixing algorithms to resolve signals from many more fluorophores than detectors. Understanding the mathematics underlying these processes is essential for researchers designing multicolor panels and interpreting high-dimensional data, as the choice of method directly impacts population resolution, data accuracy, and the feasibility of large-scale experiments.
Conventional Flow Cytometry: Compensation Matrices
Mathematical Foundation and Implementation
In conventional flow cytometry, the number of fluorescent parameters is typically equal to the number of detectors. This one-to-one relationship enables the use of a square spillover matrix (M), where each element mᵢⱼ represents the proportion of fluorescence from fluorophore j detected in the detector primarily assigned to fluorophore i [8]. The core mathematical operation of compensation involves multiplying the vector of raw measurements (r) by the inverse of this spillover matrix to obtain the vector of estimated fluorophore abundances (α̂). This process is mathematically represented as α̂ = rM⁻¹ [8]. The inversion of the square matrix M is computationally straightforward and forms the historical basis for signal correction in flow cytometry for decades.
The compensation process requires careful experimental calibration using single-stained controls to determine the values within the spillover matrix accurately. Each control specifies how one fluorophore spreads into all other detectors, building the matrix column by column [4]. While effective for panels where the number of fluorophores equals the number of detectors, this approach faces inherent limitations when the number of detectors exceeds the number of fluorophores, as it cannot utilize the additional information provided by the extra detectors.
Experimental Protocol for Compensation
The accurate implementation of compensation requires a rigorous experimental workflow:
- Single-Stained Controls: For each fluorophore in the panel, prepare a control sample stained with that fluorophore alone. These can be cells with known antigen expression or compensation beads [4] [9].
- Data Acquisition: Acquire data from each single-stained control using the same instrument settings as the fully stained experimental samples.
- Matrix Calculation: Using the instrument's software, calculate the compensation matrix by analyzing the median fluorescence intensity (MFI) of the positive population in both its primary detector and all other detectors [10].
- Application: Apply the calculated inverse matrix to the raw data from fully stained samples to obtain the compensated data, where the signal in each channel reflects only the fluorescence from its intended fluorophore.
The following diagram illustrates the logical workflow and mathematical relationship for conventional compensation:
Figure 1: Conventional compensation workflow. The raw signal vector is multiplied by the inverse of the spillover matrix to estimate fluorophore abundance.
Spectral Flow Cytometry: Least-Squares Unmixing Algorithms
Mathematical Foundation and the Need for Advanced Algorithms
Spectral flow cytometry fundamentally changes the data acquisition paradigm by employing many more detectors than fluorophores, creating an overdetermined system [8]. This system is represented by the same linear mixture model, r = Mα + e, but with a key difference: the spectral-signature matrix M is now a nonsquare matrix with dimensions L × p, where L (number of detectors) is greater than p (number of labels) [8]. The simplest mathematical approach to solving this overdetermined system is Ordinary Least-Squares (OLS) unmixing, which finds the vector α̂ that minimizes the sum of squared residuals between the observed data and the model predictions: α̂ = argminₐ ||r - Ma||² [8]. This solution is equivalent to using the pseudoinverse of M.
However, a critical finding from recent research is that OLS relies on assumptions that fluorescence data often violate, primarily that noise is Gaussian with constant variance across signal levels [8]. In reality, photon detection in flow cytometry follows Poisson statistics, where noise variance increases with signal intensity. The use of OLS on such data can lead to unmixing artifacts, including population distortion and the presence of negative values for biomarker abundances [8]. To address this, superior methods like Poisson regression within a Generalized Linear Model (GLM) framework have been developed. This approach explicitly incorporates the Poisson noise model, leading to more accurate estimation of true label abundance, particularly for dim fluorescent populations [8].
Experimental Protocol for Spectral Unmixing
The experimental workflow for spectral unmixing emphasizes precision in control preparation:
- Reference Control Acquisition: For each fluorophore, acquire data from a single-stained reference control. These controls define the unique spectral signature for each fluorophore [9].
- Optimal Control Preparation: For the most accurate unmixing, reference controls should be prepared using cells (not just beads) stained with the same antibody conjugate, from the same lot, and under identical conditions (buffers, fixation, incubation time) as the fully stained sample [10]. The positive population should be as bright or brighter than in the experimental sample [9].
- Library Creation: These validated reference spectra can be stored in a reference library on the instrument for future use, though periodic re-validation is recommended [9].
- Unmixing Execution: The unmixing algorithm mathematically decomposes the full spectrum measured from each cell in a fully stained sample into a linear combination of the reference spectra, calculating the contribution (abundance) of each fluorophore [4].
The following diagram illustrates the spectral unmixing process:
Figure 2: Spectral unmixing workflow. The full spectrum signal is decomposed using an algorithm that compares it to a library of reference signatures.
Comparative Analysis: Performance and Experimental Data
Quantitative and Qualitative Comparison
The table below provides a structured comparison of the two signal correction methodologies based on mathematical and performance characteristics.
Table 1: Comprehensive Comparison of Compensation Matrices and Least-Squares Unmixing
| Feature | Compensation Matrices | Least-Squares Unmixing |
|---|---|---|
| Mathematical Core | Inversion of a square spillover matrix [8] | Pseudoinverse or regression with a nonsquare spectral signature matrix [8] |
| System Definition | Determined system (detectors = fluorophores) [8] | Overdetermined system (detectors > fluorophores) [8] |
| Noise Model Assumption | Implicitly assumes Gaussian noise | OLS assumes Gaussian noise; advanced methods (e.g., Poisson regression) use accurate noise models [8] |
| Primary Artifacts | Spreading error, particularly with dim markers in bright channels | OLS can cause population spreading and negative values; improved by better algorithms [8] |
| Maximum Panel Size | Limited by number of detectors (typically 15-20) [7] | Very high (e.g., 30-40+ colors) [4] [11] |
| Fluorophore Similarity | Requires distinct peak emissions | Can distinguish fluorophores with similar peaks but different spectral shapes [4] |
| Autofluorescence Handling | Not explicitly handled; contributes to background | Can be explicitly extracted as a separate signal component [4] |
| Control Requirements | Single-stained controls for each fluorophore [4] | Single-stained reference controls for each fluorophore; higher precision often needed [9] [10] |
Experimental data underscores the practical impact of these mathematical differences. One study demonstrated that Poisson unmixing provided superior results compared to OLS, particularly for dim fluorescent populations, as assessed by lower absolute/relative errors and a smaller Kullback-Leibler divergence between known and approximated populations [8]. Furthermore, the ability of spectral unmixing to resolve fluorophores with high similarity indices (up to ~0.98) allows for panel designs that are impossible with conventional cytometry, where fluorophores with overlapping emission spectra cannot be used together [9].
The Scientist's Toolkit: Essential Research Reagents
Successful implementation of these mathematical corrections depends on high-quality reagents. The following table details key materials and their functions.
Table 2: Essential Research Reagents for Flow Cytometry Signal Correction
| Reagent / Material | Function in Signal Correction | Critical Considerations |
|---|---|---|
| Single-Stained Controls | Define the spectral/spillover signature for each fluorophore. The cornerstone for building matrix M [4] [9]. | Best prepared with cells (not beads) stained identically to the full panel. Must be as bright or brighter than the sample [10]. |
| Compensation Beads | Uniform particles that bind antibodies, providing a strong, consistent positive signal for spillover calculation [4]. | Can distort fluorescent signatures; may lead to inaccurate unmixing in spectral cytometry if over-relied upon [10]. |
| Viability Dye | Identifies dead cells, which have higher autofluorescence and non-specific antibody binding, preventing corrupted signal data [9]. | For reference controls, positive and negative populations must have matched autofluorescence (e.g., heat-killed vs. live cells) [9]. |
| Fc Receptor Block | Reduces non-specific antibody binding, minimizing background noise and leading to a cleaner signal for correction [11]. | Essential for achieving a "clean" spectral signature, especially for low-abundance targets. |
| Brightly Expressed Antibodies (e.g., CD4, CD8) | Useful as alternative reference controls for dim or difficult-to-stain markers when conjugated with the same fluorophore [10]. | Ensures a bright, well-defined signature for the fluorophore, even if the original marker is dim or rare. |
The mathematics underlying signal correction is a foundational element that differentiates conventional and spectral flow cytometry. Compensation matrices, relying on the direct inversion of a square matrix, are a robust and well-understood solution for determined systems. In contrast, least-squares unmixing algorithms, particularly those employing advanced noise models like Poisson regression, leverage overdetermined systems to enable highly multiplexed panels. The choice between these methods is not merely a technical preference but a strategic decision that dictates experimental scale, panel design flexibility, and ultimately, data fidelity. As flow cytometry continues to push into higher parameter spaces, the continued refinement of these mathematical approaches, coupled with stringent experimental protocols for control preparation, will be paramount for extracting biologically meaningful insights from complex cellular systems.
Flow cytometry stands as a cornerstone technique in biomedical research and drug development, enabling high-throughput, multi-parameter analysis of single cells. The core challenge in its evolution has been maximizing the amount of information obtained from each cell, which is fundamentally constrained by instrument architecture. This has led to two distinct technological pathways: conventional flow cytometry, which relies on optical filters and photomultiplier tubes (PMTs), and spectral flow cytometry, which utilizes prisms or gratings coupled with detector arrays [12] [3]. The choice between these architectures dictates every aspect of an experiment, from panel design and reagent selection to data quality and interpretability. This guide provides an objective comparison of these technologies, detailing their operational principles, performance characteristics, and practical implications for researchers aiming to implement robust controls in their studies.
Core Architectural Principles
Conventional Flow Cytometry: Discrete Channel Detection
The conventional flow cytometer operates on a "one detector–one fluorophore" principle. Its optical system is a complex assembly of dichroic mirrors and bandpass filters designed to isolate specific wavelength bands [3] [5].
- Fluidics and Illumination: Cells in suspension are hydrodynamically focused into a single-file stream and illuminated by one or more lasers [13].
- Light Collection and Separation: Emitted light from a cell—a combination of scattered and fluorescent photons—is collected. Dichroic mirrors, which reflect certain wavelengths and transmit others, route the light. Subsequent bandpass filters (typically 20–50 nm wide) further refine the light, allowing only a narrow window of wavelengths to reach each dedicated detector [12] [3].
- Detection with PMTs: The filtered light is directed to photomultiplier tubes (PMTs). These vacuum tubes contain a photocathode that releases electrons when struck by photons. These electrons are then amplified through a series of dynodes, creating a measurable electrical pulse for each photon [14]. A key feature of conventional systems is that the signal measured by each PMT is assigned to a specific fluorescent parameter based on the optical filter placed in front of it.
Spectral Flow Cytometry: Full-Spectrum Analysis
Spectral flow cytometry abandons the complex filter system for an approach that captures the entire emission spectrum of every fluorophore on a cell.
- Light Collection and Dispersion: After light is collected from the cell, it is not immediately filtered. Instead, it passes through a dispersive optic—either a prism or a diffraction grating—that spreads the light into its constituent wavelengths across a continuous spectrum [3] [5].
- Detection with Array Detectors: This dispersed spectrum is projected not onto a single PMT, but onto a linear array of detectors. These can be multianode PMTs (with 32 or more elements) or charge-coupled devices (CCDs) [5]. Each detector in the array captures the light intensity within a very narrow, specific wavelength band.
- Spectral Unmixing: The resulting data for each cell is a full vector of intensity values across all wavelength channels. Fluorophores with overlapping emissions are distinguished computationally through a process called "spectral unmixing." This algorithm deconvolutes the composite spectrum based on pre-measured reference spectra from single-stained controls [3] [15].
Critical Component Comparison
Light Dispersion: Prisms vs. Diffraction Gratings
The performance of a spectral cytometer hinges on its dispersive element. The table below compares the two primary technologies.
Table 1: Comparison of Prism and Grating Dispersive Elements
| Feature | Prism | Diffraction Grating |
|---|---|---|
| Operating Principle | Refraction | Diffraction |
| Material | Glass, Quartz, or Calcite [16] | Aluminum with etched lines [16] |
| Spectrum Purity | Lower, with potential for overlapping bands [16] | Higher, producing a sharper and more defined spectrum [16] [17] |
| Dispersion Linearity | Non-linear, varies with wavelength [5] | Linear across the spectrum [16] |
| Ray Bandwidth | Broader (e.g., 10-25 nm) [16] | Narrower (e.g., ~5 nm) [16] |
| Ghost Spectrum | Does not produce ghost spectra [16] | Can produce ghost spectra if lines are imperfect [16] |
| Dispersion Control | Fixed by material and geometry [16] | Tunable by increasing lines per inch [16] |
The sharper, linear dispersion of gratings generally makes them the preferred choice for high-resolution spectral analysis, as they allow for more precise distinction between closely related fluorophores [17]. In practice, some advanced systems use a hybrid "grism" (a grating etched onto a prism) to correct for optical aberrations and simplify the light path [18].
Detector Technologies: PMTs vs. APDs vs. Array Detectors
The detector is the final component in the signal chain, and its characteristics define the instrument's sensitivity and dynamic range.
Table 2: Comparison of Flow Cytometry Light Detectors
| Detector Type | Max Internal Gain | Dynamic Range | Noise | Peak Quantum Efficiency | Typical Use |
|---|---|---|---|---|---|
| Photomultiplier Tube (PMT) | Very High (~10⁶) [14] | Very Large [14] | Very Low [14] | Lower, drops in red/NIR [14] | Conventional cytometers; fluorescence detection |
| Avalanche Photodiode (APD) | Moderate [14] | Large [14] | Moderate [14] | High in red/NIR [14] | Some conventional cytometers; scatter detection |
| Silicon Photomultiplier (SiPM) | High (10⁵–10⁶) [14] | Wide (scales with microcell count) [14] | High [14] | High [14] | Emerging technology |
| CCD/Array Detectors | Variable (with EMCCD) [5] | Large [5] | Low (with cooling) [5] | Very High (>95%) [5] | Spectral cytometers |
Conventional cytometers primarily use PMTs for their high gain and low noise, which are ideal for detecting dim fluorescent signals. Spectral cytometers often use multianode PMTs for their speed or CCDs for their high quantum efficiency and resolution, which is critical for capturing the full emission spectrum with high fidelity [5] [14].
Experimental Data and Performance Comparison
Direct performance comparisons between conventional and spectral cytometers are context-dependent, varying with the specific panel and instrument models. The following table summarizes key differentiating metrics based on technical literature and manufacturer specifications for high-end systems.
Table 3: Instrument Architecture and Performance Summary
| Characteristic | Conventional Flow Cytometer | Spectral Flow Cytometer |
|---|---|---|
| Core Principle | Discrete filter-based detection [3] | Full-spectrum acquisition & computational unmixing [3] |
| Max Parameters (Typical) | 20-30 [12] [3] | 40+ [12] [3] |
| Spectral Overlap Management | Hardware-based compensation (subtraction) [12] | Software-based unmixing (deconvolution) [15] |
| Autofluorescence | Often considered background noise [12] | Can be measured and subtracted as a unique signal [12] |
| Optical Complexity | High (40+ filters/mirrors) [3] | Lower (fewer fixed filters) [3] |
| Key Experimental Control | FMO (Fluorescence Minus One) [12] | Single-stained reference controls [15] |
| Tandem Dye Stability | Affects compensation, requires fresh controls [15] | Critical for unmixing; breakdown shifts spectral signature [15] |
A critical experimental finding is the impact of fixation on reference controls. A study evaluating 16 fluorophores across four fixatives found that 0.5% formaldehyde best maintained biomarker integrity for single-color controls over five days, which is vital for the reproducibility of spectral unmixing in long-term studies [15]. Furthermore, the stability of tandem dyes, which can break down and alter their spectral signature, is a more significant concern in spectral flow cytometry, directly impacting the accuracy of the unmixing algorithm [15].
Essential Research Reagent Solutions
Successful implementation of either technology requires careful selection of reagents and controls. The following toolkit is essential for robust experimental design.
Table 4: Research Reagent Solutions for Flow Cytometry
| Reagent / Material | Function | Key Consideration |
|---|---|---|
| Fluorophore-conjugated Antibodies | Target-specific staining of cellular markers. | Titration is critical for optimal stain index [12]. |
| Viability Dyes | Exclusion of dead cells from analysis. | Must be titrated and compatible with fixation [12]. |
| Single-Stain Reference Controls | Define the pure spectrum of each fluorophore for unmixing (spectral) or compensation (conventional). | For spectral, stability is paramount; 0.5% formaldehyde shows promise [15]. |
| FMO Controls | Accurate gating for dim populations and setting positive/negative boundaries. | Essential for both conventional and spectral panels [12]. |
| Calibration Beads | Standardize instrument settings and monitor performance over time. | Required for daily startup and quality control. |
| Fc Receptor Blocking Reagent | Reduce nonspecific antibody binding. | Superior to the use of irrelevant isotype controls [12]. |
| Tandem Dyes | Expand the panel's color palette. | Monitor for breakdown, which is a major source of error [15]. |
Methodology for Key Validations
Protocol: Validating Single-Stain Reference Controls for Spectral Unmixing
The accuracy of spectral unmixing is entirely dependent on the quality of single-stain controls. The following protocol is adapted from industry best practices [15].
- Preparation:
- Use the same cell type as the experimental samples (e.g., PBMCs or a stable cell line).
- Split cells into aliquots, one for each fluorophore in the panel plus an unstained control.
- Staining:
- Stain each aliquot with a saturating concentration of a single antibody-fluorophore conjugate. The unstained control undergoes the same procedure without antibodies.
- Perform steps at 4°C protected from light.
- Fixation:
- Fix cells using an optimized protocol. Studies indicate 0.5% formaldehyde may provide stable spectral signatures for up to five days when stored at 4°C [15].
- Data Acquisition:
- Acquire data for all single-stained controls and the unstained control on the spectral cytometer.
- Ensure the instrument is properly calibrated using calibration beads.
- Stability Tracking (for tandem dyes):
- To monitor tandem dye stability, calculate the Mean Fluorescence Intensity (MFI) ratio of the donor emission peak to the tandem (acceptor) emission peak over time. A significant increase indicates tandem breakdown [15].
Protocol: Panel Design and Titration for High-Parameter Panels
This methodology is crucial for both conventional and spectral cytometry but is especially important for maximizing the utility of high-parameter spectral panels [12].
- Fluorophore Assignment:
- Assign bright fluorophores to low-abundance antigens and dim fluorophores to highly expressed antigens.
- In spectral panels, while unmixing can resolve overlaps, spreading fluorophores across different laser lines minimizes unmixing complexity.
- Antibody Titration:
- Perform a serial dilution of each antibody on the target cells.
- For each dilution, calculate the Stain Index:
(MFI_positive - MFI_negative) / (2 * SD_negative). - The optimal concentration is at the plateau of the highest Stain Index, ensuring saturation without excess background [12].
- Panel Validation:
- Run a fully stained sample alongside FMO controls for critical markers to establish correct gating boundaries.
System Workflow Diagrams
The diagrams below illustrate the fundamental differences in how the two technologies process light and data.
Diagram 1: Comparison of Instrument Workflows
The architectural divide between conventional and spectral flow cytometry presents researchers with a strategic choice. Conventional cytometers, with their filter-based PMT detection, are well-understood and highly effective for panels of up to ~20 parameters. Their limitations in spectral resolution and hardware complexity are real, but the direct, compensatable data is often sufficient for many applications.
Spectral cytometers, leveraging prism/grating dispersion and detector arrays, offer a paradigm shift toward higher multiplexing (40+ parameters) and powerful computational analysis. The ability to measure full emission spectra and deconvolute autofluorescence provides a new layer of information and sensitivity. However, this power comes with a heightened demand for rigorous controls, particularly concerning the stability and integrity of single-stain references, especially when using tandem dyes.
The optimal choice is not a matter of one technology being universally superior, but of matching the tool to the experimental question. For drug development professionals characterizing complex immune cell populations, the deep immunophenotyping capability of spectral cytometry can be transformative. For more routine cell analysis, a conventional cytometer may offer a more straightforward and cost-effective solution. In all cases, a rigorous approach to panel design, reagent validation, and control strategies remains the true foundation of reliable flow cytometry data.
In flow cytometry, the fundamental process of collecting and interpreting fluorescent light from labeled cells can be approached in two distinct ways. Conventional flow cytometry relies on the concept of a primary detector, where each fluorophore is assigned to a single, discrete channel. In contrast, spectral flow cytometry is built upon the concept of a spectral signature, where the identity of a fluorophore is determined by its unique, full-spectrum emission profile across an array of detectors [4] [19]. This distinction forms the core of their operational differences, influencing everything from instrument design and panel flexibility to data analysis workflows. Understanding these concepts is crucial for researchers designing experiments, particularly as the field moves toward higher-parameter panels.
The table below summarizes the core differences between these two data concepts.
| Feature | Primary Detector (Conventional Flow) | Spectral Signature (Spectral Flow) |
|---|---|---|
| Core Concept | One detector is designated as the "primary" measurer for one fluorophore [4]. | A fluorophore is identified by its unique emission pattern across all detectors [4] [19]. |
| Data Collected | Intensity of light within a narrow wavelength band (via bandpass filter) [20] [19]. | The full emission spectrum of the fluorophore across a wide range (e.g., ~350-900 nm) [19] [3]. |
| Detection System | Mirrors and optical filters (dichroic mirrors, bandpass filters) steer light to specific photomultiplier tubes (PMTs) [20] [21]. | A prism or diffraction grating disperses light across a dense array of detectors [3] [21] [22]. |
| Spillover Correction | Compensation: mathematically subtracts spillover signal from non-primary detectors [4] [21]. | Unmixing: uses a mathematical algorithm to deconvolve overlapping spectra based on reference signatures [4] [19] [23]. |
| Fluorophore Flexibility | Limited by the fixed optical filter configuration of the instrument [23]. | Limited only by the uniqueness of the fluorophore's full spectral signature [19] [23]. |
| Information Yield | Single data point (intensity) per fluorophore per cell [4]. | Multi-point vector (intensity across many wavelengths) per fluorophore per cell [4] [19]. |
The Primary Detector: A One-Channel System in Conventional Flow Cytometry
Operational Principle and Data Acquisition
In conventional flow cytometry, the optical path is designed to assign each fluorescent marker to a single, primary detector. When a fluorophore on a cell is excited by a laser, it emits light across a broad range of wavelengths. This emitted light is guided through a series of dichroic mirrors and bandpass filters [20]. A dichroic mirror reflects specific wavelengths while allowing others to pass through, effectively routing the light. The final bandpass filter in front of each detector allows only a narrow window of light (typically 20-50 nm wide) to reach the photomultiplier tube (PMT), which converts the light into an electrical signal [20] [3]. The detector paired with the bandpass filter that best matches the fluorophore's emission peak is designated its primary detector [4].
The Challenge of Spillover and Compensation
A significant challenge arises because the emission spectra of fluorophores are broad and often overlap. For example, the light from a FITC-labeled antibody will not only be detected by its primary detector but can also "spill over" into the PE detector's bandpass window [4]. To correct for this and ensure that the signal in the PE detector comes only from PE-labeled antibodies, a process called compensation is applied [4] [21]. Compensation uses single-stained control samples to calculate a spillover matrix, which then mathematically subtracts the interfering signal from all affected detectors during data analysis [4] [23]. A critical limitation is that the system only uses a small portion of the fluorophore's total emitted light, discarding potentially useful information that lies outside the defined bandpass filter [4].
The following diagram illustrates the optical pathway and data processing logic of a conventional flow cytometer.
The Spectral Signature: A Multi-Detector System in Spectral Flow Cytometry
Operational Principle and Data Acquisition
Spectral flow cytometry fundamentally rethinks the detection process. Instead of isolating narrow bands of light, it captures the entire emission spectrum for every fluorophore present on a cell [19] [3]. After a fluorophore is excited and emits light, the collected light is not immediately split with filters. Instead, it is passed through a prism or diffraction grating, which spreads the light into its constituent wavelengths, much like a rainbow [3] [22]. This dispersed light is then projected onto a dense array of detectors (e.g., 32-64 PMTs), with each detector measuring a specific, narrow segment of the full spectrum [4] [3]. The pattern of intensities across all these detectors for a single fluorophore constitutes its unique spectral signature [19].
The Power of Unmixing and Autofluorescence Extraction
In a multicolor experiment, the raw signal detected at the array is a composite, or sum, of the spectral signatures of all fluorophores present on the cell, plus the cell's inherent autofluorescence [4] [19]. To resolve the individual signals, the system uses a mathematical process called unmixing. This algorithm compares the composite spectrum to a library of reference spectra (acquired from single-stained controls) and calculates the contribution of each fluorophore that would best recreate the observed composite signal [4] [19] [23]. A powerful feature of this approach is autofluorescence extraction, where the natural autofluorescence of the cell is treated as its own "fluorophore" with a measurable signature. Its contribution can be identified and subtracted, significantly improving resolution, especially for dim markers [4] [19] [24].
The following diagram illustrates the optical pathway and data processing logic of a spectral flow cytometer.
Experimental Protocols for Control Samples
The definition of primary data directly dictates the type of controls required for a valid experiment. Below are the essential protocols for both technologies.
Single-Stained Controls for Conventional Flow Cytometry Compensation
Objective: To generate the data needed to calculate a compensation matrix that corrects for fluorescent spillover between detectors [4] [25].
- Sample Preparation: For each fluorophore in the panel, prepare a separate control sample.
- Recommended: Use cells (e.g., splenocytes, PBMCs) that express the target antigen or capture beads that bind the antibody [4].
- Critical: The control must produce a bright positive signal for the fluorophore being tested.
- Staining: Stain each control sample with a single antibody-fluorophore conjugate. Use the same antibody clone and fluorophore batch as in the full-panel experiment, especially for sensitive tandem dyes [4].
- Data Acquisition: Run each single-stained control on the cytometer using the same instrument settings (voltages, gains) as the fully stained experimental samples.
- Compensation Calculation: Using the cytometer's software, apply the compensation wizard to each control file. The software will use the positive signal from the single-stained control to calculate how much signal spills over into all other detectors. It then generates a spillover matrix that is applied to all experimental files [4] [23].
Single-Stained Reference Controls for Spectral Flow Cytometry Unmixing
Objective: To create a library of reference spectral signatures for every fluorophore used in the panel, which the unmixing algorithm requires to deconvolve the signal in fully stained samples [4] [19].
- Sample Preparation: The principle is identical to conventional controls: prepare one sample per fluorophore. However, the choice of substrate is more critical.
- Best Practice: It is strongly recommended to prepare reference controls using both beads and cells for a given fluorophore [4]. Beads provide a strong, consistent positive signal but can sometimes distort the fluorescent signature. Cells provide a more biologically relevant signature, including the context of autofluorescence.
- Staining: Identical to the conventional protocol. Stain each control with a single antibody-fluorophore conjugate from the same batch used in the full panel [4].
- Data Acquisition: Acquire each reference control using the same instrument settings as the experimental samples. It is critical to also include an unstained bead or cell sample to measure the background autofluorescence signature [4].
- Building the Reference Library: In the spectral analysis software, the spectrum from each single-stained control is saved as a reference file. The software uses these files to build a library that defines the unique spectral fingerprint of each fluorophore and the autofluorescence. This library is then used to "unmix" the composite signal from experimental samples [4] [19].
The Scientist's Toolkit: Essential Reagents and Materials
Successful execution of flow cytometry experiments, regardless of the platform, relies on a core set of validated reagents and materials.
| Item | Function & Importance |
|---|---|
| Monoclonal/Recombinant Antibodies | Preferred for high specificity and low cross-reactivity. Recombinant antibodies offer superior lot-to-lot consistency and lack an Fc region, reducing background from Fc receptor binding [25]. |
| Compensation Beads | Uniform particles that bind antibodies, providing a consistent and bright positive signal for generating single-stained controls, especially for rare markers [4]. |
| Cell Staining Buffer | A buffered salt solution (e.g., PBS) containing protein (e.g., BSA) to block non-specific antibody binding and maintain cell viability during staining [25]. |
| Viability Dye | A critical dye (e.g., fixable viability dyes) that labels dead cells, allowing for their exclusion during analysis to prevent non-specific antibody binding from skewing results [20] [25]. |
| Cell Dissociation Reagents | Enzymes (e.g., trypsin) or non-enzymatic solutions (e.g., containing EDTA) used to create a single-cell suspension from adherent cultures or solid tissues for analysis [25]. |
| Reference Spectral Library | (Spectral Specific) A pre-defined or user-generated collection of reference spectra for all fluorophores used on a specific instrument, which is the cornerstone of the unmixing process [19] [23]. |
The choice between a "primary detector" and a "spectral signature" is a choice between two fundamentally different philosophies of measuring light. The primary detector model is a direct, hardware-based approach that is well-established and highly effective for panels of low to moderate complexity. The spectral signature model is a comprehensive, software-driven approach that unlocks higher levels of multiplexing and improved resolution by treating fluorescence as a rich, information-dense signal rather than a series of discrete points. For researchers pushing the boundaries of immunophenotyping, oncology, and drug development, understanding this core distinction is the first step in designing more powerful, informative, and reliable experiments.
Practical Workflows: Implementing Controls from Setup to Acquisition
In both conventional and spectral flow cytometry, single-stain controls are indispensable for accurate data interpretation. These controls serve as the foundation for correcting fluorescence spillover, a fundamental challenge in multiparameter experiments. In conventional flow cytometry, single-stain controls provide the necessary data to calculate and subtract spillover between detectors through a process called compensation [26]. In spectral flow cytometry, these same controls are used to build a reference library of spectral signatures, which sophisticated unmixing algorithms then use to deconvolve the contributions of multiple fluorophores within a fully stained sample [26] [4].
The preparation of high-quality single-stain controls is therefore a critical step that directly impacts data quality. Whether using antibody-capture beads or cells as carriers, specific, non-negotiable requirements must be met to ensure these controls perform their intended function effectively in both systems.
Fundamental Principles and Comparison
Table 1: Core Functions of Single-Stain Controls in Conventional vs. Spectral Flow Cytometry
| Aspect | Conventional Flow Cytometry | Spectral Flow Cytometry |
|---|---|---|
| Primary Purpose | Calculate compensation matrices to subtract spillover [26] | Create reference spectral signatures for unmixing algorithms [26] [4] |
| Technical Process | Mathematical deduction of overlapping signal [26] | Principal component analysis and least squares unmixing [26] |
| Data Output | Compensation values for spillover correction | Full emission spectrum for each fluorophore |
| Control Requirements | Equally stringent for both systems | Equally stringent for both systems |
The Critical Rules for Single-Stain Control Preparation
Regardless of the cytometry platform or carrier type, three fundamental rules govern the preparation of valid single-stain controls [27]:
- Brightness Rule: The positive signal in the control must be at least as bright as, or brighter than, the experimental sample [28] [27]. This ensures accurate calculation of spillover or spectral unmixing, as dim controls can lead to under-compensation or erroneous unmixing [27].
- Background Matching Rule: The positive and negative populations within a single control must have identical autofluorescence [28] [27]. Using mismatched backgrounds (e.g., beads for positive and cells for negative) introduces significant errors [27].
- Fluorophore Matching Rule: The control must exactly match the fluorophore used in the experimental panel [27]. This is especially critical for tandem dyes (e.g., PE-Cy7), which can vary between lots and are prone to degradation [4] [27].
Experimental Protocols: Preparation of Single-Stain Controls
Protocol 1: Using Antibody-Capture Beads
Antibody-capture beads (ABCs) are synthetic beads that bind to antibodies, providing a consistent and robust positive signal [27].
- Step 1: Preparation. Use the same buffer system as for your experimental samples to maintain consistency [28].
- Step 2: Staining. Follow the manufacturer's instructions for the specific bead product. Typically, a small volume of beads is combined with a titrated amount of antibody [27]. The amount of antibody should be optimized to produce a bright signal that is on-scale for the detector [27].
- Step 3: Incubation. Incubate in the dark at room temperature for the recommended duration (usually 15-30 minutes).
- Step 4: Washing. Wash the beads to remove unbound antibody, then resuspend in an appropriate buffer for acquisition [28].
- Step 5: Acquisition. Acquire a sufficient number of events (at least 10,000 is recommended) [27]. The unstained beads from the same vial serve as the perfectly matched negative population [27].
Best Applications for Beads: Ideal for low-abundance antigens or when cell numbers are limited, as they provide a strong, consistent positive signal without consuming precious cells [27]. They are also useful for antibodies that do not have a clearly defined negative cell population.
Protocol 2: Using Cells
Using cells as carriers can more accurately reflect the experimental conditions, including cellular autofluorescence.
- Step 1: Cell Selection. The cells used must either express the target antigen (for the positive population) or not express it (for the negative population) [28]. Both populations must be of the same cell type and have undergone identical processing to ensure matched autofluorescence [28] [27].
- Step 2: Staining. Stain the cells using the same protocol as your experimental samples, including buffer, incubation time, temperature, and fixation (if used) [28] [27].
- Step 3: Processing. After staining, wash the cells and resuspend in acquisition buffer. Filtering through a nylon mesh is recommended to remove aggregates before acquisition [25] [29].
- Step 4: Acquisition. Collect a minimum of 30,000 to 50,000 events to ensure a robust measurement of the positive population [27].
Best Applications for Cells: Essential for intracellular stains, fluorescent proteins, viability dyes, or any non-antibody-based stain [27]. They are also preferred when the antibody-binding characteristics to beads may distort the fluorescent signature [4].
Data Presentation and Analysis
Table 2: Comparative Analysis of Beads vs. Cells as Single-Stain Carriers
| Characteristic | Antibody-Capture Beads | Cells |
|---|---|---|
| Signal Strength | Typically very high and consistent [27] | Variable, depends on antigen density [27] |
| Background Matching | Perfect (unstained beads from same lot) [27] | Must be carefully selected (e.g., negative cell population) [28] |
| Autofluorescence | Low and consistent, but different from cells [27] | Matches experimental sample's autofluorescence [4] |
| Best for | Abundant targets, saving experimental cells [27] | Rare antigens, intracellular stains, fluorescent proteins [27] |
| Cost & Convenience | Higher cost, very convenient | Lower cost, more laborious |
| Tandem Dye Stability | Can highlight lot-to-lot variability [4] | Reflects the actual staining condition in the experiment |
Workflow for Single-Stain Control Preparation
The following diagram illustrates the decision-making process and critical steps for preparing valid single-stain controls, integrating the three fundamental rules.
The Scientist's Toolkit: Essential Research Reagent Solutions
Table 3: Key Reagents and Materials for Single-Stain Control Experiments
| Reagent / Material | Function | Critical Considerations |
|---|---|---|
| Antibody-Capture Beads | Provide a consistent, high-signal carrier for antibodies [27] | Use the same lot for controls and experiment; can distort tandem dye signatures [4] |
| Titrated Antibody | Pre-optimized concentration for optimal signal-to-noise [28] [30] | Prevents non-specific binding (too high) and insufficient staining (too low) |
| Staining Buffer | Medium for antibody-cell incubation [28] | Must contain proteins (e.g., BSA) to block non-specific binding [28] [29] |
| Fc Receptor Blocking Reagent | Blocks non-specific antibody binding via Fc receptors [28] [31] | Critical for immune cells like monocytes and macrophages [28] [31] |
| Nylon Mesh Filter | Removes cell aggregates to prevent fluidics clogs [25] [29] | 30-50 micron mesh; essential for maintaining sample quality and instrument health [29] |
| Viability Dye | Distinguishes live from dead cells [31] [29] | Dead cells increase autofluorescence and non-specific binding [31] [29] |
The meticulous preparation of single-stain controls is a non-negotiable prerequisite for generating reliable, publication-quality data in both conventional and spectral flow cytometry. The fundamental requirements—matching brightness, background, and fluorophore identity—are universally applicable, though the underlying mathematics of compensation versus unmixing differ. By adhering to the detailed protocols for beads or cells and integrating the essential reagents from the scientist's toolkit, researchers can ensure their controls effectively serve their purpose. This rigorous approach lays the foundation for accurate multicolor panel resolution, enabling confident biological discovery and drug development.
The success of multiparameter flow cytometry experiments hinges on the strategic pairing of fluorophores with target antigens, a process guided by the fundamental principle of matching fluorophore brightness to antigen expression levels. This logical framework is critical for maximizing signal resolution and minimizing spillover, ensuring that dimly expressed markers remain detectable and brightly expressed ones do not overwhelm the detection system. Advances in both conventional and spectral flow cytometry have expanded the palette of available fluorophores, yet the core design logic remains essential for generating high-quality, reproducible data. Adherence to this logic directly enhances the sensitivity and specificity of assays used in immunology, oncology, and drug development, enabling more precise characterization of complex cell populations [32].
The strategic assignment is even more crucial for high-parameter panels, where the risk of spectral spillover increases. As panels expand beyond 30 colors, systematic planning that considers both the instrument's capabilities and the biological system's characteristics becomes indispensable [19] [33].
Fundamental Principles of Panel Design
Assessing Fluorophore Brightness
In flow cytometry, the perceived brightness of a fluorophore is not an intrinsic property but a function of its performance in a specific staining context. Two key metrics are used to quantify this brightness objectively:
Stain Index (SI): This is the preferred metric as it accounts for both the separation between positive and negative cell populations and the spread of the negative population. It is calculated as follows [32]:
SI = (Median FUpositive – Median FUnegative) / (2 × SDnegative)where FU is fluorescence intensity and SD is standard deviation.Signal-to-Noise Ratio (S/N): A simpler calculation,
S/N = MFIpositive / MFInegative, but it does not consider the spread of the negative population, which can be a critical factor in resolution [32].
The table below exemplifies how Stain Index varies across different fluorophore conjugates of the same antibody, providing a practical guide for brightness assessment [32]:
Table 1: Stain Index for Different Fluorophore Conjugates of an Anti-CD4 Antibody
| Brightness Category | Fluorophore Conjugate | Ex Max (nm) | Em Max (nm) | Stain Index |
|---|---|---|---|---|
| High | APC | 645 | 660 | 200.31 |
| High | PE | 496, 565 | 575 | 158.46 |
| Medium | PE-Cy7 | 496, 565 | 774 | 53.70 |
| Medium | Alexa Fluor 700 | 696 | 719 | 24.85 |
| Low | Pacific Blue | 410 | 455 | 14.61 |
| Low | Pacific Orange | 400 | 551 | 6.06 |
Evaluating Antigen Expression Density
Antigen expression on target cells can be broadly classified into three categories:
- Low-Density Antigens: Include cytokine receptors, certain activation markers (e.g., CD25), transcription factors, and weakly expressed checkpoint inhibitors (e.g., PD-1). These require the brightest available fluorophores for clear resolution from negative populations [32] [33].
- Medium-Density Antigens: Often encompass differentiation markers and some lineage markers. They pair effectively with mid-range brightness fluorophores.
- High-Density Antigens: Consist of many lineage markers (e.g., CD3, CD4, CD8, CD19) and abundant structural proteins. These can be successfully detected with dimmer fluorophores, conserving bright channels for more critical targets [32].
The following diagram illustrates the core decision-making workflow for assigning fluorophores to antigens:
Comparative Experimental Data: Conventional vs. Spectral Flow Cytometry
Instrument Configuration and Capabilities
The fundamental differences in optical design between conventional and spectral flow cytometers directly impact panel design logic and experimental outcomes.
Table 2: Conventional vs. Spectral Flow Cytometry Feature Comparison
| Feature | Conventional Flow Cytometry | Spectral Flow Cytometry |
|---|---|---|
| Detection Principle | Single detector per fluorophore; bandpass filters [19] | Multiple detectors per fluorophore; full spectrum capture [19] |
| Spillover Correction | Compensation [19] [33] | Spectral unmixing [19] [33] |
| Fluorophore Choice Basis | Limited by optical filter configuration [19] | Limited by uniqueness of spectral signature [19] |
| Autofluorescence Extraction | No [33] | Yes [19] [33] |
| Maximum Panel Size | ~28 colors [33] | 40+ colors [19] [3] |
| Resolution of Similar Fluorophores | No [33] | Yes [33] |
Experimental Protocol for Panel Validation
A rigorous, standardized protocol is essential for validating any multicolor panel, regardless of the platform.
- Step 1: Antibody Titration: Titrate each antibody conjugate individually to determine the concentration that provides optimal Stain Index. Use the same cell type or a closely related cell line as the final experiment [32].
- Step 2: Single-Stained Control Preparation: Prepare single-stained controls for every fluorophore in the panel. Use compensation beads or cells with known antigen expression. For spectral cytometry, these controls establish the reference spectral signature for unmixing and can often be reused after initial validation [34].
- Step 3: Full Panel Staining: Stain samples with the complete antibody panel. Include a viability dye (e.g., LIVE/DEAD Fixable stains) to exclude dead cells and debris [32].
- Step 4: Data Acquisition and Unmixing/Compensation: Acquire data on the cytometer. For conventional cytometry, apply compensation using the single-stained controls. For spectral cytometry, perform unmixing using the reference signatures [19] [34].
- Step 5: Resolution Assessment: Check the resolution of positive and negative populations for every marker. A clear separation, indicated by a high Stain Index, confirms a successful assignment [32].
Successful panel design relies on a suite of specialized reagents and digital tools.
Table 3: Essential Research Reagent Solutions for Flow Cytometry
| Tool/Reagent | Function | Example Products/Platforms |
|---|---|---|
| Bright Fluorophores | Detect low-abundance antigens; high Stain Index. | APC, PE, Brilliant Violet dyes [32] [35] |
| Mid-Range Fluorophores | Detect medium-abundance antigens. | PE-Cy7, Alexa Fluor 700, BD Horizon RealYellow [32] [35] |
| Dim Fluorophores | Detect high-abundance antigens; conserve bright channels. | Pacific Blue, Pacific Orange [32] |
| Cell Viability Dyes | Exclude dead cells from analysis, improving data accuracy. | LIVE/DEAD Fixable Stains [32] |
| Reference Control Beads | Generate consistent single-stain controls for compensation and unmixing. | Posibeads [35] |
| Spectral Unmixing Software | Analyze full-spectrum data, separate fluorophore signals, and extract autofluorescence. | SpectroFlo (Sony), CytExpert Spectral (Beckman Coulter), FlowJo [3] [35] [33] |
| Online Panel Design Tools | Visualize spectral overlap, check instrument compatibility, and build panels. | FluoroFinder, Molecular Probes Fluorescence SpectraViewer, BD Spectrum Viewer [32] [35] [33] |
Advanced Applications and Future Directions
The logical framework for fluorophore assignment is being pushed to new limits with the advent of ultra high-parameter panels and novel reagents. Researchers have successfully developed panels exceeding 40 colors for deep immunophenotyping of human immune cells in blood and tissues [33]. These panels meticulously assign fluorophores based on expression levels to dissect complex populations, such as T cell and dendritic cell subsets, with unprecedented detail. Furthermore, new dye technologies continue to emerge, providing brighter and more photostable options. Recent launches include BD Horizon RealYellow 743, a bright dye with reduced monocyte background, and Bio-Rad's StarBright dyes, which now encompass over 32 different colors, offering greater flexibility in panel construction [35].
The field is also moving towards standardized, dried antibody panels to improve reproducibility. For instance, BD Horizon Chroma Dried Panels can include up to 30 conjugates, minimizing pipetting errors and variability in high-volume testing across multiple sites [35]. These advancements, combined with the core logic of matching fluorophore brightness to antigen density, are empowering drug development professionals and researchers to generate more robust and insightful data from their flow cytometry experiments.
The Role of Unstained and FMO Controls in Conventional and Spectral Panel Validation
Flow cytometry, a cornerstone of single-cell analysis, relies heavily on appropriate controls to ensure data accuracy and interpretability. As the technology has evolved from conventional to spectral flow cytometry, the fundamental importance of unstained and Fluorescence Minus One (FMO) controls remains, while their specific applications and implementation details have undergone significant refinement. In conventional flow cytometry, these controls are primarily used for compensation and gate setting, whereas in spectral flow cytometry, they play an expanded role in spectral unmixing and autofluorescence extraction [3] [36]. This guide provides a detailed comparison of how these essential controls are utilized across both platforms, empowering researchers to make informed decisions based on their experimental needs and technological capabilities.
The validation of multicolor panels presents distinct challenges in both conventional and spectral systems. With conventional cytometry, increasing panel complexity exacerbates spectral spillover and compensation challenges [12]. Spectral cytometry, while offering enhanced multiplexing capabilities, introduces new considerations for control quality and autofluorescence management [37]. Within this context, unstained and FMO controls serve as non-negotiable elements of rigorous experimental design, providing the foundation for accurate population identification and resolution, particularly for dimly expressed antigens or complex immunophenotyping panels [28] [12].
Fundamental Principles: Conventional versus Spectral Flow Cytometry
Conventional flow cytometry operates on a "one detector–one fluorophore" principle, using optical filters (dichroic mirrors and bandpass filters) to separate and direct light emitted by fluorophores to appropriate detectors [3]. Each detector, typically a photomultiplier tube (PMT), is tuned to a narrow band of wavelengths approximating the emission peak of known fluorophores [3]. This approach necessitates compensation to correct for fluorescent signals from near or similar fluorochromes [3].
Spectral flow cytometry represents a paradigm shift, reading the full fluorescence spectrum of fluorophores and subsequently applying computational spectral separation [3]. Instead of using optical filters to separate signals, spectral cytometers use a prism or diffraction grating to scatter emitted light, which is then captured by an array of highly sensitive detectors [3]. This fundamental difference in detection methodology enables the resolution of many more parameters simultaneously and provides enhanced capabilities for detecting low-abundance markers [36].
Impact on Control Requirements
The technological differences between platforms directly influence control requirements. Conventional cytometry relies heavily on single-stain controls for compensation calculations, where spillover values between detectors are mathematically subtracted [12]. Spectral cytometry utilizes single-stain controls to build a reference spectral library for unmixing algorithms, which determine the contribution of each fluorophore to the total collected emission signal [37]. This distinction means that while both platforms require similar controls, their applications and the consequences of improper control preparation differ significantly.
Table 1: Key Technological Differences Between Conventional and Spectral Flow Cytometry
| Feature | Conventional Flow Cytometry | Spectral Flow Cytometry |
|---|---|---|
| Detection Principle | One detector per fluorophore; measures peak emission [3] | Full spectrum detection across multiple wavelengths [3] |
| Signal Separation | Optical filters (dichroic mirrors, bandpass filters) [3] | Computational unmixing of full spectral signatures [37] |
| Typical Detectors | Photomultiplier tubes (PMTs) [3] | PMT or avalanche photodiode (APD) arrays [3] |
| Maximum Parameters | Typically 10-20 colors [3] | 40+ colors [3] [36] |
| Primary Control Function | Compensation calculation [12] | Spectral library creation and unmixing [37] |
Unstained Controls: Applications Across Platforms
Core Functions and Shared Principles
Unstained controls – samples of cells processed identically to experimental samples but without the addition of fluorescent reagents – serve essential functions in both conventional and spectral flow cytometry. They provide the baseline measurement of cellular autofluorescence, which occurs when intracellular metabolic compounds emit fluorescence in response to laser excitation [12]. Autofluorescence differs in spectral range and intensity between cell types and is altered when cells age, are treated, activated, or fixed [28]. Proper characterization of autofluorescence is crucial for distinguishing true positive signals from background, particularly for dim antigens [12].
In both platforms, unstained controls are used for setting up forward and side scatter parameters and establishing detector voltages [28] [37]. The guidance for detector sensitivity has evolved, with current best practices recommending that "detector sensitivity should be increased rather than decreased while keeping the brightest fluorochrome within the linear range of detection" [12]. This approach ensures optimal separation between autofluorescence and detector noise while maintaining the dynamic range needed for bright markers.
Platform-Specific Applications
In conventional flow cytometry, unstained controls primarily establish background fluorescence levels for each detector and help visualize the effects of compensation on negative populations [12]. The autofluorescence profile is typically subtracted indirectly through the compensation process.
In spectral flow cytometry, unstained controls take on an additional, critical role in autofluorescence extraction. Spectral unmixing algorithms can isolate and extract the spectral contribution of autofluorescence from the rest of the spectral signatures, significantly improving signal resolution [28] [36]. As shown in Figure 1, this process allows for enhanced separation of positive and negative populations, particularly for fluorochromes whose emission spectra overlap with endogenous cellular fluorescence [37].
Figure 1: Applications of unstained controls in conventional versus spectral flow cytometry. While both platforms use unstained controls to establish background signals, spectral cytometry leverages them for computational autofluorescence extraction.
Experimental Protocol for Unstained Control Preparation
Sample Selection: Use the same cell type and treatment condition as experimental samples, as autofluorescence differs between cell types and is altered by treatment, activation, or fixation [28].
Processing: Process unstained controls in parallel with stained samples, using identical protocols for fixation, washing, and storage [28].
Acquisition: Run unstained controls with the same instrument settings as experimental samples. For spectral cytometers, acquire sufficient events to characterize autofluorescence variability [37].
Application: In conventional cytometry, use unstained controls to set compensation and establish negative populations. In spectral cytometry, incorporate them into the spectral unmixing algorithm as a reference for autofluorescence extraction [37].
FMO Controls: Gate Setting in Complex Panels
Definition and Universal Importance
Fluorescence Minus One (FMO) controls consist of samples stained with all fluorescent reagents in a panel except one [28]. These controls are particularly valuable in multicolor panels where fluorescent spillover and the inherent error in signal measurement contribute to spreading, making it challenging to distinguish true positive signals from background, especially for proteins with continuous expression patterns [28].
The fundamental value of FMO controls transcends technological platforms. As emphasized in current guidelines, "FMO controls are superior to unstained cells and single stain controls since they consider the influence of all the other fluorophores used in the experiment that contribute to spreading" [28]. This makes them indispensable for establishing accurate gate boundaries, particularly for low-abundance antigens or continuous expression patterns where clear separation between positive and negative populations is challenging.
Platform-Specific Considerations
In conventional flow cytometry, FMO controls are primarily used to account for spillover spreading error – the increased variance in negative populations caused by compensation mathematics [12]. This spreading can cause negative populations to appear dimly positive, particularly in channels affected by bright fluorophores in other detectors. FMO controls help distinguish true signal from this spreading, enabling proper gate placement [28] [12].
In spectral flow cytometry, spreading error remains a consideration despite different mathematical processing. Fluorophores with highly similar spectral signatures can still affect population resolution when combined [37]. FMO controls in spectral cytometry help identify when spectral overlap is affecting population resolution and guide optimization of fluorophore combinations [37].
Table 2: Applications of FMO Controls in Conventional versus Spectral Flow Cytometry
| Application | Conventional Flow Cytometry | Spectral Flow Cytometry |
|---|---|---|
| Primary Purpose | Account for spillover spreading error after compensation [12] | Evaluate effects of spectral overlap on population resolution [37] |
| Critical For | Dim antigens, continuous expression patterns [28] | Panels with fluorophores of high spectral similarity [37] |
| Gate Setting | Establish boundary between true positive and spread signal [28] | Verify unmixing accuracy for specific channels [37] |
| Troubleshooting | Identify excessive spillover requiring panel redesign [12] | Detect fluorophore combinations needing optimization [37] |
| Variants | Standard FMO (minus one fluorophore) [28] | FMx (minus multiple fluorophores) for complex panels [28] |
Experimental Protocol for FMO Control Implementation
Panel Planning: Identify critical markers requiring FMO controls, prioritizing dim antigens, continuously expressed markers, and populations where precise quantification is essential [28].
Control Preparation: For each FMO control, prepare samples containing all antibodies in the panel except the one being tested. Maintain identical cell numbers, staining volumes, and incubation conditions as fully stained samples [28].
Acquisition: Run FMO controls alongside fully stained samples using identical instrument settings. For large panels, consider which FMO controls are most essential to manage resource constraints [28].
Analysis: Use FMO controls to set gates for the omitted fluorophore. The boundary for positive expression should be determined by the spread observed in the FMO control, not in the unstained sample [28].
Figure 2: Experimental workflow for FMO control implementation across flow cytometry platforms. While the preparation is identical, analysis approaches differ between conventional and spectral systems.
Essential Research Reagent Solutions
Successful implementation of unstained and FMO controls requires specific reagents and materials. The following table details essential solutions for rigorous control experiments.
Table 3: Essential Research Reagent Solutions for Control Experiments
| Reagent/Material | Function | Application Notes |
|---|---|---|
| Viability Dyes | Distinguish live/dead cells; dead cells increase background and nonspecific binding [37] | Titrate for optimal concentration; use before antibody staining [28] |
| Fc Receptor Block | Reduce nonspecific antibody binding via Fc receptors [28] | Particularly important for immune cells; superior to isotype controls [12] |
| Antibody-Capture Beads | Generate single-stain controls for spectral library creation [28] | Ensure positive and negative populations have identical autofluorescence [28] |
| Cell Isolation Kits | Obtain pure populations for control preparation [25] | Magnetic separation or sorting for homogeneous samples [25] |
| Compensation Beads | Generate consistent single-stain controls for conventional cytometry [28] | Provide uniform population without cellular autofluorescence [28] |
| DNAse Enzymes | Prevent cell clumping during processing [25] | Particularly important for tissue-derived samples [25] |
| Cryopreservation Media | Store control cells for longitudinal studies [25] | Maintain consistent autofluorescence profiles over time [36] |
Advanced Applications and Future Directions
The application of unstained and FMO controls continues to evolve with technological advancements. In clinical diagnostics, particularly for minimal residual disease (MRD) detection, these controls enable the high sensitivity required for detecting rare cell populations at frequencies as low as 0.001% [36] [38]. The implementation of simplified MRD assays in resource-constrained settings demonstrates that rigorous control strategies can be adapted to various operational environments without sacrificing data quality [38].
Emerging spectral cytometry applications leverage unstained controls for automated autofluorescence extraction, significantly enhancing resolution of dim populations [36] [37]. Future developments likely include improved algorithms for background subtraction and standardized approaches for control implementation across platforms and laboratories. As machine learning approaches become more integrated into flow cytometry数据分析 [39], the role of high-quality controls as training references will only increase in importance.
Unstained and FMO controls remain indispensable tools for rigorous flow cytometry panel validation across both conventional and spectral platforms. While their core functions – establishing background signals and enabling accurate gate placement – remain consistent, their implementation and relative importance vary between technologies. Conventional flow cytometry relies heavily on FMO controls to address spillover spreading, while spectral flow cytometry leverages unstained controls for enhanced autofluorescence extraction. Understanding these distinctions enables researchers to optimize their control strategies based on their technological platform and experimental objectives, ensuring the generation of robust, reproducible data in an era of increasingly complex multicolor panels.
Autofluorescence (AF) presents a significant obstacle in flow cytometry, contributing substantially to background noise and potentially obscuring dimly positive populations [40]. This intrinsic background stems from naturally occurring fluorescent molecules within cells. Key metabolic components like Nicotinamide Adenine Dinucleotide (NADH) and Flavin Adenine Dinucleotide (FAD)—fundamental units of oxidative phosphorylation—are primary contributors to AF in mammalian cells [41]. These molecules have distinct spectral properties, with NADH exhibiting excitation in the near-UV range and a single emission peak, while FAD can be excited by NUV, 405nm, and 488nm lasers [41].
The interference from AF is particularly impactful when detecting low-abundance antigens or using dim fluorochromes [42]. In conventional flow cytometry, correcting for this background is challenging and often inadequate. Spectral flow cytometry, however, introduces a sophisticated solution by leveraging its full-spectrum detection capabilities to characterize and extract AF signatures, thereby significantly enhancing signal resolution and analytical precision [36] [24]. This capability is transforming data quality in applications from immunophenotyping to minimal residual disease detection.
Fundamental Differences in AF Handling: Conventional vs. Spectral Flow Cytometry
The approach to managing autofluorescence highlights a fundamental technological divergence between conventional and spectral flow cytometry. The table below compares their core methodologies:
Table 1: Fundamental Comparison of Conventional and Spectral Flow Cytometry for Autofluorescence Management
| Feature | Conventional Flow Cytometry | Spectral Flow Cytometry |
|---|---|---|
| Primary AF Method | Post-acquisition mathematical subtraction [40] | Real-time spectral unmixing and extraction [36] [42] |
| Data Collection | Narrow bandpass filters measuring peak emissions [43] | Full emission spectrum capture across multiple detectors [3] [42] |
| Underlying Process | Compensation for spillover [43] | Algorithmic "unmixing" of composite signals [44] [43] |
| AF Specificity | Treats AF as a uniform background [40] | Can discriminate specific AF signatures (e.g., from NADH, FAD) [41] |
| Impact on Resolution | Can increase spread in negative populations [36] | Enhances resolution by removing background, improving signal-to-noise [36] [42] |
The Post-Acquisition Approach of Conventional Flow Cytometry
Conventional flow cytometry relies on post-processing techniques to estimate and subtract AF. Methods like the "Zero Fluorescence Assumption" in FlowJo software treat AF as an additional parameter during compensation, using an unstained control to represent the AF signal [40]. This approach assumes the signal in the unstained control is entirely attributable to AF and mathematically deducts this averaged background. However, this method produces an estimate of the average AF across all cells in the gated population, which can lead to over-subtraction or under-subtraction in heterogeneous samples [40].
The Integrated Unmixing Approach of Spectral Flow Cytometry
Spectral flow cytometry integrates AF extraction directly into its core analytical process. Instead of using filters to isolate narrow emission bands, spectral cytometers capture the entire emission spectrum for each cell using a series of highly sensitive detectors [3] [42]. Sophisticated unmixing algorithms then deconvolute the composite signal into its individual components, including the distinct spectral "fingerprints" of specific fluorophores and the characteristic signatures of autofluorescence [36] [24]. This process allows the endogenous AF signal to be identified and extracted into a separate channel during analysis, effectively purifying the specific antibody-associated fluorescence signals [42] [45].
Experimental Data: Quantifying the Impact of Autofluorescence Extraction
The implementation of AF extraction in spectral flow cytometry provides measurable improvements in assay performance, particularly in clinical and preclinical applications requiring high sensitivity.
Table 2: Impact of Autofluorescence Extraction on Assay Performance in Key Applications
| Application Context | Panel Size | Key Finding | Impact of AF Extraction |
|---|---|---|---|
| MRD Detection in AML [36] | 24-color | Achieved sensitivity below 0.02% | Improved resolution of leukemic blast maturation states. |
| MRD Detection in B-ALL [36] | 23-color | Enabled detection of CD19-negative clones post-therapy. | Enhanced detection of dim antigens and separation of leukemic phenotypes. |
| CAR-T Cell Monitoring [36] [42] | 37-color | Identified PD-1+ CD8+ CAR-T subsets correlated with complete response. | Improved resolution of low-abundance exhaustion markers on T cells. |
| Immune Profiling [36] | >35 parameters | Feasible analysis of archived/cryopreserved specimens. | Minimized background noise in historically challenging samples. |
Empirical evidence confirms that AF extraction significantly enhances the resolution of dimly expressed markers. As noted in a 2025 review, "Extraction of AF enhances cell characterization and minimizes background noise in comparison to CFC, and together with the integration of more sensitive detectors... has significantly enhanced the resolution of cell populations in multiparametric assays" [36]. This is crucial for detecting rare cell populations or identifying subtle phenotypic shifts, such as those associated with T-cell exhaustion in cancer immunotherapy [36].
Methodologies: Protocols for Autofluorescence Extraction
Successful AF extraction relies on robust experimental protocols. The following section details the core workflow and specific methods for defining the AF signature.
Core Workflow for Spectral Flow Cytometry with AF Extraction
The following diagram illustrates the generalized workflow for a spectral flow experiment incorporating autofluorescence extraction:
Detailed Methods for Defining the AF Signature
Researchers can employ several specific techniques to define the AF signature for extraction, each with distinct advantages and limitations [45]:
Method 1: FSC/SSC Gating: This is often the default method on many instruments. The user draws a gate around the target population (e.g., lymphocytes) on the unstained sample using Forward and Side Scatter. The software then calculates the median fluorescence intensity (MFI) for each detector within this gate to create an average AF signature.
- Best For: Homogeneous populations like human PBMCs or lymphocytes.
- Limitations: Low accuracy for heterogeneous tissues, as it applies an average signature to all cells [45].
Method 2: Treating AF as a Fluorophore: The user creates a new "fluorophore" in the spectral library representing a specific AF signature (e.g., "Macrophage AF"). This is added to the panel, and the unstained sample is used to define its spectrum by gating on positive and negative populations in a fluorescent channel where the AF is bright.
- Best For: Isolating intense, reproducible AF from specific cell types like tissue macrophages.
- Advantage: Allows visualization of the AF spectrum for informed panel design [45].
Method 3: AF Explorer Tools: Advanced software tools (e.g., in Cytek Aurora or Sony ID7000) allow users to gate multiple cell populations within an unstained sample based on scatter and fluorescence, extracting a unique AF signature from each.
- Best For: Complex tissues containing multiple cell types with different AF levels (e.g., lung, skin).
- Caution: Requires careful gating to avoid unmixing errors [45].
The Scientist's Toolkit: Essential Reagents and Controls
The following reagents and controls are essential for robust autofluorescence extraction and spectral flow cytometry experiments:
Table 3: Essential Research Reagents and Controls for Spectral Flow with AF Extraction
| Item | Function | Critical Consideration |
|---|---|---|
| Unstained Cells [45] [40] | Serves as the control for defining the autofluorescence signature. | Must be from the same tissue/organism as the test sample. Viability should be high. |
| Single-Stain Controls [46] | Used to create the spectral library for unmixing each fluorophore. | Should be performed on cells (not beads) for most accurate AF-inclusive unmixing. |
| Viability Dye | Excludes dead cells, which often have heightened, variable autofluorescence. | Choose a dye compatible with your laser lines and outside your panel's emission range. |
| Spectral Flow Cytometer | Instrument capable of full-spectrum capture. | Examples: Cytek Aurora, Sony ID7000, Thermo Fisher Attune Xenith [3] [44]. |
| Spectral Unmixing Software | Performs the algorithm-based separation of signals, including AF extraction. | Examples: SpectroFlo (Cytek), FlowJo (with AutoSpill), instrument-native software [45] [40]. |
Autofluorescence extraction represents a paradigm shift in flow cytometry, moving from compensatory subtraction to integrated signal unmixing. This unique spectral capability directly addresses a fundamental source of background noise, enabling researchers and drug developers to achieve unprecedented resolution in high-parameter assays. As the technology continues to evolve, the ability to not only remove but also to biologically interpret specific autofluorescence signatures opens new frontiers in cellular analysis, particularly for metabolic studies and complex disease characterization [41]. For scientists pursuing sensitive detection of rare cell populations or subtle phenotypic changes, leveraging the full potential of spectral AF extraction is no longer an advantage—it is a necessity.
The evolution from conventional to spectral flow cytometry represents a significant technological shift, guided by the need for deeper and more precise cellular characterization. While conventional flow cytometry (CFC) is limited to measuring only the peak emission of each fluorochrome, spectral flow cytometry (SFC) captures the entire fluorescence emission spectrum for each fluorochrome across multiple laser lines. This fundamental difference demands distinct software approaches for data resolution: compensation wizards for conventional systems and spectral unmixing interfaces for spectral platforms. For researchers, scientists, and drug development professionals, understanding these software capabilities is crucial for experimental design, data accuracy, and ultimately, biological discovery [24].
Core Principles: Compensation Versus Unmixing
Conventional Flow Cytometry and Compensation
In conventional flow cytometry, the optical system uses dichroic mirrors and bandpass filters to direct narrow bands of light to specific detectors, approximating a "one detector–one fluorophore" approach. However, fluorochromes with overlapping emission spectra create spillover fluorescence that must be mathematically corrected through a process called compensation. Compensation wizards in software such as FlowJo and FACSDiva use single-stained controls to calculate a spillover matrix that subtracts interfering signals from each detector [3] [23].
Spectral Flow Cytometry and Unmixing
Spectral flow cytometers collect the entire emission spectrum of each fluorophore over a wide range of wavelengths using a prism or diffraction grating, scattering the emitted light across an array of highly sensitive detectors. The software then uses linear unmixing algorithms to deconvolute the combined signal into its individual fluorophore components based on their unique spectral signatures. This process not only separates fluorophore signals but can also characterize and extract autofluorescence, enhancing signal resolution [3] [24].
Table 1: Fundamental Differences Between Conventional Compensation and Spectral Unmixing
| Feature | Conventional Compensation | Spectral Unmixing |
|---|---|---|
| Detector System | Bandpass filters & dichroic mirrors [3] | Prism or diffraction grating [3] |
| Detector-to-Fluorophore Ratio | ~1:1 [23] | More detectors than fluorochromes (e.g., 48 detectors for <40 colors) [3] [23] |
| Core Mathematical Process | Spillover matrix subtraction [23] | Linear unmixing of full spectra [24] |
| Autofluorescence Handling | Manually gated or ignored [23] | Automated extraction using reference profiles [24] [23] |
| Maximum Panel Size | ~28 colors [23] | 40+ colors [24] [23] |
| Resolution of Similar Fluorochromes | Limited [23] | Enhanced [23] |
Software Workflows: A Comparative Analysis
Workflow in Conventional Flow Cytometry Software
The standard workflow in conventional software centers on the compensation wizard.
- Control Preparation: Researchers prepare and acquire data from single-stained controls and an unstained control.
- Matrix Calculation: The software analyzes each control to generate a compensation matrix quantifying spillover.
- Application & Verification: The matrix is applied to the experimental data, and users must visually verify compensation accuracy using bi-exponential scaling plots, often a manual and subjective process.
Recent software updates have introduced advancements like AutoSpill (implemented in FlowJo v10 in June 2020), which performs regression across single-stained controls to achieve more accurate compensation without positive and negative gating [47].
Workflow in Spectral Flow Cytometry Software
Spectral software workflows, such as those in BD's SpectroFlo or Cytek's Aurora systems, are built around the unmixing algorithm.
- Spectral Library Building: A reference library is created from single-stained controls, capturing the full spectral signature of each fluorophore.
- Autofluorescence Extraction (Optional): An unstained control can be used to define and subtract the sample's autofluorescence signature [24] [23].
- Unmixing & Quality Control: The software unmixes experimental data using the library. Quality control metrics, such as the Similarity Index (a cosine similarity score), help evaluate panel design choices post-acquisition [47] [23].
Experimental Data and Performance Comparison
Quantitative Comparison of Data Output
The following table summarizes key performance metrics derived from experimental data published for both technologies.
Table 2: Experimental Performance Metrics for Conventional vs. Spectral Flow Cytometry
| Performance Metric | Conventional Flow Cytometry | Spectral Flow Cytometry | Experimental Context |
|---|---|---|---|
| Typical Panel Size | ~10-20 parameters [3] | 30-40+ parameters [3] [24] | Standard immunophenotyping panels |
| MRD Detection Sensitivity | Varies; generally lower due to panel splitting | <0.02% in AML [24]; <0.001% in B-ALL with 23-24 color panels [24] | Single-tube, high-parameter MRD assays |
| Impact of Autofluorescence | Can obscure dim populations [24] | Improved resolution via extraction; may increase spread in negative populations [24] | Analysis of low-abundance markers |
| Signal Resolution | Limited by filter configuration and spillover spreading [3] | Enhanced resolution of similar fluorochromes (e.g., FITC vs. BY-2) [23] | Panel design with spectrally similar dyes |
Case Study: Minimal Residual Disease (MRD) Detection
MRD detection in hematologic malignancies like Acute Myeloid Leukemia (AML) and B-cell Acute Lymphoblastic Leukemia (B-ALL) demonstrates the clinical impact of these technologies.
- Spectral Protocol: Chen et al. (2023) validated a 24-color SFC panel for AML-MRD, achieving a sensitivity below 0.02% in a single tube. This comprehensive panel allowed for simultaneous assessment of lineage markers and disease-specific phenotypes, preserving marker correlation and improving the resolution of maturation states [24].
- Conventional Limitation: A similar analysis using CFC would require splitting markers across multiple tubes (e.g., 2-3 tubes of 10 colors each), leading to increased sample consumption and potential loss of correlated marker expression on rare cell populations, ultimately reducing effective sensitivity and reliability [24].
Essential Research Reagent Solutions
The successful implementation of either technology relies on carefully selected reagents. The table below details key materials for a high-parameter spectral experiment.
Table 3: Key Research Reagent Solutions for High-Parameter Flow Cytometry
| Reagent / Material | Function | Spectral-Specific Considerations |
|---|---|---|
| Fluorophore-Conjugated Antibodies | Tagging target cellular proteins for detection | BD Horizon RealYellow/RealBlue reagents with reduced cross-laser excitation are optimal [48] [23]. |
| Single-Stained Controls | Building the spectral library or compensation matrix | Essential for both; must be prepared with the same lot of reagents as the panel [23]. |
| Viability Dye | Excluding dead cells from analysis | Viability dyes like Zombie NIR are preferred for minimal spectral overlap [3]. |
| Cell Staining Buffer | Providing medium for antibody-cell interaction | Should contain proteins to block non-specific binding. |
| Autofluorescence Control (Unstained Cells) | Defining innate cellular fluorescence | Critical in SFC for autofluorescence extraction algorithms [24] [23]. |
| Standardized Beads | Instrument performance tracking and calibration | Used for daily quality control to ensure laser and detector stability. |
Visualizing the Experimental Workflows
The diagrams below illustrate the core workflows for data resolution in both conventional and spectral flow cytometry.
Conventional Flow Cytometry Workflow
Spectral Flow Cytometry Workflow
The choice between conventional and spectral flow cytometry, and their respective software interfaces, hinges on the specific research requirements. Conventional flow cytometry with compensation wizards remains a robust and accessible tool for many applications, particularly those requiring lower-parameter analysis (under 20 colors) where budget and operational simplicity are primary concerns.
However, for research and drug development demanding high-dimensionality, superior resolution, and maximal data from limited samples, spectral flow cytometry with spectral unmixing interfaces offers a clear advantage. Its ability to automate autofluorescence extraction, resolve highly similar fluorochromes, and run 40+ color panels in a single tube is transforming clinical diagnostics, immunotherapy monitoring, and biomarker discovery [24]. As software continues to evolve with integrated AI and cloud-based analytics, the power of both conventional and spectral technologies will only increase, further empowering scientists to unlock complex biological secrets [49].
Solving Common Challenges and Optimizing Panel Performance
Addressing High Spreading Error and Poor Resolution in Conventional Polychromatic Panels
In the pursuit of comprehensive cellular analysis, flow cytometry researchers increasingly rely on polychromatic panels to extract maximum information from precious samples. However, conventional flow cytometry (CFC) faces fundamental limitations when panel complexity escalates. The core challenge lies in its optical detection system, which employs dichroic mirrors and bandpass filters to direct specific wavelength ranges to individual detectors, approximating a "one detector–one fluorophore" approach [3]. This system becomes problematic when measuring multiple fluorophores with broad, overlapping emission spectra, leading to two critical issues: high spreading error and poor resolution [36] [50].
Spreading error occurs when fluorescence signal from one fluorophore "spills over" into detectors assigned to other fluorophores [4]. In conventional cytometry, this is corrected through compensation, a mathematical subtraction process that becomes increasingly complex and error-prone as panel size grows [50]. These errors directly impact resolution—the ability to distinguish dim positive signals from negative populations—which is particularly detrimental when analyzing low-abundance antigens or rare cell populations [42]. This technical comparison guide examines how spectral flow cytometry addresses these limitations through fundamental technological redesign, providing researchers with objective data to inform their technology selection.
Fundamental Technological Differences: Detection Philosophy
The distinction between conventional and spectral flow cytometry begins with their fundamental approach to fluorescence detection, which directly impacts their susceptibility to spreading error and resolution limitations.
Conventional Flow Cytometry: Filter-Based Detection
Conventional flow cytometers employ a system of optical filters and mirrors to isolate specific wavelength bands corresponding to peak emissions of fluorophores [3]. Each fluorophore is primarily assigned to a single detector, with its emission captured within a narrow bandwidth (typically 20-50 nm) [3]. When fluorophore emissions extend beyond their primary detection channel—as naturally occurs due to broad emission spectra—this spillover must be mathematically corrected through compensation procedures [4] [50]. This compensation process becomes increasingly complex with panel expansion, often exacerbating spreading error and diminishing resolution for dim markers [36].
Spectral Flow Cytometry: Full-Spectrum Acquisition
Spectral flow cytometry fundamentally reimagines this approach by capturing the entire emission spectrum of each fluorophore across multiple detectors [36] [42]. Instead of isolating narrow bands, spectral cytometers use dispersive optics (prisms or diffraction gratings) to scatter emitted light across an array of highly sensitive detectors [3] [5]. This creates a unique spectral signature for each fluorophore, which software then deconvolutes using linear unmixing algorithms [36] [4]. The complete spectral profile enables superior discrimination between fluorophores with similar peak emissions but distinct spectral shapes, significantly reducing spillover-related artifacts [42].
Table 1: Fundamental Detection System Comparison
| Feature | Conventional Flow Cytometry | Spectral Flow Cytometry |
|---|---|---|
| Detection Principle | Filter-based isolation of peak emissions | Full-spectrum capture of entire emission profile |
| Signal Processing | Compensation (spillover subtraction) | Spectral unmixing (algorithmic separation) |
| Typical Detectors | 10-20 photomultiplier tubes (PMTs) | 32-88 detector arrays [3] [51] |
| Spectral Resolution | Limited to filter bandwidths | High resolution (multiple data points across spectrum) |
| Information Utilized | Narrow band around emission peak | Complete spectral signature |
Figure 1: Detection Philosophy and Signal Processing Pathways - Conventional cytometry relies on physical filtration and mathematical compensation, while spectral cytometry utilizes full-spectrum capture and algorithmic unmixing.
Quantitative Performance Comparison: Resolution and Error Metrics
Direct comparisons between conventional and spectral flow cytometry demonstrate measurable advantages in resolution and error reduction for spectral technology, particularly as panel complexity increases.
Spreading Error and Population Resolution
Spreading error directly impacts the coefficient of variation (CV) and signal-to-noise ratio of detected populations. In conventional cytometry, spreading error increases non-linearly with panel complexity due to cumulative spillover effects [36]. Spectral cytometry's full-spectrum approach minimizes this through several mechanisms: autofluorescence extraction that removes background signal [4] [42], reduced compensation artifacts, and the ability to distinguish fluorophores with nearly identical peak emissions but distinct spectral shapes [4].
Experimental data from clinical applications demonstrates these advantages. In minimal residual disease (MRD) detection, spectral panels achieving sensitivities below 0.001% (1 in 100,000 cells) have been reported for B-cell acute lymphoblastic leukemia, enabling detection of antigen-loss variants that evade conventional flow cytometry [36]. Similarly, a 24-color spectral panel for acute myeloid leukemia MRD detection demonstrated sensitivity below 0.02% while preserving marker correlation and improving resolution of maturation states [36].
Panel Complexity and Data Quality
The performance gap between technologies widens significantly as panel complexity increases. Conventional systems typically max out at 15-20 colors [50], while spectral systems routinely support 30-40 parameters [42] [51] and advanced configurations can exceed 50 colors [51]. This expanded multiplexing capability directly addresses resolution challenges in complex cellular characterization.
Table 2: Performance Comparison in Clinical Applications
| Application | Conventional Flow Cytometry | Spectral Flow Cytometry | Reference |
|---|---|---|---|
| MRD Detection (B-ALL) | Limited by antigen-loss variants; ~0.01% sensitivity | Detects CD19-negative clones; ~10⁻⁵ sensitivity | [36] |
| Immune Profiling | 8-12 parameters typical in clinical panels | 30-40 parameters in single tube | [52] |
| Rare Population Detection | Compromised by spreading error | Enhanced via autofluorescence extraction | [4] [42] |
| Longitudinal Studies | Batch effects due to day-to-day instrument variation | Improved reproducibility through standardized unmixing | [52] |
Experimental Evidence: Case Studies in Resolution Challenges
High-Dimensional Immunophenotyping
A recent study developing a 30-color lymphocyte immunophenotyping panel for spectral cytometry highlighted approaches to resolution challenges [52]. The researchers emphasized rigorous optimization and careful analysis to minimize non-biological variability arising from multi-fluorophore panels [52]. Their methodology included antibody titration, staining optimization, and stability analyses to ensure high-resolution data with minimal error [52]. This approach allowed quantification of over 50 lymphocyte and monocyte populations from a single sample—a resolution unattainable with conventional clinical panels typically detecting eight or fewer antigens [52].
CAR-T Cell Therapy Monitoring
In cellular therapy monitoring, spectral cytometry has demonstrated superior resolution for detecting critical predictive biomarkers. Studies monitoring CD19-directed CAR-T cell therapies used high-dimensional spectral panels to identify cellular phenotypes associated with therapeutic response [36] [42]. For instance, Denlinger et al. (2024) reported enrichment of PD-1+ CD8+ CAR-T subsets in lymphoma responders using a 37-color spectral panel [36] [42]. Similarly, Zhang et al. (2024) observed that CAR-T infusion products enriched in CCR7+ early-memory cells with low CD39 expression predicted favorable outcomes in chronic lymphocytic leukemia [36]. These subtle phenotypic differences require resolution beyond conventional capabilities due to dim expression and simultaneous assessment of multiple exhaustion markers.
Methodological Considerations: Panel Design and Optimization
Effective resolution of spreading error issues requires specialized methodologies tailored to each technology's strengths and limitations.
Spectral Panel Design Protocol
The transition to spectral cytometry necessitates reconsideration of panel design strategies. Based on published methodologies [52], the following protocol optimizes resolution and minimizes error:
- Similarity Index Assessment: Utilize manufacturer tools (e.g., Cytek's Similarity Index) to compare emission spectra between all panel markers [4]. Aim for values close to 0 for markers co-expressed on the same cells [4].
- Antigen Density Matching: Pair bright fluorophores with low-expression antigens and dim fluorophores with high-expression antigens [4] [25]. This balancing prevents bright signals from overwhelming dim ones.
- Reference Control Preparation: Prepare single-stained controls using the same antibody batch as experimental samples [4]. Tandem dyes are particularly sensitive to batch effects [4].
- Autofluorescence Extraction: Include unstained controls for each tissue type to establish autofluorescence profiles [4]. This enables spectral unmixing algorithms to subtract native fluorescence.
- Validation with Biological Specimens: Test panel performance using relevant biological samples early in optimization [52]. Resolution requirements may differ between cell types.
Experimental Workflow for Resolution Assessment
Figure 2: Experimental Workflow Comparison - Conventional and spectral workflows diverge significantly in panel design and signal processing approaches, leading to different resolution outcomes.
Successful implementation of high-parameter panels requires specific reagents and resources optimized for resolution and minimal spreading error.
Table 3: Research Reagent Solutions for High-Resolution Panels
| Resource | Function | Spectral Application |
|---|---|---|
| Similarity Index Tools (e.g., Cytek) | Compare spectral overlap between fluorophores | Panel design optimization; target index <0.5 for co-expressed markers [4] |
| Recombinant Antibodies | Consistent binding with minimal lot-to-lot variation | Reduce background from Fc receptor binding; improve reproducibility [25] |
| Viability Dyes (e.g., Ghost Dye) | Distinguish live/dead cells | Autofluorescence extraction improves dead cell discrimination [52] |
| Reference Control Beads/Cells | Establish spectral signatures for unmixing | Must match antibody batch; cells preferred over beads for accuracy [4] |
| Standardized Staining Buffers | Consistent staining conditions | Reduce technical variability in high-parameter panels [52] |
| Optimized Panel Publications (OMIPs) | Peer-reviewed panel designs | Starting point for panel development [25] |
Emerging Instrumentation and Future Directions
Technological innovations continue to address resolution challenges in polychromatic flow cytometry. Recent instrument launches include the Cytek Aurora Evo, which enhances throughput while maintaining resolution across flow rates [51] [53], and the BD FACSDiscover A8, which combines spectral flow with real-time imaging [51]. The Invirtrogen Attune Xenith features six lasers and 51 fluorescent detectors, supporting both spectral unmixing and conventional compensation [51]. These platforms demonstrate the industry's commitment to resolving the fundamental limitations of conventional polychromatic panels.
Modular solutions are also emerging, such as the CytoFLEX Mosaic Spectral Detection Module, which allows users to switch between conventional and spectral modes on the same instrument [51]. This flexibility enables researchers to address resolution challenges incrementally while maintaining existing workflows for applications where conventional cytometry remains sufficient.
The fundamental differences between conventional and spectral flow cytometry detection philosophies yield measurable advantages for spectral technology in addressing spreading error and resolution limitations. Spectral cytometry demonstrates superior performance for applications requiring: high-parameter panels (30+ colors), detection of rare cell populations, resolution of dimly expressed markers, and analysis of limited sample volumes [36] [42].
Conventional flow cytometry remains suitable for lower-parameter applications (typically <15 colors) where established workflows and instrument availability are priorities. However, for researchers pursuing increasingly complex cellular characterization, spectral technology provides a solution to the fundamental resolution constraints that limit conventional polychromatic panels. As instrumentation becomes more accessible and analysis tools more sophisticated, spectral flow cytometry represents an increasingly essential approach for overcoming the historical trade-off between panel complexity and data quality.
Managing Batch-to-Batch Variation in Tandem Dyes for Reliable Spectral Unmixing
Spectral flow cytometry has revolutionized immunophenotyping by enabling high-parameter single-cell analysis, dramatically expanding our ability to resolve complex cellular populations. Unlike conventional flow cytometry, which uses optical filters to measure a narrow emission band for each fluorophore, spectral cytometry captures the full emission spectrum from all fluorophores across multiple lasers, subsequently applying unmixing algorithms to resolve individual signals [3] [36]. This technological advancement allows researchers to simultaneously analyze 30-40 parameters from a single sample, enabling unprecedented deep immunophenotyping for both research and clinical applications [3] [24].
The expanded multiplexing capability of spectral cytometry relies heavily on an extensive palette of fluorophores, among which tandem dyes play an indispensable role. These dyes consist of two covalently bound fluorescent molecules: a donor fluorophore (such as PE, APC, or PerCP) and an acceptor dye. Through fluorescence resonance energy transfer (FRET), the donor absorbs laser light and transfers energy to the acceptor, which then emits at a longer wavelength [15] [54]. This mechanism creates valuable intermediate emission profiles that fill spectral gaps between conventional dyes, thereby increasing the total number of usable channels in a panel.
However, the complex chemical structure of tandem dyes introduces a significant challenge: batch-to-batch variation. During manufacturing, slight differences in the conjugation efficiency between donor and acceptor molecules can alter the FRET efficiency, ultimately changing the spectral signature of the resulting tandem dye [15]. Even with improved modern tandems, these variations persist and become critically important in spectral cytometry, where the complete emission profile serves as a unique fingerprint for unmixing. When reference controls do not accurately match the spectral signatures present in experimental samples, unmixing errors occur, potentially leading to false positives, compromised data quality, and erroneous biological conclusions [9]. This comparison guide examines the sources and impacts of tandem dye variation and provides evidence-based strategies to ensure reliable spectral unmixing in high-parameter flow cytometry applications.
Comparative Analysis of Flow Cytometry Approaches
Fundamental Differences in Signal Detection and Compensation
The approaches to managing fluorescence spillover differ fundamentally between conventional and spectral flow cytometry, each with distinct implications for tandem dye performance and data quality.
Table 1: Comparison of Conventional vs. Spectral Flow Cytometry
| Feature | Conventional Flow Cytometry | Spectral Flow Cytometry |
|---|---|---|
| Signal Detection | Measures peak emission using bandpass filters [36] | Captures full emission spectrum across multiple detectors [3] [36] |
| Spillover Correction | Compensation using single-color controls [15] | Spectral unmixing using reference spectra [9] [15] |
| Tandem Dye Utilization | Limited by emission peak overlap [36] | Enabled by full spectral differences (Similarity Index <0.98) [9] |
| Impact of Tandem Variation | Alters compensation matrices [15] | Causes unmixing errors across multiple channels [9] [15] |
| Autofluorescence Handling | Limited subtraction capability [36] | Can be characterized and extracted using algorithms [36] [24] |
Technical Workflow Comparison
The diagram below illustrates the key technical differences between conventional and spectral flow cytometry workflows, highlighting how each system manages fluorescent signals and the specific points where tandem dye variation introduces challenges.
Experimental Evidence: Quantifying Tandem Dye Variation and Stability
Stability Assessment of Common Tandem Dyes
Recent experimental studies have systematically quantified the stability of tandem dyes under various conditions, providing crucial data for robust panel design. KCAS Bio scientists conducted rigorous stability testing on three common tandem dyes—PerCP-Cy5.5, PE-Cy7, and APC-H7—tracking their performance over time using the median fluorescence intensity (MFI) ratio of donor to tandem peak channel [15].
Table 2: Experimental Stability Data of Common Tandem Dyes
| Tandem Dye | Stability Duration | Key Stability Metric | Impact of Fixation | Recommended Use |
|---|---|---|---|---|
| PerCP-Cy5.5 | ≤5 days with proper fixation | MFI ratio (donor:tandem) | 0.5% formaldehyde maintained integrity [15] | Short-term experiments (<5 days) |
| PE-Cy7 | ≤5 days with proper fixation | MFI ratio (donor:tandem) | 4% formaldehyde caused degradation [15] | Short-term experiments (<5 days) |
| APC-H7 | ≤5 days with proper fixation | MFI ratio (donor:tandem) | CytoFix showed variable performance [15] | Short-term experiments (<5 days) |
| Brilliant Violet Tandems | High stability reported | Minimal lot-to-lot variation | Stable across fixatives [54] | Long-term & multi-site studies |
| StarBright Dyes | Enhanced stability | Efficient donor quenching | Reduced spectral spillover [54] | High-complexity panels |
Fixation and Storage Conditions
The choice of fixative significantly impacts tandem dye stability, as demonstrated in a comprehensive evaluation of 16 fluorochrome-conjugated antibodies across four different fixatives at three timepoints [15]. While all fixatives maintained biomarker integrity on day zero, only 0.5% formaldehyde preserved every biomarker's integrity across the two tested panels out to five days. This finding is particularly valuable for establishing reusable reference control sets during method validations when processed sample stability is being evaluated.
Long-term reference control stability studies have yielded promising results. When month-one and month-two samples were unmixed with reference controls acquired either at day-zero baseline or freshly prepared, the data remained comparable, suggesting that with the same antibody lots used within their expiry period, reference controls can remain effective for unmixing over extended periods [15]. Ongoing research aims to validate stability up to nine months from baseline, which would significantly benefit long-term studies.
Best Practices for Managing Tandem Dye Variation
Reference Control Preparation and Validation
Implementing rigorous protocols for reference control preparation is fundamental to minimizing unmixing errors caused by tandem dye variation. The following workflow outlines a systematic approach to creating optimal reference controls for spectral flow cytometry.
Practical Implementation Strategies
Table 3: Research Reagent Solutions for Managing Tandem Dye Variation
| Reagent Category | Specific Examples | Function in Managing Variation | Manufacturer/Provider |
|---|---|---|---|
| Next-Generation Tandems | PE-Fire, PerCP-Fire, APC-Fire | Enhanced photostability and reduced lot-to-lot variation [54] | BioLegend |
| Fluorescent Polymers | Brilliant Violet, Brilliant UV | Consistent polymerization for reduced variability [54] | BioLegend, BD Biosciences |
| Polymer Dots | StarBright | Efficient donor quenching lowers spillover [54] | Bio-Rad |
| DNA-Based Fluorophores | NovaFluor, KiraVia | Finely tunable excitation/emission profiles [54] | Thermo Fisher, Sony |
| Stabilizing Fixatives | 0.5% Formaldehyde | Maintains tandem integrity for reference control reuse [15] | Multiple |
| Monocyte Blocking Reagents | Proprietary blocking solutions | Prevents non-specific binding of certain fluorophores [54] | Fluorophore manufacturers |
Managing batch-to-batch variation in tandem dyes requires a comprehensive approach spanning reagent selection, experimental design, and quality control. Based on current evidence, the following strategic recommendations emerge:
- Prioritize stable dye chemistries such as Brilliant polymers or Fire tandems for critical markers, particularly when implementing long-term studies or multi-site collaborations [54].
- Implement strict lot-matching protocols for all tandem dyes, ensuring reference controls and experimental samples use identical reagent lots [9] [15].
- Adopt 0.5% formaldehyde fixation for reference control preservation, enabling reuse for up to five days while maintaining spectral integrity [15].
- Establish rigorous validation schedules for reference libraries, with initial monthly re-validation and comprehensive checks for unmixing errors [9].
- Utilize similarity index tools during panel design to select fluorophore combinations with indices below 0.98, ensuring reliable unmixing even with minor batch variations [9].
As spectral flow cytometry continues to expand into clinical diagnostics and regulated drug development environments, standardized approaches to managing tandem dye variation will become increasingly important. Future developments in fluorophore technology, particularly more stable tandem constructs and advanced unmixing algorithms, promise to further mitigate these challenges, enabling even higher-parameter analyses with greater reproducibility across laboratories and timepoints.
Leveraging the Similarity Index for Optimal Fluorophore Pairing in Spectral Panel Design
The transition from conventional to spectral flow cytometry represents a paradigm shift in high-dimensional cell analysis, enabling the simultaneous measurement of 40 or more markers from a single sample [3] [42]. This remarkable capability hinges on a fundamental difference in detection technology: where conventional flow cytometry uses optical filters to direct narrow wavelength bands to specific detectors (the "one detector–one fluorophore" approach), spectral flow cytometry captures the full emission spectrum of every fluorophore across a wide range of wavelengths using detector arrays [3] [23]. This technological advancement introduces both unprecedented flexibility and new complexities in panel design, chief among them the need to systematically manage fluorophore spectral overlap through the similarity index [55].
The similarity index provides a quantitative measure of how closely the spectral signatures of two fluorophores resemble each other, directly impacting the ability of unmixing algorithms to correctly assign signals to their originating fluorophores [55]. Unlike conventional compensation, which corrects for spillover between adjacent detection channels, spectral unmixing must resolve the contribution of every fluorophore across the entire spectrum [55] [23]. As panel size increases, so does the spectral complexity, making the strategic use of similarity indices not merely beneficial but essential for achieving high-resolution data from complex multicolor panels [56] [55].
Understanding the Similarity Index: From Theoretical Concept to Practical Metric
Fundamental Principles and Calculation
The similarity index is a numerical value, typically ranging from 0 to 1.0, where 1.0 indicates 100% spectral similarity between two fluorophores [55]. This metric is derived from comparing the complete emission profiles of fluorophores across all detection channels, rather than just their peak emissions [55]. In practical terms, a high similarity index (e.g., 0.8 or above) indicates that two fluorophores have largely overlapping spectra, which can challenge unmixing algorithms and potentially lead to misassignment of signals [55].
The mathematical foundation for the similarity index stems from the principles underlying spectral unmixing algorithms, which solve for the individual contribution of each fluorophore in a mixture by using reference spectra from single-stain controls [3] [55]. When fluorophores have highly similar spectra, the unmixing algorithm must resolve increasingly subtle differences, potentially amplifying noise and reducing resolution [55]. This differs fundamentally from conventional flow cytometry's compensation matrix, which addresses spillover between specific detector pairs rather than global spectral similarity [55] [23].
Similarity Index Versus Complexity Index
In spectral panel design, the similarity index works in conjunction with another important metric—the complexity index:
- Similarity Index: A pairwise measurement quantifying spectral overlap between two specific fluorophores [55].
- Complexity Index: A global measurement that assesses the cumulative similarity of all spectral signatures within a full panel [56] [55].
The complexity index increases as panels grow larger, but careful selection of fluorophores with low pairwise similarity scores can help mitigate overall complexity [56] [55]. Sophisticated panel design tools provide real-time complexity scoring as fluorophores are added to a panel, enabling designers to make informed trade-offs [56].
Table 1: Interpreting Similarity Index Values in Panel Design
| Similarity Index Range | Interpretation | Recommended Usage |
|---|---|---|
| 0.0 - 0.3 | Low similarity | Ideal for co-expressed markers |
| 0.3 - 0.6 | Moderate similarity | Generally acceptable with verification |
| 0.6 - 0.8 | High similarity | Avoid for co-expressed markers; use with caution otherwise |
| 0.8 - 1.0 | Very high similarity | Not recommended in the same panel |
Practical Application: Strategic Fluorophore Pairing Using Similarity Indices
Hierarchical Panel Design Framework
Effective spectral panel design employs a systematic approach to pairing fluorophores with markers based on both spectral characteristics and biological context. The following hierarchical strategy incorporates similarity indices at each decision point:
Identify Critical Markers and Co-Expression Patterns: Begin by mapping the biological populations of interest and determining which markers are co-expressed on the same cell populations [56] [25]. Markers that will be analyzed together on bivariate plots should be prioritized for low similarity index pairings [55].
Assign Fluorophores to Antigen Tiers: Categorize antigens by expression level and biological importance, then pair them with fluorophores of appropriate brightness while considering similarity indices [56]:
- Tertiary antigens (low expression, critical for subset identification): Assign brightest fluorophores with minimal spectral similarity to co-expressed markers [56].
- Secondary antigens: Assign remaining bright fluorophores, prioritizing those with low similarity to co-expressed tertiary antigens [56].
- Primary antigens (highly expressed, identify major populations): Can be assigned to dimmer fluorophores or those with higher similarity indices, provided they are not co-expressed with problematic markers [56] [25].
Validate Pairings with Similarity Matrix: Before finalizing the panel, review the complete similarity matrix to identify any problematic pairings with high similarity indices that might have been overlooked [55].
Advanced Strategies for Managing High-Similarity Fluorophores
Even with careful planning, situations arise where fluorophores with high similarity indices must be used together. Several advanced strategies can mitigate potential issues:
Leverage Expression Patterns: Assign highly similar fluorophores to markers with mutually exclusive expression patterns or "on/off" expression characteristics [56]. This reduces the likelihood of both fluorophores being present on the same cell, minimizing unmixing challenges.
Strategic Marker Placement: Place markers with high similarity fluorophores in different cellular compartments (surface versus intracellular) or assign them to markers that will not be visualized on the same bivariate plots during analysis [55].
Avoid Dump Channels: Traditional "dump channels" that combine multiple markers into one detector are not recommended in spectral flow cytometry [56]. Instead, detect each marker individually, as the increased dimensionality of spectral cytometry allows for deeper interrogation of cell heterogeneity without the need for channel pooling [56].
Comparative Analysis: Similarity Index Versus Conventional Spillover Spreading
Fundamental Differences in Approach
The implementation and interpretation of similarity indices in spectral flow cytometry differ substantially from spillover spreading measurements in conventional flow cytometry:
Table 2: Similarity Index vs. Conventional Spillover Metrics
| Characteristic | Spectral Similarity Index | Conventional Spillover Spreading |
|---|---|---|
| Basis of Calculation | Complete emission spectrum across all detectors [55] | Signal spillover between specific detector pairs [55] |
| Scale | 0 to 1.0 (0% to 100% similarity) [55] | Standard deviation of spillover (not absolute scale) [55] |
| Impact on Resolution | Affects unmixing algorithm performance across entire spectrum [55] | Causes spreading error in specific detector channels [55] |
| Panel Design Guidance | Prioritize low similarity for co-expressed markers [55] | Keep values below ~10 for critical markers [55] |
| Instrument Dependency | Varies with laser configuration and detector sensitivity [55] | Highly specific to optical filter configuration [55] |
Practical Implications for Panel Design
The similarity index provides a more holistic view of fluorophore compatibility than traditional spillover metrics because it accounts for the complete spectral profile rather than pairwise channel interactions [55]. This comprehensive perspective is particularly valuable when designing high-parameter panels (>20 colors) where complex interactions between multiple fluorophores can create challenging unmixing scenarios [3] [55].
In conventional flow cytometry, a spillover spreading matrix (SSM) with values below 10 is generally considered acceptable, while values above this threshold indicate potentially problematic combinations [55]. For spectral flow cytometry, no universal threshold exists for similarity indices, as the acceptable level depends on multiple factors including the specific unmixing algorithm, instrument configuration, and biological context [55]. However, as a general guideline, fluorophore pairs with similarity indices above 0.8 should be avoided for markers that are co-expressed or require high-resolution discrimination [55].
Experimental Protocols for Similarity Index-Based Panel Optimization
Control Preparation for Spectral Unmixing
Proper experimental controls are essential for validating panel designs based on similarity indices. The following protocol ensures high-quality reference spectra for accurate unmixing:
Single-Stain Control Preparation:
- Select biological material that expresses the target antigen at appropriate levels (brightly expressed antigens are ideal for controls) [25].
- Use the same antibody clone, fluorophore conjugate, and staining protocol as the full panel [25].
- Include compensation beads for conjugates targeting rare antigens or those with unusual expression patterns [25].
- For each fluorophore in the panel, prepare a separate single-stain control tube [25].
Unstained and Autofluorescence Controls:
Full-Matrix Validation:
Panel Optimization and Troubleshooting
Once initial similarity data is collected, iterative refinement ensures optimal panel performance:
Empirical Testing: Test the full panel on biological samples and review population resolution, particularly for critical subsets identified during the design phase [56].
Similarity-Driven Modifications: If population resolution is poor for co-expressed markers with high similarity indices:
Complexity Management: Monitor the overall complexity index during modifications, aiming to reduce it when possible through strategic fluorophore substitutions [56] [55].
Table 3: Essential Resources for Similarity-Based Panel Design
| Resource Category | Specific Tools | Function in Panel Design |
|---|---|---|
| Spectral Viewers | Sony Spectrum Analyzer, Cytek Cloud, FluoroFinder Spectra Viewer [3] [55] [57] | Visualize emission spectra and calculate pairwise similarity indices |
| Panel Building Platforms | Thermo Fisher Panel Builder, FluoroFinder IntelliPanel, Cytek Panel Builder [56] [55] [57] | Interactive panel design with real-time complexity scoring and similarity matrices |
| Fluorophore Databases | Vendor catalogs (BD Biosciences, BioLegend, Thermo Fisher), fluorescence reagent databases [56] [57] | Access up-to-date spectral profiles and brightness indices for available reagents |
| Published Reference Panels | OMIP (Optimized Multicolor Immunofluorescence Panel) publications [25] | Validate panel designs against professionally optimized multicolor panels |
| Instrument-Specific Tools | BD FACSymphony A5 SE, Cytek Aurora, Sony ID7000 configuration tools [3] [23] | Generate similarity indices specific to instrument laser and detector configurations |
The similarity index represents a fundamental advancement in flow cytometry panel design, providing researchers with a quantitative metric to optimize fluorophore combinations in high-parameter spectral panels. By systematically applying similarity indices throughout the design process—from initial fluorophore selection to final empirical validation—researchers can overcome the spectral challenges inherent in 30-40 color panels and achieve unprecedented resolution of cellular heterogeneity.
As spectral flow cytometry continues to evolve with new fluorophores, improved unmixing algorithms, and more sophisticated design tools, the strategic use of similarity indices will remain essential for extracting maximum biological insight from precious samples. By adopting this metric-driven approach, researchers can confidently design larger, more informative panels that push the boundaries of immunological discovery and therapeutic development.
Strategies for Resolving Dim Populations and Correcting for Cellular Autofluorescence
Spectral flow cytometry represents a significant evolution from conventional flow cytometry, primarily through its ability to resolve dim cell populations and correct for cellular autofluorescence. This capability is transforming clinical diagnostics and complex immunophenotyping by enabling high-parameter analysis with superior resolution and sensitivity.
Table of Contents
- Introduction to the Core Challenge
- Technological Foundations: Conventional vs. Spectral Flow Cytometry
- Experimental Strategies for Autofluorescence Management
- Quantitative Comparison of Performance Metrics
- Advanced Applications in Clinical and Research Settings
- Research Reagent Solutions
- Conclusions and Future Directions
In flow cytometry, dim populations—cells expressing low levels of target antigens—and cellular autofluorescence—the inherent background fluorescence from intracellular molecules like flavins and NAD(P)H—present significant analytical challenges [36] [58]. These factors obscure detection of true positive signals, reduce assay sensitivity, and complicate data interpretation. In conventional flow cytometry, autofluorescence manifests as elevated background across multiple detection channels, compressing the dynamic range and making dim populations difficult to resolve [19]. Spectral flow cytometry addresses these limitations through full-spectrum detection and advanced computational unmixing, enabling researchers to distinguish true signal from background with unprecedented precision [36] [24].
Technological Foundations: Conventional vs. Spectral Flow Cytometry
The fundamental differences between conventional and spectral flow cytometry directly impact their ability to resolve dim populations and manage autofluorescence.
Table 1: Core Technological Comparison
| Feature | Conventional Flow Cytometry | Spectral Flow Cytometry |
|---|---|---|
| Detection Method | Single detector per fluorophore measuring near emission maxima [19] | Multiple detectors capturing full emission spectrum (~350-900 nm) [19] |
| Spillover Correction | Compensation [19] | Spectral unmixing algorithms [19] |
| Autofluorescence Handling | Limited capability; contributes to background noise [19] | Active extraction using linear unmixing algorithms [36] [24] |
| Signal Resolution | Limited by filter-based detection and spillover spreading [36] | Enhanced through full-spectrum profiling and sensitive detectors [36] |
| Multiplexing Capacity | Restricted by available filter configurations [3] | Expanded by distinguishing fluorophores with overlapping peaks [36] |
| Information Capture | Partial emission profile [19] | Complete spectral signature across multiple lasers [19] |
Spectral flow cytometers replace the complex system of dichroic mirrors and bandpass filters found in conventional instruments with a prism or diffraction grating that scatters emitted light across an array of detectors (typically 32-88 channels) [3]. This full-spectrum approach enables the resolution of fluorophores with nearly identical peak emissions but distinct spectral shapes, dramatically increasing the number of parameters that can be simultaneously analyzed [36].
Experimental Strategies for Autofluorescence Management
Effective management of autofluorescence is crucial for resolving dim populations. Multiple methodological approaches have been developed for spectral flow cytometry, each with distinct advantages and applications.
Table 2: Autofluorescence Extraction Methods
| Method | Procedure | Best Applications | Accuracy & Reproducibility |
|---|---|---|---|
| FSC/SSC Gating | Gate on unstained cells in scatter parameters; software extracts median fluorescence intensity for each detector [45] | Homogeneous populations (e.g., lymphocytes, PBMCs) [45] | Low for complex samples, high for homogeneous populations [45] |
| AF as Fluorophore | Create custom AF "fluorophore" in library; gate on positive population in unstained control to define spectrum [45] | Specific cell types with strong AF (e.g., tissue macrophages) [45] | High for reproducible AF signatures [45] |
| AF Explorer Tools | Use specialized software to gate multiple populations in unstained sample; extract distinct AF signatures for each [45] | Complex tissues with multiple cell types (e.g., lung, skin) [45] | High when properly implemented with similarity threshold ≤0.9 [45] |
| Library Storage | Store AF signatures from specific cell types or experimental conditions in spectral library for future use [45] | Longitudinal studies or standardized panels [45] | High with proper validation [45] |
| Metabolic AF Exploitation | Utilize NAD(P)H autofluorescence for label-free detection of glycolytic activity [58] | Immunometabolism studies, cellular activation states [58] | High when validated with metabolic inhibitors [58] |
The following workflow diagram illustrates the decision process for selecting the appropriate autofluorescence management strategy:
Experimental Protocol: Advanced Autofluorescence Handling
For complex tissues containing multiple cell types with varying autofluorescence, the following protocol is recommended:
- Sample Preparation: Select the sample with the highest autofluorescence diversity as your unstained control [45].
- Spectral Acquisition: Run the unstained control sample on your spectral flow cytometer.
- Population Identification: Use the AF explorer tool to visualize cell populations using scatter and fluorescence parameters (commonly V7, UV6, B3, YG7) [45].
- Signature Extraction: Gate distinct populations and extract their AF signatures using the "Extract AF from gate" function.
- Similarity Assessment: Set similarity threshold to 0.9 or lower to ensure adequate discrimination between signatures [45].
- Validation: Apply the extracted signatures to a multicolor sample and verify improved population resolution.
Improper implementation of AF extraction can introduce unmixing errors, and although AF subtraction generally enhances resolution, it may increase spread in negative populations for fluorochromes overlapping with endogenous fluorescence profiles [36].
Quantitative Comparison of Performance Metrics
The advantages of spectral flow cytometry for resolving dim populations and managing autofluorescence translate into measurable performance improvements across various applications.
Table 3: Performance Comparison in Clinical Applications
| Application | Panel Size | Sensitivity | Key Advantages | Reference |
|---|---|---|---|---|
| AML MRD Detection | 24-color | <0.02% | High-resolution blast maturation profiling | [36] |
| B-ALL MRD Detection | 23-color | ~10⁻⁵ | Detection of CD19-negative leukemic clones | [36] |
| CLL/Lymphoma | Not specified | 0.005% | Increased specificity for rare malignant clones | [36] |
| Multiple Myeloma | EuroFlow NGF markers | ~10⁻⁶ | Clear distinction of clonal vs. normal plasma cells | [36] |
| Metabolic Profiling | 8 pathways + immunophenotyping | Enhanced resolution | Label-free detection of glycolysis via NAD(P)H | [58] |
Table 4: Impact of Autofluorescence Extraction on Signal Resolution
| Method | Signal-to-Noise Ratio | Dim Population Detection | Spillover Spreading | Implementation Complexity |
|---|---|---|---|---|
| Conventional (no AF handling) | Low | Limited | High | Low |
| Basic AF Subtraction | Moderate | Improved | Moderate | Low |
| Targeted AF Extraction | High | Significantly improved | Low | Moderate |
| Multiple AF Signatures | Very high | Optimal | Minimal | High |
The implementation of these advanced spectral technologies is supported by newer instruments such as the Cytek Aurora Evo, BD FACSDiscover A8, and Invitrogen Attune Xenith, which feature enhanced detectors, automated quality control, and improved unmixing algorithms [51]. These systems can resolve more than 40 parameters in a single tube, enabling comprehensive immune profiling that was previously impossible with conventional flow cytometry [36] [19].
Advanced Applications in Clinical and Research Settings
The superior capability of spectral flow cytometry for resolving dim populations and correcting autofluorescence has enabled breakthroughs across multiple domains.
In clinical diagnostics, particularly for hematologic malignancies, spectral flow cytometry has transformed measurable residual disease (MRD) detection. The technology allows consolidation of multiple diagnostic tubes into a single comprehensive assay, crucial for samples with limited cellularity such as bone marrow aspirates and pediatric biopsies [36]. For example, Chen et al. (2023) validated a 24-color spectral panel for acute myeloid leukemia MRD detection with sensitivity below 0.02%, while García-Aguilera et al. (2024) developed a 23-color panel that identified CD19-negative leukemic clones in B-cell acute lymphoblastic leukemia—a critical challenge following CD19-targeted therapies [36].
In immuno-oncology and drug development, spectral flow cytometry enables comprehensive monitoring of cellular therapies and biomarker discovery. Studies have identified distinct CAR-T cell phenotypes associated with treatment response and toxicity, such as PD-1+ CD8+ CAR-T subsets enriched in lymphoma responders and CCR7+ early-memory cells predicting favorable outcomes in chronic lymphocytic leukemia [36]. The technology's ability to simultaneously characterize therapeutic cells, residual disease, and the immune microenvironment in a single tube provides unprecedented insights into treatment mechanisms and resistance.
In immunometabolism, researchers have developed innovative approaches that leverage rather than simply correct for autofluorescence. A recent study created a standardized spectral panel profiling eight key metabolic pathways while utilizing NAD(P)H autofluorescence for label-free detection of glycolytic activity [58]. This approach revealed distinct metabolic programs in resident versus infiltrating myeloid cells and between naive, effector, and tissue-resident memory T cells following vaccination [58].
The following diagram illustrates the integrated workflow for high-parameter spectral analysis with autofluorescence management:
Research Reagent Solutions
Successful implementation of spectral flow cytometry for resolving dim populations requires appropriate reagents and controls.
Table 5: Essential Research Reagents and Controls
| Reagent/Control | Function | Application Notes |
|---|---|---|
| Unstained Cells | Define autofluorescence signatures [45] | Use the same cell type and treatment as experimental samples |
| Single-Stained Controls | Establish reference spectra for unmixing [59] | Critical for panel development and validation |
| Compensation Beads | Alternative to cells for control preparation | Particularly useful for low-abundance markers |
| Viability Dyes | Exclude dead cells (high autofluorescence) | Reduces background and improves population resolution |
| AF Explorer Software | Identify and extract multiple AF signatures [45] | Essential for complex tissues with heterogeneous AF |
| Metabolic Inhibitors | Validate specificity of metabolic probes [58] | Confirms metabolic pathway involvement |
| Reference Standards | Instrument calibration and QC | Ensures reproducibility across experiments and instruments |
Proper panel design remains crucial, with brighter fluorophores recommended for low-abundance antigens and careful attention to potential spectral overlaps even with unmixing algorithms. Commercial spectral cell sorters, such as the Invitrogen Bigfoot now equipped with a 200μm nozzle option, further enable isolation of rare populations identified through these advanced methods [51].
Spectral flow cytometry provides powerful solutions to the persistent challenges of resolving dim populations and correcting for cellular autofluorescence. Through full-spectrum detection, advanced unmixing algorithms, and flexible autofluorescence management strategies, the technology enables researchers to achieve sensitivity levels down to 0.001% in MRD detection and comprehensively profile complex cellular heterogeneity.
The future of spectral cytometry continues to evolve with emerging technologies such as ghost cytometry, LASE, and imaging flow cytometry that promise further improvements in sensitivity, throughput, and spatial resolution [36]. The integration of artificial intelligence for optimized unmixing and automated population identification will likely simplify these advanced workflows, making high-parameter spectral analysis more accessible to broader research communities.
As the field advances, standardized protocols and validation frameworks will be essential for ensuring reproducibility and reliability, particularly as spectral flow cytometry becomes increasingly embedded in clinical diagnostic pipelines and pharmaceutical development workflows. The continued refinement of strategies for managing autofluorescence and resolving dim populations will further expand the boundaries of single-cell analysis, enabling new discoveries in immunology, oncology, and beyond.
The reproducibility of flow cytometry data across different experiments, instruments, and laboratories presents a significant challenge in both research and clinical applications. Standardization practices, particularly the use of bead standards, have emerged as critical tools for achieving reliable comparability in the evolving landscapes of both conventional and spectral flow cytometry. While conventional flow cytometry uses compensation to correct for fluorescence spillover by subtracting overlapping signals, spectral flow cytometry employs full-spectrum detection and mathematical unmixing algorithms to distinguish fluorophores based on their unique spectral signatures [60] [19]. This fundamental difference in detection and analysis approaches necessitates distinct yet equally rigorous standardization methodologies.
The critical importance of standardization is highlighted by studies demonstrating that manufacturer variation contributes most significantly to observed variation in multiplex bead assays, whereas variation between lots, laboratories, or detection reagents contributes minimally [61]. Without proper standardization, direct comparisons of data acquired from different platforms become infeasible, limiting the utility and translational potential of flow cytometry data [62]. This article provides a comprehensive comparison of bead standardization practices, experimental protocols, and performance data to guide researchers in selecting appropriate strategies for cross-experiment and cross-platform comparability.
Types of Calibration and Standardization Beads
Classification and Applications
Bead standards for flow cytometry encompass several functional categories, each designed to address specific aspects of instrument performance and data standardization. These include beads for instrument calibration, fluorescence quantification, size reference, and sorting optimization.
Table 1: Types of Flow Cytometry Bead Standards and Their Applications
| Bead Type | Primary Function | Key Characteristics | Example Products |
|---|---|---|---|
| Equivalent Reference Fluorophore (ERF) Beads | Standardization for inter/intra instrument data comparison | Assigned values traceable to NIST standards; multiple intensity peaks | AccuCheck, ViroCheck [63] |
| Rainbow Calibration Particles | Routine calibration | Single mixture with 8 fluorescent intensities | Rainbow Calibration Particles [63] |
| Alignment Beads | Laser and optical alignment | Laser-specific particles; ensure optimal instrument setup | AlignFlow Plus Alignment Beads [63] |
| Size Calibration Beads | Cell size estimation and scatter calibration | Polystyrene microspheres of defined diameters | Flow Cytometry Size Calibration Kit [63] |
| Cell Sorting Beads | Sort calibration and efficiency checking | Optimized for different laser lines; check drop delay | Cell Sorting Setup Beads [63] |
Bead Standards for Quantitative Flow Cytometry
Quantitative flow cytometry (qFCM) represents an advanced approach where arbitrary units are converted to standardized units, enabling meaningful cross-platform comparisons. This is particularly crucial for extracellular particle (EP) analysis, where different equipment detects different portions of the same population due to sensitivity limitations [62]. Research has demonstrated that while uncalibrated fluorescence intensities showed poor concordance between platforms (CytoFLEX: 5.4 × 10³ a.u.; Aurora: 3.8 × 10³ a.u.), calibrated data showed remarkable alignment (CytoFLEX: 882 EGFP MESF; Aurora: 875 EGFP MESF) [62]. This highlights the critical importance of quantitative standardization for cross-platform studies.
Experimental Protocols for Bead Standardization
Standardization Workflow for Cross-Platform Comparability
The following workflow diagram illustrates a comprehensive standardization protocol for ensuring cross-experiment and cross-platform comparability:
Standardization Workflow for Cross-Platform Comparability
Protocol for Equivalent Reference Fluorophore (ERF) Beads
The use of ERF beads follows a standardized three-step process that enables quantitative comparisons across platforms and over time:
Initial Bead Acquisition: Run one drop of ERF beads and collect data in all channels required for the experiment. This establishes mean fluorescence values for the intensity peaks provided by the beads [63].
Single-Color Control Acquisition: Run a single-color control for each fluorophore used in the experiment and collect the mean fluorescence intensity [63].
Standard Curve Generation: Plot the values obtained to create a standard curve. The values collected from experimental samples should fall on this curve, providing standardized fluorescence values that are comparable across instruments and over time [63].
This process is particularly valuable for longitudinal studies and multi-center trials where data must be integrated from different instruments and locations.
Small-Particle Optimization Pipeline for Extracellular Vesicles
For specialized applications such as extracellular vesicle and virus analysis, the Small-Particle Optimization (SPOT) pipeline has been developed to optimize flow cytometer performance. This approach utilizes quantitative FCM to derive optimal small-particle fluorescence and light scatter detection settings, maximizing platform sensitivity and deriving instrument sensitivity in quantitative units [62]. The SPOT pipeline addresses the limitations of conventional quality control measures, which were developed for cellular analysis and are suboptimal for small-particle applications.
Performance Comparison and Experimental Data
Quantitative Performance Metrics
Standardization beads enable researchers to generate quantitative performance metrics for both conventional and spectral flow cytometers. These metrics provide objective data for instrument selection, protocol optimization, and data validation.
Table 2: Performance Metrics for Bead-Based Standardization Assays
| Application | Limit of Detection | Reproducibility (Intra-assay %CV) | Key Performance Indicators | Reference |
|---|---|---|---|---|
| Soluble Marker Detection | sCD25: 9.77 pg/mLsCD40L: 43.95 pg/mLsTREM-1: 12.21 pg/mL | <5% for most analytes | High sensitivity for low-concentration biomarkers | [64] |
| Cross-Platform EV Analysis | 120 nm diameter particles | Improved concordance after calibration | Median fluorescence: 875-882 EGFP MESFDiameter: 120.3-120.8 nm | [62] |
| Multiplex Bead Assays | Variable by manufacturer | Minimal lot-to-lot variation | Manufacturer is primary variation source | [61] |
Impact of Standardization on Data Comparability
The implementation of rigorous bead standardization practices has demonstrated significant improvements in data comparability across platforms. In one study evaluating recombinant extracellular vesicles (rEVs) expressing EGFP, uncalibrated data showed poor concordance between CytoFLEX and Aurora platforms, with uncalibrated fluorescence intensities of 5.4 × 10³ and 3.8 × 10³ arbitrary units, respectively [62]. After calibration to molecules of equivalent soluble fluorophore (MESF), the platforms showed remarkable alignment with median fluorescence intensities of 882 and 875 EGFP MESF, respectively [62]. Similarly, calibrated light scatter intensities aligned closely between platforms (120.8 vs. 120.3 nm diameter) [62].
Technology-Specific Considerations
Conventional vs. Spectral Flow Cytometry Standards
The fundamental differences between conventional and spectral flow cytometry technologies necessitate distinct approaches to standardization and panel design. The following diagram illustrates the key differences in how these technologies handle fluorescence detection and spillover correction:
Flow Cytometry Standards Comparison
Reference Controls for Spectral Flow Cytometry
Spectral flow cytometry requires particularly careful attention to reference controls due to its reliance on full spectral signatures for unmixing. Key considerations include:
Batch Consistency: For conjugated dyes, it is critical that controls and sample antibodies are from the same batch to avoid unmixing issues from batch-to-batch variation [4]. This is particularly important for tandem dyes (e.g., PE-Cy7), where the exact ratio of fluorophores may vary between batches.
Beads vs. Cells: While compensation beads provide a strong positive signal, they can sometimes distort fluorescent signatures upon antibody binding, leading to discrepancies during unmixing [4]. Including both bead-based and cell-based reference controls is recommended, especially when establishing new panels.
Autofluorescence Extraction: Spectral flow cytometers can extract cellular autofluorescence as a separate parameter, but this requires unstained controls for each tissue type, as autofluorescence levels vary across tissues [4].
Essential Research Reagent Solutions
Implementing effective standardization practices requires access to specific reagents and materials. The following table catalogues essential research reagent solutions for flow cytometry standardization:
Table 3: Essential Research Reagent Solutions for Flow Cytometry Standardization
| Reagent Category | Specific Examples | Function in Standardization | Key Features |
|---|---|---|---|
| Quantitative Calibration Beads | AccuCheck ERF Reference Particles | Assign standardized values to fluorescence parameters | NIST-traceable standards; 3 intensity peaks; 26-channel support [63] |
| Size Reference Beads | Flow Cytometry Size Calibration Kit | Establish correlation between scatter and particle size | Six suspensions of microspheres (1.0-15 micron) [63] |
| Alignment and Setup Beads | AlignFlow Plus Alignment Beads | Optimize laser alignment and fluidics | Laser-specific formulations; ensure proper instrument setup [63] |
| Spectral Reference Standards | Single-stained compensation beads or cells | Establish reference spectral signatures for unmixing | Critical for spectral flow cytometry; must match experimental batches [4] |
| Multi-peak Validation Beads | Rainbow Calibration Particles | Verify instrument performance across dynamic range | Eight intensities in single mixture; routine calibration [63] |
| Common Reference Standards | Custom-made reference preparations | Enable cross-comparison between different manufacturers' kits | Overcome differences in cytokine/chemokine levels between manufacturers [61] |
Bead standards are indispensable tools for achieving reliable cross-experiment and cross-platform comparability in both conventional and spectral flow cytometry. While the specific implementation may differ between technologies—with conventional flow cytometry relying on compensation and spectral flow cytometry utilizing full-spectrum unmixing—the fundamental principle remains consistent: well-characterized standards enable quantitative comparisons that transcend instrumental differences. The incorporation of common reference standards and application of the same analysis method can overcome many analytical biases, bridging comparison of independent immune profiling studies [61]. As flow cytometry continues to evolve toward higher parameter panels and more sensitive detection, particularly for challenging applications like extracellular vesicle analysis, robust standardization practices will become increasingly critical for generating reproducible, reliable, and comparable data across the research continuum.
Ensuring Accuracy: Data Validation and Cross-Platform Comparison
The advancement of flow cytometry into high-dimensional analysis has fundamentally transformed single-cell research and clinical diagnostics. As panels expand to encompass 40 colors or more, accurately assessing and correcting for fluorescent spillover has evolved from a routine procedure to a critical determinant of data integrity. The imperative for deep immunophenotyping in immunology and oncology drives the need for technologies capable of precise spillover management [3] [24]. This guide objectively compares the performance of conventional and spectral flow cytometry in managing spillover, providing researchers with the quantitative metrics and experimental protocols necessary to evaluate these technologies for their specific applications. The core challenge in high-parameter panels is the phenomenon of spillover spreading, which intrinsically limits measurement sensitivity by increasing the background spread in detectors capturing overlapping fluorescence emissions [65] [55]. Understanding and quantifying this spreading is essential for any rigorous comparison of cytometric performance.
Core Technology Comparison: Conventional Compensation vs. Spectral Unmixing
The fundamental difference between conventional and spectral flow cytometry lies in their approach to detecting and correcting fluorescent signals.
Conventional Flow Cytometry
Conventional cytometers employ a "one detector–one fluorophore" approach. They use complex systems of optical filters (dichroic mirrors and bandpass filters) to direct narrow bands of light, approximating the emission peak of specific fluorophores, to dedicated detectors [3]. Spectral overlap is then corrected mathematically through a process called compensation, which subtracts spillover signal from non-primary detectors [66]. This system is inherently limited by the number of physical detectors and optical filters, with high-end systems typically analyzing up to 20-30 parameters [3].
Spectral Flow Cytometry
Spectral cytometers collect the entire emission spectrum of every fluorophore across a wide range of wavelengths. Instead of filter-based separation, the emitted light is scattered using a prism or diffraction grating and captured by an array of highly sensitive detectors [3] [66]. Overlapping signals are then resolved using mathematical unmixing algorithms (e.g., least-weighted squares) that compare the full-spectrum data from a multicolor sample to reference controls, separating the mixed spectra into individual fluorophore contributions [9] [55]. This allows for the simultaneous analysis of up to 50 parameters by leveraging subtle differences in spectral shape, even between fluorophores with overlapping peak emissions [3] [24].
Table 1: Fundamental Differences in Spillover Management Approaches
| Feature | Conventional Flow Cytometry | Spectral Flow Cytometry |
|---|---|---|
| Core Principle | Filter-based separation of peak emissions [66] | Full-spectrum capture and computational unmixing [3] [9] |
| Correction Method | Compensation (spillover subtraction) [55] | Spectral Unmixing (mixture modeling) [55] [66] |
| Detection System | Bandpass filters & photomultiplier tubes (PMTs) [3] | Prism/grating & detector arrays (e.g., 32-64 channels) [3] |
| Information Used | Intensity in a narrow band per detector [3] | Full emission shape across all lasers [9] |
| Autofluorescence | Generally not separated from specific signal | Can be extracted as a separate component [24] |
Figure 1: Signaling Pathways for Fluorescence Detection and Spillover Correction. Conventional cytometry relies on physical filters and post-acquisition compensation, while spectral cytometry captures full spectra and uses computational unmixing.
Key Metrics for Performance Assessment
Quantifying spillover and unmixing performance is essential for instrument comparison, quality control, and panel optimization. The following metrics are used across platforms.
The Spillover Spreading Matrix (SSM)
The Spillover Spreading Matrix is a cornerstone metric for quantifying the performance of an instrument and panel. It reflects the Poisson-based error in fluorescence quantification that remains after compensation or unmixing [67] [65]. Unlike the compensation matrix, which contains spillover coefficients, the SSM quantifies the resulting spreading of the signal.
- Calculation: The SSM is calculated from single-stain controls and an unstained control. The spillover spreading value (ΔσC) for a spillover parameter C is derived from the robust standard deviations of the stained (S) and reference (R) populations: ΔσC = √(σ²C(S) - σ²C(R)) [65]. This value is then normalized by the fluorescence intensity in the primary channel to create an intrinsic metric (SSCP) that is independent of brightness [65].
- Interpretation: SSM values represent a standard deviation of spillover, or signal spread. They are not percentages and are directly comparable [67] [55]. Values above 10 are generally considered high and indicate a combination of fluorophores that may significantly impair sensitivity [55]. The SSM is highly reproducible (CV under 30% over two months) and is instrumental for instrument quality control and identifying underperforming detectors [65].
Similarity Index and Complexity Index
In spectral cytometry, predicting panel performance prior to running samples is possible using indices derived from fluorophore spectra.
- Similarity Index: This index compares how similar the full spectral signatures of two fluorophores are on a scale from 0 (unique) to 1 (identical). A similarity index below 0.98 is typically required for two fluorophores to be successfully unmixed and used together in a panel [9].
- Complexity Index: This metric measures the overall spectral similarity of all fluorophores within a panel. It is a cumulative measure, with lower scores being better. Well-designed 10-color panels may have a complexity index of 2-3, while a 40-color panel might be 40-50 [9].
Unmixing-Dependent Spreading (UDS) and the Hotspot Matrix
For very large spectral panels (e.g., >40 colors), an additional phenomenon called Unmixing-Dependent Spreading becomes a primary limitation. UDS is a mathematical phenomenon where the variance of unmixed data increases due to the overall spectral overlap within a panel, irrespective of actual expression levels [68].
- The Hotspot Matrix: A novel computational tool, the Hotspot Matrix (H), predicts UDS based on spectral signatures alone. It is calculated as H = √|S⁻¹|, where S is the panel's similarity matrix. The diagonal values of H are known as Spreading Inflation Factors (SIFs), which predict how much a fluorophore's negative population will spread due to unmixing within the full panel context [68]. This metric is platform-agnostic and can be used for in-silico panel optimization before any experiments are conducted.
Table 2: Quantitative Metrics for Spillover and Unmixing Assessment
| Metric | Definition | Application | Ideal Value/Range |
|---|---|---|---|
| Spillover Spreading Matrix (SSM) | Standard deviation of spillover signal after correction [65]. | Instrument QC, panel performance, detector comparison [67] [65]. | <10 (Lower is better) [55]. |
| Similarity Index | Cosine similarity of two fluorophores' full spectra [9] [68]. | Fluorophore pair compatibility during panel design [9]. | <0.98 for resolvable pairs [9]. |
| Complexity Index | Overall spectral similarity of all fluorophores in a panel (Condition Number) [9] [68]. | Overall panel feasibility assessment [9]. | Lower is better; no absolute threshold [9]. |
| Spreading Inflation Factor (SIF) | Diagonal of Hotspot Matrix; predicts unmixing-dependent variance inflation [68]. | Predicting performance in ultra-high-parameter spectral panels (>40 colors) [68]. | Lower is better; ratio to single-color SIF near 1 [68]. |
Experimental Protocols for Metric Validation
Protocol for Determining the Spillover Spreading Matrix
This protocol is adapted from Nguyen et al. and is applicable to both conventional and spectral systems [65].
Sample Preparation:
- Prepare a single-stained control for every fluorophore in the panel. Using cells (e.g., PBMCs or cell lines) treated identically to full-panel samples is critical for accuracy, especially for tandem dyes [65] [10].
- Prepare an unstained control from the same cell source.
- Stain cells or compensation beads using standard procedures. For cells, stain with reagents in an appropriate buffer (e.g., R10) for 20 minutes, wash twice, and fix (e.g., in 0.5% formalin) [65].
Data Acquisition:
- Acquire data for all single-stained controls and the unstained control on the cytometer.
- For meaningful cross-experiment comparison, perform calibration using multi-dye reference particles before acquisition to ensure consistent dye-to-signal levels [65].
Data Analysis and Calculation:
- Create a compensation matrix from the single-stained controls using standard software (e.g., FlowJo).
- Apply compensation to the data.
- For each single-stained control, gate on the positive population.
- For a given fluorophore (primary detector P) and its spillover into another detector C:
- Calculate the robust standard deviation (rSD) of the spillover detector C for the stained (S) and reference (R) populations. rSD is typically calculated as FC84 - FC50 (the difference between the 84th and 50th percentiles of fluorescence in channel C) [65].
- Calculate the spillover spreading: ΔσC = √( (rSDC(S))² - (rSDC(R))² ) [65].
- Calculate the median fluorescence intensity (MFI) in the primary channel P: ΔFP = FP50(S) - FP50(R) [65].
- Compute the intrinsic spillover spreading value: SSCP = ΔσC / √ΔFP [65].
- Repeat for all fluorophore/detector pairs to populate the SSM.
Figure 2: Experimental Workflow for SSM Determination. The process requires single-stain controls and calculates intrinsic spreading values post-compensation.
Protocol for Validating Spectral Unmixing Purity
Ensuring accurate unmixing in spectral cytometry requires rigorous preparation of reference controls [9] [15].
Reference Control Preparation (The "Five Rules"):
- Bright is Better: The positive peak in the reference control must be as bright or brighter than in the multi-color sample [9].
- Like-With-Like: The autofluorescence of the positive and negative cells must be identical. This is crucial for viability dyes; use heat-killed cells, split and stain half (positive) and leave half unstained (negative) [9].
- Matched Fluorophore: Use the exact same fluorophore-antibody conjugate as in the multi-color sample [9].
- Same Lot of Tandem: For tandem dyes, use antibodies from the same manufacturing lot to control for lot-to-lot variation [9].
- Identical Conditions: Expose controls to the same buffers, fixatives, permeabilization reagents, staining time, and light/heat conditions as the full-panel sample [9] [15].
Validation of Unmixing Accuracy:
- Check for Unmixing Errors: After unmixing, plot all fluorophores on NxN plots. Look for asymmetrical "hypernegative" events, positive correlations between biologically unrelated markers, and oddly-shaped negative populations, which indicate unmixing errors [9] [10].
- Compare to Reference Library: Overlay the normalized spectrum from your single-stain control with the expected spectrum from an online spectrum viewer (e.g., from Cytek, BioLegend, or Thermo). Significant deviations suggest a problem with the control [10].
- Use FMO Controls: Fluorescence-minus-one (FMO) controls remain the gold standard for validating the resolution of markers within a fully stained sample and confirming that unmixing artifacts are not creating false positives [68].
The Scientist's Toolkit: Essential Research Reagent Solutions
Successful spillover assessment and high-quality panel performance depend on the appropriate selection of reagents and materials.
Table 3: Essential Materials for Spillover and Unmixing Experiments
| Item | Function & Importance | Best Practice Recommendations |
|---|---|---|
| Single-Stain Controls | Determine spillover coefficients and spectral signatures for unmixing. The quality of controls is the largest factor in data accuracy [9]. | Use cells, not beads, where possible. Cells must be treated identically to full-panel samples (same antibody, cell count, buffer, fixative) [10]. |
| Viability Dye | Distinguish live/dead cells. Dead cells are more autofluorescent, violating the "Like-With-Like" rule if not controlled properly [9]. | For reference controls, create a matched autofluorescence negative by using heat-killed, unstained cells from the same source as the positive control [9]. |
| Tandem Dyes (e.g., PE-Cy7, APC-Cy7) | Expand panel size by creating new emission profiles. Prone to instability, which alters their spectral signature [55] [15]. | Use the same antibody lot for controls and experiment. Validate stability over time; 0.5% formaldehyde can stabilize tandems for up to 5 days [15]. Avoid exposure to light and fixatives that accelerate breakdown. |
| Fixatives (e.g., Formaldehyde) | Preserve samples for later acquisition. Can affect fluorescence, especially of tandem dyes [15]. | Test different fixatives for your panel. 0.5% formaldehyde has been shown to maintain the integrity of a wide range of biomarkers better than stronger fixatives [15]. |
| Reference Particles / Beads | Instrument quality control and calibration. | Use for daily instrument calibration (e.g., PMT voltages) to ensure consistent signal levels for cross-experiment SSM comparison [65]. Use for single-stain controls only as a last resort [10]. |
| Online Spectrum Viewers (e.g., FluoroFinder, Cytek) | Panel design tools that calculate Similarity Index and Complexity Index prior to experimentation [55]. | Use during panel design to select fluorophore combinations with low similarity (<0.98) and to assess overall panel complexity [55]. |
The choice between conventional and spectral flow cytometry for managing spillover is not merely a technical preference but a strategic decision that impacts panel complexity, data resolution, and experimental throughput. Conventional cytometry, with its well-established compensation workflow, remains a robust solution for panels of up to approximately 20 parameters. However, spectral cytometry provides a superior foundation for high-dimensional analysis by leveraging full-spectrum data and computational unmixing, enabling the resolution of 40 or more colors while offering the unique ability to separate and subtract cellular autofluorescence [3] [24].
The quantitative metrics outlined—particularly the Spillover Spreading Matrix (SSM) for empirical performance measurement and the Similarity Index for predictive panel design—provide researchers with an objective framework for instrument qualification and panel optimization [67] [9] [65]. As panel sizes push beyond 40 colors, emerging metrics like the Hotspot Matrix and Spreading Inflation Factor (SIF) will become indispensable for predicting and mitigating unmixing-dependent spreading in silico, saving valuable time and resources [68]. Ultimately, the rigorous application of these metrics and protocols ensures that the data generated, whether on conventional or spectral platforms, is of the highest integrity and reliability, fueling confident scientific discovery and clinical decision-making.
The accurate identification and validation of cell populations are fundamental to advancements in immunology, oncology, and drug development. As research questions grow more complex, scientists must choose from an array of cytometric technologies, each with distinct strengths and limitations. Conventional flow cytometry (CFC), a workhorse technology for decades, relies on optical filters and detectors to measure fluorescence from labeled antibodies, with its resolution limited by spectral overlap and the need for complex compensation [36] [69]. The emergence of spectral flow cytometry (SFC) has marked a significant evolution. SFC captures the full emission spectrum of every fluorophore, using sophisticated unmixing algorithms to distinguish between dyes with highly overlapping emissions, thereby enabling deeper phenotyping with more parameters in a single tube [36] [3]. In a parallel development, mass cytometry (CyTOF) replaced fluorophores with heavy metal isotopes and detection optics with a mass spectrometer. This virtually eliminates spectral overlap and allows for the measurement of over 40 parameters simultaneously, though it comes with the trade-off of destroying cells and operating at a slower acquisition speed [70] [3].
This guide provides an objective, data-driven comparison of these three platforms, focusing on their performance in validating cell population identification. We will summarize quantitative performance data, detail experimental protocols for cross-platform validation, and provide resources to inform platform selection for specific research and clinical objectives.
Platform Comparison: Technical Specifications and Performance Data
The choice between conventional, spectral, and mass cytometry is multifaceted, hinging on factors such as panel size, sample availability, and the required throughput. The following sections and tables provide a detailed comparison to guide this decision.
Key Characteristics and Direct Comparison
Table 1: Core Characteristics of Cytometry Platforms
| Characteristic | Conventional Flow Cytometry (CFC) | Spectral Flow Cytometry (SFC) | Mass Cytometry (CyTOF) |
|---|---|---|---|
| Fundamental Principle | Fluorescence detection via optical filters and PMTs [69]. | Full-spectrum fluorescence detection and unmixing [3]. | Heavy metal isotope detection via mass spectrometry [3]. |
| Maximum Panel Size | 15-20 colors [70] [69] | 40+ colors [36] [70] | 40+ markers [70] |
| Multiplexing Capability | Limited by spectral overlap; requires compensation [36]. | High; excels at unmixing dyes with overlapping spectra [36] [3]. | Very High; minimal signal overlap due to distinct metal masses [70]. |
| Cell Throughput | High (tens of thousands of cells/second) [70]. | High (comparable to conventional) [70]. | Lower (hundreds of cells/second); causes cell destruction [70]. |
| Cell Integrity | Cells remain intact for sorting. | Cells remain intact for sorting. | Cells are destroyed during analysis. |
| Autofluorescence Handling | Limited correction capability. | Can be characterized and subtracted during unmixing [36]. | Not applicable, as there is no cellular autofluorescence [70]. |
Table 2: Performance in Application-Based Scenarios
| Scenario | Recommended Platform | Rationale and Supporting Data |
|---|---|---|
| High-Throughput Clinical Screening (e.g., CD4+ T-cell counts) | Conventional Flow Cytometry | Optimized for standardized, lower-parameter panels with high throughput and stable MFI measurements [70]. |
| Minimal Residual Disease (MRD) Detection | Spectral Flow Cytometry | Enables high-sensitivity (up to 0.001%), single-tube assays combining lineage and disease-specific markers, crucial for low-cellity post-treatment samples [36]. |
| High-Parameter Immune Profiling in Drug Discovery | Spectral or Mass Cytometry | Both support 40+ parameter panels. SFC is preferred with limited cell input (e.g., biopsies), while CyTOF excels for deep, complex phenotyping without autofluorescence [36] [70]. |
| Rare Population Analysis (e.g., CAR-T cell tracking) | Spectral Flow Cytometry | Enhanced resolution from autofluorescence extraction and sensitive detectors improves identification of rare cells (e.g., PD-1+ CD8+ CAR-T subsets) [36]. |
| Archived/Cryopreserved Sample Analysis | Spectral Flow Cytometry | Demonstrates robust performance with cryopreserved samples, enabling high-parameter immune profiling in retrospective and longitudinal studies [36]. |
Experimental Data from Comparative Studies
Validation studies consistently demonstrate the enhanced resolution of advanced platforms. For instance, in the context of Acute Lymphoblastic Leukemia (ALL), a 23-color spectral panel was developed to identify CD19-negative leukemic clones, a critical challenge following CD19-targeted therapies [36]. Furthermore, a supervised deep learning model for automated blast cell detection in ALL achieved a median F1 score of ≈0.94 when validated on 519 B-ALL samples, showcasing the power of computational tools in validating population identification [71].
In Acute Myeloid Leukemia (AML), a validated 24-color SFC panel for MRD detection demonstrated a sensitivity below 0.02%, while preserving marker correlation and improving the resolution of blast maturation states [36]. The table below summarizes key clinical applications and their achieved sensitivities.
Table 3: Validation Data for MRD Detection Across Hematologic Malignancies Using SFC
| Disease | SFC Panel Design | Achieved MRD Sensitivity | Key Advantage |
|---|---|---|---|
| B-ALL | 23-color panel | ~10⁻⁵ (0.001%) | Enhanced detection of dim antigens and CD19-negative clones [36]. |
| AML | 24-color single-tube assay | Down to 0.02% | High-resolution profiling of blast maturation in a single tube [36]. |
| CLL & Lymphoma | Panels with CD5, CD19, CD20, CD23, CD79b, ROR1 | As low as 0.005% | Improved specificity and detection of rare malignant clones [36]. |
| Multiple Myeloma | EuroFlow NGF markers in single-tube | ~10⁻⁶ (0.0001%) | Clear distinction of clonal vs. normal plasma cells [36]. |
Experimental Protocols for Cross-Platform Validation
Validating cell population identification across different cytometry platforms requires a rigorous and standardized approach. The following protocol outlines a methodology for comparing results from conventional, spectral, and mass cytometry.
Sample Preparation and Staining
- Sample Source and Pooling: Begin with a biologically relevant sample, such as human Peripheral Blood Mononuclear Cells (PBMCs). To minimize donor-specific variation, it is recommended to pool PBMCs from multiple healthy donors [70]. Divide the pooled sample into aligned aliquots for parallel processing on each platform.
- Viability and Fixation: Stain all sample aliquots with a viability dye (e.g., Fixable Viability Stain) to exclude dead cells from the analysis. After staining, gently fix the cells. For mass cytometry, this is a required step. For fluorescence-based platforms, fixation enhances biosafety and stabilizes the samples, though it is crucial to standardize the fixation time across aliquots to avoid epitope degradation [70].
- Panel Design and Staining: This is a critical step. Design panels for each platform that target an identical set of 10-15 core cellular markers (e.g., CD3, CD4, CD8, CD19, CD14, CD16, CD45, CD56). The specific fluorophore or metal conjugate for each marker must be selected from reagents commercially available and validated for each platform.
- Conventional Panel: Prioritize bright fluorophores (e.g., PE, APC) for low-abundance antigens and carefully manage spectral overlap during panel design [69].
- Spectral Panel: Leverage the ability to use fluorophores with highly overlapping spectra, but ensure their full spectral profiles are distinct enough for unmixing algorithms [3].
- Mass Cytometry Panel: Use metal-tagged antibodies for the same core markers. Custom conjugation may be necessary for some targets [70].
- Reference Staining: Include an aliquot stained with a backbone panel (e.g., just CD45) to identify unstained populations and set negative gates.
Data Acquisition and Analysis
- Data Acquisition: Acquire data on each platform according to the manufacturer's instructions. Aim to collect a minimum of 100,000 live, single cells from each aliquot to ensure sufficient event numbers for robust statistical comparison of populations.
- Automated Gating and Population Identification: To minimize subjective bias, use automated analysis tools for population identification.
- Data Preprocessing: Apply appropriate transformation (e.g., arcsinh) to all datasets [72].
- Unsupervised Clustering: Use algorithms like FlowSOM or PhenoGraph to identify cell populations in each dataset without prior manual gating [72] [73].
- Automated Phenotyping: Utilize tools like CytoPheno to assign standardized cell type names (e.g., "naïve CD4+ T cells") to the clustered populations based on their marker expression profiles. This links the identified clusters to established biological definitions, providing an objective basis for cross-platform comparison [72].
Validation and Comparison Metrics
The final step is to quantitatively compare the populations identified across platforms.
- Population Frequency Correlation: Calculate the frequency of each phenotypically defined population (e.g., CD4+ T cells, Monocytes) as a percentage of total live cells for each platform. Perform correlation analysis (e.g., Pearson correlation) on these frequencies across matched samples.
- High-Dimensional Concordance: Use cross-platform analysis tools to project the data from all platforms into a common low-dimensional space (e.g., using UMAP or t-SNE). Visually inspect whether cells from the same biological population cluster together regardless of the source platform.
- Statistical Testing: Apply statistical tests to confirm that the median expression levels of key defining markers for each major population are not significantly different between platforms.
The Scientist's Toolkit: Essential Research Reagent Solutions
Successful cytometry experiments, particularly those for cross-platform validation, rely on a suite of essential reagents and tools.
Table 4: Essential Reagents and Tools for Cytometry Validation Studies
| Item | Function | Considerations for Validation |
|---|---|---|
| Viability Dye | Distinguishes live cells from dead cells, improving data quality. | Select a dye compatible with fixation and all laser lines (for SFC/CFC) or that does not interfere with metal tags (for CyTOF). |
| Antibody Panels | Target-specific probes for cell surface and intracellular markers. | Use matched antibody clones across platforms whenever possible. Validate titration and staining index on each platform. |
| Compensation Beads | Used in CFC and SFC to calculate fluorescence spillover and generate unmixing matrices. | Critical for accurate SFC unmixing and CFC compensation. Use beads that bind the specific antibodies in your panel. |
| Cell ID / EQ Beads | Provides a reference standard for mass cytometry, normalizing signal detection over time. | Essential for correcting instrument sensitivity drift in CyTOF runs. |
| Automated Gating Software (e.g., FlowSOM, Citrus) | Provides unbiased, reproducible cell population identification. | Use the same algorithm and parameters to analyze data from all platforms to enable direct comparison [72] [73]. |
| Phenotyping Tools (e.g., CytoPheno) | Automatically assigns standardized cell type names to clustered populations. | Reduces subjective bias and leverages established ontologies (Cell Ontology) for consistent naming across studies [72]. |
The landscape of cell population identification has been transformed by spectral and mass cytometry, which offer high-dimensional capabilities far beyond conventional flow cytometry. The choice of platform is not a matter of which is universally "best," but which is most fit-for-purpose. Conventional flow cytometry remains the gold standard for high-throughput, routine clinical diagnostics. Mass cytometry is unparalleled for the deepest, most complex phenotyping studies where spectral overlap is a major limitation. Spectral flow cytometry strikes a powerful balance, offering high-parameter analysis on a user-friendly platform that is particularly suited for applications like MRD detection, rare cell population analysis, and working with precious, limited samples [36] [70].
The future of cytometry validation lies in the increased integration of automation and artificial intelligence. From automated sample preparation to AI-powered data analysis and automated cell naming, these tools are set to further reduce subjectivity, enhance reproducibility, and unlock the full potential of high-dimensional data, ultimately accelerating discovery in biomedical research and drug development [74] [75] [72].
Flow cytometry stands as a cornerstone technology in biomedical research and clinical diagnostics, enabling high-throughput, multiparameter analysis at the single-cell level. As research questions grow more complex, the demand for technologies that can simultaneously measure dozens of parameters with high sensitivity and resolution has intensified. This comparison guide provides an objective performance benchmark between conventional and spectral flow cytometry, focusing on three critical performance metrics: parameter capacity, sensitivity, and resolution. Understanding these technical distinctions is essential for researchers, scientists, and drug development professionals to select the most appropriate technology for their specific applications, from basic immunophenotyping to advanced high-dimensional cellular analysis.
Technical Comparison: Conventional vs. Spectral Flow Cytometry
The fundamental difference between conventional and spectral flow cytometry lies in their approach to detecting and resolving fluorescent signals. Conventional flow cytometry relies on optical filters and dichroic mirrors to direct specific wavelength bands to discrete detectors, typically photomultiplier tubes (PMTs). This "one-detector-per-fluorophore" approach requires mathematical compensation to correct for inevitable spectral overlap between fluorophores with broad emission spectra [19] [76]. In contrast, spectral flow cytometry captures the full emission spectrum of every fluorophore across a wide wavelength range (typically ~350-900 nm) using a prism or diffraction grating to scatter light across an array of detectors [19] [3] [77]. Advanced algorithms then "unmix" the combined fluorescent signals based on unique spectral signatures for each fluorophore [42].
Table 1: Core Technical Specifications and Performance Comparison
| Feature | Conventional Flow Cytometry | Spectral Flow Cytometry |
|---|---|---|
| Detection Principle | Filter-based, discrete wavelength bands [19] | Full-spectrum capture via dispersion [19] [3] |
| Spillover Correction | Compensation (mathematical subtraction) [19] [76] | Unmixing (algorithmic separation) [19] [42] |
| Typical Parameter Capacity | 15-20 colors [3] [76] | 30-40+ colors [19] [3] [42] |
| Autofluorescence Handling | Difficult to separate from specific signals [42] | Can be extracted as a separate signal [19] [42] [44] |
| Fluorophore Flexibility | Limited by filter configuration and peak emission separation [19] | High; can distinguish fluorophores with similar peaks but different spectral shapes [19] [44] |
Table 2: Quantitative Performance Benchmarking
| Performance Metric | Conventional Flow Cytometry | Spectral Flow Cytometry |
|---|---|---|
| Sensitivity (Signal Resolution) | High for well-separated fluorophores; diminished by compensation spread in complex panels [19] | Enhanced ability to resolve dim populations and separate overlapping signals [42] [44] |
| Resolution of Similar Fluorophores | Limited; requires distinct peak emissions [76] | High; utilizes full spectral signature, including off-peak emissions [19] |
| Detector Configuration | ~10-20 PMTs with bandpass filters [3] | 32-64+ channel detector arrays [3] |
| Impact on Panel Design | Must minimize spectral overlap during fluorophore selection [19] | Greater freedom, but requires validation of spectral uniqueness [19] [42] |
Experimental Protocols for Performance Benchmarking
Protocol: Assessing Parameter Capacity and Spillover
Objective: To quantitatively compare the maximum number of distinct markers that can be reliably detected in a single sample and the accuracy of spillover correction.
- Instrument Calibration: Use standardized calibration beads on both conventional and spectral cytometers to ensure proper laser alignment and detector sensitivity [19].
- Panel Design:
- For conventional flow cytometry, design a panel according to standard principles, matching bright fluorophores to low-abundance antigens and minimizing spillover between adjacent channels [19].
- For spectral flow cytometry, design a panel of equivalent markers, leveraging the ability to use fluorophores with overlapping peak emissions but distinct spectral signatures [42] [44].
- Control Preparation: Prepare single-color stained controls for every fluorophore used in the panel. This is essential for generating a compensation matrix for conventional flow and a reference spectral library for spectral flow [19] [76].
- Sample Acquisition: Run the fully stained sample and all single-color controls on both systems. For high-parameter panels (>20 colors), use a sample such as PBMCs or tumor digests that contains a complex mixture of cell populations [19].
- Data Analysis:
- Conventional: Apply compensation using the single-color controls. Analyze the data by assessing the resolution of positive and negative populations for each marker [76].
- Spectral: Apply the spectral unmixing algorithm using the reference library. Evaluate the clarity of population separation [19] [42].
- Metric: Calculate the spillover spreading error (for conventional) or unmixing accuracy (for spectral) by measuring the signal intensity in non-primary channels for each single-color control [19].
Protocol: Benchmarking Sensitivity and Resolution
Objective: To determine the ability of each technology to detect dimly expressed antigens and resolve closely spaced cell populations.
- Sample Preparation: Use a biologically relevant sample, such as PBMCs. Select a known dimly expressed antigen (e.g., a cytokine receptor or checkpoint inhibitor) and a bright antigen (e.g., CD45) for comparison.
- Staining: Stain the sample with antibodies for the dim and bright markers. Include an unstained control.
- Data Acquisition: Acquire data on both conventional and spectral cytometers, ensuring PMT voltages are set using standardized methods to allow direct comparison.
- Data Analysis:
- Sensitivity: For the dim marker, calculate the Stain Index (SI = [Median Positive - Median Negative] / [2 × SD of Negative]) for both systems. A higher SI indicates better sensitivity [42].
- Resolution: Use the unstained control and the bright marker to assess the impact of autofluorescence. In spectral flow, use the autofluorescence extraction feature and re-calculate the SI for the dim marker. Compare the results to the conventional data, where autofluorescence cannot be easily separated [42] [44].
Diagram 1: Signal detection and processing workflows for conventional and spectral flow cytometry.
Key Reagent Solutions for High-Dimensional Flow Cytometry
Successful execution of high-parameter experiments, whether on conventional or spectral platforms, relies on a suite of critical reagents and materials.
Table 3: Essential Research Reagent Solutions
| Reagent / Material | Function | Application Notes |
|---|---|---|
| Fluorophore-conjugated Antibodies | Specific detection of cellular antigens. | Choose bright fluorophores (e.g., PE, APC) for low-abundance antigens [76]. Spectral allows use of tandems and dyes with similar peaks [19]. |
| Viability Dye | Exclusion of dead cells to improve data quality. | Essential for both technologies. Fixable viability dyes are preferred for intracellular staining [42]. |
| Single-color Control Beads/Samples | Generate reference spectra or compensation controls. | Mandatory for creating a spectral library (spectral) or compensation matrix (conventional) [19] [76]. |
| Standardized Calibration Beads | Monitor instrument performance and align lasers. | Critical for ensuring day-to-day reproducibility and comparing data across platforms [19]. |
| Cell Staining Buffer | Provide optimal medium for antibody binding. | Should contain protein (e.g., BSA) and may require Fc receptor blocking agents. |
| Spectral Unmixing Software | Algorithmic separation of overlapping signals. | Platform-specific software (e.g., SpectroFlo, Cytek SpectroFlo) is required for spectral data analysis [3]. |
The benchmarking data clearly delineates the performance characteristics of conventional and spectral flow cytometry. Conventional flow cytometry remains a powerful, accessible technology for panels of up to 20 parameters, where careful panel design can effectively manage spectral overlap. However, spectral flow cytometry demonstrates superior performance in parameter capacity (enabling 30-40+ color panels), sensitivity (enhanced by autofluorescence extraction and improved resolution of dim signals), and resolution (through the ability to distinguish fluorophores based on full spectral signatures) [19] [42] [44]. The choice between technologies should be guided by experimental needs: conventional cytometry is sufficient for many focused applications, while spectral cytometry is indispensable for deep immunophenotyping, rare cell detection, and maximizing information from limited samples. As the field moves toward higher-dimensional analysis, spectral technology represents the evolving frontier in flow cytometry, empowering researchers to uncover deeper biological insights with greater clarity and confidence.
Flow cytometry stands as a cornerstone technique in biomedical research and clinical diagnostics, enabling high-throughput, multi-parameter analysis of cells at the single-cell level. The technology's evolution has been marked by a continuous drive toward increasing the number of parameters measured simultaneously, providing deeper insights into complex cellular systems, particularly in immunology and oncology. The emergence of spectral flow cytometry represents a significant technological shift from conventional flow cytometry, offering novel approaches to overcome historical limitations in multiparameter panel design. This case study provides a direct, evidence-based comparison of the performance of a 20+ color panel on conventional versus spectral platforms, focusing on experimental outcomes, technical requirements, and practical implications for researchers and drug development professionals. The critical distinction lies in their fundamental approach to fluorescence detection: conventional cytometry employs a "one detector–one fluorophore" system with optical filters and compensation, while spectral cytometry captures the full emission spectrum of all fluorophores using detector arrays and algorithmic unmixing [3] [78].
Technical Comparison: Conventional vs. Spectral Flow Cytometry
The fundamental difference between conventional and spectral flow cytometry resides in their optical detection systems and data processing methodologies. Understanding these core technological distinctions is essential for interpreting their performance differences in high-parameter panels.
Detection System Architecture
Conventional Flow Cytometry: Conventional instruments use a system of dichroic mirrors and bandpass filters to separate and direct specific wavelength ranges to dedicated photomultiplier tubes (PMTs). This creates a "one detector–one fluorophore" paradigm where each detector is tuned to a narrow band (typically 20-50 nm) approximating the emission peak of a specific fluorophore [3]. This architecture necessitates a complex optical system; a cytometer measuring 12 fluorophores may contain 12-14 independent detectors and more than 40 optical filters [3]. Increasing parameters requires adding more detectors and filters, significantly increasing instrument cost and complexity.
Spectral Flow Cytometry: Spectral cytometers replace the filter-based system with a prism or diffraction grating that scatters the full emission spectrum from each cell across an array of highly sensitive detectors (on average 40 or more) [3]. This design captures the complete fluorescent signature of every fluorophore present across a wide wavelength range. The result is a less optically complex system that eliminates the need for numerous custom filters, potentially reducing manufacturing costs while increasing data richness [3].
Data Resolution: Compensation vs. Spectral Unmixing
The approach to handling fluorescent signal overlap, a major challenge in multicolor panels, differs fundamentally between the two platforms.
Conventional - Compensation: In conventional cytometry, when fluorophore emission spectra overlap, the signal detected in a "primary" channel contains contributions from its intended fluorophore plus "spillover" from others. This is corrected post-acquisition through compensation, a mathematical process that subtracts the spillover contribution based on single-stain controls [78]. This process becomes increasingly error-prone as panel complexity grows beyond 20 markers, potentially leading to misinterpretation of dim or overlapping signals [44].
Spectral - Unmixing: Spectral cytometry uses the full emission spectrum (the "spectral fingerprint") of each fluorophore. During analysis, an unmixing algorithm employs a reference library of these fingerprints (from single-stain controls) to deconvolve the complex signal from each cell into the individual contribution of each fluorophore [3] [78] [44]. This method can resolve dyes with near-identical peak emissions and optionally extract cellular autofluorescence, improving signal resolution [44].
Table 1: Fundamental Technical Differences Between Conventional and Spectral Flow Cytometry
| Feature | Conventional Flow Cytometry | Spectral Flow Cytometry |
|---|---|---|
| Detection Principle | Filter-based, "one detector–one fluorophore" | Full-spectrum collection via prism/grating |
| Spillover Correction | Mathematical compensation | Algorithmic spectral unmixing |
| Autofluorescence Handling | Contributes to background, cannot be separated | Can be identified and computationally subtracted |
| Typical Max Parameters | ~15-30 [44] | 40+ [3] [44] |
| Optical Complexity | High (many filters & detectors per fluorophore) | Lower (fixed detector array) |
The following diagram illustrates the core workflow differences between the two technologies, from light detection to data resolution.
Case Study: A 20-Color Acute Myeloid Leukemia (AML) Panel
A direct comparison was conducted using a single-tube, 20-color panel for Acute Myeloid Leukemia (AML) analysis on a spectral flow cytometer, demonstrating the practical application and benefits of high-parameter spectral analysis [79].
Experimental Protocol and Workflow
Instrumentation: The study utilized a 5-laser Cytek Aurora spectral flow cytometer. Data were acquired using Cytek Assay Setting and analyzed with SpectroFlo software [79].
Panel Design: The panel comprised 20 markers, requiring careful fluorophore selection to minimize spectral overlap even with unmixing capabilities. The stability of pre-mixed antibody cocktails was a key focus.
Sample Preparation: Bone marrow samples were processed into single-cell suspensions. To ensure consistency and minimize donor-to-donor variation, the same bone marrow sample was stained in triplicate with either fresh or frozen antibody cocktails [79].
Staining Protocol:
- Cells were counted and aliquoted.
- An Fc receptor blocking step was likely performed to reduce non-specific antibody binding, a standard practice in flow cytometry [28].
- Cells were stained with the 20-color antibody cocktail (either fresh or frozen) for a specified period.
- Cells were washed to remove unbound antibody.
- Data was acquired on the spectral cytometer [79].
Controls: The study emphasized the importance of technical controls. Single-color reference controls were used to build the spectral library in the SpectroFlo software, which is essential for the unmixing algorithm. The stability of these stored reference controls was evaluated over time [79].
Key Experimental Findings
The study yielded critical data on the robustness and practicality of running a 20-color panel on a spectral system.
- Frozen Cocktail Stability: Antibody cocktails stored frozen provided comparable results to fresh cocktails in both cell population frequencies and Median Fluorescent Intensity (MFI) for most of the 20 markers for up to 12 weeks. A notable exception was CD19 conjugated to Super Bright 780, which showed a significant MFI drop (>30%) after just 2 weeks of freezing, highlighting the variable stability of certain fluorophores, especially tandem dyes [79].
- Spectral Library Stability: The single-color reference controls stored in the software library were successfully used to unmix data from the 20-color panel for at least 8 weeks, supporting a streamlined workflow by reducing the need for frequent control preparation [79].
- Workflow Efficiency: The research demonstrated that a single-tube, 20-color panel could replace multiple smaller tubes used in conventional cytometry, leading to greater reagent and sample efficiency. This is particularly valuable for precious samples like patient bone marrow [79].
Comparative Performance Analysis
When evaluating a 20+ color panel, the performance differences between conventional and spectral platforms become pronounced across several key metrics.
Panel Complexity and Fluorophore Selection
The selection and assignment of fluorophores to antigens are critical in both systems but follow different rationales.
- Conventional Limitations: In conventional cytometry, panel design is a stringent exercise in avoiding spectral overlap. Fluorophores with broad, overlapping emission spectra cannot be used to detect antigens expressed on the same cell population, as their spillover cannot be fully corrected by compensation [78]. This forces panel designers into a limited set of compatible fluorophores for large panels.
- Spectral Flexibility: Spectral cytometry provides greater flexibility because it can distinguish fluorophores based on their entire spectral fingerprint, not just their emission peak. This allows researchers to use dyes with very similar or even nearly identical peak emissions, provided their full spectral profiles are distinct enough for the unmixing algorithm [3] [44]. This significantly expands the usable palette of fluorophores for high-parameter panels.
Resolution and Data Quality
- Signal Resolution: Spectral cytometry demonstrates superior resolution in challenging scenarios. It is more capable of isolating dim signals and accurately resolving markers with low expression levels [44]. The ability to computationally identify and subtract autofluorescence – the inherent background fluorescence from cells – further enhances signal-to-noise ratio and improves the detection of dimly expressed antigens [44].
- Compensation Artifacts vs. Unmixing Accuracy: In conventional cytometry, high levels of spillover compensation can introduce artifacts and spread error, making it difficult to distinguish true dim positive populations from negative ones [78] [44]. Spectral unmixing, while not immune to error, is generally more robust at resolving complex mixtures of signals, leading to more accurate population identification in densely packed panels [78].
Table 2: Performance Comparison for 20+ Color Panels
| Performance Metric | Conventional Flow Cytometry | Spectral Flow Cytometry |
|---|---|---|
| Max Practical Panel Size | ~15-20 colors [78] | 40+ colors [3] [44] |
| Fluorophore Selection Flexibility | Lower (Must avoid overlap) | Higher (Can use overlapping dyes) |
| Dim Population Resolution | Challenging, limited by spillover | Enhanced, aided by autofluorescence removal |
| Data Analysis Process | Manual compensation, potential for error | Automated unmixing, more reproducible |
| Rare Population Detection | Possible with careful design | Enhanced sensitivity and resolution [80] |
Implementation Considerations for Researchers
The Scientist's Toolkit: Essential Reagents and Controls
Successful execution of a 20+ color panel, especially on a spectral platform, requires meticulous preparation and validation of reagents and controls.
Table 3: Essential Research Reagent Solutions for High-Parameter Flow Cytometry
| Reagent / Material | Function | Critical Considerations |
|---|---|---|
| Titrated Antibodies | To determine optimal staining concentration that maximizes signal-to-noise ratio. | Prevents under- or over-labeling; must be performed for each antibody individually under experimental conditions [28]. |
| Viability Dye | To distinguish and exclude dead cells from analysis. | Dead cells cause non-specific antibody binding; must be titrated and used before intracellular staining [28]. |
| Fc Blocking Reagent | To block Fc receptors on immune cells, reducing non-specific antibody binding. | Crucial for improving staining resolution, especially on monocytes and macrophages [28]. |
| Single-Stain Controls | To create a reference spectral library for unmixing (spectral) or calculate compensation (conventional). | Must be brighter than sample staining and use the exact same antibody-fluorophore conjugate and lot as the panel [28]. |
| Unstained Cells | To measure cellular autofluorescence and set photodetector voltages. | Must be from the same cell type and treatment condition as the experimental sample [28]. |
| FMO Controls | To accurately set gates for markers with low or continuous expression. | Contains all antibodies except one; essential for identifying background signal spread in complex panels [28]. |
Workflow and Experimental Design
The following diagram outlines the critical steps in the experimental workflow for a high-parameter panel, highlighting steps that differ between conventional and spectral approaches.
Platform Selection Guide
Choosing between conventional and spectral cytometry depends on the specific research needs and constraints.
Choose Conventional Flow Cytometry When:
- The research question can be answered with a panel of less than 15 colors.
- The laboratory has established, well-compensated panels and seeks reliable, reproducible data for routine immunophenotyping [80].
- Budget constraints are a primary concern, and the laboratory does not require high-parameter capability.
- The application involves cell sorting, as many spectral cytometers are analyzers-only (though this is changing) [3].
Choose Spectral Flow Cytometry When:
- The research requires deep immunophenotyping with 20 or more parameters from a single sample [3] [79] [80].
- The study focuses on identifying rare cell populations or resolving dimly expressed markers, benefiting from the enhanced sensitivity and autofluorescence subtraction [44] [80].
- Sample material is limited or precious (e.g., patient biopsies, rare clinical samples), as spectral allows maximum data extraction from a single tube [79] [80].
- There is a need for greater flexibility in panel design and a desire to avoid the complexities of manual compensation [44].
This direct comparison reveals that while conventional flow cytometry remains a powerful and sufficient tool for many applications requiring lower-parameter panels, spectral flow cytometry provides a definitive advantage for complex, 20+ color panel analysis. The case study on the AML panel demonstrates that spectral technology is not only feasible but also robust, enabling efficient, high-quality data generation from a single tube with streamlined workflows [79].
The core strengths of spectral cytometry lie in its full-spectrum detection and algorithmic unmixing, which together provide superior resolution, greater flexibility in fluorophore choice, and enhanced ability to detect dim markers and rare cell populations. For researchers and drug development professionals pushing the boundaries of cellular analysis in immunology, oncology, and beyond, spectral flow cytometry represents the evolving standard for high-parameter, high-information-content experimentation.
The evolution from conventional to spectral flow cytometry represents a paradigm shift in single-cell analysis, offering unprecedented power for deep immunophenotyping. However, this power introduces new complexities in data management. Future-proofing the high-dimensional data generated by these technologies has become a critical concern for researchers, scientists, and drug development professionals. The transition is marked by a move from traditional, well-established controls to a new landscape where standardized reporting and metadata are not just beneficial, but essential for data integrity, reproducibility, and longitudinal analysis.
Spectral flow cytometry fundamentally changes how fluorescence is detected. Unlike conventional flow cytometry, which uses dichroic mirrors and bandpass filters to guide specific wavelength ranges to individual detectors, spectral cytometers capture the full emission spectrum of every fluorophore using detector arrays [81]. This shift from a "one detector–one fluorophore" model to a holistic "spectral fingerprint" approach enables the simultaneous analysis of 30 to 40+ parameters in a single tube [44]. While this dramatically increases analytical depth, it also introduces greater complexity in panel design, validation, and data interpretation, thereby elevating the importance of rigorous metadata documentation to ensure that today's datasets remain usable and meaningful in the future.
Technological Comparison: Conventional vs. Spectral Controls
The core differences between conventional and spectral flow cytometry originate from their distinct optical designs and data processing methods. These foundational differences directly influence their requirements for controls, validation, and consequently, data standardization. The table below summarizes the key technical distinctions that impact data management practices.
Table 1: Fundamental Comparison of Conventional and Spectral Flow Cytometry
| Feature | Conventional Flow Cytometry | Spectral Flow Cytometry |
|---|---|---|
| Detection Principle | Dichroic mirrors and bandpass filters isolate narrow wavelength bands [3] [81] | Prisms or gratings disperse full emission spectrum onto a detector array [3] [82] |
| Data Correction | Compensation: mathematically subtracts spillover signal between adjacent detectors [81] [44] | Spectral Unmixing: algorithms separate signals based on full spectral signatures [81] [44] [24] |
| Typical Max Parameters | ~15-20 colors [81] [44] | 30-40+ colors [3] [44] [24] |
| Fluorophore Flexibility | Limited; requires distinct emission peaks to minimize spillover [81] | High; can utilize fluorophores with similar peaks but unique off-peak spectra [82] |
| Autofluorescence Handling | Manually gated out, potentially obscuring dim signals [44] [24] | Can be automatically extracted as a separate "signal" during unmixing [44] [24] [36] |
The following diagram illustrates the fundamental difference in how signals are detected and processed in each technology, which is the root cause of their different standardization needs.
Figure 1: Signal Detection and Processing Workflows. Conventional flow cytometry relies on physical filters and post-acquisition compensation, while spectral cytometry captures the full emission spectrum and uses algorithmic unmixing, creating different data management requirements.
The Critical Role of Metadata and Standardized Reporting
Why Standardization is Non-Negotiable for Spectral Data
The high-parameter nature of spectral flow cytometry makes traditional, ad-hoc data reporting insufficient. Standardized metadata collection is the bedrock of data longevity for several reasons. First, the algorithmic nature of spectral unmixing means that raw data files are not intuitively interpretable without the instrument-specific reference files (spectral libraries) used to "unmix" them [3] [82]. A dataset is only future-proof if the complete spectral library, including all single-color controls and their associated metadata, is permanently linked to the experimental data.
Second, the enhanced sensitivity of spectral cytometry, including its ability to extract autofluorescence, is highly dependent on the specific instrument configuration and unmixing algorithms used [24] [36]. Without documenting these details, it becomes nearly impossible to reproduce results or compare data acquired across different sites or times, undermining multi-center clinical trials and longitudinal studies. As one review notes, proper handling of autofluorescence is critical, as errors "may result in unmixing errors and false-positive events" [36].
Key Metadata Elements for Future-Proofing
To ensure data remains usable, the following elements must be rigorously documented:
- Complete Instrument Configuration: Laser wavelengths and powers, detector type and settings, and optical configuration [3] [5].
- Spectral Library Details: A record of every single-color control used to build the unmixing matrix, including fluorophore, conjugated antibody, clone, and lot number [82].
- Full Panel Information: The entire antibody panel, including all markers, fluorophore conjugates, and staining protocols [35] [82].
- Data Processing Steps: Details of the unmixing software, version, and any post-acquisition adjustments, such as autofluorescence subtraction [24] [83].
Experimental Protocols and Data Generation
Protocol for Validating a High-Parameter Spectral Panel
Validating a panel for spectral flow cytometry requires a meticulous, multi-step process to ensure accurate unmixing and minimal spreading error—a key metric for resolution in highly multiplexed panels [82].
- Single-Stain Control Preparation: For every fluorophore-conjugated antibody in the panel, prepare a control sample stained with that single antibody. Use the same cell type as the experimental samples (e.g., PBMCs or spleenocytes) to capture cell-specific autofluorescence. Cells or compensation beads can be used, but cells are preferred for their autofluorescence profile [82].
- Spectral Library Acquisition: Acquire data for each single-stain control on the spectral cytometer using the same instrument settings planned for the full panel experiment. This generates the reference "fingerprint" for each fluorophore.
- Full Stain Acquisition: Run the fully stained experimental sample and an unstained control.
- Unmixing and Matrix Validation: In the spectral analysis software, use the single-stain files to create a spectral unmixing matrix. Apply this matrix to the fully stained sample. Visually inspect the data for proper population separation and check for any negative values or "unmixing errors" that indicate poor spectral separation.
- Spreading Error Assessment: Use the instrument's software to generate a similarity or spread matrix. This quantitative tool predicts how much signal from one fluorophore will "spread" into another detector, helping identify and troubleshoot problematic fluorophore combinations [82].
Key Reagent Solutions for Robust Assays
The successful implementation of spectral flow cytometry relies on a suite of specialized reagents. The table below details essential materials and their functions in ensuring data quality.
Table 2: Essential Research Reagent Solutions for Spectral Flow Cytometry
| Reagent / Material | Function & Importance in Standardization |
|---|---|
| Spectral Flow Cytometer (e.g., Cytek Aurora, BD FACSymphony A5 SE, Thermo Fisher Attune Xenith) [3] [35] | Instrument with array detectors to capture full emission spectra; the specific model and configuration are critical metadata. |
| Fluorophore-Conjugated Antibodies | Include standards (e.g., BD Horizon Brilliant dyes) and new spectral dyes (e.g., BioLegend's APC/Fire 810, Biotium's CF dyes) designed to fill spectral gaps [3] [82]. |
| Single-Stain Controls | Samples stained with a single antibody-fluorophore conjugate; absolutely required to build the spectral unmixing library [82]. |
| Viability Stains (e.g., Fixable Viability Dyes) | Critical for excluding dead cells, which exhibit high nonspecific staining and autofluorescence, from the analysis. |
| Cell Preparation Reagents | Includes red blood cell lysis buffers and tissue dissociation kits for sample preparation; protocol must be standardized for reproducibility. |
| Reference Standardization Beads | Used for instrument calibration and performance tracking over time, ensuring day-to-day data consistency. |
Quantitative Data Comparison: Performance and Validation
Robust experimental data demonstrates both the enhanced capabilities of spectral cytometry and the critical need for standardized practices to manage its complexity. The following table synthesizes performance metrics from validation studies, highlighting the practical outcomes of well-controlled spectral assays.
Table 3: Experimental Data from Spectral Flow Cytometry Applications
| Application / Panel | Key Experimental Findings | Performance Metric & Validation Outcome |
|---|---|---|
| MRD Detection in AML (24-color panel) [36] | Single-tube assay for minimal residual disease detection in Acute Myeloid Leukemia. | Sensitivity < 0.02%; improved resolution of blast maturation states compared to conventional multi-tube panels. |
| MRD Detection in B-ALL (23-color panel) [36] | Identified CD19-negative leukemic clones, a key challenge post CD19-targeted therapy. | Sensitivity of ~10⁻⁵; successfully detected antigen-loss variants. |
| CAR-T Cell Biomarker Discovery (High-parameter panel) [36] | Identification of phenotypic signatures (e.g., PD-1+ CD8+ CAR-T subsets) correlated with clinical response in lymphoma. | Enabled comprehensive immune profiling from limited specimen availability (e.g., bone marrow aspirates). |
| Automated Gating Validation (BD ElastiGate Software) [83] | Automated analysis of complex datasets (e.g., CAR-T manufacturing, tumor immunophenotyping). | Achieved high accuracy vs. manual gating (Average F1 score > 0.9), reducing analysis time and subjective variability. |
The data in Table 3 underscores a key advantage of spectral cytometry: achieving high sensitivity and deep phenotyping with minimal sample input. This is particularly valuable in clinical settings with scarce samples, such as pediatric biopsies or longitudinal monitoring [24] [36]. Furthermore, the move towards automated analysis tools like ElastiGate [83] highlights the field's progression towards standardizing not just data acquisition, but also data interpretation, which is vital for reducing inter-operator variability and ensuring consistency in results.
The comparison between conventional and spectral flow cytometry reveals a clear trajectory: as analytical power grows, so does the dependency on rigorous standardized reporting. The future of high-dimensional, data-intensive biomedical research relies on the integrity and longevity of datasets. For researchers and drug developers, this means that adopting spectral technology must go hand-in-hand with adopting a culture of meticulous metadata curation. Future-proofing is not an add-on but an integral part of the experimental process. By systematically documenting instrument parameters, reagent details, and processing steps, we ensure that the rich biological insights unlocked by spectral flow cytometry today will remain a valid and valuable resource for the discoveries of tomorrow.
Conclusion
The choice between conventional and spectral flow cytometry controls is not merely technical but strategic, fundamentally influencing the depth and reliability of experimental outcomes. Conventional compensation, while robust for lower-parameter panels, faces challenges with complexity and spreading error. Spectral unmixing, leveraging full-spectrum analysis and autofluorescence extraction, empowers high-dimensional discovery but demands meticulous panel design and control preparation. The future of cytometry lies in the intelligent application of these complementary techniques, guided by rigorous standardization and validation, to unravel cellular complexity in immunology, oncology, and drug development. As the field progresses towards even higher parameter analysis, the principles of robust control implementation will remain the cornerstone of generating credible, reproducible data.
References
- 1. Conventional Flow Cytometry VS. Spectral Flow Cytometry [https://www.novusbio.com/antibody-news/conventional-flow-cytometry-vs-spectral-flow-cytometry?srsltid=AfmBOormMVHOFi4vTDkGxGrQ3Y0fqx3hUsCYM5tWVP2VByAvQKtE9lMO]
- 2. Spectral Flow Cytometry Fundamentals [https://www.thermofisher.com/us/en/home/life-science/cell-analysis/flow-cytometry/flow-cytometry-learning-center/flow-cytometry-resource-library/flow-cytometry-methods/spectral-flow-cytometry-fundamentals.html.html]
- 3. Spectral Flow Cytometry: The Current State and Future of ... [https://pmc.ncbi.nlm.nih.gov/articles/PMC12193525/]
- 4. Antibodies 101: Conventional vs Spectral Flow Cytometry [https://blog.addgene.org/antibodies-101-conventional-vs-spectral-flow-cytometry]
- 5. Spectral Flow Cytometry - PMC [https://pmc.ncbi.nlm.nih.gov/articles/PMC3556726/]
- 6. Spectral Flow Cytometry Data Analysis [https://www.thermofisher.com/us/en/home/life-science/cell-analysis/flow-cytometry/flow-cytometry-learning-center/flow-cytometry-resource-library/flow-cytometry-methods/spectral-flow-cytometry-data-analysis.html]
- 7. Conventional Flow Cytometry VS. Spectral Flow Cytometry [https://www.novusbio.com/antibody-news/conventional-flow-cytometry-vs-spectral-flow-cytometry?srsltid=AfmBOor3VbRh_8b8cHDxPKQZr9jnLrO8GLPTaW_9IGgo99PscSKsydfL]
- 8. Generalized Unmixing Model for Multispectral Flow Cytometry Utilizing Nonsquare Compensation Matrices - PMC [https://pmc.ncbi.nlm.nih.gov/articles/PMC4177998/]
- 9. Spectral Unmixing in Flow Cytometry: 7 Top Tips for Success [https://bitesizebio.com/70438/spectral-unmixing-in-flow-cytometry/]
- 10. Tips & Tricks: Optimizing Unmixing [https://www.colibri-cytometry.com/post/tips-and-tricks-optimizing-unmixing]
- 11. How to Prepare Spectral Flow Cytometry Datasets for High ... [https://pmc.ncbi.nlm.nih.gov/articles/PMC8640183/]
- 12. Principles of Advanced Flow Cytometry: A Practical Guide [https://pmc.ncbi.nlm.nih.gov/articles/PMC10802916/]
- 13. Flow Cytometry: The Complete Guide [https://www.antibodies.com/applications/flow-cytometry]
- 14. APD vs PMT and Beyond: Flow Cytometry Light Detectors [https://www.thermofisher.com/blog/life-in-the-lab/apd-vs-pmt-and-beyond-flow-cytometry-light-detectors/]
- 15. How to Optimize Unmixing in Spectral Flow Cytometry [https://kcasbio.com/blogs/all-mixed-up-implementing-best-practices-for-unmixing-in-spectral-flow-cytometry/]
- 16. Prism vs. Grating: A Detailed Comparison [https://www.test-and-measurement-world.com/articles/optics/prism-vs-grating-comparison]
- 17. Prism vs Grating: Spectrums | Details [https://hackaday.io/project/202421/log/242670-prism-vs-grating-spectrums]
- 18. Design of a Prism-Grating Wide Spectral Range ... [https://www.mdpi.com/1424-8220/23/11/5050]
- 19. Spectral Flow Cytometry Fundamentals [https://www.thermofisher.com/us/en/home/life-science/cell-analysis/flow-cytometry/flow-cytometry-learning-center/flow-cytometry-resource-library/flow-cytometry-methods/spectral-flow-cytometry-fundamentals.html]
- 20. Flow Cytometry: An Overview - PMC [https://pmc.ncbi.nlm.nih.gov/articles/PMC5939936/]
- 21. Flow cytometry [https://en.wikipedia.org/wiki/Flow_cytometry]
- 22. What is Spectral Flow Cytometry and How Does it Work [https://andor.oxinst.com/learning/view/article/an-introduction-to-spectral-flow-cytometry]
- 23. Spectral Flow Cytometry [https://www.bdbiosciences.com/en-us/learn/applications/multicolor-flow-cytometry/spectral-flow-cytometry]
- 24. Beyond the Limits: How Is Spectral Flow Cytometry ... [https://www.mdpi.com/2073-4409/14/13/997]
- 25. Flow Cytometry Experimental Process—Spectral versus ... [https://www.thermofisher.com/us/en/home/life-science/cell-analysis/flow-cytometry/flow-cytometry-learning-center/flow-cytometry-resource-library/flow-cytometry-methods/spectral-flow-cytometry-experimental-process.html]
- 26. Conventional Flow Cytometry VS. Spectral Flow Cytometry [https://www.novusbio.com/antibody-news/conventional-flow-cytometry-vs-spectral-flow-cytometry?srsltid=AfmBOopHsgBmx1H6bDLhsnCUW9QqcecSWeeWgQ1B7hUX58hlmEJCsHaN]
- 27. 3 Requirements For Accurate Flow Cytometry Compensation [https://expertcytometry.com/requirements-for-accurate-flow-cytometry-compensation/]
- 28. Spectral Flow Cytometry Panel Controls and Sample ... [https://www.thermofisher.com/us/en/home/life-science/cell-analysis/flow-cytometry/flow-cytometry-learning-center/flow-cytometry-resource-library/flow-cytometry-methods/spectral-flow-cytometry-panel-controls-sample-preparation.html]
- 29. Sample Preparation - USF Health - University of South Florida [https://health.usf.edu/medicine/corefacilities/flowcytometry/sample-preparation]
- 30. Experimental Controls For Reproducible Flow Cytometry ... [https://expertcytometry.com/experimental-controls-for-reproducible-flow-cytometry-measurements/]
- 31. Recommended controls for flow cytometry [https://www.abcam.com/en-us/technical-resources/guides/flow-cytometry-guide/recommended-controls-for-flow-cytometry]
- 32. Flow Cytometry Panel Design: The Basics [https://www.thermofisher.com/sc/en/home/references/newsletters-and-journals/bioprobes-journal-of-cell-biology-applications/bioprobes-71/bioprobes-71-flow-cytometry-panel-design.html.html]
- 33. Spectral Flow Cytometry [https://www.bdbiosciences.com/en-nl/learn/applications/multicolor-flow-cytometry/spectral-flow-cytometry]
- 34. The Technology Behind Spectral Flow Cytometry - Blog [https://blog.td2inc.com/the-technology-behind-spectral-flow-cytometry?hsLang=en]
- 35. Latest Developments in Flow Cytometry [https://fluorofinder.com/latest-developments-in-flow-cytometry/]
- 36. Beyond the Limits: How Is Spectral Flow Cytometry ... [https://pmc.ncbi.nlm.nih.gov/articles/PMC12248732/]
- 37. Spectral Flow Cytometry Panel Evaluation [https://www.thermofisher.com/us/en/home/life-science/cell-analysis/flow-cytometry/flow-cytometry-learning-center/flow-cytometry-resource-library/flow-cytometry-methods/spectral-flow-cytometry-panel-evaluation.html]
- 38. Enhancing diagnostics through flow cytometry [https://www.frontiersin.org/journals/oncology/articles/10.3389/fonc.2025.1604295/full]
- 39. Clinical validation of a real-time machine learning-based ... [https://pubmed.ncbi.nlm.nih.gov/40016870/]
- 40. Autofluorescence Subtraction - FlowJo Documentation [https://docs.flowjo.com/flowjo/experiment-based-platforms/plat-comp-overview/autofluorescence-subtraction/]
- 41. Autofluorescence in Flow Cytometry [https://fluorofinder.com/autofluorescence-in-flow-cytometry/]
- 42. Spectral Flow Cytometry: Understanding Its Advantages [https://kcasbio.com/blogs/spectral-flow-understanding-the-advantages/]
- 43. Conventional Flow Cytometry VS. Spectral Flow Cytometry [https://www.novusbio.com/antibody-news/conventional-flow-cytometry-vs-spectral-flow-cytometry?srsltid=AfmBOoqXkmToAv02xJMZygpBgxXxINiVpHtsp97jz8mPNXVINHHClXgH]
- 44. 5 Reasons to Try Spectral for Both Low and High ... [https://www.thermofisher.com/blog/life-in-the-lab/5-reasons-to-try-spectral-for-both-low-and-high-parameter-flow-cytometry/]
- 45. Five ways to extract autofluorescence (and store it) [https://www.colibri-cytometry.com/post/five-ways-to-extract-autofluorescence-and-store-it]
- 46. Flow Cytometry Controls - Tips for Better Data [https://www.bdbiosciences.com/en-eu/learn/science-thought-leadership/blogs/flow-cytometry-controls-tips-for-better-data]
- 47. FlowJo™ Software Previous Versions [https://flowjo.com/previous-versions-flowjo]
- 48. BD Biosciences at CYTO 2025 [https://www.bdbiosciences.com/en-us/learn/science-thought-leadership/events/bd-biosciences-cyto-2025]
- 49. Market Drivers & Projections for Flow Cytometry Software ... [https://www.linkedin.com/pulse/market-drivers-projections-flow-cytometry-software-2025-2032-ztdkc]
- 50. Conventional Flow Cytometry VS. Spectral Flow Cytometry [https://www.novusbio.com/antibody-news/conventional-flow-cytometry-vs-spectral-flow-cytometry?srsltid=AfmBOooTOOhPvDVMh4dBvR2QlRNl8amm7I0coxV0DTgV4g97I1hbZZ0-]
- 51. New & Emerging Spectral Flow Cytometry Instrumentation [https://fluorofinder.com/new-and-emerging-spectral-flow-cytometry-instrumentation/]
- 52. Advanced immunophenotyping of lymphocyte and ... [https://www.frontiersin.org/journals/immunology/articles/10.3389/fimmu.2025.1577206/full]
- 53. News Release Details [https://investors.cytekbio.com/news-releases/news-release-details/cytekr-biosciences-setting-new-standard-full-spectrum-flow/]
- 54. Expansion of Fluorophores for Spectral Flow Cytometry [https://fluorofinder.com/dyes-for-spectral/]
- 55. Spectral Spillover in Flow Cytometry [https://fluorofinder.com/spectral-spillover/]
- 56. Spectral Flow Cytometry Panel Design [https://www.thermofisher.com/us/en/home/life-science/cell-analysis/flow-cytometry/flow-cytometry-learning-center/flow-cytometry-resource-library/flow-cytometry-methods/spectral-flow-cytometry-panel-design.html]
- 57. Aurora Panel Design Tools | Cytometry and Antibody ... [https://voices.uchicago.edu/ucflow/project/cytek-aurora-panel-design/]
- 58. Deep metabolic profiling of immune cells by spectral flow ... [https://www.sciencedirect.com/science/article/pii/S2589004225011551]
- 59. CYTO 2025 Tutorials: The road to successful high ... [https://learning.isac-net.org/products/cyto-2025-tutorials-the-road-to-successful-high-parameter-spectral-cytometry-experiments-guidelines-for-control-optimization-handling-of-autofluorescence-and-quality-control]
- 60. Conventional Flow Cytometry VS. Spectral Flow Cytometry [https://www.novusbio.com/antibody-news/conventional-flow-cytometry-vs-spectral-flow-cytometry?srsltid=AfmBOopfjoy8o3sgmb9TASdUOZc28L6uJuF2USTRID9-5NN5-wJCGbvG]
- 61. Cross-laboratory evaluation of multiplex bead assays ... [https://pmc.ncbi.nlm.nih.gov/articles/PMC6122788/]
- 62. Quantitative flow cytometry enables end-to- ... [https://pmc.ncbi.nlm.nih.gov/articles/PMC10753385/]
- 63. Flow Cytometer Calibration and Size Reference Beads [https://www.thermofisher.com/us/en/home/life-science/cell-analysis/flow-cytometry/flow-cytometry-calibration/flow-cytometer-alignment-and-linearity-beads.html]
- 64. Flow cytometry-based validation of soluble biomarker ... [https://www.sciencedirect.com/science/article/pii/S2352551725000630]
- 65. Quantifying Spillover Spreading for Comparing Instrument ... [https://pmc.ncbi.nlm.nih.gov/articles/PMC3678531/]
- 66. Conventional Flow Cytometry VS. Spectral Flow Cytometry [https://www.novusbio.com/antibody-news/conventional-flow-cytometry-vs-spectral-flow-cytometry?srsltid=AfmBOorKZmUou0pd1Z0qcV-1Jf1dv5dJH-az7eBLvr7ZSQt896fO8Uti]
- 67. Spillover Spreading Matrix - FlowJo Documentation [https://docs.flowjo.com/flowjo/experiment-based-platforms/plat-comp-overview/spillover-spreading-matrix/]
- 68. Measurement and prediction of unmixing-dependent ... [https://pmc.ncbi.nlm.nih.gov/articles/PMC12139922/]
- 69. Conventional Flow Cytometry VS. Spectral Flow Cytometry [https://www.novusbio.com/antibody-news/conventional-flow-cytometry-vs-spectral-flow-cytometry?srsltid=AfmBOopuYa54oSb9_rmEqZuNfsPlEgtaFwbfu9BWQYMNlosJvFFww4Aq]
- 70. Spectral Flow and Mass Cytometry: Select the Right Platform [https://cellcarta.com/science-hub/spectral-flow-and-mass-cytometry/]
- 71. Automated identification of cell populations in flow ... [https://www.sciencedirect.com/science/article/pii/S0010482522001068]
- 72. Automated descriptive cell type naming in flow and mass ... [https://www.nature.com/articles/s41598-025-12153-w]
- 73. A Survey of Flow Cytometry Data Analysis Methods - PMC [https://pmc.ncbi.nlm.nih.gov/articles/PMC2798157/]
- 74. Flow Cytometry Market Trends 2025 | Forecast to 2034 [https://www.polarismarketresearch.com/industry-analysis/flow-cytometry-market]
- 75. Flow Cytometry Market Insights, Share & Outlook 2025–2032 [https://www.skyquestt.com/report/flow-cytometry-market]
- 76. . Conventional Flow Cytometry VS Spectral Flow Cytometry [https://www.bio-techne.com/resources/blogs/conventional-flow-cytometry-vs-spectral-flow-cytometry]
- 77. Transformation in Cell Analysis: From Conventional to Spectral ... Flow [https://rsisinternational.org/journals/ijrsi/articles/transformation-in-cell-analysis-from-conventional-to-spectral-flow-cytometry/]
- 78. Conventional Flow Cytometry VS. Spectral Flow Cytometry [https://www.novusbio.com/antibody-news/conventional-flow-cytometry-vs-spectral-flow-cytometry?srsltid=AfmBOoomK_10zVLGdH3VFV5TZnSFWTtsOKys1sqMPLvpk7QrPJNXGPSk]
- 79. ICCS 2025 [https://cytometry.org/public-admin/mobile/show_presentation.php?abstractno=149]
- 80. Is Conventional or Spectral Flow Cytometry Right for Your ... [https://cruxbiolabs.com/scientific-leadership/is-conventional-or-spectral-flow-cytometry-right-for-your-study-crux-biolabs-can-help-you-decide/]
- 81. Conventional Flow Cytometry VS. Spectral Flow Cytometry [https://www.novusbio.com/antibody-news/conventional-flow-cytometry-vs-spectral-flow-cytometry?srsltid=AfmBOopufdoaRmF5FZavaCxP1zKxtfAixBkBQQYcm2hPzhIfA_-KdDDa]
- 82. Considerations for Spectral Flow Cytometry Panel Design [https://fluorofinder.com/newsletter-considerations-for-spectral-flow-cytometry-panel-design/]
- 83. Automation of flow cytometry data analysis with elastic ... [https://www.nature.com/articles/s41598-025-99118-1]