Cross-Validation of Spectroscopic and Chromatographic Methods: A Strategic Framework for Enhanced Analytical Accuracy in Pharmaceutical Research
This article provides a comprehensive guide for researchers and drug development professionals on the cross-validation of spectroscopic and chromatographic methods.
Cross-Validation of Spectroscopic and Chromatographic Methods: A Strategic Framework for Enhanced Analytical Accuracy in Pharmaceutical Research
Abstract
This article provides a comprehensive guide for researchers and drug development professionals on the cross-validation of spectroscopic and chromatographic methods. It explores the foundational principles of these complementary techniques, detailing methodological applications for simultaneous analysis of complex drug formulations. The content addresses common troubleshooting scenarios and optimization strategies, and establishes a rigorous framework for validation and comparative analysis. By synthesizing current developments, including multiplex LC-MS/MS and high-throughput workflows, this resource aims to empower scientists with practical knowledge to ensure data reliability, regulatory compliance, and enhanced decision-making in pharmaceutical analysis and therapeutic drug monitoring.
Fundamental Principles: Understanding the Complementary Roles of Spectroscopy and Chromatography
In the realm of analytical chemistry, particularly within pharmaceutical development and natural product research, separation, identification, and quantification represent three fundamental processes. The cross-validation of results between spectroscopic and chromatographic methods is a cornerstone of rigorous scientific analysis, ensuring that findings are both accurate and reliable [1]. This guide provides an objective comparison of these techniques, focusing on their distinct roles, performance characteristics, and the powerful synergies created when they are combined in hyphenated analytical platforms.
The core of this comparison lies in understanding that these processes, while often used in tandem, have different primary objectives. Separation techniques, such as chromatography, are designed to physically isolate individual components from a complex mixture. Identification techniques, predominantly spectroscopy, are used to determine the molecular structure or identity of a compound. Quantification measures the amount or concentration of a specific substance present in a sample. Modern analytical science leverages the combined strengths of these approaches to overcome the limitations inherent in any single method [1] [2].
Core Conceptual Differences
The table below summarizes the fundamental objectives, technological focuses, and data outputs that distinguish separation, identification, and quantification processes.
Table 1: Fundamental Differences Between Core Analytical Processes
| Aspect | Separation | Identification | Quantification |
|---|---|---|---|
| Primary Objective | Isolate individual components from a complex mixture. | Determine the molecular structure or identity of a compound. | Measure the amount or concentration of a substance. |
| Technological Focus | Resolving power, peak capacity, and efficiency of partitioning. | Molecular interaction with electromagnetic radiation; spectral specificity. | Signal response linearity, dynamic range, and detection sensitivity. |
| Typical Data Output | Chromatogram (signal vs. time) showing separated peaks. | Spectrum (signal vs. wavelength/wavenumber) providing a molecular fingerprint. | Concentration value (e.g., mg/mL) with associated uncertainty. |
Comparative Performance of Analytical Techniques
Different analytical techniques offer varying strengths for identification and quantification tasks. The selection of a method depends on factors such as the required specificity, sensitivity, and the nature of the sample. The following table compares the performance of several common spectroscopic techniques based on a study of protein secondary structure, illustrating how methods can be evaluated against one another.
Table 2: Comparison of Spectroscopic Techniques for Protein Secondary Structure Analysis [3]
| Technique | Performance for α-Helix | Performance for β-Sheet | Key Application Parameters |
|---|---|---|---|
| ATR-IR Spectroscopy | Excellent (via PLS models) | Excellent (via PLS models) | High signal-to-noise in mid-IR range; minimal sample preparation. |
| Raman Spectroscopy | Excellent (via PLS models) | Excellent (via PLS models) | Provides complementary information to IR; sensitive to symmetric vibrations. |
| Far-UV CD Spectroscopy | Good (via CONTINLL algorithm) | Good (via CONTINLL algorithm) | Sensitive to chiral environments; ideal for solutions and rapid conformational analysis. |
| Polarimetry | Good (with new calibration) | Not reported as a strength | Rapid measurement; simpler instrumentation but less structural detail. |
Detailed Experimental Protocols
To illustrate how these concepts are applied in practice, below are detailed protocols for a typical experiment involving cross-validation between chromatographic and spectroscopic methods.
This protocol is critical for Halal and Kosher certification, addressing the need to distinguish between porcine, bovine, and fish gelatins.
- Objective: To identify the source of gelatin in a complex product matrix using FTIR spectroscopy coupled with multivariate data analysis.
- Sample Preparation:
- Extract gelatin from the product using a warm water bath (40-50°C).
- Precipitate and purify the gelatin if necessary.
- Prepare a thin film for FTIR analysis by depositing the purified gelatin solution onto an ATR (Attenuated Total Reflection) crystal and allowing the solvent to evaporate.
- Instrumental Analysis:
- Acquire FTIR spectra in the mid-IR range (e.g., 4000-400 cm⁻¹).
- Use a high-resolution spectrometer (e.g., 4 cm⁻¹ resolution) with 32 or more scans per spectrum to ensure a high signal-to-noise ratio.
- Data Processing and Identification:
- Pre-process spectra using standard normal variate (SNV) or multiplicative scatter correction (MSC), followed by derivative spectroscopy (e.g., Savitzky-Golay) to enhance spectral features.
- Employ chemometric techniques for pattern recognition:
- Principal Component Analysis (PCA): For unsupervised exploration of natural clustering between different gelatin types.
- Partial Least Squares-Discriminant Analysis (PLS-DA):
- Soft Independent Modeling of Class Analogy (SIMCA):
- Validate the model using a separate set of samples with known origins.
This protocol emphasizes the quantification of specific, clinically relevant compounds after their separation and identification.
- Objective: To accurately quantify the concentration of a target biomarker (e.g., a specific plant secondary metabolite) in a natural medicine extract.
- Sample Preparation:
- Powder the plant material using a laboratory mill.
- Perform solid-liquid extraction (e.g., maceration, sonication) using an appropriate solvent like methanol or hydroalcoholic mixtures.
- Filter and concentrate the extract, then reconstitute it in the initial mobile phase for LC-MS analysis.
- Chromatographic Separation (LC):
- Utilize a reverse-phase C18 column.
- Employ a binary gradient elution with mobile phases such as water (with 0.1% formic acid) and acetonitrile.
- Optimize the gradient program and flow rate to achieve baseline separation of the target biomarker from other co-extractives.
- Mass Spectrometric Quantification (MS):
- Operate the mass spectrometer in multiple reaction monitoring (MRM) mode for high specificity and sensitivity.
- Use an electrospray ionization (ESI) source, typically in positive or negative mode as optimized for the analyte.
- Generate a calibration curve by analyzing a series of standard solutions with known concentrations of the pure biomarker.
- Quantify the analyte in the sample extracts by comparing the integrated peak area from the MRM transition to the calibration curve.
Synergies in Hyphenated Techniques and Data Integration
The integration of separation with identification and quantification creates a powerful analytical workflow. This synergy is most evident in hyphenated techniques like LC-MS (Liquid Chromatography-Mass Spectrometry) or GC-IR (Gas Chromatography-Infrared Spectroscopy), where the instruments are physically coupled and an effluent from the chromatography system is directly introduced into the spectroscopy system [1].
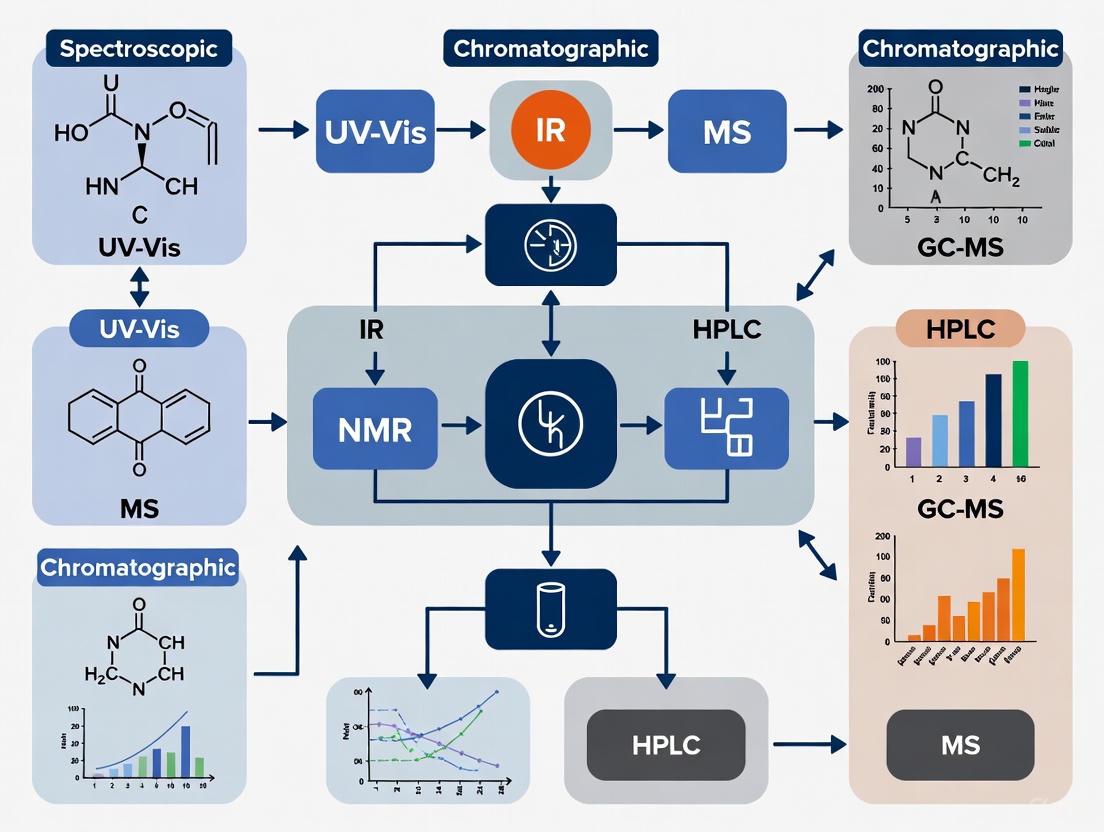
The following diagram illustrates the logical workflow and synergistic relationship between these processes in a hyphenated system.
This workflow shows how separation acts as a critical pre-processing step for identification. By simplifying the mixture, it reduces spectral overlaps and interferences, leading to more confident identifications [1]. Subsequently, a confident identification is a prerequisite for accurate quantification, as it ensures that the measured signal is correctly assigned to the target analyte. The quantification step then validates the entire process, providing the essential numerical data required for applications like drug development and quality control.
The Scientist's Toolkit: Essential Research Reagents and Materials
Successful execution of the protocols above requires specific, high-quality materials. The following table lists key reagents and their functions in analytical methods development.
Table 3: Essential Research Reagents and Materials for Analytical Method Development
| Reagent/Material | Function in Analysis | Example Use Case |
|---|---|---|
| Ultrapure Water | Serves as a solvent, mobile phase component, and for sample dilution without introducing impurities. | Critical for preparing mobile phases in HPLC to avoid baseline noise and column damage [4]. |
| Certified Reference Standards | Provides a known concentration and identity for calibrating instruments and validating methods. | Used to generate the calibration curve for accurate quantification in LC-MS [1]. |
| LC-MS Grade Solvents | High-purity solvents for mobile phases and sample preparation to minimize ion suppression and background noise. | Acetonitrile and methanol for LC-MS mobile phases ensure high sensitivity and reproducible retention times [1]. |
| Stationary Phases | The packed material within chromatography columns that enables separation based on chemical interactions. | C18 reverse-phase columns are standard for separating mid- to non-polar compounds [2]. |
| Chemometrics Software | Statistical software for processing and interpreting complex multivariate data from spectroscopic and chromatographic instruments. | Used for PCA and PLS-DA to classify gelatin sources based on FTIR spectral data [2]. |
Separation, identification, and quantification are distinct yet deeply interconnected processes in analytical chemistry. While separation techniques excel at purifying complex mixtures, spectroscopic methods provide unparalleled capabilities for structural elucidation and identification. Quantification ties these processes together by providing the essential numerical data required for decision-making.
The most significant advances in the field arise from the synergistic integration of these techniques, rather than from their use in isolation. Hyphenated instruments, combined with powerful chemometric tools, create a robust framework for the cross-validation of analytical results. This integrated approach is fundamental to progress in fields ranging from the authentication of halal pharmaceuticals [2] to the determination of protein secondary structure [3] and the comprehensive analysis of natural products [1], ultimately driving innovation and ensuring quality and safety in drug development and beyond.
Chromatographic techniques form the backbone of modern pharmaceutical analysis, providing the separation power necessary to resolve complex mixtures encountered in drug discovery, development, and quality control. Within the context of cross-validation research, where independent analytical methods verify each other's results, chromatography offers a orthogonal approach to spectroscopic techniques. The fundamental principle of chromatography involves the distribution of analytes between a stationary phase and a mobile phase, with different compounds migrating at varying rates based on their physicochemical properties. This separation mechanism provides a complementary approach to spectroscopic techniques, which primarily depend on the interaction of molecules with electromagnetic radiation. The cross-validation of spectroscopic results with chromatographic methods significantly enhances the reliability of analytical data in pharmaceutical research, as it combines separation-based identification with structural characterization capabilities.
Liquid chromatography with ultraviolet detection (LC-UV) represents one of the most established workhorses in pharmaceutical laboratories, offering robust quantitative analysis for compounds containing chromophores. Ultra-high performance liquid chromatography (UHPLC) has advanced these capabilities through the use of smaller particle sizes and higher operating pressures, delivering improved resolution and faster analysis times. Gas chromatography (GC) excels in separating volatile and semi-volatile compounds, making it indispensable for residual solvent analysis and metabolic profiling. Comprehensive two-dimensional liquid chromatography (2D-LC) represents a cutting-edge approach that combines two independent separation mechanisms, dramatically increasing peak capacity for the analysis of highly complex samples. Each technique offers distinct advantages and limitations that must be carefully considered when designing cross-validation protocols for pharmaceutical applications.
Technical Principles and Instrumentation
Fundamental Separation Mechanisms
The separation power of chromatographic techniques stems from differential partitioning of analytes between stationary and mobile phases. In reversed-phase LC, which dominates pharmaceutical applications, separation occurs primarily through hydrophobic interactions between analytes and alkylated stationary phases (typically C8 or C18), with polar aqueous-organic mobile phases driving elution [5]. The selectivity can be modulated through pH adjustment, organic modifier selection (acetonitrile or methanol), and temperature. In contrast, normal-phase chromatography utilizes polar stationary phases with non-polar organic mobile phases, separating compounds based on polarity differences. Hydrophilic interaction liquid chromatography (HILIC) represents a valuable alternative for retaining polar compounds, employing reversed-phase-type mobile phases with polar stationary phases [5].
Gas chromatography relies on volatility differences for separation, with analytes vaporized and carried through a capillary column by an inert gas mobile phase. Separation occurs through interactions between the gaseous analytes and the stationary phase coated on the column interior, with temperature programming enabling the elution of compounds with varying volatilities. The comprehensive 2D-LC approach combines two independent separation mechanisms (e.g., reversed-phase with ion-exchange or HILIC) to achieve dramatically increased peak capacities [6]. The orthogonality between dimensions—meaning the separation mechanisms are statistically independent—is crucial for maximizing the resolving power of 2D-LC systems [5].
Instrumentation Configurations
Table 1: Core Instrumentation Components Across Chromatographic Techniques
| Technique | Pump System | Injection System | Separation Column | Detection Options |
|---|---|---|---|---|
| LC-UV | Single high-pressure pump | Fixed-loop autosampler | C8/C18, 50-150 mm, 3-5 μm | UV/Vis DAD (190-800 nm) |
| UHPLC | Binary UHPLC pump (<1000 bar) | Low-dispersion autosampler | C8/C18, 50-100 mm, sub-2 μm | UV/Vis, MS, CAD, ELSD |
| GC | Gas pressure control (He, N₂, H₂) | Heated split/splitless injector | Fused silica capillary with stationary phase | FID, MS, ECD, NPD |
| 2D-LC | Dual (or more) independent pumps | Specialized interface (valve/loops) | Two different chemistries (e.g., RPLC+HILIC) | MS, UV, combination |
LC-UV systems typically incorporate a single pump delivering isocratic or gradient mobile phase, an autosampler, a stainless steel column packed with 3-5μm particles, and a UV/Vis detector. UHPLC instrumentation operates at significantly higher pressures (up to 1000-1500 bar) using pumps with improved hydraulic systems, low-dispersion tubing, and detectors with reduced cell volumes to maintain separation efficiency [5]. Modern UHPLC systems often incorporate binary or quaternary pumps for precise gradient formation and temperature-controlled column compartments for enhanced retention time stability.
GC systems consist of a pressurized gas supply, heated injector port, capillary column housed in a precision oven, and various detection options. Flame ionization detection (FID) provides universal response for organic compounds, while mass spectrometry (MS) offers identification capability. Comprehensive 2D-LC represents the most complex instrumentation, requiring two independent separation systems connected via an interface that manages fraction transfer between dimensions [5]. The most common interface employs an multi-port switching valve with dual storage loops that alternately collect and transfer effluent from the first to the second dimension [6]. This configuration enables continuous operation where the second dimension separation occurs concurrently with the first dimension separation.
Performance Comparison and Cross-Validation Applications
Analytical Figures of Merit
Table 2: Performance Characteristics of Chromatographic Techniques
| Technique | Peak Capacity | Analysis Time | Sensitivity | Orthogonality in Cross-Validation |
|---|---|---|---|---|
| LC-UV | 100-500 | 5-30 min | ng-μg (molar absorptivity dependent) | Complementary to NMR, IR for purity |
| UHPLC | 200-800 | 1-10 min | ng-μg (similar to LC-UV) | Higher throughput alternative to LC-UV |
| GC | 1,000-10,000 | 10-60 min | pg-ng (detector dependent) | Orthogonal to LC for volatile analytes |
| 2D-LC | 1,000-10,000 | 30-120 min | ng-μg (dilution factor limitation) | High orthogonality for complex mixtures |
The performance characteristics of each technique determine its suitability for specific cross-validation applications. LC-UV provides moderate peak capacity (typically 100-500) with analysis times ranging from 5-30 minutes, making it well-suited for quality control applications where robustness and cost-effectiveness are priorities [7]. Detection sensitivity is highly compound-dependent, determined by the molar absorptivity of the chromophore at the selected wavelength. UHPLC enhances separation efficiency through the use of sub-2μm particles, providing higher peak capacities (200-800) and shorter analysis times (1-10 minutes) compared to conventional LC [5]. The reduced particle size increases efficiency but requires instrumentation capable of withstanding higher operating pressures.
GC offers exceptional separation power with peak capacities reaching 1,000-10,000 in complex applications, particularly when comprehensive two-dimensional GC (GC×GC) is employed [8]. The technique provides excellent sensitivity for compatible analytes, with detection limits in the picogram to nanogram range depending on the detection method. Comprehensive 2D-LC represents the pinnacle of liquid separation power, with peak capacities reaching 1,000-10,000 [9]. This makes it particularly valuable for analyzing highly complex samples like natural product extracts, proteomic digests, and polymer mixtures that exceed the separation capacity of one-dimensional techniques.
Cross-Validation Applications in Pharmaceutical Research
Cross-validation of spectroscopic results with chromatographic methods provides enhanced confidence in analytical data through method orthogonality. LC-UV frequently serves as the reference method for potency assays in pharmaceutical quality control, with cross-validation against spectroscopic techniques like NMR or NIR confirming method accuracy [7]. The chromatographic separation preceding detection provides specificity that pure spectroscopy may lack, especially for complex formulations where excipients may interfere. For compounds with weak chromophores, LC with charged aerosol detection (LC-CAD) provides an alternative quantitative approach that responds independent of chemical structure, serving as an excellent orthogonal method for cross-validation [7].
UHPLC enables higher throughput cross-validation studies, with faster analysis times allowing more comprehensive method comparison within practical time constraints. In drug metabolism and pharmacokinetic studies, UHPLC-MS/MS often serves as the primary quantitative method, with cross-validation against LC-UV confirming results for higher concentration samples [10]. This approach combines the sensitivity of MS with the broader dynamic range and linearity of UV detection for comprehensive method verification.
GC and GC×GC provide orthogonal separation mechanisms for cross-validating LC-based methods, particularly for volatile analytes like residual solvents, metabolic profiling, and essential oil characterization [8]. The different separation principles (volatility versus polarity) and detection options make GC an ideal partner technique for verifying LC results in comprehensive testing schemes. Comprehensive 2D-LC offers unprecedented separation power for characterizing complex mixtures, with cross-validation against spectroscopic techniques confirming peak identity and purity. The structured chromatograms produced by orthogonal 2D-LC separations often group chemically related compounds, facilitating compound identification when combined with spectroscopic detection [5].
Experimental Protocols and Methodologies
LC-UV Method Development for Cleaning Verification
Cleaning verification represents a critical application of LC-UV in pharmaceutical manufacturing, ensuring equipment surfaces are free from API carryover between batches. A typical protocol involves: (1) Surface sampling using swabs wetted with an appropriate solvent; (2) Sample extraction from swabs; (3) LC-UV analysis with method-specific conditions [7]. For example, a validated 6-minute UHPLC-UV method for mometasone furoate determination employs a Waters Acquity UHPLC HSS T3 column (50 × 2.1 mm, 1.8 μm) at 40°C with acetonitrile and water (1:1, v/v) as isocratic mobile phase at 0.5 mL/min flow rate [7]. Method validation demonstrates linearity from 0.2-2.6 μg/mL, with precision and accuracy meeting regulatory requirements.
For multi-component cleaning verification, gradient methods provide simultaneous quantification of multiple APIs. Dong and colleagues developed a 10-minute gradient HPLC-UV method capable of quantifying multiple proprietary APIs at levels of 0.2 to 10 μg/mL [7]. Such universal methods significantly reduce method development time while maintaining the specificity required for reliable cleaning verification. The cross-validation of these LC-UV methods with spectroscopic techniques like FT-IR or direct surface analysis provides comprehensive cleaning verification, with each technique compensating for the limitations of the others.
Comprehensive 2D-LC Method Implementation
Implementing comprehensive 2D-LC requires careful optimization of multiple parameters to achieve successful separations. A standard protocol includes: (1) Selection of orthogonal separation mechanisms based on sample characteristics; (2) Optimization of first dimension conditions to maintain peak capacity with low flow rates (typically 0.1-0.5 mL/min); (3) Development of fast second dimension separations (typically 0.5-2 minutes) to maintain first dimension resolution; (4) Interface configuration ensuring efficient transfer between dimensions [5].
The combination of normal-phase LC in the first dimension with reversed-phase LC in the second dimension provides high orthogonality for natural product analysis, but presents significant mobile phase compatibility challenges [5]. The use of micro-flow rates in the first dimension helps reduce dilution and provides flow rates compatible with second dimension injection volumes. Alternatively, the combination of hydrophilic interaction liquid chromatography (HILIC) and reversed-phase conditions offers improved mobile phase compatibility while maintaining high orthogonality [5].
For complex samples requiring the ultimate in separation power, stop-flow methods can be implemented when the second dimension separation cannot keep up with the first dimension sampling frequency [5]. This approach allows the use of longer second dimension columns, enhancing resolution and peak capacity at the cost of increased analysis time. The implementation of active modulation techniques, such as stationary-phase assisted modulation or active solvent modulation, helps address mobile phase incompatibility issues that may arise when combining orthogonal separation mechanisms [9].
Inter-laboratory Cross-Validation Protocol
Cross-validation across multiple laboratories ensures analytical data comparability in global clinical trials. A representative protocol for lenvatinib determination in human plasma involved: (1) Method validation at each laboratory according to regulatory guidelines; (2) Cross-validation using quality control samples and clinical study samples with blinded concentrations; (3) Statistical comparison of results across laboratories [10]. In this study, seven bioanalytical methods were developed across five laboratories, employing different sample preparation techniques (protein precipitation, liquid-liquid extraction, or solid-phase extraction) but all utilizing LC-MS/MS detection [10].
The cross-validation demonstrated that accuracy of quality control samples was within ±15.3% and percentage bias for clinical study samples was within ±11.6% across all laboratories and methods [10]. This approach confirms that concentration data can be reliably compared across different laboratories and clinical studies, despite methodological differences. Such cross-validation is particularly important for pharmaceutical development, where studies often span multiple continents and years, requiring assurance of data consistency throughout the drug development lifecycle.
Research Reagent Solutions and Essential Materials
Table 3: Essential Research Reagents and Materials for Chromatographic Techniques
| Category | Specific Examples | Function in Analysis | Technical Considerations |
|---|---|---|---|
| Stationary Phases | C8, C18, HILIC, phenyl-hexyl, pentafluorophenyl | Molecular separation based on chemical interactions | Selectivity, pH stability, retention mechanism |
| Mobile Phase Additives | Formic acid, ammonium acetate, ammonium formate, TFA | Modulate retention, improve ionization, control pH | MS-compatibility, volatility, concentration optimization |
| Sample Preparation | Oasis HLB, C18, MCX, WCX cartridges | Extract, clean-up, and concentrate analytes | Recovery, selectivity, automation compatibility |
| Reference Standards | Certified reference materials, stable isotope-labeled internal standards | Quantification, method calibration, recovery determination | Purity, stability, traceability, availability |
The selection of appropriate research reagents and materials significantly impacts chromatographic method performance. Stationary phase chemistry determines the fundamental separation mechanism, with C18 providing reversed-phase retention for moderate to non-polar compounds, while HILIC phases retain polar compounds through a combination of partitioning and electrostatic interactions [5]. The trend toward superficially porous particles (also called core-shell) provides improved efficiency compared to fully porous particles, approaching the performance of sub-2μm particles without the same pressure limitations.
Mobile phase additives play a critical role in separation optimization and detection compatibility. Formic acid and acetic acid (typically 0.05-0.1%) improve protonation in positive ion MS detection, while ammonium acetate or formate (1-10mM) provide buffering capacity for retention time stability [10]. Trifluoroacetic acid (TFA) offers excellent peak shape for peptides and proteins but can cause significant ion suppression in MS detection, making it less suitable for LC-MS applications.
Sample preparation materials, particularly solid-phase extraction (SPE) sorbents, enable analyte extraction, clean-up, and concentration from complex matrices. Mixed-mode sorbents combining reversed-phase and ion-exchange mechanisms provide enhanced selectivity for basic or acidic compounds in biological matrices [10]. The move toward 96-well plate formats has automated and increased throughput for sample preparation in high-volume applications like bioanalysis and metabolomics.
Reference standards ensure method accuracy and precision, with certified reference materials providing traceability to international standards. Stable isotope-labeled internal standards (e.g., ²H, ¹³C, ¹⁵N) correct for variability in sample preparation and matrix effects, particularly in LC-MS bioanalysis [10]. The availability of appropriate reference materials often determines the feasibility of method development and validation for pharmaceutical compounds.
Workflow Visualization and Signaling Pathways
Chromatographic Analysis Workflow
The workflow for chromatographic analysis begins with sample preparation, where compounds of interest are extracted from the sample matrix and potential interferents are removed. Method selection follows, with technique choice dictated by analyte properties (volatility, polarity, stability), matrix complexity, and required sensitivity. The chromatographic separation then occurs, with compounds differentially partitioning between stationary and mobile phases based on their physicochemical properties. Detection follows separation, with technique selection (UV, MS, CAD, FID) determined by analyte characteristics and information requirements. Data analysis transforms detector signals into quantitative results through peak integration and calibration curves. Cross-validation with spectroscopic techniques confirms method accuracy and identifies potential interferences. The final stage involves scientific interpretation of results and reporting within the context of the study objectives.
2D-LC Instrument Configuration
The comprehensive 2D-LC system configuration employs two independent separation systems connected via a modulation interface. The first dimension pump delivers mobile phase through the first dimension column, where the initial separation occurs based on one retention mechanism (e.g., reversed-phase). The modulation interface, typically a multi-port switching valve with dual storage loops, continuously collects small-volume fractions of the first dimension effluent. The second dimension pump delivers a separate mobile phase, typically at higher flow rates, through the second dimension column with different selectivity (e.g., HILIC). The modulation interface alternately injects the collected fractions onto the second dimension column for rapid secondary separation. Finally, the detection system monitors the column effluent, with mass spectrometry providing the additional dimensionality needed for compound identification in complex mixtures.
Chromatographic techniques provide powerful separation capabilities that complement spectroscopic methods in comprehensive analytical strategies. LC-UV offers robust, cost-effective quantification for quality control applications, while UHPLC enhances throughput and resolution for demanding separations. GC provides exceptional separation power for volatile compounds, with comprehensive 2D-GC extending these capabilities to extremely complex mixtures. Comprehensive 2D-LC represents the cutting edge in liquid separation science, with orthogonality between dimensions dramatically increasing peak capacity for the most challenging samples.
The cross-validation of chromatographic and spectroscopic results establishes a foundation of data reliability in pharmaceutical research, with each technique compensating for the limitations of the others. As analytical challenges continue to evolve with increasingly complex pharmaceutical formulations and stricter regulatory requirements, the strategic implementation of orthogonal chromatographic techniques will remain essential for comprehensive product characterization. The continued development of stationary phases, instrumentation, and data analysis tools will further enhance the capabilities of these separation techniques, ensuring their central role in pharmaceutical analysis for the foreseeable future.
The integration of spectroscopic and spectrometric techniques with chromatographic methods represents a cornerstone of modern analytical science, particularly in pharmaceutical development and quality control. These hybrid approaches provide a powerful framework for cross-validating analytical results, ensuring data reliability, and meeting stringent regulatory requirements. Ultraviolet-Visible (UV-Vis) spectroscopy, Mass Spectrometry (MS), and Charged Aerosol Detection (CAD) each offer unique capabilities that address specific analytical challenges across the drug development pipeline. Within the framework of analytical cross-validation, these techniques provide complementary data streams that collectively build a comprehensive molecular understanding of drug substances and products.
The contemporary analytical laboratory leverages these techniques not in isolation, but as interconnected components of an integrated workflow. This guide provides a detailed comparison of UV, MS, and CAD technologies, focusing on their operational principles, performance characteristics, and practical application in conjunction with chromatographic separations. Recent instrumentation advances in 2025 have further enhanced the speed, sensitivity, and workflow efficiency of these techniques, making them more accessible and powerful than ever for researchers and drug development professionals tasked with ensuring product quality, safety, and efficacy.
Technique Fundamentals and Instrumentation Trends
The foundational principles of UV, MS, and CAD dictate their specific applications, strengths, and limitations within the analytical laboratory. Understanding these core mechanisms is essential for selecting the appropriate technique for a given analytical challenge.
UV-Vis Spectroscopy operates on the principle of electronic transitions, where molecules absorb light in the ultraviolet and visible regions (typically 190-800 nm), promoting electrons to higher energy states. The resulting absorption spectrum provides information about chromophore presence and concentration. A significant 2025 development in UV-Vis instrumentation focuses on improved optical stability through robust components with fewer moving parts, thermal regulation, and solid-state light sources, which reduces drift over time and increases instrument lifespan [11]. Modern systems also feature smaller footprints without compromising performance, addressing the premium on bench space in shared and mobile laboratories [11]. Furthermore, intuitive user interfaces with guided workflows and real-time visual feedback have become standard, minimizing training time and user error for multidisciplinary teams [11].
Mass Spectrometry separates and detects ionized atoms or molecules based on their mass-to-charge ratio (m/z). Its unparalleled specificity comes from its ability to precisely determine molecular mass and elucidate structural features through fragmentation patterns. The dominant trend in 2025 MS instrumentation is the push toward higher performance in smaller formats. Benchtop systems now deliver capabilities once reserved for floor-standing instruments, with Waters' Xevo MRT MS, for example, providing ultra-high 100k resolution with sub-ppm sensitivity in a compact qTOF format [12]. There is also a significant shift toward top-down proteomic approaches for intact protein analysis, overcoming limitations of bottom-up methods for characterizing proteoforms and post-translational modifications [12]. Instruments like Bruker's timsTOF series and Thermo Fisher's Orbitrap Astral Zoom are designed for this purpose, offering faster scan speeds, higher throughput, and expanded multiplexing capabilities [13] [12].
Charged Aerosol Detection is a universal chromatographic detection technique based on aerosol mass measurement. The effluent from a chromatograph is nebulized into droplets, which are dried to remove volatile mobile phase components, leaving analyte particles. These particles are then charged and detected by a highly sensitive electrometer, generating a signal proportional to the analyte mass [14]. A key characteristic of CAD is its uniform response for non-volatile and semi-volatile analytes, which simplifies quantitation even in the absence of authentic standards [14]. Recent advances focus on optimization and troubleshooting protocols to ensure data quality and instrument reliability. Critical parameters include optimizing the Power Function Value (PFV) to improve dynamic range and linearity, and employing an inverse gradient (admixed post-column solvent) to minimize baseline drift in gradient elution methods [14].
Table 1: Comparative Overview of Fundamental Techniques
| Feature | UV-Vis Spectroscopy | Mass Spectrometry (MS) | Charged Aerosol Detection (CAD) |
|---|---|---|---|
| Fundamental Principle | Electronic energy transitions | Mass-to-charge ratio separation & detection | Aerosol charging & charge measurement |
| Detection Mechanism | Photodetection of absorbed light | Ion detection (e.g., electron multiplier) | Electrometer measurement of particle charge |
| Primary Output | Absorption spectrum (A vs. λ) | Mass spectrum (Intensity vs. m/z) | Chromatogram (Response vs. Time) |
| Key Instrument Trends (2025) | Compact designs, intuitive interfaces, stable optics [11] | Top-down proteomics, benchtop high-resolution, workflow efficiency [13] [12] | Optimized PFV for linearity, inverse gradient for gradient elution [14] |
| Sample Destructiveness | Non-destructive | Destructive | Destructive |
Performance Comparison and Experimental Data
Selecting the appropriate analytical technique requires a clear understanding of performance metrics and how they relate to specific application needs. The following section provides a detailed, data-driven comparison.
Sensitivity and Dynamic Range: MS consistently offers the highest sensitivity, capable of detecting analytes at femtomole to attomole levels, particularly in Selected Reaction Monitoring (SRM) modes on triple quadrupole instruments. The Thermo Orbitrap Excedion Pro MS, for instance, provides enhanced sensitivity for characterizing biotherapeutics like monoclonal antibodies [13]. CAD provides universal detection for non-volatile compounds with sensitivity typically in the low nanogram range [14]. Its response is relatively uniform across chemically diverse analytes, which is a significant advantage over UV for compounds lacking a strong chromophore. UV-Vis sensitivity is highly dependent on the molar absorptivity of the analyte, with typical detection limits in the microgram range for compounds with good chromophores. A 2025 study on pharmaceutical tablets demonstrated that UV-Vis can provide sufficient sensitivity for real-time release testing, with effective sample characterization up to 0.4 mm penetration depth [15].
Specificity and Universality: MS is the unrivaled leader in specificity due to its ability to discriminate by exact mass and generate unique fragmentation patterns. The Orbitrap Astral Zoom MS, for example, enables deeper proteomic coverage and more confident biomarker identification [13]. UV-Vis specificity is low to moderate, as spectra are often broad and overlapping, though diode array detection can aid in peak purity assessment. CAD is a universal technique, providing a response for any non-volatile analyte, but it offers no inherent structural information, relying entirely on chromatographic separation for specificity [14].
Table 2: Quantitative Performance Comparison for Representative Applications
| Performance Parameter | UV-Vis Spectroscopy | Mass Spectrometry (MS) | Charged Aerosol Detection (CAD) |
|---|---|---|---|
| Typical Detection Limit | Microgram range | Femtomole to attomole range | Low nanogram range [14] |
| Dynamic Range | ~2-3 orders of magnitude | 4-6 orders of magnitude | 3-4 orders of magnitude (can be extended with PFV optimization) [14] |
| Universality of Response | Response requires a chromophore | Response depends on ionization efficiency | Universal for non-volatile analytes [14] |
| Quantitative Precision (RSD) | Typically <1% | Typically 1-5% (can be higher with complex samples) | 0.4%-2.1% (demonstrated for sialic acids) [16] |
| Key Quantitative Strength | Well-suited for high-throughput concentration assays | Unmatched sensitivity and specificity for targeted assays | Uniform response enables quantification without pure standards [14] |
Chromatographic Integration and Cross-Validation workflows
The true power of UV, MS, and CAD is realized when they are coupled with chromatographic separation techniques, primarily High-Performance Liquid Chromatography (HPLC). This combination provides a multidimensional analytical platform where separation and detection are optimized independently.
HPLC-UV/VIS remains the most widely deployed combination for quantitative analysis of chromophoric compounds in quality control laboratories due to its robustness, ease of use, and cost-effectiveness. Its application in impurity profiling is well-established.
HPLC-MS is the gold standard for identification, structural elucidation, and trace-level quantification. Its superiority in cross-validation comes from its ability to provide definitive identity confirmation based on molecular mass and fragmentation pattern, orthogonal to retention time. The 2025 introductions of systems like the Thermo Orbitrap Excedion Pro, which combines Orbitrap mass analysis with alternative fragmentation technologies, are particularly impactful for the characterization of complex biomolecules, enabling a deeper understanding of biotherapeutics [13].
HPLC-CAD excels where UV detection is inadequate and MS detection is unnecessary or problematic. It is a premier choice for quantifying compounds lacking chromophores, such as carbohydrates, lipids, inorganic ions, and surfactants. A salient 2025 application from the field of biopharmaceuticals is the determination of total sialic acid in therapeutic proteins using a label-free HPLC-CAD method [16]. This method utilized a mixed-mode HILIC-IEX separation with an in-line pre-column protein trap, successfully validating the method for specificity, linearity (R > 0.999), precision (RSD 0.4-2.1%), and accuracy (recovery 93-102%) [16]. This showcases CAD's role in cross-validating critical quality attributes that are challenging for other techniques.
The diagram below illustrates a generalized workflow for cross-validating analytical results using these complementary techniques.
Figure 1: Workflow for Cross-Validating Chromatographic Results. This diagram illustrates how a single sample, after HPLC separation, can be analyzed in parallel or sequentially by three detection techniques (UV, MS, CAD). The resulting data streams are fused to provide a cross-validated analytical result, leveraging the unique strengths of each detector.
Essential Research Reagents and Materials
Successful implementation of these analytical techniques requires careful selection of supporting reagents and materials. The following table details key components for a standardized workflow, such as the HPLC-CAD method for sialic acid quantification.
Table 3: Key Research Reagent Solutions for Featured HPLC-CAD Workflow
| Reagent/Material | Function/Purpose | Example from Literature |
|---|---|---|
| Mixed-Mode HILIC-IEX Column | Stationary phase for retention and separation of polar, ionizable sialic acids. | Used in HILIC-IEX separation of NANA and NGNA [16]. |
| Pre-column C18 Protein Trap Cartridge | In-line removal of proteins to prevent interference and analytical column contamination. | Replaceable C18 cartridge for direct injection of protein samples [16]. |
| Volatile Mobile Phase Salts | Provides ionic strength for HILIC-IEX separation while maintaining CAD compatibility. | Ammonium formate or ammonium acetate used in mobile phase [16] [17]. |
| Charged Aerosol Detector (CAD) | Universal detection of non-volatile sialic acids post-separation. | Used for quantification of underivatized sialic acids [16] [14]. |
| High-Purity Water | Critical for mobile phase preparation and sample reconstitution to minimize background noise. | Ultrapure water from systems like Milli-Q [16]. |
| Sialidase Enzyme | Enzymatic release of sialic acids from glycoproteins for total sialic acid determination. | SialEXO used to hydrolyze sialic acids from therapeutic proteins [16]. |
Application Protocols: HPLC-CAD for Sialic Acid Quantification
The following detailed protocol is adapted from the 2025 study that developed and validated a label-free HPLC-CAD method for determining total sialic acid in therapeutic proteins [16]. This protocol serves as a concrete example of a modern CAD application addressing a real-world bioanalytical challenge.
A novel label-free HPLC method utilizing mixed-mode hydrophilic interaction-ion exchange liquid chromatography (HILIC-IEX) coupled with charged aerosol detection (CAD) for the quantification of total sialic acid (N-acetylneuraminic acid, NANA, and N-glycolylneuraminic acid, NGNA) in therapeutic protein drug products.
Experimental Workflow
Figure 2: HPLC-CAD Workflow for Sialic Acid Analysis. This diagram outlines the key steps in the label-free quantification of total sialic acid in therapeutic proteins, highlighting the integrated protein trapping and HILIC-IEX separation.
Step-by-Step Procedure
Sample Preparation (Desialylation):
- Transfer an aliquot of the therapeutic protein solution (containing approximately 50-200 µg of protein) to a centrifugal filter unit (e.g., 10 kDa MWCO).
- Exchange the formulation buffer with an enzymatic reaction buffer (e.g., 25 mM sodium phosphate, pH 6.0) via centrifugation.
- Add sialidase enzyme (e.g., SialEXO, 2000 units) to the retentate.
- Incubate the mixture at 37°C for 3 hours to quantitatively release sialic acids.
- Filter the hydrolysate through the centrifugal device. The released sialic acids (NANA and NGNA) will be in the filtrate, while the desialylated protein is retained.
Chromatographic Separation and Detection:
- HPLC System: Configure a UHPLC or HPLC system with a mixed-mode HILIC-IEX column (e.g., Acclaim Mixed-Mode WAX-1). The system should be equipped with a six-port valve and a replaceable pre-column C18 cartridge (e.g., 4.6 × 10 mm) installed prior to the injection valve for in-line protein trapping.
- Mobile Phase: Prepare a volatile mobile phase. Mobile Phase A: 90% Acetonitrile (ACN) with 10% 100 mM Ammonium Formate (pH 4.5). Mobile Phase B: 10% ACN with 90% 100 mM Ammonium Formate (pH 4.5).
- Gradient: Use a linear gradient from 100% A to 60% A over 10 minutes, at a flow rate of 0.8 mL/min.
- Detection: Use a Charged Aerosol Detector. Set the evaporator temperature to 40°C and the data collection rate to 10 Hz. Optimize the Power Function Value (PFV) for the desired dynamic range (typically between 1.0 and 2.0).
- Injection: Directly inject the filtered hydrolysate (recommended: 5-10 µL).
Quantification:
- Identify NANA and NGNA peaks by comparing their retention times with those of authentic standards.
- Construct a calibration curve (e.g., 1-100 µg/mL) for NANA and NGNA. The method demonstrated excellent linearity (R > 0.999) [16].
- Calculate the total sialic acid content in the original protein sample based on the summed peak areas of NANA and NGNA, using the calibration curve and accounting for dilution factors.
Key Method Parameters and Validation Data
The developed method was rigorously validated, demonstrating satisfactory performance characteristics essential for a robust analytical procedure [16]:
- Specificity: Achieved baseline separation of NANA and NGNA without interference from the protein matrix.
- Linearity: R > 0.999 over the validated range.
- Precision: Repeatability demonstrated by RSD between 0.4% and 2.1%.
- Accuracy: Recovery of sialic acids ranged between 93% and 102%.
- Sensitivity: Quantitation limit (QL) was below 25 ng.
The synergistic use of UV-Vis spectroscopy, Mass Spectrometry, and Charged Aerosol Detection provides a powerful, multi-faceted toolkit for modern pharmaceutical analysis. As demonstrated, each technique occupies a distinct niche: UV-Vis for robust, cost-effective quantification of chromophores; MS for unparalleled specificity, sensitivity, and structural elucidation; and CAD for universal detection of non-volatile analytes where UV and MS face limitations. The ongoing evolution of these technologies in 2025—toward greater sensitivity, miniaturization, user-friendliness, and workflow integration—further solidifies their central role. When strategically deployed within a framework of cross-validation, either in parallel or via orthogonal method development, these techniques provide the comprehensive data integrity required to advance drug candidates confidently from discovery through development and into quality-controlled manufacturing, ultimately ensuring the delivery of safe and effective therapeutics.
In the rigorous world of analytical science, particularly in regulated industries like pharmaceutical development and food safety, the reliability of analytical methods is paramount. Cross-validation has emerged as a critical process to ensure that different analytical methods, whether within the same laboratory or across multiple sites, produce comparable, reliable, and accurate data. This process is especially crucial when comparing established methods with emerging technologies or when methods are transferred between laboratories. The International Council for Harmonisation (ICH) M10 guideline explicitly mandates cross-validation to demonstrate data comparability when multiple bioanalytical methods or laboratories are involved in a single study or across studies whose data will be compared [18]. Without proper cross-validation, discrepancies between methods can lead to incorrect conclusions about a drug's pharmacokinetics, efficacy, or safety, ultimately compromising regulatory decisions and public health [18].
The fundamental rationale for cross-validation lies in its ability to provide assurance of method reliability across three essential analytical performance characteristics: specificity, accuracy, and precision. Specificity ensures that the method can distinguish the analyte from interfering components in complex matrices. Accuracy reflects the closeness of measured values to the true value, while precision indicates the agreement between a series of measurements from multiple sampling of the same homogeneous sample. In complex matrices—such as biological samples, food products, or environmental samples—the presence of interfering components makes these parameters challenging to maintain, thus necessitating robust cross-validation protocols. This article examines the application of cross-validation through the lens of spectroscopic and chromatographic method comparison, providing a structured framework for analytical scientists and researchers.
Theoretical Foundations of Cross-Validation
Defining Cross-Validation in Analytical Contexts
Cross-validation in analytical science serves a distinct purpose from its namesake in machine learning. In the context of method validation, cross-validation is defined as a comparison of validation parameters of two bioanalytical methods to ensure data comparability [18]. This process is required when data are obtained from different fully validated methods within a study, from different laboratories using the same bioanalytical method, or from different fully validated methods across studies that will be combined or compared to support special dosing regimens or regulatory decisions regarding safety, efficacy, and labeling [18].
The statistical foundation of cross-validation rests on demonstrating that two methods provide equivalent results within defined acceptance criteria, or that any systematic bias between methods is quantified and accounted for in data interpretation. Unlike traditional validation parameters that often have predefined acceptance criteria (e.g., ±15% for accuracy and precision), cross-validation under ICH M10 deliberately omits specific acceptance criteria, instead emphasizing statistical approaches to assess comparability [18]. This represents a significant shift from previous industry practices where Incurred Sample Reanalysis (ISR) criteria were often applied as a surrogate benchmark for cross-validation acceptance [18].
The Challenge of Complex Matrices
Complex matrices present unique challenges for analytical methods, particularly regarding specificity. Biological samples like plasma, serum, or tissue homogenates contain numerous interfering substances that can co-elute or produce signals that overlap with the target analyte. Similarly, food matrices contain a wide variety of compounds that can interfere with analysis [19] [20]. These matrix effects can disproportionately affect different analytical techniques, making cross-validation between disparate methods especially important.
For instance, chromatographic methods like HPLC separate analytes from matrix components temporally, while spectroscopic techniques like ICP-MS or Raman spectroscopy must rely on spectral resolution or sample preparation to minimize interferences [19]. Without proper cross-validation, a method might appear valid for a simple standard solution but fail to provide accurate results in complex sample matrices. Cross-validation exercises specifically test whether different methods can overcome these matrix effects consistently, ensuring results are comparable regardless of the analytical technique employed.
Cross-Validation Methodologies and Regulatory Frameworks
Regulatory Expectations and Guidelines
The regulatory landscape for cross-validation has evolved significantly with the implementation of ICH M10, which establishes global standards for bioanalytical method validation. According to these guidelines, cross-validation should be performed to demonstrate data comparability when multiple methods or laboratories are involved in generating data for a single study or across studies where comparison will be performed [18]. However, unlike other validation parameters, ICH M10 does not specify acceptance criteria for cross-validation, creating both challenges and opportunities for the industry to develop scientifically sound approaches [18].
Prior to ICH M10, bioanalytical method validation was guided by regional guidelines from the FDA and EMA. The FDA's 2018 Bioanalytical Method Validation Guidance emphasized cross-validation when two or more methods are used to generate data within the same study or across different studies, but similarly did not define specific acceptance criteria [18]. The EMA 2011 Guideline provided more specific guidance, suggesting that when quality control (QC) samples are used for cross-validation, the mean accuracy between QCs of each method should be <15%, and when study samples are used, at least two-thirds of the samples should be within 20% [18]. The transition to ICH M10 represents a move away from rigid pass/fail criteria toward more nuanced statistical assessment of comparability.
Practical Implementation Approaches
Implementing cross-validation requires careful experimental design and statistical analysis. The fundamental principle involves analyzing the same set of samples using both methods being compared. These samples can include calibration standards, quality control samples, and, most importantly, actual study samples that represent the complete matrix complexity [18]. The resulting data are then subjected to statistical analysis to determine the level of agreement between methods and to identify any consistent bias.
ICH M10 recommends assessing the bias between methods using statistical approaches, with the responsibility for implementing and interpreting statistical analysis often falling on clinical pharmacology or biostatistics departments rather than the bioanalytical laboratory alone [18]. This collaborative approach ensures that the end users of the data understand any nuances in method comparability and can make informed decisions about combining or comparing data from different sources. The outcome of a cross-validation study should be either a confirmation that methods are equivalent or a quantification of bias that can be accounted for in data interpretation [18].
Experimental Design for Cross-Validation Studies
Sample Selection and Preparation
Proper sample selection is critical for meaningful cross-validation results. The samples used should represent the entire range of concentrations expected in actual study samples and should include the complete biological or material matrix with all its potential complexities. For pharmaceutical applications, this typically means using incurred samples (samples from dosed subjects) rather than just spiked quality control samples, as incurred samples may contain metabolites or matrix effects not present in artificially prepared samples [18].
The number of samples should be sufficient to provide adequate statistical power for comparing methods. While there is no universally prescribed number, regulatory guidelines from other contexts (such as incurred sample reanalysis) often use 5-10% of study samples or a minimum number of samples (e.g., 20) as a benchmark [18]. Samples should be aliquoted appropriately to ensure that each method tests portions from the same original sample, and stability of the analytes during the testing process should be confirmed.
Experimental Workflow for Method Comparison
The following workflow visualization outlines a generalized approach for conducting cross-validation studies between analytical methods:
Figure 1: Cross-Validation Workflow for Analytical Methods
Comparative Analysis of Spectroscopic and Chromatographic Methods
Methodological Principles and Strengths
Chromatographic methods, particularly reversed-phase high-performance liquid chromatography (RP-HPLC), separate compounds based on their differential partitioning between a mobile and stationary phase. When coupled with detection methods like diode array detection (DAD) or mass spectrometry, HPLC provides high specificity, accuracy, and precision for quantifying target analytes in complex matrices [21]. The AQbD (Analytical Quality by Design) approach further enhances method robustness by systematically identifying and controlling factors that impact method performance [21].
Spectroscopic techniques encompass a broad range of technologies that measure the interaction between matter and electromagnetic radiation. These include atomic techniques like inductively coupled plasma optical emission spectrometry (ICP-OES) for elemental analysis [22], molecular techniques like Raman spectroscopy [19], and nuclear magnetic resonance (NMR) spectroscopy for structural information [19]. These methods often offer advantages in speed, minimal sample preparation, and the ability to perform non-destructive analysis.
Quantitative Performance Comparison
The table below summarizes key performance characteristics of representative spectroscopic and chromatographic methods based on recent applications in complex matrices:
Table 1: Performance Comparison of Analytical Techniques in Complex Matrices
| Analytical Technique | Application Context | Specificity Indicators | Accuracy/Recovery | Precision (RSD) | Detection Limits | Reference |
|---|---|---|---|---|---|---|
| RP-HPLC with DAD | Favipiravir quantification in tablets | Peak purity >99%; Resolution from impurities | 98-102% | <2% | Not specified | [21] |
| ICP-OES | Trace element analysis in coffee | Spectral resolution of element-specific emissions | 93.4-103.1% | <10% (relative error <20%) | LOQ: 0.06-7.22 µg/kg | [19] |
| ICP-MS | Heavy metals in plastic food packaging | Mass resolution of target isotopes | 82.6-106% | Not specified | LOD: 0.10-0.85 ng/mL | [19] |
| Raman Spectroscopy | Alcohol measurement in beverages | Unique molecular fingerprint spectra | Comparable to reference methods | Not specified | Non-destructive, through-container | [19] |
| LA-ICP-OES | Solid food material analysis | Spatial and spectral resolution | Relative error <20% for most elements | >10% reproducibility | LOQ: 0.06 μg/g (Sr) to 400 μg/g (S) | [19] |
Comparative Experimental Data
Recent studies provide direct comparisons between methods for specific applications. In pharmaceutical analysis, an RP-HPLC method developed using an AQbD approach for favipiravir quantification demonstrated excellent performance characteristics, with system suitability parameters within United States Pharmacopeia (USP) limits and RSD values <2%, indicating high precision [21]. The method showed excellent linearity, sensitivity, and selectivity, with the mobile phase consisting of acetonitrile and disodium hydrogen phosphate anhydrous buffer (pH 3.1, 20 mM) in an 18:82 v/v ratio, using an Inertsil ODS-3 C18 column (250 mm, 4.6 mm, 5 μm, and 100 Å) with DAD detection at 323 nm [21].
In elemental analysis, ICP-OES methods have been validated for assessing chemical purity in radiopharmaceutical production. One study established that ICP-OES met validation criteria for most elements, though aluminum and calcium suffered from matrix effects [22]. The apparent molar activity calculated by ICP-OES was congruent with DOTA-titration-based effective molar activity when these problematic elements were excluded, demonstrating how cross-validation can identify specific limitations in analytical methods [22].
Case Studies: Cross-Validation in Practice
Pharmaceutical Quality Control
In a recent study validating methods for quality assessment of 67Cu from cyclotron production, researchers performed rigorous cross-validation between ICP-OES and γ-spectrometry methodologies [22]. The ICP-OES method was validated for determining non-radioactive metal impurities, while HPGe γ-spectrometry was validated for assessing radionuclidic purity. This approach recognized that neither technique alone could provide complete quality assessment—ICP-OES quantified chemical impurities but could not distinguish radioactive isotopes, while γ-spectrometry identified radionuclidic impurities but could not quantify stable metal contaminants [22].
The cross-validation revealed that apparent molar activity calculated by ICP-OES aligned with effective molar activity determined by DOTA-titration when specific elements affected by matrix effects (Al and Ca) were excluded from the calculation [22]. This finding demonstrates how cross-validation can identify specific limitations in analytical methods and guide appropriate data interpretation strategies for regulatory submissions.
Food Authentication and Adulteration Detection
In food science, cross-validation between spectroscopic techniques has become increasingly important for detecting adulteration. A systematic review of analytical techniques for yogurt adulteration detection found that infrared, Raman, fluorescence, NMR spectroscopy, and hyperspectral imaging, when combined with chemometric approaches or machine learning models, consistently achieve high sensitivity and specificity [20]. These spectroscopic methods were effective at detecting adulterants such as vegetable oils, non-dairy proteins, and synthetic additives, with performance validated through cross-correlation with multiple techniques [20].
The integration of machine learning algorithms like principal component analysis, partial least squares methods, support vector machines, artificial neural networks, and deep learning approaches has enhanced discrimination accuracy, enabling reliable classification of adulterated samples even at trace concentrations [20]. This represents an advanced form of cross-validation where computational models serve as virtual validation tools against multiple analytical techniques.
The Scientist's Toolkit: Essential Materials for Cross-Validation Studies
Table 2: Essential Research Reagents and Materials for Cross-Validation Experiments
| Item | Function in Cross-Validation | Application Example | Critical Considerations |
|---|---|---|---|
| Certified Reference Materials (CRMs) | Provide traceable standards for method calibration and accuracy assessment | TraceCERT Multielement standard for ICP-OES calibration [22] | Certification according to ISO/IEC 17025 and ISO 17034 ensures reliability |
| Matrix-Matched Quality Controls | Assess method performance in relevant sample matrices | Incurred biological samples for bioanalytical method comparison [18] | Should represent complete matrix complexity, not just spiked standards |
| Internal Standard Solutions | Correct for analytical variability and matrix effects | Stable isotope-labeled analogs in mass spectrometry | Should be absent from native samples and not interfere with analyte detection |
| Chromatographic Columns | Provide separation mechanism for LC-based methods | Inertsil ODS-3 C18 column for RP-HPLC [21] | Column batch-to-batch reproducibility affects method transfer |
| Sample Introduction Systems | Interface samples with analytical instruments | Laser ablation systems for solid sample ICP-OES [19] | Must provide representative sampling of heterogeneous materials |
| Data Analysis Software | Enable statistical comparison of method results | MODDE 13 Pro software for Monte Carlo simulation [21] | Should implement appropriate statistical tests for method comparison |
Advanced Visualization: Cross-Validation Decision Pathway
The following diagram illustrates the decision-making process for interpreting cross-validation results and determining appropriate actions based on statistical outcomes:
Figure 2: Cross-Validation Results Decision Pathway
Cross-validation serves as a critical bridge between analytical techniques, ensuring that data generated from different methods, instruments, or laboratories maintain the specificity, accuracy, and precision required for informed decision-making in pharmaceutical development, food safety, and other regulated fields. The move away from rigid pass/fail criteria toward statistical assessment of comparability, as embodied in ICH M10, represents a maturation of the field—acknowledging that analytical method performance exists on a continuum rather than as a binary outcome [18].
As analytical technologies continue to evolve, with spectroscopic methods offering increasingly rapid and non-destructive analysis and chromatographic methods providing unparalleled separation power, the role of cross-validation will only grow in importance. By implementing robust cross-validation protocols that include appropriate sample selection, statistical analysis, and bias assessment, researchers can confidently combine and compare data across multiple analytical platforms, ultimately accelerating scientific discovery while maintaining the highest standards of data integrity.
Regulatory Framework and Guidelines Governing Analytical Method Cross-Validation
Analytical method cross-validation represents a critical process in pharmaceutical development and quality control, ensuring that analytical methods produce comparable and reliable results when transferred between different laboratories, instruments, or methodologies. For researchers and drug development professionals working with spectroscopic and chromatographic methods, cross-validation provides scientific evidence that methods perform consistently across different analytical platforms, thereby supporting data integrity and regulatory submissions. Within the framework of a broader thesis on cross-validation of spectroscopic results with chromatographic methods, this guide examines the regulatory expectations, experimental protocols, and practical implementation strategies that govern this essential process.
The modern regulatory landscape has evolved from a prescriptive "check-the-box" approach to a more scientific, risk-based lifecycle model. Recent guidelines, including the simultaneous release of ICH Q2(R2) and ICH Q14, emphasize building quality into analytical methods from the initial development phase rather than treating validation as a one-time event [23]. This paradigm shift recognizes that analytical procedures exist within a dynamic ecosystem where changes in instrumentation, site operations, and technological advancements necessitate robust cross-validation protocols to ensure ongoing data reliability, particularly when correlating results between sophisticated analytical platforms like spectroscopy and chromatography.
Key Regulatory Guidelines and Their Applications
The regulatory framework for analytical method cross-validation is established through several harmonized guidelines from international organizations and regulatory bodies. These guidelines provide the foundation for demonstrating method equivalence and ensuring data integrity during method transfers between laboratories or across different analytical platforms.
Table 1: Key Regulatory Guidelines Governing Analytical Method Cross-Validation
| Regulatory Body | Guideline | Focus Areas | Cross-Validation Requirements |
|---|---|---|---|
| International Council for Harmonisation (ICH) | ICH Q2(R2): Validation of Analytical Procedures [23] | Validation parameters, modernized approach for new technologies | Establishes foundational validation criteria that must be demonstrated across sites |
| International Council for Harmonisation (ICH) | ICH Q14: Analytical Procedure Development [23] | Analytical Target Profile (ATP), risk-based development | Promotes proactive definition of performance criteria for cross-site consistency |
| U.S. Food and Drug Administration (FDA) | M10 Bioanalytical Method Validation [24] | Bioanalytical assays for nonclinical/clinical studies | Harmonized expectations for regulatory submissions |
| U.S. Food and Drug Administration (FDA) | Guidance for Industry on Analytical Procedure Validation [25] | Lifecycle approach, data integrity throughout | Focus on continued method verification rather than one-time validation |
| European Medicines Agency (EMA) | EU GMP Annex 15: Qualification and Validation [25] | Risk-based validation, process validation lifecycle | Requires risk assessment to determine validation extent |
| World Health Organization (WHO) | WHO Technical Report Series [25] | Analytical method validation parameters | Global framework emphasizing method suitability for diverse settings |
The Lifecycle Approach to Method Validation
Contemporary regulatory thinking, as reflected in recent ICH and FDA guidelines, has embraced a lifecycle approach to analytical procedures [23] [25]. This perspective recognizes that method validation is not a single event but an ongoing process that begins with method development and continues throughout the method's operational life. The Analytical Target Profile (ATP), introduced in ICH Q14, serves as a prospective summary of the method's intended purpose and required performance criteria [23]. By defining the ATP at the outset, laboratories establish clear benchmarks for cross-validation activities, ensuring that transferred methods maintain their fitness-for-purpose regardless of where they are implemented.
The FDA specifically emphasizes a risk-based approach to validation, where the rigor of cross-validation should correspond to the method's criticality regarding patient safety and product quality [25]. This principle is echoed in EU GMP Annex 15, which requires pharmaceutical manufacturers to conduct thorough risk assessments to determine the appropriate extent of validation activities [25]. For cross-validation between spectroscopic and chromatographic methods, this means focusing resources on demonstrating equivalence for critical quality attributes that directly impact product performance and patient safety.
Experimental Design for Cross-Validation
Sample Selection and Preparation
Proper experimental design forms the foundation of scientifically sound cross-validation studies. Sample selection requires careful consideration to ensure results are statistically meaningful and representative of real-world conditions. Regulatory guidelines recommend testing a minimum of 40 patient specimens, though 100 specimens are preferable to identify unexpected errors due to interferences or sample matrix effects [26]. These specimens should be carefully selected to cover the entire clinically meaningful measurement range rather than through random selection [27].
For cross-validation studies between spectroscopic and chromatographic platforms, establishing appropriate quality control (QC) samples is crucial. Recent research demonstrates that using pooled QC samples containing all chemicals from all samples analyzed provides a reliable basis for normalization across different analytical platforms [28]. In long-term studies, creating a "virtual QC sample" by incorporating chromatographic peaks from all QC results through retention time and mass spectrum verification serves as a meta-reference for analyzing and normalizing test samples [28]. This approach is particularly valuable when sample components may not fully overlap with QC components over extended periods.
Experimental Protocol and Timeline
Cross-validation experiments should be conducted over multiple analytical runs on different days to minimize systematic errors that might occur in a single run [27]. A minimum of 5 days is recommended, though extending the experiment over a longer period (e.g., 20 days) better mimics real-world conditions [27] [26]. When comparing methods, samples should be analyzed within two hours of each other unless specimen stability requires shorter timeframes [27]. This temporal proximity is particularly important when comparing spectroscopic and chromatographic methods that may have different sample preparation requirements.
Duplicate measurements for both the reference and test method are recommended to minimize random variation effects [26]. Ideally, these duplicates should be two different samples analyzed in different runs or at least in different order rather than back-to-back replicates on the same sample [27]. Duplicate analyses help identify problems arising from sample mix-ups, transposition errors, and other mistakes that could significantly impact conclusions drawn from the experiment. For cross-validation between different analytical platforms, this replication provides essential data on method precision across different environments.
Diagram 1: Cross-Validation Experimental Workflow
Data Analysis and Statistical Methods
Graphical Data Analysis Techniques
Initial data analysis in cross-validation studies should begin with graphical techniques to visualize the relationship between methods and identify potential outliers or systematic errors. The scatter plot displays the test method results on the y-axis against the reference method results on the x-axis, providing a visual representation of the agreement between methods throughout the measurement range [26]. This graphical method helps identify the linearity of response and reveals any proportional relationships between methods.
The difference plot (Bland-Altman plot) displays the differences between methods on the y-axis against the average of the methods on the x-axis [26]. This visualization technique helps identify systematic biases that may be concentration-dependent and reveals whether differences are consistent across the measurement range. When inspecting these graphs, researchers should look for points that fall outside the general pattern, as these may indicate interferents or matrix effects that differentially affect the spectroscopic and chromatographic methods being compared [27].
Statistical Approaches for Method Comparison
Appropriate statistical analysis is essential for demonstrating method equivalence in cross-validation studies. While correlation analysis and t-tests are commonly used, they are inadequate for fully assessing method comparability [26]. Correlation measures the strength of relationship between methods but cannot detect constant or proportional biases, while t-tests may fail to detect clinically meaningful differences in small sample sizes or detect statistically significant but clinically irrelevant differences in large datasets [26].
Linear regression statistics, including Deming regression and Passing-Bablok regression, are preferable for methods comparison studies as they allow estimation of systematic error at multiple medical decision concentrations and provide information about the proportional and constant nature of the error [27] [26]. For a cholesterol comparison study where the regression line is Y = 2.0 + 1.03X, the systematic error at a critical decision level of 200 mg/dL would be 8 mg/dL [27]. For methods with narrow analytical ranges, calculating the average difference (bias) between methods using paired t-test calculations is often more appropriate [27].
Table 2: Statistical Methods for Cross-Validation Data Analysis
| Statistical Method | Application Context | Key Outputs | Interpretation Guidelines |
|---|---|---|---|
| Linear Regression | Wide analytical range; comparison of spectroscopic vs. chromatographic methods | Slope, y-intercept, standard error of estimate (sy/x) | Slope ≠ 1 indicates proportional error; y-intercept ≠ 0 indicates constant error |
| Deming Regression | Both methods have measurement error; advanced method comparison | Slope, intercept with confidence intervals | Accounts for errors in both methods; more reliable than ordinary regression |
| Passing-Bablok Regression | Non-normal data distributions; outlier robustness | Slope, intercept with confidence intervals | Non-parametric method; resistant to outliers |
| Bland-Altman Analysis | Visualizing agreement across measurement range | Mean difference (bias), limits of agreement | Identifies concentration-dependent biases; establishes agreement intervals |
| Paired t-test | Narrow analytical range; constant bias assessment | Mean difference, p-value, confidence intervals | Detects consistent bias but not proportional error; sensitive to outliers |
Advanced Correction Algorithms for Long-Term Studies
In extended cross-validation studies conducted over prolonged periods, instrumental data drift becomes a significant challenge that must be addressed statistically. Recent research demonstrates that machine learning algorithms can effectively correct for long-term measurement variability in spectroscopic and chromatographic data [28]. In a 155-day GC-MS study comparing tobacco smoke samples, three algorithms were evaluated for normalizing 178 target chemicals across 20 repeated measurements.
The Random Forest algorithm provided the most stable and reliable correction model for long-term, highly variable data, while Spline Interpolation and Support Vector Regression exhibited less stability [28]. These advanced statistical approaches incorporate batch number and injection order number as numerical indices to minimize artificial parameterization while effectively addressing temporal drift in cross-validation studies [28]. For spectroscopic-chromatographic cross-validation, such algorithms can harmonize data collected across different timeframes and instrumental conditions.
Implementation and Compliance Strategy
The Scientist's Toolkit: Essential Research Reagents and Materials
Successful cross-validation requires carefully selected materials and reagents that ensure method robustness and transferability. The following toolkit represents essential components for cross-validation studies between spectroscopic and chromatographic methods.
Table 3: Essential Research Reagent Solutions for Cross-Validation Studies
| Reagent/Material | Function in Cross-Validation | Application Notes |
|---|---|---|
| Pooled Quality Control (QC) Samples | Normalization standard across instruments and platforms | Should contain all target analytes; aliquots stored properly to ensure stability [28] |
| Certified Reference Materials | Establish accuracy and traceability to reference methods | Provides definitive values for method comparison and bias assessment |
| Stable Isotope-Labeled Internal Standards | Correct for sample preparation variability in chromatographic methods | Especially critical for mass spectrometric detection; should elute near target analytes |
| System Suitability Test Mixtures | Verify instrument performance before validation experiments | Confirms resolution, sensitivity, and reproducibility meet predefined criteria |
| Matrix-Matched Calibrators | Account for matrix effects in complex samples | Should mimic the sample matrix (serum, plasma, tissue homogenate) |
| Processed Sample Stability Evaluators | Assess sample stability under analytical conditions | Includes benchtop, autosampler, and long-term stability assessments |
Documentation and Data Integrity Requirements
Comprehensive documentation forms the foundation of successful cross-validation for regulatory compliance. The FDA and EMA require strict adherence to ALCOA+ principles, ensuring data are Attributable, Legible, Contemporaneous, Original, Accurate, plus Complete, Consistent, Enduring, and Available [25]. Your validation documentation must include detailed protocols, predefined acceptance criteria, raw data, statistical analysis, and final reports justifying any deviations from expected outcomes.
For cross-validation between spectroscopic and chromatographic methods, documentation should specifically address how differences in method principles (e.g., spectroscopic quantification versus chromatographic separation) might impact results and how these differences were managed methodologically. Recent guidelines emphasize a risk-based approach to documentation, focusing resources on critical method parameters that most significantly impact product quality and patient safety [25]. This includes detailed change control documentation for any modifications made to accommodate different analytical platforms.
Diagram 2: ALCOA+ Data Integrity Principles
Cross-validation of analytical methods, particularly between spectroscopic and chromatographic platforms, requires careful attention to regulatory guidelines, robust experimental design, appropriate statistical analysis, and comprehensive documentation. The evolving regulatory landscape emphasizes a lifecycle approach with increased focus on risk assessment and proactive method planning through the Analytical Target Profile. By implementing the protocols and strategies outlined in this guide, researchers and drug development professionals can successfully demonstrate method equivalence and ensure the reliability of analytical data across different laboratories and instrumental platforms. As regulatory frameworks continue to harmonize globally, adherence to these principles will remain essential for successful technology transfers and regulatory submissions in pharmaceutical development.
Integrated Workflows and Practical Applications in Drug Development and Quality Control
The development of biotherapeutic drugs, particularly monoclonal antibodies (mAbs), has revolutionized the treatment of cancer, autoimmune disorders, and other diseases. As these therapeutic regimens become more complex—often involving combination therapies with multiple mAbs—the bioanalytical methods used to support pharmacokinetic (PK) studies and therapeutic drug monitoring (TDM) must evolve accordingly. Multiplex liquid chromatography coupled with tandem mass spectrometry (LC-MS/MS) has emerged as a powerful analytical platform that enables the simultaneous quantification of multiple mAbs in a single run, offering significant advantages in specificity, throughput, and cost-effectiveness compared to traditional ligand binding assays (LBAs) [29] [30] [31]. However, the implementation of any new analytical method requires rigorous validation to ensure data reliability and comparability, especially when transitioning from established reference methods.
Cross-validation, the experimental assessment of two or more bioanalytical methods to demonstrate their equivalency, is particularly crucial when introducing multiplex LC-MS/MS methods into existing drug development pipelines [32]. This process ensures that PK data generated using different methods or across different laboratories can be reliably compared throughout clinical trials. As per current health agency guidance, cross-validation provides limited specific recommendations, leading organizations to develop robust experimental and statistical frameworks to establish method equivalency [32]. This guide examines the development and cross-validation of a multiplex LC-MS/MS method for simultaneous mAb analysis, providing experimental data comparisons with alternative methods and detailing the protocols necessary for implementation.
LC-MS/MS Versus Traditional Methods: A Comparative Analysis
Technical and Operational Comparisons
LBA methods like enzyme-linked immunosorbent assay (ELISA) have historically been the gold standard for mAb bioanalysis [33] [34]. These methods rely on the specific interaction between antibodies and antigens, which can present challenges in multiplexing, reagent development, and specificity. In contrast, LC-MS/MS methods, particularly when using a bottom-up approach with signature peptides as surrogates for protein quantification, offer distinct advantages for simultaneous mAb analysis [33] [31] [34].
Table 1: Comparison of Bioanalytical Methods for Monoclonal Antibody Quantification
| Parameter | LBA Methods (ELISA, ECL) | Multiplex LC-MS/MS Methods |
|---|---|---|
| Development Time | Longer (weeks to months) due to need for specific capture/detection reagents [33] | Shorter (days to weeks) using generic sample preparation protocols [33] [34] |
| Multiplexing Capacity | Limited; challenging to develop for multiple analytes [29] | High; capable of simultaneously quantifying 7+ mAbs in single run [29] [31] |
| Specificity | Subject to cross-reactivity and interference [34] | High specificity through chromatographic separation and MRM detection [29] [33] |
| Dynamic Range | Typically limited (10-100 fold) [34] | Wider linear range (2-512 μg/mL demonstrated) [29] [31] [34] |
| Sample Preparation | Relatively simple immunocapture | Complex process requiring denaturation, reduction, alkylation, and digestion [33] [34] |
| Cost-effectiveness | Lower per sample but higher in multiplexing context | Higher per sample but more cost-effective for multiple analytes [29] [33] |
The fundamental difference between these platforms lies in their detection principles. While LBAs rely on biorecognition events, LC-MS/MS methods physically separate and detect signature peptides that serve as surrogates for the target mAbs. This provides LC-MS/MS with superior specificity, as demonstrated in a study comparing LC-MS/MS with electrochemiluminescence (ECL) for quantifying an anti-sclerostin mAb (SHR-1222), where the LC-MS/MS method showed markedly improved specificity and dynamic range [34].
Advantages of Multiplex LC-MS/MS for mAB Analysis
The capacity for multiplex analysis represents one of the most significant advantages of LC-MS/MS platforms. A seminal study developed and validated a multiplex LC-MS/MS method capable of simultaneously assaying seven therapeutic mAbs—bevacizumab, cetuximab, ipilimumab, nivolumab, pembrolizumab, rituximab, and trastuzumab—in human plasma [29]. This method demonstrated linearity from 2 to 100 μg/mL for all mAbs, with inter- and intra-assay precision <14.6% and accuracy ranging from 90.1–111.1% [29]. The ability to quantify multiple mAbs in a single analysis is particularly valuable for combination therapies, such as those involving immune checkpoint inhibitors (e.g., ipilimumab, nivolumab, pembrolizumab), which are increasingly used in oncology [29].
Another key advantage is the rapid method development compared to LBAs. For example, a generic sample preparation method for the multiplex analysis of seven therapeutic mAbs was developed using saturated ammonium sulfate to precipitate immunoglobulins from human plasma, followed by denaturation, reduction, alkylation, and tryptic digestion [31]. This approach can serve as a template for quantifying various mAbs with minimal customization, significantly accelerating method development [31].
Case Study: Multiplex LC-MS/MS Method for Seven mAbs
Method Development and Validation
The development of a multiplex LC-MS/MS method for simultaneous analysis of seven mAbs exemplifies a comprehensive approach to method validation [29]. This method utilized a commercial ready-to-use kit (mAbXmise) for mAb extraction and full-length stable-isotope-labeled antibodies as internal standards to account for variability in sample preparation and analysis. The validation followed current EMA guidelines and demonstrated excellent performance characteristics [29].
Table 2: Validation Parameters for Multiplex LC-MS/MS mAb Assay [29]
| Validation Parameter | Performance Results | Acceptance Criteria |
|---|---|---|
| Linearity Range | 2-100 μg/mL for all 7 mAbs | Covered expected plasma concentrations |
| Regression Coefficient (r²) | >0.994 for all mAbs | Demonstrates excellent linearity |
| Inter-assay Precision | 1.0–13.1% | <15% for LLOQ, <20% for other levels |
| Inter-assay Accuracy | 91.3–107.1% | 85-115% of nominal values |
| Intra-assay Precision | <14.6% | <15% for LLOQ, <20% for other levels |
| Intra-assay Accuracy | 90.1–111.1% | 85-115% of nominal values |
| LLOQ | 2 μg/mL for all mAbs | Sufficient for clinical concentrations |
The method addressed specific analytical challenges, such as interference in the detection of the nivolumab peptide (ASGI), which was resolved through optimization of liquid chromatography parameters [29]. Matrix effects varied among the different mAbs, ranging from -54% for nivolumab to +33% for ipilimumab, highlighting the importance of evaluating this parameter for each analyte and using appropriate internal standards to correct for these effects [29].
Cross-Validation with Reference Methods
The critical step in implementing this multiplex LC-MS/MS method was cross-validation against established reference methods. In this study, each cross-validation between reference methods (ELISA or LC-MS/MS) and the multiplex method included 16–28 plasma samples from cancer patients [29]. The results demonstrated a mean absolute bias of measured concentrations between multiplex and reference methods of 10.6%, with individual biases ranging from 3.0–19.9% across the different mAbs [29]. These values fall within acceptable limits for bioanalytical method comparison, supporting the equivalency of the multiplex method to established reference methods.
A similar approach was used in the cross-validation of methods for lenvatinib, where seven bioanalytical methods by LC-MS/MS were developed at five laboratories [10]. The cross-validation study utilized quality control samples and blinded clinical study samples to confirm comparable assay data, with accuracy of QC samples within ±15.3% and percentage bias for clinical study samples within ±11.6% [10]. This demonstrates that lenvatinib concentrations in human plasma can be compared across laboratories and clinical studies, reinforcing the importance of cross-validation in global drug development programs.
Experimental Protocols: Key Methodologies for Multiplex mAB Analysis
Sample Preparation Workflow
The sample preparation for multiplex LC-MS/MS analysis of mAbs typically follows a bottom-up proteomics approach, where proteins are digested into peptides that serve as analytical surrogates. A generic, robust method for sample preparation involves the following key steps [31]:
Immunoglobulin Precipitation: Saturated ammonium sulfate is used to precipitate immunoglobulins from human plasma or serum. After centrifugation, the supernatant containing albumin is decanted.
Denaturation: The precipitated immunoglobulin fraction is re-dissolved in buffer containing 6M guanidine for complete denaturation.
Reduction: Dithiothreitol (DTT) is added to reduce disulfide bonds, typically at 60°C for 30 minutes.
Alkylation: Iodoacetamide is used to alkylate free thiol groups, preventing reformation of disulfide bonds.
Digestion: Sequencing-grade trypsin is added for proteolytic digestion, typically at 37°C for several hours or at 60°C for 90 minutes with violent vortexing to completely dissolve the pellet [34].
Quenching: The digestion is stopped by adding acid or organic solvent.
This protocol has been validated for various mAbs, including infliximab, rituximab, cetuximab, dupilumab, dinutuximab, vedolizumab, and emicizumab, demonstrating its broad applicability [31].
Sample Preparation Workflow for Multiplex LC-MS/MS mAB Analysis
LC-MS/MS Analytical Conditions
The analytical separation and detection of signature peptides require optimization of chromatographic and mass spectrometric parameters. A typical ultra-high-performance liquid chromatography (UHPLC) method employs:
- Column: Reversed-phase C18 column (e.g., 2.1 × 100 mm, 2.7-μm 450 Å BioResolve RP mAb column) [35]
- Mobile Phase: (A) 0.1% formic acid in water; (B) 0.1% formic acid in acetonitrile
- Gradient: Shallow gradient from 5% to 45% B over 5-10 minutes
- Flow Rate: 0.3-0.5 mL/min
- Injection Volume: 5-20 μL
Mass spectrometric detection is typically performed using triple quadrupole instruments in positive ion mode with multiple reaction monitoring (MRM). The mass spectrometer parameters are optimized for each signature peptide and its corresponding stable isotope-labeled internal standard [29] [33] [34].
Cross-Validation Experimental Design and Statistical Framework
Experimental Strategy for Cross-Validation
Cross-validation between bioanalytical methods requires a rigorous experimental design to establish equivalency. Genentech, Inc. has developed a strategy that utilizes incurred samples along with comprehensive statistical analysis [32]. The approach includes:
Sample Selection: One hundred incurred study samples are selected based on four quartiles (Q) of in-study concentration levels to ensure representation across the analytical range.
Sample Analysis: The selected samples are assayed once using the two bioanalytical methods being compared.
Equivalency Assessment: Bioanalytical method equivalency is assessed based on pre-specified acceptability criteria. The two methods are considered equivalent if the percent differences in the lower and upper bound limits of the 90% confidence interval (CI) are both within ±30% [32].
Additional Analyses: Quartile analysis by concentration using the same criterion may also be performed to assess potential concentration-dependent biases.
Data Visualization: A Bland-Altman plot of the percent difference of sample concentrations versus the mean concentration of each sample is created to further characterize the data [32].
Cross-Validation Experimental Workflow
Application in Cross-Validation Studies
This statistical framework has been successfully applied in cross-validation studies for various analytes. For example, in the cross-validation of gas chromatography methods for measuring organophosphate pesticide metabolites in human urine, split sample analysis (n=46) between two laboratories showed good agreement, with relative recovery ranges of 94-119% (for GC-FPD) and 92-103% (for GC-MS), and relative standard deviations of less than 20% [36].
Similarly, a cross-validation study for lenvatinib bioanalytical methods across five laboratories demonstrated the importance of this approach in global clinical studies. The study confirmed that accuracy of QC samples was within ±15.3% and percentage bias for clinical study samples was within ±11.6%, supporting the comparability of lenvatinib concentrations across laboratories and clinical studies [10].
Essential Research Reagent Solutions
The successful development and cross-validation of multiplex LC-MS/MS methods for mAb analysis depend on several key reagents and materials. The following table outlines essential research reagent solutions and their functions in the analytical workflow.
Table 3: Essential Research Reagent Solutions for Multiplex LC-MS/MS mAB Analysis
| Reagent/Material | Function | Examples/Specifications |
|---|---|---|
| Stable Isotope-Labeled Peptides | Internal standards for quantification; correct for variability in digestion and MS detection | Full-length stable-isotope-labeled antibodies [29]; isotopically labeled peptide GPSVLPLAPSSK[13C6, 15N2]ST [33] |
| Sequencing-Grade Trypsin | Proteolytic enzyme for generating signature peptides; must be high purity to avoid autolysis | Promega sequencing trypsin [34] |
| Denaturation Agents | Disrupt protein tertiary structure for accessibility to proteolytic enzymes | Guanidine hydrochloride (6M) [31]; SDS [34] |
| Reducing Agents | Break disulfide bonds for complete denaturation | Dithiothreitol (DTT) [33] [34] |
| Alkylating Agents | Modify cysteine residues to prevent reformation of disulfide bonds | Iodoacetamide [33] [34] |
| Immunocapture Reagents | Selective enrichment of target mAbs from complex matrices | Anti-idiotypic antibodies; protein A/G [30] [37] |
| LC Columns | Separation of signature peptides prior to MS detection | Reversed-phase C18 columns (e.g., 2.1 × 100 mm, 2.7-μm) [35] |
The development and implementation of multiplex LC-MS/MS methods for simultaneous analysis of therapeutic mAbs represent a significant advancement in bioanalytical science, addressing the growing need for efficient, specific, and cost-effective analytical platforms for combination therapies and therapeutic drug monitoring. The case study examining the simultaneous quantification of seven mAbs demonstrates that properly developed and validated multiplex LC-MS/MS methods can achieve performance characteristics comparable to, and in some aspects superior to, traditional LBA methods.
The cross-validation of these methods against established reference methods is essential to ensure data comparability across clinical trials and laboratories. The experimental and statistical frameworks described provide a robust approach for demonstrating method equivalency, with acceptance criteria such as 90% confidence intervals of mean percent difference within ±30% providing scientifically sound benchmarks for equivalency.
As the biotherapeutic landscape continues to evolve with increasingly complex treatment regimens, multiplex LC-MS/MS methods will play an increasingly important role in supporting drug development and personalized medicine approaches. The continuous refinement of these methods, along with standardized cross-validation approaches, will enhance the reliability and comparability of pharmacokinetic data, ultimately contributing to the development of safer and more effective biotherapeutics.
Simultaneous drug analysis represents a pivotal advancement in pharmaceutical sciences, enabling the quantification of multiple active pharmaceutical ingredients (APIs) or metabolites in a single analytical run. This approach is particularly valuable for pharmaceutical formulations involving combination therapies, such as those developed for COVID-19, where drugs like nirmatrelvir and ritonavir are co-administered to enhance therapeutic efficacy [38]. The implementation of these methods aligns with the broader thesis of cross-validation, where chromatographic methods are rigorously validated and often compared with spectroscopic techniques to ensure result accuracy and reliability.
The critical importance of simultaneous analysis extends beyond routine quality control to therapeutic drug monitoring (TDM), where patient-specific factors such as plasma drug concentrations, therapeutic efficacy, and adverse reactions guide dosage optimization in clinical practice [39] [40]. This review comprehensively compares the performance of various analytical platforms, with a specialized focus on applications in antiviral pharmaceutical formulations, and provides detailed experimental protocols to support method implementation in diverse research settings.
Comparative Performance of Analytical Platforms
The selection of an appropriate analytical platform is fundamental to successful simultaneous drug analysis. Liquid chromatography coupled with various detection systems has emerged as the cornerstone technique due to its versatility, sensitivity, and ability to resolve complex mixtures. The table below summarizes the key performance characteristics of different chromatographic methods applied to simultaneous drug analysis in pharmaceutical formulations and biological matrices.
Table 1: Performance Comparison of Analytical Platforms for Simultaneous Drug Analysis
| Analytical Method | Analytes | Linear Range | Limit of Detection | Analysis Time | Key Advantages |
|---|---|---|---|---|---|
| RP-HPLC with UV Detection [38] | Favipiravir, Molnupiravir, Nirmatrelvir, Remdesivir, Ritonavir | 10-50 µg/mL | 0.415-0.946 µg/mL | <15 min (5 analytes) | Cost-effective, excellent for quality control |
| LC-MS/MS with Automated Pretreatment [39] [40] | Clozapine, Mycophenolic Acid, Sunitinib, N-Desethylsunitinib, Voriconazole | Various (ng/mL to µg/mL) | Sub-ng/mL | ~3 min pretreatment | High sensitivity, automated, ideal for TDM |
| LC-MS/MS for Serum Antivirals [41] | Hydroxychloroquine, Chloroquine, Favipiravir, Umifenovir, Ritonavir, Lopinavir | Not specified | Not specified | 15 min (6 analytes) | High specificity for complex matrices |
| Micellar Electro Kinetic Chromatography (MEKC) [42] | 8 Cardiovascular Drugs + Vincamine | Wide linear range (r ≥ 0.9996) | Low LOD/LOQ | Not specified | Green chemistry, reduced organic solvent |
| Temperature-Responsive Chromatography [43] | CYP450 Substrates | Not specified | Not specified | Varies with temperature | Organic solvent-free, tunable selectivity |
The data reveal that reversed-phase high-performance liquid chromatography (RP-HPLC) with UV detection offers a balanced approach for pharmaceutical formulation analysis, demonstrating robust performance for COVID-19 antivirals with excellent linearity (r² ≥ 0.9997) and precision (RSD < 1.1%) [38]. For applications requiring higher sensitivity, particularly in biological matrices, LC-MS/MS platforms provide superior detection limits and specificity, albeit at higher operational costs [39] [41]. Emerging techniques like temperature-responsive chromatography present innovative alternatives that align with green chemistry principles by eliminating organic solvent requirements, though they remain less established for routine antiviral analysis [43].
Detailed Experimental Protocols
RP-HPLC Method for COVID-19 Antivirals
The simultaneous determination of five COVID-19 antiviral drugs presents significant analytical challenges due to their diverse chemical structures. The following validated protocol demonstrates optimal performance for pharmaceutical formulation analysis [38]:
Chromatographic Conditions: Separation is achieved using a Hypersil BDS C18 column (4.5 × 150 mm, 5 μm particle size) maintained at ambient temperature. The mobile phase consists of water and methanol (30:70 v/v, pH 3.0 adjusted with 0.1% ortho-phosphoric acid) delivered in isocratic mode at a flow rate of 1 mL/min. UV detection is set at 230 nm, with an injection volume of 10 μL.
Sample Preparation: Pharmaceutical formulations are accurately weighed and dissolved in an appropriate solvent, typically the mobile phase, to achieve concentrations within the linear range of 10-50 μg/mL. Samples are filtered through a 0.45 μm membrane filter before injection.
System Suitability: The method demonstrates baseline resolution for all five analytes with retention times of 1.23 min (favipiravir), 1.79 min (molnupiravir), 2.47 min (nirmatrelvir), 2.86 min (remdesivir), and 4.34 min (ritonavir). The theoretical plates for all peaks exceed 2000, and tailing factors are less than 1.5, confirming excellent chromatographic performance.
Validation Parameters: The method validation includes linearity (r² ≥ 0.9997), accuracy (99.59-100.08% recovery), precision (RSD < 1.1%), and specificity (no interference from excipients). The limits of detection range from 0.415 to 0.946 μg/mL, while quantification limits range from 1.260 to 2.868 μg/mL for the five analytes.
Automated LC-MS/MS Method for Therapeutic Monitoring
For clinical applications requiring high sensitivity and throughput, an automated LC-MS/MS method with streamlined sample preparation has been developed [39] [40]:
Instrumentation: The system comprises an LCMS-8050 triple quadrupole mass spectrometer coupled to a Nexera X2 UHPLC system with a CLAM-2030 automated pretreatment module. Separation occurs on a YMC-Triart C18 column (50 mm × 2.1 mm, 3 μm) maintained at 40°C.
Automated Sample Preparation: The CLAM system dispenses 30 μL each of plasma sample, internal standard solution, and acetonitrile into a dedicated vial, followed by mixing for 60 seconds. The mixture is filtered through a polytetrafluoroethylene membrane (0.45 μm pores) under vacuum, diluted with 110 μL of water, and injected (5 μL) into the LC-MS/MS system. This process reduces manual pretreatment time from 15 minutes to just 3 minutes.
Mass Spectrometric Detection: Multiple reaction monitoring (MRM) transitions are optimized for each analyte and corresponding internal standards. The ion source conditions are set as follows: interface temperature 300°C, DL temperature 250°C, heat block temperature 400°C, nebulizing gas flow 3 L/min, drying gas flow 10 L/min, and heating gas flow 10 L/min.
Method Performance: The validation results demonstrate acceptable intra- and inter-assay accuracy (relative error -14.8% to 11.3%) and precision (coefficient of variation <8.8% and <10.5%, respectively). The method shows excellent correlation with conventional manual pretreatment approaches, supporting its application in routine TDM.
Figure 1: Comprehensive workflow for simultaneous drug analysis in pharmaceutical formulations and biological matrices, encompassing sample preparation, chromatographic separation, detection, and method validation stages essential for quality control and therapeutic drug monitoring.
Essential Research Reagent Solutions
Successful implementation of simultaneous analysis methods requires careful selection of research reagents and materials. The following table catalogues essential components and their specific functions in analytical procedures for pharmaceutical formulations.
Table 2: Essential Research Reagents and Materials for Simultaneous Drug Analysis
| Reagent/Material | Specification | Function in Analysis | Example Application |
|---|---|---|---|
| C18 Chromatographic Column | 4.5 × 150 mm, 5 μm particle size | Stationary phase for analyte separation | COVID-19 antiviral separation [38] |
| Mass Spectrometry Internal Standards | Isotope-labeled analogs (e.g., voriconazole-d3, clozapine-d8) | Normalization of extraction and ionization variance | Therapeutic drug monitoring [39] [40] |
| Mobile Phase Components | HPLC-grade methanol, water with pH modifiers | Liquid carrier for chromatographic separation | RP-HPLC analysis of antivirals [38] |
| Sample Pretreatment Filters | Polytetrafluoroethylene membrane, 0.45 μm pores | Removal of particulate matter from samples | Automated sample preparation [39] |
| Protein Precipitation Reagents | Acetonitrile, methanol | Deproteinization of biological samples | Plasma sample preparation [41] |
The selection of appropriate chromatographic columns is critical for achieving optimal separation efficiency, with C18 stationary phases being the most prevalent for reversed-phase applications [38]. For mass spectrometric detection, isotope-labeled internal standards are indispensable for compensating matrix effects and ionization variability, thereby ensuring quantification accuracy [39] [40]. The consistent use of HPLC-grade reagents for mobile phase preparation minimizes background interference and maintains system stability throughout analytical sequences.
Cross-Validation with Spectroscopic Methods
The integration of chromatographic and spectroscopic techniques represents a robust approach for comprehensive pharmaceutical analysis. While chromatographic methods provide superior separation capabilities, spectroscopic techniques including Raman spectroscopy, Fourier-transform infrared spectroscopy (FTIR), and ultraviolet-visible (UV-Vis) spectroscopy offer complementary information for drug formulation characterization [44].
Critical quality attributes (CQAs) such as API concentration, polymorphism, and particle size distribution can be thoroughly assessed through correlative workflows that combine multiple analytical techniques [44]. For instance, electron microscopy (EM) provides high-resolution, three-dimensional images and detailed surface morphology, while spectroscopic methods supply chemical structure information. This multidimensional approach is particularly valuable for characterizing complex dosage forms like sustained-release formulations and inhalation products, where both physical and chemical properties significantly influence product performance.
The cross-validation of chromatographic results with spectroscopic data ensures comprehensive method verification and enhances confidence in analytical outcomes. This aligns with the broader thesis that integrated analytical approaches provide more reliable characterization of pharmaceutical formulations than any single technique employed in isolation.
Environmental Impact and Sustainability
The environmental footprint of analytical methods has gained increasing attention in pharmaceutical sciences. Greenness assessment tools such as AGREE (Analytical GREEnness Metric), AGREEprep, and MoGAPI provide standardized approaches for evaluating method sustainability [38]. The RP-HPLC method for COVID-19 antivirals demonstrates favorable environmental performance with AGREE, AGREEprep, MoGAPI, BAGI, and CACI scores of 0.70, 0.59, 70%, 82.5, and 79, respectively, attributed to strategic solvent selection and minimal sample preparation requirements [38].
Alternative techniques such as Micellar Electro Kinetic Chromatography (MEKC) further enhance sustainability by utilizing micellar solutions that reduce organic solvent consumption while maintaining separation efficiency [42]. Similarly, temperature-responsive chromatography with poly(N-isopropylacrylamide)-grafted stationary phases enables separation control through temperature adjustment instead of mobile phase gradient methods, potentially eliminating organic solvent use entirely [43]. These advancements represent significant progress toward environmentally conscious pharmaceutical analysis without compromising analytical performance.
Simultaneous drug analysis methodologies have proven indispensable for the characterization of complex pharmaceutical formulations, particularly combination therapies for conditions such as COVID-19. The comparative assessment presented in this guide demonstrates that RP-HPLC provides a robust, cost-effective solution for quality control applications, while LC-MS/MS platforms offer superior sensitivity for therapeutic drug monitoring in biological matrices. The detailed experimental protocols facilitate method implementation and transfer across laboratory settings, supported by comprehensive reagent specifications.
The cross-validation of chromatographic results with spectroscopic techniques establishes a rigorous framework for analytical verification, ensuring data reliability for critical pharmaceutical decisions. Furthermore, the integration of green chemistry principles into method development promotes environmental sustainability without compromising analytical performance. As pharmaceutical formulations continue to increase in complexity, the advancement of simultaneous analysis techniques will remain essential for ensuring product quality, safety, and efficacy in both development and clinical practice.
High-Throughput and Automated Workflows for Streamlined Method Development
The escalating complexity of biopharmaceuticals and the pressure for faster innovation are driving a fundamental shift in analytical method development. Modern laboratories are increasingly adopting high-throughput technologies and automated workflows to overcome the limitations of manual, labor-intensive processes. These automated approaches are essential for investigating the vast parametric space required to optimize biobased processes, thereby accelerating development timelines and improving reproducibility [45] [46]. Within this context, cross-validation—ensuring that data from different methods and laboratories are comparable—becomes a critical component of a robust analytical strategy. Automated workflows not only enhance throughput but also generate the standardized, high-quality data necessary for reliable cross-validation and for powering artificial intelligence and machine learning (AI/ML) models [45]. This guide objectively compares the performance of various automated technologies and platforms, providing experimental data to inform their application in modern drug development.
Technology Performance Comparison: HPLC, UHPLC, and UPLC
A core aspect of streamlining method development lies in selecting the appropriate chromatographic technology. The evolution from High-Performance Liquid Chromatography (HPLC) to Ultra-High-Performance Liquid Chromatography (UHPLC) and Ultra-Performance Liquid Chromatography (UPLC) represents significant gains in speed, resolution, and efficiency.
Key Differentiators and Experimental Performance Data
The following table summarizes a direct comparison of these systems, drawing from controlled experiments that highlight performance differences.
Table 1: Chromatographic System Comparison Based on Experimental Data
| Feature | HPLC (Alliance System) | UHPLC (Arc Bio System) | UPLC (H-Class Bio System) |
|---|---|---|---|
| Typical Particle Size | 3–5 μm [47] | Sub-2-μm [48] | ~1.7 μm [47] |
| Operating Pressure | Up to 6,000 psi [47] | Higher than HPLC [48] | Up to 15,000 psi [47] |
| Extra-column Volume (Dispersion) | Highest [49] | Intermediate [49] | Lowest [49] |
| Peak Capacity (5σ, 10-min gradient) | 118 [49] | 170 [49] | 196 [49] |
| Resolution (Peaks 5 & 6 in test mix) | 1.7 [49] | 2.7 [49] | 3.1 [49] |
| Analysis Speed | Baseline (Up to 10x slower than UPLC) [47] | Faster than HPLC [49] | Fastest (Up to 10x faster than HPLC) [47] |
| Solvent Consumption | Highest | Lower than HPLC | Lowest (Up to 80% reduction with 2.1 mm column) [48] |
Experimental Protocol: System Performance Evaluation
The data in Table 1 were derived from a standardized experiment designed to evaluate system performance objectively [49] [48]. The methodology is as follows:
- Column: A reversed-phase column (e.g., Waters XBridge BEH C18, 130 Å, 2.5 µm, 4.6 x 100 mm) was used across all systems to isolate instrument performance from column variables.
- Analytes: A mixture of peptide standards or six anesthetics was used as the test sample.
- Mobile Phase: A gradient of water and acetonitrile, often with modifiers like trifluoroacetic acid (TFA) or formic acid, was employed.
- Method: A 10-minute gradient (e.g., 5%–50% acetonitrile) was run identically on each system.
- Measurement: Peak widths, retention times, and resolution were measured according to USP guidelines. Extra-column volume was determined by replacing the column with a zero-dead-volume union and injecting a standard [49].
The results demonstrate that a holistically designed low-dispersion UPLC system provides superior resolution, sensitivity, and throughput compared to modified HPLC systems [49] [48].
Cross-Validation of Spectroscopic and Chromatographic Methods
Cross-validation is a regulatory and scientific requirement to ensure data comparability across different methods, laboratories, and clinical trials. Automated workflows are pivotal in generating the robust, reproducible data required for these studies.
Case Study: Inter-Laboratory Cross-Validation of Lenvatinib Bioassay
A prime example is the global cross-validation study for the anticancer drug lenvatinib [10]. Five laboratories developed seven distinct LC-MS/MS methods for quantifying lenvatinib in human plasma.
- Experimental Protocol: Each laboratory first validated its own method (A, B, C, D, E1, E2, E3) following regulatory guidelines. Parameters included accuracy, precision, and lower limit of quantification (LLOQ). For cross-validation, blinded quality control (QC) samples and clinical study samples were distributed and analyzed by all laboratories. The methods employed different sample preparation techniques (protein precipitation, liquid-liquid extraction, solid-phase extraction) and chromatographic conditions [10].
- Results and Cross-Validation Data: All seven methods were successfully validated. In the cross-validation study, the accuracy of QC samples across all laboratories was within ±15.3%, and the percentage bias for clinical study samples was within ±11.6%. This confirmed that lenvatinib concentrations could be reliably compared across global clinical trials despite methodological differences [10].
Table 2: Cross-Validation Parameters for Lenvatinib LC-MS/MS Methods [10]
| Laboratory / Method | Sample Volume (mL) | Assay Range (ng/mL) | Sample Extraction | Internal Standard |
|---|---|---|---|---|
| A | 0.2 | 0.1–500 | Liquid-Liquid Extraction (Diethyl ether) | ER-227326 |
| B | 0.05 | 0.25–250 | Protein Precipitation (ACN-MeOH) | 13C6 lenvatinib |
| C | 0.1 | 0.25–250 | LLE (MTBE-IPA with 0.1% AA) | 13C6 lenvatinib |
| D | 0.2 | 0.1–100 | LLE (Diethyl ether) | ER-227326 |
| E1 | 0.1 | 0.25–500 | Solid Phase Extraction (HLB plate) | ER-227326 |
| E2 | 0.1 | 0.25–250 | LLE (MTBE-IPA with 0.1% AA) | 13C6 lenvatinib |
| E3 | 0.1 | 0.25–250 | SPE (MCX plate) | ER-227326 |
Automated Structure Verification (ASV) with Complementary Techniques
The combination of spectroscopic methods provides another powerful cross-validation workflow. Research shows that combining 1H NMR and IR spectroscopy significantly improves the accuracy of Automated Structure Verification (ASV) for distinguishing between highly similar isomeric compounds [50].
- Experimental Protocol: A dataset of 42 drug-like molecules and 99 pairs of correct and incorrect isomers was assembled. Experimental 1H NMR and IR spectra were collected. For each candidate structure, spectra were predicted using computational methods (e.g., DFT for NMR). The matching between experimental and predicted spectra was scored using algorithms like DP4* for NMR and a newly introduced IR.Cai for IR [50].
- Results: Used alone at a true positive rate of 90%, NMR left 27-49% of isomer pairs unsolved, and IR left 39-70% unsolved. However, when the scores from NMR and IR were combined, the unsolved rate dropped to 0–15%. This demonstrates that the techniques provide complementary information, and their integration creates a more powerful and automated verification workflow [50].
High-Throughput and Automated Workflow Implementation
Automated workflows extend beyond individual instruments to encompass entire experimental processes, delivering dramatic efficiency gains.
Workflow for Therapeutic Protein Formulation Development
A published high-throughput (HT) formulation workflow for therapeutic proteins addresses the challenge of screening at high, clinically relevant concentrations [51].
- Workflow Steps:
- Integration: A micro-buffer exchange system is integrated with automated analytical instruments.
- Processing: The system enables rapid buffer exchange for protein samples into various formulation conditions.
- Analysis: Automated instruments then characterize the samples for critical quality attributes like stability (by Size-Exclusion Chromatography (SEC) and Cation-Exchange Chromatography (CEX)) and viscosity.
- Outcome: This HT workflow reduced hands-on time by over 70% and total run time by over 30% compared to conventional ultrafiltration/diafiltration. The results for formulation properties and stability profiles were in good agreement with those from the traditional method, validating the workflow's fitness for purpose [51].
Automated Method Development for Purification
In purification, software-driven automation can dramatically boost productivity. For instance, Nurix Therapeutics automated preparative method development by using analysis software (Analytical Studio Pro) to interpret large datasets from multiple stationary and mobile phases [52]. This platform, which supports both singleton and library workflows, enabled a ten-fold increase in productivity per analyst by automating the method selection process against predefined product specifications [52].
The Scientist's Toolkit: Essential Research Reagents and Solutions
The successful implementation of the workflows described relies on a suite of essential materials and reagents.
Table 3: Key Research Reagent Solutions for Automated Workflows
| Reagent / Material | Function in Automated Workflows |
|---|---|
| Sub-2µm UPLC Columns | Provides the high-efficiency stationary phase necessary for fast, high-resolution separations in UPLC systems [48] [47]. |
| Stable Isotope-Labeled Internal Standards (e.g., 13C6 lenvatinib) | Critical for ensuring quantitative accuracy in mass spectrometry by correcting for variability in sample preparation and ionization [10]. |
| Structural Analogue Internal Standards (e.g., ER-227326) | Serves as an alternative to stable isotopes for internal standardization in bioanalytical methods [10]. |
| High-Purity Solvents & Buffers | Form the mobile phase; purity is essential for maintaining system performance, preventing background noise, and ensuring reproducible results. |
| Automated Liquid Handling Tips & Plates | Disposable consumables that enable precise, non-contact, and cross-contamination-free reagent transfer in robotic systems [46]. |
| Quality Control (QC) Samples | Precisely prepared samples with known analyte concentrations used to verify the accuracy and precision of an analytical run across laboratories [10]. |
Strategic Considerations: In-House Automation vs. Outsourcing
When adopting advanced automation, organizations face a strategic choice between building in-house capability and outsourcing to specialized partners.
- In-House Automation: Offers direct control over proprietary processes and can have lower long-term costs with high utilization. However, it requires significant upfront capital investment in robotics, integrated workcells, and AI-driven software, and demands deep technical expertise for maintenance and operation [46]. Major players like AstraZeneca have built internal capacity, such as a screening facility that can test 300,000 compounds daily using robotics [46].
- Outsourcing (Cloud Labs & CROs): Provides immediate access to state-of-the-art instrumentation and expertise without capital expenditure, converting fixed costs to variable pay-per-experiment costs. This model offers rapid scalability and flexibility [46]. Examples include Emerald Cloud Lab (ECL) and Strateos, which allow remote experiment design and execution. A key drawback is the potential loss of direct, hands-on control and the risk of eroding internal expertise over time [46].
The integration of high-throughput and automated workflows is no longer a luxury but a necessity for streamlined method development in modern drug discovery and development. As demonstrated, technologies like UPLC provide unmatched gains in speed, resolution, and efficiency over traditional HPLC. Furthermore, automated workflows are foundational to rigorous cross-validation practices, ensuring data integrity and comparability across global studies. The strategic decision to build these capabilities in-house or to leverage the growing ecosystem of cloud labs and automated CROs depends on an organization's specific goals, resources, and risk tolerance. Ultimately, the adoption of these advanced workflows, underpinned by robust experimental data and cross-validation, is critical for accelerating the delivery of new therapeutics to the market.
In pharmaceutical manufacturing, Cleaning Verification (CV) is a critical quality control process that confirms a cleaning procedure has performed correctly by testing equipment and surfaces to ensure residue levels fall within pre-defined acceptability limits [53]. The selection of analytical methods for this purpose is paramount, driven by the core analytical performance characteristics of sensitivity and specificity. Sensitivity defines a method's ability to detect low levels of a residue, while specificity confirms its capacity to accurately identify and quantify that specific residue in the presence of other components [54].
The need for robust, well-characterized methods is framed within a broader regulatory and scientific context. Health authorities, including the FDA and EMA, mandate that cleaning processes must be supported by validated analytical methods to ensure product safety and prevent cross-contamination [55] [56]. This guide provides a comparative analysis of key analytical techniques, detailing their experimental protocols and performance data to inform selection based on sensitivity and specificity requirements. Furthermore, it explores the strategic role of cross-validation, particularly the use of spectroscopic results alongside established chromatographic methods, to ensure data reliability and method equivalency throughout a method's lifecycle [57] [32] [58].
Comparative Analysis of Key Analytical Methods
The choice of an analytical method for cleaning verification depends on the nature of the residue and the required detection capability. The table below summarizes the primary techniques, their principles, and key performance characteristics.
Table 1: Key Analytical Methods for Cleaning Verification
| Method | Principle | Applications | Sensitivity | Specificity |
|---|---|---|---|---|
| High-Performance Liquid Chromatography (HPLC) [54] | Separates mixture components via interactions with a stationary and mobile phase. | Detecting and quantifying specific organic residues, including APIs and cleaning agents. | High | High |
| Total Organic Carbon (TOC) Analysis [54] | Oxidizes organic carbon to CO₂, which is then measured. | General cleanliness assessment; detecting organic residues from APIs and cleaning agents. | High | Non-specific |
| Microbiological Testing [54] | Culturing microorganisms on nutrient media and counting colonies. | Ensuring effective removal of microbial contaminants, especially in sterile manufacturing. | Variable (depends on organism) | Broad (for microbial classes) |
| UV-Visible Spectroscopy [54] | Measures absorption of ultraviolet or visible light by the sample. | Detecting compounds with chromophores. | Moderate | Low to Moderate |
| Fourier-Transform Infrared Spectroscopy (FTIR) [54] | Measures absorption of infrared light, providing a functional group spectrum. | Identifying specific organic compounds and functional groups. | Moderate | High |
| Gas Chromatography (GC) [54] | Separates volatile components via a stationary phase and carrier gas. | Analyzing volatile organic compounds and solvents. | High | High |
| Atomic Absorption Spectroscopy (AAS) [54] | Measures metal ion concentration by detecting light absorption. | Detecting trace metal contamination. | High (for metal ions) | Specific to metallic residues |
| Adenosine Triphosphate (ATP) Bioluminescence & A3 System [59] | Measures ATP, ADP, and AMP (A3) via bioluminescence to indicate total organic residue. | Rapid verification of surface cleanliness in non-sterile environments (e.g., food, low-bioburden APIs). | Moderate (broader detection with A3) | Non-specific |
Quantitative data from method validation studies provides a direct comparison of performance. Key parameters include the Limit of Detection (LOD), Limit of Quantification (LOQ), accuracy, and precision, which collectively define a method's operational range and reliability.
Table 2: Quantitative Performance Data for Analytical Methods
| Method | Typical LOD/LOQ | Key Performance Parameters | Applicable Residue Types |
|---|---|---|---|
| HPLC [54] | Low ppm range (e.g., 1-10 ppm) | Accuracy: Compare to true values. Precision: Repeatability & Reproducibility. Linearity: Across concentration range. | APIs, specific cleaning agents, organic molecules. |
| TOC Analysis [54] | Low ppb to ppm range | Does not identify specific compounds; overall organic load. | Any carbon-containing residue (proteins, sugars, lipids). |
| Microbiological Testing [54] | Varies by method (e.g., CFU/swab) | Time-consuming; less precise than chemical methods. | Viable bacteria, yeast, mold. |
| FTIR [54] | ~µg/cm² (surface load) | Rapid, non-destructive; requires spectral libraries. | Organic compounds with IR-active functional groups. |
| A3 System [59] | RLU benchmarks set via validation | More comprehensive than ATP-only; detects ATP, ADP, AMP. | General organic residue (proteins, fats, carbohydrates). |
Experimental Protocols for Method Validation and Cross-Validation
Core Analytical Method Validation
To ensure a method is fit for purpose, a structured validation protocol must be followed. The International Council for Harmonisation (ICH) guideline Q2(R1) provides a framework for this process [54].
Protocol: Analytical Method Validation for Cleaning Verification
- Develop a Validation Protocol: Create a detailed document outlining objectives, methods, acceptance criteria, and documentation requirements [54].
- Perform Validation Studies: Conduct experiments to evaluate key parameters [54]:
- Accuracy: Determine by spicking a known standard into a sample matrix and comparing the measured value to the true value. Reported as percent recovery.
- Precision: Assess through repeatability (multiple analyses of the same sample under identical conditions) and reproducibility (analysis under different conditions, e.g., different days or analysts).
- Specificity: Test the method with samples containing the target analyte alongside potential interfering substances (e.g., cleaning agents, excipients) to confirm the signal is unequivocally from the analyte.
- Linearity and Range: Prepare and analyze samples with the analyte at a series of concentrations (e.g., 50% to 150% of the target limit). Plot response versus concentration and verify the linear relationship across the intended operating range.
- LOD and LOQ: Determine the lowest concentration that can be detected (LOD) and quantified with acceptable accuracy and precision (LOQ), typically via signal-to-noise ratio or standard deviation of the response.
- Robustness: Evaluate the method's performance under deliberate, slight variations in method parameters (e.g., temperature, flow rate, mobile phase composition) to ensure consistency.
- Analyze Data: Use statistical tools to evaluate all parameters against the pre-defined acceptance criteria [54].
- Document Results: Compile a comprehensive validation report including the protocol, raw data, analysis, and conclusions [54].
Cross-Validation of Spectroscopic and Chromatographic Methods
Cross-validation is crucial when comparing two validated methods, such as when implementing a new, rapid spectroscopic technique (like FTIR) alongside an established chromatographic method (like HPLC) [57] [32] [58]. The following protocol, adapted from bioanalytical practices, provides a robust statistical assessment of equivalency.
Protocol: Cross-Validation for Method Equivalency
- Sample Selection: Select approximately 100 incurred samples (samples from actual manufacturing equipment) covering the applicable range of concentrations. These should be distributed across four quartiles (Q1-Q4) of the expected concentration levels [57] [32].
- Sample Analysis: Assay each sample once using both the established (e.g., HPLC) and the new (e.g., FTIR) analytical methods [57] [32].
- Statistical Analysis for Equivalency:
- Calculate the percent difference for each sample pair:
%(Difference) = [(Method_New - Method_Established) / Method_Established] * 100. - Compute the 90% confidence interval (CI) for the mean percent difference of all 100 samples.
- Acceptability Criterion: The two methods are considered equivalent if the lower and upper bounds of the 90% CI fall within ±30% [57] [32].
- Perform a subgroup analysis by concentration quartile using the same ±30% criterion to check for biases at different concentration levels [57].
- Calculate the percent difference for each sample pair:
- Data Characterization: Create a Bland-Altman plot, graphing the percent difference of sample concentrations against the mean concentration of each sample. This visual tool helps identify any concentration-dependent biases [57] [32].
The workflow for this cross-validation process is outlined below.
Strategic Implementation and Lifecycle Management
Selecting the right method requires a strategic, risk-based approach that considers the entire method lifecycle. The following diagram illustrates the logical decision process for method selection.
A risk-based approach is fundamental. This involves assessing the potential impact of a residue on patient safety and product quality [56]. For example, a highly potent API requires a highly specific and sensitive method like HPLC, whereas a sugar residue in an upstream bioreactor might be adequately monitored with a less specific method like TOC [56]. The manufacturing stage is also critical; residues introduced early in the process (e.g., cell culture) may be purged in subsequent steps, allowing for different acceptance criteria and method selection compared to residues introduced post-purification [56].
Once implemented, methods must be maintained through a lifecycle approach [60] [58]. This includes:
- Continuous Monitoring: Tracking method performance over time to detect deviations [54].
- Change Control: formally evaluating any proposed changes (e.g., to equipment, detergents, or analytical methods) for their impact on the validated state [60].
- Periodic Review and Retraining: Regularly reviewing procedures and retraining personnel, with higher frequency for manual processes [60].
Essential Research Reagents and Materials
Successful cleaning verification relies on a suite of specific reagents and materials. The following table details key items and their functions in the analytical process.
Table 3: Essential Research Reagent Solutions for Cleaning Verification
| Item | Function | Application Example |
|---|---|---|
| HPLC-Grade Solvents [54] | Serve as the mobile phase for HPLC; high purity is critical to prevent background interference and baseline noise. | Separation of active pharmaceutical ingredients (APIs) during HPLC analysis. |
| Validated Sampling Swabs [55] [53] | Physically remove residue from a defined surface area for analysis; material (e.g., polyester, cotton) must be compatible with the analyte and not interfere. | Swab sampling for HPLC, TOC, or microbiological testing. |
| Certified Reference Standards [54] | Provide a known concentration of the target analyte for method calibration, qualification, and determining accuracy and linearity. | Preparing calibration curves for HPLC or GC analysis. |
| Culture Media [54] | Provide nutrients to support the growth of microorganisms collected during sampling for microbiological testing. | Microbial enumeration and identification from surface samples. |
| TOC Calibration Standards [54] | Solutions with a known concentration of organic carbon (e.g., sucrose, 1,4-Benzoquinone) used to calibrate the TOC analyzer. | Ensuring accuracy and linearity of TOC analysis for cleaning samples. |
| A3/ATP Bioluminescence Assay Swabs [59] | Pre-moistened swabs containing reagents to lyse cells and initiate the light-producing reaction with ATP, ADP, and AMP. | Rapid, on-site surface testing for general organic residue. |
Role in Pharmacokinetic (PK) Studies and Therapeutic Drug Monitoring (TDM) for Personalized Medicine
The fields of Pharmacokinetics (PK) and Therapeutic Drug Monitoring (TDM) are fundamental pillars of modern personalized medicine, enabling the move away from standardized "one-size-fits-all" dosing toward tailored therapeutic regimens. PK studies characterize the time course of a drug's absorption, distribution, metabolism, and excretion (ADME) within the body, while TDM uses drug concentration measurements to guide individual dose adjustments, particularly for medications with a narrow therapeutic index [61] [62]. The ultimate goal is to optimize clinical outcomes by maximizing efficacy while minimizing toxicity.
This process is increasingly supported by Model-Informed Precision Dosing (MIPD), which integrates patient-specific factors, population PK models, and Bayesian forecasting to predict optimal dosing, thereby going beyond traditional TDM [63] [62]. Furthermore, the reliability of the entire PK/TDM enterprise depends on robust bioanalytical methods, primarily chromatography-mass spectrometry (LC-MS/MS), whose results require rigorous cross-validation to ensure data consistency across different laboratories and analytical platforms [32] [57]. This guide objectively compares the performance of different PK modeling approaches, TDM strategies, and analytical techniques that underpin personalized drug therapy.
Comparative Analysis of PK Modeling and TDM Strategies
The effectiveness of personalized medicine hinges on selecting the appropriate tools for predicting drug exposure and making dosing decisions. The following sections provide a detailed, data-driven comparison of the current methodologies.
Performance Comparison of AI vs. Population PK Models
Population PK (PopPK) models are traditional tools that use mathematical functions to describe drug behavior in a population, requiring predefined structural and statistical models. In contrast, Artificial Intelligence (AI) models, particularly ensemble methods, can learn complex patterns from high-dimensional clinical data without heavy reliance on such assumptions [64]. A recent large-scale study compared the predictive performance of ten AI models and published PopPK models for four antiepileptic drugs using real-world TDM data.
Table 1: Predictive Performance of AI vs. Population PK Models for Antiepileptic Drugs
| Drug | Best-Performing AI Model | AI Model RMSE (μg/mL) | Population PK Model RMSE (μg/mL) |
|---|---|---|---|
| Carbamazepine (CBZ) | Adaboost (ADA) | 2.71 | 3.09 |
| Phenobarbital (PHB) | eXtreme Gradient Boosting (XGB) | 27.45 | 26.04 |
| Phenytoin (PHE) | Random Forest (RF) | 4.15 | 16.12 |
| Valproic Acid (VPA) | eXtreme Gradient Boosting (XGB) | 13.68 | 25.02 |
Abbreviation: RMSE, Root Mean Squared Error (lower values indicate better predictive accuracy).
The data demonstrates that AI models matched or significantly outperformed PopPK models for three of the four drugs, with a particularly notable improvement for phenytoin and valproic acid [64]. The most influential covariate for prediction in the AI models was the time after the last drug administration. These findings suggest that AI models, which can leverage vast amounts of electronic medical record data, are a powerful alternative, especially when drug PK variability is high [64].
Accuracy and Clinical Utility of PopPK Models for Antibiotics
For many drugs, especially antibiotics, numerous PopPK models exist, and selecting the best one for clinical use is critical. A study evaluated the predictive performance of eight different published PopPK models for meropenem in a cohort of critically ill patients.
Table 2: Predictive Performance of Published PopPK Models for Meropenem in Critically Ill Patients
| Population PK Model (Source) | Absolute Bias (Mean % Difference) | Absolute Precision (95% Limits of Agreement) | Clinical Implication (Dose Change Required) |
|---|---|---|---|
| Muro et al. | 19.9% (7.3% to 32.7%) | 31.9% to 175.0% | Part of 44-64% of results |
| Crandon et al. | -1.9% (-16.2% to 12.3%) | Not statistically different from zero | Part of 44-64% of results |
| Doh et al. (with edema) | -10.3% (-23.7% to 3.1%) | Not statistically different from zero | Part of 44-64% of results |
| Leroy et al. | -108.5% (-119.9% to -97.3%) | -249.1% to -178.9% | Part of 44-64% of results |
The study revealed significant variability in model performance. While models like Crandon et al. and Doh et al. showed minimal bias, most models (7 out of 8) systematically under-predicted the actual free meropenem concentrations [65]. This under-prediction could lead to insufficient dosing and treatment failure. Despite this variability, the overall accuracy was deemed sufficient to support the inclusion of these models in dosing software to improve the probability of achieving target antibiotic exposure, though careful model selection is paramount [65].
Comparative Outcomes of TDM Sampling Strategies
The method of TDM itself is evolving. For vancomycin, recent guidelines have shifted from trough-based monitoring to area under the curve (AUC)-based dosing to improve accuracy and reduce kidney toxicity. A retrospective pediatric study compared the two approaches and the methods for estimating AUC.
Table 3: Comparison of Vancomycin TDM Strategies in Pediatric Patients
| TDM Strategy / Method | Incidence of Acute Kidney Injury (AKI) | Key Findings / Agreement |
|---|---|---|
| Trough-Based Dosing (2017-2019 cohort) | 6.7% | Traditional method, higher associated toxicity |
| AUC-Based Dosing (2020-2022 cohort) | 2.4% | Associated with a reduced incidence of AKI |
| 1-Point vs. 2-Point Sampling for AUC | Not Applicable | No significant differences in estimated AUC; AUC threshold for predicting AKI was similar (588-621 mg·h/L) |
The data indicates that AUC-based dosing was associated with a reduced incidence of vancomycin-induced AKI without compromising efficacy [66]. Furthermore, the study found no significant difference between AUC estimates derived from a single trough sample versus two samples, supporting the use of simpler, less burdensome 1-point sampling strategies in clinical practice [66].
Essential Experimental Protocols in PK/TDM
Standardized experimental protocols are the backbone of generating reliable, reproducible data for personalized medicine.
Protocol for Cross-Validation of Bioanalytical Methods
When a PK bioanalytical method is transferred between laboratories or the platform is changed (e.g., from ELISA to LC-MS/MS), a cross-validation is required to ensure equivalency. The following protocol, developed by Genentech, Inc., is a robust strategy for this process [32] [57].
- Objective: To demonstrate the equivalency of two validated bioanalytical methods used to generate PK data within the same study or across different studies.
- Sample Selection: One hundred (100) incurred study samples (e.g., clinical plasma samples) are selected to cover the applicable range of concentrations. The selection is based on four quartiles of in-study concentration levels.
- Experimental Procedure: Each of the 100 samples is assayed once using the two bioanalytical methods being compared (e.g., Lab A vs. Lab B, or ELISA vs. IA LC-MS/MS).
- Statistical Analysis and Acceptance Criterion: The percent difference between the two methods is calculated for each sample. The two methods are considered equivalent if the lower and upper bound limits of the 90% confidence interval (CI) for the mean percent difference are both within ±30%. Subgroup analysis by concentration quartile using the same criterion is also performed. A Bland-Altman plot is created to visualize the percent difference against the mean concentration of each sample [32] [57].
Protocol for Evaluating Population PK Model Performance
Before a published PopPK model is implemented in clinical software for MIPD, its predictive performance should be evaluated in the target patient population.
- Objective: To compare the prediction performance of published population pharmacokinetic models in a specific patient cohort.
- Patient Selection: Data is collected from patients who received the drug and underwent TDM. For example, critically ill adults with at least one set of serum samples (e.g., mid-interval and trough) are included. Patients on renal replacement therapy may be excluded [65].
- Data Collection: Demographic, clinical, and laboratory data (e.g., age, weight, serum creatinine, dosage history, and precise sampling times) are collected.
- Concentration Prediction: The published models, coded into dosing software (e.g., ID-ODS), are used to predict drug concentrations based on the individual patient data.
- Performance Metrics: The agreement between observed and predicted concentrations is evaluated using:
- Bias: Measured as the mean percent difference (e.g., via Bland-Altman plots).
- Precision: Measured as the 95% limits of agreement around the bias.
- Clinical Utility: Assessed by comparing whether the observed and predicted concentrations would lead to the same clinical dose adjustment based on a predefined target (e.g., trough >2 mg/L for meropenem) [65].
Visualization of Workflows and Relationships
Visual diagrams are essential for clarifying complex experimental workflows and conceptual relationships in PK/TDM.
Cross-Validation Experimental Workflow
The following diagram illustrates the step-by-step workflow for the cross-validation of two bioanalytical methods, from sample selection to final equivalency assessment [32] [57].
Model-Informed Precision Dosing (MIPD) Logic
This diagram outlines the logical flow of how MIPD integrates patient data, models, and TDM to recommend an individualized dose, creating a feedback loop for continuous optimization [63] [62].
The Scientist's Toolkit: Key Research Reagent Solutions
The following table details essential materials and technologies used in advanced PK/TDM research, as highlighted in the cited literature.
Table 4: Essential Research Reagent Solutions for PK/TDM
| Item / Technology | Primary Function in PK/TDM | Specific Application Example |
|---|---|---|
| Liquid Chromatography-Tandem Mass Spectrometry (LC-MS/MS) | High-sensitivity quantification of drugs and metabolites in complex biological matrices. | Simultaneous quantification of intracellular tacrolimus and mycophenolic acid in renal transplant recipients [63]. |
| Magnetic Bead-based Extraction | Efficient and reproducible sample preparation for complex samples. | Novel sample preparation for intracellular drug quantification in peripheral blood mononuclear cells (PBMCs) [63]. |
| Population Pharmacokinetic Modeling Software (e.g., R, NONMEM) | Development and implementation of mathematical models to describe population-level PK and variability. | Dosing software (ID-ODS) used to simulate meropenem concentrations and design personalized regimens [65]. |
| Ensemble AI Models (e.g., XGBoost, Random Forest) | Predicting drug concentrations by identifying complex patterns in high-dimensional clinical data. | Predicting concentrations of antiepileptic drugs with high accuracy using electronic medical records [64]. |
| Multiplexed MS-MRD Assay | Simultaneous evaluation of multiple protein biomarkers and therapeutic antibodies. | Monitoring M-protein clearance, therapeutic antibody PK, and immunoglobulin recovery in multiple myeloma [63]. |
| Biosensors | Continuous, real-time monitoring of drug levels. | Emerging technology for real-time TDM, potentially reducing assay turn-around times [63] [62]. |
Overcoming Analytical Challenges: Troubleshooting and Strategic Optimization of Methods
Addressing Matrix Effects and Interferences in Biological Samples
Matrix effects represent a significant challenge in the bioanalysis of pharmaceuticals, toxins, and endogenous compounds, potentially leading to inaccurate quantification, reduced sensitivity, and compromised data quality. This guide objectively compares the performance of leading chromatographic and spectroscopic techniques for identifying and mitigating these effects, framed within the critical context of cross-validating spectroscopic and chromatographic results.
Comparison of Techniques for Managing Matrix Effects
The following table summarizes the core characteristics, advantages, and limitations of current methodologies for addressing matrix effects in biological samples.
Table 1: Comparison of Analytical Techniques for Addressing Matrix Effects
| Technique | Core Mechanism for Mitigating Matrix Effects | Key Performance Data | Advantages | Limitations |
|---|---|---|---|---|
| GC-MS with Isotopologs [67] | Uses stable isotope-labeled internal standards (isotopologs) to correct for matrix-induced signal variation. | Enables simultaneous analyte quantification and ME measurement in human serum/urine. [67] | High correction accuracy; internal standard co-elutes with analyte. | Cost of labeled standards; may not correct for all interferences. |
| LC-MS/MS with Derivatization (e.g., AQC) [68] | Chemical derivatization (e.g., with AQC) improves separation and selectivity, reducing spectral interference. | Quantitative results for BMAA in mollusks were lower than HILIC, suggesting different matrix susceptibility. [68] | Can enhance sensitivity and chromatographic behavior. | Additional sample preparation step; potential for introduction of new errors. |
| HILIC-MS/MS without Derivatization [68] | Hydrophilic interaction chromatography separates polar analytes from non-polar matrix components. | BMAA results in cyanobacteria were closer to the "true value" than derivatization methods. [68] | Simpler, faster sample prep; avoids derivatization artifacts. | Can struggle with complex biological matrices; potential for co-elution. |
| GC-MS/MS with Transient Matrix Effect [69] | Uses high-boiling "protectants" (e.g., PEG-400) to temporarily enhance analyte signal. | PEG-400 increased nandrolone signal by 912% in blood plasma, lowering detection limits. [69] | Significantly boosts sensitivity for trace analysis. | Introduces a deliberate, controlled matrix effect; requires optimization. |
| spICP-MS [70] | Analyzes single particles, differentiating them from dissolved ionic matrix background. | Allows detection and characterization of metal-based NPs in complex biological samples. [70] | Direct analysis of nanoparticles; high elemental selectivity. | Limited to elemental analysis; requires sophisticated dilution and calibration. |
| Spectrofluorimetry with Chemometrics [71] | Chemometric models (e.g., GA-PLS) resolve spectral overlap from matrix components. | Achieved LOD of 22.05 ng/mL for amlodipine in plasma; recovery of 95.58-104.51%. [71] | Cost-effective, sustainable (minimal solvents); fast analysis. | Requires intrinsic fluorescence; limited to compounds with suitable properties. |
Detailed Experimental Protocols and Data
Supporting data for the techniques listed above are derived from specific experimental protocols.
Table 2: Experimental Protocols and Key Findings from cited Studies
| Technique | Sample Preparation & Protocol Details | Biological Matrix | Key Quantitative Findings on Matrix Effects |
|---|---|---|---|
| GC-MS with Isotopologs [67] | Simultaneous extraction and analysis of native amino acids and their deuterated isotopologs. Derivatization for GC-MS analysis. | Human serum and urine. | Methodology allows for precise quantification of the matrix effect itself, alongside analyte concentration. |
| LC-MS/MS for BMAA [68] | 1. Extraction: Varied ratios (1:20 to 1:2000) of sample to 20 mM HCl. 2. SPE Purification: Oasis MCX cartridges. 3. Analysis: HILIC-MS/MS (no derivatization) vs. reversed-phase LC-MS/MS (with AQC derivatization). | Cyanobacteria, diatoms, mussels, scallops, oysters. | Optimal Extraction Ratios: Total soluble form: 1:100 (phytoplankton), 1:50 (mollusks). Precipitated bound form: 1:500 (phytoplankton). [68] |
| GC-MS/MS with Transient Matrix Effect [69] | 1. Extraction: QuEChERS technique. 2. Protectant Addition: Addition of PEG-400 to the sample. 3. Analysis: GC-MS/MS with multiple reaction monitoring (MRM). | Blood plasma. | PEG-400 increased the analytical signal for nandrolone by 912%, enabling identification at trace concentrations. [69] |
| Spectrofluorimetry with GA-PLS [71] | 1. Sample Prep: Protein precipitation with acetonitrile for plasma. 2. Fluorescence Enhancement: 1% SDS-ethanolic medium, synchronous fluorescence at Δλ=100 nm. 3. Analysis: GA-PLS chemometric modeling. | Human plasma and pharmaceutical formulations. | GA-PLS outperformed conventional PLS, achieving low RRMSEP (0.93-1.24) and high accuracy (98.62-101.90% recovery) in the presence of biological matrix. [71] |
The Scientist's Toolkit: Key Research Reagent Solutions
Successful management of matrix effects relies on specific reagents and materials.
Table 3: Essential Reagents and Materials for Mitigating Matrix Effects
| Reagent/Material | Function in Addressing Matrix Effects | Example Application |
|---|---|---|
| Stable Isotope-Labeled Internal Standards (Isotopologs) | Compensates for analyte loss during preparation and signal suppression/enhancement during analysis by behaving identically to the analyte. | Quantification of amino acids in human serum and urine by GC-MS. [67] |
| High-Boiling Protectants (e.g., PEG-400) | Modifies the sample matrix in the injection port to transiently enhance the volatility and signal of target analytes in GC-based methods. | Signal enhancement of anabolic-androgenic steroids in blood plasma by GC-MS/MS. [69] |
| Oasis MCX SPE Cartridges | Purifies samples by removing interfering matrix components (e.g., salts, proteins, other amino acids) prior to LC-MS/MS analysis. | Clean-up of BMAA and its isomers from hydrolyzed extracts of phytoplankton and mollusks. [68] |
| AQC Derivatization Reagent | Adds a fluorescent tag to amines, improving chromatographic separation on reversed-phase columns and enhancing detectability, thereby reducing interference. | Analysis of the neurotoxin BMAA in complex biological samples by LC-MS/MS. [68] |
| Genetic Algorithm (GA) Software | An intelligent variable selection tool that identifies the most informative spectral wavelengths, helping to resolve overlaps between analyte and matrix signals. | GA-PLS regression for simultaneous quantification of amlodipine and aspirin in plasma by spectrofluorimetry. [71] |
Cross-Validation Workflows: Integrating Spectroscopic and Chromatographic Data
Cross-validation between techniques is crucial for verifying results, especially when matrix effects are suspected. The following workflow diagrams illustrate two strategic approaches.
Workflow 1: Foundational Cross-Validation Strategy
This diagram outlines a general framework for using orthogonal methods to confirm analytical results.
Workflow 2: Protocol for Specific Technique Cross-Validation
This diagram details a specific protocol for validating the analysis of an analyte like BMAA using two different LC-MS/MS methods.
Mechanism of Transient Matrix Effect
The dramatic signal enhancement used in some GC methods relies on a specific interaction between the protectant and the analyte in the injection port.
Emerging trends focus on green chemistry principles, with a shift toward microsampling techniques (e.g., VAMS, SPME) and miniaturized sample preparation to intrinsically reduce matrix load and solvent consumption [72]. Furthermore, the integration of machine learning and multimodal data analysis is paving the way for predictive modeling of chromatographic behavior and matrix effects, potentially reducing the need for extensive experimental iterations [73] [74]. The continued development of robust cross-validation protocols remains the cornerstone of reliable bioanalysis.
Thesis Context: In the rigorous field of cross-validation of spectroscopic and chromatographic results, the integrity of an analytical outcome is paramount. Sensitivity enhancements in Liquid Chromatography (LC) are not merely about achieving lower detection limits; they are about ensuring that these results are reproducible, accurate, and withstand comparative scrutiny with other analytical techniques. Online preconcentration and large-volume injection (LVI) represent two pivotal strategies that significantly boost sensitivity while supporting the robust, validated data required in modern drug development and environmental analysis.
The demand for lower detection limits in analytical chemistry continues to grow, driven by applications such as trace-level pharmaceutical monitoring, environmental pollutant analysis, and proteomics. Conventional liquid chromatography coupled with mass spectrometry (LC-MS) or other detectors often struggles with sensitivity when analyte concentrations are very low or sample volumes are limited. Two powerful approaches to overcome these limitations are online preconcentration and large-volume injection (LVI). These techniques work by increasing the mass of analyte introduced into the chromatographic system without compromising separation efficiency. Online preconcentration involves techniques that trap and focus analytes from a large volume of sample onto a pre-column or within the capillary itself before the analytical separation. LVI, as the name implies, allows the direct injection of hundreds of microliters of sample, far exceeding the volume of a standard LC injection, which is typically only a few microliters. When properly configured, these methods provide a direct path to significantly improved sensitivity, which is a cornerstone for generating reliable data that can be confidently cross-validated with other methodological approaches.
Online Preconcentration Techniques
Online preconcentration encompasses a family of techniques designed to concentrate target analytes from a sample matrix immediately before or during the chromatographic separation. This process enhances sensitivity by reducing dilution effects and delivering a sharper, more concentrated analyte band to the detector.
Column Switching and On-Line Solid-Phase Extraction (SPE)
Column switching is a common and robust online preconcentration strategy. The most frequent configuration is a multidimensional system using two columns, two high-pressure pumps, and a switching valve [75]. In this setup:
- A large volume of sample is loaded onto a first column (often a guard or extraction column), where analytes are trapped and the sample matrix is washed away.
- After the loading and cleaning phase, the valve switches, and the flow from a second pump elutes the focused analytes from the trapping column onto the analytical column for separation.
A key advancement in making these systems more rugged, especially for complex matrices like environmental waters or biological fluids, is the Automatic Filtration and Filter Back-Flush (AFFL) system. This approach integrates a self-cleaning filter that prevents clogging of capillary columns and connections, a common limitation when using narrow-bore columns. One study demonstrated that this AFFL-SPE-capillary LC-MS platform could inject 100 non-filtrated water samples without causing a pressure rise or clogging, showcasing exceptional ruggedness [76]. The system achieved detection limits for various pharmaceutical products in the 0.05–12.5 ng/L range, with between-day and within-day repeatability of <20% RSD [76].
On-Column Focusing (Stacking)
On-column focusing is a technique where a large volume of sample is injected directly into the analytical column. Analytes are retained and focused at the head of the column using a weak solvent, followed by gradient elution to separate the now-concentrated bands [75]. This technique effectively compresses the peak, leading to higher signal intensity. The effect of this peak compression is visually evident in chromatograms, where large volume injections with focusing produce sharp, narrow peaks compared to the broad, diluted peaks that would result from conventional injections [75]. This method is particularly beneficial for miniaturized LC systems (capillary-LC and nano-LC), which inherently benefit from reduced chromatographic dilution, thereby enhancing mass sensitivity with concentration-sensitive detectors like ESI-MS [75] [76].
Table 1: Comparison of Online Preconcentration Techniques
| Technique | Mechanism | Key Advantages | Typical Applications |
|---|---|---|---|
| Column Switching / On-line SPE | Analytes trapped on a pre-column; matrix washed away before elution to analytical column. | High degree of sample clean-up; automation; improved reproducibility [75]. | Bioanalysis, environmental water monitoring (e.g., pharmaceuticals) [75] [76]. |
| On-Column Focusing | Large sample volume injected in a weak solvent; analytes focused at column head before gradient elution. | Simpler setup; no additional hardware required; effective peak compression [75]. | Miniaturized LC systems (capillary-LC, nano-LC); analysis of polyaromatic hydrocarbons [75]. |
| In-Tube SPME | Analytes extracted and concentrated on a coated capillary prior to elution. | Further miniaturization; integration with automated systems [75]. | Bioanalytical and environmental areas [75]. |
Large-Volume Injection (LVI) Methods
Large-volume injection directly addresses sensitivity challenges by simply introducing a larger amount of the sample into the LC system. Instead of the typical 1-10 µL, LVI allows for the injection of hundreds of microliters.
LVI in Liquid Chromatography
A direct comparison of LVI with solid-phase extraction (SPE) for the target screening of 103 emerging contaminants demonstrated the clear advantages of LVI. The study found that for a 500-µL injection, the limit of quantification (LOQ) was at least 250 times lower than for a 2-µL injection for half of the compounds [77]. Furthermore, LVI provided LOQs lower than the predicted no-effect concentration for more compounds than the SPE method. While matrix effects were observed, they were within an acceptable range (10%–1000%) for 84 out of 97 compounds, and LVI achieved more accurate quantitation for a larger number of compounds compared to the SPE method [77]. This makes LVI a powerful, simpler alternative to offline SPE for many applications.
LVI in Gas Chromatography and Isotope Ratio Mass Spectrometry
The principle of LVI is also successfully applied in other chromatographic techniques. In Gas Chromatography Isotope Ratio Mass Spectrometry (GC-IRMS) for compound-specific hydrogen (δD) and carbon (δ¹³C) isotope analysis, a large-volume (20 µL) injection method using a programmable temperature vaporizer (PTV) inlet was developed. This method reduced the required sample concentration by about 80%, enabling high-throughput analysis of less concentrated environmental samples [78]. The method showed good reproducibility, with a mean precision of 4.0‰ for δD and 0.46‰ for δ¹³C measurements [78].
Experimental Protocols and Methodologies
To ensure reproducibility and support cross-validation efforts, detailed methodologies are essential. Below are outlines of key experimental protocols from the cited literature.
This protocol describes a fully automated platform for the ultra-trace analysis of pharmaceuticals in non-filtrated environmental water.
- Instrumental Setup: A 10-port, two-position switching valve configured with an automatic filtration and filter back-flush (AFFL) system, a trapping column (e.g., C18, 1 mm ID × 50 mm), and a capillary analytical column (e.g., C18, 0.3 mm ID × 150 mm). Coupled to an MS detector.
- Sample Preparation: Minimal. Standard solutions and non-filtrated creek water samples are spiked with analytes and internal standards. No filtration is required due to the integrated AFFL system.
- Procedure:
- Loading/Filtration: A 100 µL sample is injected via the autosampler. Mobile phase (150 µL/min) carries the sample through the AFFL filter, which removes particulate matter. Analytes are trapped on the SPE column while unretained matrix components are diverted to waste.
- Elution & Back-flush: After 1 minute, the switching valve changes position. The capillary LC pump elutes the analytes from the SPE trap column onto the analytical column using a gradient (e.g., from 35% to 95% methanol in 7 min). Simultaneously, the loading pump back-flushes the filter to clean it.
- Separation & Detection: Analytes are separated on the capillary column and detected by MS.
- Validation: The method was validated for LOD (0.05–12.5 ng/L), LOQ, and repeatability (RSD <20%).
This protocol details the use of LVI for sensitive compound-specific isotope analysis of n-alkanes.
- Instrumentation: GC with PTV inlet, equipped with a sintered glass liner, coupled to an IRMS.
- Sample Preparation: n-Alkanes are extracted and purified from sediment samples via standard techniques (e.g., silica gel chromatography) and dissolved in n-hexane.
- Injection Parameters:
- Injection Volume: 20 µL.
- PTV Program: Initial temperature 40°C (split vent open), ramped rapidly to 69°C to evaporate solvent, then to 320°C (split vent closed) to transfer analytes to the GC column.
- Chromatography: Separation is achieved using a DB-1 ms column (60 m × 0.25 mm ID, 0.25 µm film) with a tailored temperature program.
- Detection: Analytes are converted to H₂ (for δD via pyrolysis) or CO₂ (for δ¹³C via combustion) before isotope ratio measurement in the IRMS.
- Data Analysis: Isotopic measurements are calibrated against international standards using reference n-alkane materials.
Visualization of Operational Workflows
The following diagrams illustrate the logical steps and configurations of the two primary techniques discussed, providing a clear visual representation of the experimental workflows.
The Scientist's Toolkit: Essential Research Reagents and Materials
Successful implementation of these sensitivity-enhancing techniques relies on specific instrumentation and materials. The following table details key components.
Table 2: Essential Materials for Online Preconcentration and LVI
| Item | Function | Application Example |
|---|---|---|
| Switching Valve (6- or 10-port) | Directs flow paths for sample loading, washing, and elution in automated systems. | Core component of column switching systems for online SPE [75]. |
| Capillary/Nano-LC Columns (id < 0.5 mm) | Reduces radial dilution of analytes, enhancing mass sensitivity with concentration-sensitive detectors like ESI-MS. | Used in miniaturized LC systems for bioanalysis and proteomics [75] [76]. |
| PTV Inlet with Sintered Liner | Allows for large-volume injection by controlling solvent vaporization and analyte transfer in GC and LC. | Essential for 20 µL injections in GC-IRMS for δD and δ¹³C analysis [78]. |
| AFFL (Automatic Filtration and Filter Back-Flush) System | Self-cleaning filter that prevents clogging of capillary columns and connections when analyzing complex samples. | Enables direct injection of 100+ non-filtrated environmental water samples [76]. |
| Specialty Sorbents (e.g., RAM, Monoliths) | Provide selective extraction and concentration of analytes while removing matrix interferents like proteins. | Used in online SPE pre-columns for direct injection of biological samples [75]. |
Online preconcentration and large-volume injection are not just techniques for pushing detection limits lower; they are foundational for developing robust, reliable, and sensitive analytical methods. The experimental data and protocols presented demonstrate that these approaches can provide orders-of-magnitude improvements in sensitivity while maintaining or even enhancing analytical ruggedness. In the critical context of cross-validation, where analytical results must be verifiable and stand up to comparison with orthogonal techniques, the robust and reproducible nature of these online configurations is invaluable. By carefully selecting and optimizing these techniques—whether it is a simple on-column focusing method, a comprehensive online SPE-MS platform, or an LVI-GC-IRMS setup—researchers and drug development professionals can confidently address the growing challenges of trace-level analysis.
The cross-validation of spectroscopic results with chromatographic methods is a cornerstone of modern analytical science, particularly in pharmaceutical development. A significant challenge in this domain is the accurate analysis of compounds that lack a suitable chromophore, making them nearly invisible to the most prevalent detection technique, ultraviolet (UV) absorbance. Molecules without conjugated pi-electron systems, such as many sugars, lipids, carbohydrates, and certain inorganic ions, absorb light very weakly, leading to poor sensitivity and selectivity with UV detection [79] [80].
This limitation has driven the adoption of universal and mass-sensitive detection techniques. This guide provides an objective comparison of two powerful strategies: Liquid Chromatography coupled with Charged Aerosol Detection (LC-CAD) and Liquid Chromatography-Mass Spectrometry (LC-MS). We will evaluate their performance characteristics, provide detailed experimental protocols, and discuss their roles in a comprehensive cross-validation framework.
Detection Principle and Instrumentation
Understanding the fundamental working principles of each detector is key to selecting the appropriate analytical strategy.
Charged Aerosol Detection (CAD)
Charged Aerosol Detection is an evaporative aerosol-based technique known for its near-universal response to non-volatile and semi-volatile analytes [81]. Its operation involves three critical stages, as illustrated in the workflow below.
- Nebulization: The liquid effluent from the LC column is pneumatically transformed into a fine aerosol using a nitrogen or air gas stream [82] [81].
- Evaporation: The aerosol passes through a heated drift tube where the volatile mobile phase is evaporated. This leaves behind dried, non-volatile analyte particles [81].
- Charging and Detection: The dried particles are exposed to a stream of positively charged nitrogen gas generated by a high-voltage corona wire. The charge is then transferred to the particles, and the resulting current is measured by a highly sensitive electrometer. This current is proportional to the quantity of the analyte present [14] [81].
A key advantage of CAD is that its response is largely independent of the chemical structure of the analyte, provided the analyte is non-volatile. This leads to a more uniform response factor across different compound classes compared to UV or MS [81].
Mass Spectrometry (MS) Detection
Mass spectrometry detects analytes based on their mass-to-charge ratio (m/z). After chromatographic separation, the key steps are:
- Ionization: Analytes are converted into gas-phase ions in the ion source. Electrospray Ionization (ESI) is most common for LC-MS and requires the analyte to be ionizable [82].
- Mass Analysis: Ions are separated according to their m/z by a mass analyzer (e.g., quadrupole, time-of-flight).
- Detection: The separated ions strike a detector, generating a signal proportional to their abundance.
MS provides exceptional sensitivity and selectivity, and delivers structural information, but its response is highly dependent on the analyte's ability to ionize efficiently in the source [82].
Performance Comparison and Experimental Data
The choice between LC-CAD and LC-MS is guided by the specific analytical requirements. The table below summarizes a quantitative performance comparison of common detection techniques for non-chromophoric compounds.
Table 1: Detector Comparison for Non-Chromophoric Compounds
| Detector Feature | CAD | MS (ESI) | Refractive Index (RI) | Evaporative Light Scattering (ELSD) |
|---|---|---|---|---|
| Universality | Near-universal for non-volatiles [81] | Selective for ionizable compounds [82] | Universal | Universal for non-volatiles [80] |
| Sensitivity | Sub-nanogram [81] | High (picogram-femtogram) | Microgram [80] | Nanogram [81] |
| Gradient Elution | Fully compatible [81] | Fully compatible | Incompatible [81] | Compatible [80] |
| Response Uniformity | High for non-volatiles [14] [81] | Low (varies with ionization) | High | Moderate to Low [81] |
| Structural Information | No | Yes | No | No |
| Quantitation without Pure Standards | Yes (single calibrant) [14] [81] | Difficult (requires isotopically labeled standards) [82] | Yes | Possible, but less uniform than CAD [81] |
Key Experimental Findings
- LC-CAD for Sugars vs. HPLC-UV: A study comparing sugar analysis in honey demonstrated that HPLC with a Charged Aerosol Detector provides a robust and sensitive alternative to traditional methods. In contrast, HPLC-UV at low wavelengths (190 nm), while feasible for monosaccharides, offered poorer limits of detection for disaccharides compared to CAD and RI detection [83].
- Response Linearity in CAD: The response of a CAD is inherently non-linear but can be effectively linearized using a Power Function Value (PFV). Experimental optimization has shown that applying an optimal PFV (e.g., 1.4) can transform the response to a highly linear relationship (R² > 0.999) over a wide concentration range, which is critical for accurate quantitation [14] [82].
- MS Ionization Suppression: In LC-MS, the presence of matrix components can compete for charge during ionization, leading to ion suppression. This can cause significant inaccuracies in quantitation, a problem not encountered with CAD, as its response is independent of ionization efficiency [82].
Experimental Protocols for Method Development
LC-CAD Method Development for Counter-Ion Analysis
This protocol is adapted from applications in pharmaceutical analysis for quantifying inorganic counterions in drug substances [82] [81].
Sample Preparation:
- Dissolve the drug substance in a mixture of water and methanol (e.g., 90:10 v/v).
- Gently sonicate to ensure complete dissolution and precipitation of the free base/acid, leaving the counterion in solution.
- Centrifuge and filter the supernatant through a 0.2 µm syringe filter before injection.
Chromatographic Conditions:
- Column: Reversed-phase C18 column (e.g., 150 x 4.6 mm, 5 µm).
- Mobile Phase: 50 mM Ammonium acetate in water, adjusted to pH 5.0 with acetic acid (Volatile additive).
- Flow Rate: 1.0 mL/min.
- Injection Volume: 10 µL.
- Temperature: 30°C.
CAD Parameters:
- Evaporation Temperature: 30 - 50°C (Optimize for mobile phase composition).
- Nebulizer Gas: Nitrogen, pressure ~60 psi.
- Data Collection Rate: 10 Hz.
- Power Function Value: 1.0 (initial), optimize to 1.3 - 1.5 for linearity [14].
LC-MS Method Development for Lipid Profiling
This protocol is used for the sensitive identification and quantification of lipids, which typically lack chromophores.
Sample Preparation:
- Extract lipids from the biological matrix (e.g., plasma, tissue) using a chloroform-methanol mixture via the Folch or Bligh-Dyer method.
- Reconstitute the dried lipid extract in a 1:1 mixture of chloroform and methanol.
Chromatographic Conditions:
- Column: C8 or C18 column for non-polar lipids; HILIC for polar lipids.
- Mobile Phase A: Water with 10 mM Ammonium acetate.
- Mobile Phase B: Acetonitrile/Isopropanol (1:1) with 10 mM Ammonium acetate.
- Gradient: Ramp from 40% A to 100% B over 15 minutes.
- Flow Rate: 0.3 - 0.5 mL/min.
MS Parameters:
- Ionization Mode: ESI positive and negative mode.
- Source Temperature: 300°C.
- Ion Spray Voltage: 5500 V (positive), -4500 V (negative).
- Scan Mode: Multiple Reaction Monitoring (MRM) for quantitation; full scan for profiling.
Cross-Validation Workflow and Data Integration
In a comprehensive analytical strategy, LC-CAD and LC-MS are not mutually exclusive but are complementary techniques. The following diagram illustrates a robust workflow for cross-validating results, which is essential for regulatory submissions and high-confidence data generation.
Key Integration Points:
- Purity and Assay Analysis: Use LC-CAD for its uniform response to quantify the main component and impurities without pure standards. Use LC-MS to confirm the identity of each peak and detect any co-eluting impurities that might not be resolved chromatographically [1].
- Mass Balance: In forced degradation studies, LC-CAD can provide a mass-balanced account of all degradation products, as it detects all non-volatile species. LC-MS can then be used to identify the chemical structure of these unknown degradants [82].
- Overcoming Ion Suppression: When matrix effects in LC-MS lead to questionable quantitative results, LC-CAD can serve as an orthogonal quantitative method to verify the accuracy of the measurement, as its response is not affected by ionization suppression [82].
Essential Research Reagent Solutions
Successful implementation of these strategies requires high-purity materials to minimize background noise and ensure detector integrity.
Table 2: Essential Research Reagents and Materials
| Item | Recommended Specification | Function & Importance |
|---|---|---|
| Water | Type 1 ultrapure (18.2 MΩ·cm, < 50 ppb TOC) [84] | Mobile phase base. Minimizes non-volatile residue, critical for low CAD background. |
| Organic Solvents | LC-MS grade (low residue after evaporation) [84] | Mobile phase components. High purity reduces baseline noise and drift. |
| Volatile Additives | LC-MS grade Ammonium formate, Ammonium acetate, Formic acid, etc. [82] | pH and volatility control. Non-volatile additives (e.g., phosphate) damage the CAD. |
| Nitrogen Gas | High-purity generator or cylinder [84] | Nebulizer and charging gas for CAD. Stable flow is critical for stable baseline. |
| Dedicated Glassware | Detergent-free, meticulously rinsed [84] | Prevents contamination from surfactants or residues that cause ghost peaks. |
| Syringe Filters | Nylon or PTFE, 0.2 µm [82] | Sample clarification. Removes particulates that could clog the system. |
Both LC-CAD and LC-MS are powerful techniques that effectively address the analytical challenge of compounds with poor UV chromophores. The choice between them hinges on the specific goals of the analysis.
- LC-CAD is the superior choice for universal quantification of non-volatile analytes, especially when chemical standards are unavailable, or when a uniform response is critical for mass balance and purity assessments. Its robustness and ease of use make it highly suitable for quality control environments.
- LC-MS is unparalleled when sensitivity, selectivity, and structural confirmation are required. It is the technique of choice for identifying unknown impurities, profiling complex biological mixtures, and conducting trace-level analysis.
For a robust analytical thesis, the most effective strategy is not to choose one over the other, but to integrate them into a complementary workflow. Using LC-CAD for reliable quantitation and LC-MS for definitive identification creates a powerful cross-validation framework that leverages the strengths of both platforms, ensuring data integrity and a comprehensive understanding of the sample.
The transition of analytical methods from research and development (R&D) to Good Manufacturing Practice (GMP)-compliant quality control environments represents a critical juncture in biopharmaceutical development. This process, formalized as method transfer, qualifies a receiving laboratory to use an analytical procedure that originated in a transferring laboratory [85]. The concept of an analytical lifecycle has been widely adopted in the biopharmaceutical industry, with the US Pharmacopeia advocating for lifecycle management of analytical procedures [86]. This lifecycle encompasses method design and development, procedure qualification, and ongoing performance verification, mirroring the FDA's guidance on process validation [86].
Within this framework, the cross-validation of analytical techniques—particularly spectroscopic and chromatographic methods—provides a scientific foundation for ensuring method robustness during technology transfer. As biomanufacturers globalize their operations, with different sites performing process development, GMP manufacturing, and stability testing, the ability to demonstrate consistent method performance across multiple laboratories becomes paramount for regulatory compliance and product quality assurance [86]. This article examines the strategic approaches, experimental protocols, and comparative performance data essential for successful method transfer and scalability in regulated environments.
Fundamentals of Analytical Method Transfer
Defining Method Transfer and Its Regulatory Basis
According to the USP, analytical method transfer is "the documented process that qualifies a laboratory (the receiving laboratory) to use an analytical method that originated in another laboratory (the transferring laboratory)" [85]. This formal GMP process ensures and documents that the method performs as intended within the receiving laboratory's environment [87]. The relationship between transferring and receiving laboratories can vary; they may be internal to the same organization or external, such as when a method is transferred from a manufacturing facility to a contracted laboratory [85].
The analytical target profile serves as a foundational element in method lifecycle management, defining the method development goals and acceptance criteria before validation begins [86]. This profile may be provisional in early development but becomes more refined as products advance toward commercialization. For instance, a quantitative test for impurity measurement might evolve into a qualitative limit test when process understanding confirms consistent removal of the impurity below detection limits [86].
Strategic Transfer Approaches
A risk-based approach to method transfer selection ensures that the level of documentation and verification is proportionate to the method's complexity and criticality. The most common transfer strategies include:
Comparative Testing: This most common approach requires both laboratories to test homogeneous lots of material following a pre-approved protocol with established acceptance criteria [87] [85]. The transfer protocol stipulates detailed procedures, samples, and acceptance criteria for comparative assessment.
Covalidation: When multiple laboratories are required for GMP testing, covalidation represents an efficient strategy where the receiving laboratory participates in the validation study [87]. The primary laboratory performs full validation while receiving laboratories conduct selected activities, typically intermediate precision studies or specificity verification [86]. All data is combined into a single validation package, simultaneously qualifying all participating laboratories [86].
Revalidation/Partial Revalidation: The receiving laboratory performs complete or partial method validation per USP <1225> when the transferring laboratory is unavailable for comparative testing [85]. A risk-based approach determines which elements of the original validation require repetition [87].
Transfer Waiver: Justified omission of transfer processes may be appropriate based on the receiving laboratory's experience with similar methods or when transferring compendial procedures [87] [85]. Risk analysis considers the receiving laboratory's knowledge and the method's complexity [85].
Table 1: Risk-Based Selection of Method Transfer Approaches
| Transfer Approach | Typical Applications | Key Advantages | Regulatory Basis |
|---|---|---|---|
| Comparative Testing | Quantitative impurity methods, most non-compendial methods | Direct performance comparison between labs | ICH guidelines, USP <1224> |
| Covalidation | Methods needed at multiple sites simultaneously | Time-efficient, combined validation and transfer | ICH Q2(R1), inter-laboratory validation |
| Revalidation | When transferring lab unavailable, high-risk methods | Independent verification of method performance | USP <1225> validation requirements |
| Transfer Waiver | Compendial methods, platform assays with established use | Resource-efficient, based on prior knowledge | Risk-based justification required |
Cross-Validation of Spectroscopic and Chromatographic Methods
Principles of Cross-Validation
Cross-validation establishes the equivalence of different analytical techniques measuring the same analyte, providing scientific evidence for method reliability during technology transfer. This approach is particularly valuable when transitioning between laboratory environments where equipment capabilities may differ. The fit-for-purpose concept in method validation recognizes that validation requirements typically increase as products advance through development stages, with full validation according to ICH Q2R1 required for commercialization [86].
The inherent complexity of analyzing biopharmaceutical products has driven significant progress in analytical technologies, with hyphenated analytical platforms emerging as valuable tools for constituent identification, distribution, quantification, and authentication [1]. Combining chromatography with spectroscopy has proven particularly effective for the characterization and quantification of complex molecules [1].
Comparative Performance of Analytical Techniques
Recent research has quantitatively compared the performance characteristics of different analytical methods for specific applications, providing valuable data for method selection during technology transfer. A comprehensive comparison of four hydrogen sulfide (H₂S) detection methods demonstrates how technique selection depends on required sensitivity, response time, and cost-effectiveness [88].
Table 2: Cross-Validation Performance Data for H₂S Detection Methods [88]
| Analytical Technique | Sensitivity Range | Sample Volume | Analysis Time | Key Applications |
|---|---|---|---|---|
| Colorimetric | Millimolar to micromolar | 1 ml | ~30 minutes | Research applications, initial screening |
| Chromatographic (HPLC) | Micromolar | 25 μl | ~6 minutes per injection | Quantitative analysis in physiological solutions |
| Voltametric Electrochemical | Nanomolar | 20 ml | Minutes (real-time capability) | Physiological concentration monitoring |
| Amperometric Electrochemical | Picomolar to nanomolar | 20 ml | Minutes (real-time capability) | Ultra-sensitive detection in simulated tear fluid |
The cross-validation of near-infrared spectroscopy (NIRS) with phosphorus magnetic resonance spectroscopy (³¹P-MRS) for measuring skeletal muscle oxidative capacity further demonstrates the principle of method correlation [89]. In this study, the average recovery time constant was 31.5 ± 8.5 seconds for phosphocreatine and 31.5 ± 8.9 seconds for muscle oxygen consumption, showing remarkable agreement between the two methods [89]. The strong correlation (Pearson's r = 0.88-0.95) between techniques validated NIRS as a reliable method for assessing mitochondrial function [89].
Experimental Protocol for Cross-Validation Studies
A standardized approach to cross-validation ensures consistent evaluation of method equivalence:
Sample Preparation:
- Prepare standardized samples covering the analytical measurement range
- For chromatography-spectroscopy cross-validation, use identical sample aliquots
- Include samples representing expected specification ranges and edge-of-failure conditions
Instrumentation and Conditions:
- Operate all instruments according to qualified status with current calibration
- Document all critical instrument parameters (columns, detectors, wavelengths, etc.)
- Maintain consistent environmental conditions (temperature, humidity) where applicable
Data Collection and Analysis:
- Perform replicate measurements (n≥6) for statistical significance assessment
- Apply appropriate statistical tests (correlation analysis, Bland-Altman plots, ANOVA)
- Evaluate accuracy, precision, linearity, and range for both methods
- Compare specificity and robustness under modified conditions
Acceptance Criteria:
- Statistical equivalence (p>0.05 for significance testing)
- Correlation coefficient (r) ≥0.95 for quantitative methods
- Relative standard deviation between methods ≤15% for precision
- Mean difference between methods within predefined equivalence margin
Analytical Transfer Implementation Framework
Pre-Transfer Preparation Checklist
Successful method transfer requires meticulous preparation from both transferring and receiving laboratories. The following checklist outlines critical prerequisites:
Equipment Verification: The receiving laboratory must verify that all required equipment and systems are available, qualified, and properly calibrated in compliance with applicable regulations [85].
Documentation Review: The transferring laboratory must provide complete methodology documentation, including the analytical procedure, validation report, and any additional supporting documents [87] [85].
Training and Familiarization: The transferring laboratory should provide necessary training to the receiving laboratory for all non-USP tests, with built-in time for feasibility assessment [87] [85]. Laboratory staff must be properly trained and qualified to execute analytical methods [85].
Protocol Development: A pre-approved protocol, reviewed and approved by both laboratories, must outline the method procedure, required materials, transfer acceptance criteria, and specific analytical performance characteristics for evaluation [85].
Method Transfer Workflow
The following diagram illustrates the sequential workflow for a successful analytical method transfer, incorporating cross-validation elements where applicable:
The Scientist's Toolkit: Essential Research Reagent Solutions
Successful method transfer and cross-validation studies require specific reagents and materials designed to maintain analytical performance across laboratory environments. The following table details essential research reagent solutions and their functions in method transfer activities:
Table 3: Essential Research Reagent Solutions for Method Transfer and Cross-Validation
| Reagent/Material | Function in Method Transfer | Application Examples |
|---|---|---|
| System Suitability Standards | Verifies instrument performance meets method requirements | Column efficiency tests, detector sensitivity verification |
| Reference Standards | Quantification and method calibration | API purity determination, impurity quantification |
| Spiked Impurity Materials | Specificity and accuracy demonstration | Forced degradation studies, recovery determination |
| Stability-Indicating Materials | Method robustness assessment | Stress samples for specificity verification |
| Matrix-Blank Solutions | Specificity and selectivity verification | Placebo formulations for interference checking |
| Cross-Validation Calibrators | Equivalence establishment between techniques | Shared samples for spectroscopic-chromatographic correlation |
Scaling Analytical Methods for Commercial Manufacturing
Addressing Scale-Up Challenges
The transition from laboratory-scale to commercial-scale production presents significant challenges for biotech companies, particularly for complex modalities like cell and gene therapies [90]. According to industry experts, one of the most significant challenges is "not just the science or the scale itself, but how we manage and translate knowledge between R&D and manufacturing" [91]. This knowledge transfer gap often manifests when elegant lab-scale processes encounter scalability, validation, and documentation requirements in GMP environments that weren't fully addressed during development [91].
For autologous cell therapies, the regulatory burden surrounding product release testing creates particular complexity. These therapies often have short shelf lives and narrow dosing windows, requiring compressed release testing timeframes that necessitate rapid and real-time release methodologies [91]. Effective scaling requires early consideration of scalability in process development, including selection of cell lines, media, and equipment amenable to scaling, along with small-scale systems that mimic large-scale conditions [90].
Integrated Quality Systems
Robust quality control measures are essential for maintaining product safety and efficacy during scale-up. This includes validating quality control methods, maintaining independent QC laboratories, and ensuring data integrity through rigorous documentation practices [90]. Process Analytical Technology plays a crucial role in improving process efficiency and control by defining Critical Process Parameters and monitoring these parameters in-line or on-line to maintain a product's Critical Quality Attributes [90].
The fit-for-purpose concept extends to validation strategies throughout product development. Graduated validation approaches recognize that requirements change as products advance, with early development stages utilizing simpler validation processes that evolve toward full ICH Q2R1 validation for commercialization [86]. Generic validation approaches for platform assays enable efficient method implementation across similar biological products, significantly speeding up investigational new drug submissions during early product development stages [86].
Successful method transfer and scalability from laboratory to GMP-compliant quality control environments requires a systematic approach grounded in scientific principles and regulatory expectations. The cross-validation of spectroscopic and chromatographic methods provides a robust scientific framework for demonstrating method reliability across different laboratory environments and equipment platforms. As the biopharmaceutical industry continues to globalize and embrace complex therapeutic modalities, the strategic implementation of risk-based transfer approaches, comprehensive documentation practices, and integrated quality systems becomes increasingly critical for ensuring consistent product quality and accelerating patient access to innovative therapies.
Utilizing Design of Experiments (DoE) for Robust Chromatographic Process Characterization
Design of Experiments (DoE) has emerged as a fundamental statistical tool for efficient process optimization in pharmaceutical development, particularly for chromatographic process characterization [92]. Unlike the traditional one-factor-at-a-time (OFAT) approach, DoE enables researchers to systematically study the effects of multiple process parameters and their interactions on critical quality attributes (CQAs) through structured experimental designs [93]. This methodology aligns perfectly with the Quality by Design (QbD) framework advocated by regulatory agencies, which emphasizes building quality into processes through scientific understanding rather than relying solely on end-product testing [93]. The application of DoE in chromatography allows for the identification of optimal operating conditions while simultaneously quantifying the relationship between input factors (e.g., buffer composition, gradient slope, temperature) and output responses (e.g., purity, yield, resolution) [94] [93].
In the context of cross-validating spectroscopic and chromatographic methods, DoE provides a structured framework for establishing correlation models between these complementary analytical techniques. This is particularly valuable for natural product analysis, where the chemical complexity of samples necessitates multiple orthogonal methods for comprehensive characterization [1]. The systematic approach of DoE ensures that the experimental data used for method correlation covers the entire design space, resulting in more robust and transferable models.
Fundamental DoE Methodologies in Chromatography
Core DoE Framework and Implementation
The implementation of DoE in chromatographic process characterization typically follows a structured nine-step approach: setting objectives, identifying parameters and responses, developing experimental design, executing the design, checking data consistency, analyzing results, and interpreting findings [92]. This systematic framework ensures that all potential sources of variation are considered and that the resulting models accurately represent the true process behavior. The parameters studied typically include protein load, loading pH and conductivity, wash conditions, elution pH and conductivity, and flow rate, with primary responses focusing on step yield and purity [93].
Advanced DoE approaches include Model-Based Design of Experiments (MBDoE), which has demonstrated superior efficiency in parameter estimation for HPLC isotherm model identification compared to traditional factorial designs [95]. MBDoE quantifies parametric uncertainty through statistical tests and maximizes information obtained from each experiment, requiring fewer experimental runs to achieve the same level of precision [95]. This approach is particularly valuable for complex chromatographic systems where experimental resources are limited or costly.
Experimental Design Types and Applications
Table 1: Common DoE Designs in Chromatographic Method Development
| Design Type | Key Characteristics | Typical Applications | Advantages | Limitations |
|---|---|---|---|---|
| Full Factorial | Studies all treatment combinations of factors and levels [92] | Initial method scouting; factor interaction studies [93] | Evaluates all main effects and interactions [92] | Number of runs increases exponentially with factors [92] |
| Fractional Factorial | Studies a fraction of full factorial combinations [92] | Screening numerous factors to identify critical ones [93] | Reduces experimental burden while capturing main effects [92] | Cannot evaluate all interactions; potential aliasing [92] |
| Plackett-Burman | Efficient screening design assuming negligible interactions [92] | Initial parameter screening in complex chromatographic systems [94] | Highly efficient for identifying significant main effects [92] | Cannot estimate interactions between factors [92] |
| Response Surface Methodology (RSM) | Includes Central Composite, Box-Behnken, Doehlert designs [94] | Process optimization and design space establishment [93] | Generates mathematical models for prediction and optimization [92] | Requires prior knowledge of factor ranges; more complex analysis [94] |
| D-Optimal | Computer-generated based on statistical optimality criteria [94] | Irregular experimental regions; mixture designs [94] | Handles constrained experimental spaces efficiently [94] | Design depends on pre-specified model form [94] |
Different experimental designs serve specific purposes in chromatographic development. Screening designs like Plackett-Burman and fractional factorials are employed initially to identify factors with statistically significant effects on dependent variables (responses) [94]. These designs typically use two-factor levels and are resolution-dependent, determining the ability to estimate main effects and interactions [94]. For the main optimization stage, designs with three or more factor levels are recommended, such as central composite designs, Box-Behnken designs, and Doehlert designs [94]. These designs differ in orthogonality (diagonality) and rotatability (symmetry to a central point), which affects their statistical efficiency and applicability to different chromatographic scenarios [94].
Experimental Protocols and Case Studies
Cation-Exchange Chromatography Purification Case Study
A comprehensive case study demonstrating DoE application involved establishing the design space for an intermediate cation-exchange chromatography purification step for a protein therapeutic [93]. The step aimed to remove both process-related and product-related impurities, requiring delicate condition optimization to separate closely related species.
Experimental Protocol:
- Risk Assessment and Parameter Selection: Initial failure mode and effect analysis (FMEA) identified high-risk parameters affecting recovery and purity [93].
- Screening DoE: A two-level, eight-factor fractional factorial design was executed with 14 small-scale runs (12 experimental + 2 control) evaluating protein load, loading pH/conductivity, wash pH/conductivity, elution pH/conductivity, and flow rate [93].
- Follow-on DoE: A two-level, four-factor full factorial design focused on the most significant parameters identified from screening: protein load, wash 2 pH, wash 2 conductivity, and elution conductivity [93].
- Analysis: Results were analyzed using JMP software, with backward stepwise regression removing statistically insignificant terms (p-value > 0.05) [93].
- Model Validation: The refined regression model explained 99% of step yield variation (R² = 0.99, F(12,5) = 75.59, p < 0.0001) and 96% of purity variation (R² = 0.96, F(12,5) = 11.28, p = 0.0074) [93].
- Monte Carlo Simulation: Using the regression model and manufacturing data, simulations assessed process capability and failure rates under different scenarios to establish the design space [93].
The resulting models demonstrated excellent predictive capability with all variance inflation factor (VIF) values approximately 1, indicating no multicollinearity concerns [93]. This approach enabled the identification of robust operating ranges that consistently met the acceptance criteria of ≥65% step yield and ≥95% purity.
Gas Chromatographic Method Development Protocol
In gas chromatography (GC), DoE has been successfully applied to optimize separation parameters, injection configurations, and detector settings [94]. A representative protocol for GC method development includes:
Experimental Protocol:
- Screening Phase: Employ a 2^k full/fractional factorial or Plackett-Burman design to identify statistically significant factors [94].
- Factor Selection: Common factors include temperature program parameters (initial temperature, ramp rate, final temperature), carrier gas velocity, inlet temperature, splitless time, and detector temperatures [94].
- Response Measurement: Key responses include resolution of critical pairs, peak symmetry at 10% height, retention indices, analysis time, and peak capacity [94].
- Model Building: Use response surface methodology with second-order polynomial functions or artificial neural networks (ANN) to model the relationship between factors and responses [94].
- Multi-response Optimization: Apply desirability functions to transform multiple responses into a single total response for optimization [94].
For comprehensive two-dimensional gas chromatography (GC×GC), DoE becomes particularly valuable due to the increased number of experimental parameters. Studies have successfully employed full-factorial designs at the screening stage followed by central composite designs for optimization of parameters such as modulator temperature, modulation period, and phase ratios [94]. In these applications, artificial neural networks have demonstrated superior performance for representing nonlinear relationships compared to traditional polynomial models [94].
Figure 1: Systematic DoE Workflow for GC Method Development
Comparative Performance Data
Quantitative Comparison of DoE Approaches
Table 2: Performance Comparison of Different DoE Strategies in Chromatography
| DoE Approach | Application Context | Key Performance Metrics | Comparative Advantage | Reference |
|---|---|---|---|---|
| Model-Based DoE | HPLC isotherm identification | 30-50% reduction in experiments required vs. factorial design | Superior parameter precision with fewer experimental runs | [95] |
| Factorial DoE | CEX chromatography step characterization | R² = 0.99 for yield, R² = 0.96 for purity models | Comprehensive evaluation of main effects and interactions | [93] |
| Box-Behnken vs. Doehlert | GC×GC analysis of ignitable liquids | Both showed average prediction variance at 0.4 point | Doehlert revealed second optimum region; Box-Behnken showed higher model efficiencies | [94] |
| ANN vs. Polynomial | GC×GC enantiomer separation in wine | Nonlinear relationships better modeled by ANN | ANN superior for complex retention patterns; polynomial adequate for linear correlations | [94] |
| Kinetic Plot Method | HPLC column performance comparison | Transforms Van Deemter data to time-resolution relationships | Enables direct comparison of different column geometries and particle sizes | [96] |
The kinetic plot method represents a specialized DoE application for comparing LC column performance, transforming traditional Van Deemter curves into more practically relevant relationships between analysis time and achievable plate count [96]. This approach, based on two fundamental equations, allows direct comparison of different column configurations by calculating the minimal analysis time needed to obtain a given efficiency under pressure constraints [96].
DoE Software Capabilities Comparison
Table 3: Commercial Software Tools for DoE Implementation in Chromatography
| Software Platform | Key Features | Specialized Capabilities | Implementation Considerations |
|---|---|---|---|
| JMP | Comprehensive screening and optimization tools; advanced visualization | Integration with Monte Carlo simulation for failure prediction; validated for pharmaceutical applications [93] | Widely adopted in biopharmaceutical industry; strong technical support |
| Design Expert | Can screen up to 50 factors; ANOVA-based analysis | Specialized response surface methodology designs; desirability function optimization [92] | User-friendly interface; good for classic RSM applications |
| MODDE | Design recommendation engine; CFR Part 11 compliant | Built-in design selection guidance for new users; audit trail functionality [92] | Higher cost; strong regulatory compliance features |
| Minitab | General statistical analysis with DoE modules | Comprehensive factorial and response surface designs [92] | Broad statistical capabilities beyond DoE; steep learning curve |
DoE in Cross-Validation of Analytical Methods
The integration of DoE methodologies provides a robust statistical framework for cross-validating spectroscopic and chromatographic results, which is particularly valuable in complex analytical scenarios such as natural product analysis and halal authentication studies [1] [2]. In these applications, DoE enables the systematic correlation of data from multiple analytical platforms, including Fourier Transform Infrared Spectroscopy (FTIR), High Performance Liquid Chromatography (HPLC), and Liquid Chromatography-Mass Spectrometry (LC-MS/MS) [2].
The experimental workflow for cross-validation typically involves:
- Experimental Design: Establishing a DoE that adequately samples the chemical space of interest, ensuring representative coverage of expected variation in real samples [2].
- Parallel Analysis: Analyzing all samples using both chromatographic and spectroscopic methods under optimized conditions determined through prior DoE studies [1].
- Chemometric Analysis: Applying multivariate data analysis (MDA) techniques to the resulting datasets to identify correlation patterns and develop predictive models [2].
- Model Validation: Testing the correlation models with independent sample sets to verify predictive accuracy and establish method reliability [93].
This approach has been successfully demonstrated in halal authentication studies, where FTIR spectroscopic data was correlated with LC-MS/MS results to identify porcine gelatin biomarkers in pharmaceutical products with high confidence levels [2]. The structured nature of DoE ensures that the correlation models are based on statistically representative data, significantly enhancing the reliability of the cross-validated results.
Essential Research Reagent Solutions
Table 4: Essential Materials and Reagents for Chromatographic DoE Studies
| Category | Specific Examples | Function in DoE Studies | Implementation Considerations |
|---|---|---|---|
| Chromatography Resins | POROS resins, C18 stationary phases, ion-exchange media [93] | Separation matrix for target analytes; primary factor in selectivity optimization | Chemical stability, pressure tolerance, and lot-to-lot consistency critical for reproducible results |
| Buffer Components | Sodium phosphate, Tris-HCl, sodium chloride, acetonitrile, methanol [93] | Mobile phase composition; factors in retention and resolution optimization | Purity grade, pH consistency, and preparation protocol standardization essential |
| Analytical Standards | Pharmacopeial reference standards, synthetic peptides, biomarker compounds [2] | System suitability testing; quantification standards; method qualification | Certified reference materials with documented purity and stability |
| Detection Reagents | ELISA kits, derivatization agents, fluorescent tags [93] | Response measurement for non-UV active compounds; specificity enhancement | Compatibility with mobile phase; stability under analysis conditions |
| Column Hardware | Pre-packed columns, guard columns, frits, fittings [97] | Consistent bed support and flow distribution; factor in permeability studies | Manufacturing quality control; pressure rating appropriate for method conditions |
The selection of appropriate research reagents is critical for successful DoE implementation, as material attributes can significantly influence chromatographic responses [93]. For example, in the cation-exchange chromatography case study, resin screening identified a specific POROS resin that provided optimal separation of product-related impurities from the drug substance [93]. Similarly, in haloauthentication studies, the availability of certified reference materials for porcine and bovine gelatin biomarkers enabled the development of validated LC-MS/MS methods for religious compliance testing [2].
Design of Experiments represents a powerful methodology for robust chromatographic process characterization, providing a systematic framework for understanding complex parameter interactions and establishing scientifically justified design spaces. The comparative analysis presented demonstrates that different DoE approaches offer distinct advantages depending on the specific chromatographic application, with MBDoE providing exceptional efficiency for parameter estimation [95], while traditional factorial designs offer comprehensive interaction analysis [93]. The integration of DoE with advanced data analysis tools, including artificial neural networks and Monte Carlo simulations, enables predictive modeling of chromatographic behavior under diverse operating conditions [94] [93].
For the cross-validation of spectroscopic and chromatographic methods, DoE provides the statistical foundation for developing reliable correlation models that leverage the complementary strengths of these analytical techniques. This approach is particularly valuable in regulated environments where method robustness and reliability are paramount. As chromatographic technologies continue to evolve, with advancements in column chemistries [96], instrumentation [97], and detection methods [98], the application of structured experimental design methodologies will remain essential for maximizing analytical performance while maintaining regulatory compliance.
Establishing Method Credibility: Validation Protocols and Comparative Performance Analysis
In the field of drug development and bioanalysis, the reliability of analytical data is paramount. Ensuring that analytical methods produce trustworthy results requires rigorous validation against standardized parameters. Linearity, Lower Limit of Quantification (LLOQ), precision, accuracy, and specificity form the cornerstone of method validation, providing demonstrated evidence that a method is fit for its intended purpose [99]. Within a broader research thesis focusing on the cross-validation of spectroscopic and chromatographic results, understanding these parameters becomes critical for establishing confidence in analytical data, enabling seamless correlation between different analytical techniques, and ensuring the quality and safety of pharmaceutical products.
Comparative Analysis of Method Performance
The selection of an appropriate analytical technique involves careful consideration of key performance parameters. The table below summarizes typical validation data for High-Performance Liquid Chromatography with UV detection (HPLC-UV) and Gas Chromatography-Mass Spectrometry (GC-MS), two workhorse techniques in pharmaceutical analysis.
Table 1: Comparison of Key Validation Parameters for HPLC-UV and GC-MS Methods
| Validation Parameter | HPLC-UV Example (Cefquinome in Plasma) | GC-MS/MS Characteristics |
|---|---|---|
| Linearity Range | 0.02 to 12 μg/mL [100] | Wide dynamic range, suitable for multi-component analysis [101] |
| LLOQ | 0.02 μg/mL [100] | Capable of detecting trace amounts; femtogram-level quantitation is achievable in MRM mode [102] |
| Precision (CV) | Intra- and inter-day CV <5% [100] | High precision with low risk of false positives due to matching with complete mass spectra [101] |
| Accuracy (Bias) | Biases ranged from -3.76% to 1.24% [100] | Highly accurate, with results acceptable in a court of law for drug testing [101] |
| Specificity | Resolved from plasma components; no interference from endogenous compounds [100] | High specificity from matching mass spectra and retention time; further enhanced in MS/MS via MRM transitions [102] |
Experimental Protocols for Determining Key Parameters
To ensure the reliability of an analytical method, specific experimental protocols are followed to determine each validation parameter. These procedures are designed to thoroughly challenge the method and provide measurable evidence of its performance.
Linearity
Linearity assesses the ability of the method to obtain test results that are directly proportional to the analyte's concentration in the sample.
- Protocol: A minimum of five to six calibration standards are prepared to bracket the expected concentration range (e.g., 80-120% of the target concentration) [99]. For the cefquinome HPLC-UV method, standards were prepared from a single stock solution at concentrations from 0.02 to 12 μg/mL [100].
- Evaluation: The peak area of the analyte is plotted against the nominal concentration. The resulting data is subjected to statistical analysis, including calculation of the correlation coefficient, slope, and y-intercept of the regression line [100] [99].
Lower Limit of Quantification (LLOQ)
The LLOQ is the lowest amount of an analyte in a sample that can be quantitatively determined with suitable precision and accuracy.
- Protocol: The LLOQ is typically established by analyzing multiple replicates of a low-concentration sample. In bioanalytical method validation, it is recommended to evaluate a minimum of five concentrations to assess linearity, with the lowest point establishing the LLOQ [99].
- Evaluation: The LLOQ is accepted if the analyte response is at least 10 times the baseline noise, and the precision (CV) and accuracy (bias) are within ±20% [99]. The HPLC-UV method for cefquinome achieved an LLOQ of 0.02 μg/mL, which met these criteria [100].
Precision and Accuracy
Precision measures the closeness of repeated individual measurements, while accuracy indicates the closeness of test results to the true value.
- Protocol: Accuracy and precision are evaluated using Quality Control (QC) samples at a minimum of three concentration levels (low, medium, high), analyzed in replicates across different days [100] [99].
- Evaluation:
- Precision is expressed as the Coefficient of Variation (%CV) for repeated measurements. The cefquinome method demonstrated excellent intra-day and inter-day precision with a CV of less than 5% [100].
- Accuracy is calculated as the percentage recovery of the known concentration. The cefquinome method showed high accuracy, with biases ranging from -3.76% to 1.24% [100].
Specificity
Specificity is the ability to assess unequivocally the analyte in the presence of other components, such as impurities, degradants, or matrix components.
- Protocol: Specificity is demonstrated by analyzing blank samples of the biological matrix or placebo formulation, and then samples spiked with the analyte. For stability-indicating methods, forced degradation studies are performed by stressing the sample under acidic, basic, oxidative, and thermal conditions [103].
- Evaluation: The method is specific if there is no interference from blank matrix at the retention time of the analyte, and the analyte peak is pure and well-resolved from degradation products [100] [99] [103]. In GC-MS/MS, specificity is vastly enhanced by using Multiple Reaction Monitoring (MRM), which tracks unique precursor-to-product ion transitions [102].
Cross-Validation Workflow: Integrating Spectroscopic and Chromatographic Data
The process of cross-validating results from different analytical techniques ensures data reliability and methodological robustness. The following diagram illustrates a logical workflow for cross-validating spectroscopic and chromatographic methods, which is central to the broader research thesis.
Method Development and Optimization Logic
Developing a robust analytical method requires a structured approach to optimize critical parameters that influence the key validation outcomes. The logic flow below outlines the decision-making process in method development, particularly for chromatographic techniques.
The Scientist's Toolkit: Essential Research Reagent Solutions
The following table details key reagents, materials, and instruments essential for conducting bioanalytical method validation, along with their critical functions in the process.
Table 2: Essential Reagents and Materials for Analytical Method Validation
| Item / Reagent | Function / Application |
|---|---|
| C18 Reverse-Phase Chromatography Column | The stationary phase for separating analytes based on hydrophobicity; a core component in HPLC and LC-MS methods [100] [103]. |
| Mass Spectrometry Grade Solvents (ACN, MeOH) | High-purity solvents used in mobile phase preparation and sample extraction to minimize background noise and ion suppression in LC-MS and GC-MS [100]. |
| Analytical Reference Standards | Highly purified compounds of known identity and concentration used to prepare calibration standards and QC samples for quantifying the target analyte [100] [99]. |
| Stable Isotope-Labeled Internal Standards | Used in mass spectrometry to correct for variability in sample preparation and ionization efficiency, improving precision and accuracy [102]. |
| GC-MS/MS System with Triple Quadrupole | Instrument platform enabling highly selective and sensitive analysis via Multiple Reaction Monitoring (MRM), ideal for complex matrices and trace-level quantification [102] [104]. |
| Trifluoroacetic Acid (TFA) / Volatile Buffers | Mobile phase additives in HPLC to improve peak shape and separation; their volatility makes them compatible with MS detection [100]. |
The rigorous assessment of linearity, LLOQ, precision, accuracy, and specificity is non-negotiable for establishing reliable analytical methods in drug development. As demonstrated, techniques like HPLC-UV provide robust, cost-effective solutions, while GC-MS and GC-MS/MS offer superior sensitivity and specificity for challenging analyses. The cross-validation of data across different methodological platforms, such as correlating chromatographic results with spectroscopic findings, forms a foundational principle of modern analytical science. It ensures data integrity, builds regulatory confidence, and ultimately safeguards public health by guaranteeing the quality, efficacy, and safety of pharmaceutical products.
In the field of bioanalysis, the cross-validation of analytical methods is a critical process to ensure that data generated by different techniques are comparable and reliable. This process is particularly crucial when bridging established methods like the enzyme-linked immunosorbent assay (ELISA) with reference methods such as liquid chromatography-tandem mass spectrometry (LC-MS/MS). As drug development programs progress globally, there is an increasing need to compare pharmacokinetic data across different laboratories and methodological platforms [10] [32]. Cross-validation serves as the scientific and regulatory bridge that ensures data consistency, whether when transferring methods between laboratories or when upgrading from immunoassays to more sophisticated chromatographic techniques. This guide provides a comprehensive protocol for the cross-validation of LC-MS/MS and ELISA methods, framed within the broader context of spectroscopic and chromatographic method validation research, to support researchers, scientists, and drug development professionals in their analytical workflows.
Fundamental Principles of Cross-Validation
Cross-validation is defined as an assessment of two or more bioanalytical methods to demonstrate their equivalency [32]. This process is essential in several scenarios: when a method is transferred between different laboratories; when comparing data across global clinical trials; or when transitioning from one analytical platform to another, such as moving from ELISA to LC-MS/MS [10] [32]. The primary objective is to ensure that results from different methods or locations can be compared throughout clinical trials, maintaining data integrity and supporting regulatory submissions.
The regulatory foundation for cross-validation stems from health agency guidelines, including those from the European Medicines Agency and U.S. Food and Drug Administration [10]. While these guidelines provide the framework for method validation, specific protocols for cross-validation remain limited, leading organizations to develop robust, scientifically-driven strategies [32]. A well-executed cross-validation study confirms that methodological differences do not significantly impact the measurement of analytes, thereby ensuring that pharmacokinetic parameters remain comparable across studies and methodologies.
Methodological Comparison: LC-MS/MS vs. ELISA
Technical Foundations and Characteristics
LC-MS/MS and ELISA represent fundamentally different approaches to biomolecular analysis. LC-MS/MS combines liquid chromatography for separation with tandem mass spectrometry for detection and quantification, offering direct molecule-by-molecule analysis [105]. This technique provides exceptional specificity through separation and characteristic fragmentation patterns, allowing it to differentiate between molecular isoforms, modifications, and structurally similar compounds [105]. In contrast, ELISA is an immunoassay based on antibody-antigen interactions, where the detection relies on the binding specificity of antibodies to target antigens [106] [105].
The complexity of LC-MS/MS is significantly higher than ELISA, involving multiple steps including sample preparation, chromatographic separation, and mass spectrometric detection [105]. ELISA offers a relatively simple, often single-step assay format that is more accessible for routine analysis [105]. This difference in complexity is reflected in the cost structures, with ELISA being relatively inexpensive compared to the more costly LC-MS/MS instrumentation and operation [105].
Table 1: Fundamental Characteristics of LC-MS/MS and ELISA Methods
| Feature | ELISA | LC-MS/MS |
|---|---|---|
| Principle | Antibody-antigen interaction | Separation and fragmentation by mass spectrometry |
| Complexity | Simple, single-step assay | Multistep, complex technique |
| Cost-effectiveness | Relatively inexpensive | More expensive |
| Sensitivity | Good for moderate concentrations | Excellent for trace-level detection |
| Specificity | Can be affected by cross-reactivity | Highly specific |
| Throughput | Can analyze many samples simultaneously | Time-consuming for sample preparation and analysis |
Performance Characteristics and Applications
The sensitivity profiles of these methods differ substantially. LC-MS/MS offers superior sensitivity for trace-level detection, while ELISA provides adequate sensitivity for moderate concentrations [105]. This makes LC-MS/MS particularly valuable for quantifying low-abundance analytes or when working with limited sample volumes. The quantitative accuracy of LC-MS/MS generally exceeds that of ELISA, especially across diverse sample matrices, due to its ability to mitigate interference and matrix effects more effectively [105].
A key advantage of LC-MS/MS is its capability to distinguish between closely related molecules, including metabolic isoforms and post-translational modifications, which often present challenges for ELISA due to potential antibody cross-reactivity [105]. This specificity makes LC-MS/MS invaluable in pharmaceutical research where precise quantification of parent compounds and metabolites is essential.
ELISA finds extensive application in clinical diagnostics, drug development, and research, particularly for high-throughput screening where its simplicity and cost-effectiveness offer practical advantages [105]. LC-MS/MS applications extend beyond these areas to include environmental monitoring, forensic analysis, and situations demanding the highest levels of precision [105].
Experimental Design for Cross-Validation
Sample Selection and Preparation
A robust cross-validation design begins with appropriate sample selection. The strategy developed at Genentech, Inc. utilizes 100 incurred matrix samples (post-dose study samples) selected across four quartiles (Q) of in-study concentration levels [32]. This approach ensures evaluation across the entire analytical range, from lower limit of quantification (LLOQ) to upper limit of quantification (ULOQ). Incurred samples are preferred over spiked quality control (QC) samples because they represent the true matrix and metabolic profile of study samples, potentially revealing method-specific biases not apparent with manufactured QC samples [32].
Sample preparation must be meticulously controlled and documented for both methods. For instance, in a cross-validation study of desmosine measurements, samples included bovine-derived desmosine dissolved in injectable H₂O at concentrations of 625, 5000 ng/mL, and human serum samples fortified with desmosine at 500 and 5000 ng/mL [106]. Each sample type should be aliquoted and stored under identical conditions to prevent pre-analytical variations.
Analytical Procedures
For LC-MS/MS analysis, the protocol typically involves: adding a stable isotope-labeled internal standard (e.g., 10 µL of 100 ppm isodesmosine-¹³C₃,¹⁵N₁) to 0.2 mL samples [106]; for complex matrices like serum, hydrolysis may be required followed by clean-up using appropriate chromatography (e.g., cellulose column or cartridge) [106]; the final analysis uses multiple reaction monitoring (MRM) for specific detection, with characteristic transitions (e.g., m/z 232.10 and 397.25 for desmosine) [106].
For ELISA analysis, a competitive assay format is often employed for small molecules: the antigen is fixed on the plate [106]; a competitive reaction occurs between horseradish peroxidase (HRP)-labeled desmosine and desmosine in the sample solution [106]; appropriate dilution of samples is critical (e.g., 10-fold for injectable H₂O samples, 2-40 fold for human serum samples) [106]; calibration curves are prepared for each microplate, typically covering a range of 5-500 ng/mL [106].
Both methods should employ calibration standards prepared in identical matrices, with analysts blinded to sample concentrations to prevent bias. Each sample should be analyzed in replicate (typically n=3) to assess precision [106].
Quantitative Comparison and Statistical Analysis
Performance Metrics and Acceptance Criteria
The statistical evaluation of cross-validation data focuses on determining whether two methods produce equivalent results. According to established protocols, two methods are considered equivalent if the 90% confidence interval (CI) limits of the mean percent difference of concentrations are within ±30% [32]. This criterion applies to the entire dataset and may also be assessed quartile by concentration to identify potential concentration-dependent biases [32].
Additional performance metrics include accuracy (percentage of theoretical values), precision (relative standard deviation), and correlation coefficients. For example, in a desmosine method comparison, ELISA measurements ranged from 0.83 to 1.06 (average: 0.94) times the theoretical values, while LC-MS/MS measurements showed greater deviation at 1.69 to 2.43 times theoretical values before recalibration [106]. The correlation coefficient between methods was 0.9941, indicating excellent agreement [106].
Table 2: Quantitative Performance Comparison in Cross-Validation Studies
| Analyte | Matrix | Correlation Coefficient | ELISA Accuracy (%) | LC-MS/MS Accuracy (%) | Reference |
|---|---|---|---|---|---|
| Desmosine | Human serum | 0.9941 | 83-106% (avg. 94%) | 68-99% (avg. 87%)* | [106] |
| Tacrolimus | Kidney transplant | N/R | Regression: ELISA = 1.02·(LC-MS/MS) + 0.14 | Reference method | [107] |
| Tacrolimus | Liver transplant | N/R | Regression: ELISA = 1.12·(LC-MS/MS) - 0.87 | Reference method | [107] |
| Lenvatinib | Human plasma | N/R | Accuracy within ±15.3% | Accuracy within ±15.3% | [10] |
*After recalibration using corrected molar extinction coefficient; N/R: Not reported
Data Visualization and Interpretation
A Bland-Altman plot of the percent difference of sample concentrations versus the mean concentration of each sample should be created to characterize the data further [32]. This visualization helps identify concentration-dependent biases and assesses the agreement between methods across the measurement range.
Regression analysis also provides valuable insights. In a tacrolimus study, the relationship between ELISA and LC-MS/MS measurements was best described by the regression equation ELISA = 1.02·(LC-MS/MS) + 0.14 in kidney recipients and ELISA = 1.12·(LC-MS/MS) - 0.87 in liver recipients [107]. These equations not only demonstrate correlation but also reveal matrix-specific biases, with greater differences observed in liver recipients likely due to metabolite interference during periods of liver dysfunction [107].
Case Studies and Experimental Data
Small Molecule Analysis: Desmosine Quantification
A comprehensive cross-validation study compared isotope-dilution LC-MS/MS and a newly established ELISA for desmosine measurement [106]. The results demonstrated a high correlation coefficient (0.9941) between methods, but revealed an important discrepancy: LC-MS/MS measurements deviated approximately 2-fold from theoretical values, while ELISA measurements ranged from 0.83 to 1.06 (avg 0.94) times theoretical values [106]. Investigation traced this discrepancy to an inaccurate molar extinction coefficient for desmosine (2403 vs. previously reported 4900) used in standard preparation [106]. After recalculation using the corrected coefficient, LC-MS/MS measurements improved to 0.68-0.99 (avg 0.87) times theoretical values [106]. This case highlights how cross-validation can uncover fundamental methodological issues and improve analytical accuracy for both techniques.
Pharmaceutical Application: Lenvatinib Bioanalysis
In supporting global clinical studies of lenvatinib, a multi-targeted tyrosine kinase inhibitor, seven bioanalytical LC-MS/MS methods were developed across five laboratories [10]. Each laboratory validated their method according to bioanalytical guidelines, with parameters meeting acceptance criteria [10]. During cross-validation, QC samples and clinical study samples with blinded concentrations were assayed, revealing accuracy within ±15.3% for QC samples and percentage bias within ±11.6% for clinical study samples [10]. This comprehensive cross-validation demonstrated that lenvatinib concentrations in human plasma could be compared across laboratories and clinical studies, despite differences in sample preparation (protein precipitation, liquid-liquid extraction, or solid phase extraction) and instrumentation [10].
Hormone Analysis: Salivary Sex Hormones
A recent comparison of ELISA and LC-MS/MS for salivary sex hormone analysis revealed significant methodological differences [108]. The between-methods relationship was strong for salivary testosterone only, with LC-MS/MS showing expected physiological differences in estradiol and testosterone in women that were not detected by ELISA [108]. Machine-learning classification models demonstrated better results with LC-MS/MS, leading the authors to conclude that despite its technical challenges, LC-MS/MS was superior for salivary sex hormone quantification in healthy adults [108]. This study underscores the importance of methodological rigor in hormone assay techniques and highlights limitations of ELISA for certain analyte-matrix combinations.
Implementation Framework
Essential Research Reagents and Materials
Successful cross-validation requires carefully selected and standardized reagents. The following table outlines key materials essential for conducting rigorous method comparison studies:
Table 3: Essential Research Reagents and Materials for Cross-Validation Studies
| Reagent/Material | Function | Specification Considerations |
|---|---|---|
| Reference Standard | Primary standard for quantification | High purity, certified concentration, well-characterized storage stability |
| Isotope-Labeled Internal Standard | Normalization for LC-MS/MS | Stable isotope-labeled (¹³C, ¹⁵N), identical chemical properties to analyte |
| Capture Antibody | Antigen binding in ELISA | High specificity, minimal cross-reactivity, validated against relevant metabolites |
| Detection Antibody | Signal generation in ELISA | Conjugated to enzyme (e.g., HRP), specific to different epitope than capture antibody |
| Matrix Blank | Background signal assessment | Confirmed analyte-free, matches study sample matrix (plasma, serum, urine) |
| Quality Control Samples | Method performance monitoring | Multiple concentration levels (LQC, MQC, HQC) covering analytical range |
Workflow and Decision Pathways
The cross-validation process follows a logical sequence from planning through execution to final decision-making. The workflow below illustrates the key stages and decision points in a comprehensive cross-validation study:
Cross-Validation Workflow and Decision Pathway
Method Comparison and Relationship Mapping
Understanding the fundamental relationships between LC-MS/MS and ELISA methodologies is essential for proper cross-validation design. The diagram below illustrates the core principles, comparative advantages, and appropriate applications of each technique:
Method Relationship and Application Mapping
Cross-validation between LC-MS/MS and ELISA methods represents a critical process in ensuring data comparability across analytical platforms and throughout drug development lifecycles. This guide has outlined a comprehensive protocol encompassing experimental design, sample selection, analytical procedures, and statistical assessment that can be applied to various analyte-matrix combinations. The case studies demonstrate that while these methods can show excellent correlation, as evidenced by the 0.9941 correlation coefficient for desmosine [106], methodological differences can lead to significant biases in certain contexts, such as the observed underestimation of tacrolimus by ELISA in liver transplant recipients [107].
The framework presented here, particularly the statistical approach assessing whether the 90% confidence interval of mean percent difference falls within ±30% [32], provides a rigorous methodology for demonstrating method equivalency. Researchers should implement this protocol with careful attention to reagent quality, sample selection, and statistical power to ensure robust cross-validation outcomes. As the field of bioanalysis continues to evolve, with increasing application of LC-MS/MS for challenging analytes and matrices [105] [108], the principles of cross-validation will remain essential for maintaining data integrity across methodological transitions and supporting regulatory submissions in drug development.
In the rigorous landscape of pharmaceutical development, selecting the appropriate analytical technique for drug quantification is paramount to ensuring product safety and efficacy. This decision is particularly critical when analyzing compounds across a wide spectrum of potencies, from highly potent active pharmaceutical ingredients (APIs) to non-potent excipients. The cross-validation of analytical results, a core tenet of modern pharmaceutical research, often requires the complementary use of spectroscopic and chromatographic methods to confirm findings. Within this framework, three liquid chromatography detection techniques—Ultraviolet detection (LC-UV), Mass Spectrometry (LC-MS), and Charged Aerosol Detection (LC-CAD)—emerge as pivotal tools, each with distinct advantages and limitations. This guide provides an objective performance comparison of these techniques, supported by experimental data, to inform their application in research and quality control environments. Understanding their capabilities enables scientists to construct robust, orthogonal method portfolios for reliable cross-validation, ultimately strengthening the scientific basis for pharmaceutical quality assessment.
The three techniques—LC-UV, LC-MS, and LC-CAD—operate on fundamentally different physical principles, which directly dictate their analytical performance and ideal application scope.
Liquid Chromatography with Ultraviolet Detection (LC-UV) is one of the most established techniques in pharmaceutical analysis. It separates compounds via HPLC and detects them based on their absorption of ultraviolet or visible light. The fundamental requirement for detection is the presence of a chromophore—a functional group that absorbs light in the UV-Vis range (typically 200-400 nm). The response is governed by the Beer-Lambert law and is highly dependent on the analyte's molar absorptivity (extinction coefficient). A significant limitation is that compounds lacking a suitable chromophore, or those with very low extinction coefficients, yield weak or undetectable signals [109] [110].
Liquid Chromatography with Mass Spectrometry (LC-MS) couples chromatographic separation with mass-based detection. Following separation, analytes are ionized (commonly via Electrospray Ionization (ESI)) and the resulting ions are separated by their mass-to-charge ratio (m/z) in the mass analyzer. LC-MS provides exceptional specificity and sensitivity because it can differentiate compounds based on molecular mass and fragmentation patterns. This makes it ideal for targeted assays in complex matrices like biological fluids or for detecting low-abundance impurities [111] [110].
Liquid Chromatography with Charged Aerosol Detection (LC-CAD) is a universal detector for non-volatile and semi-volatile analytes. The column eluent is first nebulized with nitrogen to form droplets, which are then dried to produce solid analyte particles. These particles are exposed to a stream of positively charged nitrogen gas generated by a high-voltage corona wire. The charge is transferred to the particles and measured by a highly sensitive electrometer. The signal is proportional to the mass of the analyte present and is largely independent of chemical structure, as the charging process is primarily physical [109] [112]. This makes it exceptionally useful for compounds with weak or no chromophores.
Comparative Performance Data
The selection of an appropriate detection method is guided by key performance characteristics. The following table summarizes the comparative data for LC-UV, LC-MS, and LC-CAD, illustrating how these characteristics align with different analytical needs.
Table 1: Direct comparison of key performance characteristics for LC-UV, LC-MS, and LC-CAD.
| Performance Characteristic | LC-UV | LC-MS | LC-CAD |
|---|---|---|---|
| Detection Principle | Light absorption by chromophores | Mass-to-charge ratio of ions | Charge accumulation on aerosol particles |
| Universality of Response | Low (requires chromophore) | Medium (requires ionization) | High (for non-volatiles) |
| Typical Sensitivity (LOQ) | ~1-100 ng/mL [111] | ~0.002-0.005 μg/mL (2-5 ng/mL) [7] | Sub-ng to low ng on-column [112] |
| Linear Dynamic Range | ~3 orders of magnitude | >3 orders of magnitude | ~4 orders of magnitude [109] |
| Response Variability | High (depends on ε) | Moderate (depends on ionization) | Low (more uniform) [109] |
| Ideal Application Context | APIs with strong UV chromophores; potency assays | Highly potent compounds; impurities; bioanalysis [7] | Potent & medium-potent compounds without chromophores; excipients [7] |
The application of these techniques is directly influenced by the potency of the compound being analyzed, which dictates the required sensitivity. The following workflow diagram illustrates the decision-making process for technique selection based on acceptance limits, a key derivative of potency.
Diagram 1: Technique selection workflow based on potency and acceptance limits. Adapted from content on cleaning verification [7].
Experimental Protocols and Applications
Protocol for LC-UV Analysis of an Aminothiazole
A developed and validated LC-UV method for a novel aminothiazole (21MAT) provides a representative protocol [111].
- Chromatographic Conditions: An isocratic elution was performed on a Phenomenex Luna C18 (50 mm × 4.6 mm, 5 μm) column. The mobile phase consisted of 55% 0.1% v/v orthophosphoric acid in water and 45% orthophosphoric acid in acetonitrile, delivered at a flow rate of 1 mL/min. The analyte was detected at 272 nm.
- Sample Preparation: The analyte was quantified in analytical solutions, requiring dissolution in a suitable solvent compatible with the mobile phase.
- Performance Data: The method was linear over a defined concentration range suitable for analyzing in-vitro experimental samples. This method is applicable for quantifying the analyte in various analytical solutions and preclinical dose formulations.
Protocol for LC-MS/MS Bioanalysis in Rat Plasma
A robust LC-MS/MS method was established for the same aminothiazole (21MAT) in rat plasma, demonstrating the technique's application in bioanalysis [111].
- Sample Preparation: Plasma samples were processed using protein precipitation, a common technique for removing proteins from biological matrices.
- Chromatographic Conditions: Separation was achieved on a Waters Xterra RP C18 (150 mm × 4.6 mm, 5 μm) column. A gradient elution was used with a mixture of 95:5% v/v methanol:acetonitrile with 0.1% v/v formic acid as mobile phase A, and 15% of 5 mM ammonium formate solution as mobile phase B, at a flow rate of 1 mL/min.
- MS Detection: Detection was performed using electrospray ionization (ESI) in multiple reaction monitoring (MRM) mode. A structural analogue was used as an internal standard to correct for variability.
- Validation: The method was fully validated, demonstrating linearity over the range of 1.25–1250 ng/mL in rat plasma, with assessed parameters including specificity, accuracy, precision, recovery, and stability.
Protocol for LC-CAD in Cleaning Verification and Excipient Analysis
LC-CAD finds particular utility in cleaning verification (CV) for compounds with poor UV chromophores and in excipient quantification [7] [113].
- Typical Setup: The HPLC system is coupled to a charged aerosol detector. The mobile phase must be volatile (e.g., aqueous-organic mixtures with volatile additives like formic acid or ammonium acetate), similar to LC-MS requirements [112].
- Nebulizer Gas: A steady stream of purified nitrogen gas is required for nebulization and charging.
- Application in CV: For cleaning verification, LC-CAD is recommended for compounds with acceptance limits below 1 μg/cm² that lack a strong chromophore, filling a gap between LC-UV and LC-MS [7]. Its uniform response is beneficial for standard-free quantitation when reference standards are unavailable.
- Application in Excipient Analysis: LC-CAD is a "workhorse" for quantifying excipients like polysorbates. Combined with a sample preparation protocol to remove protein, it can resolve main subclasses of polysorbate and follow degradation kinetics [113].
The Scientist's Toolkit: Essential Research Reagents and Materials
Successful implementation of these chromatographic techniques relies on a suite of high-quality reagents and materials. The following table details key components and their functions.
Table 2: Essential research reagents and materials for LC-UV, LC-MS, and LC-CAD.
| Item Name | Function/Description | Critical Application Notes |
|---|---|---|
| High-Purity Volatile Buffers (e.g., Ammonium Formate, Formic Acid) | Mobile phase additives to control pH and improve chromatography. | Essential for LC-MS and LC-CAD to prevent source contamination and ensure efficient nebulization/evaporation. Avoid non-volatile buffers [111] [112]. |
| LC-MS Grade Solvents (Acetonitrile, Methanol, Water) | High-purity solvents for mobile phase preparation. | Minimizes background noise and baseline drift in all three techniques, but is critical for achieving high sensitivity in LC-MS and LC-CAD [111] [112]. |
| Stable Reference Standards | Highly pure analyte used for calibration and quantification. | Required for accurate quantitation in all techniques. Their availability and stability are paramount for method validation [111]. |
| Structural Analogue Internal Standard | A compound similar to the analyte used to correct for procedural losses and instrument variability. | Routinely used in LC-MS bioanalysis to improve accuracy and precision [111]. |
| Nitrogen Gas Generator | Provides a consistent, high-purity source of nitrogen gas. | Mandatory for LC-CAD as the nebulizing and charging gas [109] [112]. Also used as a source gas in LC-MS. |
| Low-Bleed HPLC Columns (e.g., C18, C8) | Stationary phases for chromatographic separation. | Columns should exhibit minimal "bleed" of non-volatile particles to reduce background noise, which is particularly important for maximizing sensitivity in LC-CAD [112]. |
The comparative analysis of LC-UV, LC-MS, and LC-CAD reveals a clear, complementary landscape for their use in pharmaceutical analysis, directly tied to the potency and physicochemical properties of the target analytes. LC-UV remains a robust, cost-effective workhorse for compounds with strong chromophores at medium to low potency levels. LC-MS is unparalleled in its sensitivity and specificity, making it the definitive choice for highly potent compounds, biomarker analysis, and applications requiring ultimate detection power. LC-CAD elegantly bridges a critical gap, providing uniform, mass-sensitive detection for non-volatile analytes that lack chromophores, thus finding a unique niche in the analysis of medium-potency compounds, lipids, carbohydrates, and excipients.
The broader thesis on cross-validation is strongly supported by this triad of techniques. The orthogonal detection principles (light absorption, mass, and particle charge) provide independent verification of analytical results, significantly strengthening the confidence in any finding. A robust analytical strategy for a drug development program would leverage the strengths of each technique: using LC-MS for trace-level impurity and pharmacokinetic studies, LC-CAD for excipient and formulation stability testing, and LC-UV for rapid, routine quality control of the main API. Ultimately, the informed selection and synergistic use of LC-UV, LC-MS, and LC-CAD, guided by their distinct performance profiles, empower scientists to ensure drug quality and safety across the entire spectrum of potency.
Assessing Greenness and Practicality of Analytical Methods Using Modern Metric Tools
The growing emphasis on sustainability has propelled the development of green analytical chemistry (GAC), which aims to minimize the environmental impact of analytical procedures while maintaining their effectiveness. This paradigm shift has led to the creation of several metric tools designed to quantitatively evaluate the greenness and environmental friendliness of analytical methods. These modern assessment tools provide researchers, scientists, and drug development professionals with standardized approaches to measure and compare the ecological footprint of their methodologies, particularly in the context of cross-validating spectroscopic and chromatographic results. The fundamental principle of white and green analytical chemistry integrates sustainability measures to identify cost-effective, safe, and environmentally benign approaches in analytical methods [114].
The drive toward greener methodologies is particularly relevant given recent findings that many official standard methods perform poorly on greenness criteria. A comprehensive assessment of 174 CEN, ISO, and pharmacopoeia standard methods and their 332 sub-method variations revealed that 67% of methods scored below 0.2 on the AGREEprep scale, where 1 represents the highest possible greenness score. The performance varied by application area: 86% of methods for environmental analysis of organic compounds scored below 0.2, followed by food analysis (62%), inorganic and trace metals analysis (62%), and pharmaceutical analysis (45%) [115]. These findings highlight the critical need for the analytical community to update traditional methodologies with more sustainable alternatives that align with global sustainability efforts and reduce regulatory and societal pressures.
Modern Greenness Assessment Tools
The evolution of greenness assessment has produced several sophisticated computational programs published between 2020 and 2023. These tools provide standardized approaches for evaluating the environmental friendliness of analytical methods, each with unique characteristics, advantages, and limitations [114].
Table 1: Modern Greenness Assessment Tools for Analytical Methods
| Assessment Tool | Full Name | Year Introduced | Key Characteristics | Primary Applications |
|---|---|---|---|---|
| AGREE | Analytical Greenness Calculator | 2020 | Comprehensive greenness evaluation using 12 principles of GAC | General analytical method assessment |
| AGREEprep | Analytical Greenness Metric for Sample Preparation | 2021 | Specialized focus on sample preparation steps | Sample preparation methodologies |
| ComplexGAPI | Complementary Green Analytical Procedure Index | 2021 | Visual diagram with pentagrams representing greenness | Comparative method evaluation |
| RGB12 | Red-Green-Blue | 2022 | Color-coded assessment system | Method development and optimization |
| BAGI | Blue Applicability Grade Index | 2023 | Evaluates practicality and applicability | User-friendly method selection |
| ChlorTox | Chloroform-oriented Toxicity Estimation | 2023 | Focuses on toxicity of chloroform and alternatives | Toxicity assessment of methods |
The AGREEprep metric, specifically designed for evaluating sample preparation steps, has emerged as one of the most widely adopted tools for assessing the greenness of standard methods. This metric is particularly valuable because sample preparation often represents the most environmentally impactful stage of analytical procedures, frequently involving significant energy consumption, hazardous chemicals, and waste generation [115]. The AGREE calculator provides a more comprehensive evaluation based on the 12 principles of green analytical chemistry, offering a balanced perspective on the overall environmental impact of complete analytical methods [114].
These assessment tools have become increasingly important in pharmaceutical development and regulatory contexts, where method validation must address not only traditional parameters like accuracy, precision, and specificity but also environmental considerations. The International Union of Pure and Applied Chemistry (IUPAC) has recognized this need through projects such as "Greenness of official standard sample preparation methods" (2021-015-2-500), which aims to establish standardized approaches for evaluating and improving the sustainability of analytical methodologies [115].
Experimental Protocols for Cross-Validation Studies
Cross-validation studies between spectroscopic and chromatographic methods require carefully designed experimental protocols to ensure reliable comparison of data while simultaneously assessing greenness metrics. The following detailed methodology outlines a comprehensive approach for such evaluations, adapted from published cross-validation studies and incorporating modern greenness assessment.
Sample Preparation and Extraction
The sample preparation phase begins with the collection of appropriate sample matrices. For biological samples such as urine, collect a minimum of 46 samples to achieve statistical significance, as demonstrated in organophosphate pesticide metabolite studies [36]. Stabilize samples immediately after collection using appropriate preservatives and store at -20°C until analysis. For solid samples, employ homogenization to ensure representative sampling. The extraction process should utilize green solvents such as ethanol-water mixtures or ethyl acetate rather than more hazardous alternatives like chloroform or hexane. Weigh samples accurately and add internal standards at this stage for isotopic dilution quantification where applicable [36].
During method development, pay particular attention to key parameters that significantly affect method ruggedness, including urinary matrix interferences, pH variations between samples and reagents, and the chemical compatibility of reagents used during extraction and derivatization processes. These factors frequently necessitate modifications to existing methods to render accurate, reliable data [36]. Monitor and optimize energy consumption during extraction, noting that techniques like ultrasound-assisted extraction typically consume less energy than traditional Soxhlet extraction.
Instrumental Analysis Conditions
Establish chromatographic conditions using GC-MS and GC-FPD systems for comparative analysis. For GC-MS, employ electron impact ionization mode with selected ion monitoring for specific mass fragments. For GC-FPD, optimize detector temperatures and gas flow rates for maximum sensitivity to target compounds [36]. For spectroscopic analysis, prepare samples in appropriate solvents and utilize cuvettes with path lengths of 1 cm for UV-Vis measurements. For IR spectroscopy, employ suitable sampling techniques such as attenuated total reflectance (ATR) to eliminate solvent use [116].
System suitability tests must be performed before analytical validation. For chromatographic systems, specific criteria include: relative standard deviation (RSD) of retention time repeatability ≤1% (for n=5), tailing factor (T) ≤2, resolution (Rs) >2, number of theoretical plates (N) >2000, and capacity factor >2.0 [117]. For spectroscopic methods, verify wavelength accuracy, photometric accuracy, and resolution according to instrument specifications [116].
Greenness Assessment Protocol
Apply AGREEprep metrics to evaluate the greenness of sample preparation procedures, scoring each of the designated criteria on a scale from 0 to 1. Calculate the overall AGREEprep score by combining individual criterion scores [115]. Additionally, apply the AGREE calculator to assess the overall analytical method according to the 12 principles of green analytical chemistry. This dual approach provides comprehensive evaluation of both sample preparation and complete method environmental impact [114].
Table 2: Key Performance Metrics in Cross-Validation Studies
| Performance Parameter | Acceptance Criteria | GC-MS Method Performance | GC-FPD Method Performance | Spectroscopic Methods |
|---|---|---|---|---|
| Limit of Detection (LOD) | Substance-dependent | 0.25-2.5 ng/mL (urine) | 0.10-2.5 ng/mL (urine) | Varies by technique and analyte |
| Limit of Quantification (LOQ) | S/N ≥10 | 0.25-2.5 ng/mL (urine) | Not specified | Varies by technique and analyte |
| Relative Recovery | 85-115% | 92-103% | 94-119% | 90-110% |
| Relative Standard Deviation (RSD) | <20% for bioanalytical | <20% | <20% | <5% for precision |
| Linearity Range | R² ≥0.990 | Specified for target analytes | Specified for target analytes | R² ≥0.995 |
Case Study: Cross-Validation of Chromatographic Methods
A representative example of method cross-validation can be found in a study comparing gas chromatography-flame photometric detection (GC-FPD) and gas chromatography-mass spectrometry (GC-MS) methods for measuring dialkylphosphate (DAP) metabolites of organophosphate pesticides in human urine. This study illustrates key considerations when validating and comparing analytical methods while incorporating greenness assessment [36].
The research team independently developed and modified existing methods in two separate laboratories, focusing on creating simple, cost-effective, and reliable procedures adaptable to available resources and sample matrices in different geographical locations (Thailand and the United States). During method development, they encountered significant challenges related to urinary matrix interferences and differences in pH between urine samples and reagents used in extraction and derivatization processes. These issues required careful optimization of sample preparation and chromatographic conditions to produce accurate, reliable data [36].
Both methods employed gas chromatography separation but utilized different detection systems: flame photometric detection (FPD) and electron impact ionization-mass spectrometry (EI-MS) with isotopic dilution quantification. The methods targeted six common DAP metabolites: dimethylphosphate, dimethylthiophosphate, dimethyldithiophosphate, diethylphosphate, diethylthiophosphate, and diethyldithiophosphate. Performance validation demonstrated that the GC-FPD method achieved limits of detection ranging from 0.10 ng/mL urine to 2.5 ng/mL urine, while the GC-MS method showed limits of quantification from 0.25 ng/mL urine to 2.5 ng/mL urine [36].
Recovery studies demonstrated relative recovery ranges of 94-119% for the GC-FPD method and 92-103% for the GC-MS method, with both methods exhibiting relative standard deviations of less than 20%. Cross-validation was performed by analyzing the same set of 46 urine samples collected from pregnant women residing in agricultural areas of northern Thailand. The results from split sample analysis showed strong agreement between laboratories for each metabolite, confirming that both methods could produce comparable data despite their different detection mechanisms [36].
Cross-Validation Workflow for Chromatographic Methods
Comparative Analysis of Spectroscopic and Chromatographic Methods
Technical Performance Comparison
Spectroscopic and chromatographic techniques offer complementary advantages for analytical applications, with significant differences in their operational principles, performance characteristics, and environmental impact. Understanding these distinctions is crucial for selecting the most appropriate method for specific applications in pharmaceutical analysis and research.
Ultraviolet (UV) Spectroscopy operates in the 190 to 360 nanometer range and excites non-bonding electrons, electrons in single bonds, and those involved in double and triple bonds. Its specificity arises from characteristic peak absorbances of different molecules at specific wavelengths, influenced by attached moieties such as double bonds, conjugations, and elements with pairs of non-bonding electrons. While not as information-rich as IR spectroscopy, UV spectroscopy provides sufficient detail for comparison with previously identified substances, making it valuable in pharmaceutical quality control as an HPLC detector [116].
Visible Spectroscopy spans 360 to 780 nanometers and measures color coordinates through mathematical algorithms that translate spectra into precise color specifications. The technique relies on electron transitions between orbitals around atoms within pigment molecules. Applications extend beyond simple color measurement to include quantitative analysis of colored compounds in pharmaceutical formulations [116].
Infrared (IR) Spectroscopy provides intense, isolated absorption bands of fundamental molecular vibrations from polymers and organic compounds, enabling univariate calibration with higher absorptivities suitable for solid, liquid, or gas-phase measurements. The technique typically requires small pathlengths of 0.1 to 1.0 mm for hydrocarbon liquids and solids and is generally incompatible with fiber optics without specialized materials [116].
Chromatographic methods, particularly gas chromatography (GC) and high-performance liquid chromatography (HPLC), offer superior separation capabilities for complex mixtures. The validation of these methods requires establishing performance characteristics that meet intended applications, with requirements derived from cGMP, GLP, GCP, and various regulatory standards including ISO 17025, USP, and FDA guidelines [117].
Greenness and Practicality Assessment
The greenness evaluation of analytical methods must consider multiple factors, including energy consumption, solvent use, waste generation, and toxicity. AGREEprep assessment of standard methods reveals that most official methods perform poorly on greenness criteria, particularly in environmental analysis of organic compounds where 86% of methods score below 0.2 [115].
Spectroscopic methods generally offer advantages in greenness compared to chromatographic techniques due to minimal solvent consumption, reduced sample preparation requirements, and lower energy consumption in many cases. Raman spectroscopy provides particular benefits for aqueous samples or those in glass containers, as carbon dioxide, water, and glass are weak scatterers. The technique requires minimal sample preparation, is compatible with fiber optics, and offers reasonable instrumentation costs [116].
Near-infrared (NIR) spectroscopy enables multicomponent molecular vibrational analysis even in the presence of interfering substances, though its spectra consist of overlapping vibrational bands that require chemometric data processing for interpretation. Traditional applications include agricultural product analysis for lignin polymers, paraffins, cellulose, proteins, carbohydrates, and moisture content [116].
Table 3: Greenness Comparison of Analytical Technique Categories
| Analytical Technique | Sample Preparation Requirements | Solvent Consumption | Energy Consumption | Waste Generation | Overall Greenness Potential |
|---|---|---|---|---|---|
| GC-MS | Extensive | Moderate | High | High | Low |
| GC-FPD | Extensive | Moderate | High | High | Low |
| UV-Vis Spectroscopy | Minimal | Low | Low | Low | High |
| IR Spectroscopy | Minimal | Low | Moderate | Low | Medium-High |
| NIR Spectroscopy | Minimal | Low | Low | Low | High |
| Raman Spectroscopy | Minimal | Low | Moderate | Low | High |
Chromatographic methods typically demonstrate higher sensitivity and better separation efficiency for complex mixtures but generally score lower on greenness metrics due to higher solvent consumption, greater energy requirements for separation, and increased waste generation. However, recent advancements in chromatographic technology, including ultra-high performance liquid chromatography (UHPLC) and miniaturized systems, have begun to address these environmental concerns by reducing solvent consumption and analysis times [117] [115].
The Scientist's Toolkit: Essential Research Reagents and Materials
Implementing cross-validation studies for spectroscopic and chromatographic methods requires specific reagents, reference materials, and instrumentation. The following table outlines essential components for such studies, particularly focusing on the analysis of small molecules in biological matrices.
Table 4: Essential Research Reagents and Materials for Analytical Cross-Validation Studies
| Item Category | Specific Examples | Function/Purpose | Greenness Considerations |
|---|---|---|---|
| Chromatographic Columns | C18 reverse-phase, DB-5 MS capillary column | Compound separation | Choose columns enabling faster analysis with less solvent |
| Internal Standards | Deuterated analogs, isotopic labels | Quantification calibration | Consider environmental impact of synthesis |
| Derivatization Reagents | BSTFA, MTBSTFA, PFBBr | Volatility and detection enhancement | Prefer less toxic alternatives |
| Extraction Solvents | Ethyl acetate, acetonitrile, methanol | Compound extraction and isolation | Choose safer solvents (e.g., ethanol-water mixtures) |
| Mobile Phase Additives | Formic acid, ammonium acetate, buffer salts | Chromatographic separation improvement | Proper disposal required |
| Reference Standards | Certified analyte standards, pharmaceutical standards | Method calibration and validation | Minimal use recommended |
| Sample Preparation Materials | Solid-phase extraction cartridges, filters | Sample cleanup and matrix removal | Reusable options preferred |
| Preservation Reagents | Ascorbic acid, sodium azide, acid preservatives | Sample stability maintenance | Least toxic options recommended |
| Quality Control Materials | Certified reference materials, pooled biological samples | Method accuracy and precision verification | Share resources between laboratories |
| Instrument Calibration | Tuning standards, wavelength calibration standards | Instrument performance verification | Long-lasting standards preferred |
The selection of reagents and materials significantly influences both analytical performance and greenness metrics. For example, choosing ethanol-water mixtures instead of acetonitrile for extraction procedures can substantially improve AGREEprep scores while maintaining analytical performance. Similarly, implementing microsampling techniques and reducing solvent volumes in sample preparation directly enhances method greenness without compromising data quality [114] [115].
The assessment of greenness and practicality in analytical methods using modern metric tools represents a critical advancement in sustainable science. The cross-validation of spectroscopic and chromatographic methods demonstrates that effective analytical performance can be maintained while significantly reducing environmental impact through thoughtful method design and optimization. The development of comprehensive assessment tools like AGREE, AGREEprep, and ComplexGAPI provides researchers with standardized approaches to quantify and compare the sustainability of their methodologies, enabling evidence-based decisions that balance analytical performance with environmental responsibility.
Future directions in green analytical chemistry will likely focus on the development of miniaturized systems, alternative solvent strategies, and energy-efficient instrumentation. The analytical community faces the important challenge of updating official standard methods, which currently perform poorly on greenness metrics, with more sustainable approaches that leverage recent technological advancements. By integrating greenness assessment early in method development and validation processes, researchers, scientists, and drug development professionals can contribute to more sustainable scientific practices while maintaining the high data quality required for regulatory compliance and scientific advancement.
In the field of drug development, ensuring the reliability, reproducibility, and comparability of bioanalytical data is paramount. This is especially true when data is generated from different methods or across multiple laboratories during global clinical trials. Cross-validation is a critical process that demonstrates the equivalence of data produced by different bioanalytical methods, ensuring that pharmacokinetic parameters can be validly compared across studies [10]. This case study explores real-world applications of cross-validation, with a specific focus on bridging spectroscopic and chromatographic techniques, to provide researchers and scientists with a framework for evaluating analytical performance in a regulated environment.
Case Study 1: Cross-Validation of LC-MS/MS Methods for Lenvatinib
Experimental Protocol and Methodology
A recent inter-laboratory study was conducted to support global clinical trials of lenvatinib, a multi-targeted tyrosine kinase inhibitor [10]. Five independent laboratories developed seven distinct LC-MS/MS methods for quantifying lenvatinib concentrations in human plasma.
- Sample Preparation: Laboratories employed different sample preparation techniques, including protein precipitation (PP), liquid-liquid extraction (LLE) using solvents like diethyl ether or methyl tert-butyl ether, and solid-phase extraction (SPE) with various sorbent chemistries [10].
- Chromatography: Reversed-phase HPLC systems were used across all labs, but with different columns (e.g., Symmetry Shield RP8, Hypersil Gold, Synergi Polar-RP) and mobile phase compositions, often involving buffers like ammonium acetate or acids like formic acid [10].
- Mass Spectrometry: Detection was performed using tandem mass spectrometry in positive ion electrospray mode with multiple reaction monitoring (MRM) [10].
- Cross-Validation Design: The study used a split-sample approach. Quality Control (QC) samples with known concentrations and blinded clinical study samples were analyzed by all participating laboratories to compare the accuracy and bias of the results [10].
Performance Evaluation and Quantitative Data
The success of the cross-validation was assessed by comparing the accuracy of QC samples and the percentage bias for clinical samples across all methods. The results, summarized in the table below, confirmed that all methods produced comparable data.
Table 1: Cross-Validation Results for Lenvatinib LC-MS/MS Methods [10]
| Sample Type | Performance Metric | Result | Acceptance Criteria |
|---|---|---|---|
| Quality Control (QC) Samples | Accuracy | Within ±15.3% | Typically within ±15% |
| Clinical Study Samples | Percentage Bias | Within ±11.6% | N/A |
Case Study 2: Multiplex LC-MS/MS for Monoclonal Antibodies
Experimental Protocol and Methodology
A 2021 study addressed the growing need for therapeutic drug monitoring of monoclonal antibodies (mAbs) in oncology by developing a multiplex LC-MS/MS method [118]. The goal was to simultaneously quantify seven mAbs (bevacizumab, cetuximab, ipilimumab, nivolumab, pembrolizumab, rituximab, trastuzumab) in patient plasma.
- Sample Preparation: A commercial kit (mAbXmise) was used for sample preparation, which involved immunoaffinity-based extraction. Full-length stable-isotope-labeled antibodies served as internal standards to correct for variability [118].
- Chromatography and Mass Spectrometry: The method utilized liquid chromatography coupled to tandem mass spectrometry (LC-MS/MS). Proteotypic peptides unique to each mAb were selected for quantification using multiple reaction monitoring (MRM) [118].
- Cross-Validation Design: The new multiplex method was cross-validated against established reference methods (ELISA or other LC-MS/MS methods) by analyzing a set of 16-28 patient plasma samples for each mAb [118].
Performance Evaluation and Quantitative Data
The cross-validation demonstrated that the multiplex method could produce data comparable to the established reference methods.
Table 2: Cross-Validation Results for Multiplex mAb LC-MS/MS Method [118]
| Parameter | Method Performance | Cross-Validation Result |
|---|---|---|
| Linearity | 2 - 100 µg/mL for all mAbs | - |
| Inter-assay Precision | < 14.6% | - |
| Accuracy | 90.1 - 111.1% | - |
| Agreement with Reference Methods | - | Mean absolute bias of 10.6% (range: 3.0-19.9%) |
The Scientist's Toolkit: Essential Research Reagents and Materials
The following table details key reagents and their functions in the development and cross-validation of bioanalytical methods, as illustrated in the case studies.
Table 3: Key Research Reagent Solutions for Bioanalytical Method Development
| Reagent / Material | Function in Analysis | Example Use Case |
|---|---|---|
| Stable Isotope-Labeled Internal Standards | Corrects for sample preparation and ionization variability; improves accuracy and precision. | Quantification of mAbs using 13C/15N-labeled peptides [118]. |
| Specialized SPE Sorbents | Selectively purifies and pre-concentrates analytes from complex biological matrices. | Extraction of lenvatinib from plasma using HLB or MCX plates [10]. |
| Mass Spectrometry-Grade Solvents & Buffers | Ensures high sensitivity and low background noise in LC-MS/MS systems. | Mobile phase preparation for chromatographic separation [10] [118]. |
| Proteolytic Enzymes (e.g., Trypsin) | Digests proteins into peptides for bottom-up LC-MS/MS analysis of biologics. | Sample preparation for mAb quantification [118]. |
| Certified Reference Standards | Provides the basis for accurate quantification and method calibration. | Preparation of calibration standards and QCs for lenvatinib [10]. |
Workflow and Relationship Visualizations
Bioanalytical Method Cross-Validation Workflow
The following diagram illustrates the logical workflow and decision points for conducting a successful cross-validation study, as demonstrated in the cited literature.
Diagram 1: Cross-Validation Workflow
Relationship of Analytical Techniques in Natural Product Analysis
This diagram situates cross-validation within the broader context of analytical chemistry, showing how hyphenated techniques combine separation and detection, creating the need for method comparison.
Diagram 2: Analytical Technique Relationships
The case studies presented herein demonstrate that rigorous cross-validation is achievable and essential for generating robust and comparable bioanalytical data. The lenvatinib study [10] highlights the success of inter-laboratory cross-validation even when different sample preparation and chromatographic methods are employed, provided that all methods are adequately validated. The multiplex mAb study [118] showcases a modern approach to cross-validating a new, efficient multiplex method against traditional, single-analyte reference methods. For researchers in drug development, these examples provide a clear blueprint for designing and executing cross-validation studies that ensure data integrity and support the regulatory submission process, ultimately accelerating the delivery of new therapies to patients.
Conclusion
Cross-validation of spectroscopic and chromatographic methods is not merely a regulatory requirement but a critical scientific practice that enhances the reliability and robustness of analytical data in pharmaceutical research. The synergy between these techniques provides a powerful toolkit for addressing complex challenges in drug analysis, from development to quality control and therapeutic monitoring. Future directions will be shaped by trends toward greater automation, miniaturization with microsampling and microflow LC-MS/MS, the adoption of multi-attribute monitoring (MAM) for biologics, and an increasing emphasis on green chemistry principles. By adhering to structured validation frameworks and leveraging technological advancements, researchers can continue to improve analytical precision, accelerate drug development timelines, and ultimately contribute to the delivery of safer and more effective therapeutics.
References
- 1. A comprehensive review-current development in ... [https://www.sciencedirect.com/science/article/pii/S2211715625003248]
- 2. Recent progress on the application of molecular ... [https://japsonline.com/abstract.php?article_id=4477&sts=2]
- 3. Comparison of spectroscopic techniques for determination ... [https://www.sciencedirect.com/science/article/pii/S1386142525006511]
- 4. 2025 Review of Spectroscopic Instrumentation [https://www.spectroscopyonline.com/view/2025-review-of-spectroscopic-instrumentation]
- 5. Combining Orthogonal Comprehensive Two-Dimensional ... [https://www.chromatographyonline.com/view/combining-orthogonal-comprehensive-two-dimensional-liquid-chromatography-methods-food-analysis]
- 6. Exploration of comprehensive two-dimensional liquid ... [https://www.sciencedirect.com/science/article/pii/S2772391725000209]
- 7. Combined Chromatographic and Spectrometric ... [https://www.chromatographyonline.com/view/combined-chromatographic-and-spectrometric-approaches-for-cleaning-verification-of-small-molecule-pharmaceutical-compounds-in-the-manufacturing-environment]
- 8. Comprehensive Two-Dimensional Gas Chromatography ... [https://pmc.ncbi.nlm.nih.gov/articles/PMC10140985/]
- 9. Recent Developments in Two-Dimensional Liquid ... [https://pmc.ncbi.nlm.nih.gov/articles/PMC6322149/]
- 10. Method validation studies and an inter-laboratory cross ... [https://pmc.ncbi.nlm.nih.gov/articles/PMC6041428/]
- 11. How UV-Vis is Evolving in 2025 for Better Lab Efficiency [https://www.richmondscientific.com/how-uv-vis-is-evolving-in-2025-for-better-lab-efficiency?srsltid=AfmBOorLM122hWxWRBd32ZuHJDKDuQYCoAKskK5BxZaz9Aef4pG7n57z]
- 12. 2025 ASMS: New Mass Spectrometry Technologies to ... [https://www.labx.com/resources/2025-asms-new-mass-spectrometry-technologies-to-confront-the-next-wave-of-complex-challen/5428]
- 13. News Details - Investors - Thermo Fisher Scientific [https://ir.thermofisher.com/investors/news-events/news/news-details/2025/Thermo-Fisher-Scientific-Unveils-Next-generation-Mass-Spectrometers-at-ASMS-2025-to-Revolutionize-Biopharma-Applications-and-Omics-Research/default.aspx]
- 14. A simplified tutorial on charged aerosol detection [https://www.sciencedirect.com/science/article/pii/S2772391724000689]
- 15. Penetration depth and effective sample size ... [https://www.sciencedirect.com/science/article/pii/S0022354925003417]
- 16. Development and validation of a label-free HPLC-CAD ... [https://www.sciencedirect.com/science/article/abs/pii/S073170852500278X]
- 17. Applications of Hydrophilic Interaction Chromatography in ... [https://pmc.ncbi.nlm.nih.gov/articles/PMC12430451/]
- 18. Cross-validation of pharmacokinetic assays post-ICH M10 is ... [https://pmc.ncbi.nlm.nih.gov/articles/PMC11749382/]
- 19. A Review of the Latest Spectroscopic Research in Food ... [https://www.spectroscopyonline.com/view/latest-spectroscopic-research-in-food-and-beverage-analysis]
- 20. A systematic review of analytical techniques coupled with ... [https://www.sciencedirect.com/science/article/pii/S2772502225008315]
- 21. Development and validation of a novel isocratic RP-HPLC ... [https://www.sciencedirect.com/science/article/pii/S092809872500274X]
- 22. Validation of ICP-OES and γ-spectrometry methodologies ... [https://link.springer.com/article/10.1007/s10967-025-10270-4]
- 23. ICH and FDA Guidelines for Analytical Method Validation [https://www.labmanager.com/ich-and-fda-guidelines-for-analytical-method-validation-34252]
- 24. M10 Bioanalytical Method Validation and Study Sample ... [https://www.fda.gov/regulatory-information/search-fda-guidance-documents/m10-bioanalytical-method-validation-and-study-sample-analysis]
- 25. Key Analytical Procedure Validation Regulations You ... [https://altabrisagroup.com/analytical-procedure-validation-regulations/]
- 26. Statistical analysis in method comparison studies part one [https://acutecaretesting.org/en/articles/statistical-analysis-in-method-comparison-studies-part-one]
- 27. The Comparison of Methods Experiment [https://www.westgard.com/lessons/basic-method-validation/lesson23.html]
- 28. Correction of gas chromatography–mass spectrometry long ... [https://www.nature.com/articles/s41598-025-24794-y]
- 29. Cross-Validation of a Multiplex LC-MS/MS Method for ... - PMC [https://pmc.ncbi.nlm.nih.gov/articles/PMC8401780/]
- 30. A multiplexed hybrid LC–MS/MS pharmacokinetic assay to ... [https://www.bioanalysis-zone.com/a-multiplexed-hybrid-lc-msms-pharmacokinetic-assay-to-measure-two-co-administered-monoclonal-antibodies-in-a-clinical-study/]
- 31. A generic sample preparation method for the multiplex ... [https://pubmed.ncbi.nlm.nih.gov/34509691/]
- 32. Cross validation of pharmacokinetic bioanalytical methods [https://www.sciencedirect.com/science/article/pii/S0731708524005272]
- 33. A robust and validated LC–MS/MS method for the ... [https://www.sciencedirect.com/science/article/abs/pii/S1570023223004014]
- 34. Liquid chromatography-mass spectrometry method for the ... [https://pmc.ncbi.nlm.nih.gov/articles/PMC8424367/]
- 35. Accelerating Monoclonal Antibody Quality Control [https://www.chromatographyonline.com/view/accelerating-monoclonal-antibody-quality-control-the-role-of-lc-ms-in-upstream-bioprocessing]
- 36. Cross validation of gas chromatography-flame photometric ... [https://pubmed.ncbi.nlm.nih.gov/24280209/]
- 37. Multiplex LC-MS/MS Assays for Clinical Bioanalysis of ... [https://www.mdpi.com/2073-4468/8/1/11]
- 38. Development and validation of a RP-HPLC method for ... [https://pubmed.ncbi.nlm.nih.gov/40664729/]
- 39. Development of Simultaneous Drug Concentration ... [https://pmc.ncbi.nlm.nih.gov/articles/PMC11435224/]
- 40. Development of Simultaneous Drug Concentration ... [https://www.mdpi.com/1999-4923/16/9/1138]
- 41. Simultaneous quantification method for multiple antiviral ... [https://www.sciencedirect.com/science/article/pii/S1570023223003355]
- 42. Simple simultaneous analysis of various cardiovascular ... [https://pmc.ncbi.nlm.nih.gov/articles/PMC11468470/]
- 43. Green analytical method for the simultaneous analysis of ... [https://www.nature.com/articles/s41598-020-65270-z]
- 44. Drug Formulation Characterization [https://www.thermofisher.com/us/en/home/electron-microscopy/life-sciences/drug-discovery/small-molecule/drug-formulations.html]
- 45. high-throughput technologies and automated workflows to ... [https://www.sciencedirect.com/science/article/pii/S0958166925000643]
- 46. R&D Automation in Pharma and Chemistry: Outsourcing vs ... [https://www.5-ht.com/en/media/blog/outsourcing-versus-inhouse-research-and-development-automation]
- 47. Comparing HPLC and UPLC: Which Analytical Technique ... [https://www.sepscience.com/comparing-hplc-and-uplc-which-analytical-technique-is-right-for-your-lab-8286]
- 48. Comparison of a UPLC Method across Multiple UHPLC ... [https://www.chromatographyonline.com/view/comparison-uplc-method-across-multiple-uhplc-systems]
- 49. Evaluating HPLC, UHPLC, and UPLC System Performance ... [https://www.waters.com/nextgen/us/en/library/application-notes/2018/hplc-uhplc-uplc-system-performance-reversed-phase-method-peptides.html?srsltid=AfmBOoovzXuaHbsEz5JuILjB_Xho_WngsCb1fIG8tFJcpRWzbtbxsPxx]
- 50. the powerful combination of 1 H NMR and IR spectroscopy [https://pubs.rsc.org/en/content/articlehtml/2025/sc/d5sc06866e]
- 51. Application of a High Throughput and Automated Workflow ... [https://pubmed.ncbi.nlm.nih.gov/33203511/]
- 52. Automated Method Development for High Throughput ... [https://www.virscidian.com/resource/automated-method-development-for-htp-at-nurix-therapeutics]
- 53. Cleaning Verification vs. Validation [https://optisolve.net/verification-vs-validation/]
- 54. Analytical Methods for Cleaning Validation [https://pharmallies.com/choosing-the-right-analytical-methods-for-cleaning-validation/]
- 55. 2025 Cleaning Validation Guide [https://contractorplus.app/blog/cleaning-validation]
- 56. Risk-Based Cleaning Validation in Biopharmaceutical API ... [https://www.biopharminternational.com/view/risk-based-cleaning-validation-biopharmaceutical-api-manufacturing]
- 57. Cross validation of pharmacokinetic bioanalytical methods [https://pubmed.ncbi.nlm.nih.gov/39341053/]
- 58. 2nd Annual Cleaning Validation Summit 2025 [https://www.linkedin.com/pulse/2nd-annual-cleaning-validation-summit-2025-uventia-cxlpf]
- 59. Q&A: Beyond ATP - The Future of Hygiene Verification [https://www.klipspringer.com/blogs/qa-beyond-atp-the-next-generation-of-reliable-hygiene-verification/]
- 60. Cleaning Validation Program Maintenance in a Process ... [https://ispe.org/pharmaceutical-engineering/january-february-2021/cleaning-validation-program-maintenance-process]
- 61. The Role of Pharmacokinetics and Therapeutic Drug ... [https://www.mdpi.com/journal/pharmaceutics/special_issues/OR5RBL7I95]
- 62. Model-informed precision dosing: State of the art and future ... [https://www.sciencedirect.com/science/article/pii/S0169409X24002436]
- 63. From Data to Dose: Diversity in Therapeutic Drug ... [https://pmc.ncbi.nlm.nih.gov/articles/PMC12388870/]
- 64. A Comparison of AI and Population PK Models to Predict the ... [https://pmc.ncbi.nlm.nih.gov/articles/PMC12547357/]
- 65. Comparison of the Accuracy and Precision of Pharmacokinetic ... [https://pmc.ncbi.nlm.nih.gov/articles/PMC4325820/]
- 66. Analysis of Pharmacokinetics and Comparison Between ... [https://pubmed.ncbi.nlm.nih.gov/40966765/]
- 67. Assessment of matrix effects in quantitative GC-MS by ... [https://www.sciencedirect.com/science/article/pii/S0003269725001678]
- 68. Matrix Effect of Diverse Biological Samples Extracted with ... [https://www.mdpi.com/2072-6651/14/6/387]
- 69. Application of the transient matrix effect for determination ... [https://pubmed.ncbi.nlm.nih.gov/40562948/]
- 70. Advances in ICP‐MS‐Based Nanoparticle Characterization [https://pmc.ncbi.nlm.nih.gov/articles/PMC12423364/]
- 71. PMC - PubMed Central [https://pmc.ncbi.nlm.nih.gov/articles/PMC12455781/]
- 72. Recent trends in microsampling and reduced-volume ... [https://www.sciencedirect.com/science/article/pii/S277258202500035X]
- 73. gas chromatography retention time prediction and isomer ... [https://pubs.rsc.org/en/content/articlehtml/2025/dd/d4dd00369a]
- 74. HPLC 2025 Preview: Fundamentally Speaking (Part 1) [https://www.chromatographyonline.com/view/hplc-2025-preview-fundamentally-speaking-part-1-]
- 75. Current advances and applications of online sample ... [https://www.sciencedirect.com/science/article/abs/pii/S0021967322001236]
- 76. Rugged Large Volume Injection for Sensitive Capillary LC- ... [https://pmc.ncbi.nlm.nih.gov/articles/PMC5581315/]
- 77. Sensitivity and quantitativeness of large-volume injection ... [https://www.sciencedirect.com/science/article/pii/S0269749124008947]
- 78. PMC - PubMed Central [https://pmc.ncbi.nlm.nih.gov/articles/PMC11590091/]
- 79. UV-Visible Spectroscopy [https://www2.chemistry.msu.edu/faculty/reusch/virttxtjml/spectrpy/uv-vis/spectrum.htm]
- 80. Analytical Method Development Approach When ... [https://veeprho.com/analytical-method-development-approach-when-compound-dont-have-uv-chromophore/]
- 81. Benefits of HPLC-CAD Analysis [https://www.thermofisher.com/us/en/home/industrial/chromatography/chromatography-learning-center/liquid-chromatography-information/hplc-system-components/how-hplc-detectors-work/charged-aerosol-detection/charged-aerosol-detection-benefits.html]
- 82. Tips for Liquid Chromatography Coupled with Charged ... [https://www.chromatographyonline.com/view/tips-for-liquid-chromatography-coupled-with-charged-aerosol-detection]
- 83. Comparison of ultraviolet and refractive index detections in ... [https://www.sciencedirect.com/science/article/abs/pii/S030881462101520X]
- 84. HPLC-CAD Response Factors [https://www.thermofisher.com/us/en/home/industrial/chromatography/chromatography-learning-center/liquid-chromatography-information/hplc-system-components/how-hplc-detectors-work/charged-aerosol-detection/charged-aerosol-detection-cad-performance-tips.html]
- 85. Analytical Method Transfer Checklist [https://www.propharmagroup.com/thought-leadership/how-conduct-analytical-method-transfer]
- 86. Points to Consider in Quality Control Method Validation ... [https://www.bioprocessintl.com/qa-qc/points-to-consider-in-quality-control-method-validation-and-transfer]
- 87. Method Transfer [https://www.eurofins.com/biopharma-services/product-testing/services/biopharma-product-testing-services/method-development/method-transfer/]
- 88. Comparison of colorimetric, spectroscopic and ... [https://pmc.ncbi.nlm.nih.gov/articles/PMC10910492/]
- 89. A cross-validation of near-infrared spectroscopy ... - PubMed [https://pubmed.ncbi.nlm.nih.gov/24136110/]
- 90. Essential Strategies to Assist with Biotech Scale-Up Success [https://www.thermofisher.com/blog/life-in-the-lab/bioprocessing-biotech-scale-up-strategies/]
- 91. Strategies for Scalable and GMP-Compliant Drug ... [https://www.bioanalysis-zone.com/from-lab-to-launch-strategies-for-scalable-and-compliant-drug-development-with-lenora-dieyi/]
- 92. Design of Experiment (DoE) - An efficient tool for process ... [https://www.syngeneintl.com/resources/blog/design-of-experiment-doe-an-efficient-tool-for-process-optimization/]
- 93. Establishing Process Design Space for a Chromatography ... [https://www.biopharminternational.com/view/establishing-process-design-space-chromatography-purification-step-application-quality-design-princi]
- 94. Multivariate Design of Experiments for Gas ... [https://www.chromatographyonline.com/view/multivariate-design-of-experiments-for-gas-chromatographic-analysis]
- 95. Model-based design of experiments for efficient and ... [https://www.sciencedirect.com/science/article/pii/S0098135425000250]
- 96. Comparison Techniques for HPLC Column Performance [https://www.chromatographyonline.com/view/comparison-techniques-hplc-column-performance]
- 97. Comparison of experimental and simulated separation ... [https://www.sciencedirect.com/science/article/pii/S0021967324008021]
- 98. Comparison of Chromatographic and Electrochemical ... [https://www.mdpi.com/2076-3417/15/10/5504]
- 99. Bioanalytical method validation: An updated review - PMC [https://pmc.ncbi.nlm.nih.gov/articles/PMC3658022/]
- 100. Development and Validation of a High-Performance Liquid ... [https://pmc.ncbi.nlm.nih.gov/articles/PMC3028820/]
- 101. Basics of Gas Chromatograph-Mass Spectrometry [https://www.shimadzu.com/an/service-support/technical-support/gas-chromatograph-mass-spectrometry.html]
- 102. Flying High with Sensitivity and Selectivity:- GC–MS to ... [https://www.chromatographyonline.com/view/flying-high-with-sensitivity-and-selectivity---gc-ms-to-gc-ms-ms]
- 103. Development and validation of a stability-indicating HPLC ... [https://www.sciencedirect.com/science/article/pii/S1046202324002184]
- 104. Gas chromatography/tandem Mass Spectrometry ... [https://pubmed.ncbi.nlm.nih.gov/8122294/]
- 105. The advantages and the limitations of LC-MS/MS and Elisa ... [https://www.biotrial.com/bioanalysis-lc-ms-ms-vs-elisa/]
- 106. Correlation between LC-MS/MS and ELISA methods for ... [https://pmc.ncbi.nlm.nih.gov/articles/PMC12536777/]
- 107. Comparison of an ELISA and an LC/MS/MS method for ... [https://pubmed.ncbi.nlm.nih.gov/12352932/]
- 108. Comparing immunoassay and mass spectrometry ... [https://www.sciencedirect.com/science/article/pii/S0306453025001027]
- 109. CAD vs ELSD: Which HPLC Detector Is Your Better Option? [https://www.thermofisher.com/blog/analyteguru/cad-vs-elsd-which-hplc-detector-is-your-better-option/]
- 110. Performance Evaluation of three Liquid Chromatography ... [https://pmc.ncbi.nlm.nih.gov/articles/PMC2914548/]
- 111. Development and validation of HPLC-UV and LC-MS ... [https://pmc.ncbi.nlm.nih.gov/articles/PMC11546340/]
- 112. Charged Aerosol Detection in Pharmaceutical Analysis [https://www.chromatographyonline.com/view/charged-aerosol-detection-pharmaceutical-analysis-overview]
- 113. Liquid Chromatography with Charged Aerosol Detection [https://www.coriolis-pharma.com/our-services/liquid-chromatography-with-charged-aerosol-detection/]
- 114. Assessing the Greenness and Environmental Friendliness ... [https://pubmed.ncbi.nlm.nih.gov/38241068/]
- 115. Greenness assessment of 174 CEN, ISO, and ... [https://www.sciencedirect.com/science/article/pii/S2772582025000336]
- 116. The Essentials of Analytical Spectroscopy: Theory and ... [https://www.spectroscopyonline.com/view/the-essentials-of-analytical-spectroscopy-theory-and-applications]
- 117. Validation of Chromatographic Methods of Analysis [https://www.sciencedirect.com/science/chapter/bookseries/pii/S0099542805320090]
- 118. Cross-Validation of a Multiplex LC-MS/MS Method for ... [https://www.mdpi.com/1424-8247/14/8/796]