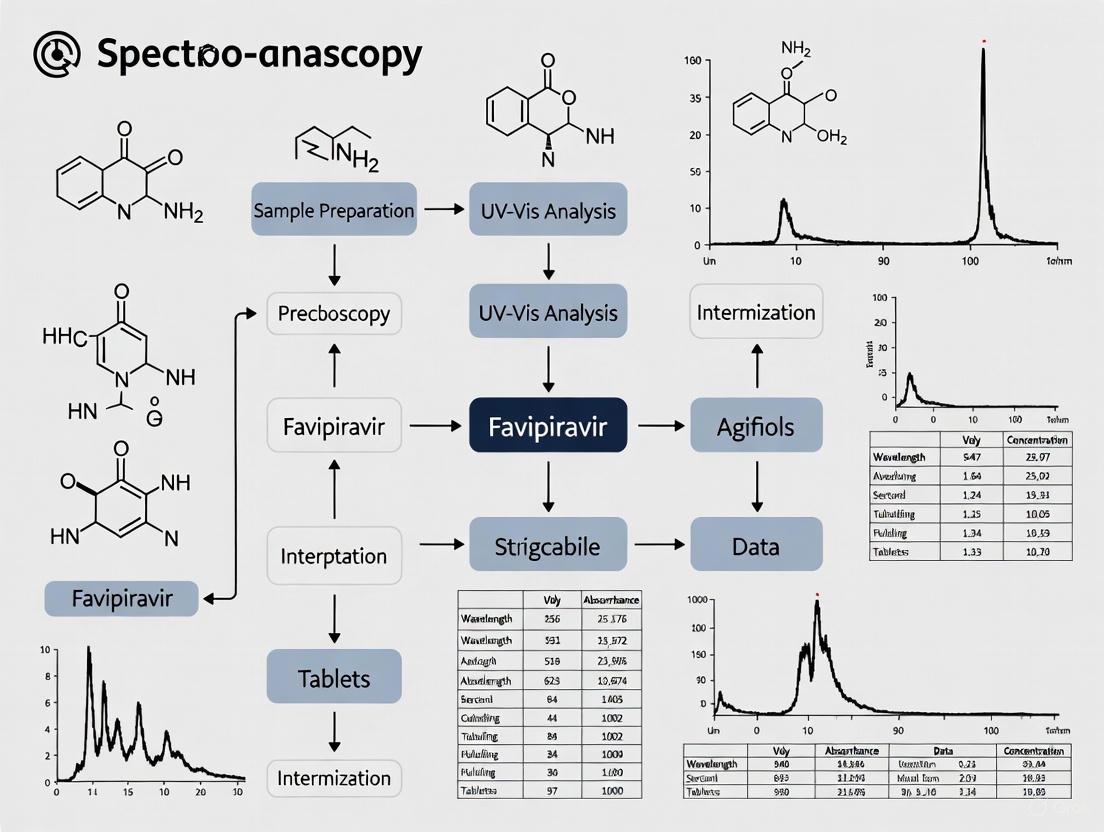
Development and Validation of a Simple UV-Vis Spectroscopy Method for Favipiravir Quantification in Tablet Formulations
This article provides a comprehensive guide for researchers and pharmaceutical analysts on developing, optimizing, and validating a UV-Vis spectroscopic method for quantifying favipiravir in tablet dosage forms.
Development and Validation of a Simple UV-Vis Spectroscopy Method for Favipiravir Quantification in Tablet Formulations
Abstract
This article provides a comprehensive guide for researchers and pharmaceutical analysts on developing, optimizing, and validating a UV-Vis spectroscopic method for quantifying favipiravir in tablet dosage forms. It covers the foundational principles of favipiravir's spectroscopic properties, a step-by-step methodological protocol using ethanol as a solvent with detection at 228 nm or 323 nm, strategies for troubleshooting and optimizing analytical parameters, and a rigorous validation framework according to ICH guidelines. The method demonstrates excellent linearity (0.5-25 µg/mL), precision (%RSD < 2), and accuracy (recovery ~99.7%), presenting a cost-effective, rapid, and reliable alternative to chromatographic techniques for routine quality control in pharmaceutical development.
Favipiravir and UV-Vis Spectroscopy: Fundamental Principles for Pharmaceutical Analysis
Chemical Foundation and Mechanism of Action
Favipiravir (C~5~H~4~FN~3~O~2~) is a synthetic pyrazine carboxamide derivative with a molecular weight of 157.10 g·mol⁻¹ [1] [2]. This prodrug possesses a unique chemical structure that enables its broad-spectrum antiviral activity, primarily as a RNA-dependent RNA polymerase (RdRp) inhibitor [3] [2] [4].
The compound appears as a white to almost white powder with a melting point between 190°C and 194°C [5]. It is slightly soluble in methanol and demonstrates stability concerns in acidic conditions where its amide moiety undergoes hydrolysis [6].
Mechanism of Action
Favipiravir's antiviral activity requires intracellular activation. The compound undergoes a series of enzymatic conversions to form its active metabolite, favipiravir-ribofuranosyl-5'-triphosphate (favipiravir-RTP) [2] [4]. This activation process begins with conversion to the ribofuranosyl monophosphate form by hypoxanthine guanine phosphoribosyltransferase (HGPRT), followed by phosphorylation [4].
The activated metabolite exerts its antiviral effect through multiple mechanisms:
- Competitive Inhibition: Favipiravir-RTP competes with purine nucleotides (particularly GTP) for incorporation into the growing RNA chain by viral RdRp [5]
- Chain Termination: Incorporation of favipiravir-RTP into the nascent RNA strand can cause premature chain termination, halting viral replication [2]
- Lethal Mutagenesis: The ambiguous base-pairing properties of favipiravir introduce mutations into viral RNA, leading to error catastrophe and loss of viral viability [4]
Table 1: Fundamental Chemical and Pharmacokinetic Properties of Favipiravir
| Property | Specification | Reference |
|---|---|---|
| Chemical Formula | C~5~H~4~FN~3~O~2~ | [1] [2] |
| Molecular Weight | 157.10 g·mol⁻¹ | [1] [2] |
| Melting Point | 190-194°C | [5] |
| Mechanism of Action | RdRp inhibition (prodrug requiring intracellular activation) | [3] [2] |
| Bioavailability | ~97.6% | [2] |
| Protein Binding | 54% | [2] |
| Elimination Half-life | 2-5.5 hours | [2] |
| Primary Metabolic Pathway | Hydroxylation via aldehyde oxidase | [2] |
Diagram 1: Favipiravir activation and antiviral mechanism pathway
Analytical Methods for Quantification
UV-Vis Spectrophotometric Methods
UV-Vis spectroscopy provides a simple, cost-effective approach for favipiravir quantification in pharmaceutical formulations. The direct spectrophotometric method utilizes favipiravir's maximum absorption at 323 nm (in methanol) [6]. The compound follows the Beer-Lambert law over a concentration range of 4-22 μg/mL, with high precision and accuracy [6].
Advanced spectrophotometric techniques have been developed to address analytical challenges:
- Dual Wavelength Method: Measures absorbance difference between 322.7 nm and 270 nm, eliminating interference from degradation products [6]
- First Derivative Spectroscopy: Uses peak-to-peak amplitudes at 338.0 nm and 308.0 nm for enhanced selectivity [6]
- Difference Spectrophotometry: Leverages spectral changes at 361.3 nm as pH changes to determine favipiravir in presence of degradants [6]
Chromatographic Methods
High-Performance Liquid Chromatography (HPLC) offers superior specificity for favipiravir quantification, particularly in complex matrices. A validated reverse-phase method employs a C-18 column with a mobile phase consisting of sodium acetate solution (pH 3.0) and acetonitrile (85:15, v/v) at a flow rate of 1.0 mL/min [7]. Detection is typically performed at 227 nm [7] or 280 nm [8], with favipiravir eluting at approximately 3.8 minutes under optimized conditions [8].
Recent advancements include green micellar RP-HPLC, which eliminates organic solvents using a mixed micellar mobile phase of 0.02 M Brij-35 and 0.1 M SDS with 0.01 M potassium dihydrogen orthophosphate (pH 3.0) [8]. This environmentally friendly approach maintains analytical performance while reducing toxic waste generation.
Table 2: Analytical Methods for Favipiravir Quantification
| Method | Conditions | Linear Range | Key Applications | Reference |
|---|---|---|---|---|
| UV-Vis (Direct) | λ~max~ 323 nm (methanol) | 4-22 μg/mL | Pure form and pharmaceutical formulations | [6] |
| UV-Vis (Dual Wavelength) | ΔA at 322.7 nm & 270 nm | 4-22 μg/mL | Laboratory mixtures with degradants | [6] |
| HPLC (Conventional) | C-18 column; acetate buffer (pH 3):ACN (85:15); 227 nm | 10-60 μg/mL | Pharmaceutical formulations | [7] |
| HPLC (Green Micellar) | C-18 column; Brij-35/SDS mobile phase; 280 nm | 5-100 μg/mL | Pure form and pharmaceutical dosage forms | [8] |
| Ratio Spectra Manipulating | Ratio difference at 222-256 nm (FPV) | 1.5-24 μg/mL | Spiked human plasma | [9] |
Therapeutic Significance and Clinical Applications
Antiviral Spectrum
Favipiravir demonstrates exceptional broad-spectrum activity against various RNA viruses. Originally approved in Japan in 2014 for pandemic influenza, its therapeutic applications have expanded to include off-label use for several significant viral pathogens [3] [1] [4].
The drug's ability to target the conserved RdRp catalytic domain across RNA viruses underpins its broad-spectrum coverage [2] [4]. This makes it particularly valuable for responding to emerging viral threats where specific therapeutics may not be available.
Table 3: Therapeutic Applications of Favipiravir
| Virus Family | Specific Viruses | Evidence Level | Clinical Context | |
|---|---|---|---|---|
| Orthomyxoviridae | Influenza A, B, C (including resistant strains) | Approved in Japan | Pandemic influenza preparedness | [1] [4] |
| Coronaviridae | SARS-CoV-2 | Authorized under emergency provisions in several countries | Mild to moderate COVID-19 | [3] [1] |
| Filoviridae | Ebola virus | Clinical trials (JIKI trial in Guinea) | Off-label use during outbreaks | [1] [4] |
| Arenaviridae | Lassa virus | Off-label use | Treatment of infections | [7] [4] |
| Paramyxoviridae | Nipah virus | Animal studies (Syrian hamster model) | 100% survival in lethal challenge model | [1] |
| Flaviviridae | West Nile virus, Yellow Fever | Animal studies | Demonstrated efficacy in rodent models | [4] |
Clinical Efficacy in COVID-19
During the COVID-19 pandemic, favipiravir emerged as a significant therapeutic option, particularly for mild to moderate cases. A systematic review and meta-analysis of clinical trials revealed that favipiravir treatment led to:
- Significant clinical improvement within seven days after hospitalization (RR = 1.24, 95% CI: 1.09-1.41) compared to control groups [10]
- Earlier viral clearance in 14 days after hospitalization, though this finding was marginally non-significant (RR = 1.11, 95% CI: 0.98-1.25) [10]
- Reduced mortality rate by approximately 30% compared to control, though not statistically significant in the overall population [10]
The "hit early-hit hard" principle is particularly relevant for favipiravir therapy, with early initiation after symptom onset associated with better outcomes [3]. The oral bioavailability of favipiravir (97.6%) makes it particularly suitable for outpatient management, potentially reducing hospital burden during pandemic surges [3] [2].
Experimental Protocols
UV-Vis Spectrophotometric Protocol for Tablet Analysis
Principle: This protocol utilizes the direct UV absorption of favipiravir at 323 nm for quantification in tablet formulations, based on validated methods with demonstrated linearity, precision, and accuracy [6].
Materials and Reagents:
- Favipiravir reference standard
- Methanol (HPLC grade)
- Favipiravir tablets (200 mg)
- Volumetric flasks (10 mL, 100 mL)
- Ultrasonic bath
- Whatman filter paper (No. 42) or 0.45 μm membrane filter
Procedure:
- Standard Stock Solution (100 μg/mL): Accurately weigh 10 mg of favipiravir reference standard and transfer to a 100 mL volumetric flask. Dissolve in and dilute to volume with methanol.
- Calibration Standards: Prepare working standards in the concentration range of 4-22 μg/mL by diluting the stock solution with methanol.
- Sample Preparation: Weigh and finely powder ten tablets. Transfer an amount equivalent to 10 mg of favipiravir to a 100 mL volumetric flask. Add approximately 30 mL of methanol, sonicate for 15 minutes, then dilute to volume with methanol. Filter through a 0.45 μm membrane filter.
- Dilution: Dilute the filtered solution with methanol to obtain a final concentration within the calibration range (4-22 μg/mL).
- Measurement: Scan the absorbance of standard and sample solutions against a methanol blank from 200-400 nm. Measure the absorbance at 323 nm.
- Calculation: Construct a calibration curve by plotting absorbance versus concentration of standard solutions. Determine the sample concentration using the regression equation.
Validation Parameters:
- Linearity: Correlation coefficient >0.999 [7] [6]
- Precision: Intra-day and inter-day RSD <2% [6]
- Accuracy: Recovery of 99.11-100.06% [6]
- Specificity: No interference from common excipients [7]
Diagram 2: UV-Vis spectrophotometric analysis workflow for favipiravir tablets
Forced Degradation Protocol for Stability Studies
Principle: This protocol evaluates favipiravir's stability under acidic conditions through forced degradation studies, monitoring the formation of hydrolysis products using spectrophotometric methods [6].
Procedure:
- Acid-Induced Degradation: Transfer 25 mg of favipiravir to a round-bottom flask. Add 25 mL of 1.0 N HCl and reflux in a water bath at 100°C for 1 hour.
- Neutralization: After cooling, neutralize the solution with 2.0 N NaOH.
- Solution Preparation: Transfer the neutralized solution to a 100 mL volumetric flask and dilute to volume with distilled water to obtain a concentration equivalent to 250 μg/mL of favipiravir degradation products.
- Analysis: Analyze the degradation mixture using the dual wavelength, first derivative, or difference spectrophotometric methods to quantify intact favipiravir in the presence of its degradation product.
Confirmation of Degradation:
- Complete degradation is confirmed by TLC using ethyl acetate:methanol:ammonia (2:4:0.1) as the developing system [6]
- The degradation product shows different spectral characteristics compared to the parent compound
The Scientist's Toolkit: Research Reagent Solutions
Table 4: Essential Materials for Favipiravir Analytical Research
| Reagent/Equipment | Specification | Function in Research |
|---|---|---|
| Favipiravir Reference Standard | Purity >98.0% (HPLC) [5] | Primary standard for calibration curve preparation and method validation |
| Methanol (HPLC Grade) | High purity, low UV absorbance | Solvent for standard and sample preparation in UV and HPLC analysis |
| Sodium Acetate Buffer | 50 mM, pH 3.0 (adjusted with glacial acetic acid) | Mobile phase component for conventional HPLC analysis [7] |
| Mixed Micellar Mobile Phase | 0.02 M Brij-35 + 0.1 M SDS + 0.01 M KH~2~PO~4~, pH 3.0 | Green chromatography mobile phase, eliminates organic solvents [8] |
| C-18 Chromatographic Column | 5 μm, 250 × 4.6 mm (e.g., VDSPHER PUR 100) | Stationary phase for reverse-phase separation [8] |
| Hydrochloric Acid | 1.0 N, analytical grade | Forced degradation studies to assess acid stability [6] |
| UV-Vis Spectrophotometer | Double-beam with quartz cells | Absorbance measurement for quantitative analysis |
| Sonication Bath | Standard laboratory type | Extraction and dissolution of tablet formulations |
Ultraviolet-Visible (UV-Vis) spectroscopy is a fundamental analytical technique in pharmaceutical analysis, providing a simple, cost-effective, and rapid means for drug quantification. Its principle is based on the measurement of the absorption of ultraviolet or visible light by a molecule at specific wavelengths. For the quantification of active pharmaceutical ingredients (APIs) like favipiravir in solid dosage forms, UV-Vis spectroscopy offers a reliable method for quality control, ensuring drug potency and uniformity. This application note details the practical use of UV-Vis spectroscopy for the analysis of favipiravir in tablets, providing validated methodologies for researchers and pharmaceutical scientists.
Fundamental Principles and Method Development
The development of a UV-Vis method for drug quantification begins with identifying the wavelength of maximum absorption (λmax) for the target molecule. For favipiravir, this involves dissolving the pure drug in a suitable solvent and scanning over a defined wavelength range.
Experimental data from multiple studies have identified two primary λmax values for favipiravir, depending on the solvent system used. A summary of the key parameters for both wavelengths is provided in Table 1.
Table 1: Key Wavelengths and Parameters for Favipiravir Quantification via UV-Vis Spectroscopy
| Parameter | λmax = 228 nm (in 90% Ethanol) [11] | λmax = 323 nm (in Pure Ethanol) [12] [6] |
|---|---|---|
| Linear Range | 0.5 - 25 µg/mL [11] | 20 - 60 µg/mL [12] |
| Limit of Detection (LOD) | 0.0435 µg/mL [11] | 3.5 µg/mL [12] |
| Limit of Quantification (LOQ) | 0.1318 µg/mL [11] | 12 µg/mL [12] |
| Correlation Coefficient (r²) | > 0.999 [11] | > 0.999 [12] |
| Precision (% RSD) | < 2% [11] | < 2% [12] |
The choice of solvent and corresponding wavelength depends on the analytical requirements. The method at 228 nm offers superior sensitivity with a much lower LOD and LOQ, making it suitable for detecting trace amounts. The method at 323 nm, while less sensitive, is robust for the assay of bulk drug and high-dose formulations.
The logical workflow for developing and applying a UV-Vis method for drug analysis, from instrument preparation to sample calculation, is outlined in the diagram below.
Advanced Spectrophotometric Techniques for Complex Mixtures
In pharmaceutical analysis, excipients or degradation products can interfere with the direct measurement of an API. To address this, advanced spectrophotometric techniques can be employed. For instance, favipiravir is susceptible to acid hydrolysis, producing a degradation product that interferes with direct measurement [6]. Several stability-indicating methods have been developed to overcome this challenge:
- Dual Wavelength (DW): The absorbance difference between two wavelengths (322.7 nm and 270 nm) is used, where the degradation product shows equal absorbance, thereby canceling out its contribution [6].
- First Derivative (D1) Peak-to-Peak: The sum of the peak amplitudes from the first derivative spectrum at 338.0 nm and 308.0 nm is correlated with the drug concentration, minimizing interference from the degradant [6].
- Difference Spectrophotometry (ΔA): The absorbance difference of the drug in an alkaline solution versus an acidic solution is measured at 361.3 nm, a point where the degradation product shows minimal change [6].
These methods demonstrate that UV-Vis spectroscopy can be selectively extended beyond simple direct measurement to provide accurate quantification even in the presence of interfering substances.
Detailed Experimental Protocol: Favipiravir Tablet Assay at 228 nm
This protocol is adapted from published methods for the quantification of favipiravir in tablet dosage forms [11].
Research Reagent Solutions
Table 2: Essential Materials and Reagents
| Item/Reagent | Specification | Function/Purpose |
|---|---|---|
| Favipiravir Reference Standard | Certified purity (e.g., >98%) [12] | Primary standard for calibration curve |
| Ethanol | Analytical grade or HPLC grade | Solvent for dissolution and dilution |
| Favipiravir Tablets | Marketed formulation (e.g., 200 mg/tablet) | Test sample for analysis |
| Volumetric Flasks | Class A, various sizes (e.g., 10, 100, 100 mL) | Precise volume measurement |
| Ultrasonic Bath | - | To aid dissolution and degassing |
| UV-Vis Spectrophotometer | with 1 cm quartz cells | Instrument for absorbance measurement |
| Analytical Balance | Sensitivity 0.1 mg | Accurate weighing of standard and sample |
| Membrane Filters | 0.45 µm porosity | Clarification of sample solutions |
Procedure
- Standard Stock Solution: Accurately weigh about 10 mg of favipiravir reference standard. Transfer to a 100 mL volumetric flask, dissolve in, and make up to volume with 90% ethanol to obtain a concentration of approximately 100 µg/mL.
- Working Standard Solutions: Pipette appropriate volumes of the stock solution (e.g., 0.5, 1, 2, 3, 4, 5 mL) into a series of 10 mL volumetric flasks. Dilute to the mark with 90% ethanol to create a calibration series ranging from 5 to 50 µg/mL.
- Sample Solution Preparation:
- Weigh and finely powder not less than 20 tablets.
- Transfer an amount of powder equivalent to 10 mg of favipiravir to a 100 mL volumetric flask.
- Add about 70 mL of 90% ethanol, sonicate for 15-20 minutes to ensure complete dissolution of the API.
- Allow to cool to room temperature, then dilute to volume with the same solvent.
- Filter a portion of the solution through a 0.45 µm membrane filter, discarding the first few mL of the filtrate.
- Further Dilution: Pipette a suitable aliquot (e.g., 1 mL) of the clear filtrate into a 10 mL volumetric flask and dilute to volume with 90% ethanol to obtain a final concentration within the linear range of the calibration curve (e.g., ~10 µg/mL).
- Absorbance Measurement: Set the spectrophotometer to 228 nm. Using 90% ethanol as the blank, measure the absorbance of all working standard solutions and the prepared sample solution.
Data Analysis
- Calibration Curve: Plot the average absorbance of each standard solution against its corresponding concentration. The regression equation (y = mx + c) is calculated using the least-squares method, where 'y' is the absorbance, 'm' is the slope, 'x' is the concentration, and 'c' is the intercept.
- Calculation of Tablet Assay: The concentration of favipiravir in the sample solution (Cs, in µg/mL) is calculated using the regression equation derived from the calibration curve. The percentage of label claim in the tablet is then determined as follows:
- Amount (mg/tablet) = (Cs × Dilution Factor × 100 mL × Average Tablet Weight) / (Weight of Powder Taken × 1000)
- % Label Claim = (Calculated Amount / Label Claim) × 100
Comparative Analysis with Other Techniques
While UV-Vis spectroscopy is highly practical, its performance can be contextualized by comparing it with a more sophisticated technique like Reverse-Phase High-Performance Liquid Chromatography (RP-HPLC). Table 3 highlights this comparison using data from validated methods for favipiravir.
Table 3: Comparison of UV-Vis and RP-HPLC Methods for Favipiravir Analysis
| Parameter | UV-Vis Spectroscopy (This Note) | RP-HPLC (for context) [13] |
|---|---|---|
| Analytical Technique | Absorption of light | Chromatographic separation & UV detection |
| Typical Runtime | Minutes (per sample) | ~5-10 minutes (per injection) [14] |
| Key Advantage | Simplicity, low cost, high speed | High selectivity, resolves mixtures & impurities |
| Key Limitation | Limited selectivity in complex mixtures | Higher cost, complex operation |
| Linearity Range | 0.5-25 µg/mL (at 228 nm) [11] | 5-100 µg/mL [15] |
| LOD / LOQ | 0.0435 / 0.1318 µg/mL (at 228 nm) [11] | 0.51 / 1.54 µg/mL [15] |
| Primary Application | Routine assay of API in formulations | Stability studies, impurity profiling, simultaneous drug analysis [16] [15] |
Diagram: Decision Pathway for Analytical Technique Selection
The choice between UV-Vis and HPLC depends on the specific analytical question. The following workflow aids in selecting the most appropriate technique.
Within the framework of developing a robust UV-Vis spectroscopy method for the quantification of Favipiravir in tablets, a comprehensive understanding of its spectroscopic profile is paramount. Favipiravir (6-fluoro-3-hydroxypyrazine-2-carboxamide), an antiviral agent with demonstrated activity against RNA viruses including SARS-CoV-2, presents specific analytical challenges and opportunities due to its molecular structure [7]. This application note details the solubility behavior and spectral characteristics of Favipiravir, providing validated protocols and key data to support researchers, scientists, and drug development professionals in the implementation of precise and accurate quantitative methods. The focus is on providing practical, experimentally-derived data that can be directly applied in quality control and pharmaceutical research settings.
Solubility and Solvent Systems
The selection of an appropriate solvent is critical for preparing analytical samples, as it influences the solubility, stability, and spectral properties of the analyte. The following table summarizes the solubility and application of different solvent systems for Favipiravir, as established in the literature.
Table 1: Solvent Systems for Favipiravir in Spectroscopic Analysis
| Solvent System | Solubility & Application Notes | Key References & Uses |
|---|---|---|
| Deionized Water | Suitable for preparing stock solutions of at least 1000 μg/mL; sonication and filtration (0.22 μm) recommended [7]. | Primary solvent in reverse-phase LC methods; used for calibration curves in the 10–60 μg/mL range [7]. |
| Methanol | Effective solvent; used for preparing stock solutions of 100 μg/mL for spectrophotometric analysis [6]. | Employed in stability-indicating methods; solvent for analyzing laboratory-prepared mixtures and formulations [6]. |
| 90% Ethanol | Confirmed solvent; used for method development and validation [11]. | Maximum absorption at 228 nm; linearity obeyed in the concentration range of 0.5-25 μg/mL [11]. |
Spectral Characteristics
The ultraviolet (UV) absorption profile of Favipiravir is fundamental to its quantification via spectrophotometry. The molecule exhibits strong absorption in the UV region due to its aromatic pyrazine ring structure.
Table 2: Documented UV Absorption Maxima (λ_max) for Favipiravir
| Solvent | λ_max (nm) | Experimental Context | Citation |
|---|---|---|---|
| Deionized Water | 227 nm | Using deionized water as solvent; spectrum recorded between 200 and 800 nm. | [7] |
| Methanol | 323 nm | Direct spectrophotometric method for determination in presence of acid degradation product. | [6] |
| 90% Ethanol | 228 nm | Method developed for estimation in pharmaceutical formulations. | [11] |
It is important to note that the absorption maximum can shift depending on the solvent and the pH of the solution. For instance, in difference spectrophotometry, where solutions in 1.0 N NaOH are measured against solutions in 1.0 N HCl, the maximum difference in absorbance for Favipiravir is observed at 361.3 nm [6]. This property can be exploited for selective quantification in the presence of interfering substances.
Advanced Spectroscopic Profiles
Beyond basic UV absorption, other spectroscopic techniques provide deeper insights into the molecular characteristics and stability of Favipiravir.
- Vibrational Spectroscopy: Infrared (IR) spectroscopy reveals key functional groups. The amide moiety in Favipiravir shows characteristic bands: NH₂ stretch bands near 3350 cm⁻¹ and 3180 cm⁻¹, and a C=O stretch band at about 1680–1640 cm⁻¹ [6]. Monitoring these bands is crucial for stability studies, as acid hydrolysis degrades the amide group.
- Stability-Indicating Spectral Signatures: Favipiravir is susceptible to acid hydrolysis. The degradation product, a carboxylic acid salt, can be identified by IR stretch bands at 1650–1540 cm⁻¹ and 1450–1360 cm⁻¹ [6]. This highlights the importance of stability-indicating methods.
Experimental Protocols
Protocol 1: Standard Solution Preparation for UV Analysis in Water
This protocol is adapted for the development and validation of a quantitative method using deionized water as the solvent [7].
Research Reagent Solutions:
- Favipiravir Reference Standard: High-purity material for accurate calibration.
- Deionized Water: Purified using a system such as Milli-Q to avoid interfering impurities.
- Volumetric Flasks (50 mL and 100 mL): For precise volume measurements.
- Ultrasonic Bath: To aid dissolution and degassing.
- Syringe Filters (0.22 μm): For removing particulate matter prior to analysis.
Procedure:
- Stock Solution (1000 μg/mL): Accurately weigh about 50 mg of pure Favipiravir and transfer it quantitatively to a 50 mL volumetric flask. Add about 30 mL of deionized water, shake or sonicate until complete dissolution, and then dilute to volume with deionized water.
- Working Standard Solutions (10–60 μg/mL): Pipette appropriate aliquots (e.g., 0.5 mL to 3.0 mL) from the stock solution into a series of 50 mL volumetric flasks. Dilute to the mark with deionized water and mix thoroughly.
- Sample Solution from Tablets: Weigh and finely powder ten tablets. Transfer an amount of powder equivalent to 50 mg of Favipiravir to a 50 mL flask. Add 30 mL of deionized water, shake for 30 minutes, and dilute to volume. Filter the solution (Whatman No. 42 filter paper or equivalent) and then further dilute filtrate as needed to fall within the working range.
Protocol 2: Stability-Indicating Analysis via Dual Wavelength Method
This method is designed to quantify Favipiravir in the presence of its acid-induced degradation product [6].
Research Reagent Solutions:
- Methanol HPLC Grade: Serves as the primary solvent.
- Hydrochloric Acid (1.0 N and 2.0 N): For forced degradation and pH adjustment.
- Sodium Hydroxide (1.0 N and 2.0 N): For neutralization and difference spectroscopy.
- FAV Degradation Product: Prepared by refluxing FAV in 1.0 N HCl for 1 hour, then neutralizing with NaOH.
Procedure:
- Forced Degradation: To confirm method specificity, reflux 25 mg of FAV with 25 mL of 1.0 N HCl in a water bath at 100°C for 1 hour. Cool, neutralize with 2.0 N NaOH, and dilute to 100 mL with methanol to obtain a 250 μg/mL degradation product solution.
- Calibration Curve (Dual Wavelength):
- Prepare FAV working solutions in methanol (4.0–22.0 μg/mL).
- Scan the spectra from 200–400 nm.
- For each concentration, calculate the absorbance difference (ΔA) between 322.7 nm and 270.0 nm. At these wavelengths, the degradation product shows equal absorbance, resulting in a net ΔA of zero for the degradant.
- Construct a calibration curve by plotting ΔA versus the corresponding FAV concentration.
Figure 1: Dual Wavelength Method Workflow. This flowchart outlines the key steps for quantifying Favipiravir in the presence of its degradation product using the dual-wavelength spectrophotometric approach.
The Scientist's Toolkit
Table 3: Essential Reagents and Equipment for Favipiravir Spectroscopic Analysis
| Item | Specification / Function |
|---|---|
| Double-Beam UV-Vis Spectrophotometer | Equipped with 1.0 cm quartz cells; capable of scanning 200-400 nm and derivative spectroscopy. |
| pH Meter | For accurate adjustment of buffer solutions used in mobile phases or stability studies. |
| Analytical Balance | High-precision (e.g., Mettler Toledo) for accurate weighing of standards and samples. |
| Ultrasonic Bath | To facilitate dissolution of standards and degassing of solvents. |
| Solvent Filtration Assembly | With 0.22 μm membrane filters for purifying mobile phases and sample solutions. |
| Volumetric Glassware | Class A flasks and pipettes for precise preparation of standard and sample solutions. |
| Favipiravir Reference Standard | Certified pure material for preparing calibration standards. |
| HPLC-Grade Solvents | Methanol, ethanol, and deionized water (Milli-Q purity) to minimize UV-absorbing impurities. |
A deep understanding of Favipiravir's solubility in various solvents and its characteristic spectral behavior is the foundation for developing reliable UV-Vis spectroscopic methods for tablet quantification. The data and protocols compiled in this application note demonstrate that simple, accurate, and precise methods can be established using common laboratory equipment. Furthermore, the availability of advanced, stability-indicating spectrophotometric techniques ensures that the analysis remains specific even in the presence of degradation products, which is crucial for ensuring drug product quality and stability throughout its shelf life.
Advantages of UV-Vis for Routine Quality Control vs. HPLC
Within pharmaceutical quality control (QC) laboratories, the selection of an appropriate analytical technique is critical for ensuring drug safety, efficacy, and consistency. For the quantification of active pharmaceutical ingredients (APIs) such as favipiravir, a broad-spectrum antiviral agent, laboratories often choose between High-Performance Liquid Chromatography (HPLC) and UV-Visible (UV-Vis) spectrophotometry [7]. This application note details the distinct advantages of UV-Vis spectroscopy for routine QC, framed within the context of a research thesis focused on developing a UV-Vis method for quantifying favipiravir in tablets. While HPLC is renowned for its high resolution and specificity, UV-Vis offers compelling benefits in simplicity, speed, and cost-effectiveness for high-throughput environments where rapid analysis is paramount [17] [18].
Key Advantages of UV-Vis Spectroscopy
UV-Vis spectroscopy is a mainstay in QC laboratories due to several inherent strengths that make it exceptionally suitable for routine analysis.
- Ease of Use and Rapid Analysis: UV-Vis spectrophotometers feature user-friendly interfaces that enable analysts with minimal training to obtain results in a matter of seconds [17]. The technique involves straightforward sample preparation, often requiring only dissolution and dilution, without the need for complex method development or column conditioning [7] [18].
- Cost-Effectiveness: The initial investment and operational costs for a UV-Vis spectrophotometer are significantly lower than those for an HPLC system. This extends to lower maintenance requirements, reduced solvent consumption, and less expensive consumables [17].
- Non-Destructive Analysis: The UV-Vis technique is non-destructive, allowing the sample to be recovered for further testing or stability studies after analysis [18].
- Excellent Quantitative Accuracy: For the assay of a single API in a formulation, UV-Vis provides highly precise and accurate quantitative results. Studies on favipiravir have demonstrated excellent linearity (correlation coefficient >0.999) and accuracy (99.83–100.45%) within a defined concentration range [7].
Comparative Analysis: UV-Vis vs. HPLC
The following table summarizes a direct comparison of key performance and operational parameters between UV-Vis and HPLC, based on data from a study quantifying favipiravir and general instrumental principles [7] [17] [19].
Table 1: Comparative Analysis of UV-Vis and HPLC for Routine Quality Control
| Parameter | UV-Vis Spectrophotometry | High-Performance Liquid Chromatography (HPLC) |
|---|---|---|
| Analysis Speed | Very fast (seconds to minutes) [18] | Slower (10-60 minutes per run) [7] [20] |
| Sample Preparation | Minimal; often just dissolution [7] | Can be complex; may require extraction, filtration [19] |
| Cost | Lower initial and operational cost [17] | High initial investment and running costs [17] [21] |
| Ease of Use | Simple, minimal training required [17] | Requires significant expertise for operation and troubleshooting [19] |
| Specificity | Lower; cannot resolve mixtures without separation [22] | Very high; can separate and quantify multiple components simultaneously [19] [23] |
| Sensitivity | High for the primary analyte [7] | Excellent, even for trace-level impurities [21] |
| Validation Performance for Favipiravir [7] | ||
| - Linearity (10–60 µg/mL) | R² > 0.999 | R² > 0.999 |
| - Accuracy (%) | 99.83 – 100.45 | 99.57 – 100.10 |
| - Intra-day Precision (RSD%) | < 1% (Low) | < 1% (Low) |
| Ideal Application | Routine, high-throughput assay of single-component samples [18] | Complex mixtures, impurity profiling, stability-indicating methods [19] [21] |
Experimental Protocol: UV-Vis Method for Favipiravir Quantification
The following detailed protocol is adapted from a published study for the quantification of favipiravir in tablet dosage forms using UV-Vis spectroscopy [7].
Research Reagent Solutions and Materials
Table 2: Essential Materials and Reagents
| Item | Specification/Function |
|---|---|
| UV-Vis Spectrophotometer | Double-beam instrument with 1.0 cm quartz cells (e.g., Shimadzu UV-1800) [7]. |
| Analytical Balance | For precise weighing of standards and samples (e.g., Mettler Toledo) [7]. |
| Favipiravir Reference Standard | High-purity material for preparing calibration standards. |
| Favipiravir Tablets | Commercial tablet formulation (e.g., Favicovir, 200 mg) [7]. |
| Deionized Water | Solvent for preparing all standard and sample solutions. |
| Volumetric Flasks | For accurate preparation and dilution of solutions. |
| Syringe Filter | 0.22 µm membrane, for filtering sample solutions if necessary. |
Procedure
Instrument Setup and λ_max Determination:
- Switch on the UV-Vis spectrophotometer and allow the lamp to warm up for the time specified by the manufacturer.
- Prepare a standard favipiravir solution (~30 µg/mL) in deionized water.
- Fill a 1 cm quartz cuvette with the solvent (deionized water) to use as the blank.
- Scan the standard solution over the wavelength range of 200–800 nm against the blank.
- Identify the wavelength of maximum absorption (λ_max). For favipiravir, this has been determined to be 227 nm [7]. Set the instrument to this fixed wavelength for all subsequent measurements.
Preparation of Calibration Curve Standards:
- Prepare a stock standard solution of favipiravir at a concentration of 1000 µg/mL in deionized water.
- Dilute the stock solution quantitatively with deionized water to prepare a series of standard solutions covering a concentration range of 10–60 µg/mL [7].
Preparation of Sample Solution:
- Accurately weigh and finely powder not less than ten favipiravir tablets.
- Transfer an accurately weighed portion of the powder, equivalent to about 50 mg of favipiravir, to a 50 mL volumetric flask.
- Add about 30 mL of deionized water, shake vigorously for 30 minutes, and dilute to volume with the same solvent to obtain a nominal concentration of 1000 µg/mL.
- Filter the solution through filter paper (e.g., Whatman No. 42). Further dilute this solution quantitatively with deionized water to obtain a final concentration within the linear range of the calibration curve (e.g., ~30 µg/mL) [7].
Measurement and Calculation:
- Measure the absorbance of each calibration standard and the prepared sample solution against the deionized water blank at 227 nm.
- Construct a calibration curve by plotting the average absorbance of each standard against its concentration.
- Perform linear regression analysis on the data. The favipiravir study confirmed a linear relationship with a correlation coefficient typically >0.999 [7].
- Calculate the concentration of favipiravir in the sample solution using the regression equation from the calibration curve, and then determine the content in the tablet formulation.
Workflow Visualization
The following diagram illustrates the logical workflow of the UV-Vis method for favipiravir quantification, highlighting its simplicity compared to HPLC.
Diagram 1: UV-Vis Quantification Workflow for Favipiravir in Tablets. The process involves straightforward sample preparation followed by rapid absorbance measurement.
For the routine quality control of favipiravir in solid dosage forms, UV-Vis spectroscopy presents a compelling alternative to HPLC. Its principal advantages of operational simplicity, rapid analysis, and low cost make it an ideal choice for high-throughput environments where the objective is the efficient and accurate quantification of the active ingredient. The validated method demonstrates excellent linearity, precision, and accuracy, fulfilling QC requirements [7]. HPLC remains the unequivocal technique for complex analyses such as impurity profiling, stability-indicating assays, and analyses of multi-component mixtures [19] [21]. However, for the specific and focused application of assaying favipiravir in tablets, UV-Vis spectroscopy offers a robust, reliable, and highly efficient solution that can significantly enhance laboratory productivity.
Current Analytical Landscape and Regulatory Considerations for Favipiravir
Favipiravir (6-fluoro-3-hydroxypyrazine-2-carboxamide) is an antiviral prodrug that has gained significant attention for its potential application against various RNA viruses, including influenza, Ebola, and SARS-CoV-2 [1] [2]. As a pyrazine analog, it undergoes intracellular conversion to its active form, favipiravir-ribofuranosyl-5'-triphosphate (F-RTP), which selectively inhibits viral RNA-dependent RNA polymerase (RdRp), thereby preventing viral transcription and replication [1] [2]. The increased therapeutic use of favipiravir, particularly during the COVID-19 pandemic, has necessitated the development of robust, accurate, and cost-effective analytical methods for its quantification in pharmaceutical formulations and biological matrices. This application note provides a comprehensive overview of the current analytical methodologies, with particular emphasis on UV-Vis spectroscopic techniques, for the quantification of favipiravir in tablet formulations, framed within a broader research thesis on analytical method development and validation.
Current Analytical Methods for Favipiravir Quantification
Various analytical techniques have been employed for the determination of favipiravir, including chromatographic methods (RP-HPLC, LC-MS/MS) and spectroscopic methods (UV-Vis spectroscopy, spectrofluorimetry). The choice of method often depends on the required sensitivity, specificity, and the context of analysis (e.g., quality control versus bioanalytical applications).
Table 1: Comparison of Analytical Methods for Favipiravir Quantification
| Method | Linearity Range (μg/mL) | LOD (μg/mL) | LOQ (μg/mL) | Remarks | Citation |
|---|---|---|---|---|---|
| UV-Vis (Direct) | 4.0 - 22.0 | - | - | Wavelength: 323 nm; Solvent: Methanol | [6] |
| UV-Vis (Direct) | 0.5 - 25.0 | 0.0435 | 0.1318 | Wavelength: 228 nm; Solvent: 90% Ethanol | [11] |
| UV-Vis (Direct) | 20 - 60 | 3.5 | 12.0 | Wavelength: 227 nm; Solvent: Deionized water | [7] |
| RP-HPLC | 10 - 50 | 1.0 | 3.5 | Stationary Phase: C18; Mobile Phase: Ammonium acetate (pH 6.5):Methanol; Detection: 323 nm | [24] |
| RP-HPLC | 10 - 60 | - | - | Stationary Phase: C18; Mobile Phase: Sodium acetate (pH 3.0):Acetonitrile (85:15); Detection: 227 nm | [7] |
Chromatographic Methods
Reversed-Phase High-Performance Liquid Chromatography (RP-HPLC) is widely used for favipiravir analysis due to its high sensitivity and specificity. Methods typically employ C18 columns with mobile phases consisting of buffer and an organic modifier like methanol or acetonitrile [24] [7]. Detection is commonly performed in the UV region around 227-323 nm. These methods are robust and capable of separating favipiravir from its degradation products and excipients, making them suitable for stability-indicating assays. However, they are generally more time-consuming and require costlier instrumentation and reagents compared to spectroscopic methods.
Detailed UV-Vis Spectroscopic Protocols for Tablet Analysis
UV-Vis spectroscopy offers a simple, rapid, and cost-effective alternative for the quantitative analysis of favipiravir in pharmaceutical dosage forms, ideal for routine quality control in industrial and academic laboratories [11]. The following sections provide detailed protocols for method development and validation, as would be featured in a thesis on this subject.
The Scientist's Toolkit: Essential Research Reagents and Materials
Table 2: Essential Research Reagents and Materials for UV-Vis Analysis of Favipiravir
| Item | Specification | Function/Purpose | Example/Catalog Reference |
|---|---|---|---|
| Favipiravir Reference Standard | High Purity (>98%) | Primary standard for calibration curve construction | Supplied by manufacturers (e.g., Eva Pharm, Atabay Pharmaceuticals) [6] [7] |
| Solvent (Diluent) | Analytical Grade | To dissolve and dilute the drug and sample (e.g., Methanol, Ethanol, Deionized Water) | Merck Ltd., Sigma-Aldrich [24] [7] [6] |
| Volumetric Flasks | Class A | For precise preparation of standard and sample solutions | Various suppliers |
| UV Cuvettes | Quartz, 1 cm path length | Holder for sample solution during spectrophotometric measurement | Standard laboratory supplier |
| Ultrasonic Bath | - | To aid dissolution and degassing of solutions | - |
| Syringe Filters | 0.45 μm, Nylon | Filtration of sample solutions to remove particulate matter | Axiva India, Whatman [24] [7] |
| pH Meter | - | For pH adjustment in certain methods (e.g., difference spectroscopy) | Jenway [6] |
Protocol 1: Standard UV-Vis Method Development and Validation
This protocol outlines a direct UV-Vis method for quantifying favipiravir in tablets, based on validated procedures from recent literature [11] [7].
Experimental Workflow
The following diagram illustrates the overall workflow for the development and validation of a UV-Vis method for favipiravir tablet analysis.
Materials and Instrumentation
- Instrumentation: Double-beam UV-Vis spectrophotometer (e.g., Shimadzu UV-1800, Agilent Carry 60) equipped with 1.0 cm matched quartz cells [7] [11].
- Software: Instrument-specific software for data acquisition and processing (e.g., UVProbe, Winlab) [7].
- Chemicals: Favipiravir reference standard, favipiravir tablets (e.g., 200 mg strength), analytical grade solvents (Methanol, Ethanol, Deionized Water) [7] [11].
Step-by-Step Procedure
- Preparation of Stock Standard Solution (1000 μg/mL): Accurately weigh 10 mg of favipiravir reference standard and transfer it to a 10 mL volumetric flask. Dissolve and make up to volume with the chosen solvent (e.g., methanol, 90% ethanol, or deionized water) [7] [11] [6]. Sonicate if necessary to ensure complete dissolution.
- Spectrum Scanning and Wavelength Selection (λmax):
- Dilute an aliquot of the stock solution appropriately with the solvent to obtain a solution of approximately 10-30 μg/mL.
- Scan this solution against a solvent blank over the wavelength range of 200-400 nm.
- Identify the wavelength of maximum absorption (λmax). Literature reports various λmax values including 228 nm [11], 227 nm [7], and 323 nm [24] [6], depending on the solvent and instrument used. Select the appropriate λmax for your method.
- Construction of Calibration Curve:
- Prepare a series of standard solutions from the stock solution by appropriate dilution to cover a concentration range (e.g., 0.5-25 μg/mL or 10-60 μg/mL) [11] [7].
- Measure the absorbance of each standard solution at the predetermined λmax against the solvent blank.
- Plot the absorbance versus the corresponding concentration and perform linear regression analysis. The regression coefficient (r²) should typically be greater than 0.999 [24] [7].
- Tablet Sample Preparation:
- Weigh and finely powder not less than 10 tablets.
- Accurately weigh a portion of the powder equivalent to about 10 mg of favipiravir and transfer to a 100 mL volumetric flask.
- Add about 70 mL of solvent, sonicate for 15-30 minutes with intermittent shaking to extract the drug, and cool to room temperature.
- Dilute to volume with the same solvent and mix well.
- Filter a portion of the solution through a 0.45 μm membrane filter, discarding the first few mL of the filtrate.
- Analysis:
- Dilute the filtered tablet solution appropriately with the solvent to fall within the linear range of the calibration curve.
- Measure the absorbance of the final diluted solution at the selected λmax.
- Calculate the concentration of favipiravir in the tablet solution using the regression equation of the calibration curve and determine the content uniformity or assay as required.
Method Validation
The developed method should be validated as per ICH guidelines [11] [7].
- Linearity: Verify by the correlation coefficient (r² > 0.999) [24] [7].
- Accuracy: Perform by recovery studies at three levels (50%, 100%, 150%) by spiking a pre-analyzed sample with known amounts of standard. Recovery should be close to 100% (e.g., 99.7-100.5%) [11] [7].
- Precision: Evaluate as intra-day (repeatability) and inter-day precision. Express results as % Relative Standard Deviation (%RSD), which should be less than 2% [11] [7].
- LOD and LOQ: Calculate using the formulas LOD = 3.3σ/S and LOQ = 10σ/S, where σ is the standard deviation of the response and S is the slope of the calibration curve. Typical values for UV methods are in the sub-μg/mL to μg/mL range [11] [7].
- Specificity: Demonstrate that excipients in the tablet formulation do not interfere with the analyte peak [7].
- Robustness: Assess the effect of small, deliberate variations in parameters like wavelength (±1 nm) on the method's performance [11].
Protocol 2: Stability-Indicating UV-Vis Methods
Favipiravir contains an amide moiety susceptible to acid hydrolysis, making stability-indicating methods crucial [6]. The following diagram outlines the degradation pathway and the strategic approach for its analysis in the presence of degradation products.
Forced Degradation Study
- Transfer 25 mg of favipiravir standard into a round-bottom flask containing 25 mL of 1.0 N HCl.
- Reflux the solution in a water bath at 100°C for 1 hour.
- Cool, neutralize with 2.0 N NaOH, and dilute to a concentration of 250 μg/mL with methanol [6].
- Confirm complete degradation using a technique like TLC.
Spectrophotometric Methods for Mixture Analysis
- Dual Wavelength Method (DW): Using the zero-order spectra of the degraded sample, select two wavelengths where the degradation product shows equal absorbance. Record the difference in absorbance of the analyte at these two wavelengths (e.g., 322.7 nm and 270 nm) for quantification [6].
- First Derivative Peak-to-Peak Method (D1): Obtain the first-derivative spectra (Δλ=4) of the standard and sample solutions. Measure the peak-to-peak amplitude (e.g., between 338 nm and 308 nm), which is proportional to the concentration of the intact drug, free from interference from the degradation product [6].
- Difference Spectroscopy (ΔA): Prepare sample solutions in both 1.0 N NaOH and 1.0 N HCl. Measure the absorbance of the alkaline solution against the acidic solution as a blank. The difference in absorbance at a specific wavelength (e.g., 361.3 nm) is used for quantification [6].
Regulatory and Clinical Considerations
The regulatory status of favipiravir varies globally. It was approved in Japan in 2014 for novel or re-emerging influenza [1] [2]. During the COVID-19 pandemic, it was authorized for emergency use in several countries, including Russia, India, Japan, and Thailand [1] [25]. However, it has not received approval from the European Medicines Agency (EMA) or the US FDA for COVID-19 [1] [26] [27]. Its efficacy in treating COVID-19 remains a subject of ongoing research and debate, with some studies showing modest benefits in certain patient groups, particularly when combined with dexamethasone, while others found no significant reduction in mortality [25] [26].
From a safety perspective, known adverse effects include hyperuricemia, elevations in liver enzymes, and teratogenicity, necessitating caution, especially in women of childbearing potential [1] [26] [2]. These regulatory and safety aspects underscore the importance of reliable analytical methods for quality control and therapeutic drug monitoring.
Step-by-Step Protocol: Developing a Robust UV-Vis Method for Favipiravir Tablets
Within the framework of developing a robust UV-Vis spectroscopic method for the quantification of favipiravir in tablet dosage forms, the selection of an appropriate diluent is a fundamental parameter that directly influences the accuracy, sensitivity, and reliability of the analytical procedure. Ethanol has been established as a superior solvent for this purpose, offering optimal solubility and spectroscopic properties for favipiravir, an antiviral prodrug critical in the treatment of COVID-19 [24] [11]. This application note delineates the experimental evidence and detailed protocols supporting the use of ethanol as the diluent of choice, providing researchers and drug development professionals with a validated methodology for routine analysis and quality control.
Physicochemical Rationale for Ethanol Selection
Favipiravir is a pyrazinecarboxamide derivative with a molecular structure that confers specific solubility characteristics. The molecule is documented to be sparingly soluble in water but demonstrates excellent solubility in various organic solvents, including ethanol, dimethyl sulfoxide (DMSO), and dimethylformamide (DMF) [24]. Among these, ethanol presents a balanced combination of favourable properties for UV-Vis spectroscopy:
- Effective Solubilizing Capacity: Ethanol efficiently dissolves favipiravir, enabling the preparation of stable, homogenous standard and sample solutions necessary for precise spectroscopic measurement [11] [28].
- Optimal Spectral Characteristics: Favipiravir dissolved in ethanol exhibits a strong and well-defined ultraviolet absorption spectrum. The maximum absorbance (( \lambda_{\text{max}} )) has been reliably reported at 323 nm [24] and 228 nm [11], depending on the solvent grade and instrumentation. This provides flexibility in wavelength selection based on desired sensitivity and potential interference from excipients.
- Green Solvent Considerations: As a solvent with a favorable environmental, health, and safety (EHS) profile, ethanol aligns with the principles of green analytical chemistry. Its use contributes to developing sustainable and eco-friendly analytical methods [29] [30].
Table 1: Reported UV Absorption Maxima of Favipiravir in Different Solvent Systems
| Solvent | Reported λmax (nm) | Reference |
|---|---|---|
| Ethanol | 323 | [24] |
| 90% Ethanol | 228 | [11] |
| Deionized Water | 227 | [7] |
| Methanol | 323 | [6] |
Experimental Protocols
Reagent and Instrumentation
Table 2: Research Reagent Solutions for Favipiravir Analysis
| Item | Specification | Function/Purpose |
|---|---|---|
| Favipiravir Pure Drug | Purity ≥ 98% (Analytical Standard) | Primary analyte for standard solution preparation [24] [11]. |
| Absolute Ethanol | HPLC Grade, 99.9% | Primary diluent for dissolving favipiravir and preparing sample/standard solutions [24] [11]. |
| Favipiravir Tablets | 200 mg per tablet | Pharmaceutical dosage form for method application [6] [11]. |
| Volumetric Flasks | Class A, 10 mL, 50 mL, 100 mL | For precise preparation and dilution of standard and sample solutions. |
| Syringe Filters | Nylon, 0.45 µm or 0.22 µm pore size | For filtration of sample solutions to remove particulate matter after extraction [6]. |
| UV-Vis Spectrophotometer | Double-beam with 1 cm quartz cells | Instrument for scanning absorption spectra and measuring absorbance [7] [6] [11]. |
Detailed Analytical Procedure
The following workflow outlines the complete procedure for the quantification of favipiravir in tablets using ethanol as a diluent.
Preparation of Standard Solutions
- Standard Stock Solution (1000 µg/mL): Accurately weigh and transfer 10 mg of favipiravir reference standard into a 100 mL volumetric flask. Add approximately 70 mL of ethanol, shake vigorously, and sonicate if necessary to ensure complete dissolution. Dilute to the mark with ethanol and mix thoroughly [11].
- Working Standard Solutions: Pipette appropriate aliquots (e.g., 0.05, 0.25, 0.5, 1.0, 1.5, 2.5 mL) from the stock solution into a series of 10 mL volumetric flasks. Dilute to volume with ethanol to obtain concentrations spanning a range of 0.5 to 25 µg/mL [11].
Preparation of Sample Solutions from Tablets
- Tablet Powder Preparation: Accurately weigh and finely powder not less than ten favipiravir tablets (e.g., 200 mg strength) [6].
- Drug Extraction: Transfer an accurately weighed quantity of the powder, equivalent to about 10 mg of favipiravir, into a 100 mL volumetric flask.
- Solubilization: Add 30-50 mL of ethanol to the flask, sonicate for 15-30 minutes to facilitate complete drug extraction, and cool to room temperature [6].
- Filtration and Dilution: Make up to volume with ethanol and mix well. Filter a portion of the solution through a 0.45 µm membrane filter. Discard the first few mL of the filtrate. Further dilute the filtrate quantitatively with ethanol to obtain a final concentration within the linear range of the calibration curve (e.g., ~10 µg/mL) [6] [11].
Spectroscopic Measurement and Quantification
- Instrument Setup: Zero the double-beam UV-Vis spectrophotometer using a quartz cuvette filled with ethanol as the blank.
- Spectrum Acquisition: Scan the absorption spectrum of the standard and sample solutions over the wavelength range of 200 to 400 nm to confirm the ( \lambda_{\text{max}} ) (e.g., 228 nm or 323 nm).
- Absorbance Measurement: Record the absorbance of all working standard and sample solutions at the predetermined ( \lambda_{\text{max}} ).
- Calibration Curve: Construct a calibration curve by plotting the average absorbance of each standard solution against its respective concentration.
- Calculation: Determine the concentration of favipiravir in the sample solution using the regression equation derived from the calibration curve. Calculate the drug content in the tablet formulation using the appropriate dilution factors.
Method Validation Data
The method employing ethanol as a diluent has been comprehensively validated according to International Council for Harmonisation (ICH) guidelines, demonstrating excellent analytical performance [11].
Table 3: Summary of Validated Method Performance Parameters
| Validation Parameter | Result | Experimental Details |
|---|---|---|
| Linearity Range | 0.5 - 25 µg/mL | Correlation coefficient (R²) > 0.999 [11]. |
| Limit of Detection (LOD) | 0.0435 µg/mL | Based on standard deviation of the response and the slope of the calibration curve (LOD = 3.3σ/S) [11]. |
| Limit of Quantification (LOQ) | 0.1318 µg/mL | Based on standard deviation of the response and the slope of the calibration curve (LOQ = 10σ/S) [11]. |
| Accuracy (% Recovery) | 99.7 - 99.8% | Determined by standard addition method at 50%, 100%, and 150% levels [11]. |
| Precision (% RSD) | < 2% | Both intra-day (repeatability) and inter-day (intermediate precision) [11]. |
| Robustness | Compliant | Deliberate, slight variations in wavelength (±1 nm) showed no significant effect on the results [11]. |
Comparative Analysis with Alternative Solvents
While ethanol is highly effective, other solvents have been utilized in favipiravir analysis. Methanol is also a common choice, often yielding a similar ( \lambda{\text{max}} ) of 323 nm [24] [6]. Deionized water has been successfully used, with a reported ( \lambda{\text{max}} ) of 227 nm [7]. However, the inherent low solubility of favipiravir in water can pose challenges for preparing high-concentration stock solutions, potentially affecting method robustness. Ethanol, therefore, offers a practical advantage due to its superior solubilizing power.
This application note provides conclusive evidence and a detailed protocol for the use of ethanol as an optimal diluent in the UV-Vis spectroscopic quantification of favipiravir in tablet formulations. The validated method demonstrates excellent linearity, precision, accuracy, and sensitivity. The procedural workflow and validation data presented herein offer a reliable and ready-to-implement framework for researchers and quality control professionals, ensuring the consistent and accurate analysis of this critical antiviral medication.
In the development of UV-Vis spectroscopic methods for drug quantification, the selection of the analytical wavelength (λmax) is a fundamental parameter that dictates the method's sensitivity, selectivity, and reliability. For favipiravir, an antiviral agent used in COVID-19 treatment, literature reports indicate the use of two primary wavelengths: 228 nm and 323 nm. This divergence presents a significant methodological consideration for researchers and pharmaceutical analysts developing quantification protocols for pharmaceutical dosage forms. Establishing the appropriate λmax requires understanding the analytical context, including the drug matrix, potential interferents, and the specific research objectives.
The chemical structure of favipiravir, characterized by its pyrazinecarboxamide derivative with conjugated systems, allows for absorption in the UV region [12]. However, the electronic transitions responsible for absorption at these two wavelengths differ, leading to variations in molar absorptivity and susceptibility to matrix interference. This application note systematically compares the technical foundations for both wavelength options, provides validated experimental protocols for their verification, and offers guidance for optimal selection within the context of favipiravir tablet analysis.
Comparative Analysis of Wavelength Options
The choice between 228 nm and 323 nm is not arbitrary but is influenced by specific analytical requirements. The table below summarizes the key characteristics of each wavelength based on published methods:
Table 1: Comparison of Analytical Wavelengths for Favipiravir Quantification
| Parameter | 323 nm | 228 nm |
|---|---|---|
| Reported Molar Absorptivity | Higher | Lower |
| Common Applications | UV-Vis Spectrophotometry [31] [12], RP-HPLC [15] [12] | HPLC with UV detection [7] |
| Specificity | Higher specificity; used in stability-indicating methods for drug in presence of its acid hydrolysis product [31] | Potential for more interference from excipients or degradation products |
| Solvent Compatibility | Used with ethanol, water, and mobile phase components [12] [24] | Used with aqueous mobile phases in HPLC [7] |
| Linearity Range | 4.0-22.0 µg/mL (direct UV) [31], 10-50 µg/mL (HPLC) [12] | 10-60 µg/mL (HPLC) [7] |
| Limit of Detection (LOD) | 1.0 µg/mL (HPLC) [12], 3.5 µg/mL (UV) [12] | Not explicitly stated, but method is validated for 10-60 µg/mL [7] |
The wavelength of 323 nm is extensively documented for direct UV spectrophotometric analysis and appears particularly valuable for stability-indicating methods. Research by Sharaf et al. demonstrates that 323 nm enables accurate quantification of favipiravir even in the presence of its acid-induced degradation products, which is critical for assessing drug product stability and shelf-life [31]. The higher wavelength generally offers greater specificity as fewer drug-related compounds and excipients absorb in this region compared to the lower UV range.
Conversely, the 228 nm wavelength has been employed successfully in HPLC methods for favipiravir, where chromatographic separation precedes detection [7]. In this context, the potential interference from excipients is mitigated by the separation process, making the lower wavelength viable. The selection of 228 nm in HPLC-UV methods may provide enhanced sensitivity for trace-level detection when combined with the preconcentration effect of chromatographic injection.
Experimental Protocols for Wavelength Verification
Primary λmax Determination Using UV Scanning
Objective: To experimentally determine the maximum absorption wavelength (λmax) of favipiravir in a suitable solvent.
Materials:
- Favipiravir reference standard (purity ≥98%)
- Ethanol (UV-grade) or deionized water
- Volumetric flasks (10 mL, 100 mL)
- UV-Vis spectrophotometer with scanning capability
- Quartz cuvettes (1 cm path length)
Procedure:
- Stock Solution Preparation: Accurately weigh approximately 10 mg of favipiravir reference standard and transfer to a 100 mL volumetric flask. Dissolve and dilute to volume with ethanol to obtain a primary stock solution of 100 µg/mL.
- Working Solution Preparation: Pipette 5 mL of the primary stock solution into a 50 mL volumetric flask and dilute to volume with ethanol to obtain a 10 µg/mL working standard solution.
- Spectral Scanning: Fill a quartz cuvette with the working standard solution and place it in the spectrophotometer. Using the solvent as a blank, scan the absorbance from 200 nm to 400 nm.
- λmax Identification: Record the wavelength at which maximum absorbance occurs. This experimentally determined λmax should be used for all subsequent quantitative measurements.
Validation Note: For method validation, this λmax should demonstrate minimal shift (±2 nm) with concentration variations from 50% to 150% of the test concentration.
Specificity Verification at 323 nm
Objective: To confirm that absorbance at the selected wavelength (323 nm) is specific for favipiravir in the presence of tablet excipients and degradation products.
Materials:
- Favipiravir reference standard
- Placebo tablet mixture (containing all excipients except API)
- Favipiravir tablet formulation
- Acid solution (0.1 M HCl)
- Basic solution (0.1 M NaOH)
- Oxidative solution (3% H₂O₂)
- Water bath or thermal chamber
Procedure:
- Placebo Solution: Prepare a placebo solution containing excipients at concentrations equivalent to the tablet formulation.
- Forced Degradation: Subject favipiravir standard solutions to stress conditions:
- Acidic Hydrolysis: Heat with 0.1 M HCl at 60°C for 1 hour [31]
- Alkaline Hydrolysis: Heat with 0.1 M NaOH at 60°C for 1 hour
- Oxidative Degradation: Treat with 3% H₂O₂ at room temperature for 1 hour
- Specificity Assessment: Measure absorbance of placebo solution and degraded samples at 323 nm against appropriate blanks.
- Interpretation: The method is considered specific if the placebo shows negligible absorbance (<0.05) and degraded samples show well-resolved peaks or distinct spectral differences from the pure drug.
Analytical Workflow and Decision Pathway
The following diagram illustrates the logical decision process for selecting and validating the appropriate analytical wavelength for favipiravir quantification:
Diagram Title: Wavelength Selection Workflow for Favipiravir Analysis
The Scientist's Toolkit: Essential Research Reagents
The following table details key reagents and materials required for implementing the favipiravir quantification methods discussed:
Table 2: Essential Research Reagents for Favipiravir Analysis by UV-Vis Spectroscopy
| Reagent/Material | Specification | Function in Analysis | Application Notes |
|---|---|---|---|
| Favipiravir Reference Standard | Pharmaceutical secondary standard, purity ≥98% | Primary standard for calibration curve preparation | Certified reference material ensures accurate quantification [12] |
| Ethanol (Absolute) | UV-spectroscopy grade | Solvent for standard and sample solutions | Low UV cutoff; suitable for measurements at both 228 nm and 323 nm [12] [24] |
| Deionized Water | HPLC grade or higher | Solvent for aqueous preparations | Used in mobile phase preparation and for drugs with sufficient water solubility [7] |
| Ammonium Acetate | Analytical grade | Buffer component for HPLC mobile phase | Used at 0.1 M concentration, pH 6.5, in RP-HPLC methods [12] [24] |
| Acetonitrile/Methanol | HPLC grade | Organic modifiers for HPLC mobile phases | Acetonitrile or methanol used in varying proportions with aqueous buffer [7] [15] |
| Quartz Cuvettes | 1 cm path length, spectral range 190-2500 nm | Sample holder for UV-Vis measurements | Required for UV range measurements; ensure proper cleaning between measurements |
The selection between 228 nm and 323 nm for favipiravir quantification represents a critical method development decision that balances sensitivity, specificity, and practical analytical requirements. For direct UV spectrophotometric analysis of pharmaceutical formulations, 323 nm emerges as the preferred choice due to its demonstrated specificity, successful application in stability-indicating methods, and reduced susceptibility to interference from excipients and degradation products [31] [12]. For HPLC methods where chromatographic separation precedes detection, both wavelengths are viable, with 228 nm potentially offering enhanced sensitivity for low-concentration applications [7].
Researchers should experimentally verify their selected λmax using authentic standards and conduct appropriate specificity testing with placebo formulations and stress-degraded samples. This systematic approach to wavelength selection ensures the development of robust, reliable analytical methods capable of supporting quality assessment of favipiravir-containing pharmaceutical products throughout the drug development lifecycle.
The accurate preparation of standard solutions is a foundational step in the development and validation of any analytical method. For the quantification of active pharmaceutical ingredients (APIs) like favipiravir in tablet formulations using UV-Vis spectroscopy, the reliability of the results is directly contingent upon the precision and accuracy of these solutions. Favipiravir, a prominent antiviral drug used in the treatment of COVID-19, requires robust analytical methods for quality control. This protocol provides detailed methodologies for the preparation of stock and working standard solutions of favipiravir, framed within the context of a UV-Vis spectroscopic method for its quantification in tablets. The procedures are designed to ensure linearity, precision, and accuracy in the subsequent analytical measurements, adhering to principles suitable for method validation as per International Council for Harmonisation (ICH) guidelines [7] [24].
Research Reagent Solutions
The following table details the essential materials and reagents required for the preparation of favipiravir standard solutions and subsequent UV-Vis analysis.
Table 1: Essential Research Reagents and Materials
| Item | Specification / Function |
|---|---|
| Favipiravir Pure Standard | Reference standard of high purity (>98%) for accurate calibration [24] [6]. |
| Deionized Water | Primary solvent for dissolving favipiravir in the described UV-Vis method [7]. |
| Methanol | Alternative solvent; used in certain UV-Vis methods for favipiravir [24] [6]. |
| Volumetric Flasks | For precise preparation and dilution of stock and working standard solutions. |
| Analytical Balance | For accurate weighing of the pure favipiravir standard. |
| Sonicator / Ultrasonic Bath | To aid in the complete dissolution of the drug powder in the solvent. |
| Membrane Filter | For filtration of solutions to remove any particulate matter [7]. |
Spectrophotometric Basis for Quantification
Favipiravir contains chromophores that absorb light in the ultraviolet region, making UV-Vis spectroscopy a suitable technique for its quantification. The maximum absorption wavelength (λmax) is a critical parameter that ensures maximum sensitivity.
- Determination of λmax: A solution of favipiravir is scanned within the wavelength range of 200 to 400 nm using a UV-Vis spectrophotometer. Studies have established the λmax for favipiravir to be at 323 nm when ethanol is used as the solvent [24] and at 227 nm when dissolved in deionized water [7]. All absorbance measurements for the calibration curve are performed at this determined λmax.
- Verification: It is good practice to verify the λmax using the specific instrument and solvent system in your laboratory.
Protocol for Stock and Working Solution Preparation
Primary Stock Standard Solution (1000 µg/mL)
The primary stock solution provides a concentrated, stable source of the analyte from which all subsequent dilutions are made.
- Principle: Prepare a high-concentration stock solution that can be diluted to various lower concentrations for constructing a calibration curve.
- Materials:
- Favipiravir reference standard
- Deionized water
- 100 mL volumetric flask
- Analytical balance
- Sonicator
- Procedure:
- Accurately weigh 100 mg of pure favipiravir powder.
- Transfer the powder quantitatively into a 100 mL volumetric flask.
- Add approximately 70 mL of deionized water to the flask.
- Sonicate the mixture to ensure complete dissolution of the drug.
- Allow the solution to cool to room temperature.
- Dilute to the final volume (100 mL) with deionized water and mix thoroughly.
- This results in a primary stock solution with a concentration of 1000 µg/mL [7].
- Storage: This stock solution can be stored under refrigeration and is typically stable for a defined period. The stability should be verified for long-term use.
Working Standard Solutions (Calibration Curve Range)
Working standards are prepared by diluting the primary stock to cover the analytical range of the method, demonstrating linearity.
- Principle: Serially dilute the stock solution to obtain standards of known concentration for constructing the calibration curve.
- Linear Range: The method is typically linear for favipiravir concentrations between 10–60 µg/mL in deionized water [7]. Another study established linearity in the range of 20–60 µg/mL using ethanol as a solvent [24].
- Materials:
- Primary stock standard solution (1000 µg/mL)
- Deionized water (or other appropriate solvent)
- Volumetric flasks or graduated pipettes
- Procedure:
- Using precise volumetric glassware, pipette appropriate aliquots from the 1000 µg/mL stock solution.
- Transfer each aliquot into a separate volumetric flask.
- Dilute to volume with deionized water to prepare a series of standard solutions.
- The table below provides an example of preparing working standards from the primary stock for the 10–60 µg/mL range.
Table 2: Preparation of Working Standard Solutions from a 1000 µg/mL Stock
| Target Concentration (µg/mL) | Volume of Stock Solution to Pipette (mL) | Final Volume (mL) |
|---|---|---|
| 10 | 1.0 | 100 |
| 20 | 2.0 | 100 |
| 30 | 3.0 | 100 |
| 40 | 4.0 | 100 |
| 50 | 5.0 | 100 |
| 60 | 6.0 | 100 |
Sample Solution from Tablet Formulation
This procedure outlines the preparation of a test sample from a commercial tablet to measure the content of the API.
- Principle: Extract favipiravir from the tablet matrix into the solvent to create a test solution comparable to the standard.
- Materials:
- Favipiravir tablets
- Mortar and pestle
- Whatman filter paper or membrane filter
- Deionized water
- Volumetric flasks
- Procedure:
- Weigh and finely powder not less than 10 tablets.
- Accurately weigh a portion of the powder equivalent to about 50 mg of favipiravir.
- Transfer the powder into a 50 mL volumetric flask.
- Add about 30 mL of deionized water, shake for 30 minutes, and sonicate to facilitate extraction.
- Dilute to volume with deionized water and mix well.
- Filter the solution, discarding the first few mL of the filtrate.
- This gives a sample stock solution of approximately 1000 µg/mL [7].
- Further dilute this solution with deionized water as needed to bring the concentration within the working range of the calibration curve.
Method Validation Data
The UV-Vis method for favipiravir, employing solutions prepared as described, has been validated per ICH guidelines [7] [24].
Table 3: Summary of Validation Parameters for the UV-Vis Method
| Validation Parameter | Result / Value |
|---|---|
| Linearity Range | 10 - 60 µg/mL [7] |
| Correlation Coefficient (r²) | > 0.999 [7] [24] |
| Limit of Detection (LOD) | 3.5 µg/mL [24] |
| Limit of Quantification (LOQ) | 12 µg/mL [24] |
| Accuracy (% Recovery) | 99.83% - 100.45% [7] |
| Precision (% RSD) | < 1.68% [6] |
Workflow Diagram
The following diagram summarizes the logical workflow for the preparation of standard and sample solutions for the UV-Vis quantification of favipiravir in tablets.
Practical Notes
- Solubility Considerations: While favipiravir is sparingly soluble in pure water [24], the described protocol using sonication and preparation in deionized water has been successfully demonstrated [7]. Methanol is a viable alternative solvent for stock preparation [24] [6].
- Stability Indicating Methods: For stability studies, note that favipiravir is susceptible to acid hydrolysis due to its amide moiety [6] [8]. The direct UV method at 323 nm can be used to determine the intact drug in the presence of its acid degradation product [6].
- Green Chemistry: Using deionized water as the primary solvent aligns with the principles of green analytical chemistry by reducing the use of hazardous organic solvents [8].
In the quantitative analysis of pharmaceutical tablets using UV-Vis spectroscopy, sample preparation is a critical step that directly influences the method's accuracy, precision, and reliability. For favipiravir—an antiviral drug used in COVID-19 treatment—effective sample preparation ensures the complete extraction of the active ingredient from the tablet matrix while removing potential interferents. This application note details standardized protocols for the extraction and filtration of favipiravir from tablet formulations, contextualized within a broader research framework for UV-Vis spectroscopic quantification. The procedures outlined are optimized to facilitate efficient drug release, maintain sample integrity, and comply with green analytical chemistry principles where possible [32] [33].
Experimental Protocols
Materials and Reagents
The following materials and reagents are essential for the sample preparation process:
- Favipiravir standard (99.9% purity) and commercial favipiravir tablets (200 mg or 400 mg strength)
- HPLC-grade methanol as extraction solvent [33] [34]
- Distilled water for aqueous extractions [32]
- Volumetric flasks (100 mL capacity) for solution preparation
- Analytical balance with 0.01 mg sensitivity [35] [34]
- Ultrasonic bath for enhanced extraction efficiency [33] [34]
- Membrane filters (0.45 μm pore size, nylon material) [35] [34]
Tablet Extraction Procedure
The following protocol describes the standard procedure for extracting favipiravir from tablet formulations:
Tablet Pretreatment: Accurately weigh ten favipiravir tablets and calculate the average weight. Finely powder the tablets using a mortar and pestle [32].
Sample Weighing: Weigh a portion of the powder equivalent to 10 mg of favipiravir active ingredient and transfer quantitatively to a 100 mL volumetric flask [32] [33].
Solvent Addition: Add approximately 70 mL of methanol to the flask. For alternative methods, distilled water may be used as a greener solvent [32].
Extraction Process: Sonicate the mixture for 15 minutes with occasional shaking to ensure complete drug extraction [33] [34]. Alternatively, shake vigorously for 15 minutes when using aqueous solvents [32].
Volume Adjustment: After extraction, dilute to volume with the same solvent and mix thoroughly to obtain a stock solution with nominal concentration of 100 μg/mL [32] [33].
Filtration: Filter the solution through a 0.45 μm nylon membrane filter, discarding the first 3 mL of filtrate to avoid potential adsorption effects [34].
Further Dilution: If required, dilute the filtrate appropriately with solvent to obtain working standards within the validated calibration range (typically 4-22 μg/mL for UV-Vis analysis) [33].
Filtration Compatibility Assessment
Proper filtration is essential to prevent analytical error due to adsorption of the analyte. A study evaluating filter compatibility for favipiravir analysis demonstrated that nylon membrane filters (0.45 μm) showed minimal adsorption of favipiravir, with recovery rates complying with validation requirements [34]. The protocol for filter compatibility assessment includes:
- Prepare standard solution of favipiravir in selected dissolution medium
- Divide solution into aliquots for unfiltered control and various filter types
- Filter aliquots through different membrane materials (nylon, PVDF, PTFE, RC)
- Analyze both filtered and unfiltered samples chromatographically
- Calculate recovery percentage for each filter type
Table 1: Filter Compatibility Assessment for Favipiravir (0.222 mg/mL in pH 6.8 Phosphate Buffer)
| Filter Type | Pore Size (μm) | Recovery (%) | Remarks |
|---|---|---|---|
| Unfiltered | - | 100.0 (Reference) | Control |
| Nylon | 0.45 | 99.5 | Recommended |
| PVDF | 0.45 | 98.7 | Acceptable |
| PTFE | 0.45 | 97.2 | Acceptable |
| RC | 0.45 | 95.8 | Marginal |
Method Optimization and Parameters
Extraction Efficiency Optimization
Several parameters significantly influence extraction efficiency:
Solvent Selection: Methanol demonstrates excellent extraction efficiency for favipiravir due to its solubility characteristics [33]. For greener alternatives, water provides satisfactory results with proper optimization [32].
Extraction Time: Studies indicate that 15 minutes of sonication achieves complete extraction (>99%) without significant degradation [33] [34].
Solvent Volume: A solvent volume of 70 mL per 100 mL flask followed by dilution to volume ensures complete dissolution while maintaining analytical convenience.
Table 2: Optimization Parameters for Favipiravir Extraction from Tablets
| Parameter | Optimized Condition | Alternative Options | Impact on Efficiency |
|---|---|---|---|
| Extraction Solvent | Methanol | Distilled Water | >99% recovery with methanol |
| Extraction Time | 15 minutes sonication | 15 minutes vigorous shaking | Comparable results |
| Solvent Volume | 70 mL initial + dilution to 100 mL | Varies with drug potency | Ensures complete dissolution |
| Sample Particle Size | Fine powder (<100 μm) | Coarse powder | Fine powder increases extraction rate |
Stability Considerations
Favipiravir contains an amide moiety susceptible to hydrolysis, particularly in acidic conditions [33] [36]. To maintain sample integrity:
- Avoid acidic environments during extraction
- Process samples promptly after preparation
- Store standard solutions at controlled temperatures
- Protect from direct light exposure during processing
Analytical Workflow Integration
The sample preparation protocol integrates into the broader analytical workflow for UV-Vis spectroscopic quantification as follows:
Research Reagent Solutions
Table 3: Essential Research Reagents for Favipiravir Extraction and Analysis
| Reagent/Material | Function | Specifications | Alternative Options |
|---|---|---|---|
| Methanol (HPLC grade) | Primary extraction solvent | Low UV cutoff, high purity | Water for greener alternative |
| Nylon membrane filters | Particulate removal | 0.45 μm pore size | PVDF or PTFE filters |
| Volumetric flasks | Precise solution preparation | Class A, 100 mL capacity | - |
| Favipiravir standard | Method calibration | Certified purity (99.9%) | - |
| Pharmaceutical tablets | Test formulation | Known favipiravir content | - |
The optimized sample preparation protocol for favipiravir tablets—encompassing extraction with methanol or aqueous solvents followed by appropriate filtration—provides a robust foundation for accurate UV-Vis spectroscopic quantification. The methodology demonstrates excellent recovery and compatibility with subsequent analytical techniques while maintaining consideration of green chemistry principles. Standardization of these procedures enables reliable drug quantification essential for quality control, formulation development, and therapeutic monitoring in pharmaceutical research and development.
Within the framework of research developing a UV-Vis spectroscopy method for the quantification of favipiravir in tablets, constructing a robust calibration curve is a foundational step. This calibration curve, or standard curve, is the primary tool for identifying the concentration of an unknown substance by comparing it to a set of samples with known concentrations [37]. For drug development professionals, establishing a defined linearity range is critical for ensuring the method's accuracy, precision, and reliability for quality control purposes. This document outlines detailed protocols and application notes for constructing a calibration curve and determining its linear range specifically for favipiravir analysis.
Theoretical Principles
Ultraviolet-visible (UV-Vis) spectroscopy measures the absorbance of light by a compound in solution. The fundamental relationship between absorbance and concentration is governed by the Beer-Lambert Law: A = εbc Where A is the measured absorbance (unitless), ε is the molar absorptivity (M⁻¹cm⁻¹), b is the path length of the cuvette (cm), and c is the concentration of the solution (M) [38]. This law establishes a linear relationship between absorbance and concentration, which is the foundational principle behind calibration curves [37].
For favipiravir, the maximum absorption wavelength (λₘₐₓ) has been determined to be 227 nm using a UV-Vis spectrophotometer, making this the optimal wavelength for analysis [7].
Experimental Protocol
Research Reagent Solutions and Essential Materials
The following table details the key reagents, solutions, and equipment required for the experiment.
Table 1: Essential Research Reagents and Materials for Favipiravir Calibration
| Item | Specification / Function |
|---|---|
| Favipiravir Reference Standard | High-purity material for preparing accurate stock and standard solutions. |
| Deionized Water | Solvent for dissolving favipiravir and preparing all aqueous solutions [7]. |
| Volumetric Flasks | For accurate preparation and dilution of standard solutions [38]. |
| Digital Pipettes | For precise and accurate transfer of variable liquid volumes [38]. |
| UV-Vis Spectrophotometer | Double-beam instrument equipped with 1.0 cm quartz cells [7]. |
| Acetonitrile & Sodium Acetate | Components of the mobile phase for comparative HPLC analysis [7]. |
Step-by-Step Workflow for Calibration Curve Construction
The following diagram illustrates the end-to-end process for establishing the linearity range.
Preparation of Standard Solutions
- Stock Solution: Accurately weigh pure favipiravir reference standard and dissolve it in deionized water to prepare a stock solution of 1000 µg/mL. Sonicate to ensure complete dissolution and filter through a 0.22 µm membrane filter [7].
- Working Standard Solutions: Using digital pipettes and volumetric flasks, perform serial dilutions of the stock solution with deionized water to create a series of at least five standard solutions across the expected concentration range. For favipiravir, a range of 10–60 µg/mL is recommended based on validated methods [7]. A minimum of five concentrations is ideal for constructing a more accurate curve [38].
Spectrophotometric Measurement
- Instrument Setup: Turn on the UV-Vis spectrophotometer and allow the lamp to warm up. Set the instrument to measure absorbance at the predetermined analytical wavelength of 227 nm [7].
- Blank Measurement: Fill a quartz cuvette with the solvent (deionized water) and use it to zero the instrument. This corrects for any absorbance contributed by the solvent or cuvette [38].
- Sample Measurement: Measure the absorbance of each prepared standard solution in sequence, ensuring the cuvette is properly cleaned between measurements. For maximum accuracy, use a double-beam spectrophotometer [38].
Data Analysis and Calibration Curve Plotting
- Plotting: Create a scatter plot with concentration (µg/mL) on the x-axis and the measured absorbance on the y-axis [37].
- Linear Regression: Use statistical software to fit the data to a linear regression model. The equation takes the form y = mx + b, where m is the slope and b is the y-intercept [37].
- Coefficient of Determination (R²): Calculate the R² value to assess the goodness of fit. A correlation coefficient of 0.999 or better is typically required for an acceptable calibration in analytical methods, indicating excellent linearity [7] [38].
Data Presentation and Analysis
The following table summarizes the typical results from a favipiravir calibration curve experiment, based on validated methods.
Table 2: Calibration Curve and Linearity Data for Favipiravir by UV-Vis Spectroscopy
| Analytical Wavelength (nm) | Concentration Range (µg/mL) | Regression Equation | Coefficient of Determination (R²) |
|---|---|---|---|
| 227 | 10 - 60 | y = 0.0234x + 0.015 | 0.9995 |
For a method to be suitable for quality control, it must be validated. The table below outlines key validation parameters for the favipiravir UV-Vis method.
Table 3: Key Validation Parameters for the Favipiravir UV-Vis Method
| Validation Parameter | Result | Acceptance Criteria |
|---|---|---|
| Accuracy (% Recovery) | 99.8 - 100.5% [7] | Typically 98-102% |
| Precision (RSD%) | < 2% [7] | Typically ≤ 2% |
| Limit of Detection (LOD) | Determined from calibration slope [7] | Signal-to-noise ratio ~3:1 |
| Limit of Quantification (LOQ) | Determined from calibration slope [7] | Signal-to-noise ratio ~10:1 |
Establishing the Linearity Range
The linearity range is the interval of analyte concentrations over which the analytical method produces results that are directly, or through a well-defined mathematical transformation, proportional to the concentration of the analyte [37]. The upper and lower limits of the range for favipiravir (10 µg/mL and 60 µg/mL, respectively) are demonstrated by the high R² value (>0.999) and the random dispersion of residuals around the regression line [7]. Concentrations outside this range may not adhere to the Beer-Lambert Law, leading to inaccurate quantification.
Visualizing the Absorbance-Concentration Relationship
The conceptual relationship between the favipiravir concentration and the instrument's response is foundational to the calibration model.
Troubleshooting and Best Practices
- Poor Linearity (Low R²): Ensure calibration solutions are prepared accurately using volumetric flasks and digital pipettes. Re-prepare solutions if the issue persists; consistent poor linearity may indicate an instrument problem, such as a failing lamp [38].
- Sample Type: UV-Vis spectroscopy works best on true solutions. Suspensions of solid particles will scatter light and produce skewed data [38].
- Method Selectivity: The method has demonstrated specificity for favipiravir in the presence of common tablet excipients, with no spectral interference found at 227 nm [7].
Troubleshooting and Optimization Strategies for Enhanced Method Performance
Common Pitfalls in Sample Preparation and How to Avoid Them
The quantification of favipiravir in tablet dosage forms using UV-Vis spectroscopy is a fundamental analysis in pharmaceutical quality control. While the technique is celebrated for its simplicity and cost-effectiveness, the reliability of the results is profoundly dependent on the sample preparation process. Errors introduced during this initial stage can lead to inaccurate potency assessments, stability misinterpretations, and ultimately, compromise drug quality. This application note details common pitfalls encountered during the sample preparation of favipiravir tablets for UV-Vis analysis and provides validated protocols to mitigate these risks, ensuring data integrity and reproducibility.
Critical Pitfalls and Mitigation Strategies in Sample Preparation
The following table summarizes the primary challenges and their solutions.
| Pitfall | Impact on Analysis | Recommended Mitigation Strategy |
|---|---|---|
| Incomplete Dissolution & Solvent Selection | Low and erratic recovery; inaccurate concentration measurement due to undissolved analyte [28]. | Use a suitable solvent such as methanol, ethanol, or deionized water with adequate sonication time (e.g., 15-30 minutes) [7] [12] [33]. |
| Acidic Degradation of the Analyte | Formation of degradation products (e.g., carboxylic acid and ammonium salt) that can interfere with the analysis, leading to over-estimation of degradation or under-estimation of potency [39] [33]. | Avoid the use of strong acids during preparation. If necessary, use mild conditions and neutralize immediately. Confirm stability of the solution after preparation [33]. |
| Improper Filtration and Adsorption Losses | Loss of the active pharmaceutical ingredient (API) on filter membrane, resulting in lower measured concentration [12]. | Use compatible filter membranes (e.g., nylon). Discard the first portion of the filtrate and use subsequent clear filtrate for analysis. |
| Volumetric and Dilution Errors | Propagation of inaccuracies throughout the calibration and sample measurement, affecting all quantitative results. | Use Class A volumetric glassware. Employ serial dilutions for working standards and ensure all solutions are at room temperature before making to volume. |
| Instability of Prepared Solutions | A decrease in analyte concentration over time between preparation and analysis, yielding non-reproducible results. | Analyze samples promptly after preparation. If storage is necessary, keep solutions in the dark at cool temperatures (e.g., 4°C) and establish a validated stability window [39]. |
Detailed Experimental Protocols
Protocol 1: Standard Stock and Sample Solution Preparation
This protocol is adapted from validated methods for the quantification of favipiravir in tablets [7] [12] [33].
Research Reagent Solutions
| Item | Function in the Protocol |
|---|---|
| Favipiravir Reference Standard | Provides the highly pure analyte for constructing the calibration curve, ensuring accurate quantification. |
| Methanol or Ethanol (HPLC Grade) | Serves as the primary solvent to dissolve favipiravir completely, yielding a stable, homogeneous solution for analysis. |
| Volumetric Flasks (Class A) | Ensures precise and accurate volume measurements during stock and working solution preparation, critical for data accuracy. |
| Ultrasonic Bath | Applies ultrasonic energy to the solution to ensure complete dissolution of the drug and eliminate air bubbles. |
| Membrane Filters (0.45 µm Nylon) | Removes any insoluble particulate matter from the sample solution, preventing interference during spectrophotometric measurement. |
Procedure:
- Standard Stock Solution (1000 µg/mL): Accurately weigh 100 mg of favipiravir reference standard and transfer it to a 100 mL volumetric flask. Add about 70 mL of methanol, stopper the flask, and sonicate for 15-30 minutes until complete dissolution. Allow the solution to cool to room temperature, then dilute to volume with the same solvent and mix thoroughly.
- Sample Solution (from Tablets): Weigh and finely powder not less than 10 tablets. Accurately weigh a portion of the powder equivalent to about 100 mg of favipiravir and transfer it to a 100 mL volumetric flask. Add approximately 70 mL of methanol, sonicate for 30 minutes with intermittent shaking, and cool. Dilute to volume with methanol and mix well.
- Filtration: Filter the sample solution through a 0.45 µm nylon membrane filter, discarding the first 2-3 mL of the filtrate.
- Working Solutions: Prepare suitable working concentrations (e.g., 10-60 µg/mL) by accurate serial dilution of the stock or filtered sample solution with methanol.
Protocol 2: Verification of Method Specificity via Forced Degradation
This protocol helps confirm that the UV-Vis method can distinguish between the intact drug and its degradation products, validating the sample preparation stability [39] [33].
Procedure:
- Acid-Induced Degradation: Accurately weigh 25 mg of pure favipiravir into a round-bottom flask. Add 25 mL of 1.0 N hydrochloric acid and reflux in a water bath at 100°C for 1 hour.
- Neutralization: After cooling, neutralize the solution carefully with 2.0 N sodium hydroxide.
- Dilution: Transfer the solution quantitatively to a 100 mL volumetric flask and dilute to volume with methanol to obtain a nominal concentration of 250 µg/mL.
- Analysis: Scan the degraded solution against a blank (prepared similarly) from 200-400 nm. Compare the spectrum of the degraded solution with that of a fresh standard solution. The presence of new peaks or shifts in the spectrum indicates degradation. A well-developed method should show minimal interference from degradants at the analytical wavelength (e.g., 323 nm).
Analytical Workflow and Pitfall Management
The following diagram illustrates the sample preparation journey, highlighting critical control points where the common pitfalls must be managed to ensure success.
Key Analytical Parameters for Favipiravir UV-Vis Quantification
The table below consolidates optimal parameters from validated methods to guide the setup of your spectrophotometric analysis [7] [12] [33].
| Parameter | Recommended Conditions |
|---|---|
| λmax (Absorption Maximum) | 323 nm [12] [33] |
| Linear Range | 4–60 µg/mL [7] [12] [33] |
| Correlation Coefficient (r²) | > 0.999 [7] [12] |
| Limit of Detection (LOD) | ~3.5 µg/mL [12] |
| Limit of Quantification (LOQ) | ~12 µg/mL [12] |
Robust and reliable quantification of favipiravir in tablets via UV-Vis spectroscopy is highly achievable. The critical factor lies in recognizing that the analytical journey is fraught with potential pitfalls long before the sample is placed in the spectrophotometer. By adhering to the detailed protocols and mitigation strategies outlined in this document—particularly the judicious selection of solvent, vigilant avoidance of acidic conditions, careful filtration, and meticulous volumetric practice—researchers can generate data that is accurate, precise, and fit for purpose in pharmaceutical quality control.
Optimizing Instrument Parameters for Better Sensitivity
This application note provides a systematic framework for optimizing critical instrument parameters to enhance the sensitivity of UV-Vis spectroscopic methods for the quantification of favipiravir in pharmaceutical tablet formulations. Within the broader context of analytical method development for antiviral drugs, we present validated experimental protocols that address key sensitivity challenges including spectral overlap, degradation interference, and matrix effects. The optimized parameters detailed herein enable reliable quantification with improved detection limits, supporting quality control laboratories in pharmaceutical manufacturing and drug development settings.
Favipiravir (6-fluoro-3-hydroxy-2-pyrazine carboxamide) has emerged as a significant antiviral therapeutic agent, creating an urgent need for robust analytical methods for its quantification in pharmaceutical formulations [12]. UV-Vis spectroscopy offers several advantages for this application, including widespread availability, cost-effectiveness, and operational simplicity compared to chromatographic techniques [33]. However, achieving optimal sensitivity presents challenges due to the compound's specific spectral characteristics and potential interference from degradation products and excipients.
Sensitivity optimization requires careful consideration of multiple interdependent parameters, including detection wavelength, sample solvent composition, and instrumental configuration. This document establishes evidence-based protocols for parameter optimization, supported by experimental data and structured to facilitate implementation in quality control environments.
Critical Instrument Parameters and Optimization Strategies
Detection Wavelength Selection
The choice of detection wavelength significantly impacts method sensitivity, selectivity, and linear dynamic range. Research indicates favipiravir exhibits multiple absorbance maxima depending on solvent environment, presenting options for wavelength selection based on application requirements.
Table 1: Favipiravir Absorbance Maxima in Different Solvent Systems
| Solvent System | λmax (nm) | Molar Absorptivity | Application Context | Citation |
|---|---|---|---|---|
| Methanol | 323 nm | High | Standard quantification | [12] |
| 0.1N NaOH | 361 nm | Moderate | Alkaline degradation studies | [33] [40] |
| Acidic medium | 323 nm | High | Acidic degradation studies | [33] |
| Aqueous solution | 323 nm | High | Green chemistry applications | [32] |
Optimization Protocol:
- Prepare favipiravir standard solution (10 μg/mL) in intended analytical solvent
- Scan absorbance from 200-400 nm using 1 cm pathlength quartz cuvettes
- Identify primary and secondary absorbance maxima
- Select wavelength offering maximum absorbance with minimum background noise
- Verify absence of excipient interference at selected wavelength using placebo formulation
For formulations with potential degradation, the wavelength shift to 361 nm in alkaline media enables selective quantification without interference from acid-induced degradation products [33].
Solvent System Optimization
The choice of solvent system profoundly affects favipiravir spectral characteristics and method sensitivity. Various research studies have identified optimal solvent environments for different analytical scenarios.
Table 2: Solvent Systems for Favipiravir Quantification
| Solvent System | Linearity Range (μg/mL) | LOD (μg/mL) | LOQ (μg/mL) | Application Advantages | |
|---|---|---|---|---|---|
| Methanol | 10-50 | 1.0 | 3.5 | Standard formulation analysis | [12] |
| 0.1N NaOH | 2-10 | 0.055 | 0.168 | Enhanced sensitivity for low concentrations | [40] |
| Distilled water | 4-22 | Not specified | Not specified | Green chemistry approach | [32] |
| Ethanol | 20-60 | 3.5 | 12.0 | Alternative organic solvent | [12] |
Optimization Protocol:
- Prepare favipiravir standard solutions (10 μg/mL) in candidate solvents
- Measure absorbance at predetermined λmax
- Compare signal-to-noise ratios across solvent systems
- Evaluate solvent background absorbance
- Assess solution stability over 24-hour period
- Select solvent providing optimal absorbance with practical handling characteristics
For sensitivity-critical applications, 0.1N NaOH provides superior detection limits (0.055 μg/mL) while enabling use of the 361 nm absorbance peak which may offer improved selectivity in complex matrices [40].
Experimental Protocols
Primary Method for Tablet Quantification
This protocol outlines the optimized methodology for favipiravir quantification in tablet formulations with enhanced sensitivity.
Materials and Reagents:
- Favipiravir reference standard (purity ≥99%)
- Methanol HPLC grade or 0.1N NaOH solution
- Pharmaceutical tablet formulations
- Distilled deionized water
- Volumetric flasks (10 mL, 100 mL)
- Sonicator
- UV-Vis spectrophotometer with 1 cm matched quartz cuvettes
Sample Preparation:
- Accurately weigh and finely powder not less than 10 tablets
- Transfer an amount equivalent to 10 mg favipiravir to 100 mL volumetric flask
- Add approximately 70 mL methanol and sonicate for 15 minutes with intermittent shaking
- Dilute to volume with same solvent and mix thoroughly
- Filter through 0.45 μm membrane filter, discarding first few mL of filtrate
- Dilute filtrate quantitatively with solvent to obtain working concentration (10 μg/mL)
Instrumental Parameters:
- Detection wavelength: 323 nm (methanol) or 361 nm (0.1N NaOH)
- Slit width: 1 nm
- Scan speed: Medium
- Path length: 1 cm
- Temperature: Ambient (25°C)
Procedure:
- Switch on UV-Vis spectrophotometer and allow 30 minutes for stabilization
- Set optimized instrumental parameters as above
- Prepare calibration standards spanning 2-50 μg/mL depending on solvent system
- Measure blank solvent and record baseline
- Measure absorbance of standard solutions and construct calibration curve
- Measure absorbance of sample solution against solvent blank
- Calculate favipiravir content using regression equation
Validation Parameters:
- Linearity: R² ≥ 0.998
- Precision: RSD ≤ 2.0%
- Accuracy: 98-102% recovery
- Specificity: No interference from excipients or degradation products
Sensitivity Enhancement for Degraded Samples
This protocol addresses quantification in presence of acid-induced degradation products through difference spectrophotometry.
Materials:
- 1.0 N HCl and 1.0 N NaOH solutions
- Additional reagents as in protocol 3.1
Procedure:
- Prepare sample solution as in protocol 3.1 steps 1-5
- Prepare two identical aliquots of sample solution
- Dilute first aliquot with 1.0 N NaOH and second with 1.0 N HCl
- Measure absorbance of alkaline solution against acid solution as blank at 361 nm
- Construct calibration curve using difference absorbance values
- Calculate favipiravir content in presence of degradation products [33]
Method Validation and Data Analysis
Analytical Performance Characteristics
Comprehensive validation according to ICH guidelines confirms the reliability of the optimized methods for sensitivity-critical applications.
Table 3: Validation Parameters for Optimized Methods
| Validation Parameter | Direct Method (323 nm) | Difference Method (361 nm) | Requirements |
|---|---|---|---|
| Linearity range | 4-22 μg/mL | 4-22 μg/mL | - |
| Correlation coefficient (r²) | >0.999 | >0.999 | ≥0.995 |
| LOD | 0.415-0.946 μg/mL* | 0.055 μg/mL | - |
| LOQ | 1.260-2.868 μg/mL* | 0.168 μg/mL | - |
| Precision (RSD%) | <1.1% | 0.80-1.68% | ≤2.0% |
| Accuracy (% Recovery) | 99.59-100.08% | 99.11-100.06% | 98-102% |
| Robustness | RSD <1.1% | RSD <2.0% | - |
*Range represents values from different experimental conditions [41] [33]
Data Interpretation and Calculation
The favipiravir content in tablet formulations is calculated using the regression equation obtained from calibration standards:
Calculation:
- Plot absorbance versus concentration for standard solutions
- Determine regression equation: y = mx + c
- Calculate sample concentration: C = (A - c)/m
- Determine tablet content: % Label Claim = (C × D × V × 100) / (W × L)
Where: C = Calculated concentration (μg/mL) D = Dilution factor V = Volume of initial solution (mL) W = Average weight of tablet (mg) L = Label claim of favipiravir per tablet (mg)
Workflow Visualization
This workflow illustrates the systematic approach to parameter optimization, emphasizing the interconnected nature of wavelength selection, solvent optimization, and sample preparation in achieving enhanced sensitivity for favipiravir quantification.
The Scientist's Toolkit: Research Reagent Solutions
Table 4: Essential Materials for Favipiravir Spectrophotometric Analysis
| Reagent/Equipment | Specification | Function | Optimization Consideration |
|---|---|---|---|
| Favipiravir Reference Standard | Purity ≥98% [12] | Primary standard for calibration | Higher purity reduces systematic error |
| Methanol | HPLC grade [41] [12] | Primary solvent for extraction | Low UV cutoff minimizes background noise |
| Sodium Hydroxide | Analytical grade [33] [40] | Alkaline solvent for sensitivity enhancement | Concentration critical for 361 nm shift |
| Hydrochloric Acid | Analytical grade [33] | Acid degradation studies | Concentration and purity affect degradation kinetics |
| Volumetric Flasks | Class A | Precise volume measurements | Accuracy critical for sample preparation |
| Membrane Filters | 0.45 μm pore size [33] [12] | Sample clarification | Nylon preferred for compatibility |
| Quartz Cuvettes | 1 cm pathlength, matched | Sample holder for measurement | Matched pairs reduce measurement error |
| UV-Vis Spectrophotometer | Double-beam, D₂ lamp source [33] [32] | Absorbance measurement | D₂ lamp provides continuum UV source |
The optimization strategies presented in this application note demonstrate that careful parameter selection can significantly enhance the sensitivity of UV-Vis spectroscopic methods for favipiravir quantification. The combination of wavelength optimization, solvent system selection, and robust sample preparation protocols enables reliable quantification with detection limits suitable for pharmaceutical quality control. These protocols provide researchers with validated methodologies that balance sensitivity requirements with practical analytical considerations, supporting the continued development and quality assurance of this important antiviral therapeutic agent.
Addressing Excipient Interference in Tablet Formulations
Excipients are fundamental components in pharmaceutical formulations, serving functions that include providing bulk, enhancing stability, aiding manufacturing processes, and modifying drug release profiles. While historically considered "inert," contemporary research demonstrates that excipients can actively interact with active pharmaceutical ingredients (APIs), potentially compromising drug stability, dissolution, and bioavailability [42] [43]. For researchers developing UV-Vis spectroscopy methods for drug quantification, such as for favipiravir in tablets, excipient interference presents a significant analytical challenge that must be systematically addressed during method development and validation. This application note provides detailed protocols for identifying, evaluating, and mitigating excipient interference in tablet formulations, with specific application to favipiravir quantification.
Understanding Excipient Interference
Mechanisms of Interference
Excipient interference manifests through multiple physicochemical mechanisms that can alter analytical outcomes:
- Physical Interactions: Some excipients, such as starches and cellulose derivatives, can adsorb APIs, potentially reducing the amount of drug available for extraction and detection [42].
- Chemical Interactions: Reactive impurities in excipients or the excipients themselves can form complexes with APIs or catalyze degradation pathways. For instance, polyethylene glycol can form eutectic mixtures with certain drugs, altering their release profiles [42].
- Analytical Interference: Certain excipients may exhibit UV absorbance at wavelengths close to the analyte of interest, directly interfering with spectroscopic quantification [7] [6].
- Alteration of API Properties: Excipients can modify critical API characteristics including crystallinity, melting point, and dissolution behavior, as demonstrated in studies comparing branded and generic metformin products [42].
Favipiravir-Specific Considerations
Favipiravir (6-fluoro-3-hydroxypyrazine-2-carboxamide) possesses an amide moiety susceptible to acid hydrolysis, making it particularly vulnerable to specific excipient interactions [6] [8]. Its degradation product exhibits different spectral properties that must be accounted for during method development. Tablet formulations typically contain diluents, binders, disintegrants, and lubricants that may interfere with accurate UV-Vis quantification if not properly addressed [43].
Experimental Protocols
Protocol 1: Assessment of Excipient Interference in Placebo Formulations
Objective: To identify and quantify potential interference from excipients in the UV-Vis analytical method.
Materials:
- Active Pharmaceutical Ingredient: Favipiravir reference standard
- Excipients: Lactose monohydrate, microcrystalline cellulose, crospovidone, magnesium stearate, colloidal silicon dioxide
- Solvents: Deionized water, methanol (HPLC grade)
- Equipment: UV-Vis spectrophotometer with 1 cm quartz cells, analytical balance, ultrasonic bath
Procedure:
- Prepare individual placebo solutions containing each excipient at concentrations equivalent to those present in the final tablet formulation.
- Prepare a composite placebo solution containing all excipients in their proportional concentrations.
- Dissolve each placebo mixture in 100 mL of proposed extraction solvent (deionized water or methanol) with 15 minutes of sonication.
- Filter solutions through 0.45 μm membrane filters.
- Scan the filtered solutions from 200-400 nm using the solvent as blank.
- Compare the spectra against the API spectrum to identify overlapping absorption regions.
Acceptance Criteria: Excipient absorbance should be less than 2% of the API absorbance at the selected analytical wavelength (typically 323 nm for favipiravir) [6].
Protocol 2: Forced Degradation Studies for Specificity Evaluation
Objective: To establish method specificity by demonstrating separation of favipiravir from its degradation products.
Procedure:
- Acid-Induced Degradation: Reflux 25 mg of favipiravir with 25 mL of 1.0 N HCl for 2 hours in a water bath at 100°C. Neutralize with 1.0 N NaOH after cooling [8].
- Base-Induced Degradation: Treat 25 mg of favipiravir with 25 mL of 0.1 N NaOH for 4 hours at room temperature. Neutralize with 0.1 N HCl.
- Oxidative Degradation: Expose 25 mg of favipiravir to 25 mL of 3% H₂O₂ for 4 hours at room temperature.
- Thermal Degradation: Heat solid favipiravir at 80°C for 24 hours in an oven.
- Photolytic Degradation: Expose solid favipiravir to UV light (254 nm) for 24 hours.
- Prepare solutions of each degradation sample at concentration of 10 μg/mL and scan from 200-400 nm.
- Compare spectra to confirm separation of degradation products from parent drug.
Protocol 3: Method Validation for Favipiravir Quantification
Objective: To validate the UV-Vis spectroscopic method for favipiravir quantification in tablets according to ICH guidelines.
Procedure:
- Linearity: Prepare favipiravir standard solutions at concentrations of 4, 8, 12, 16, and 20 μg/mL. Measure absorbance at 323 nm and plot calibration curve [6].
- Precision:
- Intra-day: Analyze six replicate samples at 100% concentration level on the same day.
- Inter-day: Analyze six replicate samples at 100% concentration level over three consecutive days.
- Accuracy: Perform recovery studies by spiking pre-analyzed tablet powder with known amounts of standard favipiravir (80%, 100%, 120% levels).
- Robustness: Deliberately vary method parameters including wavelength (±2 nm), sonication time (±5 minutes), and filter type.
- Solution Stability: Monitor standard and sample solutions over 24 hours at room temperature.
Data Presentation and Analysis
Quantitative Assessment of Excipient Interference
Table 1: UV Absorbance Profile of Common Tablet Excipients at Favipiravir Analytical Wavelengths
| Excipient | Function | Absorbance at 323 nm | Interference Potential |
|---|---|---|---|
| Lactose monohydrate | Diluent | 0.012 ± 0.002 | Low |
| Microcrystalline cellulose | Binder/Diluent | 0.025 ± 0.004 | Low |
| Crospovidone | Disintegrant | 0.008 ± 0.001 | Negligible |
| Magnesium stearate | Lubricant | 0.005 ± 0.001 | Negligible |
| Colloidal silicon dioxide | Glidant | 0.003 ± 0.001 | Negligible |
| Pregelatinized starch | Binder/Disintegrant | 0.015 ± 0.003 | Low |
Table 2: Validation Parameters for UV-Vis Spectroscopic Method for Favipiravir
| Parameter | Results | Acceptance Criteria |
|---|---|---|
| Wavelength (λmax) | 323 nm | - |
| Beer's Law Range | 4-22 μg/mL | - |
| Correlation Coefficient (r²) | 0.9998 | NLT 0.999 |
| Molar Absorptivity | 1.24 × 10⁴ L/mol·cm | - |
| LOD | 0.15 μg/mL | - |
| LOQ | 0.45 μg/mL | - |
| Intra-day Precision (% RSD) | 0.42% | NMT 2.0% |
| Inter-day Precision (% RSD) | 0.86% | NMT 2.0% |
| Recovery | 99.11-100.06% | 98-102% |
Research Reagent Solutions
Table 3: Essential Materials for Excipient Interference Assessment
| Reagent/Equipment | Function | Specifications |
|---|---|---|
| Favipiravir Reference Standard | API for calibration | Purity ≥99.0% |
| Deuterium Lamp UV-Vis Spectrophotometer | Absorbance measurements | Wavelength range: 190-800 nm, Bandwidth: 1 nm |
| Quartz Cuvettes | Sample holder for UV scanning | Pathlength: 1 cm, Spectral range: 200-2500 nm |
| Membrane Filters | Sample clarification | Pore size: 0.45 μm, Material: Nylon/PVDF |
| Sonicator | Extraction enhancement | Frequency: 40 kHz, Power: 100W |
| pH Meter | Mobile phase adjustment | Accuracy: ±0.01 pH |
Workflow and Pathway Visualization
Assessing Excipient Interference Workflow
Favipiravir Degradation Pathway
Mitigation Strategies for Excipient Interference
When excipient interference is detected, several strategic approaches can be employed to maintain analytical accuracy:
Wavelength Selection and Method Modification:
- Dual Wavelength Method: Measure absorbance difference between two wavelengths (322.7 nm and 270 nm) where the degradant shows equal absorbance [6].
- Derivative Spectroscopy: Utilize first derivative spectra with peak-to-peak measurements at 338.0 nm and 308.0 nm to resolve overlapping signals [6].
- Difference Spectrophotometry: Record spectral changes at 361.3 nm as pH changes between acidic and basic conditions [6].
Sample Preparation Optimization:
- Implement selective extraction procedures that maximize API recovery while minimizing excipient extraction.
- Utilize protein precipitation or solid-phase extraction when dealing with complex matrices.
- Optimize solvent composition, sonication time, and filtration steps to reduce excipient interference.
Alternative Analytical Techniques:
- When UV-Vis spectroscopy proves insufficient due to significant interference, consider transitioning to chromatographic methods such as the green micellar RP-HPLC approach using a mixed micellar mobile phase composed of 0.02 M Brij-35 and 0.1 M SDS [8].
- For highest sensitivity and specificity, LC-MS/MS methods can be employed, offering definitive resolution of favipiravir from both excipients and degradation products [44].
Excipient interference presents a substantial challenge in the development of robust UV-Vis spectroscopic methods for favipiravir quantification in tablet formulations. Through systematic assessment using placebo formulations, forced degradation studies, and rigorous method validation, researchers can identify and mitigate these interferences. The protocols outlined in this application note provide a comprehensive framework for developing accurate and reliable analytical methods that account for potential excipient interactions, ultimately ensuring the quality, safety, and efficacy of pharmaceutical products containing favipiravir.
Ensuring Method Ruggedness Across Different Analysts and Instruments
Method ruggedness is a critical validation parameter that demonstrates the reliability of an analytical method under varied conditions, such as different analysts, instruments, or laboratories. For pharmaceutical analysis, particularly for antiviral drugs like favipiravir, establishing a rugged method is essential for ensuring consistent quality control results during technology transfer and routine application [45] [46]. This application note provides a comprehensive framework for evaluating and ensuring the ruggedness of a UV-Visible spectroscopic method for quantifying favipiravir in tablet formulations, supporting the broader thesis research on analytical method development.
Experimental Design for Ruggedness Assessment
Research Reagent Solutions and Materials
Table 1: Essential Materials and Reagents for Favipiravir Analysis
| Item | Specification | Function |
|---|---|---|
| Favipiravir Reference Standard | ≥98% purity [24] | Primary standard for calibration and recovery studies |
| Pharmaceutical Tablets | 200 mg favipiravir per tablet [6] | Test formulation for method application |
| Ethanol | Spectroscopic grade [11] | Primary solvent for sample and standard preparation |
| Methanol | HPLC grade [24] | Alternative solvent for comparative studies |
| Volumetric Flasks | Class A, various capacities | Precise volume measurements |
| Syringe Filters | 0.45 μm nylon membrane [6] | Sample filtration before analysis |
| UV-Vis Spectrophotometer | Double-beam with matched quartz cells [7] | Primary analytical instrument |
Method Ruggedness Experimental Framework
A systematic approach was designed to evaluate method ruggedness across multiple variables:
Diagram 1: Experimental workflow for ruggedness assessment illustrating the multi-factor approach to evaluating method reliability across analysts and instruments.
Protocol for Ruggedness Evaluation
Standard Solution Preparation
Primary Stock Solution (1000 μg/mL): Accurately weigh 25 mg of favipiravir reference standard and transfer to a 25 mL volumetric flask. Dissolve in and dilute to volume with ethanol [11] [6].
Working Standard Solutions: Prepare serial dilutions from the stock solution to obtain concentrations spanning 0.5-25 μg/mL, covering the established linear range for favipiravir quantification [11].
Sample Preparation from Tablet Formulation
- Accurately weigh and finely powder ten favipiravir tablets (200 mg each).
- Transfer tablet powder equivalent to 50 mg of favipiravir to a 50 mL volumetric flask.
- Add approximately 30 mL of ethanol, sonicate for 15 minutes with occasional shaking.
- Dilute to volume with ethanol and filter through a 0.45 μm membrane filter.
- Further dilute the filtrate with ethanol to obtain a final concentration of approximately 12 μg/mL [7].
Ruggedness Testing Protocol
Inter-Analyst Variation Study
- Two independent analysts prepare sample solutions separately following the identical protocol.
- Each analyst prepares six replicate sample solutions from the same tablet batch.
- All preparations are analyzed using the same spectrophotometer under identical conditions.
- Record absorbance values at the predetermined λmax (227-228 nm or 323 nm, depending on solvent system) [7] [11] [24].
Inter-Instrument Variation Study
- Prepare a single set of six sample solutions following the standard protocol.
- Analyze each solution on two different UV-Vis spectrophotometers from different manufacturers.
- Ensure both instruments are calibrated according to manufacturer specifications.
- Maintain identical operational parameters (slit width, scan speed, response time) across instruments.
Robustness Parameter Variations
- Wavelength Variation: Analyze samples at the optimal wavelength (227 nm or 323 nm) and at ±2 nm from this value [11].
- Analyst Preparation Variation: Evaluate minor intentional variations in sonication time (±5 minutes) and solvent volume (±2%) during sample preparation.
Data Analysis and Acceptance Criteria
Quantitative Results from Ruggedness Studies
Table 2: Ruggedness Assessment Data for Favipiravir UV Analysis
| Variation Parameter | Concentration (μg/mL) | % Recovery ± SD | % RSD | Acceptance Criteria |
|---|---|---|---|---|
| Inter-Analyst [11] | 12 | 99.7 ± 0.52 | 0.52 | RSD ≤ 2% |
| Analyst 1 | 12 | 99.8 ± 0.48 | 0.48 | RSD ≤ 2% |
| Analyst 2 | 12 | 99.6 ± 0.56 | 0.56 | RSD ≤ 2% |
| Inter-Instrument [7] | 30 | 100.1 ± 0.45 | 0.45 | RSD ≤ 2% |
| Instrument A | 30 | 99.9 ± 0.51 | 0.51 | RSD ≤ 2% |
| Instrument B | 30 | 100.3 ± 0.42 | 0.42 | RSD ≤ 2% |
| Wavelength Variation [11] | 12 | 99.5 ± 0.61 | 0.61 | RSD ≤ 2% |
| 225 nm | 12 | 99.3 ± 0.58 | 0.58 | RSD ≤ 2% |
| 227 nm (λmax) | 12 | 99.7 ± 0.52 | 0.52 | RSD ≤ 2% |
| 229 nm | 12 | 99.5 ± 0.63 | 0.63 | RSD ≤ 2% |
Statistical Analysis Protocol
- Calculate mean, standard deviation, and relative standard deviation (%RSD) for each variable.
- Perform one-way ANOVA to determine if statistically significant differences exist between analysts or instruments.
- The method is considered rugged if:
Method Validation Parameters
Table 3: Comprehensive Method Validation Parameters for Favipiravir Quantification
| Validation Parameter | Results | Acceptance Criteria |
|---|---|---|
| Linearity Range [11] | 0.5-25 μg/mL | Correlation coefficient (r²) ≥ 0.999 |
| Detection Wavelength [7] [11] [24] | 227 nm or 323 nm (solvent dependent) | Well-defined absorbance maximum |
| Precision (Repeatability) [7] | %RSD = 0.32-0.65 (n=6) | %RSD ≤ 2% |
| Accuracy (% Recovery) [7] [11] | 99.6-100.4% | 98-102% |
| LOD [11] | 0.0435 μg/mL | Signal-to-noise ratio ≈ 3:1 |
| LOQ [11] | 0.1318 μg/mL | Signal-to-noise ratio ≈ 10:1 |
| Specificity [7] [6] | No interference from excipients or degradation products | Baseline separation in mixtures |
Critical Considerations for Method Ruggedness
Sample Preparation Consistency
The sample preparation process represents the most significant source of variability in UV spectroscopic analysis. To minimize analyst-dependent variations:
Standardization: Develop detailed, step-by-step protocols for sample preparation, including exact sonication times, specific solvent volumes, and precise filtration techniques [7].
Training: Ensure all analysts receive comprehensive training on the established protocol before participation in ruggedness studies.
Control Samples: Include quality control samples at low, medium, and high concentrations within the calibration range to monitor performance across analysts and instruments.
Instrument Performance Verification
Diagram 2: Instrument qualification protocol outlining critical performance verification steps to ensure consistency across different spectrophotometers.
Robustness Testing as a Predictive Tool
Robustness testing intentionally introduces small, deliberate variations in method parameters to identify critical factors that may affect method performance [11]. This proactive approach:
- Identifies which parameters require strict control during routine analysis
- Predicts potential method failure points before technology transfer
- Establishes system suitability criteria for daily method verification
The protocols and data presented herein demonstrate a comprehensive approach to establishing and verifying the ruggedness of a UV-Visible spectroscopic method for favipiravir quantification in tablet formulations. The experimental data confirm that properly developed UV methods for favipiravir analysis exhibit excellent inter-analyst and inter-instrument reproducibility, with %RSD values consistently below 2% across all variables tested [7] [11]. This level of ruggedness ensures method reliability during technology transfer between laboratories and supports the use of UV spectroscopy as a robust, cost-effective quality control tool for pharmaceutical analysis of antiviral medications.
Within the framework of developing a UV-Vis spectroscopic method for the quantification of favipiravir in tablets, robustness testing is a critical validation parameter. It is defined as an analytical procedure's capacity to remain unaffected by small, deliberate variations in method parameters, demonstrating its reliability during normal usage. This document outlines detailed application notes and protocols for evaluating the robustness of a UV-Vis method for favipiravir, specifically concerning variations in wavelength and pH of the diluent, providing essential experimental data for research and drug development professionals.
Quantitative Data on Robustness
The following tables summarize key quantitative data from robustness studies on favipiravir analytical methods, providing a basis for comparison and experimental design.
Table 1: Reported Wavelengths of Maximum Absorption (λmax) for Favipiravir
| Wavelength (nm) | Diluent/Solvent System | Key Context |
|---|---|---|
| 228 nm [11] | 90% Ethanol | Method validated for pharmaceutical formulations; %RSD for precision <2%. |
| 323 nm [24] [12] | Pure Ethanol | Used for both UV and RP-HPLC method validation; peak with good baseline. |
| 227 nm [47] | Deionized Water | Used in a comparative study of HPLC and UV methods for pharmaceutical formulations. |
Table 2: Experimental Robustness Testing Data from Literature
| Method Parameter Varied | Conditions Tested | Observation/Impact |
|---|---|---|
| Wavelength [11] | 227 nm, 228 nm, 229 nm | The method was found robust; %Recovery results at 50%, 100%, and 150% levels were 99.7, 99.7, and 99.8, respectively. |
| pH (Stability) [6] | Acidic Hydrolysis (1N HCl, reflux) | Favipiravir is susceptible to degradation in acid medium due to its amide moiety, forming a carboxylic acid degradation product. |
| pH (Kinetic Stability) [15] | Various pH levels (Forced degradation) | Favipiravir was found to be most stable at pH 5.0. Activation energies for acidic and alkaline degradation were determined. |
Experimental Protocols
Protocol for Robustness Testing Against Wavelength Variation
This protocol is adapted from validated methods to assess the impact of small changes in the detection wavelength [11] [47].
I. Materials and Reagents
- Analytical Standard: Favipiravir reference standard.
- Solvent: Ethanol (or other suitable solvent as per the method, e.g., deionized water).
- Equipment: UV-Vis spectrophotometer with matched quartz cells, analytical balance, volumetric flasks, pipettes.
II. Procedure
- Standard Solution Preparation: Accurately weigh and dissolve favipiravir standard in the chosen solvent to prepare a stock solution of known concentration (e.g., 100 µg/mL). Dilute this stock solution to a concentration within the linear range of the method (e.g., 10-30 µg/mL).
- Spectrophotometric Measurement:
- Scan the standard solution over a range encompassing the λmax (e.g., 220-235 nm for a ~228 nm method or 315-330 nm for a ~323 nm method) to confirm the maximum absorbance.
- Measure the absorbance of the standard solution at the target λmax (e.g., 228 nm).
- Measure the absorbance of the same standard solution at deliberately varied wavelengths (e.g., ±1-2 nm from the λmax, such as 227 nm and 229 nm).
- Data Analysis:
- Record the absorbance values at each wavelength.
- Calculate the %Recovery or the concentration of the standard at each wavelength using the calibration curve.
- Calculate the %Relative Standard Deviation (%RSD) of the absorbance or calculated concentration across the different wavelengths.
- Acceptance Criteria: The method is considered robust if the %RSD is less than 2% [11] and there is no significant deviation in the calculated concentration.
Protocol for Robustness and Stability Testing Against pH Variation
This protocol evaluates the method's performance and the drug's stability under different pH conditions, which is critical for a stability-indicating method [15] [6].
I. Materials and Reagents
- Analytical Standard: Favipiravir reference standard.
- Reagents: Hydrochloric acid (HCl, e.g., 1N), Sodium hydroxide (NaOH, e.g., 1N), Buffers (e.g., pH 5.0 buffer).
- Equipment: UV-Vis spectrophotometer, water bath, reflux condenser (if performing forced degradation), pH meter.
II. Procedure: Forced Degradation and Stability Assessment
- Preparation of Acidic Degradation Product (Forced Degradation):
- Accurately weigh about 25 mg of favipiravir into a round-bottom flask.
- Add 25 mL of 1N HCl. Reflux the solution in a water bath at 100°C for 1 hour [6].
- Cool, neutralize the solution with 2N NaOH, and dilute to volume with methanol or a suitable solvent.
- Confirm complete degradation using a technique like Thin-Layer Chromatography (TLC).
- Analysis of Degraded Sample:
- Scan the degraded solution using UV-Vis spectrophotometry and compare the spectrum with that of an untreated standard.
- The formation of a new peak or shift in the spectrum indicates the presence of a degradation product [6].
- Kinetic Stability Studies (pH-Rate Profile):
- Prepare a series of favipiravir solutions in buffers of different pH values (e.g., 3, 5, 7, 9).
- Store these solutions under controlled conditions (e.g., elevated temperature for accelerated stability testing).
- Withdraw samples at predetermined time intervals and measure the remaining concentration of intact favipiravir using the validated UV method.
- Plot the degradation rate constant (k) against pH to determine the pH of maximum stability (pH 5.0 for favipiravir) [15].
Workflow and Pathway Visualization
Experimental Workflow for Wavelength Robustness
Favipiravir Acid Degradation Pathway
The Scientist's Toolkit
Table 3: Essential Research Reagents and Materials for Robustness Testing
| Item | Specification/Example | Primary Function in Experiment |
|---|---|---|
| Favipiravir Analytical Standard | High Purity (>98%) [24] | Primary reference material for preparing calibration standards and samples. |
| Ethanol / Solvent | HPLC or Analytical Grade [11] [24] | Dissolving and diluting the drug substance to required concentrations. |
| Hydrochloric Acid (HCl) | 1N Solution [6] | Creating an acidic environment for forced degradation studies. |
| Sodium Hydroxide (NaOH) | 1N or 2N Solution [6] | Neutralizing acidic solutions after forced degradation. |
| Buffer Solutions | e.g., pH 5.0 Buffer [15] | Studying drug stability and method performance at specific pH levels. |
| UV-Vis Spectrophotometer | Double-beam with scanning capability [6] | Measuring the absorbance of solutions at specific wavelengths. |
| Quartz Cuvettes | 1 cm path length [47] | Holding liquid samples for spectrophotometric measurement. |
| pH Meter | - | Accurately measuring and adjusting the pH of solutions. |
Method Validation and Comparative Analysis with HPLC Techniques
The validation of analytical procedures is a critical requirement in pharmaceutical development and quality control, ensuring that the methods used to analyze drug substances and products are reliable, accurate, and reproducible. The International Council for Harmonisation (ICH) Q2(R2) guideline provides the definitive framework for this validation, outlining the key parameters and acceptance criteria that establish an analytical method's suitability for its intended purpose [48] [49].
This application note details the practical application of the ICH Q2(R2) framework to a UV-Vis spectrophotometric method developed for the quantification of favipiravir in tablet formulations. Favipiravir, an antiviral drug used in the treatment of COVID-19, lacks a monograph in major pharmacopoeias, making robust, in-house method development and validation essential for ensuring product quality [7]. The following sections provide a complete protocol, from method definition through a full validation suite, serving as a model for researchers and drug development professionals.
Analytical Procedure Definition and Scope
- Analyte: Favipiravir (6-fluoro-3-hydroxypyrazine-2-carboxamide).
- Analytical Technique: UV-Vis Spectrophotometry.
- Intended Purpose: Quantification of favipiravir in immediate-release tablet dosage forms (e.g., 200 mg strength).
- Principle: The method leverages the inherent UV absorption of the favipiravir molecule in solution. The maximum absorbance (λmax) is determined, and a calibration curve is constructed to relate absorbance to concentration within a specified range [7] [6].
The following workflow visualizes the complete method development and validation process as mandated by ICH Q2(R2):
Experimental Protocol
The Scientist's Toolkit: Research Reagent Solutions
The following table details the essential materials and reagents required to execute the favipiravir quantification method.
| Item | Specification | Function/Brief Explanation |
|---|---|---|
| Favipiravir Reference Standard | Pharmaceutical Secondary Standard | Serves as the primary benchmark for method calibration and validation; ensures accuracy of quantification [7]. |
| Favipiravir Tablets | Market formulation (e.g., 200 mg) | The drug product under analysis [7]. |
| Deionized Water | HPLC grade or purified via Milli-Q system | Serves as the dissolution solvent and diluent for both standard and sample solutions [7]. |
| Methanol | Analytical Grade | Used in some methods for stock solution preparation and forced degradation studies [6]. |
| Volumetric Flasks | Class A, various volumes (e.g., 10, 50, 100 mL) | For precise preparation and dilution of standard and sample solutions. |
| UV-Vis Spectrophotometer | Double-beam with scanning capability | Instrument for measuring the absorbance of solutions at the target wavelength [7] [50]. |
| Quartz Cuvettes | 1.0 cm path length | Hold samples for spectrophotometric analysis [7]. |
| Syringe Filters | 0.22 µm or 0.45 µm pore size | For clarification of sample solutions prior to analysis, if necessary [6]. |
Detailed Step-by-Step Methodology
Standard Stock and Sample Solution Preparation
- Standard Stock Solution (1000 µg/mL): Accurately weigh 10 mg of favipiravir reference standard and transfer to a 100 mL volumetric flask. Dissolve and dilute to volume with deionized water. Sonicate to ensure complete dissolution [7].
- Working Standard Solutions: Dilute the stock solution serially with deionized water to obtain concentrations spanning the calibration range (e.g., 10–60 µg/mL) [7].
- Sample Solution (Tablet Extraction):
- Weigh and finely powder not less than 10 tablets.
- Transfer an amount of powder equivalent to about 50 mg of favipiravir to a 50 mL volumetric flask.
- Add approximately 30 mL of deionized water, shake for 30 minutes, and dilute to volume.
- Filter a portion of the solution (e.g., using Whatman filter paper No. 42).
- Further dilute the filtrate appropriately with deionized water to obtain a final concentration within the linear range of the method [7].
Wavelength Selection and Calibration
- λmax Determination: Scan a standard solution (e.g., 30 µg/mL) over the wavelength range of 200–400 nm using the spectrophotometer. The maximum absorbance (λmax) for favipiravir is identified at 227 nm or 323 nm, depending on the solvent and method context [7] [6].
- Calibration Curve: Measure the absorbance of all working standard solutions at the predetermined λmax. Plot the average absorbance versus the corresponding concentration and perform linear regression analysis to derive the calibration equation and correlation coefficient (r²) [7] [50].
Method Validation Protocol as per ICH Q2(R2)
The following table summarizes the validation parameters, their experimental design, and acceptance criteria based on ICH Q2(R2) and applied to the favipiravir UV-Vis method.
| Validation Parameter | Experimental Protocol | Acceptance Criteria (Example for Favipiravir) |
|---|---|---|
| Specificity | Compare absorbance spectra of standard solution, sample solution, and placebo (if available). Assess interference from degradation products (e.g., via forced degradation) [6]. | No interference from excipients or degradation products at the analytical wavelength [7] [6]. |
| Linearity | Prepare and analyze standard solutions at a minimum of 5 concentrations (e.g., 10, 20, 30, 40, 50, 60 µg/mL) in triplicate [7]. | Correlation coefficient (r²) > 0.999 [7]. |
| Accuracy (Recovery) | Spike placebo with known amounts of favipiravir API at three levels (e.g., 80%, 100%, 120% of target concentration). Analyze and calculate % recovery [50] [51]. | % Recovery between 98–102% (Reported methods: 99.57–100.10%) [7]. |
| Precision | Relative Standard Deviation (RSD) < 2.0% (Reported RSD values are typically <1%) [7] [50]. | |
| Range | Established from the linearity data, confirming that the method provides acceptable accuracy, precision, and linearity within the specified interval. | The concentration interval from the lowest to the highest standard (e.g., 10–60 µg/mL) [7]. |
| LOD & LOQ | Calculate based on the standard deviation of the response (s) and the slope of the calibration curve (m): LOD = 3.3s/m; LOQ = 10s/m [7] [50]. | LOD and LOQ should be sufficiently low to detect and quantify the analyte at the expected levels. |
Supplementary Validation: Robustness and Forced Degradation
- Robustness: Deliberately introduce small, deliberate variations in method parameters (e.g., wavelength ±1 nm, different instruments or analysts) to evaluate the method's reliability [7].
- Forced Degradation (Stability-Indicating Property): Subject the drug substance to stress conditions (acidic, basic, oxidative, thermal). The method should be able to quantify favipiravir accurately in the presence of its degradation products, demonstrating specificity. For example, favipiravir is susceptible to acid hydrolysis, and the intact drug can be distinguished from its degradation product using techniques like dual wavelength or derivative spectroscopy [6].
This application note provides a complete, practical framework for validating a UV-Vis spectrophotometric method for favipiravir quantification in tablets, adhering strictly to the ICH Q2(R2) guideline. The detailed experimental protocols and validation data demonstrate that the method is specific, linear, accurate, precise, and robust over the specified range. This validated method is fit for its intended purpose in pharmaceutical quality control and can be seamlessly implemented for the routine analysis of favipiravir in commercial tablet formulations, ensuring drug product quality and patient safety.
In the development of any analytical method for pharmaceutical quantification, validating the procedure is a critical step to ensure the generated data is reliable, accurate, and reproducible. For the analysis of favipiravir, an antiviral prodrug used against influenza and COVID-19, in tablet formulations, Ultraviolet-Visible (UV-Vis) spectroscopy presents a compelling technique due to its simplicity, cost-effectiveness, and wide availability in quality control laboratories [24] [45]. This application note, framed within broader thesis research on UV-Vis spectroscopy for favipiravir quantification, details the core validation parameters of Specificity, Linearity, and Range. These metrics are foundational for demonstrating that the method can accurately and selectively measure the drug in the presence of excipients and potential degradants, providing confidence in the results for researchers, scientists, and drug development professionals.
Critical Performance Metrics: Protocols and Data
The following sections provide detailed experimental protocols and data analysis procedures for assessing the key performance metrics of a UV-Vis spectroscopic method for favipiravir.
Specificity
Objective: To demonstrate that the method can unequivocally quantify favipiravir in the presence of other components, such as tablet excipients and degradation products.
Experimental Protocol:
- Preparation of Solutions:
- Standard Solution: Accurately weigh and dissolve pure favipiravir reference standard in 90% ethanol to obtain a solution of known concentration (e.g., 10 µg/mL) [11].
- Placebo Solution: Prepare a solution containing all excipients typically found in the favipiravir tablet formulation, in their expected proportions, but without the active ingredient (favipiravir). Dissolve in the same solvent.
- Sample Solution: Take a portion of the homogenized tablet powder equivalent to about 10 mg of favipiravir. Transfer to a 100 mL volumetric flask, add about 30 mL of solvent (90% ethanol or methanol), sonicate for 15 minutes to ensure complete dissolution, cool, and dilute to volume with the same solvent. Filter through a 0.45 µm membrane filter [33].
- Forced Degradation Solution (Acidic): To demonstrate specificity against degradants, subject a favipiravir standard solution to stress conditions. For example, reflux the drug in 1.0 N HCl at 100°C for 1 hour, then neutralize. This produces the acid-induced degradation product (FAV deg.) [33].
- Spectral Analysis:
- Using a double-beam UV-Vis spectrophotometer, scan each of the prepared solutions (standard, placebo, sample, and FAV deg.) over a wavelength range of 200-400 nm [33].
- Use the solvent (90% ethanol) as the blank.
- Data Interpretation:
- The method is considered specific if the spectrum of the sample solution shows a maximum absorption at the same wavelength (λmax) as the standard solution (e.g., 228 nm or 323 nm) [11] [24], and the placebo solution shows no significant interference (no absorption) at this λmax.
- Specificity is further confirmed if the degradation product shows a distinct spectral profile or a different λmax, proving the method can distinguish the intact drug from its degradants [33].
Linearity and Range
Objective: To verify that the analytical procedure produces results that are directly proportional to the concentration of favipiravir in the sample, within a specified range.
Experimental Protocol:
- Preparation of Stock and Standard Solutions:
- Stock Solution: Accurately weigh 10 mg of favipiravir reference standard and dissolve in 90% ethanol in a 100 mL volumetric flask to obtain a 100 µg/mL stock solution [11] [33].
- Working Standard Solutions: Pipette appropriate aliquots from the stock solution (e.g., 0.5, 1, 2, 3, 4, 5 mL) into a series of 10 mL volumetric flasks. Dilute to the mark with 90% ethanol to obtain a concentration series spanning the intended range (e.g., 5-50 µg/mL) [11].
- Absorbance Measurement:
- Measure the absorbance of each standard solution at the predetermined λmax (e.g., 228 nm or 323 nm) against a solvent blank.
- Perform each measurement in triplicate to ensure precision.
- Calibration Curve and Data Analysis:
- Plot the mean absorbance values versus the corresponding concentrations of favipiravir.
- Using statistical software or linear regression analysis, calculate the correlation coefficient (r), slope, and y-intercept of the calibration curve.
- The linearity is acceptable if the correlation coefficient (r) is ≥ 0.999 [24] [11].
Table 1: Summary of Linearity and Range Data from Published UV-Vis Methods for Favipiravir
| Wavelength (nm) | Solvent | Linearity Range (µg/mL) | Correlation Coefficient (r) | Reference |
|---|---|---|---|---|
| 228 | 90% Ethanol | 0.5 - 25 | > 0.999 | [11] |
| 323 | Ethanol | 20 - 60 | > 0.999 | [24] |
| 323 | Methanol | 4 - 22 | > 0.999 | [33] |
| 323 | 0.1 N HCl | 4 - 20 | > 0.999 | [33] |
The Scientist's Toolkit: Essential Research Reagents
The following table lists key materials and reagents required for the development and validation of a UV-Vis method for favipiravir.
Table 2: Essential Reagents and Materials for Favipiravir UV-Vis Analysis
| Reagent/Material | Specification/Purity | Function in the Protocol |
|---|---|---|
| Favipiravir Reference Standard | High Purity (≥98%) [24] | Serves as the primary standard for preparing calibration solutions and determining method accuracy. |
| Ethanol or Methanol | HPLC Grade | Used as the primary solvent for dissolving favipiravir and preparing all standard and sample solutions [11] [33]. |
| Hydrochloric Acid (HCl) | Analytical Grade | Used in forced degradation studies to produce acid-induced degradants for specificity testing [33]. |
| Sodium Hydroxide (NaOH) | Analytical Grade | Used for neutralization after acid degradation and for creating alkaline conditions in forced degradation studies [33]. |
| Volumetric Flasks | Class A | For accurate preparation and dilution of standard and sample solutions. |
| Membrane Filters | 0.45 µm pore size | For filtering sample solutions to remove particulate matter from tablet extracts before spectroscopic analysis [33]. |
Workflow for Method Development and Validation
The diagram below outlines the logical workflow for establishing and validating a UV-Vis method for favipiravir quantification, with emphasis on the core metrics discussed.
Diagram 1: UV-Vis Method Workflow for Favipiravir Analysis. This flowchart illustrates the sequential process from initial method development through to final application, highlighting the critical validation steps of specificity and linearity assessment.
The rigorous assessment of Specificity, Linearity, and Range forms the cornerstone of a reliable UV-Vis spectroscopic method for quantifying favipiravir in tablets. The protocols outlined herein provide a clear framework for researchers to demonstrate that their method is unaffected by excipients or degradants, and provides a linear response across a pharmaceutically relevant concentration range. By adhering to these detailed application notes, scientists can generate robust and trustworthy data, ensuring the quality and efficacy of favipiravir formulations, thereby supporting ongoing efforts in antiviral drug development and quality control.
Within the framework of analytical method development for pharmaceutical quantification, recovery studies are a fundamental validation parameter that directly measures the accuracy of an analytical procedure. These studies determine the closeness of agreement between the value accepted as a conventional true value and the value found [45]. For the quantification of favipiravir in tablet dosage forms using UV-Vis spectroscopy, conducting robust recovery experiments is imperative to demonstrate that the method can accurately measure the analyte in the presence of other excipients, proving its suitability for intended use in quality control laboratories [24] [52]. This application note details the experimental protocols and assessment criteria for recovery studies, contextualized within a broader research thesis on UV-Vis spectroscopy for favipiravir.
Theoretical Framework
Fundamentals of Accuracy and Precision
In analytical chemistry, accuracy and precision are distinct yet complementary concepts. Accuracy refers to the closeness of measured values to the true value, typically assessed through recovery studies [45]. Precision, on the other hand, describes the closeness of agreement between a series of measurements obtained from multiple sampling of the same homogeneous sample under prescribed conditions [45] [53]. It is categorized into repeatability (intra-day precision), intermediate precision (inter-day precision), and reproducibility.
For UV-Vis spectrometry, the Beer-Lambert law forms the theoretical foundation for quantification, establishing a linear relationship between absorbance and analyte concentration at a specific wavelength [22]. The accuracy of the entire spectroscopic system is therefore contingent upon the proper functioning of all components, including the light source, wavelength selector, and detector, in maintaining this relationship for the analyte of interest within a complex matrix [22].
Signaling Pathway for Accuracy Assessment
The following diagram illustrates the logical decision-making pathway for assessing the accuracy of an analytical method based on recovery study results.
Experimental Protocol
Research Reagent Solutions
The following table catalogues the essential materials and reagents required to execute the recovery studies for favipiravir quantification.
Table 1: Essential Research Reagents and Materials
| Reagent/Material | Specification | Function in Experiment |
|---|---|---|
| Favipiravir API | High Purity (>98%) | Active Pharmaceutical Ingredient; provides the reference standard for recovery calculations [24]. |
| Ethanol (or Diluent) | HPLC/UV Grade | Solvent for dissolving favipiravir and preparing standard/sample solutions; ensures no UV interference [24] [52]. |
| Placebo Mixture | Tablet Excipients | A blend of inert components (e.g., lactose, starch) used to mimic the tablet matrix without the API. |
| Volumetric Flasks | Class A, Various Sizes | For precise preparation and dilution of standard and sample solutions to required volumes. |
| UV-Vis Spectrophotometer | - | Instrument for measuring the absorbance of favipiravir solutions at the λmax (~323 nm) [24] [22]. |
| Analytical Balance | Sensitivity 0.1 mg | For accurate weighing of the API and placebo components. |
Sample Preparation Workflow
The procedural workflow for preparing and analyzing recovery samples for favipiravir is systematic and involves multiple critical steps, as visualized below.
Detailed Methodology
Standard Solution Preparation: Accurately weigh approximately 100 mg of favipiravir reference standard and transfer to a 100 mL volumetric flask. Dissolve and make up to volume with ethanol to obtain a primary stock solution of 1000 µg/mL. Prepare a working standard solution by appropriate dilution to a concentration within the linear range (e.g., 20-60 µg/mL) [24].
Preparation of Recovery Samples: Weigh and transfer placebo mixture equivalent to one tablet into three separate 100 mL volumetric flasks, representing three concentration levels (e.g., 80%, 100%, 120% of the target test concentration). To these flasks, add known amounts of favipiravir API corresponding to the 80%, 100%, and 120% levels. Dissolve the contents and dilute to volume with ethanol. Filter if necessary [24] [54].
Procedure: Measure the absorbance of the prepared standard and recovery sample solutions at the wavelength of maximum absorption (λmax ≈ 323 nm for favipiravir) against a blank of ethanol [24] [22]. Perform each analysis in triplicate.
Calculation: The percentage recovery is calculated using the formula:
- % Recovery = (Found Concentration / Added Concentration) × 100
The found concentration is determined from the calibration curve of the standard. The overall recovery is expressed as the mean % recovery from all replicates across the different concentration levels [45] [24].
Data Presentation and Acceptance Criteria
Representative Recovery Data for Favipiravir
The following table summarizes typical recovery data for favipiravir in tablet formulations using a UV-Vis spectroscopic method, adhering to standard validation protocols.
Table 2: Representative Recovery Data for Favipiravir from Tablet Formulation [24]
| Spiking Level (%) | Amount Added (µg/mL) | Amount Found (Mean ± SD, µg/mL) | % Recovery (Mean) | % RSD |
|---|---|---|---|---|
| 80% | 32.0 | 31.8 ± 0.45 | 99.4 | 1.41 |
| 100% | 40.0 | 40.1 ± 0.38 | 100.3 | 0.95 |
| 120% | 48.0 | 47.7 ± 0.51 | 99.4 | 1.07 |
SD: Standard Deviation; RSD: Relative Standard Deviation (a measure of precision)
Interpreting Results and Compliance
For an analytical method to be considered accurate, the recovery results should meet predefined acceptance criteria, typically derived from ICH guidelines. The data in Table 2 demonstrate excellent accuracy, with all mean recovery values falling well within the acceptable range of 98–102% [45] [24]. Furthermore, the low %RSD values (< 2%) at each level confirm that the method is precise alongside being accurate. This combination validates the method's fitness for the quantitative analysis of favipiravir in tablets.
In the development and validation of a UV-Vis spectroscopic method for the quantification of active pharmaceutical ingredients (APIs) such as favipiravir in tablets, establishing sensitivity parameters is a critical requirement under ICH guidelines [45]. The Limit of Detection (LOD) and Limit of Quantitation (LOQ) define the fundamental capabilities of an analytical procedure. The LOD is the lowest concentration of an analyte that can be detected, but not necessarily quantified, under the stated experimental conditions. The LOQ is the lowest concentration that can be quantitatively determined with suitable precision and accuracy [55]. For favipiravir, a broad-spectrum antiviral agent, precise and sensitive methods are essential for quality control and ensuring therapeutic efficacy [56]. This document outlines the theoretical principles and provides detailed protocols for the determination of LOD and LOQ, specifically within the context of a UV-Vis method for favipiravir quantification in pharmaceutical dosage forms.
Theoretical Foundations of LOD and LOQ
The determination of LOD and LOQ is based on the measurement of the signal-to-noise ratio of the analytical method. The Limit of Blank (LoB) is a related concept, defined as the highest apparent analyte concentration expected to be found when replicates of a blank sample (containing no analyte) are tested [55]. The relationships between these parameters are illustrated in the following diagram, which shows how the analytical responses of blank and low-concentration samples are used to establish the LOD.
The Clinical and Laboratory Standards Institute (CLSI) guideline EP17 provides a standardized approach, defining LOD as the lowest analyte concentration likely to be reliably distinguished from the LoB [55]. The mathematical expressions are:
- LoB = meanblank + 1.645(SDblank). This establishes a threshold where only 5% of blank measurements are expected to produce a false positive.
- LOD = LoB + 1.645(SD_low concentration sample). This ensures that a concentration at the LOD will produce a signal that exceeds the LoB with 95% confidence [55].
A practical and widely accepted alternative for calculating LOD and LOQ, endorsed by ICH guidelines Q2(R1) and Q2(R2), is based on the standard deviation of the response and the slope of the calibration curve [50] [45]. This method is particularly suited for chromatographic and spectroscopic techniques during method validation.
Experimental Protocols for Favipiravir Analysis
Sample Preparation
- Standard Stock Solution: Accurately weigh 10 mg of favipiravir reference standard and transfer to a 100 mL volumetric flask. Dissolve in and make up to volume with methanol to obtain a primary stock solution of 100 µg/mL [6].
- Working Solutions: Prepare serial dilutions of the stock solution in methanol or an appropriate solvent to construct a calibration curve in the range of 4–22 µg/mL, which is a typical linear range for favipiravir UV analysis at 323 nm [6] [24].
LOD and LOQ Determination via Calibration Curve
This protocol details the calculation of LOD and LOQ based on the standard deviation of the response and the slope of the calibration curve, a method frequently employed in UV-spectrophotometric assays [50].
- Calibration Curve Construction: Prepare and analyze a minimum of six concentration levels of favipiravir within the 4–22 µg/mL range. Measure the absorbance of each solution at the λmax of 323 nm [24].
- Statistical Calculation:
- Slope (b): Determine the slope (b) of the calibration curve from the linear regression analysis.
- Standard Deviation (σ): Calculate the standard deviation of the y-intercepts of the regression lines or, more commonly, the standard deviation of the response for a low-concentration sample or from the residual standard deviation of the regression [50].
- Calculation:
- Apply the formulas
LOD = 3.3 × (σ / b)andLOQ = 10 × (σ / b)to determine the sensitivity parameters [50].
- Apply the formulas
LOD and LOQ Determination via Signal-to-Noise Ratio
This approach is often used in chromatographic methods but is also applicable to spectroscopic techniques.
- Preparation: Prepare a favipiravir solution at a concentration that is approximately expected to be near the LOQ.
- Measurement: Measure the absorbance of this solution and calculate the signal-to-noise (S/N) ratio by comparing the measured signal of the analyte peak with the background noise observed in a blank sample.
- Calculation:
- An S/N ratio of 3:1 is generally accepted for estimating the LOD.
- An S/N ratio of 10:1 is generally accepted for estimating the LOQ.
Data Presentation and Analysis
Reported LOD and LOQ values for favipiravir from the literature demonstrate the sensitivity of different analytical methods. The following table summarizes representative data for UV-Vis and HPLC methods.
Table 1: Reported Sensitivity Parameters for Favipiravir Analysis
| Analytical Method | Linear Range (µg/mL) | LOD (µg/mL) | LOQ (µg/mL) | Reference Context |
|---|---|---|---|---|
| UV-Vis Spectrophotometry | 20 - 60 [24] | 3.5 [24] | 12 [24] | Direct measurement at 323 nm. |
| UV-Vis Spectrophotometry | 4 - 22 [6] | Not Specified | Not Specified | Direct, dual wavelength, derivative, and difference methods. |
| RP-HPLC | 10 - 50 [24] | 1.0 [24] | 3.5 [24] | C18 column, ammonium acetate buffer pH 6.5: Methanol mobile phase. |
| Stability-Indicating HPLC | Varies by study | Can be as low as ng/mL level [56] | Can be as low as ng/mL level [56] | Used for determination in presence of degradation products. |
The experimental workflow for determining these parameters, from sample preparation to final calculation, is summarized below.
The Scientist's Toolkit: Research Reagent Solutions
The following table lists key materials and reagents required for the development and validation of a UV-Vis spectroscopic method for favipiravir.
Table 2: Essential Reagents and Materials for Favipiravir UV-Vis Analysis
| Reagent/Material | Specification/Function | Application Context in Favipiravir Analysis |
|---|---|---|
| Favipiravir Reference Standard | High-purity compound (>98%) for preparing primary standard solutions. | Used to prepare stock and working solutions for calibration curve [24]. |
| Methanol | Spectroscopic grade solvent for dissolving favipiravir and preparing dilutions. | Common solvent for preparing stock and sample solutions due to favipiravir's solubility [6] [24]. |
| Hydrochloric Acid (HCl) | Analytical grade for forced degradation studies. | Used to prepare acid-induced degradation products for stability-indicating methods [6]. |
| Sodium Hydroxide (NaOH) | Analytical grade for pH adjustment and forced degradation studies. | Used for neutralization after acid degradation and in difference spectrophotometry [6]. |
| Volumetric Glassware | Class A volumetric flasks and pipettes for accurate solution preparation. | Essential for precise dilution and preparation of standard and sample solutions [6] [50]. |
| Membrane Filter | 0.45 µm porosity for sample filtration. | Used to filter sample solutions from tablet matrices before analysis to remove particulate matter [6]. |
Within pharmaceutical research and quality control (QC), selecting an appropriate analytical technique is paramount for ensuring drug efficacy and safety. This application note provides a detailed comparative analysis of two fundamental techniques—UV-Vis Spectroscopy and High-Performance Liquid Chromatography (HPLC)—for the quantification of Favipiravir in tablet formulations. Favipiravir, a broad-spectrum antiviral agent, has been widely used in the treatment of COVID-19, necessitating robust and reliable assay methods for pharmaceutical dosage forms [7]. The content is structured to serve as a practical guide for researchers and scientists, offering validated protocols, performance data, and strategic insights for method selection within a drug development context.
Performance Comparison: UV-Vis vs. HPLC
The choice between UV-Vis and HPLC hinges on the specific requirements of the analysis, such as the need for simplicity, sensitivity, or specificity. The table below summarizes the typical performance characteristics of both methods for Favipiravir assay in tablets.
Table 1: Comparative Performance of UV-Vis and HPLC Methods for Favipiravir Assay
| Parameter | UV-Vis Spectrophotometry | High-Performance Liquid Chromatography (HPLC) |
|---|---|---|
| Analytical Principle | Measurement of absorbance of ultraviolet or visible light by the analyte [6]. | Separation of components followed by on-line detection (e.g., UV) [7] [57]. |
| Key Advantage | Simplicity, rapidity, cost-effectiveness, minimal solvent consumption [7]. | High specificity, ability to separate analyte from excipients and degradants, multi-analyte capability [7] [57]. |
| Key Limitation | Low specificity; susceptible to interference from excipients or degradation products with overlapping spectra [6]. | Higher instrumental and operational cost, more complex method development, higher solvent consumption. |
| Linearity Range | 4-22 µg/mL [6] / 10-60 µg/mL [7] | 10-50 µg/mL [57] |
| Detection Wavelength | 227 nm [7], 323 nm [6] | 227 nm [7], 230 nm [57], 323 nm [13] |
| Accuracy (% Recovery) | 99.83 - 100.45% [7] | 99.57 - 100.10% [7]; 99.59-100.08% (for a multi-drug method) [57] |
| Precision (RSD %) | < 2% [6]; Intra- and inter-day RSD < 1.68% [7] | < 2% [13]; Typically < 1.1% [57] |
| Limit of Detection (LOD) | Not reported in core studies, but methods are suitable for QC of formulations. | 0.415–0.946 µg/mL (for a multi-drug method) [57] |
| Analysis Time | A few minutes per sample (rapid scan). | ~6-10 minutes per sample runtime [7] [57]. |
| Greenness Profile | Generally superior due to minimal solvent use [6]. | Can be optimized for greenness (e.g., using AQbD [13]), but typically has a higher environmental impact. |
Detailed Experimental Protocols
UV-Vis Spectrophotometry Protocol for Favipiravir
This protocol is adapted from published methods for the direct UV assay of Favipiravir in tablets [7] [6].
Research Reagent Solutions
Table 2: Essential Reagents and Materials for UV-Vis Protocol
| Reagent/Material | Function | Specification/Note |
|---|---|---|
| Favipiravir Reference Standard | Primary standard for calibration curve construction | Purity ≥ 99% [6]. |
| Favipiravir Tablets | Test pharmaceutical formulation | e.g., 200 mg tablet strength. |
| Deionized Water | Solvent for dilution | HPLC grade or equivalent purity. |
| Methanol | Alternative solvent for extraction | HPLC grade [6]. |
| Volumetric Flasks | For precise preparation of standard and sample solutions | Class A; 10, 50, 100 mL. |
| UV Cuvettes | Holder for sample during measurement | Quartz, 1 cm path length. |
| Syringe Filter | Clarification of sample solutions | 0.45 µm pore size, nylon or PTFE [6]. |
Procedure
- Standard Stock Solution (100 µg/mL): Accurately weigh 10 mg of Favipiravir reference standard and transfer to a 100 mL volumetric flask. Dissolve and dilute to volume with deionized water or methanol. Sonicate to ensure complete dissolution [7] [6].
- Calibration Standards: Pipette appropriate aliquots (e.g., 0.4, 0.8, 1.2, 1.6, 2.2 mL) of the stock solution into a series of 10 mL volumetric flasks. Dilute to volume with the same solvent to obtain concentrations in the range of 4-22 µg/mL [6].
- Sample Preparation (Tablet Extract):
- Weigh and finely powder not less than 10 tablets.
- Accurately weigh a portion of the powder equivalent to about 10 mg of Favipiravir and transfer to a 100 mL volumetric flask.
- Add approximately 70 mL of solvent, sonicate for 15-30 minutes to extract the API, and cool to room temperature.
- Dilute to volume with the solvent and mix well.
- Filter a portion of the solution through a 0.45 µm syringe filter, discarding the first few mL of the filtrate [6].
- Further dilute the filtrate with solvent to obtain a final concentration within the linear range of the calibration curve.
- Measurement: Using a double-beam UV-Vis spectrophotometer, scan the standard and sample solutions against a solvent blank over the range of 200-400 nm. Record the absorbance at the selected wavelength (e.g., 323 nm).
- Calculation: Construct a calibration curve by plotting the absorbance of the standard solutions versus their respective concentrations. Determine the concentration of Favipiravir in the sample solution using the regression equation of the calibration curve. Calculate the drug content in the tablet formulation.
HPLC-UV Protocol for Favipiravir
This protocol describes an isocratic reversed-phase HPLC method for the assay of Favipiravir, consistent with several validated approaches [7] [57].
Research Reagent Solutions
Table 3: Essential Reagents and Materials for HPLC Protocol
| Reagent/Material | Function | Specification/Note |
|---|---|---|
| Favipiravir Reference Standard | Primary standard for calibration | Purity ≥ 99% [57]. |
| HPLC Grade Water | Component of mobile phase | Resistivity 18.2 MΩ·cm. |
| HPLC Grade Acetonitrile/Methanol | Organic modifier in mobile phase | Acetonitrile is most common [7] [13]. |
| Sodium Acetate / Phosphate Buffer | Aqueous buffer component of mobile phase | e.g., 50 mM, pH adjusted to 3.0-3.1 with glacial acetic acid or ortho-phosphoric acid [7] [13] [57]. |
| Syringe Filter | Filtration of mobile phase and sample solutions | 0.45 µm (or 0.22 µm) pore size, compatible with HPLC. |
| HPLC Vials | Containment for samples in autosampler | With caps and PTFE-lined septa. |
Procedure
- Mobile Phase Preparation: Prepare a mixture of 50 mM sodium acetate buffer (pH 3.0) and acetonitrile in a ratio of 85:15 (v/v). Alternatively, a water:methanol (30:70, v/v, pH 3.0) mixture can be used [7] [57]. Filter through a 0.45 µm membrane filter and degas by sonication.
- Standard Stock Solution (1000 µg/mL): Accurately weigh 100 mg of Favipiravir reference standard into a 100 mL volumetric flask. Dissolve and dilute to volume with the mobile phase or methanol.
- Calibration Standards: Dilute the stock solution with mobile phase to obtain a working standard solution (e.g., 100 µg/mL). Further dilute to prepare calibration standards in the range of 10-50 µg/mL.
- Sample Preparation (Tablet Extract):
- Weigh and finely powder not less than 10 tablets.
- Accurately weigh a portion of the powder equivalent to about 50 mg of Favipiravir into a 50 mL volumetric flask.
- Add about 30 mL of mobile phase or methanol, sonicate for 30 minutes, and dilute to volume.
- Filter a portion through a 0.45 µm syringe filter.
- Dilute the filtrate further with mobile phase to obtain a final concentration within the calibration range [7].
- Chromatographic Conditions:
- System Suitability: Before sample analysis, inject the standard solution to ensure the system meets acceptance criteria (e.g., RSD for peak area and retention time < 2%, tailing factor < 2.0, theoretical plates > 2000).
- Analysis and Calculation: Inject the standard and sample solutions. Identify the Favipiravir peak in the sample by comparing its retention time with that of the standard. Quantify the amount of Favipiravir in the sample by comparing the peak areas using the external standard method.
Strategic Workflow and Application Guidance
The following diagram illustrates the decision-making workflow for selecting the appropriate analytical technique based on the analytical objectives.
Figure 1: Method Selection Workflow for Favipiravir Assay
Application Scenarios
- UV-Vis Spectrophotometry is the ideal choice for routine quality control in a manufacturing environment where the formulation is simple, the API is stable, and the goal is rapid, cost-effective release testing of a high number of samples. Its simplicity also makes it suitable for laboratories with limited analytical instrumentation [7].
- HPLC-UV is indispensable for method development and stability studies. Its superior separation power allows it to distinguish Favipiravir from its acid hydrolysis degradation product and other potential impurities, providing a true stability-indicating method [6]. It is also the preferred technique for analyzing combination formulations or for research purposes where maximum data integrity is required [57].
Both UV-Vis spectrophotometry and HPLC are validated and effective techniques for the quantification of Favipiravir in pharmaceutical tablets. The decision between them is not a matter of which is superior, but which is most fit-for-purpose. UV-Vis offers unparalleled simplicity, speed, and economy for routine analysis of simple formulations. In contrast, HPLC provides definitive specificity and robustness for complex analyses, including stability-indicating methods and assays of combination products. The protocols and data provided herein equip researchers with the necessary information to make an informed selection and successfully implement either method in their work on Favipiravir quantification.
Conclusion
The outlined UV-Vis spectroscopic method provides a scientifically sound, cost-effective, and efficient strategy for the quantification of favipiravir in tablet formulations. Its successful validation against ICH guidelines confirms its reliability for routine quality control in pharmaceutical settings, offering a practical alternative to more complex and expensive HPLC methods. For future work, this foundational method can be extended to dissolution testing, stability studies, and potentially adapted for analysis in biological fluids, thereby supporting ongoing biomedical research and ensuring the consistent quality of this critical antiviral medication.
References
- 1. Favipiravir [https://en.wikipedia.org/wiki/Favipiravir]
- 2. Favipiravir: Uses, Interactions, Mechanism of Action [https://go.drugbank.com/drugs/DB12466]
- 3. Role of favipiravir in the treatment of COVID-19 - PMC [https://pmc.ncbi.nlm.nih.gov/articles/PMC7831863/]
- 4. Favipiravir as a potential countermeasure against ... [https://www.sciencedirect.com/science/article/abs/pii/S0166354218300172]
- 5. Favipiravir 259793-96-9 | Tokyo Chemical Industry Co. ... [https://www.tcichemicals.com/OP/en/p/F1296]
- 6. Spectrophotometric determination of favipiravir in presence of ... [https://bmcchem.biomedcentral.com/articles/10.1186/s13065-023-01046-6]
- 7. Comparison of HPLC and UV Spectrophotometric Methods ... [https://pmc.ncbi.nlm.nih.gov/articles/PMC8653657/]
- 8. A solvent-free HPLC method for the simultaneous ... [https://www.nature.com/articles/s41598-023-45618-x]
- 9. Quantitative analysis of two COVID-19 antiviral agents ... [https://pmc.ncbi.nlm.nih.gov/articles/PMC10273576/]
- 10. a systematic review and meta-analysis of clinical trials [https://www.nature.com/articles/s41598-021-90551-6]
- 11. A New Validated UV Spectroscopic Method for the ... [https://ajpaonline.com/AbstractView.aspx?PID=2024-14-2-3]
- 12. A Potential Therapeutic Drug Against Covid-19 Virus, in ... [https://link.springer.com/article/10.1007/s11094-023-02807-2]
- 13. Development and validation of a novel isocratic RP-HPLC ... [https://www.sciencedirect.com/science/article/pii/S092809872500274X]
- 14. Analytical Method Development and Validation and Forced ... [https://hal.science/hal-05271817]
- 15. A quality-by-design optimized LC method for navigating ... [https://pmc.ncbi.nlm.nih.gov/articles/PMC12357339/]
- 16. Development and validation of a RP-HPLC method for ... [https://pubmed.ncbi.nlm.nih.gov/40664729/]
- 17. Advantages and Applications of UV-Vis Analysis [https://www.richmondscientific.com/advantages-and-applications-of-uv-vis-analysis?srsltid=AfmBOorYrHn0WPgP5p1U9VjjrrP1HaQEyCZ7MiKXDD5wJ7CV-YwHXyBn]
- 18. How UV Vis Spectroscopy Revolutionizes Quality Control [https://microbiozindia.com/how-uv-vis-spectroscopy-revolutionizes-quality-control/]
- 19. The Essence of Modern HPLC: Advantages, Limitations ... [https://www.chromatographyonline.com/view/essence-modern-hplc-advantages-limitations-fundamentals-and-opportunities]
- 20. Optimization of HPLC methods for the development ... [https://pmc.ncbi.nlm.nih.gov/articles/PMC12105191/]
- 21. Top 7 Benefits of Using HPLC for Manufacturing Quality ... [https://www.thermofisher.com/blog/analyteguru/top-7-benefits-of-using-hplc-for-manufacturing-quality-control/]
- 22. UV-Vis Spectroscopy: Principle, Strengths and Limitations ... [https://www.technologynetworks.com/analysis/articles/uv-vis-spectroscopy-principle-strengths-and-limitations-and-applications-349865]
- 23. What Is HPLC and Why Is It So Commonly Used ... [https://vicihealthsciences.com/what-is-hplc/]
- 24. New Analytical Methods for the Determination of New ... [https://pmc.ncbi.nlm.nih.gov/articles/PMC9838498/]
- 25. In-hospital mortality outcomes of favipiravir in patients with ... [https://pmc.ncbi.nlm.nih.gov/articles/PMC12136412/]
- 26. Comparative Pharmacovigilance Analysis of Approved and ... [https://pmc.ncbi.nlm.nih.gov/articles/PMC12189552/]
- 27. COVID-19 medicines | European Medicines Agency (EMA) [https://www.ema.europa.eu/en/human-regulatory-overview/public-health-threats/coronavirus-disease-covid-19/covid-19-medicines]
- 28. Experimental and theoretical study of the Favipiravir ... [https://www.sciencedirect.com/science/article/abs/pii/S0167732224006597]
- 29. Quantitative analysis of two COVID-19 antiviral agents ... [https://bmcchem.biomedcentral.com/articles/10.1186/s13065-023-00967-6]
- 30. the recently approved antivirals for COVID-19 treatment [https://www.sciencedirect.com/science/article/abs/pii/S1386142522012185]
- 31. Spectrophotometric determination of favipiravir in presence ... [https://pubmed.ncbi.nlm.nih.gov/37777796/]
- 32. Green chemometric-assisted UV -spectrophotometric methods for the... [https://bmcchem.biomedcentral.com/articles/10.1186/s13065-024-01168-5]
- 33. Spectrophotometric determination of favipiravir in presence ... [https://pmc.ncbi.nlm.nih.gov/articles/PMC10542695/]
- 34. Ultra-performance Liquid Chromatography Method [https://www.ijpsonline.com/articles/development-and-validation-of-favipiravir-severe-acute-respiratory-syndrome-coronavirus-2-drug-by-dissolution-method-with-filter-c-5061.html?view=mobile]
- 35. The Development and the Validation of a Novel Dissolution ... [https://www.mdpi.com/2218-0532/90/1/3]
- 36. Favipiravir (SARS‐CoV‐2) degradation impurities [https://pmc.ncbi.nlm.nih.gov/articles/PMC9073977/]
- 37. What Is a Calibration Curve in a Spectrophotometer? [https://www.hunterlab.com/blog/what-is-a-calibration-curve-in-a-spectrophotometer/]
- 38. 4.4: UV-Visible Spectroscopy [https://chem.libretexts.org/Bookshelves/Analytical_Chemistry/Physical_Methods_in_Chemistry_and_Nano_Science_(Barron)/04%3A_Chemical_Speciation/4.04%3A_UV-Visible_Spectroscopy]
- 39. The anti-COVID-19 drug Favipiravir: Degradation, Method ... [https://pmc.ncbi.nlm.nih.gov/articles/PMC9251027/]
- 40. Development and Validation of UV Spectroscopic method ... [https://www.ijfmr.com/research-paper.php?id=17030]
- 41. Development and validation of a RP-HPLC method for ... [https://pmc.ncbi.nlm.nih.gov/articles/PMC12264094/]
- 42. Effect of Excipients on the Quality of Drug Formulation and ... [https://pmc.ncbi.nlm.nih.gov/articles/PMC10146418/]
- 43. Pharmaceutical excipients – where do we begin? [https://australianprescriber.tg.org.au/articles/pharmaceutical-excipients-where-do-we-begin.html]
- 44. Development and validation of method for analysis ... [https://pmc.ncbi.nlm.nih.gov/articles/PMC10203959/]
- 45. “A REVIEW OF ANALYTICAL METHOD DEVELOPMENT ... [https://jptcp.com/index.php/jptcp/article/view/11705]
- 46. Analytical methods for favipiravir: A critical review of ... [https://www.sciencedirect.com/science/article/pii/S0026265X25006009]
- 47. Comparison of HPLC and UV Spectrophotometric Methods ... [https://brieflands.com/journals/ijpr/articles/124310]
- 48. ICH Q2(R2) Validation of analytical procedures [https://www.ema.europa.eu/en/ich-q2r2-validation-analytical-procedures-scientific-guideline]
- 49. Q2(R2) Validation of Analytical Procedures March 2024 [https://www.fda.gov/regulatory-information/search-fda-guidance-documents/q2r2-validation-analytical-procedures]
- 50. Development and validation of the UV-spectrophotometric ... [https://pmc.ncbi.nlm.nih.gov/articles/PMC3658052/]
- 51. Analytical Method Development and Validation of UV- ... [https://juniperpublishers.com/gjpps/GJPPS.MS.ID.555735.php]
- 52. Asian Journal of Pharmaceutical Analysis [https://ajpaonline.com/HTMLPaper.aspx?Journal=Asian%20Journal%20of%20Pharmaceutical%20Analysis;PID=2024-14-2-3]
- 53. Specifying accuracy and precision criteria for ultraviolet ... [https://www.spectroscopyeurope.com/quality/specifying-accuracy-and-precision-criteria-ultraviolet-spectrometers]
- 54. Determination of Antiviral Drug, Favipiravir by a Stability- ... [https://www.orientjchem.org/staging/vol40no3/determination-of-antiviral-drug-favipiravir-by-a-stability-indicating-chromatographic-method/]
- 55. Limit of Blank, Limit of Detection and Limit of Quantitation [https://pmc.ncbi.nlm.nih.gov/articles/PMC2556583/]
- 56. Analytical methods for favipiravir: A critical review of ... [https://www.sciencedirect.com/science/article/abs/pii/S0026265X25006009]
- 57. Development and validation of a RP-HPLC method for ... [https://www.nature.com/articles/s41598-025-09904-0]