EDS vs WDS: Choosing the Right Elemental Analysis Technique for Biomedical Research
This article provides a comprehensive comparison of Energy Dispersive X-ray Spectroscopy (EDS) and Wavelength Dispersive Spectroscopy (WDS) for qualitative elemental analysis, tailored for researchers and professionals in drug development and...
EDS vs WDS: Choosing the Right Elemental Analysis Technique for Biomedical Research
Abstract
This article provides a comprehensive comparison of Energy Dispersive X-ray Spectroscopy (EDS) and Wavelength Dispersive Spectroscopy (WDS) for qualitative elemental analysis, tailored for researchers and professionals in drug development and biomedical sciences. It covers the fundamental operating principles, explores specific methodological applications from nanoparticle drug delivery to environmental pollutant detection, offers troubleshooting guidance for common analytical challenges like peak overlaps and trace element identification, and delivers a direct performance comparison to validate technique selection. The goal is to empower scientists with the knowledge to optimize their analytical strategy for accurate and reliable elemental characterization in complex biological samples.
The Core Principles: How EDS and WDS Work
When a high-energy electron beam interacts with a solid sample in a scanning electron microscope (SEM), it generates various signals that can be exploited for analytical purposes. Among these signals, characteristic X-rays are paramount for elemental composition analysis, forming the fundamental basis for both Energy Dispersive X-ray Spectroscopy (EDS/EDX) and Wavelength Dispersive X-ray Spectroscopy (WDS). The physical process begins when the incident electrons from the SEM beam possess sufficient energy to eject inner-shell electrons from atoms within the sample, creating electron vacancies [1] [2]. To stabilize the atom, an electron from a higher-energy outer shell fills this vacancy, and the excess energy is emitted as an X-ray photon [2].
The energy of this emitted X-ray is precisely equal to the difference in energy between the two electron orbitals involved in the transition. Since these energy levels are unique for each element, the resulting X-rays are "characteristic," serving as a fingerprint for the element from which they originate [3] [4]. Two primary techniques are used to detect and analyze these X-rays: EDS, which separates and detects X-rays based on their energy, and WDS, which separates them based on their wavelength [5]. This fundamental difference in detection philosophy leads to significant practical implications for analytical performance, which this guide will explore in the context of qualitative elemental analysis.
Analytical Technique Comparison: EDS vs. WDS
Although EDS and WDS are built upon the same physical phenomenon of characteristic X-ray emission, their operational principles diverge significantly, leading to distinct performance profiles.
Energy Dispersive X-ray Spectroscopy (EDS) utilizes a solid-state detector, typically a Silicon Drift Detector (SDD), to measure the energy of incoming X-ray photons simultaneously. When an X-ray strikes the detector, it generates a charge pulse proportional to the X-ray's energy. This signal is processed to build a spectrum—a histogram of X-ray counts versus energy—that identifies the elements present [1] [2]. This method is known for its speed and ability to capture the entire spectrum of elements at once.
Wavelength Dispersive X-ray Spectroscopy (WDS) operates on a different principle. It uses analyzing crystals to diffract X-rays according to Bragg's law (nλ = 2d sinθ), where each wavelength (λ) is constructively interfered at a specific angle (θ) [5]. By mechanically moving the crystal and detector along the Rowland circle, the spectrometer can scan through a range of wavelengths. Unlike EDS, WDS measures the intensity of one specific X-ray line at a time, which is the fundamental reason for its superior spectral resolution but slower data acquisition [6].
Table 1: Fundamental Operational Differences Between EDS and WDS
| Parameter | Energy Dispersive Spectroscopy (EDS) | Wavelength Dispersive Spectroscopy (WDS) |
|---|---|---|
| Detection Principle | Measures X-ray energy with solid-state detector [5] | Diffracts X-rays by wavelength using analyzing crystals [5] |
| Data Acquisition | Simultaneous for all elements [6] | Sequential measurement for each element/wavelength [6] |
| Typical Detector | Silicon Drift Detector (SDD) [2] | Proportional counter [6] |
Performance Comparison for Qualitative Analysis
The core distinction in operational principles translates directly into tangible differences in analytical performance, which are critical for researchers to consider when selecting a technique.
Spectral Resolution and Peak Overlap
Spectral resolution is arguably the most significant differentiator. EDS typically provides an energy resolution between 50-250 eV, while WDS offers a much higher resolution, generally between 3-30 eV [6]. This order-of-magnitude improvement allows WDS to cleanly separate closely spaced X-ray peaks that are irreducibly overlapped in an EDS spectrum [6]. For example, the WDS spectrum can clearly resolve the S Kα and Mo Lα peaks, whereas in an EDS spectrum, they appear as a single, unresolved peak [6]. This superior resolution eliminates the need for complex spectral deconvolution software, increasing confidence in element identification, especially in complex samples containing elements with overlapping lines.
Detection Limits and Trace Sensitivity
The minimum detection limit defines the smallest concentration of an element that a technique can reliably identify. For EDS, this limit is typically around 0.1 wt% (1000 ppm) under routine conditions [6] [7]. In contrast, WDS boasts significantly lower detection limits, often reaching 0.01 wt% (100 ppm) or better for many elements [6] [7]. This two-order-of-magnitude improvement is due to the dramatically higher peak-to-background (P/B) ratio achieved by WDS [6]. The background intensity in a WDS spectrum is significantly lower, allowing very small intensity peaks from trace elements to be discovered, whereas they would be lost in the background noise of an EDS spectrum.
Light Element Sensitivity
Analyzing light elements (e.g., Boron, Carbon, Nitrogen, Oxygen) presents a particular challenge because they emit relatively few low-energy X-rays that are easily absorbed. WDS employs specialized multi-layered crystals designed to maximize scattering efficiency for the long wavelengths produced by light elements [6]. This makes WDS particularly advantageous for detecting low concentrations of light elements, such as measuring carbon in steel or boron in inclusions, where EDS may suffer from low count rates and poor peak-to-background ratios [6].
Table 2: Qualitative Analytical Performance: EDS vs. WDS
| Performance Metric | Energy Dispersive Spectroscopy (EDS) | Wavelength Dispersive Spectroscopy (WDS) |
|---|---|---|
| Spectral Resolution | 50 - 250 eV [6] [4] | 3 - 30 eV (≈10x better) [6] |
| Minimum Detection Limit | ~0.1 wt% (1000 ppm) [6] [7] | ~0.01 wt% (100 ppm) or better [6] [7] |
| Peak-to-Background Ratio | Lower | Significantly higher (improves trace detection) [6] |
| Light Element Analysis | Standard performance | Enhanced sensitivity with specialized crystals [6] |
| Analytical Speed | Very fast; "point and press" analysis [6] | Slower due to sequential measurement [6] |
Experimental Evidence and Case Studies
Silicon Wafer Contaminant Detection
The limitations of EDS and the complementary role of WDS are clearly demonstrated in semiconductor wafer inspection. A key challenge is identifying nanoscale contaminants, such as a 3 nm thick tungsten (W) film on a silicon (Si) wafer. The strong Si Kα peak in an EDS spectrum has a broad full width at tenth maximum (FWTM) of approximately 200 eV, which obscures the weak W Mα peak at 1.774 keV [8]. In this scenario, EDS cannot reliably detect the tungsten contaminant due to the severe peak overlap and low peak-to-background ratio.
Experimental Protocol:
- Sample: A Si wafer with a deposited 3.0 nm W film.
- Instrumentation: Field emission SEM equipped with both EDS and WDS detectors.
- Conditions: Accelerating voltages from 3.0 to 15.0 kV; beam current of 5 nA.
- WDS Method: Reduced scans around the W Mα line with dwell times of 0.5-5 seconds per channel.
Results: WDS, with its superior resolution, cleanly separated the W Mα peak from the Si Kα tail. The highest W peak-to-background ratio (3.0) was achieved at 3.0 kV with a 1-second dwell time, confirming the presence of tungsten with statistical significance. This study validated WDS as a viable solution for identifying sub-10 nm contaminants that are undetectable by EDS alone under typical analysis conditions [8].
Analysis of Deacidified Paper
A 2025 study comparing SEM-EDS and SEM-WDS for assessing the distribution of alkaline components in deacidified paper cross-sections provides further evidence of WDS's accuracy. Researchers found that SEM-EDS produced false signals that could lead to an overestimation of alkaline presence, likely due to spectral overlaps and higher background [7]. In contrast, SEM-WDS provided more accurate and spatially resolved elemental distribution data, enabling a direct correlation of alkali distribution with local neutralization effects in the paper matrix. This study highlighted WDS's capability for precise mapping in complex, low-contrast organic systems [7].
Essential Research Reagent Solutions
The following reagents and materials are fundamental for preparing samples and ensuring accurate analysis for both EDS and WDS.
Table 3: Key Research Reagents and Materials for X-ray Microanalysis
| Reagent/Material | Function in Preparation/Analysis |
|---|---|
| Conductive Coatings (Carbon, Gold) | Applied to non-conductive samples to prevent charging effects that distort imaging and analysis [4] [5]. |
| Polishing Supplies (Abrasive Pads, Diamond Suspensions) | For creating a flat, featureless surface, which is critical for accurate quantitative analysis, especially in WDS [4] [5]. |
| Embedding Resins (Epoxy) | Used to mount and support fragile or particulate samples for cross-sectioning and polishing [9]. |
| Analyzing Crystals (TAP, PET, LIF) | Specialized crystals in WDS spectrometers that diffract specific X-ray wavelength ranges according to Bragg's law [6]. |
| Silicon Drift Detector (SDD) | The heart of a modern EDS system; collects X-rays and converts their energy into an electrical signal for quantification [1] [2]. |
Workflow and Signaling Pathways
The following diagram illustrates the core physical process of characteristic X-ray generation, which is the shared foundation for both EDS and WDS techniques.
The typical workflow for a combined EDS/WDS analysis, as implemented in modern software platforms, is outlined below. This integrated approach maximizes efficiency and data quality.
Both EDS and WDS are powerful techniques rooted in the fundamental physics of characteristic X-ray generation. The choice between them is not a matter of superiority but of strategic application. EDS excels as a rapid, qualitative survey tool for identifying major elements and providing an initial compositional overview with minimal setup. Conversely, WDS serves as a high-precision tool for resolving spectral ambiguities, detecting trace elements, and quantifying light elements with high confidence.
For the most comprehensive analytical strategy, an integrated approach is recommended. Leveraging the speed of EDS for initial screening followed by the high resolution of WDS for specific analytical challenges provides researchers with both efficiency and definitive results, maximizing the return from electron microscope-based microanalysis.
Energy Dispersive X-ray Spectroscopy (EDS), also referred to as EDX or EDXS, is a fundamental microanalytical technique used alongside electron microscopes to determine the elemental composition of a sample. The core principle of EDS involves discriminating the energies of characteristic X-rays generated when a sample is bombarded with a high-energy electron beam. These X-rays are element-specific, and their accurate measurement allows for both qualitative and quantitative analysis. The modern solid-state detector, particularly the Silicon Drift Detector (SDD), is the technological heart of this energy discrimination process, enabling the efficient collection and sorting of X-rays based on their energy [2].
This guide explores the operational principles of energy discrimination in EDS and provides an objective comparison with its complementary technique, Wavelength Dispersive Spectroscopy (WDS). While EDS separates X-rays based on their energy, WDS uses diffraction crystals to separate them based on their wavelength [6]. The choice between these techniques is crucial for researchers, as it directly impacts the accuracy, detection limits, and resolution of elemental analysis in fields ranging from drug development to advanced materials science.
Fundamental Principles of EDS
Characteristic X-ray Generation
The EDS process begins with the interaction of a focused electron beam (from a Scanning Electron Microscope (SEM) or Transmission Electron Microscope (TEM)) with atoms in the sample. This interaction causes the ejection of an inner-shell electron, creating an excited state. When an outer-shell electron fills this vacancy, it releases excess energy in the form of a characteristic X-ray [2]. The energy of this X-ray is precisely determined by the difference in energy levels between the two electron shells, which is a unique property of every element. This forms the foundation for elemental identification [10]. For instance, the transition of an electron from the L shell to fill a vacancy in the K shell produces a Kα X-ray, whose energy is a fingerprint for that specific element [10].
The Energy Discrimination Process
The critical function of the solid-state detector is to measure the energy of each incoming characteristic X-ray. Modern EDS systems use a Silicon Drift Detector (SDD), which has largely superseded older Si(Li) detectors [2] [10].
The operational sequence for energy discrimination is as follows:
- X-ray Absorption: An incoming X-ray photon strikes the silicon crystal of the SDD.
- Electron-Hole Pair Creation: The energy of the X-ray is dissipated within the semiconductor by creating a specific number of electron-hole pairs. The quantity of these pairs is directly proportional to the X-ray's energy. In silicon, approximately 3.8 eV of X-ray energy is required to create a single electron-hole pair [10].
- Charge Collection: A high bias voltage applied across the crystal causes the electrons to drift toward a central read-out anode. This movement of charge generates a small voltage pulse [2] [10].
- Signal Processing: The pulse processor measures the total charge (the height of the voltage pulse), which is directly proportional to the original X-ray energy.
- Spectrum Generation: A multichannel analyzer sorts and counts these pulses by energy, building a histogram that is the EDS spectrum—a plot of X-ray count rate versus energy [2] [10].
To minimize electronic noise, the SDD must be cooled. Unlike older Si(Li) detectors that required liquid nitrogen, SDDs can operate effectively with Peltier cooling to around -25°C [10].
The following diagram illustrates the signaling pathway of an X-ray photon through the EDS detection system.
EDS vs. WDS: A Technical Comparison
While EDS measures the energy of X-rays, Wavelength Dispersive Spectroscopy (WDS) operates on a different physical principle. WDS uses analyzing crystals to diffract X-rays based on their wavelengths according to Bragg's law [6]. A mechanical system moves the crystal and detector along a focusing circle to scan through wavelengths sequentially. This fundamental difference leads to distinct performance characteristics, making EDS and WDS complementary rather than competing techniques.
Table 1: Key Performance Characteristics of EDS and WDS [6] [11] [7].
| Parameter | Energy Dispersive Spectroscopy (EDS) | Wavelength Dispersive Spectroscopy (WDS) |
|---|---|---|
| Analytical Principle | Measures X-ray energy | Measures X-ray wavelength |
| Spectral Resolution | 50-250 eV | 3-30 eV (≈10x better than EDS) |
| Detection Limits | ~0.1 wt% (1000 ppm) | ~0.01 wt% (100 ppm) or better |
| Peak-to-Background Ratio | Lower | Significantly higher (up to 8x higher in some systems) |
| Measurement Speed | Fast; all elements detected simultaneously | Slower; sequential element measurement |
| Typical Use Case | Rapid survey analysis, major/minor elements | Trace elements, resolving severe peak overlaps, high-precision quantification |
| Light Element Analysis | Possible with modern polymer windows | Excellent, with specialized multilayer crystals |
Resolving Peak Overlaps
A critical limitation of EDS is its difficulty in resolving closely spaced X-ray peaks. For example, the peaks for S Kα (2.307 keV) and Mo Lα (2.293 keV), or Si Kα (1.740 keV), W Mα (1.774 keV), and Ta Mα (1.709 keV), are often indistinguishable in an EDS spectrum due to its inherent spectral resolution of 50-250 eV [6] [11] [8]. This can lead to misidentification or inaccurate quantification. WDS, with its superior resolution (10x better), easily separates these overlapping peaks, as shown in a study of a Si-W-Ta sample where EDS failed to differentiate the elements while WDS provided clear, distinct peaks for each [11].
Trace Element Detection
The significantly higher peak-to-background (P/B) ratio of WDS dramatically improves its sensitivity. In a study on steel, WDS was able to characterize low levels of phosphorus and cobalt that were challenging to detect with EDS [6]. For a borosilicate glass sample with 2 wt% boron, the boron peak was hardly visible with EDS but was clearly detected with WDS [11]. This makes WDS indispensable for identifying trace contaminants or dopants at concentrations below the typical EDS detection limit of 0.1 wt% [7].
Table 2: Quantitative Analysis Comparison of a Ni Monocrystal (values in wt%). Data adapted from application note [11].
| Element | EDS Result | Combined EDS/WDS Result | Actual Value | Discrepancy (EDS vs. Actual) |
|---|---|---|---|---|
| Al | 6.30 | 6.62 | - | - |
| Ta | 9.61 | 7.48 | 7.50 | +28% |
| W | 7.57 | 4.75 | 4.75 | +59% |
| Re | 2.19 | 3.01 | 3.00 | -27% |
| Ni | 58.39 | 57.56 | - | - |
Table 2 demonstrates the dramatic improvement in quantitative accuracy when WDS is used for elements suffering from peak overlaps (Ta, W, Re). The EDS-only results show severe discrepancies (up to 59% for W) due to inability to resolve the overlapping peaks, while the combined EDS/WDS results are consistent with the actual values [11].
Experimental Protocols for EDS and WDS Analysis
Protocol: Standardless EDS Qualitative Analysis
This protocol is designed for rapid elemental identification in a homogeneous sample using an SEM-EDS system [6] [2].
- Sample Preparation: The sample must be solid and stable under vacuum. For optimal results, it should be prepared with a flat, polished surface to minimize topographic effects. For SEM, coating with a thin conductive layer (e.g., carbon) may be necessary for non-conductive samples [7] [12].
- Instrument Setup: Insert the sample into the SEM chamber. Ensure the EDS detector is activated and cooled to its operating temperature. Navigate to the region of interest using the SEM beam.
- Parameters Selection:
- Accelerating Voltage: Typically 10-20 kV to efficiently excite a broad range of characteristic X-rays.
- Beam Current: Adjust to achieve a sufficient X-ray count rate without damaging the sample or saturating the detector.
- Working Distance: Set to the manufacturer's specification for optimal detector resolution and count rate (e.g., 10 mm).
- Live Time: Set the acquisition time, typically 60-100 seconds, to collect enough counts for reliable identification.
- Data Acquisition: Start the acquisition. The EDS system will collect all X-rays simultaneously and display the spectrum in real-time.
- Element Identification: Use the software's auto-identification routine to label the peaks in the spectrum. Manually verify the identified elements, as software can sometimes misidentify peaks, especially when overlaps occur [3].
Protocol: Combined EDS/WDS Quantitative Analysis
This protocol is used for high-precision quantification, especially when trace elements or peak overlaps are involved [6] [11] [12]. It requires a system with both EDS and WDS detectors.
- Sample Preparation: The sample must be meticulously polished to a flat, featureless surface. Topography severely degrades quantitative accuracy. The sample should be coated with a thin conductive carbon layer if necessary [12].
- Initial EDS Survey: Perform a standardless EDS analysis as per Protocol 4.1 to identify all major and minor elements present.
- WDS Spectrometer Configuration: Based on the EDS survey, configure the WDS spectrometers. For each element of interest (particularly those with overlaps or at trace levels), select the appropriate analyzing crystal (e.g., LIF, PET, TAP) to maximize diffraction efficiency for that element's X-ray lines [6].
- Standard-Based k-ratio Measurement:
- For WDS quantification, standards of known composition are required [12].
- Measure the characteristic X-ray intensity (peak minus background) for each element in the unknown sample.
- Under identical instrument conditions, measure the intensity for the same X-ray line in a pure element or well-characterized compound standard.
- Calculate the k-ratio (intensityunknown / intensitystandard) for each element [12].
- Data Processing and Matrix Corrections: Input the k-ratios into the quantification software. The software will apply ZAF (Atomic number, Absorption, Fluorescence) or φ(ρz) matrix corrections to convert the k-ratios into accurate mass concentrations [12].
The logical workflow for deciding between these techniques is summarized below.
The Scientist's Toolkit
Table 3: Essential Research Reagent Solutions for EDS/WDS Microanalysis.
| Item | Function | Application Notes |
|---|---|---|
| Conductive Coatings (Carbon, Gold) | Prevents charging on non-conductive samples, ensuring stable electron beam imaging and X-ray analysis. | Carbon is preferred for EDS/WDS as it has a minimal interfering X-ray signal. Gold coating can obscure light elements. |
| Polishing Supplies (Abrasive Papers, Diamond Suspensions) | Creates a flat, scratch-free surface essential for accurate quantitative microanalysis. | Topography causes X-ray absorption and fluorescence effects, leading to quantification errors [12]. |
| Pure Element & Compound Standards | Provides reference X-ray intensities for the k-ratio/matrix correction quantification method, essential for WDS and high-accuracy EDS. | Examples: Pure Mg for Mg, MgO for O, FeS2 for S [12]. |
| Conductive Mounting Resins | Encapsulates fragile or irregular samples for polishing and provides a path to electrical ground. | Epoxy resins filled with carbon or copper are commonly used. |
| Critical Point Dryer | Preserves the delicate surface structure of beam-sensitive (e.g., biological, polymer) samples during dehydration to avoid collapse. | Prevents structural artifacts that could be misinterpreted during analysis [3]. |
Wavelength-Dispersive X-ray Spectroscopy (WDS) is a powerful technique for elemental analysis that provides superior spectral resolution and sensitivity compared to its more common counterpart, Energy-Dispersive X-ray Spectroscopy (EDS). Both techniques operate on the same fundamental principle: when a sample is bombarded with a high-energy electron beam, inner-shell electrons are ejected from atoms, and as outer-shell electrons fill these vacancies, they emit characteristic X-rays unique to each element [7] [13]. The critical difference lies in how these characteristic X-rays are detected and measured. EDS uses a solid-state detector to measure the energy of incoming X-rays simultaneously across the spectrum, enabling rapid analysis [4] [14]. In contrast, WDS employs a diffracting crystal to separate X-rays based on their wavelengths, offering unparalleled precision for quantitative analysis and trace element detection [7] [14]. This guide explores the core operational principle of WDS—wavelength separation using diffracting crystals—and objectively compares its performance with EDS, providing researchers with the data needed to select the appropriate microanalysis technique.
Fundamental Principle: The Bragg Law of Diffraction
The entire operation of a WDS system hinges on Bragg's Law of X-ray Diffraction [15] [13]. This physical principle governs how X-rays are selectively diffracted by a crystal to separate them according to their wavelength.
Bragg's Law is expressed by the equation: nλ = 2d sinθ Where:
- n is an integer representing the order of the reflection.
- λ is the wavelength of the incident X-ray.
- d is the interplanar spacing of the diffracting crystal.
- θ is the angle between the incident X-ray beam and the crystal planes.
In a typical WDS setup, the spectrometer mechanically links the diffracting crystal and the X-ray detector. To measure a specific X-ray wavelength (and thus a specific element), the crystal is rotated to the precise Bragg angle (θ) that satisfies Bragg's Law for that wavelength. Simultaneously, the detector is moved to the corresponding 2θ angle to catch the diffracted X-rays [15]. This process is repeated for each element, as only one wavelength can be measured at any given crystal position [13] [14].
Diagram illustrating Bragg's Law, where X-rays of wavelength (λ) are diffracted by crystal planes separated by distance (d) at a specific angle (θ).
Performance Comparison: WDS vs. EDS
The different physical principles of EDS and WDS lead to a distinct trade-off in analytical performance, making each technique suitable for different applications.
Table 1: Direct Performance Comparison of EDS and WDS Techniques
| Performance Parameter | Energy-Dispersive Spectroscopy (EDS) | Wavelength-Dispersive Spectroscopy (WDS) |
|---|---|---|
| Spectral Resolution | ~128-130 eV [4] | ~5-10 eV [7] [13] |
| Detection Limit | 0.1 - 0.5 wt% (1000-5000 ppm) [7] [4] | ~0.01 wt% (100 ppm) or better [7] |
| Data Acquisition Speed | Fast (simultaneous multi-element collection) [4] [14] | Slow (sequential element measurement) [13] [14] |
| Peak Overlap | Common, requires software deconvolution [4] [13] | Rare, can resolve closely spaced X-ray lines [7] [14] |
| Typical Application | Qualitative & semi-quantitative survey analysis [4] [14] | High-precision quantitative & trace element analysis [7] [14] |
Comparative Experimental Data
A recent 2025 study directly compared SEM-EDS and SEM-WDS for analyzing alkaline distribution in deacidified paper, providing robust experimental data on their performance [7]. The study found that SEM-EDS produced false signals that could lead to an overestimation of alkaline presence. In contrast, SEM-WDS provided accurate and spatially resolved elemental distribution data, which was confirmed through correlation with micro-pH distribution profiles on the same cross-sections. This higher accuracy is directly attributable to WDS's superior spectral resolution, which prevents misinterpretation due to peak overlap [7].
Experimental Protocol for WDS Analysis
The following methodology outlines a standard protocol for conducting elemental analysis using a WDS system, as exemplified by its application in characterizing material homogeneity [7].
Sample Preparation
- Polished Sections: Samples must be prepared as polished cross-sections or smooth surfaces to ensure topographical features do not interfere with X-ray measurement.
- Conductive Coating: Non-conductive samples, such as polymers or biological tissues, require a thin conductive coating (e.g., carbon) to prevent charging under the electron beam [3] [4].
- Cryo-Preparation (for biological samples): To preserve elemental distribution in hydrated biological specimens, cryofixation followed by freeze-drying is recommended to prevent the loss or translocation of diffusible ions during chemical fixation and dehydration [3].
Instrumental Setup and Data Acquisition
- Microscope Alignment: The electron column of the SEM or Electron Probe Microanalyzer (EPMA) must be properly aligned to ensure a focused and stable electron beam on the sample surface.
- Spectrometer Configuration: Select a diffracting crystal with an appropriate
d-spacing for the range of elemental wavelengths to be analyzed. Multiple crystals are often available in an EPMA to cover the entire periodic table. - Wavelength Selection: For each element of interest, the spectrometer is tuned by setting the crystal to the Bragg angle (θ) that satisfies Bragg's Law for the element's characteristic X-ray wavelength.
- Intensity Measurement: At each specified wavelength, the intensity of the diffracted X-rays is measured by the detector (e.g., a gas-flow proportional counter [15]) for a predetermined counting time.
- Peak and Background Measurement: For quantitative analysis, the peak intensity for an element is measured, and the background intensity on either side of the peak is also measured and subtracted.
- Sequential Analysis: Steps 3-5 are repeated for every element included in the analysis protocol.
Data Processing and Quantification
- Matrix Corrections: The measured X-ray intensities from the sample are compared to intensities from standards of known composition. Sophisticated matrix correction algorithms (e.g., ZAF or φ(ρz) corrections) are then applied to account for atomic number (Z), absorption (A), and fluorescence (F) effects, yielding highly accurate quantitative results [13] [14].
- Elemental Mapping: While slower than EDS mapping, WDS can create elemental distribution maps by measuring the intensity of a single X-ray wavelength at each pixel in a raster, providing highly specific maps free from peak overlaps [7].
Workflow diagram for a sequential WDS analysis, highlighting the iterative process of measuring one element at a time.
Essential Research Reagent Solutions for WDS
Successful and accurate WDS analysis relies on several key components and materials.
Table 2: Essential Materials and Reagents for WDS Analysis
| Item | Function / Purpose |
|---|---|
| Diffracting Crystals (e.g., LiF, PET, TAP) | Core component for wavelength separation. Crystals with different d-spacing are used to cover different ranges of the X-ray spectrum. |
| Polishing Materials (Abrasive powders, lapping films) | To create a flat, scratch-free sample surface, which is critical for accurate quantitative analysis. |
| Conductive Coatings (High-purity carbon, gold, platinum) | Applied to non-conductive samples to dissipate charge build-up from the electron beam, ensuring image stability and measurement accuracy. |
| Elemental Standards (Pure elements or well-characterized compounds) | Certified reference materials with known composition are essential for calibrating the instrument and performing quantitative matrix corrections. |
| Mounting Materials (Phenolic or epoxy resins) | To securely hold the sample during polishing and analysis. |
| Gas for Proportional Counter (P10 gas: 90% Ar, 10% CH₄) | The operating gas for the flow-proportional X-ray detector, which is common in WDS systems [15]. |
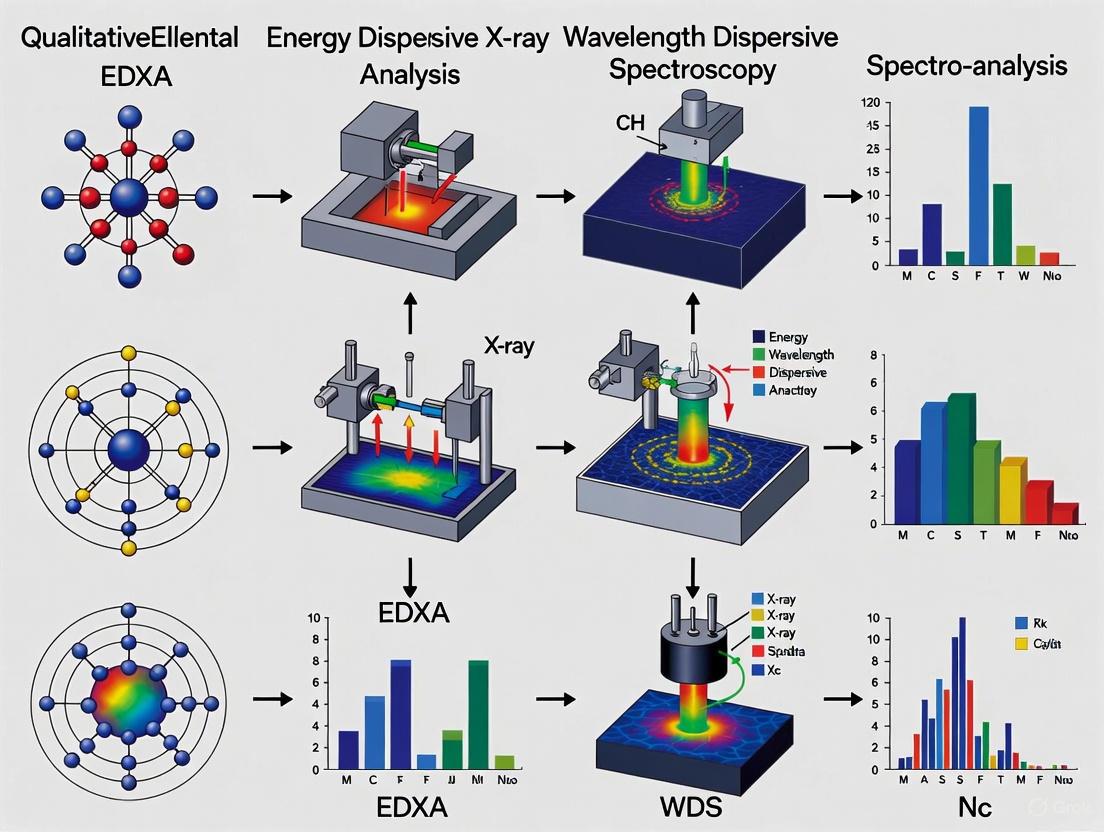
This guide provides an objective comparison between Energy Dispersive X-ray Analysis (EDXA or EDS) and Wavelength Dispersive Spectroscopy (WDS) for qualitative elemental analysis, detailing their performance, key outputs, and optimal applications for researchers.
Analytical Techniques at a Glance
Table 1: Core Characteristics of EDXA and WDS
| Feature | Energy Dispersive X-ray Analysis (EDXA) | Wavelength Dispersive Spectroscopy (WDS) |
|---|---|---|
| Basic Principle | Separates and detects X-rays by their energy [5]. | Separates and detects X-rays by their wavelength [5]. |
| Spectral Resolution | Lower (∼50-250 eV) [16]. | Higher, 10x better than EDS (∼3-30 eV) [16] [5]. |
| Typical Detection Limit | 0.1 wt% (1000 ppm) or worse [7] [16]. | 0.01 wt% (100 ppm) or better [7] [16] [5]. |
| Speed of Analysis | Fast; simultaneous multi-element collection [16]. | Slower; sequential element measurement [16]. |
| Primary Use Case | Rapid elemental identification, qualitative and semi-quantitative analysis [4]. | Accurate quantification, trace element detection, resolving peak overlaps [11] [16]. |
Decoding Spectral Outputs
The spectra produced by EDXA and WDS are the fundamental outputs for elemental identification, but they differ significantly in clarity and information density.
EDXA Spectra: Speed with Limitations
An EDXA spectrum is a histogram plot of X-ray counts against energy, where the peak positions identify elements, and the peak areas are proportional to concentration [3]. However, its limited energy resolution can lead to peak overlaps, where X-ray lines from different elements with similar energies are presented as a single, indistinguishable peak. This is a critical limitation for qualitative analysis, as it can lead to misidentification [11] [16]. For instance, the peaks for sulfur (S Kα) and molybdenum (Mo Lα) overlap, as do tungsten (W Mα) and silicon (Si Kα) [11] [16]. While software deconvolution can help, it is not always reliable for complex mixtures.
WDS Spectra: High-Fidelity Signatures
WDS overcomes the resolution limitation by using diffracting crystals to physically separate X-rays based on wavelength. This results in spectra with narrow, well-defined peaks and a much lower background [16]. This superior resolution allows WDS to clearly distinguish between overlapping peaks that are inseparable by EDXA, providing unambiguous elemental identification and more accurate qualitative analysis [11] [16].
Experimental Protocols for Comparison
To ensure valid and reproducible results when comparing these techniques, a structured experimental protocol is essential.
Sample Preparation
Proper preparation is critical for both techniques, especially for quantitative analysis.
- Polished Surface: Samples for quantitative analysis should be flat and polished to ensure a uniform surface and minimize topographic effects on X-ray emission [5] [4].
- Conductive Coating: Non-conductive samples require a thin conductive coating (e.g., carbon) to prevent charge accumulation under the electron beam [5] [4].
- Preparation Artifacts: Be aware that preparation methods can alter elemental composition. For instance, dispersing zeolite samples in deionized water can cause ion exchange and cation mobilization, affecting quantitative results [9].
Data Collection Workflow
The following diagram illustrates the typical data collection workflow for WDS, which involves sequential element measurement, in contrast to EDXA's simultaneous collection.
Combined EDS/WDS Analysis Protocol
A powerful modern approach is the integrated use of both techniques to maximize efficiency and accuracy [16].
- Initial Screening with EDS: Use EDS for a rapid, qualitative survey of the sample to identify all major and minor elements. This "point-and-press" analysis quickly reveals the sample's overall composition [16].
- Targeted Analysis with WDS: Based on the EDS results, employ WDS to perform accurate quantification and to investigate specific analytical challenges, such as:
- Data Correlation: Use software platforms that integrate EDS and WDS data to produce a single, comprehensive analytical report.
Performance Data and Experimental Evidence
Table 2: Quantitative Performance Comparison from Experimental Data
| Analysis Scenario | EDXA Result | WDS Result | Actual/Reference Value | Key Implication |
|---|---|---|---|---|
| Ni Monocrystal (Ta, W, Re) [11] | Significant discrepancies (27-59% error) due to peak overlaps. | Consistent with actual values. | W: 4.75 wt%, Re: 3.00 wt% | WDS enables reliable quantification where EDS fails due to overlaps. |
| Boron in Glass (2 wt%) [11] | Peak is hardly visible. | Clear, identifiable boron peak. | 2 wt% B | WDS dramatically improves detection and identification of light and low-concentration elements. |
| Deacidified Paper (Mg) [7] | Produced false signals, overestimating alkaline presence. | Provided accurate, spatially resolved Mg distribution. | N/A | WDS offers superior accuracy for elemental mapping and avoids false positives. |
| Steel Sample (Trace P, Co) [16] | Near or below detection limit. | Quantified at ~0.03 wt%. | N/A | WDS detection limits are up to 10x lower, enabling trace element analysis. |
The Scientist's Toolkit: Essential Research Reagents and Materials
Table 3: Key Materials for EDXA and WDS Analysis
| Item | Function in Analysis |
|---|---|
| Polishing Materials (e.g., diamond suspension, alumina powder) | To create a flat, scratch-free surface on solid samples, which is crucial for accurate quantitative analysis [5] [4]. |
| Conductive Coatings (e.g., carbon tape, carbon paint, sputter coaters) | To immobilize samples and provide a path to ground for electron beam charge, preventing "charging" effects that distort imaging and analysis [5] [4]. |
| Standard Reference Materials | Samples with known, certified compositions are essential for calibrating WDS systems and for performing standard-based quantification in EDS to ensure high accuracy [16] [9]. |
| Cryogenic Preparation Equipment | For preparing biological or hydrated specimens to prevent the loss or translocation of diffusible elements during analysis [3]. |
| Specialized Diffracting Crystals (e.g., LSM, PET, TAP) | Used in WDS spectrometers to diffract specific wavelength ranges with high efficiency, including those for light elements [16]. |
Decision Pathway for Technique Selection
Use the following workflow to determine the most appropriate technique for your analytical goals.
EDXA and WDS are powerful, complementary techniques for qualitative and quantitative elemental analysis. EDXA excels as a first-pass tool for its speed and ease of use in identifying major elements. In contrast, WDS is the definitive technique for high-fidelity qualitative analysis, providing the spectral resolution and sensitivity needed to resolve overlaps, identify trace elements, and generate accurate quantitative data. The integration of both techniques on a single instrument provides a powerful and efficient solution for the most demanding analytical challenges in research and development.
Strategic Applications in Biomedical and Pharmaceutical Research
Identifying and Mapping Environmental Pollutants and Heavy Metals in Tissues
The accumulation of environmental pollutants and heavy metals in biological tissues is a significant concern in toxicology and environmental health. Accurate identification and mapping of these elements within tissue structures are crucial for understanding exposure risks and metabolic pathways. *Energy Dispersive X-ray Analysis (EDXA) and *Wavelength Dispersive Spectroscopy (WDS) are two core microanalytical techniques used with electron microscopes for qualitative elemental analysis. This guide provides an objective comparison of their performance in detecting environmental contaminants such as lead, arsenic, and other heavy metals within biological specimens, supported by experimental data and detailed methodologies [3] [16].
Technical Comparison: EDXA vs. WDS
Core Principles and Mechanisms
EDXA (Energy Dispersive X-ray Analysis) EDXA operates by detecting the characteristic X-rays emitted from a sample when excited by an electron beam. The detector measures the energy of these X-rays simultaneously across a wide spectrum, allowing for quick identification of elements present based on their unique energy signatures [17] [2]. This technique is known for its speed and ease of use, providing a "point and press" method for initial elemental screening [16].
WDS (Wavelength Dispersive Spectroscopy) WDS functions by diffracting characteristic X-rays emitted from the sample using analyzing crystals. Unlike EDXA, it separates X-rays based on their wavelengths through Bragg diffraction, measuring one element at a time with significantly higher spectral resolution. This mechanical process requires more precise alignment but delivers superior analytical performance for specific challenging applications [7] [18].
Performance Comparison Table
Table 1: Technical and performance specifications of EDXA and WDS for elemental analysis in biological tissues.
| Parameter | EDXA | WDS |
|---|---|---|
| Spectral Resolution | 50-250 eV [16] | 3-30 eV [16] |
| Typical Detection Limits | 0.1 wt% (1000 ppm) [7] [16] | 0.01 wt% (100 ppm) or better [7] [16] |
| Peak-to-Background Ratio | Lower [16] | Significantly higher (up to 10x) [16] |
| Analysis Speed | Fast; simultaneous multi-element detection [2] [16] | Slower; sequential element measurement [16] [18] |
| Light Element Sensitivity (Z<11) | Moderate, can be challenging [16] | High, with specialized multi-layered crystals [16] [18] |
| Capability for Trace Element Mapping | Limited by peak overlaps and detection limits [7] [8] | Excellent; capable of mapping trace elements at low concentrations [16] [18] |
| Quantitative Accuracy without Standards | Semi-quantitative with standardless analysis [3] [16] | High accuracy, but requires measurement of standard samples [16] [18] |
EDXA Advantages: The key strength of EDXA lies in its rapid analytical speed and ability to detect multiple elements simultaneously, making it ideal for initial surveys and identifying major constituents in a sample [2] [16]. Modern silicon drift detectors (SDDs) have further enhanced its throughput and stability [17] [2].
EDXA Limitations: EDXA struggles with peak overlaps (e.g., S Kα and Mo Lα lines) and has higher detection limits, making it unsuitable for identifying trace-level contaminants. Its lower spectral resolution can lead to false signals or an overestimation of element presence in complex biological matrices [7] [16].
WDS Advantages: WDS excels where EDXA falters. Its superior energy resolution allows it to cleanly separate overlapping X-ray peaks, and its much lower detection limits (as low as 100 ppm) enable the identification and mapping of trace elements [7] [16]. The technique also offers enhanced sensitivity for light elements and provides highly accurate quantitative data [16] [18].
WDS Limitations: The primary trade-off for WDS's performance is speed. Because it measures one spectral line at a time, data acquisition is slower. The instrumentation is also more complex and requires careful alignment to maintain Bragg's condition [16] [18].
Experimental Data and Application in Tissue Analysis
Case Study: Assessing Heavy Metal Pollution in Tissues
Background: A study investigating the impact of environmental heavy metals on bone tissue used EDXA to detect accumulated metals like lead (Pb) and arsenic (As). While EDXA confirmed the presence of these metals, it faced limitations in quantifying low-level deposits and distinguishing lead from potential spectral overlaps in the mineralized bone matrix [3].
Comparative Experimental Protocol:
- Sample Preparation: Tissue samples (e.g., bone, liver) are fixed, dehydrated, and embedded in resin. For EDXA, critical-point drying is often used for SEM analysis. To preserve elemental distribution, cryofixation techniques are superior, where tissues are rapidly frozen and may be analyzed freeze-dried or as frozen-hydrated sections to prevent the translocation of soluble ions [3].
- Data Collection:
- EDXA: An area of interest is selected via SEM. A spectrum is acquired from a point, a line scan, or an area to create an elemental map. Acquisition is fast, providing real-time chemical imaging in modern systems [2] [16].
- WDS: Based on initial EDXA results, specific elements of interest (e.g., Pb, As) are analyzed. The WDS spectrometer is tuned to the precise wavelength for each element's characteristic X-ray peak and background. The stage is then moved to map the distribution of each element individually across the tissue section [16] [18].
- Results: In the bone tissue study, WDS provided quantitatively accurate concentration measurements of lead and conclusively ruled out false positives from spectral overlaps. It successfully generated high-contrast elemental maps showing the precise localization of trace metals within the bone microstructure, which was not achievable with EDXA due to its higher detection limits and poorer peak-to-background ratio [3] [16].
Performance Data Table
Table 2: Experimental performance data for EDXA and WDS in analyzing heavy metals in a simulated tissue matrix (e.g., resin-embedded tissue with known metal inclusions).
| Analysis Task | EDXA Performance | WDS Performance |
|---|---|---|
| Detecting Pb Lα (10.55 keV) in presence of As Kα (10.53 keV) | Severe peak overlap; difficult to deconvolute and quantify [17] | Peaks are fully resolved; accurate identification and quantification possible [16] |
| Mapping distribution of ~500 ppm Arsenic in liver tissue | Signal often obscured by background noise; map is noisy with low confidence [7] | Clear mapping with high signal-to-noise ratio; distribution patterns are visually distinct [16] [18] |
| Quantifying Calcium (major) vs. Cadmium (trace) in bone | Accurate for Ca; large error for Cd if concentration is near 0.1 wt% limit [3] | High accuracy for both major Ca and trace Cd concentrations (>100 ppm) [16] |
| Measurement Time for multi-element map (Pb, As, Cd) | ~Minutes for all elements simultaneously [2] | ~Minutes to tens of minutes per element, sequenced [18] |
Decision Workflow and Research Reagents
Technique Selection Workflow
This diagram outlines the decision-making process for selecting between EDXA and WDS based on research goals.
Essential Research Reagent Solutions
Table 3: Key reagents and materials for EDXA and WDS analysis of biological tissues.
| Item | Function | Considerations for Tissue Analysis |
|---|---|---|
| Cryo-embedding Media (e.g., OCT compound) | Supports tissue during cryo-sectioning for frozen-hydrated analysis. | Prevents element redistribution; essential for analyzing soluble ions [3]. |
| Epoxidic Resin | Infiltrates and embeds dehydrated tissue for stable sectioning. | Standard for routine analysis; may lead to loss of diffusible elements [3]. |
| Conductive Coatings (e.g., Carbon) | Applied to non-conductive tissue samples to prevent charging. | Must be thin and uniform; heavy metals can interfere with light element analysis [3]. |
| Standard Reference Materials | Certified samples with known element concentrations for quantification. | Crucial for accurate WDS quantification; matrix-matched standards (e.g., doped gelatin) are ideal [3] [16]. |
| Heavy Metal Salt Solutions | Used for creating calibration curves or spiking control samples. | Allows for method validation and quantification of elements like Pb, As, and Cd [3]. |
EDXA and WDS are complementary, not competing, techniques in the environmental researcher's toolkit. EDXA is the superior choice for rapid, qualitative survey analysis to identify and map major elemental constituents within tissues. In contrast, WDS is indispensable for high-sensitivity, quantitative investigations of trace heavy metals, particularly when precise quantification, resolving peak overlaps, or analyzing light elements is critical. For a comprehensive analysis, an integrated approach using EDXA for initial screening followed by targeted WDS measurement on elements of concern provides the most efficient and accurate results for identifying and mapping environmental pollutants in tissues [16] [18].
Characterizing Pathological Mineral Deposits and Calcifications
In biomedical research, accurately determining the elemental composition of pathological deposits—such as vascular calcifications, kidney stones, or mineral accumulations in tissues—is crucial for understanding their formation and developing treatments. Energy Dispersive X-ray Analysis (EDXA) and Wavelength Dispersive Spectroscopy (WDS) are two core microanalytical techniques used for this purpose. While both techniques operate on similar physical principles, their analytical capabilities differ significantly. This guide provides an objective comparison of EDXA and WDS performance, supported by experimental data, to inform researchers and drug development professionals selecting the optimal methodology for qualitative elemental analysis of biological specimens.
Energy Dispersive X-ray Analysis (EDXA), also commonly known as EDS or EDX, is an analytical technique integrated with electron microscopes (SEM or TEM) used for elemental analysis or chemical characterization of a sample [17] [3]. It works by detecting the characteristic X-rays emitted from a sample when it is excited by a high-energy electron beam. The energy of these X-rays is element-specific, allowing for the identification of elements present [17]. Modern EDXA systems can detect elements from beryllium (⁴Be) to uranium (⁹²U), with windowless detectors even capable of detecting lithium (³Li) [4].
Wavelength Dispersive Spectroscopy (WDS) is a complementary technique also used for elemental analysis within electron microscopes [16] [19]. Unlike EDXA, which discriminates X-rays by their energy, WDS uses diffracting crystals to separate X-rays according to their wavelengths [20]. This fundamental difference in detection philosophy underpins the distinct performance characteristics of the two techniques.
Core Physical Principles
The process begins when an electron beam strikes the sample, ejecting electrons from inner atomic shells and creating vacancies. When these vacancies are filled by electrons from higher-energy shells, characteristic X-rays are emitted [17]. In EDXA, a solid-state detector measures the energy of these X-rays simultaneously, producing a spectrum that is a histogram of X-ray counts versus energy [3]. In WDS, the X-rays emitted from the sample are collimated and directed onto a diffracting crystal. The crystal rotates to satisfy the Bragg condition (nλ = 2d sinθ) for different X-ray wavelengths, which are then detected sequentially by a proportional counter [20]. This mechanical process is more complex but provides superior spectral resolution.
Critical Performance Comparison
The choice between EDXA and WDS involves balancing analytical speed against precision and detection capability. The table below summarizes their key performance characteristics, which are critical for analyzing often heterogeneous and complex pathological mineral deposits.
Table 1: Performance Comparison between EDXA and WDS
| Analytical Parameter | EDXA | WDS |
|---|---|---|
| Spectral Resolution | ~128-130 eV [4], typically 50-250 eV [16] | ~3-30 eV, typically 10x better than EDXA [16] [20] |
| Typical Detection Limits | 0.1 wt% (1000 ppm) or worse [7] [16] [4] | 0.01 wt% (100 ppm) or better [7] [16] |
| Analysis Speed | Fast; simultaneous collection of all elements; "point-and-press" [16] [4] | Slower; sequential element measurement [16] |
| Peak-to-Background Ratio | Lower | Significantly higher, improving trace element detection [16] [11] |
| Light Element Sensitivity | Limited, requires special detectors | Improved, uses specialized multi-layered crystals [16] |
| Quantitative Accuracy | Semi-quantitative; standardless analysis possible but can have significant errors, especially with overlaps [9] [4] [11] | High quantitative accuracy and precision; requires standards but results are comparable to wet chemical analysis [16] [20] |
Interpretation of Performance Differences
- Spectral Resolution and Peak Overlap: The superior resolution of WDS (about 10x better) allows it to cleanly separate X-ray peaks that EDXA cannot distinguish [16]. For example, the S Kα (2.307 keV) and Mo Lα (2.293 keV) peaks are often indistinguishable by EDXA but are easily resolved by WDS [16]. In a biological context, this is vital for correctly identifying elements like phosphorus and calcium in calcifications without interference from overlapping signals.
- Detection Limits and Trace Analysis: The significantly lower background and higher peak-to-background ratio in WDS enable it to detect trace elements at concentrations up to two orders of magnitude lower than EDXA [16]. This is crucial for detecting low levels of heavy metals or dopants in pathological deposits that may be biologically relevant but fall below EDXA's detection threshold [7] [3].
- Quantitative Accuracy: EDXA is excellent for qualitative and semi-quantitative analysis but can produce considerable errors in complex materials. A study on a Ni monocrystal showed that EDXA overestimated Ta by 28% and W by 59% due to peak overlaps, while the combined EDS/WDS quantification yielded accurate results matching the actual values [11]. For precise quantification of elemental ratios in minerals, WDS is demonstrably superior.
Experimental Data in Pathological Contexts
Case Study: Analyzing Erionite Fibers
A 2025 study investigating individual carcinogenic erionite fibers provides a clear example of EDXA's limitations in quantitative analysis of complex minerals. Researchers analyzed 325 individual fibers using SEM-EDXA and compared the results to Electron Probe Microanalyzer (EPMA)-WDS reference data. The SEM-EDXA results showed systematic overestimations of Si and Mg and underestimations of Al, K, and Ca. Furthermore, despite the high purity of the bulk sample, none of the individual fibers analyzed by SEM-EDXA fully met the established quantitative chemical criteria for erionite identification [9]. This highlights that for definitive identification and accurate chemistry of fibrous minerals in tissue sections (e.g., in mesothelioma research), WDS provides more reliable data.
Case Study: Evaluating Paper Deacidification
A 2025 study comparing SEM-EDXA and SEM-WDS for assessing alkaline distribution in deacidified paper found that EDXA produced false signals that could lead to an overestimation of alkaline presence. In contrast, SEM-WDS provided more accurate and spatially resolved elemental distribution data. The higher sensitivity and accuracy of WDS were pivotal in confirming the significant inhomogeneity of a commercial deacidification agent (Bookkeeper), which would be critical for assessing its efficacy and long-term preservation potential [7]. This analytical principle translates directly to biomedicine for mapping the distribution of therapeutic nanoparticles or mineral deposits within a tissue matrix.
Detailed Experimental Protocols
Protocol 1: Cross-Sectional Analysis of Calcifications via SEM-WDS
This protocol, adapted from a paper conservation study, is directly applicable to analyzing the cross-sectional distribution of elements in pathological calcifications [7].
- Sample Preparation: Tissue samples (e.g., arterial wall with calcification) are fixed, dehydrated, and embedded in epoxy resin. The block is sectioned (~1 µm thickness) using an ultramicrotome and mounted on a conductive substrate, such as a carbon-coated slide or a polished graphite stub.
- Sample Coating: To prevent charging under the electron beam, the cross-section is coated with a thin, conductive layer of carbon via sputter coating.
- Instrument Setup:
- Microscope: Scanning Electron Microscope (SEM).
- Accelerating Voltage: 15-20 kV (a common setting for intermediate atomic number elements).
- Beam Current: Use a higher beam current than for standard EDXA (e.g., 20-50 nA) to generate sufficient X-ray counts for WDS analysis [20].
- WDS Data Acquisition:
- Select diffracting crystals appropriate for the target elements (e.g., TAP for light elements like O, Mg, Al; PETJ for P, S, Cl, K, Ca; LiF for heavier elements).
- For each element of interest, the WDS spectrometer is tuned to the characteristic X-ray peak position and a background position.
- Elemental distribution maps are acquired by scanning the electron beam across the region of interest and measuring the X-ray intensity at each pixel for the specified wavelength.
- Data Correlation: The resulting elemental maps (e.g., for Ca and P) can be directly correlated with the sample's morphology and, if applicable, with micro-pH distribution profiles from the same cross-section to link alkali presence with local neutralization effects [7].
Protocol 2: Trace Element Identification in Inclusions via Combined EDXA/WDS
This protocol leverages the strengths of both techniques for efficient analysis of inclusions or particulates in tissues [16] [11].
- Sample Preparation: Tissues are prepared as for standard SEM analysis. For trace metal analysis, cryofixation techniques (e.g., freeze-drying of cryo-sectioned tissues) are preferred to prevent the loss or translocation of diffusible ions during chemical fixation and dehydration [3].
- Initial EDXA Screening:
- Use EDXA for rapid, qualitative assessment of the sample to identify regions containing inclusions and determine the major elements present.
- Perform an initial quick elemental map with EDXA to locate areas of interest.
- Targeted WDS Analysis:
- Based on the EDXA results, use WDS to perform precise quantitative analysis on specific inclusions.
- Use WDS to resolve any overlapping peaks identified in the EDXA spectrum (e.g., S vs. Mo, Ta vs. W).
- Use WDS to create high-sensitivity elemental maps for trace elements of interest that were at or below the detection limit of EDXA.
- Quantification: For WDS quantification, measure standards of known composition (similar to the sample matrix) under identical analytical conditions to create calibration curves, ensuring high quantitative accuracy [16] [20].
The Scientist's Toolkit: Essential Research Reagents and Materials
Table 2: Key Materials for EDXA and WDS Analysis of Biological Specimens
| Item | Function | Considerations for Pathological Samples |
|---|---|---|
| Epoxy Resin (e.g., Epon 812) | Embedding medium for tissue to provide structural support during sectioning. | Provides a stable, ultra-smooth surface for quantitative analysis. |
| Carbon Conductive Tape | Mounting and grounding samples to prevent charging. | Essential for non-conductive biological samples to ensure image stability and analytical accuracy. |
| Sputter Coater | Applies a thin, ultra-pure conductive layer (Carbon) onto the sample surface. | Carbon is preferred over gold for microanalysis as it does not introduce interfering X-ray lines. |
| Polished Graphite or Silicon Wafer Stubs | Provide a highly conductive, ultra-flat substrate for mounting cross-sections. | Minimizes background X-ray signal, crucial for trace element detection. |
| Standard Reference Materials | Certified samples with known composition for quantitative WDS calibration. | Necessary for accurate quantification; should be matrix-matched to biological specimens where possible (e.g., doped albumin or gelatin) [3]. |
| Cryo-Preparation Equipment (Freeze Dryer) | Prepates frozen-hydrated tissues to preserve the original location of soluble ions. | Critical for studies of diffusible elements (e.g., Na⁺, K⁺, Ca²⁺) to avoid artifacts from chemical preparation [3]. |
The following workflow diagram outlines the decision process for selecting between EDXA and WDS based on key analytical requirements.
Analytical Technique Selection Workflow
In conclusion, EDXA and WDS serve complementary roles in the microanalysis of pathological mineral deposits. EDXA is the superior tool for initial, rapid qualitative analysis, major element mapping, and when analytical speed and ease of use are paramount. WDS is unequivocally more powerful for applications requiring definitive identification of trace elements, accurate quantification, resolving spectral overlaps, or analyzing light elements at low concentrations. For the most robust and comprehensive analysis, a combined approach—using EDXA for rapid survey and WDS for resolving critical analytical challenges—provides an optimal solution, enabling researchers to fully characterize the complex chemistry of pathological biominerals.
Analyzing Inorganic Contaminants in Implants and Prostheses (Metallosis)
Metallosis, a serious complication arising from the wear and tear of orthopedic implants and prostheses, results in the release of inorganic metallic debris—such as cobalt, chromium, and titanium—into the surrounding biological tissues. Accurately identifying and quantifying this contamination is crucial for understanding implant failure mechanisms and associated tissue damage. Within the context of a broader thesis on analytical techniques, this guide objectively compares two core microanalytical methods used for qualitative and quantitative elemental analysis: Energy Dispersive X-ray Spectroscopy (EDS/EDX) and Wavelength Dispersive Spectroscopy (WDS). When integrated with a Scanning Electron Microscope (SEM), both techniques analyze characteristic X-rays emitted from a sample to determine its elemental composition [2] [5]. However, their fundamental operational differences lead to distinct performance characteristics, making each suitable for specific aspects of metallosis research. This guide provides a data-driven comparison to help researchers select the optimal methodology for detecting and mapping inorganic contaminants in biological tissues.
Fundamental Principles and Technical Comparison
How EDS and WDS Work
- Energy Dispersive X-Ray Spectroscopy (EDS): EDS operates by measuring the energy of characteristic X-rays emitted from a sample irradiated by the SEM's electron beam. A silicon drift detector (SDD) collects and sorts these X-rays by their energy, simultaneously generating a full spectrum that allows for the rapid identification of multiple elements present in the sample [2]. This "point-and-press" capability makes it excellent for initial surveys.
- Wavelength Dispersive X-Ray Spectroscopy (WDS): WDS separates X-rays based on their wavelength using diffracting crystals. According to Bragg's law, each element's characteristic X-rays are diffracted at a unique angle. The spectrometer mechanically scans through these angles, measuring the intensity of one specific X-ray line at a time [6] [5]. This sequential process is inherently slower but delivers superior spectral resolution.
Direct Performance Comparison Table
The table below summarizes the key technical performance metrics of EDS and WDS, critical for planning experiments related to inorganic contaminant analysis.
Table 1: Performance Comparison of EDS and WDS for Elemental Analysis
| Feature | EDS/EDX | WDS | Implication for Metallosis Research |
|---|---|---|---|
| Operating Principle | Measures X-ray energy [5] | Measures X-ray wavelength [5] | Fundamental difference dictates workflow. |
| Spectral Resolution | 50 - 250 eV [6] | 3 - 30 eV [6] | WDS is superior for resolving overlapping peaks from adjacent elements. |
| Detection Limit | ~0.1 wt% (1000 ppm) [7] [6] | ~0.01 wt% (100 ppm) or better [11] [7] [5] | WDS is ~10x more sensitive, crucial for detecting trace metal contaminants. |
| Speed of Analysis | Fast; simultaneous spectrum collection [2] [21] | Slow; sequential element measurement [6] [21] | EDS is ideal for rapid screening; WDS for detailed, high-precision points/maps. |
| Peak-to-Background Ratio | Lower | Significantly higher [11] [6] | WDS provides cleaner spectra with lower noise, improving trace element detection. |
| Typical Analytical Use | Qualitative & semi-quantitative survey [22] | High-precision quantitative analysis [22] [5] | EDS for initial identification, WDS for definitive quantification. |
Experimental Protocols for Contaminant Analysis
Sample Preparation Workflow
Proper sample preparation is critical for obtaining reliable microanalytical data from biological tissues. The general workflow involves:
- Tissue Extraction and Fixation: Surgically remove the peri-prosthetic tissue and fix it in a buffered formalin solution to preserve morphology.
- Dehydration and Embedding: Dehydrate the tissue through a graded series of ethanol and embed in a hard epoxy resin to provide support for sectioning.
- Sectioning and Polishing: Use a microtome to create thin cross-sections (typically 1-10 µm). The sample must be polished to an ultra-flat, smooth surface to prevent topographical artifacts during X-ray analysis [5].
- Coating: Apply a thin conductive coating (e.g., carbon) to non-conductive biological samples to prevent charging effects under the electron beam [5].
EDS Analysis Protocol
- Instrument Setup: Load the prepared sample into the SEM chamber. Select an accelerating voltage (typically 10-20 kV) sufficient to excite the characteristic X-rays of the elements of interest (e.g., Co, Cr, Ti).
- Region of Interest Identification: Use backscattered electron (BSE) imaging to locate bright, high-atomic-number regions indicative of potential metallic contamination.
- Data Acquisition:
- Point Analysis: Position the electron beam on a specific particle or tissue area to acquire a qualitative EDS spectrum in seconds [2] [22].
- Elemental Mapping: Raster the beam across a defined area to collect a full spectrum at each pixel. Software then generates false-color maps showing the spatial distribution of elements [2].
- Data Analysis: Use software to identify elemental peaks in the spectrum. For quantification, standardless methods built into the software provide semi-quantitative weight percentage values [22].
WDS Analysis Protocol
- Initial EDS Survey: Begin with a rapid EDS analysis to identify the major elements present. This informs which elements require high-resolution WDS analysis [11] [6].
- WDS Spectral Scan: For elements with overlapping EDS peaks (e.g., S Kα and Mo Lα, or V Kβ and Cr Kα), perform a WDS wavelength scan. This involves moving the diffracting crystal through a range of angles to obtain a high-resolution spectrum free of overlaps [11] [6].
- Quantitative Point Analysis: For precise quantification of specific contaminants, position the beam on the feature of interest. Measure the X-ray intensity for the element(s) of interest, then measure intensities from well-characterized standard reference materials. Use a ZAF or φ(ρZ) correction algorithm to calculate accurate weight percentages [11] [9].
- High-Sensitivity Mapping: For mapping trace elements, WDS can be set to the specific wavelength of the element. While slower than EDS mapping, it provides maps with much higher contrast and sensitivity, revealing the distribution of trace contaminants that would be lost in the EDS background noise [11].
The following diagram illustrates the logical decision-making process for incorporating EDS and WDS in an analytical workflow for metallosis.
The Scientist's Toolkit: Essential Research Reagents and Materials
Successful elemental analysis requires specific materials and instrumentation. The following table details key components of the research toolkit.
Table 2: Essential Research Reagent Solutions for SEM-EDS/WDS Analysis
| Item | Function/Description | Application in Metallosis Research |
|---|---|---|
| Epoxy Resin | A hard, stable polymer used for embedding tissue samples. | Provides structural support during sectioning and polishing, ensuring a flat analysis surface. |
| Polishing Compounds | Suspensions of fine alumina, silica, or diamond particles. | Used to create a scratch-free, ultra-flat surface on the sample, which is critical for accurate X-ray quantification. |
| Conductive Carbon Coating | A thin, high-purity carbon layer applied via sputter or evaporation coating. | Dissipates charge on non-conductive biological tissues, preventing image distortion and X-ray drift during analysis. |
| Standard Reference Materials | Certified materials with known elemental composition (e.g., pure metals, simple oxides). | Essential for calibrating the WDS system and achieving high quantitative accuracy for metal contaminants [11] [9]. |
| Silicon Drift Detector (SDD) | The core component of a modern EDS system [2]. | Collects X-rays with high throughput, enabling fast elemental mapping and analysis. |
| Diffracting Crystals | Crystals with specific lattice spacings (e.g., LIF, PET, TAP) used in WDS spectrometers. | Separate X-rays by wavelength, providing the high resolution needed to distinguish between overlapping elemental peaks [6] [5]. |
The choice between EDS and WDS for analyzing inorganic contaminants in metallosis is not a matter of one technique being universally superior, but rather of selecting the right tool for the specific research question.
- Use EDS for rapid screening, qualitative phase identification, and creating elemental maps to visualize the general distribution of major metallic contaminants (e.g., Co, Cr) in tissues. Its speed and ease of use make it an indispensable first step in most analytical workflows [2] [22].
- Employ WDS when the research demands high quantitative accuracy, requires the resolution of severe spectral overlaps (e.g., V Kβ and Cr Kα), or needs to detect and map trace elements present at concentrations below 0.1 wt%. Its superior resolution and sensitivity are crucial for definitive identification and precise quantification, especially for complex or low-level contamination [11] [6] [7].
For the most comprehensive analysis, an integrated approach is highly recommended. Utilizing EDS for an initial overview followed by targeted WDS measurements on specific areas of interest combines the strengths of both techniques, providing both a broad contextual picture and definitive, high-quality data on the inorganic contaminants responsible for metallosis.
Solving Common Analytical Challenges: Peak Overlaps, Trace Elements, and Light Elements
Energy Dispersive X-ray Spectroscopy (EDS) and Wavelength Dispersive Spectroscopy (WDS) are two primary techniques used for qualitative and quantitative elemental analysis within electron microscopes. While both methods detect characteristic X-rays emitted from a sample following irradiation by an electron beam, their fundamental mechanisms for distinguishing X-ray energies differ significantly, leading to distinct performance profiles, especially in resolving severe spectral peak overlaps [6] [21].
EDS is a widely adopted, routine technique that uses a solid-state detector to measure the energy of incoming X-rays simultaneously across a wide energy range. Its key advantages are speed and ease of use, often functioning in a "point and press" manner for quick elemental identification [6] [4]. In contrast, WDS employs a diffracting crystal to separate X-rays based on their wavelengths. This crystal is mechanically scanned to detect specific wavelengths sequentially, a process that, while slower, provides superior spectral resolution [6] [7]. This guide objectively compares their performance in challenging analytical scenarios, providing the experimental context and data crucial for researchers and scientists in fields ranging from materials science to drug development.
Core Principles and Comparative Strengths
The choice between EDS and WDS often hinges on a trade-off between analytical speed and spectral resolution. The following table summarizes their core characteristics:
Table 1: Fundamental comparison of EDS and WDS techniques
| Feature | Energy Dispersive Spectroscopy (EDS) | Wavelength Dispersive Spectroscopy (WDS) |
|---|---|---|
| Detection Principle | Measures X-ray energy directly with a semiconductor detector [21] | Diffracts X-rays by wavelength using an analyzing crystal [6] [21] |
| Data Acquisition | Simultaneous; entire energy spectrum captured at once [21] | Sequential; measures one X-ray line at a time [21] |
| Typical Energy Resolution | 50-250 eV [6] [4] | 3-30 eV [6] (Approximately 10x better than EDS [6]) |
| Detection Limits (Typical) | ~0.1 wt% (1000 ppm) [6] [7] | ~0.01 wt% (100 ppm) or better [6] [7] |
| Analytical Speed | Fast; ideal for initial survey analysis [6] [21] | Slower; required for high-precision measurement of specific elements [6] [21] |
| Peak-to-Background Ratio | Lower | Significantly higher, aiding trace element detection [6] |
The following workflow diagram illustrates the decision-making process for selecting the appropriate technique based on analytical goals and sample characteristics:
Practical Application: Resolving Severe Peak Overlaps
Severe peak overlaps occur when the characteristic X-ray lines of two or more elements have nearly identical energies, making them indistinguishable by EDS due to its limited resolution. WDS excels in these situations, as demonstrated in the following critical examples.
Case 1: Sulfur (S Kα) vs. Molybdenum (Mo L)
- The Overlap: The S Kα peak (energy: 2.307 keV) is closely spaced to the Mo Lα peak (energy: 2.293 keV) [6].
- EDS Performance: In an EDS spectrum, these two peaks merge into a single, broad peak, making it impossible to confidently determine the presence or quantity of either element without sophisticated and less reliable peak deconvolution software [6].
- WDS Resolution: The high energy resolution of WDS (around 5-10 eV in this energy range) cleanly separates these two peaks. A graphical video cited in the search results shows a WDS scan clearly resolving the S and Mo peaks, which appear as a single overlap in the simultaneously acquired EDS spectrum [6]. This allows for straightforward identification and accurate quantification of both sulfur and molybdenum.
Case 2: Tantalum (Ta M) vs. Silicon (Si K)
- The Overlap: The Ta Mα peak (energy: 1.711 keV) directly interferes with the Si Kα peak (energy: 1.740 keV).
- EDS Performance: EDS systems struggle to resolve this energy difference (~29 eV). The presence of tantalum can lead to a false positive for silicon, or the presence of silicon can interfere with the accurate measurement of tantalum, especially if one is a minor or trace element.
- WDS Resolution: WDS easily differentiates between these two lines. By using an appropriate analyzing crystal, WDS can scan the specific wavelengths, providing a distinct peak for each element and enabling precise measurement without mutual interference.
Case 3: Tungsten (W M) vs. Silicon (Si K) & Vanadium (V) in a Ti Alloy
- The Overlap: The W Mα peak (energy: 1.775 keV) is also very close to the Si Kα peak, creating another common overlap. A cited research example involves the analysis of V in a Ti alloy, where the V Kα and Ti Kβ peaks severely overlap in EDS [6].
- EDS Performance: The EDS spectrum shows a convolved peak, making the accurate quantification of vanadium, particularly at low concentrations, highly uncertain [6].
- WDS Resolution: In the Ti alloy study, WDS was used to map the distribution of V, successfully characterizing segregation despite the dominant Ti signal [6]. Quantitative results demonstrated that WDS provided measurements of V with much lower uncertainty and improved accuracy compared to EDS [6].
Table 2: Summary of challenging peak overlaps and technique performance
| Overlapping Peaks | Approx. Energy | EDS Analysis Challenge | Recommended WDS Solution |
|---|---|---|---|
| S Kα / Mo Lα | ~2.3 keV | Peaks merge; impossible to deconvolute confidently [6] | High-resolution scan separates peaks for accurate S and Mo quantification [6] |
| Ta Mα / Si Kα | ~1.7 keV | Risk of false Si detection or inaccurate Ta measurement | Analyzing crystal (e.g., PET) resolves interference. |
| V Kα / Ti Kβ | ~4.9-5.0 keV | Severe overlap prevents accurate V quantification in Ti alloys [6] | WDS provides precise V measurement with lower error [6] |
| W Mα / Si Kα | ~1.8 keV | Interference complicates analysis of Si in presence of W (and vice versa) | WDS distinguishes between W M-series and Si Kα lines. |
Experimental Protocols for EDS and WDS Analysis
Sample Preparation
- General Requirement: Samples for both EDS and WDS must be compatible with the vacuum environment of a Scanning Electron Microscope (SEM) or Electron Probe Microanalyzer (EPMA) [3].
- Solid Samples: Should be clean, polished flat, and electrically conductive. Non-conductive specimens require a thin conductive coating (e.g., carbon) to prevent charging, especially for high-accuracy quantitative analysis [4].
- Biological/Tissue Samples: Require specific preparation to preserve elemental composition. This typically involves cryofixation (freezing) to prevent the loss or translocation of diffusible ions, followed by freeze-drying and resin embedding [3].
- Paper/Polymers: Cross-sections are often prepared to study elemental distribution, as demonstrated in a 2025 study on deacidified paper. These cross-sections may be coated with carbon to ensure conductivity [7].
Data Acquisition Protocols
- EDS Qualitative Analysis:
- Place the prepared sample in the microscope chamber and evacuate.
- Select an accelerating voltage (typically 10-20 kV) sufficient to excite the elements of interest.
- Locate the area of interest and acquire a spectrum with a live time of 30-60 seconds to identify all major and minor elements present [4].
- WDS Quantitative Point Analysis:
- After an initial EDS survey, select the specific elemental lines for WDS analysis.
- For each element, select the appropriate analyzing crystal (e.g., LIF, PET, TAP) to maximize diffraction efficiency for that X-ray wavelength.
- Position the WDS spectrometer on the peak wavelength for the element and measure the X-ray intensity.
- Move the spectrometer to measure the background on either side of the peak.
- Repeat for each element and use a standard sample of known composition to convert measured intensities into quantitative concentrations [6].
Data Interpretation
- EDS: Element identification is performed by matching peak energies in the spectrum to a database. Quantification is typically "standardless," using software that compares peak intensities and applies matrix corrections [4]. Overlapping peaks require deconvolution algorithms, which can introduce uncertainty [6].
- WDS: Identification is based on wavelength. Quantification requires measuring standards to create a calibration curve, which results in highly accurate and precise data, often comparable to wet chemical analysis [6]. An example is the use of WDS to create a calibration curve for carbon in steel, greatly improving accuracy over EDS [6].
The Scientist's Toolkit: Essential Research Reagents & Materials
Table 3: Key materials and reagents for EDS/WDS microanalysis
| Item | Function / Application |
|---|---|
| Conductive Coatings (Carbon, Gold/Palladium) | Applied to non-conductive samples to dissipate electron charge and prevent image distortion and spectral artifacts [4]. |
| Polishing Supplies (Abrasive Papers, Diamond Suspensions) | For preparing solid material samples with a flat, scratch-free surface, which is critical for accurate quantitative analysis [4]. |
| Standard Reference Materials | Certified samples with known composition (e.g., pure elements, simple compounds) essential for accurate quantitative WDS analysis and for verifying EDS system calibration [6]. |
| Cryo-Preparation Equipment | Includes plunge freezers, freeze dryers, and cryo-ultramicrotomes. Crucial for preparing biological specimens to retain the in-situ location of soluble elements [3]. |
| Embedding Resins (Epoxy, FFPE) | Used to infiltrate and support porous, fragile, or biological samples (like paper or tissue) for cross-sectioning and analysis [3] [7]. |
| Analyzing Crystals (e.g., LIF, PET, TAP) | The heart of the WDS spectrometer. Different crystals with varying lattice spacings are used to diffract specific wavelength ranges of X-rays efficiently [6]. |
For routine qualitative analysis and fast elemental mapping where major elements are unaffected by peak overlaps, EDS remains the superior tool due to its speed and simplicity [6] [4]. However, in the face of severe peak overlaps—such as S Kα/Mo L, Ta M/Si K, and W M/Si K—or when precise quantification and trace element detection are required, WDS is demonstrably more powerful [6] [7]. The experimental data and protocols outlined in this guide provide a framework for researchers to make an informed choice, leveraging the strengths of each technique to achieve confident and accurate elemental analysis. For the most challenging analytical problems, an integrated EDS-WDS workflow, where EDS is used for initial screening and WDS for resolving critical overlaps, represents the optimal approach in modern microanalysis [6].
Strategies for Detecting and Quantifying Trace Elements (<0.1 wt%)
Electron-excited X-ray microanalysis is a cornerstone technique for determining the elemental composition of materials at the microscale, providing researchers with critical insights for materials development, failure analysis, and quality control. Within this field, two principal techniques dominate: Energy Dispersive X-ray Spectroscopy (EDS) and Wavelength Dispersive Spectroscopy (WDS). While both methods analyze characteristic X-rays generated by electron beam-sample interactions to identify and quantify elements, their approaches and performance characteristics differ significantly [6] [5].
The detection and accurate quantification of trace elements—those present at concentrations below 0.1 weight percent (wt%)—present a particular challenge in microanalysis. Trace elements, even at minute levels, can profoundly influence material properties, performance, and reliability in applications ranging from semiconductor devices to advanced alloys. This comparison guide objectively evaluates the performance of EDS and WDS techniques for trace element analysis, providing researchers with experimental data and methodological frameworks to select the optimal approach for their specific analytical requirements.
Fundamental Principles and Technical Comparison
Core Analytical Principles
Energy Dispersive X-ray Spectroscopy (EDS) employs a solid-state semiconductor detector to separate and measure characteristic X-rays based on their energy. The detector collects X-rays across a wide energy range simultaneously, allowing rapid identification of elements present in the sample. Modern EDS systems typically use silicon drift detectors (SDDs) which offer high throughput and excellent stability [4] [12].
Wavelength Dispersive Spectroscopy (WDS) operates on a fundamentally different principle, using analyzing crystals to diffract characteristic X-rays according to their wavelengths through Bragg's law. The spectrometer mechanically moves the crystal and detector along the Rowland circle to focus on specific wavelengths sequentially, providing extremely high spectral resolution [6] [23]. This mechanical scanning process means WDS cannot analyze multiple elements simultaneously like EDS, but delivers superior resolution for each measurement.
Performance Specifications Comparison
Table 1: Technical Comparison of EDS and WDS for Trace Element Analysis
| Parameter | EDS | WDS |
|---|---|---|
| Energy Resolution | 50-250 eV (typically 130 eV) [4] [23] | 5-30 eV (typically 10-20 eV) [6] [23] |
| Detection Limits | 0.08-0.5 wt% (800-5000 ppm) [4] [7] | 0.001-0.01 wt% (10-100 ppm) [6] [23] [7] |
| Peak-to-Background Ratio | Lower [11] | 10x higher or more [11] |
| Analysis Speed | Fast (simultaneous multi-element detection) [6] [4] | Slow (sequential element measurement) [6] [23] |
| Light Element Sensitivity | Moderate [4] | High (using specialized multilayer crystals) [6] |
| Spatial Resolution | ~1 μm to nanometers (depending on beam energy and sample) [24] | ~1 μm to nanometers (similar to EDS) [23] |
The superior energy resolution of WDS—approximately 10 times better than EDS—enables clear separation of closely spaced X-ray peaks that appear as overlaps in EDS spectra [6]. This resolution advantage directly contributes to WDS's significantly lower detection limits, which can reach as low as 10 ppm for certain elements, approximately two orders of magnitude better than conventional EDS [23].
Experimental Performance Data and Case Studies
Resolving Spectral Overlaps
A critical challenge in trace element analysis is distinguishing between elements with closely spaced characteristic X-ray peaks. EDS struggles with energy differences smaller than its resolution limit (typically >50 eV), requiring mathematical deconvolution that introduces uncertainty, particularly for minor and trace constituents [11].
Experimental Case - Si-W-Ta System: In a study analyzing a sample containing silicon, tungsten, and tantalum, EDS failed to resolve the Si Kα (1.740 keV), W Mα (1.775 keV), and Ta Mα (1.710 keV) peaks due to their close energy separation (~30-65 eV). These elements appeared as an indistinguishable merged peak in the EDS spectrum, making accurate quantification impossible. WDS clearly separated all three peaks, enabling precise measurement of each element's concentration without mathematical deconvolution [11].
Similar advantages are evident for rare earth elements, whose L-lines are concentrated in a narrow energy region where EDS cannot qualitatively separate constituent elements, while WDS provides clear peak separation [23].
Trace Element Detection and Mapping
The significantly improved peak-to-background ratio of WDS dramatically enhances its sensitivity for detecting trace elements. While EDS detection limits are typically around 0.1 wt% (1000 ppm) at best, WDS can reliably detect concentrations of 100 ppm or lower, with some applications achieving detection limits below 10 ppm [6] [23] [7].
Experimental Case - Steel Analysis: In the analysis of steel samples, WDS enabled characterization of low levels of phosphorus and cobalt that were undetectable by standard EDS [6]. The high sensitivity of WDS also facilitates elemental mapping of trace constituents, as demonstrated in an alloy segregation study where WDS successfully mapped vanadium distribution despite severe spectral overlap with titanium in the EDS spectrum [6].
Table 2: Quantitative Analysis Comparison of Ni Monocrystal (wt%) [11]
| Element | EDS Result | EDS+WDS Result | Actual Value | Discrepancy (EDS vs Actual) |
|---|---|---|---|---|
| Al | 6.30 | 6.62 | - | - |
| Ta | 9.61 | 7.48 | 7.50 | +28% |
| W | 7.57 | 4.75 | 4.75 | +59% |
| Re | 2.19 | 3.01 | 3.00 | -27% |
| Mo | 0.79 | 0.74 | - | - |
| Ti | 1.11 | 1.15 | - | - |
| Cr | 6.21 | 6.04 | - | - |
| Co | 7.83 | 7.56 | - | - |
| Ni | 58.39 | 57.56 | - | - |
As shown in Table 2, the combined EDS/WDS quantification approach corrects severe discrepancies observed in EDS-only analysis, particularly for elements with overlapping peaks (Ta, W, Re). The WDS measurements show excellent agreement with actual values, while EDS-only results exhibited errors up to 59% [11].
Light Element Analysis
The analysis of light elements (boron to fluorine) presents particular challenges due to their low X-ray yields and easily absorbed low-energy photons. WDS addresses these challenges through specialized multilayer crystals that maximize scattering efficiency for the long wavelengths produced by light elements [6].
Experimental Case - Boron in Glass: In a borosilicate glass containing 2 wt% boron, the boron peak was barely detectable by EDS due to the low peak-to-background ratio. In contrast, WDS clearly resolved the boron peak, enabling accurate quantification [11]. Similarly, WDS has been successfully applied to measure low concentrations of boron and carbon in boride and carbide inclusions, and trace levels of light elements (boron, carbon, nitrogen) in metal matrices [6].
Experimental Protocols and Methodologies
Sample Preparation Requirements
Both EDS and WDS require proper sample preparation, but WDS has more stringent requirements due to its focusing optics:
- Surface Flatness: WDS requires highly polished, flat surfaces because the Rowland circle focusing mechanism is sensitive to topographic variations. Unevenness greater than ~10 μm can defocus X-rays, reducing intensity and analytical precision [23]. EDS is more tolerant of surface roughness.
- Conductive Coating: Non-conductive samples require a thin conductive coating (carbon is preferred for X-ray analysis) to prevent charging effects [5]. Carbon coatings minimize X-ray absorption, which is particularly important for light elements.
- Standards: For quantitative WDS analysis, standard samples with known compositions are required for each element of interest [23]. EDS commonly uses standardless quantification, though standard-based methods improve accuracy.
WDS Quantitative Analysis Protocol
The WDS quantitative analysis method follows a well-established k-ratio protocol based on Castaing's original approach [12]:
Diagram 1: WDS quantitative analysis workflow
- Standard Measurement: Acquire characteristic X-ray intensity for element A in a standard sample of known composition under specific operating conditions (accelerating voltage, beam current, working distance) [23] [12].
- Unknown Measurement: Measure the characteristic X-ray intensity for the same element A in the unknown sample using identical instrument conditions [23] [12].
- k-ratio Calculation: Compute the intensity ratio: k = Iunknown / Istandard [12].
- Matrix Corrections: Apply correction algorithms (ZAF or φρZ methods) to account for interelement effects, including atomic number (Z), absorption (A), and fluorescence (F) [23] [12].
- Concentration Calculation: The corrected concentration of element A in the unknown is obtained by: Cunknown = k × Cstandard × (correction factors) [12].
Integrated EDS-WDS Analysis Protocol
Modern microanalysis systems increasingly combine EDS and WDS capabilities to leverage the strengths of both techniques:
Diagram 2: Integrated EDS-WDS analysis approach
- Initial EDS Survey: Perform rapid EDS analysis to identify major elements and screen for potential analytical challenges [6].
- Challenge Assessment: Evaluate the EDS spectrum for peak overlaps, trace elements near detection limits, and light elements that may benefit from WDS analysis [11].
- Targeted WDS Analysis: Configure WDS spectrometers to specifically address the identified challenges—resolving overlaps, quantifying trace elements, or improving light element measurement accuracy [6] [11].
- Data Integration: Combine EDS results for unaffected major elements with WDS results for challenging elements to generate a comprehensive quantitative analysis [11].
Essential Research Reagents and Materials
Table 3: Key Research Reagents and Materials for Trace Element Microanalysis
| Item | Function/Purpose | Application Notes |
|---|---|---|
| Polished Specimen Mounts | Provide stable, conductive holding for samples during analysis | Standard 1-inch diameter for EPMA compatibility; specific geometries for specialized stages [5] |
| Conductive Coatings (Carbon) | Eliminate charging effects on non-conductive samples | Preferred over metal coatings for minimal X-ray absorption, especially critical for light element analysis [4] [5] |
| Polishing Supplies | Create flat, damage-free surfaces required for quantitative analysis | Diamond suspensions (1 µm to 0.25 µm final polish); colloidal silica for final polishing [5] |
| Certified Standard Materials | Enable quantitative WDS analysis through k-ratio method | Pure elements (Fe, Ni, Cr, etc.) and stoichiometric compounds (MgO, SiO₂, etc.) with documented compositions [23] [12] |
| Reference Materials | Verify analytical accuracy and precision | Well-characterized multi-element materials with trace element concentrations similar to unknowns [12] |
The comparative analysis of EDS and WDS demonstrates that these techniques offer complementary capabilities for trace element analysis. EDS provides rapid, multi-element analysis suitable for initial specimen characterization and major element quantification, while WDS delivers superior resolution and sensitivity for challenging analytical scenarios involving peak overlaps, trace elements, or light elements.
For researchers designing microanalysis strategies for trace elements (<0.1 wt%), the following guidelines are recommended:
- Use EDS for initial screening, major element analysis, and applications requiring rapid multi-element characterization where trace element detection below 1000 ppm is not critical [6] [4].
- Employ WDS when analyzing elements with severe spectral overlaps, quantifying trace elements below 1000 ppm, achieving the highest quantitative accuracy, or measuring light elements at low concentrations [6] [11] [23].
- Implement integrated EDS-WDS approaches to maximize analytical efficiency and accuracy, using EDS for straightforward elements and WDS for challenging components [6] [11].
The strategic combination of both techniques, leveraging their respective strengths, provides researchers with the most comprehensive approach for detecting and quantifying trace elements across diverse material systems.
Optimizing Analysis for Light Elements (Boron to Fluorine)
Elemental analysis of light elements (Boron to Fluorine, atomic numbers 5-9) presents significant challenges in scanning electron microscopy (SEM) due to their characteristically low X-ray yields and the ease with which these low-energy X-rays are absorbed by the sample itself or even by air molecules within the instrument [6] [3]. Accurate detection and quantification of these elements are, however, critical across numerous scientific fields, from developing new semiconductor dopants to characterizing catalytic materials and analyzing biological samples [6] [3]. Two primary techniques are employed for X-ray microanalysis in an SEM: Energy Dispersive X-ray Spectroscopy (EDS) and Wavelength Dispersive X-ray Spectroscopy (WDS). While both techniques aim to determine the elemental composition of a sample, their underlying mechanisms and performance characteristics, especially for light elements, differ substantially [6] [21].
This guide provides an objective, data-driven comparison of EDS and WDS for analyzing the light element series. It details the fundamental principles of each technique, summarizes their performance metrics in comparable tables, and outlines experimental protocols to help researchers, scientists, and development professionals select and optimize the appropriate microanalytical method for their specific application needs.
Fundamental Principles and Technical Comparison
How EDS and WDS Work
Energy Dispersive X-ray Spectroscopy (EDS) operates on the principle of energy discrimination. When a sample is bombarded with the SEM's electron beam, it emits characteristic X-rays. An EDS detector, typically a silicon drift detector (SDD), collects these X-rays and sorts them by their energy [4] [17]. The detector measures the entire spectrum of X-ray energies simultaneously, providing a rapid, "point-and-press" qualitative and semi-quantitative overview of the elements present [6] [4]. However, the energy resolution of EDS is limited to approximately 50-250 eV, which can lead to overlaps between the peaks of different elements [6] [21].
In contrast, Wavelength Dispersive X-ray Spectroscopy (WDS) functions by separating X-rays according to their wavelengths using a diffracting crystal [6] [25]. The geometry of the spectrometer is based on the Rowland circle, where the sample, a curved analyzing crystal, and the detector are all precisely aligned. The crystal rotates to diffract specific X-ray wavelengths that satisfy Bragg's Law toward the detector, while all other wavelengths are rejected [25]. This mechanical process allows WDS to achieve a superb energy resolution of 3-30 eV—about an order of magnitude better than EDS [6]. The trade-off is that WDS measures elements sequentially rather than simultaneously, which typically results in longer data acquisition times [6] [21].
Performance Specifications for Light Elements
The technical distinctions between EDS and WDS lead to direct and significant differences in their performance, particularly for the challenging detection of light elements. The following table summarizes these key performance metrics.
Table 1: Performance Comparison of EDS and WDS for Light Element Analysis
| Performance Characteristic | Energy Dispersive Spectroscopy (EDS) | Wavelength Dispersive Spectroscopy (WDS) |
|---|---|---|
| Analytical Principle | Energy discrimination of X-rays [21] | Wavelength dispersion via diffracting crystal [21] |
| Spectral Resolution | 50 - 250 eV [6] | 3 - 30 eV [6] |
| Typical Detection Limits | ~0.1 wt% (1000 ppm) [6] [7] | ~0.01 wt% (100 ppm) or better [6] [7] |
| Peak-to-Background Ratio | Lower, making small peaks hard to distinguish [6] | Significantly higher, revealing trace element peaks [6] |
| Analysis Speed | Fast; full spectrum acquired simultaneously [6] [21] | Slower; sequential element measurement [6] [21] |
| Capability for B, C, N, O, F | Limited due to poor resolution and low peak-to-background [6] | Excellent; uses specialized layered crystals to maximize efficiency [6] [25] |
Experimental Data and Methodologies
Quantitative Analysis of Carbon in Steel
The superior quantitative accuracy of WDS is exemplified in the analysis of carbon in steel, a routine yet critical application in metallurgy. The following experimental protocol and results demonstrate the creation of a high-accuracy calibration curve using WDS.
Experimental Protocol:
- Standard Preparation: A set of certified steel standards with known carbon contents, for example, ranging from 0.056 to 1.27 wt%, is obtained [6].
- Instrument Setup: The electron microprobe (EPMA) or SEM equipped with a WDS spectrometer is used. A specialized multi-layered analyzing crystal (e.g., LSM-200) optimized for long wavelengths (low energies) of light elements is selected [6].
- Data Acquisition: For each standard, the WDS spectrometer is tuned to the wavelength of the carbon Kα line. The beam current is stabilized, and the intensity of the carbon X-ray line is measured by counting X-ray photons over a fixed time (dwell time) at the peak position and on the background on either side [6] [25]. The net intensity (peak minus background) is calculated.
- Calibration Curve: A plot is generated with the known carbon concentration of each standard on the x-axis and the measured net X-ray intensity (often expressed as a "k-ratio" relative to a pure standard) on the y-axis. A linear or polynomial regression is fitted to the data points [6].
- Analysis of Unknown: An unknown steel sample is analyzed under identical conditions. Its measured net intensity is then input into the calibration equation to determine its carbon content with high accuracy [6].
Results: The WDS method produces a calibration curve with a high correlation coefficient (R² > 0.99), allowing for the accurate determination of carbon in unknown steel samples at low concentration levels, a task where EDS typically struggles due to its higher detection limits and poorer peak-to-background ratio [6].
Table 2: Representative Data for a WDS Carbon Calibration Curve
| Standard Sample | Certified C Content (wt%) | Measured Net Intensity (counts/sec) |
|---|---|---|
| Standard A | 0.056 | 125 |
| Standard B | 0.25 | 580 |
| Standard C | 0.60 | 1420 |
| Standard D | 1.27 | 3050 |
| Unknown Steel | To be determined | 950 |
Resolving Spectral Overlaps in Complex Materials
A common limitation of EDS is its inability to deconvolve overlapping X-ray peaks from different elements, a problem that is acute for light elements and their adjacent neighbors. WDS excels in this area due to its high spectral resolution.
Experimental Protocol for Peak Resolution:
- Initial EDS Survey: A sample with suspected peak overlaps (e.g., containing Molybdenum and Sulfur) is first analyzed by EDS to obtain a broad elemental spectrum [6].
- Identification of Overlap: The EDS spectrum shows a broad, merged peak in the energy range for S Kα (2.307 keV) and Mo Lα (2.293 keV) [6].
- Targeted WDS Analysis: A WDS spectrometer is programmed to scan through the wavelength range corresponding to the overlapping energies.
- Spectral Acquisition: The WDS system, using an appropriate analyzing crystal, is scanned step-by-step. At each step, the diffracted X-ray intensity is measured, building a high-resolution spectrum [6].
Results: The resulting WDS spectrum will clearly resolve the S and Mo peaks into two distinct, sharp peaks, enabling confident identification and accurate quantification of both elements. In the EDS spectrum, these peaks are inseparable, leading to potential misidentification and significant quantitative errors [6] [25].
Analysis Workflow for Light Elements
The following diagram illustrates a typical analytical decision-making workflow when facing the challenge of light element analysis, integrating both EDS and WDS techniques.
Diagram 1: Analytical Workflow for Light Element Analysis. This flowchart guides the researcher on whether to rely on EDS data or proceed to more accurate WDS measurements based on initial findings.
The Scientist's Toolkit: Essential Reagents and Materials
Successful and accurate microanalysis, particularly of light elements, requires more than just a capable instrument. The following table details key consumables, standards, and preparation materials essential for reliable EDS and WDS work.
Table 3: Essential Research Reagents and Materials for Microanalysis
| Item Name | Function/Purpose | Application Notes |
|---|---|---|
| Certified Standard Materials | Calibration of X-ray intensity for quantitative analysis [6] [9]. | WDS quantification requires well-characterized standards for each element; EDS often uses standardless routines but standards improve accuracy [6] [25]. |
| Specialized WDS Crystals | Diffraction of specific X-ray wavelengths; crucial for light elements [6]. | Multilayered crystals (e.g., LSM) are used for high efficiency with long-wavelength X-rays from B, C, N, O, F [6]. |
| Conductive Coatings | Prevents charging on non-conductive samples, which deflects the electron beam. | A thin, ultra-pure carbon coat is preferred for light element analysis as it does not generate interfering X-ray peaks [4]. |
| Polishing Supplies | Creates a flat, featureless surface for accurate X-ray quantification. | Sub-micron alumina or diamond suspensions are used to achieve a scratch-free finish, minimizing topographic effects on X-ray intensity [4]. |
| High-Purity Resins | For embedding and preparing cross-sections of fragile or porous materials. | Essential for analyzing samples like deacidified paper or biological tissues to preserve structure during sectioning [7] [3]. |
The choice between EDS and WDS for the analysis of light elements from Boron to Fluorine is not a matter of which technique is universally superior, but rather which is most appropriate for the specific analytical requirements. EDS provides an unparalleled combination of speed and ease-of-use for initial material characterization and the analysis of major elements. However, when the application demands high quantitative accuracy, the detection of trace concentrations, or the resolution of complex spectral overlaps, WDS is the unequivocally superior technique. Its high spectral resolution and excellent peak-to-background ratio, enabled by specialized spectrometer crystals, allow it to overcome the fundamental limitations of EDS for light element analysis. For the most comprehensive analytical strategy, modern integrated EDS/WDS systems allow researchers to leverage the initial survey speed of EDS and then apply the pinpoint accuracy of WDS for the most challenging aspects of light element characterization.
Sample Preparation Best Practices for Biological Specimens to Prevent Element Loss
In the comparative analysis between Energy Dispersive X-ray Spectroscopy (EDS/EDX) and Wavelength Dispersive Spectroscopy (WDS) for qualitative elemental analysis, sample preparation emerges as the most critical factor determining data accuracy, particularly for biological specimens. The fundamental challenge in biological microanalysis involves maintaining elements at their original physiologically active sites throughout the preparation process to ensure analytical results provide true and meaningful biological information [3]. While WDS offers superior spectral resolution and lower detection limits (~0.01 wt%) compared to EDS (~0.1 wt%), both techniques face significant limitations when sample preparation fails to prevent elemental loss, redistribution, or introduction of artifacts [7] [4]. The integrity of any subsequent elemental analysis, regardless of methodological sophistication, depends entirely on the initial steps taken to preserve the native elemental distribution within biological tissues.
Biological specimens present unique challenges for elemental analysis due to their high water content, diffuse anatomical structures, and presence of diffusible ions that can easily translocate during processing. This guide systematically compares preparation methodologies, evaluates their impact on analytical outcomes for both EDS and WDS techniques, and provides evidence-based protocols to optimize elemental preservation for accurate microanalytical results in biomedical research.
Fundamental Challenges in Biological Sample Preparation
Mechanisms of Element Loss and Redistribution
The primary challenge in preparing biological specimens for elemental microanalysis involves preventing the loss or redistribution of elements of interest, particularly diffusible ions such as Na+, K+, Ca2+, and Cl- [3]. Conventional preparation methods for electron microscopy, including chemical fixation, dehydration, and resin embedding, can cause significant elemental displacement through several mechanisms:
- Solubilization and Leaching: Diffusible elements dissolve into aqueous solutions during processing steps, effectively removing them from their original biological locations [3].
- Ion Exchange: Chemical fixatives and buffers can introduce foreign ions that displace native elements or form insoluble complexes that alter the original elemental distribution [9].
- Structural Collapse: Dehydration without proper support causes cellular structures to collapse, mechanically redistributing elements to non-physiological locations [3].
The table below summarizes the major challenges and their impact on elemental analysis:
Table 1: Challenges in Biological Sample Preparation for Elemental Microanalysis
| Challenge | Impact on Elements | Effect on Analysis |
|---|---|---|
| Aqueous Processing | Loss of diffusible ions through solubilization | False negatives; underestimated concentrations |
| Chemical Fixation | Introduction of foreign ions (e.g., Os, S) | Elemental contamination; obscured native signals |
| Resin Embedding | Incomplete infiltration causing heterogeneous solidification | Uneven analysis regions; poor section quality |
| Ambient Temperature Processing | Enhanced molecular mobility and element diffusion | Elemental redistribution from original sites |
Technical Limitations of Microanalytical Techniques
Both EDS and WDS face inherent technical limitations when analyzing biological specimens. EDS detectors typically have lower energy resolution (~128-130 eV) compared to WDS (~10 eV), making peak deconvolution more challenging for biologically relevant elements with overlapping X-ray emissions [4]. WDS provides superior spectral resolution and lower detection limits but requires longer acquisition times and is more sensitive to surface topography, necessitating exceptionally flat and polished biological samples [5] [7].
The detection limits of approximately 0.1 mmol per kg of dry specimen (10 ppm) for EDS present additional challenges for detecting trace elements in biological systems [3]. These technical constraints heighten the importance of optimal sample preparation to maximize the analytical capabilities of each technique.
Comparative Analysis of Sample Preparation Methodologies
Conventional Chemical Fixation and Resin Embedding
Traditional approaches for biological electron microscopy follow a standardized protocol: primary fixation in aldehydes (e.g., 4% paraformaldehyde), post-fixation in osmium tetroxide, dehydration through graded ethanol series, and embedding in epoxy resin [3]. While this method provides excellent structural preservation for morphological studies, it proves problematic for elemental analysis:
- Elemental Loss: Studies demonstrate significant leaching of diffusible elements during aqueous processing steps, with up to 90% loss of soluble ions reported in some systems [3].
- Contamination Introduction: Osmium tetroxide post-fixation introduces heavy metal atoms that can obscure the detection of biologically relevant elements and generate overlapping X-ray peaks in EDS spectra [3].
- Limited Analytical Utility: Conventional protocols are only suitable for elements tightly bound to biological structures or heavy elements not susceptible to solubilization [3].
This method remains appropriate for analyzing stable elemental components in biological systems, such as silicon in plant phytoliths or calcified structures in mineralized tissues, where the elements of interest are structurally integrated and not prone to dissolution.
Cryogenic Methodologies for Elemental Preservation
Cryofixation techniques developed initially for immunocytochemistry applications provide superior elemental preservation by immobilizing cellular constituents in their native state through rapid freezing [3]. These methodologies effectively prevent the loss or acquisition of elements during sample preparation when properly executed.
- Rapid Freezing Techniques: plunge freezing, high-pressure freezing, and slam freezing physically stabilize cellular architecture and elemental distribution within milliseconds [3].
- Cryo-Substitution and Freeze-Drying: Dehydration and resin infiltration at low temperatures prevent elemental redistribution while enabling conventional microtomy [3].
- Frozen-Hydrated Sectioning: Cryo-ultramicrotomy allows analysis of fully hydrated specimens, preserving the complete elemental complement without chemical alteration [3].
The experimental data consistently demonstrate that cryogenic approaches maintain elemental concentrations at physiologically relevant levels, enabling accurate quantification when combined with appropriate standardization methods [3]. The primary limitations include requirements for specialized equipment, technical expertise, and challenges in handling temperature-sensitive materials throughout the analytical process.
Table 2: Comparison of Sample Preparation Methodologies for Elemental Analysis
| Methodology | Element Preservation | Structural Preservation | Technical Complexity | Compatibility with EDS/WDS |
|---|---|---|---|---|
| Chemical Fixation/Resin Embedding | Poor for diffusible ions | Excellent | Moderate | EDS: Good; WDS: Good (with polishing) |
| Cryofixation/Freeze-Substitution | Good to excellent | Very good | High | EDS: Very good; WDS: Very good |
| Frozen-Hydrated Analysis | Excellent | Good (vitreous ice) | Very high | EDS: Limited; WDS: Limited |
| FFPE Tissue Reprocessing | Variable (element-dependent) | Moderate | Low | EDS: Limited; WDS: Not recommended |
Specialized Approaches for Archival Materials
Recent methodological advances enable elemental analysis of archival formalin-fixed paraffin-embedded (FFPE) tissues, expanding opportunities for retrospective clinical studies [3]. This protocol involves identifying regions of interest on hematoxylin-and-eosin stained sections, placing embedding beam capsules over selected areas, and detaching the capsules from slides using thermal shock (liquid nitrogen) after resin polymerization [3].
While this approach enables valuable cohort studies using pathological archives, it introduces significant limitations:
- Prior Element Loss: Conventional tissue processing for histopathology causes substantial elemental leaching before analysis [3].
- Contamination Sources: Staining components, adhesive tapes, and processing chemicals introduce exogenous elements that complicate analysis [3].
- Sectioning Challenges: FFPE-derived samples may produce non-uniform thickness, affecting quantitative analysis [3].
This method represents a compromise that sacrifices optimal elemental preservation for access to clinically annotated tissue resources, requiring careful interpretation of results with understanding of the inherent limitations.
Experimental Protocols and Workflows
Cryofixation Protocol for Optimal Elemental Preservation
The following protocol, adapted from current methodologies, provides a standardized approach for preparing biological specimens for elemental microanalysis:
Rapid Cryofixation:
- Excise tissue samples (< 1 mm³) using ceramic tools to avoid metal contamination
- High-pressure freeze samples within 30-60 seconds of excision
- Alternatively, plunge-freeze in liquid ethane cooled by liquid nitrogen for ultrarapid freezing
Freeze-Substitution:
- Transfer frozen samples to precooled substitution medium (-90°C) containing 2% osmium tetroxide in acetone
- Gradually raise temperature to -50°C over 24 hours
- Wash with precooled acetone to remove residual substitution medium
Low-Temperature Infiltration and Embedding:
- Infiltrate with LR White or Lowicryl resin series at -50°C
- Polymerize under UV light at -50°C for 48 hours followed by 24 hours at room temperature
Sectioning and Mounting:
- Cut 100 nm ultrathin sections using dry diamond knife to avoid aqueous contact
- Collect sections on formvar-coated nickel or copper grids
- Avoid heavy metal stains (e.g., uranyl acetate, lead citrate) that compromise EDS analysis [3]
This protocol preserves diffusible elements while maintaining structural integrity sufficient for correlative ultrastructural and elemental analysis.
Preparation Workflow for Conductive Coating
Proper conductive coating is essential for preventing charging effects during EDS and WDS analysis, particularly for non-conductive biological samples:
Diagram 1: Decision workflow for conductive coating selection (Max Width: 760px)
The selection of coating material significantly impacts analytical results. Carbon coating produces minimal interference with characteristic X-rays from biological elements but provides less effective conductivity. Metal coatings (gold, gold/palladium) offer superior conductivity but introduce characteristic X-ray lines that may overlap with biologically relevant elements [26]. Aluminum provides an intermediate solution with good conductivity and lower interference for specific energy ranges (0.8-4 keV) [26].
Quantitative Comparison of Preparation Method Efficacy
Elemental Recovery Rates Across Methods
Comparative studies of preparation methodologies demonstrate significant variation in elemental preservation efficacy. The table below summarizes experimental data on elemental recovery rates:
Table 3: Elemental Recovery Rates by Preparation Methodology
| Element | Chemical Fixation | Cryofixation/Freeze-Substitution | Frozen-Hydrated | FFPE Reprocessing |
|---|---|---|---|---|
| Na⁺ | 5-15% | 85-95% | 95-100% | 2-8% |
| K⁺ | 10-20% | 80-90% | 90-98% | 5-10% |
| Ca²⁺ | 20-40% | 75-85% | 85-95% | 15-25% |
| Mg²⁺ | 25-45% | 70-80% | 80-90% | 20-30% |
| Cl⁻ | 8-18% | 82-92% | 92-99% | 3-9% |
| P | 60-80% | 90-98% | 95-100% | 50-70% |
| S | 70-85% | 92-97% | 95-100% | 60-75% |
Data adapted from multiple sources comparing relative elemental recovery rates compared to reference values [3] [9].
The superior preservation of cryogenic methodologies is evident across all diffusible ions, with frozen-hydrated techniques approaching near-complete retention of native elemental composition. Chemical fixation methods demonstrate substantial losses, particularly for monovalent ions, while reprocessed FFPE tissues retain only minimal amounts of original diffusible elements.
Impact on Analytical Sensitivity and Detection Limits
Sample preparation methodology directly influences the minimum detection limits achievable with EDS and WDS systems:
Table 4: Detection Limits (wt%) by Technique and Preparation Method
| Element | EDS with Chemical Fixation | EDS with Cryofixation | WDS with Chemical Fixation | WDS with Cryofixation |
|---|---|---|---|---|
| Na | 0.8-1.2 | 0.2-0.4 | 0.1-0.2 | 0.05-0.1 |
| Mg | 0.5-0.8 | 0.15-0.3 | 0.08-0.15 | 0.03-0.08 |
| P | 0.3-0.5 | 0.1-0.2 | 0.05-0.1 | 0.02-0.05 |
| S | 0.3-0.5 | 0.1-0.2 | 0.05-0.1 | 0.02-0.05 |
| Cl | 0.4-0.6 | 0.1-0.3 | 0.08-0.15 | 0.03-0.08 |
| K | 0.3-0.5 | 0.08-0.15 | 0.05-0.1 | 0.02-0.05 |
| Ca | 0.2-0.4 | 0.05-0.1 | 0.03-0.08 | 0.01-0.03 |
Detection limits represent typical values for biological specimens under optimized analytical conditions [3] [7] [4].
The data demonstrate that cryogenic preparation improves detection limits by approximately 3-5 times for EDS and 2-3 times for WDS, primarily by preserving higher elemental concentrations in the analyzed volume. WDS maintains its inherent advantage of approximately 10 times lower detection limits compared to EDS across all preparation methods [7].
The Scientist's Toolkit: Essential Research Reagents and Materials
Table 5: Essential Reagents and Materials for Elemental Microanalysis
| Item | Function | Application Notes |
|---|---|---|
| High-Pressure Freezer | Rapid cryofixation with minimal ice crystal formation | Essential for optimal elemental preservation; requires specialized equipment |
| Cryogenic Ultramicrotome | Sectioning of frozen or resin-embedded samples | Enables thin section production without elemental redistribution |
| Ceramic Knives | Sample excision without metal contamination | Avoids introduction of analytical interferences from metal tools |
| LR White Resin | Low-temperature embedding medium | Preserves element distribution better than epoxy resins |
| Formvar-Coated Nickel Grids | Section support without copper interference | Nickel provides minimal background signal in EDS analysis |
| Carbon Coating System | Application of conductive layers | Optimal for EDS analysis of light elements |
| Cryo-Storage System | Maintenance of sample temperature below -80°C | Prevents ice crystal growth and elemental diffusion |
| Standard Reference Materials | Quantification and calibration | Gelatin or albumin-based standards with known element concentrations [3] |
The selection of appropriate sample preparation methodologies for biological elemental analysis requires careful consideration of research objectives, available resources, and analytical priorities. Cryogenic approaches, particularly high-pressure freezing followed by freeze-substitution, provide the optimal balance between elemental preservation and practical implementation for most research applications. While WDS provides superior analytical sensitivity and spectral resolution, proper sample preparation remains more critical than technique selection for obtaining biologically meaningful results.
For studies requiring absolute elemental quantification, cryogenic methods combined with appropriate standardization using matrix-matched reference materials provide the most reliable approach [3]. When access to cryogenic equipment is limited, modified chemical fixation protocols using optimized buffers and minimal processing times can provide acceptable alternatives for analyzing structurally bound elements, though with recognized limitations for diffusible ions.
The continued advancement of correlative approaches, combining the high spatial resolution of EDS with the superior spectral resolution of WDS, promises enhanced capabilities for biological elemental analysis, provided that sample preparation methodologies evolve to support these sophisticated analytical platforms.
Direct Technique Comparison: Performance, Speed, and Accuracy
In the field of electron microscopy, Energy Dispersive X-ray Spectroscopy (EDS) and Wavelength Dispersive X-ray Spectroscopy (WDS) are two principal techniques for elemental analysis. The core difference lies in their energy resolution—a specification that fundamentally dictates their analytical capabilities. Energy resolution, typically measured as the full width at half maximum (FWHM) of the Mn Kα peak, defines a spectrometer's ability to distinguish between X-rays of similar energies. EDS systems, with resolutions around 130 eV, and WDS systems, with dramatically sharper resolutions of 10-20 eV, offer vastly different performance profiles [6] [27].
This guide provides an objective comparison for researchers and scientists, framing the EDS vs. WDS discussion within qualitative elemental analysis. The higher spectral resolution of WDS directly addresses specific limitations of EDS, particularly concerning peak overlaps and trace element detection, but comes with trade-offs in speed and operational complexity. Understanding this technical showdown is crucial for selecting the appropriate microanalytical technique, as the choice profoundly impacts the accuracy, detection limits, and reliability of experimental results in fields ranging from materials science to pharmaceutical development.
Technical Comparison: EDS vs. WDS at a Glance
The following table summarizes the fundamental characteristics and performance metrics of EDS and WDS techniques, highlighting the impact of their differing energy resolutions.
Table 1: Technical and Performance Comparison of EDS and WDS
| Feature | Energy Dispersive X-ray Spectroscopy (EDS) | Wavelength Dispersive X-ray Spectroscopy (WDS) |
|---|---|---|
| Basic Principle | Measures X-ray energy using a solid-state detector [4]. | Uses diffracting crystals to separate X-rays by wavelength [6] [25]. |
| Energy Resolution | ~128-130 eV (for modern Silicon Drift Detectors, SDD) [4] [27]. Can degrade at high count rates [28]. | ~5-30 eV, typically 10x better than EDS [6] [27]. |
| Detection Limits | ~0.1 - 0.5 wt% (1000 - 5000 ppm) [4] [7]. | ~0.01 wt% (100 ppm) or better, up to two orders of magnitude lower than EDS [6] [7]. |
| Peak Overlap | Significant challenges with closely spaced peaks (e.g., S Kα vs. Pb Mα) [28]. | Excellent for resolving closely spaced and overlapping peaks (e.g., Mo and S) [6] [25]. |
| Typical Analysis Speed | Very fast; acquires full spectrum simultaneously in seconds [6] [4]. | Slower; measures elements sequentially; requires longer acquisition times [6] [21]. |
| Light Element Sensitivity | Possible with windowless detectors, but challenging due to absorption and low fluorescence yield [28] [18]. | High sensitivity for light elements (Be to O) using specialized multilayer crystals [6] [18]. |
| Quantitative Accuracy | Good for standardless, semi-quantitative analysis [4]. | High quantitative accuracy and precision, comparable to wet chemical analysis; requires standards [6]. |
Experimental Insights: Performance Data in Practice
Case Study 1: Resolving Severe Peak Overlaps in Galena
A definitive experiment comparing the capabilities of EDS and WDS involves analyzing galena (PbS), a mineral where the S Kα line (2.307 keV) and the main Pb Mα line (2.346 keV) are separated by a mere 39 eV [28].
- Experimental Protocol: A galena sample was analyzed using two different EDS detectors (with 138 eV and 122 eV resolution, respectively) and a WDS spectrometer. The electron beam was focused on a single spot, and X-ray spectra were acquired from the same location.
- Results and Interpretation: The 122 eV EDS detector showed some improvement over the 138 eV detector, but the Pb and S peaks remained severely overlapped, preventing direct, confident identification and quantification [28]. In contrast, the WDS spectrum, with its superior energy resolution, clearly resolved the S and Pb peaks into distinct, well-separated peaks [28]. This demonstrates that even advanced EDS detectors cannot overcome fundamental physics for closely spaced peaks, whereas WDS provides unambiguous results without the need for complex spectral deconvolution.
Case Study 2: Trace Element Analysis in Steel
Another critical application is the measurement of trace elements, which are essential for understanding material properties but exist at low concentrations.
- Experimental Protocol: A steel sample with known low concentrations of phosphorus (P) and cobalt (Co) was analyzed using both EDS and WDS. Quantitative spot analyses were performed at multiple points, and the results were averaged.
- Results and Interpretation: The WDS analysis reliably detected and quantified the trace levels of P and Co, thanks to its significantly higher peak-to-background (P/B) ratio [6]. The EDS technique, with its higher background and poorer resolution, struggled to distinguish the weak characteristic X-ray peaks of these trace elements from the spectral background, leading to much higher minimum detection limits [6]. For applications requiring the identification of trace constituents at levels below 0.1 wt%, WDS is the unequivocally superior technique.
Table 2: Summary of Key Experimental Outcomes
| Experimental Goal | EDS Performance & Limitation | WDS Performance & Advantage |
|---|---|---|
| Resolving S and Pb in Galena | Fails to separate peaks; results in a merged spectral peak, complicating identification and quantification [28]. | Cleanly resolves the S Kα and Pb Mα peaks, allowing for direct and confident analysis [28]. |
| Measuring trace P and Co in Steel | Limited by high background; detection limits are too high for accurate measurement of low-concentration elements [6]. | High P/B ratio enables detection and quantification of elements at concentrations as low as 100 ppm [6]. |
| Light Element Analysis | Challenging due to absorption of low-energy X-rays by detector windows and the sample itself [28]. | Specialized crystals maximize efficiency for detecting low-energy X-rays from elements like B, C, N, and O [6]. |
Operational Workflows: A Tale of Two Techniques
The fundamental difference in how EDS and WDS collect data leads to distinct operational workflows, which can be visualized in the following diagram.
Diagram 1: EDS and WDS Operational Workflows
The Scientist's Toolkit: Essential Components for Microanalysis
Understanding the key components of each system is vital for researchers to effectively utilize these techniques.
Table 3: Essential Research Reagent Solutions for EDS and WDS
| Item / Component | Function / Role in Analysis |
|---|---|
| Silicon Drift Detector (SDD) | The core of modern EDS systems; a solid-state detector that collects and separates X-rays by their energy with high throughput and good resolution [28] [27]. |
| Analyzing Crystals (e.g., TAP, PET, LIF) | The heart of the WDS spectrometer. Crystals with specific lattice spacings (d-spacings) are used to diffract X-rays according to Bragg's Law, providing high-resolution wavelength separation [25] [27]. |
| Proportional Counter (Gas-Flow/Sealed) | The detector used in WDS. It converts diffracted X-ray photons into electrical pulses, providing high signal-to-noise ratios, which is crucial for trace element detection [25]. |
| Standard Reference Materials | Certified samples with known compositions. Essential for accurate WDS quantification to calibrate the instrument and correct for matrix effects (ZAF corrections) [6] [25]. |
| Conductive Coating (e.g., Carbon) | A thin layer applied to non-conductive samples to prevent charging under the electron beam, which is critical for obtaining accurate quantitative data, especially in high-vacuum mode [4]. |
The showdown between EDS and WDS is not about declaring one technique universally superior, but about matching the tool to the scientific question. EDS, with its speed, ease of use, and ability to survey the entire elemental landscape simultaneously, is an unparalleled tool for initial sample characterization, quick phase identification, and major element analysis [6] [4]. Its "point and press" nature makes it an excellent first step in any microanalytical investigation.
Conversely, WDS is the specialist's instrument, deployed when analytical challenges demand the highest performance. Its superior energy resolution (~10-20 eV) makes it the definitive choice for resolving severe peak overlaps, quantifying trace elements down to ppm levels, and achieving the highest quantitative accuracy [6] [25] [7]. The trade-off is a significant increase in analysis time and operational complexity.
For modern laboratories, the most powerful approach is an integrated one. Many instrument software platforms now allow for the seamless combination of EDS and WDS, enabling researchers to use EDS for rapid overview and major element analysis while simultaneously employing WDS to tackle specific, challenging elements [6]. This synergistic strategy leverages the strengths of both techniques, providing both comprehensive coverage and definitive results for the most critical aspects of an analysis.
In the field of qualitative elemental analysis, Energy Dispersive X-ray Spectroscopy (EDS) and Wavelength Dispersive X-ray Spectroscopy (WDS) are two cornerstone techniques for determining the elemental composition of materials within a scanning electron microscope (SEM) or electron probe microanalyzer (EPMA). Both techniques operate on the same fundamental principle: a high-energy electron beam strikes the sample, ejecting inner-shell electrons from atoms. As outer-shell electrons fill these vacancies, they emit characteristic X-rays whose energy or wavelength is unique to each element [6] [3]. The critical difference lies in how these characteristic X-rays are detected and measured.
EDS uses a solid-state detector to sort and count X-rays based on their energy. It is renowned for its speed and ability to collect a full spectrum of elements simultaneously, making it a superb tool for initial, rapid characterization [6] [29]. WDS, on the other hand, uses a system of diffracting crystals to separate X-rays based on their wavelengths according to Bragg's Law. This mechanical diffraction process is what grants WDS its superior spectral resolution but also makes it a slower, sequential measurement technique [25] [29]. The choice between these techniques often hinges on a trade-off between analytical speed and the required level of detection sensitivity and spectral clarity, with the detection limit being a paramount differentiator.
The Core Comparison: Detection Limits and Performance
The term "detection limit" refers to the minimum concentration of an element that can be reliably detected by an analytical technique. It is often defined as a peak height three times the standard deviation of the background noise [6]. The stark difference in the detection limits of EDS and WDS is a direct consequence of their differing detector technologies and how they handle X-ray signals.
Quantitative Performance Data
The following table summarizes the key performance characteristics that influence the detection limits of EDS and WDS.
Table 1: Performance Comparison Between EDS and WDS
| Feature | Energy Dispersive X-ray Spectroscopy (EDS) | Wavelength Dispersive X-ray Spectroscopy (WDS) |
|---|---|---|
| Typical Detection Limit | 0.1 wt% (1000 ppm) [7] [23] | 0.01 wt% or better (100 ppm or less) [6] [23] |
| Spectral Resolution | 50 - 150 eV [6] [29] | 3 - 30 eV [6] [23] |
| Peak-to-Background Ratio | Lower | Significantly higher (e.g., 10x) [6] |
| Measurement Speed | Fast; simultaneous multi-element collection [29] | Slow; sequential element measurement [23] |
| Key Strength | Rapid survey analysis, live chemical imaging [6] | Trace element analysis, resolving peak overlaps [25] |
Underlying Reasons for the Difference in Detection Limits
The two-order-of-magnitude advantage WDS holds in detection limits is attributable to two main factors:
- Superior Spectral Resolution: The energy resolution of WDS is typically 10 times better than that of EDS [6] [29]. While an EDS system might report a peak for Manganese Kα that is 135-150 eV wide, the same peak measured by WDS would be only about 10 eV wide [29]. This sharp resolution ensures that closely spaced X-ray peaks from different elements are cleanly separated, preventing small peaks of trace elements from being obscured or lost within the tail of a major element's peak [8].
- Higher Peak-to-Background (P/B) Ratio: In any X-ray spectrum, the characteristic peaks of elements are superimposed on a continuous background of "Bremsstrahlung" radiation. WDS systems excel at suppressing this background. The significantly lower background intensity in a WDS spectrum means that even very small characteristic peaks from trace elements stand out clearly, making them statistically detectable [6]. This improved P/B ratio is a major contributor to WDS's ability to detect elements at concentrations as low as 100 ppm, a level where EDS signals would be lost in the noise [6] [7].
Experimental Protocols and Applications
The distinct capabilities of EDS and WDS make them suited for different experimental scenarios. The following workflow illustrates a typical correlative approach that leverages the strengths of both techniques.
Diagram 1: A Correlative EDS/WDS Analysis Workflow
Key Experimental Applications
1. Resolving Severe Peak Overlaps
- Protocol: When EDS analysis suggests the presence of elements with overlapping peaks (e.g., sulfur (S) Kα at 2.307 keV and molybdenum (Mo) Lα at 2.293 keV), a WDS scan is performed across the specific wavelength range. The high-resolution WDS spectrometer, with an appropriate analyzing crystal, is mechanically scanned to separate the closely spaced peaks [6] [25].
- Supporting Data: A direct comparison of EDS and WDS spectra from the same material shows that while EDS presents a single, merged peak, WDS clearly resolves the individual S and Mo peaks, allowing for confident identification and accurate quantification without complex deconvolution software [6] [29].
2. Trace Element Identification and Mapping
- Protocol: To identify trace elements (e.g., phosphorus or cobalt in steel), a high beam current (several hundred nA) is used with WDS to maximize X-ray counts. The spectrometer is tuned to the characteristic wavelength of the trace element, and counts are accumulated over a longer dwell time to achieve sufficient statistics [6] [23].
- Supporting Data: A study analyzing steel was able to characterize low levels of P and Co using WDS, which provided the necessary sensitivity. The detection limit for WDS in such applications can be as low as 10-100 ppm, compared to about 1000 ppm for EDS, making WDS up to two orders of magnitude better for trace element detection [6] [23].
3. Analysis of Light Elements
- Protocol: Measuring low concentrations of light elements (e.g., Boron, Carbon, Nitrogen) is challenging due to their low X-ray yields and easy absorption. WDS uses specialized multi-layered crystals designed to maximize scattering efficiency for the long wavelengths produced by these elements [6].
- Supporting Data: WDS can be used to create calibration curves for carbon in steel using certified standards. This allows for highly accurate quantification of carbon content in unknown samples, a task that is difficult with EDS due to its lower peak-to-background ratios for low-energy X-rays [6].
4. Semiconductor Wafer Contaminant Detection
- Protocol: To detect nanoscale contaminants (e.g., a 3 nm Tungsten film) on a silicon wafer, a low accelerating voltage (e.g., 3-5 kV) is used to minimize electron beam penetration into the substrate and maximize interaction with the surface contaminant. WDS is then used to isolate the contaminant's peak (e.g., W Mα) from the strong, broad tail of the silicon peak [8].
- Supporting Data: Experimental results demonstrated that WDS could achieve a statistically significant peak-to-background ratio for tungsten under conditions where EDS could not separate the W signal from the Si background. This confirms WDS as a vital technique for critical wafer inspection applications [8].
The Scientist's Toolkit: Essential Reagent Solutions
Table 2: Key Materials and Equipment for EDS/WDS Microanalysis
| Item | Function in Analysis |
|---|---|
| Polished Specimen Blocks | A flat, polished surface is critical, especially for WDS, to ensure consistent X-ray focus on the Rowland circle and accurate quantification [23]. |
| Conductive Coating (Carbon) | Applied to non-conductive samples to prevent charge buildup under the electron beam, which can distort imaging and X-ray analysis. |
| Certified Standard Reference Materials | Essential for accurate quantitative WDS analysis. Standards with known composition are used to calibrate X-ray intensity measurements for each element [12] [23]. |
| Analyzing Crystals (e.g., LIF, PET, TAP) | A suite of diffracting crystals with different lattice spacings is used in WDS to cover the full range of elemental wavelengths, from light to heavy elements [25]. |
| Silicon Drift Detector (SDD) | The core component of modern EDS systems, providing high throughput and stability for fast elemental analysis and mapping [17]. |
In the face-off between EDS and WDS for qualitative and quantitative elemental analysis, the choice is not about which technique is universally superior, but which is best suited for the specific analytical question. EDS stands out for its unparalleled speed and efficiency, serving as an excellent tool for initial sample screening, major element composition analysis, and live chemical imaging. However, when the research demands the highest level of sensitivity, precision, and spectral clarity, WDS is the unequivocal choice. Its ability to detect elements at the 0.01 wt% level, resolve challenging spectral interferences, and accurately quantify light and trace elements makes it an indispensable tool for advanced materials characterization, failure analysis, and cutting-edge research where every part-per-million counts. A modern, integrated approach that leverages the speed of EDS for initial survey and the power of WDS for targeted, high-sensitivity analysis represents the most effective strategy for comprehensive elemental microanalysis.
In the field of qualitative elemental analysis, two primary techniques dominate research using electron microscopes: Energy Dispersive X-ray Spectroscopy (EDS) and Wavelength Dispersive Spectroscopy (WDS). The choice between these methods often centers on a fundamental trade-off: the speed of simultaneous multi-element detection offered by EDS versus the high precision and resolution achieved through the sequential measurement of WDS. Both techniques analyze the characteristic X-rays generated when a sample is bombarded with an electron beam, but their mechanisms for detecting and discriminating these X-rays are fundamentally different, leading to distinct performance profiles [21] [5].
This guide objectively compares EDS and WDS, providing researchers and scientists with the data necessary to select the appropriate technique for their specific analytical challenges, particularly in contexts requiring qualitative identification and distribution of elements.
Core Principles and Analytical Workflows
The fundamental difference between EDS and WDS lies in how they distinguish between the characteristic X-rays emitted by different elements.
EDS (Energy Dispersive X-ray Spectroscopy): This technique uses a solid-state detector to measure the energy of incoming X-rays simultaneously. When an X-ray strikes the semiconductor detector, it generates a charge pulse proportional to the X-ray's energy. This allows the system to collect the entire spectrum of X-ray energies at once, providing immediate information on all elements present within the excitation volume [29] [1]. This is a simultaneous multi-element analysis method.
WDS (Wavelength Dispersive Spectroscopy): In contrast, WDS separates X-rays based on their wavelengths using the principle of X-ray diffraction. The spectrometer employs an analyzing crystal with a specific lattice spacing. The crystal and detector are moved to precise angles so that only X-rays of a specific wavelength satisfy Bragg's Law and are diffracted into the detector at a time. This means WDS measures the intensity of one elemental line at a time, making it a sequential measurement technique [29] [5].
The following diagram illustrates the distinct operational workflows for EDS and WDS analysis.
Direct Performance Comparison: EDS vs. WDS
The different operational principles of EDS and WDS lead to significant differences in their analytical performance. The table below summarizes the key performance characteristics for direct comparison.
Table 1: Direct Performance Comparison of EDS and WDS
| Performance Characteristic | EDS (Energy Dispersive Spectroscopy) | WDS (Wavelength Dispersive Spectroscopy) |
|---|---|---|
| Analysis Type | Simultaneous multi-element analysis [21] | Sequential measurement [21] |
| Spectral Resolution | 50-250 eV (typically ~130 eV for Mn Kα) [6] [29] [4] | 3-30 eV (typically ~10 eV for Mn Kα) [6] [29] [4] |
| Detection Limit (Typical) | 0.1 wt% (1000 ppm) [6] [7] [4] | 0.01 wt% (100 ppm) or better [6] [29] [7] |
| Peak-to-Background Ratio | Lower [6] | Significantly higher (≥10x) [6] [29] |
| Analytical Speed | Very fast; full spectrum in seconds [29] [21] | Slower; requires scanning for each element [21] |
| Light Element Performance (Be, B, C, N, O) | Standard performance [4] | Enhanced sensitivity with specialized crystals [6] [5] |
Advantages and Limitations in Practice
EDS Advantages and Typical Use Cases: The primary advantage of EDS is its speed. The ability to identify all elements from a region of interest in seconds makes it an ideal tool for initial sample screening, quick qualitative assessment, and creating elemental maps where a general overview of composition is needed [6] [4]. Its operation is often "point and press," requiring minimal prior knowledge of the sample [6].
WDS Advantages and Typical Use Cases: The superior resolution and sensitivity of WDS make it the method of choice for resolving complex analytical problems. Its key applications include: separating closely overlapping X-ray peaks (e.g., S Kα vs. Pb Mα, or V Kβ vs. Ti Kα) that are inseparable by EDS [6] [29]; identifying and quantifying trace elements present at levels below the detection limit of EDS [5] [7]; and performing highly accurate quantitative analysis with precision comparable to wet chemical methods [6].
Experimental Protocols and Data Validation
Protocol for Comparative Analysis of Peak Overlap
Objective: To demonstrate the capability of WDS to resolve spectral overlaps that EDS cannot, using a known complex sample [29].
Materials: A certified reference material or synthesized sample containing elements with overlapping X-ray lines, such as a Pt-Au-Nb alloy or a sample containing both sulfur (S) and molybdenum (Mo) [6] [29].
Methodology:
- Mount and coat the sample following standard SEM preparation protocols to ensure conductivity.
- Insert the sample into the SEM chamber and locate a region of interest.
- EDS Analysis: Acquire an X-ray spectrum using an EDS detector with a live time of 30-60 seconds to ensure sufficient counts.
- WDS Analysis: On the same spot, configure the WDS spectrometers. Set the spectrometer for the specific wavelength of one overlapping element (e.g., S Kα) and perform a wavelength scan across the energy range encompassing all potential overlaps. Repeat for the other element (e.g., Mo) [6].
- Compare the acquired EDS and WDS spectra.
Expected Outcome: The EDS spectrum will show a single, broadened peak for the overlapping elements. In contrast, the WDS scan will reveal distinct, well-resolved peaks for each element, allowing for unambiguous identification and more accurate quantification without complex spectral deconvolution [6] [29].
Protocol for Assessing Trace Element Detection
Objective: To compare the minimum detection limits of EDS and WDS for a trace element in a matrix [7].
Materials: A homogeneous sample with a certified low concentration of a trace element (e.g., Cobalt in steel at ~0.05 wt%) [6].
Methodology:
- Prepare a polished, flat cross-section of the sample.
- EDS Analysis: Acquire multiple EDS spectra from different points with a long live time (e.g., 100 seconds) to improve counting statistics. Use the software to quantify the trace element.
- WDS Analysis: On the same points, configure the WDS spectrometer to the characteristic X-ray line of the trace element. Measure the peak intensity and the background on either side of the peak.
- Calculate the Peak-to-Background (P/B) ratio for both techniques and compare the standard deviation of the quantitative results.
Expected Outcome: The WDS analysis will yield a significantly higher P/B ratio and much lower statistical scatter (by a factor of up to 8x) in the quantitative results for the trace element, confirming its superior detection limit and quantitative precision [6] [29].
The Scientist's Toolkit: Essential Equipment and Reagents
Table 2: Key Research Reagent Solutions for EDS/WDS Analysis
| Item | Function / Description | Critical Requirement |
|---|---|---|
| Polished Sample Blocks | Mounted and polished samples (e.g., epoxy resin blocks) for analysis. | A flat, polished surface is mandatory for accurate quantitative analysis, especially for WDS, to maintain a consistent X-ray take-off angle [5] [4]. |
| Conductive Coatings | Thin films (e.g., carbon) evaporated or sputtered onto non-conductive samples. | Prevents charging effects that distort imaging and X-ray data. Carbon is preferred for light element analysis as it does not introduce significant overlapping peaks [5] [4]. |
| Certified Reference Materials (CRMs) | Standards of known composition for quantitative calibration. | Essential for high-accuracy WDS quantification. Used to create calibration curves (e.g., for carbon in steel) [6]. |
| Specialized WDS Crystals | Analyzing crystals with different lattice spacings (e.g., LIF, PET, TAP). | Different crystals diffract specific wavelength ranges. A suite of crystals is required to cover the entire periodic table, especially for light elements [29] [5]. |
| Windowless SDD Detector | A Silicon Drift Detector (SDD) for EDS without a protective window. | Enables the detection of low-energy X-rays from light elements, down to lithium (Li), which are easily absorbed [1] [4]. |
Integrated Analysis: The Modern Correlative Approach
The dichotomy between EDS and WDS is not absolute. Modern instrumentation and software increasingly support fully integrated EDS/WDS analysis [6]. In this correlative approach, the strengths of both techniques are combined:
- Rapid Survey with EDS: EDS is used for initial, fast screening to identify major elements and get a general overview of the sample's composition.
- Targeted High-Resolution with WDS: WDS is then deployed specifically to measure elements with overlapping peaks in the EDS spectrum or to quantify trace elements with high precision [6].
This hybrid workflow maximizes efficiency and data quality, saving time while ensuring the highest confidence in the final results [6]. A 2025 study on deacidified paper effectively used this approach, employing SEM-EDS for initial assessment and SEM-WDS for accurate, spatially resolved elemental distribution data [30] [7].
The choice between EDS and WDS is not about finding a universally superior technique, but about matching the tool to the specific research question. EDS provides unparalleled speed and efficiency for simultaneous multi-element analysis, making it ideal for qualitative surveys and mapping. WDS offers unmatched precision, resolution, and sensitivity for solving challenging analytical problems involving peak overlaps and trace elements. For the most comprehensive material characterization, the integrated use of both techniques represents the state-of-the-art, allowing researchers to first quickly understand their sample with EDS and then probe its deepest compositional secrets with WDS.
Energy Dispersive X-ray Spectroscopy (EDS) and Wavelength Dispersive X-ray Spectroscopy (WDS) are two complementary techniques for elemental analysis in electron microscopy. Both techniques rely on the detection of characteristic X-rays emitted from a sample when excited by a high-energy electron beam. The energy of these X-rays is characteristic of the atomic structure of the element from which they are emitted, allowing for the determination of elemental composition [13]. Despite this common fundamental principle, EDS and WDS differ significantly in their detection methods, performance characteristics, and optimal application areas, making them uniquely suited for a hybrid approach that leverages their complementary strengths.
EDS operates by using a semiconductor detector to measure the energy of incoming X-rays simultaneously across a wide energy spectrum, enabling rapid identification of multiple elements present in a sample [21] [17]. This "point and press" capability makes EDS exceptionally useful for initial sample screening and qualitative analysis. In contrast, WDS employs diffracting crystals to separate X-rays based on their wavelengths according to Bragg's law (nλ = 2d sin θ, where n is an integer, λ is the wavelength, d is the crystal lattice spacing, and θ is the diffraction angle) [13]. This wavelength dispersion method provides superior spectral resolution but analyzes elements sequentially rather than simultaneously [6] [21]. The integration of both techniques within a single instrument platform, particularly modern scanning electron microscopes (SEM), creates a powerful analytical system that combines the speed of EDS with the precision of WDS, offering researchers unparalleled flexibility in addressing diverse analytical challenges.
Fundamental Principles and Technical Comparison
Core Technological Differences
The fundamental distinction between EDS and WDS lies in their mechanisms for distinguishing X-ray energies and wavelengths. EDS utilizes a solid-state detector, typically a silicon drift detector (SDD) cooled by the Peltier effect, which measures the energy of each X-ray photon incident upon it [6] [17]. When an X-ray strikes the detector, it generates electron-hole pairs proportional to its energy. This charge pulse is converted to a voltage pulse, which is sorted by energy to build a spectrum histogram displaying intensity versus energy [17]. This process allows all elements to be detected simultaneously, enabling real-time chemical imaging and rapid elemental identification.
Conversely, WDS employs a different physical principle based on X-ray diffraction. The system uses analyzing crystals with specific interplanar spacings that are mechanically moved along the circumference of a Rowland circle [6] [31]. Each crystal diffracts only X-rays of specific wavelengths that satisfy the Bragg condition, effectively filtering individual X-ray lines and delivering them to a proportional counter detector [6]. This sequential measurement process provides exceptional spectral resolution but requires more time for full spectrum acquisition compared to EDS. The mechanical requirements of WDS spectrometer design are considerably more complex, requiring state-of-the-art engineering and precision craftsmanship to maintain optimal alignment and performance [6].
Performance Characteristics Comparison
Table 1: Direct comparison of key performance characteristics between EDS and WDS
| Performance Parameter | EDS | WDS |
|---|---|---|
| Spectral Resolution | 50-250 eV [6] | 3-30 eV [6] |
| Detection Limits | ~1000 ppm (0.1 wt%) [6] [7] | ~100 ppm or better [6] [7] |
| Analysis Speed | Fast, simultaneous collection [21] | Slower, sequential collection [21] |
| Peak-to-Background Ratio | Lower [6] | Significantly higher [6] |
| Elemental Range | Typically Z≥4 (Be) [31] | Typically Z≥4 (Be) [31] |
| Light Element Sensitivity | Moderate | High with specialized crystals [6] |
| Quantitative Accuracy | Moderate (standardless) [6] | High (requires standards) [6] [31] |
The performance differential between the two techniques is substantial, particularly regarding spectral resolution and detection limits. The approximately 10x better energy resolution of WDS (typically 5 eV compared to 50-250 eV for EDS) enables clear separation of closely spaced X-ray peaks that would be unresolvable with conventional EDS [6] [13]. For example, WDS can easily distinguish between the S Kα (2.307 keV) and Mo Lα (2.293 keV) lines, which severely overlap in EDS spectra, as well as resolve the Si Kα and W Mα overlap [6] [32]. This superior resolution eliminates the need for complex spectral deconvolution procedures and enables more confident elemental identification, particularly in complex samples containing multiple elements with overlapping X-ray emissions.
The significantly improved peak-to-background ratio of WDS, which can be up to two orders of magnitude better than EDS, dramatically enhances detection limits for trace elements [6] [7]. While routine EDS analysis typically detects elements at concentrations around 1000 ppm (0.1 wt%) at best, WDS can reliably detect elements at 100 ppm or considerably less, making it up to 10x more sensitive for trace element analysis [6] [7]. This enhanced sensitivity, combined with superior spectral resolution, makes WDS particularly valuable for applications requiring precise quantification of minor and trace elements, such as determining dopant concentrations in semiconductor materials or measuring trace element distributions in geological samples [6].
The Hybrid EDS-WDS Analytical Workflow
Integrated Methodology
The hybrid EDS-WDS approach follows a systematic workflow that maximizes analytical efficiency while delivering high-confidence results. This integrated methodology leverages the complementary strengths of both techniques by using EDS for rapid initial characterization and survey analysis, followed by targeted WDS measurements for elements that benefit from its superior performance characteristics. Modern software platforms, such as Oxford Instruments' AZtec or EDAX's APEX, seamlessly integrate both techniques, allowing simultaneous or sequential data collection and facilitating direct comparison of results [6] [32].
The analytical workflow begins with EDS for initial sample screening and major element composition assessment. This rapid "point and press" analysis identifies all elements present in the sample above approximately 0.1 wt% concentration and provides a comprehensive overview of sample composition [6]. The EDS results then inform the subsequent WDS analysis strategy, determining which elements require more precise measurement via WDS. Elements presenting analytical challenges in EDS—such as those affected by peak overlaps, present at trace concentrations, or requiring high quantitative accuracy—are selected for WDS analysis. This targeted approach optimizes instrument time by applying the more time-intensive WDS technique only where it provides significant analytical benefits, while relying on faster EDS for elements it can characterize adequately.
Workflow Visualization
Integrated EDS-WDS Analytical Workflow
This optimized workflow demonstrates how the hybrid approach strategically deploys each technique according to its strengths. EDS provides the initial comprehensive elemental survey and handles quantification of major elements unaffected by spectral overlaps, while WDS addresses analytically challenging elements requiring its superior resolution and sensitivity [6]. The final data integration step combines results from both techniques, yielding a complete quantitative analysis that benefits from the speed of EDS and the precision of WDS where needed. This integrated approach is particularly valuable for analyzing complex materials containing both major constituents and trace elements or elements with overlapping X-ray lines, such as compound semiconductors, geological materials, and advanced alloys [6].
Experimental Protocols for Hybrid Analysis
Protocol for Combined EDS-WDS Elemental Mapping
Elemental mapping reveals spatial distribution of elements within a sample, and the hybrid approach significantly enhances mapping efficiency and quality. The following protocol outlines the procedure for combined EDS-WDS mapping:
Sample Preparation: Prepare polished sections appropriate for electron microprobe analysis. Apply conductive coating (carbon or thin metal film) for non-conductive samples to prevent charging effects [3].
Instrument Setup: Mount sample in SEM or electron microprobe equipped with both EDS and WDS detectors. Ensure proper detector calibration and instrument alignment according to manufacturer specifications [32].
Initial EDS Survey: Acquire EDS spectrum from representative area to identify all elements present. Use large area analysis or multiple points to account for sample heterogeneity.
Region of Interest Selection: Select area for mapping based on EDS survey results and sample features of interest. Optimize beam parameters (accelerating voltage, beam current) for required X-ray excitation and spatial resolution.
Element Assignment Strategy:
Simultaneous Data Acquisition: Configure software to acquire EDS and WDS maps simultaneously where possible. For WDS mapping, optimize counting times and step sizes based on element concentrations and analytical requirements.
Data Processing: Process EDS and WDS maps using appropriate background correction and peak deconvolution algorithms. For WDS data, collect off-peak background measurements to accurately model and subtract background contributions [31].
Data Correlation: Overlay EDS and WDS maps in integrated software platform to correlate elemental distributions and identify mineral phases or material constituents.
This protocol was effectively applied in an analysis of alloy segregation, where EDS mapped major elements (Ti, Al) while WDS specifically targeted V, which exhibited severe overlap with Ti in the EDS spectrum [6]. The resulting combined elemental maps clearly revealed segregation patterns that would have been ambiguous using EDS alone.
Protocol for Trace Element Quantification
Accurate trace element quantification represents a significant challenge for EDS but is well-suited to WDS capabilities. The following protocol details the hybrid approach for trace element analysis:
Standard Selection: Select well-characterized certified reference materials matching the sample matrix as closely as possible. WDS quantification requires measurement of standard samples and does not use the standardless quantitative techniques common in EDS [6] [31].
EDS Qualitative Analysis: Perform initial EDS analysis to identify all major and minor elements present. Use this information to select appropriate standards and define the analytical matrix.
WDS Spectral Scan: Acquire high-resolution WDS spectral scans across regions of interest for target trace elements. Use fine step sizes (e.g., 0.0005 Å) to accurately characterize peak shapes and backgrounds.
Peak and Background Measurement: For each element, measure peak intensities at the maximum and background intensities on both sides of the peak. Use the same measurement conditions for both unknowns and standards.
Intensity Ratio Calculation: Calculate net peak intensities (peak minus background) for unknowns and standards. Determine k-ratios (unknown intensity/standard intensity) for each element.
Matrix Correction: Apply matrix correction algorithms (ZAF or φρZ) to convert k-ratios to elemental concentrations. These corrections account for atomic number effects (Z), absorption (A), and fluorescence (F) [31].
Data Validation: Compare EDS and WDS results for consistency in major element concentrations. Use internal consistency checks (element totals, stoichiometry) to validate quantitative results.
This approach enabled accurate measurement of vanadium in a titanium alloy sample, where WDS analysis provided significantly lower uncertainty and improved accuracy compared to EDS measurements [6]. Similarly, in deacidified paper analysis, WDS provided accurate distribution profiles of alkaline components (Mg) that were misinterpreted by EDS due to false signals and poor detection limits [7].
Essential Research Toolkit for Hybrid EDS-WDS Analysis
Table 2: Essential equipment and reagents for hybrid EDS-WDS analysis
| Category | Item | Specification/Type | Function/Purpose |
|---|---|---|---|
| Instrumentation | Scanning Electron Microscope | Variable pressure capability | Sample imaging and electron beam generation |
| EDS Detector | Silicon Drift Detector (SDD) | Simultaneous multi-element detection | |
| WDS Spectrometer | Multiple crystal types | High-resolution wavelength-dispersive analysis | |
| Software | Integrated Analysis Platform | e.g., AZtec, APEX | Simultaneous EDS-WDS data acquisition and processing |
| Sample Preparation | Polishing System | Automated polisher with multiple abrasive steps | Creating flat, scratch-free surfaces for quantitative analysis |
| Conductive Coating System | Carbon or thin metal coater | Reducing charging effects on non-conductive samples | |
| Ultramicrotome | Glass or diamond knives | Preparing thin sections for enhanced spatial resolution | |
| Calibration Standards | Multi-element Reference Materials | Certified microanalysis standards | Quantitative calibration for both EDS and WDS |
| Pure Element Standards | High-purity elements (>99.9%) | Standardization for WDS quantitative analysis | |
| Specialized Supplies | Cryogenic Preparation System | High-pressure freezing, freeze substitution | Preserving elemental distribution in biological samples |
| Conductive Adhesives | Carbon tape, silver paint, colloidal graphite | Mounting samples without introducing contaminating elements |
The research toolkit for hybrid EDS-WDS analysis requires specific instrumentation, sample preparation equipment, and calibration materials to ensure optimal performance. Modern SEM-based systems offer significant advantages for correlative work, as they can be equipped with multiple detectors (BEX, EBSD, etc.) alongside EDS-WDS capabilities, enabling comprehensive sample characterization without transferring samples between instruments [6]. This saves considerable time and cost while avoiding potential sample contamination.
Sample preparation is particularly critical for successful hybrid analysis. Proper preparation techniques include creating polished surfaces with minimal relief for quantitative analysis, applying appropriate conductive coatings to prevent charging, and using specialized techniques like cryofixation for biological samples to prevent elemental redistribution [3]. For WDS analysis, precise control of sample height relative to the spectrometer focal plane is essential, with automated focus routines (such as Smart Focus in EDAX systems) ensuring optimal spectrometer performance [32].
Application Case Studies
Semiconductor Materials Characterization
The hybrid approach proved essential for analyzing AlGaN and GaN compound semiconductor materials during PhD research focused on the effects of n- and p-type doping and AlN content on material quality [6]. EDS provided rapid assessment of major element distributions (Ga, N) and identified regions of interest, while WDS delivered the accurate and precise compositional data required for quantifying AlN content and measuring low dopant concentrations beyond EDS detection limits. The high spectral resolution of WDS enabled clear separation of overlapping X-ray lines that would have complicated EDS quantification, while its superior peak-to-background ratio allowed detection of trace dopants at concentrations critical to semiconductor performance [6].
Analysis of Deacidified Paper Materials
In conservation science, researchers compared SEM-EDS and SEM-WDS for assessing alkaline component distribution in deacidified paper cross-sections [7]. This study revealed that SEM-DS produced false signals that could lead to overestimation of alkaline presence, while SEM-WDS provided more accurate and spatially resolved elemental distribution data. The hybrid approach used EDS for initial screening to identify general areas of alkaline deposition, followed by high-resolution WDS mapping to accurately determine magnesium distribution patterns from MgO treatments. The WDS analysis confirmed significant inhomogeneity in Bookkeeper deacidification treatment, highlighting the need for more precise evaluation tools in conservation practice [7]. The combined approach enabled direct correlation of alkali distribution with local neutralization effects measured through micro-pH distribution profiles.
Steel and Alloy Analysis
Steel analysis benefits significantly from the hybrid approach, particularly for characterizing low levels of phosphorus and cobalt that challenge EDS detection capabilities [6]. In one application, EDS provided rapid analysis of major alloying elements (Fe, Cr, Ni), while WDS targeted trace elements exploiting its improved peak-to-background ratio. This combination delivered complete compositional analysis with detection limits up to two orders of magnitude better for trace elements compared to EDS alone [6]. Similarly, analysis of carbide inclusions in steel utilized EDS for major element quantification while employing WDS with specialized multi-layered crystals to measure low concentrations of light elements (boron, carbon) with greatly improved accuracy [6]. The WDS analysis enabled creation of calibration curves for carbon content in steel using standards with carbon contents ranging from 0.056 to 1.27 wt%, significantly improving measurement accuracy compared to EDS [6].
The hybrid EDS-WDS approach represents the current state-of-the-art in electron microscope-based elemental microanalysis, effectively combining the strengths of both techniques to maximize analytical efficiency and confidence. This integrated methodology leverages the speed and simultaneous multi-element capability of EDS for initial sample characterization and major element analysis, while deploying the superior spectral resolution and detection limits of WDS for analytically challenging elements affected by peak overlaps, present at trace concentrations, or requiring high quantitative accuracy.
As microanalytical challenges continue to evolve with the development of increasingly complex materials systems, the complementary nature of EDS and WDS ensures that their integrated use will remain essential for comprehensive materials characterization. Modern software platforms that seamlessly combine both techniques, along with virtual WDS simulation tools that predict analytical outcomes before data collection, are making this powerful hybrid approach increasingly accessible to researchers across diverse fields [6]. The continued advancement of both technologies—including silicon drift detectors for EDS and enhanced optic systems for WDS—promises to further strengthen this synergistic relationship, providing researchers with an ever-expanding toolkit for addressing the most challenging analytical problems in materials science, geology, biology, and conservation science.
Conclusion
EDS and WDS are not competing but complementary techniques that form a powerful hierarchy for elemental analysis. EDS serves as an excellent tool for rapid, initial screening and major element identification, while WDS is the definitive method for resolving analytical ambiguities, quantifying trace elements, and achieving the highest levels of accuracy. The future of elemental analysis in biomedical research lies in the intelligent integration of both techniques, leveraging the speed of EDS for initial surveys and the precision of WDS for critical validation. This combined approach will be crucial for advancing applications in targeted drug delivery, understanding disease mechanisms through elemental bioaccumulation, and ensuring the safety of biomedical implants, ultimately leading to more precise and reliable scientific outcomes.
References
- 1. What is EDS/EDX? [https://nano.oxinst.com/campaigns/what-is-eds/edx]
- 2. What is EDS? | Energy Dispersive X-Ray Spectroscopy [https://www.bruker.com/en/landingpages/bna/technology/what-is-eds.html]
- 3. Energy Dispersive X-ray (EDX) microanalysis [https://pmc.ncbi.nlm.nih.gov/articles/PMC5907194/]
- 4. A Quick Guide to EDS Elemental Analysis [https://www.jeolusa.com/NEWS-EVENTS/Blog/a-quick-guide-to-eds-elemental-analysis]
- 5. WDS [https://www.gatan.com/techniques/wds]
- 6. Difference between EDS and WDS? What is it all about? [https://www.oxinst.com/blogs/difference-between-eds-and-wds-what-is-it-all-about]
- 7. Choosing between energy-dispersive or wavelength ... [https://link.springer.com/article/10.1007/s10570-025-06771-w]
- 8. A study on using WDS for silicon wafer contaminant detection [https://www.edax.com/resources/application-notes/breaking-through-eds-limitations-a-study-on-using-wds-for-silicon-wafer-contaminent-detection]
- 9. Determining factors affecting the accuracy of SEM-EDX ... [https://www.nature.com/articles/s41598-025-09551-5]
- 10. EDS Principle - West Campus Materials Characterization Core [https://ywcmatsci.yale.edu/edx-principle]
- 11. Enhancements from EDS to WDS [https://www.edax.com/resources/application-notes/enhancements-from-eds-to-wds]
- 12. Performing elemental microanalysis with high accuracy ... [https://pmc.ncbi.nlm.nih.gov/articles/PMC4555346/]
- 13. Wavelength Dispersive X-Ray Spectroscopy - an overview [https://www.sciencedirect.com/topics/chemistry/wavelength-dispersive-x-ray-spectroscopy]
- 14. EDS & WDS - The Differences and Uses [https://meteoritic.com/pages/what-is-the-difference-between-eds-and-wds-spectroscopy]
- 15. Wavelength-dispersive spectrometer for X-ray ... [https://pmc.ncbi.nlm.nih.gov/articles/PMC3025658/]
- 16. Difference between EDS and WDS? What is it all about? [https://nano.oxinst.com/blogs/difference-between-eds-and-wds-what-is-it-all-about]
- 17. Energy-dispersive X-ray spectroscopy [https://en.wikipedia.org/wiki/Energy-dispersive_X-ray_spectroscopy]
- 18. What is WDS? | Wavelength Dispersive Spectroscopy [https://www.bruker.com/en/landingpages/bna/technology/what-is-wds.html]
- 19. Wavelength Dispersive Spectroscopy (WDS) [https://www.edax.com/products/wds]
- 20. Quantitative WDS analysis using electron probe ... [https://www.sciencedirect.com/science/article/abs/pii/S1044580305002561]
- 21. Difference between EDS and WDS spectroscopy [https://rockymountainlabs.com/eds-and-wds-spectroscopy/]
- 22. Qualitative Analysis [https://ors.ou.edu/microprobe/Qual.html]
- 23. wavelength-dispersive X-ray spectroscopy, WDS, WDX [https://www.jeol.com/words/semterms/20121024.072658.php]
- 24. Energy Dispersive X-Ray Spectroscopy (EDS/EDX) of ... [https://www.bruker.com/en/products-and-solutions/elemental-analyzers/eds-wds-ebsd-SEM-Micro-XRF/quantax-eds-for-sem/eds-sem-semiconductor.html]
- 25. Wavelength-Dispersive X-Ray Spectroscopy (WDS) [https://serc.carleton.edu/research_education/geochemsheets/wds.html]
- 26. What is Energy-Dispersive X-Ray Spectroscopy (EDX)? [https://vaccoat.com/blog/edx/]
- 27. WDS versus silicon drift detector EDS: A case report for the ... [https://www.sciencedirect.com/science/article/abs/pii/S0968432806002095]
- 28. Using Energy Resolution to Collect Data for EDS [https://www.azom.com/article.aspx?ArticleID=11984]
- 29. Tech Note: WDS vs EDS [https://www.mcswiggen.com/TechNotes/WDSvsEDS.htm]
- 30. Integrated Parallel Beam WDS/EDS Analysis: Benefits and ... [https://pubmed.ncbi.nlm.nih.gov/41140088/]
- 31. WDS Quantitative Analyses - Microchemical Analysis Facility [https://maf.stanford.edu/electron-microprobe/applications/wds-quantitative-analyses]
- 32. EDAX Lambda WDS Spectrometers [https://www.edax.com/products/wds/lambda-wds-analysis-system]