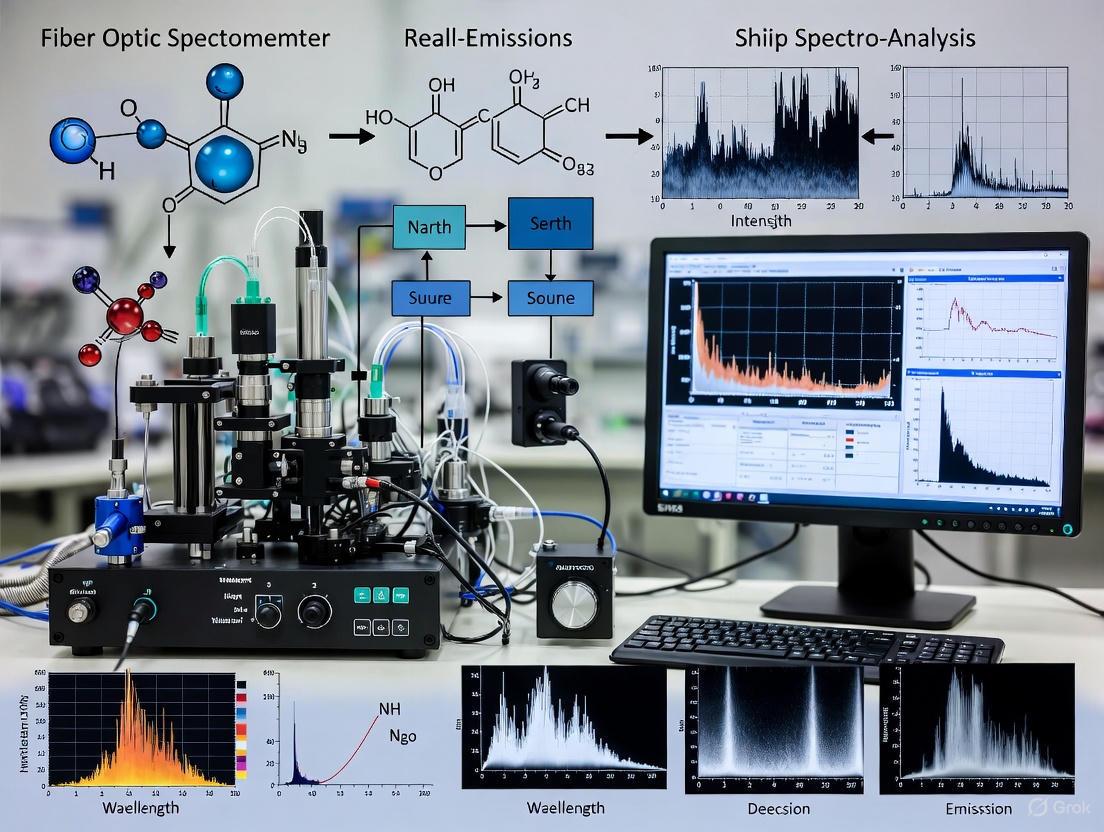
Fiber Optic Spectrometers for Real-Time Ship Emissions Monitoring: Technology, Applications, and Compliance
This article explores the transformative role of fiber optic spectrometers in enabling real-time, in-situ monitoring of ship exhaust emissions.
Fiber Optic Spectrometers for Real-Time Ship Emissions Monitoring: Technology, Applications, and Compliance
Abstract
This article explores the transformative role of fiber optic spectrometers in enabling real-time, in-situ monitoring of ship exhaust emissions. It covers the foundational technology behind modular spectroscopy, its specific methodologies for detecting pollutants like SO2 and NOx, strategies for overcoming field deployment challenges, and validation against other monitoring techniques. Aimed at environmental researchers, maritime engineers, and regulatory compliance professionals, this analysis highlights how this technology provides the precise, verifiable data essential for navigating stringent environmental regulations such as the EU ETS and IMO DCS.
The Urgent Drive for Accurate Emissions Monitoring: Regulations and Environmental Impact
The Global Challenge of Maritime Emissions
International shipping is a critical pillar of the global economy, responsible for transporting over 80% of global trade by volume [1]. However, the sector is also a significant and growing source of atmospheric emissions, contributing substantially to global greenhouse gas (GHG) emissions and air pollution [2]. In 2018 alone, the global shipping industry emitted over 1.056 billion tons of carbon dioxide [2]. Under a business-as-usual scenario, maritime CO2 emissions could quintuple by 2050, potentially contributing 18% of total anthropogenic GHG emissions [2].
The international regulatory landscape is evolving rapidly in response to this challenge. The International Maritime Organization (IMO) has established a strategy targeting a peak in international shipping emissions by 2030 and achieving net-zero emissions by 2050 [2] [3]. In April 2025, the IMO approved draft regulations for a Net-zero Framework, comprising a global fuel standard and a global GHG pricing mechanism, scheduled to enter into force in 2027 [3]. Simultaneously, regional frameworks like the EU's Monitoring, Reporting, and Verification (MRV) system and Emissions Trading System (ETS) are creating additional compliance requirements for ship operators [2].
Within this regulatory context, advanced monitoring technologies are becoming indispensable for compliance verification, enforcement, and the development of effective mitigation strategies. Fiber optic spectrometers, particularly those employing hyperspectral imaging and differential optical absorption spectroscopy (DOAS), represent a transformative approach for the real-time, precise quantification of ship emissions, offering significant advantages over traditional methods [1].
Maritime Emission Monitoring Frameworks and Standards
Compliance with emerging international regulations requires robust methodologies for quantifying ship emissions. The IMO and EU MRV frameworks specify four principal carbon monitoring methodologies [2]:
- Bunker Delivery Note (BDN) Tracking and Periodic Fuel Tank Inventory Checks: Calculates fuel consumption based on delivery notes and tank inventories but cannot distinguish between different emission sources.
- Onboard Bunker Fuel Oil-Tank Monitoring: Uses level sensors to measure fuel volume in tanks, converting to mass via density measurements.
- Flow-Meter Monitoring for Fuel Combustion Processes: Involves installing flow meters at fuel inlets/outlets to record real-time consumption for different engines and boilers.
- Direct CO2-Emission Monitoring: Employs real-time monitoring of CO2 concentration and exhaust gas flow rates to determine total emissions.
The first three are indirect monitoring approaches that calculate emissions based on fuel consumption and emission factors, while the fourth is a direct monitoring method [2]. For air pollutants like SO2 and NO2, remote sensing techniques are increasingly vital for enforcement and scientific study.
Table 1: International Regulatory Drivers for Maritime Emission Monitoring
| Regulatory Body | Regulation/Strategy | Key Requirements | Timeline |
|---|---|---|---|
| International Maritime Organization (IMO) | 2023 IMO Strategy on Reduction of GHG Emissions from Ships | Peak shipping emissions by 2030; Net-zero by 2050 | In effect [2] |
| International Maritime Organization (IMO) | MARPOL Annex VI (Revised) | Mandatory Energy Efficiency Existing Ship Index (EEXI) & Carbon Intensity Indicator (CII) [2] | In effect |
| International Maritime Organization (IMO) | IMO Net-Zero Framework | Mandatory GHG fuel intensity (GFI) standards & global GHG pricing [3] | Entry into force 2027 [3] |
| European Union (EU) | EU MRV (Monitoring, Reporting, and Verification) | Monitoring and reporting of CO2, CH4, N2O emissions [2] | Compliance for CH4/N2O from 2026 [2] |
| European Union (EU) | EU Emissions Trading System (ETS) Maritime | Surrender allowances for CO2 emissions (50% of extra-EU voyages included) [2] | From 2024 [2] |
Fiber Optic Spectrometry for Emission Quantification
Fundamental Principles
Fiber optic spectrometers applied to ship emission monitoring primarily rely on absorption spectroscopy in the UV and visible light ranges. The core principle is the Beer-Lambert Law, which relates the absorption of light to the properties of the material through which the light is traveling. When sunlight is scattered by the atmosphere and passes through a ship's plume, trace gases like SO2 and NO2 absorb specific characteristic wavelengths [1].
The measured quantity is typically the Differential Slant Column Density (DSCD), which represents the concentration of a trace gas integrated along the effective light path through the plume. To convert this DSCD into a Vertical Column Density (VCD)—a more standardized measure—an Air Mass Factor (AMF) is calculated using radiative transfer models. The accuracy of this conversion is highly dependent on atmospheric conditions, particularly the presence of aerosols, which can significantly alter the light path [1].
Key Instrumentation and System Architecture
A state-of-the-art system for fast-hyperspectral imaging remote sensing, as demonstrated for quantifying NO2 and SO2 from marine vessels, integrates several key components into a cohesive architecture [1]:
Diagram 1: Fast-hyperspectral imaging system architecture for ship emission quantification.
Application Notes: Experimental Protocols
Protocol 1: Field Deployment and Plume Imaging
This protocol details the steps for the remote, non-intrusive quantification of NO2 and SO2 emissions from a marine vessel using a fast-hyperspectral imaging system [1].
- Objective: To acquire quantitative images of NO2 and SO2 distribution within a ship's plume and calculate emission fluxes.
- Principle: Solar scattered light penetrating the emission plume is absorbed by trace gases. The system captures spectral data, which is analyzed using DOAS to retrieve DSCDs, subsequently converted to VCDs.
- Materials:
- Fast-hyperspectral imaging remote sensing instrument.
- Calibration light source.
- Meteorological station (for wind data).
- Procedure:
- Site Selection and Setup: Position the instrument on a vantage point (e.g., shore, bridge) with a clear, unobstructed view of the target area and prevailing wind direction. The distance to the expected plume location should be known.
- System Calibration: Conduct a field-of-view (FOV) detection using a calibrated light source. Perform wavelength calibration using known spectral lines.
- Reference Spectrum Acquisition: Before scanning the plume, conduct two zenith measurements to obtain reference spectra with minimal pollutant absorption.
- Plume Scanning: Initiate an automated "S"-shaped trajectory scan of the preset imaging area using the 2D scanning system. The integration time for a single spectrum is typically 3 seconds. A complete scan should take <4 minutes to capture the dynamic plume.
- Parallel Data Acquisition: Simultaneously collect data from the visible camera (for scene context), the multi-channel UV camera (for high-resolution plume contouring), and the hyperspectral camera (for high-precision quantification).
- Aerosol Determination: Analyze the variation of O4 DSCDs along a fixed elevation angle through the plume. A standard deviation of O4 DSCDs <20% indicates aerosols are absent, dictating the subsequent AMF calculation scheme.
- Data Storage: Store all spectral data, images, and instrument metadata (e.g., time, GPS, viewing angles) for post-processing.
Protocol 2: Laboratory Validation and System Performance
This protocol ensures the instrument's precision and reliability before and after field deployment.
- Objective: To validate the system's accuracy, precision, and detection limits for target gas species.
- Materials:
- Calibration cells with known concentrations of NO2 and SO2.
- Temperature-controlled chamber.
- Spectral analysis software (e.g., DOAS evaluation software).
- Procedure:
- Temperature Stability Test: Place the spectrometer in the thermostatic convection chamber and activate the precision temperature control system. Verify the stability at 20°C ± 0.5°C under varying ambient conditions [1].
- Spectral Linearity Check: Expose the system to calibration cells with varying, known concentrations of NO2 and SO2. Confirm that the retrieved DSCDs show a linear response with concentration (R² > 0.99).
- Detection Limit Determination: Perform repeated measurements of a zero-air sample (or a very low-concentration cell). Calculate the standard deviation of the retrieved DSCDs; the 3σ value defines the instrument's detection limit for each gas.
- Spectral Resolution Verification: Use a low-pressure mercury or other line light source to measure the instrument's full width at half maximum (FWHM) and confirm it meets specifications.
- Cross-validation: Compare the results from the hyperspectral camera system with the absorption intensity ratios derived from the multi-wavelength UV camera filters for consistency.
The Scientist's Toolkit: Research Reagent Solutions
Table 2: Essential Materials and Reagents for Fiber-Optic-Based Ship Emission Monitoring
| Item Name | Technical Specification / Purity | Primary Function in Research |
|---|---|---|
| NO2 Calibration Cell | Certified concentration in N2 (e.g., 1-100 ppm), stable optical path length | Instrument calibration and validation; establishing the linearity and accuracy of the DOAS retrieval for NO2 [1]. |
| SO2 Calibration Cell | Certified concentration in N2 (e.g., 1-100 ppm), stable optical path length | Instrument calibration and validation; verifying the sensitivity and specificity of the SO2 absorption band analysis [1]. |
| Zero-Air Generator | Produces hydrocarbon-free, dry air with < 0.1 ppm total hydrocarbons | Providing a clean background spectrum for differential measurements and for system purging [1]. |
| Wavelength Calibration Source | Low-pressure mercury-argon lamp or similar, with known, sharp emission lines | Precise wavelength assignment across the detector's pixels, which is critical for accurate DSCD calculation [1]. |
| High-Precision Temperature Control System | Stability of ±0.5°C (e.g., 20°C ± 0.5°C) [1] | Minimizing spectrometer thermal drift, a major source of spectral noise and instrumental instability [1]. |
| Multi-wavelength Filter Set | Center wavelengths at 310/330 nm (for SO2) and 405/470 nm (for NO2) [1] | Enabling high-spatial-resolution plume contour identification and qualitative assessment of gas distribution via the UV camera [1]. |
Data Presentation and Analysis
The performance of optical remote sensing methods must be evaluated against established monitoring techniques. The following table summarizes and compares the key characteristics of different maritime emission monitoring methodologies.
Table 3: Comparative Analysis of Ship Emission Monitoring Methods
| Monitoring Method | Target Analytes | Approximate Accuracy/Uncertainty | Spatial Resolution | Temporal Resolution | Key Advantages |
|---|---|---|---|---|---|
| Bunker Fuel Tank Monitoring [2] | CO2 (calculated) | Low (varies widely) | Entire vessel | Voyage-based | Simple, low-cost |
| Flow-Meter Monitoring [2] | CO2 (calculated) | High | Per emission source (e.g., main engine) | Real-time | High accuracy, enables refined energy management |
| Direct CO2 Monitoring [2] | CO2 | High | Per exhaust stack | Real-time | Direct measurement, less reliant on fuel properties |
| Fast-Hyperspectral Imaging [1] | NO2, SO2 | High (enabled by precision temperature control ±0.5°C) | < 0.5 m × 0.5 m (distance-dependent) | < 4 minutes per scan | Non-intrusive, provides plume distribution, high spatiotemporal resolution |
| UV Camera with Filters [1] | NO2, SO2 | Moderate (qualitative to semi-quantitative) | High (for plume contour) | Real-time imaging | Excellent for instant plume visualization |
The data processing workflow for transforming raw spectral data into quantifiable emission metrics involves several critical steps, each with specific computational requirements.
Diagram 2: Data analysis workflow for emission quantification.
Fiber Optic Spectrometry (FOS) represents a powerful analytical technique for real-time, in-situ monitoring of gaseous emissions. Within the maritime industry, this technology is increasingly critical for complying with stringent international regulations on air pollutants such as sulfur dioxide (SO₂) and nitrogen dioxide (NO₂) [4] [2]. This document outlines the core principles, application protocols, and key experimental methodologies for deploying fiber optic spectrometry in ship emission monitoring, providing a foundation for research and development in this field.
Core Monitoring Principles and Techniques
Fiber optic spectrometry for emission monitoring is primarily based on absorption spectroscopy. The fundamental principle involves directing light through a gas sample; target molecules absorb specific wavelengths of light, and the resulting attenuation of light intensity is measured to quantify gas concentrations [2].
Several spectroscopic techniques are employed for direct emission monitoring:
- Non-Dispersive Infrared (NDIR): Often used for CO₂ monitoring.
- Tunable Diode Laser Absorption Spectroscopy (TDLAS): Offers high sensitivity and selectivity for specific gases.
- Differential Optical Absorption Spectroscopy (DOAS): Particularly effective for measuring trace gases like SO₂ and NO₂ in open-path configurations [1] [2].
These methods leverage the unique absorption "fingerprints" of molecules, allowing for continuous, real-time quantification of emissions directly from a ship's exhaust stream [2].
Key Application: Fast-Hyperspectral Imaging for Ship Emissions
A advanced application of this technology is Fast-Hyperspectral Imaging, which enables high-precision, long-range sensing of SO₂ and NO₂ emissions from marine vessels [1].
Instrument Design and Workflow
The system integrates multiple optical subsystems for comprehensive data acquisition, as illustrated in the following workflow.
Experimental Protocol: Hyperspectral Imaging of Ship Plumes
Objective: To achieve high-precision imaging and quantification of NO₂ and SO₂ in marine vessel emission plumes. Principle: Measure the Differential Slant Column Density (DSCD) of target gases by analyzing solar scattered spectral radiation absorbed by the plume [1].
Materials:
- Fast-hyperspectral imaging remote sensing instrument [1].
- Calibrated reference gas cells.
- Industrial control computer with specialized software.
Procedure:
- System Setup and Calibration:
- Position the instrument with a clear, unobstructed view of the target area (e.g., a shipping lane).
- Power on the system and initialize all subsystems: hyperspectral camera, UV camera, and visible camera.
- Activate the spectrometer's temperature control system to maintain a stable temperature of 20 °C ± 0.5 °C to minimize spectral noise [1].
- Perform a reference measurement by collecting zenith spectra prior to scanning.
Data Acquisition:
- Initiate an automated "S"-shaped scanning pattern across the preset imaging area using the 2D scanning system.
- Simultaneously collect data from all three camera systems [1]:
- The hyperspectral camera collects solar scattering spectra with an integration time of approximately 3 seconds per spectrum.
- The multi-channel UV camera captures images through specific filter pairs (e.g., 310/330 nm for SO₂; 405/470 nm for NO₂) to aid in plume contour identification.
- The visible camera records contextual images of the imaging area.
- A complete scan of a target plume should take <4 minutes.
Data Analysis:
- Pre-process the raw spectra to remove noise and correct for instrumental effects.
- Apply the DOAS method to the hyperspectral data to retrieve the DSCDs of NO₂ and SO₂, and O₂-O₂ (O₄) collision complexes [1].
- Classify the plume as "aerosol-present" or "aerosol-absent" based on the variation of O₄ DSCDs (standard deviation <20% indicates aerosol absence) [1].
- Calculate the Air Mass Factor (AMF) using a radiative transfer model, selecting the appropriate scheme based on the aerosol classification.
- Compute the Vertical Column Density (VCD) of the target gases.
Research Reagent Solutions
Table 1: Key optical components for hyperspectral emission monitoring.
| Component | Function | Specification Example |
|---|---|---|
| Multimode Optical Fiber | Transmits collected scattered light to the spectrometer. | Low-OH, high UV throughput [1]. |
| Spectrometer | Disperses light and measures intensity vs. wavelength. | Thermoelectrically cooled (<-10°C), high signal-to-noise ratio [1]. |
| Interference Filters | Isolates specific absorption bands for target gases. | Center wavelengths: 310 nm & 330 nm for SO₂; 405 nm & 470 nm for NO₂ [1]. |
| Temperature Control System | Stabilizes spectrometer temperature to reduce noise. | Maintains 20 °C ± 0.5 °C [1]. |
Comparison of Ship Emission Monitoring Methods
The International Maritime Organization (IMO) and EU MRV regulations recognize several methodologies for ship emission reporting [2]. The following table compares these methods, highlighting the role of direct optical monitoring.
Table 2: Comparison of ship carbon emission monitoring and calculation methods.
| Monitoring Method | Accuracy | Real-Time Performance | Key Advantage | Key Limitation |
|---|---|---|---|---|
| Bunker Delivery Note (BDN) Tracking | Low | No (Periodic) | Simple, low cost | Cannot distinguish between emission sources [2] |
| Onboard Tank Level Monitoring | Variable | No (Periodic) | Simple implementation | Low accuracy, cannot distinguish sources [2] |
| Flow Meter Monitoring | High | Yes | High accuracy, source-specific | Measures fuel, not direct emissions [2] |
| Direct CO₂ Emission Monitoring | High | Yes | Measures actual exhaust gas concentration | Requires robust sampling and analysis system [2] |
| Direct SO₂/NO₂ Monitoring (e.g., FOS) | High | Yes | Real-time, specific pollutant data | Sensitive to calibration and environmental conditions [1] [2] |
Fiber optic spectrometry provides a robust, accurate, and real-time solution for monitoring ship emissions, directly addressing the needs of modern environmental regulations. Techniques like fast-hyperspectral imaging allow for the precise quantification of key pollutants like SO₂ and NO₂, advancing research capabilities and enabling effective compliance monitoring. The continuous evolution of spectroscopic sensors and data analysis algorithms promises even greater integration of this technology into the maritime industry's environmental management systems.
Key Advantages Over Traditional Lab Analysis
The monitoring of ship emissions is a critical component in global efforts to reduce atmospheric pollution and its impacts on human health and climate. Traditional methods for analyzing emissions have predominantly relied on manual sample collection followed by laboratory-based analysis. While accurate, this approach creates a significant time lag between sampling and the availability of results, preventing real-time operational adjustments and immediate regulatory compliance verification.
In contrast, fiber optic spectrometer-based systems represent a transformative technological shift. These systems facilitate real-time, in-situ monitoring of key pollutants such as nitrogen oxides (NOx), sulfur dioxide (SO2), and ammonia (NH3) directly within a ship's exhaust stream [5]. This application note details the specific advantages of this technology and provides detailed protocols for its deployment in ship emissions monitoring, framing it within broader research on advanced environmental sensing.
Key Advantages of Fiber Optic Spectrometer Systems
The transition from traditional lab analysis to fiber optic spectrometer systems offers several distinct, quantifiable advantages, summarized in the table below.
Table 1: Key Advantages of Fiber Optic Spectrometry Over Traditional Lab Analysis
| Feature | Traditional Lab Analysis | Fiber Optic Spectrometer Systems | Practical Implication for Research & Compliance |
|---|---|---|---|
| Measurement Timeline | Offline; days to weeks | Real-time/continuous (seconds) [5] | Enables immediate detection of emission events and rapid response. |
| Data Availability | Delayed, discrete data points | Continuous data streams for trend analysis [6] | Supports dynamic operational adjustments and complex pattern analysis. |
| Location of Analysis | Laboratory-based | In-situ measurement on the ship [5] | Eliminates sample degradation during transport; measures under true operational conditions. |
| Logistical Overhead | High (physical collection, transport, lab costs) | Low once installed; minimal manual intervention [5] | Reduces long-term monitoring costs and operational complexity for shipping companies. |
| Adaptability & Flexibility | Low; methods are fixed post-sampling | High; modular systems can be reconfigured for new gases [5] | Future-proofs monitoring infrastructure against evolving regulatory requirements. |
| Spatial Resolution | Single-point source data | Capable of hyperspectral imaging with sub-meter resolution [1] | Allows for precise plume tracking and source identification within a exhaust stream. |
Beyond the factors in the table, a critical advantage is the direct operational impact. Real-time data allows ship operators to immediately optimize engine performance and fuel quality to minimize emissions, ensuring compliance with increasingly stringent international regulations from the IMO and EU [6]. Furthermore, the rugged design of systems from suppliers like Danfoss IXA ensures they can withstand harsh marine environments with minimal maintenance, even during long voyages [5].
Experimental Protocols for Real-Time Ship Emissions Monitoring
This section provides a detailed methodology for deploying a fiber optic spectrometer system to monitor gaseous ship emissions, based on established industrial and research practices.
System Configuration and Key Research Reagents
The core of the monitoring system is a modular spectrometer connected to a probe positioned in the ship's exhaust stack via fiber optic cables.
Table 2: Essential Materials and Research Reagent Solutions
| Item / Solution | Function / Specification | Research Application |
|---|---|---|
| UV-Vis Spectrometer | Measures absorption spectra (e.g., 300-950 nm range) [5] | Detects specific absorption features of NO2, SO2, and other gases. |
| Fiber Optic Probe | Ruggedized, transmits light to/from the measurement zone. | Enables remote sensing; separates sensitive spectrometer from harsh stack environment. |
| Calibration Gas Mixtures | Certified concentrations of NO2, SO2 in inert gas. | Provides reference spectra for quantitative Differential Optical Absorption Spectroscopy (DOAS) analysis. |
| Hyperspectral Imaging System | Advanced setup with VIS camera, UV camera, and hyperspectral camera [1] | Provides precise imaging and quantification of NO2 and SO2 plume contours and distribution. |
| Temperature Control System | Maintains spectrometer at 20°C ± 0.5°C [1] | Ensures spectral stability and high-precision measurements by reducing instrument noise. |
Protocol 1: Continuous In-Situ Exhaust Gas Monitoring
Workflow Description: This protocol describes the setup for continuous, in-situ monitoring of exhaust gas concentrations using a fiber optic spectrometer system deployed on a marine vessel.
Procedure Steps:
- System Installation: Install a high-temperature, corrosion-resistant fiber optic probe directly into the ship's exhaust stack, ensuring it is positioned to capture a representative gas sample. Route the fiber optic cables to a spectrometer unit located in a controlled, less harsh environment [5].
- Calibration: Prior to deployment, calibrate the spectrometer using certified calibration gas mixtures to obtain reference absorption spectra for target gases. This step is crucial for the DOAS analysis.
- Real-Time Data Acquisition: The system continuously transmits light through the exhaust gas via the probe and back to the spectrometer. Absorption spectra are acquired with a high frequency (e.g., every few seconds) [5].
- Spectral Analysis: Process the collected spectra using a Differential Optical Absorption Spectroscopy (DOAS) algorithm. This fitting routine compares the measured spectra to the reference spectra to isolate the absorption features of the target gases from other interfering factors.
- Data Output and Reporting: The calculated concentrations of NO2, SO2, and other pollutants are output in real-time. This data can be displayed on the ship's bridge, logged for internal records, and formatted for compliance reporting to regulatory bodies like the IMO [6].
Protocol 2: Remote Plume Imaging and Quantification
Workflow Description: This protocol uses a advanced hyperspectral imaging system for remote sensing of ship emissions, enabling visualization and quantification of the entire gas plume.
Procedure Steps:
- System Setup: Deploy a fast-hyperspectral imaging system that co-axially integrates a hyperspectral camera, a visible light camera, and a multiwavelength UV camera. This setup is typically land-based or mounted on another vessel [1].
- Area Scanning: Control the telescope of the system using a 2D scanning system (azimuth and elevation motors) to perform a continuous "S"-shaped trajectory scan, covering the preset imaging area where the ship's plume is located. A complete scan typically takes under 4 minutes [1].
- Spectral Collection: The hyperspectral camera collects solar scattering spectra that have passed through the ship's plume. Simultaneously, the multiwavelength UV camera captures images through specific filters (e.g., 310/330 nm for SO2, 405/470 nm for NO2) to help precisely identify the plume's outline [1].
- Differential Slant Column Density (DSCD) Calculation: Analyze the collected spectra to calculate the DSCDs of NO2 and SO2, which represent the concentration of the gas along the light path.
- Aerosol Correction via O4 Analysis: Analyze the variation of O4 (oxygen collisional pair) absorption within the plume. Use this to categorize the plume as either aerosol-present or aerosol-absent. This classification is critical for selecting the correct Air Mass Factor (AMF) calculation scheme in the radiative transfer model [1].
- Vertical Column Density (VCD) Retrieval: Input the appropriate AMF, calculated based on the aerosol classification, into a radiative transfer model to convert the DSCDs into Vertical Column Densities (VCDs), providing a two-dimensional quantitative image of the pollutant distribution within the plume [1].
Fiber optic spectrometer systems provide a paradigm shift in ship emissions monitoring, moving from delayed, discrete lab results to actionable, real-time data. The key advantages—including continuous in-situ measurement, ruggedness for the marine environment, and the ability to provide both point concentrations and full plume visualization—make this technology indispensable for modern maritime compliance and environmental research. The detailed protocols outlined herein provide a framework for researchers and engineers to implement these systems effectively, contributing to more accurate emissions accounting and a cleaner marine atmosphere.
Emissions from marine vessels, particularly sulfur dioxide (SO₂), nitrogen oxides (NOₓ), and particulate matter (PM₂.₅), represent a significant challenge to atmospheric environmental quality and human health. These pollutants are core byproducts of combustion in ship engines, which predominantly use heavy fuel oil. SO₂ emissions, which result directly from the sulfur content in fuel, are a primary precursor to the formation of secondary sulfate aerosols, a major component of PM₂.₅ [7]. NOₓ, comprising NO and NO₂, contributes to the formation of ground-level ozone and secondary particulate nitrate [8]. The cumulative impact of these pollutants on coastal air quality and global ecosystems has prompted stringent international regulations, creating an urgent need for accurate, real-time monitoring technologies to ensure compliance and protect public health.
Fiber optic spectrometer-based systems, particularly those employing differential optical absorption spectroscopy (DOAS) and related hyperspectral imaging techniques, are emerging as powerful tools for quantifying these gaseous pollutants. Their non-contact, remote sensing capability is ideal for monitoring mobile and dynamic sources like ship exhausts, providing critical data that can be used to validate emission inventories and assess the effectiveness of cleaner fuel policies.
Monitoring Technologies and Quantitative Findings
Remote sensing technologies for ship emissions have evolved significantly, moving from point measurements towards high-resolution imaging techniques that allow for both the quantification of gas concentrations and the visualization of plume dispersion. The core principle underlying these methods is the unique absorption that gas molecules like SO₂ and NO₂ exhibit in the ultraviolet (UV) and infrared (IR) spectral regions. By measuring the attenuation of sunlight as it passes through a ship's plume, these systems can calculate the concentration of the target gas along the light path.
Recent advancements focus on overcoming the limitations of earlier techniques, such as poor temporal/spatial resolution, an inability to perform nighttime monitoring, and difficulty in accurately identifying the plume轮廓. The table below summarizes key performance data and findings from recent studies on pollutant reductions and monitoring technologies.
Table 1: Quantitative Findings on Pollutant Reductions and Monitoring Performance
| Aspect | Quantitative Finding | Context / Technology | Source |
|---|---|---|---|
| PM₂.₅ Response to SO₂ Reductions | Decrease of 1.8–3.9 μg/m³ | Associated with SO₄²⁻ decreases of 46–63% | [8] |
| PM₂.₅ Response to NOₓ Reductions | Additional decrease of 0.2–1.0 μg/m³ | With a 40% HNO₃ decrease (approximating NOₓ reductions) | [8] |
| SO₂ Concentration Inversion Error | Relative error ≤ 10.36% | Using infrared multispectral imaging | [7] |
| SO₂ Emission Rate Inversion Error | Error of 11.64% | Under a temperature deviation of 100 K using optical flow method | [7] |
| Imaging Spatial Resolution | < 0.5 m × 0.5 m | Achieved by fast-hyperspectral imaging, dependent on distance | [9] |
These quantitative findings highlight two critical points: first, that reductions in SO₂ and NOₓ emissions lead to tangible improvements in ambient PM₂.₅ levels, underscoring the direct benefit of emission control regulations [8]. Second, modern optical imaging methods have achieved a high degree of accuracy in quantifying emissions, with errors for SO₂ concentration and emission rate hovering around 10-12% [7], making them reliable tools for regulatory compliance and scientific research.
Experimental Protocols for Real-Time Ship Emission Monitoring
This section details specific methodologies for deploying optical sensing systems to monitor SO₂ and NO₂ from ship exhausts.
Protocol 1: Fast-Hyperspectral Imaging (e.g., for NO₂ and SO₂)
This protocol is designed for high-precision quantification and imaging of multiple pollutants with high spatiotemporal resolution [9].
Instrument Setup and Calibration
- System Assembly: Deploy the fast-hyperspectral imaging instrument. The core components must include a coaxial visible camera, a multi-channel UV camera system with a filter wheel, a hyperspectral camera system (telescope, fiber, spectrometer), and a 2D motorized scanning system.
- Wavelength Calibration: For the hyperspectral spectrometer, ensure calibration across the 300-400 nm UV range. The UV camera filters should be centered at 310 nm & 330 nm for SO₂ and 405 nm & 470 nm for NO₂ to capture differential absorption [9].
- Thermal Stabilization: Activate the spectrometer's temperature control system to maintain a stable temperature of 20 °C ± 0.5 °C to minimize spectral noise and drift [9].
- Field of View (FOV) Alignment: Precisely align the FOV of the visible, UV, and hyperspectral cameras to ensure spatial data correlation.
Field Measurement and Data Acquisition
- Site Selection: Position the instrument at a coastal location with a clear line of sight to shipping lanes, considering typical wind patterns.
- Reference Spectrum Collection: Before scanning a target ship, conduct two zenith measurements with the hyperspectral camera to obtain reference spectra with minimal pollutant absorption [9].
- Automated "S"-Pattern Scanning: Initiate the automated scanning sequence. The 2D scanning system moves the telescope in a pre-programmed "S"-shaped trajectory to cover the entire imaging area. The hyperspectral camera collects solar scattering spectra with an integration time of 3 seconds per spectrum [9].
- Simultaneous Imaging: The visible and UV cameras concurrently capture images to provide visual context and high-spatial-resolution plume absorption data.
Data Processing and Air Mass Factor (AMF) Calculation
- Spectral Analysis: Process the collected hyperspectral data using the DOAS method to retrieve the Differential Slant Column Densities (DSCDs) of NO₂ and SO₂.
- Plume Categorization and AMF: Classify the plume based on aerosol content by analyzing variations in O₄ DSCDs.
- Develop and apply different radiative transfer models for aerosol-present and aerosol-absent plumes to calculate the appropriate AMF for each measurement point [9].
- VCD Calculation: Convert the DSCDs to Vertical Column Densities (VCDs) using the calculated AMFs.
Plume Identification and Flux Calculation
- Plume轮廓 Delineation: Use the multi-wavelength UV images to precisely identify the outline of the NO₂ and SO₂ plumes.
- Mass Flux Determination: Combine the VCD data with the plume's planar dimensions and wind speed data (from a co-located meteorological station) to calculate the mass emission rates (e.g., g/s) for NO₂ and SO₂.
The following workflow diagram illustrates this multi-step protocol:
Protocol 2: Infrared Multispectral Imaging (e.g., for SO₂)
This protocol is optimized for 24/7 monitoring of SO₂, leveraging its strong absorption characteristics in the infrared spectrum [7].
System Configuration and Band Selection
- Instrument Design: Construct a remote sensing system around a mid-wave or long-wave infrared camera equipped with a suite of narrow-band filters.
- Spectral Basis: Select the optimal monitoring band for SO₂. The 7.3 μm band is preferred due to its strong absorption and minimal interference from other atmospheric gases like H₂O and CO₂ [7].
- Background Radiation Correction: Implement a background reconstruction algorithm to account for and remove the effects of ambient background radiation, which is crucial for accurate quantification.
Field Deployment and Image Capture
- Port Placement: Install the system at a port with a clear view of ship stacks and exhaust pathways.
- Continuous Monitoring: Operate the camera to capture sequential infrared images of ships operating in the harbor. The system's independence from sunlight enables effective daytime and nighttime monitoring.
- Data Recording: Record the image sequence along with timestamp data for subsequent processing.
Image Processing and Concentration Inversion
- SO₂ Concentration Mapping: Apply a pre-calibrated inversion algorithm to the sequence of infrared images. This algorithm converts the measured radiance attenuation, after background subtraction, into a two-dimensional concentration map of the SO₂ plume.
Emission Rate Calculation using Optical Flow
- Plume Motion Tracking: Use a machine vision optical flow algorithm (e.g., Lucas-Kanade) to process the sequence of SO₂ concentration images. This algorithm tracks the movement and deformation of the plume between consecutive frames [7].
- Velocity Field Generation: The optical flow analysis produces a velocity field for the moving plume.
- Emission Rate Determination: Calculate the SO₂ emission rate by integrating the product of the gas concentration and the velocity field normal to a defined measurement plane downwind of the emission source. The reported inversion error for this method is 11.64% under a temperature deviation of 100 K [7].
The Scientist's Toolkit: Key Research Reagent Solutions
The successful implementation of the protocols above relies on a suite of specialized hardware and software components. The following table details these essential research tools and their functions within the context of fiber-optic-based emission monitoring.
Table 2: Essential Research Tools for Optical Emission Monitoring
| Tool Name / Category | Function in Research | Specific Example / Note |
|---|---|---|
| Hyperspectral Spectrometer | The core sensor for capturing high-resolution solar scattering spectra in the UV-visible range for DOAS analysis. | Covers 300-400 nm; requires high spectral resolution (<0.5 nm) [9]. |
| UV Camera & Filter Wheel | Provides high-spatial-resolution imaging for precise plume轮廓 identification at specific absorption wavelengths. | Filters at 310/330 nm (SO₂) and 405/470 nm (NO₂) [9]. |
| Infrared Camera (MWIR/LWIR) | Enables SO₂ imaging based on molecular absorption in the infrared, allowing for 24/7 all-weather monitoring. | Must be sensitive to the 7.3 µm band; requires cooled detector for high sensitivity [7]. |
| Precision Temperature Control System | Stabilizes spectrometer temperature to reduce thermal noise, a critical factor for measurement precision. | Maintains 20 °C ± 0.5°C [9]. |
| 2D Scanning System (Azimuth/Elevation) | Automates the pointing of the telescope/camera to perform systematic scans of the imaging area. | Enables "S"-pattern scanning with angular precision <0.1° [9]. |
| DOAS Fitting Algorithm | Software algorithm that fits reference absorption cross-sections to measured spectra to retrieve pollutant DSCDs. | Core to quantitative analysis; requires high-quality cross-section data. |
| Optical Flow Algorithm | Machine vision method for tracking the motion and deformation of a gas plume between consecutive image frames. | Used to calculate plume velocity for emission rate quantification (e.g., Lucas-Kanade) [7]. |
| Radiative Transfer Model | Software used to simulate light propagation through the atmosphere, crucial for calculating the Air Mass Factor (AMF). | Models like SCIATRAN or VLIDORT; must account for aerosol effects [9]. |
Data Interpretation and Pathway Analysis
The data obtained from these protocols feeds into a critical decision-making pathway for environmental management. The quantitative measurements of SO₂ and NO₂ column densities and their calculated emission rates serve as direct input for evaluating compliance with international MARPOL Annex VI regulations, which set limits on the sulfur content in fuel and NOₓ emission tiers. Furthermore, this high-resolution data is essential for validating and refining atmospheric chemistry models that predict the formation of secondary pollutants like PM₂.₅ and ozone.
The relationship between primary emissions (SO₂, NOₓ) and secondary particulate formation is a complex, multi-pathway process. Reductions in SO₂ emissions lead to a direct decrease in sulfate aerosols (SO₄²⁻), which is a major component of PM₂.₅. As shown in Table 1, a 46-63% reduction in sulfate concentrations can lower PM₂.₅ mass by 1.8–3.9 μg/m³ [8]. Similarly, reductions in NOₓ emissions lower atmospheric concentrations of nitric acid (HNO₃), which can condense to form particulate nitrate (NO₃⁻). The incremental PM₂.₅ reduction from a 40% HNO₃ decrease is somewhat smaller (0.2–1.0 μg/m³) [8], highlighting that the PM₂.₅ response to emission controls is pollutant-specific and can be non-linear. Advanced monitoring with fiber-optic spectrometers provides the empirical data needed to trace these pathways from source to impact, enabling more effective and targeted emission control strategies.
How It Works: Deploying Spectroscopic Systems for Real-Time Exhaust Gas Analysis
Real-time monitoring of ship emissions is critical for enforcing environmental regulations and mitigating the impact of maritime transport on air quality and climate change. International regulations and the EU Horizon 2026 call explicitly highlight the pressing need for accurate, real-time measurement technologies to enforce emission limits in waterfront cities [10]. This application note details a system architecture that leverages modular fiber optic spectrometers coupled with ruggedized probes to create a robust solution for the direct, real-time measurement of gaseous ship emissions, including CO₂, CO, and NOx, in the harsh marine environment.
System Architecture & Technical Specifications
The proposed system is built around a modular fiber optic spectrometer, which serves as the core analytical engine. This device is connected via fiber optic cables to a ruggedized probe installed directly in the ship's exhaust stack.
Core System Components
- Modular Fiber Optic Spectrometer: A flexible platform, such as the PC2000, which uses a 2048-element linear CCD array and is responsive from 200-1100 nm, covering UV, Visible, and Shortwave NIR regions crucial for gas absorption spectroscopy [11]. Its modularity allows for customization with various gratings and slits to optimize for specific pollutants.
- Ruggedized Emission Probe: A custom-designed probe featuring environmental sealing (high IP rating) and corrosion-resistant materials (e.g., Hastelloy) to withstand high temperatures, pressure, shock, vibration, and corrosive exhaust gases [12]. It incorporates a built-in sample cell with precise optical path length.
- Fiber Optic Cabling: SMA 905-terminated, high-temperature optical fibers to transmit light from the probe to the spectrometer, immune to electromagnetic interference prevalent in engine rooms [11].
Technical Specifications
Table 1: Key Specifications of a Modular Fiber Optic Spectrometer (e.g., PC2000) [11]
| Parameter | Specification |
|---|---|
| Detector | 2048-element linear silicon CCD array |
| Spectral Range | 200 - 1100 nm |
| Grating Options | Multiple (e.g., 600 lines/mm for a ~650 nm range) |
| Optical Resolution (FWHM) | ~0.3 nm to 10.0 nm (configurable) |
| Stray Light | < 0.05% at 600 nm |
| Fiber Optic Connector | SMA 905 |
| Integration Time | 3 milliseconds to 60 seconds |
Table 2: Key Specifications for a Ruggedized Ship Emissions Probe
| Parameter | Specification / Requirement |
|---|---|
| Operating Temperature | Up to 500°C (or higher with purge/cooling) |
| Material | 316 Stainless Steel or Nickel Alloys |
| Environmental Sealing | IP67 or higher |
| Vibration Resistance | > 5 g RMS (as per marine engine standards) |
| Optical Path Length | Customizable (e.g., 0.5 m to 2 m) |
The logical flow of the system, from light generation to data output, is visualized below.
Experimental Protocols for Ship Emission Monitoring
Protocol 1: Direct Exhaust Gas Measurement
Objective: To directly measure the concentration of CO₂, CO, and NOx in the exhaust gas of a ship's main propulsion engine in real-time.
Materials:
- Modular fiber optic spectrometer (e.g., configured with a 600 lines/mm grating for a balanced range and resolution) [11].
- Ruggedized, heated sample probe with a known optical path length.
- High-temperature fiber optic patch cables.
- Calibration gas cylinders (N₂ for zero, and known concentrations of CO₂, CO, NOx).
- PEMS (Portable Emission Measurement System) for validation, using NDIR for CO₂/CO and CLD for NOx [13].
Methodology:
- System Integration: Install the ruggedized probe into a dedicated port on the ship's exhaust stack, ensuring a gas-tight seal. Connect it to the spectrometer located in a controlled environment via fiber optic cables.
- Wavelength Calibration: Use a light source with known emission lines (e.g., Hg-Ar lamp) to calibrate the wavelength axis of the spectrometer.
- Concentration Calibration:
- Flow zero gas (N₂) through the probe and record the reference spectrum.
- Flow each calibration gas and record the corresponding absorption spectrum.
- Apply the Beer-Lambert Law to establish a calibration curve for each pollutant, correlating absorption depth at specific wavelengths (e.g., 4.26 µm for CO₂, 4.67 µm for CO, and 5.3 µm for NOx) with concentration.
- Real-Time Measurement: During vessel operation, continuously acquire absorption spectra from the exhaust stream. The integration time of the spectrometer should be set to capture transient engine behaviors (e.g., 1-10 Hz) [11].
- Data Processing: In real-time, process the acquired spectra using the pre-computed calibration curves to report mass concentrations of each pollutant.
The workflow for this direct measurement and subsequent data modeling is outlined below.
Protocol 2: Hybrid AI Model for Emission Prediction
Objective: To develop a high-accuracy prediction model for emissions by fusing spectroscopic data with real-time engine operational parameters, overcoming the limitations of simple fuel-based calculations [14].
Materials:
- Spectral concentration data from Protocol 1.
- Engine operational data from the ship's Alarm Monitoring System (AMS), including RPM, torque, power, and exhaust gas temperatures [13].
- Computing hardware (e.g., Intel i9 CPU, 32 GB RAM) and software (Python 3.9+) [13].
Methodology:
- Data Synchronization: Precisely time-sync the spectrometer data stream with the AMS data stream. The data should be sampled at a high frequency (e.g., 0.1 Hz) to capture dynamic operations [13].
- Feature Selection: Employ a feature selection algorithm like LASSO (Least Absolute Shrinkage and Selection Operator) regression on the initial dataset to identify the most influential engine parameters affecting emissions (e.g., RPM and exhaust gas temperature are key for NOx) [13].
- Model Training: Implement a stacking ensemble model.
- Level 1 (Base Models): Train a Time-Series Forecasting Transformer (TSF-Transformer) to capture long-term temporal dependencies in the data, and an XGBoost model to capture nonlinear feature interactions.
- Level 2 (Meta-Model): Use the predictions from the base models as inputs to a final linear regression model that produces the ultimate emission prediction.
- Validation: Validate the model's performance against a withheld test dataset or PEMS measurements using metrics like Root Mean Square Error (RMSE) and Mean Absolute Error (MAE). A recent study showed this hybrid approach can reduce RMSE for NOx by up to 40% compared to conventional methods [13].
The Scientist's Toolkit
Table 3: Essential Research Reagent Solutions for Ship Emission Monitoring
| Item | Function / Explanation |
|---|---|
| Modular Spectrometer | The core analytical instrument; its modularity allows selection of gratings and detectors to target specific pollutants like CO₂ and NOx across UV-VIS-NIR [15] [11]. |
| Ruggedized Fiber Probe | Samples light from the harsh exhaust environment; its durability is characterized by resistance to shock, vibration, temperature, and corrosion, ensuring data integrity [12]. |
| Calibration Gas Standards | Certified mixtures of CO₂, CO, and NOx in N₂. Essential for establishing the quantitative relationship between spectral absorption and gas concentration (Beer-Lambert Law). |
| PEMS (Portable Emission Measurement System) | A gold-standard reference using NDIR (for CO₂/CO) and CLD (for NOx) to validate the measurements from the fiber optic system [13]. |
| Hybrid AI Model (Transformer-XGBoost) | A machine learning framework that integrates real-time spectral and engine data to provide highly accurate and robust emission predictions under variable operating conditions [13]. |
The enforcement of stringent global regulations on ship emissions, such as the International Maritime Organization's (IMO) 2020 global sulfur cap, has created a critical need for robust, real-time monitoring technologies [16] [2]. Spectral techniques, including Differential Optical Absorption Spectroscopy (DOAS) and Fourier-Transform Infrared (FTIR) spectroscopy, have emerged as powerful tools for quantifying atmospheric pollutants from maritime activities [16] [17] [18]. When integrated with fiber optics, these methods enable remote, sensitive, and continuous monitoring of ship emissions, providing valuable data for regulatory compliance and environmental research [19] [2]. These application notes detail the protocols for deploying DOAS and FTIR systems within the context of real-time ship emissions monitoring.
DOAS and FTIR are both absorption spectroscopy techniques but operate in different spectral regions and employ distinct optical principles. DOAS primarily utilizes the ultraviolet (UV) and visible spectral regions to measure trace gases with structured absorption bands in these ranges, such as SO₂, NO₂, and HCHO [18] [20]. The core of the DOAS method is the separation of broad and narrow band spectral structures to isolate the narrow absorption features of trace gases [20]. FTIR spectroscopy, on the other hand, operates in the infrared (IR) region and is ideal for molecules that exhibit fundamental vibrational-rotational absorption bands, including CO₂, CH₄, and N₂O [17] [2]. Its operation relies on an interferometer to create an interference pattern, which is then converted into a spectrum via a Fourier transform [17].
Table 1: Comparative Analysis of DOAS and FTIR Spectroscopic Techniques
| Feature | DOAS (UV/Visible) | FTIR (Infrared) |
|---|---|---|
| Typical Measured Gases | SO₂, NO₂, HCHO [18] | CO₂, CH₄, N₂O [2] |
| Core Optical Principle | Spectrometer with grating [20] | Interferometer with moving mirrors [17] |
| Key Data Processing Step | Separation of narrow-band absorption features [20] | Fourier Transform of interferogram [17] |
| Typical Configuration for Ship Monitoring | MAX-DOAS (Multi-Axis DOAS) [18] | In-situ extractive system with flow cell [2] |
| Primary Advantage for Ship Emissions | Long-path, remote sensing of smokestack plumes [16] | Multi-component gas analysis and high specificity [2] |
Application in Ship Emissions Monitoring
Quantitative Findings from Field Studies
Long-term observational studies have demonstrated the effectiveness of these spectroscopic techniques in evaluating regulatory policies. For instance, a six-year DOAS study at a Shanghai port quantified that ship activities increased ambient SO₂ concentrations in the channel by 0.48 ± 0.25 ppbv, which constituted 43.24% of the urban background levels [16]. The same study revealed that while SO₂ levels declined during the policy adjustment phase (2018-2020), a post-2020 rebound occurred, driven by increased ship traffic despite continued low-sulfur fuel policies [16]. MAX-DOAS instruments have also proven effective in measuring emission ratios; observations in the North Sea detected elevated SO₂/NO₂ ratios in ship plumes, which can be used to verify compliance with fuel sulfur content regulations [18].
Experimental Protocols
Protocol A: Long-Path DOAS for Area Monitoring of SO₂ and NO₂
This protocol is designed for monitoring trace gas concentrations over a shipping channel or port area.
- Objective: To quantify the path-averaged concentration of SO₂ and NO₂ in a shipping channel and attribute enhancements to ship emissions.
- Materials:
- Active DOAS system with a UV light source (e.g., 150 W xenon lamp) [16].
- Spectrometer optimized for the 299–308 nm (for SO₂) and 425–450 nm (for NO₂) spectral ranges [16] [20].
- Array of retroreflectors to return the light signal.
- Fiber optic cables for light signal transmission [19].
- Computer with DOAS analysis software (e.g., DOASIS, QDOAS) [16] [20].
- Methodology:
- Site Selection: Establish the DOAS transmitter and receiver on opposite sides of the shipping channel. The light path should be 12-15 m above the water surface to intersect with ship exhaust plumes [16].
- System Setup: Align the light source with the retroreflector array across the defined path (e.g., 1540 m) [16]. Connect the receiving telescope to the spectrometer via a fiber optic cable.
- Data Collection: Continuously measure the attenuated light spectrum (I). Regularly record a reference spectrum (I₀) using a clean background sector or during periods of minimal ship traffic [20].
- Spectral Retrieval: In the analysis software, fit the known absorption cross-sections of SO₂ and NO₂ to the differential optical density of the measured spectrum. The fit yields the Slant Column Density (SCD), which is the integrated number of molecules along the light path [20].
- Data Processing: Apply machine learning models (e.g., Extreme Gradient Boosting) for gap-filling and meteorological normalization of the SCD time series to derive the ship-related concentration component [16].
Protocol B: FTIR for Direct Stack Emission Monitoring
This protocol is for in-situ, extractive measurement of multiple gases from a ship's exhaust stack.
- Objective: To directly measure the concentrations of CO₂, CH₄, and other gases in a ship's exhaust for emission factor calculation and regulatory reporting.
- Materials:
- FTIR spectrometer (e.g., MATRIX-F II) with a robust, low-maintenance design [21].
- Heated sampling probe and sample line to prevent condensation.
- Multipass gas cell with a long path length for enhanced sensitivity.
- Flow meter to measure sample gas flow rate [2].
- Calibration gas mixtures for target analytes.
- Methodology:
- System Integration: Install the sampling probe directly on the ship's exhaust stack. Connect the probe to the FTIR analyzer via the heated sample line. Ensure the flow meter is installed to log the exhaust gas flow rate [2].
- Calibration: Regularly validate the instrument performance using the internal automated validation program (e.g., OPUS Validation Program) and calibrate with certified gas mixtures [21].
- Measurement: The sample gas is continuously drawn through the multipass cell in the FTIR spectrometer. The interferometer in the FTIR collects an interferogram, which is converted via Fourier Transform into an infrared absorption spectrum [17].
- Quantification: Use the analyzer's software to perform a multivariate fit of the measured spectrum against reference spectra of the target gases. The output is the concentration of each gas in the sample stream.
- Emission Calculation: Combine the measured CO₂ concentration with the exhaust gas flow rate to calculate the total mass of CO₂ emissions over a specific period, as per EU MRV and IMO DCS requirements for direct monitoring [2].
Workflow Visualization
The following diagram illustrates the logical workflow for a ship emissions monitoring campaign using a combination of open-path and in-situ spectroscopic techniques.
Diagram: Ship Emissions Monitoring Workflow. SCD: Slant Column Density.
The Scientist's Toolkit: Essential Research Reagents and Materials
For researchers developing and deploying fiber-optic spectrometer systems for ship emission monitoring, a set of essential components and software tools is required.
Table 2: Key Research Reagent Solutions and Materials
| Item Name | Function/Brief Explanation |
|---|---|
| DOASIS / QDOAS Software | Specialized software for spectral retrieval and analysis in DOAS applications; used to fit reference absorption cross-sections to measured spectra and calculate Slant Column Densities (SCDs) [16] [20]. |
| Reference Absorption Cross-Section Libraries | High-resolution, laboratory-measured spectra of target gases (e.g., SO₂, NO₂) at specific temperatures; serve as the fundamental calibration data for quantitative spectral analysis [20]. |
| FTIR Validation Program (e.g., OVP) | Software that executes a series of performance tests (e.g., wavelength accuracy, signal-to-noise) to ensure the FTIR spectrometer is operating within specifications, which is critical for applications in regulated industries [21]. |
| Fiber Optic Multiplexer | A device that allows a single spectrometer to sequentially monitor multiple remote sampling points (e.g., different stacks or light paths), significantly enhancing the monitoring capacity and cost-effectiveness [21]. |
| Certified Calibration Gas Mixtures | Gases with precisely known concentrations of CO₂, SO₂, etc., used for periodic calibration and validation of in-situ FTIR systems to ensure long-term measurement accuracy [2]. |
| Industry-Standard Communication Interface (e.g., OPC, Modbus) | Enables the integration of spectrometer data into broader process control environments and data acquisition systems, facilitating real-time data streaming and centralized monitoring [21]. |
In-Situ Deployment on Vessels and in Ports
The maritime industry faces increasing regulatory and societal pressure to mitigate its environmental impact, with ship emissions being a primary concern. International regulations, such as the Energy Efficiency Existing Ship Index (EEXI) and the Carbon Intensity Indicator (CII), are enforcing stricter limits on emissions of nitrogen oxides (NOx) and sulfur oxides (SOx) [22]. Traditional emissions monitoring methods often lack the real-time, in-situ capabilities necessary for effective compliance and operational optimization. Fiber optic spectrometers represent a technological breakthrough, enabling precise, real-time quantification of gaseous pollutants directly at the source. These instruments leverage the principles of optical absorption spectroscopy, where specific gases like nitrogen dioxide (NO2) and sulfur dioxide (SO2) absorb light at unique characteristic wavelengths. By analyzing transmitted or scattered light, these spectrometers can identify and quantify emission concentrations with high sensitivity. Their modularity, flexibility, and resilience to harsh marine environments make them particularly suited for deployment directly aboard vessels and at strategic locations within port facilities [23] [24]. This document provides detailed application notes and experimental protocols for researchers and engineers deploying fiber optic spectrometers for real-time emission monitoring in maritime settings, contextualized within a broader research thesis on advancing optical sensing for maritime sustainability.
Technical Specifications & Market Context
The global fiber optic spectrometer market, valued at USD 447 million in 2025, is projected to grow steadily, reflecting its expanding application base [24]. A significant portion of this growth is driven by environmental monitoring applications, including the quantification of ship emissions [23]. Key technical parameters for spectrometers deployed in emission monitoring are summarized in Table 1.
Table 1: Key Technical and Market Parameters for Emission Monitoring Spectrometers
| Parameter | Typical Specification / Value | Notes / Relevance to Emission Monitoring |
|---|---|---|
| Global Market Value (2025) | USD 0.447 Billion [24] | Baseline for industry investment. |
| Projected Market Value (2034) | USD 0.628 Billion [24] | Indicates expected market growth. |
| Compound Annual Growth Rate (CAGR) | 4.36% (2025-2034) [24] | -- |
| Dominant Spectral Band (Type) | Ultraviolet (UV) Band (38% share) [24] | Critical for detecting SO₂ and NO₂. |
| Dominant Application Segment | Spectral Measurement (44% share) [24] | Directly aligns with gas concentration analysis. |
| Key Innovation Trend | Miniaturization & Portability (>53% of innovations) [24] | Enables flexible, field-deployable systems for in-situ measurements. |
| Leading Regional Market | North America (41% of global usage) [24] | -- |
The selection of the appropriate spectral band is paramount. The ultraviolet (UV) band is dominant in this application due to the strong absorption cross-sections of SO₂ and NO₂ in the UV range, allowing for high-sensitivity detection [24]. The trend toward miniaturization and portability is a key enabler, facilitating the installation of spectrometer systems on various ship platforms and at multiple points within port infrastructure without requiring significant space or structural modifications [23] [24].
Experimental Protocols for Emission Monitoring
This section outlines detailed methodologies for deploying fiber optic spectrometers in two critical scenarios: remote sensing of vessel plumes and in-situ exhaust gas monitoring.
Protocol A: Remote Plume Imaging & Quantification
This protocol utilizes a fast-hyperspectral imaging remote sensing technique to quantify emissions from a distance, typically deployed from shore, a patrol boat, or another vessel [1].
1. Principle: The method measures the differential slant column densities (DSCDs) of NO₂ and SO₂ by analyzing the absorption of solar scattered light as it passes through a ship's emission plume. A hyperspectral camera captures the unique absorption spectra of the target gases across multiple pixels, creating a concentration map of the plume [1].
2. Equipment:
- Fast-hyperspectral imaging remote sensing instrument, comprising [1]:
- Hyperspectral camera system (spectrometer with a temperature-stabilized coaxial telescope).
- Multi-channel UV camera system with a filter wheel (e.g., filters at 310/330 nm for SO₂ and 405/470 nm for NO₂).
- Visible camera for live imaging and plume identification.
- 2D scanning system for elevation and azimuth control.
- Industrial control machine (IPC) for data acquisition and instrument control.
- High-precision temperature control system (maintaining 20°C ± 0.5°C) to stabilize the spectrometer and reduce noise [1].
3. Procedure: 1. System Setup and Calibration: Position the instrument with a clear line-of-sight to the anticipated shipping lane or port area. Conduct zenith measurements to obtain reference spectra free from plume contamination. Calibrate the 2D scanning system and verify the focus and FOV of all cameras [1]. 2. Plume Detection and Scanning: Upon visual or spectral identification of a vessel plume, initiate an automated "S"-shaped scanning pattern across the plume using the 2D scanning system. The integration time for a single spectrum is typically 3 seconds [1]. 3. Data Acquisition: Simultaneously collect data from all three camera systems (hyperspectral, UV, visible) during the scan. The hyperspectral system captures DSCDs, while the multi-wavelength UV images help precisely identify the plume's contour and internal structure [1]. 4. Aerosol Correction: Analyze the variation of O₄ DSCDs along a fixed elevation angle through the plume. If the standard deviation is <20%, classify the plume as "aerosol-absent." For plumes with significant aerosols, more complex radiative transfer modeling (3D-RTM) is required to account for aerosol scattering [1]. 5. Quantification: Convert the measured DSCDs to Vertical Column Densities (VCDs) using Air Mass Factors (AMFs) calculated with a radiative transfer model (e.g., LIDORT), incorporating the aerosol classification from the previous step [1].
The following workflow diagram illustrates the key steps of this protocol:
Protocol B: In-Situ Exhaust Gas Monitoring
This protocol involves the direct installation of a fiber optic spectrometer system to measure emissions directly within a vessel's exhaust stack or at a port-side sampling point.
1. Principle: A fiber optic probe is inserted into the exhaust gas stream, and a light source (e.g., a broadband lamp) on one side transmits light through the gas to a spectrometer on the other side. The spectrometer analyzes the absorption spectrum to determine the concentration of SO₂ and NO₂ based on the Beer-Lambert law [23].
2. Equipment:
- Fiber optic spectrometer (UV-Vis or UV-NIR range).
- Deuterium-tungsten or Xenon arc lamp as a broadband light source.
- High-temperature, corrosion-resistant fiber optic probes with gas-sealed purge windows.
- Sample conditioning system (e.g., heated filter, dryer to remove particulate matter and water vapor without absorbing target gases).
- Data acquisition and control unit.
3. Procedure: 1. System Integration: Install the sampling probe directly into the exhaust stack, ensuring a representative sampling point. Connect the probe to the light source and spectrometer via high-grade UV optical fibers. Integrate the sample conditioning system to protect the optical components. 2. Background Measurement: Record a background reference spectrum (I₀) with the light source on but with clean air (or nitrogen) flowing through the sampling line. 3. Sample Measurement: Continuously acquire sample spectra (I) from the exhaust gas stream. The integration time of the spectrometer should be optimized for the expected concentration range and flow conditions. 4. Data Processing: Calculate the absorbance spectrum A(λ) = -log₁₀(I / I₀). Fit the measured absorbance using known reference spectra of SO₂ and NO₂ (and other interfering gases if necessary) to retrieve their concentrations. Apply temperature and pressure corrections based on onboard sensor data. 5. Data Logging and Reporting: Stream the concentration data to the vessel's data acquisition system for real-time reporting, compliance logging, and integration with voyage optimization systems.
The logical workflow for this in-situ monitoring is outlined below:
The Scientist's Toolkit: Research Reagent Solutions
For researchers developing and calibrating these monitoring systems, a suite of essential materials and "reagent solutions" is required. These are not chemical reagents in the traditional sense but are critical components for constructing a reliable sensing system.
Table 2: Essential Research Reagents & Materials for Emission Monitoring Systems
| Item / Solution | Function & Explanation |
|---|---|
| Calibration Gas Cylinders | Certified reference materials containing known concentrations of SO₂, NO₂, and other gases in a balanced air or nitrogen matrix. Used for periodic calibration and validation of the spectrometer's quantitative accuracy. |
| Hyperspectral Imaging Software | Custom or commercial software (e.g., ENVI, SpecAir) for processing raw spectral data cubes, performing spectral unmixing, and generating georeferenced emission maps from remote sensing data [1]. |
| Radiative Transfer Models (RTM) | Software such as LIDORT or SCIATRAN. Critical for Protocol A to calculate Air Mass Factors (AMFs), which convert measured slant column densities into vertical column densities by simulating light propagation through the atmosphere [1]. |
| High-Temperature Optical Probes | Specialized probes designed for direct insertion into hot, corrosive exhaust streams. They feature purge gas interfaces and durable sapphire windows to maintain optical clarity and prevent fouling in Protocol B. |
| Spectral Reference Libraries | Digital databases (e.g., HITRAN, MPI-Mainz) containing high-resolution absorption cross-section spectra of SO₂, NO₂, and other relevant gases at various temperatures and pressures. Essential for fitting measured absorbance spectra in both protocols [1]. |
The in-situ deployment of fiber optic spectrometers on vessels and in ports represents a powerful approach for achieving precise, real-time monitoring of ship emissions. The protocols outlined here—ranging from advanced remote hyperspectral imaging to direct stack monitoring—provide a framework for researchers and maritime stakeholders to validate and implement this technology. As the market for these systems grows and technologies like miniaturization and AI-enhanced data analysis mature, fiber optic spectrometers are poised to become an indispensable tool for ensuring regulatory compliance, enabling operational efficiencies, and fostering a more sustainable maritime industry.
Application Note: Real-Time Monitoring of Ship Emissions
Marine vessel emissions negatively impact atmospheric quality, particularly in coastal regions and busy shipping lanes, making accurate emission monitoring an essential prerequisite for environmental control [1]. International Maritime Organization (IMO) regulations have established strict limits on sulfur content in fuel and nitrogen oxide (NOx) emissions, requiring ship operators to document regulatory compliance [25]. This application note examines the Danfoss IXA MES 1001 marine emission sensor within a research framework exploring fiber optic spectrometer applications for real-time ship emissions monitoring.
The Danfoss IXA MES 1001 is an intelligent sensor technology enabling precise and continuous measurement of environmentally harmful gases NOx, SO2, and NH3 directly in the exhaust pipe [26]. Engineered for harsh maritime environments, the sensor provides several critical functions for emission control and process optimization [27]:
- Continuous Emission Monitoring (CEM): Enables shipowners to document regulatory compliance at all times, creating greater transparency in the maritime industry [25].
- SCR System Optimization: Particularly relevant in Selective Catalytic Reduction (SCR) applications, where it monitors and controls the SCR process [26].
- Tamper-Proof Measurement: Provides reliable, type-approved data for enforcement of global regulations [28].
Key technical specifications include operation at exhaust pipe temperatures up to 500°C, data updates every second, self-calibration capabilities, and minimal maintenance requirements [28]. Installation requires only pressurized air, a data cable, and power, significantly reducing implementation complexity [28].
Research Context: Advanced Spectroscopic Monitoring Techniques
While point sensors like the MES 1001 provide direct exhaust measurements, complementary spectroscopic imaging techniques offer remote quantification capabilities. Recent research demonstrates fast-hyperspectral imaging remote sensing can achieve precise imaging of NO2 and SO2 from marine vessels [1]. This technique overcomes limitations of previous imaging methods that suffered from insufficient detection accuracy and inadequate spatiotemporal resolution [1].
The integration of point sensor data with emerging spectroscopic methods opens new possibilities for comprehensive emission monitoring systems that combine direct measurement with plume diffusion evaluation [1].
Table 1: Quantitative Performance Data for Emission Monitoring Technologies
| Technology | Target Analytes | Measurement Approach | Key Performance Characteristics |
|---|---|---|---|
| Danfoss IXA MES 1001 [26] [25] | NOx, SO2, NH3 | Direct in-stack measurement | Continuous measurement; withstands 500°C; 1-second data updates |
| Fast-Hyperspectral Imaging [1] | NO2, SO2 | Remote imaging | <0.5m spatial resolution; <4min scan time; high precision imaging |
| Single-Particle Mass Spectrometry (SPMS) [29] | Particle-bound PAHs, Metals | Remote particle analysis | Qualitative chemical signatures; 0.2-2.5μm particle size range |
Experimental Protocols
Protocol 1: Sensor-Based Emission Monitoring and SCR Optimization
This protocol details the methodology for deploying the MES 1001 sensor for direct emission monitoring and SCR process control.
Materials and Equipment
- Danfoss IXA MES 1001 marine emission sensor [26]
- Sensor installation kit (power cables, data interface)
- Pressurized air supply system [28]
- Data acquisition platform (EmViz software recommended) [27]
- Reference gas calibration standards
Procedure
- Sensor Installation: Mount the MES 1001 sensor directly in the exhaust pipe, ensuring secure placement capable of withstanding temperatures to 500°C [28].
- System Connection: Connect pressurized air supply, power source (24V DC), and data communication cables per manufacturer specifications [28].
- Commissioning: Power on the sensor and verify system initialization. The self-calibrating feature requires minimal manual intervention [28].
- Data Integration: Configure EmViz software platform to collect and store all relevant emission data. Establish data transmission to central server for fleet-wide analysis [27].
- SCR Optimization: For vessels equipped with SCR systems:
- Data Validation: Perform regular verification against reference methods to ensure ongoing measurement accuracy.
Data Analysis
- Calculate NOx and SO2 emission factors relative to fuel consumption and engine power
- Document compliance with IMO MARPOL regulations [28]
- Analyze NH3 slip in SCR systems to optimize reagent usage
- Correlate emission data with engine parameters and fuel quality
Diagram 1: MES 1001 Deployment Workflow
Protocol 2: Hyperspectral Imaging for Plume Analysis
This protocol adapts emerging spectroscopic techniques for remote quantification of ship emissions, compatible with point sensor validation.
Materials and Equipment
- Fast-hyperspectral imaging instrument (coaxial visible camera, UV camera, hyperspectral camera) [1]
- 2D scanning system with elevation and azimuth motors [1]
- Temperature-stabilized spectrometer (20°C ± 0.5°C) [1]
- Industrial control machine with spectral analysis software [1]
- Calibration light source and reference standards
Procedure
- Instrument Configuration: Set up the hyperspectral imaging system at a strategic location with clear view of vessel exhaust plumes (up to 2km distance) [29].
- Temperature Stabilization: Activate the temperature control system to maintain spectrometer at 20°C ± 0.5°C to reduce spectral noise [1].
- Scanning Sequence: Program the 2D scanning system for continuous "S"-shaped trajectory scanning across the preset imaging area [1].
- Reference Measurements: Conduct two zenith measurements before serpentine scanning as reference spectra for entire observation period [1].
- Plume Imaging: Acquire spectral data with integration time of 3 seconds per measurement, completing full plume scanning within 4 minutes [1].
- Aerosol Characterization: Determine presence of aerosols within plume by analyzing variation of O4 differential slant column densities (DSCDs) [1].
Data Processing
- Calculate differential slant column densities (DSCDs) of NO2 and SO2 [1]
- Classify plumes as aerosol-present or aerosol-absent based on O4 variation [1]
- Apply appropriate air mass factor (AMF) calculation schemes based on aerosol classification [1]
- Reconstruct plume distribution and quantify emission rates
Diagram 2: Hyperspectral Imaging Workflow
The Scientist's Toolkit: Research Reagents & Materials
Table 2: Essential Materials for Marine Emission Monitoring Research
| Item | Function/Application | Technical Specifications |
|---|---|---|
| MES 1001 Marine Emission Sensor [26] [25] | Continuous in-stack measurement of NOx, SO2, NH3 | Withstands 500°C; 1-second data updates; self-calibrating |
| Hyperspectral Imaging System [1] | Remote quantification of NO2 and SO2 plumes | <0.5m spatial resolution; 3s integration time; temperature stabilization ±0.5°C |
| Silica Optical Fibers [30] | UV-Vis spectral transmission for process spectrometers | High-OH for 180-1200nm; Low-OH for 400-2400nm; polyimide coating to 300°C |
| Single-Particle Mass Spectrometer (SPMS) [29] | Qualitative characterization of particle chemical signatures | 0.2-2.5μm particle size; detects transition metals and PAHs |
| Optical Particle Sizer (OPS) [29] | Monitoring particle number and size distribution | Identifies potential ship exhaust plumes through rapid changes |
| SCR System Test Bench | Validation of sensor performance in SCR control applications | Simulates engine exhaust conditions for closed-loop testing |
The Danfoss IXA MES 1001 marine emission sensor represents a robust solution for continuous in-stack monitoring of ship emissions, providing critical data for regulatory compliance and process optimization. When integrated with emerging spectroscopic techniques like fast-hyperspectral imaging, researchers can develop comprehensive monitoring approaches that combine the accuracy of point measurements with the contextual understanding of plume dispersion analysis. This multi-modal approach addresses the growing demand for transparent, verifiable emission data in the maritime industry while providing valuable insights for environmental impact assessment.
Data Integration with Fleet Management and Compliance Platforms
The integration of fiber optic spectrometer systems with fleet management and compliance platforms creates a robust architecture for real-time ship emissions monitoring. This integration addresses the critical need for accurate environmental compliance data within maritime operational frameworks, enabling simultaneous optimization of fleet performance and regulatory reporting [4].
Table 1: Core Functional Components of the Integrated System
| Component | Function in Emissions Monitoring | Integration Method with Fleet Data |
|---|---|---|
| Fiber Optic Spectrometer | Real-time detection and quantification of specific gas compounds (e.g., CO₂, SOₓ, NOₓ) in exhaust streams [4] [31]. | Data streamed via IoT protocols to a central fleet management data lake [32]. |
| Continuous Emission Monitoring System (CEMS) | Provides continuous, real-time data on gas emission concentrations for compliance assurance [4] [31]. | Fully integrated with telematics data for correlated analysis of emissions and vehicle performance [33]. |
| Onboard Telematics Unit | Collects vehicle data (location, speed, fuel consumption, engine diagnostics) [32] [33]. | Serves as the data hub, merging emission readings with operational parameters. |
| AI-Powered Analytics Platform | Uses predictive models to forecast emission levels, optimize routes for fuel efficiency, and flag potential non-compliance [32]. | Processes the combined dataset to generate actionable insights for fleet managers. |
| Compliance Reporting Module | Automatically generates reports for regulatory bodies using fused emissions and operational data. | Pulls verified data from the integrated platform to ensure accuracy and auditability. |
The synergy between these components allows for a closed-loop system where real-time emission data directly influences operational decisions. For instance, the system can trigger automatic alerts for corrective action—such as adjusting vessel speed or course—if emission levels approach regulatory thresholds [32] [4].
Experimental Protocols
Protocol: System Integration and Data Workflow Validation
Objective: To establish and validate the end-to-end data workflow from the fiber optic spectrometer through the fleet management platform to the final compliance report.
Materials:
- Fiber Optic Spectrometer System (calibrated for CO₂, NOₓ, SOₓ)
- Vessel with integrated telematics system (e.g., Geotab [33])
- Cloud-based data aggregation platform (e.g., Lytx Vision Platform [33])
- Data processing unit with API connectivity
Methodology:
- Hardware Installation and Calibration:
- Install the fiber optic spectrometer probe in the ship's exhaust stack, ensuring an unobstructed optical path.
- Calibrate the spectrometer using certified reference gases for target analytes.
- Verify the physical and digital connection between the spectrometer and the vessel's onboard telematics gateway.
Data Stream Configuration:
- Configure the spectrometer to push timestamped emission concentration data (e.g., in ppm or mg/m³) to the telematics unit at a defined frequency (e.g., 1 Hz).
- Configure the telematics unit to package emission data with its standard operational data (GPS coordinates, speed, RPM, fuel rate, engine load) into a unified data packet.
- Establish a secure cellular or satellite link to transmit the unified data packets to the cloud-based fleet management platform.
Data Fusion and Processing:
- Within the cloud platform, implement data validation rules to flag and exclude erroneous readings (e.g., sensor fault, lost signal).
- Fuse the validated emission data with real-time vessel operational data using the common timestamp and vessel ID.
- Use AI-driven algorithms to analyze the fused dataset. Key analyses include:
- Correlation of emission peaks with specific operating conditions (e.g., high engine load, rapid acceleration).
- Calculation of total trip emissions (CO₂, SOₓ, NOₓ) and fuel efficiency [32].
Output and Reporting:
- Visualize real-time and historical emission trends alongside operational data on a configurable dashboard [33].
- Automatically generate compliance reports at the end of each reporting period, formatted to meet regional regulatory standards (e.g., EU MRV, IMO DCS).
Protocol: Validation of Spectrometer Accuracy Against Reference Methods
Objective: To verify the accuracy and precision of the fiber optic spectrometer readings against standard laboratory reference methods under simulated operational conditions.
Materials:
- Fiber Optic Spectrometer System
- Certified gas calibration mixtures
- Laboratory-grade gas analyzer (as a reference)
- Gas mixing and delivery system
- Test engine or exhaust simulation rig
Methodology:
- Set up the test apparatus, connecting the test engine's exhaust to a manifold where both the fiber optic spectrometer probe and the sampling line for the reference gas analyzer are installed.
- Start the engine and stabilize it at a predefined operating condition (e.g., steady-state cruise).
- Simultaneously record concentration measurements for target gases (CO₂, NOₓ) from both the fiber optic spectrometer and the reference analyzer over a period of 30 minutes.
- Repeat step 3 for at least five different engine operating conditions (e.g., idle, low load, high load, acceleration, deceleration) to cover a range of emission concentrations.
- Use statistical analysis (e.g., linear regression, Bland-Altman plots) to compare the dataset from the spectrometer against the reference method. The system is considered validated if the measurements fall within ±5% of the reference values across the tested concentration range.
Mandatory Visualization
Integrated Data Workflow
Compliance Data Verification Logic
The Scientist's Toolkit: Research Reagent Solutions & Essential Materials
Table 2: Key Materials and Reagents for System Deployment and Validation
| Item | Function/Application | Specification Notes |
|---|---|---|
| Certified Calibration Gases | Calibration and periodic validation of the fiber optic spectrometer's accuracy for target analytes (CO₂, NOₓ, SOₓ) [4]. | Must be traceable to national/international standards. Concentrations should span the expected measurement range. |
| Reference Gas Analyzer | Serves as the "gold standard" for the experimental validation of the fiber optic spectrometer's performance in Protocol 2.2. | Should be a laboratory-grade instrument (e.g., NDIR for CO₂, Chemiluminescence for NOₓ). |
| Optical Cleaning Kit | Maintenance of the spectrometer's probe and optical components to ensure signal integrity and measurement accuracy. | Includes solvents and lint-free wipes suitable for the probe's optical material (e.g., quartz, sapphire). |
| Data Logging Simulator | Testing the integration workflow (Protocol 2.1) by generating simulated telematics and emission data streams. | Must be capable of outputting data in the same format as the actual vessel telematics system. |
| API Development Toolkit | Facilitating the custom integration between the emission data stream and the fleet management platform's backend [32] [33]. | Includes tools for testing RESTful/SOAP APIs and handling data authentication protocols. |
Ensuring Reliability at Sea: Overcoming Harsh Environments and Data Challenges
The deployment of fiber optic spectrometers for real-time ship emissions monitoring represents a significant advancement in environmental sensing for the maritime industry [5]. However, the operational efficacy of these sophisticated analytical instruments is contingent upon their ability to withstand the exceptionally harsh marine environment. This document details the specific challenges posed by vibration, temperature fluctuations, and corrosion, and provides structured application notes and experimental protocols to ensure reliable spectrometer performance and data integrity within the context of ship emissions research.
Harsh Marine Condition Analysis
The marine environment presents a unique combination of stressors that can compromise analytical instrumentation. Table 1 summarizes the primary challenges and their potential impacts on fiber optic spectrometer systems.
Table 1: Analysis of Harsh Marine Conditions on Spectrometer Systems
| Environmental Stressor | Specific Challenges | Potential Impact on Spectrometer System |
|---|---|---|
| Vibration & Physical Impact | Engine vibrations, wave impacts, mechanical shock [34]. | Misalignment of optical components (gratings, mirrors), dislodgement of fiber optic connections, signal noise, premature mechanical failure [34]. |
| Temperature Fluctuations | Stark contrasts between sun-exposed and water-adjacent areas; extreme variances [34]. | Wavelength drift in detectors, changes in detector response (sensitivity), deformation of structural components, condensation [5]. |
| Corrosion | Constant exposure to salt-laden sea spray, high salinity, and moisture leading to atmospheric and crevice corrosion [35]. | Degradation of electrical components and enclosures, failure of connectors, impaired thermal management, reduced structural integrity [34]. |
Experimental Protocols for System Validation
Protocol for Vibration and Shock Resistance Testing
Objective: To validate the structural integrity and optical stability of the fiber optic spectrometer under simulated shipboard vibration conditions.
Materials:
- Fiber Optic Spectrometer Unit
- Vibration Test Shaker System
- Optical Light Source (e.g., Deuterium-Tungsten Halogen)
- Data Acquisition System
- Fixturing for mounting spectrometer
Methodology:
- Baseline Measurement: Establish a baseline spectral measurement of the light source with the spectrometer in a static, controlled environment.
- Fixture Mounting: Securely mount the spectrometer to the vibration shaker table using brackets that simulate the intended marine mounting.
- Vibration Profile: Subject the spectrometer to vibration profiles per relevant standards (e.g., MIL-STD-810G, Method 514.7), focusing on low-frequency vibrations typical of ship engines and wave action.
- In-situ Monitoring: Continuously acquire spectral data from the light source throughout the vibration test.
- Post-Test Analysis: Perform a final spectral measurement under static conditions. Compare pre-, during-, and post-test spectra for wavelength shifts and changes in signal intensity.
Data Analysis: Calculate the root-mean-square (RMS) value of the spectral baseline noise before and during vibration. Quantify any permanent wavelength shift (in nm) post-test. A successful test will show no permanent wavelength shift and an acceptable increase in noise during vibration.
Protocol for Thermal Cycling and Performance Validation
Objective: To assess the wavelength stability and detection sensitivity of the spectrometer across the expected operational temperature range.
Materials:
- Fiber Optic Spectrometer Unit
- Thermal Chamber
- Calibrated Light Source with known emission peaks
- Thermocouples
Methodology:
- Instrumentation: Place the spectrometer and calibrated light source inside the thermal chamber. Attach thermocouples to the spectrometer casing and internal optical bench.
- Temperature Cycling: Program the thermal chamber to cycle between the specified low and high temperatures (e.g., -10°C to +55°C), with appropriate dwell times at each extreme to reach thermal equilibrium.
- Spectral Acquisition: At set temperature intervals (e.g., every 5°C), acquire a high-resolution spectrum of the calibrated source.
- Data Recording: Record the precise temperature and the corresponding spectrum for each interval.
Data Analysis: For each acquired spectrum, identify the known emission peaks of the calibrated source. Plot the recorded wavelength of these peaks against the chamber temperature. The coefficient of thermal wavelength drift (nm/°C) can be calculated from this data. System software can use this coefficient for automatic thermal compensation.
Protocol for Corrosion Resistance Assessment
Objective: To evaluate the effectiveness of protective measures against saltwater corrosion.
Materials:
- Spectrometer Enclosure Samples (with and without protective coatings)
- Salt Spray Chamber (ASTM B117)
- Microscope for surface inspection
- Electrical Continuity Tester
Methodology:
- Sample Preparation: Prepare samples of the spectrometer's enclosure material, some with the specified marine-grade coating (e.g., CNT-enhanced epoxy systems [34]) and some uncoated controls.
- Exposure: Place samples in a salt spray chamber set to continuously mist a 5% NaCl solution at 35°C.
- Periodic Inspection: Remove samples at set intervals (e.g., 24, 48, 96, 200 hours). Visually inspect and photograph for signs of rust, pitting, or coating blistering under a microscope.
- Functional Test: For connector ports or functional elements, test electrical continuity and insulation resistance after exposure and a drying period.
Data Analysis: The time to first appearance of corrosion on coated samples versus controls provides a quantitative measure of coating efficacy. This data informs maintenance schedules and material selection.
System Integration and Signaling Workflow
The process of real-time emissions monitoring involves a coordinated sequence from light collection to data reporting. The following diagram illustrates this integrated workflow and the critical control points for managing environmental stressors.
The Researcher's Toolkit: Key Materials and Reagents
Selecting appropriate materials and reagents is fundamental to developing a robust marine monitoring system. Table 2 catalogs essential solutions for this application.
Table 2: Research Reagent Solutions for Marine Emission Monitoring
| Item / Reagent | Function / Rationale | Key Characteristics for Marine Use |
|---|---|---|
| Calibration Gas Mixtures | Provide known concentrations of target analytes (e.g., NOx, SO₂) for periodic calibration of the spectrometer system [5]. | Traceable to international standards; stable under varying temperature conditions. |
| Nanomaterial-based Assays | Used in high-sensitivity fluorescence assays for specific pollutants like mercury in water [5]. | High specificity and sensitivity; stable in aqueous matrices. |
| Marine-Grade Coatings | Protect spectrometer enclosures and external components from corrosion [34]. | High adhesion strength (e.g., >5,500 psi), abrasion resistance, and barrier properties; often epoxy-based with additives like zinc or CNTs [34]. |
| Thermal Conductive Pastes/Greases | Manage heat dissipation from internal components to the enclosure, mitigating temperature-induced drift. | High thermal conductivity, non-corrosive, stable over a wide temperature range. |
| Optical Alignment Epoxy | Secure optical components (lenses, mirrors, gratings) firmly in place to resist misalignment from vibration. | High tensile strength, low shrinkage upon curing, and minimal outgassing. |
Data Presentation and Analysis
Effective data summarization is critical for analysis and reporting. Table 3 provides a template for presenting key performance metrics of the spectrometer system under test conditions, allowing for easy comparison against specifications.
Table 3: Performance Data Summary for Spectrometer Validation
| Validation Parameter | Test Method | Specification Limit | Measured Result | Compliance |
|---|---|---|---|---|
| Wavelength Stability | Thermal Cycling (-10°C to 55°C) | Drift ≤ ±0.1 nm | +0.05 nm | Pass |
| Signal-to-Noise Ratio | At 500 nm, 1s integration | ≥ 500:1 | 650:1 | Pass |
| Vibration Resistance | 5-500 Hz, 1 Octave/min | No mechanical failure | No failure observed | Pass |
| Corrosion Resistance | Salt Spray, 500 hours | No red rust on critical parts | No corrosion | Pass |
| Detection Limit (SO₂) | In exhaust matrix | ≤ 1 ppm | 0.7 ppm | Pass |
Calibration and Maintenance Strategies for Long Voyages
The implementation of fiber optic spectrometers for real-time ship emissions monitoring represents a significant technological advancement in the maritime industry's pursuit of environmental compliance and operational efficiency. These systems, which leverage techniques such as laser absorption spectroscopy and hyperspectral imaging, enable the precise quantification of pollutants including NOx, SO2, and CO2 directly from vessel exhaust streams [5] [1]. The accuracy of these measurements is fundamentally dependent on the stability and precision of the optical components, which are subjected to harsh marine conditions during long voyages, including temperature fluctuations, vibration, humidity, and salt spray. Consequently, a rigorous framework for calibration and maintenance is not merely beneficial but essential for ensuring data integrity across extended operational timelines.
This document establishes detailed application notes and protocols specifically designed for research-grade fiber optic emission monitoring systems aboard vessels. The procedures outlined herein are critical for supporting the broader thesis that real-time optical spectroscopy can serve as a reliable and compliant method for emissions tracking under the International Maritime Organization (IMO) Data Collection System (DCS) and EU Monitoring, Reporting, and Verification (MRV) regulations [2]. By providing standardized methodologies for calibration and predictive maintenance, this work aims to equip researchers and maritime engineers with the tools necessary to maintain instrument validity and generate high-quality, defensible emissions data throughout long-distance voyages.
Calibration Principles and Methodologies
Core Calibration Concepts
Calibration of fiber optic spectrometers involves a series of procedures to characterize and correct for the system's Optical Transform Function (OTF), which encompasses the combined wavelength-dependent response of the light source, optical fibers, and detector [36]. The primary relationship describing a raw measured signal is: [ S{measured} = L(B + T{illumination} \times T{collection} \times S{tissue}) ] where ( L ) is the illumination source spectrum, ( B ) is the background signal, ( T{illumination} ) and ( T{collection} ) are the throughput responses of the illumination and collection channels, and ( S{tissue} ) is the intrinsic sample response [36]. For emission monitoring, ( S{tissue} ) is replaced by the gas absorption signature. The goal of calibration is to isolate this intrinsic signal by accurately accounting for all other instrumental variables.
Calibration Techniques and Comparison
A multi-step calibration protocol is required to address different aspects of system performance. The key techniques, their applications, and limitations are summarized in the table below.
Table 1: Summary of Key Calibration Techniques for Fiber Optic Spectrometers
| Calibration Technique | Primary Function | Standard/Procedure | Critical Parameters | Limitations & Voyage Considerations |
|---|---|---|---|---|
| Background Measurement | Quantifies system's inherent electronic noise & stray light [36]. | Acquire spectrum with light source off or with probe in a light-absorbing black cone fixture [36]. | Signal-to-Noise Ratio (SNR), Dark Current | Requires a dedicated, perfectly absorbing fixture. Must be performed frequently to account for detector drift. |
| Wavelength Calibration | Establishes accurate correlation between pixel index and wavelength [36]. | Use emission lines from a calibration lamp (e.g., Hg/Ar). Fit known peak wavelengths to pixel positions. | Peak Center Precision, Linear Dispersion | Assumes lamp spectrum is stable. Lamp aging or damage can introduce errors. |
| Intensity/Radiance Calibration | Normalizes for spectral shape of light source & system throughput [36]. | Measure a certified diffuse reflectance standard (e.g., Spectralon). | Reflectance Factor, Spectralon Bi-directional Reflectance Distribution Function (BRDF) | Standard surface must remain uncontaminated; cleaning protocols are critical in marine environments. |
| Strain Coefficient Calibration | Critical for fiber Bragg grating (FBG) sensors used in structural monitoring [37]. | Apply known displacement using a tensile load test and measure Brillouin Frequency Shift (BFS). | Strain Coefficient (Cε), Brillouin Frequency Shift (BFS) | Conventional methods underestimate coefficient due to slippage; improved methods use laser displacement sensors [37]. |
Maintenance Strategies for Long-Duration Voyages
Predictive Maintenance Framework
For maritime emission monitoring systems, a Predictive Maintenance (PdM) strategy is highly recommended over traditional reactive or scheduled preventive approaches. PdM leverages data-driven models to forecast potential equipment failures, thereby optimizing maintenance schedules, reducing downtime, and extending machinery lifespan [38]. Studies indicate that PdM can minimize maintenance operational expenses by up to 45% compared to conventional strategies [38]. This is achieved by analyzing operational data from onboard sensors to identify patterns indicative of impending degradation.
The implementation of PdM aligns with the Shipping 4.0 paradigm, which integrates vessels into a cyber-enabled ecosystem comprising the ship itself and a Shore-based Control Center (SCC) [38]. Within this framework, Machine Learning (ML) and Deep Learning (DL) models can be deployed to process vast amounts of sensor data in real-time, enabling proactive maintenance interventions. To address challenges of data privacy and intermittent satellite connectivity, decentralized learning paradigms such as Federated Learning (FL) can be employed. FL allows models to be trained locally on vessel data, with only model parameter updates being transmitted to the SCC, thus ensuring data security and efficient bandwidth use [38].
System-Specific Maintenance Protocols
Table 2: Predictive Maintenance Checklist for Key Spectrometer Subsystems
| Subsystem | Potential Failure Modes | Monitoring Parameters | Predictive Maintenance Action |
|---|---|---|---|
| Light Source | Intensity decay, spectral shift. | Output power stability, spectral centroid. | Log power output over time; model degradation for replacement before failure. |
| Optical Fibers & Probes | Bending loss, connector contamination, core damage. | Signal throughput, back-scattered light. | Monitor relative signal level from a reference path; schedule cleaning or inspection upon trend change. |
| Spectrometer Detector | CCD/InGaAs array degradation, dark current increase. | Signal-to-Noise Ratio (SNR), dark current level. | Regular dark and reference measurements; flag system for service if SNR drops below threshold. |
| Sampling Interface | Probe window fouling, cell clogging with soot/particulates. | Pressure drop across sample cell, signal attenuation. | Correlate pressure drop with signal level; trigger alert for automated purge or manual cleaning. |
| Thermal Management | Failure of Peltier cooler/heater, leading to spectral drift. | Spectrometer core temperature, heat sink temperature. | Implement a high-precision temperature control system (e.g., 20°C ± 0.5°C) and monitor power consumption of thermal unit [1]. |
Detailed Experimental Protocols
Protocol for Automated In-Situ Calibration
This protocol utilizes an automated calibration tool to ensure standardization and repeatability, minimizing human error [36].
- Objective: To perform a complete calibration of a fiber-optic spectrometer-based emissions monitoring system without operator intervention, ensuring consistency over long voyages.
- Materials: Automated calibration tool with motorized stage, background fixture (black absorbing material), white reflectance standard (Spectralon), wavelength calibration lamp, and scattering phantom [36].
- Procedure:
- System Initialization: The fiber-optic probe is inserted into the calibration tool's fixture. The tool's software initiates the calibration sequence.
- Background Acquisition: The motorized stage positions the black cone background fixture under the probe. A measurement is taken with the light source on, and a second "bias" measurement is taken with an in-line shutter closed to capture dark noise [36].
- Wavelength Calibration: The stage moves the wavelength calibration lamp into position. The spectrum of the lamp is acquired, and known peak positions (e.g., from a Hg/Ar lamp) are automatically identified and fitted to establish the pixel-to-wavelength mapping.
- Intensity Response Calibration: The stage moves the white reflectance standard into the probe's field of view. A measurement is acquired to normalize the system's spectral response.
- System Performance Verification: The stage presents one or two scattering phantoms with known optical properties. A measurement is acquired and compared to the expected values to verify the entire calibration procedure was successful [36].
- Frequency: Before and after a long voyage, and at minimum once per week during continuous operation. More frequent verification using the scattering phantom is recommended.
Protocol for Direct CO2 Emission Quantification
This protocol details the use of a calibrated spectrometer for measuring CO2 emissions from a ship's stack, a methodology recognized under the EU MRV regulation [2].
- Objective: To directly measure and calculate the mass of CO2 emitted from a ship's exhaust in real-time.
- Materials: Calibrated fiber-optic spectrometer (e.g., Ocean Optics Flame series), sampling probe installed on the chimney, heated sample line, gas cell, flow meter, data acquisition system [5] [2].
- Procedure:
- Gas Sampling: A representative sample of the exhaust gas is continuously extracted from the stack via a sampling probe and transported through a heat-traced line to prevent condensation [2].
- Spectral Measurement: The gas is passed through a measurement cell. The spectrometer, configured for a specific absorption technique (e.g., NDIR, TDLAS), acquires the transmission spectrum of the gas [2] [4].
- Concentration Calculation: The concentration of CO2 (( C{CO2} )) in the exhaust is determined by applying the Beer-Lambert law, using the pre-calibrated absorption cross-sections for CO2 at the measured wavelength(s).
- Mass Flow Calculation: The total mass emission (( M{CO2} )) is calculated using the formula: [ M{CO2} = C{CO2} \times Q{exhaust} \times t ] where ( Q{exhaust} ) is the volumetric flow rate of the exhaust gas measured by the flow meter, and ( t ) is the time [2].
- Data Recording: The system continuously records ( C{CO2} ), ( Q{exhaust} ), and calculated ( M_{CO2} ), tagged with GPS position and timestamp for regulatory reporting.
The Scientist's Toolkit: Essential Research Reagents & Materials
Table 3: Key Research Reagent Solutions and Materials for Emission Monitoring
| Item Name | Function / Application | Technical Specifications / Notes |
|---|---|---|
| Certified Gas Mixtures | Calibration and validation of gas concentration measurements. | NIST-traceable mixtures of CO2, SO2, NOx in N2 at known concentrations (e.g., 100 ppm, 500 ppm). |
| Spectralon White Standard | Intensity/radiance calibration for reflectance probes. | Diffuse reflectance standard (>99% reflectance in UV-Vis-NIR); requires careful handling to prevent contamination. |
| Wavelength Calibration Lamp | Establishing accurate pixel-to-wavelength correlation. | Pen-ray style lamp containing Hg, Ar, or Ne, providing narrow, known emission lines. |
| Optical Scattering Phantoms | System performance verification and monitoring. | Solid or liquid phantoms with stable and known reduced scattering (μs') and absorption (μa) coefficients. |
| Black Calibration Fixture | Background and dark noise measurement. | Cone geometry made with high-absorption material (e.g., Acktar Spectral Black Foil, absorbs >99.99% light) [36]. |
Workflow and System Architecture Diagrams
Diagram Title: Automated Calibration and Monitoring Workflow
Diagram Title: Federated Learning for Predictive Maintenance
Managing and Processing Large Volumes of Spectral Data
The enforcement of stringent environmental regulations, such as those from the International Maritime Organization (IMO), has made the accurate monitoring of ship exhaust emissions a critical research and operational focus. Within this field, fiber optic spectrometers have emerged as vital tools for the real-time quantification of key gaseous pollutants, including nitrogen dioxide (NO₂) and sulfur dioxide (SO₂) [1] [5]. These instruments operate by measuring the unique absorption signatures of gas molecules in ultraviolet (UV) and visible light spectra. A single monitoring campaign can generate terabytes of spectral data, creating a significant bottleneck if not managed effectively. The transition from traditional extractive sampling to remote optical sensing underscores the necessity for robust data management protocols that ensure data integrity, facilitate complex analysis, and support regulatory compliance [1]. This document outlines application notes and detailed protocols for handling the large volumes of spectral data produced by fiber optic spectrometers in real-time ship emissions monitoring.
Data Management and Infrastructure
The foundation of effective spectral data analysis is a structured and interoperable management system. The core challenge lies in transforming raw, high-volume spectral data into findable, accessible, interoperable, and reusable (FAIR) information assets.
Spectral Data Management Systems
Centralized data management systems are crucial for organizing spectral data and associated metadata. Platforms like PeakForest provide a specialized infrastructure designed to manage metabolite spectral data, and their principles are highly applicable to emissions monitoring [39]. PeakForest is an open-source, modular system that captures and stores experimental spectral metadata and creates a structured, queryable database. Its representational state transfer (REST) application programming interfaces (APIs) enable seamless integration with external data treatment tools and pipelines, which is essential for automating the flow of data from spectrometer to final report [39].
Data Formats and FAIR Principles
Adherence to standard data formats and the FAIR principles is non-negotiable for data interoperability and long-term usability.
- Standardized Formats: For mass spectrometry-like data (e.g., from some hyperspectral sensors), the mzML format is a recommended standard for data interchange [39]. Utilizing such community-developed formats ensures that data can be read and processed by a wide array of analytical software.
- Metadata Requirements: Comprehensive metadata is the cornerstone of FAIR data. Each spectral data file must be accompanied by metadata detailing the experimental context, as outlined in Table 1.
Table 1: Essential Metadata for Ship Emissions Spectral Data
| Metadata Category | Specific Parameters | Importance for Data Reuse |
|---|---|---|
| Instrumental | Spectrometer model, grating, detector type, spectral range, integration time | Essential for understanding data quality and reproducing measurements. |
| Acquisition Context | Date, time, GPS coordinates of sensor and vessel, solar geometry, plume distance | Critical for spatial-temporal analysis and correcting for atmospheric conditions. |
| Environmental | Ambient temperature, pressure, relative humidity, wind speed/direction | Required for accurate radiative transfer modeling and concentration calculations. |
| Target Gas | Target analyte (e.g., NO₂, SO₂), reference absorption cross-sections used | Links the raw data to the specific analytical model and quantification method. |
- Data Curation: Implementing a rigorous curation workflow within a system like PeakForest allows researchers to validate, annotate, and link spectral data to specific chemical compounds and emission events, dramatically improving the confidence in subsequent identifications and quantifications [39].
Experimental Protocols for Ship Emissions Monitoring
This section provides a detailed methodology for deploying a fiber optic spectrometer system to quantify pollutant emissions from marine vessels.
Instrumentation and Setup
The core of the monitoring system is a fast-hyperspectral imaging remote sensing instrument. A recommended configuration integrates several key components [1]:
- Hyperspectral Spectrometer: A high-resolution spectrometer for precise quantification of trace gases.
- Supporting Cameras: A multi-channel UV camera with a filter wheel (e.g., with filters centered at 310/330 nm for SO₂ and 405/470 nm for NO₂) for high-spatial-resolution plume contour identification, and a visible camera for live scene recording [1].
- Stabilization Systems: A high-precision temperature control system (e.g., maintaining 20°C ± 0.5°C) is critical for reducing spectrometer noise and ensuring data stability. A 2D scanning system enables automated "S"-shaped trajectory scanning of the target area [1].
Table 2: Key Research Reagent Solutions and Materials
| Item | Function/Description |
|---|---|
| Hyperspectral Fiber Optic Spectrometer | Core instrument for capturing high-fidelity solar scattering spectra from the UV to visible range for DOAS analysis. |
| Multi-wavelength UV Filter Set | Filters (e.g., 310 nm, 330 nm for SO₂; 405 nm, 470 nm for NO₂) used with a UV camera to precisely identify plume contours. |
| High-Precision Temperature Control Chamber | Maintains the spectrometer at a stable temperature (e.g., 20°C ± 0.5°C), minimizing thermal drift and spectral noise. |
| Radiative Transfer Model (RTM) Software | Software (e.g., SCIATRAN, LIDORT) used to calculate Air Mass Factors (AMF) for converting measured Slant Column Densities (SCD) to Vertical Column Densities (VCD). |
| Spectral Data Management Platform (e.g., PeakForest) | A structured database system for storing, curating, and annotating spectral data and metadata to ensure FAIR compliance. |
Data Acquisition Workflow
The following workflow, visualized in the diagram below, should be executed for each monitoring event.
Diagram 1: Experimental workflow for spectral data acquisition and processing in ship emissions monitoring.
- System Calibration and Setup: Ensure the spectrometer's temperature control system is active and stable. Verify the wavelength calibration of the hyperspectral spectrometer. Confirm the synchronization between the hyperspectral camera, UV camera, and visible camera.
- Reference Spectrum Acquisition: Before scanning the target area, conduct two zenith measurements to acquire reference solar spectra. These spectra are critical as they represent the "clean" background atmospheric state used in the Differential Optical Absorption Spectroscopy (DOAS) analysis [1].
- Plume Scanning: Initiate an automated "S"-shaped scan of the target area (e.g., a ship's exhaust plume) using the 2D scanning system. The integration time for a single spectrum is typically 3 seconds. A complete scan of a plume should take less than 4 minutes to capture its dynamic nature [1]. Simultaneously, the UV and visible cameras capture images to aid in plume identification.
- Metadata Logging: Throughout the acquisition, automatically log all essential metadata listed in Table 1, including GPS coordinates, timestamps, and environmental parameters.
Data Processing and Analysis Protocol
The processing workflow converts raw spectral data into quantified emission fluxes.
- Pre-processing: Perform standard spectral pre-processing on the raw data. This includes dark current subtraction and re-calibration to a standard wavelength scale if necessary.
- DOAS Analysis: Apply the DOAS fitting algorithm to the measured spectra. The model fits reference absorption cross-sections of the target gases (NO₂, SO₂) and other relevant absorbers to the logarithm of the measured intensity divided by the reference zenith intensity. The output of this step is the Differential Slant Column Density (DSCD), which represents the integrated concentration of the gas along the effective light path through the plume [1].
- Aerosol Correction and Air Mass Factor (AMF) Calculation: The accuracy of the final Vertical Column Density (VCD) is highly dependent on the AMF, which is sensitive to aerosol distribution.
- Aerosol Presence Check: Analyze the variation of O₄ (oxygen collision complex) DSCDs along the scan. A standard deviation of O₄ DSCDs below 20% indicates an "aerosol-absent" plume; otherwise, aerosols are considered present [1].
- AMF Calculation:
- Aerosol-Absent Plume: Use a standard one-dimensional radiative transfer model (RTM) with retrieved aerosol vertical profiles from the background atmosphere as input constraints [1].
- Aerosol-Present Plume: The stereoscopic distribution of aerosols within the plume must be simulated and reconstructed using a more complex 3D radiative transfer model (3D-RTM) to derive an accurate AMF [1].
- Vertical Column Density (VCD) Retrieval: Calculate the VCD for each measurement point using the formula:
VCD = DSCD / AMF. This converts the path-integrated concentration into a vertically integrated concentration. - Emission Flux Calculation: To determine the total mass flow rate of a pollutant, integrate the VCDs across the plume cross-section and multiply by the wind speed vector perpendicular to the plume direction. This step requires contemporaneous wind data, typically obtained from a meteorological station or model. The relationship is summarized in the diagram below.
Diagram 2: Logical relationship for calculating emission flux from VCD and wind data.
Effectively managing and processing the large volumes of spectral data generated by fiber optic spectrometers is a multidisciplinary challenge that lies at the heart of modern, real-time ship emissions monitoring. By implementing a structured data management infrastructure based on FAIR principles, such as the PeakForest model, and adhering to the detailed experimental protocols outlined for acquisition, processing, and analysis, researchers can ensure the production of high-quality, reliable, and defensible data. This rigorous approach is indispensable for validating monitoring technologies, enforcing environmental regulations, and ultimately contributing to the improvement of the marine atmospheric environment. Future work will focus on integrating artificial intelligence for real-time data analysis and tackling emerging challenges such as the measurement of greenhouse gases and nighttime imaging [1].
Achieving Regulatory-Quality Data for EU MRV and IMO DCS
The global effort to decarbonize maritime transport relies on two cornerstone regulatory systems for monitoring greenhouse gas (GHG) emissions: the European Union's Monitoring, Reporting, and Verification (EU MRV) and the International Maritime Organization's Data Collection System (IMO DCS). While sharing the common objective of quantifying and reducing shipping emissions, these systems diverge significantly in their scope, methodology, and data reporting requirements. Compliance necessitates robust, auditable data management protocols, creating a compelling application for advanced real-time monitoring technologies such as fiber optic spectrometers.
Fiber optic spectrometer systems enable the precise, continuous measurement of exhaust gas constituents, providing the empirical data foundation required for both regulatory compliance and strategic decarbonization initiatives. This document outlines detailed application notes and experimental protocols for deploying these systems to meet the specific data quality standards of the EU MRV and IMO DCS frameworks.
Comparative Analysis of EU MRV and IMO DCS
A clear understanding of the distinct requirements of each regulatory system is fundamental to developing an effective monitoring strategy. The following table summarizes the key operational parameters for EU MRV and IMO DCS.
Table 1: Key Comparison Between EU MRV and IMO DCS Regulations
| Parameter | EU MRV | IMO DCS |
|---|---|---|
| Governance Body | European Union (EU) [40] | International Maritime Organization (IMO) [41] |
| Primary Legal Basis | Regulation (EU) 2015/757 [40] [42] | MARPOL Annex VI, Resolution MEPC.278(70) [41] |
| Ship Size Scope | ≥ 5,000 GT; from 2025: offshore ships and general cargo ships ≥ 400 GT [40] [42] | ≥ 5,000 GT [41] [43] |
| Geographical Scope | Voyages to/from/between ports in the European Economic Area (EEA) [40] [42] | All international voyages [44] |
| Reporting Entity | Shipping Company [40] | Ship (data reported to Flag State) [41] |
| Monitoring Methodology | Per voyage, with specific port call and at-berth distinctions [40] | Annual aggregated data [44] |
| Key Reported Gases | CO₂, CH₄, N₂O [40] | CO₂ (from fuel consumption) [41] |
| Public Data Transparency | Public data on individual ship performance [44] | Anonymized, aggregated annual reports [41] [44] |
| Key Compliance Deadlines | Verified company-level emissions report submitted by 31 March of the following year [45] | Data reported to Flag State by 31 March; Statement of Compliance issued by 31 May [45] |
| Main Compliance Outcome | Emissions Report & Document of Compliance (DoC) [42] | Statement of Compliance (SoC) [43] |
Fiber Optic Spectrometry for Marine Emissions Monitoring
Fiber optic spectrometers represent a paradigm shift in mid-infrared (Mid-IR) spectroscopy, which is critical for analyzing molecular "fingerprints" of gases like CO₂, NOₓ, and SOₓ in exhaust streams [46]. These systems use optical fibers to deliver light to and from the sampling point, offering unparalleled flexibility in challenging industrial environments [46].
A key innovation is upconversion technology, which converts mid-IR light into the visible spectrum. This allows the use of high-performance, room-temperature visible-light detectors, overcoming limitations of traditional cooled Mid-IR detectors such as noise, slow speed, and operational complexity [46]. The result is a system capable of highly sensitive (down to pW/nm), high-speed (up to 130 kHz acquisition rates) measurements, ideal for real-time, non-invasive monitoring on moving vessels [46].
System Integration and Data Flow
The integration of a fiber optic spectrometer into a vessel's data infrastructure creates a continuous flow from measurement to verified reporting. The diagram below illustrates this workflow for generating regulatory-quality data.
Experimental Protocols for System Deployment and Validation
Protocol 1: Pre-Deployment Sensor Calibration and Installation
Objective: To ensure the fiber optic spectrometer is accurately calibrated against traceable standards and correctly installed for representative sampling.
Materials:
- Fiber optic spectrometer system with upconversion module [46]
- NIST-traceable calibration gas cylinders (e.g., known concentrations of CO₂, CH₄, NOₓ in N₂)
- Temperature and pressure sensors for environmental compensation
- Sample probe designed for high-particulate, high-temperature exhaust streams
- Heated sample line to prevent condensation
Procedure:
- Lab Calibration:
- Connect the spectrometer to a calibrated gas cell.
- Introduce zero gas (high-purity N₂) and record the baseline spectrum.
- Sequentially introduce at least three different concentrations of each target analyte (CO₂, CH₄).
- Use linear regression to establish a calibration curve (absorbance vs. concentration) for each gas.
- Validate the calibration with a separate, certified gas standard; ensure accuracy is within ±1.5% of the reference value.
- Field Installation:
- Install the sample probe in the vessel's exhaust stack, ensuring a location with well-mixed gas and representative of total exhaust (e.g., >5 stack diameters downstream from any flow disturbance).
- Connect the probe to the spectrometer unit via the heated, fiber-optic sample line. Route the line away from high-heat sources and electromagnetic interference.
- Power the system and verify signal integrity. Perform a final field validation check using a portable calibration gas source.
Protocol 2: In-Situ Data Collection and Voyage Reporting
Objective: To collect continuous emissions data and compile it into a structured format compliant with EU MRV (per voyage) and IMO DCS (annual aggregate) requirements.
Materials:
- Calibrated and installed fiber optic spectrometer
- Onboard Data Acquisition System (DAS) with GPS input
- Automated data logging software
Procedure:
- Data Stream Configuration:
- Configure the DAS to record gas concentrations (CO₂, CH₄), stack gas temperature, and volumetric flow rate at a minimum frequency of 1 Hz.
- Synchronize all data streams with the vessel's GPS to tag measurements with timestamps and location.
Voyage Definition (EU MRV):
- Define voyage start/end based on "port of call" as per EU MRV: the port where a ship stops to load/unload cargo or embark/disembark passengers [40].
- Program the DAS to automatically segment data into voyages using geofencing for EEA ports.
Emissions Calculation:
- For each second, calculate the mass emission rate (kg/s) for CO₂ using the measured concentration, gas flow rate, temperature, and pressure.
- Integrate the mass emission rate over the duration of a voyage to get total voyage emissions (kg CO₂).
- For IMO DCS, aggregate the total fuel consumption (calculated from emissions) and distance travelled over the entire calendar year [41] [43].
Protocol 3: Data Verification and Compliance Submission
Objective: To subject the collected emissions data to internal quality checks and prepare it for independent verification and submission to regulatory authorities.
Materials:
- Completed Emissions Report草案
- Bunker Delivery Notes (BDNs) and fuel oil samples
- Logbook records of main engine, auxiliary engine, and boiler operation
- Access to EU THETIS-MRV and IMO GISIS platforms
Procedure:
- Internal Data Cross-Check:
- Perform a carbon balance check: compare the total CO₂ emissions derived from spectrometer data against the total CO₂ emissions calculated from bunker fuel consumption (using BDNs and emission factors).
- The two values should align within an acceptable margin (e.g., ±5-10%). Document any significant discrepancies and their likely causes.
Verification and Site Visit Preparation:
- Engage an accredited verifier (e.g., DNV, LR) to assess the monitoring plan and annual emissions report [42] [45].
- Prepare for a mandatory site visit at least once every four years. This can be a physical or virtual visit to the company's office or the ship to validate the monitoring and reporting systems described in the Monitoring Plan [47].
- Provide the verifier with secure access to the raw, time-stamped data from the spectrometer system to demonstrate the integrity of the data trail.
Final Submission:
The Scientist's Toolkit: Essential Research Reagents and Materials
Table 2: Key Research Reagent Solutions for Emissions Monitoring
| Item | Function / Application | Specification Notes |
|---|---|---|
| Mid-IR Fiber Optic Spectrometer | Core sensing unit for non-invasive, real-time gas analysis in exhaust stacks [46]. | Must feature upconversion technology for room-temperature operation, high sensitivity (pW/nm), and acquisition rates ≥1 kHz for real-time resolution [46]. |
| NIST-Traceable Calibration Gases | Critical for establishing measurement accuracy and traceability for regulatory audits. | Certified mixtures of CO₂, CH₄, and N₂O in a nitrogen balance. Concentrations should span the expected measurement range. |
| Heated Sample Probe & Line | Extracts a representative gas sample from the exhaust stream while maintaining integrity. | Must withstand high temperatures (e.g., >500°C) and be constructed from materials inert to corrosive exhaust components (e.g., SOₓ). |
| Onboard Data Acquisition System (DAS) | Synchronizes and logs spectrometer data with vessel operational parameters (GPS, engine power). | Requires robust, marine-grade hardware and software capable of continuous, time-aligned data logging from multiple sources. |
| Emissions Management Software Platform | Data platform for aggregating, validating, and generating compliance reports (e.g., DNV's Emissions Connect) [48]. | Should enable secure data sharing with verifiers and stakeholders, and provide tools for CII and EU ETS allowance forecasting [48]. |
Proving Performance: How Fiber Optic Systems Stack Up Against Other Methods
The enforcement of stringent international regulations, such as those outlined in MARPOL Annex VI, has created a critical need for robust and reliable methods to monitor ship emissions in real-time. While fiber optic spectrometers represent a promising technology for this application, validating their performance against established reference methods is a fundamental step in their development and deployment. This document provides detailed application notes and protocols for the validation of emerging optical monitoring systems against three cornerstone reference techniques: the Sniffing Method, Fourier-Transform Infrared (FTIR) Spectroscopy, and Ultraviolet (UV) Imaging. Framed within broader research on fiber optic spectrometers, this guide equips researchers and scientists with the necessary tools to conduct rigorous, comparative performance assessments, thereby accelerating the adoption of advanced, real-time monitoring solutions in the maritime industry.
Reference Methods: Principles and Quantitative Comparison
A thorough understanding of established reference methods is a prerequisite for any validation campaign. The following table summarizes the key characteristics of the three primary techniques.
Table 1: Quantitative Comparison of Reference Methods for Ship Emission Monitoring
| Method | Principle | Typical Detection Limit for SO₂ | Measured Pollutants | Key Advantages | Reported Accuracy/Precision |
|---|---|---|---|---|---|
| Sniffing Method | In-situ measurement of SO₂/CO₂ ratio in the plume to calculate Fuel Sulfur Content (FSC) [49] [50] | N/A (Direct concentration measurement) | SO₂, NOx, CO₂ [49] [50] | Considered the most accurate method; can simultaneously measure multiple gases [49] [50] | FSC error <15% under optimal conditions (wind >2 m/s, distance <400 m) [50] |
| FTIR Spectroscopy | Broadband absorption measurement of molecular vibrational-rotational signatures [51] [52] | ~1 ppm (for industrial SO₂ systems) [53] | Simultaneous quantification of all regulated gases and >100 Hazardous Air Pollutants [51] | Highly versatile; single-source quantification for multiple gases; suitable for harsh marine environments [51] | Effective for CO and O₃ profiling; validated against global models [52] |
| UV Imaging | Dual-band UV absorption imaging to derive SO₂ column density [54] | Dependent on optical path and camera SNR [54] | SO₂ (and potentially NOx with appropriate filters) [54] | Provides 2D spatial distribution of plume; high temporal resolution [54] | Accuracy highly dependent on optimal band selection (e.g., 300 nm & 310 nm) to maximize SNR [54] |
Detailed Experimental Protocols
Protocol for the Sniffing Method Validation
The sniffing method is often considered the benchmark for FSC determination due to its direct measurement approach and high accuracy under controlled conditions [49] [50].
- Objective: To validate the FSC derived from a fiber optic spectrometer by comparing it against the FSC calculated from a reference sniffer system measuring the SO₂-to-CO₂ ratio in a ship's exhaust plume.
- Equipment:
- Reference Analyzers: Thermo Scientific 43i (SO₂), 42i (NOx), and 410i (CO₂) analyzers [49] [50].
- Multifunctional meteorological station for wind speed, wind direction, temperature, and humidity [49] [50].
- Automatic Identification System (AIS) receiver for ship data (e.g., identity, speed) [49].
- Data acquisition system (e.g., industrial computer) [49].
- Procedure:
- System Deployment: Install the sniffing station on a fixed location (e.g., bridge, shore near shipping lane) or a mobile platform (e.g., patrol boat) to intercept the exhaust plume of target ships [50].
- Data Acquisition: As a ship passes, continuously record the concentrations of CO₂, SO₂, and NOx. Simultaneously, record high-frequency meteorological data and AIS information [49].
- Peak Identification: Employ an automatic peak recognition algorithm to identify the peaks in the concentration data above the background levels. The algorithm should calculate incremental, correlation, and comprehensive discriminant indices to ensure the plume is correctly captured [49].
- FSC Calculation: For each identified plume peak, calculate the FSC using the ratio of SO₂ to CO₂ and the assumption that the carbon content in the fuel is 87% [50]. The formula is: FSC = (Ratio of SO₂ to CO₂) × (Molar mass of S / Molar mass of C) × (12/32) × 100%.
- Data Filtering: Apply quality controls. Discard data points where wind speed is below 2 m/s or the monitoring distance exceeds 400 meters, as these conditions significantly increase error [50].
- Data Analysis: Perform a linear regression analysis comparing the FSC values obtained from the reference sniffing system against those derived from the fiber optic spectrometer under test. Report the coefficient of determination (R²), slope, intercept, and root mean square error (RMSE).
Protocol for FTIR Spectroscopy Cross-Validation
FTIR spectroscopy offers a powerful reference method due to its ability to quantitatively measure a wide array of gas species simultaneously [51].
- Objective: To cross-validate the concentration measurements of specific pollutants (e.g., SO₂, NOx) from a fiber optic spectrometer against a reference FTIR system.
- Equipment:
- Marine-grade FTIR spectrometer (e.g., METEL CEMS at Maine Maritime Academy) capable of withstanding shock, vibration, and corrosion [51].
- Heated sample line and particulate filter to condition the exhaust gas sample.
- Calibration gas mixtures for the target pollutants.
- Procedure:
- Co-located Sampling: Install the sampling inlets of the fiber optic spectrometer and the FTIR system in close proximity (e.g., within the same stack or exhaust duct) to ensure they are analyzing the same gas stream.
- System Calibration: Calibrate the reference FTIR system using certified calibration gases according to the manufacturer's protocol. The fiber optic spectrometer should use its own standard calibration.
- Simultaneous Measurement: Conduct simultaneous measurements over a defined period, capturing a range of engine loads and corresponding emission levels.
- Data Synchronization: Ensure the data logging systems of both instruments are synchronized in time to allow for direct point-by-point comparison.
- Data Analysis: For each target gas (SO₂, NO), create a scatter plot of the FTIR concentration (reference) versus the fiber optic spectrometer concentration (test). Calculate the correlation statistics (R², RMSE). A Bland-Altman plot can also be used to visualize the bias between the two methods across the concentration range.
Protocol for UV Imaging Correlation Studies
UV imaging provides a remote, non-contact method to visualize and quantify SO₂ in a plume, offering a different modality for validation [54].
- Objective: To correlate the path-integrated SO₂ concentrations or emission rates derived from a fiber optic spectrometer with those obtained from a reference UV camera system.
- Equipment:
- UV-sensitive camera with a double-filter wheel system.
- Optimal bandpass filters, typically centered near 300 nm (absorption channel) and 310 nm (reference channel), to maximize the signal-to-noise ratio for ship exhaust levels [54].
- Calibration cells of known SO₂ concentration for empirical calibration of the camera.
- Procedure:
- Co-located Field Setup: Position the UV camera and the fiber optic spectrometer with a clear, simultaneous view of the same ship's exhaust plume.
- Image and Spectral Acquisition: The UV camera captures a rapid sequence of images (e.g., multiple frames per second) through both filters. The fiber optic spectrometer simultaneously acquires its spectral data.
- Image Processing:
- For each image pair, compute the optical density for each pixel: OD = -ln(Absorption Image / Reference Image).
- Convert the optical density to SO₂ column density (e.g., ppm·m) using the known absorption cross-section of SO₂ at the filter wavelengths or an empirical calibration [54].
- Emission Rate Calculation: Combine the calculated SO₂ column density with the plume velocity (derived from cross-correlation of subsequent images or from wind data) and the plume cross-sectional area to compute an SO₂ emission rate [54].
- Data Analysis: Compare the time series of path-integrated SO₂ from the fiber optic spectrometer with the spatially resolved data from the UV camera. For a more integrated validation, compare the calculated SO₂ emission rates from both systems over multiple plume events.
Signaling Pathways and Workflow Visualization
The following diagrams illustrate the logical workflows and data processing pathways for the key validation protocols.
Diagram 1: Sniffing Method FSC Validation Workflow
Diagram 2: Multi-Method SO₂ Measurement Correlation
The Scientist's Toolkit: Key Research Reagent Solutions
The following table details essential materials and instruments used in the featured validation experiments.
Table 2: Essential Research Reagents and Materials for Emissions Monitoring Validation
| Item Name | Function / Application | Specific Example / Specification |
|---|---|---|
| Certified Calibration Gases | Calibration and zeroing of gas analyzers (FTIR, Sniffer) to ensure traceable accuracy. | Certified SO₂, NOx, and CO₂ mixtures in nitrogen balance gas, traceable to NIST standards. |
| Thermo Scientific 43i SO₂ Analyzer | Reference SO₂ measurement in sniffer systems based on UV fluorescence principle [49] [50]. | Measurement range: 0-500 ppm; Deviation: ±1 ppb [50]. |
| Thermo Scientific 42i NOx Analyzer | Reference NOx measurement in sniffer systems based on chemiluminescence [49] [50]. | Measurement range: 0-500 ppm; Deviation: ±1 ppb [50]. |
| Thermo Scientific 410i CO₂ Analyzer | Reference CO₂ measurement in sniffer systems based on infrared absorption [49] [50]. | Measurement range: 0-5000 ppm; Deviation: ±1 ppm [50]. |
| UV Bandpass Filters | Isolating specific wavelength regions for SO₂ absorption and reference in UV camera systems [54]. | Center wavelengths at 300 nm (absorption) and 310 nm (reference) with 10 nm FWHM (Full Width at Half Maximum) [54]. |
| Marine-Grade FTIR System | Continuous, multi-species gas emissions monitoring in harsh marine environments [51]. | System ruggedized for shock, vibration, and corrosion resistance per marine standards [51]. |
| AIS Receiver | Correlating detected emission plumes with specific vessel information (identity, type, speed) [49]. | Receives AIS data for automatic identification of target ships and logging of operational parameters. |
Comparative Analysis of Detection Limits and Accuracy
Fiber optic spectrometers represent a transformative technology for the real-time monitoring of ship emissions, a critical application given the stringent new regulations from the International Maritime Organization (IMO) and European Union [2]. These sensors offer significant advantages for decentralized, real-time environmental monitoring, including a small footprint, high sensitivity, immunity to electromagnetic interference, and operational simplicity [55] [56]. This application note provides a comparative analysis of the detection limits and accuracy of various fiber optic sensing configurations, with a specific focus on their applicability for monitoring key shipborne pollutants such as black carbon, CO₂, and heavy metals. The content is structured to support researchers and scientists in selecting and implementing the most appropriate fiber optic sensor technology for their specific emission monitoring challenges, providing detailed protocols and data-driven comparisons.
Performance Comparison of Sensing Technologies
The selection of a fiber optic sensor is primarily governed by the target analyte and the required detection performance. The following table summarizes the capabilities of different fiber optic sensing technologies for detecting various analytes relevant to ship emissions and environmental monitoring.
Table 1: Comparative performance of fiber optic sensing technologies
| Sensor Technology | Target Analyte | Detection Principle | Detection Limit | Reported Accuracy/Notes | Applicability to Ship Emissions |
|---|---|---|---|---|---|
| LSPR-based Optical Fiber Sensor [55] | Arsenic Ions (As) in water | Localized Surface Plasmon Resonance (LSPR) with Au nanoparticles & Al₂O₃/GO nanocomposite | 0.09 ppb (parts per billion) | <5% relative difference vs. ICP-MS; Reusable, stable, 0.5s response time. | High (for wastewater/scrubber discharge monitoring) |
| Deep Learning SPR Sensor [56] | Mercury Ions (Hg²⁺) in water | Surface Plasmon Resonance (SPR) with Ag/GST/Ag film, MOF layer, & AuNPs | 10 pM (pico-molar) | Test accuracy of 97.5%; RI sensitivity of 11,471 nm/RIU. | High (for hazardous heavy metal discharge monitoring) |
| Flue Gas Sensor (Project Cleanship) [6] | Black Carbon (Soot Particles) | Real-time flue gas analysis (technology principle not specified) | Real-time monitoring at realistic concentrations | Enables precise understanding of emission sources and reduction strategies. | Direct (specifically designed for ship smokestack emissions) |
| Direct CO₂ Monitoring [2] | Carbon Dioxide (CO₂) | Spectral techniques (NDIR, TDLAS, UV-DOAS, FTIR) | Not explicitly quantified | High accuracy; Allows for distinction between different emission sources (e.g., main vs. auxiliary engine). | Direct (mandated methodology under EU MRV) |
The data reveals a clear technological trend: combining sophisticated fiber optic probes with machine learning data analysis achieves exceptional sensitivity and accuracy [55] [56]. For example, the LSPR-based arsenic sensor detects concentrations 111 times lower than the WHO permissible limit, while the SPR mercury sensor achieves a remarkable 10 pM detection limit. For direct ship stack gas monitoring, technologies for black carbon and CO₂ are now being deployed on vessels like the M/T Falstria Swan, providing the data needed for compliance with evolving IMO and EU regulations [6] [2].
Experimental Protocols
Protocol A: LSPR-based Detection of Trace Heavy Metals in Aqueous Effluents
This protocol details the methodology for detecting heavy metal ions (e.g., arsenic, mercury) in ship discharge water or scrubber effluent, based on advanced LSPR/SPR sensors [55] [56].
1. Sensor Probe Fabrication:
- Fiber Preparation: Use a standard multimode optical fiber. A small section of the cladding is removed to create a sensing region where the evanescent field can interact with the environment.
- Functionalization: The exposed core is coated with a thin film of gold nanoparticles (AuNPs). A sensitizing nanocomposite layer is then applied over the AuNPs. For arsenic, this is an aluminum oxide/graphene oxide (Al₂O₃/GO) nanocomposite [55]. For mercury, a more complex structure involving a Ag/GST/Ag composite film and a metal-organic framework (UiO-66-NH₂) is used to immobilize probe DNA (pDNA) [56].
2. Measurement Setup:
- Optical Interrogation: Connect the sensor probe to a broadband light source (e.g., halogen lamp) and an optical spectrum analyzer (OSA).
- Fluidics: The sensor probe is immersed in a flow cell through which the water sample is passed.
3. Data Acquisition:
- As the target analyte (e.g., As ions, Hg²⁺) binds to the functionalized layer, it causes a change in the local refractive index.
- This change induces a measurable shift in the LSPR/SPR resonance wavelength peak [55]. In the case of the mercury sensor, the binding of target DNA-conjugated AuNPs via T-Hg²⁺-T structures further amplifies this signal [56].
4. Data Analysis:
- Traditional Method: Track the resonance wavelength dip shift over time and correlate it to analyte concentration using a pre-established calibration curve [56].
- Deep Learning Enhancement: For optimal accuracy, a deep learning model (e.g., a Residual Neural Network or ResNet) can be trained on the raw or pre-processed spectral data. The model learns to classify spectra based on analyte concentration, achieving higher accuracy and robustness against noise compared to manual dip identification [56].
The following workflow diagram illustrates the core experimental and data analysis process:
Figure 1: Workflow for LSPR/SPR-based heavy metal detection.
Protocol B: Direct Measurement of Gaseous Ship Stack Emissions
This protocol outlines the procedure for the real-time, direct measurement of gaseous emissions like CO₂ and particulate matter (e.g., black carbon) from a ship's exhaust [6] [2].
1. System Installation:
- Sampling Probe: Install a robust, heated sampling probe directly into the ship's exhaust stack (smokestack).
- Sample Line: Use a heat-traced sample line to transport the gas from the probe to the analyzer cabinet, preventing condensation of volatile components.
- Analyzer Cabinet: The cabinet houses the core measurement technology. For CO₂, this is typically a spectrometer based on NDIR, TDLAS, UV-DOAS, or FTIR technology [2]. For black carbon, a specialized flue gas sensor is used [6].
- Flow Meter: A flow meter is installed in the stack to measure the total exhaust gas volume.
2. Calibration:
- Regularly calibrate the gas analyzers using certified standard reference gases of known concentration.
- Calibrate the flow meter according to manufacturer specifications.
3. Continuous Monitoring:
- The system continuously draws a sample of the exhaust gas.
- The gas analyzer measures the concentration of the target pollutant (e.g., CO₂ in % or ppm).
- The flow meter measures the volumetric flow rate of the exhaust.
4. Data Processing and Reporting:
- The total mass emission of the pollutant is calculated by integrating the concentration data with the flow rate data over time.
- Emissions can be allocated to specific operational periods (e.g., at sea, in port) or specific emission sources (main engine, auxiliary engine) [2].
- Data is processed into key performance indicators (e.g., g CO₂/kWh) required for regulatory reporting under EU ETS and FuelEU Maritime [6].
The Scientist's Toolkit: Research Reagent Solutions
Successful implementation of high-sensitivity fiber optic sensors, particularly for heavy metals, relies on specialized materials and reagents.
Table 2: Essential research reagents and materials for fiber optic sensor development
| Reagent/Material | Function in Experiment | Example Application |
|---|---|---|
| Gold Nanoparticles (AuNPs) | Transducer element; enables LSPR/SPR phenomenon by supporting collective electron oscillations upon light interaction. | Core sensing element in arsenic [55] and mercury [56] sensors. |
| Functional Nanocomposites (e.g., Al₂O₃/GO) | Sensitizing layer; selectively binds to target analyte, causing a localized refractive index change for detection. | Al₂O₃/GO composite for selective arsenic ion binding [55]. |
| Metal-Organic Frameworks (MOFs), e.g., UiO-66-NH₂ | Porous sensitizing layer; provides a high density of active sites for enhanced adsorption and immobilization of probe molecules. | UiO-66-NH₂ used to immobilize pDNA and enhance RI response in Hg²⁺ sensor [56]. |
| Chalcogenide Alloys (e.g., Ge₂Sb₂Te₅ - GST) | High-refractive-index material in composite films; enhances light-matter interaction and electric field localization, boosting sensitivity. | Ag/GST/Ag composite film in SPR sensor for ultra-high RI sensitivity [56]. |
| Probe DNA (pDNA) and DNA-conjugated AuNPs | Biological recognition element; binds specifically to target analytes (e.g., via T-Hg²⁺-T structures), providing high selectivity. | Used in the Hg²⁺ sensor for specific binding and signal amplification [56]. |
| Certified Standard Reference Gases | Calibration of direct emission monitors; provides known concentration points for accurate quantification of gaseous pollutants. | Essential for calibrating NDIR, TDLAS systems for CO₂ monitoring on ships [2]. |
This application note demonstrates that fiber optic spectrometers are a potent tool for the real-time monitoring of ship emissions. The choice between a highly sensitive LSPR/SPR sensor for aqueous contaminants and a robust direct emission monitor for stack gases depends entirely on the specific monitoring objective. The integration of advanced materials like MOFs and GST alloys, coupled with deep learning for data analysis, is pushing the boundaries of detection limits and accuracy. These technological advancements will provide the shipping industry with the data integrity and operational clarity required to navigate the complex landscape of environmental compliance and achieve its long-term decarbonization goals.
Advantages of Imaging Spectroscopy for Plume Analysis
Within the overarching research on fiber optic spectrometers for real-time ship emissions monitoring, imaging spectroscopy stands out as a transformative technology for plume analysis. This Application Note details the specific advantages of these techniques, which merge imaging with spectroscopy to enable the precise identification, quantification, and spatial mapping of pollutants in marine vessel exhaust. Where traditional point measurements or extractive sampling methods fall short, imaging spectroscopy provides a non-contact, holistic view of emission plumes, facilitating compliance with stringent environmental regulations and advancing our understanding of the impact of maritime transport on the atmospheric environment [5] [1].
Key Advantages Summarized
The transition from conventional monitoring to imaging-based spectroscopic analysis offers several distinct advantages for characterizing ship emissions.
- High Spatiotemporal Resolution: Modern fast-hyperspectral imaging techniques achieve high precision imaging of nitrogen dioxide (NO₂) and sulfur dioxide (SO₂) with an imaging spatial resolution of less than 0.5 m × 0.5 m and a complete plume scanning process typically completed in under 4 minutes [1]. This allows for detailed observation of trace gas distribution within the plume itself.
- Real-time, In-situ Capability: Fiber optic spectrometers have become faster, smaller, and more powerful, enabling deployment almost anywhere for real-time, in-situ monitoring. This is a significant advance over earlier instruments that required extracting field samples and transporting them to a laboratory for analysis [5].
- Multi-Pollutant Quantification: Imaging spectroscopy enables the simultaneous quantification of multiple air pollutants, including NOₓ, SO₂, and NH₃, from a single measurement platform [5] [1]. This provides a more comprehensive emission profile than single-pollutant sensors.
- Non-Contact and Remote Operation: The technique allows for remote sensing of emissions from a distance, which is crucial for monitoring operating ships without interfering with their voyage. This remote capability also enables the assessment of plume diffusion and transport in the atmosphere [1].
- Cost-Effectiveness and Flexibility: When integrated into specialized marine sensors, spectrometer-based systems offer a more cost-effective and flexible solution for continuous emission measurements compared to many existing alternatives, all while withstanding harsh marine conditions [5].
Quantitative Data Comparison
The following tables summarize key performance metrics and target analytes for imaging spectroscopy in plume analysis.
Table 1: Performance Metrics of Imaging Spectroscopy Techniques for Plume Analysis
| Metric | Fast-Hyperspectral Imaging [1] | Modular Fiber Optic Spectroscopy [5] |
|---|---|---|
| Spatial Resolution | < 0.5 m × 0.5 m | Dependent on deployment and sensor head design |
| Temporal Resolution | < 4 minutes per plume scan | Real-time, continuous |
| Key Analytes | NO₂, SO₂ | NOₓ, SO₂, NH₃ |
| Deployment Mode | Remote, non-contact | In-situ, can be integrated on-board |
| Key Advantage | High spatial detail for plume structure and diffusion | Ruggedized for long-term, real-time operation on vessels |
Table 2: Target Pollutants and Their Significance
| Pollutant | Environmental and Regulatory Significance |
|---|---|
| Nitrogen Oxides (NOₓ) | Contributes to smog formation, acid rain, and respiratory health issues. A key regulated emission from combustion engines. |
| Sulfur Dioxide (SO₂) | Primary cause of acid rain. Subject to strict global limits in marine fuels (e.g., IMO 2020). |
| Ammonia (NH₃) | A precursor to secondary particulate matter (PM2.5) and an indicator of certain emission control strategies. |
Experimental Protocol: Fast-Hyperspectral Imaging of Ship Plumes
This protocol outlines the methodology for high-precision, high spatiotemporal resolution imaging of NO₂ and SO₂ emitted from marine vessels, as documented in recent scientific literature [1].
Instrument Setup and Calibration
- System Configuration: The core instrument consists of a coaxial system integrating a hyperspectral camera, a visible camera, and a multiwavelength filter UV camera system.
- Temperature Stabilization: A critical step is the activation of the high-precision temperature control system for the spectrometer. The system must maintain a stable temperature of 20 °C ± 0.5 °C to minimize spectral noise and ensure data integrity. The stability should be verified before deployment.
- Spectral Reference: Conduct two zenith sky measurements before initiating the plume scan to serve as reference spectra for the entire observation period.
- Field of View (FOV) Alignment: Precisely align the FOV of the hyperspectral camera using a calibrated illuminant to ensure accurate spatial registration.
Data Acquisition
- Scanning Pattern: Program the instrument's 2D scanning system (azimuth and elevation motors) to perform a continuous scan in an "S"-shaped trajectory across the preset imaging area containing the target vessel and its plume.
- Spectral Collection: For each measurement point in the scan, collect solar scattering spectra with an integration time of approximately 3 seconds.
- Plume Imaging: Simultaneously, collect images using the visible camera for context and the multi-channel UV camera (with filters centered at, for example, 310/330 nm for SO₂ and 405/470 nm for NO₂) to aid in precise plume contour identification.
- Ancillary Data: Record the reference interferogram from a 488 nm diode laser using a photodiode to track and correct for mirror position errors in the interferometer, a process known as He-Ne correction.
Data Processing and Analysis
- Pre-processing: Convert the raw interferogram data into spectral data for each pixel using a Fourier transform.
- Air Mass Factor (AMF) Calculation: The vertical column density (VCD) calculation's accuracy depends on the AMF, which is affected by aerosols.
- Determine the presence of aerosols within the plume by analyzing the variation of O₄ differential slant column densities (DSCDs) across the plume.
- If the standard deviation of O₄ DSCDs is below 20%, classify the plume as "aerosol-absent" and use standard radiative transfer models (RTM) with retrieved aerosol profiles.
- If aerosols are present (O₄ variation > 20%), employ 3D radiative transfer modeling to reconstruct the stereoscopic distribution of aerosols within the plume for accurate AMF calculation.
- Quantification: Apply differential optical absorption spectroscopy (DOAS) or similar spectral analysis techniques to the hyperspectral data to retrieve the DSCDs of NO₂ and SO₂. Convert DSCDs to VCDs using the calculated AMFs to obtain quantitative emission values.
Workflow Visualization
The diagram below illustrates the logical workflow for the hyperspectral imaging and analysis of a ship's emission plume.
The Scientist's Toolkit: Research Reagent Solutions
Table 3: Essential Components for a Ship Emission Imaging Spectroscopy System
| Item | Function in the Experiment |
|---|---|
| Hyperspectral Imaging System | Core component for collecting high-fidelity spectral data across a spatial plane. Enables identification and mapping of multiple gases simultaneously. |
| Modular Fiber Optic Spectrometer | Provides flexibility for integration into various sensor configurations; used for continuous, real-time monitoring of specific exhaust parameters [5]. |
| Multi-wavelength UV Camera & Filter Wheel | Equipped with specific filter pairs (e.g., 310/330 nm for SO₂, 405/470 nm for NO₂) to help precisely identify plume contours and internal gas distribution [1]. |
| Precision Temperature Control System | Maintains the spectrometer at a constant temperature (e.g., 20°C ± 0.5°C), which is critical for minimizing instrumental drift and ensuring high-precision measurements [1]. |
| Reference Laser (e.g., 488 nm Diode Laser) | Provides a stable reference signal to correct for vibrations and mirror position errors in the interferometer, ensuring accurate optical path difference (OPD) determination [1]. |
| Ruggedized Sensor Housing | Protects sensitive optical components from harsh marine conditions (salt, humidity, vibration), enabling long-term, reliable operation in the field [5]. |
| Radiative Transfer Model (RTM) | Software tool used to calculate the Air Mass Factor (AMF), which is essential for converting measured slant column densities into accurate vertical column densities of pollutants [1]. |
This document provides a detailed cost-benefit analysis for the implementation of fiber optic spectrometer-based systems for the real-time monitoring of ship emissions. Stricter international regulations from the International Maritime Organization (IMO) and the European Union are driving the maritime industry toward accurate, verifiable emission tracking [2]. This analysis compares the initial investment against long-term operational savings, providing researchers and engineers with structured data and protocols to justify the adoption of this technology.
Fiber optic sensing technology is recognized for its high precision, immunity to electromagnetic interference, and capability to withstand harsh environments [57]. When applied to emission quantification, systems utilizing techniques like UV-DOAS and Tunable Diode Laser Absorption Spectroscopy (TDLAS) enable real-time, direct measurement of pollutants such as NO2 and SO2 [2] [1]. This shift from indirect calculation to direct measurement offers significant advantages in data accuracy and operational efficiency, forming the basis for the cost-benefit rationale explored in this note.
Quantitative Cost-Benefit Analysis
Comparative Analysis of Monitoring Methodologies
The following table summarizes the core characteristics, costs, and benefits of the primary emission monitoring methodologies.
Table 1: Comparison of Ship Emission Monitoring Methods
| Monitoring Method | Typical Initial Investment | Key Operational Costs | Payback Period & ROI | Accuracy & Real-Time Capability | Primary Regulatory Applicability |
|---|---|---|---|---|---|
| Bunker Delivery Note (BDN) & Tank Sounding | Low (Manual processes) | High (Labor-intensive, prone to error) | N/A (Low efficiency) | Low accuracy; No real-time data [2] | IMO DCS, EU MRV [2] |
| Flow Meter Monitoring | Medium (Sensor procurement & installation) | Medium (Periodic calibration & maintenance) | Data not available | High accuracy; Real-time fuel data [2] | IMO DCS, EU MRV [2] |
| Direct CO2 Monitoring (e.g., CEMS) | High (Equipment & integration) | Medium (Calibration, power, data management) | Data not available | High accuracy; Real-time emission data [2] | EU MRV [2] |
| Fiber Optic Spectrometer-Based Sensing | High (Advanced optics, system integration) | Lower (Durable components, reduced labor) | Market CAGR of 10.7% [57] | Very High precision & real-time capability [57] [1] | IMO, EU MRV, Port State Control |
Detailed Cost and Savings Breakdown
Table 2: Initial Investment vs. Operational Savings Breakdown for Fiber Optic Spectrometer Systems
| Cost & Savings Category | Specific Items | Quantitative Impact / Notes |
|---|---|---|
| Initial Investment (CAPEX) | Hyperspectral Camera, UV Camera, Spectrometer [1] | Major portion of upfront cost; precision optics are critical. |
| Fiber Optic Bundles & Probes [58] | Enables flexible and remote sensing in challenging ship environments. | |
| System Integration & Calibration Platform | Includes design of temperature-stabilized enclosures (±0.5°C) [1]. | |
| Operational Expenditure (OPEX) | Manual Fuel Tank Checks & BDN Administration | Significant labor cost reduction through automation. |
| Regulatory Penalties & Non-Compliance Fines | Mitigation of EU ETS penalties (e.g., €2,400 per ton of non-compliant fuel) [2]. | |
| Predictive Maintenance & Fuel Efficiency | Real-time data enables engine optimization, reducing fuel consumption. | |
| Intangible Benefits | Corporate Social Responsibility (CSR) | Enhanced brand reputation and stakeholder trust [4]. |
| Data for R&D | High-quality emission data supports research into low-carbon technologies. |
Experimental Protocols for Real-Time Ship Emission Monitoring
Protocol 1: System Setup and Calibration for Fiduciary Measurements
Objective: To establish a standardized procedure for the deployment and calibration of a fiber optic spectrometer system for precise emission quantification.
Materials:
- Fast-hyperspectral imaging instrument (e.g., integrating hyperspectral camera, UV camera with filter wheel) [1].
- High-resolution fiber optic spectrometer (e.g., HR4000CG or equivalent) [59].
- Calibrated light source (e.g., Deuterium-Halogen combination source) [60].
- Optical fibers and bifurcated/trifurcated fiber assemblies [58].
- Temperature-controlled enclosure for spectrometer (20°C ± 0.5°C) [1].
- Diffuse reflectance standard white board [60].
Workflow Diagram: System Setup and Calibration
Procedure:
- Hardware Connection: Connect the light source to the transmittance integrating sphere's input port using an optical fiber. Connect the sphere's output port to the fiber optic spectrometer using a second fiber. Connect the spectrometer to a PC via USB [60].
- System Power-On: Power the light source with a stable 12V supply and turn it on. Allow a warm-up period of at least 10 minutes for the light source output to stabilize [60].
- Dark Spectrum Collection: With the light source off or blocked, collect a dark background spectrum to account for sensor noise and thermal electrons. This spectrum is automatically subtracted from subsequent measurements [60] [59].
- Reference Spectrum Collection: Seal the sample port of the integrating sphere. Collect a reference spectrum, which typically uses air or a calibrated white standard as the reference material [60].
- Sample Measurement & Validation: Remove the cover and place a calibration sample (e.g., a 785 nm long-wave pass filter) in the sample port. Collect the sample spectrum. The software calculates transmittance as the ratio of the sample spectrum to the reference spectrum [60]. Validate the entire system calibration using known standard filters.
Protocol 2: On-Vessel Deployment and Plume Imaging for NO₂/SO₂
Objective: To execute real-time, remote sensing and quantification of NO₂ and SO₂ emissions from a ship's exhaust plume.
Materials:
- Fast-hyperspectral imaging remote sensing instrument [1].
- 2D motorized scanning system (azimuth and elevation control) [1].
- Industrial control computer (IPC) with analysis software.
- Multi-wavelength filter sets (e.g., 310/330 nm for SO₂, 405/470 nm for NO₂) [1].
Workflow Diagram: On-Vessel Deployment and Plume Imaging
Procedure:
- Field Deployment: Position the instrument on a suitable platform (e.g., another vessel, shore-based station) with a direct line of sight to the target ship's exhaust stack.
- Reference Measurement: Before scanning, conduct two zenith measurements of the sky to obtain reference spectra for the entire observation period [1].
- Automated Plume Scanning: The IPC controls the 2D scanning system to perform a continuous "S"-shaped trajectory scan of the preset imaging area, covering the vessel's plume. A single spectrum is collected every 3 seconds of integration time [1].
- Multi-Modal Data Acquisition: During scanning, the system simultaneously collects:
- Aerosol Categorization and AMF Calculation: Analyze the variation of O₄ differential slant column densities (DSCDs) within the plume. Categorize the plume as "aerosol-present" or "aerosol-absent" [1].
- Emission Quantification: Apply the appropriate Air Mass Factor (AMF) calculation scheme based on the aerosol categorization to convert DSCDs to Vertical Column Densities (VCDs). Quantify the emission rates of NO₂ and SO₂ and visualize their distribution within the plume [1].
The Scientist's Toolkit: Research Reagent Solutions
Table 3: Essential Materials and Equipment for Ship Emission Monitoring
| Item | Function & Application | Technical Notes |
|---|---|---|
| High-Resolution Fiber Optic Spectrometer | Core device for capturing spectral data from 200-1100 nm [59]. | Requires high dynamic range and sensitivity for weak signals. |
| Bifurcated/Trifurcated Fiber Assembly | Splits or combines optical signals to/from multiple sources or spectrometers [58]. | Essential for extended spectral range (e.g., using Si and InGaAs detectors simultaneously) [58]. |
| Deuterium-Halogen Light Source | Provides stable, broadband output from UV to NIR for calibration and transmission measurements [60]. | A warm-up period of ~10 minutes is required for output stabilization [60]. |
| Transmittance Integrating Sphere | Creates a Lambertian surface for highly accurate transmittance measurements by collecting diffuse light [60]. | Made of PTFE material for high stability and reflectance from UV to NIR [60]. |
| Multi-Wavelength Filter Sets | Isolate specific absorption bands for target gases (NO₂, SO₂) in imaging applications [1]. | Used in filter wheels paired for strong/weak absorption bands of each gas [1]. |
| Temperature-Controlled Enclosure | Maintains spectrometer at a constant temperature (e.g., 20°C ± 0.5°C) to minimize thermal noise and drift [1]. | Critical for ensuring data consistency and measurement accuracy in field deployments [1]. |
Conclusion
Fiber optic spectrometry has emerged as a cornerstone technology for the maritime industry's green transition, moving emissions monitoring from periodic checks to continuous, auditable intelligence. By providing real-time, precise data on key pollutants, these systems empower ship operators to achieve regulatory compliance, optimize fuel efficiency, and make verifiable progress toward decarbonization. Future advancements will hinge on the integration of hyperspectral imaging, enhanced data analytics powered by AI, and the development of even more compact and robust systems capable of measuring an expanding range of greenhouse gases, solidifying the role of optical sensing in creating a sustainable future for global shipping.
References
- 1. Emission quantification of NO2 and SO2 from marine vessels [https://www.nature.com/articles/s41377-025-01922-x]
- 2. Research on Ship Carbon-Emission Monitoring ... [https://www.mdpi.com/2073-4433/16/7/773]
- 3. IMO approves net-zero regulations for global shipping [https://www.imo.org/en/mediacentre/pressbriefings/pages/imo-approves-netzero-regulations.aspx]
- 4. Monitoring Flare Performance and Opacity [https://shipandshore.com/monitoring-flare-performance-and-opacity/]
- 5. Using Spectroscopy to Monitor and Preserve the ... [https://www.oceanoptics.com/blog/spectroscopy-for-environmental-monitoring/]
- 6. New sensor measures ship's particle emissions in real time [https://swzmaritime.nl/news/2025/05/12/new-sensor-measures-ships-particle-emissions-in-real-time/]
- 7. Remote sensing monitoring system for ship exhaust using ... [https://www.sciencedirect.com/science/article/abs/pii/S0263224125003239]
- 8. Effects of SO and 2 emission reductions on NOx . PM mass... 2 5 [https://pubmed.ncbi.nlm.nih.gov/15828668/]
- 9. Emission quantification of NO2 and SO2 from marine vessels [https://pmc.ncbi.nlm.nih.gov/articles/PMC12420823/]
- 10. Real time monitoring of regulated and non- ... [https://www.horizon-europe.gouv.fr/real-time-monitoring-regulated-and-non-regulated-emissions-all-types-vessels-and-other-port-40805]
- 11. PC2000 Fiber Optic Spectrometer -- Specifications [http://www.coseti.org/specspec.htm]
- 12. Rugged Accelerometers for Marine and Offshore Applications [https://www.oceansciencetechnology.com/suppliers/rugged-accelerometers/]
- 13. Real-time emission prediction for ship engine using ... [https://www.nature.com/articles/s41598-025-24393-x]
- 14. Methods for monitoring carbon emissions from ships [https://www.sciencedirect.com/science/article/abs/pii/S2211464525000582]
- 15. Modular Spectrometers Insightful Analysis: Trends, ... [https://www.archivemarketresearch.com/reports/modular-spectrometers-194281]
- 16. Six-year DOAS observations reveal post-2020 rebound of ship ... [https://acp.copernicus.org/articles/25/13849/2025/acp-25-13849-2025.html]
- 17. FTIR-DOAS Technology - Opsis AB [https://www.opsis.se/en/knowledge-base/monitoring-methods/ftir-doas-technology/]
- 18. MAX-DOAS observations of ship emissions in the North Sea [https://www.sciencedirect.com/science/article/abs/pii/S0025326X24007380]
- 19. Real-Time Monitoring Utilizing Fiber-Optic Sensors [https://www.mdpi.com/1424-8220/24/14/4601]
- 20. The DOAS technique and instruments [https://frm4doas.aeronomie.be/index.php/guidelines-fileformats?view=article&id=10:doas&catid=2]
- 21. MATRIX-F II FT-NIR Spectrometer [https://www.bruker.com/en/products-and-solutions/infrared-and-raman/ft-nir-spectrometers/matrix-f-ft-nir-spectrometer.html]
- 22. EEXI and CII: 2025 Guide to Shipping's Sustainability ... [https://searoutes.com/2025/10/21/eexi-cii-shipping-sustainability-regulations-2026-2028/]
- 23. Fiber Optical Spectrometer 2025 Trends and Forecasts 2033 [https://www.archivemarketresearch.com/reports/fiber-optical-spectrometer-185584]
- 24. Fiber Optical Spectrometer Market Size, Share & Trends ... [https://www.businessresearchinsights.com/market-reports/fiber-optical-spectrometer-market-101140]
- 25. NOx, SO2 & NH3 sensor, MES 1001 [https://www.danfoss.com/en/products/ixa/emission-monitoring/marine-emission-sensors/nox-so2-nh3-sensor-mes-1001/]
- 26. Emission monitoring - Danfoss IXA [https://www.danfoss.com/en/about-danfoss/our-businesses/emission-monitoring-danfoss-ixa/]
- 27. Emission monitoring for marine [https://www.danfoss.com/en/markets/marine-and-offshore/ixa/emission-monitoring-for-marine/]
- 28. Danfoss IXA: Frontpage - New [https://danfoss-ixa.com/]
- 29. Detection and analysis of ship emissions using single ... [https://www.sciencedirect.com/science/article/pii/S2590162124000698]
- 30. Technical Note: Choosing the Right Optical Fiber for Your ... [https://artphotonics.com/technical-note-choosing-the-right-optical-fiber-for-your-process-spectrometer/]
- 31. State-of-the-art carbon metering: Continuous emission ... [https://www.sciencedirect.com/science/article/pii/S2405844025006887]
- 32. Top 8 Fleet Management Industry Trends for 2025 [https://intelliarts.com/blog/fleet-management-technology-trends/]
- 33. Lytx Introduces Lytx+ with Geotab Integration: A Video-Powered All-in-One Fleet Management Solution [https://www.lytx.com/news-events/press-release/2025/lytx-introduces-lytx-plus-with-geotab-integration]
- 34. Common Challenges of Marine Coatings for Corrosion ... [https://teslanano.com/common-challenges-of-marine-coatings-for-corrosion-protection/]
- 35. What Is Ship Corrosion? Guide To Prevent Marine Corrosion [https://evac.com/blog/what-is-ship-corrosion-a-beginners-guide-to-understanding-corrosion-and-its-impact/]
- 36. Fully automated fiber-based optical spectroscopy system ... [https://pmc.ncbi.nlm.nih.gov/articles/PMC8357326/]
- 37. An Improved Calibration Method to Determine the Strain ... [https://www.mdpi.com/2304-6732/8/10/429]
- 38. Towards Predictive Maintenance in the Maritime Industry [https://www.mdpi.com/2077-1312/13/3/425]
- 39. PeakForest: a multi-platform digital infrastructure for interoperable... [https://link.springer.com/article/10.1007/s11306-022-01899-3]
- 40. FAQ - Monitoring, reporting and verification of maritime ... [https://climate.ec.europa.eu/eu-action/transport-decarbonisation/reducing-emissions-shipping-sector/faq-monitoring-reporting-and-verification-maritime-transport-emissions_en]
- 41. Data Collection System ( IMO ) DCS [https://www.imo.org/en/ourwork/environment/pages/data-collection-system.aspx]
- 42. MRV – Monitoring, Reporting and Verification (EU and UK) [https://www.dnv.com/maritime/insights/topics/mrv/]
- 43. IMO DCS [https://www.dnv.com/maritime/insights/topics/dcs/]
- 44. — Sustainable IMO DCS Ships [https://www.sustainable-ships.org/rules-regulations/imo-dcs]
- 45. 25/2025 Submission deadlines for 2025 emissions data ... [https://www.lr.org/en/knowledge/class-news/25-25/]
- 46. Optical Fiber Spectrometers: Revolutionizing Mid-Infrared ... [https://nlir.com/optical-fiber-spectrometers-revolutionizing-mid-infrared-spectroscopy/]
- 47. Site visit requirements under EU MRV and FuelEU Maritime [https://www.dnv.com/news/2025/site-visit-requirements-under-eu-mrv-and-fueleu-maritime/]
- 48. DNV launches real-time emissions data verification solution ... [https://www.dnv.com/news/2023/dnv-launches-real-time-emissions-data-verification-solution-for-trusted-collaboration-across-maritime-value-chain-242396/]
- 49. Surveillance practice and automatic data algorithm of ... [https://www.sciencedirect.com/science/article/abs/pii/S0959652623013835]
- 50. Investigation of sniffer technique on remote measurement of ... [https://pmc.ncbi.nlm.nih.gov/articles/PMC9481039/]
- 51. Marine Engine Continuous Emissions Monitoring System [https://mainemaritime.edu/metel/metel/projects/marine-engine-continuous-emissions-monitoring-system/]
- 52. Ship-borne FTIR measurements of CO and O3 ... [https://acp.copernicus.org/articles/12/815/2012/]
- 53. Broadband spectroscopic sensor for real-time monitoring of ... [https://opg.optica.org/abstract.cfm?uri=ao-46-13-2503]
- 54. An improved method for optimizing detection bands of ... [https://www.sciencedirect.com/science/article/abs/pii/S1309104222001623]
- 55. Optical fiber sensor provides simple and sensitive ... [https://www.optica.org/about/newsroom/news_releases/2025/optical_fiber_sensor_provides_simple_and_sensitive_detection_of_arsenic_in_drinking_water/]
- 56. Deep learning-enhanced ultra-sensitive fiber optic SPR ... [https://www.sciencedirect.com/science/article/abs/pii/S1350449525004219]
- 57. Fiber Optic Sensors Market Size 2025-2029 [https://www.technavio.com/report/fiber-optic-sensors-market-industry-analysis]
- 58. An Introduction to a Spectrometer : Fiber Bundles - B&W Tek Optic [https://bwtek.com/an-introduction-to-a-spectrometer-fiber-optic-bundles/]
- 59. (PDF) Optical measurements of ocean colour with the... - Academia.edu [https://www.academia.edu/1874035/Optical_measurements_of_ocean_colour_with_the_field_based_High_Resolution_Fiber_Optic_Spectrometer_HR4000CG_for_remote_sensing_applications]
- 60. Transmittance Measurement Scheme... Fiber Optic Spectrometer [https://www.optosky.net/fiber-optic-spectrometer-transmittance-measurement-scheme.html]