FTIR Spectroscopy in Minced Beef Adulteration Detection: A Comprehensive Guide for Food Safety Researchers
This article provides a systematic overview of Fourier Transform Infrared (FTIR) spectroscopy for detecting adulterants in minced beef, a critical concern for food authenticity and public health.
FTIR Spectroscopy in Minced Beef Adulteration Detection: A Comprehensive Guide for Food Safety Researchers
Abstract
This article provides a systematic overview of Fourier Transform Infrared (FTIR) spectroscopy for detecting adulterants in minced beef, a critical concern for food authenticity and public health. Aimed at researchers and analytical professionals, it explores the foundational principles of FTIR as a vibrational spectroscopy technique and its specific application to complex meat matrices. The content details methodological workflows from sample preparation to spectral acquisition, addresses common analytical challenges and optimization strategies for enhancing sensitivity and specificity, and critically validates the technique against other analytical methods. By synthesizing current research, this guide serves as a comprehensive resource for developing robust, rapid, and non-destructive screening protocols in food fraud prevention and quality control laboratories.
Understanding FTIR Spectroscopy: Core Principles for Beef Adulteration Analysis
Application Notes
Thesis Context: FTIR Spectroscopy for Minced Beef Adulteration Detection
Within the framework of thesis research focused on detecting adulterants in minced beef, Fourier Transform Infrared (FTIR) spectroscopy serves as a rapid, non-destructive analytical tool. It identifies molecular "fingerprints" by measuring the absorption of infrared light, which corresponds to specific vibrational modes of chemical bonds. Adulterants such as soy protein, wheat gluten, or offal introduce distinct spectral signatures, allowing for their detection against the background of pure beef spectra. The technique's speed and minimal sample preparation make it ideal for screening purposes in food safety and quality control.
Key Spectral Regions and Molecular Assignments for Beef Adulteration
The mid-infrared region (4000–400 cm⁻¹) is most informative. Critical spectral regions for analyzing minced beef and common adulterants include:
- Amide Region (1800–1500 cm⁻¹): Dominated by protein absorptions (Amide I ~1650 cm⁻¹, Amide II ~1550 cm⁻¹). Changes in peak shape and intensity can indicate substitution with non-meat proteins.
- Fatty Acid Region (3000–2800 cm⁻¹, ~1745 cm⁻¹): C-H stretching bands (~2925, 2854 cm⁻¹) and the ester C=O stretch of triglycerides (~1745 cm⁻¹) are key markers for fat content. Adulteration with cheaper fats alters this region.
- Fingerprint Region (1500–600 cm⁻¹): Contains complex, overlapping bands from various biomolecules. Multivariate analysis is often required to identify subtle changes introduced by adulterants like starches or connective tissue.
Table 1: Characteristic FTIR Absorption Bands for Minced Beef Constituents and Common Adulterants
| Wavenumber (cm⁻¹) | Assignment | Molecular Origin | Relevance to Adulteration |
|---|---|---|---|
| ~3280 | N-H Stretch | Proteins (Amide A) | Protein content marker; altered by non-meat protein addition. |
| 2925, 2854 | C-H Stretch (asym/sym) | Lipids (CH₂ groups) | Primary lipid markers; intensity correlates with fat content. |
| ~1745 | C=O Stretch | Lipids (triglyceride esters) | Specific fat absorption. |
| ~1650 | C=O Stretch (Amide I) | Proteins (α-helix, β-sheet) | Secondary protein structure; sensitive to protein type/source. |
| ~1550 | N-H Bend, C-N Stretch (Amide II) | Proteins | Confirms protein presence and interacts with Amide I for analysis. |
| ~1450 | C-H Bend (asym) | Lipids, Proteins | Methylene deformation. |
| ~1395 | C-H Bend (sym) | Lipids, Proteins | Methyl deformation. |
| ~1240 | P=O Stretch (asym) | Phospholipids, DNA | Connective tissue or offal indicator. |
| 1150-1000 | C-O Stretch, C-C Stretch | Carbohydrates (Starch) | Strong bands indicate plant-based adulterants (e.g., breadcrumb, soy). |
Table 2: Typical FTIR Instrument Parameters for Food Adulteration Studies
| Parameter | Common Setting | Rationale |
|---|---|---|
| Spectral Range | 4000 - 400 cm⁻¹ | Captures full mid-IR fingerprint. |
| Resolution | 4 - 8 cm⁻¹ | Optimal balance between spectral detail and signal-to-noise for complex biomaterials. |
| Number of Scans | 32 - 128 | Adequate signal averaging for homogeneous pastes/powders. |
| Apodization Function | Happ-Genzel or Blackman-Harris | Reduces spectral artifacts from interferogram truncation. |
| Detector | DTGS (Deuterated Triglycine Sulfate) | Standard for room-temperature operation, robust. |
| Beam Splitter | KBr (Potassium Bromide) | Standard for mid-IR range. |
Experimental Protocols
Protocol 1: Sample Preparation and Data Acquisition for Minced Beef
Title: ATR-FTIR Analysis of Minced Beef Homogenate Purpose: To acquire high-quality, reproducible FTIR spectra from minced beef samples for subsequent chemometric analysis. Materials: See "The Scientist's Toolkit" below. Procedure:
- Homogenization: Weigh 5.0 g of minced beef sample. Homogenize with 10 mL of deionized water using a laboratory blender for 2 minutes at high speed to create a uniform slurry.
- Presentation: Place a small aliquot (~50 µL) of the homogenate onto the crystal surface of the Attenuated Total Reflectance (ATR) accessory.
- Drying (Optional): Gently dry the sample under a stream of nitrogen gas to remove excess water, which has a strong, broad IR absorption that can obscure the region of interest.
- Acquisition: a. Clean the ATR crystal with ethanol and lint-free tissue. Acquire a background spectrum (ambient air). b. Apply sample to cover the crystal completely. Ensure good, uniform contact. c. Acquire the sample spectrum with the following instrument settings: Spectral Range: 4000–600 cm⁻¹; Resolution: 4 cm⁻¹; Number of Scans: 64; Apodization: Happ-Genzel.
- Replication: Clean the crystal thoroughly between replicates. Acquire a minimum of three spectral replicates per sample from independent homogenate aliquots.
Protocol 2: Spectral Pre-processing for Chemometric Analysis
Title: Spectral Pre-processing Workflow for Adulteration Models Purpose: To prepare raw spectra for multivariate calibration by removing physical artifacts and enhancing chemical information. Procedure:
- Atmospheric Compensation: Subtract a pre-recorded water vapor spectrum or use the instrument's automated compensation function to minimize rotational vapor lines.
- ATR Correction: Apply a built-in ATR correction algorithm (e.g., using refractive index of sample ~1.5) to compensate for wavelength-dependent penetration depth.
- Smoothing: Apply a Savitzky-Golay filter (e.g., 2nd polynomial, 9–13 points) to reduce high-frequency noise.
- Baseline Correction: Use an automated concave rubberband method (e.g., 64 points) or a polynomial fit to remove scattering effects and sloping baselines.
- Vector Normalization: Normalize the entire spectrum to its Euclidean norm (unit vector length) to correct for variations in total signal intensity due to path length or concentration differences.
- Spectral Derivative: Apply a 2nd derivative (Savitzky-Golay, 2nd polynomial, 9 points) to resolve overlapping bands and enhance subtle spectral features. This is critical for subsequent Principal Component Analysis (PCA) or Partial Least Squares Regression (PLS-R).
Diagrams
Title: FTIR Spectral Pre-processing Workflow
Title: FTIR-based Adulteration Research Workflow
The Scientist's Toolkit: Essential Research Reagents & Materials
Table 3: Key Materials for FTIR-based Minced Beef Adulteration Research
| Item | Function & Relevance |
|---|---|
| FTIR Spectrometer (with ATR accessory) | Core instrument. ATR enables direct analysis of solid/liquid samples with minimal preparation. |
| High-Purity Solvents (e.g., HPLC-grade Ethanol, Acetone) | For cleaning the ATR crystal between samples to prevent cross-contamination. |
| Reference Materials (Pure Beef Protein, Fat Extracts, Adulterants: Soy, Wheat, PB) | Essential for building calibration models and validating method specificity. |
| Chemometric Software (e.g., Unscrambler, SIMCA, PLS_Toolbox) | For performing multivariate data analysis (PCA, PLS-R) to extract meaningful patterns from complex spectral data. |
| Nitrogen Gas (Dry) | For gently drying aqueous samples on the ATR crystal to reduce strong water vapor interference in spectra. |
| Laboratory Blender/Homogenizer | Creates a uniform paste from meat samples, ensuring spectral reproducibility. |
| Microbalance (0.1 mg precision) | Required for accurate weighing of samples and adulterants for calibration model preparation. |
| Lint-Free Wipes/Kimwipes | For cleaning the ATR crystal without leaving fibers that could generate spectral artifacts. |
Why FTIR for Food Adulteration? Advantages of Speed, Non-Destructiveness, and Green Chemistry.
Within the broader thesis investigating Fourier transform infrared (FTIR) spectroscopy for minced beef adulteration, this document details the core advantages and applications of the technique. The focus is on its rapid, non-destructive, and environmentally benign nature, aligning with Green Chemistry principles, which make it superior to traditional, destructive, and solvent-intensive methods for food fraud detection.
Key Advantages of FTIR for Adulteration Detection
Table 1: Comparison of FTIR with Traditional Methods for Adulteration Detection
| Feature | FTIR Spectroscopy | Traditional Methods (e.g., HPLC, PCR, ELISA) |
|---|---|---|
| Speed | 30 seconds to 5 minutes per sample. | Hours to days, including extensive sample preparation. |
| Sample Preparation | Minimal; often requires only homogenization or direct analysis (ATR). | Extensive: extraction, purification, derivatization. |
| Destructiveness | Non-destructive; sample can be retained for other tests. | Destructive; sample is consumed or altered. |
| Solvent Use | Little to none (especially with ATR-FTIR). | High volumes of organic solvents often required. |
| Analytical Throughput | High; suitable for screening large batches. | Low to moderate. |
| Operator Skill | Moderate; training focused on instrumentation & data analysis. | High; requires specialized biochemical expertise. |
| Cost per Analysis | Low after initial capital investment. | High (reagents, consumables, labor). |
Application Notes for Minced Beef Adulteration
Detection of Plant Protein Adulterants
FTIR, particularly Attenuated Total Reflectance (ATR) mode, rapidly identifies adulteration with cheaper plant proteins (soy, pea, wheat gluten). The spectral regions of 1700-1600 cm⁻¹ (Amide I) and 1600-1500 cm⁻¹ (Amide II) show distinct, quantifiable shifts and intensity changes when plant proteins are present. Chemometrics (e.g., PLS regression) can quantify adulteration levels as low as 1-5% w/w.
Detection of Non-Meat Animal Proteins
Adulteration with offal (liver, heart) or other species (pork, chicken) is detectable due to subtle differences in lipid composition (C=O stretch ~1745 cm⁻¹) and protein profiles. Spectral libraries and multivariate classification models (e.g., PCA-LDA) achieve high differentiation accuracy.
Quantification of Fat Content and Added Water
The strong lipid absorption bands (~2925, 2854, 1745 cm⁻¹) and the broad O-H stretching band (~3300 cm⁻¹) from water allow for rapid, simultaneous estimation of fat and moisture content, key parameters for economic adulteration.
Experimental Protocols
Protocol 1: ATR-FTIR for Screening Minced Beef for Plant Protein Adulteration
Objective: To rapidly screen and quantify the level of soy protein adulteration in minced beef.
The Scientist's Toolkit:
| Item | Function |
|---|---|
| FTIR Spectrometer with ATR accessory | Core instrument. Diamond ATR crystal is preferred for durability and contact. |
| Spectral Library of Pure Components | Reference spectra of pure minced beef, soy protein, pea protein, etc., for comparison. |
| Chemometrics Software (e.g., Unscrambler, SIMCA, PLS_Toolbox) | For multivariate calibration (PLS) and classification model development. |
| Hydraulic Press or Flat-Platen ATR Clamp | To ensure consistent, homogeneous contact between sample and ATR crystal. |
| High-Purity Solvents (e.g., ethanol, acetone) | For cleaning the ATR crystal between samples to prevent cross-contamination. |
Procedure:
- Sample Preparation:
- Prepare calibration samples by homogenizing pure minced beef with known concentrations (e.g., 0, 1, 2, 5, 10, 20% w/w) of soy protein isolate.
- Ensure particle size is consistent using a fine grinder.
Instrument Setup:
- Clean the ATR crystal thoroughly with solvent and a lint-free cloth. Acquire a background spectrum.
- Set parameters: Resolution = 4-8 cm⁻¹, Scan range = 4000-600 cm⁻¹, Scans = 32-64.
Data Acquisition:
- Place a representative portion of the minced beef sample onto the ATR crystal.
- Use the clamp to apply consistent pressure to form a uniform film.
- Acquire the infrared spectrum. Clean the crystal between each sample.
Data Analysis:
- Pre-process spectra: Apply vector normalization, baseline correction, and 2nd derivative (Savitzky-Golay) to enhance spectral features.
- Develop a Partial Least Squares (PLS) regression model using the calibration set spectra and known adulterant concentrations.
- Validate the model using an independent set of samples. The model can then predict adulteration levels in unknown samples.
FTIR Adulteration Analysis Workflow
Protocol 2: Non-Destructive Monitoring of Multiple Adulterants
Objective: To use a single FTIR measurement to assess minced beef for potential fat/water content alteration and foreign protein presence.
Procedure:
- Build a Comprehensive Model:
- Create a training set encompassing pure beef and samples adulterated with various targets (added water, vegetable oil, soy, pork, offal) at different levels.
- Collect ATR-FTIR spectra for all training samples.
Multivariate Analysis:
- Use Principal Component Analysis (PCA) to observe natural clustering of samples based on their spectral fingerprints.
- Develop classification models (e.g., Soft Independent Modelling of Class Analogy - SIMCA) for each authentic/adulterated class.
- Develop PLS models for key quantitative parameters (total fat, total water, specific adulterant %).
Screening Unknowns:
- Acquire spectrum of the unknown sample.
- The model first classifies the sample (e.g., "consistent with pure beef" or "consistent with soy-adulterated").
- Subsequently, relevant quantitative models provide estimated concentrations.
FTIR Aligns with Green Chemistry
This document serves as detailed Application Notes and Protocols within a broader doctoral thesis investigating the application of Fourier Transform Infrared (FTIR) spectroscopy coupled with chemometrics for the rapid, non-destructive detection and quantification of adulterants in minced beef. The thesis posits that FTIR, with its molecular fingerprinting capability, is a superior screening tool compared to traditional, often destructive, methods like PCR or HPLC, for addressing economically motivated adulteration (EMA) in meat products.
Common Adulterants: Prevalence and Quantitative Data
Minced beef is susceptible to adulteration with cheaper substances to increase profit. The following table summarizes the primary adulterant classes, their motivations, and reported prevalence ranges from recent studies (2020-2024).
Table 1: Common Adulterants in Minced Beef: Types, Motivations, and Prevalence
| Adulterant Class | Specific Adulterants | Primary Motivation | Typical Reported Concentration Range in Adulterated Samples | Key Detecting Spectral Regions (FTIR) |
|---|---|---|---|---|
| Other Meats | Pork, Chicken, Turkey, Horse | Cost reduction; undeclared species | 1% - 50% (w/w) | Amide I & II (1700-1500 cm⁻¹); Lipid region (3000-2800, 1800-1700 cm⁻¹) |
| Offal | Heart, Liver, Kidney, Lung | Utilization of by-products; cost reduction | 5% - 30% (w/w) | Complex protein/lipid profiles; subtle shifts in Amide bands |
| Plant Proteins | Soy, Pea, Wheat Gluten, Lentil | Cost reduction; protein boosting | 1% - 20% (w/w) | Carbohydrate bands (1200-900 cm⁻¹); distinct Amide I profile |
| Water / Ice | Added water, Ice chips | Weight increase | 5% - 30% (v/w) | Strong O-H stretching (~3400 cm⁻¹) and bending (~1640 cm⁻¹) |
| Non-Meat Animal Proteins | Milk powder, Whey, Egg white | Protein boosting; binder | 1% - 10% (w/w) | Lactose bands (for milk); specific protein secondary structure features |
| Fillers & Extenders | Starch, Cellulose, Carrageenan | Bulk increase; texture modification | 0.5% - 5% (w/w) | Strong C-O and C-O-C bands (1200-1000 cm⁻¹) |
Experimental Protocols for FTIR-Based Detection
Protocol: Sample Preparation for FTIR Analysis of Minced Beef Adulterants
Objective: To prepare homogeneous, reproducible samples for FTIR spectroscopic analysis. Materials: Minced beef (control), adulterant (e.g., pork mince, soy protein isolate, powdered liver), analytical balance, mortar and pestle or cryogenic grinder, liquid nitrogen, hydraulic press, diamond ATR crystal. Procedure:
- Formulation: Precisely weigh control beef and adulterant to create calibration blends (e.g., 0%, 1%, 5%, 10%, 20%, 50% adulteration by weight).
- Homogenization: For solid-solid mixtures (meat/meat, meat/plant protein), co-grind using a cryogenic grinder with liquid nitrogen to achieve a particle size < 100 µm.
- Hydration Control: For water adulteration studies, add ultrapure water directly to minced beef and mix thoroughly. Allow equilibration for 10 minutes.
- Presentation: Place a representative portion of the homogenized sample onto the ATR crystal. Use a hydraulic press to ensure consistent, firm contact.
- Cleaning: Clean the ATR crystal with ethanol (70%) and lint-free tissue between samples. Perform a background scan after cleaning.
Protocol: FTIR Spectral Acquisition and Pre-processing
Objective: To collect high-quality, reproducible FTIR spectra suitable for chemometric analysis. Instrument Setup: FTIR Spectrometer with DTGS detector and ATR accessory (diamond crystal). Parameters:
- Spectral Range: 4000 - 600 cm⁻¹
- Resolution: 4 cm⁻¹
- Scans per Spectrum: 64 (background: 64)
- Apodization: Happ-Genzel Procedure:
- Acquire background spectrum of clean ATR crystal.
- Place prepared sample on crystal, apply consistent pressure via clamp.
- Acquire sample spectrum.
- Repeat in triplicate for each calibration blend and unknown sample.
- Pre-processing (Critical for Chemometrics): Export spectra and apply the following sequence using software (e.g., Unscrambler, MATLAB): a. ATR Correction (if not automated): Apply correction for depth of penetration variation with wavelength. b. Vector Normalization or Standard Normal Variate (SNV): To reduce scattering effects. c. Savitzky-Golay Derivative (2nd polynomial, 9-15 points): To enhance spectral resolution and remove baseline offsets.
Protocol: Development of PLS-R Calibration Models for Quantification
Objective: To build a predictive model linking spectral data to adulterant concentration. Chemometric Software: PLS_Toolbox, Unscrambler, or open-source (R, Python with scikit-learn). Procedure:
- Dataset Construction: Assemble a matrix (X) of pre-processed spectra (rows=samples, columns=wavenumbers) and a vector (Y) of known adulterant concentrations.
- Data Splitting: Randomly split data into calibration (≈70%) and independent validation (≈30%) sets. Use Kennard-Stone algorithm for structured splitting.
- Model Calibration: Apply Partial Least Squares Regression (PLS-R) to the calibration set. Use leave-one-out cross-validation to determine the optimal number of latent variables (LVs) by minimizing the Root Mean Square Error of Cross-Validation (RMSECV).
- Model Validation: Apply the optimized model to the independent validation set. Calculate key figures of merit:
- R² (coefficient of determination) for calibration and prediction.
- RMSE (Root Mean Square Error) for calibration (RMSEC) and prediction (RMSEP).
- RPD (Ratio of Performance to Deviation): RPD > 2.5 indicates good predictive ability.
- Discrimination Analysis (for Speciation): Use Principal Component Analysis (PCA) or Linear Discriminant Analysis (LDA) on spectral data to visualize clustering of pure beef and different adulterant classes.
Visualizations
Title: FTIR Workflow for Beef Adulterant Analysis
Title: PLS-R Modeling from Spectral Data
The Scientist's Toolkit: Key Research Reagent Solutions
Table 2: Essential Materials and Reagents for FTIR Adulteration Research
| Item | Function / Purpose in Research | Specification Notes |
|---|---|---|
| FTIR Spectrometer with ATR | Core instrument for molecular fingerprinting. Attenuated Total Reflectance (ATR) allows direct analysis of solids/liquids. | Diamond ATR crystal is essential for durability. DTGS detector for routine use. |
| Cryogenic Mill | Homogenizes meat-adulterant mixtures to a uniform micron-scale powder, ensuring spectral reproducibility. | Must be capable of using liquid nitrogen for cooling to prevent analyte degradation and achieve fine texture. |
| Chemometric Software | For multivariate data analysis: Pre-processing, PCA, PLS-R model development, and validation. | Commercial (Unscrambler, PLS_Toolbox) or open-source (R with pls, Python with scikit-learn/pyChemometrics). |
| Certified Reference Materials | Pure, authenticated samples of beef, pork, chicken, soy protein, etc., for creating accurate calibration models. | Sourced from national metrology institutes or reputable commercial suppliers. Critical for model accuracy. |
| Hydraulic ATR Clamp | Applies consistent, high pressure to sample on ATR crystal, ensuring optimal and reproducible infrared contact. | Reduces spectral noise and variability due to contact issues. |
| Spectroscopic Grade Solvents | For cleaning the ATR crystal between samples to prevent cross-contamination. | Ethanol (70-99%), HPLC-grade water. Lint-free wipes. |
| Liquid Nitrogen | Cryogen for sample grinding and, optionally, for cooling MCT detectors in advanced FTIR systems. | Prevents thermal degradation of samples during grinding and improves detector signal-to-noise ratio. |
Within the context of minced beef adulteration research, Fourier Transform Infrared (FTIR) spectroscopy serves as a rapid, non-destructive tool for detecting biomolecular signatures indicative of contamination or substitution with cheaper meats (e.g., pork, horse) or non-meat fillers (e.g., soy, wheat). Each adulterant introduces distinct changes to the spectral profile based on its unique biochemical composition of lipids, proteins, and carbohydrates. Identifying these key signatures allows for the development of robust, quantitative adulteration screening methods.
Key Biomolecular FTIR Signatures and Quantitative Data
The primary absorption bands for major biomolecules in meat and common adulterants are summarized below. Wavenumber ranges and band assignments are critical for spectral interpretation.
Table 1: Key FTIR Absorption Bands for Biomolecules in Meat Adulteration Analysis
| Biomolecule Class | Key Wavenumber Range (cm⁻¹) | Vibration Mode & Band Assignment | Diagnostic Significance for Adulteration |
|---|---|---|---|
| Proteins | ~3280 | N-H stretch, Amide A | Total protein content indicator. |
| ~3070 | N-H stretch, Amide B | Secondary to Amide I/II. | |
| 1700-1600 (≈1650) | C=O stretch, Amide I | Secondary structure (α-helix/β-sheet) sensitive. Primary protein band. | |
| 1600-1500 (≈1540) | N-H bend / C-N stretch, Amide II | Strong protein marker. Intensity ratio to lipids can shift with adulteration. | |
| ~1450, ~1400 | CH₂/CH₃ deformations, Amide III region | Contributions from proteins and lipids. | |
| Lipids | ~3010 | =C-H stretch (cis double bonds) | Unsaturated fat content. Can vary by meat source. |
| 3000-2800 (≈2920, 2850) | CH₂ asymmetric & symmetric stretches | Major lipid marker. High in adipose tissue. | |
| ~1745 | Ester C=O stretch (triglycerides) | Specific to fats/oils. Strong marker for fat content and plant oils. | |
| 1470-1400 (≈1465, 1417) | CH₂/CH₃ bending | Lipid contributions. | |
| ~1230, ~1160 | C-O ester asymmetric & symmetric stretches | Phospholipid and triglyceride markers. | |
| Carbohydrates | 1200-950 (≈1150, 1080, 1020) | C-O, C-C, C-O-H stretches & bending | Broad, complex bands. Strong signature for plant-based adulterants (e.g., starches, cellulose). |
Table 2: Example Spectral Ratio Metrics for Detecting Adulteration in Minced Beef (Hypothetical Data from Literature)
| Spectral Ratio (cm⁻¹) | Pure Beef Mean Ratio (±SD) | 20% Pork Adulteration Mean Ratio (±SD) | 10% Wheat Filler Mean Ratio (±SD) | Primary Interpretation |
|---|---|---|---|---|
| Amide I / CH₂ stretch (1650/2920) | 1.82 (±0.15) | 1.45 (±0.12)* | 1.90 (±0.18) | Decrease indicates higher relative lipid (pork fat). |
| CH₂ / Amide II (2920/1540) | 0.55 (±0.05) | 0.72 (±0.06)* | 0.58 (±0.05) | Increase indicates higher relative lipid content. |
| Carbohydrate Region / Amide II (1050/1540) | 0.15 (±0.03) | 0.18 (±0.04) | 0.41 (±0.07)* | Significant increase indicates non-meat plant material. |
*Statistically significant difference (p < 0.05) from pure beef control.
Experimental Protocol: FTIR Analysis for Minced Beef Adulteration Screening
Protocol Title: Attenuated Total Reflectance (ATR)-FTIR Spectral Acquisition and Pre-processing for Biomolecular Signature Analysis of Minced Meat.
1. Objective: To collect high-quality FTIR spectra from minced meat samples for the identification of lipid, protein, and carbohydrate signatures to detect adulteration.
2. Materials & Reagent Solutions:
- Research Reagent Solutions & Essential Materials:
- FTIR Spectrometer: Equipped with a temperature-stabilized DTGS or MCT detector and an ATR accessory (diamond or ZnSe crystal).
- ATR Crystal Cleaning Kit: Includes non-abrasive wipes, HPLC-grade water, ethanol (≥99%), and acetone.
- Hydraulic Press or Flat-Platen Press: For creating uniform, smooth sample surfaces against the ATR crystal.
- Laboratory Blender or Grinder: For homogenizing meat samples to a consistent particle size (< 2 mm).
- Reference Materials: Pure minced beef (verified origin), potential adulterants (e.g., minced pork, chicken, textured vegetable protein, wheat flour).
- Spatulas & Single-Use Sampling Tools: To prevent cross-contamination.
- Background Environment: Purged with dry, CO₂-scrubbed air or nitrogen to reduce spectral interference from water vapor and CO₂.
3. Procedure: 1. Sample Preparation: Homogenize control (pure beef) and test samples thoroughly. For solid samples, use a pre-chilled grinder. Prepare adulterated blends gravimetrically (e.g., 95% beef / 5% pork w/w). 2. Instrument Preparation: Clean the ATR crystal sequentially with acetone, ethanol, and water, drying thoroughly between solvents. Perform a background scan with a clean crystal under the same purge conditions to be used for samples. 3. Spectral Acquisition: * Place a representative subsample (~1-2g) on the crystal. * Use the hydraulic press to apply consistent, firm pressure to ensure good optical contact. * Acquire spectra over the range 4000-600 cm⁻¹ with 4 cm⁻¹ resolution. Co-add 64-128 scans per spectrum to maximize signal-to-noise ratio. * For each sample batch, acquire at least 5-10 technical replicates from different sub-samplings. * Re-clean the crystal and acquire a new background scan every 5-10 samples or if visual contamination is noted. 4. Spectral Pre-processing (Essential for Analysis): * Perform Atmospheric Compensation (or subtract a water vapor reference spectrum). * Apply Vector Normalization (typically Min-Max or Standard Normal Variate - SNV) to correct for path length differences. * Apply a Savitzky-Golay 2nd derivative (e.g., 9-13 point smoothing) to resolve overlapping bands and establish precise peak positions for biomolecular identification.
4. Data Analysis: * Visually inspect pre-processed spectra for key band positions (see Table 1). * Calculate relevant band area or height ratios (see Table 2) for quantitative comparison. * Employ multivariate analysis (e.g., PCA, PLS-DA) using the entire fingerprint region (1800-900 cm⁻¹) to develop classification models.
Visualization Diagrams
Diagram 1: FTIR Workflow for Meat Adulteration Analysis
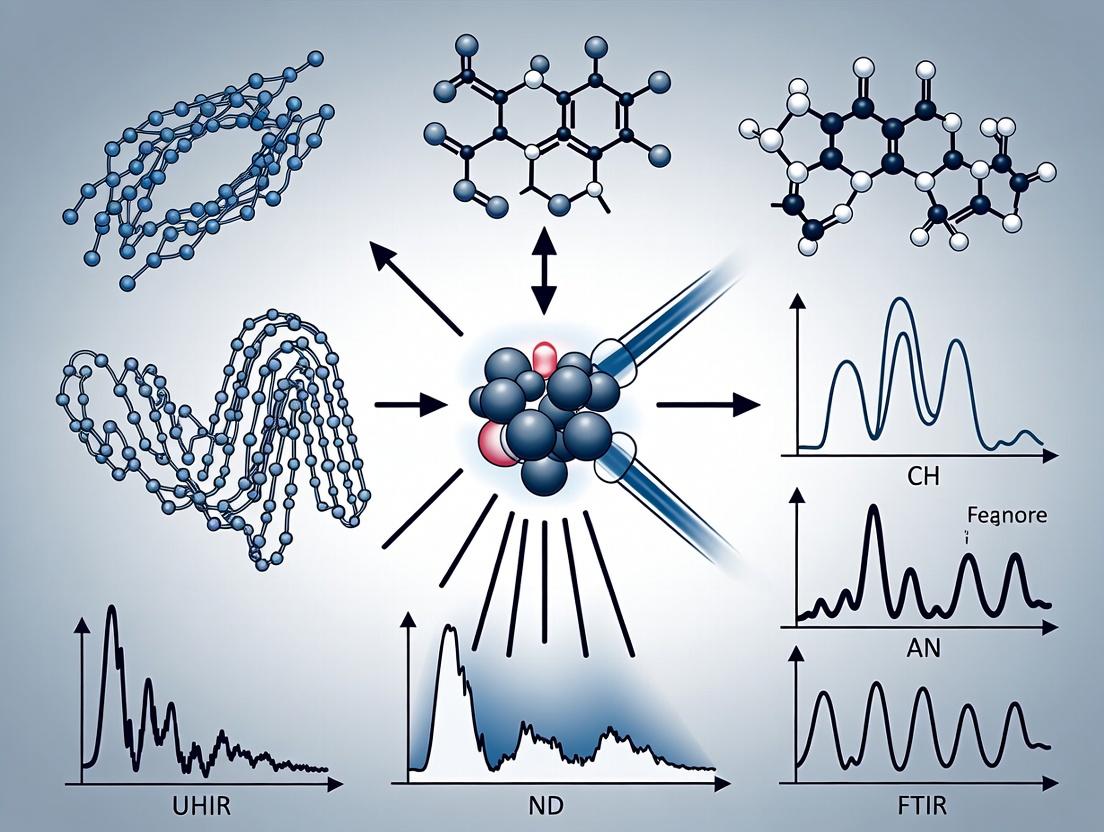
Diagram 2: From IR Light to Biomolecular Signatures
Fourier transform infrared (FTIR) spectroscopy is a powerful analytical technique for detecting adulteration in minced beef, such as the addition of cheaper meats (e.g., pork, poultry) or non-meat proteins. The core challenge lies in the complex biochemical matrix of minced meat, where spectral signatures of primary components (proteins, lipids, water) exhibit significant overlap and interference. This obscures the subtle spectral markers of adulterants, complicating quantitative analysis. This application note details protocols and data interpretation strategies to overcome this challenge, supporting the broader thesis that advanced chemometric techniques applied to FTIR data are essential for robust food authentication.
Application Notes & Key Data
Note 1: Spectral Regions of Interest and Interference The Amide I (~1600-1700 cm⁻¹) and Amide II (~1480-1570 cm⁻¹) bands are critical for protein analysis but are overlapped by water vapor and fat (C=O stretch ~1740 cm⁻¹) absorptions. The lipid region (2800-3000 cm⁻¹) can be masked by adulterants with similar fat profiles.
Note 2: The Role of Chemometrics Multivariate statistical methods are non-negotiable for deconvoluting overlapping spectral data. Partial Least Squares Regression (PLSR) and Support Vector Machines (SVM) are used to correlate spectral data with adulterant concentration, while Principal Component Analysis (PCA) reduces dimensionality to identify clustering patterns.
Table 1: Characteristic FTIR Bands and Common Interferences in Minced Meat Analysis
| Wavenumber (cm⁻¹) | Assignment | Primary Source | Potential Interfering Adulterant Signal |
|---|---|---|---|
| ~3280 | N-H Stretch | Meat Proteins | Water O-H stretch |
| ~2918, ~2850 | C-H Stretch | Lipids | Adulterant lipids (e.g., pork fat) |
| ~1745 | C=O Stretch | Ester (Lipids) | - |
| ~1645 | Amide I | Proteins | Water H-O-H bend |
| ~1545 | Amide II | Proteins | - |
| ~1450 | C-H Bend | Lipids/Proteins | - |
| ~1238 | Amide III | Proteins | - |
| ~1150-1000 | C-O Stretch | Carbohydrates | Fillers (e.g., starch, cellulose) |
Table 2: Performance Metrics of Chemometric Models for Pork Adulteration in Beef (Hypothetical Recent Data)
| Chemometric Model | Spectral Range (cm⁻¹) | Preprocessing | R² (Calibration) | RMSEP (%) | LOD (%) |
|---|---|---|---|---|---|
| PLSR | 1800-1000 | SNV, 2nd Der. | 0.98 | 2.1 | 4.5 |
| SVM (RBF Kernel) | 3000-2800, 1800-1000 | MSC, 1st Der. | 0.99 | 1.5 | 2.8 |
| PCA-LDA | 1500-900 | Vector Norm. | N/A | N/A | 7.0 |
Experimental Protocols
Protocol 1: Sample Preparation & FTIR Spectral Acquisition for Minced Meat Adulteration Studies
Objective: To prepare homogeneous adulterated meat samples and collect high-quality, reproducible FTIR spectra. Materials: Pure minced beef, minced adulterant (e.g., pork, turkey), analytical balance, cryogenic grinder, freeze dryer, hydraulic press, FTIR spectrometer with ATR accessory. Procedure:
- Formulation: Prepare calibration samples by accurately mixing pure beef with the adulterant at 0-50% w/w concentration in 5% increments. Use triplicates for each level.
- Homogenization: Homogenize each mixture using a cryogenic grinder under liquid nitrogen to ensure uniform particle size and distribution.
- Drying: Lyophilize a representative sub-sample (~1g) for 24 hours to remove variable water content, a major source of spectral interference.
- Pelletizing: For transmission analysis, mix 1 mg of dried, ground sample with 300 mg of dried KBr. Press under vacuum at 10 tons for 2 minutes to form a clear pellet.
- ATR Alternative: For ATR analysis, place the fresh or dried homogenate directly onto the crystal. Apply uniform pressure with the anvil.
- Spectral Acquisition:
- Instrument: FTIR Spectrometer with DLATGS detector.
- Resolution: 4 cm⁻¹.
- Scans: 64 co-added scans per spectrum.
- Range: 4000 - 600 cm⁻¹.
- Background: Acquire every 30 minutes.
- Environment: Purge with dry air for 10 min before and during acquisition.
Protocol 2: Spectral Preprocessing & Chemometric Model Development
Objective: To mitigate physical light scattering effects and enhance chemical signals before building predictive models. Procedure:
- Preprocessing Suite: Process raw spectra sequentially using: a. Atmospheric Correction: Subtract water vapor and CO₂ bands. b. Smoothing: Apply Savitzky-Golay filter (window 9, polynomial order 2). c. Baseline Correction: Use asymmetric least squares (ALS). d. Scatter Correction: Apply Standard Normal Variate (SNV) or Multiplicative Scatter Correction (MSC). e. Derivatization: Calculate 2nd derivative using Savitzky-Golay (window 9, polynomial order 2) to resolve overlapping bands.
- Dataset Division: Split preprocessed data into calibration (70%), validation (15%), and test (15%) sets using Kennard-Stone algorithm.
- Model Building:
- PLSR: Use leave-one-out cross-validation on the calibration set to determine the optimal number of latent variables (minimizing RMSEV).
- SVM: Optimize hyperparameters (e.g., cost C, gamma for RBF kernel) via grid search.
- Validation: Apply the finalized model to the independent test set and report R², RMSEP, and slope.
Visualizations
Title: Spectral Overlap & Chemometric Resolution in Adulterated Meat
Title: FTIR Workflow for Adulterant Detection
The Scientist's Toolkit: Key Research Reagent Solutions
Table 3: Essential Materials for FTIR-Based Minced Meat Authentication
| Item | Function/Benefit |
|---|---|
| FTIR Spectrometer with ATR | Enables rapid, non-destructive analysis of minimal sample without extensive preparation. |
| Cryogenic Grinder (with LN₂) | Provides homogeneous sample powder, critical for reproducible spectra, by preventing thawing and fat smearing. |
| Freeze Dryer (Lyophilizer) | Removes water, eliminating the strong O-H bending band interference (~1640 cm⁻¹) that masks the crucial Amide I region. |
| Potassium Bromide (KBr), Infrared Grade | For creating transparent pellets for transmission FTIR, the gold standard for quantitative analysis. |
| Chemometric Software (e.g., PLS_Toolbox, Unscrambler) | Provides advanced algorithms (PLSR, SVM, PCA) essential for deconvoluting overlapping spectral data and building predictive models. |
| Hydraulic Pellet Press | Forms uniform KBr pellets for transmission FTIR, ensuring consistent pathlength. |
| Desiccator Cabinet | Stores dried KBr and sample pellets to prevent moisture absorption before spectral acquisition. |
| Certified Reference Materials (Pure Beef, Pork, etc.) | Essential for creating accurate calibration models and validating method specificity and accuracy. |
Step-by-Step Protocol: FTIR Workflow for Minced Beef Adulteration Screening
Within the context of a thesis investigating the use of Fourier Transform Infrared (FTIR) spectroscopy for detecting adulterants (e.g., offal, plant proteins, cheaper meat species) in minced beef, sample preparation is the critical foundation for generating reliable, reproducible, and high-quality spectral data. Inadequate preparation can introduce artifacts, scatter, and inconsistent path lengths, obscuring the subtle spectral differences indicative of adulteration. This document outlines standardized protocols for homogenization, drying, and the creation of potassium bromide (KBr) pellets, which are essential for transmission FTIR analysis in this research.
Protocols and Application Notes
Homogenization Protocol for Minced Beef Samples
Objective: To create a chemically and physically uniform representative sample from a heterogeneous batch of minced beef, ensuring that a small subsample for analysis accurately reflects the whole.
Detailed Methodology:
- Sample Acquisition: Obtain at least 50g of minced beef from a defined batch. Record source and lot information.
- Initial Processing: If the sample is frozen, thaw it overnight at 4°C in a sealed container to prevent moisture loss.
- Primary Homogenization: Using a pre-chilled commercial blender or food processor, blend the entire 50g sample for 60 seconds at high speed. Pause after 30 seconds to scrape down the sides with a spatula.
- Cryogenic Grinding (For Enhanced Homogeneity): a. Submerge a portion of the homogenized sample in liquid nitrogen for 60 seconds until brittle. b. Transfer the frozen sample to a pre-cooled cryogenic mill or mortar and pestle. c. Grind vigorously until a fine, uniform powder is achieved (typically 1-2 minutes).
- Subsampling: Using a spatula, mix the final homogenate thoroughly and immediately collect triplicate 1.0g ± 0.01g subsamples for subsequent drying.
Drying Protocol (Lyophilization)
Objective: To remove interstitial and bulk water completely, as the strong O-H stretching and bending vibrations of water dominate the mid-IR region and can mask important protein, fat, and adulterant signals.
Detailed Methodology:
- Preparation: Spread each 1g homogenized subsample thinly and evenly in a dedicated, clean lyophilization tray or glass dish.
- Freezing: Flash-freeze the samples by placing the tray in a -80°C freezer for a minimum of 4 hours (or overnight).
- Lyophilization: Transfer the frozen samples to a pre-cooled (-50°C or below) freeze-dryer. Maintain primary drying at a chamber pressure of <0.1 mBar for 24-48 hours.
- Completion Check: The process is complete when the sample appears as a dry, porous cake or powder and shows no sign of moisture upon returning to room temperature and atmospheric pressure.
- Post-Drying Grinding: Gently grind the lyophilized cake into a fine, uniform powder using an agate mortar and pestle. Store in a desiccator containing phosphorus pentoxide (P₂O₅) or silica gel until analysis.
KBr Pellet/Disk Preparation Protocol
Objective: To prepare a transparent disk for transmission FTIR analysis, where the analyte (dried beef powder) is uniformly dispersed in a non-absorbing IR matrix (KBr) at an appropriate concentration.
Detailed Methodology:
- Material Preparation: Dry spectroscopic-grade KBr powder in an oven at 110°C for a minimum of 24 hours. Store in a desiccator.
- Weighing: Precisely weigh 1.0 mg (± 0.01 mg) of the dried, powdered beef sample and 100 mg (± 0.1 mg) of dried KBr powder. This yields a 1% (w/w) sample concentration, which is optimal for FTIR to avoid Beer-Lambert law deviations.
- Mixing and Homogenization: Combine the sample and KBr in an agate mortar. Mix gently initially, then grind and mix thoroughly for 60-90 seconds to achieve a microscopically homogeneous mixture.
- Pellet Die Assembly: Clean the anvils and die body of a 7mm pellet die with methanol and lint-free cloth. Assemble the die with one anvil in place.
- Loading: Transfer the entire mixture into the die barrel, ensuring it is centered and level.
- Pelleting: Place the second anvil on top. Apply a pressure of 8-10 tons (for a 7mm die) using a hydraulic press for 1-2 minutes. For consistent results, use a gauge to standardize pressure and time.
- Disk Handling: Carefully dismantle the die and remove the transparent pellet. Mount it in a pellet holder. Analyze immediately or store in a desiccator to prevent moisture absorption.
Data Presentation
Table 1: Impact of Sample Preparation Steps on FTIR Spectral Quality for Minced Beef Analysis
| Preparation Step | Key Parameter | Optimal Value/Range | Effect on FTIR Spectrum |
|---|---|---|---|
| Homogenization | Particle Size | < 50 µm (post cryo-grinding) | Reduces Mie scattering, improves baseline flatness, ensures spectral reproducibility. |
| Drying (Lyophilization) | Final Moisture Content | < 2% (w/w) | Drastically reduces broad O-H stretch (~3400 cm⁻¹) and H-O-H bend (~1640 cm⁻¹) bands, revealing amide I/II and lipid bands. |
| KBr Pelletization | Sample Concentration | 0.5% - 1.5% (w/w) | Prevents total absorption (saturation) in strong bands (e.g., Amide I). Allows linear Beer-Lambert behavior. |
| KBr Pelletization | Applied Pressure | 8-10 tons (7mm die) | Produces a clear, mechanically stable pellet with uniform path length, minimizing scattering and interference fringes. |
| Overall | Spectral Signal-to-Noise Ratio (SNR) | > 500:1 (at 2000 cm⁻¹) | Direct result of optimal preparation, enabling detection of subtle adulterant spectral features. |
Visualization of Workflows
FTIR Sample Prep Workflow for Minced Beef
The Scientist's Toolkit: Research Reagent Solutions
Table 2: Essential Materials for FTIR Sample Preparation in Food Adulteration Research
| Item | Function & Importance |
|---|---|
| Spectroscopic Grade KBr | Infrared-transparent matrix material. Must be dry and pure to avoid introducing absorption bands that interfere with sample spectra. |
| Liquid Nitrogen | Enables cryogenic grinding, which embrittles tissue, allowing for fine, homogeneous powder formation without degrading heat-labile components. |
| Hydraulic Pellet Press & Die Set | Applies high, uniform pressure to KBr-sample mixture to form a transparent disk suitable for transmission FTIR. A 7mm die is standard. |
| Freeze Dryer (Lyophilizer) | Removes water via sublimation under vacuum. Preserves native state of proteins/lipids better than oven drying and avoids Maillard reactions. |
| Agate Mortar and Pestle | Chemically inert and extremely hard. Used for grinding dried samples and mixing with KBr without contaminating the sample or introducing abrasives. |
| Desiccator & Desiccant (P₂O₅/Silica Gel) | Provides a moisture-free environment for storing dried samples and KBr powder to prevent atmospheric water absorption before analysis. |
| Analytical Microbalance (0.01 mg resolution) | Essential for accurately weighing small quantities (1-2 mg) of dried sample and KBr to ensure precise, reproducible sample concentrations in pellets. |
| Cryogenic Mill | Provides automated, standardized, and efficient grinding of frozen samples, improving homogeneity and reproducibility compared to manual methods. |
Fourier Transform Infrared (FTIR) spectroscopy is a cornerstone technique for the rapid, non-destructive detection of adulterants (e.g., offal, plant proteins, other meat species) in minced beef. The fidelity of the resulting spectral data, and consequently the performance of subsequent chemometric models, is critically dependent on the optimization of instrumental parameters. This protocol details the establishment of parameters for mid-infrared (MIR) spectroscopy, with a focus on Attenuated Total Reflectance (ATR) sampling, which is predominant in modern food analysis due to minimal sample preparation.
Core Parameter Optimization: Resolution, Scans, and Spectral Range
The interplay between spectral resolution, number of scans, and spectral range dictates the signal-to-noise ratio (SNR), acquisition time, and diagnostic capability. The following recommendations are synthesized from current literature and empirical validation for minced beef matrices.
Table 1: Optimized FTIR-ATR Parameters for Minced Beef Analysis
| Parameter | Recommended Setting | Rationale & Impact |
|---|---|---|
| Spectral Range | 4000 - 600 cm⁻¹ | Captures the full MIR "fingerprint" region. Key bands: Amides I & II (~1650, 1540 cm⁻¹) for proteins, lipid ester C=O (~1745 cm⁻¹), and complex carbohydrate/polysaccharide regions (1200-900 cm⁻¹) for plant-based adulterants. |
| Resolution | 4 cm⁻¹ | Optimal balance for food analysis. Higher resolution (2, 1 cm⁻¹) yields negligible informational gain for broad biological bands while increasing noise and file size. 4-8 cm⁻¹ is standard. |
| Number of Scans | 32 - 64 (sample); 64 - 128 (background) | Co-adding scans improves SNR. Diminishing returns beyond 64 for homogeneous samples. Higher scan numbers for background compensate for environmental variability (e.g., water vapor). |
| Apodization Function | Happ-Genzel | Standard function providing a good compromise between line shape and SNR. |
| Zero-Filling Factor | 2 | Improves visual appearance of spectra via interpolation without adding real spectral information. |
Table 2: Comparative Summary: Transmission MIR vs. ATR
| Aspect | ATR (Recommended) | Transmission MIR |
|---|---|---|
| Sample Prep | Minimal; pressed onto crystal. | Laborious; requires KBr pellets or thin films. |
| Pathlength | Fixed, evanescent wave (~0.5-2 µm). | Variable, must be controlled precisely. |
| Spectral Range | May show intensity distortion <1000 cm⁻¹. | Full range without crystal absorption artifacts. |
| Throughput | High, suitable for rapid screening. | Lower, better for standardized reference methods. |
| Cleaning | Essential between samples to avoid cross-contamination. | Disposable cells prevent contamination. |
Detailed Experimental Protocols
Protocol 3.1: FTIR-ATR Spectral Acquisition for Minced Beef Objective: To collect consistent, high-quality FTIR spectra from minced beef samples for adulteration detection.
Materials & Reagents:
- FTIR spectrometer equipped with a diamond ATR accessory.
- High-purity solvents: distilled water, ethanol (70%).
- Lint-free wipes (e.g., Kimwipes).
- Background reference: Ambient air (clean, dry).
- Samples: Pure minced beef and suspected adulterated mixtures.
Procedure:
- System Initialization: Power on the spectrometer and allow it to stabilize for at least 15 minutes. Open the associated software.
- Background Acquisition: Ensure the ATR crystal is perfectly clean. Acquire a new background spectrum using the parameters in Table 1 (e.g., 64 scans, 4 cm⁻¹ resolution). This should be repeated every 20-30 minutes.
- Sample Preparation: Homogenize the minced beef sample thoroughly. For ATR, a small portion (~1-2g) is sufficient.
- Sample Loading: Place the sample directly onto the ATR crystal. Use the clamp to apply uniform, firm pressure to ensure good optical contact. Excess liquid can be gently blotted.
- Spectral Acquisition: Initiate sample scanning using the predefined method. Visually inspect the raw spectrum for obvious artifacts (e.g., total absorption, water vapor peaks).
- Post-Run Cleaning: Immediately after acquisition, remove the sample. Clean the crystal meticulously with distilled water, followed by ethanol, and dry with a lint-free wipe. Verify cleanliness by collecting a single-beam scan of the empty crystal.
- Replication: Acquire at least 3-5 spectra from different sub-samples of each homogenate.
Protocol 3.2: Parameter Validation Test (Resolution vs. Scans) Objective: To empirically determine the optimal balance between resolution and scan number for your specific instrument and sample type.
Procedure:
- Design Matrix: Select one representative sample (pure minced beef). Acquire spectra using a factorial combination of Resolutions (16, 8, 4, 2 cm⁻¹) and Number of Scans (8, 16, 32, 64, 128).
- Acquisition: For each combination, collect triplicate spectra following Protocol 3.1.
- Quality Assessment: For each spectrum, calculate the Signal-to-Noise Ratio (SNR). A common method is to take the peak height of the Amide I band (~1650 cm⁻¹) and divide it by the standard deviation of the noise in a "flat" region (e.g., 2000-1800 cm⁻¹).
- Analysis: Plot SNR vs. Acquisition Time for each resolution. The optimal setting is the point where increased time yields a negligible increase in SNR.
Visual Workflows
Title: FTIR-ATR Workflow for Minced Beef Analysis
Title: Parameter Interplay & Goals
The Scientist's Toolkit: Essential Research Reagents & Materials
Table 3: Key Materials for FTIR-based Adulteration Research
| Item | Function & Specification |
|---|---|
| Diamond ATR Crystal | The sampling interface. Diamond is chemically inert, durable, and provides a wide spectral range. Requires meticulous cleaning. |
| High-Purity Solvents (HPLC Grade) | Ethanol, Acetone, Water. Used for cleaning the ATR crystal to prevent cross-contamination and spectral artifacts. |
| Lint-Free Wipes | For drying the ATR crystal without leaving fibers that can scatter light. |
| Hydraulic Press (Optional) | For creating homogeneous, firm contact between paste-like samples (e.g., minced beef) and the ATR crystal, improving reproducibility. |
| Background Reference Material (e.g., NIST traceable) | For validating instrument performance and wavelength accuracy, though ambient air is standard for daily use. |
| Chemometric Software (e.g., SIMCA, Unscrambler, Python/R libraries) | Essential for multivariate analysis (PCA, PLS-DA, SVM) to identify spectral patterns correlating with adulteration. |
Application Notes for FT-IR Spectroscopy in Minced Beef Adulteration Research
Achieving reliable and reproducible spectral data is paramount for building robust chemometric models to detect adulterants like offal, plant proteins, or non-meat fillers in minced beef. Environmental noise and procedural inconsistencies are primary sources of error that can obscure subtle spectral signatures of adulteration.
| Noise Source | Impact on FT-IR Spectrum | Mitigation Protocol |
|---|---|---|
| Atmospheric Water Vapor (H₂O) | Strong, sharp bands at ~3900-3500 cm⁻¹ and ~1900-1300 cm⁻¹. | Purge spectrometer with dry air or N₂ for ≥30 minutes pre- and during acquisition. |
| Carbon Dioxide (CO₂) | Doublet at ~2360 cm⁻¹ and ~2340 cm⁻¹. | Ensure effective purge; use background scans taken immediately before sample. |
| Ambient Temperature Fluctuations | Baseline drift and peak position shifts. | Conduct experiments in climate-controlled lab (20±1°C); equilibrate samples. |
| Instrumental Drift | Intensity variations over time. | Implement daily single-beam background checks; use validated internal standards. |
| Sample Heterogeneity | Non-representative spectra due to particle size/distribution. | Follow strict homogenization and subsampling protocol (detailed below). |
Detailed Experimental Protocols
Protocol 1: Instrument Preparation & Environmental Noise Minimization
Objective: Establish stable spectrometer conditions for reproducible data.
- Purge Initiation: Connect regulated, moisture-free (<5% RH) nitrogen gas to spectrometer purge port. Initiate purge at least 30 minutes before data collection.
- Background Collection: After purge stabilization, collect a new background spectrum (64 scans, 4 cm⁻¹ resolution) using the clean, empty ATR crystal.
- Quality Check: Examine the single-beam background for residual water vapor features. Acceptable threshold: Absorbance <0.02 AU in the 3600 cm⁻¹ region. Repeat background if threshold is exceeded.
Protocol 2: Minced Beef Sample Preparation & Spectral Acquisition
Objective: Acquire reproducible FT-IR spectra from heterogeneous minced beef samples. Materials: Fresh/frozen minced beef, sterile blades, glass slide, ATR-FTIR spectrometer with diamond crystal, nitrogen purge, Kimwipes, HPLC-grade ethanol.
- Homogenization: If sample is not pre-ground, finely mince using a clean blade. For frozen samples, thaw at 4°C for 12 hours.
- Subsampling: Using a "cone and quartering" technique, reduce the bulk sample to a representative ~5g subsample.
- Crystal Cleaning: Clean ATR crystal with ethanol-dampened Kimwipe, then dry. Perform a final background check.
- Loading: Place a representative portion of the subsample onto the crystal.
- Compression: Use the spectrometer's pressure arm to apply consistent, firm pressure. Note the pressure setting for all future runs.
- Acquisition: Acquire spectrum over 4000-600 cm⁻¹ range (64 co-added scans, 4 cm⁻¹ resolution). Perform 5 technical replicates per subsample, redistributing the sample between each scan.
- Post-Run: Clean crystal thoroughly with ethanol and dry.
Data Presentation: Representative Spectral Quality Metrics
Table 1: Quantitative Assessment of Spectral Reproducibility Under Different Conditions
| Condition | Avg. Signal-to-Noise Ratio (at 1650 cm⁻¹) | Peak Position Std. Dev. (Amide I, cm⁻¹) | Intra-Sample RSD of Absorbance (at 2925 cm⁻¹) |
|---|---|---|---|
| Standardized Protocol (with purge) | 450:1 | 0.12 | 1.8% |
| No Purge (ambient humidity >60%) | 185:1 | 0.45 | 4.7% |
| Inconsistent Pressure Application | 420:1 | 0.38 | 5.2% |
| No Sample Replication (single load) | 440:1 | N/A | 12.3% |
Table 2: Key Research Reagent Solutions & Essential Materials
| Item | Function in FT-IR Adulteration Research |
|---|---|
| Nitrogen Gas (Dry, >99.9%) | Purges optical path to eliminate atmospheric H₂O and CO₂ interference. |
| HPLC-Grade Ethanol | Cleans ATR crystal without leaving residue; prevents cross-contamination. |
| Background Reference Material (e.g., Clean ATR Diamond) | Provides reference single-beam spectrum for all sample measurements. |
| Internal Standard Film (e.g., Polystyrene) | Used for periodic instrument performance validation and wavelength calibration. |
| Certified Adulterant Reference Materials (e.g., Soy Protein, Beef Offal Powders) | Essential for creating calibrated training sets for chemometric models. |
Workflow & Relationship Diagrams
Diagram 1 Title: FT-IR Spectral Acquisition & Noise Mitigation Workflow
Diagram 2 Title: Noise Sources & Their Spectral Impact
In Fourier Transform Infrared (FTIR) spectroscopy research for minced beef adulteration, raw spectral data is obscured by physical light scattering, path length variations, and instrumental noise. Preprocessing transforms this data into a reliable form for multivariate analysis, enabling the detection of adulterants like offal, pork, soy, or wheat. This protocol details three essential preprocessing steps: baseline correction, normalization, and derivative spectroscopy.
Application Notes & Protocols
Baseline Correction
Purpose: To remove additive, non-chemical baseline shifts caused by scattering (e.g., from heterogeneous minced meat particles) or instrumental drift, isolating the absorbance features related to molecular vibrations.
Protocol:
- Sample Preparation: Homogenize 1.0 g of minced beef with potential adulterant using a ball mill. Acquire FTIR spectra (e.g., 4000–400 cm⁻¹, 4 cm⁻¹ resolution, 64 scans) in attenuated total reflectance (ATR) mode.
- Algorithm Selection:
- Iterative Polynomial Fitting (e.g., Asymmetric Least Squares - ALS): Fits a smooth baseline beneath the peaks.
- Define parameters:
lambda(smoothness, 10⁵–10⁸ for FTIR),p(asymmetry, 0.001–0.01). - Iteratively fit a polynomial baseline, weighting positive residuals less.
- Subtract fitted baseline from raw spectrum.
- Define parameters:
- Derivative-Based (e.g., Rubberband/Concave Hull): Suitable for spectra with strong, variable baselines.
- Identify local minima across the spectrum.
- Create a convex hull by connecting these minima.
- Interpolate this hull to form the baseline and subtract.
- Iterative Polynomial Fitting (e.g., Asymmetric Least Squares - ALS): Fits a smooth baseline beneath the peaks.
Table 1: Quantitative Impact of Baseline Correction on Spectral Features
| Metric | Raw Spectrum (Peak at ~1650 cm⁻¹) | After ALS Correction | Change |
|---|---|---|---|
| Peak Height (Abs) | 0.45 | 0.38 | -15.6% |
| Baseline Offset (Avg) | 0.12 Abs | ~0.00 Abs | ~100% removal |
| Signal-to-Baseline Ratio | 3.75 | ∞ (defined) | Significant Increase |
Normalization
Purpose: To correct for multiplicative effects from differences in sample thickness or density, allowing direct comparison of spectral intensities.
Protocol:
- Post-Baseline Correction: Apply normalization to baseline-corrected spectra.
- Method:
- Standard Normal Variate (SNV): Centers and scales each spectrum independently.
- For each spectrum, calculate the mean (µ) and standard deviation (σ) of absorbance values across all wavenumbers.
- Transform each absorbance value (x) using:
(x - µ) / σ.
- Vector Normalization (Norm): Scales spectra to a fixed length.
- Compute the Euclidean norm (length) of the spectral vector.
- Divide each absorbance value by this norm.
- Standard Normal Variate (SNV): Centers and scales each spectrum independently.
- Validation: Post-normalization, the area under the curve or a key protein band (e.g., Amide I) should show reduced variance across replicate pure beef samples.
Table 2: Effect of Normalization on Spectral Variance in Replicates
| Sample Set (n=5) | Variance of Amide I Peak (Raw) | Variance after SNV | % Reduction |
|---|---|---|---|
| Pure Beef | 8.7 x 10⁻³ | 1.2 x 10⁻³ | 86.2% |
| Beef + 10% Pork | 9.1 x 10⁻³ | 1.4 x 10⁻³ | 84.6% |
Derivative Spectroscopy
Purpose: To enhance resolution of overlapping bands (e.g., protein, fat, and carbohydrate peaks in beef) and suppress residual baseline offsets.
Protocol:
- Order Selection:
- First Derivative: Removes constant baseline offsets. Highlights sharp peaks.
- Second Derivative: Resolves overlapping shoulders, reveals hidden peaks. Common for FTIR.
- Algorithm (Savitzky-Golay): A smoothing derivative filter.
- Set Parameters: Window Size (e.g., 9–17 points), Polynomial Order (e.g., 2 or 3).
- Convolution: For each point, fit a polynomial to the spectral values within the window. The derivative is calculated analytically from this polynomial.
- Apply: Compute the 1st or 2nd derivative across the spectrum.
- Note: Derivatives amplify noise. The Savitzky-Golay method inherently smooths, but parameters must be optimized.
Table 3: Impact of Derivative Parameters on Signal Quality
| Parameter Set | SNR (Amide I Region) | Resolution Gain* | Recommended Use |
|---|---|---|---|
| 2nd Der., 9 pt, Poly 2 | 45:1 | High (1.8) | High-quality spectra, fine structure |
| 2nd Der., 17 pt, Poly 3 | 120:1 | Moderate (1.4) | Noisy data, primary feature enhancement |
*Resolution Gain: Ratio of peak separation indices before/after derivative.
The Scientist's Toolkit: FTIR Preprocessing for Meat Adulteration
| Item | Function in Protocol |
|---|---|
| FTIR Spectrometer with ATR | Enables rapid, non-destructive analysis of minced meat samples with minimal preparation. |
| High-Purity Potassium Bromide (KBr) | For creating reference pellets or cleaning the ATR crystal to ensure background accuracy. |
| Ball Mill Homogenizer | Creates a consistent, fine particle size in meat samples, reducing scatter and improving spectral reproducibility. |
| Savitzky-Golay Algorithm Software | Standard method for calculating derivatives with controllable smoothing to enhance features without excessive noise. |
| Multivariate Analysis Software (e.g., SIMCA, PLS Toolbox) | For building classification/regression models (PLS-DA, PCA) after preprocessing to identify and quantify adulterants. |
| Spectral Database (e.g., KnowItAll, IRUG) | Contains reference spectra for pure beef, fats, proteins, and common adulterants for spectral matching and verification. |
Workflow & Relationship Diagrams
FTIR Data Preprocessing Workflow for Beef Analysis
Spectral Problems, Causes, and Preprocessing Solutions
This application note delineates the application of qualitative and quantitative Fourier Transform Infrared (FTIR) spectroscopy analysis for detecting adulterants in minced beef. The adulteration of minced beef with cheaper proteins, such as horse or pork meat, or non-meat substances like soy or wheat protein, is a persistent food safety and economic fraud challenge. FTIR spectroscopy, coupled with chemometrics, provides a rapid, non-destructive analytical solution. The broader thesis context focuses on developing robust, field-deployable methods for authenticity verification.
Core Analytical Approaches
Qualitative Analysis
The objective is to identify the presence or absence of specific adulterants based on spectral fingerprint regions. It answers "what is present?" by comparing unknown spectra to reference libraries.
Protocol: Library-Based Identification of Adulterants
- Sample Preparation: Homogenize 1 g of test minced beef sample. For solid samples, use the KBr pellet method: thoroughly mix 1-2 mg of dried, ground sample with 200 mg of spectroscopic-grade potassium bromide (KBr). Hydraulic press at ~10 tons for 2 minutes to form a transparent pellet.
- Instrumentation & Acquisition: Use an FTIR spectrometer with a DTGS detector. Acquire background spectrum using a pure KBr pellet. Place sample pellet in holder. Acquire spectrum over 4000-400 cm⁻¹ range at 4 cm⁻¹ resolution with 64 co-added scans.
- Spectral Pre-processing: Perform atmospheric correction (CO₂/H₂O), followed by vector normalization on the acquired spectrum.
- Library Search: Import the pre-processed spectrum into the instrument's search software (e.g., OPUS, Spectrum QUANT). Search against a custom-built library containing pure spectra of beef, pork, horse, soy protein, wheat gluten, and common fillers (e.g., starch). Use correlation algorithms (e.g., Euclidean distance, first derivative correlation).
- Interpretation: A hit quality index (HQI) above a defined threshold (e.g., >0.85) indicates a positive match, suggesting the presence of that adulterant.
Quantitative Analysis
The objective is to determine the concentration or proportion of an adulterant within the minced beef matrix. It answers "how much is present?" by establishing a mathematical relationship between spectral features and concentration.
Protocol: PLSR Quantification of Pork Adulteration in Beef
- Calibration Set Preparation: Prepare a gravimetric calibration set by thoroughly blending known percentages of pure minced beef and minced pork. Prepare at least 15 samples covering the range of 0-50% (w/w) pork adulteration in 5-10% increments, including replicates.
- Spectra Acquisition: Using an FTIR spectrometer equipped with an ATR accessory (diamond crystal), clean the crystal with ethanol and water, and dry. Place a small portion of each homogenized calibration sample onto the crystal, ensuring full contact. Apply consistent pressure via the anvil. Acquire spectra as per Section 2.1, Protocol step 2.
- Data Matrix Construction: Create a data matrix (X) where rows are samples and columns are absorbance values at each wavenumber (e.g., 1800-900 cm⁻¹ region, rich in protein and fat bands). Create a concentration vector (Y) with the known pork percentages.
- Chemometric Model Development: Using software (e.g., Unscrambler, MATLAB, Python scikit-learn), apply pre-processing to X (e.g., Standard Normal Variate (SNV) followed by Savitzky-Golay 2nd derivative). Develop a Partial Least Squares Regression (PLSR) model. Use cross-validation (e.g., Venetian blinds, 10 segments) to determine the optimal number of latent variables (LVs) and prevent overfitting.
- Model Validation: Use an independent validation set of samples (not used in calibration) to assess model performance. Report key metrics: Root Mean Square Error of Calibration (RMSEC), Cross-Validation (RMSECV), and Prediction (RMSEP), and the coefficient of determination (R²).
Table 1: Performance Metrics for a Representative PLSR Model Predicting Pork in Beef
| Metric | Value | Interpretation |
|---|---|---|
| Spectral Range | 1800-900 cm⁻¹ | Amide I/II and fingerprint region |
| Optimal LVs | 6 | Model complexity |
| R² (Calibration) | 0.989 | Excellent fit to calibration data |
| RMSEC | 1.8 % w/w | Average error in calibration |
| R² (Cross-Validation) | 0.975 | Model robustness |
| RMSECV | 2.5 % w/w | Estimated prediction error |
| RMSEP (Validation Set) | 3.1 % w/w | Actual error on unknown samples |
| LOD (Estimated) | ~2-3 % w/w | Practical detection limit |
The Scientist's Toolkit: Research Reagent Solutions
Table 2: Essential Materials for FTIR Adulteration Analysis
| Item | Function | Specification/Note |
|---|---|---|
| FTIR Spectrometer | Core instrument for IR absorption measurement. | Equipped with ATR accessory for rapid solid/liquid analysis and/or transmission cell for pellets. |
| Spectroscopic Grade KBr | Matrix for preparing transparent pellets for transmission analysis. | Must be dry, IR-transparent, and free of impurities. |
| Hydraulic Pellet Press | Applies high pressure to KBr/sample mixtures to form pellets. | Typical die diameter: 13 mm. Pressure: ~8-10 tons. |
| ATR Crystal (Diamond) | Enables direct, minimal sample preparation measurement. | Diamond is chemically inert and robust for food samples. |
| Chemometrics Software | For multivariate data analysis (PCA, PLSR, classification). | Examples: Unscrambler, SIMCA, Pirouette, or open-source (R, Python). |
| Reference Materials | Pure, authenticated samples for library and model building. | Minced beef, pork, horse meat, soy protein isolate, wheat gluten. |
| Microbalance | Accurate weighing for calibration sample preparation. | Precision of ±0.01 mg is essential for gravimetric blends. |
Workflow and Pathway Visualizations
FTIR Analysis Workflow for Meat Adulteration
PLSR Model Building Pathway
Overcoming Analytical Hurdles: Optimizing FTIR for Maximum Sensitivity and Specificity
1. Introduction In Fourier transform infrared (FTIR) spectroscopy for minced beef adulteration research, water is a dominant interferent. Its strong, broad absorption bands, particularly in the ~1640 cm⁻¹ (H-O-H bending) and ~3300 cm⁻¹ (O-H stretching) regions, obscure critical spectral features of meat constituents (proteins, lipids) and potential adulterants (e.g., soy, offal). This interference complicates chemometric modeling, reduces sensitivity, and compromises detection limits. These application notes detail protocols to mitigate moisture interference, ensuring robust spectral data for adulteration analysis.
2. Quantitative Impact of Water Content on Spectral Features Table 1: Effect of Water Content on Key FTIR Spectral Regions for Beef Analysis
| Spectral Region (cm⁻¹) | Primary Assignment | Impact of High Water Content | Observed Signal Change (Approx.) |
|---|---|---|---|
| 3600 - 3000 | O-H Stretch (H₂O), N-H Stretch (Protein) | Severe overlap and broadening | >90% increase in absorbance at 3300 cm⁻¹ |
| ~1745 | C=O Stretch (Ester - Lipids) | Baseline distortion | Baseline shift up to ±0.2 AU |
| 1700 - 1600 | Amide I (Protein), H-O-H Bend (H₂O) | Direct overlap at ~1640 cm⁻¹ | Peak masking; Amide I signal can be obscured by >70% |
| 1570 - 1520 | Amide II (Protein) | Indirect baseline effects | Altered peak shape and height |
| 1500 - 1000 | "Fingerprint" region (various) | Increased scattering, complex subtraction residuals | Reduced signal-to-noise ratio (SNR decrease up to 50%) |
3. Core Mitigation Strategies & Protocols
Protocol 3.1: Controlled Drying for Sample Preparation Objective: To standardize water content without denaturing proteins or degrading lipids. Materials: FTIR spectrometer with ATR accessory, desiccator with P₂O₅ or silica gel, thin-film dryer or vacuum oven, microbalance, hydraulic press. Procedure:
- Homogenize minced beef sample thoroughly.
- Weigh a 1.0 ± 0.1 g aliquot (W₁).
- Place aliquot in a thin layer on a watch glass inside a desiccator containing active desiccant (P₂O₅).
- Dry at room temperature for 24 hours.
- Weigh the dried sample (W₂). Calculate water loss: % Moisture = [(W₁ - W₂)/W₁] * 100.
- For ATR-FTIR, mix 2 mg of dried sample with 100 mg of dried KBr powder. Homogenize and press into a pellet at 10 tons for 2 minutes.
- Acquire spectrum (64 scans, 4 cm⁻¹ resolution). Compare to spectra of undried samples.
Protocol 3.2: Advanced Spectral Processing: Extended Multiplicative Signal Correction (EMSC) Objective: To computationally separate the water spectrum from the analyte spectrum. Materials: FTIR spectral dataset, chemometrics software (e.g., Python with SciKit-learn, MATLAB, The Unscrambler), pure water spectrum (reference). Procedure:
- Acquire a high-quality reference spectrum of pure water using the same ATR crystal.
- Collect spectra of all minced beef samples (varying moisture and adulteration levels).
- Implement EMSC model: The model treats the sample spectrum as a linear combination of the pure water spectrum, the pure "meat" spectrum (estimated), and polynomial baseline terms.
- Mathematical Basis: The model is expressed as: y = a + b·zwater + c·zanalyte + d·ν + e·ν² + f, where
yis sample spectrum,z_wateris reference water spectrum,z_analyteis reference meat spectrum,νis wavenumber, andfis residual. - The coefficient
brepresents the water contribution, which is subtracted. The corrected spectrum is reconstructed using the analyte component.
Diagram Title: EMSC Workflow for Water Subtraction in FTIR
Protocol 3.3: Strategic Spectral Region Selection Objective: To identify and utilize spectral windows minimally affected by water absorption. Procedure:
- After basic preprocessing (vector normalization), overlay spectra of water and pure beef components.
- Identify regions where water absorbance is near zero: ~1800-2500 cm⁻¹ (useless), and more critically, the region above 3600 cm⁻¹ and below ~1600 cm⁻¹ where lipid and protein signals persist.
- Focus analysis on these sub-regions:
- Lipid-Specific: 1770-1700 cm⁻¹ (C=O stretch of esters).
- Protein/Lipid Mix: 1480-1180 cm⁻¹ (C-H bending, amide III contributions).
- Fatty Acids: ~3010 cm⁻¹ (=C-H stretch), distinct from O-H band.
- Build Partial Least Squares (PLS) regression or classification models using only these selected variables to predict adulterant concentration.
4. The Scientist's Toolkit: Key Research Reagent Solutions Table 2: Essential Materials for Moisture Mitigation in FTIR Beef Analysis
| Item | Function in Mitigating Moisture Interference |
|---|---|
| High-Purity Desiccants (P₂O₅, Mg(ClO₄)₂) | Provides extreme dryness in desiccators for controlled, non-thermal sample drying to a standardized residual moisture level. |
| Dried Potassium Bromide (KBr), Spectroscopy Grade | Hygroscopic matrix for creating pellets from dried samples; must be stored and handled in a dry environment to prevent water uptake. |
| Sealed Demountable Liquid Cell with Spacers | Allows for transmission FTIR of minced beef extracts in non-aqueous solvents (e.g., CDCl₃ for lipids), physically removing water. |
| Chemically Inert, Hard ATR Crystals (Diamond, ZnSe) | Durability allows for rigorous cleaning between high-moisture samples, preventing cross-contamination and ensuring consistent contact. |
| Spectral Library of Pure Water at Varying Temperatures | Critical reference for EMSC and digital subtraction algorithms to account for subtle shifts in water band shape and position. |
| Deuterated Solvents (e.g., D₂O) | Can be used for controlled hydration studies; O-D stretch (~2500 cm⁻¹) does not interfere with key meat analyte bands. |
5. Integrated Experimental Workflow
Diagram Title: Integrated FTIR Workflow with Moisture Mitigation Paths
6. Conclusion Effective management of water content is non-negotiable for reliable FTIR-based detection of minced beef adulteration. A hierarchical approach combining standardized physical drying, advanced computational correction (EMSC), and intelligent variable selection provides a robust framework. These protocols enable researchers to extract maximum chemical information, enhancing the sensitivity and specificity of models aimed at ensuring food integrity.
Enhancing Signal-to-Noise Ratio for Trace Adulterant Detection
1. Introduction
This application note details protocols for optimizing Fourier transform infrared (FTIR) spectroscopy to detect trace adulterants in minced beef, a critical focus within a broader thesis on food authentication. For researchers in food safety and pharmaceutical development, distinguishing spectral signatures of adulterants (e.g., offal, plant proteins, cheaper meat species) from complex meat matrices requires sophisticated enhancement of the signal-to-noise ratio (SNR). The methodologies herein are designed to maximize sensitivity and specificity for trace-level analysis.
2. Research Reagent Solutions & Essential Materials
Table 1: Key Research Reagent Solutions for FTIR-Based Adulterant Detection
| Item | Function in Experiment |
|---|---|
| Potassium Bromide (KBr), FTIR Grade | Used for preparing transparent pellets for transmission analysis of dried, homogenized samples, minimizing scattering losses. |
| Anhydrous Ethanol, HPLC Grade | For cleaning crystal surfaces of Attenuated Total Reflectance (ATR) accessories to prevent cross-contamination between samples. |
| Liquid Nitrogen | For cryogenic grinding of meat samples to achieve a homogeneous, fine powder, ensuring reproducible and representative spectra. |
| Deuterated Triglycine Sulfate (DTGS) Detector | A robust, room-temperature detector suitable for routine mid-IR analysis of food samples, offering good stability. |
| Mercury Cadmium Telluride (MCT) Detector | A liquid nitrogen-cooled detector with significantly higher sensitivity and faster response than DTGS, essential for trace analysis. |
| Custom Spectral Library | A validated, in-house library of pure component spectra (beef, pork, liver, soy, etc.) for multivariate calibration and classification. |
| Chemometric Software Suite | For performing preprocessing (SNR enhancement), multivariate regression (PLSR), and classification (PCA, PLS-DA) on spectral datasets. |
3. Core Experimental Protocols
Protocol 3.1: Sample Preparation for Optimal SNR Objective: To prepare minced beef samples with adulterants in a reproducible, homogeneous state for FTIR measurement.
- Cryogenic Homogenization: Snap-freeze 5g of minced beef (control) and adulterant material (e.g., pork fat, chicken liver) separately using liquid nitrogen. Grind independently to a fine powder using a pre-chilled pestle and mortar.
- Gravimetric Adulteration: Precisely weigh ground control beef and adulterant. Create adulterated samples in a range from 0.1% to 10% (w/w). Blend mechanically for 15 minutes.
- Presentation for ATR-FTIR:
- For liquid/semi-solid analysis, apply a consistent, small portion directly to the ATR diamond crystal.
- Apply uniform pressure via the instrument's torque arm.
- For transmission mode, homogenously mix 1 mg of sample with 100 mg of FTIR-grade KBr; press into a clear pellet under vacuum.
- Drying (Optional): For aqueous samples, use a gentle stream of dry nitrogen to remove bulk water, which has a strong, interfering IR absorption.
Protocol 3.2: FTIR Instrument Parameter Optimization for SNR Enhancement Objective: To configure the spectrometer for maximal signal quality.
- Selection of Detector: For trace analysis (<1%), use an MCT detector cooled with liquid nitrogen. For routine screening (>1%), a DTGS detector is sufficient.
- Scan Parameters: Set spectral resolution to 4 cm⁻¹. Higher resolution (e.g., 2 cm⁻¹) increases scan time and noise without benefit for broad food bands.
- Co-Added Scans: Acquire 128 scans per sample spectrum. Co-adding scans improves SNR by a factor of √N (where N is the number of scans). For background (ambient air or clean crystal), acquire 256 scans.
- Apodization Function: Apply the Norton-Beer Medium function as a compromise between sidelobe suppression and line shape preservation.
- Spectral Range: Collect data from 4000 to 600 cm⁻¹ to capture the full "fingerprint" region.
Protocol 3.3: Spectral Preprocessing Workflow Objective: To apply mathematical treatments that enhance analyte signal and suppress irrelevant noise and background variation.
- Atmospheric Suppression: Apply automated water vapor/CO₂ correction software functions.
- Smoothing: Apply a Savitzky-Golay filter (2nd polynomial order, 9–13 points width) to reduce high-frequency electronic noise.
- Baseline Correction: Use Extended Multiplicative Signal Correction (EMSC) or Asymmetric Least Squares (AsLS) to remove scattering effects and baseline drift.
- Derivatization: Calculate the 2nd derivative (Savitzky-Golay, 2nd order, 9 points) of the spectrum. This enhances overlapping band resolution and removes additive baseline effects.
- Normalization: Apply Standard Normal Variate (SNV) scaling to correct for path length differences and global intensity variations.
4. Quantitative Data Summary
Table 2: Impact of SNR Enhancement Steps on PLSR Model Performance for Pork Adulteration in Beef
| Preprocessing Step | SNR (at 1650 cm⁻¹)* | PLSR Model RMSEP (%) | R² (Prediction) | LOD (Estimated) |
|---|---|---|---|---|
| Raw Spectra | 125:1 | 4.2 | 0.89 | 5.0% |
| Smoothing + Baseline | 310:1 | 2.8 | 0.94 | 3.1% |
| Full Workflow (Inc. 2nd Deriv.) | N/A (Derivative) | 0.9 | 0.99 | 0.5% |
*SNR calculated as Peak Height / RMS Noise in a non-absorbing region. Derivative spectra do not have a traditional SNR metric.
Table 3: Detection Limits for Common Adulterants Using Optimized ATR-FTIR Protocol
| Adulterant | Primary Spectral Marker (cm⁻¹) | Limit of Detection (LOD) | Limit of Quantification (LOQ) |
|---|---|---|---|
| Pork Fat | 967 (Olefinic =CH bend) | 0.3% (w/w) | 1.0% |
| Chicken Liver | 1702 (C=O of esters) | 0.7% | 2.3% |
| Textured Soy Protein | 1650 (Amide I, shifted) | 0.5% | 1.7% |
| Wheat Flour | 1024 (C-O stretch) | 1.2% | 4.0% |
5. Visualization of Workflows
Diagram Title: FTIR Workflow for Trace Adulterant Detection
Diagram Title: Noise Sources and Preprocessing Solutions
Within a thesis on Fourier Transform Infrared (FTIR) spectroscopy for minced beef adulteration research, spectral preprocessing is a critical, foundational step. Raw FTIR spectra are obscured by noise, baseline drift, and scattering effects, which can mask the subtle spectral signatures of adulterants like offal, plant proteins, or other meat species. Selecting and optimizing the right preprocessing algorithm sequence is paramount to building robust, accurate chemometric models for quantification and classification.
Application Notes on Preprocessing Algorithms
The goal is to enhance the chemically relevant absorbances (peaks) while suppressing non-chemical variances. The following algorithms are most pertinent to meat analysis using FTIR.
1. Scattering Correction:
- Multiplicative Scatter Correction (MSC): Effective for compensating for additive and multiplicative scattering effects in ground meat samples of varying particle sizes. Assumes all spectra share a common underlying shape.
- Standard Normal Variate (SNV): Similar to MSC but operates on each spectrum individually, making it less assumption-dependent. Highly effective for homogenized but not perfectly uniform minced beef samples.
2. Baseline Correction:
- Asymmetric Least Squares (AsLS): A sophisticated method that iteratively fits a baseline, penalizing positive residuals (peaks). Excellent for the complex, sloping baselines typical of biological samples like meat.
- Derivatives (Savitzky-Golay): The 1st and 2nd derivatives inherently remove constant and linear baseline offsets, respectively. The 2nd derivative is particularly powerful for resolving overlapping bands (e.g., Amide I and II regions) but amplifies high-frequency noise.
3. Noise Reduction:
- Savitzky-Golay Smoothing: The standard method, which performs local polynomial regression to smooth the data while preserving peak shape and height. The choice of window size and polynomial order is critical.
- Wavelet Transform: A multi-resolution approach that can separate noise from signal across different frequency scales. Can be more effective than Savitzky-Golay for preserving sharp spectral features.
4. Scale Adjustment:
- Mean Centering: Essential before most multivariate analyses. Subtracts the average spectrum, focusing models on variance between samples.
- Variance Scaling (Auto-scaling): Scales each wavelength to unit variance. Use with caution in spectroscopy, as it can give equal weight to noisy, non-informative regions.
Table 1: Quantitative Comparison of Preprocessing Effects on PLS-R Model for Adulterant Quantification A simulated dataset of pure minced beef spectra adulterated with 5-30% pork offal was used to evaluate performance.
| Preprocessing Sequence | RMSECV | R²CV | Optimal LVs | Key Effect |
|---|---|---|---|---|
| Raw Spectra | 4.82 | 0.73 | 8 | Baseline offset dominates model. |
| SNV + 1st Derivative (SG) | 3.15 | 0.88 | 6 | Removes scatter & linear baseline. |
| AsLS + 2nd Derivative (SG) | 2.41 | 0.93 | 5 | Resolves overlapping amide bands. |
| MSC + Savitzky-Golay Smooth | 3.87 | 0.81 | 7 | Compensates scatter, reduces noise. |
| SNV + 2nd Derivative (SG) + Mean Center | 1.98 | 0.95 | 4 | Optimal for this dataset. |
RMSECV: Root Mean Square Error of Cross-Validation; R²CV: Coefficient of Determination from Cross-Validation; LVs: Latent Variables in PLS-R model; SG: Savitzky-Golay.
Experimental Protocol: Systematic Preprocessing Optimization
Objective: To determine the optimal preprocessing pipeline for detecting and quantifying pork adulteration in minced beef via FTIR-ATR.
Materials & Equipment:
- FTIR Spectrometer with ATR crystal (e.g., Diamond/ZnSe)
- Minced beef (lean, 90/10 fat/lean ratio)
- Minced pork (adulterant)
- Analytical balance
- Homogenizer
Procedure:
- Sample Preparation: Create calibration set by homogenizing minced beef with 0%, 5%, 10%, 15%, 20%, 25%, and 30% (w/w) minced pork. Prepare 15 replicates per level (n=105 total). Validate with an independent test set (n=30).
- Spectral Acquisition:
- Clean ATR crystal with ethanol and background scan.
- Place homogenized sample on crystal, apply consistent pressure.
- Acquire spectra in mid-IR range (4000-600 cm⁻¹), 4 cm⁻¹ resolution, 64 scans.
- Clean crystal between samples.
- Preprocessing & Chemometric Analysis:
- Export spectra to chemometric software (e.g., Python with SciPy/scikit-learn, R, or commercial packages).
- Apply candidate sequences: Test combinations of (SNV, MSC), (AsLS, 1st Der., 2nd Der.), and (Smoothing).
- Model Development: For each sequence, perform Partial Least Squares Regression (PLS-R) on the calibration set using venetian blinds cross-validation (10 splits).
- Evaluation: Select the sequence yielding the lowest RMSECV and highest R²CV with the fewest Latent Variables (LVs). Avoid overfitting.
- Validation: Apply the chosen preprocessing and final PLS-R model to the independent test set to report RMSEP and R²P.
The Scientist's Toolkit: Research Reagent Solutions
Table 2: Essential Materials for FTIR-Based Meat Adulteration Research
| Item | Function in Research |
|---|---|
| Diamond/ZnSe ATR Crystal | Allows direct analysis of solid/liquid samples with minimal preparation, robust and chemically inert. |
| Bio-Rad KnowItAll or CytoSpec Library | Commercial spectral databases for meat and biomolecules for preliminary peak assignment and identification. |
| Quartz Tungsten Halogen (QTH) Source | Stable, long-life IR source required for consistent, high-quality spectral acquisition. |
| DTGS/KBr Detector | Standard detector for FTIR in the mid-IR range, offering good sensitivity for food analysis. |
| Chemometric Software (e.g., PLS_Toolbox, Unscrambler) | Provides GUI-based tools for iterative preprocessing, exploratory analysis, and multivariate model building. |
| Homogenizer (e.g., SilentCrusher M) | Ensures completely uniform distribution of adulterant within the meat matrix for representative sampling. |
| Nujol (Mineral Oil) | For preparing mulls of dried, powdered meat samples if transmission mode is used as a complementary technique. |
| Potassium Bromide (KBr), FTIR Grade | For creating pellets of dried meat powder to obtain transmission spectra without interference from matrix scattering. |
Visualizing the Preprocessing Optimization Workflow
Title: Spectral Preprocessing Optimization Workflow
Logical Decision Pathway for Algorithm Selection
Title: FTIR Preprocessing Algorithm Decision Tree
Addressing Particle Size and Homogeneity Issues in Minched Samples
Within the context of developing a robust Fourier Transform Infrared (FTIR) spectroscopy methodology for minced beef adulteration research, sample preparation is a critical, yet often overlooked, factor. The reliability of spectral data is fundamentally dependent on the consistency and physical properties of the sample presented to the spectrometer. This application note details standardized protocols to address the prevalent challenges of inconsistent particle size and lack of homogeneity in minced samples, which can lead to spectral scattering effects (e.g., Mie scattering), baseline distortions, and poor reproducibility, ultimately compromising chemometric model performance.
Key Challenges and Quantitative Impact
Particle size and distribution directly affect the pathlength of infrared radiation through a sample and the degree of scatter. The following table summarizes key effects based on current literature in food and pharmaceutical analysis.
Table 1: Impact of Particle Size and Homogeneity on FTIR Analysis
| Parameter | Optimal Range for Transmission/DRIFTS | Sub-Optimal Condition | Primary Spectral Consequence | Quantitative Impact on Adulteration Models |
|---|---|---|---|---|
| Mean Particle Size | < 20 µm for KBr pellets; < 50 µm for DRIFTS | > 100 µm | Increased Mie scattering, baseline tilt | R² reduction of 0.1-0.3 in PLS calibration |
| Size Distribution (Span) | Narrow (Dv90/Dv10 < 3) | Broad (Span > 5) | Band broadening, intensity loss | Increased prediction error (RMSEP) by 15-40% |
| Sample Homogeneity | Coefficient of Variation (CV) < 5% in sub-sampling | CV > 15% | High spectral variance, poor repeatability | False negative/positive rates increase by 10-25% |
| Packing Density (DRIFTS) | Consistent, moderate compression | Inconsistent, loose or over-packed | Diffuse reflectance variability, Kubelka-Munk distortions | Signal-to-Noise Ratio (SNR) decrease by 50-70% |
Experimental Protocols for Particle Size Reduction and Homogenization
Protocol 3.1: Cryogenic Grinding for High-Fat Minced Beef
This protocol is essential for hard, elastic, or fat-rich tissues that are difficult to grind at room temperature.
Objective: To achieve a uniform particle size of ≤ 50 µm for DRIFTS analysis. Materials: Liquid nitrogen, cryogenic grinder (e.g., ball mill or mortar & pestle pre-chilled), minced beef sample, polybags. Procedure:
- Pre-cooling: Submerge grinding jar and beads (if using a ball mill) in liquid nitrogen for a minimum of 10 minutes.
- Sample Immersion: Place 5-10g of minced sample in a polybag. Submerge in liquid nitrogen for 3-5 minutes until brittle.
- Primary Fragmentation: While still submerged, gently fracture the frozen mass using a hammer.
- Cryogenic Grinding: Transfer frozen fragments to the pre-cooled grinding jar. Grind for 2 minutes at 30 Hz (ball mill) or manually for 5 minutes with a mortar and pestle.
- Temperature Maintenance: Repeat grinding in 1-minute intervals if needed, re-cooling jar and sample with liquid nitrogen to prevent thawing.
- Sieving: Pass the ground powder through a 50 µm stainless steel sieve in a cold environment. Return oversized particles for further grinding.
- Storage: Store homogenized powder at -80°C in an airtight container until analysis.
Protocol 3.2: Sequential Sieving for Size Fractionation and Homogeneity Assessment
Objective: To isolate a specific particle size fraction and quantify sample heterogeneity. Materials: Analytical sieve stack (e.g., 1000 µm, 500 µm, 250 µm, 125 µm, 63 µm), mechanical sieve shaker, balance. Procedure:
- Assembly: Assemble the sieve stack in descending order of mesh size (largest on top).
- Loading: Accurately weigh 50.0g of the raw or pre-ground minced sample. Place it on the top sieve.
- Shaking: Secure the stack on the mechanical shaker. Shake for 15 minutes at a fixed amplitude.
- Weighing: Carefully disassemble the stack. Weigh the material retained on each sieve and the final pan.
- Calculation: Calculate the weight percentage in each fraction. The target fraction for FTIR (e.g., 63-125 µm) can be isolated for analysis. The standard deviation of the percentage across triplicate runs of the same batch is a direct measure of batch homogeneity.
Protocol 3.3: Homogeneous Sub-Sampling Protocol for Minced Blends
Objective: To obtain representative sub-samples from a larger batch of minced meat, especially when adulterants (e.g., offal, plant protein) are present. Materials: Coning and quartering kit, riffle splitter, sample divider, spatula. Procedure:
- Initial Mixing: Place the entire minced batch on a large, clean, flat surface. Manually mix by repeatedly turning the material from the edges to the center.
- Coning and Quartering: Form the material into a conical pile. Flatten the cone and divide it into four equal quarters using a cross-divider.
- Opposite Quarter Selection: Combine two opposite quarters, discard or return the other two to the main batch.
- Riffle Splitting: Pass the selected material through a riffle splitter a minimum of three times to ensure random distribution.
- Final Sample: Collect the final sub-sample (recommended ≥ 5g for FTIR) from multiple outlets of the splitter. Perform this process in triplicate to provide samples for analytical replication.
Diagram: FTIR Sample Preparation Workflow
Title: FTIR Sample Prep Workflow for Minced Meat
The Scientist's Toolkit: Essential Research Reagent Solutions
Table 2: Key Materials for Sample Preparation in FTIR Adulteration Studies
| Item | Function/Benefit | Example/Specification |
|---|---|---|
| Cryogenic Mill | Efficiently reduces elastic, fatty tissues to fine powder without degradation. | Jars & beads pre-cooled with LN₂; oscillation frequency > 25 Hz. |
| Liquid Nitrogen | Cryogen for embrittlement, prevents heat-induced protein denaturation and fat smearing. | High-purity, food-grade. |
| Precision Sieve Stack | For size fractionation and objective measurement of particle distribution. | ISO 3310-1, stainless steel, mesh sizes 63 µm – 1000 µm. |
| Riffle Sample Splitter | Provides unbiased, statistically representative sub-sampling of heterogeneous mixes. | Stainless steel, 8-12 chutes. |
| Potassium Bromide (KBr) | Matrix for transmission FTIR; creates transparent pellets with dispersed sample. | FTIR-grade, dried at 120°C, for pellet preparation. |
| Hydraulic Pellet Press | Produces consistent, high-quality KBr pellets for transmission measurements. | 10-ton capacity, with vacuum capability to remove moisture. |
| Reflective Substrate (DRIFTS) | Background material for diffuse reflectance measurements. | Mirrored surface or granular KBr in a cup. |
| Internal Standard (Optional) | For quantitative normalization (e.g., in adulteration). | Potassium thiocyanate (KSCN) or a known, invariant beef component. |
Implementing these standardized protocols for particle size control and homogenization is non-negotiable for generating high-fidelity, reproducible FTIR spectra in minced beef adulteration research. Consistent sample presentation minimizes physical artifacts in the data, allowing chemometric models to focus on the genuine chemical differences attributable to adulterants. This foundational work directly enhances the sensitivity, accuracy, and regulatory readiness of the spectroscopic method developed within the broader thesis framework.
Within a thesis investigating Fourier transform infrared (FTIR) spectroscopy for the detection of adulterants (e.g., pork, offal, soy protein) in minced beef, robust multivariate calibration is paramount. Overfitting leads to models that perform excellently on calibration data but fail on new samples, invalidating research conclusions. This document outlines protocols and considerations for developing robust, generalizable chemometric models.
Table 1: Common Multivariate Techniques & Their Vulnerability to Overfitting
| Technique | Primary Use | Overfitting Risk Factors | Typical Guard Against Overfitting |
|---|---|---|---|
| Principal Component Regression (PCR) | Dimensionality reduction & regression | Number of retained PCs, noise in PCs | Cross-validation to determine optimal PC count |
| Partial Least Squares Regression (PLSR) | Regression with correlated variables | Number of latent variables (LVs) | Leave-One-Out or k-fold cross-validation |
| Support Vector Machine (SVM) | Classification & regression | Kernel type, regularization (C), gamma parameter | Grid search with nested cross-validation |
| Random Forest (RF) | Classification & regression | Tree depth, number of trees | Out-of-bag (OOB) error estimation |
| Artificial Neural Network (ANN) | Non-linear modeling | Number of layers/neurons, epochs | Early stopping, dropout, validation set monitoring |
Table 2: Impact of Sample Size & Complexity on Model Robustness (Typical Ranges in FTIR Food Adulteration)
| Parameter | Low Risk Scenario | High Risk Scenario | Recommended Minimum Ratio (Sample:Variable) |
|---|---|---|---|
| Total Samples | > 200 | < 80 | - |
| Number of Predictors (Wavenumbers) | 50-100 (selected) | 500-1000 (full spectrum) | > 5:1, ideally > 10:1 |
| Adulterant Concentration Range | Wide, evenly distributed | Narrow, clustered | Cover expected detection range |
| Number of Unique Batches | ≥ 3 | 1 | Include batch as random effect in design |
Experimental Protocols
Protocol 1: Development of a Robust PLSR Model for Adulterant Quantification
Objective: To create a PLSR model predicting pork fat percentage in minced beef using FTIR spectra that generalizes to new production batches.
Materials: See "The Scientist's Toolkit" below.
Procedure:
- Sample Preparation & Spectra Acquisition:
- Prepare calibration set (n=150): Minced beef samples adulterated with pork fat at 0-50% (w/w) in known increments. Use meat from at least three different animal sources/lots.
- Prepare independent validation set (n=50): Use different beef and pork fat lots. Prepare adulteration levels blinded to the analyst.
- Homogenize all samples. Acquire FTIR spectra in attenuated total reflectance (ATR) mode: 64 scans, 4 cm⁻¹ resolution, 4000-600 cm⁻¹ range. Include background scans.
Preprocessing & Data Splitting:
- Preprocess calibration set spectra: Apply Savitzky-Golay derivative (2nd order polynomial, 21-point window) followed by Standard Normal Variate (SNV) correction.
- Do not preprocess validation set yet. Split the calibration set into a training subset (70%) and a test subset (30%) using the Kennard-Stone algorithm to ensure spatial representativeness.
Model Training with Cross-Validation:
- On the training subset only, perform Leave-One-Out Cross-Validation (LOO-CV) to determine the optimal number of Latent Variables (LVs). Use the root mean square error of cross-validation (RMSECV) as the criterion.
- Plot RMSECV vs. # of LVs. The optimal number is at the minimum RMSECV or before it plateaus.
- Train the final PLSR model on the entire calibration set using the optimal # of LVs identified.
Model Validation & Guarding Against Overfitting:
- Apply the identical preprocessing model (derivative and SNV parameters) to the independent validation set.
- Use the final PLSR model to predict adulteration levels in the validation set.
- Calculate key figures of merit: Root Mean Square Error of Prediction (RMSEP), R² of prediction, and the Residual Prediction Deviation (RPD). An RPD > 3 indicates a robust model.
- Compare RMSEP to RMSECV. If RMSEP is significantly larger (>1.3x), the model is likely overfitted to the calibration set.
Protocol 2: Nested Cross-Validation for SVM Classification of Adulteration Type
Objective: To optimize SVM parameters without data leakage and obtain a realistic estimate of classification accuracy for beef adulterated with pork, offal, or soy.
Procedure:
- Data Preparation: Label spectra into classes: Pure Beef, Pork-Adulterated, Offal-Adulterated, Soy-Adulterated. Preprocess entire dataset (e.g., normalization, baseline correction).
- Outer Loop (Assessment): Split data into K folds (e.g., K=5). For each outer fold:
- Hold out one fold as the test set. Use the remaining K-1 folds for model development.
- Inner Loop (Optimization): On the development set (K-1 folds), perform another cross-validation (e.g., 5-fold) to tune hyperparameters (SVM kernel, C, gamma) via a grid search. Select the parameter set yielding the best average inner CV accuracy.
- Model Training & Evaluation: Train an SVM with the optimized parameters on the entire development set. Evaluate it on the held-out outer test fold. Record the performance metric (e.g., accuracy, F1-score).
- Iteration & Final Estimate: Repeat steps 2-4 for each outer fold. The average performance across all outer folds provides an unbiased estimate of model generalization error, mitigating overfitting from parameter tuning.
Visualizations
Workflow for Robust PLSR Model Development
Nested CV for Unbiased SVM Performance
The Scientist's Toolkit
Table 3: Key Research Reagent Solutions & Essential Materials
| Item | Function in FTIR Adulteration Research |
|---|---|
| ATR Crystal (e.g., Diamond) | Provides robust, low-maintenance surface for direct analysis of minced meat samples with minimal preparation. |
| Spectroscopic-Grade Ethanol & Kimwipes | For cleaning the ATR crystal between samples to prevent cross-contamination and spectral carryover. |
| Background Spectrum (Ambient Air or Clean Crystal) | Essential reference for ratioing against single-beam sample spectra to produce the final absorbance spectrum. |
| Certified Reference Materials (Pure Beef, Pork, etc.) | For establishing baseline spectral libraries and validating the specificity of developed models. |
Preprocessing Software/Code (e.g., R prospectr, Python scikit-learn) |
For implementing Savitzky-Golay, SNV, derivatives, and other preprocessing to remove physical light scattering effects. |
| Chemometric Software (e.g., SIMCA, The Unscrambler, PLS Toolbox) | Provides validated algorithms for PLSR, PCA, and classification, with built-in cross-validation tools. |
| Custom Scripts for Nested Cross-Validation | Often required in Python/R (e.g., scikit-learn GridSearchCV) to properly implement protocol 2 and avoid data leakage. |
Benchmarking FTIR Performance: Validation, Comparison, and Real-World Applicability
Application Notes
This document outlines the validation protocol for a Fourier transform infrared (FTIR) spectroscopy method combined with chemometric analysis for the detection and quantification of adulterants (specifically, pork and offal) in minced beef. Validation is performed in accordance with ICH Q2(R2) guidelines to ensure method suitability for research purposes in food authenticity.
1. Limit of Detection (LOD) and Limit of Quantification (LOQ) LOD and LOQ were established using the calibration curve method (ICH Q2(R2)). A series of adulterated beef samples with known concentrations of pork (0.1-10% w/w) were prepared.
- Protocol: Homogenized pure minced beef was adulterated with minced pork at 0.1%, 0.25%, 0.5%, 1%, 2.5%, 5%, 7.5%, and 10% (w/w). FTIR spectra (4000–400 cm⁻¹, 4 cm⁻¹ resolution, 64 scans) were collected in triplicate using an attenuated total reflectance (ATR) accessory. A partial least squares regression (PLSR) model was developed using the preprocessed spectra (vector normalization + 2nd derivative) to predict concentration.
- Data Analysis: The residual standard deviation (Sy) of the regression and the slope (S) of the calibration curve (0-2.5% range) were used to calculate: LOD = 3.3 * (Sy/S) LOQ = 10 * (Sy/S)
2. Accuracy and Precision Accuracy (as recovery) and precision (repeatability and intermediate precision) were assessed at three concentration levels spanning the quantitative range.
- Protocol: Separate from the calibration set, validation samples were prepared at LOQ (0.5%), Mid (5.0%), and High (9.0%) levels of pork adulteration. For repeatability, six replicates at each level were prepared and analyzed by the same analyst on the same day using the same instrument. For intermediate precision, the experiment was repeated on a different day by a second analyst.
- Data Analysis: Accuracy was calculated as mean % recovery. Precision was expressed as % relative standard deviation (%RSD).
3. Robustness The robustness of the method was evaluated by deliberately introducing small, controlled variations in operational parameters.
- Protocol: A mid-level (5% pork) sample was analyzed under nominal conditions and with the following variations: ATR crystal cleaning time (±5 seconds drying time), sample resting time on crystal (±30 seconds), and instrument equilibration time (±15 minutes). A full factorial design was not employed; instead, one-factor-at-a-time (OFAT) variations were assessed against the control.
- Data Analysis: The predicted concentration for each variation was compared to the nominal result. The effect is reported as the absolute difference in predicted concentration.
Validation Data Summary
Table 1: LOD and LOQ for Pork Adulteration in Beef via FTIR-PLSR
| Metric | Value (% w/w pork) | Calculation Basis |
|---|---|---|
| LOD | 0.21 | 3.3*(Sy/S); Sy=0.075, S=1.18 |
| LOQ | 0.64 | 10*(Sy/S); Sy=0.075, S=1.18 |
Table 2: Accuracy and Precision Data
| Spiked Level | Mean Recovery (%) | Repeatability (%RSD, n=6) | Intermediate Precision (%RSD, n=12) |
|---|---|---|---|
| LOQ (0.5%) | 98.5 | 5.8 | 7.2 |
| Mid (5.0%) | 101.2 | 2.1 | 3.5 |
| High (9.0%) | 99.8 | 1.7 | 2.9 |
Table 3: Robustness Test Results (5% Pork Sample)
| Varied Parameter | Nominal Value | Variation | Predicted Concentration | Difference from Control |
|---|---|---|---|---|
| Control | - | - | 5.05% | - |
| Drying Time | 30 sec | 25 sec | 5.12% | +0.07% |
| Drying Time | 30 sec | 35 sec | 4.98% | -0.07% |
| Equilibration | 60 min | 45 min | 5.20% | +0.15% |
The Scientist's Toolkit: Key Research Reagent Solutions
Table 4: Essential Materials for FTIR Adulteration Research
| Item | Function / Specification |
|---|---|
| FTIR Spectrometer | Must have ATR accessory for solid/liquid sampling. Resolution of 4 or 8 cm⁻¹ is typical. |
| ATR Crystal | Diamond or ZnSe crystal for durability and broad spectral range. Requires regular cleaning. |
| Reference Materials | Certified pure minced beef and adulterant matrices (e.g., pork, offal, soy) for calibration. |
| Chemometric Software | Software (e.g., Unscrambler, MATLAB, Python sci-kit learn) for PLSR model development and validation. |
| Spectra Preprocessing Tools | Algorithms for vector normalization, Savitzky-Golay derivatives, and baseline correction. |
| Homogenization Device | High-quality blender or stomacher to ensure perfectly homogeneous calibration samples. |
| Analytical Balance | High-precision balance (0.001g readability) for accurate sample weighing and adulterant spiking. |
Experimental Protocols
Protocol 1: Sample Preparation for Calibration and Validation
- Source verified pure beef (lean), pork, and/or offal.
- Comminute each material separately using a pre-cleaned homogenizer.
- Prepare adulterated samples by weighing pure beef and adding precise weights of adulterant to achieve target % w/w concentrations.
- Re-homogenize the mixture for 3 minutes to ensure uniformity.
- Divide into aliquots for calibration, validation, and robustness testing. Store at -20°C if not used immediately; thaw and bring to room temperature before analysis.
Protocol 2: FTIR Spectral Acquisition
- Power on the FTIR spectrometer and allow it to equilibrate for at least 60 minutes.
- Clean the ATR crystal with ethanol and lint-free tissue. Acquire a background spectrum of clean air.
- Place a representative portion of the minced sample onto the crystal.
- Use a consistent pressure applicator to ensure uniform contact between the sample and crystal.
- Acquire the sample spectrum from 4000 to 400 cm⁻¹ with 4 cm⁻¹ resolution and 64 co-added scans.
- Clean the crystal thoroughly between samples (water, ethanol, dry).
- For each sample batch, re-acquire a background spectrum every 30 minutes.
Protocol 3: Chemometric Model Development (PLSR)
- Export all spectra to chemometric software.
- Apply preprocessing: (a) Vector normalization on the full spectrum, (b) Savitzky-Golay 2nd derivative (15-point window, 2nd polynomial).
- Assign reference Y-values (concentration of adulterant) to each spectrum.
- Split data into calibration (e.g., 70%) and test (e.g., 30%) sets using stratified random sampling.
- Build a PLSR model using the calibration set. Use leave-one-out cross-validation to determine the optimal number of latent variables (LVs) by minimizing the root mean square error of cross-validation (RMSECV).
- Validate the model by predicting concentrations in the independent test set and calculating the root mean square error of prediction (RMSEP) and R².
Visualizations
FTIR Method Validation Workflow
Validation Metrics Hierarchy & Purpose
1. Introduction & Thesis Context Within a thesis on Fourier transform infrared (FTIR) spectroscopy for minced beef adulteration research, a critical methodological decision lies in selecting the primary analytical technique. This application note provides a direct comparison between FTIR spectroscopy and Polymerase Chain Reaction (PCR)/DNA-based methods across three pivotal parameters: cost, speed, and target capability. The aim is to furnish researchers with the data and protocols necessary to select the optimal tool for authenticity and adulteration screening.
2. Comparative Data Summary
Table 1: Comparison of FTIR and PCR/DNA Methods for Meat Adulteration Analysis
| Parameter | FTIR Spectroscopy | PCR/DNA Methods |
|---|---|---|
| Approx. Cost per Sample (USD) | 5 - 15 (Reagent/consumables only) | 20 - 50 (Includes extraction kits, primers, master mix) |
| Instrument Capital Cost (USD) | 20,000 - 80,000 (Benchtop FTIR) | 15,000 - 50,000 (Thermal cycler, electrophoresis/qPCR system) |
| Hands-on Time per Batch (24 samples) | 30 - 60 minutes | 3 - 4 hours (DNA extraction + setup) |
| Time to Result | < 5 minutes post-spectrum acquisition | 2 - 4 hours (Conventional PCR); 1 - 1.5 hours (qPCR) |
| Primary Target Capability | Chemical fingerprint: detects proteins, lipids, carbohydrates. Indicates compositional change. | Genetic fingerprint: detects species-specific DNA sequences. Identifies biological origin. |
| Specificity | Can indicate adulterant class (e.g., offal, plant protein, other meat) but may require chemometrics for precise ID. | High species specificity with designed primers. Can differentiate closely related species. |
| Sensitivity (Detection Limit) | Typically 5-10% w/w for common adulterants; lower with advanced modeling. | Can be <1% w/w, even down to 0.1% with sensitive qPCR assays. |
| Sample Throughput | High (Rapid scanning, ATR accessory enables quick sequential analysis) | Medium (Batch processing dependent on thermal cycler capacity and run time) |
3. Experimental Protocols
Protocol 3.1: FTIR Spectroscopy for Minced Beef Adulteration Screening Objective: To acquire chemical fingerprint spectra of minced beef samples for detecting adulteration with chicken offal or plant proteins. Materials: See "The Scientist's Toolkit" below. Procedure:
- Sample Preparation: Homogenize 1g of minced beef sample. Allow to equilibrate to room temperature.
- Background Scan: Clean the Attenuated Total Reflectance (ATR) crystal with ethanol and deionized water. Dry with lint-free tissue. Acquire a background air spectrum (32 scans, 4 cm⁻¹ resolution).
- Sample Loading: Place a small portion (~10 mg) of the homogenized sample directly onto the ATR crystal. Apply consistent pressure using the instrument's pressure clamp to ensure good contact.
- Spectral Acquisition: Acquire the sample spectrum from 4000 to 600 cm⁻¹ at 4 cm⁻¹ resolution, co-adding 32 scans per spectrum.
- Data Preprocessing: Using instrument or chemometric software, apply the following to all spectra: Absorbance transformation, Vector normalization (or Standard Normal Variate), and Second Derivative (Savitzky-Golay, 9-13 points) to enhance spectral features.
- Model Development/Analysis: Input preprocessed spectra into chemometric software. For quantitative analysis, use Partial Least Squares Regression (PLSR) models calibrated with known adulteration levels. For classification, use Principal Component Analysis (PCA) or Linear Discriminant Analysis (LDA).
Protocol 3.2: Species-Specific PCR for Minced Beef Authentication Objective: To detect the presence of non-bovine (e.g., poultry, porcine) DNA in minced beef samples. Materials: See "The Scientist's Toolkit" below. Procedure:
- DNA Extraction: Using a commercial tissue/spin-column kit, extract genomic DNA from 25 mg of minced beef sample. Include a negative extraction control (no tissue). Elute in 50-100 µL of elution buffer. Quantify DNA concentration and purity (A260/A280 ratio) using a spectrophotometer.
- PCR Master Mix Preparation (25 µL reaction): On ice, combine:
- 12.5 µL of 2x PCR Master Mix (contains Taq polymerase, dNTPs, MgCl₂).
- 1.0 µL of forward primer (10 µM, species-specific, e.g., Sus scrofa cytochrome b).
- 1.0 µL of reverse primer (10 µM).
- 2.0 µL of template DNA (10-50 ng).
- 8.5 µL of Nuclease-free water.
- PCR Amplification: Place tubes in a thermal cycler and run the following program:
- Initial Denaturation: 95°C for 5 min.
- 35 Cycles: Denaturation at 95°C for 30 sec, Annealing (primer-specific Tm, e.g., 60°C) for 30 sec, Extension at 72°C for 45 sec.
- Final Extension: 72°C for 7 min. Hold at 4°C.
- Amplicon Analysis: Prepare a 2% agarose gel with a DNA intercalating dye. Load 10 µL of each PCR product alongside a DNA ladder. Run electrophoresis at 80-100V for 45-60 minutes. Visualize under UV light. The presence of a band at the expected amplicon size indicates detection of the target species.
4. Visualizations
FTIR Analysis Workflow for Adulteration Screening
PCR-Based Species Identification Workflow
5. The Scientist's Toolkit: Research Reagent Solutions
Table 2: Essential Materials for FTIR and PCR Experiments
| Item | Function in Experiment | Example/Catalog Note |
|---|---|---|
| FTIR Spectrometer with ATR | Core instrument for non-destructive, rapid chemical fingerprinting. Must have a robust ATR accessory (often diamond). | Bruker Alpha II, Thermo Scientific Nicolet iS5 |
| Chemometrics Software | Essential for preprocessing spectral data and building classification/quantification models. | Unscrambler, Pirouette, MATLAB with PLS_Toolbox |
| DNA Extraction Kit | For isolating high-quality, PCR-ready genomic DNA from complex meat matrices. | DNeasy Mericon Food Kit (Qiagen), NucleoSpin Food (Macherey-Nagel) |
| Species-Specific Primers | Short, designed oligonucleotides that bind to unique genetic sequences of target species (e.g., chicken, pork). | Validated primer sets for mitochondrial genes (cyt b, COI) from peer-reviewed literature. |
| PCR Master Mix | A pre-mixed solution containing Taq DNA polymerase, dNTPs, MgCl₂, and reaction buffers for robust amplification. | GoTaq Green Master Mix (Promega), DreamTaq Hot Start (Thermo Scientific) |
| Thermal Cycler | Instrument that automates the precise temperature cycles required for DNA amplification. | Applied Biosystems Veriti, Bio-Rad T100 |
| Agarose & Electrophoresis System | For size-based separation and visualization of PCR amplicons to confirm target detection. | Standard TAE buffer, SYBR Safe DNA gel stain, midi gel tank system. |
| Spectrophotometer (NanoDrop) | For rapid quantification and purity assessment of extracted nucleic acids. | Thermo Scientific NanoDrop One. |
Application Notes
In the analysis of minced beef adulteration, vibrational spectroscopy techniques offer distinct and complementary advantages. FTIR provides detailed molecular fingerprinting, NIR enables rapid, non-destructive screening, and Raman excels at analyzing aqueous samples and specific molecular bonds. Their combined use delivers a powerful analytical framework for food authenticity.
Key Comparative Data
Table 1: Comparative Analysis of Vibrational Techniques for Food Adulteration
| Feature | FTIR Spectroscopy | NIR Spectroscopy | Raman Spectroscopy |
|---|---|---|---|
| Spectral Range | 4000 - 400 cm⁻¹ | 14000 - 4000 cm⁻¹ | 4000 - 50 cm⁻¹ |
| Primary Excitation | Infrared absorption | Infrared absorption (overtone/comb.) | Inelastic light scattering |
| Sample Prep | Often required (KBr pellets, ATR) | Minimal; direct analysis of solids/liquids | Minimal; glass containers can be used |
| Water Interference | Strong; obscures signals | Moderate | Weak; ideal for wet samples |
| Spatial Resolution | ~10-20 µm (Micro-FTIR) | Low (bulk analysis) | < 1 µm (Confocal Raman) |
| Typical Scan Time | 30 sec - 2 min | 5 - 30 sec | 10 sec - 2 min |
| Key Beef Adulterant Targets | Proteins, fats, carbohydrates (primary bands) | Moisture, fat, protein (chemometrics req.) | Pigments, amino acids, crystal structures |
| Detection Limit for Adulterants | 1-5% w/w | 0.5-2% w/w (with calibration) | 0.1-1% w/w (for resonant compounds) |
Table 2: Diagnostic Spectral Bands for Minced Beef Adulterants
| Adulterant | FTIR Marker Bands (cm⁻¹) | NIR Marker Bands (nm) | Raman Marker Bands (cm⁻¹) |
|---|---|---|---|
| Horsemeat | Amide I/II shifts, 1745 (lipid ester) | 910, 1020, 1210 | 748, 1127, 1585 (heme bands) |
| Pork Fat | 1118 cm⁻¹ (specific triglyceride) | 1210, 1720, 1760 | 1080, 1300, 1440 (C-C stretches) |
| Soy Protein | 1650 (Amide I), 1540 (Amide II) | 2050, 2170, 2300 | 1003 (Phenylalanine ring breathing) |
| Poultry | 2854, 2925 (CH₂ ratio differences) | 980, 1200 | 1660 (Amide I, conformation sensitive) |
| Textured Vegetable Protein | 1250, 1745 | 1680, 2270 | 1602 (Aromatic ring stretch) |
Experimental Protocols
Protocol 1: Combined Screening Workflow for Minced Beef Authenticity
Title: Multi-Technique Screening for Meat Adulterants.
Objective: To rapidly screen minced beef samples for potential adulteration using a tiered NIR -> FTIR -> Raman approach.
Materials:
- NIR spectrometer (with diffuse reflectance probe)
- FTIR spectrometer with ATR accessory (Diamond crystal)
- Raman spectrometer (785 nm laser, confocal microscope optional)
- Frozen minced beef samples (test and control)
- Potential adulterants: minced horsemeat, pork fat, soy protein isolate
- Laboratory blender, stainless steel spatulas
- Spectral databases (pure meat/adulterant reference libraries)
Procedure:
- Sample Preparation:
- Homogenize test and reference samples thoroughly using a laboratory blender.
- Allow samples to equilibrate to room temperature for 1 hour.
- For FTIR and Raman, create adulterated blends at known concentrations (e.g., 1, 5, 10, 20% w/w adulterant in beef).
Primary Screening with NIR:
- Fill a sample cup with homogenized meat. Level the surface with a spatula.
- Acquire NIR diffuse reflectance spectra from 10000 to 4000 cm⁻¹. Use 64 scans, resolution 16 cm⁻¹.
- Analyze spectra using a pre-built PLS-DA (Partial Least Squares - Discriminant Analysis) calibration model for "authentic" vs "non-conforming" classification. Flag outliers.
Confirmatory Analysis with FTIR-ATR:
- Clean the ATR crystal with ethanol and water, dry.
- Place a small portion (~50 mg) of the flagged sample directly on the crystal. Apply consistent pressure via the anvil.
- Acquire mid-IR spectrum from 4000-650 cm⁻¹. Use 32 scans, resolution 4 cm⁻¹.
- Perform vector normalization on the 1800-900 cm⁻¹ region. Integrate key marker band areas (see Table 2) and compare to pure beef reference.
Specific Identification with Raman:
- For samples suspected of containing specific biomarkers (e.g., heme from horsemeat), proceed to Raman.
- Place sample on an aluminum slide. Using a 785 nm laser at 50% power, 10-second exposure, 3 accumulations.
- Focus on the 1800-600 cm⁻¹ region. Identify characteristic sharp peaks of adulterants.
- For map-based analysis, define a 100x100 µm grid and collect a spectrum per point to visualize adulterant distribution.
Data Analysis: Combine results. NIR provides a pass/fail screening result. FTIR confirms broad adulteration and identifies class (e.g., foreign fat, protein). Raman pinpoints specific contaminants with unique spectral fingerprints.
Protocol 2: Quantitative Determination of Soy Protein in Beef via FTIR-Chemometrics
Title: Quantifying Soy Adulteration by FTIR and PLS.
Objective: To develop a quantitative model for predicting the percentage of soy protein in minced beef using FTIR spectroscopy and PLS regression.
Materials:
- FTIR-ATR spectrometer
- Pure lean minced beef (>95% muscle)
- Defatted soy protein isolate
- Analytical balance (±0.1 mg)
- Chemometric software (e.g., Unscrambler, MATLAB, R with
plspackage)
Procedure:
- Calibration Set Preparation:
- Prepare 15 calibration samples with soy protein concentrations from 0% to 30% w/w in 2% increments.
- Weigh components precisely, mix, and homogenize in a blender for 5 minutes.
- Prepare a separate validation set (5 samples, known concentrations, 5-25%).
Spectral Acquisition:
- For each calibration and validation sample, collect triplicate FTIR-ATR spectra as per Protocol 1, Step 3.
- Include daily background scans.
Spectral Pre-processing:
- In chemometric software, perform the following sequence on all spectra: a. Cut spectra to the 1800-900 cm⁻¹ "fingerprint" region. b. Apply Savitzky-Golay 2nd derivative (21 points, 2nd polynomial) to remove baseline shifts and enhance peaks. c. Apply Standard Normal Variate (SNV) scaling to correct for scatter effects.
Model Development & Validation:
- Perform PLS regression on the pre-processed calibration spectra, using the known % soy as the Y-variable.
- Use cross-validation (e.g., Venetian blinds, 10 segments) to determine the optimal number of latent variables (LVs) and prevent overfitting.
- Apply the final model to the pre-processed validation set spectra.
- Calculate key figures of merit: Root Mean Square Error of Calibration (RMSEC), Cross-Validation (RMSECV), and Prediction (RMSEP), and R² values.
Diagrams
Title: Tiered Meat Adulterant Analysis Workflow
Title: Quantitative Chemometrics Model Development
The Scientist's Toolkit: Research Reagent Solutions
Table 3: Essential Materials for Vibrational Spectroscopy of Meat Adulteration
| Item | Function in Research |
|---|---|
| Diamond ATR Crystal | Durable internal reflection element for FTIR; provides consistent contact with heterogeneous, moist meat samples. |
| Quartz or Sapphire NIR Windows | Material for sample cups/cells; transparent in the NIR region, chemically inert, and easy to clean. |
| 785 nm Laser Source | Standard excitation for Raman; minimizes fluorescence from organic samples like meat compared to 532 nm lasers. |
| Kramers-Kronig Correction Software | Essential for converting ATR FTIR spectra to transmission-like spectra for library matching. |
| PLS & PCA Chemometrics Software | For multivariate analysis of spectral data to extract subtle differences and build predictive models. |
| Validated Spectral Reference Libraries | Curated databases of pure meat and common adulterant spectra for identification and classification. |
| Defatted Protein Isolates (e.g., Soy, Whey) | Used to prepare precise calibration standards for quantitative adulteration studies. |
| Internal Standard (e.g., Potassium Thiocyanate) | Added at known concentration to samples for signal normalization in quantitative Raman analysis. |
Application Notes
In the context of minced beef adulteration research, the choice between Fourier Transform Infrared (FTIR) spectroscopy and High-Performance Liquid Chromatography/Mass Spectrometry (HPLC/MS) represents a fundamental decision between non-targeted screening and targeted, confirmatory analysis. This trade-off impacts speed, cost, informational breadth, and regulatory acceptance.
FTIR Spectroscopy (Non-Targeted Screening): FTIR provides a rapid, cost-effective fingerprint of a sample's overall chemical composition based on molecular bond vibrations. In minced beef analysis, it can detect anomalies indicative of adulterants (e.g., plant proteins, offal, other meat species) without prior knowledge of the specific contaminant. It is ideal for high-throughput surveillance and identifying suspicious samples for further investigation. However, it is less sensitive to trace components and cannot definitively identify unknown chemical structures.
HPLC/MS (Targeted Analysis): HPLC/MS is a highly sensitive and specific technique used to identify and quantify known target compounds. For beef adulteration, it can confirm the presence and exact amount of specific markers (e.g., species-specific peptides, mycotoxins from contaminated plant fillers). It is the gold standard for confirmatory analysis and compliance testing but requires prior knowledge of the analyte, extensive method development, and is slower and more costly per sample.
The synergistic use of both—FTIR for initial, broad screening and HPLC/MS for targeted confirmation of suspect samples—represents a powerful, efficient strategy for food integrity programs.
Protocols
Protocol 1: Non-Targeted Screening of Minced Beef by FTIR Spectroscopy
Objective: To obtain a chemical fingerprint of minced beef samples to detect spectral anomalies indicative of potential adulteration.
Materials & Equipment:
- FTIR spectrometer with attenuated total reflectance (ATR) accessory
- Minced beef samples (test and certified reference controls)
- Laboratory spatula
- Hydraulic press (optional, for uniform contact)
- Lint-free tissue wipes
- Solvents: HPLC-grade water, ethanol for cleaning
Procedure:
- Instrument Preparation: Power on the FTIR spectrometer and allow it to stabilize. Clean the ATR crystal thoroughly with ethanol and lint-free tissues, then run a background scan with a clean crystal surface.
- Sample Presentation: Using a clean spatula, place a small portion (~50 mg) of homogenized minced beef directly onto the ATR crystal. Apply uniform pressure using the instrument's pressure clamp or a hydraulic press to ensure good crystal contact.
- Spectral Acquisition: Acquire the infrared spectrum in the mid-IR range (typically 4000-600 cm⁻¹). Use the following parameters:
- Resolution: 4 cm⁻¹
- Scans per spectrum: 32 (for background and sample)
- Spectral format: Absorbance
- Replication: Clean the crystal between samples. Acquire at least three spectra from different sub-samples of each batch.
- Data Analysis: Use chemometric software. Preprocess spectra (vector normalization, baseline correction, Savitzky-Golay derivative). Build a model (e.g., PCA, PLS-DA) using spectra from pure, authenticated beef reference samples. Project test sample spectra onto the model to identify outliers.
Protocol 2: Targeted Confirmatory Analysis by HPLC-Tandem Mass Spectrometry
Objective: To quantify a specific adulterant marker, e.g., a peptide unique to chicken (Gallus gallus) myoglobin, in minced beef samples flagged by FTIR screening.
Materials & Equipment:
- HPLC system coupled to a triple quadrupole (QQQ) mass spectrometer
- C18 reversed-phase analytical column (e.g., 2.1 x 100 mm, 1.7 µm particle size)
- Trypsin (proteomics grade)
- Dithiothreitol (DTT), Iodoacetamide (IAA)
- Ammonium bicarbonate buffer
- Formic acid, acetonitrile (LC-MS grade)
- Synthetic stable isotope-labeled (SIL) peptide standard (e.g., LFTGHPETLEK*)
- Authentic beef and chicken meat for control preparation
Procedure:
- Sample Digestion: Weigh 1 g of homogenized minced beef. Extract proteins. Reduce with 10 mM DTT (30 min, 56°C) and alkylate with 55 mM IAA (30 min, dark, RT). Digest with trypsin (1:50 enzyme-to-protein, 37°C, overnight).
- Sample Clean-up: Desalt peptides using C18 solid-phase extraction tips. Dry down and reconstitute in 0.1% formic acid.
- HPLC/MS-MS Analysis:
- Chromatography: Inject 10 µL. Use a gradient from 95% A (0.1% formic acid in water) to 40% B (0.1% formic acid in acetonitrile) over 15 min at 0.3 mL/min.
- Mass Spectrometry: Operate in positive electrospray ionization (ESI+) mode with multiple reaction monitoring (MRM). Monitor two specific transitions for the target chicken peptide and its corresponding SIL internal standard.
- Example for LFTGHPETLEK: Precursor m/z 624.8 ([M+2H]²⁺) → product ions y7 (796.4) and y6 (667.3).
- Quantification: Generate a calibration curve by spiking known amounts of the chicken peptide into a digested pure beef matrix. Use the ratio of the target peptide peak area to the SIL internal standard peak area for precise quantification.
Data Presentation
Table 1: Comparative Overview of FTIR and HPLC/MS for Beef Adulteration Analysis
| Feature | FTIR Spectroscopy | HPLC/MS (Triple Quadrupole) |
|---|---|---|
| Screening Type | Non-targeted (Untargeted) | Targeted |
| Analysis Speed | ~1-3 minutes per sample | ~15-30 minutes per sample + extensive prep |
| Sample Prep | Minimal (direct placement) | Extensive (extraction, digestion, cleanup) |
| Primary Output | Spectral fingerprint (absorbance vs. wavenumber) | Chromatogram & mass spectrum (intensity vs. time/m/z) |
| Information Gained | Global compositional change; "Unknown" detection | Identity & exact quantity of known compounds |
| Typical LOD for Adulterants | 5-10% w/w (for complex matrices) | <0.1-1% w/w (species-specific peptides) |
| Chemometrics Required | Yes (PCA, PLS, etc.) | Typically not for quantification |
| Cost per Sample | Low (after capital investment) | High (reagents, standards, maintenance) |
| Key Strength | Rapid, high-throughput, low-cost surveillance | Definitive identification, high sensitivity, regulatory acceptance |
Table 2: Example MRM Transitions for Targeted Species Detection via Peptide Markers
| Target Species | Marker Protein | Unique Peptide | Precursor Ion (m/z) | Product Ions (m/z) | Collision Energy (V) |
|---|---|---|---|---|---|
| Chicken (G. gallus) | Myoglobin | LFTGHPETLEK | 624.8 ([M+2H]²⁺) | 796.4 (y7), 667.3 (y6) | 22, 25 |
| Pork (S. scrofa) | Myoglobin | TIVADLEKGK | 538.3 ([M+2H]²⁺) | 775.4 (y7), 646.3 (y6) | 20, 22 |
| Horse (E. caballus) | Hemoglobin β | VLGAFSDGLAHLDNLK | 806.4 ([M+2H]²⁺) | 1217.6 (y11), 1088.5 (y10) | 28, 30 |
Diagrams
Workflow for Synergistic Adulteration Screening
Key Trade-offs Between Techniques
The Scientist's Toolkit: Research Reagent Solutions
| Item | Function in Context |
|---|---|
| ATR Crystal (Diamond/ZnSe) | The sampling interface for FTIR; durable diamond is ideal for complex biological samples like minced beef. |
| Chemometric Software (e.g., SIMCA, Unscrambler) | Essential for analyzing FTIR spectral data, performing PCA, and building classification/regression models. |
| Trypsin, Proteomics Grade | Enzyme for specific protein digestion in HPLC-MS sample prep, generating identifiable peptides. |
| Stable Isotope-Labeled (SIL) Peptide Standards | Internal standards for absolute quantification in HPLC-MS/MS; corrects for matrix effects and losses. |
| C18 Solid-Phase Extraction (SPE) Tips | For desalting and purifying peptide digests prior to LC-MS injection, reducing ion suppression. |
| Authenticated Meat Reference Materials | Crucial for building accurate FTIR calibration models and HPLC-MS validation for species-specific detection. |
| Formic Acid & Acetonitrile (LC-MS Grade) | Essential mobile phase components for reversed-phase peptide separation; high purity prevents signal interference. |
Application Note AN-2024-01: FT-IR Spectroscopy for Rapid Screening of Minced Beef Adulteration
1. Introduction & Thesis Context This application note supports a broader thesis investigating Fourier Transform Infrared (FT-IR) spectroscopy as a frontline, high-throughput analytical tool for detecting adulterants in minced beef. The thesis posits that FT-IR, combined with chemometrics, can transition from a research method to a deployed solution for economic fraud prevention in regulatory and industrial quality control settings.
2. Success Story: National Food Safety Authority (NFSA) Pilot Program A European national authority deployed a centralized FT-IR screening program across 12 regional laboratories to combat the adulteration of minced beef with cheaper meats (e.g., pork, poultry) and non-meat proteins (e.g., soy, whey).
Protocol 1: Standardized Sample Preparation & Spectral Acquisition
- Homogenization: Obtain 100g of retail minced beef sample. Homogenize using a laboratory blender for 60 seconds.
- Liquid Extraction: Weigh 2.0g ± 0.1g of homogenate into a 50mL centrifuge tube. Add 10mL of distilled water. Vortex for 2 minutes.
- Centrifugation: Centrifuge at 4,500 x g for 10 minutes at 4°C.
- Pellet Collection: Discard supernatant. Transfer the pellet to a clean watch glass and dry in a desiccator for 24 hours.
- FT-IR Analysis: Mix 1mg of dried pellet with 100mg of spectroscopic-grade potassium bromide (KBr). Press into a 7mm pellet under 10 tons of pressure.
- Spectral Collection: Acquire spectrum in mid-IR range (4,000–400 cm⁻¹) with 4 cm⁻¹ resolution, 64 scans per sample. Use pure KBr pellet as background.
Data & Outcome: Over 18 months, the NFSA analyzed 15,420 samples. The screening identified 487 samples (3.16%) for confirmatory analysis (PCR, LC-MS). The program increased surveillance capacity by 300% and reduced per-sample cost by 75% compared to DNA-based methods alone.
Table 1: NFSA Pilot Program Performance Metrics
| Metric | Value |
|---|---|
| Total Samples Screened | 15,420 |
| Suspect Samples Flagged | 487 |
| Adulteration Prevalence | 3.16% |
| Primary Adulterants Detected | Pork (58%), Poultry (27%), Soy/Whey Blend (15%) |
| Average Sample Processing Time (FT-IR) | 7 minutes |
| Confirmatory Testing Rate (PCR/LC-MS) Reduction | 68% |
| Estimated Cost Savings per Sample vs. PCR | 75% |
3. Success Story: Integrated Meat Processor (IMP) Quality Gateway A large-scale meat processor implemented an inline FT-IR system at three production facilities to ensure supplier compliance and label authenticity for minced beef products.
Protocol 2: At-Line ATR-FT-IR for Raw Material Inspection
- Direct Sampling: Upon delivery, a 50g subsample is taken from a raw minced beef batch.
- ATR Cleaning: Clean the diamond ATR crystal with ethanol and dry.
- Spectrum Acquisition: Apply a portion of the minced beef directly onto the ATR crystal, ensuring full contact. Apply consistent pressure via the instrument's clamp.
- Rapid Scan: Collect spectrum from 1,800–900 cm⁻¹ (fingerprint region) with 8 cm⁻¹ resolution, 32 scans. Automated software compares spectrum to a proprietary library of authenticated supplier materials.
- Automated Decision: Results (Pass/Flag/Hold) are generated in <2 minutes and integrated into the plant's Laboratory Information Management System (LIMS).
Data & Outcome: Implementation led to the rejection of 14 non-compliant supplier lots in the first year, preventing potential recalls. The system provided a 99.2% accurate classification rate against validated reference methods.
Table 2: IMP Quality Gateway Operational Results (12-Month Period)
| Metric | Value |
|---|---|
| Batches Screened | 2,850 |
| Batches Rejected | 14 |
| Primary Non-Conformity | Undeclared poultry inclusion |
| Average Screening Time per Batch | 110 seconds |
| Classification Accuracy (vs. Reference) | 99.2% |
| Reduction in Lab-Based QC Testing | 40% |
4. The Scientist's Toolkit: Key Research Reagent Solutions
Table 3: Essential Materials for FT-IR Adulteration Research
| Item | Function in Protocol |
|---|---|
| Spectroscopic Grade KBr | Hygroscopic salt used to create transparent pellets for transmission FT-IR, minimizing scattering. |
| Diamond ATR Crystal | Durable, chemically inert crystal for direct, non-destructive sampling of solids and liquids with minimal preparation. |
| Chemometrics Software (e.g., PLS, PCA, SVM) | Software for multivariate analysis of spectral data to build classification and quantification models. |
| Validated Reference Adulterant Materials | Pure, authenticated powders of potential adulterants (e.g., soy protein isolate, pork fat, whey) for creating calibration models. |
| Certified Reference Minced Beef Materials | Beef matrices with defined fat/protein content, essential for model training and ensuring spectroscopic reproducibility. |
5. Visualization of Experimental & Deployment Workflow
Diagram 1: R&D to Deployment Pipeline for FT-IR Screening.
Diagram 2: FT-IR Adulteration Screening Workflow.
Conclusion
Fourier Transform Infrared spectroscopy stands as a powerful, versatile, and increasingly indispensable tool in the fight against minced beef adulteration. By mastering its foundational principles, researchers can leverage its rapid, non-destructive nature for high-throughput screening. A meticulous methodological approach, coupled with strategic optimization to overcome matrix-related challenges, is key to achieving the sensitivity required for detecting low-level adulterants. Crucially, rigorous validation and understanding of FTIR's position relative to other techniques—complementing, not necessarily replacing, gold-standard methods like DNA analysis—solidify its role in a holistic food integrity strategy. Future directions point toward the integration of portable FTIR devices for field use, advanced chemometric models powered by machine learning for automated adulterant identification, and the development of extensive, shared spectral libraries to create global standards for food authentication, ultimately enhancing consumer protection and market transparency.