HPLC vs. UV-Vis: A Strategic Guide to Recovery Rate Comparison for Accurate Pharmaceutical Analysis
This article provides a comprehensive comparison of High-Performance Liquid Chromatography (HPLC) and UV-Visible Spectrophotometry (UV-Vis) methods, with a specific focus on recovery rates—a critical parameter for assessing analytical accuracy in...
HPLC vs. UV-Vis: A Strategic Guide to Recovery Rate Comparison for Accurate Pharmaceutical Analysis
Abstract
This article provides a comprehensive comparison of High-Performance Liquid Chromatography (HPLC) and UV-Visible Spectrophotometry (UV-Vis) methods, with a specific focus on recovery rates—a critical parameter for assessing analytical accuracy in drug development. Tailored for researchers and pharmaceutical scientists, the content explores the fundamental principles of both techniques, their practical applications in complex matrices like formulations and biological fluids, and strategies for troubleshooting suboptimal recovery. It further details rigorous validation protocols and presents comparative case studies to guide method selection, ensuring reliable and compliant analytical outcomes for pharmaceutical quality control and therapeutic drug monitoring.
Understanding HPLC and UV-Vis: Core Principles and Their Impact on Recovery Rate Accuracy
In analytical chemistry, the recovery rate is a fundamental metric for assessing method accuracy, defined as the percentage of a known amount of analyte that is recovered when the test procedure is applied to the sample [1]. It provides documented evidence that an analytical method does what it is intended to do—measure the target substance correctly and consistently [2]. A recovery value close to 100% indicates high trueness, meaning the method yields results very close to the accepted reference value [3]. This parameter is validated through rigorous experiments and is important for ensuring reliability in fields ranging from pharmaceutical development to food safety and environmental monitoring. This guide objectively compares the performance of High-Performance Liquid Chromatography (HPLC) and Ultraviolet-Visible (UV-Vis) Spectrophotometry in terms of recovery rate, providing the experimental data and protocols necessary for informed method selection.
Understanding Recovery Rate in Method Validation
The recovery rate, often used synonymously with accuracy, is a measure of the closeness of agreement between the average value obtained from a large series of test results and an accepted reference value [1]. It is typically expressed as a percentage and calculated as follows:
Recovery (%) = (Measured Concentration / Known Concentration) × 100%
A recovery of 100% signifies no bias, while values significantly above or below 100% indicate a proportional bias in the method [1]. In practice, recovery experiments are conducted by analyzing samples spiked with known concentrations of the analyte. The resulting measured concentration is compared to the expected value to calculate the recovery percentage [2]. This process is often performed at multiple concentration levels (e.g., low, medium, and high) across the method's specified range to thoroughly establish accuracy [4] [2]. The data is then reported as the percent recovery of the known, added amount, sometimes accompanied by confidence intervals [2].
Key Research Reagent Solutions
The following table details essential reagents and materials commonly used in the development and validation of analytical methods, along with their critical functions.
| Reagent/Material | Function in Analytical Methods |
|---|---|
| C18 Chromatography Column | The stationary phase for reverse-phase HPLC; separates analytes based on their hydrophobicity [4] [5]. |
| Methanol (HPLC-grade) | A common organic solvent used in the mobile phase for HPLC to elute compounds from the column [4] [5]. |
| Formic Acid | A mobile-phase additive in HPLC; improves chromatographic performance by suppressing analyte ionization and enhancing peak shape [4]. |
| Analytical Reference Standards | High-purity compounds (e.g., Quercitrin, Levofloxacin) with known identity and concentration; used for calibration and to validate method accuracy [4] [5]. |
| Antimony Pentachloride (SbCl₅) | A derivatization reagent used in UV-Vis methods to form colored complexes with specific analytes (e.g., chalcones) for detection [6]. |
| Promethazine (PTZ) | A chromogenic reagent used in UV-Vis methods; reacts with oxidizing analytes (e.g., potassium bromate) to form a colored complex for measurement [7]. |
| Membrane Filter (0.45 µm) | Used to purify sample solutions by removing particulates that could damage HPLC columns or interfere with detection [4]. |
Experimental Protocols for Determining Recovery
The determination of recovery is integral to method validation protocols and follows a standardized approach.
Sample Preparation and Spiking
A known quantity of a pure analytical standard is added (spiked) into a blank or placebo matrix that mimics the real sample. For instance, in drug analysis, the analyte is spiked into the drug product's excipients. In food analysis, a contaminant like potassium bromate may be spiked into bread extract [7]. The spiked concentration should cover the method's range, typically at least three levels (low, medium, high) with multiple replicates (e.g., n=3) at each level [4] [2].
Extraction and Analysis
The spiked samples are then processed according to the analytical method—which includes steps like extraction, dilution, and derivatization—and analyzed alongside unspiked blanks and standard solutions [4] [7]. The measured concentration of the analyte in the spiked sample is determined from the calibration curve.
Recovery Calculation and Acceptance
The recovery percentage is calculated for each spiked sample. The results are summarized as the average recovery and relative standard deviation (RSD) at each concentration level. Acceptance criteria depend on the application but often fall within 98–102% for pharmaceutical assays, with wider ranges (e.g., 70–110%) acceptable for trace analysis of impurities or complex matrices [1] [2]. The RSD for precision at each level should typically be within acceptable limits (e.g., ≤8%) [4].
Comparative Experimental Data: HPLC vs. UV-Vis
A direct comparison of HPLC and UV-Vis methods for determining Levofloxacin released from a composite scaffold highlights significant differences in performance, particularly regarding recovery rate and precision [5].
Table 1: Method Performance Comparison for Levofloxacin Analysis [5]
| Method | Regression Equation (Linearity) | Correlation Coefficient (R²) | Recovery Rate (Mean ± SD) at Different Concentrations |
|---|---|---|---|
| HPLC | y = 0.033x + 0.010 | 0.9991 | Low (5 µg/ml): 96.37% ± 0.50%Medium (25 µg/ml): 110.96% ± 0.23%High (50 µg/ml): 104.79% ± 0.06% |
| UV-Vis | y = 0.065x + 0.017 | 0.9999 | Low (5 µg/ml): 96.00% ± 2.00%Medium (25 µg/ml): 99.50% ± 0.00%High (50 µg/ml): 98.67% ± 0.06% |
Table 2: Application-Specific Recovery Data from Analytical Literature
| Analyte (Matrix) | Method | Reported Recovery Range | Key Validation Parameters |
|---|---|---|---|
| Quercitrin (Pepper Extract) [4] | HPLC | 89.02% – 99.30% | Linearity: R² > 0.9997Precision RSD: 0.50% - 5.95% |
| Potassium Bromate (Bread) [7] | UV-Vis | 82.97% – 108.54% | Linearity: R² = 0.9962LOD/LOQ: 0.005 μg/g / 0.016 μg/g |
| Chalcones (Plant Extracts) [6] | UV-Vis | 98% – 102% | Linearity: R² = 0.9994Specificity: Specific for chalcones among flavonoids |
Analysis and Discussion of Comparative Performance
The data reveals a clear performance differential between HPLC and UV-Vis methods. HPLC generally provides superior specificity due to its separation power, effectively isolating the target analyte from complex sample matrices and resulting in more consistent and accurate recovery rates, as seen with quercitrin [4]. In the Levofloxacin study, while both methods showed excellent linearity, the HPLC recovery values were more variable, particularly at medium and high concentrations. This was attributed to UV-Vis's inability to distinguish the drug from other interfering substances released by the composite scaffold, leading to inaccurate concentration measurements [5].
UV-Vis spectroscopy, while more affordable and faster, is susceptible to matrix interference because it measures total absorbance without separation. This often necessitates extensive sample cleanup or derivatization to achieve specificity, as demonstrated by the use of antimony pentachloride for chalcones [6] or promethazine for potassium bromate [7]. Even with these steps, recovery can be wider-ranging, as shown in the potassium bromate study [7]. Consequently, UV-Vis is best suited for relatively simple matrices or for estimating total content of a class of compounds.
The recovery rate is a non-negotiable indicator of an analytical method's accuracy. The choice between HPLC and UV-Vis spectrophotometry directly impacts this critical parameter. HPLC is the unequivocal choice for applications demanding high accuracy in complex matrices, such as pharmaceutical drug release testing or quantifying specific compounds in plant extracts, due to its superior specificity and robust performance. UV-Vis remains a valuable, cost-effective tool for applications where the matrix is simple, the analyte has strong, unique absorbance, or the goal is a rapid estimation of total class content. Ultimately, the decision must be guided by the intended use of the method, the nature of the sample, and the required level of accuracy and precision, with validation data—particularly recovery rates—providing the essential evidence for fitness-for-purpose.
In the field of pharmaceutical development and quality control, the selection of an appropriate analytical technique is critical for obtaining reliable and meaningful data. Ultraviolet-visible (UV-Vis) spectroscopy and high-performance liquid chromatography (HPLC) represent two fundamentally different approaches to chemical analysis, each with distinct advantages and limitations. While UV-Vis spectroscopy offers remarkable simplicity and speed for specific applications, HPLC provides superior specificity for complex mixtures. This guide objectively compares the performance of UV-Vis spectroscopy against HPLC and other techniques, with particular focus on their application in drug analysis, recovery rate studies, and method validation. The fundamental principles of UV-Vis spectroscopy make it an attractive option for routine analyses, but its chromophore-dependent nature presents significant limitations that researchers must carefully consider when designing analytical protocols, especially in the context of drug stability testing, impurity profiling, and formulation analysis [8] [9].
Theoretical Foundations and Practical Implementation
Fundamental Principles of UV-Vis Spectroscopy
UV-Vis spectroscopy operates on the principle that molecules containing chromophores can absorb light in the ultraviolet and visible regions of the electromagnetic spectrum (typically 190-800 nm) [9]. When a molecule is exposed to UV or visible light, electrons undergo transitions from ground state to excited state molecular orbitals, with the energy difference between these states determining the wavelength of absorption [10]. The extent of light absorption follows the Beer-Lambert law, which states that absorbance (A) is proportional to the concentration of the absorbing species: A = εlc, where ε is the molar absorptivity coefficient, l is the path length, and c is the concentration [9] [11]. This linear relationship forms the basis for quantitative analysis using UV-Vis spectroscopy.
The technique specifically detects molecules with chromophores - functional groups that absorb UV or visible light due to electron transitions. Common chromophores in pharmaceuticals include conjugated π-systems (e.g., in aromatic compounds), carbonyl groups, and other systems with non-bonding electrons [12]. The extent of conjugation significantly affects absorption characteristics; as conjugation increases, the energy required for π→π* transitions decreases, resulting in absorption at longer wavelengths (bathochromic shift) and increased intensity (hyperchromic effect) [12]. This chromophore dependency simultaneously defines the utility and limitations of UV-Vis spectroscopy, as compounds lacking suitable chromophores cannot be detected effectively [9] [11].
Instrumentation and Workflow
A basic UV-Vis spectrophotometer consists of several key components: a light source (typically deuterium lamp for UV, tungsten for visible), a monochromator to select specific wavelengths, a sample compartment, and a detector (photodiode or photomultiplier tube) [11]. Modern instruments often include sophisticated software for data acquisition, processing, and method validation. The typical workflow involves sample preparation (often requiring dilution in an appropriate solvent), instrument calibration, measurement of standards for calibration curves, and subsequent analysis of unknown samples [11].
Recent advancements in UV-Vis technology have expanded its applications in pharmaceutical sciences. UV dissolution imaging, for instance, generates spatially and temporally resolved absorbance maps, allowing researchers to visualize dissolution phenomena at the solid-liquid interface and monitor drug release in real-time [13]. This application demonstrates how traditional UV-Vis principles can be adapted for more complex analytical challenges in drug development.
Figure 1: Fundamental workflow of a UV-Vis spectrophotometer, illustrating the sequential process from light source to quantitative analysis.
Performance Comparison: UV-Vis Spectroscopy vs. HPLC
Quantitative Analysis of Recovery Rates
Recovery rate studies provide critical insights into the accuracy and reliability of analytical methods. The following table summarizes comparative recovery rate data from published studies that directly compared UV-Vis and HPLC methods for pharmaceutical compounds:
Table 1: Comparison of Recovery Rates Between HPLC and UV-Vis Methods for Pharmaceutical Compounds
| Compound Analyzed | HPLC Recovery Rate (%) | UV-Vis Recovery Rate (%) | Matrix/Formulation | Reference |
|---|---|---|---|---|
| Levofloxacin (Low Concentration) | 96.37 ± 0.50 | 96.00 ± 2.00 | Mesoporous silica microspheres/n-HA composite scaffolds | [14] |
| Levofloxacin (Medium Concentration) | 110.96 ± 0.23 | 99.50 ± 0.00 | Mesoporous silica microspheres/n-HA composite scaffolds | [14] |
| Levofloxacin (High Concentration) | 104.79 ± 0.06 | 98.67 ± 0.06 | Mesoporous silica microspheres/n-HA composite scaffolds | [14] |
| Voriconazole | 90-110% (RSD < 2%) | 90-110% (RSD < 2%) | Bulk and tablet dosage form | [15] |
The data demonstrates that while both methods can achieve acceptable recovery rates within pharmaceutical standards (typically 90-110%), HPLC generally provides more consistent results across different concentration ranges, particularly in complex matrices like composite scaffolds [14]. The precision of HPLC (as evidenced by lower standard deviations) offers distinct advantages for quantitative analysis, though UV-Vis remains suitable for simpler formulations where chromophore interference is minimal [15].
Comprehensive Method Comparison
The selection between UV-Vis and HPLC involves balancing multiple factors including specificity, sensitivity, complexity, and operational requirements. The following table provides a detailed comparison of these analytical techniques:
Table 2: Comprehensive Technical Comparison Between UV-Vis Spectroscopy and HPLC
| Parameter | UV-Vis Spectroscopy | High-Performance Liquid Chromatography (HPLC) |
|---|---|---|
| Principle | Absorption of UV/visible light by chromophores | Separation followed by detection (often UV-based) |
| Specificity | Low (measures total absorbance at wavelength) | High (separates compounds before detection) |
| Sensitivity | Moderate (depends on molar absorptivity) | High (pre-concentration and separation possible) |
| Linear Range | ~0.05-50 μg/ml (compound-dependent) | ~0.01-500 μg/ml (wider dynamic range) |
| Analysis Time | Fast (minutes) | Slow to moderate (10-30 minutes) |
| Sample Preparation | Minimal (often just dilution) | Extensive (filtration, extraction, etc.) |
| Cost | Low (equipment and operation) | High (equipment, solvents, columns) |
| Operator Skill | Basic training required | Advanced training needed |
| Applications | Quantitative analysis, kinetics, dissolution testing | Complex mixtures, impurity profiling, identity confirmation |
| Limitations | Chromophore required, interference from impurities | Higher cost, complexity, method development time |
This comparison highlights the fundamental trade-offs between these techniques. UV-Vis spectroscopy offers clear advantages in terms of speed, cost, and operational simplicity, making it ideal for high-throughput environments and routine analyses of pure compounds [11] [16]. However, its lack of specificity represents a significant limitation for complex samples, where HPLC's separation capabilities provide unequivocal advantages despite higher operational complexity and cost [14] [17].
Experimental Protocols and Methodologies
Detailed HPLC Method for Levofloxacin Analysis
The comparative study on Levofloxacin analysis provides a representative example of a validated HPLC method for pharmaceutical compounds [14]:
- Equipment: Shimadzu liquid chromatograph with LC-2010AHT gradient pump, CBM-20A system controller, and UV-Visible detector
- Column: Sepax BR-C18 (250 × 4.6 mm; 5 μm particle diameter)
- Mobile Phase: 0.01 mol/l KH₂PO₄, methanol, and 0.5 mol/l tetrabutylammonium hydrogen sulphate (75:25:4 ratio)
- Flow Rate: 1 ml/min
- Detection Wavelength: 290 nm
- Injection Volume: 10 μl for assay determination
- Column Temperature: 40°C
- Sample Preparation: Levofloxacin standard solutions prepared in simulated body fluid (SBF) across concentration range of 0.05-300 μg/ml. Internal standard (Ciprofloxacin) added to working solution, vortex-mixed for 5 minutes, followed by liquid-liquid extraction with dichloromethane, centrifugation at 7,155 × g for 5 minutes, and drying of supernatant under nitrogen at 50°C.
- Validation: Linear regression equation y = 0.033x + 0.010 with R² = 0.9991, precision RSD < 2%, recovery rates 96.37-110.96% across concentration range.
UV-Vis Spectrophotometric Method for Levofloxacin
The same study detailed the UV-Vis methodology for direct comparison [14]:
- Equipment: UV-2600 UV-Vis spectrophotometer
- Wavelength Selection: Scanning of standard solutions at 200-400 nm to determine maximum absorption wavelength
- Sample Preparation: Levofloxacin standard solutions prepared in SBF across concentration range of 0.05-300 μg/ml
- Measurement: After instrument zeroing, direct measurement of absorbance at λmax
- Validation: Linear regression equation y = 0.065x + 0.017 with R² = 0.9999, precision RSD < 2%, recovery rates 96.00-99.50% across concentration range.
Figure 2: Decision pathway for selecting between UV-Vis and HPLC methods based on sample complexity and analytical requirements.
Essential Research Reagents and Materials
Successful implementation of either UV-Vis or HPLC methods requires specific reagents and materials tailored to each technique. The following table details essential research reagents and their functions in pharmaceutical analysis:
Table 3: Essential Research Reagents and Materials for Pharmaceutical Analysis
| Reagent/Material | Function/Application | Technique |
|---|---|---|
| Methanol (HPLC-grade) | Mobile phase component; sample solvent | HPLC |
| Acetonitrile (HPLC-grade) | Organic modifier in mobile phase | HPLC |
| Buffer Salts (e.g., KH₂PO₄) | Mobile phase component for pH control | HPLC |
| Tetrabutylammonium bromide | Ion-pairing reagent for separation | HPLC |
| C18 Chromatography Columns | Stationary phase for reverse-phase separation | HPLC |
| Simulated Body Fluid (SBF) | Dissolution medium mimicking physiological conditions | Both |
| Reference Standards | Method calibration and quantification | Both |
| Ultrapure Water | Solvent and mobile phase component | Both |
| Appropriate Solvents (e.g., iso-propyl alcohol) | Sample dissolution for UV-Vis analysis | UV-Vis |
| Dichloromethane | Liquid-liquid extraction in sample preparation | HPLC |
The selection of appropriate reagents, particularly HPLC-grade solvents and high-purity reference standards, is critical for obtaining reliable results with either technique. For UV-Vis spectroscopy, solvent choice is especially important as many solvents have significant UV absorption that can interfere with analysis [9]. For HPLC method development, mobile phase composition and column selection significantly impact separation efficiency and must be optimized for each application [14] [17].
Implications for Pharmaceutical Research and Quality Control
The comparative data and methodological considerations presented in this guide have significant implications for pharmaceutical research and quality control practices. UV-Vis spectroscopy remains an indispensable tool for routine analyses, particularly in scenarios demanding rapid results, minimal sample preparation, and cost-effectiveness [11] [16]. Its extensive application in dissolution testing, drug stability assessment, and concentration verification of active pharmaceutical ingredients (APIs) underscores its utility in pharmaceutical quality systems [8] [16].
However, the recovery rate comparisons and specificity limitations clearly demonstrate that UV-Vis spectroscopy is not appropriate for all analytical scenarios. In complex formulations, drug delivery systems, and situations requiring impurity profiling, HPLC provides superior accuracy and reliability despite its greater operational demands [14]. The pharmaceutical industry's increasing reliance on hyphenated techniques (e.g., HPLC-UV) represents a strategic approach to leveraging the advantages of both techniques - the separation power of chromatography with the detection capabilities of UV spectroscopy [11].
Method selection should be guided by the specific analytical requirements, sample complexity, and regulatory considerations. For pure compounds with strong chromophores in simple matrices, UV-Vis spectroscopy offers an efficient and cost-effective solution. For complex mixtures, formulations with interfering compounds, or when specificity is paramount, HPLC remains the technique of choice despite its greater resource requirements. This balanced understanding of both techniques enables researchers to make informed decisions that optimize analytical workflows while ensuring data quality and regulatory compliance.
In the modern laboratory, High-Performance Liquid Chromatography (HPLC) serves as a cornerstone of analytical precision for the routine yet formidable challenge of analyzing complex mixtures [18]. From environmental monitoring and pharmaceutical research to metabolomics, samples rarely contain a single analyte of interest but instead present a symphony of thousands of components, many of which can interfere with accurate measurement [18]. The ability to precisely separate, identify, and quantify target compounds within this intricate matrix is what distinguishes routine analysis from groundbreaking discovery. This guide provides an objective comparison between HPLC and Ultraviolet-Visible (UV-Vis) spectrophotometry, focusing on their performance in method recovery rates—a critical parameter in pharmaceutical analysis and drug development. The content is framed within the broader context of analytical method selection, where understanding the inherent strengths and limitations of each technique is paramount for generating reliable and valid data.
HPLC vs. UV-Vis: A Fundamental Comparison
Core Principles and Mechanisms
High-Performance Liquid Chromatography (HPLC) is a sophisticated analytical technique used to separate, identify, and quantify components in a liquid mixture [18]. It operates by pumping a pressurized liquid solvent (the mobile phase) through a column packed with a solid adsorbent material (the stationary phase). The different components of the sample interact differently with the stationary phase due to their distinct chemical properties, causing them to move through the column at varying speeds and elute at different retention times [18]. The result is a chromatogram, a graphical representation that reveals the precise retention time and quantity of each separated component, providing a powerful snapshot of the sample’s composition [18].
Ultraviolet-Visible (UV-Vis) Spectrophotometry, in contrast, is a technique that measures the absorption of ultraviolet or visible light by a sample [9]. It operates on the principle that chromophores—functional groups in molecules that absorb light—will excite electrons to higher energy molecular orbitals when irradiated [9]. The amount of light absorbed at a specific wavelength is measured, and according to the Beer-Lambert Law, this absorbance is directly proportional to the concentration of the absorbing species in the solution [9]. Unlike HPLC, UV-Vis is a non-separative technique; it provides a composite absorbance for all light-absorbing species in the sample at the chosen wavelength.
Visualizing the Core Techniques
The following diagrams illustrate the fundamental workflows for HPLC and UV-Vis methods, highlighting the key steps that contribute to their differing selectivity.
Comparative Performance Data: Recovery Rates and Validation
The most significant distinction between HPLC and UV-Vis methods emerges in the analysis of complex samples, where the presence of multiple components can lead to interference. The following table summarizes key findings from comparative studies, with a focus on recovery rate—a crucial indicator of an analytical method's accuracy, defined as the percentage of a known amount of analyte that is recovered and measured.
Table 1: Comparative Analytical Performance of HPLC and UV-Vis Methods
| Analyte | Sample Matrix | HPLC Recovery Rate (%) | UV-Vis Recovery Rate (%) | Key Findings | Source |
|---|---|---|---|---|---|
| Voriconazole | Bulk & Tablet Dosage Form | 90-110% (within standard limits) | 90-110% (within standard limits) | Both methods were linear, precise, and accurate. HPLC provided separation from excipients. | [15] |
| Levofloxacin | Mesoporous Silica/n-HA Composite Scaffolds | 96.37 - 110.96% | 96.00 - 104.79% | UV-Vis was deemed inaccurate for measuring drug concentration in the complex scaffold system; HPLC is the preferred method. | [14] |
| Metformin Hydrochloride | Commercial Tablet Formulations | 98 - 101% | 92 - 104% | UHPLC showed superior repeatability and a tighter, more accurate recovery range compared to UV-Vis. | [19] |
| Sugars (e.g., Fructose, Glucose) | Honey | N/A | N/A | HPLC with RI detection is standard; UV detection at low wavelengths is possible but susceptible to interference in complex matrices. | [20] |
Interpretation of Comparative Data
The data from these controlled studies reveals a critical trend:
- For Simple Matrices: In the analysis of voriconazole in a relatively simple tablet dosage form, both HPLC and UV-Vis methods can be validated to perform within standard acceptance criteria (90-110% recovery) [15]. This demonstrates that UV-Vis is a capable and cost-effective technique for routine quality control of formulations where the active ingredient's absorption is distinct from excipients.
- For Complex Matrices: The study on levofloxacin released from a composite scaffold is particularly telling. While both techniques showed recovery rates close to 100%, the authors concluded that UV-Vis was not accurate for this application [14]. The complex scaffold components introduced interfering substances that absorbed at the same wavelength as the drug, leading to inaccurate concentration measurements despite a seemingly acceptable recovery. HPLC's power to physically separate the levofloxacin from these interferences before detection made it the unequivocally preferred method.
This underscores a fundamental point: a good recovery rate in a simple matrix does not guarantee accuracy in a complex one. HPLC's separation power provides a built-in mechanism to overcome matrix effects, leading to more reliable results in challenging samples.
Experimental Protocols for Method Comparison
To illustrate how the comparative data in Table 1 was generated, this section outlines standard experimental methodologies for developing and validating both HPLC and UV-Vis methods, focusing on the parameters critical for assessing recovery rate.
Detailed HPLC Protocol for Drug Analysis
The following protocol is synthesized from the methods used for voriconazole and levofloxacin analysis [15] [14].
Instrumentation and Materials:
- HPLC System: Equipped with a pump, autosampler, column thermostat, and UV or PDA detector.
- Column: A reverse-phase column, typically C18 (e.g., 250 mm x 4.6 mm, 5 µm particle size).
- Mobile Phase: A mixture of a water-soluble buffer and an organic solvent. For example, acetonitrile and 0.1% orthophosphoric acid in a 60:40 %v/v ratio [15] or a mixture of 0.01 mol/L KH₂PO₄, methanol, and 0.5 mol/L tetrabutylammonium hydrogen sulphate (75:25:4) [14].
- Standards: High-purity reference standard of the analyte.
Chromatographic Conditions:
Sample Preparation:
- The drug substance (bulk or extracted from formulation) is accurately weighed and dissolved in an appropriate solvent (e.g., simulated body fluid, methanol, or mobile phase) to a known concentration.
- For recovery studies, the sample is spiked with a known amount of the reference standard.
System Suitability and Calibration:
Detailed UV-Vis Protocol for Drug Analysis
This protocol is based on methods used for voriconazole, levofloxacin, and gepirone hydrochloride [15] [14] [21].
Instrumentation and Materials:
- UV-Vis Spectrophotometer: Equipped with matched quartz cuvettes.
- Solvent: A solvent that adequately dissolves the analyte and is transparent at the wavelength of interest. Iso-propyl alcohol, water, or buffers like 0.1N HCl are commonly used [15] [21].
- Standards: High-purity reference standard of the analyte.
Method Development:
- Wavelength Selection: A standard solution of the analyte is scanned over a range (e.g., 200-400 nm) to determine its λmax, the wavelength of maximum absorption (e.g., 256 nm for voriconazole, 233/235 nm for gepirone) [15] [21].
- Specificity: The absorbance spectrum of the sample is compared to that of the pure standard and a placebo (mixture of excipients) to check for overlapping absorptions.
Sample Preparation:
- Similar to HPLC, the drug is dissolved in the chosen solvent to a concentration within the Beer-Lambert law's linear range (e.g., 2–20 µg/mL for gepirone) [21].
Calibration and Validation:
The Scientist's Toolkit: Essential Research Reagents and Materials
The reliability of both HPLC and UV-Vis methods is contingent on the quality and appropriate selection of research materials. The following table details key reagents and their functions in method development.
Table 2: Essential Research Materials for HPLC and UV-Vis Analysis
| Material/Reagent | Function in Analysis | Example from Cited Studies |
|---|---|---|
| Reverse-Phase C18 Column | The stationary phase for separating analytes based on hydrophobicity. The heart of the HPLC system. | Used for separation of voriconazole and levofloxacin [15] [14]. |
| Acetonitrile & Methanol | Common organic modifiers for the mobile phase in reverse-phase HPLC. They control the strength of the mobile phase and the retention time of analytes. | Acetonitrile used for voriconazole; Methanol used for levofloxacin [15] [14]. |
| Buffers (e.g., Phosphate, Orthophosphoric Acid) | Added to the aqueous portion of the mobile phase to control pH and suppress ionization of analytes, ensuring reproducible separation and peak shape. | 0.1% orthophosphoric acid for voriconazole; 0.01M KH₂PO₄ for levofloxacin [15] [14]. |
| UV-Transparent Solvents | Solvents used in UV-Vis that do not absorb significantly at the wavelength of analysis, allowing for accurate measurement of the analyte's absorbance. | Iso-propyl alcohol for voriconazole; 0.1N HCl for gepirone [15] [21]. |
| Solid Phase Extraction (SPE) Cartridges | Used for sample preparation to clean up complex samples, remove interfering matrix components, and pre-concentrate analytes before injection into the HPLC. | Crucial for analyzing trace compounds in complex samples like biological fluids [18]. |
| Reference Standards | Highly pure compounds of known concentration and identity used to calibrate instruments and quantify the analyte in unknown samples. Essential for accurate recovery studies. | National Institutes for Food and Drug Control standard for levofloxacin [14]. |
Technical Advantages and Limitations in Practice
The Separation Power of HPLC
The primary advantage of HPLC is its unparalleled ability to resolve a complex mixture into its individual components. This is achieved by optimizing the three pillars of chromatography: selectivity, resolution, and efficiency [18].
- Column Chemistry: The selection of the stationary phase is paramount. While C18 columns are the industry standard, specialized columns like HILIC (for polar compounds), chiral columns (for enantiomers), and ion-exchange columns (for charged molecules) can dramatically improve selectivity for specific compound classes [18].
- Mobile Phase Optimization: Using gradient elution, where the solvent strength is gradually increased, can expand the separation window and prevent co-elution in samples with a wide range of analyte polarities [18].
- Advanced Detection: While UV detectors are common, coupling HPLC with Mass Spectrometry (MS) provides an unambiguous molecular signature for each separated component, allowing for high-confidence identification and quantification even when components co-elute [18].
The Simplicity and Vulnerability of UV-Vis
UV-Vis spectrophotometry's main advantage is its simplicity, cost-effectiveness, and speed for straightforward analyses [21] [9]. However, its fundamental limitation is the lack of separation.
- Susceptibility to Interference: Any compound in the sample that absorbs light at the same wavelength as the analyte will contribute to the total measured absorbance, leading to positively biased results. This makes it highly vulnerable to matrix effects [14].
- Beer-Lambert Law Deviations: The linear relationship between absorbance and concentration can deviate at high concentrations due to phenomena like absorption flattening, and the instrument's stray light can cause significant errors, especially at high absorbances [9].
- Limited Applicability: The analyte must contain a chromophore. Compounds without a UV-Vis chromophore, such as sugars, cannot be detected directly without derivatization, though they can sometimes be measured at very low wavelengths (e.g., <200 nm) with potential for more interference [20].
The following diagram summarizes the decision-making logic for method selection based on sample complexity and analytical requirements.
In the realm of pharmaceutical analysis and drug development, the selection of an appropriate analytical technique is paramount for ensuring accurate quantification of active pharmaceutical ingredients (APIs). High-performance liquid chromatography (HPLC) and ultraviolet-visible spectrophotometry (UV-Vis) represent two foundational methodologies employed for this purpose, each with distinct characteristics and applications [22]. This guide provides a direct, objective comparison of these techniques, framed within the critical context of recovery rate comparisons, to support researchers, scientists, and drug development professionals in making informed methodological choices. Recovery rate, which assesses a method's ability to accurately measure the analyte from a given matrix, serves as a key indicator of reliability, especially in complex sample analyses such as drug-delivery systems and formulated products [14].
Core Characteristics and Performance Comparison
Fundamental Principles and Instrumentation
UV-Vis Spectrophotometry: This technique measures the absorption of ultraviolet or visible light by an analyte. It is based on the Beer-Lambert law, which relates absorbance to concentration. The instrumentation is relatively simple, consisting of a light source, a monochromator, a sample holder, and a detector [22]. Its application is most reliable for analytes containing chromophores and in relatively simple matrices where spectral interferences are minimal.
High-Performance Liquid Chromatography (HPLC): HPLC is a separation technique that separates the components of a mixture based on their interactions with a stationary phase and a mobile phase. The separated analytes are then detected and quantified, often using a UV-Vis detector. The core components include a pump, an injector, a column, and a detector [22]. Its primary strength lies in its ability to isolate the target analyte from other components in a complex mixture before quantification.
Direct Comparative Data: Levofloxacin Analysis
A direct comparative study of HPLC and UV-Vis for quantifying Levofloxacin released from a mesoporous silica microspheres/nano-hydroxyapatite (n-HA) composite scaffold provides key performance metrics [14]. The data are summarized in the table below.
Table 1: Quantitative Method Performance Comparison for Levofloxacin Analysis
| Performance Parameter | HPLC Method | UV-Vis Method |
|---|---|---|
| Linear Regression Equation | y = 0.033x + 0.010 | y = 0.065x + 0.017 |
| Coefficient of Determination (R²) | 0.9991 | 0.9999 |
| Recovery Rate (Low Concentration, 5 µg/mL) | 96.37 ± 0.50% | 96.00 ± 2.00% |
| Recovery Rate (Medium Concentration, 25 µg/mL) | 110.96 ± 0.23% | 99.50 ± 0.00% |
| Recovery Rate (High Concentration, 50 µg/mL) | 104.79 ± 0.06% | 98.67 ± 0.06% |
The study concluded that while both methods demonstrated excellent linearity, UV-Vis was not accurate for measuring drugs loaded onto biodegradable composite scaffolds due to impurity interference. HPLC was identified as the preferred method for evaluating the sustained release characteristics of Levofloxacin from the composite scaffolds [14].
Broader Comparative Context
The findings from the Levofloxacin study are consistent with comparisons in other pharmaceutical and chemical contexts:
Analysis of Metformin Hydrochloride: A comparison of UHPLC (an advanced form of HPLC) and UV-Vis for quantifying metformin in commercial tablets found that while both were successful, UHPLC demonstrated superior precision. The repeatability (expressed as relative standard deviation) for UHPLC was <1.578%, compared to <3.773% for UV-Vis. The percentage recovery for UHPLC (98-101%) was also tighter than that for UV-Vis (92-104%) across five different products [19].
Analysis of Bakuchiol in Cosmetics: A study comparing UV-Vis, NMR, and HPLC for quantifying bakuchiol in cosmetic serums found that HPLC and NMR provided comparable results, while UV-Vis faced limitations. Specifically, for two emulsion-type samples (Samples 5 and 6), bakuchiol could not be properly extracted or quantified via UV-Vis due to the sample matrix, whereas HPLC successfully determined the content [23].
Experimental Protocols for Key Comparisons
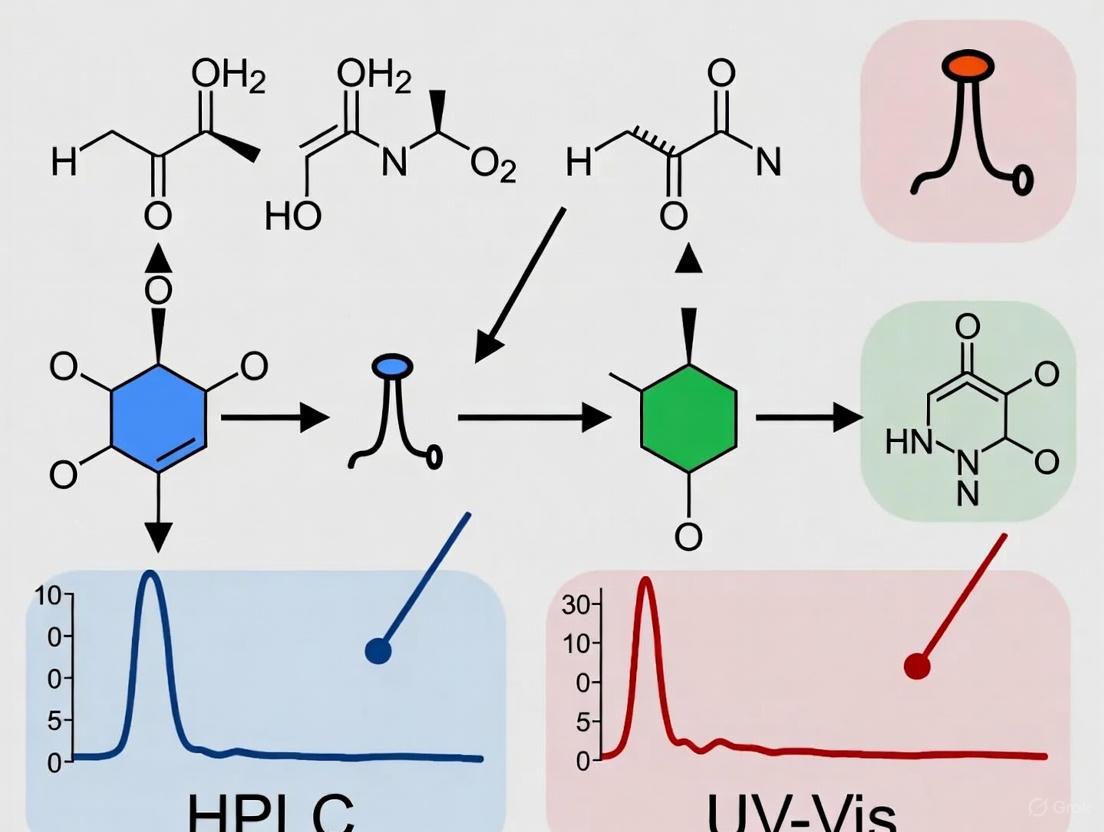
Detailed Methodology: Levofloxacin Release Study
The following protocol outlines the key experimental steps from the direct comparison of HPLC and UV-Vis for Levofloxacin quantification [14].
Diagram: Experimental Workflow for Method Comparison
The Scientist's Toolkit: Key Research Reagent Solutions
Table 2: Essential Reagents and Materials for HPLC and UV-Vis Analysis
| Reagent/Material | Function in Analysis | Example from Levofloxacin Study |
|---|---|---|
| Analytical Standard | High-purity reference compound for accurate calibration and quantification. | Levofloxacin (National Institutes for Food and Drug Control) [14]. |
| Internal Standard | Compound added to samples to correct for variability in sample preparation and injection; used in HPLC. | Ciprofloxacin (Sigma-Aldrich) [14]. |
| HPLC-Grade Solvents | High-purity solvents for mobile phase preparation to prevent column damage and baseline noise. | Methanol (HPLC-grade) [14]. |
| Buffering Salts | To maintain a constant pH in the mobile phase, ensuring reproducible separation. | KH₂PO₄ and Tetrabutylammonium bromide [14]. |
| Chromatographic Column | The stationary phase where the chemical separation of mixture components occurs. | Sepax BR-C18 column (250 × 4.6 mm; 5 µm) [14]. |
| Simulated Biological Fluid | A solution that mimics the ionic composition of body fluids for drug release studies. | Simulated Body Fluid (SBF) [14]. |
The direct, side-by-side comparison of HPLC and UV-Vis methodologies reveals a clear distinction in their application profiles, largely defined by the complexity of the sample matrix.
UV-Vis Spectrophotometry offers significant advantages in terms of speed, cost-effectiveness, and operational simplicity, making it an excellent choice for routine quality control of simple, single-component samples or for initial rapid screening [22]. Its limitations become apparent in complex matrices, where it lacks the specificity to distinguish the target analyte from interfering substances, leading to potentially inaccurate recovery rates, as demonstrated in the Levofloxacin-loaded scaffold study [14].
High-Performance Liquid Chromatography (HPLC) is characterized by its superior specificity, sensitivity, and accuracy, particularly when analyzing complex mixtures. Its ability to physically separate the analyte of interest from other components before detection makes it the gold standard for rigorous quantification, impurity profiling, and stability-indicating assays [14] [22]. The primary trade-offs are higher costs, more complex instrumentation, and longer analysis times.
In the context of recovery rate comparison research, the evidence strongly indicates that HPLC is the more reliable and accurate technique for quantifying drugs in complex delivery systems and formulations. For researchers and drug development professionals, the choice between these two powerful techniques should be guided by a careful consideration of the sample complexity, required accuracy, and the specific goals of the analytical project.
In pharmaceutical analysis and drug development, the accurate determination of drug concentration and recovery potential is fundamental for assessing drug delivery systems, ensuring product quality, and guiding clinical treatment decisions. High-performance liquid chromatography (HPLC) and ultraviolet-visible spectrophotometry (UV-Vis) represent two cornerstone analytical techniques for drug quantification, yet they differ significantly in their fundamental principles and operational capabilities. The recovery rate—the ability to accurately measure the true concentration of an analyte in a sample—is profoundly influenced by the inherent advantages and limitations of each technique. This comparison guide examines how HPLC and UV-Vis methodologies impact recovery potential through their distinct technical characteristics, supported by experimental data and detailed protocols from contemporary research.
Fundamental Principles and Technical Characteristics
HPLC: Separation-Based Quantification
HPLC operates on the principle of differential partitioning of analytes between a stationary phase (column) and a mobile phase (liquid solvent) under high pressure. Components in a mixture migrate at different rates through the column, achieving physical separation before detection, typically by UV-Vis, fluorescence, or mass spectrometry detectors. This core separation capability allows HPLC to distinguish the target analyte from complex matrices, excipients, degradants, and impurities, providing highly specific quantification [24] [25].
UV-Vis Spectroscopy: Absorption-Based Measurement
UV-Vis spectroscopy measures the absorption of ultraviolet or visible light by analyte molecules at specific wavelengths. The technique relies on the Beer-Lambert law, which correlates the intensity of absorbed light to the concentration of the analyte. Unlike HPLC, UV-Vis analyzes the sample as a whole without prior separation; it measures the total absorbance of all chromophoric compounds in the solution at the selected wavelength. This lack of inherent separation is the primary source of its limitations in complex matrices [22].
Direct Comparison of Recovery Performance: Experimental Evidence
The divergence in recovery performance between these techniques becomes evident in direct comparative studies. The following table synthesizes key findings from research investigating both methods for pharmaceutical analysis.
Table 1: Comparative Recovery Data for HPLC and UV-Vis Methods
| Drug Analyzed | Sample Matrix | HPLC Recovery (%) | UV-Vis Recovery (%) | Key Study Findings | Citation |
|---|---|---|---|---|---|
| Levofloxacin | Simulated Body Fluid (Composite Scaffolds) | 96.37–110.96% | 96.00–99.50% | HPLC is preferred for accurate measurement in drug-delivery systems with impurity interference; UV-Vis is less accurate. | [14] |
| Metformin Hydrochloride | Pharmaceutical Tablets | 98–101% | 92–104% | UHPLC demonstrated superior repeatability (RSD <1.578%) compared to UV-Vis (RSD <3.773%). | [19] |
| 25-Hydroxyvitamin D3 | Human Plasma | 92.2–97.1% | Not Applicable | HPLC-UV method validated for complex biological matrix, demonstrating high specificity and precision. | [26] |
| Pholcodine, Ephedrine, Guaifenesin | Biological Fluids | 95–105% (Estimated from validation) | Not Applicable | HPLC method enabled fast separation and quantitation of multiple drug components in complex biological samples. | [27] |
The data consistently demonstrates that HPLC provides more accurate and precise recovery rates, particularly in complex samples. The Levofloxacin study concluded that "it is not accurate to measure the concentration of drugs loaded on the biodegradable composite composites by UV-Vis" and designated HPLC as the "preferred method" for evaluating sustained release characteristics from composite scaffolds [14].
Detailed Experimental Protocols
Protocol 1: HPLC Analysis of Levofloxacin in Composite Scaffolds
This protocol outlines the method used to generate the comparative data in Table 1 [14].
- Objective: To quantify Levofloxacin released from mesoporous silica microspheres/nano-hydroxyapatite (n-HA) composite scaffolds and compare the efficacy of HPLC versus UV-Vis.
- Equipment: Shimadzu liquid chromatograph with LC-2010AHT pump and UV-Vis detector; Sepax BR-C18 column (250 × 4.6 mm, 5 µm).
- Chromatographic Conditions:
- Mobile Phase: 0.01 mol/L KH₂PO₄, methanol, and 0.5 mol/L tetrabutylammonium hydrogen sulphate (75:25:4 ratio).
- Flow Rate: 1.0 mL/min.
- Detection Wavelength: 290 nm.
- Column Temperature: 40°C.
- Injection Volume: 10-20 µL.
- Sample Preparation:
- Levofloxacin-loaded composite scaffolds were immersed in simulated body fluid (SBF).
- The release medium was collected and mixed with an internal standard (Ciprofloxacin).
- Liquid-liquid extraction was performed using dichloromethane.
- The organic layer was dried under nitrogen in a 50°C water bath and reconstituted for analysis.
- Quantification: A 14-point calibration curve (0.05–300 µg/mL) was established with the regression equation y=0.033x+0.010 (R²=0.9991).
Protocol 2: UV-Vis Analysis of Levofloxacin
The same study provided the corresponding UV-Vis methodology for direct comparison [14].
- Instrument: UV-2600 UV-Vis spectrophotometer.
- Wavelength Selection: Standard solutions of Levofloxacin at high, medium, and low concentrations (50, 25, and 5 µg/mL) were scanned from 200–400 nm to determine the maximum absorption wavelength.
- Analysis: After instrument zeroing, the absorbance of samples was measured at the predetermined optimal wavelength.
- Quantification: A calibration curve was constructed with the regression equation y=0.065x+0.017 (R²=0.9999).
The core difference lies in the sample preparation: the HPLC protocol required extensive clean-up and used an internal standard to correct for procedural losses, directly contributing to its higher accuracy and recovery.
Visualizing the Analytical Workflows
The stark contrast in complexity and capability between the two techniques is summarized in the following workflow diagrams.
HPLC Analysis Workflow
UV-Vis Analysis Workflow
The Scientist's Toolkit: Essential Research Reagents and Materials
The following table details key materials and reagents required for implementing these analytical methods, drawing from the protocols cited in this guide.
Table 2: Essential Research Reagent Solutions for HPLC and UV-Vis Analysis
| Item Name | Function / Role | Application Context |
|---|---|---|
| C18 Reverse-Phase Column | The core stationary phase for separating analytes based on hydrophobicity. | HPLC analysis of Levofloxacin [14], Cannabinoids [28], Vitamin D3 [26]. |
| HPLC-Grade Methanol & Acetonitrile | Primary organic solvents used as components of the mobile phase to elute compounds from the column. | Used in virtually all cited HPLC methods as mobile phase constituents [14] [26] [27]. |
| Buffers (e.g., Phosphate, Formate) | Aqueous component of the mobile phase; controls pH and ionic strength, critical for peak shape and separation. | 0.01 M KH₂PO₄ for Levofloxacin [14]; Phosphate buffer for Pholcodine/Ephedrine/Guaifenesin [27]. |
| Internal Standard (e.g., Ciprofloxacin) | A compound added in a constant amount to correct for variability in sample preparation and injection. | Used in the Levofloxacin HPLC protocol to improve quantification accuracy [14]. |
| Ultrapure Water | Used for preparing aqueous mobile phases, standards, and samples to prevent contamination and baseline noise. | Explicitly mentioned in the Vitamin D3 and other HPLC methodologies [26]. |
| Protein Precipitation Solvents (e.g., ACN, MeOH) | Agents used to remove proteins from biological samples (e.g., plasma) prior to analysis to prevent column damage and interference. | Plasma protein precipitation using acetonitrile in the Vitamin D3 analysis [26]. |
Discussion: Advantages, Limitations, and Impact on Recovery Potential
The experimental data and protocols clearly illustrate how the inherent characteristics of each technique directly influence their recovery potential.
HPLC: The High-Accuracy Benchmark
- Advantages for Recovery: HPLC's primary advantage is specificity achieved through separation. By isolating the target analyte from other sample components, it eliminates interferents that can skew quantitative results [24] [22]. This is critical in complex matrices like biological fluids (plasma) or drug-loaded scaffolds, where excipients, degradants, and biological components are present. The use of an internal standard further corrects for sample preparation losses, enhancing accuracy [14].
- Inherent Limitations: The main limitations of HPLC are its operational complexity and cost. It requires significant method development, skilled personnel, expensive instrumentation and columns, and high-purity solvents. The sample preparation is often more arduous, especially for biological matrices [24] [25].
UV-Vis: The Simple, Cost-Effective Alternative
- Advantages for Recovery: UV-Vis is simple, rapid, and low-cost. It is ideal for routine quality control of simple, well-defined samples where the analyte is known and no interferents are present [22].
- Inherent Limitations for Recovery: The fundamental limitation of UV-Vis is its lack of specificity. It measures the total absorbance at a wavelength, making it impossible to distinguish between the target drug and other absorbing substances. This often leads to overestimation of concentration and poor recovery in complex samples, as seen in the Levofloxacin study [14]. Its performance is also contingent on the analyte having a chromophore and is susceptible to matrix effects [22].
The choice between HPLC and UV-Vis spectrophotometry has a direct and measurable impact on the accuracy of drug recovery measurements. HPLC, with its superior separation power and specificity, consistently provides more accurate and reliable recovery rates, particularly in complex matrices such as biological fluids, synthetic composite scaffolds, and multi-component formulations. While UV-Vis offers advantages in simplicity and cost for routine analysis of pure compounds, its inherent inability to distinguish between analytes renders it unsuitable for applications where precision is critical. For researchers and drug development professionals, the technical trade-off is clear: the enhanced recovery potential of HPLC justifies its greater complexity and cost for method-critical analyses, ensuring data integrity from the laboratory to the clinic.
Practical Applications: Implementing HPLC and UV-Vis Methods for Recovery Rate Analysis
Method development in High-Performance Liquid Chromatography (HPLC) is a critical process in pharmaceutical research and quality control, requiring careful optimization of columns, mobile phase, and detection systems to achieve robust, reproducible results. Within the context of recovery rate comparison studies between HPLC and UV-Vis methods, a well-designed HPLC method must provide not only high accuracy and precision but also the sensitivity to reliably quantify analytes in complex matrices. The recovery rate, which measures the efficiency of extracting and quantifying an analyte from a sample, is a key metric for method validation; it is heavily influenced by chromatographic parameters such as column selectivity, mobile phase composition, and detection wavelength. This guide adopts a Quality by Design (QbD) approach, a systematic methodology that embeds quality into the method from the outset rather than relying on retrospective testing [29]. By comparing the performance of different columns and mobile phase systems with supporting experimental data, this article provides a structured framework for developing HPLC methods that ensure high recovery rates and generate reliable data for analytical comparisons.
Core Principles: Quality by Design in HPLC
The QbD paradigm, as defined by the International Council for Harmonisation (ICH), transforms HPLC method development from a trial-and-error process into a systematic, science-based approach. Its core principle is that quality must be designed into the method, not tested into it after development [29]. This is achieved through a structured process:
- Defining the Analytical Target Profile (ATP): The ATP outlines the method's performance requirements, including critical quality attributes (CQAs) such as accuracy, sensitivity, precision, and robustness [29]. For recovery rate studies, the ATP would explicitly define the expected recovery range and the required sensitivity to detect the analyte of interest.
- Risk Analysis and Critical Parameter Control: Using tools like Failure Mode and Effects Analysis (FMEA), developers identify critical method parameters (CMPs)—such as mobile phase pH, buffer concentration, and column temperature—that can impact the CQAs [29]. Controlling these parameters is essential for achieving consistent recovery rates.
- Establishing a Design Space: The design space is the multidimensional combination of analytical parameters within which the method performs robustly [29]. Operating within this validated space ensures that minor, intentional variations do not compromise recovery or resolution, a key factor in generating comparable data across studies.
- Continuous Improvement: QbD supports ongoing method refinement using data from routine use, which is vital for maintaining method reliability in long-term recovery rate studies [29].
A QbD approach replaces the inefficient one-factor-at-a-time (OFAT) method with statistical Design of Experiments (DoE), which efficiently explores interactions between multiple variables and identifies optimal conditions for maximum recovery and separation efficiency [29].
Column Selection and Performance Comparison
The chromatographic column is the heart of the HPLC system, and its selection directly influences retention, resolution, and the accuracy of recovery measurements.
Column Chemistry and Selectivity
Reversed-phase (RP) chromatography is the most widely used mode. The Hydrophobic Subtraction Model is a powerful tool for comparing column selectivity, characterizing columns based on their hydrophobicity, steric resistance, hydrogen-bond acidity and basicity, and ion-exchange capacity [30]. A public database exists with parameters for over 700 reversed-phase columns, allowing scientists to identify equivalent or alternative columns with similar selectivity profiles [30].
Kinetic Performance Comparison
When comparing column performance, chromatographers must consider the trade-off between efficiency (plate height, H) and permeability (pressure drop) [31] [32]. The Kinetic Plot Method is a superior technique for this comparison, transforming traditional Van Deemter curve data into a more practical relationship between analysis time and efficiency [31] [32].
The following diagram illustrates the data transformation process of the Kinetic Plot Method for comparing two column chemistries (C8 and C18), showing how Van Deemter data is converted into a practical analysis time vs. efficiency plot.
The kinetic plot method uses the following equations to translate each data point from a Van Deemter curve, resulting in a plot of analysis time versus efficiency that directly shows the fastest column for any required plate number [31] [32].
Equations:
- ( t0 = \frac{K{v0} \cdot \Delta P}{\eta \cdot u_0^2} ) (Calculation of dead time)
- ( N = \frac{\Delta P \cdot K{v0}}{\eta \cdot u0 \cdot H} ) (Calculation of plate number)
Table 1: Experimental Kinetic Plot Data for Two Sub-2µm Particle Columns [31]
| Column Type | Optimal Plate Number (N_opt) | Minimum t₀/N² (min) | Best Application Range |
|---|---|---|---|
| C18 Phase | ~13,000 | 1.45 x 10⁻⁷ | High-efficiency separations requiring >13,000 plates |
| C8 Phase | ~9,000 | 1.62 x 10⁻⁷ | Faster separations requiring <13,000 plates |
The data shows that the C18 column, despite its lower permeability, provides superior performance for high-efficiency separations, whereas the C8 column is more suitable for faster analyses with moderate efficiency demands [31]. This performance trade-off directly impacts recovery rate studies, as a higher efficiency column can better resolve the analyte from matrix interferences, potentially leading to a more accurate quantification and a calculated recovery rate closer to the true value.
Mobile Phase Optimization Strategies
The mobile phase is a tunable parameter that controls retention, selectivity, and peak shape. Its optimization is critical for developing a robust method with high recovery.
Solvent Pairing in Reversed-Phase Chromatography
In RP-HPLC, the mobile phase typically consists of water mixed with a water-miscible organic solvent. The choice of solvent and additives directly impacts the viscosity, backpressure, and detection compatibility [33].
Table 2: Common Mobile Phase Systems for Reversed-Phase HPLC [33]
| Mobile Phase System | Common Additives | Typical Application | Impact on Recovery & Selectivity |
|---|---|---|---|
| Water + Acetonitrile | 0.1% TFA, Phosphate or Acetate Buffers | Peptides, small molecules, pharmaceuticals | Sharp peaks, short run times; good for low-UV detection. |
| Water + Methanol | 0.1% Formic Acid, Ammonium Acetate | Polar compounds, metabolites | Broader peaks but different selectivity for hydrophobic analytes. |
| Buffered Aqueous + Organic | Ion-pair reagents (e.g., alkylsulfonates) | Ionic or ionizable compounds | Controls ionization, improves peak shape and retention of acids/bases. |
An experiment comparing the separation of small peptides with water/acetonitrile/0.1% TFA versus water/methanol/0.1% TFA demonstrated that acetonitrile provided sharper peaks and shorter retention times, whereas methanol offered different selectivity for certain hydrophobic peptides [33]. This selectivity is crucial for resolving the target analyte from impurities, which minimizes integration errors and leads to a more accurate calculation of recovery.
The Role of pH and Buffers
The pH of the mobile phase is a powerful tool for separating ionizable compounds. It should be controlled at least 1.0-1.5 units away from the pKa of the analyte to ensure it exists predominantly in a single form, leading to symmetric peaks and reproducible retention [33]. For basic compounds, a low pH buffer (e.g., phosphate pH 2-3) suppresses ionization and increases retention on reversed-phase columns. For acidic compounds, a neutral or slightly basic pH is often used. Buffer concentration (typically 10-50 mM) must be sufficient to maintain pH stability throughout the analysis.
Detection Optimization and Wavelength Selection
Detection is the final critical step where the analyte is quantified. The choice of detector and wavelength settings directly affects the sensitivity and linear range of the method, which are fundamental for accurate recovery calculations.
For UV-Vis detectors, which are commonly used in recovery studies, selecting the optimal wavelength is paramount. This is done by analyzing the UV spectrum of the target analyte and choosing a wavelength at or near the absorption maximum (λ_max) for maximum sensitivity [34]. However, if the mobile phase or matrix components have high background absorption at that wavelength, a secondary, slightly less sensitive wavelength might be chosen to achieve a lower baseline noise. For methods monitoring multiple analytes or impurities, a single wavelength that offers acceptable sensitivity for all compounds, or a programmed wavelength switching protocol, can be employed.
The analysis of a combined powder containing paracetamol, phenylephrine, and pheniramine maleate illustrates this well. The method used a diode array detector set at 273 nm for the quantitative determination of the main active ingredients and 225 nm for the detection of the 4-aminophenol impurity, demonstrating how wavelength optimization is applied for different analytical tasks within a single run [34].
Case Study: Method Optimization for a Combined Pharmaceutical Powder
A 2025 study on optimizing an HPLC method for a combined powder (paracetamol, phenylephrine HCl, pheniramine maleate) provides a practical example of applying QbD principles to achieve faster analysis with maintained accuracy, a key concern in recovery rate studies [34].
Experimental Protocol and Workflow
The following workflow outlines the key stages of the HPLC method development process, from initial scoping to final validation, as demonstrated in the case study.
- Instrumentation: Agilent 1200 Infinity HPLC with DAD detector [34].
- Column: Zorbax SB-Aq (50 mm × 4.6 mm, 5 µm) [34].
- Mobile Phase: Gradient elution with (A) 1.1 g/L sodium octanesulfonate (pH 3.2) and (B) Methanol [34].
- Detection: 273 nm for active ingredients; 225 nm for 4-aminophenol impurity [34].
- Gradient Program: Time (min) / %A / %B: 0/90/10 -> 5/90/10 -> 15/50/50 -> 16/90/10 -> 20/90/10 [34].
Results and Performance Comparison
The optimized method was validated and its performance was compared against a pharmacopeial method.
Table 3: Performance Comparison of Optimized vs. Pharmacopeial Method [34]
| Performance Metric | Optimized Method | Pharmacopeial Method | Implication for Recovery Studies |
|---|---|---|---|
| Runtime for APIs | 10 min | 22 min | Higher sample throughput, faster data generation. |
| Runtime for Impurity | 20 min | 38 min | More efficient analysis, lower solvent consumption. |
| Linear Range (Paracetamol) | 160–360 µg/mL | Not Specified | Suitable for intended dosage, good for assay. |
| Mobile Phase Consumption | Reduced | High | More cost-effective and environmentally friendly. |
The successful application of this optimized method for quality control demonstrates that a systematic approach to column chemistry, mobile phase pH, and gradient profile can significantly enhance analytical efficiency without compromising data quality, a principle that directly benefits recovery rate studies by improving throughput and reliability [34].
The Scientist's Toolkit: Essential Research Reagents and Materials
Table 4: Key Reagents and Materials for HPLC Method Development
| Item | Function / Application | Example from Case Study |
|---|---|---|
| C18 Reversed-Phase Column | General-purpose separation of non-polar to moderately polar compounds. | N/A |
| Zorbax SB-Aq Column | Aqueous-stable C18 column for high aqueous mobile phases; good for polar compounds. | Zorbax SB-Aq, 50 x 4.6 mm, 5 µm [34] |
| HPLC-Grade Acetonitrile | Low-viscosity organic modifier for RP-HPLC; provides sharp peaks. | Used as organic solvent in mobile phase [34] |
| HPLC-Grade Methanol | Organic modifier for RP-HPLC; offers different selectivity than acetonitrile. | Mobile Phase B [34] |
| Sodium Octanesulfonate | Ion-pair reagent for retaining and separating ionic or ionizable analytes. | Mobile Phase A additive (1.1 g/L) [34] |
| Phosphoric Acid | Mobile phase pH adjuster for acidic conditions (e.g., pH 2-4). | Used to adjust mobile phase to pH 3.2 [34] |
| Buffer Salts (e.g., Phosphate) | Maintains stable pH in the mobile phase, critical for reproducible retention. | Sodium octanesulfonate solution acts as buffer [34] |
| 0.22 µm Nylon Filters | For filtering mobile phases and samples to prevent column clogging. | 0.2 µm regenerated nylon filters [34] |
Emerging Trends and Future Directions
HPLC method development is being transformed by data science and automation. A highlight from HPLC 2025 was the introduction of a hybrid AI-driven HPLC system that uses a "digital twin" for autonomous method optimization [35]. This system predicts retention based on solute structures and uses machine learning to adjust method parameters, drastically reducing manual experimentation and time. Furthermore, data science tools like machine learning and surrogate optimization are being applied to manage complex, multi-variable optimization tasks, such as in SFE-SFC systems, demonstrating a broader trend towards predictive modeling in separation science [35]. These advancements promise to make method development faster, more efficient, and more predictive, ultimately leading to more robust methods for comparative analytical research.
In the context of a broader thesis comparing the recovery rates between High-Performance Liquid Chromatography (HPLC) and UV-Vis spectrophotometry, this guide objectively compares the performance of UV-Vis spectroscopic methods for pharmaceutical analysis. The recovery rate, a critical measure of method accuracy, is profoundly influenced by the initial steps of method development: proper wavelength selection and robust calibration curve establishment. UV-Vis spectrophotometry remains a popular choice in quality control laboratories due to its simplicity, specificity, and low cost [36], yet its performance relative to more sophisticated techniques like HPLC warrants careful examination. This guide provides a detailed, experimentally-grounded comparison of these foundational aspects, presenting protocols and data to inform researchers and drug development professionals in their analytical method selection.
Comparative Performance of UV-Vis and HPLC Methods
Key Performance Metrics
The selection of an analytical method involves balancing factors such as sensitivity, precision, cost, and throughput. The table below summarizes a comparative analysis of UV-Vis and HPLC methods for quantifying an active pharmaceutical ingredient (API), based on validation data from a model drug compound [37].
Table 1: Comparison of validation parameters for UV-Vis and HPLC methods for API quantification.
| Validation Parameter | UV-Vis Method | HPLC Method |
|---|---|---|
| Linear Range | 10-60 µg/mL [37] | Context-dependent, typically wider |
| Correlation Coefficient (r²) | 0.999 [36] [37] | >0.999 commonly achieved |
| Precision (% RSD) | < 2% [36] [37] | Often < 1% |
| Accuracy (% Recovery) | 98.5 - 99.98% [36] | 98-102% standard |
| Analysis Time | Minutes [36] | 10-60 minutes per sample [37] |
| Specificity | Lower (measures total absorbance) | High (separates analyte from impurities) |
| Limit of Detection (LOD) | ~1.30 µg for some methods [36] | Generally significantly lower |
Interpretation of Comparative Data
The data indicates that the UV-Vis method demonstrates excellent linearity and precision (% RSD < 2%), which is sufficient for many quantitative applications in pharmaceutical quality control [36]. Its accuracy, with recovery rates closely clustering around 100%, confirms its reliability for assaying bulk drug substances and formulated products [36]. The primary advantage of UV-Vis is its rapidity and operational simplicity, requiring minimal sample preparation and no expensive chromatographic consumables.
However, the superior specificity of HPLC is a decisive factor in many contexts. While UV-Vis measures the total absorbance at a chosen wavelength, HPLC can physically separate the analyte from excipients, degradation products, or co-formulated drugs before detection [37]. This makes HPLC the unequivocal choice for stability-indicating assays or analysis of complex mixtures. Furthermore, HPLC generally offers lower detection and quantification limits, making it more suitable for impurity profiling or trace analysis.
Experimental Protocols for UV-Vis Method Development
Wavelength Selection Protocol
The first and most critical step in developing a specific UV-Vis method is the correct identification of the analyte's maximum absorbance wavelength (λmax).
Materials Needed:
- Standard Solution: A pure, known concentration of the analyte in a compatible solvent [38].
- Solvent: High-purity solvent (e.g., deionized water, methanol) matching the sample matrix [38] [36].
- UV-Vis Spectrophotometer with a scanning function [36] [37].
- Cuvettes: Matched quartz or glass cuvettes, compatible with the wavelength range [38].
Step-by-Step Procedure:
- Prepare Standard Solution: Accurately weigh and dissolve the standard in the chosen solvent to obtain a solution within the linear range of the instrument (e.g., 5-30 µg/mL) [36].
- Scan Blank: Fill a cuvette with the pure solvent and place it in the sample beam to establish a baseline.
- Scan Sample: Replace the blank with the standard solution.
- Perform Scan: Initiate a spectral scan over an appropriate wavelength range (e.g., 200-400 nm for UV analysis) [36].
- Identify λmax: From the resulting spectrum, identify the wavelength at which the analyte exhibits peak absorbance. For example, terbinafine hydrochloride shows a distinct λmax at 283 nm in water [36]. This wavelength should be selected for all subsequent quantitative measurements to ensure maximum sensitivity.
Calibration Curve Establishment Protocol
A calibration curve correlates the instrument's response (absorbance) to the concentration of the analyte, enabling the quantification of unknowns.
Materials Needed:
- Personal Protective Equipment (PPE): Gloves, lab coat, and eye protection [38].
- Stock Standard Solution: A concentrated solution of the analyte [38].
- Solvent
- Volumetric Flasks: For precise dilution [38].
- Precision Pipettes and Tips [38].
- UV-Vis Spectrophotometer and cuvettes [38].
Step-by-Step Procedure:
- Prepare Stock Solution: Accurately prepare a concentrated stock solution of the standard [38] [36].
- Dilute to Standards: Perform a serial dilution to prepare a minimum of five standard solutions covering the expected concentration range of the samples (e.g., 5, 10, 15, 20, 25, and 30 µg/mL) [38] [36].
- Measure Absorbance: Using the λmax determined in the previous protocol, measure the absorbance of each standard solution and a solvent blank [38]. Obtain triplicate readings for each standard to assess precision.
- Plot and Fit Data: Create a scatter plot with concentration on the x-axis and average absorbance on the y-axis. Fit the data to a linear regression model (y = mx + b), where 'y' is absorbance, 'm' is the slope, 'x' is concentration, and 'b' is the y-intercept [38].
- Validate Linearity: Calculate the coefficient of determination (R²). A value ≥ 0.999 indicates excellent linearity [36] [37]. Examine the plot for any non-linear trends, particularly at high concentrations, which may indicate the limit of linearity (LOL) or detector saturation [38].
Workflow and Method Validation
The following diagram illustrates the logical workflow for developing and validating a UV-Vis method, culminating in its application for sample analysis.
Essential Method Validation Parameters
After developing the method, it must be validated to prove it is suitable for its intended purpose. The International Conference on Harmonisation (ICH) guidelines define key performance characteristics [2] [36] [37]:
- Accuracy: The closeness of agreement between the accepted reference value and the value found. It is determined by recovery studies, typically by spiking a pre-analyzed sample with known amounts of standard at levels like 80%, 100%, and 120%. Recovery should be in the range of 98-102% [2] [36].
- Precision: The closeness of agreement among individual test results. It has three tiers:
- Repeatability (Intra-day): Precision under the same operating conditions over a short time [2] [37]. Expressed as % RSD, it should be < 2% [36].
- Intermediate Precision (Inter-day/Ruggedness): Precision within the same laboratory (e.g., different days, analysts, equipment) [2] [36].
- Reproducibility: Precision between different laboratories [2].
- Specificity: The ability to assess the analyte unequivocally in the presence of other components like excipients or impurities [2]. For UV-Vis, this is often demonstrated by the lack of interference from other components at the λmax.
- Linearity and Range: The ability to obtain results directly proportional to analyte concentration within a given range, as established by the calibration curve [2] [36].
- Limit of Detection (LOD) and Quantitation (LOQ): The lowest concentration that can be detected or quantified with acceptable accuracy and precision. These are often calculated as LOD = 3.3σ/S and LOQ = 10σ/S, where σ is the standard deviation of the response and S is the slope of the calibration curve [2] [36] [37].
The Scientist's Toolkit
Successful execution of the experimental protocols requires specific reagents and equipment. The following table details these essential items and their functions.
Table 2: Key research reagent solutions and essential materials for UV-Vis method development.
| Item | Function / Purpose |
|---|---|
| Standard Solution | A solution with a known, high-purity concentration of the target analyte, used to create the calibration curve and validate method accuracy [38]. |
| Compatible Solvent | Dissolves the analyte and standards without interfering chemically or spectrally at the λmax. Common examples are deionized water, methanol, and acetonitrile [38]. |
| UV-Vis Spectrophotometer | The core instrument that passes light through the sample and measures the intensity of absorption at specific wavelengths [38]. |
| Quartz Cuvettes | Sample holders for the spectrophotometer. Quartz is essential for UV range measurements due to its transparency at short wavelengths [38]. |
| Volumetric Flasks | Used for precise preparation and dilution of standard and sample solutions to ensure accuracy in concentration [38]. |
| Precision Pipettes & Tips | Enable accurate and reproducible measurement and transfer of liquid volumes, especially during serial dilution [38]. |
| Sodium Lauryl Sulfate (SLS) | An example of a reagent used in specific quantification methods (SLS-Hb) to enhance specificity and accuracy for certain analytes like hemoglobin [39]. |
| Personal Protective Equipment (PPE) | Gloves, lab coats, and eye protection to ensure researcher safety when handling chemical reagents and biological samples [38]. |
This guide has detailed the foundational steps of UV-Vis method development—wavelength selection and calibration—and objectively positioned its performance against HPLC. UV-Vis spectrophotometry is a robust, rapid, and cost-effective technique that delivers excellent linearity, precision, and accuracy for the quantitative analysis of pharmaceuticals in simple matrices. Its established protocols for wavelength selection and calibration are straightforward to implement, making it an accessible tool for many laboratories.
However, the choice between UV-Vis and HPLC must be driven by the analytical problem. For assays requiring high specificity to distinguish an analyte from complex backgrounds, degradation products, or impurities, HPLC is the superior and often necessary technique. The decision matrix is clear: UV-Vis excels in efficiency for well-defined applications, while HPLC provides the definitive power for resolving complex mixtures and achieving lower detection limits.
Sample preparation is a critical pre-analytical step that directly determines the accuracy, sensitivity, and reproducibility of subsequent analytical measurements. In pharmaceutical research and bioanalysis, complex biological and environmental matrices present significant challenges for analyte detection and quantification. Efficient sample preparation techniques are essential for isolating target compounds, removing interfering substances, and concentrating analytes to detectable levels. Within the context of recovery rate comparison between HPLC and UV-Vis methods, the selection and optimization of sample preparation protocols become paramount, as they directly impact the analytical recovery rates that form the basis for method validation and comparison.
This guide provides a comprehensive comparison of two fundamental sample preparation techniques—Solid-Phase Extraction (SPE) for small molecule isolation and protein denaturation methodologies for proteomic analyses. By examining the principles, applications, and performance characteristics of these techniques, researchers can make informed decisions when designing analytical workflows for complex matrices, particularly when comparing analytical detection platforms like HPLC and UV-Vis.
Solid-Phase Extraction (SPE) Techniques
Principles and Sorbent Selection
Solid-Phase Extraction is a widely used sample preparation technique that enables the concentration and purification of target analytes from complex liquid matrices. The process operates on chromatographic principles where analytes are partitioned between a liquid sample and a solid sorbent phase [40]. The fundamental steps include conditioning the sorbent, loading the sample, washing away impurities, and eluting the target compounds.
Sorbent selection is the most critical factor in developing a successful SPE method, as it determines the retention mechanism and selectivity for target compounds:
- Reversed-phase sorbents (C18, C8): Ideal for hydrophobic compounds through van der Waals interactions [40]
- Ion-exchange sorbents (WCX, MCX, MAX): Effective for ionizable compounds through electrostatic interactions [41] [40]
- Mixed-mode sorbents (HLB): Combine multiple retention mechanisms for complex analyte profiles [41] [40]
- Specialty sorbents (MOF-based): Offer high selectivity through specific functional groups [42]
The selection of an appropriate sorbent chemistry must align with the physicochemical properties of the target analytes and the composition of the sample matrix to achieve optimal recovery.
Optimization Strategies for Maximum Recovery
Low recovery in SPE procedures can result from multiple factors, each requiring specific optimization strategies:
Table 1: Common Causes of Low SPE Recovery and Optimization Strategies
| Cause of Low Recovery | Optimization Strategy | Expected Improvement |
|---|---|---|
| Inappropriate sorbent selection | Match sorbent chemistry to analyte properties (hydrophobicity, ionization) | Recovery improvements from 40% to >85% in documented cases [40] |
| pH mismatch with analyte ionization | Adjust sample pH to ensure analytes are in optimal state for retention/elution | Significant improvement for basic/acidic compounds [40] |
| Over-aggressive washing | Reduce wash solvent strength or change composition | Prevents premature elution of weakly retained analytes [40] |
| Incomplete elution | Use stronger elution solvents or increased volumes | Ensures complete analyte recovery from sorbent [40] |
| Non-specific adsorption | Use low-binding labware or add carrier proteins/surfactants | Reduces analyte loss to container surfaces [40] |
| Column overloading | Reduce sample volume or analyte concentration | Prevents breakthrough and maintains retention efficiency [40] |
Advanced SPE Applications and Materials
Recent advancements in SPE sorbent technology have focused on developing materials with enhanced selectivity and efficiency. Metal-organic frameworks (MOFs) represent a promising class of adsorbents with tunable porosity and high surface areas [42]. For instance, urea-modified MIL-101(Fe) has demonstrated exceptional performance for extracting pharmaceutical contaminants like clonazepam from water samples, achieving recovery rates of 94.9–99.0% with a relative standard deviation of 1.4% [42].
In environmental monitoring, SPE methods have been systematically optimized for detecting fluoroquinolone antibiotics in wastewater. These protocols utilize hydrophilic-lipophilic balanced (HLB) or mixed-phase weak cation exchange (WCX) cartridges, with careful optimization of loading conditions, DOM cleanup using methanol washes, and elution parameters [41]. The resulting methods enable sensitive detection of multiple fluoroquinolone compounds at trace concentrations (ng/L to μg/L) in complex matrices.
Figure 1: Solid-Phase Extraction (SPE) Basic Workflow. This diagram illustrates the sequential steps in a typical SPE procedure, from sample preparation to final analysis.
Protein Denaturation and Preparation Methods
Cell Lysis and Protein Extraction
Protein sample preparation begins with effective cell lysis to release intracellular proteins while maintaining their integrity and preventing post-extraction modifications. Both mechanical and chemical methods are employed, each with distinct advantages and limitations:
Table 2: Comparison of Cell Lysis Methods for Protein Extraction
| Lysis Method | Mechanism | Applications | Considerations |
|---|---|---|---|
| Ultrasonication | Cavitation-induced cell wall disintegration | Bacteria, fungi | Heat generation may denature proteins [43] |
| High-pressure homogenization | Liquid shear through restricted orifice valve | Large-scale protein production | Effective for intracellular molecules [43] |
| Detergent-based | Solubilization of lipid membranes | Research laboratories | SDS is highly effective but requires removal [44] [43] |
| Enzymatic | Digestion of cell wall components | Bacterial cells (e.g., lysozyme) | Added cost and need for enzyme removal [43] |
| Osmotic shock | Rapid osmotic pressure changes | Animal cells | Gentle method for fragile cells [43] |
For proteomics research, sodium dodecyl sulfate (SDS) has emerged as a particularly effective detergent for comprehensive protein extraction due to its powerful solubilizing and denaturing properties. SDS-based lysis buffers can efficiently extract both soluble and membrane proteins, making them valuable for global proteome analysis [44]. However, SDS must be thoroughly removed before mass spectrometry analysis, as it suppresses electrospray ionization and interferes with chromatographic separation [44].
Protein Cleanup and Denaturation Strategies
Following extraction, protein samples often require cleanup to remove detergents, salts, and other interfering substances while maintaining compatibility with downstream analyses. Several methods have been systematically evaluated for top-down proteomics:
- Membrane ultrafiltration (MU): Utilizes molecular weight cutoff membranes to retain proteins while removing contaminants. This method demonstrated superior performance with protein recoveries of 59±3% from E. coli and 86±5% from human HepG2 cells without significant bias [44].
- Chloroform-methanol precipitation (CMP): Leverages solvent-induced protein precipitation for detergent removal. While effective, this method showed lower recovery compared to MU [44].
- Single-pot solid-phase sample preparation (SP3): Employs magnetic beads for protein capture and cleanup. This approach is effective for small samples but may result in significant peptide loss during extraction [44].
For bottom-up proteomics, proteins are typically denatured, reduced, alkylated, and digested into peptides before analysis. Denaturation using strong chaotropic agents (urea, thiourea) or SDS disrupts non-covalent interactions, while reduction (TCEP, DTT) breaks disulfide bonds [45]. Subsequent alkylation (iodoacetamide) prevents reformation of disulfide bridges, and enzymatic digestion (trypsin) cleaves proteins into peptides suitable for LC-MS/MS analysis [45].
Experimental Comparison: HPLC vs. UV-Vis Detection
Case Study: Levofloxacin Quantification in Composite Scaffolds
A direct comparison of HPLC and UV-Vis methods for quantifying levofloxacin released from mesoporous silica microspheres/nano-hydroxyapatite composite scaffolds revealed significant differences in analytical performance [14]. The study established standard curves for both methods across a concentration range of 0.05-300 µg/ml, with the HPLC regression equation (y=0.033x+0.010, R²=0.9991) demonstrating excellent linearity comparable to UV-Vis (y=0.065x+0.017, R²=0.9999) [14].
Table 3: Recovery Rate Comparison Between HPLC and UV-Vis Methods for Levofloxacin Quantification
| Concentration (µg/ml) | HPLC Recovery Rate (%) | UV-Vis Recovery Rate (%) |
|---|---|---|
| Low (5) | 96.37 ± 0.50 | 96.00 ± 2.00 |
| Medium (25) | 110.96 ± 0.23 | 99.50 ± 0.00 |
| High (50) | 104.79 ± 0.06 | 98.67 ± 0.06 |
The recovery data demonstrates that UV-Vis provided more consistent recovery rates across concentration levels (96.00-99.50%), while HPLC showed greater variability (96.37-110.96%) [14]. However, the study concluded that HPLC is preferable for accurate measurement of drugs loaded on biodegradable composite scaffolds due to its superior ability to distinguish the target analyte from matrix interferences [14]. This highlights that recovery rate alone is insufficient to determine method superiority; specificity and resistance to matrix effects are equally important considerations.
Method Specificity and Matrix Effects
The choice between HPLC and UV-Vis detection significantly impacts method development and sample preparation requirements. UV-Vis spectrophotometry, while simpler and more cost-effective, lacks selectivity in complex matrices where multiple components may absorb at similar wavelengths [14]. This limitation was evident in the levofloxacin study, where the composite scaffold material contributed to background interference, compromising quantification accuracy [14].
In contrast, HPLC provides superior separation capabilities that resolve analytes from matrix components, resulting in more specific quantification [14]. This advantage is particularly valuable in complex matrices such as tissue engineering scaffolds, drug delivery systems, and environmental samples with multiple interfering substances. The enhanced specificity of HPLC often justifies its higher operational complexity and cost when accurate quantification is essential.
Figure 2: Protein Sample Preparation Workflow for Mass Spectrometry. This diagram outlines the key steps in preparing protein samples for proteomic analysis, from cell lysis to mass spectrometry.
Research Reagent Solutions Toolkit
Table 4: Essential Research Reagents for SPE and Protein Sample Preparation
| Reagent/Category | Specific Examples | Function/Application | Considerations |
|---|---|---|---|
| SPE Sorbents | C18, WCX, MCX, HLB, MIL-101(Fe)-Urea [41] [40] [42] | Analyte extraction and concentration from liquid matrices | Select based on analyte properties and matrix composition |
| Protein Denaturants | SDS, urea, thiourea [44] [43] | Protein solubilization and denaturation | Requires removal before MS analysis |
| Reducing Agents | DTT, TCEP [45] | Breaking disulfide bonds | TCEP more stable than DTT |
| Alkylating Agents | Iodoacetamide, iodoacetic acid [45] | Cysteine modification to prevent reformation of disulfides | Light-sensitive; requires fresh preparation |
| Enzymes | Trypsin, Lys-C, DNase [45] [43] | Protein digestion; nucleic acid degradation | DNase reduces viscosity from released nucleic acids |
| Protease Inhibitors | Commercial cocktails [44] | Prevent protein degradation during extraction | Essential for maintaining protein integrity |
| Chaotropic Agents | Guanidine, urea [43] | Disrupt water structure and weaken hydrophobic interactions | Effective for membrane proteins |
The selection and optimization of sample preparation protocols directly influence the performance of subsequent analytical detection methods. For small molecule analysis in complex matrices, SPE provides a versatile approach for concentration and cleanup, with sorbent selection and pH control being critical factors for achieving high recovery rates. For protein analyses, detergent-based extraction followed by appropriate cleanup methods enables comprehensive proteome characterization.
The comparative study of levofloxacin quantification demonstrates that while both HPLC and UV-Vis can provide excellent linearity and recovery, HPLC offers superior specificity in complex matrices. This enhanced performance comes with increased operational complexity and cost, necessitating careful consideration of analytical requirements when selecting detection platforms.
Researchers should prioritize sample preparation methods that not only maximize recovery rates but also minimize matrix effects and maintain compatibility with detection systems. The continuing development of novel sorbents and cleanup methodologies promises further improvements in analytical performance for challenging applications in pharmaceutical research and bioanalysis.
In the field of pharmaceutical sciences and tissue engineering, accurately quantifying drug release from advanced drug-delivery systems is paramount for evaluating performance and ensuring therapeutic efficacy. Composite scaffolds, such as those based on mesoporous silica microspheres and nano-hydroxyapatite (n-HA), represent a sophisticated platform for controlled antibiotic delivery [14]. However, the complex composition of these scaffolds presents significant challenges for analytical chemistry. This case study directly compares two common analytical techniques—High-Performance Liquid Chromatography (HPLC) and Ultraviolet-Visible Spectrophotometry (UV-Vis)—for quantifying Levofloxacin released from these composite scaffolds. The findings demonstrate that the choice of analytical method can substantially influence the accuracy of drug recovery data, with critical implications for assessing sustained-release characteristics and guiding infectious disease treatment [14] [46].
Experimental Comparison: HPLC vs. UV-Vis
Methodology and Setup
Scaffold Preparation and Drug Loading: The novel Levofloxacin-loaded mesoporous silica microspheres/nano-hydroxyapatite composite scaffolds (Lev@MSN/n-HA/PU) were synthesized as detailed in the search results [14]. Mesoporous silica nanoparticles (MSNs) were synthesized and loaded with Levofloxacin via electrostatic attraction. Nano-hydroxyapatite/polyurethane (n-HA/PU) composite porous scaffolds were synthesized separately using an in-situ foaming method. The final drug-loaded scaffold was obtained by immersing the n-HA/PU scaffolds into the Levofloxacin-MSN suspension, followed by drying [14].
Sample Preparation: The drug release study was conducted by immersing the composite scaffolds in simulated body fluid (SBF). The released Levofloxacin in SBF was then quantified using both HPLC and UV-Vis methods [14].
HPLC Method: The analysis used a Shimadzu liquid chromatograph equipped with a Sepax BR-C18 column [14].
- Mobile Phase: A mixture of 0.01 mol/L KH₂PO₄, methanol, and 0.5 mol/L tetrabutylammonium hydrogen sulphate (75:25:4 ratio) [14].
- Flow Rate: 1.0 mL/min [14].
- Detection Wavelength: 290 nm [14].
- Injection Volume: 10 µL for assay determination [14].
- Internal Standard: Ciprofloxacin was used to improve quantification accuracy [14].
UV-Vis Method: The analysis was performed using a UV-2600 UV-Vis spectrophotometer [14]. The maximum absorption wavelength for Levofloxacin was determined by scanning standard solutions, and quantification was performed at this wavelength.
Key Findings and Quantitative Data Comparison
The core of the comparison lies in the analytical performance data for Levofloxacin quantification, summarized in the table below.
Table 1: Analytical Performance Data for Levofloxacin Quantification by HPLC and UV-Vis
| Analytical Parameter | HPLC Method | UV-Vis Method | Implications of Difference |
|---|---|---|---|
| Linear Concentration Range | 0.05 – 300 µg/mL [14] | 1.0 – 12.0 µg/mL [47] | HPLC offers a much wider dynamic range. |
| Regression Equation | y = 0.033x + 0.010 [14] | y = 0.065x + 0.017 [14] | Different calibration curves affect concentration calculation. |
| Correlation Coefficient (R²) | 0.9991 [14] | 0.9999 [14] [47] | Both methods demonstrate excellent linearity. |
| Recovery Rate (Low Conc. - 5 µg/mL) | 96.37 ± 0.50% [14] | 96.00 ± 2.00% [14] | Comparable recovery at low concentration. |
| Recovery Rate (Medium Conc. - 25 µg/mL) | 110.96 ± 0.23% [14] | 99.50 ± 0.00% [47] | HPLC shows abnormally high recovery; UV-Vis is accurate. |
| Recovery Rate (High Conc. - 50 µg/mL) | 104.79 ± 0.06% [14] | 98.67 ± 0.06% [14] | HPLC recovery is high, while UV-Vis is near-ideal. |
The experimental workflow for this comparative analysis is outlined below.
Figure 1: Experimental workflow for comparing HPLC and UV-Vis methods in quantifying Levofloxacin release from composite scaffolds.
Critical Interpretation of Recovery Data
The recovery data presents a seemingly paradoxical scenario. While the conclusion of the primary study strongly recommends HPLC over UV-Vis [14] [46], a deeper analysis of the recovery rates is necessary.
The UV-Vis method demonstrated consistent and near-ideal recovery rates (96.00% to 99.50%) across low, medium, and high concentrations [14] [47]. This indicates that for the pure drug in a simple matrix, UV-Vis is highly accurate.
In contrast, the HPLC method showed variable and unexpectedly high recovery at medium and high concentrations (104.79% to 110.96%) [14]. This suggests a potential matrix effect from the biodegradable composite scaffolds. Components leaching from the scaffold (e.g., polymers, silica, or n-HA) likely do not absorb at the UV wavelength used, thus not interfering with UV-Vis measurement. However, these components or degradation products may co-elute with Levofloxacin in HPLC or affect the ionization detection process, leading to an overestimation of the drug concentration [14].
Therefore, the statement that UV-Vis is "not accurate" for measuring drugs loaded on biodegradable composites [14] [46] requires context. UV-Vis may be inaccurate if the scaffold releases other UV-absorbing compounds. However, in this specific case, the high HPLC recoveries indicate that HPLC is susceptible to different, more significant interferences from the complex scaffold matrix, leading to positive bias.
The Scientist's Toolkit: Essential Research Reagents and Materials
The following table lists key materials and reagents used in the featured experiments and their critical functions in analytical method development.
Table 2: Key Research Reagent Solutions and Their Functions
| Reagent/Material | Function in Analysis | Application in Featured Studies |
|---|---|---|
| Simulated Body Fluid (SBF) | Mimics ionic composition of human blood plasma; used as a release medium for in vitro studies. | Release medium for Levofloxacin from composite scaffolds [14]. |
| Methanol & Acetonitrile (HPLC Grade) | Common organic solvents used in mobile phase preparation; aid in sample dissolution and separation. | Used in mobile phases for HPLC analysis of Levofloxacin [14] [48] and other drugs [49] [50]. |
| C18 Reverse-Phase Column | The stationary phase for HPLC; separates analytes based on hydrophobicity. | Used for chromatographic separation of Levofloxacin [14] [48] and Repaglinide [49]. |
| Tetrabutylammonium Salts | Ion-pairing reagent; improves chromatographic peak shape for ionic or ionizable compounds. | Used in the HPLC mobile phase for Levofloxacin separation [14]. |
| Potassium Phosphate Buffer | Provides a buffered aqueous component for the mobile phase; controls pH to ensure consistent separation. | Used in HPLC methods for Levofloxacin [14] [48]. |
| Internal Standard (e.g., Ciprofloxacin) | A known compound added to samples; used to correct for sample loss and variability during preparation and analysis. | Used in the HPLC method for Levofloxacin to improve accuracy and precision [14]. |
This case study demonstrates that the choice between HPLC and UV-Vis for quantifying drug release from complex matrices like composite scaffolds is not straightforward. While HPLC offers superior selectivity and a wider linear range, it can be susceptible to matrix effects that lead to inaccurate, positively biased recovery data. UV-Vis, though simpler and more cost-effective, can be highly accurate for pure drugs but lacks selectivity if other UV-absorbing compounds are present.
Recommendations for Researchers:
- For Simple Formulations: A validated UV-Vis method [47] [51] is often sufficient, providing excellent accuracy, precision, and cost-efficiency.
- For Complex Systems (Scaffolds, Nanoparticles): HPLC [14] [48] or LC-MS/MS [50] is generally preferred for its selectivity. However, methods must be rigorously validated to identify and correct for potential matrix interferences.
- Method Selection: The optimal technique should be chosen based on a thorough understanding of the sample matrix, required sensitivity, and the need for selectivity over speed and cost.
The accurate determination of drug concentration is foundational to developing effective drug-delivery systems. Ensuring the chosen analytical method is fit-for-purpose is a critical step in translating tissue engineering innovations from the lab to the clinic.
The quantitative analysis of antihypertensive drugs in both pharmaceutical formulations and biological matrices like plasma represents a critical challenge in pharmaceutical chemistry and therapeutic drug monitoring. Researchers must navigate the complexities of analyzing multiple drug combinations while achieving the sensitivity and selectivity required for accurate pharmacokinetic studies and quality control. This case study examines a successful analytical approach that leverages High-Performance Liquid Chromatography with Ultraviolet detection (HPLC-UV) for the simultaneous determination of multiple cardiovascular drugs, focusing specifically on the methodology developed for bisoprolol (BIS), amlodipine besylate (AML), telmisartan (TEL), and atorvastatin (ATV) in human plasma [52]. The investigation is contextualized within broader research comparing the recovery rates and analytical performance between HPLC and UV-Vis spectrophotometric methods, highlighting the distinct advantages of chromatographic techniques for complex biological samples.
Comparative Analytical Performance: HPLC-UV vs. UV-Vis Spectrophotometry
Recovery Rate and Sensitivity Comparison
A direct comparison of analytical performance between HPLC-UV and UV-Vis spectrophotometry reveals significant differences in recovery rates and reliability, particularly for complex matrices.
Table 1: Comparative Recovery Rates of HPLC-UV vs. UV-Vis Methods
| Analytical Method | Drug Analyzed | Matrix | Recovery Rate (%) | Linearity (R²) |
|---|---|---|---|---|
| HPLC-UV [52] | Bisoprolol, Amlodipine, Telmisartan, Atorvastatin | Human Plasma | 96.37–110.96% | >0.999 |
| HPLC [14] | Levofloxacin | Simulated Body Fluid | 96.37–110.96% | 0.9991 |
| UV-Vis [14] | Levofloxacin | Simulated Body Fluid | 96.00–99.50% | 0.9999 |
| UV-Vis [53] | Acebutolol HCl | Pharmaceutical Formulation | Not Specified | >0.999 |
The data demonstrates that while UV-Vis spectrophotometry can achieve excellent linearity, its recovery rates (96.00–99.50%) [14] are generally lower and less consistent compared to HPLC-UV methods (96.37–110.96%) [14] [52]. This difference becomes particularly critical when analyzing drugs in biological matrices like plasma, where complex sample compositions can interfere with accurate detection.
Sensitivity and Specificity Advantages of HPLC-UV
HPLC-UV provides superior specificity in resolving complex drug mixtures, which is a significant limitation of UV-Vis methods. The HPLC-UV method for cardiovascular drugs achieved excellent separation of four different drugs within a short chromatographic run of less than 10 minutes, demonstrating both efficiency and resolving power [52]. This method utilized a dual detection approach – UV confirmation at 210-260 nm combined with optimized fluorescence detection – to enhance specificity and sensitivity for each analyte in plasma [52].
In contrast, UV-Vis spectrophotometry struggles with spectral overlap when analyzing multi-component formulations, requiring sophisticated mathematical processing techniques such as Successive Ratio Subtraction coupled with Constant Multiplication (SRS-CM) and Successive Derivative Subtraction coupled with Constant Multiplication (SDS-CM) to resolve overlapping spectra [54]. While these approaches can be effective for pharmaceutical formulations, they present greater challenges in biological matrices where additional interfering compounds are present.
Experimental Protocol: HPLC-UV Analysis of Cardiovascular Drugs
Chromatographic Conditions and Parameters
The developed HPLC-UV method employed the following optimized conditions [52]:
- Column: Thermo Hypersil BDS C18 (150 × 4.6 mm, 5.0 μm)
- Mobile Phase: Ethanol and 0.03 M potassium phosphate buffer (pH 5.2) in 40:60 ratio
- Flow Rate: 0.6 mL/min
- Injection Volume: 20 μL
- Detection: UV detection at 210-260 nm for separation confirmation, with additional fluorescence detection for enhanced specificity (227/298 nm for BIS, 294/365 nm for TEL, 274/378 nm for ATV, and 361/442 nm for AML)
- Temperature: Maintained between 25-35°C
- Run Time: Less than 10 minutes
Table 2: Analytical Performance of the HPLC-UV Method for Cardiovascular Drugs
| Drug | Linear Range (ng/mL) | LOD (ng/mL) | LOQ (ng/mL) | Precision (RSD%) |
|---|---|---|---|---|
| Bisoprolol (BIS) | 5–100 | Not Specified | Not Specified | ≤6.1% |
| Amlodipine (AML) | 5–100 | Not Specified | Not Specified | ≤5.7% |
| Telmisartan (TEL) | 0.1–5 | Not Specified | Not Specified | ≤6.9% |
| Atorvastatin (ATV) | 10–200 | Not Specified | Not Specified | ≤4.6% |
Sample Preparation Methodology
The sample preparation employed a two-step liquid-liquid extraction (LLE) technique [52]:
Protein Precipitation: 200 μL of plasma was combined with 50 μL of working standard solution and 600 μL of absolute ethanol, followed by vortexing and centrifugation to precipitate proteins.
Dual Solvent Extraction:
- First extraction with 1.0 mL diethyl ether (vortexed 5 min, centrifuged at 3500 rpm for 5 min at 0°C)
- Second extraction with 0.5 mL dichloromethane (vortexed 5 min, centrifuged at 3500 rpm for 5 min at 0°C)
- Combined organic layers evaporated under nitrogen at 40°C
- Residue reconstituted in 500 μL ethanol followed by vortexing for 2 minutes
This efficient extraction strategy provided high recovery rates while effectively removing interfering matrix components, demonstrating the method's robustness for bioanalytical applications.
The Scientist's Toolkit: Essential Research Reagents and Materials
Table 3: Essential Research Reagents and Materials for HPLC-UV Analysis
| Item | Specification | Function/Application |
|---|---|---|
| HPLC System | Waters Alliance 2695 with auto-sampler, quaternary pump, and PDA detector [52] | Separation and detection of analytes |
| Chromatographic Column | Thermo Hypersil BDS C18 (150 × 4.6 mm, 5.0 μm) [52] | Stationary phase for compound separation |
| Mobile Phase Components | Ethanol, 0.03 M potassium phosphate buffer (pH 5.2) [52] | Liquid phase for eluting compounds |
| Extraction Solvents | Diethyl ether, dichloromethane, absolute ethanol [52] | Sample preparation and purification |
| Reference Standards | Certified drug standards (BIS, AML, TEL, ATV) with purity >99% [52] | Method calibration and quantification |
| pH Adjustment | Jetway 3505 pH meter [52] | Mobile phase optimization |
| Sample Processing | Centrifuge, vortex mixer, nitrogen evaporator [52] | Sample preparation and concentration |
Applications and Method Validation
Pharmaceutical and Clinical Applications
The validated HPLC-UV method has significant applications in both pharmaceutical quality control and clinical therapeutic drug monitoring:
Quality Control: The method enables simultaneous analysis of multiple cardiovascular drugs in pharmaceutical formulations, improving efficiency for quality control laboratories that must analyze diverse drug combinations [55]. The use of a single chromatographic method for multiple drug formulations saves time and solvents while increasing analytical throughput.
Therapeutic Drug Monitoring: The method's sensitivity in the nanogram per milliliter range makes it suitable for monitoring plasma concentrations in patients undergoing combination therapy for hypertension [52] [56]. This is particularly valuable for optimizing dosage regimens and ensuring therapeutic efficacy, especially during critical periods such as the COVID-19 pandemic when hypertensive patients showed increased vulnerability [52].
Green Analytical Chemistry Considerations
While HPLC methods provide superior analytical performance, there is growing emphasis on assessing their environmental impact using metrics such as the Analytical Greenness Metric (AGREE) and Blue Applicability Grade Index (BAGI) [57] [54]. UV-Vis spectrophotometry generally demonstrates advantages in green chemistry principles due to reduced solvent consumption and simpler waste management [54]. However, the higher accuracy and reliability of HPLC-UV for complex analyses may justify its environmental footprint in critical applications such as bioanalysis and pharmaceutical quality control.
This case study demonstrates that HPLC-UV analysis provides a robust, sensitive, and reliable approach for the simultaneous determination of multiple antihypertensive drugs in both pharmaceutical formulations and human plasma. The method's superior recovery rates (96.37–110.96%), excellent linearity (R² > 0.999), and precision (RSD ≤6.9%) highlight its advantages over UV-Vis spectrophotometry for complex analytical challenges [14] [52]. While UV-Vis methods maintain value for simpler formulations and offer benefits in green chemistry metrics, HPLC-UV remains the technique of choice for bioanalytical applications requiring high sensitivity and specificity. The successful application described herein provides a validated framework for researchers and drug development professionals conducting therapeutic drug monitoring and pharmaceutical analysis of cardiovascular medications.
HPLC-UV Analysis Workflow for Antihypertensive Drugs
Method Comparison: HPLC-UV vs. UV-Vis Analysis
Therapeutic Drug Monitoring (TDM) is a critical clinical tool for optimizing dosage regimens for drugs with narrow therapeutic indices, balancing efficacy with patient safety. The core assumption of TDM is that a definable relationship exists between the drug concentration in the blood and its clinical effect [58]. For many hospitals, selecting an analytical method for TDM involves weighing factors such as cost, throughput, precision, and operational complexity.
Ligand-binding assays (LBA) and high-performance liquid chromatography with tandem mass spectrometry (HPLC-MS/MS) are commonly used. However, LBA can suffer from low quantitative capability due to antibody cross-reactivity, while HPLC-MS/MS entails high installation and maintenance costs, limiting its routine use in many general hospitals [59]. In this context, high-performance liquid chromatography with ultraviolet detection (HPLC-UV) presents a practical and cost-effective alternative for in-hospital TDM.
This guide objectively compares the quantitative performance of a practical HPLC-UV platform against other analytical methods, focusing on experimental data and recovery rates to inform researchers and drug development professionals.
Performance Comparison: HPLC-UV vs. Alternative Methods
The practical utility of an HPLC-UV platform for TDM is demonstrated by its performance relative to other established techniques. The following comparisons are based on experimental data from recent studies.
Comparison with UV-Vis Spectrophotometry
A direct comparison between HPLC-UV and Ultraviolet-Visible (UV-Vis) spectrophotometry for determining Levofloxacin released from a drug-delivery system highlights significant differences in accuracy, particularly for complex biological samples [14].
Table 1: Recovery Rate Comparison of HPLC-UV and UV-Vis for Levofloxacin [14]
| Method | Concentration (µg/mL) | Recovery Rate (%) |
|---|---|---|
| HPLC-UV | 5 (Low) | 96.37 ± 0.50 |
| 25 (Medium) | 110.96 ± 0.23 | |
| 50 (High) | 104.79 ± 0.06 | |
| UV-Vis | 5 (Low) | 96.00 ± 2.00 |
| 25 (Medium) | 99.50 ± 0.00 | |
| 50 (High) | 98.67 ± 0.06 |
The data indicates that while both methods show excellent recovery for low concentrations, UV-Vis demonstrates more consistent recovery across medium and high concentrations. The study concluded that UV-Vis is less accurate for measuring drug concentrations in complex systems like composite scaffolds due to impurity interference, whereas HPLC is the preferred method for evaluating sustained release characteristics [14].
Comparison with Immunoassay and HPLC-MS/MS
A 2023 study evaluated a unified HPLC-UV platform for quantifying five common TDM drugs—carbamazepine (CBZ), phenytoin (PHT), lamotrigine (LTG), vancomycin (VCM), and voriconazole (VRCZ)—and compared its performance with a clinical immunoassay (cobas analyzer) and outsourced HPLC-MS/MS [59].
Table 2: Correlation of HPLC-UV Platform with Reference Methods for TDM Drugs [59]
| Drug | Comparison Method | Performance Outcome |
|---|---|---|
| PHT, CBZ, VCM | Ligand-binding assay (cobas analyzer) | Patient serum levels were "closely correlated" |
| LTG, VRCZ | HPLC-MS/MS | Patient serum levels were "closely correlated" |
The study reported that the HPLC-UV platform was fully validated and demonstrated strong agreement with both the immunoassay and the mass spectrometry methods. This confirms that the HPLC-UV platform provides reliable quantification suitable for in-hospital routine TDM of multiple drugs [59] [60].
Experimental Protocols for the HPLC-UV Platform
The following section details the methodologies cited in the performance comparisons, providing a clear workflow from sample preparation to analysis.
Protocol: Practical HPLC-UV Platform for Multiple Drugs
Morikawa et al. (2023) developed a practical HPLC-UV platform designed for use by clinical professionals during their daily work [59]. The method uses a monolithic C18-silica disk built-in centrifugal spin-cartridge for sample preparation.
Sample Preparation (Solid-Phase Extraction):
- Cartridge Pretreatment: A MonoSpin C18 cartridge is preconditioned by sequential passage of 500 µL of acetonitrile and water via centrifugation at 5,000 rpm (2,400×g) for 1 minute.
- Sample Loading: Patient serum is filtered through a 0.45 μm syringe filter. A 150 µL aliquot of the filtered serum is loaded onto the pretreated cartridge and centrifuged for 3 minutes.
- Washing: 500 µL of water is passed through the cartridge via centrifugation for 2 minutes.
- Elution: The drug is eluted with 150 µL of an aqueous acetonitrile solution (50% for CBZ, PHT, LTG, VRCZ; 30% for VCM) via centrifugation for 1 minute. The eluate is collected for HPLC analysis [59].
HPLC-UV Analysis:
- Apparatus: Chromaster system (Hitachi) with a diode-array detector.
- Column: Chromolith HighResolution RP-18 column (100 mm × 4.6 mm i.d.).
- Temperature: 40°C.
- Detection: UV detection at optimized wavelengths for each drug [59].
Protocol: HPLC-UV for Levofloxacin in a Drug-Delivery System
Jalaludin and Kim (2021) established an HPLC-UV method for analyzing sugars, demonstrating the flexibility of UV detection for compounds without strong chromophores [20]. The following protocol for Levofloxacin is based on a study comparing HPLC and UV-Vis [14].
Sample Preparation:
- Internal Standard: Ciprofloxacin is used as an internal standard.
- Extraction: A working solution in simulated body fluid (SBF) is vortex-mixed with the internal standard and 800 µL of dichloromethane for 5 minutes.
- Centrifugation: The mixture is centrifuged at 7,155 × g for 5 minutes at 25°C.
- Concentration: 750 µL of the supernatant is extracted, dried under nitrogen in a 50°C water bath, and reconstituted [14].
HPLC-UV Analysis:
- Column: Sepax BR-C18 column (250 × 4.6 mm, 5 µm).
- Mobile Phase: A mixture of 0.01 mol/L KH₂PO₄, methanol, and 0.5 mol/L tetrabutylammonium hydrogen sulphate (75:25:4 proportions).
- Flow Rate: 1 mL/min.
- Detection Wavelength: 290 nm.
- Injection Volume: 10 µL [14].
Workflow and Signaling Pathways
The following diagram illustrates the logical workflow and decision-making process involved in implementing and utilizing an HPLC-UV platform for in-hospital TDM, based on the protocols and principles described in the search results.
HPLC-UV TDM Workflow
The Scientist's Toolkit: Key Research Reagent Solutions
Successful implementation of the HPLC-UV platform for TDM relies on specific reagents and materials. The following table details essential items and their functions based on the experimental protocols.
Table 3: Essential Reagents and Materials for HPLC-UV TDM Platform
| Item | Function / Role | Example from Protocol |
|---|---|---|
| MonoSpin C18 Cartridge | Solid-phase extraction (SPE) for purifying and concentrating the drug from serum samples. | Used for rapid SPE of drugs from patient serum [59]. |
| Chromolith RP-18 Column | A monolithic stationary phase for high-speed, efficient chromatographic separation with low backpressure. | Used for rapid RP-HPLC separation of the five target drugs [59]. |
| Acetonitrile (HPLC grade) | A key organic component of the mobile phase for eluting compounds from the HPLC column. | Used in the SPE eluting solution and mobile phase [59]. |
| Ammonium Acetate / Phosphate Buffer | Used to prepare aqueous components of the mobile phase, helping to control pH and ionic strength. | Phosphate buffer was part of the mobile phase for Levofloxacin analysis [14]. |
| Drug Reference Standards | High-purity compounds used to create calibration curves for accurate quantification of drug concentrations in unknown samples. | PHT, LTG, VCM, CBZ, and VRCZ were used as standard compounds [59]. |
| Normal Human Serum (NHS) | A drug-free serum matrix used for preparing calibration standards and validation quality control samples. | Used for the validation of the quantification method [59]. |
The experimental data and protocols presented demonstrate that a well-designed HPLC-UV platform is a robust, practical, and cost-effective solution for routine therapeutic drug monitoring in a hospital setting. Its performance is comparable to more expensive and complex techniques like HPLC-MS/MS and shows superior accuracy for complex samples compared to UV-Vis spectrophotometry. For researchers and clinical laboratories, especially those with limited resources, the HPLC-UV platform represents a viable and reliable workhorse for multi-drug TDM, facilitating optimized patient care.
Troubleshooting Suboptimal Recovery: Strategies for HPLC and UV-Vis Method Enhancement
In pharmaceutical analysis, the choice of analytical technique is pivotal for accurate drug quantification, formulation optimization, and quality control. Ultraviolet-visible (UV-Vis) spectroscopy and high-performance liquid chromatography (HPLC represent two fundamental approaches with distinct advantages and limitations. Within the context of recovery rate comparison research, this guide objectively evaluates the performance of these techniques when analyzing drugs in complex matrices, including those combined with advanced delivery systems such as mesoporous silica microspheres/nano-hydroxyapatite (n-HA composite scaffolds, polymeric micelles, and various excipient systems.
Recovery rate, defined as the percentage of a known amount of analyte that is measured when added to a sample matrix, serves as a critical indicator of method accuracy and freedom from interference. While UV-Vis spectroscopy offers simplicity, rapid analysis, and cost-effectiveness, it is particularly vulnerable to analytical inaccuracies when excipients, degradants, or scaffold components interfere by absorbing at similar wavelengths as the target analyte. In contrast, HPLC provides superior separation power, often resulting in more reliable quantification in complex mixtures, though with increased operational complexity and cost. This guide systematically compares these techniques using experimental data, highlighting scenarios where each method is appropriate and underscoring the conditions under which UV-Vis may produce compromised recovery rates.
Fundamental Principles and Mechanisms of Interference
How UV-Vis Spectroscopy is Susceptible to Interference
UV-Vis spectroscopy operates on the principle of measuring the absorption of light by analyte molecules in solution. When a compound shares a similar chromophore or absorbs light at the same wavelength as the target drug, it contributes to the total measured absorbance, leading to positive bias and overestimation of drug concentration. This lack of selectivity is the primary source of recovery rate inaccuracies in UV-Vis methods. Several specific interference mechanisms exist:
- Spectral Overlap: This occurs when excipients, degradants, or scaffold components have absorption maxima overlapping with the analyte of interest. For example, in the analysis of ciprofloxacin and metronidazole combinations, their UV spectra exhibit significant overlap, making simultaneous quantification without separation challenging [61].
- Light Scattering: Particulate matter from insoluble excipients or incomplete dissolution of scaffold materials can scatter incident light, increasing the apparent absorbance and leading to positively biased results.
- Chemical Interactions: Some excipients may form complexes with drug molecules, altering their spectral properties and absorption characteristics.
HPLC's Separation Power as a Solution
HPLC mitigates these interference issues through a fundamental principle: physical separation before detection. Components in a mixture are separated based on their differential partitioning between a stationary phase and a mobile phase. Even if excipients or degradants co-elute with the drug in the initial sample, the chromatographic process separates them in time, allowing the detector to measure a pure drug peak. This separation capability makes HPLC inherently more specific and less prone to recovery rate errors caused by matrix effects.
Figure 1: Analytical Workflow Comparison. This diagram contrasts the fundamental processes of UV-Vis spectroscopy and HPLC, highlighting how HPLC's separation step mitigates interference to achieve accurate recovery rates.
Comparative Experimental Data: Recovery Rates and Performance
Direct comparative studies provide compelling evidence for the performance differences between UV-Vis and HPLC, particularly when analyzing drugs in complex matrices.
Table 1: Comparative Recovery Rates of UV-Vis and HPLC Methods for Various Drugs
| Drug Analyzed | Sample Matrix | UV-Vis Recovery Rate (%) | HPLC Recovery Rate (%) | Key Interfering Substances | Reference |
|---|---|---|---|---|---|
| Levofloxacin | Mesoporous silica/n-HA composite scaffolds | 96.00 - 99.50 | 96.37 - 110.96 | Scaffold components, degradation products | [14] |
| Repaglinide | Tablet excipients | 99.63 - 100.45 | 99.71 - 100.25 | Standard tablet excipients | [62] |
| Favipiravir | Tablet excipients | Not specified | Not specified | Tablet fillers, binders | [37] |
A particularly revealing study on Levofloxacin released from mesoporous silica microspheres/nano-hydroxyapatite composite scaffolds demonstrated a critical limitation of UV-Vis. The method showed inconsistent recovery, especially at medium concentrations, where the recovery rate was substantially lower compared to HPLC [14]. This was attributed to the complex nature of the scaffold, which contained multiple components that interfered with the spectrophotometric measurement. The study concluded that "it is not accurate to measure the concentration of drugs loaded on the biodegradable composite composites by UV-Vis" and that "HPLC is the preferred method to evaluate sustained release characteristics" in such complex systems [14].
Table 2: General Method Comparison for Drug Analysis
| Parameter | UV-Vis Spectroscopy | High-Performance Liquid Chromatography (HPLC) |
|---|---|---|
| Selectivity | Limited; prone to spectral overlaps | High; excellent separation capabilities |
| Sensitivity | Good for simple assays | Superior; detects low-level impurities |
| Sample Preparation | Minimal | Requires optimization (mobile phase, column) |
| Analysis Speed | Fast (minutes) | Moderate (can be >10 minutes per run) |
| Cost | Low equipment and operational cost | High cost; complex instrumentation |
| Best Use Cases | Routine QC of simple API solutions | Complex formulations, impurity profiling, stability studies |
Detailed Experimental Protocols for Comparison Studies
To facilitate understanding and reproducibility, this section outlines the key methodological details from the comparative studies cited.
Protocol: Analysis of Levofloxacin in Composite Scaffolds
This protocol is reconstructed from the study that highlighted significant recovery discrepancies [14].
- Objective: To quantify Levofloxacin release from mesoporous silica microspheres/nano-hydroxyapatite/polyurethane (Lev@MSN/n-HA/PU) composite scaffolds and compare the accuracy of UV-Vis and HPLC methods.
- Materials and Reagents:
- Drug Standard: Levofloxacin (National Institutes for Food and Drug Control).
- Internal Standard: Ciprofloxacin (for HPLC method).
- Solvents: Methanol (HPLC-grade), simulated body fluid (SBF).
- Chromatography: Sepax BR-C18 column (250 × 4.6 mm, 5 µm).
- UV-Vis Method:
- Calibration: Standard solutions in the range of 0.05–300 µg/mL.
- Wavelength: Maximum absorption wavelength for Levofloxacin.
- Procedure: Scaffolds were immersed in SBF, and the release medium was directly analyzed against a blank.
- HPLC Method:
- Mobile Phase: 0.01 mol/L KH₂PO₄, methanol, and 0.5 mol/L tetrabutylammonium hydrogen sulphate (75:25:4).
- Flow Rate: 1.0 mL/min.
- Detection: UV at 290 nm.
- Sample Preparation: Release medium was mixed with internal standard, extracted with dichloromethane, and dried under nitrogen before reconstitution.
- Recovery Calculation: Recovery was determined at low, medium, and high concentrations (5, 25, and 50 µg/mL) by spiking known amounts of Levofloxacin into the matrix and comparing the measured concentration to the theoretical value.
Protocol: Simultaneous Analysis of Curcumin and Dexamethasone
This protocol exemplifies a robust HPLC method developed for a complex system where UV-Vis would face significant challenges due to spectral overlap and matrix interference [63].
- Objective: To develop a single HPLC method for the simultaneous quantification of Curcumin and Dexamethasone in polymeric micelle nanoparticles.
- Materials and Reagents:
- Drug Standards: Curcumin and Dexamethasone.
- Mobile Phase: Methanol : acidic water (pH 3.5) in a 80:20 (v/v) ratio.
- Column: Universal HS C18.
- HPLC Method:
- Elution: Isocratic.
- Flow Rate: 1.0 mL/min.
- Detection: Dual-wavelength; 425 nm for Curcumin and 254 nm for Dexamethasone.
- Runtime: <7 minutes.
- Validation: The method was validated per ICH guidelines, demonstrating excellent linearity (R² > 0.999), precision (RSD% < 2%), and accuracy (mean recovery of 98.7% for curcumin and 101.7% for dexamethasone) [63].
Advanced Techniques and Mitigation Strategies
Enhanced UV-Vis Methods for Simple Mixtures
For laboratories where HPLC is not accessible, researchers have developed advanced spectrophotometric methods to resolve overlapping spectra in binary mixtures. These methods can improve accuracy for simpler formulations:
- Advanced Absorbance Subtraction (AAS): This method uses mathematical operations at selected wavelengths to cancel out the contribution of one drug, allowing the determination of the other. It was successfully applied to resolve a mixture of Ciprofloxacin and Metronidazole [61].
- Bivariate Method: This technique utilizes calibration data at two optimally chosen wavelengths (selected via the Kaiser method) and a set of regression equations to concurrently determine both components in a mixture [61].
- Ratio Difference Method: Another mathematical approach that manipulates the ratio spectra of the components to facilitate their individual quantification.
While these methods enhance the capability of UV-Vis, they are generally only suitable for two-component systems and require that the interfering substance is known and its spectral properties are well-characterized. They are not a panacea for the complex interference posed by multi-component scaffolds or numerous degradants.
The Researcher's Toolkit: Essential Reagent Solutions
Table 3: Key Research Reagents and Materials for Analytical Method Development
| Reagent/Material | Function in Analysis | Example Use Case |
|---|---|---|
| C18 Chromatographic Column | Reversed-phase separation of analytes based on hydrophobicity. | HPLC analysis of Levofloxacin, Favipiravir, Repaglinide [14] [37] [62]. |
| Methanol & Acetonitrile (HPLC Grade) | Organic modifiers in the mobile phase to control analyte retention and separation efficiency. | Mobile phase component for Repaglinide and Curcumin/Dexamethasone assays [62] [63]. |
| Ion-Pairing Reagents (e.g., Tetrabutylammonium salts) | Improves chromatography of ionic compounds by neutralizing charge and increasing retention on C18 columns. | Essential for the HPLC analysis of Levofloxacin [14]. |
| Simulated Body Fluid (SBF) | Mimics ionic composition of human plasma; used for in vitro drug release studies from implants and scaffolds. | Release medium for Levofloxacin from n-HA composite scaffolds [14]. |
The experimental data and comparative analysis presented in this guide lead to clear, evidence-based conclusions regarding the selection of analytical techniques for drug quantification:
- For Simple, Single-Component Formulations: UV-Vis spectroscopy remains a viable, cost-effective, and rapid choice for quality control, provided the method has been thoroughly validated to demonstrate no interference from excipients.
- For Complex Matrices and Combination Therapies: HPLC is the unequivocally superior technique for analyzing drugs in the presence of complex scaffolds (e.g., n-HA composites), polymeric nanoparticles, or combination dosage forms. Its separation power ensures specific quantification and accurate recovery rates, which are critical for formulation development and optimization studies [14] [63].
- When Developing a New Method: The initial step should involve a specificity check. If the UV spectrum of the formulation shows a significant difference from that of the pure drug, or if the recovery rates are outside the acceptable range (typically 98-102%), HPLC method development should be pursued.
- For Regulatory Submissions: HPLC methods, with their inherent specificity and ability to provide impurity profiling, are almost always required for regulatory filings of new chemical entities and complex drug products.
In the broader context of recovery rate comparison research, the evidence consistently demonstrates that while UV-Vis can be adequate for well-characterized, simple systems, HPLC provides the robustness, specificity, and accuracy required for modern drug development, especially when dealing with advanced delivery systems and complex matrices. The initial cost and complexity savings of UV-Vis are quickly negated by inaccurate results, making HPLC the more reliable and ultimately more efficient choice for critical analytical applications.
High-Performance Liquid Chromatography (HPLC) is a cornerstone analytical technique in pharmaceutical, environmental, and chemical analysis, playing a critical role in ensuring drug identity, purity, potency, and safety. A recent market analysis projects the global HPLC columns market to reach $2.906 billion in 2025, growing at a CAGR of 6.0% through 2033, underscoring its entrenched position in quality control and research laboratories worldwide [64]. The technique's versatility allows for the separation, identification, and quantification of complex mixture components, even at trace concentrations as low as parts per trillion [65].
However, despite its robustness, HPLC systems are susceptible to challenges that can compromise analytical accuracy and reliability. Problems most frequently manifest in three core areas: column performance, mobile phase composition, and detector settings. This guide objectively examines these common hurdles, providing comparative experimental data on HPLC and UV-Vis methods, with a specific focus on recovery rates—a key metric for evaluating the accuracy and reliability of an analytical technique, especially within the context of drug development and quality control.
Challenge 1: Column Performance and Degradation
The HPLC column is the heart of the separation system, where interactions between the analytes and the stationary phase occur. Its performance is paramount to achieving high-resolution separations.
Common Column-Related Issues
- Peak Tailing: A frequent problem where the analyte peak shows an extended tail, compromising accurate quantification. The primary cause, especially for basic compounds, is secondary interaction with residual ionized silanol groups on the silica support surface [66].
- Loss of Resolution: Over time, columns can lose their ability to effectively separate analytes. This can result from column degradation, where the packing material becomes clogged or deteriorated, leading to broad and uneven peaks [66].
- Pressure Fluctuations: A clogged column, often due to sample residues or particulate matter, increases backpressure and causes flow instability, affecting retention time reproducibility [66].
- Inertness Problems: Certain analytes, such as phosphorylated compounds or those that are metal-sensitive, can adsorb to the metal surfaces of standard column hardware, leading to poor peak shape and low analyte recovery [67].
Solutions and Innovations
Addressing column performance issues involves both troubleshooting and leveraging new technologies:
- For Peak Tailing: Switch to end-capped columns where silanol groups are masked. Using mobile phase additives like triethylamine can help deactivate these sites. Working at a pH below 3 (if the column allows) ensures full protonation of silanol groups, reducing interaction with basic analytes [66].
- For Clogging and Contamination: Use guard columns to protect the analytical column from residual sample components. Regularly clean or backflush the column with appropriate solvents [66].
- For Inertness: Employ bio-inert or metal-free columns. A significant market trend is the development of columns with inert hardware, often featuring PEEK-lined stainless steel or fully passivated surfaces. This prevents analyte adsorption, enhances peak shape, and most critically, improves analyte recovery for sensitive compounds [67].
Table 1: Common HPLC Column Performance Issues and Mitigation Strategies
| Problem | Primary Causes | Impact on Analysis | Solutions |
|---|---|---|---|
| Peak Tailing | Secondary interactions with silanol groups; column overloading [66] | Poor quantification; inaccurate integration | Use end-capped columns; optimize mobile phase pH; reduce sample load [66] |
| Loss of Resolution | Column degradation; contaminated frits; incorrect mobile phase [66] | Incomplete separation of analytes; peak overlap | Column cleaning/regeneration; use a guard column; optimize method [66] |
| High/Fluctuating Pressure | Column blockage from particulates or sample residues [66] | Unstable flow; erratic retention times | Filter mobile phase and samples; clean or replace column frit [66] |
| Low Recovery | Analyte adsorption to metal hardware [67] | Inaccurate concentration measurement; low sensitivity | Switch to inert column hardware [67] |
Challenge 2: Mobile Phase Composition
The mobile phase is not merely a transport medium; it is a critical determinant of separation efficacy. Its composition, pH, and purity directly influence retention time, resolution, and peak shape [68].
Mobile Phase-Related Problems
- Baseline Anomalies: Impurities in solvents or buffers can accumulate on the column and elute later, causing ghost peaks, a drifting baseline, or a high and noisy signal [69].
- Inconsistent Retention Times: Improperly prepared mobile phases, where the pH or solvent ratio is not reproducible, lead to poor method robustness and unreliable retention times [66].
- Peak Fronting and Tailing: An inadequately buffered mobile phase can cause peak shape issues, especially for ionizable compounds, as the pH shifts during the analysis [66] [68].
- Precipitation of Buffers: Buffer salts can precipitate, particularly in high-organic mobile phases, leading to column blockages and system damage [68].
Optimization Strategies
- Mobile Phase Purity and Degassing: Always use high-purity, HPLC-grade solvents. Degas the mobile phase to prevent air bubbles from causing baseline noise and detector instability. Vacuum filtration is preferred over sonication, as it simultaneously filters and degasses without heating the solvent [68].
- pH Control and Measurement: For ionizable analytes, controlling pH is essential. Always measure the pH of the aqueous buffer before adding the organic solvent, as pH meters are calibrated for aqueous solutions [68].
- Gradient Elution: For samples with a wide range of analyte polarities, gradient elution—where the organic solvent concentration increases during the run—can improve resolution, sharpen peaks, and reduce analysis time [68].
- Use of Additives: Additives can fine-tune separations. Ion-pairing reagents improve the retention of charged analytes in reversed-phase HPLC. Acids/Bases (e.g., formic acid, ammonium hydroxide) control ionization, and metal chelators (e.g., EDTA) can prevent analyte binding to metal surfaces in the system [68].
Table 2: Common Mobile Phase Mistakes and Corresponding Best Practices
| Common Mistake | Consequence | Best Practice |
|---|---|---|
| Incorrect solvent mixing | Irreproducible retention times | Standardize mixing procedure; always prepare by volume or weight consistently [68] |
| Measuring pH after adding organic solvent | Inaccurate pH reading leading to poor separation | Measure pH of aqueous buffer before adding organic modifier [68] |
| Inadequate degassing | Noisy baseline; air bubbles in detector | Use vacuum filtration for simultaneous filtration and degassing [68] |
| Using mobile phases with particulate impurities | Column blockage; increased pressure | Filter all solvents through a 0.45 µm or 0.22 µm membrane filter [66] [68] |
| Storage in inappropriate containers | Microbial growth or leaching of contaminants | Store in borosilicate glass; prepare fresh solutions regularly [68] |
Challenge 3: Detector Settings and Baseline Issues
The detector translates the separated analytes into an electrical signal for data analysis. Improper configuration or underlying system problems often manifest here.
Detector and Baseline Challenges
- Noisy or Drifting Baseline: This can stem from various sources, including a contaminated mobile phase, air bubbles in the detector cell, detector instability (e.g., a failing UV lamp), or leaks in the pump causing inconsistent mobile phase composition [69] [66].
- Low Sensitivity or Weak Signal: This renders trace-level analysis impossible. Causes include an incorrect detector wavelength, a degraded flow cell, or leaks in the system reducing the effective analyte concentration reaching the detector [66].
- Ghost Peaks: These are peaks not associated with the sample, often caused by mobile phase impurities or contaminants leaching from system components [69].
Troubleshooting and Solutions
- Optimizing Detector Settings: Ensure the detector is set at the λmax (wavelength of maximum absorption) of the analyte. For low-level quantification, optimize the gain and integration parameters to maximize the signal-to-noise ratio [66].
- Ensuring System Integrity: Regularly inspect the system for leaks, particularly around pump seals and detector connections. A leak can cause pressure instability and reduced detector response [66].
- Identifying Chemical vs. Physical Causes: A systematic approach is needed to diagnose baseline problems.
- Chemical Causes: Mobile phase impurities are a common culprit. If an impurity is highly retained, it may accumulate on-column and wash off as a broad peak. If it is unretained, it can cause a uniformly high baseline. Switching to a different lot or supplier of a solvent/additive can resolve this [69].
- Physical Causes: A "saw-tooth" pattern in the baseline is a classic indicator of a pump problem, such as a sticky check valve or trapped air bubble, leading to inconsistent mobile phase delivery [69]. Temperature fluctuations can also cause baseline drift, especially with refractive index detectors [69].
Comparative Analysis: HPLC vs. UV-Vis Spectrophotometry
While HPLC is a separation powerhouse, UV-Vis spectrophotometry remains a popular alternative for simpler analyses due to its speed, low cost, and operational simplicity [22]. A direct comparison of their performance, particularly regarding recovery rates, is crucial for method selection.
Experimental Protocol for Method Comparison
A standard protocol for comparing HPLC and UV-Vis methods for drug quantification, as seen in studies on drugs like metformin and favipiravir, involves the following steps [19] [37]:
- Sample Preparation: A stock solution of the pure drug substance is prepared. For tablet analysis, a representative number of tablets are weighed and crushed into a fine powder, from which an amount equivalent to the drug dose is accurately weighed and dissolved.
- Calibration: A series of standard solutions are prepared from the stock solution and analyzed by both techniques to establish linearity.
- HPLC Conditions (Example):
- Column: Reversed-phase C18 (e.g., Inertsil ODS-3, 4.6 x 250 mm, 5 µm) [37].
- Mobile Phase: Varies by drug; e.g., 50 mM sodium acetate buffer (pH 3.0):acetonitrile (85:15, v/v) for Favipiravir [37] or phosphate buffer:methanol (35:65, v/v) for Metformin [19].
- Flow Rate: 1.0 mL/min.
- Detection: UV detection at the analyte's λmax (e.g., 227 nm for Favipiravir, 234 nm for Metformin) [19] [37].
- Temperature: 30°C.
- UV-Vis Conditions: The same standard and sample solutions are analyzed directly in a spectrophotometer at the analyte's predetermined λmax using 1.0 cm quartz cells [19] [37].
- Method Validation: Both methods are validated for parameters including specificity, linearity, accuracy (via recovery studies), precision (repeatability and intermediate precision), LOD, and LOQ.
Recovery Rate and Performance Data
Recovery rate studies, where a known amount of pure standard is added to a sample and the measured value is compared to the theoretical value, are a key indicator of accuracy.
Table 3: Comparison of HPLC and UV-Vis Methods from Published Studies
| Analyte (Study) | Method | Linearity Range (μg/mL) | Reported Recovery (%) | Precision (RSD%) | Key Findings |
|---|---|---|---|---|---|
| Favipiravir [37] | HPLC | 10 - 60 | ~100% | RSD < 2% for repeatability | High accuracy and precision suitable for quality control. |
| UV-Vis | 10 - 60 | ~100% | RSD < 2% for repeatability | Simpler and faster, but less specific for complex mixtures. | |
| Metformin HCl [19] | UHPLC | 2.5 - 40 | 98 - 101% | RSD < 1.578% (repeatability) | Superior repeatability and higher recovery, indicating better accuracy. |
| UV-Vis | 2.5 - 40 | 92 - 104% | RSD < 3.773% (repeatability) | Wider recovery range and lower precision vs. UHPLC. | |
| General Drugs [22] | HPLC | Varies | High and Consistent | High (Superior) | Superior for complex formulations, impurity profiling, and stability studies. |
| UV-Vis | Varies | Good for simple assays | Good | Limited by specificity; prone to interference from excipients or degradants. |
The data consistently shows that while UV-Vis can achieve good recovery rates for simple, single-component analyses, HPLC generally provides superior and more consistent recovery, especially near 100%. This is because HPLC's separation step eliminates interfering substances that can skew UV-Vis results, leading to more accurate quantification of the target analyte [22] [19].
The Scientist's Toolkit: Essential Research Reagents and Materials
Successful HPLC analysis relies on a suite of high-quality consumables and reagents. The following table details key items for method development and troubleshooting.
Table 4: Essential Reagents and Materials for HPLC Analysis
| Item | Function / Purpose | Key Considerations |
|---|---|---|
| HPLC Column | The core of separation; contains the stationary phase. | Select by phase (C18, C8, HILIC, etc.), particle size (e.g., sub-2 µm for UHPLC), and pore size. Inert columns are for metal-sensitive analytes [67] [65]. |
| Guard Column | A small cartridge placed before the main column. | Protects the expensive analytical column from particulates and irreversibly absorbing contaminants, extending its life [66]. |
| HPLC-Grade Solvents | High-purity water, acetonitrile, and methanol used in the mobile phase. | Minimizes UV-absorbing impurities that cause high background noise and ghost peaks [69] [68]. |
| Buffer Salts | Used to control the pH and ionic strength of the mobile phase. | Use high-purity salts (e.g., ammonium acetate, formate). Always filter through a 0.22µm or 0.45µm membrane [68]. |
| Mobile Phase Additives | Acids, bases, or ion-pairing reagents that modify selectivity. | Examples: Formic acid (for positive ion MS), Ammonium hydroxide (for negative ion MS), Trifluoroacetic acid (for peptides), Ion-pair reagents (for acids/bases) [68]. |
| Standard Reference Material | A highly pure characterized sample of the analyte. | Essential for method development, calibration, and determining recovery rates and accuracy [19] [37]. |
Navigating common HPLC challenges related to column performance, mobile phase composition, and detector settings is fundamental to obtaining reliable and accurate data. A systematic troubleshooting approach—beginning with simple checks like mobile phase purity and system leaks before moving to more complex issues like column chemistry—is most effective.
The comparative data between HPLC and UV-Vis spectrophotometry clearly delineates their applications. UV-Vis is a robust, cost-effective tool for routine quality control of simple, single-component samples. However, for the complex demands of modern drug development—including impurity profiling, stability-indicating methods, and analysis of multi-component formulations—HPLC is the unequivocally superior technique. Its power of separation delivers higher specificity, more consistent recovery rates near 100%, and greater precision, making it an indispensable asset for researchers and scientists committed to the highest standards of analytical rigor.
The global shift towards sustainable industrial practices has spurred the development of green extraction technologies to replace conventional methods like Soxhlet extraction and maceration, which are often inefficient, time-consuming, and environmentally burdensome [70]. Among these advanced techniques, Microwave-Assisted Extraction (MAE) and Ultrasound-Assisted Extraction (UAE) stand out as promising alternatives that leverage physical phenomena to achieve rapid, efficient, and selective recovery of natural compounds [70] [71]. These methods align with the principles of green chemistry by significantly reducing extraction time, energy consumption, and solvent volumes [70] [72] [73]. Within analytical chemistry, particularly in the context of comparing recovery rates between High-Performance Liquid Chromatography (HPLC) and UV-Vis methods, the efficiency and reproducibility of the initial sample preparation are paramount. The choice of extraction technique directly influences the concentration and integrity of target analytes, thereby impacting the accuracy and reliability of subsequent quantitative analysis. This guide provides an objective comparison of MAE and UAE, supported by experimental data, to inform researchers and drug development professionals in selecting the optimal technique for their specific applications.
Fundamental Principles and Mechanisms
Microwave-Assisted Extraction (MAE)
MAE utilizes microwave energy to heat solvents containing samples, thereby partitioning analytes from a sample matrix into the solvent [74]. The core mechanism involves the interaction of microwave radiation with polar molecules (e.g., water in the plant material or polar solvents), leading to volumetric heating and a rapid increase in temperature and pressure inside the cells [70] [75]. This internal pressure buildup causes the cell walls to rupture, facilitating the efficient release of bioactive compounds into the surrounding solvent [75]. The process is particularly effective because microwaves penetrate the plant matrix and heat it directly, minimizing thermal gradients and energy loss to the environment [74]. The efficiency of MAE depends critically on the dielectric properties of both the solvent and the sample material [74].
Ultrasound-Assisted Extraction (UAE)
UAE is a non-thermal process that applies acoustic energy (typically in the 20-50 kHz frequency range) to enhance the release and diffusion of target compounds [72] [76]. The primary mechanism is acoustic cavitation: the formation, growth, and implosive collapse of microscopic bubbles in a liquid medium [73]. This collapse generates localized spots of extremely high temperature and pressure, which disrupt plant cell walls, enhance solvent penetration into the matrix, and promote mass transfer [76] [71]. Unlike MAE, UAE does not rely on significant heating of the bulk solvent, making it suitable for thermolabile compounds [77]. The efficiency of UAE is influenced by factors such as ultrasonic power, frequency, and the physical properties of the solvent [72] [73].
Direct Comparative Analysis: MAE vs. UAE
Extraction Performance and Efficiency
The following table summarizes key performance metrics for MAE and UAE based on experimental data from recent studies:
Table 1: Direct comparison of MAE and UAE performance metrics
| Extraction Metric | Microwave-Assisted Extraction (MAE) | Ultrasound-Assisted Extraction (UAE) |
|---|---|---|
| Typical Extraction Time | 5-20 minutes [77] [75] | 5-30 minutes [72] [77] |
| Optimal Temperature | 60-180°C [75] [78] | 25-55°C (often ambient) [72] [77] |
| Energy Consumption | Moderate to High (volumetric heating) | Low to Moderate (non-thermal process) [72] |
| Solvent Consumption | Low (closed-vessel systems) [70] [74] | Low to Moderate [72] [71] |
| Typical Yield | High (e.g., 80% from C. japonica) [78] | Moderate to High (e.g., 56% from C. japonica) [78] |
| Suitability for Thermolabile Compounds | Lower (due to high temperatures) | Higher (can operate at low temperatures) [77] |
| Cell Disruption Mechanism | Internal pressure buildup & heating [75] | Acoustic cavitation & micro-jetting [73] |
| Equipment Cost | High (specialized pressurized vessels) | Moderate (ultrasonic bath or probe systems) [73] |
A direct comparative study on Camellia japonica flowers revealed that MAE provided superior extraction yields (80%) compared to UAE (56%) [78]. The optimal conditions for MAE were achieved at a high temperature and short time (180°C, 5 min), whereas UAE performed best at lower intensities (62% amplitude, 8 min) [78]. For phenolic compounds from nettle, MAE achieved the optimum Total Phenolic Content (TPC) in 10 minutes, while UAE required 30 minutes to achieve a comparable TPC value [77].
Analytical Recovery Rate Considerations
The efficiency of MAE and UAE directly impacts the recovery rates of target compounds, which is a critical parameter when comparing analytical techniques like HPLC and UV-Vis for quantification. Higher extraction efficiency provides a more accurate representation of the actual compound concentration in the source material.
Table 2: Recovery of specific bioactive compounds using MAE and UAE
| Compound Class | Source Material | MAE Performance | UAE Performance | Analysis Method |
|---|---|---|---|---|
| Total Phenolics | Nettle | 24.64 ± 2.36 mg GAE/g [77] | 23.86 ± 1.92 mg GAE/g [77] | UV-Vis (Folin-Ciocalteu) |
| Flavonoids | Hawthorn | Optimized yield with 60% EtOH, 65°C [75] | Not Reported | HPLC/UV |
| Sulforaphane | Broccoli Florets | Favored by enzyme inactivation [72] | Higher at 25°C [72] | Liquid Chromatography |
| Pectin | Fruit By-products | Not Reported | Yield up to 28.1% [76] | Gravimetric/Analytical |
When validating an analytical method, the consistency of extraction is as important as the yield. MAE, with its controlled temperature and pressure, often provides better precision. For instance, one study noted that the precision for MAE (coefficient of variation of 3%) was significantly better than for sonication [74]. This high reproducibility is crucial for obtaining reliable recovery rate data in comparative studies between HPLC and UV-Vis, as it reduces variability introduced during sample preparation.
Experimental Protocols and Methodologies
Representative MAE Protocol for Phenolic Compounds
The following optimized protocol for extracting polyphenols from hawthorn leaves and flowers illustrates a standard MAE workflow [75]:
- Sample Preparation: Hawthorn leaves and flowers are freeze-dried and ground to a particle size of 160–500 μm.
- Solvent Selection: A hydroethanolic solution (60% ethanol in water) is used as the extraction solvent.
- Loading: A solid-to-solvent ratio of 1:20 (g:mL) is used. For example, 2.5 g of plant material is mixed with 50 mL of solvent in a specialized microwave vessel.
- Extraction Parameters: The vessel is placed in the microwave system, and extraction is carried out at 65°C for 10 minutes with continuous stirring at 900 rpm. The microwave power is automatically modulated to maintain the target temperature.
- Post-Extraction Processing: After cooling, the extraction mixture is centrifuged (e.g., at 5000 rpm for 10 minutes) to separate the solid residue. The supernatant (extract) is filtered (e.g., 0.22 μm) prior to analysis.
Representative UAE Protocol for Bioactive Compounds
The following protocol for extracting bioactive compounds from broccoli byproducts demonstrates a typical UAE setup [72]:
- Sample Preparation: Broccoli leaves and florets are freeze-dried and ground to a particle size of <56 μm.
- Solvent Selection: Distilled water is used as a green solvent.
- Loading: A solid-to-liquid ratio of 1:25 or 2:25 (g:mL) is tested. The sample and solvent are placed in a beaker.
- Extraction Parameters: The beaker is placed in an ultrasonic bath (e.g., 35 kHz frequency, 720 W power) or treated with an ultrasonic probe. Extraction is conducted at a controlled temperature (e.g., 25°C) for 15-20 minutes.
- Post-Extraction Processing: The extract is roughly filtered, centrifuged at 10,000 rpm for 10 minutes, and the supernatant is filtered through a 0.45 μm membrane filter for HPLC analysis.
The Scientist's Toolkit: Essential Research Reagents and Materials
Table 3: Key reagents and equipment for MAE and UAE experiments
| Item | Function/Application | Examples from Literature |
|---|---|---|
| Extraction Solvents | To dissolve and release target compounds from plant matrix. | Ethanol, Water, Hydroethanolic mixtures (e.g., 50-75% ethanol) [75] [79]. |
| Polar Solvents (for MAE) | Essential for absorbing microwave energy efficiently. | Water, Methanol, Acetone-hexane mixtures [74]. |
| Analytical Standards | For identification and quantification of target compounds via HPLC. | Gallic acid, Chlorogenic acid, Rutin, Quercetin, Vitexin [75] [78]. |
| Antioxidant Assay Kits | To determine the bioactivity of extracts. | DPPH, ABTS, FRAP reagents [72] [77] [75]. |
| Specialized MAE Vessels | Withstand high pressure and temperature; enable controlled heating. | Closed vessels made of microwave-transparent materials (e.g., Teflon) [74]. |
| Ultrasonic Systems | Generate cavitation; can be bath or more intense probe systems. | Ultrasonic bath (35 kHz) or probe homogenizer (20 kHz) [72] [77]. |
| Centrifuge | Separate solid plant residue from the liquid extract post-extraction. | Centrifugation at 5,000-10,000 rpm for 10-15 minutes [72] [75]. |
| Syringe Filters | Clarify extracts prior to HPLC or UV-Vis analysis. | 0.22 μm or 0.45 μm nylon or PVDF filters [75] [78]. |
Microwave-Assisted Extraction and Ultrasound-Assisted Extraction both represent significant advancements over traditional extraction methods, offering improved efficiency, reduced solvent consumption, and shorter processing times. The choice between them, however, is application-dependent.
- MAE is often the superior choice for high-throughput applications where maximum yield is the primary objective and the target compounds are thermally stable. Its high reproducibility also makes it excellent for analytical applications where precision is critical [70] [74] [78].
- UAE excels with thermolabile compounds and is advantageous for its simpler equipment setup and ability to operate effectively at low temperatures [72] [77] [71]. It is a robust and versatile tool for general laboratory extraction.
Future developments are likely to focus on the synergy of these technologies and increased automation. The integration of artificial intelligence and machine learning for process prediction and control is an emerging trend in MAE optimization [70]. Furthermore, the combination of UAE and MAE in sequential or simultaneous modes, along with the use of novel green solvents like deep eutectic solvents, presents a promising frontier for further enhancing the recovery of bioactive compounds in a sustainable manner [70] [73]. For researchers comparing recovery rates between HPLC and UV-Vis methods, selecting the appropriate extraction technique is the critical first step in ensuring that the analytical data truly reflects the composition of the source material.
Forced degradation studies, also known as stress testing, represent a critical component in the development of stability-indicating High-Performance Liquid Chromatography (HPLC) methods. These studies involve the intentional degradation of drug substances and products under conditions more severe than accelerated stability protocols to identify potential degradation products and pathways [80]. The primary objective is to demonstrate that the analytical method can accurately and specifically measure the active pharmaceutical ingredient (API) without interference from degradation products, impurities, or excipients [80]. This capability is fundamental to ensuring drug safety and efficacy throughout the product lifecycle, as it monitors stability and detects degradants that could affect therapeutic performance.
The International Council for Harmonisation (ICH) guidelines recognize the importance of stress testing for identifying likely degradation products, establishing degradation pathways, and validating stability-indicating methods [80]. While regulatory guidance provides a general framework, the practical implementation of forced degradation studies requires careful scientific judgment to generate relevant degradation profiles without over-stressing or under-stressing the samples [80]. This article explores the strategic application of forced degradation studies to optimize the specificity of HPLC methods, with particular emphasis on recovery rate comparisons between HPLC and UV-Vis spectroscopic techniques.
Theoretical Foundations: Objectives and Strategic Implementation
Core Objectives of Forced Degradation Studies
Forced degradation studies serve multiple essential purposes in pharmaceutical development. These include establishing degradation pathways of drug substances and products, differentiating drug-related degradation products from non-drug related compounds in formulations, elucidating the structure of degradation products, determining the intrinsic stability of drug molecules, and understanding degradation mechanisms such as hydrolysis, oxidation, thermolysis, or photolysis [80]. Additionally, these studies are crucial for revealing the chemical properties of drug molecules, generating more stable formulations, and solving stability-related problems that may emerge during product development [80].
Strategic Timing and Conditions
The strategic implementation of forced degradation studies significantly impacts their effectiveness. While regulatory guidance suggests stress testing during Phase III development, initiating these studies earlier in preclinical phases or Phase I clinical trials is highly encouraged [80]. This early implementation provides sufficient time for identifying degradation products, elucidating structures, and optimizing stress conditions, ultimately offering timely recommendations for improving manufacturing processes and selecting appropriate stability-indicating methods.
A key consideration in forced degradation strategy is determining the appropriate extent of degradation. Degradation between 5% and 20% is generally accepted for validating chromatographic assays, with many scientists considering 10% degradation as optimal for analytical validation [80]. The stress conditions should be consistent with the product's decomposition under normal manufacturing, storage, and use conditions. A minimal list of stress factors must include acid and base hydrolysis, thermal degradation, photolysis, and oxidation, while potentially also incorporating freeze-thaw cycles and shear stress [80].
Table 1: Recommended Stress Conditions for Forced Degradation Studies
| Stress Condition | Recommended Parameters | Typical Duration | Comments |
|---|---|---|---|
| Acid Hydrolysis | 0.1-5 M HCl at 40-80°C | 4-8 hours | Concentration and temperature dependent on drug stability |
| Base Hydrolysis | 0.1-1 M NaOH at 40-80°C | 4-8 hours | Shorter durations for labile compounds |
| Oxidative Stress | 3-30% H₂O₂ at room temperature | 4-24 hours | Typically performed at room temperature |
| Thermal Stress | 60-105°C for solid state | 24 hours to several days | For both drug substance and product |
| Photolysis | As per ICH Q1B guidelines | 24 hours to 7 days | Specific light sources and intensities |
| Humidity Stress | 75-85% relative humidity | 1-4 weeks | For solid state stability assessment |
Experimental Design and Methodologies
Chromatographic Method Development with Forced Degradation
The development of a stability-indicating HPLC method for Velpatasvir copovidone solid dispersion (VEL-CSD) exemplifies the systematic approach to forced degradation studies. In this case, researchers subjected the drug substance and solid dispersion to stressed alkaline, acidic, oxidative, and thermal conditions according to ICH guidelines Q1A(R2) [81]. The study revealed that VEL is labile under alkaline, acidic, and oxidative conditions, and is also photolabile, showing significant degradation during photostability studies as described by ICH Q1B [81].
The chromatographic separation was achieved using a symmetry analytical C18 column (250 mm × 4.6 mm, 5 µm) with a gradient elution of mobile phase containing 0.05% Trifluoroacetic acid (TFA) and methanol at a flow rate of 0.8 mL min⁻¹ [81]. Simultaneous detection of all degradation products and VEL was performed using a UV detector at 305 nm, demonstrating adequate specificity for separating VEL from eight potential degradation products [81]. This method was successfully validated for precision, specificity, and linearity using reference standards as prescribed by ICH Q2(R1), with limits of quantification and detection determined from the calibration curve [81].
Advanced Optimization Using Experimental Design
The application of Design of Experiments (DoE) represents a significant advancement in HPLC method development. A comparative study between empirical HPLC development and DoE-optimized UHPLC method for guanylhydrazones with anticancer activity demonstrated the advantages of the systematic approach [82]. The UHPLC method developed using factorial design showed superior performance with four times less solvent consumption and 20 times less injection volume while maintaining better column performance compared to the empirically developed HPLC method [82].
The researchers concluded that the factorial design made method development faster, more practical, and more rational compared to the traditional empirical approach [82]. This optimization strategy allowed for simultaneous evaluation of multiple factors, including temperature, mobile phase composition, and pH, leading to more robust and efficient methods suitable for quality control of pharmaceutical compounds.
Comparative Data Analysis: HPLC vs. UV-Vis Methods
Recovery Rate Comparisons
The comparative analysis of HPLC and UV-Vis methods for drug quantification reveals significant differences in performance characteristics, particularly in the context of forced degradation studies. A study on Voriconazole analysis developed and validated both spectrophotometric and HPLC methods, finding that while both techniques demonstrated acceptable linearity, precision, accuracy, ruggedness, and robustness, the HPLC method offered superior specificity in the presence of degradation products [15].
The UV spectrophotometric analysis used iso-propyl alcohol as a solvent and measured absorbance at λmax of 256 nm, providing adequate molar absorptivity for standard quality control [15]. However, the HPLC method, utilizing a 60:40% v/v acetonitrile:orthophosphoric acid (0.1%) mobile phase under low pressure gradient mode, provided sharper peaks with a shorter retention time of 2.841 minutes and better resolution of potential degradants [15]. Both methods showed RSD values less than 2% and percent recovery within standard limits (90-110%), indicating that for simple formulations without significant degradation, UV-Vis may suffice, but for stability-indicating purposes, HPLC is unequivocally superior [15].
Table 2: Comparison of HPLC and UV-Vis Method Performance in Pharmaceutical Analysis
| Performance Parameter | HPLC Method | UV-Vis Method | Implications for Degradation Studies |
|---|---|---|---|
| Specificity | High (separates analytes from degradants) | Low (measures total absorbance) | Critical for stability-indicating methods |
| Sensitivity | Excellent (detects low-level degradants) | Moderate to Good | Essential for impurity profiling |
| Precision | RSD typically <2% | RSD typically <2% | Both techniques provide adequate precision |
| Recovery Rates | 90-110% (often 98-102%) | 90-110% | Comparable recovery for intact drug |
| Analysis Time | Longer (method development and run time) | Shorter | UV-Vis offers higher throughput for simple assays |
| Instrument Cost | Higher | Lower | Economic considerations for routine testing |
| Data Complexity | High (multiple peaks, retention times) | Low (single wavelength measurement) | HPLC requires more sophisticated interpretation |
Case Study: Velpatasvir Analysis with Stability-Indicating Methodology
The forced degradation study of Velpatasvir provides compelling data on the necessity of stability-indicating HPLC methods. The study successfully separated and quantified Velpatasvir from eight degradation products using a validated HPLC-UV method [81]. The method demonstrated excellent performance parameters, including precision, specificity, and linearity, with the ability to detect and quantify degradation products at low levels [81].
This case study highlights a key advantage of HPLC over UV-Vis spectroscopy in forced degradation studies: while UV-Vis might detect overall changes in drug concentration, it cannot distinguish between the parent compound and its degradation products, potentially leading to inaccurate stability assessments. The HPLC method's capability to separate process impurities and degradation products in both VEL drug substance and VEL-CSD makes it indispensable for comprehensive stability evaluation [81].
The Scientist's Toolkit: Essential Reagents and Materials
Successful forced degradation studies and HPLC method development require specific reagents and materials carefully selected for their intended functions. The following essential components represent the core toolkit for researchers in this field:
Reference Standards: High-purity drug substances and known impurities (e.g., Velpatasvir 99.6% and degradation product standards) are essential for method validation and identification of degradation pathways [81].
HPLC-Grade Solvents: Methanol, acetonitrile, and water of appropriate purity ensure reproducible chromatographic performance and prevent column damage [81] [83].
Buffer Components: Trifluoroacetic acid, potassium dihydrogen phosphate, phosphoric acid, and other pH modifiers enable control of mobile phase pH for optimal separation [81] [83].
Stress Testing Reagents: Hydrochloric acid, sodium hydroxide, hydrogen peroxide (30%), and other reagents simulate various degradation conditions [81] [83].
Chromatographic Columns: C18 columns (e.g., 250 mm × 4.6 mm, 5 µm) provide the stationary phase for reverse-phase separation of analytes and degradants [81] [84].
Filter Materials: Membrane filters (0.45 µm or 0.22 µm) remove particulate matter from samples and mobile phases to protect HPLC systems [81].
Workflow and Pathway Visualization
The following diagram illustrates the systematic workflow for conducting forced degradation studies and applying the results to HPLC method development:
Forced Degradation to HPLC Method Workflow
The relationship between stress conditions, degradation pathways, and analytical outcomes can be visualized through the following pathways:
Degradation Pathways and Detection Methods
Forced degradation studies represent an indispensable tool in the development of stability-indicating HPLC methods, providing critical data on drug substance behavior under various stress conditions. The comparative analysis of HPLC and UV-Vis methods demonstrates that while UV-Vis spectroscopy may offer advantages in simplicity and cost for routine analysis of stable formulations, HPLC remains the unequivocal choice for comprehensive forced degradation studies and stability-indicating method development. The superior specificity, sensitivity, and resolution of HPLC enable researchers to separate, identify, and quantify degradation products, ensuring accurate stability assessment and ultimately protecting patient safety.
The integration of systematic approaches such as Design of Experiments further enhances the efficiency and effectiveness of HPLC method development, allowing for more robust and transferrable methods. As pharmaceutical compounds continue to increase in complexity, the role of forced degradation studies in optimizing HPLC method specificity will remain paramount, providing the scientific foundation for quality assurance throughout the drug product lifecycle.
In the demanding field of pharmaceutical analysis, the integrity of a single data point can have monumental consequences, influencing patient diagnoses and product safety [85]. System suitability and robustness testing are critical, non-negotiable phases of analytical method validation that act as safeguards to ensure results are not merely a snapshot of ideal conditions but a reliable, reproducible truth [85]. For scientists in drug development, mastering these concepts is paramount for regulatory compliance and delivering trustworthy data.
The robustness of an analytical procedure is formally defined as "a measure of its capacity to remain unaffected by small but deliberate variations in method parameters and provides an indication of its reliability during normal usage" [86]. Originally performed at the end of the validation process, it is now recommended to be executed during method optimization to proactively identify and mitigate potential failure points before a method is transferred to another laboratory [86]. This proactive approach is a strategic investment in the quality, efficiency, and reputation of a laboratory [85].
Core Concepts and Regulatory Framework
Distinguishing Robustness and Ruggedness
While often used interchangeably, robustness and ruggedness address different aspects of method reliability:
- Robustness Testing: An intra-laboratory study that examines how an analytical method's results are affected by small, planned changes to its operational parameters [85]. Examples include minor adjustments to mobile phase pH, flow rate, or column temperature in HPLC [85] [86].
- Ruggedness Testing: An inter-laboratory study that assesses the reproducibility of results under real-world environmental variations, such as different analysts, instruments, laboratories, or days [85].
The relationship between these two validation parameters is synergistic. Robustness is the necessary first step to fine-tune the method, while ruggedness is the ultimate litmus test verifying the method is fit for its intended purpose across different settings [85].
The Role of System Suitability Testing
System suitability testing (SST) is a critical checkpoint to verify that the analytical system is operating correctly at the time of the test. The limits for SST responses are often defined based on robustness test results [86]. For chromatography methods, typical SST parameters include retention time, theoretical plate count, tailing factor, and resolution [87] [86]. A method might be robust concerning its quantitative results, yet SST responses can still be significantly affected by some factors, making their assessment crucial [86].
Table 1: Key Differences Between Robustness and Ruggedness Testing
| Feature | Robustness Testing | Ruggedness Testing |
|---|---|---|
| Purpose | Evaluate performance under small, deliberate parameter variations [85] | Evaluate reproducibility under real-world, environmental variations [85] |
| Scope | Intra-laboratory, during method development [85] | Inter-laboratory, often for method transfer [85] |
| Variations | Small, controlled changes (e.g., pH ±0.1, flow rate ±0.1 mL/min) [85] [88] | Broader factors (e.g., different analyst, instrument, lab, day) [85] |
| Primary Question | How well does the method withstand minor tweaks? [85] | How well does the method perform in different settings? [85] |
Experimental Design for Robustness Testing
Implementing a robustness test involves a structured, systematic approach [86].
A Stepwise Workflow
The process can be broken down into distinct steps:
- Selection of Factors and Levels: Choose method parameters most likely to affect results and define their extreme levels symmetrically or asymmetrically around the nominal level [86].
- Selection of an Experimental Design: Typically use two-level screening designs like Plackett-Burman or fractional factorial designs [86].
- Selection of Responses: Choose both assay responses (e.g., content determination) and SST responses (e.g., resolution, peak asymmetry) [86].
- Execution of Experiments: Perform experiments in a defined sequence, potentially using an anti-drift sequence or correcting for time effects with nominal replicates [86].
- Estimation and Analysis of Effects: Calculate the effect of each factor and determine its statistical and practical significance [86].
- Drawing Conclusions: Use the results to define robust operational ranges or implement precautionary measures [86].
The following workflow diagram visualizes this multi-step process and the decision points within it.
Selecting Factors and Setting Levels
A critical step is choosing which parameters to investigate and the range of variation. For an HPLC method, quantitative factors often include mobile phase pH, column temperature, flow rate, and detection wavelength [86]. The interval for variation should be representative of what might occur when the method is transferred [86]. For instance, the volume fraction of the organic solvent (%B) in reversed-phase HPLC is a crucial factor due to its significant impact on retention time [88]. A variation of ±1% in organic content is often appropriate, as it represents a maximum realistic variability from mobile phase preparation using standard laboratory equipment [88].
Utilizing Experimental Designs
Experimental designs like Plackett-Burman or fractional factorial designs allow for the efficient examination of multiple factors in a minimal number of experiments [86]. These screening designs allow the estimation of factor effects, revealing which parameters have a significant influence on the method's responses. This data-driven approach moves method development beyond phenomenological interpretation toward a fundamental, predictive framework [89].
Comparative Analysis: HPLC vs. UV-Vis in Method Validation
The application of robustness testing and the interpretation of system suitability criteria vary significantly between techniques like HPLC and UV-Vis spectroscopy, which impacts their suitability for different analytical scenarios, including recovery rate studies.
Robustness Testing and System Suitability Parameters
HPLC methods, with their multi-parameter nature, require a more complex robustness assessment. The following table summarizes the core differences in how these two techniques are validated and controlled.
Table 2: Comparison of System Suitability and Robustness Focus in HPLC and UV-Vis Methods
| Aspect | HPLC Methods | UV-Vis Spectrophotometry |
|---|---|---|
| System Suitability Parameters | Retention time, theoretical plates, tailing factor, resolution [87] [86] | Absorbance accuracy, wavelength precision, stray light, spectral bandwidth [90] |
| Key Robustness Factors | Mobile phase pH & composition, flow rate, column temperature, column type (batch, supplier) [86] [88] | Wavelength accuracy, scan speed, stability of reference standards, sample preparation steps (e.g., dilution, sonication time) [90] |
| Typical Recovery Rate Performance | High precision (e.g., RSD < 2%), recovery rates of 99-101% are routinely achievable [87] [91] | Generally higher variability in complex matrices; recovery can be compromised without adequate separation |
| Primary Source of Unreliability | Changes in stationary surface chemistry, mobile phase degradation, instrumental drift [89] [86] | Matrix interference, chemical instability of the analyte during measurement, instrumental drift [90] |
Recovery Rate Comparison in a Broader Research Context
The choice between HPLC and UV-Vis for recovery rate studies is fundamentally a trade-off between selectivity and simplicity. HPLC methods, with their inherent separation power, excel in selectively quantifying the target analyte in the presence of excipients and potential degradants. This directly translates to high accuracy and precision in recovery rate studies. For example, a validated stability-indicating RP-HPLC method for mesalamine demonstrated excellent accuracy with recoveries between 99.05% and 99.25% (%RSD < 0.32%) [91]. Similarly, a method for favipiravir showed precision and accuracy with an RSD < 2% [87].
UV-Vis spectroscopy, while simpler and more cost-effective, is susceptible to matrix effects where other components in a sample can absorb at the same wavelength, leading to positively biased recovery results. Its effective sample size is also limited by the penetration depth of light, which, in the case of pharmaceutical tablets, is relatively shallow (e.g., up to 0.4 mm experimentally, with a theoretical maximum of 1.38 mm) [92]. This can raise questions about the representativeness of the sample volume analyzed for heterogeneous solid dosage forms. Consequently, UV-Vis is generally more suited for well-defined, simple matrices or for analyses where the sample preparation includes a robust separation or cleanup step to ensure specificity.
Case Study: Robustness in HPLC Method Development
Application of AQbD for Favipiravir Quantification
A practical application of robust method development is illustrated in a 2025 study that used an Analytical Quality by Design (AQbD) approach to develop a green, reversed-phase HPLC method for favipiravir [87]. The process began with a risk assessment to identify high-risk factors, which were subsequently studied using a d-optimal experimental design. The factors included:
- X1: Ratio of solvent
- X2: pH of the buffer
- X3: Column type
Their impact was measured on critical responses: peak area (Y1), retention time (Y2), tailing factor (Y3), and theoretical plates count (Y4) [87]. The Method Operable Design Region (MODR) was established using Monte Carlo simulations, defining the robust set point for the method: an Inertsil ODS-3 C18 column with a mobile phase of acetonitrile and disodium hydrogen phosphate anhydrous buffer (pH 3.1, 20 mM) in an 18:82 v/v ratio [87]. The method was successfully validated, showing excellent precision, accuracy, and robustness (RSD < 2%), confirming its suitability for routine quality control [87].
Robustness Testing for a Mesalamine Assay
Another example is the development and validation of a stability-indicating RP-HPLC method for mesalamine [91]. The method was validated in accordance with ICH guidelines, and its robustness was confirmed under slight, deliberate variations of method parameters, with all results showing an RSD value below 2% [91]. This level of consistency under variation is a hallmark of a robust method, ensuring that the assay of a commercial tablet (Mesacol, 800 mg) showed a recovery of 99.91% without interference from degradants formed during forced degradation studies [91].
Essential Research Reagent Solutions
The following table details key materials and reagents commonly employed in developing and validating robust HPLC methods, as evidenced in the cited research.
Table 3: Key Research Reagent Solutions for Robust HPLC Method Development
| Reagent / Material | Typical Function in Analysis | Example from Literature |
|---|---|---|
| C18 Chromatographic Column | The stationary phase for reversed-phase separation; its type and batch are critical robustness factors [87] [86]. | Inertsil ODS-3 C18 column (250 mm, 4.6 mm, 5 μm, 100 Å) for favipiravir analysis [87]. |
| Buffers (e.g., Phosphate) | Component of the aqueous mobile phase to control pH, a key factor influencing retention and selectivity [87] [88]. | Disodium hydrogen phosphate anhydrous buffer (20 mM, pH 3.1) used in the AQbD study [87]. |
| HPLC-Grade Organic Solvents | The organic modifier (e.g., Acetonitrile, Methanol) in the mobile phase to control elution strength [88] [91]. | Acetonitrile and Methanol were used as modifiers for favipiravir and mesalamine, respectively [87] [91]. |
| Chemical Standards for Forced Degradation | Used in stress studies to demonstrate method specificity and stability-indicating capability [91]. | 0.1 N HCl, 0.1 N NaOH, and 3% Hydrogen peroxide (H₂O₂) for degrading mesalamine [91]. |
System suitability and robustness testing are foundational to ensuring that analytical methods consistently produce reliable results, a non-negotiable requirement in pharmaceutical development [85]. As demonstrated, HPLC remains the gold standard for applications requiring high selectivity and accurate recovery rate quantification, particularly in complex matrices. Its multi-parameter nature necessitates a systematic approach to robustness testing, facilitated by experimental design and frameworks like AQbD [87] [86].
The fundamental understanding of adsorption processes and surface heterogeneity, as explored in fundamental separation science, underpins the rational development of truly robust chromatographic methods [89]. By proactively identifying and controlling sensitive method parameters, scientists can build a foundation of data integrity that ensures patient safety and product quality.
Validation and Comparative Analysis: Ensuring Reliable Recovery Rate Data
In pharmaceutical analysis and drug development, the reliability of analytical data is paramount. Analytical method validation provides documented evidence that a specific method consistently yields results that are accurate, precise, and reliable for its intended purpose. For researchers and scientists selecting between analytical techniques such as High-Performance Liquid Chromatography (HPLC) and Ultraviolet-Visible spectrophotometry (UV-Vis), understanding key validation parameters is crucial for making informed decisions. These parameters ensure that methods are "fit-for-purpose" and comply with regulatory standards from organizations like the International Council for Harmonisation (ICH) [2] [93].
This guide objectively compares HPLC and UV-Vis methods through the lens of five core validation parameters—Accuracy, Precision, Linearity, Limit of Detection (LOD), and Limit of Quantitation (LOQ)—within the context of recovery rate comparison research. The data presented will equip drug development professionals with the experimental evidence needed to select the appropriate analytical technique based on their specific project requirements, matrix complexity, and desired data quality.
Core Definitions of Key Validation Parameters
- Accuracy refers to the closeness of agreement between a measured value and an accepted reference or true value. It indicates the method's trueness and is typically reported as a percentage recovery of a known, spiked amount [2] [93].
- Precision expresses the closeness of agreement between a series of measurements obtained from multiple sampling of the same homogeneous sample under prescribed conditions. It is usually divided into repeatability (intra-day precision) and intermediate precision (inter-day, inter-analyst, inter-equipment) and reported as the relative standard deviation (%RSD) [2].
- Linearity is the ability of a method to elicit test results that are directly, or through a well-defined mathematical transformation, proportional to the concentration of analyte in samples within a given range. It is demonstrated by a high coefficient of determination (R²) [2].
- Limit of Detection (LOD) is the lowest concentration of an analyte that can be detected, but not necessarily quantified, under the stated experimental conditions. It is a limit test specifying whether an analyte is above or below a certain value [2] [94].
- Limit of Quantitation (LOQ) is the lowest concentration of an analyte that can be quantitatively determined with acceptable precision and accuracy. The LOQ represents the lowest point on the calibration curve that can be reliably measured [2] [94].
Diagram 1: Hierarchical structure of key analytical method validation parameters and their associated metrics.
Experimental Comparison: HPLC vs. UV-Vis
Case Study: Levofloxacin Analysis in Composite Scaffolds
A direct comparative study analyzed Levofloxacin released from mesoporous silica microspheres/nano-hydroxyapatite (n-HA) composite scaffolds using both HPLC and UV-Vis methods. This research provides concrete experimental data on recovery rates, which is crucial for evaluating the performance of both techniques in a complex drug-delivery system [14].
Table 1: Comparison of Validation Parameters for Levofloxacin Analysis
| Validation Parameter | HPLC Method Performance | UV-Vis Method Performance |
|---|---|---|
| Linearity | y = 0.033x + 0.010R² = 0.9991Range: 0.05-300 µg/mL | y = 0.065x + 0.017R² = 0.9999Range: 0.05-300 µg/mL |
| Accuracy (Recovery %) | Low (5 µg/mL): 96.37 ± 0.50%Medium (25 µg/mL): 110.96 ± 0.23%High (50 µg/mL): 104.79 ± 0.06% | Low (5 µg/mL): 96.00 ± 2.00%Medium (25 µg/mL): 99.50 ± 0.00%High (50 µg/mL): 98.67 ± 0.06% |
| Precision | Not explicitly reported | Not explicitly reported |
| LOD/LOQ | Not explicitly reported | Not explicitly reported |
The study concluded that UV-Vis was inadequate for accurately measuring drug concentrations loaded onto biodegradable composite scaffolds due to impurity interference. HPLC was determined to be the preferred method for evaluating the sustained release characteristics of Levofloxacin from these complex systems [14].
Experimental Protocols
- Equipment: Shimadzu liquid chromatograph with LC-2010AHT gradient pump, CBM-20A system controller, and Shimadzu CLASS-VP UV-Visible detector.
- Column: Sepax BR-C18 (250 × 4.6 mm; 5 µm particle diameter).
- Mobile Phase: 0.01 mol/L KH₂PO₄, methanol, and 0.5 mol/L tetrabutylammonium hydrogen sulphate (75:25:4 ratio).
- Flow Rate: 1 mL/min.
- Detection Wavelength: 290 nm.
- Injection Volume: 10 µL for assay determination.
- Column Temperature: 40°C.
- Sample Preparation: Levofloxacin standard dissolved in simulated body fluid (SBF), with ciprofloxacin as internal standard. Sample extraction using dichloromethane, followed by vortex mixing, centrifugation, and drying under nitrogen.
- Equipment: UV-2600 UV-Vis spectrophotometer.
- Wavelength Selection: Standard solutions scanned from 200-400 nm to determine maximum absorption wavelength.
- Sample Preparation: Levofloxacin standard prepared in simulated body fluid (SBF) at concentrations of 5, 25, and 50 µg/mL.
Comparative Analysis of Validation Parameters
Accuracy and Precision
Accuracy measurements determine the exactness of an analytical method, typically assessed through recovery studies of spiked samples. The Levofloxacin study revealed that while both methods showed acceptable recovery at low concentrations, HPLC demonstrated variable recovery at medium and high concentrations (110.96% and 104.79% respectively), whereas UV-Vis maintained more consistent recovery across concentration levels (96.00-99.50%) [14].
Precision encompasses repeatability (intra-assay), intermediate precision, and reproducibility. For chromatographic methods, precision is typically documented as %RSD from a minimum of nine determinations across the method range [2]. UV-Vis methods can also demonstrate high precision, as shown in a terbinafine hydrochloride study where intraday and interday precision showed %RSD values less than 2% [36].
Linearity and Range
Both HPLC and UV-Vis methods can exhibit excellent linearity across defined concentration ranges. The Levofloxacin study demonstrated that both techniques achieved R² values >0.999 across the 0.05-300 µg/mL range [14]. Similarly, a study analyzing bakuchiol in cosmetic products found both HPLC and UV-Vis provided reliable linear responses for quantification [23].
The range represents the interval between upper and lower concentration levels that demonstrate acceptable precision, accuracy, and linearity. ICH guidelines specify minimum ranges depending on the type of method, with assay methods typically requiring 80-120% of target concentration [2].
LOD and LOQ
LOD and LOQ represent the sensitivity of an analytical method. In chromatographic analysis, these are commonly determined via signal-to-noise ratios (3:1 for LOD, 10:1 for LOQ) or using the formulas:
- LOD = 3.3 × σ/S
- LOQ = 10 × σ/S
where σ is the standard deviation of the response and S is the slope of the calibration curve [2].
The conceptual relationship between blank samples, LOD, and LOQ is crucial. The limit of blank (LoB) represents the highest apparent analyte concentration expected from blank samples, while LOD is the lowest concentration reliably distinguished from LoB. LOQ is the lowest concentration where precise and accurate quantification occurs [94].
Diagram 2: Relationship and progression between Limit of Blank (LoB), Limit of Detection (LOD), and Limit of Quantitation (LOQ).
Research Reagent Solutions
Table 2: Essential Materials and Their Functions in Analytical Method Validation
| Reagent/Equipment | Function/Purpose | Example Applications |
|---|---|---|
| HPLC System with UV/UV-Vis Detector | Separation and quantification of analytes in a mixture | Levofloxacin in scaffolds [14], Anti-epileptic drugs [95] |
| UV-Vis Spectrophotometer | Direct quantification of chromophore-containing compounds | Terbinafine HCl [36], Chalcone analysis [96] |
| C18 Reverse Phase Column | Stationary phase for separating non-polar to moderately polar compounds | Levofloxacin [14], Bakuchiol [23], Neuromodulating agents [95] |
| Methanol/Acetonitrile (HPLC Grade) | Mobile phase components for eluting analytes | Levofloxacin analysis [14], Sugar analysis [20] |
| Buffer Salts (e.g., KH₂PO₄) | Mobile phase modifiers to control pH and ionic strength | Levofloxacin analysis [14] |
| Internal Standards (e.g., Ciprofloxacin) | Reference compounds to normalize analytical variations | Levofloxacin quantification [14] |
The comparative analysis of HPLC and UV-Vis methods reveals distinct advantages and limitations for each technique. UV-Vis spectrophotometry offers simplicity, rapid analysis, and cost-effectiveness for applications where the target analyte possesses a strong chromophore and exists in a relatively pure matrix without interfering substances [36] [96]. However, in complex matrices such as drug-loaded composite scaffolds, HPLC demonstrates superior specificity due to its separation capability, effectively distinguishing the target analyte from impurities and excipients [14] [23].
For researchers and drug development professionals, the selection between these analytical techniques should be guided by:
- Matrix Complexity: HPLC is preferred for complex biological or formulation matrices with potential interferents.
- Specificity Requirements: HPLC provides superior specificity through chromatographic separation.
- Sensitivity Needs: Both techniques can achieve low detection limits, with HPLC generally offering better specificity at these levels.
- Throughput and Cost Considerations: UV-Vis offers higher throughput and lower operational costs for appropriate applications.
The experimental data on Levofloxacin recovery rates clearly demonstrates that while UV-Vis may appear adequate in simplified systems, HPLC provides more reliable results in complex drug delivery systems, making it the preferred method for investigating sustained release properties in tissue engineering applications [14].
In pharmaceutical analysis, the accuracy of a method in determining a drug's concentration is fundamentally assessed by its recovery rate. This parameter indicates the closeness of the measured value to the true value. High-performance liquid chromatography (HPLC) and ultraviolet-visible spectrophotometry (UV-Vis) are two widely employed techniques, yet they often yield different recovery rates due to their inherent operational principles. For researchers and drug development professionals, understanding the source of these discrepancies is crucial for selecting the appropriate analytical method. This guide provides a direct, data-driven comparison of HPLC and UV-Vis, focusing on recovery rates, to inform method selection in research and quality control.
Performance Comparison: HPLC vs. UV-Vis at a Glance
The table below summarizes key performance metrics from direct comparative studies, highlighting the typical differences in recovery rates and other validation parameters between HPLC and UV-Vis methods.
Table 1: Direct Experimental Comparison of HPLC and UV-Vis Performance
| Analyte | Method | Reported Recovery Rate (%) | Linearity (R²) | Key Findings and Context |
|---|---|---|---|---|
| Levofloxacin [14] | HPLC | 96.37 (Low), 110.96 (Medium), 104.79 (High) | 0.9991 | Medium/High concentrations showed higher variance; method preferred in complex scaffolds. |
| UV-Vis | 96.00 (Low), 99.50 (Medium), 98.67 (High) | 0.9999 | Better recovery precision at medium/high levels; less accurate with impurities. | |
| Metformin HCl [19] | UHPLC | 98 - 101 | Not Specified | Consistent and accurate results across commercial products. |
| UV-Vis | 92 - 104 | Not Specified | Wider recovery range, indicating lower accuracy and potential for bias in some samples. |
Beyond recovery rates, the fundamental characteristics of each technique define their application scope. The following table outlines their general advantages and limitations.
Table 2: Fundamental Characteristics of HPLC and UV-Vis Methods
| Aspect | HPLC | UV-Vis Spectroscopy |
|---|---|---|
| Selectivity | High; separates analytes from impurities [14] [22] | Limited; susceptible to interference from excipients or degradation products [14] [22] |
| Sensitivity | Superior; can detect and quantify low-level impurities [22] | Good for simple assays, but less sensitive for trace analysis [22] |
| Sample Complexity | Ideal for complex mixtures (e.g., formulations, biological fluids) [14] [27] | Best for simple, single-component samples [22] |
| Cost & Operation | High cost; complex instrumentation; requires skilled operation [22] | Low cost; simple setup; minimal training required [22] |
| Best Use Cases | Impurity profiling, stability-indicating methods, analysis of multi-component samples [22] | Routine quality control of raw materials and simple, single-analyte formulations [22] |
Experimental Protocols from Key Studies
Analysis of Levofloxacin in Composite Scaffolds
This study provides a direct, side-by-side protocol for analyzing a drug released from a complex scaffold, a scenario common in advanced drug delivery research [14].
HPLC Method Details:
- Chromatograph: Shimadzu system with a UV-Vis detector.
- Column: Sepax BR-C18 (250 x 4.6 mm, 5 µm).
- Mobile Phase: 0.01 mol/L KH₂PO₄, methanol, and 0.5 mol/L tetrabutylammonium hydrogen sulphate (75:25:4 ratio).
- Flow Rate: 1.0 mL/min.
- Detection Wavelength: 290 nm.
- Injection Volume: 10 µL for assay.
- Internal Standard: Ciprofloxacin.
- Sample Preparation: The sample in SBF was mixed with the internal standard, extracted with dichloromethane, vortex-mixed, centrifuged, and the supernatant was dried under nitrogen before reconstitution.
UV-Vis Method Details:
- Instrument: UV-2600 UV-Vis spectrophotometer.
- Wavelength Selection: Scanned from 200–400 nm to determine the maximum absorption wavelength for Levofloxacin.
- Sample Preparation: Direct analysis of the sample in simulated body fluid (SBF).
Analysis of Metformin Hydrochloride in Tablets
This protocol compares the routine analysis of a common drug in commercial products, representing a typical quality control scenario [19].
UHPLC Method Details:
- Mobile Phase: A mixture of 0.05 M phosphate buffer (pH 3.6) and methanol in a 35:65 ratio.
- Validation Results: Demonstrated repeatability and reproducibility with relative standard deviations (RSD) of less than 1.578% and 2.718%, respectively.
UV-Vis Method Details:
- Detection Wavelength: 234 nm.
- Blank: A mixture of methanol and water.
- Validation Results: Showed higher variability with repeatability and reproducibility RSDs of less than 3.773% and 1.988%, respectively.
Decision Pathway for Method Selection
The following diagram illustrates a logical workflow for choosing between HPLC and UV-Vis based on your analytical needs and sample characteristics.
The Scientist's Toolkit: Essential Research Reagents and Materials
The following table lists key reagents and materials used in the featured experiments, along with their critical functions in analytical method development.
Table 3: Key Reagents and Materials for HPLC and UV-Vis Analysis
| Reagent / Material | Function in Analysis | Example from Literature |
|---|---|---|
| C18 Chromatography Column | The stationary phase for separating compounds based on hydrophobicity. | Sepax BR-C18 column for Levofloxacin [14]; Inertsil ODS-3 C18 for neuromodulating drugs [95]. |
| Methanol / Acetonitrile (HPLC-grade) | Organic modifiers in the mobile phase to control elution strength and separation. | Used in the mobile phase for Levofloxacin and Metformin analysis [14] [19]. |
| Buffer Salts (e.g., KH₂PO₄) | Adjusts and maintains the pH of the mobile phase, critical for reproducible separation. | 0.01 mol/L KH₂PO₄ in Levofloxacin HPLC method [14]. |
| Ion-Pair Reagents (e.g., Tetrabutylammonium salts) | Enhances the separation of ionic compounds by pairing with analytes. | Tetrabutylammonium hydrogen sulphate for Levofloxacin separation [14]. |
| Internal Standard (e.g., Ciprofloxacin) | A compound added in a constant amount to correct for procedural losses and instrument variability. | Ciprofloxacin used in the HPLC analysis of Levofloxacin [14]. |
| Simulated Body Fluid (SBF) | A solution that mimics the ionic composition of human blood plasma; used for drug release studies. | Medium for Levofloxacin release from composite scaffolds [14]. |
The choice between HPLC and UV-Vis is not a matter of one technique being universally superior, but of selecting the right tool for the specific analytical challenge. The experimental data consistently shows that HPLC provides more accurate and reliable recovery rates for complex samples, such as those involving drug delivery scaffolds, multi-component formulations, or biological matrices, due to its high selectivity and separation power. Conversely, UV-Vis remains a valuable, cost-effective tool for routine analysis of simple, single-analyte samples where high selectivity is not a primary concern. For researchers, the decision pathway and performance data presented herein provide a evidence-based framework for choosing the optimal method to ensure data integrity in drug development.
In the rigorous world of drug development and clinical diagnostics, the selection of an appropriate analytical technique is paramount. High-Performance Liquid Chromatography with Ultraviolet detection (HPLC-UV), Liquid Chromatography-Tandem Mass Spectrometry (LC-MS/MS), and various immunoassay platforms each offer distinct advantages and limitations. The concept of a "gold standard" is method-specific and context-dependent; for instance, LC-MS/MS is often referenced for its superior specificity and sensitivity in complex biological matrices, while modern immunoassays offer unparalleled throughput for clinical diagnostics. This guide provides an objective, data-driven comparison of these techniques, with a specific focus on recovery rates—a critical metric indicating the efficiency of an analytical method to accurately measure the analyte present in a sample. Recovery rate comparisons reveal fundamental differences in method performance, directly impacting the reliability of pharmacokinetic data, therapeutic drug monitoring, and clinical decisions. Framed within broader research on recovery rate comparisons between chromatographic and spectroscopic methods, this analysis equips researchers and drug development professionals with the experimental evidence needed to select the optimal methodology for their specific application.
Fundamental Principles and Typical Applications
- HPLC-UV separates compounds based on their interaction with a stationary and mobile phase, followed by detection via ultraviolet light absorption. It is widely used for quantifying small molecule drugs and metabolites in formulations and biological samples due to its robustness and accessibility [97] [50].
- LC-MS/MS combines the separation power of liquid chromatography with the high sensitivity and specificity of mass spectrometry. It is considered the reference method for many bioanalytical applications, including preclinical pharmacokinetics and therapeutic drug monitoring (TDM) of complex molecules [98] [99] [50].
- Immunoassays rely on the binding affinity between an antibody and an antigen (analyte). These methods are dominant in high-volume clinical settings for measuring hormones, biomarkers, and certain drugs due to their rapid turnaround and automation capabilities [98] [100].
Quantitative Performance Benchmarking
The following table summarizes key performance characteristics, including recovery rates, as reported in recent comparative studies.
Table 1: Comparative Performance of HPLC-UV, LC-MS/MS, and Immunoassays
| Analytical Technique | Analyte | Reported Recovery Rate (%) | Linear Range | Key Advantage | Primary Limitation |
|---|---|---|---|---|---|
| HPLC-UV [97] | Vancomycin | N/R (Precision: ≤8.39% CV) | 4.5–80 mg/L | Simple, cost-effective, "green" solvent usage [97] | Lower sensitivity vs. MS |
| HPLC-UV [101] | Aflatoxin B1 | 92.42% (RSD 5.97) | N/R | High accuracy and precision in complex feeds [101] | Extensive sample prep required |
| LC-MS/MS [50] | Aminothiazole (21MAT) | N/R (Precision: ≤9.8% CV) | 1.25–1250 ng/mL | High sensitivity and specificity for NCEs [50] | High instrument cost and complexity |
| Immunoassay (ELISA) [101] | Aflatoxin B1 | 75.64% (RSD 34.88) | N/R | High throughput, suitable for screening [101] | Higher variability, cross-reactivity |
| Immunoassay (Various) [100] | 25-Hydroxyvitamin D | N/R (Variable bias vs. RMP) | N/R | Automated, fast, no extraction needed [100] | Significant bias in some platforms |
Abbreviations: N/R: Not Reported; NCE: New Chemical Entity; RMP: Reference Measurement Procedure; RSD: Relative Standard Deviation; CV: Coefficient of Variation.
A direct comparison between HPLC and ELISA for aflatoxin B1 quantification in feed samples starkly illustrates the recovery rate disparity, with HPLC demonstrating significantly higher and more consistent recovery [101]. Furthermore, a 2024 study developing methods for a novel aminothiazole concluded that the LC-MS/MS method was superior to the HPLC-UV method in terms of sensitivity and linear range, highlighting the performance gap for demanding preclinical applications [50].
Detailed Experimental Protocols from Recent Studies
Protocol 1: HPLC-UV Determination of Vancomycin in Human Plasma
This 2025 method exemplifies a simple, reproducible, and green approach for TDM in critically ill patients [97].
- Sample Preparation: Protein precipitation was achieved using 10% perchloric acid. Only 0.3 mL of plasma was used, minimizing sample volume from patients.
- Chromatographic Conditions:
- Column: C18 column.
- Mobile Phase: Phosphate buffer (pH 2.8) and acetonitrile in a 90:10 (v/v) ratio.
- Flow Rate: 1 mL/min.
- Detection: UV detection at 192 nm.
- Run Time: 10 minutes.
- Validation Data: The method was linear from 4.5–80 mg/L (r² > 0.99). Intra-day and inter-day precision (CV%) were within 8.39% and 5.58%, respectively, meeting European Medicines Agency (EMA) guidelines [97].
Protocol 2: Comparative Analysis of Urinary Free Cortisol: Immunoassays vs. LC-MS/MS
This 2025 study compared four new immunoassays against LC-MS/MS for diagnosing Cushing's syndrome [98].
- Sample Material: 24-hour urine samples from 94 Cushing's syndrome patients and 243 non-patients.
- Reference Method: A laboratory-developed LC-MS/MS method was used as the reference.
- Immunoassay Platforms: Tests were performed on Autobio A6200, Mindray CL-1200i, Snibe MAGLUMI X8, and Roche 8000 e801 platforms.
- Key Findings: All immunoassays showed strong correlation with LC-MS/MS (Spearman r = 0.950–0.998) but exhibited a proportionally positive bias. The study concluded that while these immunoassays simplify workflows by eliminating extraction, method-specific cut-off values must be established for accurate clinical diagnosis [98].
Protocol 3: Extraction and Analysis of Favipiravir from Dried Plasma Spots
A 2025 study provided a direct comparison between Microwave-Assisted Extraction (MAE) and Ultrasound-Assisted Extraction (UAE) coupled with HPLC-UV for the antiviral drug favipiravir.
- Sample Preparation: A miniaturized on-spot plasma protein denaturation protocol was used. A tiny volume of plasma was adsorbed onto paper discs to create Dried Plasma Spots (DPS). Proteins were denatured with only 10 μL of methanol.
- Extraction Techniques: Both MAE (using microwave irradiation) and UAE (using ultrasonic cavitation) were optimized and compared for extracting the drug from the DPS.
- Comparative Outcome: UAE demonstrated higher recovery rates and was identified as a greener alternative. However, MAE offered better practicality for simultaneous processing of multiple samples [102]. This highlights how sample preparation techniques can significantly influence the performance of the same core analytical platform (HPLC-UV).
Decision Workflow and Technical Guidelines
The following diagram outlines a logical pathway for selecting the most appropriate analytical technique based on project requirements.
Essential Research Reagent Solutions
The following table lists key reagents and materials critical for successfully implementing the analytical methods discussed.
Table 2: Key Research Reagents and Materials for Bioanalytical Methods
| Reagent/Material | Function in Analysis | Application Examples |
|---|---|---|
| C18 Chromatographic Columns | Reversed-phase stationary phase for compound separation. | Vancomycin HPLC-UV [97]; Aminothiazole LC-MS/MS [50]. |
| Solid Phase Extraction (SPE) Columns | Sample clean-up and pre-concentration of analytes from complex matrices. | Aflatoxin B1 analysis in feed samples [101]. |
| Protein Precipitants (e.g., Perchloric Acid, Methanol) | Denature and remove proteins from biological samples. | Plasma deproteinization for vancomycin [97] and on-spot denaturation for favipiravir [102]. |
| Stable Isotope-Labeled Internal Standards | Normalize variability in sample preparation and ionization for LC-MS/MS. | Essential for quantitative accuracy in bioanalytical LC-MS/MS [50]. |
| Specific Antibodies | Molecular recognition elements for selective analyte binding in immunoassays. | Quantification of urinary free cortisol [98] and aflatoxin B1 [101]. |
| Mobile Phase Additives (e.g., Formic Acid, Ammonium Formate) | Modulate pH and ionic strength to optimize chromatographic separation and MS ionization. | Critical for peak shape and sensitivity in both HPLC-UV and LC-MS/MS [97] [50]. |
The choice between HPLC-UV, LC-MS/MS, and immunoassays involves a careful trade-off between sensitivity, specificity, throughput, cost, and operational complexity. HPLC-UV remains a robust, cost-effective workhorse for many drug quantification assays, especially when paired with modern extraction techniques [102] [97]. However, LC-MS/MS is unequivocally the gold standard for applications demanding the highest level of specificity, sensitivity, and multi-analyte capability in complex matrices [98] [99] [50]. Immunoassays, while highly convenient and automated, can suffer from variable recovery, cross-reactivity, and bias, necessitating thorough validation against reference methods like LC-MS/MS for critical clinical decision-making [98] [100] [101].
Future trends point toward the miniaturization of sample preparation (e.g., Dried Plasma Spots) [102] and the development of "greener" analytical methods that reduce solvent consumption [97]. Furthermore, the integration of advanced data acquisition modes in LC-MS and the continued standardization of immunoassays will further enhance the accuracy and reliability of bioanalysis, solidifying the role of these techniques in the next generation of drug development and clinical diagnostics.
In the field of drug development and analytical science, method comparison studies are essential for validating new analytical techniques against established reference methods. The core objective is to determine whether two methods can be used interchangeably without affecting the reliability of patient results or scientific conclusions [103]. This evaluation is particularly crucial in pharmaceutical research, where the choice between established techniques like High-Performance Liquid Chromatography (HPLC) and Ultraviolet-Visible Spectrophotometry (UV-Vis) can significantly impact the accuracy of drug quantification in complex matrices [14] [104].
Such comparisons are fundamental to assessing method trueness and are often conducted following established clinical laboratory standards such as CLSI EP09-A3 [103]. The central question these studies address is whether a significant bias exists between methods. If this bias exceeds a pre-defined, clinically or analytically acceptable limit, the methods cannot be considered interchangeable [103]. The quality of the method comparison study, therefore, depends on a well-designed experiment and the application of appropriate statistical procedures for data analysis, moving beyond inadequate approaches like correlation coefficients and t-tests to more robust methods like regression and Bland-Altman analysis [103] [105].
Fundamental Statistical Approaches
Two statistical methodologies form the cornerstone of modern method comparison: regression analysis and the Bland-Altman plot. Each offers unique insights into the relationship and agreement between two measurement techniques.
Limitations of Basic Statistical Methods
Traditional statistical methods often prove inadequate for method comparison studies. Correlation analysis (e.g., Pearson's r) only measures the strength of association between two methods, not their agreement. A high correlation coefficient can be misleading, as it may exist even when large, consistent differences between methods are present [103] [105]. Similarly, t-tests primarily detect differences in average values but may fail to identify proportional errors or biases that vary across the measurement range. Their sensitivity is also heavily influenced by sample size, potentially missing clinically significant differences in small samples or highlighting statistically significant but analytically irrelevant differences in large datasets [103].
Regression Analysis in Method Comparison
Regression analysis characterizes the relationship between measurements from two methods by establishing a functional relationship between them. The Passing-Bablok and Deming regression techniques are particularly suited for method comparison as they account for measurement errors in both methods [103]. For instance, in a study comparing HPLC-UV with LC-MS/MS for voriconazole monitoring, Deming's regression demonstrated a slope of 1.03 and an intercept of -0.08, indicating minimal proportional or constant bias between the methods [106]. The resulting regression equation (y = α + βx) provides a mathematical model to predict systematic biases, where the intercept (α) represents constant bias and the slope (β) represents proportional bias [105].
Bland-Altman Analysis for Assessing Agreement
The Bland-Altman plot (also known as the difference plot) provides a complementary approach by visualizing the agreement between two methods [103] [105]. Instead of plotting measured values directly, it displays the difference between paired measurements against their average value for each sample [105]. This visualization helps identify the magnitude and pattern of discrepancies across the measurement range. Key elements of the Bland-Altman plot include:
- Mean Difference: The average bias between the two methods, represented by a central line.
- Limits of Agreement: Defined as the mean difference ± 1.96 standard deviations of the differences, providing an interval expected to contain 95% of discrepancies between methods [105].
- Pattern Analysis: Visual assessment of whether differences are consistent across the measurement range or exhibit trends.
In the voriconazole study, the Bland-Altman analysis revealed a minimal mean difference of 0.025 μg/mL between HPLC-UV and LC-MS/MS methods, confirming good agreement [106]. This approach is particularly valuable for identifying concentration-dependent biases that might be missed by regression analysis alone.
Experimental Comparison: HPLC vs. UV-Vis Spectrophotometry
Case Study: Levofloxacin Quantification
A direct comparison of HPLC and UV-Vis methodologies for quantifying Levofloxacin released from mesoporous silica microspheres/nano-hydroxyapatite composite scaffolds provides insightful experimental data on their relative performance [14]. The study established standard curves for both methods across a concentration range of 0.05-300 μg/mL, with the HPLC method exhibiting a regression equation of y=0.033x+0.010 (R²=0.9991) and the UV-Vis method showing y=0.065x+0.017 (R²=0.9999) [14].
Table 1: Analytical Performance of HPLC and UV-Vis Methods for Levofloxacin Quantification
| Analytical Parameter | HPLC Method | UV-Vis Method |
|---|---|---|
| Linear Range (μg/mL) | 0.05-300 | 0.05-300 |
| Regression Equation | y=0.033x+0.010 | y=0.065x+0.017 |
| Coefficient of Determination (R²) | 0.9991 | 0.9999 |
| Recovery Rate (Low Concentration, 5 μg/mL) | 96.37±0.50% | 96.00±2.00% |
| Recovery Rate (Medium Concentration, 25 μg/mL) | 110.96±0.23% | 99.50±0.00% |
| Recovery Rate (High Concentration, 50 μg/mL) | 104.79±0.06% | 98.67±0.06% |
The recovery rate data demonstrates that while both methods performed comparably at low concentrations, the HPLC method showed slightly higher variability at medium and high concentrations [14]. Despite this, the authors concluded that UV-Vis spectrophotometry was insufficiently accurate for measuring drug concentrations loaded on biodegradable composite scaffolds due to potential impurity interference, recommending HPLC as the preferred method for evaluating the sustained release characteristics of Levofloxacin [14].
Experimental Protocol for Method Comparison
A robust method comparison study requires careful experimental design and execution. The following protocol outlines key considerations:
Sample Preparation and Analysis:
- Select at least 40-100 patient samples covering the entire clinically meaningful measurement range [103].
- Perform duplicate measurements for both current and new methods to minimize random variation effects [103].
- Randomize sample sequence to avoid carry-over effects and analyze samples within their stability period, preferably within 2 hours of collection [103].
- For levofloxacin analysis, prepare standard solutions in simulated body fluid (SBF) with concentration gradients ranging from 0.01-300 μg/mL [14].
- For HPLC analysis, use a C18 column with mobile phase consisting of 0.01 mol/L KH₂PO₄, methanol, and 0.5 mol/L tetrabutylammonium hydrogen sulphate (75:25:4 ratio) at a flow rate of 1 mL/min with detection at 290 nm [14].
Data Collection:
- Conduct measurements over multiple days (at least 5) and multiple runs to mimic real-world variability [103].
- For UV-Vis analysis, scan standard solutions at 200-400 nm to determine maximum absorption wavelength (λ=262 nm for bakuchiol, for example) [23].
- Define acceptable bias before experimentation based on clinical outcomes, biological variation, or state-of-the-art performance [103].
Statistical Analysis Workflow
The statistical evaluation of method comparison data follows a systematic workflow to thoroughly assess agreement between analytical techniques.
Figure 1: Statistical Analysis Workflow for Method Comparison Studies
Data Visualization Techniques
Scatter Plots provide the initial visual assessment of the relationship between two methods, with each point representing a pair of measurements (method A vs. method B) [103]. The line of equality (y=x) serves as a reference for perfect agreement. Scatter plots help identify the distribution of data points across the measurement range and reveal obvious outliers or unexpected gaps in the data [103].
Difference Plots (Bland-Altman plots) transform this visualization to focus specifically on agreement by plotting the difference between methods against their average for each sample [103] [105]. This approach facilitates the identification of concentration-dependent biases and helps establish limits of agreement.
Quantitative Analysis Procedures
Regression Analysis Calculation:
- For Deming regression, calculate slope (β) and intercept (α) using formulas that account for measurement errors in both methods.
- Compute confidence intervals for both parameters to assess statistical significance.
- Interpret results: A slope not significantly different from 1 indicates no proportional bias, while an intercept not significantly different from 0 indicates no constant bias [106].
Bland-Altman Analysis Calculation:
- Compute differences between paired measurements: δ = Method A - Method B
- Calculate mean difference: δ̄ = Σδ/n
- Determine standard deviation of differences: s₍δ₎
- Establish limits of agreement: δ̄ ± 1.96 × s₍δ₎
- Analyze the plot for relationship between difference and magnitude: consistent scatter indicates constant variance, while funnel-shaped patterns suggest proportional error [105].
Essential Research Reagent Solutions
Table 2: Key Research Reagents and Materials for HPLC and UV-Vis Method Comparison
| Reagent/Material | Function | Example Specifications |
|---|---|---|
| Chromatography Column | Separates analytes in complex mixtures | Sepax BR-C18 column (250×4.6 mm; 5 µm particle diameter) [14] |
| Mobile Phase Components | Carries samples through chromatography system | KH₂PO₄, methanol, tetrabutylammonium hydrogen sulphate (75:25:4 ratio) [14] |
| Solid-Phase Extraction Cartridges | Isolates and purifies analytes from complex matrices | Monolithic C18-silica disk centrifugal spin-cartridges [107] |
| Standard Reference Materials | Calibration and quality control | Certified reference standards (e.g., Levofloxacin, National Institutes for Food and Drug Control) [14] |
| Internal Standards | Corrects for procedural variability | Stable isotope-labeled analogs for MS methods; structural analogs for UV (e.g., Ciprofloxacin for Levofloxacin) [14] |
| Simulated Biological Fluids | Mimics in vivo conditions for drug release studies | Simulated Body Fluid (SBF) for dissolution testing [14] |
Application in Pharmaceutical Research
Therapeutic Drug Monitoring
Method comparison studies have significant practical applications in therapeutic drug monitoring (TDM), where rapid and accurate quantification of drug concentrations is essential for patient management. A study comparing HPLC-UV with LC-MS/MS for voriconazole TDM demonstrated that while both methods showed excellent correlation (Pearson's r=0.988), the HPLC-UV platform significantly reduced reporting times (0.433 hours vs. 74.3 hours, p<0.001) [106]. This highlights the importance of considering both analytical performance and practical operational factors when selecting methods for clinical applications.
Analysis of Complex Matrices
The choice between HPLC and UV-Vis becomes particularly important when analyzing complex biological matrices or herbal medicines. A comparison of these methods for quantifying flavonoids from Bauhinia forficata leaves revealed that while HPLC provided specific quantification of individual compounds, UV-Vis spectrophotometry offered a broader assessment of total flavonoid content and remained effective even when specific markers were absent [104]. Similarly, in the quantification of bakuchiol in cosmetic products, both HPLC and NMR methods provided accurate results, while UV-Vis faced challenges with emulsion-based samples [23].
Key Considerations for Method Selection
When comparing analytical methods, researchers should consider multiple factors beyond statistical agreement:
- Specificity: HPLC and LC-MS/MS offer superior specificity in complex mixtures due to chromatographic separation [105] [107].
- Sensitivity: Detection limits vary significantly between techniques, with MS-based methods typically offering the highest sensitivity [105].
- Throughput and Cost: UV-Vis methods are generally faster and more cost-effective for simple analyses, while HPLC provides better specificity for complex samples [14] [104].
- Matrix Effects: Complex biological matrices may interfere with UV-Vis detection, making HPLC more suitable for such applications [14] [23].
Statistical analysis for method comparison requires a multifaceted approach that incorporates both regression and Bland-Altman methodologies. While regression analysis establishes the functional relationship between methods, Bland-Altman plots provide critical insights into their agreement across the measurement range. The case studies presented demonstrate that the choice between HPLC and UV-Vis methods depends heavily on the specific application, required specificity, and sample matrix complexity. By implementing rigorous statistical comparison protocols and understanding the strengths and limitations of each analytical technique, researchers can make informed decisions about method selection for pharmaceutical analysis and drug development applications.
Selecting the appropriate analytical technique is a critical step in pharmaceutical development, balancing the need for accurate data with analytical efficiency. This guide provides a structured comparison between High-Performance Liquid Chromatography (HPLC) and UV-Vis Spectrophotometry, focusing on their performance relative to sample complexity and data requirements, with a specific emphasis on recovery rate comparisons.
High-Performance Liquid Chromatography (HPLC)
HPLC is a separation technique that resolves complex mixtures into individual components through differential partitioning between a mobile liquid phase and a stationary phase packed in a column. The core principle involves pumping the sample mixture under high pressure through the column, where components interact differently with the stationary phase, leading to separation based on characteristics like polarity, size, or charge. Detection occurs after separation, providing both qualitative (retention time) and quantitative (peak area) data for each component. Modern HPLC systems offer significant advancements, with instruments like the Agilent Infinity III series operating at pressures up to 1300 bar, and the Shimadzu i-series supporting pressures up to 70 MPa (approximately 10,150 psi), enabling faster analyses and superior separations [108].
UV-Vis Spectrophotometry
UV-Vis Spectrophotometry is a non-separative technique based on the measurement of the absorption of ultraviolet or visible light by molecules in a solution. When analyte molecules are exposed to light at specific wavelengths, they undergo electronic transitions, absorbing energy. The extent of absorption at a given wavelength follows the Beer-Lambert law, which states that absorbance is directly proportional to the concentration of the absorbing species. Unlike HPLC, UV-Vis analyzes the entire sample solution without prior separation, resulting in a composite spectrum that represents the sum of all absorbing species present. This makes it excellent for quantitative analysis of target compounds in pure solutions or simple mixtures but challenging in complex matrices due to potential spectral overlaps [109] [23].
Performance Comparison: Experimental Data and Recovery Rates
Direct comparative studies provide the most valuable insights for method selection. The following data, summarized from controlled experiments, highlights the performance characteristics of each technique.
Table 1: Comparative Method Validation Data for Favipiravir Analysis [110]
| Validation Parameter | HPLC Method Performance | UV-Vis Method Performance |
|---|---|---|
| Linearity Range | 10–60 μg/mL | 10–60 μg/mL |
| Correlation Coefficient (r) | >0.999 | >0.999 |
| Accuracy (Recovery Rate) | 99.57% - 100.10% | 99.83% - 100.45% |
| Intra-day Precision (% RSD) | Low RSD (specific value not stated) | Low RSD (specific value not stated) |
| Inter-day Precision (% RSD) | Low RSD (specific value not stated) | Low RSD (specific value not stated) |
| Specificity | No interference from excipients | No interference from excipients in simple formulations |
A separate study analyzing bakuchiol in cosmetic products further validates these findings, demonstrating that both HPLC and quantitative NMR produced comparable quantification results, while UV-Vis faced limitations with complex emulsion formulations where complete extraction was challenging [23] [111].
Table 2: Comparative Technique Attributes Based on Sample Complexity
| Attribute | HPLC | UV-Vis Spectrophotometry |
|---|---|---|
| Analytical Scope | Separation and quantification of multiple components | Primarily quantification of a single or total absorbing component |
| Ideal Sample Complexity | Medium to High (mixtures with interfering compounds) | Low (pure substances or simple mixtures) |
| Key Advantage | High specificity and selectivity in complex matrices | Simplicity, speed, and cost-effectiveness |
| Key Limitation | More complex operation, longer analysis time, higher cost | Lacks specificity in complex matrices |
| Detection Capability | Various detectors (e.g., UV, MS, CAD) can be used [109] | Direct UV-Vis absorption measurement |
Detailed Experimental Protocols
To ensure reproducibility and provide a clear framework for laboratory implementation, detailed protocols for a comparative analysis are outlined below.
HPLC Method for Pharmaceutical Formulation (e.g., Favipiravir)
- Instrumentation: An HPLC system equipped with a quaternary pump, autosampler, column oven, and UV detector is used. For example, an Agilent 1260 series or equivalent [110] [112].
- Chromatographic Conditions:
- Column: Reverse-phase C18 column (e.g., Inertsil ODS-3, 250 mm × 4.6 mm, 5 μm) [110].
- Mobile Phase: Sodium acetate solution (50 mM, pH 3.0 with glacial acetic acid) and acetonitrile in a ratio of 85:15 (v/v) [110].
- Flow Rate: 1.0 mL/min [110].
- Column Temperature: 30 °C [110].
- Detection Wavelength: 227 nm [110].
- Injection Volume: Typically 10-20 μL.
- Sample Preparation:
- Accurately weigh and crush not less than ten tablets.
- Transfer an amount of powder equivalent to about 50 mg of the active ingredient into a 50 mL volumetric flask.
- Add about 30 mL of diluent (e.g., deionized water or mobile phase), shake for 30 minutes, and sonicate if necessary.
- Dilute to volume with the diluent and mix well.
- Filter the solution through a 0.22 μm or 0.45 μm membrane filter, discarding the first few mL of the filtrate [110].
- System Suitability: Prior to analysis, confirm system performance with criteria such as %RSD for replicate injections of a standard solution (<2.0%), tailing factor for the analyte peak (<2.0), and a theoretical plate count above a specified minimum [112].
UV-Vis Spectrophotometric Method for Pharmaceutical Formulation
- Instrumentation: A double-beam UV-Vis spectrophotometer with 1.0 cm matched quartz cells is required [110].
- Method Conditions:
- Sample Preparation:
- Prepare a sample solution following a procedure similar to the HPLC method, ensuring the final concentration falls within the validated linear range (e.g., 10–60 μg/mL) [110].
- Due to the lack of separation, it is critical that the placebo formulation or excipients do not absorb significantly at the chosen wavelength to ensure the accuracy of the recovery rate.
- Validation: Construct a calibration curve using at least five concentrations of the reference standard within the linear range. The accuracy (recovery) is determined by spiking a known amount of the reference standard into the placebo or pre-analyzed sample [110].
Workflow and Selection Logic
The decision to use HPLC or UV-Vis is not merely a technical choice but a strategic one that impacts data quality, resource allocation, and project timelines. The following workflow provides a logical framework for this decision-making process, based on the initial sample characteristics and final data requirements.
Essential Research Reagent Solutions
The successful implementation of either analytical method relies on the use of high-quality reagents and materials. The following table lists key items and their functions in the context of the described protocols.
Table 3: Essential Research Reagents and Materials
| Item | Function / Purpose | Example / Specification |
|---|---|---|
| HPLC-Grade Solvents | To serve as the mobile phase, ensuring low UV background and minimal interference. | Acetonitrile, Methanol, Water [110] [112]. |
| Buffer Salts & pH Modifiers | To control pH and ionic strength of the mobile phase, optimizing separation and peak shape. | Sodium acetate, Ammonium formate, Formic acid, Glacial acetic acid [110] [112]. |
| Reference Standard | A highly purified compound used to calibrate the instrument and quantify the analyte. | USP/NF reference standard or qualified in-house reference material [112]. |
| Chromatographic Column | The stationary phase where the physical separation of mixture components occurs. | C18 reverse-phase column (e.g., 150-250 mm x 4.6 mm, 3-5 μm) [110] [112]. |
| Syringe Filters | To clarify sample solutions by removing particulate matter that could damage the HPLC system. | 0.45 μm or 0.22 μm, Nylon or PTFE membrane [112]. |
| Volumetric Glassware | For precise preparation and dilution of standard and sample solutions. | Class A volumetric flasks and pipettes [112]. |
The choice between HPLC and UV-Vis spectrophotometry is fundamentally governed by the sample complexity and the specificity of data required. Experimental data confirms that both techniques can exhibit excellent and comparable accuracy (recovery rates of ~99.6-100.5%) and precision when applied to suitable samples [110]. UV-Vis spectrophotometry is a robust, simple, and cost-effective solution for the quantitative analysis of pure compounds or simple mixtures. For complex formulations requiring separation, specific identification, and individual quantification of multiple components, HPLC is the unequivocal choice due to its superior resolving power and specificity. The structured workflow and comparative data provided in this guide empower scientists to make an informed, rational selection of the most appropriate analytical tool for their specific pharmaceutical development needs.
Conclusion
The choice between HPLC and UV-Vis methods for recovery rate analysis is not a matter of one being universally superior, but of selecting the right tool for the specific analytical challenge. UV-Vis offers a rapid, cost-effective solution for simple, well-defined samples where target analytes are free from interference. In contrast, HPLC, with its superior separation power, is indispensable for achieving accurate recovery from complex matrices such as combination drugs, biological fluids, and novel drug-delivery scaffolds, where excipients or other components can severely skew UV-Vis results. The rigorous validation of recovery rates is paramount for regulatory compliance and ensuring drug safety and efficacy. Future directions point toward the adoption of greener methods, further miniaturization and automation of HPLC systems, and the strategic use of hybrid techniques like LC-MS/MS for ultimate confirmation, all aimed at enhancing the accuracy, efficiency, and sustainability of pharmaceutical analysis.
References
- 1. Use of recovery and bias information in analytical ... [https://www.sciencedirect.com/science/article/abs/pii/S0165993608001891]
- 2. Analytical Method Validation: Back to Basics, Part II [https://www.chromatographyonline.com/view/analytical-method-validation-back-basics-part-ii]
- 3. Percentage recovery: Significance and symbolism [https://www.wisdomlib.org/concept/percentage-recovery]
- 4. Validation of the High-Performance Liquid ... [https://pmc.ncbi.nlm.nih.gov/articles/PMC11699575/]
- 5. Experimental and Therapeutic Medicine [https://www.spandidos-publications.com/10.3892/etm.2019.7238]
- 6. Development and validation of a UV–Vis ... [https://pmc.ncbi.nlm.nih.gov/articles/PMC11750579/]
- 7. Development and validation of a green UV–Vis ... [https://www.sciencedirect.com/science/article/abs/pii/S0308814625038294]
- 8. Using UV-Vis Spectrophotometry In Drug Stability Testing ... [https://www.hunterlab.com/blog/using-uv-vis-spectrophotometry-in-drug-stability-testing-can-predict-commercial-viability/]
- 9. Ultraviolet–visible spectroscopy [https://en.wikipedia.org/wiki/Ultraviolet%E2%80%93visible_spectroscopy]
- 10. UV-Visible Spectroscopy [https://www2.chemistry.msu.edu/faculty/reusch/virttxtjml/spectrpy/uv-vis/spectrum.htm]
- 11. UV-Vis Spectrophotometry: In-Depth Analysis Methods For ... [https://www.alwsci.com/news/spectroscopy-uv-vis-spectrophotometry-in-de-81882656.html]
- 12. Interpreting Ultraviolet Spectra - The Effect of Conjugation [https://chem.libretexts.org/Bookshelves/Organic_Chemistry/Map%3A_Organic_Chemistry_(Wade)_Complete_and_Semesters_I_and_II/Map%3A_Organic_Chemistry_(Wade)/16%3A_Conjugated_Systems_Orbital_Symmetry_and_Ultraviolet_Spectroscopy/16.10%3A_Interpreting_Ultraviolet_Spectra_-_The_Effect_of_Conjugation]
- 13. Application of UV dissolution imaging to pharmaceutical ... [https://www.sciencedirect.com/science/article/abs/pii/S0169409X21003422]
- 14. Comparison of high-performance liquid chromatography ... [https://pmc.ncbi.nlm.nih.gov/articles/PMC6425260/]
- 15. Comparative UV Spectrophotometric and HPLC Method for ... [https://rjptonline.org/AbstractView.aspx?PID=2025-18-9-25]
- 16. UV-Vis Spectrophotometer Applications [https://www.thermofisher.com/us/en/home/industrial/spectroscopy-elemental-isotope-analysis/molecular-spectroscopy/uv-vis-spectrophotometry/applications.html]
- 17. Development and validation of an HPLC method for ... [https://www.sciencedirect.com/science/article/pii/S1872204025000404]
- 18. High-Performance Liquid Chromatography (HPLC) for ... [https://www.labmanager.com/high-performance-liquid-chromatography-hplc-for-complex-mixtures-34238]
- 19. Comparative performance of liquid chromatography and ... [https://www.sciencedirect.com/science/article/pii/S2405844024085827]
- 20. Comparison of ultraviolet and refractive index detections in ... [https://www.sciencedirect.com/science/article/abs/pii/S030881462101520X]
- 21. Development and Validation of a UV Spectroscopic ... [https://link.springer.com/article/10.1007/s10812-025-02018-5]
- 22. Comparative Study of UV And HPLC Methods for ... [https://www.ijsrtjournal.com/article/Comparative+Study+of+UV+And+HPLC+Methods+for+Estimation+of+Drug]
- 23. Comparison of Quantification Using UV-Vis, NMR, and ... [https://www.mdpi.com/1422-0067/26/14/6638]
- 24. The Essence of Modern HPLC: Advantages, Limitations ... [https://www.chromatographyonline.com/view/essence-modern-hplc-advantages-limitations-fundamentals-and-opportunities]
- 25. Advantages, Limitations, And Future Trends Of High- ... [https://www.alwsci.com/news/advantages-limitations-and-future-trends-of-85237687.html]
- 26. An HPLC-UV Method to Assess Human Plasma 25(OH)D3 [https://www.mdpi.com/2072-6643/16/14/2304]
- 27. Design-assisted HPLC-UV method for therapeutic drug ... [https://www.nature.com/articles/s41598-024-78793-6]
- 28. Recent HPLC-UV Approaches for Cannabinoid Analysis [https://pmc.ncbi.nlm.nih.gov/articles/PMC12196272/]
- 29. A Beginner's Guide to Quality by Design (QbD) for HPLC ... [https://www.sepscience.com/a-beginners-guide-to-quality-by-design-qbd-for-hplc-method-development-11307]
- 30. HPLC Columns - HPLC column selectivity measurements of ... [https://www.hplccolumns.org/]
- 31. Comparison Techniques for HPLC Column Performance [https://www.chromatographyonline.com/view/comparison-techniques-hplc-column-performance]
- 32. Comparison Techniques For HPLC Column Performance [https://www.chromatographyonline.com/view/comparison-techniques-hplc-column-performance-3]
- 33. Mobile Phase Selection Guide: Optimal Solvent Pairing ... [https://www.alwsci.com/news/mobile-phase-selection-guide-optimal-solvent-77320943.html]
- 34. Optimization of HPLC methods for the development ... [https://pmc.ncbi.nlm.nih.gov/articles/PMC12105191/]
- 35. HPLC Update Day 2: Modern Method Development [https://www.chromatographyonline.com/view/hplc-update-day-2-modern-method-development]
- 36. Development and validation of the UV-spectrophotometric ... [https://pmc.ncbi.nlm.nih.gov/articles/PMC3658052/]
- 37. Comparison of HPLC and UV Spectrophotometric Methods ... [https://brieflands.com/journals/ijpr/articles/124310]
- 38. How to Make a Calibration Curve: A Step-by-Step Guide [https://www.labmanager.com/how-to-make-a-calibration-curve-28411]
- 39. Comparative Evaluation of UV-Vis Spectroscopy-Based ... [https://pmc.ncbi.nlm.nih.gov/articles/PMC11430504/]
- 40. Why Is Your SPE Recovery So Low? - News [https://www.alwsci.com/news/why-is-your-spe-recovery-so-low-85174255.html]
- 41. Systematic optimization of an SPE with HPLC-FLD method ... [https://www.sciencedirect.com/science/article/abs/pii/S0304389414006839]
- 42. Highly selective solid phase extraction of clonazepam from ... [https://www.nature.com/articles/s41598-025-07127-x]
- 43. Sample Preparation for Large-Scale Protein Purification [https://www.chromatographyonline.com/view/sample-preparation-large-scale-protein-purification-0]
- 44. Toward a Universal Sample Preparation Method for ... [https://pmc.ncbi.nlm.nih.gov/articles/PMC7542658/]
- 45. Protein Sample Preparation for Mass Spectrometry [https://www.thermofisher.com/us/en/home/life-science/protein-biology/protein-biology-learning-center/protein-biology-resource-library/pierce-protein-methods/sample-preparation-mass-spectrometry.html]
- 46. Comparison of high-performance liquid chromatography ... [https://pubmed.ncbi.nlm.nih.gov/30906459/]
- 47. Development and validation of a simple UV ... [https://pmc.ncbi.nlm.nih.gov/articles/PMC5760935/]
- 48. RP-HPLC-UV validation method for levofloxacin ... [https://www.sciencedirect.com/science/article/pii/S1878535221005979]
- 49. Development and validation of RP-HPLC method for ... [https://www.sciencedirect.com/science/article/abs/pii/S0026265X21005750]
- 50. Development and validation of HPLC-UV and LC-MS/MS ... [https://bmcchem.biomedcentral.com/articles/10.1186/s13065-024-01321-0]
- 51. DEVELOPMENT AND VALIDATION OF A SIMPLE UV ... [https://ijpsr.com/bft-article/development-and-validation-of-a-simple-uv-spectrophotometric-method-for-the-determination-of-levofloxacin-both-in-bulk-and-pharmaceutical-formulation/]
- 52. Development and validation of a highly sensitive HPLC ... [https://www.nature.com/articles/s41598-025-94907-0]
- 53. Development and validation of RP-HPLC method ... [https://www.sciencedirect.com/science/article/abs/pii/S3050475925007298]
- 54. Univariate and multivariate signal processing ... [https://www.nature.com/articles/s41598-025-22700-0]
- 55. A Rapid HPLC Method for the Concurrent Determination of ... [https://www.mdpi.com/2297-8739/8/6/86]
- 56. Development of an HPLC-UV Method for the Analysis of ... [https://pmc.ncbi.nlm.nih.gov/articles/PMC3619551/]
- 57. Evaluation of green and practical analytical techniques for ... [https://www.sciencedirect.com/science/article/pii/S0026265X25029649]
- 58. Best practice in therapeutic drug monitoring - PMC [https://pmc.ncbi.nlm.nih.gov/articles/PMC1873661/]
- 59. Evaluation of the clinical and quantitative performance ... [https://pmc.ncbi.nlm.nih.gov/articles/PMC10544152/]
- 60. Evaluation of the clinical and quantitative performance of a ... [https://www.semanticscholar.org/paper/Evaluation-of-the-clinical-and-quantitative-of-a-of-Morikawa-Fukami/1f7bfd531673df0da9311e084156a8853db69b28]
- 61. Different methods for resolving overlapping UV spectra of ... [https://bmcchem.biomedcentral.com/articles/10.1186/s13065-023-01007-z]
- 62. Comparison of UV spectrophotometry and high ... [https://pmc.ncbi.nlm.nih.gov/articles/PMC3658086/]
- 63. Development of a reverse-phase HPLC method for the ... [https://pmc.ncbi.nlm.nih.gov/articles/PMC12562788/]
- 64. HPLC Columns Strategic Insights: Analysis 2025 and ... [https://www.archivemarketresearch.com/reports/hplc-columns-213249]
- 65. HPLC Column Market - Growth and Forecast to 2035 [https://www.transparencymarketresearch.com/hplc-column-market.html]
- 66. Advanced Guide to HPLC Troubleshooting: Solve common ... [https://pharmacores.com/advanced-guide-to-hplc-troubleshooting/]
- 67. Innovations in Liquid Chromatography: 2025 HPLC ... [https://www.chromatographyonline.com/view/innovations-in-liquid-chromatography-2025-hplc-column-and-accessories-review]
- 68. Mobile Phase Optimization: A Critical Factor in HPLC [https://www.phenomenex.com/knowledge-center/hplc-knowledge-center/mobile-phase-in-chromatography?srsltid=AfmBOoptOmS4RadwLh0-f48kbcdFmNCh4jd-r9jMblkXjqesfCbDFgpb]
- 69. Essentials of LC Troubleshooting, Part IV: What Is Going ... [https://www.chromatographyonline.com/view/essentials-of-lc-troubleshooting-part-iv-what-is-going-on-with-the-baseline-]
- 70. Microwave-assisted extraction: Recent advances in ... [https://www.sciencedirect.com/science/article/pii/S2772826925000677]
- 71. Ultrasound assisted extraction (UAE) of bioactive ... [https://www.sciencedirect.com/science/article/pii/S1350417720309950]
- 72. Ultrasound-Assisted Extraction of Bioactive Compounds ... [https://pmc.ncbi.nlm.nih.gov/articles/PMC11120188/]
- 73. - Ultrasound and the Encapsulation of Bioactive... Assisted Extraction [https://pmc.ncbi.nlm.nih.gov/articles/PMC9564298/]
- 74. Microwave Assisted Extraction - an overview [https://www.sciencedirect.com/topics/chemistry/microwave-assisted-extraction]
- 75. Optimization of Microwave-Assisted Extraction ... [https://pmc.ncbi.nlm.nih.gov/articles/PMC11939473/]
- 76. sciencedirect.com/topics/biochemistry-genetics-and-molecular-biology... [https://www.sciencedirect.com/topics/biochemistry-genetics-and-molecular-biology/ultrasound-assisted-extraction]
- 77. Comparison of microwave and ultrasound-assisted extraction ... [https://pmc.ncbi.nlm.nih.gov/articles/PMC4190243/]
- 78. Comparative Study of Microwave-Assisted Extraction and ... [https://www.mdpi.com/2673-4591/37/1/124]
- 79. Microwave-Assisted Extraction for the Sustainable ... [https://www.mdpi.com/2673-4079/6/3/26]
- 80. Development of forced degradation and stability indicating ... [https://pmc.ncbi.nlm.nih.gov/articles/PMC5761119/]
- 81. Forced Degradation Studies and Development and Validation of HPLC-UV Method for the Analysis of Velpatasvir Copovidone Solid Dispersion - PMC [https://pmc.ncbi.nlm.nih.gov/articles/PMC9311562/]
- 82. Development and Validation of HPLC-DAD and UHPLC ... [https://pmc.ncbi.nlm.nih.gov/articles/PMC6151785/]
- 83. Optimization and Validation of an HPLC Method ... [https://pmc.ncbi.nlm.nih.gov/articles/PMC12409534/]
- 84. RP-HPLC Method Development, Validation Including Stability Indicating and Forced Degradation Studies for the Estimation of Pemetrexed in API and Pharmaceutical Dosage Form - ADS [https://ui.adsabs.harvard.edu/abs/2023JPhCS2603a2055V/abstract]
- 85. Robustness and Ruggedness Testing in Analytical Chemistry [https://www.labmanager.com/robustness-and-ruggedness-testing-in-analytical-chemistry-34247]
- 86. Robustness Tests | LCGC International [https://www.chromatographyonline.com/view/robustness-tests]
- 87. Development and validation of a novel isocratic RP-HPLC ... [https://www.sciencedirect.com/science/article/pii/S092809872500274X]
- 88. Implementing Robustness Testing for HPLC Methods [https://www.sepscience.com/implementing-robustness-testing-for-hplc-methods-6978]
- 89. HPLC 2025 Preview: Fundamentally Speaking (Part 1) [https://www.chromatographyonline.com/view/hplc-2025-preview-fundamentally-speaking-part-1-]
- 90. How UV-Vis is Evolving in 2025 for Better Lab Efficiency [https://www.richmondscientific.com/how-uv-vis-is-evolving-in-2025-for-better-lab-efficiency?srsltid=AfmBOop-Hj5660DynLHHPk4USO_KJOGzRLq5cFLsgqt8XN8TlpAYvNPS]
- 91. Design and validation of a robust stability-indicating reversed ... [https://pmc.ncbi.nlm.nih.gov/articles/PMC12619242/]
- 92. Penetration depth and effective sample size ... [https://www.sciencedirect.com/science/article/pii/S0022354925003417]
- 93. The 6 Key Aspects of Analytical Method Validation [https://www.elementlabsolutions.com/uk/chromatography-blog/post/6-key-aspects-of-analytical-method-validation]
- 94. Limit of Blank, Limit of Detection and Limit of Quantitation [https://pmc.ncbi.nlm.nih.gov/articles/PMC2556583/]
- 95. A sustainable multi-task HPLC–UV method for ... [https://www.nature.com/articles/s41598-025-07502-8]
- 96. Development and validation of a UV–Vis ... [https://www.sciencedirect.com/science/article/pii/S2215016124005703]
- 97. The Development and Validation of a Simple HPLC-UV ... [https://pmc.ncbi.nlm.nih.gov/articles/PMC11901705/]
- 98. Comparative evaluation of four new immunoassays and LC ... [https://pubmed.ncbi.nlm.nih.gov/40584217/]
- 99. Impact of old and current immunoassays on the 1 mg ... [https://pubmed.ncbi.nlm.nih.gov/40659360/]
- 100. Assessment of measurement uncertainty of immunoassays ... [https://www.degruyterbrill.com/document/doi/10.1515/cclm-2025-0554/html?srsltid=AfmBOoq-SgWTZDbrjXVbmR1InKpx1xAD-zspwRIXHkmp5Fwlj31GxGFZ]
- 101. High-performance liquid chromatography and Enzyme-Linked ... [https://bmcresnotes.biomedcentral.com/articles/10.1186/s13104-019-4538-z]
- 102. Comparative insights to microwave and ultrasound as ... [https://www.sciencedirect.com/science/article/abs/pii/S0021967325005746]
- 103. Statistical analysis in method comparison studies part one [https://acutecaretesting.org/en/articles/statistical-analysis-in-method-comparison-studies-part-one]
- 104. Comparative evaluation of UV/VIS and HPLC analytical ... [https://www.sciencedirect.com/science/article/pii/S0102695X13700061]
- 105. Mass Spectrometry-Based Evaluation of the Bland–Altman ... [https://www.mdpi.com/1420-3049/28/13/4905]
- 106. Rapid Therapeutic Drug Monitoring of Voriconazole Based ... [https://pmc.ncbi.nlm.nih.gov/articles/PMC12108353/]
- 107. Evaluation of the clinical and quantitative performance of a ... [https://jphcs.biomedcentral.com/articles/10.1186/s40780-023-00298-7]
- 108. New HPLC, MS, and CDS Products from 2024–2025 [https://www.chromatographyonline.com/view/new-hplc-ms-and-cds-products-from-2024-2025-a-brief-review]
- 109. How HPLC Detectors Work [https://www.thermofisher.com/us/en/home/industrial/chromatography/chromatography-learning-center/liquid-chromatography-information/hplc-system-components/how-hplc-detectors-work.html]
- 110. Comparison of HPLC and UV Spectrophotometric Methods ... [https://pmc.ncbi.nlm.nih.gov/articles/PMC8653657/]
- 111. Comparison of Quantification Using UV-Vis, NMR, and ... [https://pubmed.ncbi.nlm.nih.gov/40724887/]
- 112. A Well-Written Analytical Procedure for Regulated HPLC ... [https://www.chromatographyonline.com/view/a-well-written-analytical-procedure-for-regulated-hplc-testing]