HPLC vs. UV-Vis for Levofloxacin Quantification: A Comprehensive Guide for Analytical Scientists and Drug Developers
This article provides a systematic comparison of High-Performance Liquid Chromatography (HPLC) and Ultraviolet-Visible (UV-Vis) Spectrophotometry for the quantification of levofloxacin in pharmaceutical formulations and complex biological matrices.
HPLC vs. UV-Vis for Levofloxacin Quantification: A Comprehensive Guide for Analytical Scientists and Drug Developers
Abstract
This article provides a systematic comparison of High-Performance Liquid Chromatography (HPLC) and Ultraviolet-Visible (UV-Vis) Spectrophotometry for the quantification of levofloxacin in pharmaceutical formulations and complex biological matrices. Tailored for researchers, scientists, and drug development professionals, it explores the foundational principles, methodological applications, troubleshooting strategies, and validation parameters for both techniques. Drawing on recent studies, it critically evaluates performance in scenarios ranging from routine quality control to analysis in drug-delivery systems and environmental samples. The synthesis offers evidence-based guidance for method selection to ensure accurate, reliable, and compliant levofloxacin analysis in both research and industrial settings.
Levofloxacin Analysis: Fundamental Principles and the Core Divide Between HPLC and UV-Vis Techniques
The Critical Role of Accurate Levofloxacin Quantification in Pharmaceutical Quality and Public Health
Accurate quantification of pharmaceutical compounds is a cornerstone of drug quality control and efficacy. For broad-spectrum antibiotics like levofloxacin, precise measurement is not merely a regulatory formality but a critical factor in combating infectious diseases and preventing the development of antibiotic resistance. This guide provides a comprehensive comparison of two fundamental analytical techniques—High-Performance Liquid Chromatography (HPLC) and Ultraviolet-Visible Spectrophotometry (UV-Vis)—for levofloxacin quantification, presenting objective experimental data to inform method selection by researchers and pharmaceutical scientists.
Methodological Face-Off: HPLC vs. UV-Vis in Laboratory Practice
A direct comparison study highlights the practical and performance differences between HPLC and UV-Vis methods for analyzing levofloxacin, particularly when released from a modern drug-delivery system like mesoporous silica microspheres/nano-hydroxyapatite (n-HA) composite scaffolds [1].
Table 1: Direct Performance Comparison of HPLC and UV-Vis for Levofloxacin Analysis
| Performance Parameter | HPLC Method | UV-Vis Method |
|---|---|---|
| Linear Concentration Range | 0.05–300 µg/ml | 0.05–300 µg/ml |
| Regression Equation | y = 0.033x + 0.010 | y = 0.065x + 0.017 |
| Coefficient of Determination (R²) | 0.9991 | 0.9999 |
| Recovery Rate (Low - 5 µg/ml) | 96.37 ± 0.50% | 96.00 ± 2.00% |
| Recovery Rate (Medium - 25 µg/ml) | 110.96 ± 0.23% | 99.50 ± 0.00% |
| Recovery Rate (High - 50 µg/ml) | 104.79 ± 0.06% | 98.67 ± 0.06% |
| Key Application Note | Preferred for complex matrices (e.g., drug-delivery scaffolds) with impurity interference | Less accurate for drug release from biodegradable composites |
The experimental data reveals that while both methods show excellent linearity, HPLC demonstrates superior accuracy and consistency, especially at medium and high concentrations. The study concluded that UV-Vis is not accurate for measuring drugs loaded on biodegradable composites due to its susceptibility to impurity interference, making HPLC the preferred method for evaluating the sustained-release characteristics of levofloxacin from advanced drug-delivery systems [1].
Detailed Experimental Protocols
To ensure reproducibility and provide a clear technical overview, the following experimental workflows and parameters are drawn from validated studies.
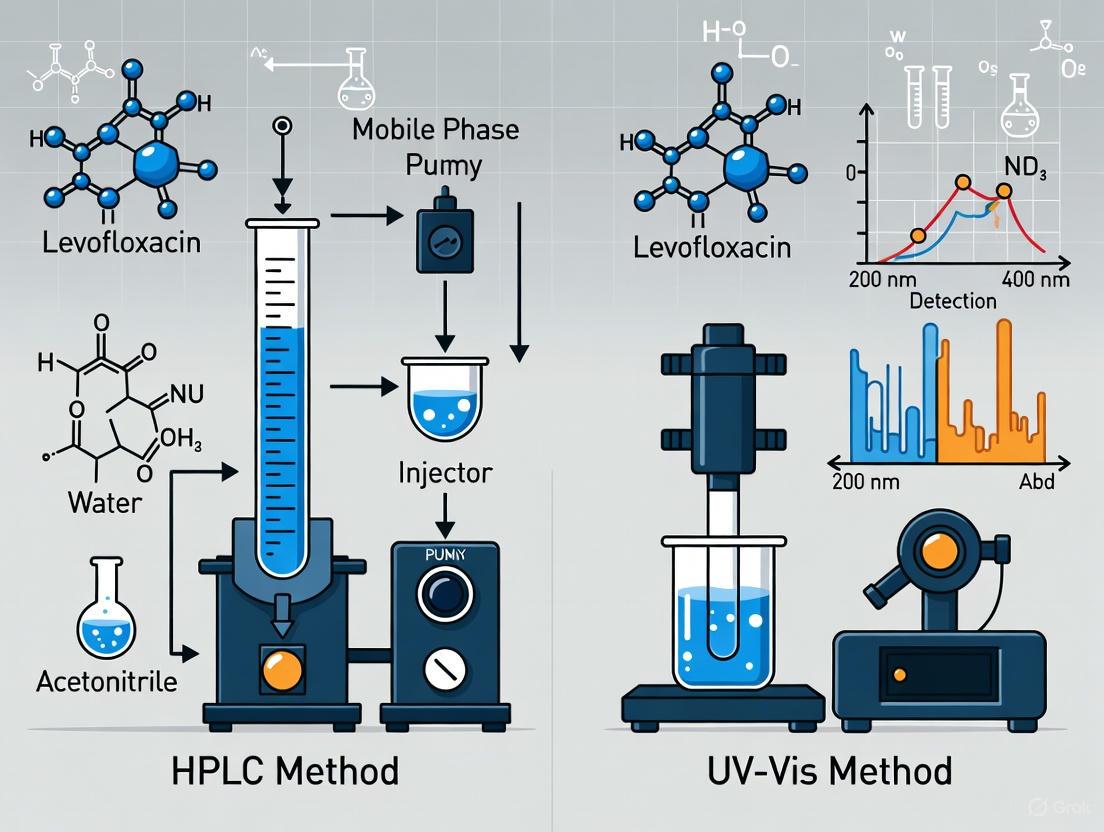
Protocol 1: HPLC Analysis of Levofloxacin
The following diagram illustrates the multi-step sample preparation process for HPLC analysis, which includes the use of an internal standard for high accuracy.
Chromatographic Conditions:
- Column: Sepax BR-C18 (250 × 4.6 mm; 5 µm particle diameter) [1]
- Mobile Phase: Mix of 0.01 mol/L KH₂PO₄, methanol, and 0.5 mol/L tetrabutylammonium hydrogen sulphate (75:25:4 ratio) [1]
- Flow Rate: 1.0 mL/min [1]
- Detection: UV detector at 290 nm [1]
- Injection Volume: 10 µL for assay determination [1]
- Column Temperature: 40°C [1]
An alternative RP-HPLC method for levofloxacin hemihydrate uses a mobile phase of acetonitrile, methanol, and phosphate buffer (pH 3) in a ratio of 17:3:80, with detection at 295 nm, demonstrating a retention time of 7.66 minutes [2].
Protocol 2: UV-Vis Analysis of Levofloxacin
UV-Vis methodology is more straightforward, focusing on direct measurement of absorbance without separation.
Standard Workflow:
- Preparation: Prepare standard solutions of levofloxacin in simulated body fluid (SBF) across the desired concentration range (e.g., 0.05-300 µg/mL) [1].
- Wavelength Selection: Scan the standard solutions across the 200-400 nm range to identify the maximum absorption wavelength for levofloxacin [1].
- Calibration: Measure the absorbance of standard solutions at the determined wavelength (often around 290-295 nm) and construct a calibration curve [1] [2].
- Analysis: Measure the absorbance of unknown samples and calculate their concentration using the regression equation from the calibration curve.
The Scientist's Toolkit: Essential Research Reagents and Materials
Table 2: Key Reagents and Equipment for Levofloxacin Quantification
| Item | Function / Application | Example Specifications / Notes |
|---|---|---|
| Levofloxacin Certified Reference Material (CRM) | Primary standard for preparing calibration curves; ensures accuracy and traceability. | Purity ≥ 99.9% [3] [4]. |
| Ciprofloxacin | Internal Standard for HPLC; corrects for procedural losses and improves accuracy. | Used in HPLC to account for sample preparation variability [1]. |
| Methanol & Acetonitrile (HPLC-grade) | Mobile phase components; dissolve samples and standards. | Low UV cut-off, high purity to prevent interference and column damage [1] [2]. |
| Phosphate Buffer | Aqueous component of mobile phase; controls pH for optimal separation. | Typical pH ~3-6; concentration ~0.01-0.04 M [1] [5]. |
| C18 Chromatography Column | Stationary phase for HPLC; separates levofloxacin from other compounds. | e.g., 250 x 4.6 mm, 5 µm particle size [1]. |
| Simulated Body Fluid (SBF) | Dissolution medium; mimics in-vivo conditions for drug release studies. | Used for release testing from scaffolds and implants [1]. |
Advanced and Emerging Techniques
While HPLC and UV-Vis are foundational, other techniques offer unique advantages for specific applications.
ATR-FTIR Spectroscopy: This technique is emerging as a rapid, direct method for quantifying levofloxacin in solid formulations without extensive sample preparation. It is particularly useful for identifying API adulteration or degradation through principal component analysis (PCA). However, its limits of detection (LOD) and quantification (LOQ) are significantly higher than chromatographic methods, reported at 7.616% w/w and 23.079% w/w, respectively, making it suitable for different application niches [3].
Green Potentiometric Sensors: Solid-contact ion-selective electrodes (SC-ISEs) represent a green, cost-effective, and portable alternative for analyzing levofloxacin in complex matrices like chicken tissues. These sensors are advantageous for on-site analysis as they often require no sample extraction steps. Their greenness can be quantitatively evaluated using the Analytical GREEnness (AGREE) metric, aligning with modern trends towards sustainable analytical chemistry [4] [5].
The choice between HPLC and UV-Vis for levofloxacin quantification is not a matter of which is universally better, but which is more appropriate for the specific analytical challenge.
- For routine, high-throughput analysis of pure levofloxacin formulations where cost and speed are prioritized and matrix interference is minimal, UV-Vis offers a valid and efficient solution.
- For development and analysis of complex drug-delivery systems (e.g., composite scaffolds), bioequivalence studies, or any situation where high specificity and accuracy in a complex matrix are paramount, HPLC is the unequivocally recommended technique due to its superior separation power and resistance to interference.
- For specialized applications like rapid solid-dosage screening or on-site residue monitoring, emerging techniques like ATR-FTIR and potentiometric sensors provide valuable, pragmatic alternatives.
This methodological clarity directly supports the overarching goals of pharmaceutical quality and public health by ensuring that levofloxacin-containing products deliver the correct dose, thereby maximizing therapeutic efficacy and minimizing the risk of antibiotic resistance.
Ultraviolet-Visible (UV-Vis) spectrophotometry and High-Performance Liquid Chromatography (HPLC) represent two fundamental pillars of analytical chemistry in pharmaceutical research and quality control. Within the specific context of levofloxacin quantification—a fluoroquinolone antibiotic requiring precise therapeutic drug monitoring—understanding the comparative strengths and limitations of these techniques is paramount for researchers and drug development professionals. UV-Vis spectrophotometry measures the amount of discrete wavelengths of UV or visible light absorbed by or transmitted through a sample, providing information on sample composition and concentration [6]. This technique operates on the principle that molecules absorb light in the ultraviolet (UV) and visible (vis) regions of the electromagnetic spectrum, with measurements based on the Beer-Lambert law [7]. In contrast, HPLC separates mixture components through a column under high pressure before detection, typically using UV absorption, offering superior separation capabilities at the cost of increased complexity and operational expenses.
The selection between these methodologies for antibiotic analysis involves careful consideration of multiple factors, including required sensitivity, sample complexity, available resources, and desired throughput. This guide provides an objective comparison of UV-Vis spectrophotometry and HPLC, specifically framing their performance characteristics within levofloxacin quantification research. By examining fundamental principles, experimental data, and practical applications, we aim to equip scientists with the necessary information to make informed methodological choices for pharmaceutical analysis projects involving fluoroquinolone antibiotics and similar compounds.
Fundamental Principles and Instrumentation
Principles of UV-Vis Spectrophotometry
UV-Vis spectroscopy functions as an analytical technique that measures the amount of discrete wavelengths of UV or visible light absorbed by or transmitted through a sample in comparison to a reference or blank sample [6]. This measurement provides insights into sample composition and concentration. The technique operates on the Beer-Lambert law, which states that the absorbance of light by a substance is directly proportional to its concentration and the path length of the light through the sample [7]. The mathematical expression of this fundamental relationship is A = εcl, where A represents absorbance, ε is the molar absorptivity or extinction coefficient, c denotes concentration, and l signifies the path length [7] [8].
The underlying physical mechanism involves light energy promoting electrons in a substance to higher energy states. The specific amount of energy required for these electronic transitions varies depending on the molecular structure and bonding environment of different substances, explaining why absorption occurs at characteristic wavelengths for different compounds [6]. Human-visible light spans approximately 380 nm (violet) to 780 nm (red), while UV light encompasses wavelengths from approximately 100 nm to 380 nm [6]. When molecules contain chromophores—light-absorbing components such as aromatic rings or conjugated systems—they exhibit characteristic absorption patterns in these regions, enabling identification and quantification.
Key Instrumentation Components
A UV-Vis spectrophotometer consists of several essential components that work in concert to measure light absorption:
- Light source: Provides broad-wavelength illumination, typically using a single xenon lamp or dual lamps (deuterium for UV and tungsten/halogen for visible ranges) [6]
- Wavelength selector: Monochromators containing diffraction gratings (typically 1200-2000 grooves per mm) separate broad-wavelength light into specific wavelengths [6]
- Sample holder: Cuvettes (often quartz for UV transparency) hold samples during analysis [6] [8]
- Detector: Converts light intensity into electrical signals using photomultiplier tubes (PMT), photodiodes, or charge-coupled devices (CCD) [6]
The simplified diagram below illustrates how these components interact within a UV-Vis spectrophotometer:
For HPLC instrumentation, the configuration is substantially more complex, incorporating additional components for solvent delivery, sample introduction, separation, and detection. Key elements include high-pressure pumps, autosamplers or manual injectors, specialized chromatography columns (typically C18 for reversed-phase), and detectors (often UV-based). The mobile phase composition and gradient profile serve as critical parameters that must be optimized for each analyte, making HPLC method development more time-consuming than UV-Vis spectrophotometry.
Advantages of UV-Vis Spectrophotometry: Speed and Cost Efficiency
UV-Vis spectrophotometry offers distinct practical advantages that make it particularly valuable for pharmaceutical applications where rapid analysis and cost considerations are paramount. When specifically considering levofloxacin quantification research, these advantages translate into tangible benefits for screening studies, method development, and quality control applications.
Rapid Analysis Capabilities
The most significant advantage of UV-Vis spectrophotometry lies in its speed and efficiency. The technique enables almost immediate results after sample introduction, as it requires no separation step and involves minimal data processing for straightforward quantitative analysis [9]. This rapid analysis is particularly valuable in time-sensitive applications such as quality control in pharmaceutical manufacturing or high-throughput screening during drug development [9]. For levofloxacin analysis, this means multiple samples can be analyzed in quick succession, significantly accelerating research timelines compared to chromatographic methods.
Experimental data from pharmaceutical studies consistently demonstrates this speed advantage. In research comparing UV and HPLC methods for repaglinide quantification, authors noted the extreme simplicity of the UV approach, stating that "spectrophotometric method is very simple, as no reagent, pH adjustment or extraction technique is necessary" [10]. Similarly, in favipiravir analysis, the run time for the HPLC method was approximately 10 minutes per sample after method optimization, whereas UV-Vis analysis required only the time for a simple absorbance measurement [11]. This substantial difference in analysis time becomes particularly significant when processing large sample batches.
Cost-Effectiveness and Accessibility
From an economic perspective, UV-Vis spectrophotometry presents substantial advantages in both equipment acquisition and operational expenses. Basic UV-Vis spectrophotometers have a relatively affordable initial cost compared to other analytical instruments [9]. The technique is "much cheaper" than alternatives such as FTIR, HPLC, or GC [9], making it accessible to laboratories with limited budgets. This cost advantage extends beyond initial purchase to ongoing operational expenses, as UV-Vis requires less specialized training, consumes minimal solvents (often just a single diluent), and has lower maintenance requirements compared to HPLC systems.
The economic comparison between techniques is summarized in the table below:
Table 1: Cost and Speed Comparison Between UV-Vis and HPLC for Pharmaceutical Analysis
| Parameter | UV-Vis Spectrophotometry | HPLC | Experimental Evidence |
|---|---|---|---|
| Analysis Time | Seconds to minutes per sample | 10-60 minutes per sample | Favipiravir analysis: HPLC run time = 10 min [11] |
| Equipment Cost | Relatively affordable | Significantly higher | Described as "much cheaper" than HPLC [9] |
| Solvent Consumption | Minimal (dilution only) | High (mobile phase) | Repaglinide study: UV used only methanol [10] |
| Method Development | Rapid optimization | Time-consuming | Multiple parameters to optimize [11] |
Additional Practical Advantages
Beyond speed and cost, UV-Vis spectrophotometry offers several other beneficial characteristics for pharmaceutical analysis:
- Non-destructive nature: Samples remain unchanged after analysis, allowing for repeated measurements or subsequent analysis using other techniques [9] [7]. This is particularly valuable for precious or limited samples.
- High sensitivity and accuracy: Modern UV-Vis instruments can detect minute changes in absorbance, enabling accurate quantification even at low concentrations [9] [7].
- Simplicity of operation: Minimal training requirements compared to chromatographic techniques, reducing operator error and increasing accessibility [10].
- Versatility: Applicable to various sample types including solutions, suspensions, and solids through different measurement modalities [9].
For levofloxacin quantification specifically, recent advances in photoluminescence-spectroelectrochemistry (PL-SEC) have demonstrated how UV-based techniques can be adapted for challenging matrices like urine samples, achieving detection limits of 0.17 µM with high reproducibility (%RSD < 3.5%) [12]. This illustrates how fundamental UV principles can be enhanced to address specific analytical challenges in antibiotic quantification.
Inherent Limitations and Methodological Constraints
Despite its advantages in speed and cost, UV-Vis spectrophotometry presents significant limitations that researchers must consider when selecting an analytical method for levofloxacin quantification or similar pharmaceutical applications. Understanding these constraints is essential for appropriate method selection and interpreting results accurately.
Specificity Challenges in Complex Mixtures
A primary limitation of UV-Vis spectrophotometry is its relative lack of specificity when analyzing complex mixtures. The technique measures total absorbance at selected wavelengths without separating mixture components, which can lead to overlapping absorption bands from multiple substances [9]. In pharmaceutical formulations containing excipients, impurities, or degradation products—all common in real-world samples—these interfering compounds can absorb at similar wavelengths to the target analyte, resulting in inaccurate quantification [8].
This limitation becomes particularly problematic for levofloxacin analysis in biological matrices like urine or serum, where endogenous compounds such as uric acid may interfere with measurement [12]. While advanced techniques like photoluminescence-spectroelectrochemistry can address some specificity issues, conventional UV-Vis lacks inherent separation capabilities. Research on protein quantification similarly highlights that "interference from contaminants, such as nucleic acids, salts, and other impurities" represents a "primary challenge" for accurate UV-Vis measurements [8].
Sensitivity and Dynamic Range Constraints
UV-Vis spectrophotometry exhibits limitations in both sensitivity and dynamic range that may impact its suitability for certain pharmaceutical applications:
- Limited sensitivity: Direct UV absorbance measurements may fail to detect very low analyte concentrations, necessitating more sensitive techniques for trace analysis [8]. While techniques like fluorescence detection can enhance sensitivity, standard UV-Vis has higher detection limits compared to specialized HPLC detectors.
- Constrained dynamic range: The technique has a "rather limited dynamic range," meaning very high analyte concentrations may exceed the spectrophotometer's linear range, requiring sample dilution that introduces additional variability [8]. The optimal absorbance range for reliable quantification is typically 0.1-2.0 absorbance units [7].
- Path length dependence: Accuracy depends on consistent path length, with even minor variations in cuvette dimensions or positioning affecting results [6].
Experimental comparisons demonstrate these limitations quantitatively. In repaglinide analysis, the HPLC method showed a wider linear range (5-50 μg/mL) compared to UV spectrophotometry (5-30 μg/mL) [10]. Similarly, the favipiravir study found HPLC provided superior sensitivity, with lower detection and quantification limits than the UV method [11].
Sample-Related Limitations
The reliability of UV-Vis spectrophotometry is highly dependent on sample characteristics and preparation:
- Susceptibility to matrix effects: Turbidity or particulate matter can scatter light, adversely affecting absorbance measurements [9]. This necessitates careful sample preparation including filtration or clarification.
- Solvent restrictions: The chosen solvent must be transparent at the measurement wavelength and not react with the analyte [6]. For UV measurements below 200 nm, specialized equipment with argon gas purging is required as molecular oxygen absorbs in this region [6].
- Stray light interference: Imperfections in optical components can allow stray light to reach the detector without passing through the sample, distorting spectra and reducing measurement accuracy, particularly at low absorbance levels [9].
The table below summarizes key methodological limitations supported by experimental evidence:
Table 2: Limitations of UV-Vis Spectrophotometry Supported by Experimental Studies
| Limitation | Impact on Analysis | Experimental Evidence |
|---|---|---|
| Specificity Issues | Inaccurate quantification in mixtures | HPLC preferred for "high-resolution separation of components" [9] |
| Linear Range | Limited concentration range | Repaglinide: UV range 5-30 μg/mL vs. HPLC 5-50 μg/mL [10] |
| Sensitivity | Higher detection limits | Favipiravir: UV higher LOD/LOQ than HPLC [11] |
| Matrix Effects | Interference from contaminants | Protein analysis: nucleic acids, salts affect accuracy [8] |
Experimental Comparison: UV-Vis Spectrophotometry vs. HPLC
Direct methodological comparisons in pharmaceutical research provide valuable insights into the performance characteristics of UV-Vis spectrophotometry relative to HPLC. These experimental studies quantify differences in accuracy, precision, sensitivity, and linearity under controlled conditions, offering evidence-based guidance for method selection in levofloxacin quantification research.
Methodological Protocols for Drug Quantification
Standardized experimental protocols enable meaningful comparison between analytical techniques. For UV-Vis spectrophotometry, a typical methodology follows these steps:
- Standard solution preparation: A stock solution of the reference standard (e.g., 1000 μg/mL) is prepared in an appropriate solvent such as methanol or deionized water [10] [11]
- Calibration curve generation: The stock solution is diluted to multiple concentrations within the expected linear range (typically 5-50 μg/mL) [10]
- Wavelength selection: The maximum absorption wavelength (λmax) is determined by scanning standards across the UV spectrum (e.g., 200-400 nm) [10]
- Sample preparation: Tablet formulations are weighed, powdered, dissolved, sonicated, filtered, and diluted to appropriate concentrations [10] [11]
- Measurement and quantification: Absorbance is measured against a blank, and sample concentration is calculated using the calibration curve [10]
For HPLC analysis, the methodology includes additional separation steps:
- Mobile phase preparation: Optimized composition (e.g., methanol-water mixtures, often with pH adjustment) is filtered and degassed [10] [11]
- Chromatographic conditions: Specific column (typically C18), flow rate (e.g., 1.0 mL/min), and detection wavelength are established [10] [11]
- System suitability testing: Parameters including tailing factor, theoretical plates, and retention time reproducibility are verified [11]
- Sample analysis: Extracted samples are injected, and peak areas are used for quantification against the calibration curve [11]
The following workflow diagram illustrates the key steps in both methodologies:
Comparative Experimental Data
Experimental studies directly comparing UV-Vis and HPLC methods provide quantitative performance data. In repaglinide analysis, both methods demonstrated excellent linearity (r² > 0.999) within their respective concentration ranges [10]. The HPLC method showed superior precision (%R.S.D. < 1.50 for HPLC vs. <2.0 for UV) and marginally better accuracy (mean recoveries 99.71-100.25% for HPLC vs. 99.63-100.45% for UV) [10]. Similarly, favipiravir research confirmed that "liquid chromatographic is a more widespread method in quality control laboratories" due to higher sensitivity and accuracy, though acknowledging that "spectrophotometric method is very simple" [11].
These findings consistently demonstrate that while HPLC generally provides superior analytical performance in terms of specificity, sensitivity, and precision, UV-Vis spectrophotometry offers adequate performance for many quality control applications with significantly simpler operation and faster analysis times. For levofloxacin quantification, the choice between techniques should be guided by specific application requirements—with UV-Vis sufficient for routine quality checks of pure formulations, while HPLC remains necessary for complex biological matrices or when metabolite interference is anticipated.
Essential Research Toolkit for UV-Vis Spectrophotometry
Implementing reliable UV-Vis spectrophotometry for pharmaceutical analysis requires specific reagents, equipment, and methodologies. The following research toolkit summarizes essential components for levofloxacin quantification studies, drawing from validated experimental approaches across multiple drug compounds.
Table 3: Research Reagent Solutions and Essential Materials for UV-Vis Pharmaceutical Analysis
| Item | Function/Purpose | Specifications/Examples |
|---|---|---|
| UV-Vis Spectrophotometer | Primary measurement instrument | Double-beam configuration preferred; wavelength range 190-1100 nm [10] |
| Quartz Cuvettes | Sample containment for UV measurements | 1 cm path length standard; high UV transparency [6] [8] |
| Reference Standard | Calibration and method validation | High-purity analyte (e.g., levofloxacin ≥98%) [10] [11] |
| Solvents | Sample dissolution and dilution | Methanol, deionized water; UV-transparent grades [10] [11] |
| pH Adjustment Reagents | Mobile phase modification (if needed) | Orthophosphoric acid, acetic acid for buffer preparation [10] [11] |
| Filtration Apparatus | Sample clarification | 0.22 μm membrane filters, syringe filters [11] |
| Volumetric Equipment | Precise solution preparation | Class A volumetric flasks, pipettes [10] |
| Software | Data acquisition and processing | Instrument-specific programs for spectrum analysis [10] |
This toolkit provides the foundation for establishing validated UV-Vis methods for levofloxacin quantification. For enhanced reliability, researchers should incorporate orthogonal methods such as HPLC with UV or mass spectrometric detection to verify results, particularly when analyzing complex samples [8]. Additionally, proper method validation following ICH guidelines—assessing linearity, precision, accuracy, specificity, LOD, LOQ, and robustness—is essential for generating reliable, reproducible data suitable for pharmaceutical research and quality control [10] [11].
UV-Vis spectrophotometry remains an indispensable analytical technique in pharmaceutical research, offering compelling advantages in speed, cost-effectiveness, and operational simplicity that make it particularly valuable for screening studies and routine quality control of formulations. The technique's foundation in the Beer-Lambert law provides a straightforward relationship between absorbance and concentration that facilitates rapid method development and implementation [6] [7]. For levofloxacin quantification specifically, UV-Vis methods can deliver adequate performance for pure formulations and standardized samples, enabling efficient analysis with minimal resource investment.
However, the inherent limitations of UV-Vis spectrophotometry—particularly regarding specificity in complex matrices, sensitivity constraints, and susceptibility to interference—necessitate careful consideration of application requirements [9] [8]. When analyzing levofloxacin in biological samples or complex formulations, HPLC provides superior separation capabilities, specificity, and sensitivity despite higher operational costs and longer analysis times [10] [11]. The experimental data consistently demonstrates that methodological selection represents a trade-off between efficiency and comprehensive analytical performance.
For researchers and drug development professionals working with levofloxacin and similar fluoroquinolone antibiotics, a strategic approach combining both techniques may offer optimal efficiency and reliability. UV-Vis spectrophotometry serves as an excellent screening tool for rapid analysis during method development and formulation studies, while HPLC provides definitive quantification for complex matrices and regulatory submissions. This balanced methodology leverages the respective strengths of both techniques while mitigating their limitations, advancing both efficiency and accuracy in pharmaceutical analysis.
In the field of pharmaceutical research and drug development, the accurate quantification of active compounds is paramount. For researchers and drug development professionals, the choice of analytical methodology can significantly impact the reliability of data, particularly when investigating complex drug delivery systems or monitoring residue depletion. Levofloxacin, a broad-spectrum fluoroquinolone antibiotic, serves as an excellent model compound for comparing two fundamental analytical techniques: High-Performance Liquid Chromatography (HPLC) and Ultraviolet-Visible Spectrophotometry (UV-Vis). While both methods are employed for drug quantification, they differ substantially in their separation power, specificity, and sensitivity—attributes that directly influence their appropriateness for specific research applications.
The critical distinction emerges from HPLC's ability to separate the target analyte from complex matrices and potential degradation products, whereas UV-Vis provides a composite measurement of all UV-absorbing species in a sample. This comparison guide objectively examines the performance characteristics of both techniques through experimental data, providing scientists with evidence-based insights for method selection in levofloxacin quantification research and broader pharmaceutical applications.
Methodological Principles and Technical Foundations
Fundamental Operating Principles
High-Performance Liquid Chromatography (HPLC) operates on the principle of separating compounds through differential partitioning between a mobile phase (liquid solvent) and a stationary phase (column packing material). The separation mechanism involves multiple interactive forces, including hydrophobic interactions, hydrogen bonding, and ionic interactions, depending on the column chemistry and mobile phase composition. For levofloxacin analysis, reversed-phase C18 columns are typically employed, where the non-polar stationary phase interacts with hydrophobic regions of the analyte molecule, while the polar mobile phase (often a mixture of aqueous buffer and organic solvent) facilitates elution. The detection is typically accomplished using UV detectors at wavelengths specific to levofloxacin (290-295 nm), providing both separation and selective detection.
Ultraviolet-Visible Spectrophotometry (UV-Vis) measures the absorption of ultraviolet or visible light by molecules in solution at specific wavelengths. When molecules contain chromophores (functional groups that absorb UV or visible light), electrons transition from ground state to excited states upon irradiation. Levofloxacin, with its aromatic quinoline structure, exhibits strong UV absorption at approximately 292 nm. However, UV-Vis lacks separation capability and measures the total absorbance of all chromophores in the sample path, which can lead to interference from complex matrices or degradation products.
Advanced UV-Vis Techniques
Derivative UV-spectrophotometry represents an enhancement to conventional UV-Vis methods, utilizing first to higher-order derivatives of absorbance with respect to wavelength for analysis. This technique provides both qualitative and quantitative information from spectra with overlapping bands. Even-order derivatives exhibit strong negative or positive bands with minima or maxima at the same wavelength as the absorbance band's maximum, with the number of observed bands being one more than the derivative order. The "peak-zero" (P—O) and "peak-peak" (P—P) techniques enable measurement of amplitudes from derivative spectra for quantification, offering improved sensitivity and selectivity in the determination of drugs like levofloxacin, norfloxacin, and moxifloxacin [13].
Experimental Comparison: HPLC versus UV-Vis for Levofloxacin Quantification
Performance Characteristics in Controlled Studies
A direct comparison study evaluating both methods for assessing levofloxacin released from mesoporous silica microspheres/nano-hydroxyapatite composite scaffolds revealed significant differences in performance metrics. The research established standard curves for both techniques across a concentration range of 0.05-300 µg/mL, with the regression equation for HPLC being y=0.033x+0.010 (R²=0.9991), compared to y=0.065x+0.017 (R²=0.9999) for UV-Vis [1] [14].
Table 1: Method Validation Parameters for Levofloxacin Quantification
| Parameter | HPLC Method | UV-Vis Method | Experimental Conditions |
|---|---|---|---|
| Linear Range | 0.05-300 µg/mL | 0.05-300 µg/mL | Simulated Body Fluid |
| Regression Equation | y = 0.033x + 0.010 | y = 0.065x + 0.017 | Standard curve |
| Correlation Coefficient (R²) | 0.9991 | 0.9999 | |
| Recovery (Low Concentration: 5 µg/mL) | 96.37 ± 0.50% | 96.00 ± 2.00% | n ≥ 3 |
| Recovery (Medium Concentration: 25 µg/mL) | 110.96 ± 0.23% | 99.50 ± 0.00% | n ≥ 3 |
| Recovery (High Concentration: 50 µg/mL) | 104.79 ± 0.06% | 98.67 ± 0.06% | n ≥ 3 |
The recovery data demonstrates that UV-Vis provided more consistent recovery rates across concentration levels (96.00-99.50%), whereas HPLC showed greater variability (96.37-110.96%) in this particular study [1]. This anomaly in HPLC recovery, particularly at medium and high concentrations, may reflect matrix effects in the complex composite scaffold environment rather than inherent method inadequacy.
Specificity and Interference Challenges
The critical advantage of HPLC emerges in complex matrices where multiple components may interfere with accurate quantification. In drug delivery systems like mesoporous silica microspheres/nano-hydroxyapatite composite scaffolds, several components can co-elute or absorb at similar wavelengths, compromising UV-Vis accuracy. The study concluded that "it is not accurate to measure the concentration of drugs loaded on the biodegradable composite composites by UV-Vis" and designated "HPLC as the preferred method to evaluate sustained release characteristics of Levofloxacin" in such complex systems [1] [14].
Degradation presents another challenge where HPLC demonstrates superior specificity. Research has identified that levofloxacin undergoes daylight-mediated degradation to levofloxacin N-oxide, particularly in infusion solutions like 0.9% NaCl, 5% glucose, and Ringer's solution [15]. This degradation product, detected at m/z 378 via LC-MS analysis (compared to m/z 362 for intact levofloxacin), forms regardless of the solvent used when exposed to daylight. HPLC successfully separates this degradation product from the parent compound, whereas UV-Vis cannot distinguish between them, potentially leading to overestimation of active drug concentration.
Detailed Experimental Protocols
HPLC Method for Levofloxacin Quantification
Equipment and Conditions:
- Chromatograph: Shimadzu liquid chromatograph with model LC-2010AHT gradient pump, CBM-20A system controller, and Shimadzu CLASS-VP UV-Visible detector [1]
- Column: Sepax BR-C18 column (250×4.6 mm; 5 µm particle diameter) [1]
- Column Temperature: 40°C [1]
- Mobile Phase: 0.01 mol/L KH₂PO₄, methanol, and 0.5 mol/L tetrabutylammonium hydrogen sulphate in proportion of 75:25:4 [1]
- Flow Rate: 1 mL/min [1]
- Detection Wavelength: 290 nm [1]
- Injection Volume: 10-20 µL [1]
Sample Preparation:
- Prepare standard levofloxacin solution (3 mg/mL) in simulated body fluid [1]
- Add 10 µL of levofloxacin standard solutions to 100 µL blank simulated body fluid [1]
- Add 10 µL ciprofloxacin (500 µg/mL) as internal standard [1]
- Vortex-mix for 5 minutes [1]
- Add 800 µL dichloromethane and vortex-mix for additional 5 minutes [1]
- Centrifuge at 7,155 × g for 5 minutes at 25°C [1]
- Extract 750 µL of supernatant and dry with nitrogen in a 50°C water bath [1]
- Reconstitute in appropriate solvent for injection [1]
Validation Parameters: A validated reversed-phase HPLC-UV method for levofloxacin hemihydrate determination demonstrated specificity with a retention time of 7.66 minutes, linearity in the range of 4.8-29.04 µg/mL, and all validation criteria (specificity, linearity, accuracy, precision, LOD, LOQ, robustness) within acceptable ranges [2].
UV-Vis Method for Levofloxacin Quantification
Equipment and Conditions:
- Spectrophotometer: UV-2600 UV-Vis spectrophotometer or equivalent [1]
- Wavelength: 292 nm [16]
- Solvent System: Water:methanol:acetonitrile (9:0.5:0.5) [16]
Sample Preparation:
- Prepare standard levofloxacin solution in selected solvent system [16]
- Dilute samples to fall within linear range of 1.0-12.0 μg/mL [16]
- Measure absorbance against blank solvent at 292 nm [16]
Method Validation: The UV-Vis method demonstrated linearity in the range of 1.0-12.0 μg/mL with a correlation coefficient (R²) of 0.9998 and mean recovery of 99.00-100.07% [16]. This method has been successfully applied to the determination of levofloxacin content in commercial formulations, with results in good agreement with label claims [16].
Applications in Research Contexts
Complex Drug Delivery Systems
In advanced drug delivery research, such as levofloxacin-loaded mesoporous silica microspheres/nano-hydroxyapatite composite scaffolds, HPLC provides critical advantages for characterizing sustained release profiles. The composite scaffolds contain multiple components including mesoporous silica nanoparticles, nano-hydroxyapatite particles, and polyurethane matrix, all of which can interfere with UV-Vis measurements but are effectively separated by HPLC [1]. This separation capability enables accurate determination of drug release kinetics from these sophisticated delivery systems, essential for predicting in vivo performance.
Drug Stability and Degradation Studies
HPLC's superiority extends to stability studies where degradation products must be monitored. Research has demonstrated that levofloxacin undergoes degradation to levofloxacin N-oxide when exposed to daylight in various infusion solutions [15]. The HPLC method successfully resolved this degradation product from the parent compound, enabling quantitative assessment of decomposition rates. In contrast, UV-Vis would measure combined absorbance, failing to distinguish active compound from degradation products. This capability is crucial for establishing proper storage conditions and shelf life for pharmaceutical formulations.
Residue Analysis in Biological Matrices
For pharmacological evaluation of drug residue depletion, such as monitoring levofloxacin residues in broiler chicken tissues, HPLC represents the gold standard. A recent study utilized validated HPLC methods to quantify levofloxacin depletion from liver, kidney, and breast muscle, determining appropriate withdrawal periods to ensure food safety [17]. The method effectively measured residues in complex biological matrices, addressing significant public health concerns regarding antibiotic residues in food products.
Research Reagent Solutions
Table 2: Essential Research Reagents for Levofloxacin Analysis
| Reagent/Material | Function/Application | Specifications/Alternatives |
|---|---|---|
| Levofloxacin Reference Standard | Method calibration and quantification | National Institutes for Food and Drug Control (cat. no. 130455-201106) [1] |
| Ciprofloxacin | Internal standard for HPLC | Sigma-Aldrich (cat no. 17850-5G-F) [1] |
| Methanol (HPLC-grade) | Mobile phase component, solvent | HPLC-grade with low UV cutoff [1] |
| Tetrabutylammonium Bromide | Ion-pair reagent in mobile phase | Analytically pure; enhances separation [1] |
| Simulated Body Fluid (SBF) | Release medium for dissolution studies | Mimics physiological conditions [1] |
| KH₂PO₄ | Buffer component for mobile phase | 0.01 mol/L in mobile phase [1] |
| Sepax BR-C18 Column | Stationary phase for separation | 250×4.6 mm; 5 µm particle diameter [1] |
| Acetonitrile (HPLC-grade) | Alternative organic mobile phase | Used in RP-HPLC methods (17:3:80 with methanol:phosphate buffer) [2] |
Method Selection Workflow
Diagram 1: Analytical Method Selection Workflow for Levofloxacin Quantification
Both HPLC and UV-Vis spectrophotometry have distinct positions in the analytical toolkit for pharmaceutical research. UV-Vis offers advantages of simplicity, rapid implementation, and cost-effectiveness for routine quality control of simple formulations where specificity is not compromised. However, for research applications involving complex drug delivery systems, biological matrices, stability studies, or precise pharmacokinetic investigations, HPLC provides indispensable separation power, specificity, and accurate quantification.
The experimental data demonstrates that while UV-Vis may show excellent linearity and recovery in controlled conditions, these performance metrics can be compromised in complex research scenarios. HPLC emerges as the unequivocal choice for method-sensitive applications where reliable separation from interfering compounds or degradation products is essential. As pharmaceutical research advances toward more complex drug delivery systems and regulatory requirements for specificity intensify, HPLC continues to provide the separation power, specificity, and sensitivity required for robust scientific investigation.
The accurate quantification of levofloxacin, a broad-spectrum fluoroquinolone antibiotic, is fundamental to pharmaceutical quality control, therapeutic drug monitoring, and environmental surveillance. Researchers and analysts primarily rely on two analytical techniques for this purpose: Ultraviolet-Visible spectrophotometry (UV-Vis) and High-Performance Liquid Chromatography (HPLC). While both methods are well-established, their performance characteristics, applicability, and reliability vary significantly across different sample matrices and analytical requirements. This guide provides an objective comparison of UV-Vis and HPLC methods for levofloxacin quantification, supported by experimental data, to help researchers select the optimal technique for specific workflows in drug development, clinical analysis, and environmental monitoring.
Technical Comparison: UV-Vis vs. HPLC for Levofloxacin Analysis
The fundamental differences between UV-Vis and HPLC methodologies stem from their operating principles, which directly influence their application scope and performance.
UV-Vis Spectrophotometry measures the absorption of ultraviolet or visible light by a sample, relying on the Beer-Lambert law which states that absorbance is proportional to concentration. For levofloxacin, the typical absorption maximum (λmax) is around 290-295 nm [2] [1]. This method is valued for its operational simplicity, rapid analysis time, and lower instrumental costs. However, its major limitation is lack of specificity in complex mixtures, as it cannot distinguish between levofloxacin and other UV-absorbing compounds that may be present in the sample [18] [1].
HPLC, particularly Reverse-Phase HPLC (RP-HPLC), separates components in a mixture before quantification. Levofloxacin analysis typically uses a C18 column with a mobile phase consisting of aqueous buffers (often phosphate buffer at pH ~3) mixed with organic modifiers like acetonitrile or methanol [2] [1]. Detection is commonly performed with UV detectors at 290-295 nm [1]. The key advantage of HPLC is its superior selectivity and specificity, achieved through chromatographic separation that isolates levofloxacin from interfering substances, making it suitable for complex sample matrices [1] [14].
The following workflow diagrams illustrate the typical processes for both techniques in levofloxacin analysis:
Levofloxacin Analysis Workflow: UV-Vis vs. HPLC
Performance Data Comparison
Direct comparative studies reveal significant differences in the performance characteristics of UV-Vis and HPLC methods for levofloxacin quantification across various parameters.
Table 1: Direct Comparison of UV-Vis and HPLC for Levofloxacin Analysis in Drug Delivery Systems [1] [14]
| Parameter | UV-Vis Method | HPLC Method |
|---|---|---|
| Linear Range | 0.05-300 µg/mL | 0.05-300 µg/mL |
| Regression Equation | y = 0.065x + 0.017 | y = 0.033x + 0.010 |
| Correlation Coefficient (R²) | 0.9999 | 0.9991 |
| Recovery (Low Concentration) | 96.00 ± 2.00% | 96.37 ± 0.50% |
| Recovery (Medium Concentration) | 99.50 ± 0.00% | 110.96 ± 0.23% |
| Recovery (High Concentration) | 98.67 ± 0.06% | 104.79 ± 0.06% |
| Precision (RSD) | <2% | <2% |
Table 2: Advanced UV-Based Techniques for Complex Matrices [18] [19]
| Parameter | SPE-UV-Dual Wavelength Method |
|---|---|
| Application | Treated medical wastewater |
| Linear Range | 10-1000 ng/mL |
| Correlation Coefficient (R²) | 0.9984 |
| Limit of Detection (LOD) | 2.95 ng/mL |
| Precision (Intra-day RSD) | 2.49% |
| Precision (Inter-day RSD) | 0.31% |
| Recovery in Spiked Wastewater | 76.8-87.8% |
Table 3: Validated RP-HPLC Method for Pharmaceutical Formulations [2]
| Parameter | RP-HPLC Method |
|---|---|
| Linear Range | 4.8-29.04 µg/mL |
| Retention Time | 7.66 minutes |
| Mobile Phase | ACN:MeOH:Phosphate buffer (17:3:80), pH 3 |
| Flow Rate | 1 mL/min |
| Detection Wavelength | 295 nm |
Key Experimental Protocols
HPLC Method for Levofloxacin in Pharmaceutical Formulations
This validated RP-HPLC method is suitable for quantifying levofloxacin hemihydrate in ocular polymeric nanoparticles and other dosage forms [2]:
- Apparatus: HPLC system with UV detector
- Column: C18 analytical column (250 × 4.6 mm, 5 µm particle size)
- Mobile Phase: Acetonitrile:methanol:phosphate buffer pH 3 (17:3:80, v/v/v)
- Flow Rate: 1.0 mL/min
- Detection Wavelength: 295 nm
- Injection Volume: 10-20 µL
- Column Temperature: Ambient or controlled at 40°C
- Sample Preparation: Dissolve appropriate amount of sample in mobile phase, filter through 0.45 µm membrane
- Validation Parameters: Specificity, linearity, accuracy, precision, LOD, LOQ, and robustness were validated according to ICH guidelines
Solid-Phase Extraction with Dual Wavelength UV Analysis for Wastewater
This innovative approach enhances the specificity of UV analysis for complex environmental samples [18] [19]:
- Sample Preparation: Pre-concentrate and purify levofloxacin from wastewater using HLB solid-phase extraction cartridges
- SPE Sorbent: Hydrophilic-Lipophilic Balance (HLB) cartridge, which shows excellent recovery (60.5-103.3%) over wide pH range compared to C18 (<40% recovery)
- Dual Wavelength Measurement: Measure absorbance at 295 nm and 379 nm
- Calculation: Apply dual-wavelength equation to determine levofloxacin concentration while correcting for interference from tetracycline, which has equal absorbance at both wavelengths
- Method Performance: LOD of 2.95 ng/mL with intra-day and inter-day precision of 2.49% and 0.31% RSD, respectively
Research Reagent Solutions
The following reagents and materials are essential for implementing the described levofloxacin quantification methods:
Table 4: Essential Research Reagents and Materials
| Reagent/Material | Function/Application | Specifications/Notes |
|---|---|---|
| Levofloxacin Reference Standard | Primary standard for calibration | High purity grade (>90%) from certified suppliers |
| Methanol (HPLC Grade) | Mobile phase component, sample solvent | Low UV absorbance, high purity |
| Acetonitrile (HPLC Grade) | Mobile phase component | Low UV absorbance, high purity |
| Phosphate Buffer (pH 3) | Mobile phase component | Adjust with orthophosphoric acid |
| HLB Solid-Phase Extraction Cartridges | Sample pre-concentration and clean-up | Superior to C18 for broad pH range applications |
| C18 Chromatography Column | Stationary phase for HPLC separation | 250 × 4.6 mm, 5 µm particle size recommended |
| Simulated Body Fluid (SBF) | Release studies medium | For drug delivery system evaluations |
| Tetrabutylammonium Hydrogen Sulphate | Ion-pairing reagent for HPLC | Enhances separation of polar compounds |
| Formic Acid | Mobile phase additive | Improves peak shape in HPLC |
Application-Based Method Selection
The choice between UV-Vis and HPLC for levofloxacin analysis depends primarily on the sample matrix, required specificity, and available resources. The following decision pathway provides guidance for selecting the appropriate method:
Levofloxacin Method Selection Guide
Recommended Applications for UV-Vis Methods
- Quality control of raw materials and simple formulations where levofloxacin is the primary UV-absorbing component [20]
- Routine analysis in resource-limited settings where HPLC instrumentation is unavailable or impractical
- Preliminary screening before more specific chromatographic analysis
- Educational and training laboratories where method simplicity is advantageous
- High-throughput analysis of large sample numbers when specificity is not critical
Recommended Applications for HPLC Methods
- Complex pharmaceutical formulations including sustained-release systems, implants, and combination products [1] [14]
- Biological fluids (serum, plasma) for therapeutic drug monitoring and pharmacokinetic studies [1]
- Environmental samples (wastewater, surface water) where multiple interfering compounds are present [18]
- Stability studies and forced degradation experiments where separation from degradation products is essential [2]
- Regulatory submissions and method validation requiring high specificity and reliability
- Research applications where accurate speciation and quantification are critical
The selection between UV-Vis and HPLC for levofloxacin quantification requires careful consideration of analytical requirements, sample complexity, and available resources. UV-Vis spectrophotometry offers advantages in simplicity, cost-effectiveness, and rapid analysis for straightforward samples, while HPLC provides superior specificity, accuracy, and sensitivity for complex matrices. Recent advancements, such as solid-phase extraction coupled with dual-wavelength detection, have enhanced the capability of UV-based methods for environmental monitoring. However, for most pharmaceutical applications involving complex formulations or biological matrices, HPLC remains the gold standard due to its proven reliability, specificity, and ability to separate levofloxacin from interfering compounds. Researchers should align their method selection with their specific analytical needs, considering both technical requirements and practical constraints to ensure accurate and reliable levofloxacin quantification.
From Theory to Practice: Implementing HPLC and UV-Vis Methods for Levofloxacin in Real-World Samples
Within pharmaceutical research and quality control, the accurate quantification of active pharmaceutical ingredients like levofloxacin, a broad-spectrum fluoroquinolone antibiotic, is paramount. The selection of an appropriate analytical technique is a fundamental decision that directly impacts the reliability of data, particularly when investigating complex formulations such as drug-eluting scaffolds or polymeric nanoparticles. This guide provides a detailed, data-driven comparison of High-Performance Liquid Chromatography (HPLC) and Ultraviolet-Visible (UV-Vis) spectrophotometry for levofloxacin analysis. We present optimized HPLC protocols and objectively evaluate the performance of both methods based on experimental data, framing the discussion within the broader context of selecting the right analytical tool for specific research applications.
Analytical Method Comparison: HPLC vs. UV-Vis
The choice between HPLC and UV-Vis spectrophotometry hinges on the specific requirements of the analysis, including the sample complexity, required specificity, and desired throughput. The following table summarizes the core characteristics of each method.
Table 1: Fundamental Comparison of HPLC and UV-Vis for Levofloxacin Analysis
| Feature | HPLC (High-Performance Liquid Chromatography) | UV-Vis (Ultraviolet-Visible Spectrophotometry) |
|---|---|---|
| Core Principle | Separation of components followed by detection | Direct measurement of absorbance without separation |
| Selectivity | High; can separate levofloxacin from impurities, degradation products, and complex matrices [21] | Low; measures total absorbance, which can be interfered with by other UV-absorbing substances [1] |
| Data Output | Chromatogram (retention time, peak area) | Absorbance spectrum (absorbance at specific λ_max) |
| Key Strength | Accurate quantification in complex samples and stability studies [1] [21] | Rapid, simple, and cost-effective for pure samples [22] |
| Typical Analysis Time | Longer (per sample) | Shorter (per sample) |
| Cost | Higher (instrumentation, solvents, columns) | Lower |
A direct comparative study highlights the practical implications of these fundamental differences. When assessing levofloxacin released from a sophisticated mesoporous silica/nano-hydroxyapatite composite scaffold, HPLC demonstrated superior accuracy in recovery experiments compared to UV-Vis [1] [23].
Table 2: Experimental Recovery Rate Data from a Comparative Study [1]
| Levofloxacin Concentration | HPLC Recovery Rate (%) | UV-Vis Recovery Rate (%) |
|---|---|---|
| Low (5 µg/mL) | 96.37 ± 0.50 | 96.00 ± 2.00 |
| Medium (25 µg/mL) | 110.96 ± 0.23 | 99.50 ± 0.00 |
| High (50 µg/mL) | 104.79 ± 0.06 | 98.67 ± 0.06 |
The data shows that while both methods performed adequately at low concentrations, HPLC provided more consistent precision (evidenced by smaller standard deviations), and its accuracy was more robust across different concentration levels in a complex sample matrix. The study concluded that HPLC is the preferred method for evaluating the sustained-release characteristics from such composite scaffolds [1].
Optimized HPLC Protocols for Levofloxacin
This section provides specific, validated protocols for the HPLC analysis of levofloxacin, drawn from recent research.
Standard RP-HPLC Protocol for Ocular Nano-Formulations
This method has been validated for determining levofloxacin hemihydrate (LEVH) in ocular polymeric nanoparticles [2] [24].
- *Column:* Luna Phenomenex C18 (250 × 4.6 mm; 5 µm)
- *Mobile Phase:* Acetonitrile:Methanol:Phosphate Buffer (pH 3.0) in a ratio of 17:3:80 (v/v/v) [2] [24]
- *Flow Rate:* 1.0 mL/min
- *Detection Wavelength:* 295 nm
- *Injection Volume:* 20 µL
- *Retention Time:* ~7.66 minutes [2]
- *Linearity Range:* 4.8 - 29.04 µg/mL [2]
HPLC Protocol for Complex Drug-Delivery Scaffolds
This method was used successfully to analyze levofloxacin released from mesoporous silica microspheres/nano-hydroxyapatite composite scaffolds [1].
- *Column:* Sepax BR-C18 (250 × 4.6 mm; 5 µm)
- *Mobile Phase:* 0.01 mol/L KH₂PO₄ : Methanol : 0.5 mol/L Tetrabutylammonium Hydrogen Sulphate (75:25:4)
- *Flow Rate:* 1.0 mL/min
- *Detection Wavelength:* 290 nm
- *Column Temperature:* 40°C
- *Internal Standard:* Ciprofloxacin [1]
- *Linearity Range:* 0.05 - 300 µg/mL [1]
Table 3: Compendium of Validated HPLC Parameters for Levofloxacin
| Parameter | Protocol A [2] [24] | Protocol B [1] | Protocol C [25] | Protocol D [26] |
|---|---|---|---|---|
| Column | C18 (250 x 4.6 mm, 5µm) | C18 (250 x 4.6 mm, 5µm) | BDS Hypersil C18 (100 x 4.6 mm, 2.4µm) | C18 (Not Specified) |
| Mobile Phase | ACN:MeOH:Phosphate Buffer (17:3:80, pH 3) | Phosphate Buffer:MeOH:Ion-Pair (75:25:4) | MeOH:Phosphate Buffer (28:72, pH 3) | ACN:MeOH:Phosphate Buffer (15:25:60) |
| Flow Rate | 1.0 mL/min | 1.0 mL/min | 1.0 mL/min | 1.0 mL/min |
| Detection (λ) | 295 nm | 290 nm | Not Specified | 287 nm (UV), FLD (300/500 nm) |
| Retention Time | ~7.66 min | Not Specified | Not Specified | Not Specified |
Complementary UV-Vis Spectrophotometric Method
For situations where sample complexity is low and high throughput is a priority, a validated UV-Vis method can be a suitable alternative.
- *Solvent/Diluent:* Water:Methanol:Acetonitrile (9:0.5:0.5 v/v) [22]
- *Wavelength (λ_max):* 292 nm [22]
- *Linearity Range:* 1.0 - 12.0 µg/mL [22]
- *Correlation Coefficient (R²):* >0.999 [22]
- *Validation:* The method has been validated for precision, accuracy, and specificity, demonstrating excellent mean recovery of 99.00-100.07% for pharmaceutical dosage forms [22].
Workflow and Method Selection Guide
The following diagram illustrates the decision-making process for selecting the appropriate analytical method and the subsequent workflow for HPLC analysis, which is detailed in the protocols above.
The Scientist's Toolkit: Essential Research Reagents and Materials
A successful analytical method relies on high-quality, specific reagents and materials. The following table lists key components used in the featured levofloxacin protocols.
Table 4: Essential Research Reagents and Materials for Levofloxacin Analysis
| Reagent/Material | Function in the Analysis | Example from Protocols |
|---|---|---|
| C18 Chromatography Column | The stationary phase for reverse-phase separation; its carbon chain provides the hydrophobic surface for analyte interaction. | Luna Phenomenex C18 (250 x 4.6 mm; 5 µm) [2], Sepax BR-C18 [1] |
| Acetonitrile (HPLC Grade) | Organic modifier in the mobile phase; reduces analyte retention time by competing for stationary phase sites. | Used in ACN:MeOH:Buffer (17:3:80) [2] |
| Methanol (HPLC Grade) | Organic modifier in the mobile phase; can be used alongside or instead of acetonitrile. | Used in Phosphate Buffer:MeOH (75:25) [1] |
| Phosphate Buffer (pH 3) | Aqueous component of the mobile phase; low pH suppresses ionization of acidic/basic analytes, controlling retention. | 25 mM Phosphate Buffer, pH 3.0 [2] [25] |
| Tetrabutylammonium Salt | Ion-pairing reagent; interacts with ionic analytes to improve peak shape and separation for charged molecules. | Tetrabutylammonium hydrogen sulphate [1] |
| Levofloxacin Hemihydrate RS | Reference Standard (RS); a highly characterized material with known purity, used for accurate calibration. | National Institutes for Food and Drug Control [1] |
| Ciprofloxacin | Internal Standard; added in a constant amount to samples and standards to correct for procedural losses/variability. | Used as an internal standard in HPLC analysis [1] |
The choice between HPLC and UV-Vis spectrophotometry for levofloxacin quantification is not a matter of one method being universally superior, but rather of selecting the right tool for the specific research context. UV-Vis spectrophotometry offers a rapid, economical, and straightforward solution for the analysis of levofloxacin in pure bulk materials or simple pharmaceutical formulations where interference is not a concern. In contrast, HPLC provides the necessary selectivity, accuracy, and robustness for complex scenarios, including stability-indicating assays, analysis in sophisticated drug-delivery systems like polymeric nanoparticles or composite scaffolds, and any situation where specificity is critical. The optimized HPLC protocols detailed herein, particularly those utilizing C18 columns with acidic phosphate buffer-acetonitrile mobile phases and detection at 290-295 nm, provide a validated foundation for reliable levofloxacin quantification in demanding research applications.
In pharmaceutical research and quality control, selecting the appropriate analytical technique is paramount for accurate drug quantification. Ultraviolet-Visible (UV-Vis) spectroscopy serves as a fundamental tool for characterizing molecular properties and determining concentrations in solution. This guide objectively compares UV-Vis spectroscopy with High-Performance Liquid Chromatography (HPLC) within the context of levofloxacin quantification research, providing standardized methodologies for wavelength selection and sample preparation. Understanding the relative strengths and limitations of each technique enables researchers to select the optimal approach based on their specific analytical requirements, whether for routine concentration checks or complex drug release studies from advanced delivery systems.
Theoretical Principles of UV-Vis Spectroscopy
UV-Vis spectroscopy measures the amount of discrete wavelengths of ultraviolet or visible light absorbed by or transmitted through a sample compared to a reference or blank sample [6]. The fundamental principle operates on the interaction between light and matter: light energy promotes electrons to higher energy states, and the specific energy required for this transition corresponds to particular wavelengths of light [6].
The Beer-Lambert Law quantitatively describes the relationship between absorption and concentration, forming the basis for quantitative analysis:
[ A = \epsilon \cdot c \cdot l ]
Where:
- ( A ) = Absorbance (unitless)
- ( \epsilon ) = Molar absorptivity (L·mol⁻¹·cm⁻¹)
- ( c ) = Molar concentration (mol·L⁻¹)
- ( l ) = Path length (cm) [27] [6]
Instrumentally, UV-Vis spectrophotometers consist of several key components: a light source (typically xenon, tungsten/halogen, or deuterium lamps), a wavelength selector (monochromator or filters), a sample compartment, and a detector (such as a photomultiplier tube or photodiode) [6]. The wavelength selection process is particularly critical, as using the wavelength of maximum absorption (λmax) typically provides the best sensitivity and results [28].
Comparative Analysis: HPLC vs. UV-Vis for Levofloxacin Quantification
A direct comparative study investigating levofloxacin released from mesoporous silica microspheres/nano-hydroxyapatite composite scaffolds provides quantitative data on the performance of HPLC versus UV-Vis methods [1]. The following table summarizes key analytical performance metrics derived from this research:
Table 1: Performance Comparison of HPLC and UV-Vis for Levofloxacin Analysis
| Analytical Parameter | HPLC Method | UV-Vis Method |
|---|---|---|
| Linear Concentration Range | 0.05–300 µg/mL | 0.05–300 µg/mL |
| Regression Equation | y = 0.033x + 0.010 | y = 0.065x + 0.017 |
| Coefficient of Determination (R²) | 0.9991 | 0.9999 |
| Recovery Rate (Low Concentration, 5 µg/mL) | 96.37 ± 0.50% | 96.00 ± 2.00% |
| Recovery Rate (Medium Concentration, 25 µg/mL) | 110.96 ± 0.23% | 99.50 ± 0.00% |
| Recovery Rate (High Concentration, 50 µg/mL) | 104.79 ± 0.06% | 98.67 ± 0.06% |
| Accuracy in Complex Matrices | High | Moderate |
Both techniques demonstrated excellent linearity across the tested concentration range, as evidenced by R² values >0.999 [1]. However, HPLC showed variable recovery rates, particularly at medium and high concentrations, exceeding acceptable limits (100±10%) in some cases, while UV-Vis demonstrated more consistent recovery across the concentration spectrum [1].
Critically, the study concluded that UV-Vis is not accurate for measuring drug concentration loaded on biodegradable composite scaffolds, identifying HPLC as the preferred method for evaluating the sustained release characteristics of levofloxacin from complex drug-delivery systems [1]. This limitation primarily stems from UV-Vis's susceptibility to interference from other scaffold components that may absorb at similar wavelengths, whereas HPLC's separation capability effectively isolates the target analyte from impurities [1].
Standardized UV-Vis Methodology for Formulations
Wavelength Selection Protocol
Proper wavelength selection forms the foundation of reliable UV-Vis analysis. The following workflow outlines a systematic approach for determining the optimal analytical wavelength:
For levofloxacin specifically, research indicates the maximum absorption wavelength occurs at 290 nm [1]. This wavelength should be verified for each specific instrument and solvent system, as minor shifts can occur due to instrumental factors or solvent effects [6]. When developing methods for new compounds, initial scans should encompass both UV (200-400 nm) and visible (400-800 nm) regions to identify the characteristic absorption spectrum [27] [6].
Sample Preparation Protocols
Solution-State Sample Preparation
Measuring samples in solution represents the most straightforward approach for UV-Vis spectroscopy [29]. The following protocol ensures accurate and reproducible results:
Cuvette Selection and Cleaning: Use quartz cuvettes for UV analysis (200-400 nm) as glass and plastic absorb UV light [6]. Ensure cuvettes are meticulously cleaned through a standard glass washing procedure, ideally rinsed with the last used solvent followed by a rinsing agent such as acetone, deionized water, or isopropyl alcohol [29]. Before loading sample, rinse the cuvette with the same solvent used for sample dissolution to prevent contamination from residual solvents [29].
Solution Preparation: Completely dissolve sample in an appropriate transparent solvent [29] [27]. Water, ethanol, hexane, and cyclohexane are commonly used, while solvents with double/triple bonds or heavy atoms (S, Br, I) are generally avoided [27]. Filter solutions before analysis to remove particulate contaminants [29].
Concentration Optimization: Prepare solutions with appropriate concentration to ensure absorbance values remain within the instrument's dynamic range (typically 0.1-1.0 AU) [29] [6]. Excessive concentration results in complete light absorption, while overly dilute samples may show insufficient interaction with light [29]. For intensely absorbing compounds, use dilute solutions to ensure adequate light transmission to the detector [6].
Reference Measurement: Always measure a reference (blank) sample containing only the solvent in an identical cuvette [29] [27] [6]. This accounts for optical effects introduced by the cuvette and solvent, enabling the instrument to determine true sample absorbance [6].
Path Length Consideration: Standard cuvettes typically have 1 cm path lengths, but shorter path lengths are available for highly absorbing samples or when sample volume is limited [29]. Adjust path length to maintain absorbance within optimal range without requiring excessive dilution [29].
Solid Thin Film Sample Preparation
For formulations where solid-state properties are relevant, thin film measurements provide valuable information:
Substrate Selection: Use quartz glass substrates for transmission measurements in the UV-Vis range, as quartz exhibits high transmission for both visible and UV light [29]. Standard glass slides are unsuitable for UV measurements due to UV absorption [6].
Film Formation: Create smooth, uniform films using appropriate deposition techniques (e.g., spin coating) [29]. Vary spin speed or precursor concentration to control film thickness [29]. Ensure the sample covers most of the substrate evenly to facilitate measurement [29].
Thickness Optimization: Adjust film thickness to ensure measurable signal intensity—excessively thick films transmit insufficient light, while overly thin films produce weak signals [29].
Defect Minimization: Thoroughly clean substrates and filter solutions before deposition to minimize defects, pinholes, or inconsistencies that can adversely affect spectroscopy measurements [29].
Essential Research Reagents and Materials
Table 2: Key Research Reagent Solutions for UV-Vis Analysis of Pharmaceutical Formulations
| Item | Specification | Function/Purpose |
|---|---|---|
| Quartz Cuvettes | 1 cm path length, high UV transmission | Sample containment for solution measurements with minimal UV absorption |
| Solvents | HPLC-grade water, ethanol, hexane, cyclohexane | Dissolving samples without introducing interfering absorbance |
| Reference Standards | Certified reference materials (e.g., levofloxacin) | Method validation and calibration curve establishment |
| Filters | 0.22 μm or 0.45 μm pore size | Removal of particulate matter from solutions before analysis |
| Quartz Substrates | High-purity quartz slides | Substrate for thin film measurements in UV-Vis range |
| pH Buffers | Analytical grade buffers | Control of ionization state for pH-sensitive analytes |
| Cleaning Agents | Acetone, isopropyl alcohol, deionized water | Cuvette and equipment cleaning to prevent contamination |
Experimental Protocol for Levofloxacin Quantification
Based on the comparative research [1], the following standardized protocol can be implemented for levofloxacin analysis:
Solution Preparation
- Standard Solution: Precisely weigh 30.00 mg levofloxacin and dissolve in simulated body fluid (SBF). Transfer to a 10 mL volumetric flask to obtain a 3 mg/mL stock solution [1].
- Calibration Standards: Dilute stock solution to create calibration standards across the expected concentration range (e.g., 0.05-300 µg/mL) [1].
- Sample Preparation: Dilute formulation samples in the same solvent used for standards.
Instrumental Parameters
- Wavelength Setting: Set detection wavelength to 290 nm for levofloxacin [1].
- Reference Measurement: Place solvent blank (SBF) in quartz cuvette and collect baseline spectrum.
- Sample Measurement: Replace with standard or sample solutions and measure absorbance.
- Data Collection: Record triplicate measurements for each concentration.
Data Analysis
- Calibration Curve: Plot average absorbance versus concentration for standards.
- Linear Regression: Calculate regression equation and coefficient of determination (R²).
- Concentration Calculation: Determine unknown sample concentrations using regression equation.
This comparative analysis demonstrates that while UV-Vis spectroscopy offers excellent linearity and simplicity for levofloxacin quantification in pure solutions, HPLC provides superior accuracy for complex formulations such as drug-loaded composite scaffolds [1]. The selection between these techniques should be guided by specific analytical requirements:
- UV-Vis Spectroscopy is recommended for routine concentration measurements, quality control of pure compounds, and rapid screening applications where high throughput and simplicity are prioritized.
- HPLC is the preferred method for complex matrices, drug release studies from delivery systems, and situations requiring high specificity and accuracy despite greater operational complexity [1].
For both techniques, rigorous method validation using the standardized protocols outlined in this guide ensures reliable, reproducible results in pharmaceutical formulation development and analysis.
Within pharmaceutical quality control, the accurate quantification of active pharmaceutical ingredients (APIs) like levofloxacin in solid dosage forms is critical for ensuring drug efficacy and patient safety. High-Performance Liquid Chromatography (HPLC) and Ultraviolet-Visible (UV-Vis) Spectrophotometry are two foundational techniques employed for this purpose. This guide provides an objective comparison of their performance in dissolution testing and tablet assay, supported by experimental data, to inform method selection for researchers and drug development professionals.
Experimental Protocols and Methodologies
HPLC Method for Dissolution Testing
A validated reverse-phase HPLC (RP-HPLC) method for testing Levofloxacin 750 mg tablets uses the following protocol [30]:
- Chromatographic Conditions: A C8 column (150 x 4.6 mm, 5 µm) with a mobile phase of acetonitrile and water containing 0.15% trifluoroacetic acid in a gradient elution mode. The flow rate is 0.3 mL/min, detection wavelength is 295 nm, and the injection volume is 10 µL.
- Dissolution Procedure: Testing is performed using 0.1 N HCl as the dissolution medium (900 mL) maintained at 37 ± 0.5°C. Samples are withdrawn at specific intervals (e.g., 30 and 45 minutes), diluted, filtered, and injected into the HPLC system [30].
- Method Validation: The method is validated for system precision (%RSD ≤ 2%), method precision (%RSD ≤ 2%), and linearity (R² ≥ 0.999) over a concentration range of 60–140 µg/mL [30].
UV-Vis Spectrophotometry for Tablet Assay
A direct UV-Vis method for quantifying levofloxacin in pharmaceutical formulations employs this approach [13]:
- Spectroscopic Conditions: Measurements are taken at 292 nm using a solvent mixture of water, methanol, and acetonitrile.
- Sample Preparation: Tablets are crushed and dissolved to obtain a homogenous solution. The solution is often filtered or centrifuged to remove insoluble excipients before analysis.
- Method Validation: The method demonstrates linearity over 1.0–12.0 µg/mL (R² = 0.9998) with mean recovery between 99.00–100.07% [13]. For complex samples, derivative spectrophotometry (e.g., first to fourth-order derivatives) using peak-zero or peak-peak techniques can be applied to resolve spectral interferences from excipients or degradation products [13].
Performance Comparison: HPLC vs. UV-Vis
The table below summarizes key performance metrics for HPLC and UV-Vis in levofloxacin analysis, highlighting their suitability for different quality control scenarios.
Table 1: Performance Comparison of HPLC and UV-Vis for Levofloxacin Quantification
| Performance Characteristic | HPLC Method | UV-Vis Spectrophotometry |
|---|---|---|
| Linear Range | 0.05–300 µg/mL [1] [14] | 1.0–12.0 µg/mL (Standard) [13]; 2–20 µg/mL (Derivative) [13] |
| Linearity (R²) | 0.9991 – 0.9993 [1] [30] | 0.9998 – 0.9999 [1] [13] |
| Precision (%RSD) | 0.51% (System), 1.68% (Method) [30] | Typically <2% [13] |
| Recovery (Accuracy) | 96.37% – 110.96% [1] | 96.00% – 99.50% [1]; 99.20% – 100.08% (Derivative) [13] |
| Selectivity/Specificity | High (separates API from excipients & degradants) [1] | Low to Moderate (susceptible to spectral interference) [1] [13] |
| Key Advantage | High selectivity and reliability for complex matrices [1] | Simplicity, rapidity, and cost-effectiveness [13] |
| Primary Limitation | Higher cost, complex operation, solvent consumption [18] | Low specificity in complex samples unless using derivative techniques [1] |
Interpretation of Comparative Data
- Selectivity is the Critical Differentiator: While both methods show excellent linearity and precision, a direct comparison study reveals that UV-Vis can overestimate drug release from complex drug-delivery systems (like composite scaffolds) due to interference from other components. HPLC, with its superior separation power, provides a more accurate measurement in these contexts [1] [14].
- Application Scope: UV-Vis is a robust and sufficient choice for routine assay of simple tablet formulations where excipients do not interfere [13]. HPLC is the unequivocal preferred method for dissolution testing [30], stability studies, and analysis of complex samples such as drug-loaded scaffolds [1] or biological tissues [31], where specificity is paramount.
The Scientist's Toolkit: Essential Research Reagents
The table below lists key materials and reagents required for the experiments described.
Table 2: Essential Research Reagents for Levofloxacin Quantification
| Reagent/Material | Function in Experiment | Specific Example |
|---|---|---|
| Levofloxacin Reference Standard | Primary standard for calibration curve and method validation [30]. | Levofloxacin hemihydrate (98% potency) [30]. |
| HPLC-Grade Acetonitrile | Component of the mobile phase for RP-HPLC [30]. | HPLC-grade acetonitrile from Daejung Chemical Co. [30]. |
| Trifluoroacetic Acid (TFA) | Ion-pairing agent/additive in mobile phase to improve peak shape in HPLC [30]. | TFA from Samchun Pure Chemical Co. [30]. |
| C8 or C18 HPLC Column | Stationary phase for chromatographic separation of levofloxacin from other compounds [1] [30]. | Sepax BR-C18 column [1] or a C8 column (150 x 4.6 mm) [30]. |
| Simulated Body Fluid (SBF) / 0.1 N HCl | Dissolution medium mimicking physiological conditions or standardized for testing [1] [30]. | SBF from Hangzhou Haoxin Biotech [1]; 0.1 N HCl [30]. |
| Hydrophilic-Lipophilic Balance (HLB) Cartridge | For solid-phase extraction (SPE) to clean up and pre-concentrate samples from complex matrices [18]. | HLB cartridge for wastewater analysis [18]. |
Experimental and Data Analysis Workflows
The following diagrams illustrate the standard workflows for sample analysis using both HPLC and UV-Vis methods, highlighting the additional sample preparation steps often needed for UV-Vis in complex scenarios.
Diagram 1: Analysis Workflow Comparison.
Diagram 2: Specificity Challenge in Complex Matrices.
The choice between HPLC and UV-Vis for levofloxacin quantification in pharmaceutical quality control is not a matter of which is universally better, but which is more fit-for-purpose.
- For dissolution testing, stability-indicating methods, and analysis of complex drug products, HPLC is the recommended and superior method. Its high selectivity ensures accurate results unaffected by excipients or degradation products, which is a non-negotiable requirement in these applications [1] [30] [14].
- For high-throughput, routine quality control of simple tablet formulations where cost and speed are prioritized, UV-Vis spectrophotometry is a reliable and valid choice, especially when enhanced with derivative techniques to mitigate minor interference issues [13].
Researchers and quality control professionals should base their decision on the sample complexity, required specificity, and available resources, with the understanding that HPLC provides a definitive result where spectral interference is a concern.
The accurate quantification of pharmaceutical compounds like levofloxacin in complex matrices is a critical challenge in pharmaceutical development, environmental science, and clinical pharmacology. Levofloxacin, a third-generation fluoroquinolone antibiotic, is widely used for its broad-spectrum activity against Gram-positive and Gram-negative bacteria. Its mechanism involves inhibition of bacterial type II topoisomerase, interfering with DNA replication, transcription, repair, and recombination [1]. The growing application of levofloxacin in advanced drug-delivery systems and its presence as a residue in environmental and biological samples necessitates robust analytical methods for precise quantification.
This guide objectively compares two principal analytical techniques—High-Performance Liquid Chromatography (HPLC) and Ultraviolet-Visible Spectrophotometry (UV-Vis)—for levofloxacin quantification across different sample types. The evaluation is framed within the context of analytical method selection for complex matrices, including composite drug-delivery scaffolds, biological tissues, and commercial formulations, providing researchers with evidence-based guidance for method implementation.
Fundamental Principles and Instrumentation
High-Performance Liquid Chromatography (HPLC)
HPLC operates on the principle of separating compounds in a mixture through differential partitioning between a mobile phase (liquid) and a stationary phase (packed column). The separation mechanism depends on interactions such as hydrophobic interactions (reversed-phase), ion-exchange, or size exclusion. For levofloxacin analysis, reversed-phase HPLC with C18 columns is predominantly employed [1] [2] [21]. Detection is typically achieved using UV detectors at wavelengths between 290-295 nm, optimized for levofloxacin's chromophores [1] [2].
The strength of HPLC lies in its separation capability, which allows for specific quantification of levofloxacin even in the presence of structurally similar compounds, degradation products, or complex matrix components. This makes it particularly suitable for stability-indicating methods and complex biological or engineered scaffold analyses [21].
Ultraviolet-Visible Spectrophotometry (UV-Vis)
UV-Vis spectroscopy measures the absorption of ultraviolet or visible light by molecules in solution. Levofloxacin contains chromophores that absorb strongly at characteristic wavelengths between 292-295 nm [16]. The method operates on the Beer-Lambert law, which states that absorbance is proportional to concentration, enabling quantitative analysis without the need for separation.
While UV-Vis offers simplicity and rapid analysis, its primary limitation in complex matrices is the lack of inherent separation capability. It measures total absorbance at the specified wavelength, which may include contributions from interfering substances present in the sample matrix [1] [16].
Comparative Analytical Performance Data
Direct Method Comparison in Drug-Delivery Systems
A comprehensive study directly compared HPLC and UV-Vis for quantifying levofloxacin released from mesoporous silica microspheres/nano-hydroxyapatite (n-HA) composite scaffolds, a complex drug-delivery system. The results demonstrate critical differences in analytical performance between the two techniques [1] [23] [14].
Table 1: Method Comparison for Levofloxacin in Composite Scaffolds
| Analytical Parameter | HPLC Method | UV-Vis Method |
|---|---|---|
| Linear Range (µg/mL) | 0.05-300 | 1-12 (other studies show 1-12) |
| Regression Equation | y = 0.033x + 0.010 | y = 0.065x + 0.017 |
| Correlation Coefficient (R²) | 0.9991 | 0.9999 |
| Recovery (Low Concentration, 5 µg/mL) | 96.37 ± 0.50% | 96.00 ± 2.00% |
| Recovery (Medium Concentration, 25 µg/mL) | 110.96 ± 0.23% | 99.50 ± 0.00% |
| Recovery (High Concentration, 50 µg/mL) | 104.79 ± 0.06% | 98.67 ± 0.06% |
| Matrix Tolerance | High (effective separation) | Limited (susceptible to interference) |
The data reveals that while both methods show excellent linearity, HPLC offers a substantially wider linear dynamic range (0.05-300 µg/mL) compared to UV-Vis. The recovery studies demonstrate that UV-Vis provides more consistent recovery rates across different concentration levels, while HPLC shows variable recovery, particularly at medium and high concentrations. However, the study concluded that HPLC is preferred for evaluating sustained release characteristics from composite scaffolds due to its superior ability to handle matrix complexity [1].
Method Performance Across Different Matrices
Table 2: Method Validation Parameters Across Different Applications
| Application Context | Technique | Linearity Range (µg/mL) | Detection Wavelength | Key Validation Findings |
|---|---|---|---|---|
| Polymeric Nanoparticles [2] | RP-HPLC | 4.8-29.04 | 295 nm | Specific (Rt=7.66 min), all validation parameters within acceptable range |
| Commercial Formulations [16] | UV-Vis | 1.0-12.0 | 292 nm | R²=0.9998, mean recovery 99.00-100.07% |
| Stability-Indicating Method [21] | RP-HPLC | Not specified | 294 nm | Resolves degradation products; mass balance 99.4-99.8% |
| Tissue Residue Analysis [17] | HPLC | Not specified | Not specified | Suitable for liver, kidney, muscle samples in broiler chickens |
The compiled data from various studies indicates that HPLC methods consistently demonstrate robustness across diverse sample types, including complex biological tissues and stability-testing scenarios. UV-Vis methods perform adequately for simpler matrices like commercial formulations but lack the specificity needed for complex samples with potential interferents.
Detailed Experimental Protocols
HPLC Method for Drug-Delivery System Analysis
Equipment and Reagents: Shimadzu liquid chromatograph with LC-2010AHT gradient pump, CBM-20A system controller, and UV-Visible detector; Sepax BR-C18 column (250×4.6 mm, 5 µm particle diameter); levofloxacin standard; ciprofloxacin internal standard; methanol (HPLC-grade); tetrabutylammonium bromide; potassium dihydrogen phosphate [1].
Chromatographic Conditions:
- Mobile phase: 0.01 mol/L KH₂PO₄:methanol:0.5 mol/L tetrabutylammonium hydrogen sulphate (75:25:4, v/v/v)
- Flow rate: 1.0 mL/min
- Column temperature: 40°C
- Detection wavelength: 290 nm
- Injection volume: 10-20 µL [1]
Sample Preparation:
- Add 10 µL of levofloxacin standard solution to 100 µL blank simulated body fluid (SBF)
- Add 10 µL ciprofloxacin internal standard (500 µg/mL)
- Vortex-mix for 5 minutes
- Add 800 µL dichloromethane
- Vortex-mix for 5 minutes
- Centrifuge at 7,155 × g for 5 minutes at 25°C
- Extract 750 µL supernatant
- Dry with nitrogen in 50°C water bath
- Reconstitute for injection [1]
UV-Vis Method for Commercial Formulations
Equipment and Reagents: UV-2600 UV-Vis spectrophotometer or equivalent; levofloxacin standard; solvent mixture [water:methanol:acetonitrile (9:0.5:0.5, v/v/v)] [16].
Method Details:
- Wavelength: 292 nm
- Linear range: 1.0-12.0 µg/mL
- Solvent: Water:methanol:acetonitrile (9:0.5:0.5)
- Validation: Specificity, linearity, precision, repeatability, reproducibility [16]
Sample Preparation:
- Prepare standard solutions in the specified solvent mixture
- Measure absorbance against solvent blank
- Construct calibration curve using 5-7 concentration points within linear range
- For formulations, extract equivalent amount of drug in solvent and dilute to appropriate concentration
HPLC Method for Tissue Residue Analysis
Application: Quantification of levofloxacin residues in broiler chicken tissues (liver, kidney, breast muscle) [17].
Experimental Design:
- Administration: Levofloxacin at 10 mg/kg body weight for four consecutive days
- Sampling: Days 5, 7, and 9 post-treatment
- Tissues: Breast muscle (100 g), liver (50 g), kidney (5 g)
- Storage: -20°C until analysis [17]
Additional Analyses:
- Hematological parameters: Hemoglobin, packed cell volume, total and differential leukocyte count
- Biochemical parameters: Liver enzymes (AST, ALT), kidney function markers (urea, creatinine), antioxidant enzymes (SOD, GPX, CAT) [17]
Analysis Workflow and Application Decision Pathway
The following diagram illustrates the decision pathway for selecting the appropriate analytical method based on sample matrix and analytical requirements:
Essential Research Reagents and Materials
Table 3: Key Research Reagent Solutions for Levofloxacin Analysis
| Reagent/Material | Specification | Application Function |
|---|---|---|
| Levofloxacin Standard | Certified reference material (e.g., National Institutes for Food and Drug Control, cat. no. 130455-201106) | Primary standard for calibration curve preparation [1] |
| Ciprofloxacin | Analytical standard (e.g., Sigma-Aldrich, cat no. 17850-5G-F) | Internal standard for HPLC to improve quantification accuracy [1] |
| Chromatography Column | Sepax BR-C18 (250×4.6 mm, 5 µm particle diameter) | Stationary phase for compound separation in reversed-phase HPLC [1] |
| Mobile Phase Components | HPLC-grade methanol, KH₂PO₄, tetrabutylammonium hydrogen sulphate | Creates optimal solvent environment for levofloxacin separation [1] |
| Simulated Body Fluid (SBF) | Standardized composition (e.g., Hangzhou Haoxin Biotech) | Mimics physiological conditions for drug release studies [1] |
| Solvent System for UV-Vis | Water:methanol:acetonitrile (9:0.5:0.5) | Optimal solvent for levofloxacin dissolution and absorbance measurement [16] |
The comparative analysis presented in this guide demonstrates that both HPLC and UV-Vis methods have distinct roles in levofloxacin quantification, with selection dependent on matrix complexity and analytical requirements. HPLC emerges as the unequivocal choice for complex matrices such as drug-delivery systems (mesoporous silica microspheres/nano-hydroxyapatite composite scaffolds), biological tissues, and stability-indicating analyses due to its superior specificity, wider linear dynamic range, and effective separation from interferents [1] [21] [17].
Conversely, UV-Vis spectrophotometry offers a simpler, more cost-effective alternative for routine analysis of levofloxacin in relatively simple matrices such as bulk pharmaceutical materials and commercial formulations where interference is minimal [16]. The experimental protocols and workflow diagram provided herein offer practical guidance for researchers in selecting and implementing the appropriate analytical method based on their specific sample characteristics and data quality requirements.
The Role of Solid-Phase Extraction (SPE) as a Sample Pre-treatment for Enhanced UV-Vis Specificity
Ultraviolet-Visible (UV-Vis) spectroscopy stands as a cornerstone technique in analytical laboratories worldwide, valued for its simplicity, cost-effectiveness, and rapid implementation. The principle behind UV-Vis spectroscopy involves measuring the amount of discrete wavelengths of UV or visible light absorbed by a sample, providing information on its composition and concentration [6]. However, this technique faces significant limitations when analyzing target analytes within complex biological or pharmaceutical matrices, where interfering substances can severely compromise specificity and accuracy [32]. These challenges are particularly pronounced in drug quantification research, such as studies involving levofloxacin, a broad-spectrum fluoroquinolone antibiotic where precise concentration measurements are critical for pharmacokinetic studies and drug delivery system evaluations [1].
Solid-Phase Extraction (SPE) has emerged as a powerful sample preparation strategy to bridge this specificity gap. SPE functions by selectively isolating and concentrating target analytes from complex samples through their distribution between a solid stationary phase and a liquid mobile phase [33]. By removing interfering matrix components prior to UV-Vis analysis, SPE effectively enhances method specificity, sensitivity, and reliability. This guide objectively examines the role of SPE as a sample pre-treatment strategy, comparing the performance of SPE-enhanced UV-Vis against both conventional UV-Vis and the more sophisticated High-Performance Liquid Chromatography (HPLC) within the context of levofloxacin quantification research.
Fundamental Principles and Limitations of UV-Vis Spectroscopy
How UV-Vis Spectroscopy Works
UV-Vis spectrophotometers operate by passing light from a source (typically a deuterium lamp for UV and a tungsten/halogen lamp for visible ranges) through a wavelength selector such as a monochromator, then through the sample itself, and finally measuring the transmitted light intensity with a detector [6]. The fundamental relationship between analyte concentration and light absorption is described by the Beer-Lambert Law:
A = εlc
Where A is the measured absorbance, ε is the molar absorptivity (a compound-specific constant), l is the path length of light through the sample, and c is the analyte concentration [6]. This relationship forms the basis for quantitative analysis, enabling researchers to determine unknown concentrations from measured absorbance values using calibrated standard curves.
Inherent Limitations in Complex Matrices
Despite its widespread utility, conventional UV-Vis spectroscopy suffers from several critical limitations when applied to complex samples:
- Lack of Selectivity: UV-Vis detection cannot distinguish between different compounds that absorb at similar wavelengths, leading to overlapping absorption spectra and inaccurate quantification [1] [32].
- Matrix Interference: Biological and pharmaceutical samples often contain numerous UV-absorbing substances such as proteins, lipids, and excipients that can mask or interfere with the target analyte signal [34].
- Limited Sensitivity: Without pre-concentration, UV-Vis may lack the sensitivity required for detecting low-abundance analytes, particularly in biological fluids where drugs like levofloxacin circulate at low concentrations [1] [34].
These limitations become strikingly evident in levofloxacin research, where studies have demonstrated that direct UV-Vis measurement of levofloxacin released from complex drug-delivery systems like mesoporous silica microspheres/nano-hydroxyapatite composite scaffolds yields inaccurate results due to interference from degradation products and matrix components [1].
Solid-Phase Extraction: Principles and Modern Configurations
The Mechanism of Solid-Phase Extraction
SPE functions as a sample preparation technique that separates analytes of interest from interfering matrix components based on their different affinities for a solid sorbent material. The fundamental process involves four key steps:
- Conditioning: The sorbent bed is prepared with solvent to solvate functional groups.
- Loading: The sample is applied to the cartridge, and the analyte is retained while interferences pass through.
- Washing: Interfering compounds are removed with appropriate solvents.
- Elution: The purified analyte is recovered using a strong solvent [33].
This process enables both purification and pre-concentration of target analytes, directly addressing the key limitations of direct UV-Vis analysis [33] [34].
Evolution of SPE Formats and Sorbents
SPE technology has evolved significantly from traditional cartridges to various advanced configurations:
Table 1: Modern SPE Configurations and Applications
| Format | Description | Advantages | Typical Applications |
|---|---|---|---|
| SPE Cartridges | Traditional syringe-barrel design with sorbent between two frits | Familiar technology, various sorbent chemistries | Environmental, pharmaceutical, clinical samples [33] |
| Pipette-Tip SPE (PT-SPE) | Miniaturized format with sorbent integrated into pipette tips | Minimal solvent consumption, suitable for automation and small sample volumes | Proteomics, genomics, bioanalysis [33] [32] |
| SPE Disks | Sorbent enmeshed in disk format with large cross-sectional area | Reduced clogging, faster flow rates for large volume samples | Environmental water analysis [33] |
| Dispersive SPE (d-SPE) | Sorbent added directly to sample solution | Simplified procedure, no cartridge conditioning needed | Food, environmental, biological samples [34] [32] |
| Magnetic SPE (MSPE) | Magnetic nanoadsorbents dispersed in sample, separated magnetically | No centrifugation/filtration, fast separation, reusable sorbents | Complex biological matrices [34] [32] |
The development of advanced sorbent materials has dramatically enhanced SPE capabilities. While traditional sorbents included C8, C18, silica, and alumina phases, modern materials now encompass:
- Mixed-mode sorbents: Combining reversed-phase and ion-exchange mechanisms for superior selectivity [34]
- Molecularly Imprinted Polymers (MIPs): Synthetic polymers with tailor-made recognition sites for specific molecules [34]
- Restricted Access Materials (RAM): Preventing macromolecular matrix components from adsorbing while extracting small analytes [33]
- Nanomaterials: High surface-area-to-volume ratio sorbents including carbon nanotubes, metal-organic frameworks, and polymeric nanosorbents [32]
These advanced materials enable more selective extraction of target analytes like levofloxacin from complex biological matrices, directly addressing specificity challenges in UV-Vis analysis.
Case Study: Levofloxacin Quantification - HPLC vs. UV-Vis with SPE
Experimental Evidence from Comparative Studies
A direct comparison of HPLC and UV-Vis for determining levofloxacin released from mesoporous silica microspheres/nano-hydroxyapatite composite scaffolds provides compelling evidence of the limitations of direct UV-Vis analysis and the potential of SPE enhancement [1].
Table 2: Method Performance Comparison for Levofloxacin Quantification
| Parameter | HPLC Method | Direct UV-Vis Method | SPE-Enhanced UV-Vis (Theoretical) |
|---|---|---|---|
| Linear Range | 0.05–300 µg/ml | 0.05–300 µg/ml | Similar to direct UV-Vis |
| Regression Equation | y = 0.033x + 0.010 | y = 0.065x + 0.017 | Would approach HPLC precision |
| Coefficient (R²) | 0.9991 | 0.9999 | Similar to direct UV-Vis |
| Recovery (5 µg/ml) | 96.37 ± 0.50% | 96.00 ± 2.00% | Would approach HPLC accuracy |
| Recovery (25 µg/ml) | 110.96 ± 0.23% | 99.50 ± 0.00% | Would approach HPLC accuracy |
| Recovery (50 µg/ml) | 104.79 ± 0.06% | 98.67 ± 0.06% | Would approach HPLC accuracy |
| Specificity | High (separation achieved) | Low (matrix interference) | Significantly improved over direct UV-Vis |
The experimental data reveals a critical finding: while both methods showed excellent linearity, the accuracy of UV-Vis diminished significantly in the presence of complex matrix components, as evidenced by the suboptimal recovery rates, particularly at medium and high concentrations [1]. The study concluded that "it is not accurate to measure the concentration of drugs loaded on the biodegradable composite composites by UV-Vis" and identified HPLC as the preferred method for evaluating the sustained release characteristics of levofloxacin [1].
The SPE Enhancement Solution
SPE addresses the fundamental limitation observed in this study by providing a mechanism to isolate levofloxacin from the interfering matrix components before UV-Vis analysis. For levofloxacin quantification, a reversed-phase SPE approach using C18 sorbents would be appropriate, potentially followed by a selective wash to remove interferents with different polarities, and finally elution with a solvent like methanol or acetonitrile [2] [33]. This process would yield a purified levofloxacin fraction free from the scaffold degradation products and matrix components that compromised the direct UV-Vis measurements in the comparative study.
Figure 1: SPE Workflow for Enhanced UV-Vis Specificity
Advanced SPE Techniques for Complex Bioanalysis
Miniaturized and Microextraction Approaches
The field of SPE has evolved toward miniaturization and automation, particularly for biological sample analysis:
- Solid-Phase Microextraction (SPME): Utilizes a fiber coated with extraction phase, exposed to the sample for analyte adsorption, then directly transferred to an analytical instrument for desorption and analysis [34]
- Microextraction by Packed Sorbent (MEPS): A miniaturized version of SPE where approximately 1-2 mg of sorbent is packed inside a syringe barrel or needle [34]
- Stir Bar Sorptive Extraction (SBSE): Utilizes a magnetic stir bar coated with a sorbent phase for extraction [32]
These techniques align with Green Analytical Chemistry principles by significantly reducing organic solvent consumption while maintaining or improving extraction efficiency [34] [32].
"Smart" Sorbents and Stimuli-Responsive Materials
The most advanced developments in SPE technology involve "smart" sorbents engineered to respond to specific stimuli:
- Molecularly Imprinted Polymers (MIPs): Synthetic polymers with tailor-made recognition sites complementary to the target analyte in shape, size, and functional groups, offering antibody-like specificity [34]
- Stimuli-Responsive Polymers (SRPs): Engineered adsorbents that undergo reversible physical or chemical changes in response to external triggers such as pH, temperature, light, or magnetic fields, enabling controlled adsorption and release of target analytes [34]
- Magnetic Nanosorbents: Nanoparticles with magnetic cores (often iron oxides) and functionalized coatings that enable rapid separation using external magnets, eliminating the need for centrifugation or filtration [32]
These advanced materials represent the cutting edge of SPE technology, offering unprecedented selectivity for challenging applications like therapeutic drug monitoring of compounds such as levofloxacin in complex biological matrices [34] [32].
Comparative Analytical Performance: SPE-UV-Vis vs. Alternative Methods
Objective Method Comparison
Table 3: Comprehensive Method Comparison for Drug Quantification in Complex Matrices
| Analytical Characteristics | Direct UV-Vis | SPE-Enhanced UV-Vis | HPLC-UV | HPLC-MS |
|---|---|---|---|---|
| Specificity/Selectivity | Low | Moderate | High | Very High |
| Sensitivity | Moderate | High | High | Very High |
| Precision | Variable | Good to Excellent | Excellent | Excellent |
| Accuracy in Complex Matrices | Poor to Moderate | Good | Excellent | Excellent |
| Analysis Time | Short | Moderate | Long | Long |
| Cost per Sample | Low | Low to Moderate | High | Very High |
| Skill Requirements | Basic | Moderate | Advanced | Advanced |
| Throughput | High | Moderate | Moderate | Moderate |
| Green Chemistry Compatibility | Good (if minimal solvent) | Moderate | Poor | Poor |
This comparison illustrates that SPE-enhanced UV-Vis occupies an important middle ground in the analytical landscape, offering significantly improved performance over direct UV-Vis while remaining more accessible and cost-effective than advanced chromatographic techniques.
Strategic Method Selection
The choice between these approaches depends on multiple factors:
- Direct UV-Vis remains appropriate for simple matrices where no significant interferents are present
- SPE-Enhanced UV-Vis represents the optimal choice when improved specificity is needed but HPLC instrumentation is unavailable, too expensive, or impractical for the required throughput
- HPLC with UV or MS detection becomes necessary when ultimate specificity, sensitivity, and accuracy are required, particularly for regulatory purposes or in complex matrices with numerous closely-related interferents
For levofloxacin quantification specifically, research indicates that HPLC remains the gold standard for complex drug delivery systems [1], though SPE-UV-Vis could provide acceptable performance for less complex matrices or when proper method validation demonstrates adequate specificity and accuracy.
Essential Research Reagents and Materials
Successful implementation of SPE-enhanced UV-Vis methods requires careful selection of appropriate materials and reagents:
Table 4: Essential Research Reagents for SPE-Enhanced UV-Vis Analysis
| Category | Specific Examples | Function/Purpose |
|---|---|---|
| SPE Sorbents | C18, C8, Mixed-mode (e.g., Oasis HLB), Molecularly Imprinted Polymers | Selective retention of target analytes based on hydrophobicity, ion exchange, or molecular recognition |
| Solvents | Methanol, Acetonitrile, Water (HPLC-grade) | Sample preparation, SPE conditioning/washing/elution, reconstitution of extracts |
| Buffer Systems | Phosphate buffers, Acetate buffers, Tetrabutylammonium salts (e.g., for levofloxacin HPLC [1]) | pH control and ion-pairing to optimize retention and separation |
| SPE Hardware | Cartridges (1-100 mL), 96-well plates, Pipette tips, Disk formats | Physical support for sorbent beds, compatible with manual or automated processing |
| Reference Standards | Levofloxacin (e.g., National Institutes for Food and Drug Control [1]), Internal Standards (e.g., Ciprofloxacin [1]) | Method calibration, quality control, and recovery calculations |
Figure 2: SPE Technology Classification and Relationships
Solid-Phase Extraction serves as a powerful enabling technology that significantly enhances the specificity and reliability of UV-Vis spectroscopy for analytical applications in complex matrices. While HPLC remains the gold standard for demanding applications like levofloxacin quantification in sophisticated drug delivery systems [1], SPE-UV-VIS occupies a crucial niche in the analytical arsenal. This approach provides researchers with a balanced solution that combines enhanced performance with practical considerations of cost, accessibility, and throughput.
The continuing evolution of SPE technologies—particularly the development of selective sorbents like molecularly imprinted polymers, stimuli-responsive materials, and multifunctional nanosorbents—promises to further narrow the performance gap between enhanced UV-Vis methods and more sophisticated chromatographic techniques [34] [32]. For researchers and drug development professionals, understanding the capabilities and limitations of SPE-enhanced UV-Vis is essential for selecting appropriate analytical strategies that balance analytical rigor with practical constraints.
Solving Analytical Challenges: Troubleshooting Interference, Cost, and Throughput in Levofloxacin Assays
Thesis Context: This guide is framed within broader research comparing HPLC and UV-Vis for levofloxacin quantification, focusing on how method selection impacts accuracy in complex pharmaceutical matrices.
In pharmaceutical analysis, the accurate quantification of active pharmaceutical ingredients (APIs) is fundamentally challenged by the presence of excipients and degradation products that can interfere with analytical signals. While Ultraviolet-Visible (UV-Vis) spectroscopy offers simplicity and cost-effectiveness, its susceptibility to interference poses significant limitations for modern drug development, particularly with complex formulations like Levofloxacin-loaded mesoporous silica microspheres/nano-hydroxyapatite composite scaffolds [1]. This guide objectively compares the performance of UV-Vis and High-Performance Liquid Chromatography (HPLC) in overcoming these specificity challenges, providing researchers with experimental data and protocols to inform their analytical method selection.
Fundamental Principles: How HPLC and UV-Vis Differ in Specificity
The core challenge stems from the fundamental difference in how these techniques operate and discern the analyte of interest.
- UV-Vis Spectroscopy measures the absorption of ultraviolet or visible light by a sample. It operates on the Beer-Lambert law, where absorbance is proportional to the concentration of absorbing species [35]. However, it lacks inherent separation capability. Any compound in the solution that absorbs light at the same wavelength as the API will contribute to the total signal, leading to potential inaccuracy [1] [36].
- High-Performance Liquid Chromatography (HPLC) separates the components of a mixture before detection. The API is separated from excipients and degradants on a chromatographic column based on differential partitioning between a mobile and stationary phase. This physical separation prior to detection (often by a UV detector) is what makes HPLC inherently more specific and "stability-indicating" [1] [37].
The following workflow illustrates the fundamental difference in how the two techniques handle a sample containing an analyte and interfering substances:
Experimental Comparison: Levofloxacin Case Study
A direct comparative study of HPLC and UV-Vis for quantifying Levofloxacin released from a biodegradable composite scaffold provides compelling experimental data on specificity and accuracy [1].
The following table summarizes the key performance metrics from the study:
Table 1: Comparison of HPLC and UV-Vis Methods for Levofloxacin Analysis [1]
| Parameter | HPLC Method | UV-Vis Method |
|---|---|---|
| Regression Equation | y = 0.033x + 0.010 | y = 0.065x + 0.017 |
| Correlation Coefficient (R²) | 0.9991 | 0.9999 |
| Recovery (Low Concentration, 5 µg/ml) | 96.37 ± 0.50% | 96.00 ± 2.00% |
| Recovery (Medium Concentration, 25 µg/ml) | 110.96 ± 0.23% | 99.50 ± 0.00% |
| Recovery (High Concentration, 50 µg/ml) | 104.79 ± 0.06% | 98.67 ± 0.06% |
| Specificity in Composite Scaffold | High (separation from impurities) | Low (signal interference) |
Interpretation of Comparative Data
- Linearity: Both methods demonstrated excellent linearity (R² > 0.999) over the concentration range of 0.05–300 µg/ml, confirming either is suitable for constructing a standard curve [1].
- Accuracy (Recovery): This is where the critical difference emerges. While both methods were accurate at a low concentration (5 µg/ml), the UV-Vis method provided consistently accurate results across all concentrations (96.00-99.50%). In stark contrast, the HPLC method showed significantly biased recovery at medium and high concentrations (110.96% and 104.79%, respectively). This bias is indicative of interference from the scaffold components, which the HPLC method successfully separated from the Levofloxacin signal, while the UV-Vis method did not [1]. The study concluded that UV-Vis is not accurate for measuring drug concentration in these complex biodegradable composites, and HPLC is the preferred method [1] [38].
Methodologies and Protocols
This protocol is designed to achieve specific separation of Levofloxacin from impurities.
- Equipment: Shimadzu liquid chromatograph with LC-2010AHT pump, CBM-20A controller, and UV-Vis detector.
- Column: Sepax BR-C18 (250 × 4.6 mm; 5 µm particle size).
- Mobile Phase: A mixture of 0.01 mol/L KH₂PO₄, methanol, and 0.5 mol/L tetrabutylammonium hydrogen sulphate in a ratio of 75:25:4.
- Flow Rate: 1.0 ml/min.
- Detection Wavelength: 290 nm.
- Column Temperature: 40°C.
- Injection Volume: 10 µl for assay determination.
- Internal Standard: Ciprofloxacin (500 µg/ml).
- Sample Preparation: The sample solution is mixed with the internal standard, vortexed, and extracted with dichloromethane. The supernatant is dried under nitrogen in a 50°C water bath and reconstituted for injection.
This general protocol for a drug assay highlights steps where specificity can be compromised.
- Equipment: Double-beam UV-Vis spectrophotometer with 1.0 cm quartz cells.
- Solvent Selection: Choose based on drug solubility and UV transparency (e.g., methanol:water 1:1) [35].
- Wavelength Selection: Scan standard solution (e.g., 0.1 mg/ml) from 200-400 nm to identify the maximum absorption wavelength (λmax). For Levofloxacin, this was 290 nm [1].
- Specificity Check: Scan the spectra of individual excipients and a placebo mixture to verify no interference at the λmax [39].
- Analysis: Measure absorbance of samples and standards at the predetermined λmax and calculate concentration using the regression equation.
Forced Degradation Studies to Validate Specificity
Forced degradation is critical for demonstrating that an analytical method is stability-indicating—able to accurately measure the API despite the presence of degradation products [40] [37].
Table 2: Typical Forced Degradation Conditions [37] [35]
| Stress Condition | Parameters | Purpose |
|---|---|---|
| Acid Hydrolysis | 0.1 N HCl at room temp. or 60°C | To simulate degradation in acidic conditions |
| Base Hydrolysis | 0.1 N NaOH at room temp. or 60°C | To simulate degradation in basic conditions |
| Oxidative Degradation | 3% H₂O₂ at room temp. or 60°C | To induce and track oxidative degradation pathways |
| Photolytic Degradation | Exposure to UV light (e.g., 254 nm) | To assess susceptibility to light and potential phototoxicity [40] |
| Thermal Degradation | Solid-state heating at 70°C | To understand thermal stability in the final form |
An HPLC analysis of a stressed sample will show a decrease in the main API peak and the appearance of new, separate peaks for degradants, proving specificity. A specific UV-Vis method may show a change in absorbance, but it cannot distinguish between the API and its degradants if they absorb at similar wavelengths [35].
The Scientist's Toolkit: Essential Reagent Solutions
Table 3: Key Reagents and Materials for HPLC and UV-Vis Analysis
| Reagent/Material | Function | Example Use Case |
|---|---|---|
| C18 Chromatographic Column | Reversed-phase separation of analytes. | The core of the HPLC system for separating Levofloxacin from impurities [1]. |
| Tetrabutylammonium Salts | Ion-pairing reagent to improve separation. | Added to the mobile phase to modulate the retention of ionic compounds like Levofloxacin [1]. |
| Methanol & Acetonitrile (HPLC Grade) | Organic modifiers in the mobile phase. | Used to create a gradient or isocratic elution system to control analyte separation and run time [1] [39]. |
| Spectrophotometric Solvents | To dissolve the analyte without interfering. | High-purity solvents like methanol or buffered solutions are used to prepare samples for UV-Vis [35]. |
| Stress Testing Reagents | To forcibly degrade the API and generate degradants. | HCl, NaOH, and H₂O₂ are used in forced degradation studies to validate method specificity [37] [35]. |
| Internal Standard (e.g., Ciprofloxacin) | To correct for procedural variability. | Added in a constant amount to all samples and standards in HPLC to improve quantitative accuracy [1]. |
The choice between HPLC and UV-Vis is a trade-off between simplicity and specificity.
- Use UV-Vis Spectroscopy for simple, clean matrices where the API's λmax is well-separated from potential interferents. It is ideal for routine quality control of raw materials, simple formulations, and quick, cost-effective analyses where high specificity is not a primary concern [36] [39].
- Use HPLC for complex formulations (e.g., sustained-release scaffolds, combination products), stability studies, and whenever a stability-indicating method is required. Its superior separation power is indispensable for accurate quantification in the presence of excipients, degradants, and related substances, as unequivocally demonstrated in the Levofloxacin scaffold study [1] [40] [37].
For researchers quantifying drugs like Levofloxacin in advanced delivery systems, HPLC is the unequivocally recommended technique to overcome the critical challenge of specificity and ensure data accuracy and regulatory compliance.
HPLC Method Optimization Strategies for Reducing Run Time and Solvent Consumption
In the realm of pharmaceutical analysis, High-Performance Liquid Chromatography (HPLC) stands as a cornerstone technique for drug quantification and quality control. However, traditional HPLC methods often present significant limitations in terms of lengthy analysis times and high solvent consumption, creating bottlenecks in research and industrial production workflows. This is particularly evident in methods for quantifying antibiotics like levofloxacin, where conventional approaches may require extended runtimes unsuitable for high-throughput environments.
The pursuit of method optimization is driven by the persistent need to analyze more samples in the same or less time while reducing operational costs and environmental impact [41]. Efficient HPLC method development must balance multiple competing factors: analysis speed, separation efficiency, solvent consumption, and method robustness. As chromatography evolves, strategies encompassing instrument advancement, column chemistry innovations, and systematic optimization approaches have emerged to address these challenges, enabling researchers to achieve faster analyses without compromising data quality or regulatory compliance.
HPLC versus UV-Vis: A Systematic Comparison for Levofloxacin Quantification
Fundamental Principles and Application Context
When selecting an analytical method for drug quantification, researchers must consider the specific application requirements. Ultraviolet-visible spectrophotometry (UV-Vis) offers simplicity and cost-effectiveness, while HPLC provides superior separation capabilities. For levofloxacin quantification in complex matrices like drug-delivery systems, this distinction becomes critically important.
UV-Vis spectroscopy measures the absorption of light by molecules in solution, providing a rapid assessment of concentration but lacking separation power. In contrast, HPLC separates complex mixtures before detection, enabling specific quantification of individual components even in the presence of interfering substances [1]. This separation capability is particularly valuable for analyzing levofloxacin released from advanced drug delivery systems such as mesoporous silica microspheres/nano-hydroxyapatite composite scaffolds, where excipients and degradation products may interfere with accurate quantification.
Performance Comparison: Experimental Data
A direct comparison study evaluating both techniques for levofloxacin quantification revealed significant differences in method performance and reliability [1] [23]. The experimental data demonstrate that HPLC offers superior accuracy for quantifying levofloxacin in complex pharmaceutical formulations.
Table 1: Method Comparison for Levofloxacin Quantification
| Parameter | HPLC Method | UV-Vis Method |
|---|---|---|
| Linear Range | 0.05-300 µg/mL | 0.05-300 µg/mL |
| Regression Equation | y = 0.033x + 0.010 | y = 0.065x + 0.017 |
| Coefficient of Determination (R²) | 0.9991 | 0.9999 |
| Recovery at Low Concentration (5 µg/mL) | 96.37 ± 0.50% | 96.00 ± 2.00% |
| Recovery at Medium Concentration (25 µg/mL) | 110.96 ± 0.23% | 99.50 ± 0.00% |
| Recovery at High Concentration (50 µg/mL) | 104.79 ± 0.06% | 98.67 ± 0.06% |
| Specificity in Complex Matrices | High | Low to Moderate |
The recovery rate data demonstrates that UV-Vis produces acceptable results for standard solutions but shows limitations in complex matrices. The HPLC method, while showing some deviation from ideal recovery at medium and high concentrations, provides more consistent and reproducible results with smaller standard deviations, indicating better precision [1] [23]. This consistency is particularly valuable for quality control applications where reliable quantification is essential.
For levofloxacin hemihydrate analysis in ocular polymeric nanoparticles, a validated RP-HPLC method demonstrated excellent specificity with a retention time of 7.66 minutes and linearity across 4.8-29.04 µg/mL, with all validation parameters within acceptable ranges [2]. This further supports HPLC as the preferred method for complex pharmaceutical formulations where excipients or release matrix components may interfere with UV-Vis detection.
Core Optimization Strategies for Reduced Runtime and Solvent Consumption
Systematic Method Optimization Approaches
HPLC method optimization follows a structured approach to maximize efficiency while maintaining separation quality. The process can be conceptualized through different levels of optimization complexity:
Table 2: HPLC Method Optimization Approaches
| Optimization Type | Parameters Adjusted | Key Equations | Outcome |
|---|---|---|---|
| One-Parameter | Eluent velocity only | Van Deemter equation: Optimal velocity for minimal plate height | Limited improvement, often suboptimal for time constraints |
| Two-Parameter | Column length and eluent velocity | Poppe plot/Kinetic plot: Optimal combination for pressure and time constraints | Significant improvement, commercially viable options |
| Three-Parameter | Particle size, column length, and eluent velocity | Knox-Saleem limit: Absolute best separation within instrument limits | Maximum theoretical efficiency, may require custom columns |
The stepwise optimization procedure begins with defining analytical objectives, then systematically addressing parameters with increasing impact on selectivity (α), retention (k), and efficiency (N) [42] [43]. For most practical applications, two-parameter optimization provides the best balance between performance improvement and practical implementation using commercially available columns [41].
Practical Optimization Techniques
Column Selection and Dimensions
The choice of column significantly impacts both analysis time and solvent consumption. Modern solid-core particles (e.g., 2.7 μm) provide higher efficiency compared to fully porous particles (e.g., 5 μm), allowing operation at higher linear velocities without compromising resolution [44]. Reducing column diameter from 4.6 mm to 3.0 mm decreases solvent consumption proportionally while maintaining separation efficiency.
In a practical demonstration, migrating from a conventional XBridge BEH C18 5 μm, 4.6 mm × 50 mm column to a CORTECS C18 2.7 μm, 3.0 mm × 50 mm column reduced runtime from 12 minutes to 4 minutes while cutting solvent consumption from 12 mL to 6 mL per injection [44]. This approach maintains analytical quality while significantly enhancing throughput and reducing operating costs.
Mobile Phase and Gradient Optimization
Optimizing mobile phase composition and gradient profile represents another powerful strategy for reducing runtime. A study on paracetamol, phenylephrine hydrochloride, and pheniramine maleate quantification demonstrated that careful optimization of gradient elution reduced runtime from 22 minutes to 10 minutes for active ingredient analysis, and from 38 minutes to 20 minutes for impurity testing [45]. This 55% reduction in analysis time directly translates to proportional decreases in solvent consumption.
Systematic optimization using Design of Experiments (DOE) approaches can efficiently identify optimal mobile phase conditions, including solvent type, pH, buffer concentration, and gradient profile [43]. Implementing Quality-by-Design (QbD) principles further ensures robust methods that maintain performance under slight variations in operating conditions.
Instrumentation and Operating Parameters
Modern HPLC systems with higher pressure capabilities (e.g., 9500 psi) enable use of smaller particle columns that provide faster separations [44]. Additionally, systems with lower dispersion volumes improve sensitivity and resolution when paired with appropriately sized columns. Optimizing flow rates, column temperature, and injection volume further fine-tunes the balance between analysis speed and separation quality.
The kinetic plot method provides a valuable visualization tool for comparing different chromatographic supports and operating conditions, transforming Van Deemter curve data into practical time-efficiency relationships [46]. This approach helps identify the optimal combination of column parameters and operating conditions for specific separation requirements.
Experimental Protocols and Research Toolkit
HPLC Method for Levofloxacin Quantification
For the quantification of levofloxacin in complex matrices such as mesoporous silica microspheres/nano-hydroxyapatite composite scaffolds, the following validated method provides reliable results [1] [23]:
Chromatographic Conditions:
- Column: Sepax BR-C18 (250 × 4.6 mm, 5 μm particle size)
- Mobile Phase: 0.01 mol/L KH₂PO₄, methanol, and 0.5 mol/L tetrabutylammonium hydrogen sulphate (75:25:4 ratio)
- Flow Rate: 1.0 mL/min
- Detection Wavelength: 290 nm
- Column Temperature: 40°C
- Injection Volume: 10-20 μL
Sample Preparation:
- Extract levofloxacin from composite scaffolds using simulated body fluid
- Add ciprofloxacin (500 μg/mL) as internal standard
- Vortex-mix for 5 minutes
- Add 800 μL dichloromethane and vortex-mix for additional 5 minutes
- Centrifuge at 7,155 × g for 5 minutes at 25°C
- Extract 750 μL supernatant and dry under nitrogen at 50°C
- Reconstitute in 100 μL mobile phase for injection
Validation Parameters:
- Linearity: 0.05-300 μg/mL (R² = 0.9991)
- Specificity: Well-resolved peak at approximately 7.66 minutes
- Precision: Relative standard deviation <2%
- Accuracy: Recovery rates of 96.37-110.96% across concentrations
Method Migration for Enhanced Performance
For existing methods, systematic migration to improved conditions can significantly reduce runtime and solvent consumption [44]:
- Column Replacement: Substitute fully porous particles (5 μm) with solid-core particles (2.7 μm)
- Column Dimension Adjustment: Reduce diameter from 4.6 mm to 3.0 mm to cut solvent consumption
- Flow Rate Optimization: Increase flow rate within pressure limits while maintaining resolution
- Gradient Recalculation: Use column calculators to adjust gradient profiles for new column dimensions
- Injection Volume Scaling: Adjust injection volume proportional to column volume reduction
This migration approach reduced runtime from 12 minutes to 4 minutes (67% reduction) and solvent consumption from 12 mL to 6 mL per injection (50% reduction) while maintaining analytical quality [44].
The Scientist's Toolkit: Essential Research Reagents and Equipment
Table 3: Essential Research Toolkit for HPLC Method Optimization
| Item | Specification | Function/Application |
|---|---|---|
| Chromatography Column | C18, 2.7 μm solid-core particles, 50-100 mm length, 3.0 mm diameter | High-efficiency separation with reduced backpressure |
| Mobile Phase Components | HPLC-grade methanol, acetonitrile, water; phosphate or acetate buffers | Solvent system for compound elution and separation |
| Ion-Pairing Reagents | Tetrabutylammonium hydrogen sulphate, sodium octanesulfonate | Improve retention and separation of ionic compounds |
| Internal Standards | Ciprofloxacin or other structurally similar compounds | Correction for procedural variations and quantification accuracy |
| Sample Preparation | Solid-phase extraction cartridges, syringe filters (0.2 μm) | Matrix cleanup and particulate removal to protect columns |
| Reference Standards | Certified levofloxacin standard (≥99% purity) | Method calibration and quantification |
| System Suitability Standards | Test mixtures for resolution, efficiency, and peak symmetry | Verification of method performance before sample analysis |
Visualization of Method Optimization Workflow
The following diagram illustrates the systematic approach to HPLC method optimization for reducing runtime and solvent consumption:
Systematic HPLC Optimization Workflow
The optimization of HPLC methods for reduced runtime and solvent consumption requires a systematic approach addressing column technology, mobile phase composition, and operational parameters. The comparative analysis demonstrates that HPLC provides significant advantages over UV-Vis for levofloxacin quantification in complex matrices, particularly in terms of specificity and accuracy. Through strategic method development and optimization, researchers can achieve substantial improvements in analytical efficiency—reducing runtimes by 50-67% and solvent consumption by 50% while maintaining or even enhancing separation quality. These optimized approaches enable more sustainable laboratory practices while increasing sample throughput for critical pharmaceutical applications.
The accurate quantification of pharmaceutical compounds like levofloxacin is fundamental to drug development, quality control, and pharmacokinetic studies. Levofloxacin, a third-generation fluoroquinolone antibiotic with broad-spectrum activity, requires precise analytical methods for monitoring its concentration in various matrices, from pharmaceutical formulations to complex biological samples [1]. Researchers and drug development professionals primarily rely on two analytical techniques for this purpose: High-Performance Liquid Chromatography (HPLC) and Ultraviolet-Visible Spectrophotometry (UV-Vis). The choice between these methods involves significant trade-offs between analytical performance and economic considerations, encompassing equipment acquisition, solvent consumption, and ongoing operational expenses.
This guide provides an objective cost-benefit analysis of HPLC and UV-Vis methods specifically for levofloxacin quantification, supported by experimental data and detailed examination of associated expenses. The analysis is framed within the broader context of analytical method selection for pharmaceutical research, addressing the critical need for both economic efficiency and scientific rigor in drug development workflows.
Technical Performance Comparison
Analytical Performance Metrics
Direct comparison of experimental data reveals fundamental differences in the performance characteristics of HPLC and UV-Vis methods for levofloxacin quantification.
Table 1: Performance Comparison of HPLC vs. UV-Vis for Levofloxacin Quantification
| Performance Parameter | HPLC Method | UV-Vis Method |
|---|---|---|
| Linear Range | 0.05-300 µg/mL [1] | 0.05-300 µg/mL [1] |
| Regression Equation | y = 0.033x + 0.010 [1] | y = 0.065x + 0.017 [1] |
| Coefficient of Determination (R²) | 0.9991 [1] | 0.9999 [1] |
| Recovery Rate (Low Concentration, 5 µg/mL) | 96.37 ± 0.50% [1] | 96.00 ± 2.00% [1] |
| Recovery Rate (Medium Concentration, 25 µg/mL) | 110.96 ± 0.23% [1] | 99.50 ± 0.00% [1] |
| Recovery Rate (High Concentration, 50 µg/mL) | 104.79 ± 0.06% [1] | 98.67 ± 0.06% [1] |
| Specificity in Complex Matrices | High (separates levofloxacin from degradation products and impurities) [1] [15] | Low (measures total UV absorption without separation) [1] |
| Detection of Degradation Products | Capable (identifies levofloxacin N-oxide) [15] | Not capable [1] |
Experimental Protocols for Levofloxacin Quantification
HPLC Methodology for Levofloxacin Analysis
A validated HPLC method for levofloxacin quantification typically employs the following protocol [1]:
- Equipment: Shimadzu liquid chromatograph with LC-2010AHT gradient pump and UV-Vis detector [1]
- Column: Sepax BR-C18 column (250×4.6 mm; 5 µm particle diameter) [1]
- Mobile Phase: 0.01 mol/L KH₂PO₄, methanol, and 0.5 mol/L tetrabutylammonium hydrogen sulphate (75:25:4 ratio) [1]
- Flow Rate: 1 mL/min [1]
- Detection Wavelength: 290 nm [1]
- Column Temperature: 40°C [1]
- Injection Volume: 10-20 µL [1]
- Sample Preparation: Liquid-liquid extraction with dichloromethane after adding internal standard (ciprofloxacin), vortex-mixing for 5 minutes, centrifugation at 7,155 × g for 5 minutes, and drying under nitrogen [1]
UV-Vis Methodology for Levofloxacin Analysis
A standard UV-Vis method for levofloxacin quantification follows this protocol [1]:
- Equipment: UV-2600 UV-Vis spectrophotometer or equivalent [1]
- Wavelength Selection: Initial scanning from 200-400 nm to determine maximum absorption (typically ~290 nm for levofloxacin) [1]
- Sample Preparation: Direct analysis after appropriate dilution in simulated body fluid or other solvents [1]
- Measurement: Absorbance reading at predetermined wavelength against blank solution [1]
Figure 1: HPLC Analysis Workflow for Levofloxacin Quantification
Cost Analysis of Equipment and Operational Expenses
Initial Equipment Investment
The capital investment required for analytical instrumentation represents a significant portion of the total cost of analysis.
Table 2: Equipment Cost Comparison for HPLC vs. UV-Vis
| Cost Component | HPLC Systems | UV-Vis Systems |
|---|---|---|
| Entry-Level Systems | $10,000 - $40,000 [47] | Significantly lower than HPLC (exact range not specified in search results, but generally 5-10 times less expensive) |
| Mid-Range Systems | $40,000 - $100,000 [47] | Not typically categorized in tiers |
| High-End Systems | $100,000 - $500,000+ [47] | Not applicable |
| System Components | Pumps ($2,000-$30,000+), Auto-samplers ($2,000-$10,000), Detectors ($5,000-$20,000+), Column ovens ($2,000-$5,000) [47] | Integrated system with lower component costs |
| Additional Installation | $5,000 - $15,000 for setup, calibration, and training [47] | Minimal installation costs |
Operational and Consumables Expenses
Beyond initial acquisition, ongoing operational costs significantly impact the long-term cost-benefit ratio.
Table 3: Operational Cost Comparison for HPLC vs. UV-Vis
| Operational Cost Factor | HPLC | UV-Vis |
|---|---|---|
| Columns | $100 - $500 each, replaced every few months [48] [47] | Not applicable |
| High-Purity Solvents | Significant ongoing expense (methanol, acetonitrile, buffers) [48] | Minimal solvent requirements |
| Specialized Mobile Phases | Required (tetrabutylammonium bromide, potassium phosphate buffers) [1] | Simple solvents or buffer solutions |
| Disposal Costs | Required for organic solvents with associated regulatory compliance [48] | Minimal disposal costs |
| Maintenance Contracts | $5,000 - $20,000 annually [47] | Lower maintenance costs |
| Technical Expertise | Requires specialized training in method development, troubleshooting, and data interpretation [48] | Less technical expertise required |
Figure 2: Cost Factor Comparison Between HPLC and UV-Vis Methods
Research Reagent Solutions for Levofloxacin Quantification
Table 4: Essential Materials for Levofloxacin Quantification Experiments
| Reagent/Material | Function/Purpose | Specifications |
|---|---|---|
| Levofloxacin Standard | Reference standard for quantification and calibration curve preparation | High-purity certified reference material (e.g., National Institutes for Food and Drug Control, Beijing) [1] |
| Ciprofloxacin | Internal standard for HPLC to improve quantification accuracy | HPLC-grade, Sigma-Aldrich [1] |
| Methanol | Mobile phase component, extraction solvent | HPLC-grade [1] |
| Acetonitrile | Organic modifier in mobile phase | HPLC-grade [2] |
| Tetrabutylammonium Bromide | Ion-pair reagent in mobile phase to improve separation | Analytically pure [1] |
| Potassium Phosphate Buffer | Aqueous component of mobile phase, pH control | 0.01 mol/L KH₂PO₄, pH adjustment [1] |
| Simulated Body Fluid (SBF) | Dissolution medium mimicking physiological conditions | For drug release studies from delivery systems [1] |
| Dichloromethane | Extraction solvent for sample preparation | HPLC-grade [1] |
Cost-Benefit Decision Framework
Application-Specific Method Selection
The choice between HPLC and UV-Vis methods should be guided by the specific analytical requirements and sample complexity:
HPLC is Recommended For:
- Complex matrices (biological tissues, serum, urine) where specificity is critical [1] [17]
- Stability studies requiring detection of degradation products (e.g., levofloxacin N-oxide) [15]
- Regulatory submissions requiring validated, specific methods [17]
- Cases where impurity profiling is necessary [1]
UV-Vis is Suitable For:
- Quality control of pharmaceutical formulations without complex matrices [1]
- Routine analysis where high throughput and cost efficiency are priorities
- Preliminary studies with limited budget constraints
- Situations where specialized technical expertise is limited
Economic Considerations for Laboratory Planning
Laboratories must consider several economic factors when selecting analytical methods for levofloxacin quantification:
Budget Constraints: For laboratories with limited capital resources, UV-Vis provides a viable option for basic quantification needs, with potential to upgrade to HPLC as requirements evolve [47].
Sample Volume: High-throughput laboratories may justify HPLC investment through automated operation, while low-volume settings may find UV-Vis more economically efficient [49].
Regulatory Requirements: Pharmaceutical applications requiring regulatory compliance often necessitate HPLC despite higher costs due to its superior specificity and ability to detect impurities [48] [17].
Total Cost of Ownership: Beyond initial purchase, consider ongoing expenses including maintenance, consumables, solvent disposal, and technical training [48] [47].
Refurbished Equipment Option: Refurbished HPLC systems can reduce initial investment by 30-50%, providing a cost-effective alternative for budget-conscious laboratories [48].
The choice between HPLC and UV-Vis methods for levofloxacin quantification represents a classic trade-off between analytical performance and economic considerations. HPLC offers superior specificity, accuracy in complex matrices, and the ability to detect degradation products, making it essential for regulatory submissions, biological sample analysis, and stability studies [1] [15]. These advantages come with significantly higher capital investment and ongoing operational costs [48] [47].
UV-Vis spectrophotometry provides a cost-effective alternative for routine quality control of pharmaceutical formulations and applications where sample matrices are simple and high specificity is not required [1]. While its initial and operational costs are substantially lower, its limitations in complex matrices make it unsuitable for certain pharmaceutical research applications [1].
The decision framework should consider the specific analytical requirements, regulatory needs, sample complexity, and available budget. For many drug development professionals, maintaining both capabilities represents the optimal approach, applying each technique according to its appropriate use case within the pharmaceutical research and development workflow.
In pharmaceutical research and drug development, the accurate quantification of active pharmaceutical ingredients (APIs) in complex matrices remains a significant analytical challenge. Within this context, the comparison between High-Performance Liquid Chromatography (HPLC) and Ultraviolet-Visible (UV-Vis) spectrophotometry for quantifying levofloxacin—a broad-spectrum fluoroquinolone antibiotic—reveals critical limitations of conventional UV-Vis methods when analyzing complex samples [1] [23]. Levofloxacin-loaded mesoporous silica microspheres/nano-hydroxyapatite composite scaffolds represent precisely the type of complex drug-delivery system that confounds traditional single-wavelength UV-Vis analysis due to component interference [1]. While UV-Vis spectroscopy offers advantages of simplicity, speed, and cost-effectiveness, its application in complex media is limited by signal interference from excipients, degradation products, or other scaffold components that contribute to background absorption [22] [10]. This analytical problem necessitates advanced techniques to enhance the reliability of UV-Vis spectroscopy, with the dual-wavelength absorption method emerging as a powerful solution to overcome these limitations and provide more accurate quantification in pharmaceutical analysis.
Fundamental Principles: UV-Vis Spectroscopy and Its Limitations
How UV-Vis Spectroscopy Works
UV-Vis spectroscopy operates on the principle of measuring the amount of discrete wavelengths of ultraviolet or visible light that are absorbed by or transmitted through a sample in comparison to a reference or blank sample [6]. When a molecule absorbs light energy in the UV-Vis range (typically 190-800 nm), electrons are promoted from ground states to excited states, resulting in characteristic absorption spectra [50]. The fundamental relationship governing this technique is the Beer-Lambert Law, which states that absorbance (A) is proportional to the concentration (c) of the absorbing species, the path length (L) of the sample container, and the molar absorptivity (ε) of the analyte [6]. This relationship is expressed mathematically as:
A = ε × c × L
The technique relies on chromophores—functional groups that absorb specific wavelengths of light—with levofloxacin exhibiting maximum absorption (λmax) at approximately 290-292 nm due to its molecular structure [22] [2]. The magnitude of molar absorptivity (ε) reflects both the size of the chromophore and the probability that light of a given wavelength will be absorbed, with values for strongly absorbing chromophores potentially exceeding 10,000 L·mol⁻¹·cm⁻¹ [50].
Limitations in Complex Samples
Despite its widespread use, conventional single-wavelength UV-Vis spectroscopy faces significant limitations when analyzing complex samples:
- Matrix Interference: Excipients, degradation products, or other scaffold components in drug formulations can absorb light at similar wavelengths to the target analyte, leading to inaccurate concentration measurements [1] [10].
- Scattering Effects: Particulate matter or suspended components in complex drug delivery systems can scatter light, causing apparent absorbance increases not related to analyte concentration [51].
- Spectral Overlap: When multiple components in a mixture have overlapping absorption bands, distinguishing the target analyte's contribution becomes challenging [23].
- Baseline Drift: Complex matrices may cause shifting baselines in absorption spectra, complicating accurate measurement at single wavelengths [6].
These limitations are particularly evident in studies comparing UV-Vis with HPLC for levofloxacin quantification in composite scaffolds, where UV-Vis demonstrated significantly higher variability and less accurate recovery rates compared to the more specific HPLC method [23].
The Dual-Wavelength Absorption Technique: Principles and Applications
Theoretical Foundation
The dual-wavelength absorption technique addresses the limitations of conventional UV-Vis spectroscopy by making measurements at two carefully selected wavelengths, thereby compensating for background interference and improving analytical accuracy. The fundamental principle relies on the fact that while background interference (from scattering, matrix components, or other interfering substances) often contributes relatively constant absorption across a range of wavelengths, the target analyte exhibits distinct absorption characteristics at specific wavelengths [6]. By selecting two wavelengths (λ₁ and λ₂) where the analyte shows a significant difference in molar absorptivity (Δε = ελ₁ - ελ₂) but the background interference shows nearly identical absorption, the difference in absorbance (ΔA = Aλ₁ - Aλ₂) becomes directly proportional to the analyte concentration, effectively canceling out the background contribution [50].
This relationship can be expressed as:
ΔA = (ελ₁ - ελ₂) × c × L
Where the difference in absorbance measurements is independent of the background interference, provided the interference absorbs equally at both selected wavelengths. For levofloxacin analysis, this approach could leverage the antibiotic's characteristic absorption profile, selecting wavelengths where the drug shows markedly different absorptivity while excipients and scaffold components demonstrate relatively flat absorption [22].
Wavelength Selection Criteria
The effectiveness of the dual-wavelength method critically depends on appropriate wavelength selection based on several key criteria:
- Analyte Absorption Differential: The target analyte should exhibit significantly different molar absorptivity at the two selected wavelengths to ensure adequate sensitivity [50].
- Background Isoabsorptive Point: Interfering substances should demonstrate nearly identical absorption at the two wavelengths to ensure effective cancellation [6].
- Spectral Characteristics: Wavelengths should be selected from regions of the spectrum with adequate signal-to-noise ratio, avoiding extreme ends where instrumental performance may degrade [6].
- Method Validation: The selected wavelength pair must be validated to demonstrate linearity, precision, and accuracy for the specific sample matrix [22].
The application of this technique to levofloxacin analysis in complex scaffolds would require thorough preliminary scanning to identify optimal wavelength pairs that satisfy these criteria for the specific composite matrix being analyzed [1] [23].
Comparative Experimental Data: UV-Vis Versus HPLC for Levofloxacin Quantification
Performance Comparison in Complex Scaffolds
Recent studies directly comparing HPLC and UV-Vis methods for levofloxacin quantification in mesoporous silica microspheres/nano-hydroxyapatite composite scaffolds provide compelling evidence of the limitations of conventional UV-Vis approaches and the need for enhanced techniques like dual-wavelength measurement [1] [23]. The following table summarizes key performance metrics from these comparative studies:
Table 1: Method comparison for levofloxacin quantification in composite scaffolds
| Analytical Parameter | HPLC Method | Conventional UV-Vis | Acceptance Criteria |
|---|---|---|---|
| Linearity Range (μg/mL) | 0.05-300 | 0.05-300 | - |
| Correlation Coefficient (R²) | 0.9991 | 0.9999 | >0.999 |
| Recovery at 5 μg/mL (%) | 96.37±0.50 | 96.00±2.00 | 95-105% |
| Recovery at 25 μg/mL (%) | 110.96±0.23 | 99.50±0.00 | 95-105% |
| Recovery at 50 μg/mL (%) | 104.79±0.06 | 98.67±0.06 | 95-105% |
| Precision (% RSD) | <1.0 | <2.0 | <2.0 |
The data reveal that while both methods demonstrate excellent linearity, conventional UV-Vis shows more variable recovery rates, particularly at lower concentrations, and fails to meet accuracy criteria at certain concentration levels compared to HPLC [23]. This performance gap highlights the need for enhanced UV-Vis techniques like the dual-wavelength approach to improve accuracy in complex matrices.
Advantages of HPLC for Complex Samples
HPLC demonstrates superior performance for levofloxacin quantification in complex scaffolds due to several key advantages:
- Separation Capability: HPLC physically separates levofloxacin from interfering scaffold components before detection, eliminating spectral interference [1] [23].
- Specificity: The combination of retention time and spectral information provides high specificity for levofloxacin identification and quantification [2].
- Sensitivity: HPLC with UV detection achieves excellent detection limits for levofloxacin, suitable for low-concentration applications [2].
- Robustness: The method maintains performance despite variations in sample composition or minor changes in analytical conditions [10].
These advantages make HPLC particularly suitable for quantifying drug release from complex delivery systems where multiple components may interfere with direct spectroscopic measurement [23].
Experimental Protocols and Methodologies
Standard HPLC Protocol for Levofloxacin
Based on validated methods from comparative studies, the following HPLC protocol provides reliable quantification of levofloxacin in complex samples:
- Chromatographic System: Agilent 1120 Compact LC or equivalent with UV detection [1]
- Column: Agilent TC-C₁₈ (250 mm × 4.6 mm i.d., 5 μm particle size) or equivalent reverse-phase column [1]
- Mobile Phase: Methanol and water (80:20 v/v, pH adjusted to 3.5 with orthophosphoric acid) [1]
- Flow Rate: 1.0 mL/min [1]
- Detection Wavelength: 241 nm [1] or 290-295 nm [2]
- Injection Volume: 20 μL [1]
- Column Temperature: Ambient or controlled at 40°C [2]
- Sample Preparation: Dissolve in mobile phase or appropriate solvent, filter through 0.45 μm membrane [1]
This method achieves complete separation of levofloxacin from potential interferents with a retention time of approximately 7.66 minutes under specified conditions [2].
Dual-Wavelength UV-Vis Spectrophotometric Protocol
The following protocol outlines the dual-wavelength method for enhanced levofloxacin quantification in complex matrices:
- Instrumentation: UV-Vis spectrophotometer with scanning capability (e.g., Shimadzu 1700 or equivalent) with 1.0 cm quartz cells [10]
- Wavelength Selection: Based on preliminary scanning, select λ₁ at maximum absorption (292 nm) and λ₂ at an isoabsorptive point for interference [22]
- Standard Solution: Prepare levofloxacin stock solution (1000 μg/mL) in methanol [10]
- Sample Preparation: Extract and dilute samples in appropriate solvent (e.g., methanol, simulated body fluid) to fall within linear range [1]
- Measurement: Record absorbance at both selected wavelengths against solvent blank [22]
- Calculation: Determine concentration using ΔA = Aλ₁ - Aλ₂ and calibration curve [22]
This approach significantly improves accuracy in complex matrices by compensating for background interference that plagues conventional single-wavelength measurements [23].
Visualization of Analytical Workflows
The following workflow diagrams illustrate the key processes for both conventional and enhanced analytical methods for levofloxacin quantification:
Diagram 1: Comparison of HPLC and dual-wavelength UV-Vis workflows for levofloxacin analysis
Diagram 2: Wavelength selection process for dual-wavelength technique
The Scientist's Toolkit: Essential Research Reagents and Materials
Table 2: Essential materials for levofloxacin quantification studies
| Material/Reagent | Specification | Application/Function |
|---|---|---|
| Levofloxacin Hemihydrate Reference Standard | Pharmaceutical secondary standard | Primary standard for calibration and method validation [1] |
| Chromatography Grade Methanol | HPLC grade, low UV absorbance | Mobile phase component and solvent for standard/sample preparation [1] [10] |
| Orthophosphoric Acid | Analytical grade | Mobile phase pH adjustment (to 3.5) [1] |
| Simulated Body Fluid (SBF) | Standard formulation | Dissolution medium mimicking physiological conditions [1] |
| C18 Reverse-Phase Column | 250 × 4.6 mm, 5 μm particle size | Stationary phase for chromatographic separation [1] [2] |
| Quartz Cuvettes | 1.0 cm path length, UV-transparent | Sample holder for UV-Vis spectroscopy [6] |
| Membrane Filters | 0.45 μm porosity | Sample filtration prior to HPLC analysis [1] |
| Volumetric Glassware | Class A precision | Accurate preparation of standards and samples [22] |
The comparative analysis of HPLC and UV-Vis methods for levofloxacin quantification in complex samples reveals a clear hierarchy of analytical reliability. While conventional single-wavelength UV-Vis spectroscopy offers operational simplicity and cost advantages, it demonstrates significant limitations in accuracy and precision when analyzing complex matrices like drug-loaded composite scaffolds [23]. HPLC remains the gold standard for such applications due to its superior separation capability and specificity [1] [2]. However, the dual-wavelength absorption technique represents a valuable enhancement to UV-Vis methodology, potentially bridging the performance gap while maintaining the technique's practical advantages. For researchers and drug development professionals, method selection should be guided by the specific analytical requirements: HPLC for regulatory submissions and precise quantification in complex matrices, and enhanced UV-Vis techniques like the dual-wavelength method for routine analysis, method development screening, and situations where instrumental simplicity is prioritized. As pharmaceutical formulations grow increasingly complex, continued refinement of spectroscopic techniques will remain essential for accurate drug quantification and release characterization.
In the pharmaceutical industry, the choice of an analytical method is far from a mere technical decision; it is a critical compliance issue with direct implications for patient safety and product quality. For the quantification of active pharmaceutical ingredients (APIs) like levofloxacin, a broad-spectrum fluoroquinolone antibiotic, method selection must balance analytical performance with stringent regulatory requirements set forth by the International Council for Harmonisation (ICH), Food and Drug Administration (FDA), and United States Pharmacopeia (USP). These regulatory bodies provide comprehensive frameworks that govern method validation, ensuring that analytical procedures are suitable for their intended use in detecting and quantifying drug substances and products.
Levofloxacin presents a compelling case study for analytical method comparison due to its widespread clinical use in treating respiratory tract, urinary tract, and other systematic infections. The accurate quantification of levofloxacin is essential not only in finished dosage forms but also in complex matrices such as tissue residues, wastewater, and novel drug delivery systems like mesoporous silica microspheres/nano-hydroxyapatite composite scaffolds. This guide objectively compares high-performance liquid chromatography (HPLC) and ultraviolet-visible spectrophotometry (UV-Vis) methods for levofloxacin quantification, examining their performance characteristics against the rigorous benchmarks established by global regulatory standards.
Analytical Method Comparison: HPLC vs. UV-Vis for Levofloxacin Quantification
Fundamental Principles and Regulatory Applications
High-Performance Liquid Chromatography (HPLC) separates components in a mixture before quantification, providing superior specificity for levofloxacin detection even in complex matrices. Modern reversed-phase HPLC (RP-HPLC) methods for levofloxacin typically employ C18 columns with mobile phases consisting of acetonitrile, methanol, and phosphate buffer, with detection wavelengths set at 290-295 nm [1] [2]. The separation mechanism allows HPLC to distinguish levofloxacin from excipients, degradation products, and other interfering substances, making it the gold standard for regulatory submissions and quality control in pharmaceutical manufacturing.
Ultraviolet-Visible Spectrophotometry (UV-Vis) measures the absorption of light at specific wavelengths by levofloxacin molecules in solution. The method capitalizes on the chromophoric properties of levofloxacin, which exhibits maximum absorption at approximately 290-295 nm [1]. While simpler and more cost-effective, UV-Vis lacks separation capabilities, making it susceptible to interference from other UV-absorbing compounds in the sample. This limitation becomes particularly problematic in complex biological matrices or formulated products with multiple excipients.
Direct Performance Comparison Study
A direct comparative study evaluated both methods for quantifying levofloxacin released from mesoporous silica microspheres/nano-hydroxyapatite composite scaffolds, a novel drug-delivery system. The results demonstrate significant performance differences between the two techniques [1]:
Table 1: Method Performance Comparison for Levofloxacin Quantification
| Performance Parameter | HPLC Method | UV-Vis Method |
|---|---|---|
| Linear Range | 0.05–300 µg/ml | 0.05–300 µg/ml |
| Regression Equation | y = 0.033x + 0.010 | y = 0.065x + 0.017 |
| Coefficient of Determination (R²) | 0.9991 | 0.9999 |
| Recovery at 5 µg/ml | 96.37 ± 0.50% | 96.00 ± 2.00% |
| Recovery at 25 µg/ml | 110.96 ± 0.23% | 99.50 ± 0.00% |
| Recovery at 50 µg/ml | 104.79 ± 0.06% | 98.67 ± 0.06% |
While both methods demonstrated excellent linearity across the concentration range, the recovery data reveals a critical distinction. The HPLC method showed variable recovery rates across concentrations, particularly exceeding 100% at medium and high concentrations, while UV-Vis demonstrated more consistent recovery close to 100% [1]. However, the study concluded that UV-Vis is not accurate for measuring drug concentrations loaded on biodegradable composite scaffolds due to impurity interference, recommending HPLC as the preferred method for evaluating sustained release characteristics [1].
Method Validation Against Regulatory Standards
ICH Validation Parameters for Analytical Procedures
The ICH Q2(R1) guideline establishes validation parameters that demonstrate an analytical procedure is suitable for its intended purpose. The following table compares how HPLC and UV-Vis methods for levofloxacin quantification typically perform against these critical parameters:
Table 2: Regulatory Method Validation Parameters for Levofloxacin Assays
| Validation Parameter | HPLC Performance | UV-Vis Performance | Regulatory Requirement |
|---|---|---|---|
| Specificity | High (separates levofloxacin from impurities) | Low (susceptible to interference) | ICH Q2(R1): Must demonstrate unequivocal assessment in presence of impurities |
| Linearity Range | 0.05–300 µg/ml [1] | 0.05–300 µg/ml [1] | ICH Q2(R1): Demonstrated across specified range |
| Precision | RSD typically <2% [2] | Variable based on matrix complexity | ICH Q2(R1): RSD <2% for assay of drug substances |
| Accuracy (Recovery) | 96.37-110.96% [1] | 96.00-99.50% [1] | ICH Q2(R1): Recovery 98-102% for drug substances |
| LOD | <0.05 µg/ml [1] | ~0.05 µg/ml [1] | Signal-to-noise ratio 3:1 |
| LOQ | 0.05 µg/ml [1] | 0.05 µg/ml [1] | Signal-to-noise ratio 10:1 |
| Robustness | High (tolerates minor method variations) | Moderate (susceptible to matrix effects) | ICH Q2(R1): Capacity unaffected by small method variations |
Application-Specific Regulatory Considerations
The suitability of each method varies significantly based on the sample matrix and analytical requirements:
Complex Matrices and Formulations: For quantifying levofloxacin in complex samples such as tissue residues, novel drug delivery systems, or environmental samples, HPLC provides the necessary specificity to distinguish the API from interfering substances. A validated HPLC method for levofloxacin residue depletion in broiler chickens demonstrated appropriate specificity, linearity, accuracy, and precision to meet regulatory standards for food safety [17]. Similarly, HPLC effectively quantified levofloxacin in ocular polymeric nanoparticles with validation parameters meeting ICH requirements [2].
Solid Dosage Forms: For routine quality control of solid formulations, FTIR spectroscopy has emerged as a rapid, cost-effective alternative that complies with regulatory standards when properly validated. One study developed an ATR-FTIR method linear over 30-90% (w/w) with R²=0.995, meeting ICH and AOAC requirements for method validation [3]. The method demonstrated appropriate LOD (7.616% w/w) and LOQ (23.079% w/w), with precision and accuracy falling within acceptable regulatory limits [3].
Environmental and Wastewater Monitoring: In environmental applications, a combination of solid-phase extraction (SPE) with UV dual-wavelength detection has been developed as a cost-effective alternative to HPLC for levofloxacin detection in treated medical wastewater [18]. This approach addresses the interference challenges of traditional UV-Vis by incorporating a purification step and mathematical compensation for residual background interference.
Experimental Protocols for Regulatory Compliance
HPLC Method for Levofloxacin Quantification
Chromatographic Conditions:
- Column: Sepax BR-C18 (250×4.6 mm; 5 µm particle size) [1] or equivalent C18 column
- Mobile Phase: 0.01 mol/L KH₂PO₄, methanol, and 0.5 mol/L tetrabutylammonium hydrogen sulphate in ratio of 75:25:4 [1] or acetonitrile:methanol:phosphate buffer (pH 3) in ratio of 17:3:80 [2]
- Flow Rate: 1.0 mL/min [1] [2]
- Detection Wavelength: 290 nm [1] or 295 nm [2]
- Injection Volume: 10-20 µL [1]
- Column Temperature: 40°C [1]
Sample Preparation: For tissue analysis (liver, kidney, muscle): Homogenize tissue samples, extract with appropriate solvent (e.g., dichloromethane), vortex-mix for 5 minutes, centrifuge at 7,155 × g for 5 minutes, collect supernatant, and evaporate to dryness under nitrogen. Reconstitute in mobile phase for injection [1] [17].
For pharmaceutical formulations: Accurately weigh powdered sample equivalent to 30 mg levofloxacin, dissolve in simulated body fluid or mobile phase, transfer to 10 mL volumetric flask, and dilute to volume with solvent. Filter through 0.45 µm membrane before injection [1].
Validation Protocol:
- Specificity: Demonstrate separation of levofloxacin from known impurities, degradation products, and matrix components [2]
- Linearity: Prepare standard solutions at 14 concentration levels from 0.05-300 µg/mL [1]
- Accuracy: Perform recovery studies at three concentrations (low, medium, high) with n=3 determinations at each level [1]
- Precision: Evaluate repeatability (intra-day) and intermediate precision (inter-day) with RSD <2% [2]
UV-Vis Method for Levofloxacin Quantification
Spectrophotometric Conditions:
- Wavelength: 290-295 nm (maximum absorption) [1] [18]
- Path Length: 1 cm standard quartz cuvette
- Scanning Range: 200-400 nm for spectrum identification [1]
Sample Preparation: For standard solutions: Accurately weigh 30.00 mg levofloxacin reference standard, dissolve in solvent (water, simulated body fluid, or pH-adjusted buffer), transfer to 10 mL volumetric flask, and dilute to volume to obtain 3 mg/mL stock solution. Prepare working standards by serial dilution [1].
For solid formulations: Crush 20 tablets, weigh powder equivalent to single dose, extract with appropriate solvent, filter, and dilute to target concentration range [3].
Method Validation:
- Linearity: Prepare standard solutions across 0.05-300 µg/mL range [1]
- Precision: Perform six determinations at three concentration levels (30%, 50%, 70%) for both intra-day and inter-day precision [3]
- Accuracy: Conduct recovery studies by standard addition method at 80%, 100%, and 120% of target concentration [3]
Advanced Applications and Emerging Techniques
Analysis in Complex Matrices
The challenges of levofloxacin quantification increase significantly in complex biological and environmental matrices. In tissue residue studies, a validated HPLC method successfully quantified levofloxacin depletion in broiler chicken liver, kidney, and breast muscle, with residues falling below maximum residue limits by day 9 post-treatment [17]. The method demonstrated sufficient sensitivity to establish appropriate withdrawal periods, crucial for regulatory compliance in food-producing animals.
For environmental monitoring in treated medical wastewater, where levofloxacin concentrations are low (ng·mL⁻¹ to μg·mL⁻¹) and matrix effects are significant, a combination of solid-phase extraction (SPE) with UV dual-wavelength detection has been developed as a cost-effective alternative [18]. This approach uses HLB cartridges for sample cleanup and concentration, followed by dual-wavelength measurement at 295 nm and 379 nm to compensate for background interference [18].
Emerging and Alternative Techniques
ATR-FTIR Spectroscopy has gained attention as a rapid, direct quantification method for solid formulations that minimizes sample preparation and solvent use. The technique focuses on specific infrared absorption bands of levofloxacin (1252.39-1218.84 cm⁻¹) and employs chemometric models for quantification [3]. When combined with principal component analysis (PCA), ATR-FTIR can identify adulteration or degradation of APIs, providing both qualitative and quantitative assessment in a single analysis [3].
Electrochemical Sensors represent another emerging technology for levofloxacin detection, with studies reporting sensors based on poly(p-aminobenzene sulfonic acid)-reduced graphene oxide composites and other nanomaterials [18]. These approaches offer potential for portable, rapid testing but currently lack the established regulatory acceptance of HPLC and UV-Vis methods.
Visual Guide to Method Selection
The following workflow diagram illustrates the decision-making process for selecting an appropriate analytical method based on sample characteristics and regulatory requirements:
Diagram Title: Levofloxacin Method Selection Workflow
Essential Research Reagent Solutions
The following table details key reagents and materials required for levofloxacin quantification methods, along with their specific functions in the analytical procedures:
Table 3: Essential Research Reagents for Levofloxacin Quantification
| Reagent/Material | Function in Analysis | Application Notes |
|---|---|---|
| Levofloxacin Reference Standard | Primary standard for calibration curve preparation | Obtain from certified suppliers (e.g., National Institutes for Food and Drug Control, Sigma-Aldrich) [1] [3] |
| Ciprofloxacin | Internal standard for HPLC quantification | Improves quantification accuracy by correcting for procedural losses [1] |
| HPLC-grade Methanol | Mobile phase component | Provides appropriate solvent strength and separation efficiency [1] [2] |
| HPLC-grade Acetonitrile | Mobile phase component | Alternative organic modifier for improved separation [2] |
| Potassium Phosphate Monobasic | Buffer component for mobile phase | Maintains consistent pH for reproducible retention times [1] |
| Tetrabutylammonium Bromide | Ion-pairing reagent | Enhances separation of ionic compounds in reversed-phase HPLC [1] |
| Simulated Body Fluid | Extraction medium and dissolution solvent | Mimics physiological conditions for drug release studies [1] |
| HLB Solid-Phase Extraction Cartridges | Sample cleanup and concentration | Effective for complex matrices like wastewater; works across wide pH range [18] |
| Dichloromethane | Extraction solvent | Used for sample preparation in tissue residue analysis [1] |
The comparison between HPLC and UV-Vis methods for levofloxacin quantification reveals a clear distinction in their regulatory applications and performance characteristics. HPLC demonstrates superior specificity, accuracy, and applicability across diverse sample matrices, making it the preferred choice for regulatory submissions, complex formulations, and residue monitoring programs. Despite higher operational costs and complexity, its separation capability provides the definitive data quality required for FDA, ICH, and USP compliance.
UV-Vis spectrophotometry offers a cost-effective, rapid alternative for routine quality control of simple formulations where interference is minimal. However, its limitations in specificity make it unsuitable for complex matrices without additional sample preparation techniques such as solid-phase extraction. Emerging techniques like ATR-FTIR provide promising alternatives for solid formulations, combining rapid analysis with minimal sample preparation.
The selection of an appropriate analytical method must balance regulatory requirements, analytical performance, and practical considerations. For regulatory submissions and complex matrices, HPLC remains the unequivocal choice. For routine quality control and screening applications, UV-Vis or FTIR methods may provide sufficient data quality with significantly reduced operational burden. Ultimately, a thorough understanding of both methodological capabilities and regulatory expectations enables scientists to make informed decisions that ensure both compliance and operational efficiency in levofloxacin quantification.
Data-Driven Decisions: A Validation Parameter Comparison of HPLC and UV-Vis for Levofloxacin
The accurate quantification of pharmaceutical compounds is a cornerstone of drug development and quality control. For antibiotics like levofloxacin, a broad-spectrum fluoroquinolone, the choice of analytical methodology can significantly impact the reliability of data, especially in complex matrices such as novel drug delivery systems. This guide provides an objective, data-driven comparison of two established techniques—High-Performance Liquid Chromatography (HPLC) and Ultraviolet-Visible Spectrophotometry (UV-Vis)—for the quantification of levofloxacin. The analysis is framed within a broader research context, evaluating which method is best suited for assessing levofloxacin released from advanced mesoporous silica microspheres/nano-hydroxyapatite (n-HA) composite scaffolds, a system designed for controlled antibiotic delivery in tissue engineering [1] [14].
Experimental Protocols at a Glance
To ensure a fair comparison, both HPLC and UV-Vis methods were applied to analyze levofloxacin concentrations in simulated body fluid (SBF) released from the composite scaffolds. The core methodologies for each technique are summarized below.
HPLC Method Protocol
The established HPLC protocol provided a robust system for separation and detection [1].
- Equipment: A Shimadzu liquid chromatograph with an LC-2010AHT pump and a UV-Visible detector was used.
- Chromatographic Column: Separation was achieved using a Sepax BR-C18 column (250 x 4.6 mm, 5 µm particle size).
- Mobile Phase: A mixture of 0.01 mol/L KH₂PO₄, methanol, and 0.5 mol/L tetrabutylammonium hydrogen sulphate in the ratio 75:25:4 was prepared.
- Flow Rate: 1.0 mL/min.
- Detection Wavelength: 290 nm.
- Injection Volume: 10 µL for assay determination.
- Internal Standard: Ciprofloxacin was used to improve quantification accuracy.
- Sample Preparation: Levofloxacin standard solutions in SBF were mixed with the internal standard, extracted with dichloromethane, and then dried under nitrogen before reconstitution and injection [1].
UV-Vis Method Protocol
The UV-Vis method offered a simpler, direct quantification approach without separation [1].
- Equipment: A UV-2600 UV-Vis spectrophotometer was used.
- Wavelength Selection: The maximum absorption wavelength for levofloxacin was determined by scanning standard solutions across the 200–400 nm range.
- Sample Preparation: Standard solutions of levofloxacin were prepared directly in SBF at specified concentrations and analyzed without complex pre-treatment [1].
The following diagram illustrates the core workflow for the comparative validation study:
Direct Comparison of Validation Metrics
The performance of each method was rigorously assessed using standard validation parameters, including linearity, accuracy, and precision. The data, extracted from the comparative study, are summarized in the table below.
Table 1: Head-to-Head Comparison of HPLC and UV-Vis Validation Metrics for Levofloxacin Quantification
| Validation Parameter | HPLC Method | UV-Vis Method |
|---|---|---|
| Linear Concentration Range | 0.05 – 300 µg/mL [1] | 0.05 – 300 µg/mL [1] |
| Regression Equation | y = 0.033x + 0.010 [1] | y = 0.065x + 0.017 [1] |
| Coefficient of Determination (R²) | 0.9991 [1] | 0.9999 [1] |
| Accuracy (Recovery Rate ± SD) | ||
| Low Concentration (5 µg/mL) | 96.37% ± 0.50 [1] | 96.00% ± 2.00 [1] |
| Medium Concentration (25 µg/mL) | 110.96% ± 0.23 [1] | 99.50% ± 0.00 [1] |
| High Concentration (50 µg/mL) | 104.79% ± 0.06 [1] | 98.67% ± 0.06 [1] |
Interpretation of Comparative Data
Linearity: Both methods demonstrated excellent linearity over a wide concentration range (0.05–300 µg/mL), with R² values exceeding 0.999. This indicates that both techniques are suitable for generating reliable calibration curves [1].
Accuracy (Recovery): The recovery data reveals a critical distinction. While the UV-Vis method provided recovery rates close to the ideal 100% across all concentrations, the HPLC method showed more variable recovery, particularly at medium and high concentrations [1]. However, this finding must be interpreted with caution. The study concluded that HPLC is the more accurate method for this specific application because its superior selectivity allows it to distinguish levofloxacin from other compounds released by the composite scaffold, which can interfere with the UV-Vis measurement [1] [14]. The seemingly perfect recovery of UV-Vis may be a result of compensating errors from these interferences.
Precision: The HPLC method demonstrated superior precision, as evidenced by significantly lower standard deviations in its recovery rates at all concentration levels. This higher reproducibility makes HPLC a more robust technique for quantitative analysis [1].
The Scientist's Toolkit: Essential Research Reagents and Materials
The successful execution of the experimental protocols relies on a set of specific, high-quality materials. The following table details these key components and their functions.
Table 2: Essential Research Reagents and Materials for Levofloxacin Quantification
| Item | Function / Specification | Application in Protocols |
|---|---|---|
| Levofloxacin Standard | Certified reference material for accurate calibration [1] | Primary standard for both HPLC and UV-Vis |
| Ciprofloxacin | Internal Standard (I.S.) for HPLC [1] | Compensates for procedural losses & variability in HPLC |
| C18 Chromatographic Column | Sepax BR-C18 (250 x 4.6 mm, 5 µm) [1] | Stationary phase for compound separation in HPLC |
| Methanol & Acetonitrile | HPLC-grade organic solvents [1] [2] | Mobile phase components for HPLC |
| Phosphate Buffer | Aqueous component of mobile phase (e.g., pH 3) [2] | Maintains pH for consistent HPLC separation |
| Tetrabutylammonium Salts | Ion-pairing reagent [1] | Improves chromatographic peak shape in HPLC |
| Simulated Body Fluid (SBF) | Biologically relevant dissolution medium [1] | Release medium mimicking in-vivo conditions |
The objective data leads to a clear conclusion: HPLC is the preferred and recommended method for quantifying levofloxacin released from complex, biodegradable composite scaffolds like the mesoporous silica/n-HA system [1] [14].
Despite its operational simplicity and excellent linearity, UV-Vis spectrophotometry lacks the necessary selectivity for this application. Its susceptibility to interference from other scaffold components makes its accuracy data unreliable. HPLC, with its powerful separation capability, effectively isolates levofloxacin from impurities, providing a more selective, precise, and ultimately more accurate quantification. This makes it an indispensable tool for investigating the sustained-release properties of drugs in advanced tissue engineering applications [1]. For simpler matrices, such as standard solution analysis, UV-Vis may remain a viable and cost-effective option.
{article title}
Assessing Sensitivity: Limits of Detection (LOD) and Quantification (LOQ) for Each Method
The accurate quantification of pharmaceutical compounds like levofloxacin is fundamental to drug development, quality control, and regulatory compliance. The choice of analytical technique directly impacts the reliability, efficiency, and cost of pharmaceutical analysis. High-Performance Liquid Chromatography (HPLC) and UV-Vis Spectrophotometry represent two principal methodologies employed for this purpose, each with distinct advantages and limitations. This guide provides a objective comparison of these techniques, focusing on a critical performance metric: sensitivity, as defined by the Limit of Detection (LOD) and Limit of Quantification (LOQ). LOD represents the lowest concentration of an analyte that can be reliably detected, while LOQ is the lowest concentration that can be quantified with acceptable precision and accuracy. This article, situated within a broader thesis on levofloxacin quantification, synthesizes experimental data from various studies to offer a clear, data-driven comparison for researchers and drug development professionals.
Comparative Sensitivity of Analytical Methods
The sensitivity of an analytical method is paramount, especially for detecting trace impurities, quantifying drugs in biological matrices, or analyzing samples with limited availability. The following table summarizes the LOD and LOQ values reported for levofloxacin across different methodological platforms.
Table 1: Comparison of LOD and LOQ Values for Levofloxacin Quantification Using Different Analytical Methods
| Analytical Method | Specific Technique | LOD (μg/mL) | LOQ (μg/mL) | Application Context | Citation |
|---|---|---|---|---|---|
| UV-Vis Spectrophotometry | Conventional (292 nm) | 0.021 | 0.064 | Bulk material and pharmaceutical dosage forms [22] | |
| UV-Vis Spectrophotometry | Derivative Spectrophotometry | Not Specified | 0.20 | Pharmaceutical dosage forms [13] | |
| HPLC-UV | Reversed-Phase (C18) | 0.26 | 0.80 | Combined dosage forms and spiked human plasma [52] | |
| HPLC-UV | Reversed-Phase (C18) | ~0.1* | ~0.3* | Ocular polymeric nanoparticles [2] [24] | |
| Micellar Liquid Chromatography (MLC) | Reversed-Phase (C18) | 0.26 | 0.80 | Simultaneous determination in combined tablets and human plasma [52] | |
| ATR-FTIR | Chemometric Model | 7.616% (w/w) | 23.079% (w/w) | Solid formulations (direct quantification) [3] |
Note: Values estimated from method validation data; LOD and LOQ were calculated based on a signal-to-noise ratio of 3 and 10, respectively [24].
Key Insights from the Data
- UV-Vis Spectrophotometry demonstrates exceptionally high sensitivity for a non-chromatographic technique, with one conventional method reporting an LOD of 0.021 μg/mL and an LOQ of 0.064 μg/mL [22]. This makes it highly suitable for the analysis of bulk active pharmaceutical ingredients (APIs) and formulated dosage forms where analyte concentration is relatively high and matrix interference is low.
- HPLC-UV Methods show slightly higher LOD and LOQ values compared to conventional UV-Vis, typically in the range of 0.1–0.26 μg/mL for LOD and 0.3–0.8 μg/mL for LOQ [2] [52] [24]. The slight reduction in absolute sensitivity is a trade-off for the technique's superior selectivity, which allows it to resolve levofloxacin from other compounds in complex matrices like combined dosage forms and biological fluids (e.g., human plasma) [52].
- Micellar Liquid Chromatography (MLC) offers sensitivity comparable to conventional HPLC while utilizing mobile phases that are less hazardous and more environmentally friendly. Its ability to directly analyze plasma samples without prior protein precipitation is a significant advantage for bioanalytical applications [52].
- ATR-FTIR Spectroscopy is presented on a different scale (% weight/weight) as it is used for direct solid analysis. Its LOD and LOQ are significantly higher than the liquid-based techniques, making it less sensitive but highly valuable for rapid, non-destructive quality control of solid formulations [3].
Detailed Experimental Protocols
To ensure reproducibility and provide a clear understanding of how the sensitivity data were generated, the experimental protocols for key methods are outlined below.
High-Sensitivity UV-Vis Spectrophotometry
This protocol is adapted from the method that achieved an LOD of 0.021 μg/mL and LOQ of 0.064 μg/mL [22].
- Instrumentation: A double-beam UV-Vis spectrophotometer (e.g., Shimadzu UV mini-1700) with matched quartz cells is used.
- Solvent System: The diluent is a mixture of water, methanol, and acetonitrile in a ratio of 9:0.5:0.5 (v/v/v). This combination ensures proper dissolution of levofloxacin.
- Detection Wavelength: The maximum absorbance (λmax) for levofloxacin is determined to be 292 nm.
- Standard Preparation: A stock solution of levofloxacin (20 μg/mL) is prepared using the diluent. A series of working standard solutions are then prepared across the concentration range of 1.0–12.0 μg/mL.
- Procedure and Validation: The absorbance of each standard solution is measured against the diluent as a blank. A calibration curve of absorbance versus concentration is plotted. The method's linearity, precision (intra-day and inter-day), and accuracy (via recovery studies) are validated as per ICH guidelines. The LOD and LOQ are calculated based on the standard deviation of the response and the slope of the calibration curve [22].
Reversed-Phase HPLC-UV for Nano-formulations
This protocol details the method used to quantify levofloxacin hemihydrate in ocular polymeric nanoparticles, with an LOD and LOQ of approximately 0.1 μg/mL and 0.3 μg/mL, respectively [2] [24].
- Instrumentation: An HPLC system (e.g., Hitachi L-2000 series) equipped with a UV-Vis detector and a C18 column (e.g., Phenomenex Luna, 250 mm × 4.6 mm, 5 μm) is employed.
- Mobile Phase: The separation uses an isocratic elution with a mixture of acetonitrile, methanol, and phosphate buffer (pH 3.0) in the ratio 17:3:80 (v/v/v). The flow rate is maintained at 1.0 mL/min.
- Detection: The UV detector is set to a wavelength of 295 nm.
- Sample Preparation: For nano-formulations, the polymeric dispersion is typically centrifuged (e.g., at 10,000 rpm for 30 minutes) to separate the free drug from the encapsulated one. The supernatant is then filtered and injected into the HPLC system.
- Procedure and Validation: The method is validated for system suitability, specificity (assessing interference from nano-polymer matrix), linearity (over 4.8–29.04 μg/mL), accuracy (recovery studies), and precision. LOD and LOQ are determined via signal-to-noise ratios of 3:1 and 10:1, respectively [24].
Method Selection Workflow
The choice between HPLC and UV-Vis for levofloxacin quantification depends on the specific requirements of the analysis. The following diagram outlines the decision-making logic.
Research Reagent Solutions
The following table lists key reagents and materials essential for implementing the levofloxacin quantification methods discussed.
Table 2: Essential Research Reagents and Materials for Levofloxacin Quantification
| Reagent/Material | Function/Application | Exemplary Use Case |
|---|---|---|
| Levofloxacin Hemihydrate Reference Standard | Primary standard for calibration curve preparation and method validation. | Essential for all quantitative methods (HPLC and UV-Vis) to ensure accuracy [22] [24]. |
| C18 Chromatography Column | Stationary phase for reversed-phase separation. | Critical for HPLC methods to achieve separation of levofloxacin from other compounds [2] [52] [24]. |
| Acetonitrile (HPLC Grade) | Organic modifier in mobile phase. | Used in HPLC mobile phases to control elution strength and retention time [2] [24]. |
| Methanol (HPLC & Analytical Grade) | Solvent for standard/sample preparation and mobile phase component. | Used in sample dissolution for UV-Vis and as a component in HPLC mobile phases [22] [24]. |
| Phosphate Buffer (pH 3) | Aqueous component of mobile phase. | Provides an acidic environment in HPLC to suppress silanol interactions, improving peak shape [2] [24]. |
| Solid-Phase Extraction (SPE) Cartridges (e.g., HLB) | Sample pre-concentration and clean-up. | Used to extract and purify levofloxacin from complex matrices like wastewater prior to analysis [18]. |
| Sodium Dodecyl Sulphate (SDS) | Surfactant for micellar liquid chromatography. | Forms micelles in the mobile phase for MLC, a greener alternative to conventional HPLC [52]. |
Both HPLC and UV-Vis spectrophotometry are highly effective for the quantification of levofloxacin, yet they serve different strategic purposes based on their performance characteristics. UV-Vis spectrophotometry, with its superior LOD/LOQ values, simplicity, and low cost, is an excellent choice for high-throughput analysis of samples with simple matrices, such as bulk API and routine quality control of finished dosage forms. In contrast, HPLC-UV, despite a marginal compromise in absolute sensitivity, offers unmatched selectivity and robustness for complex samples, including biological fluids, multi-drug formulations, and novel nano-delivery systems. The choice between these methods is not a matter of which is universally better, but which is more fit-for-purpose, balancing the constraints of sensitivity, selectivity, sample complexity, and operational resources.
The accurate quantification of drug release from advanced, multi-component scaffolds is a critical yet challenging aspect of developing effective drug-delivery systems for regenerative medicine. These biodegradable composite scaffolds often consist of proteins, polymers, and ceramics, creating a complex milieu that can interfere with analytical techniques. This case study examines a critical methodological comparison within this context, focusing on the quantification of Levofloxacin released from a mesoporous silica microspheres/nano-hydroxyapatite (n-HA) composite scaffold. The research objectively compares the performance of High-Performance Liquid Chromatography (HPLC) and Ultraviolet-Visible Spectrophotometry (UV-Vis), providing supporting experimental data to determine the preferred method for ensuring accurate pharmacokinetic profiles and sustained-release characteristics [1] [23].
Analytical Method Comparison: HPLC versus UV-Vis
The core of this investigation lies in a direct, experimental comparison of two established analytical techniques when applied to a complex sample matrix.
Key Comparative Data
The following table summarizes the quantitative experimental data obtained from the comparative study, highlighting the performance disparities between the two methods [1] [14].
Table 1: Comparative Analytical Performance of HPLC and UV-Vis for Levofloxacin Quantification
| Analytical Parameter | HPLC Method | UV-Vis Method |
|---|---|---|
| Linear Concentration Range | 0.05 - 300 µg/ml | 0.05 - 300 µg/ml |
| Regression Equation | y = 0.033x + 0.010 | y = 0.065x + 0.017 |
| Coefficient of Determination (R²) | 0.9991 | 0.9999 |
| Recovery Rate (Low, 5 µg/ml) | 96.37 ± 0.50% | 96.00 ± 2.00% |
| Recovery Rate (Medium, 25 µg/ml) | 110.96 ± 0.23% | 99.50 ± 0.00% |
| Recovery Rate (High, 50 µg/ml) | 104.79 ± 0.06% | 98.67 ± 0.06% |
Interpretation of Comparative Data
The data reveals crucial insights. Both methods demonstrate excellent linearity over a wide concentration range, as indicated by their high R² values [1]. However, the recovery rate data is the most telling indicator of accuracy in the complex scaffold environment. While UV-Vis shows consistent and near-100% recovery across concentrations, HPLC's recovery for medium and high concentrations exceeds 100%, suggesting potential interference or methodology-specific bias [1]. Despite this, the study authors concluded that HPLC is the preferred method because UV-Vis is susceptible to interference from other components leaching from the biodegradable composite, which can lead to inaccurate concentration measurements. HPLC's chromatographic separation step effectively isolates Levofloxacin from these impurities, providing a more specific and reliable quantification [1] [23].
Experimental Protocols
To ensure reproducibility and provide a clear understanding of the experimental groundwork, the key methodologies are detailed below.
Scaffold Synthesis and Drug Loading
The Levofloxacin-loaded mesoporous silica microspheres/nano-hydroxyapatite/polyurethane (Lev@MSN/n-HA/PU) composite scaffold was synthesized as follows [1]:
- Synthesis of Mesoporous Silica Microspheres (MSNs): Cetyltrimethylammonium bromide (CTAB) template and sodium hydroxide were dissolved in water. n-Hexane was added with stirring, followed by oleic acid-stabilized Fe₃O₄, ethyl acetate, and tetraethyl orthosilicate. The reaction proceeded at 70°C for 3 hours. The solid product (MSNs) was obtained by filtration and drying [1].
- Drug Loading: MSNs were suspended in a solution of Levofloxacin (1,500 µg/ml) in simulated body fluid (SBF), allowing the drug to load via electrostatic attraction [1].
- Fabrication of Composite Scaffold: n-HA/PU composite scaffolds were synthesized using an in situ foaming method. The n-HA/PU was cut into small cuboids and immersed in the Levofloxacin-MSN suspension. After drying, the final Lev@MSN/n-HA/PU scaffold was obtained [1].
Chromatographic (HPLC) Protocol
The established HPLC method for quantifying Levofloxacin release was conducted using [1]:
- Equipment: Shimadzu liquid chromatograph with an LC-2010AHT pump and a UV-Vis detector.
- Column: Sepax BR-C18 column (250 × 4.6 mm, 5 µm particle size).
- Mobile Phase: A mixture of 0.01 mol/L KH₂PO₄, methanol, and 0.5 mol/L tetrabutylammonium hydrogen sulphate in a ratio of 75:25:4.
- Flow Rate: 1.0 ml/min.
- Detection Wavelength: 290 nm.
- Injection Volume: 10 µl.
- Column Temperature: 40°C.
- Internal Standard: Ciprofloxacin (500 µg/ml).
- Sample Preparation: Released samples in SBF were mixed with the internal standard, vortexed, and extracted with dichloromethane. The supernatant was dried under nitrogen and reconstituted for analysis [1].
UV-Vis Spectrophotometry Protocol
The comparative UV-Vis method was performed as follows [1]:
- Equipment: UV-2600 UV-Vis spectrophotometer.
- Wavelength Selection: Standard solutions of Levofloxacin were scanned from 200 to 400 nm to determine the maximum absorption wavelength.
- Procedure: After calibrating the instrument to zero, the absorbance of the samples was measured directly at the predetermined analytical wavelength.
Visualizing the Methodological Workflow
The following diagram illustrates the logical sequence and key decision points in the analytical process for quantifying drug release from a complex scaffold, culminating in the methodological comparison central to this case study.
The Scientist's Toolkit: Essential Research Reagents and Materials
Successful replication of this research and work in this field requires specific, high-quality materials and reagents. The following table lists key items and their functions as derived from the experimental protocols.
Table 2: Key Research Reagent Solutions for Scaffold Drug Release Studies
| Reagent / Material | Function in the Experiment | Specifications / Notes |
|---|---|---|
| Levofloxacin Standard | Active Pharmaceutical Ingredient (API) for calibration standards and quantification. | Sourced from National Institutes for Food and Drug Control; high purity reference standard [1]. |
| Ciprofloxacin | Internal Standard for HPLC analysis. | Used to correct for procedural losses and variability; purchased from Sigma-Aldrich [1]. |
| Simulated Body Fluid (SBF) | Release medium mimicking physiological conditions. | Used to study drug release kinetics in a biologically relevant environment [1]. |
| Mesoporous Silica Microspheres (MSNs) | Primary drug carrier/nanoparticle. | High surface area and adjustable pore size enable high drug loading [1]. |
| Nano-Hydroxyapatite (n-HA) | Bioceramic component of the composite scaffold. | Provides osteoconductivity and mechanical strength; integrated into polyurethane matrix [1]. |
| Tetrabutylammonium Bromide | Ion-pairing agent in HPLC mobile phase. | Critical for achieving chromatographic separation of Levofloxacin; analytical grade [1]. |
| Methanol & Acetonitrile | HPLC-grade organic solvents. | Component of the mobile phase (Methanol) [1]; also used in other RP-HPLC methods [2]. |
This case study demonstrates a clear disparity in the functional performance of HPLC and UV-Vis methods when applied to a complex drug-delivery scaffold. While UV-Vis offers simplicity and showed excellent linearity and precision in recovery rates, the chromatographic separation capability of HPLC makes it the unequivocally preferred method for this application. The ability of HPLC to isolate the target drug, Levofloxacin, from the myriad of other compounds leaching from the biodegradable scaffold matrix is critical for obtaining accurate and reliable release kinetics data. This methodological insight is indispensable for researchers and drug development professionals working to characterize advanced, multi-functional drug-delivery systems accurately, ensuring that subsequent therapeutic guidance for treating conditions like infectious diseases or regenerative processes is based on robust analytical findings [1] [23].
For researchers and drug development professionals, selecting an analytical method is a critical decision that balances precision, cost, and operational practicality. High-performance liquid chromatography (HPLC) and ultraviolet-visible (UV-Vis) spectrophotometry represent two fundamental pillars in the analytical scientist's toolkit, particularly for quantifying active pharmaceutical ingredients like levofloxacin. While both techniques offer valuable quantification capabilities, their performance diverges significantly when subjected to the inevitable variations encountered in real-world laboratory environments. The concepts of robustness (a method's capacity to remain unaffected by small, deliberate changes in procedural parameters) and ruggedness (its reliability when used under different conditions, such as by different analysts or instruments) are paramount in determining a method's suitability for regulatory submission and quality control. This guide provides an objective comparison of how HPLC and UV-Vis methods withstand these critical method variations, with specific experimental data from levofloxacin quantification studies to inform method selection in pharmaceutical research and development.
Fundamental Principles and Key Differences
Core Technological Mechanisms
The fundamental difference between HPLC and UV-Vis spectrophotometry lies in their separation capability, which directly impacts their susceptibility to interference and method variations.
UV-Vis Spectrophotometry operates on the principle of measuring the absorption of ultraviolet or visible light by a sample at a specific wavelength. For levofloxacin, this is typically in the range of 290-295 nm [1] [2]. This technique is inherently a "whole mixture" analysis, as the recorded absorbance represents the sum of all absorbing species in the sample at that wavelength. This lack of separation is the primary reason for its vulnerability to interference from excipients, degradation products, or other chromophores, which can lead to positively biased results.
High-Performance Liquid Chromatography (HPLC), particularly Reverse-Phase (RP)-HPLC, combines a separation mechanism with detection. The sample components are first separated based on their differential partitioning between a stationary phase (e.g., a C18 column) and a mobile phase. The separated analyte (e.g., levofloxacin) then passes through a detector, often a UV-Vis detector. This separation step prior to detection is crucial. It isolates the target analyte's signal from interfering substances, ensuring that the detected signal is specific to levofloxacin. A typical levofloxacin method uses a C18 column with a methanol/buffer mobile phase and detection at 290 nm [1].
Visualizing the Workflows and Vulnerability Points
The diagrams below illustrate the core workflows for both techniques and highlight the key points where method variations can introduce error, underscoring the difference in their vulnerability profiles.
Direct Experimental Comparison for Levofloxacin Quantification
A direct comparison study evaluating the quantification of Levofloxacin released from a complex drug-delivery system (mesoporous silica microspheres/nano-hydroxyapatite composite scaffolds) provides critical, head-to-head performance data [1].
Accuracy in a Complex Matrix
The study compared the recovery rates of levofloxacin from simulated body fluid at three different concentrations using both HPLC and UV-Vis methods. The results, summarized in the table below, highlight a significant difference in accuracy, especially for medium and high concentrations.
Table 1: Recovery Rate Comparison for Levofloxacin in a Complex Matrix [1]
| Concentration Level | Theoretical Concentration (µg/ml) | HPLC Recovery Rate (% ± SD) | UV-Vis Recovery Rate (% ± SD) |
|---|---|---|---|
| Low | 5 | 96.37 ± 0.50 | 96.00 ± 2.00 |
| Medium | 25 | 110.96 ± 0.23 | 99.50 ± 0.00 |
| High | 50 | 104.79 ± 0.06 | 98.67 ± 0.06 |
The data demonstrates that while both methods performed adequately at the low concentration, the UV-Vis method showed significant positive bias at medium and high concentrations, with recovery rates deviating substantially from 100%. The authors concluded that this inaccuracy stems from UV-Vis's inability to distinguish levofloxacin from other interfering substances released from the biodegradable composite scaffold, making it unsuitable for this application. In contrast, HPLC provided superior accuracy due to its separation power [1].
Ruggedness and Precision Performance
Precision, a key component of ruggedness, was also evaluated in the same study. The relative standard deviation (RSD) values for the HPLC method were exceptionally low (<0.5% across all concentrations), indicating excellent repeatability and minimal susceptibility to random operational variations [1]. Another study on levofloxacin hemihydrate in ocular nanoparticles reported that an RP-HPLC method met all validation criteria for precision, with RSD values within acceptable limits [2].
For UV-Vis, a separate study on riboflavin demonstrated that well-developed methods can achieve good precision, with inter-day and intra-day RSD values ranging from 0.66% to 1.39% [53]. This suggests that for simple matrices where the analyte is the primary chromophore, UV-Vis can be a rugged technique. However, its precision can be severely compromised in complex matrices where interfering substances are present, as these can vary between runs and analysts.
The Scientist's Toolkit: Essential Reagents and Materials
The experimental protocols for HPLC and UV-Vis require specific reagents and materials to ensure method robustness. The following table details key components used in the cited levofloxacin studies.
Table 2: Key Research Reagent Solutions for Levofloxacin Analysis
| Item | Function in Analysis | Application in HPLC | Application in UV-Vis |
|---|---|---|---|
| C18 Column | Stationary phase for analyte separation; critical for robustness. | Sepax BR-C18 [1] or similar (e.g., ODS) [54]. | Not Applicable. |
| Mobile Phase | Carries sample through column; composition/pH are Critical Method Parameters. | Methanol/Buffer mixture [1] or Acetonitrile/Buffer [2]. | Not Applicable. |
| Internal Standard | Corrects for procedural losses/injection variability; enhances precision. | Ciprofloxacin [1]. | Not typically used. |
| Solvent (Diluent) | Dissolves the sample; must be compatible with the system. | Simulated Body Fluid [1], Methanol:Water [54]. | 0.1N NaOH [53], Water, or Buffer. |
| Standard Reference | Calibrates the instrument and quantifies the unknown sample. | Levofloxacin certified reference standard [1]. | Levofloxacin certified reference standard. |
Optimizing Robustness in Method Development and Validation
Systematic Approach to HPLC Robustness
For HPLC, robustness is proactively built into the method through systematic development and validation, often guided by a Quality by Design (QbD) approach. This involves identifying Critical Method Parameters (CMPs) and studying their impact on Critical Quality Attributes (CQAs) like retention time, peak area, and resolution.
A robust HPLC method for levofloxacin was demonstrated in a study where the mobile phase consisted of a mixture of 0.01 mol/L KH₂PO₄, methanol, and 0.5 mol/L tetrabutylammonium hydrogen sulphate (75:25:4), which provided consistent retention and separation [1]. Another study on domiphen bromide showcased the use of a full factorial Design of Experiments (DoE) to optimize CMPs like acetonitrile ratio, flow rate, and column temperature, statistically confirming their influence and establishing a robust design space [55].
Managing UV-Vis Method Limitations
For UV-Vis, ensuring robustness is more about controlling the sample environment and acknowledging the technique's inherent limitations.
- Wavelength Selection: Using the precise λₘₐₓ (e.g., 295 nm for levofloxacin [2]) is crucial. A shift of just a few nanometers can significantly alter absorbance readings.
- Sample Purity: The method is only robust if the sample matrix is simple and consistent. Any change in the composition of excipients or the presence of degradation products can directly impact accuracy, as seen in the levofloxacin scaffold study [1].
- Control of Variables: Parameters like temperature and solvent consistency must be tightly controlled, as they can affect absorbance [53]. Ruggedness is demonstrated by showing consistent results across different analysts and instruments using the same simple matrix.
The choice between HPLC and UV-Vis spectrophotometry for quantifying levofloxacin—or any API—is not a matter of which technique is universally superior, but which is fit-for-purpose based on the sample matrix and regulatory requirements.
| Scenario | Recommended Technique | Rationale |
|---|---|---|
| Complex Matrices (e.g., drug-delivery scaffolds, biological fluids, formulated products) | HPLC | Its separation capability provides inherent specificity, mitigating interference and ensuring accurate, robust, and rugged results [1]. |
| High-Purity Samples (e.g., raw material identification, dissolution media) | UV-Vis | Offers a fast, cost-effective, and simple alternative that can be highly precise when interference is absent [53]. |
| Stability-Indicating Methods | HPLC | Essential for tracking the main analyte and resolving it from its degradation products, a core requirement for stability studies [54] [55]. |
| Routine Quality Control (where specificity is confirmed) | UV-Vis | Can be ideal for high-throughput environments analyzing simple samples where speed and cost are primary concerns. |
In summary, HPLC is the unequivocal choice when method robustness and ruggedness are paramount, especially in the presence of complex matrices or for regulatory-focused studies. UV-Vis serves as a capable and efficient tool for simpler, well-defined applications where its limitations regarding specificity are not a critical factor. Understanding these operational characteristics enables scientists and drug development professionals to make informed decisions that ensure data integrity and streamline the path from development to commercial production.
For researchers and drug development professionals quantifying levofloxacin, High-Performance Liquid Chromatography (HPLC) and Ultraviolet-Visible (UV-Vis) spectrophotometry have long been standard techniques. A direct comparison study of these methods for assessing levofloxacin release from a novel mesoporous silica microspheres/nano-hydroxyapatite (n-HA) composite scaffold revealed critical differences. While both methods showed excellent linearity (R² > 0.999), the recovery rates for HPLC (96.37% - 110.96%) were markedly more accurate and consistent than those for UV-Vis (96.00% - 99.50%) across low, medium, and high concentrations (5, 25, and 50 µg/ml) [1] [23]. The study concluded that in the presence of complex scaffold materials, UV-Vis is prone to inaccuracies likely due to impurity interference, establishing HPLC as the preferred method for detailed release studies in tissue engineering and drug delivery systems [1]. However, the field is evolving, and emerging techniques like Attenuated Total Reflectance-Fourier Transform Infrared (ATR-FTIR) spectroscopy are now challenging the status quo by offering rapid, direct analysis with minimal sample preparation.
Experimental Protocols for Levofloxacin Quantification
Established HPLC Protocol for Sustained-Release Studies
The validated HPLC method for levofloxacin quantification involves a meticulous protocol to ensure accuracy and reproducibility [1].
- Equipment: A Shimadzu liquid chromatograph equipped with a CBM-20A system controller, a UV-visible detector, and a Sepax BR-C18 column (250 × 4.6 mm; 5 µm particle diameter).
- Chromatographic Conditions: The column temperature is maintained at 40°C. The mobile phase consists of 0.01 mol/l KH₂PO₄, methanol, and 0.5 mol/l tetrabutylammonium hydrogen sulphate in a ratio of 75:25:4, delivered at a flow rate of 1 ml/min. Detection is performed at 290 nm.
- Sample Preparation: Levofloxacin is dissolved in simulated body fluid (SBF). The working solution is mixed with an internal standard (Ciprofloxacin), vortexed, and then extracted with dichloromethane. After centrifugation, the supernatant is dried under nitrogen in a 50°C water bath before reconstitution and injection [1].
Emerging ATR-FTIR Protocol for Direct Solid Analysis
A recently developed (2025) ATR-FTIR method provides a rapid and pragmatic alternative for quantifying levofloxacin in solid formulations, requiring minimal sample preparation [3] [56].
- Equipment: An Agilent 630-ATR-FTIR spectrophotometer equipped with a temperature-controlled diamond-attenuated total reflectance crystal.
- Spectral Acquisition: A small quantity of a homogenous solid mixture of the sample is placed directly on the ATR crystal. Spectra are acquired in transmission mode (%T) over the spectral range of 4000–400 cm⁻¹ at a resolution of 2 cm⁻¹.
- Chemometric Analysis: A quantitative model is developed using the specific frequency region of 1252.39–1218.84 cm⁻¹. The acquired spectra are processed with chemometric software (e.g., Microlab Quant Software, Matlab) to build a partial least squares regression model for quantification and to perform Principal Component Analysis (PCA) for identifying adulteration or degradation [3].
Comparative Analysis of Quantitative Performance
The table below summarizes the key performance metrics of HPLC, UV-Vis, and the emerging ATR-FTIR technique for levofloxacin analysis.
Table 1: Performance Comparison of Analytical Techniques for Levofloxacin Quantification
| Parameter | HPLC | UV-Vis Spectrophotometry | ATR-FTIR (with Chemometrics) |
|---|---|---|---|
| Linear Range | 0.05 - 300 µg/ml [1] | 0.05 - 300 µg/ml [1] | 30 - 90% w/w [3] |
| Regression Equation | y = 0.033x + 0.010 [1] | y = 0.065x + 0.017 [1] | N/A (Model-based) |
| Coefficient of Determination (R²) | 0.9991 [1] | 0.9999 [1] | 0.995 [3] |
| Recovery Rate (Medium Conc.) | 110.96 ± 0.23% [1] | 99.50 ± 0.00% [1] | ~100% (Reported as accurate) [3] |
| Limit of Detection (LOD) | Not Specified | Not Specified | 7.616% w/w [3] |
| Limit of Quantification (LOQ) | Not Specified | Not Specified | 23.079% w/w [3] |
| Key Advantage | High accuracy in complex matrices [1] | Simplicity and wide linear range [1] | Rapid, direct analysis of solids; identifies adulteration [3] |
Essential Research Reagents and Materials
Successful execution of these analytical methods relies on specific, high-quality reagents and materials.
Table 2: Key Research Reagent Solutions for Levofloxacin Analysis
| Reagent / Material | Function / Application | Specification / Note |
|---|---|---|
| Levofloxacin Certified Reference Material (CRM) | Primary standard for calibration in both HPLC and ATR-FTIR [3] [2] | Ensures traceability and accuracy of quantification. |
| Ciprofloxacin | Internal Standard (IS) for HPLC [1] | Corrects for volumetric and procedural losses. |
| Simulated Body Fluid (SBF) | Dissolution medium for in-vitro release studies (HPLC/UV-Vis) [1] | Mimics physiological conditions for drug release. |
| Tetrabutylammonium Hydrogen Sulphate | Ion-pairing agent in HPLC mobile phase [1] | Improves chromatographic peak shape and separation. |
| USP Grade Excipients (e.g., Avicel, Starch) | Diluent for preparing calibration standards in ATR-FTIR [3] | Creates a representative matrix for solid dosage form analysis. |
Workflow and Applicability of Techniques
The following diagram illustrates the core workflows for HPLC and ATR-FTIR, highlighting their fundamental differences in process and application.
The choice of analytical technique for levofloxacin quantification is highly dependent on the research or quality control objective. HPLC remains the undisputed gold standard for obtaining high-accuracy pharmacokinetic data and studying drug release from complex biodegradable scaffolds, where specificity is paramount [1]. In contrast, the emerging ATR-FTIR technique, empowered by robust chemometric models, establishes itself as a powerful tool for rapid, direct, and non-destructive analysis of solid formulations. Its unique capability for simultaneous quantification and identification of adulteration or degradation makes it exceptionally suitable for high-throughput quality control in pharmaceutical regulatory laboratories, offering a compelling alternative that bypasses the solvent-intensive and time-consuming steps of chromatographic methods [3].
Conclusion
The choice between HPLC and UV-Vis for levofloxacin quantification is not a matter of one being universally superior, but of selecting the right tool for the specific analytical challenge. For simple, single-component formulations where cost and speed are paramount, UV-Vis remains a viable option. However, for complex matrices—such as drug-delivery scaffolds, environmental wastewater, or when impurity profiling is required—HPLC's superior specificity, accuracy, and robustness make it the unequivocal preferred method, as evidenced by its better recovery rates in challenging scenarios. Future directions point toward the development of even faster HPLC techniques, the integration of green analytical chemistry principles to reduce solvent use, and the exploration of hyperspectral detection and portable devices for on-site analysis. This evidence-based framework empowers scientists to make informed decisions, ultimately enhancing the reliability of levofloxacin quantification in drug development and clinical research.
References
- 1. Comparison of high-performance liquid chromatography ... [https://pmc.ncbi.nlm.nih.gov/articles/PMC6425260/]
- 2. RP-HPLC-UV validation method for levofloxacin ... [https://www.sciencedirect.com/science/article/pii/S1878535221005979]
- 3. ATR–FTIR‐Based Direct and Rapid Quantification of ... [https://pmc.ncbi.nlm.nih.gov/articles/PMC12491855/]
- 4. Monitoring levofloxacin resistance by assaying its residues ... [https://www.sciencedirect.com/science/article/abs/pii/S0889157524007920]
- 5. A quality by design HPLC method for cephalosporin ... [https://www.nature.com/articles/s41598-024-84647-y]
- 6. UV-Vis Spectroscopy: Principle, Strengths and Limitations ... [https://www.technologynetworks.com/analysis/articles/uv-vis-spectroscopy-principle-strengths-and-limitations-and-applications-349865]
- 7. Spectrophotometry: Uses, Advantages & Applications [https://lifesciences.danaher.com/us/en/library/spectrophotometry.html]
- 8. UV-VIS Spectrometry for Protein Concentration Analysis [https://www.mabion.eu/science-hub/articles/uv-vis-spectrometry-for-protein-concentration-analysis/]
- 9. Advantages of UV-Vis Spectrophotometers [https://www.acttr.com/en/en-faq/en-faq-uv-vis/134-en-faq-uv-vis-advantage-disadvantage.html]
- 10. Comparison of UV spectrophotometry and high ... [https://pmc.ncbi.nlm.nih.gov/articles/PMC3658086/]
- 11. Comparison of HPLC and UV Spectrophotometric Methods ... [https://brieflands.com/journals/ijpr/articles/124310]
- 12. Levofloxacin determination in urine by photoluminescence ... [https://www.sciencedirect.com/science/article/pii/S0013468625014823]
- 13. Determination of levofloxacin, norfloxacin, and moxifloxacin in ... [https://bmcchem.biomedcentral.com/articles/10.1186/s13065-024-01193-4]
- 14. Experimental and Therapeutic Medicine [https://www.spandidos-publications.com/10.3892/etm.2019.7238/abstract]
- 15. The degradation of levofloxacin in infusions exposed to ... [https://www.nature.com/articles/s41598-019-40201-9]
- 16. Development and validation of a simple UV ... [https://www.sciencedirect.com/science/article/pii/S2095177912000834]
- 17. Pharmacological evaluation of levofloxacin residue ... [https://www.nature.com/articles/s41598-025-17575-0]
- 18. The quantitative detection of levofloxacin in treated medical ... [https://www.sciencedirect.com/science/article/abs/pii/S2214714425007548]
- 19. The quantitative detection of levofloxacin in treated medical ... [https://ui.adsabs.harvard.edu/abs/2025JWPE...7307682L/abstract]
- 20. Comparative UV Spectrophotometric and HPLC Method for ... [https://rjptonline.org/AbstractView.aspx?PID=2025-18-9-25]
- 21. A validated stability-indicating RP-HPLC method for ... [https://pubmed.ncbi.nlm.nih.gov/19632800/]
- 22. Development and validation of a simple UV ... [https://pmc.ncbi.nlm.nih.gov/articles/PMC5760935/]
- 23. Comparison of high-performance liquid chromatography ... [https://pubmed.ncbi.nlm.nih.gov/30906459/]
- 24. RP-HPLC-UV validation method for levofloxacin hemihydrate ... [https://arabjchem.org/rp-hplc-uv-validation-method-for-levofloxacin-hemihydrate-estimation-in-the-nano-polymeric-ocular-preparation/]
- 25. Comparison of the chromatographic behavior ... [https://pubmed.ncbi.nlm.nih.gov/21612150/]
- 26. DEVELOPMENT AND VALIDATION OF RP-HPLC ... [https://ijpsr.com/bft-article/development-and-validation-of-rp-hplc-method-for-determination-of-levofloxacin-in-tablet-using-uv-and-fluorescence-detectors-simeltaniously/]
- 27. UV-Visible Spectroscopy [https://www2.chemistry.msu.edu/faculty/reusch/virttxtjml/spectrpy/uv-vis/uvspec.htm]
- 28. Choosing the Wavelength of Spectrophotometers [https://www.hunterlab.com/blog/choosing-the-wavelength-of-spectrophotometers/]
- 29. Sample Preparation for UV-Vis Spectroscopy [https://www.ossila.com/pages/preparing-samples-uv-vis-spectroscopy]
- 30. Validation of Dissolution Method of Levofloxacin 750 mg ... [https://figshare.com/articles/thesis/Validation_of_Dissolution_Method_of_Levofloxacin_750_mg_Tablet_by_High_Performance_Liquid_Chromatography_docx/30124789]
- 31. Pharmacological evaluation of levofloxacin residue ... [https://pubmed.ncbi.nlm.nih.gov/40940386/]
- 32. Nanosorbents in solid-phase extraction techniques for ... [https://www.sciencedirect.com/science/article/abs/pii/S0026265X24022823]
- 33. A review of the modern principles and applications of solid ... [https://link.springer.com/article/10.1007/s44211-022-00190-8]
- 34. Innovative Solid-Phase Extraction Strategies for Improving ... [https://www.mdpi.com/1420-3049/29/10/2278]
- 35. Validation; Forced Degradation | Linearity | Specificity | UV/ ... [https://www.ijpsonline.com/articles/stabilityindicating-uvvis-spectrophotometric-method-for-diazepam-development-and-validation-3468.html?view=mobile]
- 36. UV-Vis vs. Other Olive Oil Testing Methods [https://bhooc.com/blogs/articles/uv-vis-vs-other-olive-oil-testing-methods?srsltid=AfmBOoqZQNGd4N59zMCRFkw2qwZKLLiVWSgNETVyQE4b_0gPu2IFZs4q]
- 37. Development of forced degradation and stability indicating ... [https://www.sciencedirect.com/science/article/pii/S2095177913001007]
- 38. Comparison of high-performance liquid chromatography ... [https://www.semanticscholar.org/paper/Comparison-of-high-performance-liquid-and-to-the-to-Wang-Wang/10340a470794e83881626f58cfebf3e0ba575657]
- 39. Formulation and Development of a Validated UV ... [https://pmc.ncbi.nlm.nih.gov/articles/PMC5448154/]
- 40. Predicting Degradation Related Impurities and ... [https://pmc.ncbi.nlm.nih.gov/articles/PMC3909161/]
- 41. A Simple Approach to Performance Optimization in HPLC and Its Application in Ultrafast Separation Development [https://www.chromatographyonline.com/view/simple-approach-performance-optimization-hplc-and-its-application-ultrafast-separation-development]
- 42. HPLC Method Development Steps [https://www.thermofisher.com/us/en/home/industrial/chromatography/chromatography-learning-center/liquid-chromatography-information/hplc-method-development-steps.html]
- 43. Strategies for Method Development and Optimization in HPLC - Drawell [https://www.drawellanalytical.com/strategies-for-method-development-and-optimization-in-hplc/]
- 44. Improve HPLC Methods by Increasing Sample Throughput Using the ACQUITY Arc System | Waters [https://www.waters.com/nextgen/us/en/library/application-notes/2016/improve-hplc-methods-by-increasing-sample-throughput-using-the-acquity-arc-system.html]
- 45. Optimization of HPLC methods for the development of quality control methods of combined powder formulations with paracetamol, phenylephrine hydrochloride, pheniramine maleate - PMC [https://pmc.ncbi.nlm.nih.gov/articles/PMC12105191/]
- 46. Comparison Techniques for HPLC Column Performance [https://www.chromatographyonline.com/view/comparison-techniques-hplc-column-performance-0]
- 47. Chromatography System Costs: Factors & Pricing Breakdown [https://www.excedr.com/blog/chromatography-system-pricing-guide]
- 48. Why Is HPLC So Expensive? - MONAD [https://monadlabtech.com/blogs/why-is-hplc-so-expensive]
- 49. Comprehensive Guide to HPLC Systems: Cost, Suitability ... [https://arcscientific.com/scientific-equipment/hplc-systems/]
- 50. -Visible Spectroscopy UV [https://www2.chemistry.msu.edu/faculty/reusch/virttxtjml/spectrpy/uv-vis/spectrum.htm]
- 51. Quantitative evaluation of true-to-life nanoplastics using UV -visible... [https://pubs.rsc.org/en/content/articlehtml/2025/en/d5en00502g]
- 52. Micellar liquid chromatographic method for the simultaneous ... [https://pmc.ncbi.nlm.nih.gov/articles/PMC4015170/]
- 53. Development and validation of uv -visible spectrometric method for... [https://ijpsr.com/bft-article/development-and-validation-of-uv-visible-spectrometric-method-for-estimation-of-water-soluble-vitamin-riboflavin/?view=fulltext]
- 54. Design and validation of a robust stability-indicating reversed ... [https://pmc.ncbi.nlm.nih.gov/articles/PMC12619242/]
- 55. Robust RP-HPLC Method for the Analysis of Domiphen ... [https://link.springer.com/article/10.1007/s12247-025-10074-9]
- 56. ATR-FTIR-Based Direct and Rapid Quantification of ... [https://pubmed.ncbi.nlm.nih.gov/41048974/]