Hyperspectral Imaging vs. Spectroscopy: A Guide to Optical Analysis for Biomedical Research
This article provides a comparative analysis of hyperspectral imaging (HSI) and spectroscopy for researchers and professionals in drug development and biomedical science.
Hyperspectral Imaging vs. Spectroscopy: A Guide to Optical Analysis for Biomedical Research
Abstract
This article provides a comparative analysis of hyperspectral imaging (HSI) and spectroscopy for researchers and professionals in drug development and biomedical science. It covers the foundational principles of both techniques, highlighting how HSI captures spatially-resolved spectral data to form a 'hypercube,' while conventional spectroscopy provides detailed spectral information from a single point. The scope extends to methodological applications in areas like cancer diagnostics, pharmaceutical analysis, and tissue characterization, exploring the integration of machine learning for data processing. The article also addresses troubleshooting for data complexity and hardware limitations and offers frameworks for the validation and comparative assessment of each technique's performance. Finally, it synthesizes key takeaways to guide the selection of the appropriate analytical method for specific research objectives.
Core Principles: From Spectral Fingerprints to Spatial Maps
In the realm of optical analysis, researchers must often choose between two powerful technological approaches: point spectroscopy and hyperspectral imaging (HSI). These techniques, while sharing a common foundation in spectroscopy, differ fundamentally in their data acquisition methodologies and informational output. Point spectroscopy is an analytical technique that captures the complete spectrum of light from a single, discrete location on a sample, providing detailed chemical information for that specific point without inherent spatial context [1]. In contrast, hyperspectral imaging (HSI) represents an advanced methodology that combines imaging and spectroscopy to simultaneously capture both spatial and spectral information from across an entire sample area [1] [2]. This technique generates a three-dimensional dataset known as a "hypercube," which contains the full spectrum for each pixel in a two-dimensional spatial plane, thereby creating a detailed chemical map of the sample surface [1].
The core distinction lies in their fundamental data acquisition approaches. Point spectroscopy employs a "point-by-point mapping" or "whiskbroom" technique, where spectra are sequentially acquired from an array of points across the region of interest [3]. Conversely, HSI can utilize either "pushbroom" imaging (capturing a line of spectra simultaneously) or "direct hyperspectral imaging" (capturing a two-dimensional spatial image for each wavelength band) [3]. This fundamental difference in acquisition strategy leads to significant implications for their application in research and drug development, affecting factors such as analysis time, spatial coverage, and the type of scientific questions that can be effectively addressed.
Technical Comparison: Data Acquisition and Performance
The operational distinctions between point spectroscopy and HSI translate directly into measurable differences in performance characteristics, which determine their suitability for specific research scenarios. The following table summarizes the key technical parameters that differentiate these two approaches.
Table 1: Performance comparison between point spectroscopy and hyperspectral imaging
| Performance Characteristic | Point Spectroscopy | Hyperspectral Imaging |
|---|---|---|
| Spatial Coverage | Single point measurement | Entire field of view (FOV) at once [3] |
| Spectral Resolution | High (instrument dependent) | High (comparable to point spectroscopy) [3] |
| Data Dimensionality | Single spectrum per measurement | Hypercube (x, y spatial dimensions + spectral dimension) [1] [3] |
| Measurement Approach | Whiskbroom (point-by-point) [3] | Direct imaging or pushbroom [3] |
| Laser Power Density at Target | Higher (concentrated on single point) | Up to 277 times lower (spread across wider area) [3] |
| Analysis Speed for Large Areas | Slow (requires spatial scanning) | Fast (simultaneous spatial coverage) [3] [4] |
| Sensitivity to Subtle Changes | Limited to spectral changes | High (detects both spatial and spectral alterations) [5] |
A comparative study of stand-off Raman configurations highlights these performance trade-offs. When both techniques were deployed at 15 meters, the direct HSI system demonstrated superior spectral resolution and signal-to-noise ratio while more than doubling the FOV of the point imaging system, despite reducing laser power densities at the target by a factor of 277 [3]. This combination of wider coverage and reduced power density makes HSI particularly valuable for analyzing sensitive or valuable samples where minimal invasiveness is crucial.
The difference in data structure is equally significant. Point spectroscopy generates a single spectrum representing the average composition within the measurement spot, potentially obscuring spatial heterogeneity. HSI preserves the spatial relationships between different chemical components, enabling researchers to visualize distribution patterns and identify minor constituents that might be missed by point sampling [1]. This capability makes HSI exceptionally sensitive for detecting localized alterations, as demonstrated in studies where it identified laser-induced changes in paintings that were undetectable by point Raman spectroscopy [5].
Experimental Applications and Protocols
Stand-off Chemical Identification
Objective: To compare the effectiveness of point imaging (PI) and direct hyperspectral Raman imaging (HSRI) for chemical identification at a distance of 15 meters [3].
Methodology:
- PI System: A collimated laser beam created an illuminated point with a diameter of 6 mm, mapped over the target area using a motorized mirror. Backscattered Rayleigh light was filtered, and Raman photons were guided via a fiber optical bundle to a spectrograph coupled with an intensified charge-coupled device (iCCD) camera [3].
- HSRI System: An expanded laser beam illuminated an area of approximately 100 mm diameter. Raman photons were filtered through a liquid crystal tunable filter (LCTF) and directly imaged onto an iCCD camera. The system collected spectral snapshots, with the hyperspectral image cube built by stacking these snapshots [3].
- Data Analysis: The output hyperspectral image data cube from the HSRI system was processed with chemometric algorithms like vertex component analysis to generate false-color images representing chemical composition [3].
Key Findings: The HSRI system demonstrated superior spectral resolution and signal-to-noise ratio while covering more than double the FOV of the PI system with significantly reduced laser power density (factor of 277 lower) [3]. This makes HSRI particularly advantageous for applications requiring analysis of sensitive materials or large areas.
Monitoring Laser-Induced Alterations on Cultural Heritage Materials
Objective: To evaluate the sensitivity of VIS-NIR HSI compared to point Raman spectroscopy for detecting subtle laser-induced alterations on paint mock-ups [5].
Methodology:
- Sample Preparation: 15-year-old oil paint mock-ups containing vermilion, realgar, and red lead pigments applied on a preparation layer of chalk in rabbit skin glue on plywood substrate [5].
- Irradiation: Three different continuous wave lasers (532 nm, 785 nm, 1064 nm) at different spot sizes, power levels, and exposure times were used to induce potential alterations [5].
- Monitoring: Simultaneous monitoring using VIS-NIR reflectance HSI (400-900 nm) and thermal imaging during Raman spectroscopy. Post-irradiation analysis using optical coherence tomography and synchrotron-based micro-X-ray powder diffraction to confirm physical and chemical changes [5].
- Data Analysis: Comparison of pre-irradiation (120 s) and post-irradiation (300 s) reflectance spectra to detect subtle changes [5].
Key Findings: HSI was "orders of magnitude more sensitive" than point Raman spectroscopy and even synchrotron-based micro-X-ray powder diffraction in detecting laser-induced alterations [5]. Transient and reversible reflectance changes detected by HSI served as precursors to permanent damage, enabling the establishment of safety thresholds for laser analysis of sensitive materials.
Microplastics Analysis
Objective: To compare the efficiency of point spectroscopy versus HSI for the identification and characterization of microplastics (MP) in environmental samples [4].
Methodology:
- Sample Preparation: Environmental samples processed through density separation, enzymatic treatment, and wet peroxidation to isolate MP, which are then deposited on filters [4].
- Point Spectroscopy Analysis: Manual or software-assisted selection of particles followed by point measurements using FT-IR or Raman spectroscopy. For automated analysis, particle identification software selects particles based on bright or dark-field imaging, followed by sequential point measurements using a motorized stage [4].
- HSI Analysis: Entire filter imaged using HSI systems, generating a data cube where each pixel contains a full spectrum. Chemical identification performed through multivariate classification algorithms applied to the entire dataset [4].
- Data Analysis: For point spectroscopy, each identified particle is analyzed individually. For HSI, chemometric analysis identifies polymer types across the entire filter surface without prior particle selection [4].
Key Findings: HSI significantly reduces analysis time compared to point-by-point mapping, especially for samples with numerous particles [4]. While point techniques can achieve slightly better spatial resolution (detecting particles down to 1 μm for Raman versus >250 μm for HSI), HSI provides complete spatial coverage without selection bias, providing more representative data for heterogeneous samples [4].
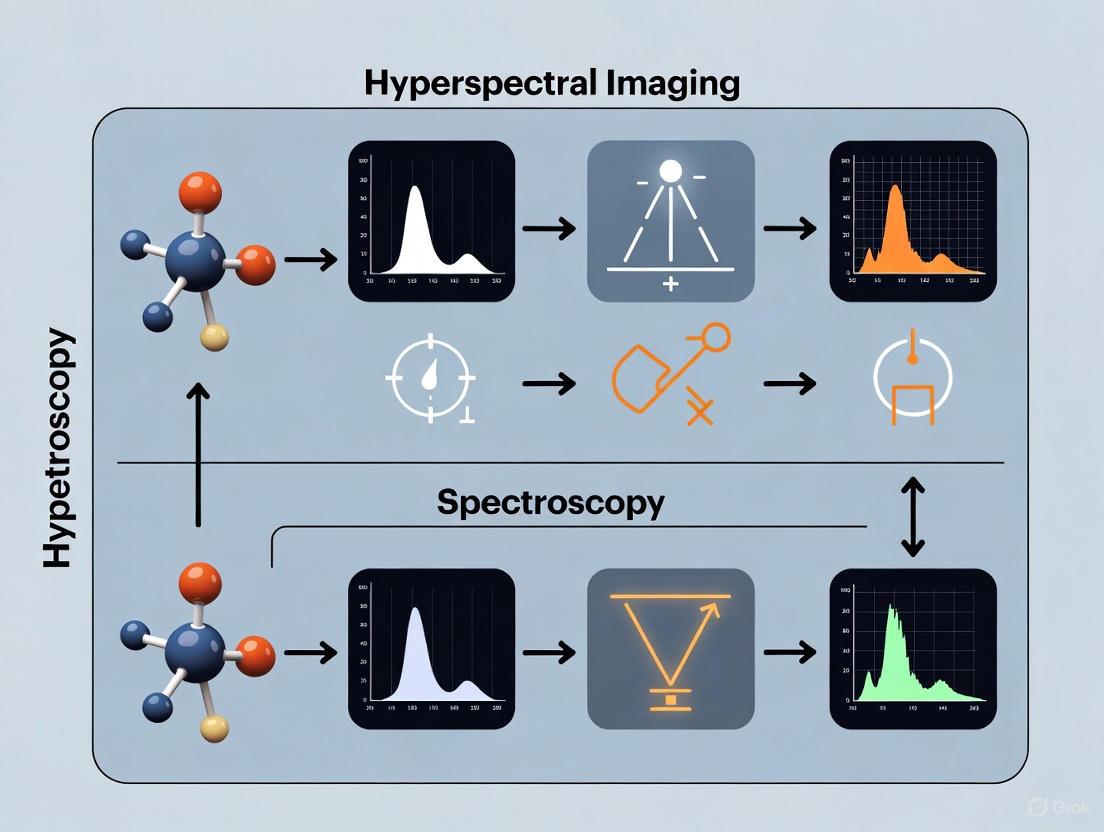
The following diagram illustrates the fundamental workflow differences between these two analytical approaches:
The Scientist's Toolkit: Key Research Reagents and Materials
Table 2: Essential equipment and materials for point spectroscopy and HSI experiments
| Item | Function | Example Applications |
|---|---|---|
| Liquid Crystal Tunable Filter (LCTF) | Electrically tunable optical filter that selects specific wavelength bands for direct HSI [3]. | Stand-off Raman imaging, chemical mapping [3]. |
| Motorized Translation Stage | Precisely moves samples for point-by-point mapping in whiskbroom imaging [3]. | Automated point spectroscopy mapping, spatial scanning [3]. |
| Intensified CCD (iCCD) Camera | High-sensitivity detector capable of gating to suppress ambient light during Raman measurements [3]. | Stand-off spectroscopy, low-light conditions [3]. |
| Fiber Optical Bundle | Transmits collected light from telescope to spectrometer in point imaging systems [3]. | Remote point spectroscopy, flexible light collection [3]. |
| VIS-NIR Hyperspectral Imager | Captures spectral data in the 400-900 nm range for reflectance spectroscopy [5]. | Monitoring laser-induced alterations, pigment analysis [5]. |
| IR-Transparent Filters | Specialized substrates that allow transmission measurements for FT-IR spectroscopy [4]. | Microplastics analysis, transmission spectroscopy [4]. |
| Algorithmically Designed Color Reference Chart | Provides spectral calibration for computational spectrometry methods [6]. | Recovering spectral information from conventional photographs [6]. |
The choice between point spectroscopy and hyperspectral imaging depends fundamentally on the specific research objectives and sample characteristics. Point spectroscopy remains invaluable for applications requiring detailed spectral analysis of specific, known sample locations, particularly when high spectral resolution is paramount and spatial distribution is either known or irrelevant. Its simpler instrumentation and potentially lower cost make it accessible for routine analytical tasks.
Conversely, hyperspectral imaging provides distinct advantages when dealing with heterogeneous samples, unknown composition distribution, or when the research question requires understanding spatial relationships between different chemical components. The ability to survey entire samples rapidly and non-destructively makes HSI particularly valuable for precious or irreplaceable samples, quality control processes requiring comprehensive assessment, and exploratory research where unexpected constituents might be present.
For drug development professionals and researchers, the emerging trend involves integrating both technologies within complementary workflows. Point spectroscopy can provide detailed verification of specific regions identified through initial HSI screening, combining the comprehensive spatial coverage of HSI with the potentially higher spectral detail of point analysis. Furthermore, advancements in computational methods, such as algorithms that extract hyperspectral information from conventional photographs, promise to make spatial-spectral analysis more accessible across various research applications [6].
Hyperspectral imaging (HSI) and spectroscopy represent two powerful paradigms for material analysis across scientific disciplines. While both techniques rely on the interaction of light with matter to generate spectral data, their fundamental output—a single spectrum versus a hypercube—dictates their respective applications, strengths, and limitations. Spectroscopy is a technique that identifies materials by analyzing their spectral signatures based on the absorption, reflection, and scattering characteristics of light at different wavelengths [7]. It typically provides a single spectrum representing the average composition of a measured spot.
In contrast, hyperspectral imaging (HSI) merges spectroscopy with digital imaging [1]. Unlike standard cameras that capture only three color channels (red, green, and blue), HSI systems record hundreds or even thousands of contiguous spectral bands for each pixel in an image [8]. This creates a three-dimensional data structure known as a hypercube or datacube, which contains two spatial dimensions (x, y) and one spectral dimension (λ) [9] [10]. This rich dataset enables researchers to not only identify chemical compositions but also visualize their spatial distribution across a sample.
Within optical analysis research, particularly in pharmaceutical development and life sciences, the choice between these techniques carries significant implications for experimental design, data complexity, and analytical outcomes. This guide provides a structured comparison of their data output fundamentals to inform method selection.
Fundamental Data Structures: From Spectra to Hypercubes
The Spectroscopy Spectrum: One-Dimensional Data Output
A spectroscopic analysis generates a spectrum—a one-dimensional plot representing light intensity as a function of wavelength or frequency. This plot serves as a unique "chemical fingerprint" where peaks and valleys correspond to specific molecular vibrations, bonds, or elements. In a typical experiment, this spectrum represents the average composition within the instrument's measurement spot, lacking inherent spatial context. Each material exhibits distinctive spectral patterns based on its chemical composition and physical properties [7].
Table: Core Characteristics of Spectroscopic Data Output
| Feature | Description | Typical Data Scale |
|---|---|---|
| Dimensionality | 1D (Intensity vs. Wavelength) | - |
| Spatial Context | None (point measurement) | Single spot analysis |
| Data Volume | Low | Kilobytes (KB) per spectrum |
| Primary Output | Spectral curve / graph | - |
| Composition Info | Bulk chemical identification | Average for measured area |
The HSI Hypercube: Three-Dimensional Data Integration
The hypercube is the defining data structure of HSI, integrating spatial and spectral information into a single three-dimensional dataset [9]. Imagine a stack of images, where each layer represents the same scene captured at a different, specific wavelength. Each pixel in this cube contains a full, continuous spectrum, allowing for the precise identification of materials based on their spectral signature while preserving their location information [8] [10].
Table: Core Characteristics of a Hyperspectral Hypercube
| Feature | Description | Typical Data Scale |
|---|---|---|
| Dimensionality | 3D (x, y, λ) | - |
| Spatial Context | High (per-pixel spectrum) | Millions of spatial pixels |
| Data Volume | Very High | Megabytes to Gigabytes (MB-GB) per cube |
| Primary Output | Data cube / hypercube | - |
| Composition Info | Chemical identification & spatial distribution | Maps of component distribution |
Diagram: HSI Hypercube Generation. The process begins with optical scanning of a physical sample, resulting in a 3D hypercube containing two spatial dimensions (X, Y) and one spectral dimension (λ). Each pixel within the spatial plane contains a full spectral signature that can be extracted for material identification.
Technical Comparison: Capabilities and Limitations
Direct Performance Comparison in Forensic Science
A 2025 study directly compared HSI and Near-Infrared (NIR) spectroscopy for estimating the age of bloodstains in forensic contexts, providing concrete experimental data on their relative performance [11]. The research aged bloodstains on various substrates over 60 days, analyzing them periodically with both techniques.
Table: Experimental Comparison of HSI vs. NIR Spectroscopy for Bloodstain Age Estimation
| Parameter | Hyperspectral Imaging (HSI) | Near-Infrared (NIR) Spectroscopy |
|---|---|---|
| Application Context | Bloodstain deposition time estimation | Bloodstain deposition time estimation |
| Data Type | Spatial-spectral hypercubes | Point-based spectral measurements |
| Key Advantage | Visualizes spatial distribution of age-related changes | Superior penetration capabilities & high sensitivity |
| Processing Method | Partial Least Squares (PLS) polynomial regression, Multilayer Perceptron (MLP) | Partial Least Squares (PLS) polynomial regression, Multilayer Perceptron (MLP) |
| Prediction Error (RMSEP) | 8.35 days (homologous data) | 8.15 days (homologous data) |
| Optimal Approach | Multimodal data fusion with NIR | Multimodal data fusion with HSI |
| Reference | Liang et al. 2025, Anal. Methods [11] | Liang et al. 2025, Anal. Methods [11] |
The study found that while both techniques achieved similar prediction errors as standalone methods, fusing data from both modalities through multimodal data fusion significantly enhanced the overall model performance and general applicability [11]. This demonstrates the complementary nature of imaging and non-imaging spectroscopic approaches.
Methodological Workflows in Practice
Spectroscopy Workflow Protocol:
- Sample Preparation: Samples are typically homogenized or representative portions selected for point measurement.
- Instrument Calibration: Standard reference materials are used to calibrate the spectrometer.
- Spectral Acquisition: The instrument collects a single spectrum from the measurement spot, averaging the signal over the sampled area.
- Spectral Preprocessing: Techniques include smoothing, baseline correction, and normalization to reduce noise and enhance features [7].
- Chemometric Analysis: Multivariate analysis (e.g., PLS regression) correlates spectral features with properties of interest [11].
HSI Workflow Protocol:
- System Setup: Appropriate HSI system selection (push broom, snapshot) based on application needs [9].
- Spatial-Spectral Calibration: White reference imaging corrects for uneven illumination; dark reference accounts for sensor noise [9].
- Hypercube Acquisition: Capture of the full spatial-spectral data cube across the desired wavelength range (e.g., 400-2500 nm) [12].
- Data Preprocessing: Includes background masking to isolate regions of interest, normalization of reflectance, and correction of lighting artifacts [9].
- Spectral-Spatial Analysis: Application of machine learning algorithms for segmentation, classification, and quantitative mapping of components [11] [1].
Diagram: Comparative Workflows: HSI vs. Spectroscopy. The workflows diverge at sample preparation, with HSI preserving spatial structure and spectroscopy requiring homogenization. The outputs differ fundamentally (chemical maps vs. bulk quantification), though they can be fused for enhanced analysis.
Application-Specific Performance Across Industries
Performance Metrics in Diverse Research Applications
The distinctive data outputs of spectroscopy and HSI make them suitable for different application scenarios across industries. The following table summarizes their documented performance in various scientific domains.
Table: Application Performance Across Scientific Domains
| Field | HSI Performance & Applications | Spectroscopy Performance & Applications |
|---|---|---|
| Pharmaceuticals & Drug Discovery | Label-free drug visualization in cells; monitoring drug metabolism [13] | Bulk chemical analysis of pharmaceutical compounds; quality control |
| Medical Diagnostics | Differentiates cancerous vs. healthy tissue (87-95% accuracy) [8] [10]; intraoperative guidance | Liquid biopsies; serum analysis; limited spatial information |
| Forensic Science | Bloodstain age estimation (RMSEP: ~8 days); species identification with machine learning [11] [1] | Bloodstain age estimation (RMSEP: ~8 days); bulk material identification [11] |
| Agriculture & Food Science | Egg freshness prediction (R²: 0.91); crop disease detection (98% accuracy) [8] [1] | Composition analysis of homogenized food samples; nutrient quantification |
| Environmental Monitoring | Soil property estimation; water quality assessment; plastic waste detection (70-80% accuracy) [8] [14] | Point measurements of soil/water parameters; limited spatial coverage |
Complementary Roles in Pharmaceutical Research
In drug discovery and development, HSI and spectroscopy offer complementary capabilities. Spectroscopy techniques like spontaneous Raman scattering provide detailed molecular information from specific cellular locations [13]. However, the emergence of hyperspectral SRS microscopy has enabled rapid, label-free visualization of drug distributions within cells and tissues by generating detailed chemical maps based on molecular vibrations [13].
This capability is particularly valuable for assessing drug uptake, localization, and metabolism in preclinical models—key factors in reducing drug attrition rates [13]. The hypercube data output allows researchers to correlate drug distribution with specific cellular compartments or tissue structures, providing insights that single-point spectroscopy cannot deliver.
Implementation Considerations for Research Applications
The Scientist's Toolkit: Essential Research Materials
Table: Essential Equipment and Analytical Tools
| Item | Function | Relevance to Data Output |
|---|---|---|
| Hyperspectral Imaging Systems (e.g., SPECIM IQ [9]) | Captures spatial-spectral hypercubes across VNIR-SWIR ranges (400-2500 nm) [12] | Generates 3D hypercube data with both spatial and spectral information |
| Spectrometers (NIR, Raman) | Measures point-based spectral signatures of samples | Produces 1D spectral data for bulk composition analysis |
| Standard Reference Panels | Calibrates instruments for accurate reflectance measurements [9] | Ensures data accuracy and comparability across both techniques |
| Chemometrics Software | Applies algorithms (PLS, PCA, MLP) for spectral analysis [11] [7] | Extracts meaningful information from spectral and spatial-spectral data |
| Machine Learning Libraries (Python, Scikit-learn [9]) | Processes high-dimensional data; performs classification & regression | Essential for analyzing complex hypercube data from HSI |
Strategic Selection Guidelines
Choosing between HSI and spectroscopy involves careful consideration of research objectives and practical constraints:
Select Hyperspectral Imaging When:
- Research questions require spatial distribution mapping of chemical components
- Samples are heterogeneous with spatial variations in composition
- The application involves unknown or variable regions of interest
- Objectives include visualizing gradients, boundaries, or localized phenomena
- Applications include tissue classification, crop health mapping, or material heterogeneity studies [8] [10]
Select Spectroscopy When:
- Primary need is high-throughput bulk composition analysis
- Samples are homogeneous or can be effectively homogenized
- Budget, data storage, or computational resources are limited
- Applications focus on quantitative analysis of known, uniform materials
- Rapid, portable measurement is prioritized over spatial information [11] [7]
For complex analytical challenges, a combined approach utilizing both techniques often provides the most comprehensive solution, as demonstrated by the forensic study where data fusion significantly enhanced prediction accuracy [11].
The fundamental distinction between a single spectrum and a hypercube defines the analytical capabilities of spectroscopy and hyperspectral imaging. Spectroscopy excels at providing precise chemical fingerprints from specific locations, while HSI delivers comprehensive spatial-chemical maps, enabling visualization of heterogeneity and distribution patterns.
In optical analysis research, particularly for drug development and life sciences, this distinction directly impacts experimental design and analytical outcomes. HSI's hypercube data structure offers unparalleled insights into spatial relationships and heterogeneity, while spectroscopy provides efficient, high-precision chemical analysis for homogeneous materials. The emerging trend of multimodal integration, combining both approaches with advanced machine learning, represents the future of optical analysis—leveraging the complementary strengths of both data paradigms to advance scientific discovery.
In optical analysis, the electromagnetic spectrum is divided into specific regions based on how light interacts with matter. The ultraviolet (UV), visible (VIS), near-infrared (NIR), and short-wave infrared (SWIR) ranges constitute the fundamental "optical window" for a vast array of analytical techniques, from microscopy to remote sensing [15]. These non-ionizing radiation bands are critical for research because their photon energies correspond to specific molecular transitions, including electronic excitations (UV-VIS) and molecular vibrations (NIR-SWIR) [15] [16]. The ability to probe these interactions forms the basis for identifying materials, assessing chemical composition, and determining physical properties in a non-destructive manner, which is particularly valuable in pharmaceutical and biomedical research [17].
The distinction between hyperspectral imaging and spectroscopy often lies in how these wavelength ranges are exploited. While conventional spectroscopy techniques typically measure a single spectrum from a sample point or volume, hyperspectral imaging generates a spatially resolved spectrum for each pixel in a scene, creating a rich three-dimensional dataset known as a hyperspectral cube [15] [18]. This integration of spatial and spectral information enables more comprehensive analysis but requires careful consideration of the operational wavelength ranges to optimize detection for specific applications.
Defining the Spectral Regions
The optical spectrum used in analytical applications is systematically divided into regions defined by specific wavelength boundaries. Each region offers unique insights based on how different materials absorb, reflect, or emit radiation.
Table 1: Standard Wavelength Ranges for Optical Analysis
| Spectral Region | Wavelength Range | Primary Interactions | Key Material Properties Probed |
|---|---|---|---|
| Ultraviolet (UV) | 200 - 400 nm [15] | Electronic transitions | Molecular conjugation, chromophores |
| Visible (VIS) | 400 - 700 nm [15] [19] | Electronic transitions | Color, pigment composition |
| Near-Infrared (NIR) | 700 - 1000/1100 nm [15] [20] | Overtone & combination vibrations | Organic functional groups (O-H, N-H, C-H) |
| Short-Wave Infrared (SWIR) | 1000 - 2500 nm [15] [16] [19] | Fundamental molecular vibrations | Moisture, proteins, sugars, mineral composition |
Ultraviolet and Visible (UV-VIS) Regions
The UV (200-400 nm) and VIS (400-700 nm) regions involve high-energy photons that cause electronic transitions in molecules [15]. These transitions occur when electrons are promoted to higher energy orbitals, making UV-VIS spectroscopy particularly sensitive to conjugated systems and chromophores. In pharmaceutical research, this region is extensively used for quantifying drug concentrations, studying protein-ligand interactions, and validating the identity of chemical compounds through characteristic absorption profiles [17].
Near-Infrared (NIR) Region
The NIR region (700-1100 nm) captures overtone and combination bands of fundamental molecular vibrations, primarily those involving C-H, O-H, and N-H bonds [15] [20]. While these signals are weaker than fundamental absorptions, they enable deeper penetration into biological tissues and are valuable for non-invasive analysis of intact samples. The NIR region is often called the "NIR-I" window in biomedical contexts, where it facilitates small animal imaging with reduced scattering compared to visible light [20].
Short-Wave Infrared (SWIR) Region
The SWIR region (1000-2500 nm) contains more specific and pronounced spectral features resulting from fundamental molecular vibrations [16]. This region provides distinct spectral fingerprints for many materials, including moisture content, sugars, proteins, and specific mineral types [16]. SWIR imaging is particularly powerful because it can probe chemical composition beyond surface appearance. Recent technological advances have expanded the traditional SWIR range (900-1700 nm) to include extended SWIR (eSWIR) up to 2500 nm, enabling detection of an even broader array of molecular species [19].
Comparative Analysis: Hyperspectral Imaging vs. Spectroscopy
The choice between hyperspectral imaging and point spectroscopy depends on the research objectives, with each approach offering distinct advantages for material characterization and analysis.
Table 2: Hyperspectral Imaging vs. Spectroscopy for Optical Analysis
| Analysis Feature | Hyperspectral Imaging (HSI) | Conventional Spectroscopy |
|---|---|---|
| Data Dimensionality | 3D (x, y, λ): Spatially resolved spectra [15] | 1D (λ): Single point or bulk measurement [21] |
| Spectral Resolution | High (hundreds of contiguous bands) [18] | Very High (can exceed HSI) [21] |
| Spatial Information | Directly provides chemical distribution maps [16] | Requires raster scanning for mapping |
| Measurement Throughput | High for large areas (parallel acquisition) [18] | Lower (sequential point measurements) |
| Data Volume | Large (data cubes require significant processing) [21] [15] | Small (individual spectra) |
| Primary Applications | Tissue heterogeneity, mineral mapping, quality control [22] [16] | Concentration quantification, kinetic studies, pure material analysis [17] |
Data Structure and Information Content
Hyperspectral imaging creates a data cube where two spatial dimensions combine with one spectral dimension, providing a complete spectrum for every pixel [15]. This structure enables researchers to visualize the spatial distribution of chemical components within a sample. For example, in pharmaceutical quality control, HSI can map the homogeneity of active ingredient distribution in a tablet, while also detecting contaminants in specific regions [22] [17]. In contrast, conventional spectroscopy generates a single spectrum representing the average composition of the sampled volume, making it excellent for uniform samples but limited for heterogeneous materials [21].
Application-Specific Performance
The selection between these techniques often depends on the fundamental research question. Hyperspectral imaging excels when spatial distribution is critical, such as in medical diagnostics for identifying tumor margins, in agriculture for mapping crop stress, or in mineralogy for identifying ore distribution [22] [16] [18]. Spectroscopy remains superior for high-precision quantification of analytes in solution, detailed kinetic studies, and when analyzing minute spectral shifts requiring the highest possible spectral resolution [21] [17]. In drug development, this might translate to using spectroscopy for precise concentration measurements in plasma, while employing HSI for characterizing drug distribution in tissue samples [17].
Experimental Protocols for Spectral Analysis
Protocol 1: SWIR Hyperspectral Imaging for Pharmaceutical Quality Control
This protocol details the detection of active pharmaceutical ingredient (API) distribution in solid dosage forms using SWIR hyperspectral imaging [16].
Methodology:
- Sample Preparation: Place tablet samples on a motorized translation stage under the SWIR hyperspectral camera.
- Image Acquisition: Use a push-broom SWIR imaging system (1000-2500 nm range) with spectral resolution ≤ 10 nm. Illuminate samples with halogen lamps at 30° incidence angle to minimize specular reflection.
- Spectral Calibration: Acquire dark current (with lens cap) and white reference (using Spectralon panel) images for radiometric correction.
- Data Collection: Scan each tablet with spatial resolution ≤ 50 μm/pixel. Generate hyperspectral cubes with spatial dimensions (x, y) and spectral dimension (λ).
- Data Analysis:
- Apply Savitzky-Golay smoothing and Standard Normal Variate (SNV) normalization to reduce noise.
- Use Principal Component Analysis (PCA) to identify spectral patterns associated with API and excipients.
- Develop partial least squares (PLS) regression models to quantify API concentration, validated with reference HPLC measurements.
Protocol 2: NIR-II/SWIR Fluorescence Spectroscopy for Preclinical Imaging
This protocol utilizes the NIR-II/SWIR window (1000-1700 nm) for deep-tissue fluorescence imaging in small animals, offering superior resolution compared to conventional NIR-I imaging [20].
Methodology:
- Fluorescent Probe Selection: Administer NIR-II fluorescent probes (e.g., single-walled carbon nanotubes, quantum dots, or rare-earth-doped phosphors) via tail vein injection in mice.
- Instrument Setup: Use a scientific-grade InGaAs camera (640×512 pixel array) with sensitivity in the 900-1700 nm range. Cool detector to -40°C to reduce dark current.
- Excitation Source: Illuminate with 808 nm laser source with appropriate bandpass filters.
- Image Acquisition: Acquire fluorescence images with exposure times 100-500 ms. Use 1300 nm longpass emission filters to isolate NIR-II signal.
- Data Processing:
- Subtract background autofluorescence using images from pre-injection time points.
- Apply flat-field correction to compensate for uneven illumination.
- Calculate signal-to-background ratio (SBR) and spatial resolution using line profile analysis across blood vessels.
- Compare image quality with parallel NIR-I (700-900 nm) imaging using silicon-based detectors.
The Scientist's Toolkit: Essential Research Reagent Solutions
Successful implementation of optical analysis techniques requires specific instrumentation and reagents tailored to the wavelength range and application.
Table 3: Essential Research Tools for Optical Analysis Across Spectral Ranges
| Tool Category | Specific Examples | Function & Application |
|---|---|---|
| Detection Systems | InGaAs FPA cameras (640×512) [23] [20], SenSWIR sensors [19], Scientific CCD/CMOS [20] | SWIR/NIR detection (InGaAs), VIS/NIR detection (Si-based sensors) |
| Spectral Separation | Diffraction gratings [15], Prisms [15], Liquid Crystal Tunable Filters (LCTFs) [15] | Wavelength dispersion for spectral resolution |
| Illumination Sources | Halogen lamps [19], 808 nm lasers [20], Tungsten-filament sources | Broadband (halogen) or specific (laser) excitation |
| Reference Materials | Spectralon panels [16], NIST-traceable standards | Radiometric calibration, wavelength verification |
| Fluorescent Probes | Single-walled carbon nanotubes [20], Rare-earth-doped phosphors [20], Quantum dots [20] | Contrast agents for NIR-II bioimaging |
| Software Tools | The Spectral Assistant/TSSA [21], LightField [20], ENVI | Hyperspectral data processing & analysis |
The strategic selection of wavelength ranges—UV-VIS-NIR-SWIR—forms the foundation of effective optical analysis in research environments. While UV-VIS provides electronic transition information valuable for quantification, the NIR-SWIR regions offer deeper material characterization through vibrational spectroscopy. The choice between hyperspectral imaging and conventional spectroscopy represents a fundamental trade-off between spatial mapping capability and spectral resolution or measurement throughput. Hyperspectral imaging excels in visualizing chemical distribution in complex, heterogeneous samples, while spectroscopy remains powerful for precise quantification of specific analytes. Emerging technologies, including extended-range InGaAs detectors, quantum-enhanced sensors, and miniaturized hyperspectral systems, continue to expand the applications of these techniques across pharmaceutical development, biomedical research, and material science [24] [19]. Researchers can optimize their analytical approaches by understanding the specific information content and technical requirements of each spectral region and measurement modality.
Hyperspectral imaging (HSI) and spectroscopy are foundational technologies in modern optical analysis, each offering distinct approaches to material characterization. Hyperspectral imaging combines imaging and spectroscopy to capture a three-dimensional data cube, providing both spatial and spectral information for every pixel in a scene [1]. This enables researchers to visualize the distribution of chemical compounds across a sample surface. In contrast, conventional spectroscopy typically acquires a single spectrum from a specific spot on a sample, providing detailed chemical information but without inherent spatial context [25]. The core hardware components—spectrometers, detectors, and imaging systems—define the capabilities, limitations, and appropriate applications for each technique, making component selection critical for research and drug development applications.
The technological landscape is evolving rapidly, with the global hyperspectral imaging systems market projected to grow from USD 847 million in 2024 to approximately USD 1,535 million by 2029, representing a compound annual growth rate (CAGR) of 12.6% [26]. This growth is fueled by emerging applications across healthcare, life sciences, and drug development that demand more precise analytical capabilities. This guide provides a detailed comparison of the key hardware components, supported by experimental data, to inform researchers and professionals in selecting the optimal technology for their specific analytical requirements.
Core Hardware Components and Technologies
Detector Technologies
The detector is a critical hardware component that converts photons into electrical signals, with its material composition determining sensitivity across specific wavelength ranges.
Table 1: Key Detector Technologies for Hyperspectral Imaging and Spectroscopy
| Detector Type | Material Composition | Wavelength Range | Common Applications | Relative Performance |
|---|---|---|---|---|
| Silicon (Si) | Crystalline Silicon | ~400-1000 nm (VNIR) | Plant phenotyping, color measurement [27] [28] | High quantum efficiency in VNIR; insensitive beyond 1000 nm |
| Indium Gallium Arsenide (InGaAs) | InGaAs photodiode arrays | 900-1700 nm (NIR) [25] | Wood analysis, pharmaceutical authentication, forensic blood detection [11] [25] [8] | Good SNR; typically requires cooling for optimal performance [25] |
| Mercury Cadmium Telluride (MCT) | HgCdTe alloy | 1000-2500 nm (SWIR) [25] | Moisture mapping, polymer analysis, chemical imaging [27] [25] | High sensitivity across SWIR; requires cryogenic cooling |
| Next-Generation Sensors (e.g., IMX990) | Advanced semiconductor | 490-1780 nm [29] | Industrial sorting, document verification, medical diagnostics [29] | Enhanced spectral detail with reduced noise; single-camera solution [29] |
Spectrometer Configurations
Spectrometers form the core of both conventional spectroscopy and hyperspectral imaging systems, with distinct configurations optimized for different measurement scenarios.
Conventional Benchtop Spectrometers typically utilize a point-based approach where light is collected from a single, defined location on a sample via a fiber optic probe or direct illumination [25]. These systems provide high spectral resolution and signal-to-noise ratio (SNR) by averaging multiple sub-scans from the same spot, making them ideal for homogeneous sample analysis or when detailed chemical information from specific points is required [25]. The hardware typically includes a high-resolution dispersive element and a sensitive detector array, with scan times averaging 40 seconds per sample in comparative studies [25].
Hyperspectral Imaging Spectrometers employ various scanning methodologies to capture spatial and spectral information simultaneously:
Pushbroom/Line-Scanning: This dominant HSI technology captures an entire line of spatial data with full spectral information for each pixel simultaneously [27] [26]. The system moves the sample or sensor to build a complete data cube. Pushbroom systems accounted for the largest market share (62% in 2024) and are expected to maintain 30% revenue share in 2025 due to their high spatial and spectral fidelity [27] [30]. They are particularly valuable for conveyor-based industrial applications and laboratory analysis of solid samples [26].
Snapshot Imaging: These systems capture the entire hyperspectral data cube in a single exposure without scanning, enabling rapid analysis of dynamic processes [27]. While offering advantages for real-time applications, they typically provide lower spatial and spectral resolution compared to pushbroom systems. The snapshot imaging segment is growing rapidly with a CAGR of 16.9% [27].
Tunable-Filter Systems: These systems employ electronically tunable filters (such as acousto-optic or liquid crystal filters) that sequentially scan through wavelengths while a conventional camera captures images at each band [27]. This approach offers flexibility in spectral band selection but involves longer acquisition times due to the sequential capture process.
Imaging Systems and Platforms
The integration of spectroscopic components into complete imaging systems creates platforms tailored to specific application environments:
Laboratory Imaging Systems include benchtop HSI instruments designed for controlled laboratory settings. These systems typically incorporate stable illumination sources, precision translation stages for sample movement, and environmental controls to ensure measurement consistency. Examples include the Specim FX120, a long-wave infrared pushbroom camera for chemical imaging [26].
Portable and Handheld Devices represent a growing segment enabled by detector miniaturization. These battery-operated instruments allow field-based analysis for applications such as agricultural monitoring, environmental assessment, and pharmaceutical authentication [8] [28]. The development of "snapshot" HSI technology is particularly relevant for smartphone integration and medical diagnostics [27].
Remote Sensing Platforms include UAV-mounted and satellite-based HSI systems for large-area monitoring. The FY 2025 U.S. defense budget earmarks significant funding for space-borne hyperspectral constellations, with companies like Orbital Sidekick already deploying satellites with 468 spectral bands dedicated to methane and pipeline monitoring [27].
Performance Comparison and Experimental Data
Analytical Performance Metrics
Direct comparisons between hyperspectral imaging and conventional spectroscopy reveal distinct performance characteristics across key metrics:
Table 2: Performance Comparison of HSI and Conventional Spectroscopy
| Performance Metric | Hyperspectral Imaging (Pushbroom) | Conventional Spectroscopy (Point-based) |
|---|---|---|
| Spatial Information | Full spatial context (data cube) [1] | Single point measurement [25] |
| Spectral Range | VNIR (400-1000 nm), SWIR (1000-2500 nm), LWIR (7.7-12.3 µm) [27] [26] | Typically limited to specific range per instrument |
| Spectral Resolution | Varies (e.g., 1.43 nm/channel for advanced systems [29]) | Typically higher resolution for benchtop systems |
| Acquisition Speed | 3-5 seconds per sample for lab systems [25] | ~40 seconds per sample for high-quality spectra [25] |
| Signal-to-Noise Ratio | Generally lower due to limited integration time per pixel [25] | Higher due to multiple averaged sub-scans [25] |
| Data Volume | Very high (1+ TB/hour for megapixel cameras) [27] | Moderate (MB per spectrum) |
Experimental Comparison Studies
Wood Property Analysis
A rigorous comparison of one NIR-HSI (900-1700 nm) and three SWIR-HSI (1000-2500 nm) cameras with a benchtop NIR spectrometer (1100-2500 nm) for analyzing specific gravity (SG) and stiffness (MOE) in Douglas-fir samples revealed important performance differences [25].
Experimental Protocol:
- Sample Preparation: 100 Douglas-fir samples were selected to represent the full range of MOE and SG values
- Spectral Acquisition: All samples were analyzed on four different HSI instruments and a benchtop NIR spectrometer
- Data Processing: Spectral data from all instruments was processed using consistent chemometric methods
- Model Validation: Calibration models for SG and MOE were developed and validated using cross-validation techniques
Key Findings: The limited wavelength range NIR-HSI camera (900-1700 nm) provided the best models for MOE prediction, while both NIR-HSI and two SWIR-HSI cameras delivered comparable SG results. The benchtop NIR spectrometer generally provided superior signal-to-noise ratio but without spatial context [25].
Bloodstain Deposition Time Estimation
Forensic research compared HSI and NIR spectroscopy for estimating bloodstain deposition time, highlighting the complementary value of both technologies [11].
Experimental Protocol:
- Sample Preparation: Bloodstains were aged on various substrates over a 60-day period
- Spectral Acquisition: Periodic analyses conducted using both HSI and NIR spectroscopy
- Data Processing: Chemometric analysis following standard normal variate (SNV) preprocessing
- Model Development: Application of PLS regression with polynomial features and multilayer perceptron (MLP) for data fusion
Key Findings: For homologous data fusion, comparable root mean square errors of prediction (RMSEP) were achieved for HSI and NIR spectra (8.35 and 8.15 days, respectively). The integration of both methods through data fusion helped mitigate external influences and enhanced general applicability [11].
Research Reagent Solutions and Essential Materials
Table 3: Essential Research Materials for Hyperspectral Imaging and Spectroscopy
| Item | Function | Example Applications |
|---|---|---|
| Spectralon Reference Panels | Provides >99% diffuse reflectance for calibration [25] | Instrument calibration before sample measurement |
| Tungsten Halogen Illumination | Stable, broad-spectrum light source for NIR-SWIR [25] | Consistent sample illumination in laboratory HSI |
| Peltier-Cooled Detector Assemblies | Reduces thermal noise in InGaAs and MCT detectors [25] | Improving SNR in NIR and SWIR spectral regions |
| Linear Translation Stages | Provides precise sample movement for pushbroom scanning [25] | Laboratory HSI of solid samples |
| Hyperspectral Data Processing Software | Analyzes large hyperspectral data cubes [27] | Chemical mapping, classification, quantification |
| Chemometric Software Packages | Develops predictive models from spectral data [11] | PLS regression, PCA, machine learning applications |
Technology Selection Workflow
Technology Selection Workflow for Optical Analysis
Implementation Considerations for Research and Drug Development
Data Management and Computational Requirements
The substantial data volumes generated by hyperspectral imaging systems present significant implementation challenges. A megapixel camera streaming 1,000 spectral channels at 100 frames per second can produce more than 1 TB of data per hour, necessitating robust data management infrastructure [27]. Organizations must invest in high-throughput data links, petabyte-scale storage archives, and advanced computational resources for processing and analysis. Many research facilities are adopting cloud-based analytics platforms and AI-driven data reduction techniques to manage these computational demands effectively [28].
Expertise and Training Requirements
Both hyperspectral imaging and advanced spectroscopy techniques demand specialized expertise for proper implementation. Successful deployment requires knowledge in remote sensing, spectral analysis, image processing, and chemometrics [26]. The shortage of qualified professionals with these interdisciplinary skills can constrain adoption, particularly in rapidly expanding application areas. Organizations should anticipate ongoing training requirements and potentially higher operational costs associated with specialized personnel needs.
Cost Analysis and Budget Considerations
Hardware acquisition represents only one component of the total cost of ownership. Complete hyperspectral imaging solutions for research laboratories frequently exceed USD 500,000, with additional annual costs for data management and specialized software [27]. Conventional spectroscopy systems typically involve lower initial investment but may lack the spatial capabilities needed for heterogeneous sample analysis. The development of more affordable, portable systems (sub-USD 10,000 for some agricultural drone payloads) is increasing accessibility across budget-constrained research environments [27].
Future Trends and Developments
The hyperspectral imaging landscape is evolving rapidly, with several key trends shaping future capabilities:
AI Integration and Automation: The integration of artificial intelligence, particularly deep learning algorithms, is transforming data analysis workflows. Adaptive acquisition algorithms and neural network-based feature extraction are enabling automated interpretation of complex spectral data, reducing dependency on specialized expertise [8]. Edge neural networks now reside directly on detector arrays, pushing real-time throughput beyond 1.2 terabits per second for applications requiring immediate analytical results [27].
Miniaturization and Portability: Ongoing sensor miniaturization is producing increasingly compact and portable systems. The development of thin-film filter stacks from organizations like Imec allows CMOS-level manufacturing, dramatically reducing costs while increasing frame rates [27]. This trend is enabling new application scenarios in field-based analysis, medical diagnostics, and integration with consumer devices.
Cost Reduction Trends: Rapid cost erosion in VNIR/SWIR sensors is significantly improving accessibility. InGaAs wafer yields have doubled since 2024, with shared back-end packaging lines mimicking smartphone camera economics and pushing average selling prices down nearly 40% per year [27]. Cost parity with mid-range CMOS imagers is expected by 2027, potentially transitioning hyperspectral cameras from capital equipment to consumable tools in many production and research environments.
Multimodal Data Fusion: Research increasingly demonstrates the complementary value of combining multiple spectral technologies. Studies show that data fusion of HSI and NIR spectroscopy helps mitigate external influences and enhances methodological generalizability [11]. The implementation of multilayer perceptrons for regression prediction through multimodal data fusion has demonstrated improved overall model performance for analytical applications [11].
Techniques and Transformative Applications in Biomedicine and Pharma
The imperative for precise tumor margin assessment during cancer surgery is a significant challenge in surgical oncology. Up to 39% of patients leave the operating room with positive or close margins, which drastically increases the risk of local recurrence and necessitates further interventions [31] [32]. In breast-conserving surgery (BCS) specifically, re-excision rates due to positive margins can be as high as 19% [33]. Traditional methods for intraoperative margin assessment, including frozen section analysis, present limitations such as processing delays, sampling errors, and prolonged surgical times [34] [32]. These clinical challenges have driven the development of advanced, label-free optical technologies that can provide real-time, objective tissue differentiation without requiring exogenous contrast agents.
Hyperspectral imaging (HSI) and diffuse reflectance spectroscopy (DRS) represent two complementary approaches in this innovative field. Both techniques leverage the interaction between light and biological tissues to extract diagnostically valuable information based on tissue composition, morphology, and physiology [33] [34]. When light illuminates tissue, it undergoes several processes including absorption by chromophores (such as hemoglobin, water, and lipids) and scattering from cellular and subcellular structures [33]. These optical properties alter with disease progression, creating spectral signatures that can differentiate malignant from benign tissue [31] [32]. This review provides a comprehensive comparison between imaging-based (HSI) and point-based (DRS) techniques, examining their respective technologies, performance metrics, experimental protocols, and potential for integration into clinical workflows for cancer diagnostics and surgical guidance.
Technology Comparison: Hyperspectral Imaging vs. Spectroscopy
The fundamental distinction between hyperspectral imaging and spectroscopy lies in their spatial approach to spectral acquisition. Hyperspectral imaging is a whole field-of-view technique that captures both spatial and spectral information simultaneously, creating a three-dimensional dataset called a hypercube (x,y,λ) [33] [34]. This hypercube contains complete spectral information for each pixel within the imaging area, enabling the creation of spatial maps of tissue composition. In contrast, diffuse reflectance spectroscopy is a point-based technique that measures the intensity of diffusely reflected light as a function of wavelength from a single, specific tissue location using fiber optic probes placed in contact with the tissue [33].
Technical Specifications and Data Output: Hyperspectral imaging systems typically acquire data across hundreds of narrow, contiguous spectral bands, ranging from the visible to near-infrared regions (e.g., 450-900 nm) [31] [32]. This extensive spectral resolution enables precise identification of materials and tissues that traditional imaging cannot distinguish [8]. The resulting data structure facilitates both spectral analysis and spatial visualization of tissue characteristics. Conversely, diffuse reflectance spectroscopy provides a single spectral curve representing the average optical properties of the probed tissue volume without inherent spatial context. This makes DRS suitable for specific point measurements but limited for assessing large or heterogeneous tissue areas.
Clinical Integration and Practical Considerations: From a clinical implementation perspective, HSI offers non-contact operation, which is particularly advantageous for intraoperative use where maintaining sterile fields is crucial [34] [35]. The ability to rapidly scan entire surgical fields (e.g., tumor beds) without physical contact represents a significant advantage for workflow integration. However, HSI systems generate large, complex datasets that require sophisticated processing algorithms and substantial computational resources [8] [34]. DRS systems, with their simpler data structure and smaller footprint, may offer easier initial implementation and lower computational demands, but their point-sampling nature requires multiple measurements to assess larger areas, potentially increasing procedure time and introducing sampling errors.
Table 1: Fundamental Technical Characteristics of HSI and DRS
| Characteristic | Hyperspectral Imaging (HSI) | Diffuse Reflectance Spectroscopy (DRS) |
|---|---|---|
| Spatial Approach | Whole field-of-view imaging | Point-based measurement |
| Data Structure | 3D hypercube (x,y,λ) | 1D spectral curve |
| Spectral Resolution | Hundreds of contiguous bands | High spectral resolution |
| Tissue Contact | Non-contact | Contact (fiber optic probe) |
| Data Complexity | High (large datasets) | Low to moderate |
| Spatial Coverage | Wide area assessment | Single point assessment |
| Clinical Integration | Non-interference with sterile field | Potential disruption of sterile field |
Performance Comparison and Experimental Data
Multiple clinical studies have demonstrated the efficacy of both hyperspectral imaging and diffuse reflectance spectroscopy for discriminating between cancerous and normal tissues across various cancer types. A systematic review and meta-analysis of 19 studies examining spectrally resolved diffuse reflectance techniques for breast cancer detection revealed that imaging-based techniques (including HSI) achieved pooled sensitivity of 0.90 (CI 0.76–1.03) and specificity of 0.92 (CI 0.78–1.06), outperforming probe-based techniques (sensitivity: 0.84, CI 0.78–0.89; specificity: 0.85, CI 0.79–0.91) [33].
Organ-Specific Performance Metrics: In head and neck cancer applications, a study involving surgical specimens from 16 patients demonstrated that HSI could distinguish between cancer and normal tissue with an average accuracy of 90±8%, sensitivity of 89±9%, and specificity of 91±6% [31] [32]. For brain tumor delineation, an in-vivo study of 61 HS images from 34 patients achieved a median macro F1-Score of 70.2±7.9% for classifying tumor tissue, normal tissue, and blood vessels [35]. In dermatology applications, HSI has demonstrated sensitivity of 87% and specificity of 88% for skin cancer detection, while achieving 86% sensitivity and 95% specificity for colorectal cancer detection [8].
Breast Cancer Tissue Analysis: Research on breast cancer tissues has shown particularly promising results. One study utilizing HSI and K-means classification for histologic evaluation of ductal carcinoma in situ achieved sensitivity of 85.45% and specificity of 94.64% with a true negative rate of 95.8% and false positive rate of 4.2% [36]. Another investigation using laser-induced fluorescence with hyperspectral detection identified emission at 561 nm as exhibiting the greatest variation in fluorescence signal intensity between tumor and normal tissue, serving as an optical predictive biomarker for breast tumor identification [37].
Table 2: Performance Metrics Across Cancer Types and Modalities
| Cancer Type | Technique | Accuracy | Sensitivity | Specificity | Study Details |
|---|---|---|---|---|---|
| Breast Cancer | Imaging-based (pooled) | - | 0.90 | 0.92 | Meta-analysis of multiple studies [33] |
| Breast Cancer | Probe-based (pooled) | - | 0.84 | 0.85 | Meta-analysis of multiple studies [33] |
| Head & Neck | HSI | 90±8% | 89±9% | 91±6% | 16 patients, ex-vivo [31] |
| Brain Tumor | HSI | - | - | - | F1-Score: 70.2±7.9%, 34 patients, in-vivo [35] |
| Ductal Carcinoma | HSI + K-means | - | 85.45% | 94.64% | Histologic evaluation [36] |
| Skin Cancer | HSI | - | 87% | 88% | Clinical study [8] |
| Colorectal Cancer | HSI | - | 86% | 95% | Clinical study [8] |
Experimental Protocols and Methodologies
Hyperspectral Imaging Protocol
The standard experimental workflow for hyperspectral imaging in cancer diagnostics involves several methodical steps from data acquisition to classification. A typical protocol begins with system calibration using white and dark reference images. The white reference is acquired using a standard reflectance board, while the dark reference is captured with the camera shutter closed [31] [32]. These references are essential for subsequent data normalization to account for spectral non-uniformity of the illumination and dark current effects.
Following calibration, hyperspectral images of tissue specimens are acquired across a broad spectral range (typically 450-900 nm) at narrow intervals (e.g., 2-5 nm) [31] [32]. For surgical guidance applications, this imaging is performed in situ or on freshly excised specimens. The acquired raw data undergoes preprocessing including normalization using the equation: Ireflect(λ) = [Iraw(λ) - Idark(λ)] / [Iwhite(λ) - Idark(λ)], where Ireflect(λ) is the normalized reflectance value at wavelength λ, Iraw(λ) is the sample pixel intensity, and Iwhite(λ) and Idark(λ) are reference intensities [32].
A critical preprocessing step involves glare detection and removal, as specular reflections from moist tissue surfaces do not contain diagnostically useful information [31] [32]. glare detection typically involves calculating the standard deviation of spectral derivative curves or total reflectance values, with glare pixels exhibiting higher values than normal tissue pixels. Following glare removal, feature extraction is performed, which may include first- and second-order derivatives of spectral curves, statistical features (mean, standard deviation, total reflectance), and Fourier coefficients [31].
The final stage involves tissue classification using machine learning algorithms such as linear discriminant analysis (LDA) or support vector machines (SVM) [31]. For validation, classified images are compared against histopathological findings from hematoxylin and eosin (H&E) stained sections evaluated by experienced pathologists [31] [36].
HSI Experimental Workflow: The standard protocol for hyperspectral imaging in cancer diagnostics, from system calibration to histopathological validation.
Spectroscopy Protocol
Diffuse reflectance spectroscopy follows a different methodological approach centered on point measurements. The experimental setup typically involves a fiber optic probe containing multiple fibers, with one fiber connected to a broadband light source that transmits light to the tissue, and other fibers collecting diffusely reflected light for measurement by a spectrometer [33]. The probe is placed in direct contact with the tissue area of interest, and spectral measurements are taken from specific points.
The acquired DRS spectra are typically analyzed using models based on approximations of the radiative transport equation, such as diffusion theory, or through Monte Carlo simulations [33]. These analytical approaches enable the extraction of quantitative information about tissue optical properties, particularly absorption and scattering coefficients. The absorption data provides information about chromophore concentrations (hemoglobin, water, lipids), while scattering properties offer insights into tissue microstructure.
Validation of DRS findings follows a similar approach to HSI, with correlation to histopathological diagnosis from biopsied tissues. The primary distinction is that DRS provides information only from the specific points measured, requiring careful selection of measurement sites to ensure representative sampling of both cancerous and normal tissue regions for model development and validation.
Research Reagent Solutions and Essential Materials
Implementing hyperspectral imaging or spectroscopy for cancer research requires specific instrumentation and computational resources. The core components include specialized cameras, light sources, and analytical tools that vary between the two modalities.
Table 3: Essential Research Materials and Their Functions
| Component | Function | Examples/Specifications |
|---|---|---|
| HSI Camera Systems | Capture spatial and spectral data simultaneously | Maestro system (PerkinElmer), snapshot HSI (Rebellion Photonics) [31] [36] |
| Spectroscopy Systems | Measure point-based spectral data | Fiber optic probes coupled with spectrometers [33] |
| Light Sources | Provide illumination across spectral range | Halogen, xenon, or LED lamps; laser sources (e.g., 450 nm for fluorescence) [34] [37] |
| Reference Standards | Calibrate system response | White reference boards, dark reference measurements [31] [32] |
| Data Processing Software | Analyze spectral data, classify tissues | MATLAB, Python with custom algorithms for feature extraction [31] [35] |
| Machine Learning Tools | Tissue classification | LDA, SVM, K-means clustering algorithms [31] [36] [35] |
| Histopathology Materials | Validation ground truth | H&E staining, digitized slides [31] [36] |
For hyperspectral imaging, the Maestro imaging system represents a commercially available solution that incorporates a wavelength-scanning mechanism using a liquid crystal filter and a CCD detector, capable of obtaining reflectance images from 450-950 nm [31] [32]. Alternatively, snapshot HSI systems like the Arrow camera can capture 31 spectral bands within the 461-641 nm range in a single exposure, providing advantages for imaging moving tissues or reducing acquisition times [36]. For spectroscopy systems, fiber optic probes with multiple collection fibers arranged in specific geometries enable depth-resolved sampling of tissue optical properties.
Advanced computational tools are equally crucial for both techniques. Machine learning algorithms including support vector machines, linear discriminant analysis, and K-means clustering have been successfully implemented for tissue classification [31] [36] [35]. For HSI, spatial-spectral classification approaches that incorporate both spectral information and spatial relationships between pixels have demonstrated improved performance over purely spectral classifiers [34] [35].
Clinical Implementation and Future Directions
The translation of hyperspectral imaging and spectroscopy from research settings to clinical practice faces several considerations. For intraoperative guidance, HSI offers the significant advantage of providing wide-field assessment of surgical margins in near real-time, which aligns well with surgical workflow requirements [34]. The non-contact, label-free nature of the technology eliminates the need for contrast administration and associated regulatory hurdles or potential side effects [34] [32]. However, challenges remain regarding the integration of HSI systems into operating room environments, including sterility maintenance, system portability, and intuitive data visualization for surgeons.
The computational demands of HSI data processing represent another implementation challenge, particularly for real-time applications. Current research is addressing this limitation through the development of optimized algorithms, hardware acceleration, and artificial intelligence approaches that can provide rapid tissue classification [8] [34] [35]. The integration of deep learning techniques has shown particular promise for improving classification accuracy while reducing processing time [8] [35].
For spectroscopy, the simpler data structure facilitates faster processing times, but the point-sampling approach presents clinical limitations for comprehensive margin assessment. This technology may find optimal application in guided biopsy procedures or as a complementary tool to confirm suspicious areas identified through other imaging modalities.
Future developments in both fields are likely to focus on miniaturization of hardware, enhanced computational efficiency, and multi-modal integration. The combination of HSI with other imaging techniques, such as fluorescence or ultrasound, could leverage the strengths of each modality to improve diagnostic accuracy [34]. Additionally, the development of standardized protocols and validation across multiple institutions will be crucial for establishing these optical technologies as reliable tools for cancer diagnosis and surgical guidance.
As these technologies continue to evolve, their potential to provide real-time, objective tissue characterization during surgical procedures promises to significantly impact oncologic surgery outcomes. By enabling more complete tumor resections while preserving healthy tissue, both hyperspectral imaging and spectroscopy represent valuable additions to the surgeon's arsenal in the ongoing effort to improve cancer care.
Pharmaceutical Quality Control and Counterfeit Drug Detection
Counterfeit pharmaceuticals represent a critical global public health threat, contributing to hundreds of thousands of deaths annually and an estimated $200 billion illicit market [38]. The sophistication of counterfeit operations has evolved beyond simple visual inspection, necessitating advanced analytical technologies for detection. Within this landscape, hyperspectral imaging and spectroscopy have emerged as powerful orthogonal techniques for non-destructive pharmaceutical analysis.
This guide provides a systematic comparison of hyperspectral imaging versus spectroscopic techniques, evaluating their technical capabilities, performance characteristics, and practical implementation for pharmaceutical quality control and counterfeit detection. We examine specific experimental data, methodological protocols, and technological advancements to inform researchers, scientists, and drug development professionals in selecting appropriate analytical approaches for their specific applications.
Fundamental Technical Principles
Hyperspectral imaging combines spatial and spectral information by capturing images across numerous contiguous spectral bands, creating a three-dimensional data cube (x, y, λ) where each pixel contains a complete spectral signature [8]. This enables simultaneous morphological and molecular analysis of pharmaceutical products.
Vibrational spectroscopy techniques, including Raman and Fourier Transform Infrared (FT-IR) spectroscopy, analyze molecular vibrations without spatial resolution, providing detailed chemical fingerprinting through spectral peaks corresponding to specific functional groups and chemical bonds [39] [40].
Performance Comparison
The table below summarizes key performance characteristics based on experimental studies:
Table 1: Performance Comparison of Pharmaceutical Analysis Techniques
| Parameter | VNIR HSI (400-1000 nm) | SWIR HSI (1000-2500 nm) | Raman Spectroscopy | FT-IR Spectroscopy |
|---|---|---|---|---|
| Spatial Resolution | 10-30 μm | 10-30 μm | ~2 μm (microscopy) [40] | 5.5 μm (imaging) [40] |
| Penetration Depth | Surface analysis | Deeper penetration [41] | Surface and subsurface | Surface analysis |
| Sensitivity to Low-Dose Compounds | Limited | Moderate | Excellent [40] | Good |
| Detection Capabilities | Surface morphology, color variations [39] | Chemical distribution, coating penetration [41] | Molecular fingerprinting, crystal forms | Organic and inorganic compounds [40] |
| Accuracy in Counterfeit Detection | >90% with machine learning [38] | Nearly 100% with PCA/GLCM [41] | High with library matching | High with multivariate analysis |
| Analysis Time | Rapid (minutes per sample) | Moderate | Moderate to slow | Moderate |
Table 2: Experimental Results from Counterfeit Drug Detection Studies
| Study Focus | Technology Used | Key Findings | Accuracy/Performance |
|---|---|---|---|
| Viagra Counterfeits [41] | SWIR HSI (1000-2500 nm) | Significant reflectance differences at 1619.75 nm; GLCM contrast 16±4% higher in counterfeits | Nearly 100% discrimination using PCA |
| Multiple API Identification [42] | SWIR HSI (900-1700 nm) | Clear distinction between ibuprofen, paracetamol, and acetylsalicylic acid tablets | Complete classification of different APIs |
| API Concentration Variation [42] | SWIR HSI (900-1700 nm) | Identification of different ibuprofen concentrations through blister packaging | 100% accuracy in concentration differentiation |
| Falsified Antimalarials [40] | Raman vs. FT-IR Imaging | Raman superior for low-dose compounds; FT-IR detected both organic and inorganic components | Complete composition elucidation of falsified tablets |
| Adulterated Medicines [38] | VNIR HSI (350-1050 nm) with machine learning | Detection of calcium carbonate adulteration in tablet powders | >90% classification accuracy |
Experimental Protocols and Methodologies
Hyperspectral Imaging Analysis of Solid Dosage Forms
Sample Preparation Protocol:
- Use intact tablets without mechanical alteration
- For coated tablets, ensure uniform surface orientation
- Include authentic reference samples from verified sources
- Analyze multiple tablets from same batch (recommended n=3) for representativeness [40]
Data Acquisition Parameters (SWIR HSI):
- Spectral range: 900-2500 nm [41] [42]
- Spatial resolution: Dependent on objective lens, typically 10-30 μm
- Calibration: White reference (100% reflectance) and dark reference (0% reflectance)
- Environmental control: Stable illumination, minimal ambient light interference
Data Processing Workflow:
- Calibration: Normalize raw data using white and dark references
- Spectral Preprocessing: Standard Normal Variate (SNV) normalization, Savitzky-Golay smoothing, first derivative processing [41]
- Feature Extraction: Principal Component Analysis (PCA) for dimensionality reduction
- Texture Analysis: Grey-Level Co-Occurrence Matrix (GLCM) to quantify ingredient distribution homogeneity [41]
- Classification: Partial Least Squares Discriminant Analysis (PLS-DA) or machine learning classifiers
Experimental Findings: SWIR hyperspectral imaging demonstrated definite advantages over VNIR imaging, with higher wavelengths less sensitive to non-uniform illumination and capable of acquiring spectral information underneath tablet coatings [41]. The GLCM contrast parameter effectively quantified homogeneity of ingredient distribution, with falsified drugs showing 16±4% higher contrast than authentic products due to inferior manufacturing processes [41].
Raman and FT-IR Spectroscopy for Composition Elucidation
Sample Presentation:
- Unmodified tablet surfaces or cross-sections for microscopy
- Consistent pressure application for ATR-FT-IR
- Minimal sample exposure to prevent moisture absorption or degradation
Instrumental Parameters (Raman):
- Excitation source: 1064 nm laser [39]
- Laser power: ~1W
- Spectral resolution: 4 cm⁻¹
- Co-added scans: 256 for optimal signal-to-noise ratio [39]
- Wavenumber range: 150-1800 cm⁻¹
Data Analysis Methodology:
- Spectral Preprocessing: SNV normalization, first derivative (Savitzky-Golay), 23-point smoothing [39]
- Multivariate Analysis: Multivariate Curve Resolution-Alternating Least Square (MCR-ALS) for pure compound extraction [40]
- Semi-Quantification: Direct Classical Least Square (DCLS) applied to MCR-ALS pure spectrum matrix
Comparative Performance: Raman hyperspectral imaging demonstrated superior sensitivity for detecting low-dose compounds, attributed to its smaller sampling volume (~2 μm spot size) compared to FT-IR imaging (5.5 μm spatial resolution) [40]. Both techniques successfully identified organic and inorganic components in falsified antimalarial tablets, enabling complete composition elucidation and production fingerprinting.
Advanced Applications and Recent Technological Developments
Artificial Intelligence Integration
The integration of artificial intelligence has significantly enhanced hyperspectral data processing capabilities:
- Deep Learning Architectures: Convolutional Neural Networks (CNNs) enable efficient pixel-wise classification and target detection, automatically extracting nonlinear spectral features without manual preprocessing [43].
- Lightweight CNNs: 1D-CNN models provide effective onboard processing for resource-constrained environments, demonstrating feasibility in satellite missions like Phi-Sat-1 for real-time analysis under limited computational resources [43].
- Multilayer Perceptron Classifiers: Achieve >90% classification accuracy for detecting adulterated medicines, successfully identifying calcium carbonate additives in pharmaceutical powders [38].
Portable and Field-Deployable Systems
Technological miniaturization has enabled field-deployable systems for point-of-need pharmaceutical analysis:
- Mobile Laboratories: Deployment of over 400 van-based labs in China equipped with NIR spectrophotometers for in-field drug verification against spectral libraries [44].
- Handheld Spectrometers: Portable Raman and NIR devices allow rapid screening at supply chain checkpoints, pharmacies, and border controls with analysis times under 30 seconds [45].
- Miniaturized HSI Systems: Compact hyperspectral sensors with adaptive acquisition algorithms enable field-deployable systems for agricultural, healthcare, and pharmaceutical monitoring [8].
Essential Research Reagent Solutions
Table 3: Key Research Materials and Equipment for Pharmaceutical Analysis
| Item | Function/Application | Technical Specifications |
|---|---|---|
| HERA SWIR Hyperspectral Camera [42] | API identification and distribution analysis | Spectral range: 900-1700 nm; High spatial and spectral resolution |
| FT-Raman Spectrometer [39] | Molecular fingerprinting of pharmaceutical compounds | 1064 nm laser excitation; 4 cm⁻¹ resolution; 256 co-added scans |
| Portable NIR Analyzers [45] | Field-based counterfeit screening | microPHAZIR RX; Rapid analysis (<30 seconds); Non-destructive |
| Handheld Raman Spectrometers [40] | Supply chain verification through packaging | Through-container analysis; Library matching capabilities |
| Multivariate Analysis Software | Chemometric processing of spectral data | PCA, MCR-ALS, PLS regression algorithms; SNV preprocessing |
Hyperspectral imaging and vibrational spectroscopy provide complementary analytical capabilities for pharmaceutical quality control and counterfeit detection. SWIR hyperspectral imaging (1000-2500 nm) offers advantages for ingredient distribution mapping and coating penetration analysis, while Raman spectroscopy demonstrates superior sensitivity for low-dose compound detection. FT-IR spectroscopy provides comprehensive organic and inorganic component identification.
The integration of artificial intelligence, particularly deep learning architectures, has dramatically enhanced processing capabilities for hyperspectral data, enabling real-time analysis and automated feature extraction. Technological miniaturization continues to advance field-deployable systems, making sophisticated pharmaceutical analysis increasingly accessible throughout the global supply chain.
Selection between these orthogonal techniques should be guided by specific analytical requirements: hyperspectral imaging for spatial distribution assessment and spectroscopy for detailed molecular fingerprinting. Implementation of both approaches provides comprehensive pharmaceutical authentication, addressing the critical public health challenge of counterfeit medicines through advanced optical analysis technologies.
In the field of optical bioanalysis, Förster Resonance Energy Transfer (FRET) imaging and hyperspectral imaging (HSI) represent two powerful yet distinct approaches for probing biological systems. FRET imaging operates at the molecular scale, enabling the visualization of protein interactions, conformational changes, and biochemical signaling dynamics within living cells [46] [47]. In contrast, hyperspectral imaging provides macroscopic structural and compositional information by capturing spatially-resolved spectral data across wide areas of tissue [48] [1]. This guide provides a detailed objective comparison of these technologies, focusing on their application in biomolecular and hemodynamic analysis, supported by experimental data and protocols to inform research and drug development.
Technology Fundamentals and Comparison
Core Principles of FRET Imaging
FRET is a distance-dependent quantum mechanical process where energy non-radiatively transfers from an excited donor fluorophore to a nearby acceptor chromophore. The efficiency of this transfer is inversely proportional to the sixth power of the distance between the fluorophores, making FRET exceptionally sensitive to nanometer-scale molecular proximity changes [47]. This mechanism enables researchers to monitor molecular interactions, conformational changes, and biochemical activities in live cells with high spatiotemporal resolution, effectively serving as a "molecular ruler" for distances between 1-10 nanometers [46]. Genetically encoded FRET probes, typically employing fluorescent protein variants like CFP/YFP, have revolutionized the field by allowing specific labeling of cellular components and monitoring of dynamic processes including calcium flux, membrane voltage, and protease activity in living systems [49] [46].
Core Principles of Hyperspectral Imaging
Hyperspectral imaging integrates conventional imaging and spectroscopy to generate a three-dimensional dataset known as a hypercube, containing two spatial dimensions and one spectral dimension [48]. Unlike standard RGB imaging that captures only three broad wavelength bands, HSI acquires contiguous narrow spectral bands (often hundreds) across a wide electromagnetic range, from ultraviolet to short-wave infrared [48] [1]. When applied to biological tissue, HSI detects how light interacts with tissue components through absorption, scattering, and reflection processes. The resulting spectral signatures provide quantitative diagnostic information about tissue physiology, morphology, and composition [48]. In hemodynamics, HSI specifically exploits the distinct absorption characteristics of oxyhemoglobin and deoxyhemoglobin to assess blood oxygen saturation noninvasively [50].
Direct Technology Comparison
Table 1: Fundamental Characteristics of FRET Imaging and Hyperspectral Imaging
| Parameter | FRET Imaging | Hyperspectral Imaging |
|---|---|---|
| Spatial Resolution | Diffraction-limited (~200 nm) | Pixel-based (varies with system) |
| Proximity Sensitivity | 1-10 nm (molecular scale) | >1 μm (tissue scale) |
| Primary Biological Targets | Protein interactions, conformational changes, ion concentrations | Tissue morphology, composition, hemodynamics |
| Sample Preparation | Requires genetic encoding or fluorescent labeling | Typically label-free, non-invasive |
| Temporal Resolution | High (milliseconds to seconds) | Moderate (seconds to minutes) |
| Key Applications | Intracellular signaling, synaptic plasticity, molecular interactions | Tissue oxygenation, disease diagnosis, surgical guidance |
| Depth Penetration | Superficial (single cells to thin tissue sections) | Deeper tissue (up to several mm) |
Experimental Applications and Protocols
FRET Imaging for Neuronal Signaling Analysis
Experimental Protocol for Synaptic Plasticity Studies:
FRET imaging has been particularly valuable for studying hippocampal long-term potentiation (LTP), a fundamental process underlying learning and memory. The typical experimental workflow involves:
Probe Selection and Expression: Genetically encoded FRET probes such as GCaMP2 (for calcium) or synaptopHluorin (for neurotransmitter release) are expressed in target neurons using viral vectors or transgenic animals [49]. The selection criteria include brightness, dynamic range, and appropriate binding kinetics for the process being studied.
Sample Preparation: Acute brain slices (300-400 μm thickness) are prepared and maintained in oxygenated artificial cerebrospinal fluid. Alternatively, in vivo imaging through cranial windows can be performed for more physiological observations [46].
Image Acquisition: A widefield or confocal microscope equipped with appropriate filter sets for FRET pairs (e.g., CFP/YFP) is used. For quantitative measurements, fluorescence lifetime imaging (FLIM) systems provide more accurate FRET efficiency calculations by measuring donor fluorescence decay rates [46].
Stimulation and Recording: Neurons are stimulated electrically or chemically while time-lapse FRET images are captured. For calcium sensors like cameleon, the ratio of YFP to CFP emission intensity increases upon calcium binding, indicating neuronal activation [46].
Data Analysis: FRET efficiency is calculated using acceptor photobleaching, sensitized emission, or fluorescence lifetime measurements. Specialized software tracks changes in FRET signals over time, correlating them with stimulus parameters [47].
Key Experimental Data: In vivo FRET imaging of cerebellar Purkinje cells expressing GCaMP2 has successfully detected stimulus-evoked calcium transients with high spatiotemporal resolution, revealing dendritic computation mechanisms [49]. Similarly, synaptopHluorin has enabled visualization of odorant-evoked neurotransmitter release in mouse olfactory receptor neurons, demonstrating presynaptic activity patterns in response to different stimuli [49].
Hyperspectral Imaging for Hemodynamic Assessment
Experimental Protocol for Blood Oxygen Saturation Measurement:
HSI provides non-invasive assessment of tissue oxygenation by leveraging the distinct absorption spectra of oxyhemoglobin and deoxyhemoglobin. A typical experimental protocol includes:
System Configuration: A pushbroom HSI system with sequential bandpass illumination is configured to cover the 500-600 nm range, where hemoglobin exhibits strong characteristic absorption [50]. The system is radiometrically calibrated using a standard reflectance target.
Sample Stabilization: The tissue area of interest (e.g., skin, muscle, or brain cortex) is immobilized to prevent motion artifacts during scanning. Consistent illumination is maintained using halogen lights with stable power output [50].
Data Acquisition: Hyperspectral images are captured using a line-scanning approach, building the hypercube one spatial line at a time. Scanning duration depends on the area size and spatial resolution required, typically taking several seconds to minutes [48].
Spectral Processing: Raw spectral data undergoes preprocessing including flat-field correction, dark current subtraction, and normalization. The reflectance spectrum at each pixel is converted to absorbance using the Beer-Lambert law [50].
Quantitative Analysis: Multivariate linear regression or other chemometric methods are applied to quantify oxyhemoglobin and deoxyhemoglobin concentrations based on their known extinction coefficients. Oxygen saturation is calculated as the ratio of oxyhemoglobin to total hemoglobin [50].
Key Experimental Data: Studies utilizing HSI for blood oxygen assessment have demonstrated robust correlation with invasive blood gas measurements while offering the advantage of continuous, non-contact monitoring [50]. In forensic applications, HSI has shown capability for bloodstain age estimation on various substrates over 60 days using chemometric analysis of spectral data, with root mean square errors of prediction around 8 days for optimized models [11].
Table 2: Performance Metrics for Hemodynamic Assessment Techniques
| Performance Metric | Hyperspectral Imaging | Near-Infrared Spectroscopy | Traditional Pulse Oximetry |
|---|---|---|---|
| Spatial Resolution | High (μm to mm scale) | Low (cm scale) | Single point measurement |
| Temporal Resolution | Moderate (seconds) | High (milliseconds) | High (milliseconds) |
| Penetration Depth | Superficial to deep (μmm to cm) | Deep (cm) | Superficial (mm) |
| Oxygen Saturation Accuracy | High (validated against blood gas) | Moderate | High |
| Information Content | High (spatial maps + spectral data) | Moderate (bulk tissue spectra) | Low (single value) |
Research Reagent Solutions and Essential Materials
Table 3: Key Research Reagents and Materials for FRET and Hyperspectral Imaging
| Item | Function | Example Applications | Technical Notes |
|---|---|---|---|
| Genetically Encoded FRET Probes | Molecular sensing of ions, metabolites, and enzymatic activities | Cameleon (Ca²⁺), synaptopHluorin (neurotransmitter release) | Select based on dynamic range, brightness, and appropriate affinity [49] [46] |
| Hyperspectral Cameras | Capture spatial and spectral data simultaneously | SOC710 Series, IMX990-based systems | Spectral range selection depends on target chromophores (VNIR for hemoglobin, SWIR for deeper tissue) [29] [51] |
| Cell/Tissue Culture Materials | Maintain biological samples during imaging | Primary neurons, tissue slices, cell lines | Optimize for physiological relevance and experimental accessibility [49] [46] |
| Calibration Standards | Ensure quantitative spectral measurements | Spectralon reflectance targets, fluorescent beads | Critical for between-experiment reproducibility and quantitative comparisons [50] [48] |
| Specialized Illumination | Provide stable, uniform sample irradiation | Halogen lights, LED arrays, lasers | Uniform illumination essential for quantitative analysis; avoid tissue heating [50] [51] |
| Image Analysis Software | Process and quantify imaging data | FLIM analysis, spectral unmixing, multivariate analysis | Advanced algorithms (PLS regression, CNN) enhance data extraction accuracy [11] [1] |
Integrated Data Analysis and Interpretation
Comparative Data Analysis Workflows
FRET Data Analysis Pipeline:
- Preprocessing: Correct for background fluorescence, photobleaching, and channel crosstalk.
- Ratio Calculation: Compute emission ratios (acceptor/donor) for ratiometric FRET probes.
- FRET Efficiency Calculation: Determine using either acceptor photobleaching, sensitized emission, or fluorescence lifetime measurements.
- Spatiotemporal Mapping: Generate maps of FRET efficiency across cellular structures over time.
- Statistical Analysis: Correlate FRET changes with experimental manipulations using appropriate statistical tests.
HSI Data Analysis Pipeline:
- Spectral Calibration: Convert raw digital numbers to reflectance/absorbance values using calibration standards.
- Spectral Preprocessing: Apply scatter correction (e.g., SNV), smoothing, and derivative spectroscopy to enhance features.
- Feature Extraction: Identify characteristic spectral features related to target analytes (e.g., hemoglobin absorption peaks).
- Quantitative Modeling: Apply chemometric methods (PLS regression, MLP, CNN) to extract physiological parameters.
- Spatial Mapping: Generate false-color maps showing distribution of measured parameters across tissue.
Integrated Experimental Design Considerations
When planning experiments utilizing these technologies, several critical factors determine success:
Temporal Requirements: FRET imaging typically offers higher temporal resolution (millisecond scale) suitable for tracking rapid signaling events, while HSI acquisition is generally slower (second to minute scale) but provides comprehensive spatial-spectral information [46] [50].
Spatial Considerations: FRET imaging operates at diffraction-limited resolution, ideal for subcellular structures, while HSI resolution depends on the optical system and working distance, making it better suited for tissue-level analysis [47] [48].
Sample Compatibility: FRET requires specific labeling strategies which may perturb biological systems, whereas HSI is generally non-invasive but provides more indirect physiological information [49] [50].
Data Complexity: Both techniques generate large, multidimensional datasets requiring specialized computational tools for proper interpretation and analysis [46] [11].
FRET imaging and hyperspectral imaging offer complementary capabilities for optical analysis in biological research. FRET provides unparalleled molecular-scale resolution for probing specific biochemical events in living cells, while HSI enables non-invasive, macroscopic assessment of tissue composition and hemodynamics. The choice between these technologies depends fundamentally on the research question, with FRET excelling at mechanistic studies of molecular interactions and HSI providing superior capabilities for tissue-level physiological monitoring. As both technologies continue to advance, their integration with machine learning and multimodal imaging approaches promises to further enhance their utility in basic research and drug development applications.
Hyperspectral imaging (HSI) and traditional spectroscopy are powerful techniques for optical analysis, each with distinct advantages. Spectroscopy involves studying matter through its interaction with electromagnetic radiation, providing detailed chemical and structural information for qualitative and quantitative sample characterization [52]. Hyperspectral imaging extends this by combining spatial and spectral data, capturing hundreds of contiguous narrow spectral bands to create a detailed "hypercube" where each pixel contains a full spectrum [1]. This spatial-spectral combination enables precise material identification and distribution mapping across complex surfaces.
The integration of machine learning has revolutionized both fields, transforming spectral data analysis. Machine learning algorithms have advanced computational spectroscopy by enabling computationally efficient predictions of electronic properties and facilitating high-throughput screening [52]. In hyperspectral imaging, machine learning strengthens capabilities for automated material identification, target detection, and spectral unmixing—the process of discerning individual materials and their proportions within mixed pixels [53] [43]. This review examines the role of spectral unmixing and machine learning in advanced data analysis, comparing their applications across hyperspectral imaging and spectroscopic methodologies.
Performance Comparison: Spectral Unmixing Techniques
Spectral unmixing is a core analytical technique in hyperspectral imaging that decomposes mixed pixel spectra into a set of pure constituent spectra (endmembers) and their corresponding fractional abundances [53]. This section compares the predominant unmixing approaches and their performance characteristics.
Table 1: Comparison of Major Spectral Unmixing Approaches
| Unmixing Approach | Key Algorithms | Underlying Assumptions | Strengths | Limitations |
|---|---|---|---|---|
| Linear Unmixing | Non-negative Matrix Factorization (NMF), Vertex Component Analysis (VCA), Sequential Maximum Angle Convex Cone (SMACC) | Single scattering; linear combination of endmember spectra [53] | Computational efficiency; well-established; mathematically tractable [53] | Fails with intimate mixtures; ignores multiple scattering [53] |
| Nonlinear Unmixing | Kernel-based methods, neural networks, radiative transfer modeling | Multiple scattering occurs; intimate mixtures present [53] | Handles complex mixing physics; improved accuracy for intimate mixtures [53] | Higher computational demand; more complex parameter tuning [53] |
| Deep Learning-Based | Autoencoders, Convolutional Neural Networks (CNNs), Generative Adversarial Networks (GANs) | Data-driven features can represent mixing processes [43] | Automatic feature extraction; handles complex nonlinearities; state-of-the-art accuracy [43] | "Black box" interpretation; requires large training datasets [54] |
The standard linear unmixing approach assumes that the spectrum observed at each pixel represents a linear combination of the endmember spectra within that pixel [53]. This assumption holds well in applications where materials are spatially separated with minimal scattering, but performance degrades with intimate mixtures where nonlinear effects dominate. Recent methodologies increasingly address these limitations through nonlinear and deep learning approaches that capture more complex mixing physics [53].
Table 2: Quantitative Performance Comparison of Unmixing Algorithms
| Algorithm | Spectral Accuracy (SAD) | Spatial Accuracy (RMSE) | Computational Efficiency | Robustness to Noise |
|---|---|---|---|---|
| VCA | 0.94-0.98 | 0.08-0.12 | High | Medium |
| NMF | 0.92-0.96 | 0.06-0.09 | Medium | High |
| Kernel-based | 0.96-0.99 | 0.05-0.08 | Low | High |
| Deep Learning (CNN) | 0.98-0.99 | 0.03-0.05 | Low (training) / High (inference) | Very High |
Performance metrics represent typical ranges across multiple benchmark studies [55] [53]. Spectral Accuracy measured by Spectral Angle Distance (SAD, higher is better), Spatial Accuracy by Root Mean Square Error (RMSE, lower is better) of abundance maps.
Experimental Protocols and Methodologies
Benchmark Dataset Creation for Spectral Unmixing
The validation of spectral unmixing algorithms requires carefully designed benchmark datasets with known ground truth. A representative experimental protocol involves creating targeted scenes containing several panels of different colors and proportions [55]. In one published methodology, researchers used a terrestrial hyperspectral imager to capture scenes at various spatial resolutions ranging from 1 mm to 2 cm [55]. The target scene contained paper-based panels (each 2 cm × 2 cm) with different colors and proportions, glued to a black background board that maintained distinguishable distances between panels.
Beyond hyperspectral image acquisition, reference spectral signatures of candidate mixture materials were obtained through in-situ hyperspectral reflectance measurements using a spectroradiometer [55]. This dual-measurement approach ensures accurate ground truth for algorithm validation. Data acquisition under natural illumination conditions introduces realistic variability, enhancing the dataset's utility for evaluating algorithm robustness. Such datasets are specifically designed for proof-of-concept studies in spectral unmixing and enable performance evaluation of statistical and machine learning algorithms for target detection, classification, and sub-pixel classification tasks [55].
Bloodstain Deposition Time Estimation Protocol
A comparative study of hyperspectral and near-infrared spectroscopy for forensic applications exemplifies rigorous experimental design. Researchers aged bloodstains on various substrates over a 60-day period, conducting periodic analyses using both spectral methods [11]. Chemometric analysis of the spectral data followed Standard Normal Variate (SNV) preprocessing before applying different regression algorithms.
The analytical methodology progressed through several stages. First, linear regression analysis determined the effect of substrate material on bloodstain deposition. After distinguishing materials, partial least squares (PLS) regression extracted eight latent variables from HSI and NIR spectral data for regression prediction [11]. When linear approaches showed suboptimal performance, polynomial features were introduced into the PLS regression algorithm to capture nonlinear relationships in the spectral data, significantly enhancing prediction performance. Finally, researchers implemented a multilayer perceptron (MLP) for regression prediction through multimodal data fusion, further improving overall model performance [11].
Machine Learning Evaluation in Spectroscopic Ellipsometry
A comprehensive protocol for evaluating machine learning algorithms in spectroscopic analysis examined ZnTiO3 nanocomposites. Researchers obtained dielectric function spectra and refractive indices in the photon energy range of 0.59-4.59 eV using ellipsometry [56]. They then compared artificial neural network (ANN) and support vector regression (SVR) methods with traditional non-linear regression for analyzing ellipsometric parameters (ψ and Δ).
The methodology included quantitative evaluation of error, accuracy, and computational time required for each method [56]. This tripartite assessment provided a balanced comparison metric beyond simple predictive accuracy. The optical constants of the ZnTiO3 nanocomposite were calculated from ellipsometry measurement data, with band gap and inter-band transition energies determined through derivative analysis of the dielectric function. This protocol demonstrates how machine learning can streamline the inverse problem in spectroscopic ellipsometry, where analytical solutions are generally infeasible, especially for multi-layer samples [56].
Machine Learning Integration in Spectral Analysis
Machine Learning Approaches for Spectral Data
Machine learning has dramatically transformed spectral data analysis through several complementary approaches:
Supervised Learning: This dominant approach involves training models on input-output pairs where target properties are known. The loss function is minimized by optimizing randomly initialized model parameters during training [52]. In spectroscopy, supervised learning typically predicts tertiary outputs (like spectra) directly from input data, though learning secondary outputs (like electronic energies) provides more physical information [52]. Common applications include regression models for property prediction and classification tasks for material identification.
Unsupervised Learning: These techniques find patterns in data without access to target properties, using dimensionality reduction (like Principal Component Analysis) or clustering to post-process and analyze data [52]. Unsupervised learning is particularly valuable for exploratory analysis of spectral datasets where ground truth is incomplete or unavailable.
Deep Learning Architectures: Convolutional Neural Networks (CNNs) have shown exceptional performance for both spectral and spatial analysis of hyperspectral data, enabling efficient pixel-wise classification and target detection [43]. Lightweight CNNs and 1D-CNN models are particularly effective for resource-constrained environments like onboard satellite processing, where energy and memory are severely limited [43].
Explainable AI in Spectroscopy
As machine learning models grow more complex, interpretability has emerged as a critical challenge. Explainable Artificial Intelligence (XAI) techniques help address the "black box" nature of advanced models by identifying influential spectral regions and providing feature importance scores [54]. Key XAI approaches include:
- SHAP (SHapley Additive exPlanations): Calculates the marginal contribution of each feature (wavelength) to the prediction based on cooperative game theory.
- LIME (Local Interpretable Model-agnostic Explanations): Approximates complex models with locally interpretable models to explain individual predictions.
- Saliency Maps: Visualize which spectral regions contribute most to predictions through gradient-based sensitivity analysis [54].
The interpretability of machine learning models in spectroscopy remains challenging due to high-dimensional correlated data, the black-box nature of advanced models, lack of standardized interpretability metrics, and the inherent trade-off between accuracy and transparency [54]. Future directions include developing scalable XAI for high-dimensional spectra, integrating domain knowledge into XAI frameworks, and establishing standardized evaluation protocols.
Implementation and Practical Considerations
Research Reagent Solutions and Essential Materials
Table 3: Essential Research Materials for Hyperspectral Imaging and Spectroscopy
| Item | Function | Application Examples |
|---|---|---|
| Hyperspectral Camera | Captures spatial and spectral data simultaneously; critical for imaging applications [1] | Material identification, agricultural monitoring, forensic analysis [1] |
| Spectroradiometer | Provides precise point-based spectral measurements; validates imaging data [55] | Ground truth measurement, calibration, reference signatures [55] |
| Standard Reference Panels | Enables radiometric calibration; ensures measurement consistency | White balance, reflectance calibration, quality assurance |
| Controlled Illumination | Provides consistent, broad-spectrum lighting for reproducible measurements [51] | Laboratory hyperspectral imaging, indoor applications |
| Chemical Standards | Validates spectral signatures; confirms detection limits | Method validation, calibration curves, quality control |
| Computational Resources | Processes large hyperspectral datasets; runs machine learning algorithms [43] | Data analysis, model training, visualization |
System Cost Considerations
Implementing spectral analysis systems requires significant financial investment, with costs varying substantially by spectral range and application requirements:
- VNIR (400-1000 nm): $25,000 - $75,000 (Silicon CCD/CMOS detectors)
- SWIR (900-1700 nm): $45,000 - $90,000 (InGaAs detectors)
- Extended SWIR (1000-2500 nm): $150,000 - $300,000 (MCT, InSb detectors)
- MWIR (3000-5000 nm): $175,000 - $700,000 (InSb, PbSe detectors) [51]
Beyond the core camera, complete hyperspectral imaging systems typically include lenses, scanning stages, illumination sources, calibration references, and acquisition software [51]. Researchers can achieve cost savings through careful component selection, using existing computational resources, self-sourcing illumination (e.g., halogen lights), and constructing custom dark boxes or lab enclosures using light-blocking materials [51].
Spectral unmixing and machine learning have fundamentally advanced data analysis capabilities in both hyperspectral imaging and spectroscopy. While hyperspectral imaging provides unparalleled spatial-spectral information for complex surface analysis, traditional spectroscopy offers robust quantitative characterization for point-based measurements. Machine learning bridges these domains, enabling automated interpretation of complex spectral data and advancing applications from remote sensing to pharmaceutical development.
The integration of explainable AI techniques will be crucial for future adoption in regulated industries like drug development, where model interpretability is essential for validation and compliance. As hyperspectral systems become more accessible and machine learning algorithms more sophisticated, the synergy between spectral unmixing and artificial intelligence will continue to drive innovations in optical analysis research, enabling new discoveries and applications across scientific disciplines.
In the field of optical analysis research, hyperspectral imaging (HSI) has emerged as a powerful tool that combines imaging and spectroscopy to capture both spatial and spectral information from a scene. A fundamental challenge in HSI analysis is the prevalence of mixed pixels, which occur when multiple materials contribute to the spectral signature of a single pixel due to limited spatial resolution or material interactions [57]. Linear Spectral Unmixing (LSU) addresses this challenge by decomposing mixed pixels into their constituent pure materials (endmembers) and quantifying their proportional abundances [58] [57]. This process is crucial for transitioning from qualitative to quantitative analysis in hyperspectral remote sensing, enabling applications ranging from mineral exploration to historical document analysis [59] [60].
The selection between supervised and unsupervised approaches represents a critical methodological division in LSU. Supervised unmixing relies on prior knowledge of endmembers, while unsupervised methods automatically extract endmembers directly from the image data itself. This guide provides a comprehensive comparison of these two paradigms, focusing on their operational principles, experimental performance, and practical applicability within optical analysis research.
Conceptual Foundations of Linear Spectral Unmixing
The Linear Mixing Model
The Linear Mixing Model (LMM) is the most widely used foundation for spectral unmixing. It assumes that the spectral signature of each pixel results from a linear combination of the endmember spectra, weighted by their respective abundance fractions [58]. Mathematically, this is represented as:
[ \mathbf{y} = \mathbf{M}\mathbf{a} + \mathbf{n} ]
Where:
- (\mathbf{y}) is the observed spectral vector of a pixel
- (\mathbf{M}) is the matrix containing the endmember spectra
- (\mathbf{a}) is the abundance vector containing the proportions of each endmember
- (\mathbf{n}) represents additive noise or model error
The LMM operates under two primary physical constraints: abundance sum-to-one (ASC) and abundance non-negativity (ANC) [59]. These constraints ensure that the estimated proportions are physically meaningful, with abundances between 0 and 1 that sum to 1 for each pixel.
Key Concepts and Terminology
- Endmembers: Pure spectral signatures representing distinct materials present in the scene. These constitute the "building blocks" of all observed pixels [57].
- Abundances: Proportional concentrations of each endmember within a pixel, typically expressed as fractions between 0 and 1 [57].
- Spectral Libraries: Collections of known endmember spectra used in supervised unmixing approaches [60] [61].
- Mixed Pixels: Pixels containing multiple materials, whose spectra represent combinations of constituent endmember signatures [57].
Supervised Unmixing Approaches
Principles and Workflow
Supervised unmixing requires prior knowledge of endmembers, which are provided to the algorithm as input. These endmembers can be obtained from laboratory measurements, field spectroscopy, or existing spectral libraries [60]. The primary task of supervised methods is to accurately estimate the abundance fractions of these known endmembers within each pixel of the hyperspectral image.
The fundamental assumption is that all significant materials present in the scene are represented in the provided spectral library. The algorithm's performance heavily depends on the completeness and quality of this library, as missing or inaccurate endmembers can lead to significant unmixing errors.
Common Algorithms and Methodologies
Table 1: Key Supervised Unmixing Algorithms
| Algorithm | Full Name | Key Features | Typical Applications |
|---|---|---|---|
| FCLSU | Fully Constrained Least Squares Unmixing | Applies ASC and ANC constraints via least squares optimization | Mineral mapping [59], Historical document analysis [60] |
| SUnSAL | Sparse Unmixing via variable Splitting and Augmented Lagrangian | Leverages spectral sparsity; assumes each pixel contains few endmembers | Weed identification [62], Land cover mapping |
| SUnSAL-TV | SUnSAL with Total Variation | Incorporates spatial contextual information through TV regularization | Complex natural scenes with spatial continuity [62] |
| CR-FCLSM | Continuum Removal-FCLSM | Applies continuum removal preprocessing to enhance spectral features | Mixed mineral analysis [59] |
| NL-FCLSM | Natural Logarithm-FCLSM | Uses logarithmic transformation to improve linear characteristics | Binary mineral mixtures [59] |
Experimental Protocols and Validation
In controlled experiments with mineral mixtures (dolomite and gypsum), researchers have developed specific protocols for validating supervised unmixing methods [59]:
Sample Preparation: Pure mineral powders are mixed in precise volume ratios (e.g., 19 different mixtures), with composition verified using X-Ray Diffraction (XRD) to ensure mineralogical purity.
Spectral Acquisition: Hyperspectral data is collected using laboratory spectrometers under controlled illumination conditions to minimize external influences.
Library Development: Pure endmember spectra are collected from homogeneous samples of each mineral to build the spectral library.
Unmixing Execution: Algorithms are applied to estimate abundance fractions for each mixture.
Accuracy Assessment: Estimated abundances are compared against known mixture ratios using metrics like Abundance Error (AE) and Mean Absolute Error (MAE).
For historical document analysis, a similar rigorous approach is employed [60]:
- Hyperspectral images are captured using line-scan cameras covering VNIR (400-1000 nm) and SWIR (900-1700 nm) ranges.
- Reflectance calibration is performed using a 90% reflectance reference tile.
- Spatial registration ensures pixel-wise correspondence between VNIR and SWIR data.
- Known material samples (inks, parchment, paper) provide reference endmembers.
Unsupervised Unmixing Approaches
Principles and Workflow
Unsupervised methods operate without prior knowledge of endmembers, simultaneously extracting endmembers and estimating their abundances directly from the image data [57]. These approaches are particularly valuable in exploratory analysis where reference spectra may be unavailable or incomplete.
Most unsupervised algorithms are grounded in geometric principles, identifying endmembers as pure pixels occupying the vertices of the data simplex in the spectral feature space. This approach assumes the presence of at least one pure pixel for each endmember in the image—an assumption that may not hold in all practical scenarios.
Common Algorithms and Methodologies
Unsupervised approaches encompass several methodological families:
Geometric Methods: Including Pixel Purity Index (PPI), N-FINDR, and Vertex Component Analysis (VCA), which identify endmembers by locating the simplex vertices in the spectral data space [57].
Statistical Methods: Such as Independent Component Analysis (ICA) and Nonnegative Matrix Factorization (NMF), which decompose the data matrix under statistical independence or non-negativity constraints [57].
Sparse Regression Methods: Formulate unmixing as a sparse regression problem against a potentially over-complete spectral library [57].
Deep Learning Approaches: Autoencoders, convolutional neural networks, and transformers that learn endmember representations and abundance estimates through data-driven training [57] [61].
Experimental Protocols and Validation
Validating unsupervised methods presents unique challenges due to the absence of ground truth endmembers. Common protocols include:
Synthetic Data Generation: Creating simulated hyperspectral scenes with known endmembers and abundances to quantitatively assess unmixing accuracy [61].
Endmember Number Estimation: First determining the number of endmembers using methods like Hysime or virtual dimensionality before extraction [57].
Pure Pixel Assumption Assessment: Evaluating whether the scene contains pure pixels, which determines the appropriateness of different algorithms.
Comparison with Reference Data: When available, comparing extracted endmembers with laboratory spectra of suspected materials.
In deep learning approaches, the validation protocol typically involves [61]:
- Dividing data into training, validation, and test sets
- Using metrics like top-2 match accuracy and abundance MAE
- Comparing against baseline methods like constrained least squares
Comparative Performance Analysis
Quantitative Performance Metrics
Table 2: Performance Comparison of Unmixing Methods Across Applications
| Application Domain | Method Type | Specific Algorithm | Performance Metrics | Reference Results |
|---|---|---|---|---|
| Mineral Mapping | Supervised | NL-FCLSM | Abundance Error (AE) | 0.051 [59] |
| Supervised | RDM | Abundance Error (AE) | 0.082 [59] | |
| Supervised | CR-FCLSM | Abundance Error (AE) | 0.161 [59] | |
| Weed Identification | Supervised | VPGDU | Mean Absolute Error (MAE) | <12% [62] |
| Supervised | SUnSAL-TV | Mean Absolute Error (MAE) | ~13% lower than FCLSU [62] | |
| Historical Manuscripts | Supervised | FCLSU + SVM | Classification Accuracy | Improved detection of bleed-through [60] |
| Simulated Data | Deep Learning (Unsupervised) | Multi-head-attention network | Top-2 Match Accuracy | 97.8% [61] |
| Abundance MAE | 0.010 [61] | |||
| Simulated Data | Supervised Baseline | Constrained Least Squares | Top-2 Match Accuracy | 43.7% [61] |
| Abundance MAE | 0.094 [61] |
Methodological Trade-offs and Considerations
Table 3: Strategic Comparison of Supervised vs. Unsupervised Approaches
| Factor | Supervised Unmixing | Unsupervised Unmixing |
|---|---|---|
| Prior Knowledge Requirement | Requires complete spectral library | No prior knowledge needed |
| Computational Demand | Generally lower computational cost | Higher computational complexity |
| Implementation Complexity | Straightforward implementation | More complex parameter tuning |
| Accuracy with Complete Library | High accuracy when library is complete | Variable, depends on scene purity |
| Accuracy with Incomplete Library | Significant performance degradation | More robust to unknown materials |
| Handling of Rare/Unknown Materials | Cannot identify materials outside library | Can discover unexpected materials |
| Interpretability | High (known endmembers) | Lower (extracted endmembers may need identification) |
| Optimal Use Cases | Well-characterized environments with known materials | Exploratory analysis, unknown environments |
Integrated Workflows and Hybrid Approaches
Sequential Unmixing Strategies
In practical applications, researchers often employ hybrid approaches that leverage the strengths of both paradigms. A common strategy involves using unsupervised methods for initial endmember extraction, followed by supervised abundance estimation [57]. This approach is particularly valuable when the available spectral library may be incomplete or when unknown materials are suspected to be present in the scene.
Another emerging trend is the use of unsupervised pre-processing to refine spectral libraries before supervised unmixing. This addresses the library redundancy problem, where large spectral libraries contain many similar or correlated signatures that can degrade unmixing performance [61].
Deep Learning Integration
Recent advances in deep learning have begun to blur the traditional distinction between supervised and unsupervised approaches [57] [61]. Autoencoder architectures, for instance, can be trained in either supervised or unsupervised modes, or through semi-supervised approaches that leverage both labeled and unlabeled data. These methods have demonstrated superior performance in some applications, with one multi-head-attention network achieving 97.8% top-2 match accuracy compared to 43.7% for traditional constrained least squares [61].
The Researcher's Toolkit
Essential Research Reagents and Materials
Table 4: Key Materials and Computational Resources for Spectral Unmixing Research
| Resource Category | Specific Items | Function/Role in Research |
|---|---|---|
| Reference Materials | Mineral powder samples (e.g., dolomite, gypsum) [59] | Provide controlled experimental mixtures for method validation |
| Historical ink and parchment mock-ups [60] | Enable testing on culturally relevant materials with known composition | |
| 90% Reflectance reference tiles [60] | Support reflectance calibration during hyperspectral image acquisition | |
| Spectral Libraries | USGS Spectral Library [59] | Provide validated endmember spectra for supervised unmixing |
| Institutional spectral databases | Offer domain-specific reference signatures for targeted applications | |
| Software Tools | Python 3.10 with unmixing toolboxes [57] | Provide implemented algorithms for method development and testing |
| MATLAB Image Processing Toolbox [60] | Enable spatial registration and pre-processing of hyperspectral data | |
| Computational Resources | GPU clusters | Accelerate processing of deep learning approaches and large datasets |
Experimental Workflow Visualization
The following diagram illustrates a generalized workflow for comparing supervised and unsupervised unmixing approaches, synthesized from multiple experimental protocols in the search results:
Comparative Unmixing Workflow - This diagram illustrates the parallel pathways for supervised and unsupervised spectral unmixing approaches, converging on abundance estimation and validation.
The choice between supervised and unsupervised linear spectral unmixing approaches involves significant methodological trade-offs that must be carefully considered within the specific context of the research application. Supervised methods offer precision and computational efficiency when complete spectral libraries are available, making them ideal for well-characterized environments where target materials are known in advance. Unsupervised approaches provide discovery capability and adaptability to new environments, at the cost of greater computational complexity and potential interpretability challenges.
Recent advances, particularly in deep learning architectures and hybrid approaches, are gradually bridging the gap between these paradigms. The emergence of multi-head-attention networks and autoencoder-based methods demonstrates the potential for substantially improved unmixing accuracy, with one study reporting top-2 match accuracy improvements from 43.7% to 97.8% compared to traditional methods [61].
For researchers and practitioners, the selection criteria should extend beyond mere algorithmic performance to consider data characteristics, application requirements, and practical constraints. As hyperspectral imaging continues to evolve toward higher spatial and spectral resolutions, and as computational power increases, the integration of both supervised and unsupervised paradigms within unified frameworks represents the most promising direction for advancing quantitative optical analysis across scientific domains.
Overcoming Challenges: Data, Hardware, and Analytical Workflows
Hyperspectral imaging (HSI) generates three-dimensional datacubes that combine two-dimensional spatial information with one-dimensional spectral data, resulting in vast and complex datasets [63]. This technology, originally developed for remote sensing and astronomy, has found widespread application in biomedical research, environmental monitoring, and drug development [63] [2]. The prominent advantage of HSI lies in its superior capability for discriminating multiple chemical species, particularly when their emission or reflectance spectra are partially overlapped [63]. However, this detailed spectral resolution comes with a significant computational cost—the generation of enormous data volumes that can overwhelm conventional processing workflows, especially in time-sensitive research environments such as live-cell imaging or real-time diagnostics.
The core challenge in managing hyperspectral big data stems from several inherent characteristics of the technology. First, HSI systems typically capture tens to hundreds of contiguous spectral bands, creating substantial storage and processing demands [63]. Second, the data's high dimensionality introduces statistical challenges often referred to as the "curse of dimensionality," where the feature space becomes increasingly sparse [64]. Third, many applications require rapid analysis for practical utility, such as intraoperative surgical guidance or real-time environmental monitoring [43] [64]. These constraints have driven the development of sophisticated computational strategies aimed at reducing data dimensionality while preserving diagnostically or scientifically relevant information.
Fundamental Data Acquisition Strategies
The process of managing hyperspectral data begins at the acquisition stage, where different imaging strategies inherently influence subsequent processing requirements. Understanding these fundamental acquisition methods is crucial for selecting appropriate data management strategies.
- Point-scanning spectrometry employs a linear array of detectors to measure spectral information (λ) at an instant, followed by scanning across all spatial locations (x, y) to fill out the datacube, commonly used in hyperspectral confocal microscopy [63].
- Pushbroom spectrometry utilizes a 2D detector array to collect one (y, λ) slice of the datacube at once, requiring scanning in only one spatial (x) dimension, often implemented in line-scanning microscopy [63] [65].
- Wavelength-scanning spectrometry captures one (x, y) slice of the datacube at a time, then scans across all wavelengths (λ), representative of acousto-optic or liquid crystal tunable filter-based systems [63].
- Snapshot imaging spectrometry acquires the entire 3D datacube in a single exposure, dramatically improving light throughput compared to scanning-based systems, with technologies including image mapping spectrometry and computed tomography imaging spectrometry [63].
Each approach presents distinct trade-offs between acquisition speed, spatial resolution, spectral resolution, and photon efficiency that directly impact downstream data processing requirements. For instance, snapshot systems minimize motion artifacts and enable faster temporal sampling but may produce larger immediate data volumes, while scanning approaches allow more flexible resolution adjustments at the cost of increased acquisition time.
Comparative Analysis of Processing Algorithms
Dimensionality Reduction Techniques
Dimensionality reduction represents a critical first step in managing hyperspectral data complexity, with approaches falling into two main categories: feature extraction and band selection. Feature extraction methods transform the original spectral data into a lower-dimensional space, while band selection methods identify and retain the most informative spectral bands from the original data.
Table 1: Performance Comparison of Dimensionality Reduction Methods
| Method | Type | Key Advantage | Data Reduction Rate | Classification Accuracy | Computational Demand |
|---|---|---|---|---|---|
| Standard Deviation Band Selection [64] | Band Selection | Preserves original spectral bands | Up to 97.3% | 97.21% (organ tissues) | Low |
| Principal Component Analysis (PCA) [64] | Feature Extraction | Maximizes variance retention | Variable | Varies by application | Medium |
| Mutual Information with mRMR [64] | Band Selection | Identifies most class-relevant features | Variable | Up to 99.71% | High |
| Deep Margin Cosine Autoencoder [64] | Feature Extraction | Captures non-linear patterns | Variable | 98.41-99.97% (tissue) | Very High |
| Clustering-based Band Selection [64] | Band Selection | Maintains physical interpretability | Variable | Can surpass full-spectrum | Medium |
Recent research demonstrates that straightforward band selection approaches can provide remarkable efficiency. One study utilizing the standard deviation for band selection achieved a 97.3% reduction in data size while maintaining 97.21% classification accuracy for organ tissues with high spectral similarity [64]. This performance nearly matched the 99.30% accuracy achieved with full-spectrum data while dramatically decreasing computational requirements. Importantly, the standard deviation method exhibited superior stability and efficiency compared to mutual information- and Shannon entropy-based selection approaches [64].
For biomedical applications, clustering-based band selection has proven particularly effective. The Data Gravitation and Weak Correlation Ranking approach groups highly correlated spectral bands and selects representative bands from each cluster, preserving diagnostically relevant spectral content while significantly reducing data dimensionality [64]. In some cases, the reduced band set甚至可以 surpassed full-spectrum data in classification accuracy for tissue differentiation tasks, likely due to the removal of noise and spectral redundancy that can degrade classifier performance [64].
Spectral Unmixing Algorithms
Spectral unmixing addresses the fundamental challenge of identifying constituent materials within mixed pixels, where multiple substances contribute to the measured spectral signature. This process is particularly important in biological and medical applications where distinct cellular components or tissue types coexist within single pixels.
Table 2: Comparison of Spectral Unmixing Algorithms for Excitation-Scanning HSI
| Algorithm | Type | Key Principle | Linear Response to Ca²⁺ | Sensitivity to Autofluorescence | Best Application Context |
|---|---|---|---|---|---|
| Linear Unmixing (LU) [66] | Supervised | Linear algebra decomposition | Strong | Moderate | Known spectral signatures |
| Matched Filter (MF) [66] | Supervised | Signature matching | Strong | Low to moderate | Target detection |
| Constrained Energy Minimization (CEM) [66] | Supervised | Energy minimization | Moderate | Low | Low-contrast targets |
| Spectral Angle Mapper (SAM) [66] | Supervised | Spectral similarity | Weak | High | Spectral library matching |
| Non-negative Matrix Factorization (NMF) [63] | Unsupervised | Parts-based factorization | N/A | Adaptive | Unknown mixtures |
In dynamic cell signaling studies, such as monitoring Ca²⁺ signals in human airway smooth muscle cells (HASMCs), Linear Unmixing and Matched Filtering have demonstrated particularly strong performance, both providing similar linear responses to increasing Ca²⁺ concentrations [66]. These approaches proved effective for excitation-scanning HSI, where signal strength is often limited. The implementation of a theoretical sensitivity framework further enhanced performance by enabling pixel filtering to reject signals below a minimum detectable limit, revealing subtle kinetic features that might otherwise remain obscured [66].
The selection between supervised and unsupervised approaches depends largely on prior knowledge of the system under investigation. Supervised linear unmixing requires accurate information about the number of chromophores in the mixture and their emission or reflectance spectra, performing optimally when such reference spectra are readily available [63]. When dealing with unknown mixtures or substantial biological variability, unsupervised approaches like Non-negative Matrix Factorization become necessary, as they can estimate both the spectral component matrix and concentration matrix without exact prior knowledge [63].
Deep Learning Architectures
Deep learning has emerged as a transformative approach for hyperspectral data analysis, automatically extracting nonlinear spectral features without manual preprocessing and enabling the detection of materials or environmental anomalies that might otherwise be invisible to human analysts [43].
Table 3: Deep Learning Approaches for Hyperspectral Data Processing
| Architecture | Key Features | Best Suited Applications | Computational Requirements | Implementation Considerations |
|---|---|---|---|---|
| Lightweight CNNs & 1D-CNNs [43] | Reduced parameters, efficient inference | Onboard processing, resource-limited environments | Low to moderate | Ideal for satellite, portable devices |
| Convolutional Autoencoders [64] | Learned compression, feature extraction | Dimensionality reduction, denoising | Moderate | Balance between depth and resources |
| Deep Margin Cosine Autoencoder [64] | Enhanced class separability | Biomedical tissue classification | High | Requires extensive labeled data |
| Convolutional Neural Networks (CNNs) [43] | Joint spatial-spectral feature learning | Land classification, target detection | Moderate to high | Flexible architecture customization |
| Generative Adversarial Networks (GANs) [43] | Data augmentation, noise reduction | Limited training data scenarios | High | Training stability challenges |
Research from the European Space Research and Technology Centre demonstrates that lightweight CNNs and one-dimensional CNN models are particularly effective for onboard processing in resource-constrained environments like satellite systems [43]. The Phi-Sat-1 mission has successfully proven the feasibility of deploying compact neural networks to detect cloud cover in real time under severely limited energy and memory conditions [43]. This approach represents a significant advancement for applications requiring immediate analysis without data transmission delays.
For biomedical applications, the Deep Margin Cosine Autoencoder has shown exceptional performance in tumor tissue classification, achieving accuracies between 98.41% for normal tissue and 99.97% for tumor tissue by integrating spectral compression with a cosine-margin loss function to enhance class separability in the latent space [64]. However, such sophisticated models require extensive labeled datasets, careful architecture tuning, and substantial computational resources, potentially limiting their deployment in clinical environments with restricted infrastructure [64].
Experimental Protocols for Algorithm Validation
Protocol 1: Performance Benchmarking of Spectral Analysis Algorithms
This protocol outlines the methodology for comparing spectral analysis algorithms, based on experimental approaches used to evaluate Ca²⁺ signaling in human airway smooth muscle cells [66].
Cell Culture and Preparation:
- Human airway smooth muscle cells (HASMCs) are cultured in Dulbecco's Modified Eagles Medium supplemented with 5% fetal bovine serum, basic fibroblast growth factor, epidermal growth factor, and antibiotics [66].
- Cells are seeded onto laminin-coated glass coverslips and incubated until 70-80% confluency is achieved.
- Fluorescent labeling is performed using Ca²⁺ indicator Cal 520-AM (5 µM concentration, 30-minute incubation) and/or nuclear label NucBlue (2 drops, 20-minute incubation) [66].
Data Acquisition:
- Time-lapse excitation-scanning HSI data is acquired using a system that sequentially illuminates samples across different excitation wavelengths while detecting emission with a broad-band filter [66].
- The system captures the excitation spectrum rather than the emission spectrum, providing improved signal strength compared to traditional emission-scanning approaches.
Algorithm Implementation:
- Four spectral analysis algorithms are implemented: Linear Unmixing (LU), Spectral Angle Mapper (SAM), Constrained Energy Minimization (CEM), and Matched Filter (MF) [66].
- A theoretical sensitivity framework is applied to filter pixels with signals below a minimum detectable limit.
- Performance is quantified based on linear response to Ca²⁺ concentration and ability to reveal subtle kinetic features obscured by autofluorescence.
Protocol 2: Dimensionality Reduction Evaluation Framework
This protocol describes the methodology for evaluating dimensionality reduction techniques, based on experiments conducted with organ tissue samples [64].
Hyperspectral Imaging Setup:
- A broadband light source with tungsten-halogen bulb (spectral range: 360-2600 nm) is used for illumination [64].
- Samples are imaged using a 100× objective lens with numerical aperture of 0.85 to maintain spectral integrity while providing high spatial detail.
- A motorized sample holder enables precise line scanning with step size of 0.5 μm per scanned line.
Dimensionality Reduction Implementation:
- Multiple band selection methods are implemented: standard deviation (STD), mutual information (MI), Shannon entropy, and random band selection (RBS) as a control [64].
- Feature extraction methods including Principal Component Analysis are implemented for comparison.
- The reduction process maintains varying percentages of original spectral bands (from 10% to 2.7% of original data volume).
Performance Validation:
- A straightforward convolutional neural network is used for classification of organ tissues with high spectral similarity.
- Classification accuracy is measured against ground truth annotations.
- Computational efficiency is assessed based on processing time and memory requirements.
- Stability is evaluated through multiple iterations with different initial conditions.
The Scientist's Toolkit: Essential Research Reagents & Materials
Table 4: Essential Research Materials for Hyperspectral Imaging Experiments
| Material/Reagent | Specifications | Function | Application Context |
|---|---|---|---|
| Cal 520-AM [66] | 5 µM in DMSO, 30 min incubation | Ca²⁺ indicator for cell signaling | Dynamic studies in live cells |
| NucBlue [66] | 2 drops per sample, 20 min incubation | Nuclear counterstain | Cellular localization reference |
| HASMCs [66] | Human airway smooth muscle cells, 70-80% confluency | Model system for signaling studies | Calcium signaling, contractile studies |
| DMEM Culture Medium [66] | Supplemented with 5% FBS, growth factors | Cell maintenance and growth | Live cell imaging studies |
| Spectralon References [65] | 99% and 50% diffuse reflectance standards | Radiometric calibration | Instrument calibration |
| IGT Reference Paper [65] | C2846, non-fluorescent backing | Standardized background | Reflectance measurements |
| Tungsten-Halogen Source [64] | 360-2600 nm range, integrated collimating optics | Broadband illumination | General HSI applications |
| HySpex VNIR-1800 [65] | Push-broom hyperspectral camera | Data acquisition | Cultural heritage, material science |
The effective management of high-dimensional hyperspectral datasets requires careful algorithm selection based on specific application requirements. For resource-constrained environments such as onboard satellite processing or portable medical devices, lightweight CNNs and standard deviation-based band selection provide an optimal balance between performance and computational demands [43] [64]. In biomedical applications where interpretability is crucial, clustering-based band selection or Linear Unmixing approaches offer superior transparency while maintaining high accuracy [66] [64].
For the most challenging classification tasks with abundant computational resources and labeled data, sophisticated approaches like Deep Margin Cosine Autoencoders deliver state-of-the-art performance [64]. Regardless of the specific algorithms chosen, the implementation of a theoretical sensitivity framework with appropriate pixel filtering significantly enhances the detection of subtle features in noisy data [66]. As hyperspectral imaging continues to expand into new research domains, these data management strategies will play an increasingly critical role in translating spectral information into actionable scientific insights.
Hyperspectral imaging (HSI) has emerged as a powerful analytical tool that combines imaging and spectroscopy to provide a detailed spectral signature for every pixel in a scene. Unlike conventional RGB imaging with three broad bands or multispectral imaging with several discrete bands, hyperspectral imaging captures hundreds of contiguous narrow spectral bands, creating a rich three-dimensional data cube often called a hypercube [67]. This technological capability has found diverse applications across pharmaceutical development, agricultural monitoring, medical diagnostics, and environmental science [67] [22]. However, researchers and development professionals face a fundamental challenge: navigating the inherent trade-offs between spatial resolution, spectral resolution, temporal resolution (speed), and system cost. These parameters are deeply interconnected in HSI system design, where optimizing one typically necessitates compromises in others [68]. This guide provides a comprehensive comparison of current hyperspectral imaging technologies, examining how these critical hardware limitations manifest across different system architectures and their implications for optical analysis research compared to conventional spectroscopy.
Fundamental Hardware Trade-Offs in Hyperspectral Imaging
The Interdependence of Key Performance Parameters
The performance of any hyperspectral imaging system is governed by several interdependent hardware parameters. Spectral range defines the breadth of wavelengths the camera can capture, from ultraviolet (UV) through long-wave infrared (LWIR), with the choice of detector material being the primary determining factor [51] [68]. Spectral resolution refers to the system's ability to distinguish between adjacent wavelengths, determining how finely the spectral signature can be resolved [68]. Spatial resolution defines the smallest detectable detail in an image, which is a function of sensor design, optics, and operating altitude [67]. Finally, frame rate (speed) determines how quickly the system can capture complete hyperspectral data cubes, which is crucial for imaging dynamic processes or implementing real-time monitoring [68].
These parameters engage in a constant trade-off. For instance, higher spatial and spectral resolutions typically result in larger data volumes, which can overwhelm data transmission systems and slow acquisition speeds. Similarly, expanding the spectral range into infrared regions requires more expensive detector materials (e.g., InGaAs, MCT) and often cryogenic cooling, dramatically increasing costs [51] [68]. The following sections explore how these trade-offs manifest in different system architectures and application contexts.
Quantitative Comparison of HSI System Performance and Cost
Table 1: Hyperspectral Camera Performance Specifications and Cost by Spectral Range
| Spectral Range | Wavelength Coverage | Detector Materials | Spatial Resolution | Frame Rate Limitations | Price Range (USD) |
|---|---|---|---|---|---|
| VNIR | 400 – 1000 nm | Silicon CCD, CMOS | Medium to High | Medium to High (snapshot) | $25,000 – $75,000 |
| SWIR | 900 – 1700 nm | InGaAs | Medium | Medium (push-broom) | $45,000 – $90,000 |
| Extended SWIR | 1000 – 2500 nm | MCT, InSb | Medium to Low | Low | $150,000 – $300,000 |
| MWIR | 3000 – 5000 nm | InSb, PbSe | Low to Medium | Low to Medium | $175,000 – $700,000 |
| LWIR | 8000 – 14000 nm | FTIR | Low | Low | $800,000+ |
Table 2: Comparison of Hyperspectral Imaging Methods and Their Performance Trade-Offs
| Imaging Method | Spectral Resolution | Spatial Resolution | Frame Rate | Relative Cost | Best Suited Applications |
|---|---|---|---|---|---|
| Push-Broom (Line-scan) | High | High | Low | Medium to High | Laboratory analysis, stationary inspection |
| Snapshot | Low to Medium | Medium to High | High (Video-rate) | Medium | Real-time monitoring, dynamic process control |
| Tunable Filter | Medium to High | Medium to High | Low to Medium | Medium | Microscopy, specific wavelength applications |
| Whisk-Broom (Point-scan) | High | High | Very Low | High | High-precision laboratory measurements |
| Fourier Transform | Very High | Low to Medium | Low | Very High | Chemical analysis, research applications |
Experimental Evidence: Quantifying the Trade-Offs
High-Speed Pharmaceutical Inspection Protocol
Objective: To evaluate the feasibility of using hyperspectral imaging for real-time quality control of pharmaceutical tablets, specifically assessing API (Active Pharmaceutical Ingredient) concentration and distribution homogeneity at manufacturing line speeds.
Methodology: A study conducted by Indatech utilized a Specim FX17 push-broom NIR (900-1700 nm) hyperspectral imaging system integrated with a custom optical probe containing multiple optical fibers [69]. The system was configured to inspect tablets on a manufacturing line, with the push-broom scanner capturing spectral data across a linear field of view as tablets moved beneath it on a conveyor system. Each tablet was imaged across hundreds of spectral bands, with the resulting data processed using multivariate analysis algorithms to quantify API concentration and distribution homogeneity.
Results and Trade-off Analysis: The implementation achieved inspection rates of 150,000 to 800,000 tablets per hour, successfully identifying tablets with incorrect API concentration or non-homogeneous distribution [69]. This case illustrates the speed-resolution trade-off: while push-broom systems typically sacrifice frame rate, they can still achieve high throughput for specific industrial applications by optimizing the scanning geometry and data processing pipeline. However, this required a specialized implementation with custom optical components, increasing system complexity and cost.
Cost-Effective Active Hyperspectral Imaging System
Objective: To develop a lower-cost hyperspectral imaging alternative capable of operating in confined spaces and low-light environments, potentially making the technology accessible for broader research applications.
Methodology: Researchers developed a prototype active HSI system using an array of 76 single-wavelength LEDs as controlled illumination sources, coupled with a full-spectrum camera [70]. The system actively emits specific wavelengths when imaging, rather than relying on ambient light or broadband sources. This design eliminates the need for complex bandpass filters or dispersive optics, significantly reducing hardware complexity. The system was tested for material classification accuracy and spectral analysis performance against conventional hyperspectral imaging systems.
Results and Trade-off Analysis: The prototype system demonstrated significant cost reduction compared to commercial HSI systems while maintaining the ability to distinguish materials based on spectral signatures [70]. However, this approach involved trading off full spectral continuity for discrete wavelength sampling, potentially missing subtle spectral features between the LED wavelengths. This represents a strategic compromise between cost and spectral resolution that may be acceptable for applications targeting specific known spectral features.
High-Speed Mid-Infrared Hyperspectral Chemical Imaging
Objective: To overcome the traditional speed limitations of mid-infrared hyperspectral imaging, particularly for capturing dynamic chemical processes.
Methodology: A recent innovative approach utilized chirped pulse upconversion of sub-cycle pulses at the image plane to enable high-speed scanless MIR hyperspectral imaging [71]. The technique employs global irradiation of samples with broadband MIR pulses, which are then upconverted to visible light using a nonlinear crystal and detected with a silicon-based hyperspectral camera. This method eliminates the need for wavelength or spatial scanning, significantly accelerating data acquisition.
Results and Trade-off Analysis: The system achieved capture of 640 × 480 pixel images with 1069 spectral bands in just 8 seconds, far faster than traditional FTIR-based MIR imaging approaches [71]. For discrete frequency imaging, the system reached frame rates of 5 kHz. This breakthrough addresses the traditional speed-resolution trade-off in MIR imaging but requires highly specialized laser systems and optical setups, representing a high-cost solution primarily suitable for well-funded research facilities.
Visualization of Hardware Limitations and System Selection
Diagram 1: Hardware limitation relationships and decision pathways in hyperspectral imaging system design. Parameters compete, requiring strategic trade-offs based on application requirements.
The Scientist's Toolkit: Essential Research Reagent Solutions
Table 3: Key Components for Hyperspectral Imaging Experimental Setups
| Component | Function | Examples & Specifications | Application Notes |
|---|---|---|---|
| Hyperspectral Camera Core | Captures spectral-spatial data cube | Specim FX17 (NIR), Headwall Hyperspec, Living Optics VIS-NIR | Selection depends on required spectral range and imaging method |
| Illumination Source | Provides consistent, broadband illumination | Halogen lights, customized LED arrays | Critical for reproducible results; affects signal-to-noise ratio |
| Calibration References | Ensures spectral and radiometric accuracy | White reference panels, wavelength calibration standards | Essential for quantitative comparisons across time and systems |
| Data Processing Software | Analyzes hyperspectral data cubes | Spectral analysis algorithms, machine learning classifiers | Often requires custom development for specific applications |
| Scanning Stage/Platform | Enables spatial scanning for push-broom systems | Motorized stages, conveyor systems, UAV platforms | Required for push-broom systems; adds to system cost and complexity |
Strategic Implementation Guide for Research Applications
Framework for Selecting Hyperspectral Imaging Systems
Choosing the appropriate hyperspectral imaging technology requires careful consideration of research objectives and constraints. For pharmaceutical development applications such as tablet homogeneity analysis or coating quality assessment, SWIR push-broom systems like the Specim FX17 have proven effective, despite their moderate cost ($45,000–$90,000), because they provide the necessary spectral information in the NIR range relevant to pharmaceutical compounds [69] [72]. For dynamic process monitoring or real-time quality control, snapshot systems offering video-rate capture may be preferable, even with their lower spectral resolution, as they can capture temporal changes in spectral properties [68] [22]. For field applications or studies with limited budgets, emerging lower-cost alternatives such as active LED-based systems or customized solutions provide a viable entry point, though often with compromises in spectral range or resolution [70] [73].
Future Directions in Hyperspectral Imaging Technology
The field of hyperspectral imaging continues to evolve with several promising trends that may alleviate current hardware limitations. Snapshot imaging technologies are advancing toward higher spectral resolutions while maintaining their speed advantages [68] [22]. Computational imaging approaches, including hyperspectral reconstruction from multispectral data, show potential for reducing costs while preserving spectral information content [73]. Additionally, the integration of machine learning directly into hyperspectral data processing pipelines is helping to extract more information from limited datasets, potentially reducing the need for extremely high spatial or spectral resolutions in some applications [70]. These advancements suggest that the strict trade-offs between spatial-spectral resolution, speed, and cost may become less constraining in coming years, opening new possibilities for research applications across scientific disciplines.
Hyperspectral imaging technology presents researchers with a complex landscape of hardware limitations where spatial resolution, spectral resolution, acquisition speed, and system cost exist in a delicate balance. As the experimental evidence demonstrates, there is no universal solution—each imaging method and spectral range offers distinct advantages that must be matched to specific research requirements and constraints. Push-broom systems provide high spectral fidelity for laboratory analysis, while snapshot technologies enable real-time monitoring applications, and emerging low-cost alternatives increase accessibility at the expense of comprehensive spectral coverage. For researchers and drug development professionals, successful implementation requires carefully considering which parameters are most critical for their specific applications and making strategic decisions about where compromises can be tolerated. As technology continues to advance, particularly in computational imaging and machine learning, the current limitations are likely to become less restrictive, further expanding the potential of hyperspectral imaging across scientific research domains.
Hyperspectral imaging (HSI) and spectroscopy are powerful optical analysis techniques that have become indispensable in modern research, from drug development to material science. HSI combines digital imaging with spectroscopy, capturing a full spectrum for each pixel in a scene to form a three-dimensional data cube (hypercube) that contains both spatial and spectral information [1] [15]. Spectroscopy, in its conventional form, provides detailed spectral data from a single point or averaged area without spatial context [74]. The fundamental distinction lies in their data output: HSI generates spatially-resolved spectral data, enabling visualization of chemical distribution, while conventional spectroscopy offers precise spectral information from a specific measurement point [1] [74].
The critical challenge for researchers lies in selecting appropriate analysis methods for the rich datasets generated by these techniques. Classical approaches, rooted in statistical and chemometric principles, provide interpretable and established workflows. In contrast, artificial intelligence (AI)-driven methods offer unprecedented capabilities for handling complex, high-dimensional data but require substantial computational resources and expertise [75] [76]. This guide objectively compares both analytical paradigms, providing experimental data and protocols to inform selection for specific research applications in pharmaceutical development and scientific discovery.
Fundamental Principles: Classical Versus AI-Driven Analysis
Classical Analysis Methods
Classical analysis methods for spectroscopic and HSI data are typically grounded in statistical modeling and chemometrics. These approaches include:
Principal Component Analysis (PCA): A dimensionality reduction technique that transforms high-dimensional spectral data into a smaller set of uncorrelated variables (principal components) that capture the maximum variance in the data [15]. This method is particularly valuable for identifying patterns, outliers, and dominant spectral features without the influence of data labels.
Partial Least Squares (PLS) Regression: A supervised method that projects both predictors (spectral data) and responses (target properties) to new spaces, maximizing the covariance between them [11]. PLS is widely employed for quantitative analysis, such as predicting component concentrations or physical properties from spectral measurements.
Linear Discriminant Analysis (LDA): A classification technique that finds linear combinations of features that best separate two or more classes of samples [15]. LDA is effective for categorical discrimination based on spectral signatures.
Spectral Unmixing: A process that decomposes mixed pixels in HSI data into a collection of pure constituent spectra (endmembers) and their corresponding fractional abundances [15]. This is particularly crucial for analyzing heterogeneous samples where multiple components contribute to the spectral signal at each pixel.
AI-Driven Analysis Methods
AI-driven methods leverage machine learning (ML) and deep learning (DL) to automatically learn complex patterns and relationships from spectral data:
Convolutional Neural Networks (CNNs): Specialized deep learning architectures capable of processing spatial-spectral data cubes directly [1] [15]. CNNs automatically learn relevant features from both spatial and spectral dimensions, eliminating the need for manual feature engineering.
Support Vector Machines (SVMs): Supervised learning models that find optimal hyperplanes to separate different classes in high-dimensional feature spaces [1] [76]. SVMs are particularly effective for small to medium-sized datasets and can handle nonlinear classification through kernel functions.
Random Forests (RF): Ensemble methods that construct multiple decision trees during training and output the mode of classes (classification) or mean prediction (regression) of individual trees [76]. RF algorithms provide feature importance estimates and are robust to overfitting.
Autoencoders: Neural networks designed for unsupervised dimensionality reduction and feature learning [75]. They compress input data into a lower-dimensional latent space representation then reconstruct the output from this representation, effectively learning efficient data encodings.
Graph Neural Networks: Deep learning approaches that operate on graph-structured data, particularly valuable for modeling molecular structures and their vibrational relationships [75].
Table 1: Fundamental Characteristics of Classical and AI-Driven Analytical Approaches
| Characteristic | Classical Methods | AI-Driven Methods |
|---|---|---|
| Theoretical Foundation | Statistics, linear algebra | Neural networks, optimization theory |
| Feature Engineering | Manual, expert-driven | Automatic, learned from data |
| Data Requirements | Lower (can work with small datasets) | Higher (requires large datasets) |
| Interpretability | High (transparent models) | Lower ("black box" models) |
| Computational Demand | Moderate | High (especially for training) |
| Handling Nonlinearity | Limited (requires explicit modeling) | Strong (inherently handles complexity) |
Performance Comparison: Quantitative Analysis
Numerous studies have directly compared the performance of classical and AI-driven methods across various applications. The following experimental data illustrates their relative strengths and limitations.
Forensic Science Application: Bloodstain Analysis
In forensic science, determining bloodstain age is critical for crime scene reconstruction. A 2025 study compared Hyperspectral Imaging (HSI) and Near-Infrared (NIR) spectroscopy combined with different algorithms for bloodstain deposition time estimation over 60 days [11].
Table 2: Performance Comparison for Bloodstain Age Estimation (RMSEP in Days)
| Analytical Method | Algorithm | Homogeneous Substrates | Heterogeneous Substrates | Multimodal Data Fusion |
|---|---|---|---|---|
| HSI with Classical PLS | Linear PLS | 15.42 days | 18.73 days | - |
| NIR with Classical PLS | Linear PLS | 14.98 days | 17.95 days | - |
| HSI with Enhanced Classical | PLS-Polynomial | 8.35 days | 9.21 days | - |
| NIR with Enhanced Classical | PLS-Polynomial | 8.15 days | 8.92 days | - |
| Multimodal with AI | MLP (Low-level Fusion) | - | - | 7.84 days |
| Multimodal with AI | MLP (Intermediate Fusion) | - | - | 7.25 days |
Experimental Protocol: Bloodstains were aged on various substrates including cotton, wool, and polyester. Spectral data was collected periodically over 60 days using both HSI (400-1000 nm range) and NIR spectroscopy (750-2500 nm). Data preprocessing included Standard Normal Variate (SNV) transformation to reduce scattering effects. For classical analysis, Partial Least Squares (PLS) regression was employed with polynomial feature expansion to capture nonlinear relationships. For AI-driven analysis, a Multilayer Perceptron (MLP) neural network was implemented with different fusion strategies: low-level fusion (combining raw data from both techniques) and intermediate-level fusion (combining feature-level data) [11].
Biomedical and Food Safety Applications
The integration of Surface-Enhanced Raman Spectroscopy (SERS) with AI algorithms has demonstrated remarkable performance in biomedical analysis and food safety monitoring:
Table 3: Accuracy Comparison for SERS-Based Detection Across Applications
| Application Domain | Target Analyte | Classical Method | AI-Driven Method | Reported Accuracy |
|---|---|---|---|---|
| Disease Diagnosis | COVID-19 (saliva/nasopharyngeal) | PCA-LDA | Random Forest | >95% [76] |
| Pathogen Detection | Bacteria (pure samples) | - | Random Forest | 99% [76] |
| Pathogen Detection | Bacteria (clinical samples) | - | CNN-LSTM-Attention | 96% [76] |
| Food Safety | Food pollutants | Traditional analysis | Artificial Neural Networks | R² >0.98 [76] |
| Environmental Monitoring | Synthetic hair dyes in soils | - | Machine Learning | 97.9% [76] |
Experimental Protocol for SERS-ML Integration: Substrate preparation involved synthesizing plasmonic nanoparticles (typically gold or silver) with controlled size, shape, and surface chemistry to enhance Raman signals. Samples were applied to these substrates and SERS spectra were collected using appropriate laser excitation wavelengths. For AI-driven analysis, datasets were typically divided into training, validation, and test sets. Models were trained using iterative optimization processes, with data augmentation techniques applied to enhance model robustness and generalizability [76].
Methodological Workflows: From Data Acquisition to Interpretation
The analytical process differs significantly between classical and AI-driven approaches, each with distinct workflow requirements.
Classical Analysis Workflow
AI-Driven Analysis Workflow
The Scientist's Toolkit: Essential Research Reagents and Materials
Successful implementation of HSI and spectroscopic analysis requires specific materials and computational resources. The following table details essential components for establishing these analytical capabilities.
Table 4: Essential Research Reagents and Materials for HSI and Spectroscopic Analysis
| Category | Item | Specification/Function | Application Examples |
|---|---|---|---|
| Spectral Standards | White Reference Panels | Provides baseline reflectance calibration | All HSI and spectroscopic measurements [15] |
| Spectral Standards | Wavelength Calibration Standards | Validates spectral accuracy and resolution | Mercury-argon lamps, holmium oxide [15] |
| SERS Substrates | Gold Nanoparticles | Enhances Raman signals via plasmonic effects | Biomedical detection, trace analysis [76] |
| SERS Substrates | Silver Nanostructures | Alternative SERS substrate with different enhancement properties | Chemical detection, environmental monitoring [76] |
| Sample Preparation | Specific Binding Agents | Antibodies, aptamers for target recognition | Pathogen detection, biomarker identification [76] |
| Computational Resources | GPU Accelerators | Parallel processing for deep learning training | CNN, neural network implementation [75] |
| Software Libraries | Chemometrics Packages | PLS, PCA, multivariate analysis | Classical spectral analysis [11] [15] |
| Software Libraries | Deep Learning Frameworks | TensorFlow, PyTorch for model development | AI-driven spectral analysis [75] [76] |
Selection Guidelines: Matching Methods to Research Objectives
The choice between classical and AI-driven methods should be guided by specific research requirements, available resources, and application constraints.
When to Prefer Classical Methods
- Limited Dataset Size: Classical methods generally require fewer samples for robust model development and are less prone to overfitting with small datasets [11].
- Interpretability Requirements: When understanding the relationship between spectral features and target properties is essential, classical methods provide transparent, interpretable models [11] [74].
- Resource Constraints: Classical algorithms have lower computational demands and can be implemented on standard workstations without specialized hardware [74].
- Established Analytical Protocols: For quality control applications where method validation and regulatory compliance are priorities, classical approaches benefit from established documentation and acceptance [74].
When to Prefer AI-Driven Methods
- Complex Spectral Relationships: When analyzing intricate spectral patterns with nonlinear relationships, AI methods consistently outperform classical approaches [75] [76].
- Large-Scale Data Analysis: For processing massive hyperspectral datasets or high-throughput screening applications, AI methods provide scalable solutions [1] [77].
- Real-Time Analysis Requirements: Deployed AI models can provide rapid predictions essential for process monitoring or diagnostic applications [76] [77].
- Multimodal Data Integration: When combining spectral data with other data types (e.g., imaging, molecular structures), AI approaches offer flexible fusion capabilities [75] [11].
Hybrid Approaches
Increasingly, researchers are adopting hybrid methodologies that leverage the strengths of both paradigms:
- Physics-Informed Neural Networks: Incorporating physical laws and constraints into AI models to improve generalizability and physical consistency [75].
- AI-Enhanced Spectral Unmixing: Using neural networks to improve endmember selection and abundance estimation in mixed spectra analysis [15].
- Transfer Learning: Applying pre-trained AI models to new but related analytical problems, reducing data requirements while maintaining performance [75].
The selection between classical and AI-driven analysis methods for hyperspectral imaging and spectroscopy represents a critical decision point in modern research methodology. Classical approaches provide interpretability, statistical rigor, and efficiency with smaller datasets, making them ideal for established analytical protocols and resource-constrained environments. AI-driven methods offer superior performance for complex pattern recognition, large-scale data analysis, and real-time applications, albeit with greater computational demands and data requirements.
The evolving landscape suggests a future where hybrid approaches that leverage the strengths of both paradigms will become increasingly prevalent. As AI methodologies continue to mature with advances in explainable AI, transfer learning, and physics-informed neural networks, the integration of these powerful tools into mainstream analytical workflows appears inevitable. Researchers are advised to consider their specific application requirements, data characteristics, and interpretability needs when selecting between these complementary analytical approaches.
Hyperspectral imaging (HSI) is an advanced optical sensing technique that captures spatially resolved spectral information, creating a detailed "hypercube" where each pixel contains a continuous spectrum. This allows for non-invasive, label-free analysis of material, chemical, and biological properties across diverse fields from precision agriculture to medical diagnostics and pharmaceutical research [15] [1]. This guide objectively compares HSI against traditional spectroscopy, focusing on performance driven by sensor miniaturization, artificial intelligence (AI), and computational imaging.
System Comparison: Hyperspectral Imaging vs. Spectroscopy
The core distinction lies in HSI's ability to add a spatial dimension to the rich spectral data provided by traditional spectroscopy. This enables material identification and mapping across a surface, rather than at a single point.
Table 1: Fundamental Comparison: Hyperspectral Imaging vs. Spectroscopy
| Feature | Hyperspectral Imaging (HSI) | Traditional Spectroscopy |
|---|---|---|
| Data Acquired | Spatially-resolved spectra (x, y, λ); a "data cube" [15] | Single spectrum or a series of spectra from a specific point or area |
| Spatial Context | High; enables visualization of chemical distribution and heterogeneity [1] | None to low; no inherent spatial information |
| Analysis Scope | Macroscopic; ideal for analyzing surfaces, tissues, or entire scenes | Microscopic (specific point) or bulk analysis |
| Throughput for Heterogeneous Samples | High; can analyze large areas and multiple features simultaneously | Lower; requires multiple measurements for heterogeneous samples |
| Primary Strength | Identification, localization, and quantification of multiple components across a sample [78] | Precise quantification and identification of chemical bonds and components at a specific spot |
| Example Application | Mapping disease margins in tissue [78], detecting pest infestation in a crop field [1] | Verifying the chemical structure of a synthesized drug compound, measuring solution concentration |
Quantitative Performance Data in Research Applications
Recent experimental studies directly compare HSI and spectroscopic techniques or demonstrate the performance of next-generation HSI systems enhanced by AI.
Table 2: Quantitative Performance Data from Recent Studies
| Application / Study | Method & Model | Key Performance Metrics | Comparative Insight |
|---|---|---|---|
| Bloodstain Age Estimation [11] | - HSI with PLS Polynomial Regression- NIR Spectroscopy with PLS Polynomial Regression- Multimodal Fusion with MLP | - RMSEP (Homologous Data): HSI: 8.35 days; NIR: 8.15 days [11]- RMSEP (Multimodal Fusion): Further improvement over single modes [11] | NIR spectroscopy showed comparable, and sometimes slightly superior, prediction accuracy to HSI for this specific temporal analysis. Data fusion of both modalities yielded the best performance, mitigating external influences. |
| Cherry Tomato Quality Prediction [79] | - HSI with Deep Learning (ResNet, Transformer) | - Coefficient of Determination (R²): Up to 0.96 for physicochemical properties (e.g., soluble solids, acidity) [79] | Optimized deep learning models applied to HSI data achieved exceptional non-destructive prediction accuracy, outperforming traditional machine learning models. |
| Next-Gen HSI Camera [29] [80] | - Single-camera (Sony IMX990) vs. State-of-the-art dual-camera | - Spectral Range: 490–1780 nm [29]- Spectral Resolution: 1.43 nm/channel [29]- MTF Contrast: 1.97 lines mm⁻¹ [29] | The new miniaturized single-chip solution demonstrated enhanced spectral detail, reduced noise, and simplified hardware compared to a more complex dual-camera setup, promising for industrial applications. |
| Counterfeit Detection [78] | - HSI with AI-based analysis | - Fake Currency Detection: High accuracy in 400–500 nm range [78]- Counterfeit Alcohol Detection: F1-score of 99.03% [78] | HSI provides a rapid, non-destructive method for verifying authenticity with extremely high accuracy by detecting subtle spectral differences. |
Experimental Protocols and Workflows
To ensure reproducible and reliable results, researchers follow structured experimental workflows. The following diagram illustrates a generalized protocol for a comparative HSI study.
Detailed Experimental Methodology
The following protocols are synthesized from the cited research to provide a concrete framework for comparison.
Protocol A: Non-Destructive Fruit Quality Assessment [79] This protocol demonstrates HSI's use for predicting internal physicochemical properties.
- Sample Preparation: A large set of cherry tomato samples (e.g., 310) is collected, representing natural variation.
- Data Acquisition: Hyperspectral images are captured in two spectral ranges: Visible/Near-Infrared (VIS/NIR: 406–1010 nm) and Near-Infrared (NIR: 957–1677 nm). A calibration standard (e.g., white reference) is used for radiometric correction.
- Reference Measurement: Standard destructive lab tests are performed to measure ground truth values for soluble solids content, acidity, sugar content, and firmness.
- Spectral Preprocessing: Four preprocessing methods are applied to the extracted spectral data to enhance features and reduce scatter: Multiplicative Scatter Correction (MSC), Standard Normal Variate (SNV), and 1st and 2nd derivatives.
- Model Training & Optimization: Both traditional machine learning (PLSR, SVR) and deep learning models (VGG, ResNet, Transformer) are developed. A key step is using Bayesian optimization to automatically tune the DL architecture and select the optimal preprocessing method.
- Validation & Interpretation: Model performance is validated on a held-out test set using R² and RMSE. Grad-CAM is used to identify which wavelengths the DL models "pay attention to," linking predictions to chemically informative spectral regions.
Protocol B: Forensic Bloodstain Deposition Time Estimation [11] This protocol directly compares HSI and NIR spectroscopy for a temporal analysis task.
- Sample Preparation: Bloodstains are aged on various forensically relevant substrates (e.g., fabric, wood) over a 60-day period.
- Data Acquisition: The same sample set is analyzed periodically using both a hyperspectral imager and a point-based NIR spectrometer.
- Spectral Preprocessing: The spectral data from both devices is preprocessed using Standard Normal Variate (SNV) to remove scattering effects.
- Non-Linear Regression Modeling: Partial Least Squares (PLS) regression is initially used but yields suboptimal results. The model is improved by introducing polynomial features to capture nonlinear relationships in the aging data.
- Multimodal Data Fusion: A Multilayer Perceptron (MLP) is employed to fuse the HSI and NIR spectral data, creating a more robust model that leverages the strengths of both modalities.
- Performance Evaluation: Models are evaluated based on the Root Mean Square Error of Prediction (RMSEP) in days, comparing the performance of HSI-only, NIR-only, and fused-data approaches.
The Scientist's Toolkit: Essential Research Reagents and Materials
Successful implementation of HSI and spectroscopy relies on a suite of hardware, software, and analytical components.
Table 3: Key Research Reagent Solutions for HSI and Spectroscopy
| Item | Function & Role in Research |
|---|---|
| Hyperspectral Imager (e.g., Specim, Headwall, Resonon) | Core sensor for capturing spatial-spectral data cubes. Selection depends on spectral range (VNIR, SWIR) and form factor (lab, airborne) [81]. |
| Spectrometer (NIR, FTIR) | Provides high-resolution reference spectra for validation or point analysis. Often used in tandem with HSI for cross-verification [11]. |
| Calibration Standards (White Reference, Wavelength Standard) | Critical for converting raw data to reflectance/absorbance and ensuring spectral accuracy across all measurements. |
| Controlled Illumination (Halogen Lights) | Provides consistent, broad-spectrum lighting to ensure high-quality, reproducible spectral data [51]. |
| Data Processing Software (Python, R, ENVI, Proprietary SDKs) | Platform for implementing preprocessing, machine learning, and deep learning algorithms for spectral analysis [79] [15]. |
| Spectral Libraries (Public, Commercial, Custom) | Databases of known material spectra used as references for identification, classification, and model training. |
Visualization of Key Technological Relationships
The integration of core technologies is driving advancement in hyperspectral analysis. The following diagram maps the logical relationships between these key areas.
The comparative analysis reveals that the choice between hyperspectral imaging and spectroscopy is not a matter of superiority but of strategic application. Spectroscopy remains the gold standard for precise, quantitative chemical analysis of specific points or homogeneous samples. In contrast, hyperspectral imaging is unparalleled in tasks requiring spatial context, such as mapping heterogeneity, locating specific features in a complex sample, or performing non-destructive quality control on entire products.
The convergence of sensor miniaturization (e.g., single-chip cameras like the IMX990), AI integration (with models like Transformers and ResNet achieving exceptional accuracy), and computational imaging (which can extract hyperspectral-level detail from conventional cameras) is fundamentally transforming the field [29] [79] [6]. These emerging solutions are making HSI more accessible, powerful, and integrable into diverse workflows, from the laboratory to the field and the production line, offering researchers and drug development professionals unprecedented tools for optical analysis.
Direct Comparison and Validation Frameworks for Informed Method Selection
In optical analysis research, particularly in the rapidly advancing field of hyperspectral imaging, spectral and spatial resolution represent two fundamental dimensions of data acquisition that often involve critical trade-offs. Spectral resolution refers to a sensor's ability to resolve fine wavelength intervals across the electromagnetic spectrum, effectively measuring how many distinct "colors" can be distinguished. Spatial resolution, in contrast, defines the level of detail in an image based on pixel size, determining how small an object can be and still be detected as a separate entity [82] [83].
The interplay between these two resolution types forms a core consideration in experimental design across diverse fields, from geological mapping to pharmaceutical analysis. This guide provides a technical comparison of these critical parameters, supported by experimental data and structured methodologies, to inform researchers and development professionals in selecting optimal configurations for their specific applications within hyperspectral imaging and spectroscopy.
Defining the Fundamentals: Resolution Types
What is Spatial Resolution?
Spatial resolution quantifies the ground area represented by a single pixel in an image. Higher spatial resolution means smaller pixels and more detailed imagery, allowing researchers to distinguish smaller objects and finer structural patterns. For example, drone-captured imagery often features very high spatial resolution (centimeter-scale pixels), while satellite data like Landsat-8 typically has moderate spatial resolution (15-100 meter pixels) [83]. The quality of an image is directly influenced by its spatial resolution; smaller grid cells capture more detail with more pixels per unit area [83].
What is Spectral Resolution?
Spectral resolution describes the ability to resolve spectral features by defining the number and width of wavelength bands that a sensor can detect. High spectral resolution involves many narrow, contiguous bands, enabling precise identification of materials based on their subtle spectral signatures. Hyperspectral imaging, which can divide reflected light into hundreds of narrow spectral bands (often with bandwidths of 10 nm or less), represents the high end of spectral resolution, while multispectral systems with 4-36 broader bands offer lower spectral resolution [83] [84]. This parameter is crucial for characterizing samples and distinguishing between visually similar materials with different molecular compositions [82].
Table 1: Core Characteristics of Spatial and Spectral Resolution
| Attribute | Spatial Resolution | Spectral Resolution |
|---|---|---|
| Definition | Ground area represented by a single pixel | Ability to resolve fine wavelength intervals |
| Measurement Units | Meters/pixel, Centimeters/pixel | Nanometers (bandwidth), Number of bands |
| High Resolution Example | WorldView-3 satellite (0.3m pixels) | Hyperspectral imaging (hundreds of narrow bands) |
| Low Resolution Example | MODIS satellite (250-1000m pixels) | Multispectral imaging (4-36 broader bands) |
| Primary Function | Resolving structural details and object identification | Material characterization and chemical analysis |
| Key Trade-off | Coverage area vs. detail level | Measurement time vs. information content |
Technical Comparison: Performance in Research Applications
Performance in Environmental and Geological Mapping
A 2025 study on mapping unburned vegetation within fire scars provides compelling experimental data on the relative importance of these resolution types. Researchers conducted 420 classifications using various combinations of spectral and spatial characteristics from LANDSAT, ASTER, and IKONOS satellites, finding that spectral resolution played a more significant role across the full range of separability values. However, in scenarios with high separability values, spatial resolution became the dominant factor influencing mapping accuracy [85].
The same study revealed that each resolution type differentially impacts error types: spectral resolution primarily affects commission errors (false positives) of the unburned class, while spatial resolution more significantly influences omission errors (false negatives) [85]. This distinction is critical for researchers designing experiments where different error types carry different consequences.
In geological mapping, a 2024 comparative analysis of PRISMA, EnMAP, and EMIT hyperspectral satellite data revealed notable differences in consistency between the VNIR and SWIR spectral ranges. The VNIR range showed greater similarity between sensors, while the SWIR range—crucial for identifying minerals like carbonates and clays—displayed more variability, highlighting the need for accurate radiometric corrections, especially in geologically informative SWIR regions [86].
Instrumentation and Technological Advances
The 2025 review of spectroscopic instrumentation reveals a growing divergence between laboratory and field-portable/handheld instruments across various spectroscopic techniques [87]. For Near-Infrared (NIR) spectroscopy, all new products introduced were miniature or handheld devices designed for field use, while Mid-IR instrumentation showed specialization toward microscopy and specific industrial applications like biopharmaceutical analysis [87].
Notable recent developments include:
- Bruker Vertex NEO platform: Incorporating vacuum ATR accessory technology that maintains samples at normal pressure while the optical path remains under vacuum, effectively removing atmospheric interference [87]
- QCL-based microscopy systems: Such as the LUMOS II ILIM and Protein Mentor, specifically designed for protein analysis in biopharmaceutical applications with spectral ranges targeting protein absorptions (1800-1000 cm⁻¹) [87]
- Hyperspectral satellite advancements: PRISMA, EnMAP, and EMIT sensors providing global hyperspectral coverage for regional-scale mineralogical and environmental mapping [86]
Table 2: Resolution Specifications of Representative Satellite Sensors
| Satellite/Sensor | Spatial Resolution | Spectral Resolution | Primary Applications |
|---|---|---|---|
| WorldView-3 | 0.3 m (panchromatic) | 8 multispectral bands (400-1040 nm) | High-detail land use, urban planning |
| Landsat 8 | 30 m (15 m panchromatic) | 11 bands from Coastal Aerosol to Thermal IR | Land cover monitoring, vegetation trends |
| MODIS | 250-1000 m | 36 spectral bands | Climate studies, large-scale vegetation |
| PRISMA | 30 m | ~240 contiguous bands (400-2500 nm) | Mineral mapping, environmental monitoring |
| EnMAP | 30 m | ~220 contiguous bands (420-2450 nm) | Ecosystem processes, resource exploration |
| EMIT | 60 m | 285 contiguous bands (380-2500 nm) | Mineral dust source composition |
Experimental Protocols and Methodologies
Protocol: Assessing Resolution Impact on Classification Accuracy
The experimental design for evaluating spectral versus spatial resolution in environmental mapping [85] provides a robust methodological framework applicable across domains:
- Data Acquisition: Acquire satellite images at various spectral configurations (VNIR, SWIR) and spatial resolutions (original and spatially degraded datasets)
- Spatial Degradation: Systematically degrade high-resolution datasets to create comparable resolution series (up to 512m in the referenced study)
- Classification Processing: Apply supervised maximum likelihood classifier to multiple resolution combinations
- Accuracy Assessment: Execute numerous classifications (420 in the referenced study) across spectral-spatial combinations
- Statistical Analysis: Employ linear regression models to capture relationships between classification accuracy and image characteristics
- Error Analysis: Differentiate between commission and omission errors for target classes
Protocol: Inter-Sensor Consistency Assessment for Geological Mapping
For researchers comparing hyperspectral data from different sources, the methodology from the 2024 geological mapping study offers a structured approach [86]:
- Site Selection: Choose geologically significant sites with good exposure and arid climates to minimize vegetation and moisture effects
- Multi-Sensor Data Collection: Obtain contemporaneous or near-contemporaneous data from multiple hyperspectral sensors (PRISMA, EnMAP, EMIT, airborne HyMap)
- Qualitative Spectral Assessment: Evaluate the ability of each sensor to resolve diagnostic mineral absorption features
- Spectral Index Calculation: Apply established spectral indices sensitive to expected minerals
- Spectral Unmixing: Perform linear unmixing to estimate mineral abundances
- Correlative Analysis: Conduct quantitative correlation between reflectance values, band ratios, and abundance maps across sensors
The Hyperspectral Advantage: Integration of Spectral and Spatial Data
Hyperspectral imaging represents the pinnacle of combined spatial and spectral resolution, capturing both detailed spatial information and continuous spectral signatures across hundreds of narrow bands. This integration enables advanced applications like high-throughput optical spectroscopy of picoliter droplets [88] and regional-scale mineralogical mapping from spaceborne platforms [86].
The workflow below illustrates how spatial and spectral information integrate in a typical hyperspectral data analysis pipeline for material identification and characterization:
The Scientist's Toolkit: Essential Research Solutions
Table 3: Key Instrumentation and Research Solutions for Hyperspectral Analysis
| Solution/Technology | Function | Application Context |
|---|---|---|
| Imaging Spectrometers | Collect reflected light energy in multiple spectral bands | Fundamental data acquisition for hyperspectral imaging |
| FT-IR Spectrometers | Provide molecular fingerprinting through infrared absorption | Laboratory-based material identification, protein characterization |
| QCL Microscopy Systems | Enable high-resolution chemical imaging of micron-scale areas | Pharmaceutical impurity analysis, protein aggregation studies |
| Field-Portable NIR Spectrometers | Bring laboratory-quality analysis to field settings | Agricultural quality control, geochemical surveying |
| Spectral Unmixing Algorithms | Resolve mixed pixel compositions into constituent materials | Mineral mapping, land cover classification, cellular analysis |
| Radiometric Correction Tools | Remove atmospheric and topographic effects from spectral data | Pre-processing of satellite and airborne imagery |
| Spectral Library Databases | Provide reference spectra for material identification | Automated mineralogy, pharmaceutical compound verification |
The comparative analysis of spatial versus spectral resolution reveals a nuanced relationship where dominance depends on specific application requirements and experimental conditions. While spectral resolution generally plays a more significant role in material identification across diverse scenarios, spatial resolution becomes critically important for accurately mapping discrete objects and boundaries, particularly in high-separability contexts [85].
For researchers designing optical analysis studies, the decision framework should consider:
- Primary research question: Material identification prioritizes spectral resolution; structural analysis emphasizes spatial resolution
- Error tolerance: Spectral resolution controls false positives; spatial resolution influences false negatives
- Scale of phenomena: Macroscopic processes may tolerate lower spatial resolution; microscopic features require higher spatial resolution
- Technical constraints: Field applications favor portable NIR instruments; laboratory settings enable advanced FT-IR and QCL microscopy
The ongoing advancement of hyperspectral technologies continues to push the boundaries of both resolution types, with emerging satellite platforms providing unprecedented global hyperspectral coverage and laboratory instruments delivering increasingly detailed molecular and structural insights across scientific disciplines.
Hyperspectral imaging (HSI) and conventional spectroscopy are two powerful analytical techniques in the field of optical sensing. While both methods leverage spectral information to characterize materials, they differ fundamentally in their approach and capabilities. HSI combines digital imaging with spectroscopy to capture spatial and spectral information simultaneously, forming a three-dimensional hypercube with two spatial dimensions and one spectral dimension [15]. Conventional spectroscopy, including near-infrared (NIR) spectroscopy, typically provides spectral information from a single point or averaged over a sample area without spatial resolution [89]. This comparison guide objectively evaluates the performance metrics of these technologies, focusing on accuracy, sensitivity, specificity, and limitations within optical analysis research, to inform researchers, scientists, and drug development professionals in their methodological selections.
The core distinction between HSI and conventional spectroscopy lies in their data acquisition approaches. HSI captures spatially resolved spectral data, often exceeding hundreds of narrow, contiguous spectral bands (typically at 5-10 nm resolution) from the visible to short-wave infrared regions (380-2500 nm) [15]. Each pixel in a hyperspectral image contains a full spectral signature, enabling the creation of chemical maps that display the distribution of components across a sample [1]. Conventional NIR spectroscopy, in contrast, obtains a single spectrum representing the average composition of the measured spot or area, lacking inherent spatial context [89].
This fundamental difference dictates their respective application domains. HSI excels in applications requiring spatial heterogeneity assessment, such as identifying tissue abnormalities in medical diagnostics, detecting non-uniform contamination in food products, or mapping mineral distributions in geological samples. Conventional spectroscopy is well-suited for homogeneous sample analysis or when average composition data is sufficient, offering advantages in speed, cost, and simplicity for high-throughput quantitative analysis.
Table 1: Fundamental Comparison Between Hyperspectral Imaging and Spectroscopy
| Feature | Hyperspectral Imaging (HSI) | Conventional Spectroscopy |
|---|---|---|
| Data Dimensionality | 3D Hypercube (x, y, λ) | 1D Spectrum (λ) or single-point measurement |
| Spatial Information | Detailed spatial distribution of chemical components | No inherent spatial resolution; bulk analysis |
| Spectral Range | Typically 400-1000 nm (VNIR) or 900-1700 nm (SWIR) [90] | Similar spectral range (e.g., NIR: 750-2500 nm) [89] |
| Primary Output | Chemical composition maps & spectral signatures | Average spectral signature of the sampled area |
| Typical Analysis Scale | Macroscopic to microscopic (e.g., organ, tissue, single cell) [64] | Bulk material or specific measurement point |
Comparative Performance Metrics
Accuracy and Precision
Accuracy refers to how close a measurement is to the true value, while precision indicates the reproducibility of measurements. Both HSI and conventional spectroscopy can achieve high accuracy when properly calibrated and validated against reference methods.
In quantitative analysis of fruit quality, HSI combined with deep learning models has demonstrated remarkable accuracy. For predicting soluble solids content (SSC) and vitamin C (VC) in apples across multiple varieties, a CNN-BiGRU-Attention model achieved coefficients of determination (R²) of 0.891 for VC and 0.807 for SSC on test sets [90]. Cross-year validation further confirmed model robustness with R² values of 0.829 for VC and 0.779 for SSC [90]. In medical applications, HSI achieved a classification accuracy of 92.11% for distinguishing well-differentiated hepatocellular carcinoma (HCC) from cirrhosis, and 84.67% when classifying four liver tissue types (well-differentiated HCC, poorly differentiated HCC, cirrhosis, and normal tissue) [91].
Conventional spectroscopy also shows strong performance in quantitative tasks. In forensic science, NIR spectroscopy applied to bloodstain age estimation achieved performance comparable to HSI, with root mean square errors of prediction (RMSEP) of 8.15 days for NIR versus 8.35 days for HSI when using polynomial feature-enhanced partial least squares (PLS) regression [11].
Sensitivity and Specificity
Sensitivity (the ability to correctly identify positive cases) and specificity (the ability to correctly identify negative cases) are critical metrics for classification and diagnostic tasks. HSI often exhibits advantages in these areas due to its spatial resolution capabilities.
In biomedical applications, HSI systems have demonstrated exceptional sensitivity and specificity. For liver tumor classification, models achieved sensitivity and specificity values indicating strong diagnostic performance, though exact values were not specified in the source [91]. For organ tissue classification using a standard deviation-based band selection approach combined with a convolutional neural network (CNN), HSI reached 97.21% accuracy, approaching the 99.30% accuracy achieved with full-spectrum data [64]. This demonstrates high sensitivity in detecting subtle spectral differences between tissues with strong visual similarity.
Conventional spectroscopy methods can also achieve high sensitivity and specificity in optimized applications. For instance, in forensic blood identification, spectroscopy combined with machine learning algorithms successfully distinguished human from animal bloodstains with "remarkable accuracy" [1]. The extreme learning machine (ELM) algorithm applied to spectral data demonstrated "superior performance" in this discrimination task [1].
Table 2: Performance Metrics in Practical Applications
| Application | Technology | Accuracy | Sensitivity/Specificity | Reference |
|---|---|---|---|---|
| Liver Tumor Classification | HSI (400-1000 nm) with 3D Ra-Net | 92.11% (2-class); 84.67% (4-class) | "Strong diagnostic performance" reported [91] | [91] |
| Organ Tissue Classification | HSI with STD band selection + CNN | 97.21% (vs. 99.30% full-spectrum) | Not specified | [64] |
| Apple Quality Prediction | HSI (400-1000 nm) with CNN-BiGRU-A | R²: 0.891 (VC), 0.807 (SSC) | Not applicable (regression) | [90] |
| Bloodstain Age Estimation | NIR Spectroscopy with PLS | RMSEP: 8.15 days | Not applicable (regression) | [11] |
| Bloodstain Species Identification | Spectroscopy with ELM | "Remarkable accuracy" | High discrimination capability | [1] |
Experimental Protocols and Methodologies
Hyperspectral Imaging Protocols
A typical HSI workflow involves several standardized steps. In a study on apple quality assessment [90], the protocol began with data acquisition using a hyperspectral imaging system covering 400-1000 nm with 512 spectral bands. White reference correction was performed using a standard reflectance tile, and dark current correction using a capped lens. Regions of interest (ROIs) were extracted through image processing steps including image enhancement, binary segmentation, connected component analysis, contour extraction, B-spline fitting, and smoothing to ensure accurate retrieval of spectral reflectance.
For medical tissue classification [91], the protocol involved constructing a hyperspectral liver pathology dataset using an HSI microscope system. The system included a broadband light source (360-2600 nm) and a 100× objective lens with a numerical aperture of 0.85 for high spatial detail. Samples were scanned with a motorized stage moving at 0.5 μm per line. Band selection techniques like the Norris derivative and Successive Projections Algorithm (SPA) were applied to reduce data dimensionality while preserving diagnostically relevant spectral features.
Spectroscopy Protocols
In conventional spectroscopy studies, such as bloodstain analysis [11], the typical protocol involves placing the sample in a spectroscopy instrument equipped with a NIR light source and detector. Spectra are collected at specific time intervals for temporal studies. The raw spectral data undergoes preprocessing, including Standard Normal Variate (SNV) transformation to remove scattering effects, followed by derivative processing to enhance spectral features.
Data analysis typically employs chemometric methods such as Partial Least Squares (PLS) regression for quantitative analysis or discriminant analysis for classification. For nonlinear relationships, methods like PLS with polynomial features or multilayer perceptrons (MLP) may be implemented. Validation is performed through cross-validation and external validation sets to ensure model robustness.
Limitations and Challenges
Both techniques face distinct limitations that researchers must consider when selecting an analytical approach.
Hyperspectral Imaging Limitations
HSI systems generate extremely large datasets, creating significant challenges in data storage, processing, and computational requirements [15]. A single hypercube can contain hundreds of megabytes, making real-time analysis difficult without sophisticated dimensionality reduction techniques [64]. The high hardware costs of scientific-grade HSI systems also present barriers to widespread adoption.
In agricultural applications, HSI models can suffer from generalization decay when applied across different plant varieties, geographical origins, or growing seasons due to environmental heterogeneity [90]. In medical applications, deep learning approaches for HSI often require extensive labeled datasets, substantial computational resources, and yield features that lack direct spectral interpretability, complicating their integration into diagnostic pipelines that require transparency [64].
Spectroscopy Limitations
Conventional spectroscopy's primary limitation is the lack of spatial information, making it unsuitable for analyzing heterogeneous samples or locating specific features within a sample [89]. This bulk analysis approach can miss important localized variations in composition or structure.
Spectroscopy methods typically require precise calibration for each sample type and can be sensitive to environmental conditions such as temperature, humidity, and sample presentation (e.g., particle size, packing density) [89]. The technique also has limited penetration depth, particularly in the NIR region, potentially providing incomplete information for thick or opaque samples.
The Scientist's Toolkit
Essential Research Reagent Solutions
Table 3: Essential Materials and Their Functions in HSI and Spectroscopy
| Item | Function | Application Examples |
|---|---|---|
| Standard Reflectance Tile | White reference for radiometric calibration; corrects for illumination inhomogeneity | All HSI and reflectance spectroscopy applications [90] |
| Hyperspectral Imaging Systems (e.g., 400-1000 nm, 900-1700 nm) | Captures spatial and spectral data simultaneously; forms 3D hypercube | Medical diagnosis, food quality assessment, agricultural monitoring [91] [90] |
| Conventional NIR Spectrometers | Provides spectral data without spatial resolution; faster and often more cost-effective | Bulk material analysis, quantitative chemical analysis [89] |
| Chemometric Software (e.g., PLS, SVM, PCA) | Analyzes spectral data; builds predictive models; reduces dimensionality | Multivariate calibration, classification, spectral unmixing [11] [92] |
| Deep Learning Frameworks (e.g., CNN, 3D Ra-Net) | Processes high-dimensional HSI data; extracts spatial-spectral features | Image classification, object detection in complex scenes [91] [90] |
| Linear Variable Band-Pass Filter (LVBPF) | Enables miniaturization of HSI systems; filter wavelength changes linearly with position | CubeSat-based Earth observation, portable HSI systems [93] |
Hyperspectral imaging and conventional spectroscopy offer complementary strengths for optical analysis in research applications. HSI provides superior spatial-chemical characterization capabilities, making it ideal for heterogeneous sample analysis and feature localization, with demonstrated accuracy exceeding 90% in multiple medical and agricultural applications. Conventional spectroscopy offers a more practical solution for homogeneous sample analysis or when average composition data suffices, with advantages in speed, cost, and simplicity.
The choice between these technologies ultimately depends on the specific research requirements, particularly the need for spatial information, sample heterogeneity, available resources, and analytical performance requirements. Future advancements in sensor miniaturization, data processing algorithms, and computational power will likely expand the applications and capabilities of both techniques, further establishing their value in scientific research and industrial applications.
In optical analysis research, a central challenge involves selecting the optimal technique for non-invasive material characterization. Hyperspectral imaging (HSI) and fiber-optic reflectance spectroscopy (FORS) represent two powerful analytical methods with distinct operational principles and application strengths. HSI combines conventional imaging and spectroscopy to acquire spatially-resolved spectral information, generating a full spectrum for each pixel in a captured scene [15]. In contrast, FORS provides single-point reflectance measurements using a fiber-optic probe, offering high spectral resolution but no inherent spatial information [65]. This guide objectively compares the performance of these complementary techniques through experimental data and detailed methodology, providing researchers with a framework for selecting appropriate analytical approaches based on specific research requirements.
Experimental Protocols and Methodologies
Instrumentation and Measurement Geometry
FORS Setup and Configuration: The FORS system used in comparative studies typically consists of a spectrometer with a fiber-optic connector between the measurement probe and spectrometer entrance port, often with a diffuser mounted over the probe. In a documented case study, an Ocean Optics USB2000+ spectrometer was utilized with a 45°/0° measurement geometry, where the illumination is at 45° and detection at 0° (normal to the sample surface), complying with standard recommendations for reflectance measurements [65]. This configuration minimizes specular reflection and provides consistent, comparable data.
HSI Setup and Configuration: Hyperspectral imaging systems employ different operational principles, with pushbroom scanning being a common approach. In this configuration, the camera acquires image data line by line as a translation stage moves, while both the camera and light source remain fixed [65]. A HySpex VNIR-1800 pushbroom system (400-1000 nm spectral range) has been used in comparative studies, requiring specific radiometric calibration procedures where only a small portion of a Spectralon reference is included in the image to calculate the reference spectrum [65]. The spatial and spectral resolution specifications vary significantly between HSI systems, influencing their application suitability.
Sample Preparation and Backing Materials
Sample preparation differs substantially between the techniques due to their fundamental measurement approaches. FORS analyzes single points requiring minimal sample preparation, while HSI requires careful consideration of the entire imaging area.
For transparent or translucent materials like stained glass, the backing material significantly influences reflectance measurements. Studies recommend using non-spectrally selective backing substrates (perfect white diffusers) free of optical brighteners to avoid unwanted spectral artifacts, particularly in the UV region [65]. Researchers have compared various paper substrates, including IGT Reference paper C2846, to identify materials compliant with ISO 13655:2017 standards [65]. This consideration is particularly crucial for HSI measurements of transparent cultural heritage materials.
Table 1: Experimental Configurations for HSI and FORS
| Parameter | Hyperspectral Imaging (HSI) | Fiber-Optic Reflectance Spectroscopy (FORS) |
|---|---|---|
| Spatial Information | Full spatial mapping (hyperspectral cube) | Single-point measurement |
| Spectral Range | 380-2500 nm (typical) [15] | 250-2500 nm (system dependent) |
| Measurement Geometry | Various (pushbroom, snapshot, etc.) | Typically 45°/0° or diffuse |
| Measurement Time | Minutes for large areas | Seconds per measurement point |
| Backing Requirements | Critical for transparent samples | Less critical (point measurement) |
| Data Structure | 3D hypercube (x,y,λ) | 1D spectrum (intensity vs. wavelength) |
Radiometric Calibration Procedures
Both techniques require rigorous radiometric calibration to ensure accurate, comparable results, though the implementation differs:
HSI Calibration: For pushbroom HSI systems, radiometric calibration from radiance to reflectance is performed by dividing the radiance spectra of the sample by the radiance spectra of a diffusing panel reference. The calibration must account for the line-scanning nature of the acquisition, where the signal averaged from a few lines is considered representative of the light distribution across the field of view [65]. This process is typically performed using specialized software, with open-source solutions like Fiji sometimes employed [65].
FORS Calibration: FORS systems perform radiometric calibration by taking reference measurements without the sample, collecting all light coming from the source diffused by a cosine corrector. The sample spectra are then calculated by dividing each measurement by this reference [65]. The different calibration approaches between HSI and FORS can introduce variations in measured reflectance and transmittance spectra, which must be considered when comparing results.
Performance Comparison and Validation Data
Quantitative Agreement Between Techniques
Direct comparison studies reveal a strong correlation between HSI and FORS measurements. In a case study analyzing colored glass samples, the agreement between techniques was quantified using CIELAB color values and the color difference metric ΔE00. Results demonstrated that HSI agreed with FORS up to 93% of the time in reflectance mode when using appropriate spectral analysis algorithms [65]. This high degree of concordance validates HSI as a reliable technique for spectral characterization, while providing the additional advantage of spatial distribution mapping.
Cultural Heritage Application: A comparative study on Armenian manuscripts (11th-18th centuries CE) demonstrated that HSI (380-1000 nm range) agreed with Raman spectroscopy (a benchmark technique) at best 93% of the time for pigment identification [94]. Performance was enhanced using the Spectral Feature Fitting (SFF) algorithm and reference databases with strong similarity to the artifacts under analysis [94].
Table 2: Performance Metrics for HSI and FORS
| Performance Metric | HSI Performance | FORS Performance | Application Context |
|---|---|---|---|
| Spectral Agreement | 93% with FORS [65] | Reference method | Colored glass analysis |
| Pigment Identification Accuracy | 93% with Raman spectroscopy [94] | Not reported | Armenian manuscripts |
| Spatial Coverage | Large areas in single acquisition | Single point measurement | All applications |
| Measurement Speed | ~15 min for A4 area [94] | Seconds per point | Manuscript analysis |
| Classification Accuracy | Up to 97.9% [95] | System dependent | Pearl identification |
Material Classification Performance
HSI demonstrates exceptional capability for material classification across diverse applications. In pearl identification, HSI-NIR spectroscopy combined with linear discriminant analysis achieved 97.9% overall accuracy for discriminating between imitation pearls and three types of cultured pearls (B-SW, B-FW, and NB-FW) [95]. The F1 scores for identifying the specific pearl types were 95.6%, 96%, 100%, and 100% respectively, demonstrating robust classification performance [95].
For electrolyzer material recycling, HSI with transformer-based deep learning models enabled precise identification of critical raw materials, enhancing resource efficiency and circularity in waste streams [12]. The integration of high spatial resolution RGB imaging with high spectral resolution HSI created a multimodal approach that significantly boosted detection performance beyond what either modality could achieve alone [12].
Application-Specific Workflows
Workflow for Cultural Heritage Analysis
The analytical workflow for cultural heritage materials exemplifies the complementary nature of HSI and FORS:
Diagram 1: Heritage Analysis Workflow
This integrated approach leverages the strengths of both techniques: HSI rapidly surveys large areas to identify regions of interest, while FORS provides detailed validation at specific points. Research on Armenian manuscripts demonstrated that this combined methodology significantly improved pigment identification efficiency compared to either technique alone [94].
Workflow for Industrial Material Sorting
Industrial applications, such as recycling critical raw materials from electrolyzers, employ a different workflow optimized for high-throughput classification:
Diagram 2: Industrial Sorting Workflow
This workflow enables non-invasive analysis of shredded electrolyzer samples, facilitating quantitative material classification through integrated RGB and HSI data processed with state-of-the-art deep learning architectures [12]. The approach demonstrates how HSI can be deployed in operational industrial settings for material recovery.
The Scientist's Toolkit: Essential Research Reagents and Materials
Table 3: Essential Research Materials for HSI and FORS Analysis
| Item | Function/Purpose | Application Examples |
|---|---|---|
| Spectralon References | Provides non-absorbing, spectrally flat reference for radiometric calibration | Reflectance standardization in HSI and FORS [65] |
| IGT Reference Paper | Non-spectrally selective backing material for transparent samples | Reflectance measurements of stained glass [65] |
| Calibration Targets | Wavelength and intensity calibration verification | EO targets with Erbium Oxide absorption features [96] |
| Fiber-Optic Probes | Light delivery and collection for FORS | Point measurements on precious artifacts [65] |
| Translation Stages | Precise sample movement for pushbroom HSI | Laboratory-based HSI of flat samples [65] |
| Standardized Illumination | Controlled, consistent lighting conditions | Reproducible HSI and FORS measurements [96] |
The validation case studies demonstrate that both HSI and FORS provide reliable spectral data with high agreement (up to 93%) when properly calibrated [65]. The selection between techniques should be guided by research objectives:
- Choose HSI when spatial distribution mapping is required, large areas need rapid assessment, or unsupervised screening is necessary before targeted analysis.
- Choose FORS when high spectral resolution point measurements are sufficient, minimal sample contact is critical, or budget constraints limit equipment options.
- Employ both techniques when comprehensive material characterization is required, leveraging HSI for spatial mapping and FORS for point validation.
For advanced applications, integrating HSI with artificial intelligence through transformer-based models and other deep learning architectures provides powerful material classification capabilities, achieving up to 97.9% accuracy in controlled settings [12] [95]. This integration represents the future direction for non-invasive analytical methods across scientific disciplines.
This guide provides an objective comparison between spectroscopy and hyperspectral imaging (HSI) to help researchers select the optimal technique for their specific analytical goals. Spectroscopy is ideal for bulk material analysis and quantitative concentration measurements when spatial information is not required. In contrast, HSI excels in applications demanding spatial mapping of chemical composition, heterogeneity analysis, and non-destructive visualization of sample properties. The decision fundamentally hinges on whether your research question is "what is it?" (spectroscopy) versus "where is it?" (HSI).
Spectroscopy: Bulk Material Analysis
Spectroscopy is the study of the interaction between matter and light, used to identify substances and quantify their concentrations [97]. It measures the absorption, emission, or scattering of light across a range of wavelengths to generate a spectral signature that serves as a molecular fingerprint for the material under investigation [98] [97]. This technique is predominantly used for analyzing the average properties of a sample, providing high-quality spectral data from a specific spot or volume without inherent spatial context.
Hyperspectral Imaging: Spatially-Resolved Chemical Mapping
Hyperspectral Imaging (HSI) combines spectroscopy with digital imaging, capturing a full spectrum for every pixel within a scene [1]. This creates a three-dimensional data cube, where two dimensions represent spatial coordinates (x, y) and the third dimension represents wavelength (λ) [22]. Unlike standard RGB imaging which records only three broad color bands, HSI collects data across dozens to hundreds of narrow, contiguous spectral bands, enabling detailed material identification and mapping across a sample surface [22]. This allows researchers to not only identify chemical components but also visualize their spatial distribution and heterogeneity.
Comparative Performance Data
Direct Technical Comparison
Table 1: Key performance characteristics of spectroscopy versus hyperspectral imaging.
| Parameter | Spectroscopy | Hyperspectral Imaging (HSI) |
|---|---|---|
| Spatial Information | Single point or bulk average | Full spatial mapping for every pixel |
| Spectral Resolution | Very High (e.g., <1 nm) [29] | High (e.g., ~1.43 nm per channel) [29] |
| Data Output | Spectrum (Intensity vs. Wavelength) | Hypercube (x, y, λ) [1] |
| Data Volume | Low (single spectrum) | Very High (thousands of spectra per image) [99] |
| Analysis Focus | Composition, concentration | Composition, spatial distribution, heterogeneity |
| Throughput | High for single-point measurements | Slower due to scanning and larger data sets |
Application-Based Performance
Table 2: Technique suitability and performance metrics for common application areas.
| Application Area | Technique | Key Performance Metrics | Reference Experimental Results |
|---|---|---|---|
| Bloodstain Age Estimation | NIR Spectroscopy | Prediction Accuracy (RMSEP) | RMSEP: ~8.15 days over 60 days [11] |
| HSI | Prediction Accuracy (RMSEP) | RMSEP: ~8.35 days over 60 days [11] | |
| Material Identification | Spectroscopy | Qualitative & Quantitative Analysis | Identifies functional groups, measures concentration [98] |
| HSI | Detection & Spatial Sorting | Enhanced spectral detail for detection/out-sorting [29] | |
| Food Freshness Assessment | HSI (VIS-NIR) | Classification Accuracy | 100% accuracy for tilapia fillets [1] |
| Industrial Sorting | Next-Gen HSI | Contrast & Spectral Detail | MTF contrast of 1.97 lines mm⁻¹ [29] |
Decision Framework and Selection Workflow
The following diagram outlines a systematic workflow to guide researchers in selecting the appropriate technique based on their specific research goals and sample characteristics.
Experimental Protocols for Cross-Validation
Protocol: Bloodstain Deposition Time Estimation
This protocol, adapted from a 2025 forensic study, demonstrates a direct comparison between NIR spectroscopy and HSI for estimating the age of bloodstains [11].
- Objective: To determine the time since deposition (bloodstain age) non-destructively.
- Sample Preparation: Create bloodstains on various evidentiary substrates (e.g., cotton, wood, plastic). Age samples under controlled conditions for a period up to 60 days, collecting data at regular intervals.
- Data Acquisition:
- NIR Spectroscopy: Use a NIR spectrometer to collect point spectra from the bloodstains.
- HSI: Use a pushbroom or snapshot HSI system covering the VNIR or SWIR range to capture hypercubes of the bloodstains.
- Data Analysis:
- Preprocessing: Apply Standard Normal Variate (SNV) to correct for scattering effects.
- Modeling: Employ chemometric methods. Start with Partial Least Squares (PLS) regression. For non-linear relationships, use PLS polynomial regression or a Multilayer Perceptron (MLP).
- Data Fusion: For enhanced accuracy, fuse spectral data from both techniques using low-level or intermediate-level fusion algorithms.
- Validation: Evaluate model performance using Root Mean Square Error of Prediction (RMSEP) on a validation set.
Protocol: Food Freshness and Quality Assessment
This protocol outlines the use of HSI for non-destructive quality control, as demonstrated in studies on tilapia fillets and apples [1].
- Objective: To determine food freshness (e.g., storage time) or detect defects non-destructively.
- Sample Preparation: Obtain samples (e.g., fish fillets, fruits) and subject them to controlled storage conditions (e.g., 4°C for 0–14 days). For fruits, samples may include both healthy and defective (e.g., bruised, infested) specimens.
- Data Acquisition:
- Use HSI systems in both the Visible-Near Infrared (VIS-NIR, 397–1003 nm) and Short-Wave Infrared (SWIR, 935–1720 nm) ranges.
- Ensure consistent illumination and use a white reference for calibration.
- Data Analysis:
- Spectral Extraction: Extract average spectra from Regions of Interest (ROIs) corresponding to different quality levels.
- Model Development: Train machine learning models. Compare traditional algorithms (PLS-DA, SVM, KNN) with Convolutional Neural Networks (CNN), which can automatically extract features from spectral data.
- Spatial Mapping: Use the trained model to predict the quality for every pixel in a new sample, creating a visual classification map.
- Validation: Report classification accuracy on a separate test set of samples.
Essential Research Reagent Solutions
Table 3: Key materials and software tools for spectroscopy and HSI research.
| Category | Item | Function & Application Notes |
|---|---|---|
| Calibration Standards | White Reference (e.g., Spectralon) | Critical for calibrating both HSI and spectrometer readings to a known reflectance. |
| Wavelength Calibration Standards | Ensures spectral accuracy across devices. | |
| Sample Presentation | Lab-Made Dark Box [51] | Creates a controlled, light-free environment for consistent measurements. |
| Scanning Stage / Conveyor Belt | Essential for pushbroom HSI to move the sample or camera and build the hypercube. | |
| Illumination | Halogen Lamps [51] | A broad-spectrum source ideal for HSI, providing uniform illumination across VNIR-SWIR. |
| Software & Databases | Chemometrics Software (e.g., PLS toolkits) | For building quantitative and classification models from spectral data. |
| Spectral Libraries | Reference databases for material identification. | |
| Data Analysis | Machine Learning Frameworks | For implementing advanced models like CNN or MLP for spectral data fusion and analysis [1] [11]. |
The choice between spectroscopy and hyperspectral imaging is not a matter of one being superior to the other, but rather selecting the right tool for a specific research question. Spectroscopy remains the workhorse for high-throughput, quantitative analysis of homogeneous materials or when specific chemical bonds and concentrations are the primary interest. Hyperspectral imaging is unequivocally powerful for visualizing spatial heterogeneity, mapping component distribution, and analyzing complex, structured samples non-destructively. As sensor technology continues to advance, with developments like the Sony IMX990 chip offering enhanced spectral detail and reduced noise in a single camera, HSI is becoming more accessible and powerful for industrial and research applications [29] [80]. By applying the decision framework and experimental insights provided in this guide, researchers can make informed, evidence-based decisions to accelerate their discoveries.
Conclusion
Hyperspectral imaging and conventional spectroscopy are powerful, complementary techniques for optical analysis. HSI excels in providing non-invasive, label-free spatial mapping of chemical composition, making it indispensable for complex tissue analysis and morphological context. Spectroscopy remains the gold standard for obtaining highly detailed spectral data from a specific point. The convergence of AI, miniaturization, and advanced computational methods like spectral unmixing is overcoming traditional barriers of cost and complexity, paving the way for more accessible and automated systems. For biomedical and clinical research, the future lies in leveraging the strengths of each method—using HSI for spatial discovery and spectroscopy for deep spectral validation—to drive innovations in disease diagnostics, drug development, and personalized medicine.
References
- 1. The Advantages and Landscape of Hyperspectral Imaging ... [https://www.spectroscopyonline.com/view/the-advantages-and-landscape-of-hyperspectral-imaging-spectroscopy]
- 2. Hyperspectral imaging and its applications: A review [https://www.sciencedirect.com/science/article/pii/S2405844024092399]
- 3. Comparing mapping and direct hyperspectral imaging in ... [https://pmc.ncbi.nlm.nih.gov/articles/PMC6774338/]
- 4. as an emerging tool to analyze microplastics... Hyperspectral imaging [https://microplastics.springeropen.com/articles/10.1186/s43591-021-00014-y]
- 5. Time and spatially resolved VIS-NIR hyperspectral imaging as ... [https://pubs.rsc.org/en/content/articlehtml/2024/an/d3an02041j]
- 6. 'More than just an image': Purdue tech extracts ... [https://www.purdue.edu/newsroom/2025/Q3/more-than-just-an-image-purdue-tech-extracts-hyperspectral-info-from-conventional-photos]
- 7. Progress in the application of hyperspectral imaging ... [https://pmc.ncbi.nlm.nih.gov/articles/PMC12226550/]
- 8. Hyperspectral Imaging Is Transforming Science, Medicine, ... [https://www.spectroscopyonline.com/view/hyperspectral-imaging-is-transforming-science-medicine-and-industry]
- 9. Hyperspectral reflectance imaging and spectral component ... [https://pmc.ncbi.nlm.nih.gov/articles/PMC12166450/]
- 10. Hyperspectral Imaging System Applications in Healthcare [https://www.mdpi.com/2079-9292/14/23/4575]
- 11. Comparative analysis of hyperspectral and near-infrared ... [https://pubs.rsc.org/en/content/articlelanding/2025/ay/d4ay02167c]
- 12. Electrolyzers-HSI: Close-Range Multi-Scene Hyperspectral ... [https://www.nature.com/articles/s41597-025-06279-9]
- 13. Emerging applications of stimulated Raman scattering ... [https://pubs.rsc.org/en/content/articlehtml/2025/cs/d5cs00748h]
- 14. A Hybrid Framework for Soil Property Estimation from ... [https://www.mdpi.com/2072-4292/17/15/2568]
- 15. Hyperspectral Imaging [https://arxiv.org/html/2508.08107v1]
- 16. Short-Wave Infrared Hyperspectral Imaging [https://www.specim.com/technology/swir-hyperspectral-imaging/]
- 17. status of novel spectral imaging techniques and... Development [https://pmc.ncbi.nlm.nih.gov/articles/PMC10759257/]
- 18. Imaging: Types, Benefits, and Applications - JOUAV Hyperspectral [https://www.jouav.com/blog/hyperspectral-imaging.html]
- 19. SWIR Cameras And Their Applications [https://www.axiomoptics.com/application/swir-imaging-applications/]
- 20. Scientific NIR-II / SWIR Cameras for Advanced Imaging ... [https://www.teledynevisionsolutions.com/learn/learning-center/scientific-imaging/scientific-nir-ii--swir-cameras-for-advanced-imaging-and-spectroscopy-applications/]
- 21. and Spectroscopy Imaging – Quantitative Imaging Hyperspectral [https://research.csiro.au/qi/spectroscopy-and-hyperspectral-imaging/]
- 22. The latest hyperspectral imaging products for 2025 [https://www.imveurope.com/article/latest-hyperspectral-imaging-products-2024]
- 23. NIR SWIR Cameras - Market Leading Solutions [https://andor.oxinst.com/products/nir-swir-cameras]
- 24. Market Hyperspectral : Strategic Acquisitions... Imaging Research 2025 [https://finance.yahoo.com/news/hyperspectral-imaging-market-research-2025-151100725.html]
- 25. Comparative Performance of NIR-Hyperspectral Imaging ... [https://www.mdpi.com/2673-9321/2/3/35]
- 26. Hyperspectral Imaging Systems Market Size, Share [https://www.marketsandmarkets.com/Market-Reports/hyperspectral-imaging-market-246979343.html]
- 27. Hyperspectral Imaging Market Size & Share Analysis [https://www.mordorintelligence.com/industry-reports/hyperspectral-imaging-market]
- 28. In Agriculture Market: Hyperspectral Advances... Imaging 2025 [https://farmonaut.com/blogs/hyperspectral-imaging-in-agriculture-market-2025-advances]
- 29. A direct comparison of a next generation hyperspectral ... [https://www.sciencedirect.com/science/article/pii/S1386142524012344]
- 30. Market | Global Market Analysis Report - 2035 Hyperspectral Imaging [https://www.futuremarketinsights.com/reports/hyperspectral-imaging-market]
- 31. Label-Free Hyperspectral Imaging and Quantification ... [https://pmc.ncbi.nlm.nih.gov/articles/PMC6169991/]
- 32. a pilot study on surgical specimens of cancer patients [https://www.spiedigitallibrary.org/journals/JBO/volume-22/issue-08/086009/Label-free-reflectance-hyperspectral-imaging-for-tumor-margin-assessment/10.1117/1.JBO.22.8.086009.full]
- 33. A Comparison of Spectroscopy and Imaging Techniques ... [https://pmc.ncbi.nlm.nih.gov/articles/PMC10251883/]
- 34. Hyperspectral imaging for tumor resection guidance in surgery [https://pmc.ncbi.nlm.nih.gov/articles/PMC12327654/]
- 35. Hyperspectral imaging benchmark based on machine ... [https://www.nature.com/articles/s41698-023-00475-9]
- 36. Hyperspectral Imaging and K-Means Classification for ... [https://www.frontiersin.org/journals/oncology/articles/10.3389/fonc.2018.00017/full]
- 37. Delineation and detection of breast cancer using novel label ... [https://bmcmedimaging.biomedcentral.com/articles/10.1186/s12880-023-01095-2]
- 38. Detection of Counterfeit Medicines Using Hyperspectral ... [https://pubmed.ncbi.nlm.nih.gov/33019376/]
- 39. Counterfeit classifications using Raman spectroscopy and ... [https://www.europeanpharmaceuticalreview.com/article/166284/counterfeit-classifications-using-raman-spectroscopy-and-visible-near-infrared-vnir-hyperspectral-imaging/]
- 40. Comparison of hyperspectral imaging techniques for the ... [https://www.sciencedirect.com/science/article/abs/pii/S0039914019301699]
- 41. The use of hyperspectral imaging in the VNIR (400–1000 ... [https://www.sciencedirect.com/science/article/abs/pii/S0039914016304830]
- 42. Hyperspectral imaging for drugs identification and sorting [https://nireos.com/application/drugs-identification-and-sorting/]
- 43. AI Deep Learning Advances Hyperspectral Imaging for ... [https://www.spectroscopyonline.com/view/ai-deep-learning-advances-hyperspectral-imaging-for-earth-observation]
- 44. Using Spectral Analysis to Detect Counterfeit Drugs [https://www.hunterlab.com/blog/spectrophotometers-and-fraud-exposure-using-spectral-analysis-to-detect-counterfeit-drugs/]
- 45. Counterfeit Drug Detection Device Market Analysis Report ... [https://finance.yahoo.com/news/counterfeit-drug-detection-device-market-084000313.html]
- 46. Application of FRET probes in the analysis of neuronal ... [https://www.frontiersin.org/journals/neural-circuits/articles/10.3389/fncir.2013.00163/full]
- 47. Fluorescence Resonance Energy Transfer (FRET) ... [https://evidentscientific.com/en/microscope-resource/knowledge-hub/techniques/fluorescence/fret/fretintro]
- 48. Medical hyperspectral imaging: a review - PMC [https://pmc.ncbi.nlm.nih.gov/articles/PMC3895860/]
- 49. Optical Imaging of Brain Activity In Vivo Using Genetically ... [https://www.ncbi.nlm.nih.gov/books/NBK20237/]
- 50. Hyperspectral imaging for non-invasive blood oxygen ... [https://www.sciencedirect.com/science/article/pii/S1572100024000425]
- 51. How Much Does A Hyperspectral Camera Cost in 2025? [https://surfaceoptics.com/hyperspectral-camera-price-2025/]
- 52. Machine learning spectroscopy to advance computation ... [https://pmc.ncbi.nlm.nih.gov/articles/PMC12590498/]
- 53. Hyper-spectral Unmixing algorithms for remote ... [https://www.sciencedirect.com/science/article/pii/S2590197425000795]
- 54. Demystifying the Black Box: Making Machine Learning ... [https://www.spectroscopyonline.com/view/demystifying-the-black-box-making-machine-learning-models-explainable-in-spectroscopy]
- 55. Multi-resolution terrestrial hyperspectral dataset for spectral ... [https://www.sciencedirect.com/science/article/pii/S2352340922005339]
- 56. Performance of machine learning algorithms in ... [https://www.nature.com/articles/s41598-023-50620-4]
- 57. Conventional to Deep Learning Methods for Hyperspectral ... [https://www.mdpi.com/2072-4292/17/17/2968]
- 58. Advances in Hyperspectral Image Unmixing [https://www.sciencedirect.com/science/article/pii/S3050520825000351]
- 59. Applicability Analysis with the Improved Spectral Unmixing ... [https://www.mdpi.com/2075-163X/15/7/715]
- 60. Spectral unmixing as a preprocessing step for SVM-based ... [https://www.nature.com/articles/s40494-025-02029-7]
- 61. Evaluation of deep-learning-based approaches for spectral ... [https://www.spiedigitallibrary.org/conference-proceedings-of-spie/13455/134550P/Evaluation-of-deep-learning-based-approaches-for-spectral-unmixing/10.1117/12.3053529.full]
- 62. Comparative analysis of spectral unmixing methods for ... [https://www.sciencedirect.com/science/article/pii/S2772375525000681]
- 63. Optical hyperspectral imaging in microscopy and spectroscopy [https://pmc.ncbi.nlm.nih.gov/articles/PMC4348353/]
- 64. Dimensionality reduction in hyperspectral imaging using ... [https://www.nature.com/articles/s41598-025-21738-4]
- 65. Comparison of Hyperspectral Imaging and Fiber-Optic ... [https://www.mdpi.com/2571-9408/5/3/73]
- 66. Comparing Performance of Spectral Image Analysis ... [https://pmc.ncbi.nlm.nih.gov/articles/PMC10295298/]
- 67. Hyperspectral imaging and its applications: A review - PMC [https://pmc.ncbi.nlm.nih.gov/articles/PMC11253060/]
- 68. Hyperspectral Imaging Camera: Cost vs. Capabilities [https://www.livingoptics.com/hyperspectral-camera-price-vs-performance-finding-the-right-balance/]
- 69. High-speed analysis of powder and tablets with ... [https://www.specim.com/high-speed-analysis-of-powder-and-tablets-with-hyperspectral-imaging/]
- 70. Active and Low-Cost Hyperspectral Imaging for the ... [https://pmc.ncbi.nlm.nih.gov/articles/PMC9920345/]
- 71. High-speed scanless entire bandwidth mid-infrared ... [https://www.nature.com/articles/s41467-023-39628-6]
- 72. Hyperspectral Imaging Applications in Pharmaceutical PAT [https://headwallphotonics.com/hyperspectral-imaging-applications-in-pharmaceutical-pat/]
- 73. Cost-efficient Active Illumination Camera For Hyper ... [https://arxiv.org/html/2406.19560v1]
- 74. Conventional Near-Infrared Spectroscopy and ... [https://pmc.ncbi.nlm.nih.gov/articles/PMC12195655/]
- 75. AI Shakes Up Spectroscopy as New Tools Reveal the ... [https://www.spectroscopyonline.com/view/ai-shakes-up-spectroscopy-as-new-tools-reveal-the-secret-life-of-molecules]
- 76. Applications of artificial intelligence and machine learning ... [https://www.sciencedirect.com/science/article/abs/pii/S0169743925001303]
- 77. Hyperspectral Imaging In Agriculture Market: 2025 Advances [https://farmonaut.com/remote-sensing/hyperspectral-imaging-in-agriculture-market-2025-advances]
- 78. Modern Trends and Recent Applications of Hyperspectral ... [https://www.mdpi.com/2227-7080/13/5/170]
- 79. Hyperspectral Imaging based Deep Learning Benchmarks ... [https://www.sciencedirect.com/science/article/pii/S2772502225006924]
- 80. A direct comparison of a next generation hyperspectral ... [https://pure.au.dk/portal/en/publications/a-direct-comparison-of-a-next-generation-hyperspectral-camera-to-]
- 81. Top Hyperspectral Imaging Tools for 2025 [https://flypix.ai/blog/hyperspectral-imaging-tools/]
- 82. What Is the Difference Between Spatial and Spectral ... [https://www.hunterlab.com/blog/difference-between-spatial-and-spectral-resolution/]
- 83. Spatial Resolution vs Spectral Resolution [https://gisgeography.com/spatial-resolution-vs-spectral-resolution/]
- 84. Introduction to Spatial and Spectral Resolution: Multispectral Imagery | Earth Data Science - Earth Lab [https://earthdatascience.org/courses/earth-analytics/multispectral-remote-sensing-data/introduction-multispectral-imagery-r/]
- 85. The role of spectral vs spatial resolution of satellite data on the accuracy of mapping unburned vegetation within fire scar perimeters - ScienceDirect [https://www.sciencedirect.com/science/article/pii/S2666017225000471]
- 86. A Spectral and Spatial Comparison of Satellite-Based ... [https://www.mdpi.com/2072-4292/16/12/2089]
- 87. 2025 Review of Spectroscopic Instrumentation [https://www.spectroscopyonline.com/view/2025-review-of-spectroscopic-instrumentation]
- 88. Hyperspectral Imaging for High Throughput Optical ... [https://www.nature.com/nature-index/article/10.1021/acs.analchem.4c04731]
- 89. Conventional Near-Infrared Spectroscopy and ... [https://pubmed.ncbi.nlm.nih.gov/40572446/]
- 90. Deep learning-enabled hyperspectral imaging for high ... [https://www.frontiersin.org/journals/plant-science/articles/10.3389/fpls.2025.1634785/full]
- 91. Hyperspectral imaging combined with residual-attention- ... [https://www.sciencedirect.com/science/article/pii/S1572100025001772]
- 92. Advancements, limitations and challenges in hyperspectral ... [https://www.sciencedirect.com/science/article/pii/S2590157524001226]
- 93. On-Orbit Performance and Hyperspectral Data Processing ... [https://www.mdpi.com/2072-4292/17/11/1903]
- 94. Comparing the effectiveness of hyperspectral imaging and ... [https://www.nature.com/articles/s40494-018-0206-1]
- 95. Hyperspectral imaging near-infrared spectroscopy as a ... [https://www.sciencedirect.com/science/article/pii/S0026265X25026736?via%3Dihub]
- 96. Evaluating Normalization Methods for Robust Spectral ... [https://pmc.ncbi.nlm.nih.gov/articles/PMC11763101/]
- 97. The latest spectroscopy products for 2025 [https://www.electrooptics.com/article/latest-spectroscopy-products-2025]
- 98. A Beginner's Guide to Spectroscopy in Energy Applications [https://www.spectroscopyonline.com/view/a-beginner-s-guide-to-spectroscopy-in-energy-applications]
- 99. The Growing Hyperspectral Imaging Market [https://blog.bccresearch.com/the-growing-hyperspectral-imaging-market-trends-opportunities-and-future-prospects]