Laser-Induced Breakdown Spectroscopy (LIBS): A Comprehensive Guide to Principles, Applications, and Technological Advances for Researchers
This article provides a comprehensive examination of Laser-Induced Breakdown Spectroscopy (LIBS), a rapid, versatile elemental analysis technique.
Laser-Induced Breakdown Spectroscopy (LIBS): A Comprehensive Guide to Principles, Applications, and Technological Advances for Researchers
Abstract
This article provides a comprehensive examination of Laser-Induced Breakdown Spectroscopy (LIBS), a rapid, versatile elemental analysis technique. Tailored for researchers and drug development professionals, it covers foundational principles and explores diverse applications from pharmaceutical analysis to environmental monitoring. The content details methodological approaches for complex samples, addresses key operational challenges with advanced optimization strategies, and validates LIBS performance against established analytical techniques. By synthesizing recent technological innovations—including AI-enhanced data processing and novel laser beam designs—this guide serves as a critical resource for evaluating and implementing LIBS in research and industrial settings, highlighting its growing potential for real-time, on-site analysis.
Understanding LIBS: Core Principles, Market Growth, and Industrial Significance
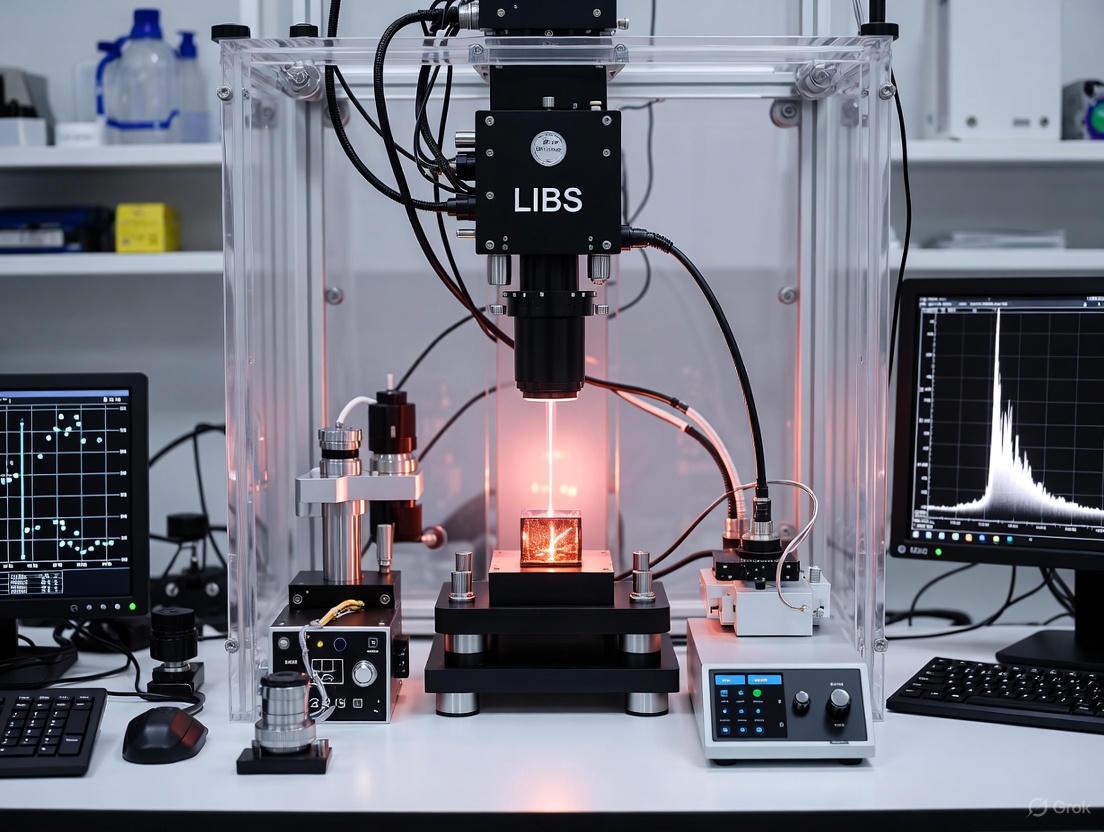
Laser-Induced Breakdown Spectroscopy (LIBS) is an advanced atomic emission spectroscopic technique that has solidified its role in material analysis research due to its rapid, minimally destructive, and multi-elemental capabilities [1]. The fundamental principle involves using a high-powered laser pulse to ablate a microscopic amount of material, creating a transient plasma whose characteristic optical emission is analyzed to determine the elemental composition of the target [2]. The technique's unique advantage lies in its minimal sample preparation requirements, applicability to all states of matter (solid, liquid, gas), and potential for remote, stand-off analysis, making it invaluable for fields ranging from planetary exploration to biomedical research [3] [1]. This application note details the core physics, instrumental components, and standardized protocols essential for leveraging LIBS in research environments, providing a foundation for its application in material analysis.
Fundamental Physics and Process Dynamics
The LIBS process is a sequential physical phenomenon that occurs within a microsecond timeframe, encompassing laser-matter interaction, plasma formation and evolution, and characteristic light emission. The underlying physics can be dissected into four critical stages, with the entire process from ablation to data collection typically completing within microseconds to milliseconds [1].
Laser Ablation and Plasma Initiation: The process begins when a high-energy laser pulse (typically nanosecond duration) is focused onto a small spot (diameters of tens of µm) on the sample surface [4]. The resulting energy fluence is sufficient to cause rapid vaporization and ionization of the sample material, forming a dense plasma plume with initial temperatures often exceeding 10,000–20,000 K [3]. This plasma primarily consists of electrons, ions, and atoms in excited states.
Plasma Expansion and Cooling: Following the laser pulse, the plasma expands rapidly away from the sample surface and begins to cool. During this expansion, the plasma interacts with the surrounding ambient atmosphere (e.g., air, argon), which can influence its dynamics and emission characteristics [3].
Optical Emission: As the plasma cools, electrons within ions and atoms revert from excited states to lower energy states, releasing energy in the form of photons. The wavelength of these emitted photons is unique to each element and ionic transition, while their intensity relates to the concentration of the element in the sample [5]. This emission is rich with atomic ionic lines, neutral atomic lines, and in some cases, molecular bands.
Spectral Collection and Analysis: The emitted light is collected and dispersed by a spectrometer. The resulting spectrum, a plot of light intensity versus wavelength, serves as a unique fingerprint of the sample's elemental composition [6] [7]. Quantitative analysis is achieved by comparing the intensities of specific elemental lines to calibration models or through calibration-free methods which rely on modeling the plasma physics [3].
The diagram below illustrates this continuous workflow.
Key Components of a LIBS Instrument
A typical LIBS system is built from four core components that work in concert to execute and analyze the laser-induced plasma [1]. The specifications of these components directly influence the system's performance, including its sensitivity, resolution, and applicability.
- Laser Source: The laser serves as the excitation source. Common configurations use Q-switched Nd:YAG lasers generating pulses at fundamental wavelengths (1064 nm) or harmonics (e.g., 532 nm), with pulse durations in the nanosecond range and pulse energies from a few millijoules to hundreds of millijoules [5] [4]. The laser's wavelength, pulse energy, and duration critically affect ablation efficiency and plasma properties.
- Spectrometer: This instrument disperses the collected plasma light into its constituent wavelengths. LIBS systems often employ echelle spectrometers with high resolving powers (e.g., R = 6000) to resolve closely spaced spectral lines, or simpler grating spectrometers for specific ranges [5] [4]. The spectral range covered (e.g., 240–850 nm) determines which elements can be detected.
- Detector: An intensified CCD (ICCD) or other time-gated camera is typically used to capture the dispersed spectrum. Time-gating is crucial: by setting a delay between the laser pulse and detector activation, the strong, featureless continuum background from the hot plasma (Bremsstrahlung radiation) can be minimized, allowing for the clear detection of atomic emission lines [4].
- Data Acquisition and Control System: This computer-based system synchronizes the laser firing, spectrometer settings, and detector gating. It also processes the raw spectral data, performing tasks like background subtraction, wavelength calibration, and spectral analysis.
Table 1: Typical Specifications of a Research-Grade LIBS Instrument
| Component | Typical Specifications | Research Considerations |
|---|---|---|
| Laser | Nd:YAG, 1064/532 nm, 4-10 ns pulse width, 1-100 mJ energy, 1-20 Hz repetition rate [5] [4] | Higher energy increases ablation; UV wavelengths can offer better spatial resolution on some materials. |
| Spectrometer | Echelle or Czerny-Turner design; Resolving Power > 5000 [4]; Range: 200-850 nm [5] | Higher resolving power separates overlapping peaks; broader range detects more elements. |
| Detector | Intensified CCD (ICCD), time-gated (delay: 0.3-1 µs, width: 1-50 µs) [4] | Optimal gate delay/width maximizes signal-to-noise and is sample-dependent. |
| Spectral Resolution | ~0.1 nm (depending on spectrometer and slit width) | Necessary to distinguish between closely spaced emission lines. |
Experimental Protocol for Solid Sample Analysis
This protocol provides a standardized methodology for the quantitative analysis of a geochemical sample (e.g., soil, rock, or pressed pellet), a common application in material science [4]. The workflow integrates steps for sample preparation, instrument setup, data acquisition, and data analysis, ensuring reproducible and reliable results.
Sample Preparation Protocol:
- Homogenization: If the sample is a powder or soil, ensure it is thoroughly homogenized using a mortar and pestle or a mechanical grinder.
- Pelletization (Optional but Recommended): Mix approximately 400 mg of the sample powder with 400 mg of a binding agent (e.g., dental gypsum) to enhance coherence [4].
- Pressing: Transfer the mixture into a pellet die and compress using a hydraulic press at a pressure of 5-10 tons for 1-2 minutes to form a solid, flat-surfaced pellet.
- Storage: Store the prepared pellets in a desiccator to prevent moisture absorption until analysis.
Instrument Setup and Calibration:
- Laser Alignment: Place the sample pellet on the translation stage in the sample chamber. Align the laser focus to the sample surface using a built-in camera or He-Ne guiding laser to achieve the smallest possible spot size.
- Optical Alignment: Align the collection lens and fiber optic cable to maximize the plasma light collected. The detection distance should be fixed and reproducible [5].
- Wavelength Calibration: Use a spectral calibration lamp (e.g., Hg/Ar) to verify and calibrate the wavelength axis of the spectrometer [4].
- Parameter Setting: Set the following key parameters, which may require optimization for different sample matrices:
Data Acquisition and Analysis:
- Spectral Collection: Acquire spectra from multiple locations (e.g., 10-50 spots) on the pellet surface to account for sample heterogeneity. A minimum of 500 spectra per sample is recommended for building robust classification models [4].
- Pre-processing: Subject raw spectra to pre-processing steps, including dark noise subtraction, intensity normalization (e.g., to the total spectral intensity or a specific plasma line), and background baseline removal [5].
- Qualitative & Quantitative Analysis: Identify elements present by matching observed emission peaks to known spectral databases (e.g., NIST Atomic Spectra Database). For quantitative analysis, employ multivariate calibration models (e.g., Partial Least Squares Regression) built using standards of known composition [6] [7].
The following diagram summarizes this experimental workflow.
The Scientist's Toolkit: Essential Research Reagents and Materials
Successful LIBS analysis requires specific reagents and materials for sample preparation, system calibration, and validation. The following table details key solutions and their functions in a typical LIBS laboratory.
Table 2: Key Research Reagent Solutions and Materials for LIBS
| Reagent/Material | Function/Application | Research Notes |
|---|---|---|
| Certified Reference Materials (CRMs) | Calibration and validation of quantitative models; essential for assessing accuracy [5] [4]. | Select CRMs that closely match the sample matrix (e.g., soil, alloy, polymer). |
| Pellet Binder (e.g., Gypsum, Polyvinyl Alcohol) | Provides structural integrity to powdered samples during pressing and laser ablation [4]. | Must be spectroscopically pure to avoid introducing contaminant spectral lines. |
| Spectral Calibration Lamp (Hg, Ar, Ne) | Verifies and calibrates the wavelength axis of the spectrometer, ensuring precise peak assignment. | Required for initial setup and periodic verification of spectral accuracy. |
| Collimation and Alignment Tools | Ensures optimal laser focusing and plasma light collection, maximizing signal intensity and reproducibility. | Includes alignment lasers, mirrors, and lens positioning stages. |
Advanced Applications and Future Outlook
The fundamental physics of LIBS enables its use in a diverse array of advanced research applications. In planetary exploration, LIBS instruments like ChemCam (Curiosity rover) and SuperCam (Perseverance rover) perform remote geochemical analysis on Martian surfaces, with detection distances varying from 1.6 to 7 meters [7] [5]. A major research focus is overcoming the "distance effect" on spectral fidelity, with novel approaches like multi-model calibration and deep convolutional neural networks (CNNs) showing promise for maintaining analytical accuracy despite changing distances [6] [5].
In the biomedical field, LIBS is emerging as a tool for rapid tissue analysis and disease diagnosis. Applications include discriminating between cancerous and healthy tissues in skin, brain, lung, and colorectal cancers by detecting alterations in trace metal concentrations (e.g., Cu, Zn, Na, K) [1]. The combination of LIBS with chemometrics is crucial for extracting meaningful diagnostic information from complex biological spectra [1].
Future developments are geared towards enhancing quantitative accuracy and robustness. Key trends include the development of calibration-transfer methodologies between different LIBS instruments using spectral line binning, which allows sharing of calibration models and reduces the need for extensive re-calibration [7]. Furthermore, multi-pulse LIBS and microwave-enhanced LIBS are active areas of research aimed at significantly improving the signal-to-noise ratio and lowering limits of detection [3] [2]. As instrumentation becomes more compact and machine learning algorithms more sophisticated, the application of LIBS for real-time, in-line industrial process control and field-deployable diagnostic tools is poised for substantial growth.
Laser-Induced Breakdown Spectroscopy (LIBS) has emerged as a powerful analytical technique for rapid, multi-element analysis of various materials with minimal sample preparation. This application note details the core components of a LIBS system—laser sources, spectrometers, and data processing units—within the context of advanced material analysis research. LIBS operates by using a high-energy laser pulse to generate a microplasma on the sample surface; the collected light from this plasma is then spectrally resolved and analyzed to determine elemental composition [8] [9]. The technique's versatility makes it invaluable across diverse fields, including pharmaceutical development, metal processing, geological analysis, and biomedical applications [10] [11] [12].
For researchers and drug development professionals, understanding the technical specifications and integration of these core components is crucial for developing robust analytical methods. The performance of a LIBS system directly impacts key analytical figures of merit such as limit of detection (LOD), measurement precision, and analysis throughput. Contemporary advancements continue to enhance these systems through miniaturization, improved spectral resolution, and the integration of machine learning algorithms for data processing [8] [13].
Core Component Analysis
The laser source is the fundamental component responsible for sample ablation and plasma generation. Its parameters directly influence plasma characteristics and the resulting spectral quality.
Table 1: Key Laser Source Specifications and Their Analytical Impact
| Laser Parameter | Typical Specifications | Impact on Analysis | Considerations for Researchers |
|---|---|---|---|
| Laser Type | Q-switched Nd:YAG (most common) [9] | Determines wavelength, pulse duration, and energy stability. | Solid-state lasers like Nd:YAG are preferred for their robustness and reliability in industrial settings. |
| Wavelength | 1064 nm (fundamental), 532 nm (2nd harmonic) [9] | Affects laser-sample coupling and ablation efficiency. Shorter wavelengths often improve absorption on metallic surfaces. | The choice depends on the sample matrix; UV wavelengths may reduce background continuum emission. |
| Pulse Duration | Nanosecond (ns) regime [12] | Longer pulses can lead to greater sample heating. | Ultrashort (femtosecond) pulses offer reduced thermal effects but are more complex and expensive. |
| Pulse Energy | Millijoules (mJ) per pulse [12] | Higher energy can enhance emission signal but may increase fractionation and plasma shielding. | Must be optimized to achieve sufficient signal without excessive sample damage or spectral noise. |
| Repetition Rate | 1-100 Hz [12] | Dictates analysis speed for mapping or high-throughput screening. | Higher repetition rates enable rapid screening but require synchronized, fast data acquisition systems. |
Laser parameters must be optimized for specific applications. For instance, the plasma temperature and electron density, critical for quantitative analysis, are strongly influenced by laser energy and wavelength [9]. In pharmaceutical research, where sample damage might be a concern, lower pulse energies or UV wavelengths might be preferable. The trend toward portable and handheld LIBS devices has also driven the development of compact, low-power-consumption laser sources suitable for field use [14] [10].
Spectrometers
The spectrometer resolves the light emitted by the laser-induced plasma into its constituent wavelengths, enabling element identification and quantification.
Table 2: Spectrometer Configurations and Performance Characteristics
| Spectrometer Type | Spectral Range | Resolution (λ/Δλ) | Typical Applications | Advantages & Limitations |
|---|---|---|---|---|
| Echelle Spectrometer | Broad (e.g., 200-780 nm) | High (>10,000) [12] | Multi-element analysis of complex matrices (e.g., industrial waste, geological samples). | Simultaneous broad coverage and high resolution; complex optical alignment. |
| Czerny-Turner | UV-Vis-NIR selectable | Medium to High (several thousands) | General purpose analysis, specific element detection. | Good flexibility and resolution; limited simultaneous spectral range. |
| Compact/Portable | Varies by design | Varies (often lower than benchtop) | Field analysis, mining (e.g., lithium mapping), in-line process control [14]. | Portability and robustness; trade-off in resolution and sensitivity. |
The spectral resolution and throughput of the spectrometer are paramount. High resolution is necessary to distinguish closely spaced emission lines, which is critical for analyzing complex materials containing multiple elements [15]. The detected signal strength, ( n{det} ), is a function of the spectrometer's efficiency and can be expressed as: ( n{det} = (\Delta n{ki}/\Delta t) \times (\Delta\Omega/4\pi) \taug \gamma{det} ) where ( \gamma{det} ) is the total detection efficiency, ( \Delta\Omega ) is the collected solid angle, and ( \tau_g ) is the detector gate width [12]. This relationship highlights the importance of efficient light collection and high-sensitivity detectors (e.g., ICCD, CCD) for achieving low limits of detection. The global market for high-resolution LIBS spectrometers, valued at USD 1.2 billion in 2024, reflects the growing demand for these advanced components [10].
Data Processing Units
Data processing units transform raw spectral data into meaningful qualitative and quantitative results. This component has seen significant advances with the integration of modern computational techniques.
Data Processing Workflow: The workflow begins with pre-processing of raw spectra to correct for background noise, normalize signal intensity, and calibrate wavelength. For quantitative analysis, the system must relate spectral line intensity to element concentration. This is typically achieved through calibration-based methods using certified reference materials (CRMs) to build multivariate calibration models [12]. Alternatively, Calibration-Free LIBS (CF-LIBS) can be employed, which calculates concentrations directly from spectral data by modeling the plasma under the assumption of local thermodynamic equilibrium (LTE) and an optically thin plasma [9].
The integration of machine learning (ML) and artificial intelligence (AI) is transforming data processing in LIBS. These algorithms can handle complex, multidimensional spectral data, mitigate matrix effects, and improve the accuracy of quantitative analysis [8] [13]. For example, ML models are trained on extensive spectral libraries to rapidly identify and quantify elements in unknown samples [14]. Furthermore, the move towards Industry 4.0 involves connecting LIBS sensors to cloud platforms via the Internet of Things (IoT) for real-time data monitoring, predictive maintenance, and remote analysis [13].
Experimental Protocols
Protocol 1: LIBS System Setup and Alignment
This protocol ensures optimal performance of the core components for reliable data acquisition.
- Laser-Sample Alignment: Mount the sample securely on a stable XYZ stage. Using low laser energy, fire single pulses and visually locate the laser spot on the sample surface. Adjust the focusing lens (typically a plano-convex lens with a focal length of 50-150 mm) until the smallest, brightest spot is observed. The laser focus is often set slightly below the surface to minimize air breakdown [9].
- Plasma Light Collection: Align the collection optics (lens or fiber optic cable) to capture the maximum plasma emission. The collection axis should be at an angle (e.g., 30-45 degrees) to the laser path to avoid specular reflections. The collected light is then coupled into a fiber optic cable and directed to the spectrometer entrance slit.
- Spectrometer and Detector Synchronization: Connect the laser Q-switch output to the spectrometer/detector as a trigger. Set the detector delay time (( td )) and gate width (( tw )) using a delay generator. A typical delay time is 1-2 µs to avoid the intense continuous background radiation, with a gate width of 5-10 µs to capture the atomic emission [12].
- Wavelength Calibration: Use a standard light source (e.g., Hg/Ar lamp) with known emission lines to calibrate the wavelength axis of the spectrometer. Verify the calibration accuracy across the entire spectral range.
Protocol 2: Quantitative Analysis of a Metal Alloy
This protocol outlines the steps for determining the composition of a metal sample, such as copper, using a calibration-based approach.
- Sample Preparation: Clean the surface of the sample and certified reference materials (CRMs) with an appropriate solvent (e.g., ethanol) and, if necessary, lightly abrade to remove oxides. Ensure the samples are mounted to present a flat, homogeneous surface to the laser.
- Instrument Calibration:
- Acquire LIBS spectra from the CRMs at multiple locations (e.g., 10 spectra per CRM) to account for heterogeneity.
- For each CRM spectrum, integrate the peak intensity or area for the analyte elements (e.g., Cu I at 324.75 nm, 327.39 nm; Pb I at 405.78 nm) [8].
- Plot the integrated intensity versus the known concentration for each element and perform a linear (or non-linear) regression to create a calibration curve.
- Sample Measurement: Acquire LIBS spectra from the unknown metal sample under identical experimental conditions (laser energy, delay time, etc.).
- Data Analysis and Quantification: Apply the same spectral processing to the unknown sample's spectra. Use the pre-constructed calibration curves to convert the measured line intensities into elemental concentrations. Report the average concentration and standard deviation from the multiple measurements.
Protocol 3: Validation Using Calibration-Free LIBS
This protocol provides a method for quantitative analysis when CRMs are not available.
- Spectral Acquisition: Record a high-resolution spectrum from the unknown sample, ensuring a wide spectral range is covered to capture all major element lines.
- Line Identification: Identify all emission lines in the spectrum using a database such as the NIST Atomic Spectra Database [15].
- Plasma Parameter Calculation:
- Calculate the plasma temperature (( Te )) using the Boltzmann plot method, which involves multiple emission lines from the same species and ionization state.
- Calculate the electron number density (( Ne )) from the Stark broadening of a well-isolated emission line (e.g., H-α line if present, or a neutral atom line from a major element) [9].
- Validation of LTE: Check that the plasma meets the criteria for Local Thermodynamic Equilibrium (LTE), a prerequisite for CF-LIBS [9].
- Concentration Calculation: Assuming an optically thin plasma, use the measured line intensities, plasma temperature, and known transition probabilities (from NIST) to calculate the concentration of each element present using the CF-LIBS algorithm [9] [12].
System Integration and Workflow
The interaction between the laser, spectrometer, and data processing unit follows a precise sequence to transform a laser pulse into an analytical result. The following diagram illustrates this integrated workflow.
Essential Research Reagents and Materials
Table 3: Key Research Reagents and Materials for LIBS Experiments
| Item Name | Function/Application | Technical Notes |
|---|---|---|
| Certified Reference Materials (CRMs) | Calibration and validation of quantitative methods. | Must be matrix-matched to the sample type (e.g., copper alloy CRMs for analyzing copper scraps) [12]. |
| Standard Emission Lamps | Wavelength calibration of the spectrometer. | Hg/Ar or Ne lamps provide sharp, known emission lines across a broad spectral range [15]. |
| Neodymium-Doped Yttrium\nAluminum Garnet (Nd:YAG) Laser | Standard laser source for plasma generation. | Q-switched, operates at fundamental 1064 nm or harmonics; the workhorse for most LIBS systems [9]. |
| Echelle Spectrometer | High-resolution, broad-spectrum analysis. | Enables simultaneous detection of multiple elements from UV to NIR [12]. |
| Intensified CCD (ICCD) Detector | Time-gated detection of plasma emission. | Allows for precise control of delay and gate times to reject early continuum background [12]. |
| NIST Atomic Spectra Database | Spectral line identification and transition probabilities. | Critical for both qualitative analysis and Calibration-Free LIBS calculations [15]. |
| Pure Element Samples | System performance verification and fundamental studies. | High-purity metals or salts used to identify characteristic emission lines. |
Laser-Induced Breakdown Spectroscopy (LIBS) is a rapid, laser-based analytical technique used for the elemental analysis of materials. A high-focused laser pulse is directed at the sample surface, creating a micro-plasma. The light emitted from this cooling plasma is collected and analyzed, revealing the sample's elemental composition based on the unique spectral "fingerprint" of each element [16] [17]. The LIBS market is demonstrating robust growth, fueled by increasing demand for rapid, prep-less elemental analysis across industrial and research sectors.
Table 1: Global LIBS Market Size and Growth Projections
| Report Metric | Values | Source/Notes |
|---|---|---|
| Market Value in 2024 | $2.8 billion | [18] |
| Projected Value in 2034 | $5.7 billion | [18] |
| Compound Annual Growth Rate (CAGR) | 7.4% (2024-2034) | [18] |
| Alternative 2023 Market Value | $2.5 billion | Projected to reach $3.8 billion by 2028 (CAGR of 8%) [19] |
| Key Driver | Demand for rapid material identification in industrial applications [18] |
It is important to note that while this article uses the provided title, the market size figures from current industry reports are significantly higher than the $500 million referenced. The market growth is primarily driven by the need for instantaneous elemental analysis in manufacturing and quality control processes [18].
Table 2: LIBS Market Segmentation and Characteristics (2024)
| Segment | Leading Sub-category | Market Share / Characteristic |
|---|---|---|
| By Product Type | Benchtop LIBS | 45% market share; preferred for laboratory precision [18] |
| By Application | Material Testing | 38% market share; e.g., metal analysis in aerospace [18] |
| By End-Use Industry | Metals & Mining | 32% market share; for process optimization [18] |
| Fastest-Growing Application | Environmental Monitoring | CAGR of 9.1% (2024-2034) [18] |
| Key Regional Market | Asia-Pacific | Highest growth potential due to rapid industrialization [18] |
Application Note: Material Analysis in Construction and Environmental Science
Protocol 1: Quantitative Analysis of Cement Content in Concrete
The following protocol is adapted from a study on the non-destructive analysis of cement content, a critical parameter for concrete's strength, durability, and permeability [20].
- 1. Sample Preparation: Minimal preparation is required. Ensure the concrete surface is clean and dry to prevent interference with the laser-sample interaction. The non-destructive nature of LIBS allows for direct measurement of structural components [20] [17].
- 2. Instrument Setup: Configure a spatially resolved LIBS system. The key parameters to control and optimize include spatial resolution, measurement area, and boundary effects to minimize discretization errors from rasterized surface measurements [20].
- 3. Data Acquisition: Fire a series of short-pulse laser beams (e.g., Nd:YAG 1064nm Laser) across the sample surface to create a chemical map. The resultant plasma light is collected via fiber optics and analyzed by a high-resolution spectrometer, such as an AvaSpec-ULS2048 or equivalent [20] [21].
- 4. Data Processing & Analysis: Employ multivariate analysis. Combine Principal Component Analysis (PCA) with density-based spectral clustering to achieve clear separation between the cement paste, aggregates, and void phases within the concrete [20].
- 5. Quantification: Under optimized conditions, this method has demonstrated an average relative error of approximately 8% for estimating cement content, an improvement over traditional, destructive methods [20].
Protocol 2: Detection of Heavy Metals and Additives in Environmental Microplastics
LIBS is effective for the direct analysis of pristine and environmentally aged microplastics, including the detection of heavy metals and additives that pose environmental risks [22].
- 1. Sample Presentation: Secure microplastic samples on a suitable substrate. No chemical preparation is needed, preserving the sample's original state [17].
- 2. LIBS Measurement: Direct the focused laser pulses onto the microplastic particles. The laser ablates a tiny amount of material (µg to ng), forming a plasma. The emitted light is collected for spectral analysis [21] [17].
- 3. Spectral Analysis - PCA Approach: Apply a PCA-based approach to the collected spectra. This statistical method helps identify and differentiate the spectral signatures of target elements (e.g., Chromium, Cadmium, Lead) and organic components (e.g., Chlorophyll a, biofilm) associated with environmental aging and pollution [22].
- 4. Interpretation: Identify the unique elemental emission lines in the spectrum to confirm the presence of specific heavy metals and additives within the microplastic matrix [17].
The Scientist's Toolkit: Essential Research Reagent Solutions
Table 3: Key Components of a LIBS Analytical System
| Item / Component | Function / Application Notes |
|---|---|
| Pulsed Laser (e.g., Nd:YAG) | The excitation source; produces short, high-power pulses to ablate the sample and generate plasma. Typical pulse durations are in the nanosecond range [21] [17]. |
| Spectrometer | Analyzes the light emitted by the plasma. Arrayed, high-resolution spectrometers (e.g., AvaSpec-ULS2048) are often used to capture a wide spectral range with high detail [21]. |
| Calibration Standards | Certified reference materials with known elemental compositions are essential for developing quantitative analysis methods and calibrating the instrument [21]. |
| Fiber Optics | A light collection system that transfers the emitted light from the plasma to the spectrometer entrance slit efficiently [16] [21]. |
| Chemometric Software | Advanced software for multivariate data analysis (e.g., PCA, clustering) is crucial for interpreting complex spectra, differentiating phases, and quantifying elements [20] [17]. |
Laser-Induced Breakdown Spectroscopy (LIBS) has emerged as a versatile analytical technique for rapid, multi-elemental analysis across diverse sectors. This laser-based technique uses a high-energy pulsed laser to generate a microplasma on the sample surface, and the characteristic emission spectra from this plasma are analyzed to determine elemental composition [8] [23]. The minimal sample preparation requirements, capability for stand-off analysis, and capacity to detect most elements in the periodic table make LIBS particularly valuable for applications ranging from environmental monitoring to defense security [23] [24]. This article details specific application protocols and experimental methodologies that demonstrate LIBS implementation across environmental, industrial, pharmaceutical, and defense sectors, providing researchers with practical frameworks for material analysis.
Environmental Monitoring
Application Note: Heavy Metal Contamination in Soil and Food Products
LIBS enables rapid, on-site detection of heavy metal contaminants in environmental and agricultural samples, providing significant advantages over traditional laboratory-based techniques that require extensive sample preparation and lengthy analysis times [25] [26]. The capability for in-situ monitoring allows for immediate assessment and remediation planning for contaminated sites.
Table 1: LIBS Detection of Heavy Metals in Environmental Samples
| Target Analyte | Sample Matrix | Detection Range | Key Spectral Lines | Limit of Detection |
|---|---|---|---|---|
| Cadmium (Cd) | Cocoa powder | 70-5000 ppm | Cd I: 340.36 nm, 361.05 nm | 0.08 μg/g (for 361.05 nm line) |
| Lead (Pb) | Soil | Varies by concentration | Pb I: 405.78 nm | Not specified |
| Arsenic (As) | Soil | Varies by concentration | As I: 278.02 nm | Not specified |
Protocol: Detection of Cadmium in Cocoa Powder
Objective: To quantify cadmium concentrations in commercial cocoa powder using LIBS [27].
Materials and Reagents:
- Cocoa powder (Pacari organic)
- Tetrahydrate cadmium nitrate (Cd(NO₃)₂·4H₂O), 98% purity
- Hydraulic press with stainless-steel die (15.5 mm diameter)
- Mortar and pestle for homogenization
- Hot plate for dehydration (150-300°C temperature range)
Experimental Procedure:
Sample Preparation:
- Dehydrate 4.5000 g of cadmium nitrate tetrahydrate by gradually increasing temperature from 150°C to 300°C to evaporate absorbed water.
- Homogenize the resulting 1.6095 g of cadmium salt using a mortar and pestle.
- Create a base mixture by combining 1.7500 g of cocoa powder with the dried salt, resulting in a cadmium concentration of 9197 ppm.
- Prepare dilution series by mixing the base mixture with additional cocoa powder to achieve concentrations ranging from 70-5000 ppm.
- Compress 1 g of each mixture into pellets using a hydraulic press (15.5 mm diameter, approximately 2.90 mm height after sanding).
Instrumental Parameters:
- Laser: Nd:YAG (1064 nm, 8 ns pulse width, 75 mJ/pulse)
- Gate delay: 3 μs
- Gate width: 10 μs
- Integration time: 1.05 ms
- Lens-to-sample distance: 82 mm
- Accumulation: 10 laser shots per point, 5 different positions per pellet
Data Analysis:
- Use Cd atomic emission lines at 340.36 nm and 361.05 nm for quantification.
- Apply background subtraction algorithm to minimize matrix effects.
- Construct calibration curves using known concentrations.
- Validate method with double-blind unknown samples.
Industrial Applications
Application Note: Metal Recycling and Material Sorting
LIBS technology plays a crucial role in industrial sorting processes, particularly in metal recycling, where it enables rapid identification and separation of copper and other valuable metals from mixed scrap [8]. This application addresses the looming global copper shortage by improving recycling efficiency and purity, with the International Energy Agency projecting that by 2030, global copper mines will meet only 80% of world requirements [8].
Table 2: Industrial LIBS Applications and Parameters
| Application | Key Elements Detected | Analysis Speed | Advantages |
|---|---|---|---|
| Copper Recycling | Cu, Pb, Sn, Zn, Al | Micro-seconds | Non-destructive, reduces energy costs |
| Alloy Verification | Varies by alloy composition | Real-time | Ensures product consistency, 30% faster throughput |
| Plastic Sorting | C, H, Cl, F | Seconds | Automates sorting, reduces contamination |
| Wood Modification | C, O, Mg | Minimal sample prep | Determines graphene oxide incorporation |
Protocol: Copper Extraction from Recycled Metal
Objective: To identify and sort high-purity copper from mixed metal scrap through LIBS analysis [8].
Materials:
- Mixed metal scrap samples
- Automated LIBS sorting system
- Robotic arm for material handling
- Conveyor belt system
Experimental Procedure:
Sample Presentation:
- Spread scrap metal pieces on conveyor belt ensuring minimal overlap.
- Maintain consistent distance between samples and laser source.
LIBS Analysis:
- Focus high-energy laser pulse on sample surface to generate plasma.
- Collect emitted light via optical system and spectrometer.
- Analyze spectral signatures to distinguish copper from other metals (aluminum, iron, zinc).
- Determine alloy compositions based on elemental ratios.
Sorting Mechanism:
- Implement automated sorting based on spectral fingerprints.
- Use robotic arms to separate high-purity copper from contaminated materials.
- Employ real-time monitoring of molten metal composition during smelting.
Key Parameters:
- Laser pulse energy: 9 mJ (for MarSCoDe duplicate instrument) [5]
- Wavelength ranges: 240-340 nm, 340-540 nm, 540-850 nm
- Pulse repetition rate: 1-3 Hz
- Detection distance: 1.6-7 m for standoff analysis
Pharmaceutical and Food Safety
Application Note: Cleaning-in-Place (CIP) Monitoring and Contaminant Detection
LIBS provides innovative solutions for pharmaceutical and food industries through in-line monitoring of manufacturing processes and rapid detection of contaminants [28]. The technique enables real-time verification of cleaning effectiveness in CIP systems and identification of hazardous substances in food products, significantly reducing analysis time from days to minutes [26].
Protocol: In-line Monitoring of Dairy Fouling
Objective: To monitor cleaning-in-place processes in dairy industry using LIBS for real-time detection of residual fouling [28].
Materials:
- Laboratory-scale CIP system
- Dairy fouling samples
- Aqueous solutions for cleaning
- Flow cell compatible with LIBS analysis
Experimental Procedure:
System Setup:
- Integrate LIBS probe into CIP system flow cell.
- Ensure proper alignment for consistent plasma generation.
- Calibrate system using standards with known fouling concentrations.
Data Collection:
- Perform LIBS analysis during cleaning cycles.
- Monitor characteristic elements of dairy fouling (calcium, magnesium, carbon).
- Collect spectra at predetermined time intervals throughout cleaning process.
Process Verification:
- Establish baseline signals for clean system.
- Determine threshold values for acceptable cleaning levels.
- Correlate spectral signatures with visual inspection and traditional microbial tests.
Defense and Security
Application Note: Explosive and Hazardous Material Detection
LIBS offers significant advantages for defense and security applications, particularly in the standoff detection of explosives and hazardous materials [24]. The technique allows non-contact analysis of potentially dangerous substances at safe distances, making it invaluable for border security, airport screening, and military operations.
Table 3: LIBS Detection of Explosive Materials
| Explosive Type | Key Identifying Elements | Detection Distance | Characteristic Features |
|---|---|---|---|
| RDX (Hexogen) | C, H, N, O | Standoff capability | High-energy explosive |
| HMX (Octogen) | C, H, N, O | Standoff capability | Higher stability than RDX |
| TNT | C, H, N, O, (NO₂ groups) | Standoff capability | Aromatic compound |
| Ammonium Nitrate | N, H, O | Standoff capability | Common explosive precursor |
Protocol: Standoff Detection of Explosive Residues
Objective: To identify and classify explosive residues at safe distances using standoff LIBS [24].
Materials:
- Q-switched Nd:YAG laser
- Beam expander and focusing optics
- Spectrometer with wide spectral range
- Robotic positioning system for precise targeting
Experimental Procedure:
System Configuration:
- Set up laser with beam expander for standoff detection.
- Align collection optics to maximize signal from distant samples.
- Calibrate wavelength using standard reference materials.
Sample Analysis:
- Position explosive samples at varying distances (1-10 m).
- Acquire LIBS spectra using appropriate laser energy for distance.
- Analyze spectral lines characteristic of explosive materials:
- Nitrogen lines (CN bands ~385 nm, 358 nm)
- Carbon line (C₂ Swan bands ~516 nm)
- Oxygen lines (777 nm, 844 nm)
- Specific elemental ratios
Data Interpretation:
- Apply chemometric algorithms for material classification.
- Use machine learning models to distinguish explosives from interferents.
- Correlate spectral signatures with known explosive fingerprints.
The Scientist's Toolkit: Essential Research Reagents and Materials
Table 4: Key Research Reagent Solutions for LIBS Applications
| Material/Reagent | Function | Application Sectors |
|---|---|---|
| Certified Reference Materials (GBW series) | Calibration and validation | Environmental, Industrial |
| Tetrahydrate Cadmium Nitrate | Contaminant spiking | Environmental, Food Safety |
| Graphene Oxide Dispersion | Wood modification agent | Industrial, Materials |
| Explosive Standards (RDX, TNT, etc.) | Method development | Defense, Security |
| Hydraulic Press with Die | Pellet preparation | Multiple sectors |
| Nd:YAG Laser (1064 nm) | Plasma generation | Universal |
| Czerny-Turner Spectrometer | Spectral resolution | Universal |
Advanced Technical Considerations
Addressing Matrix Effects and Quantitative Precision
While LIBS offers numerous advantages, challenges remain in quantitative precision due to matrix effects where the sample's physical and chemical properties influence plasma formation and spectral accuracy [8]. Recent advances incorporate machine learning algorithms to mitigate these effects, particularly in complex matrices like organic materials and food products [27].
Distance Effect Compensation
In practical applications with varying detection distances, such as planetary exploration or standoff explosive detection, the LIBS distance effect causes spectral profile discrepancies [5]. Advanced approaches now employ deep convolutional neural networks (CNN) to directly process multi-distance spectra, with recent models achieving 92.06% classification accuracy without conventional distance correction [5].
Ambient Gas Optimization
Recent research reveals how ambient gas properties (specific heat ratio, molar mass, and ionization energy) significantly impact LIBS signal quality [29]. Controlling these parameters enhances signal stability and repeatability, with higher sound speed in the ambient gas leading to more stable plasma behavior and improved analytical performance [29].
Laser-Induced Breakdown Spectroscopy has evolved into a mature analytical technique with demonstrated applications across environmental, industrial, pharmaceutical, and defense sectors. The protocols outlined in this article provide researchers with practical frameworks for implementing LIBS across these diverse fields. As the technology continues to advance through integration with machine learning, improved instrumentation, and better understanding of fundamental processes, LIBS is poised to expand further into real-time monitoring applications where rapid, elemental analysis is critical. The ongoing development of portable, user-friendly systems will continue to broaden LIBS adoption across these sectors, particularly for field-based analysis and quality control applications.
Laser-Induced Breakdown Spectroscopy (LIBS) has emerged as a powerful analytical technique that addresses critical limitations of traditional elemental analysis methods. For researchers and drug development professionals, the technique's core advantages—exceptional speed, minimal sample preparation, and remarkable portability—enable new possibilities for rapid material characterization and quality control. This application note details how these intrinsic benefits of LIBS technology create paradigm shifts in analytical workflows across pharmaceutical, geological, and industrial settings, providing specific experimental protocols and technical data to guide implementation.
Comparative Advantages of LIBS
Quantitative Comparison of LIBS vs. Traditional Techniques
The following table summarizes key performance metrics where LIBS demonstrates significant advantages over conventional analytical methods.
Table 1: Performance comparison of LIBS versus traditional analytical techniques
| Analytical Parameter | LIBS | Traditional Laboratory Techniques (ICP-MS, XRF, SEM) | Reference |
|---|---|---|---|
| Analysis Time | Seconds to minutes for direct analysis [30] | Days to months for laboratory results [14] | |
| Sample Preparation | Minimal to none; direct analysis of solids, liquids, gases [31] [32] | Extensive preparation often required (digestion, dilution, pelletization) [33] [9] | |
| Portability | Handheld devices to photocopier-sized field instruments [14] | Primarily laboratory-bound systems [14] | |
| Elemental Coverage | All elements, including light elements (H, Li, Be, B, C, N, O) [30] [21] | Limited for light elements (e.g., XRF cannot detect Li) [14] [34] | |
| Sample Throughput | High; rapid screening of multiple samples [30] | Low; limited by sample preparation and instrument time [14] | |
| Destructiveness | Minimally destructive (ng-µg ablated) [30] [35] | Often fully destructive (sample digestion) or requiring sectioning [9] | |
| Operational Cost | Lower running costs; no consumables [31] | High costs for gases, reagents, and laboratory infrastructure [9] |
Key Technical Advantages Explained
- Speed: LIBS produces immediate results by eliminating lengthy sample preparation and laboratory analysis delays. Traditional drill core analysis can require 2-3 months for assay results, while LIBS provides instant field analysis for rapid decision-making [14]. Single-spot analysis can be completed within seconds [30].
- Minimal Sample Preparation: Unlike techniques requiring complex digestion, dilution, or pelletization, LIBS analyzes materials in their native state. This "no-prep" advantage eliminates preparation artifacts and significantly reduces labor and time [31] [32] [21].
- Portability: LIBS systems range from handheld devices to portable field instruments, enabling in-situ analysis in mining operations, pharmaceutical manufacturing facilities, or environmental field sites [14] [32]. This eliminates the need for sample transport and preserves sample integrity.
Experimental Protocols
Protocol 1: Pharmaceutical Tablet Homogeneity Analysis
Application: Determining active pharmaceutical ingredient (API) distribution and detecting contaminants in solid dosage forms.
Workflow Overview:
Materials & Equipment:
- LIBS spectrometer system (Nd:YAG laser, 1064 nm) [35]
- High-resolution spectrometer (190-900 nm range) [30]
- Precision XYZ translation stage
- Pharmaceutical tablets (test and reference standards)
- Specline software or equivalent multivariate analysis package [30]
Procedure:
- Sample Mounting: Place intact tablet on LIBS sample stage without any cutting, polishing, or preparation. Ensure stable positioning to prevent movement during analysis [35].
- Instrument Parameters:
- Spatial Mapping:
- Program XYZ stage to create measurement grid across tablet surface
- Set measurement density to 5-20 points per mm² depending on required resolution
- Use 5-10 laser pulses per measurement point to ensure statistical significance [35]
- Data Acquisition:
- Collect spectra at each grid point
- Include reference standards for quality control
- Monitor plasma emission stability throughout acquisition
- Data Analysis:
Key Advantages Demonstrated:
- Speed: Complete mapping in minutes versus hours/days with traditional techniques
- Minimal Preparation: Direct tablet analysis without sectioning or coating
- Versatility: Applicable to various tablet formulations and excipients
Protocol 2: Field-Based Geological Sample Screening
Application: Rapid elemental mapping of drill cores for mineral exploration and resource assessment.
Workflow Overview:
Materials & Equipment:
- Portable or handheld LIBS analyzer [14] [32]
- Geological reference standards
- Compact air puffer for surface cleaning
- Field laptop with spectral analysis software
- Machine learning algorithms for mineral classification [33]
Procedure:
- Sample Preparation:
- Clean drill core surface with air puffer to remove dust and debris
- No cutting, polishing, or crushing required
- Select analysis points along core length at 10-50 cm intervals [14]
- Field Calibration:
- Analyze certified reference materials matching expected geology
- Verify instrument performance with quality control standards
- Update chemometric models based on local geological conditions [33]
- Data Collection:
- Real-Time Analysis:
- Compare spectra to mineral spectral libraries
- Apply random forest or SVM algorithms for mineral classification [33]
- Generate immediate elemental composition maps
- Data Interpretation:
- Identify mineral assemblages based on elemental correlations
- Map mineral zoning and alteration patterns
- Make real-time decisions on drilling direction and sample selection for laboratory analysis [14]
Key Advantages Demonstrated:
- Portability: Field-based analysis eliminates need for sample transport
- Speed: Immediate results versus 2-3 months for laboratory assays [14]
- Minimal Preparation: Direct analysis of drill cores without cutting or polishing
Essential Research Reagent Solutions
Table 2: Key components for a LIBS analytical system
| Component | Specifications | Function in LIBS Analysis |
|---|---|---|
| Pulsed Laser | Nd:YAG (1064 nm), 5-50 Hz, 5-100 mJ/pulse, 5-10 ns pulse width | Generates plasma through sample ablation; high pulse energy enables better signal-to-noise ratio [31] [9] |
| Spectrometer | Czerny-Turner or Echelle design, 190-900 nm range, resolution 0.05-0.3 nm | Disperses plasma light into constituent wavelengths for elemental identification [30] [32] |
| Detector | ICCD, CCD, or CMOS arrays; gateable for time-resolved detection | Captures time-resolved emission spectra; gating reduces background continuum radiation [32] [9] |
| Optical Fiber | UV-VIS-NIR compatible, 200-2500 nm range, low OH content | Transmits plasma light from sample to spectrometer; enables flexible system configurations [30] |
| Translation Stage | XYZ precision control, µm resolution, programmable patterns | Enables automated mapping and depth profiling through successive laser pulses [30] [35] |
| Reference Standards | Certified elemental/geological/pharmaceutical standards | Enables quantitative calibration and method validation for specific sample matrices [33] |
| Chemometrics Software | PCA, PLS, random forest, support vector machine algorithms | Processes complex spectral data; enables classification and quantification of elements [31] [33] |
The synergistic combination of speed, minimal preparation, and portability establishes LIBS as a transformative analytical technology for research and industrial applications. For pharmaceutical professionals, it enables rapid formulation development and quality assurance through direct tablet analysis. For geoscientists, it provides real-time field decision support through instantaneous elemental mapping. These protocols demonstrate how LIBS addresses critical bottlenecks in traditional analytical workflows, potentially reducing analysis times from months to minutes while providing comprehensive elemental data that surpasses many conventional techniques. As LIBS technology continues to evolve with improvements in laser miniaturization, spectrometer design, and machine learning algorithms, its adoption as a primary analytical technique is expected to expand across diverse scientific disciplines.
LIBS in Action: Methodological Strategies for Diverse Sample Matrices
Sample Preparation Protocols for Solids, Liquids, and Biological Matrices
Laser-Induced Breakdown Spectroscopy (LIBS) has gained widespread adoption for material analysis due to its rapid, multi-element analysis capability, minimal sample preparation requirements, and suitability for in-situ measurements [36] [31]. However, the analytical performance of LIBS—including its accuracy, repeatability, and reproducibility—can be significantly enhanced through tailored sample preparation protocols [36]. Such protocols mitigate inherent challenges such as matrix effects and poor sensitivity, particularly for liquid and biological specimens [36] [37]. This document establishes standardized sample preparation methodologies for solid, liquid, and biological matrices within LIBS-based research, providing detailed protocols to improve data quality and ensure result comparability across studies. By implementing these procedures, researchers can expand LIBS applications into trace element analysis and complex sample types while maintaining the technique's inherent advantages of speed and flexibility [38].
Sample Preparation for Solid Matrices
Solid samples represent the most straightforward application for LIBS, though preparation remains critical for achieving quantitative results. The fundamental goal for solid sample preparation is to create a homogeneous, flat surface to improve laser coupling and plasma stability [36]. Direct analysis of manufactured solids like metals, glasses, and polymers is often possible with minimal preparation, whereas powdered specimens like soils, sediments, and manufactured pellets require more extensive processing [36].
Protocol for Powdered Solids: Sediment and Soil Analysis
This protocol is adapted from methods used for river sediment analysis, which successfully compensates for variable texture and granulometry [39].
- Materials Required: Freeze dryer, mechanical grinder (e.g., agate mortar and pestle or ball mill), 100-mesh sieve (150 µm), hydraulic press, pellet die set.
- Procedure:
- Drying: Place the collected sample in a freeze dryer until completely desiccated to preserve volatile components.
- Grinding: Use the mechanical grinder to pulverize the sample to a fine powder. The goal is to reduce particle size for enhanced homogeneity.
- Sieving: Pass the powdered material through the 100-mesh sieve to ensure uniform particle size distribution. This step is critical for reducing heterogeneity-induced matrix effects.
- Pelletization: Transfer a representative portion (e.g., 500 mg) of the sieved powder into a pellet die. Compact the powder using a hydraulic press at a defined pressure (e.g., 5 tons) for a specific duration (e.g., 1 minute) to form a rigid pellet [39].
- Optimization Notes: The pressure applied during pelletization should be optimized based on the sample material. Higher pressures generally produce more cohesive pellets but can vary with the organic/inorganic content of the sample. The use of binding agents should be avoided if possible, as they can dilute the analyte and introduce contaminants [36].
Protocol for Metallic Alloys: Surface Preparation
Metallic alloys, such as lead-free solders, are often suitable for direct LIBS analysis but require surface treatment to ensure reproducibility [36] [40].
- Materials Required: Sequential grit silicon carbide paper (e.g., 120, 400, 800 grit), polishing cloth, alumina or diamond suspension polish, ultrasonic cleaner, solvent (e.g., ethanol or acetone).
- Procedure:
- Sectioning: If necessary, cut the sample to a suitable size for analysis using a precision saw.
- Grinding: Progressively grind the analysis surface with silicon carbide paper, moving from coarser to finer grits, to remove large imperfections and create a uniform surface plane.
- Polishing: Use a polishing cloth with progressively finer abrasive suspensions (e.g., 1.0 µm and 0.3 µm alumina) to create a mirror-finish, scratch-free surface.
- Cleaning: Place the polished sample in an ultrasonic cleaner filled with a suitable solvent (e.g., ethanol or acetone) for 5-10 minutes to remove any embedded abrasive particles or contaminants. Air-dry completely before analysis [40].
Table 1: Summary of Solid Sample Preparation Protocols
| Sample Type | Key Preparation Steps | Primary Objective | Critical Parameters |
|---|---|---|---|
| Powders (Soils, Sediments) | Freeze-drying, Grinding, Sieving, Pelletization | Homogeneity & Stability | Particle size (<150 µm), Pressing pressure (e.g., 5 tons) [39] |
| Metallic Alloys | Grinding, Polishing, Ultrasonic Cleaning | Surface Uniformity | Surface roughness, Cleanliness [36] [40] |
| Pressed Powders with Binder | Mixing with binder, Pressing | Cohesion for fragile materials | Binder-to-sample ratio, Homogeneity of mixture [36] |
Sample Preparation for Liquid Matrices
Direct LIBS analysis of liquids is challenging due to surface ripples, splashing, shorter plasma lifetime, and suppressed plasma formation, leading to poor repeatability and sensitivity [36] [38]. Consequently, liquid-to-solid conversion is the most common strategy, often coupled with pre-concentration techniques to improve limits of detection (LODs) for trace elements [36] [38].
Protocol: Liquid-to-Solid Conversion via Substrate Absorption
This method is simple and effective for aqueous samples, converting the liquid into a solid residue for analysis [36].
- Materials Required: Filter paper or other porous substrate (e.g., wood slice, cellulose membrane), hot plate or oven, micropipettes.
- Procedure:
- Substrate Preparation: Cut the substrate to a size suitable for the LIBS sample holder.
- Sample Deposition: Using a micropipette, deposit a precise, small volume (e.g., 10–50 µL) of the liquid sample onto the center of the substrate, allowing it to absorb and spread evenly.
- Drying: Place the substrate on a hot plate or in an oven at a mild temperature (e.g., 60–80 °C) until the liquid is completely evaporated and a solid residue remains. Avoid excessive temperatures that may cause volatile analyte loss.
- Analysis: The dried substrate with the concentrated residue is then directly analyzed by LIBS.
Protocol: Dispersive Liquid-Liquid Microextraction (DLLME)
DLLME is a powerful pre-concentration technique that can lower LODs to the parts-per-billion (ppb) level, making LIBS suitable for trace metal analysis in liquids [41] [38].
- Materials Required: Micropipettes, centrifuge tubes, centrifuge, extraction solvent (e.g., carbon tetrachloride, chloroform), disperser solvent (e.g., acetone, methanol).
- Procedure:
- Extraction: In a centrifuge tube, mix the aqueous sample (e.g., 5 mL) with a mixture of the disperser solvent (e.g., 1 mL) and the extraction solvent (e.g., 50 µL). The disperser solvent facilitates the formation of fine droplets of the extraction solvent throughout the aqueous sample, creating a large surface area for analyte transfer.
- Phase Separation: Centrifuge the mixture for a short period (e.g., 5 minutes) to separate the phases. The dense extraction solvent, now enriched with the target analytes, will form a sedimented droplet at the bottom of the tube.
- Collection: Carefully retrieve the enriched organic droplet (e.g., 10–20 µL) using a micro-syringe.
- Analysis Preparation: Deposit the extracted droplet onto a flat, inert substrate (e.g., a silicon wafer or filter paper) and allow it to dry before LIBS analysis [38].
Table 2: Summary of Liquid Sample Preparation and Microextraction Methods
| Method | Procedure Overview | Typical Enrichment Factor | Key Advantage | Reported LOD |
|---|---|---|---|---|
| Direct Liquid Analysis | Analysis of bulk liquid, surface, or jet | 1x | Speed, simplicity | High ppm - Low ppm [38] |
| Liquid-to-Solid Conversion | Absorption on substrate followed by drying | 10-100x | Experimental simplicity | ppm - High ppb [36] |
| Dispersive Liquid-Liquid Microextraction (DLLME) | Liquid-liquid extraction with a dispersive solvent | 100-500x | High enrichment, low solvent volume | ppb level [38] |
| Thin-Film Microextraction (TFME) | Extraction on a sorbent-coated film | 50-200x | Ease of automation, no centrifugation | ppb level [38] |
Sample Preparation for Biological Matrices
Biological matrices are highly complex and heterogeneous, ranging from soft tissues and plants to biofluids. Preparation aims to remove interfering organic compounds, homogenize the sample, and present it in a form compatible with LIBS ablation [36] [37]. Key challenges include high water content, the presence of salts and phospholipids, and low concentration of target analytes [37].
Protocol for Soft Tissues and Plant Materials
This protocol is essential for analyzing animal tissues, plant leaves, and similar soft biological materials.
- Materials Required: Cryostat or freeze dryer, mechanical homogenizer or ball mill, pellet die, hydraulic press.
- Procedure:
- Stabilization: Rapidly freeze the sample using liquid nitrogen to preserve its native state and halt metabolic processes.
- Homogenization: Grind the frozen sample into a fine, homogeneous powder using a cryostatic mill (e.g., cryostat) or a mechanical homogenizer. Liquid nitrogen should be used during grinding to prevent thawing.
- Pelletization: Transfer the homogenized powder into a pellet die and press into a pellet using a hydraulic press. The pressure must be optimized to create a cohesive pellet without inducing chemical changes (e.g., 5-10 tons for 1-2 minutes) [36].
- Alternative Approach: For harder biological materials like bones or teeth, direct analysis on a polished cross-section may be feasible [36].
Protocol for Biofluids (e.g., Blood, Serum, Urine)
Biofluids often require pre-concentration and matrix simplification due to their complex composition and low analyte levels [37].
- Materials Required: Centrifuge, micropipettes, solid-phase extraction (SPE) cartridges or thin-film microextraction (TFME) devices, appropriate elution solvents.
- Procedure (Solid-Phase Microextraction - SPME):
- Deproteinization (Optional): Centrifuge the biofluid sample to remove precipitated proteins or other particulates.
- Extraction: Pass the clarified biofluid through a conditioned SPE cartridge or immerse a TFME device. The sorbent selectively retains the target analytes.
- Washing & Elution: Wash the sorbent with a mild solvent to remove weakly adsorbed interferents. Elute the captured analytes with a small volume of a stronger solvent.
- Analysis Preparation: Deposit the eluent onto a substrate and evaporate to dryness, leaving a solid residue for LIBS analysis. Alternatively, for TFME, the thin film with the adsorbed analytes can be analyzed directly after a brief drying step [38].
Table 3: Preparation Methods for Biological Matrices in LIBS
| Biological Matrix | Key Challenges | Recommended Preparation Methods |
|---|---|---|
| Soft Tissues & Plants | High water content, heterogeneity | Freezing, Cryo-homogenization, Pelletization [36] |
| Biofluids (Blood, Urine) | Complex matrix, low analyte concentration, salts | Deproteinization, Microextraction (SPME, TFME) [37] [38] |
| Hair & Nails | Toughness, external contamination | Washing with solvent, Cutting, Pressing into pellets [37] |
| Bones & Teeth | Hardness, heterogeneity | Embedding in resin, Sectioning, Polishing [36] |
The Scientist's Toolkit: Essential Reagents and Materials
Table 4: Key Research Reagent Solutions for LIBS Sample Preparation
| Item Name | Function/Application | Examples & Notes |
|---|---|---|
| Hydraulic Press & Pellet Die | Compressing powdered samples into solid pellets for robust and repeatable analysis. | Used for soils, sediments, plant materials, and synthetic powders. Pressures typically 5-15 tons [36] [39]. |
| Freeze Dryer (Lyophilizer) | Gently removing water from heat-sensitive samples without altering structure or causing loss of volatile elements. | Critical for biological tissues and wet sediments prior to grinding and pelletizing [39]. |
| Binding Agents | Providing cohesion for powders that do not form stable pellets on their own. | Use sparingly to avoid analyte dilution. Examples include powdered cellulose, boric acid, or Ag powder [36]. |
| Microextraction Kits | Pre-concentrating trace analytes from liquid and biological samples to improve detection limits. | Includes materials for DLLME (extraction solvents) and SPME/TFME (sorbent-coated fibers or films) [41] [38]. |
| Polishing Supplies | Creating a flat, uniform surface on bulk solid samples to minimize plasma variability. | Sequential grit papers (SiC), polishing cloths, and alumina/diamond suspensions (0.3-1.0 µm) [40]. |
| Reference Materials | Calibrating the LIBS system and validating sample preparation methods. | Certified Reference Materials (CRMs) with a matrix matching the sample type (e.g., NIST standards) [40]. |
Matrix effects constitute a significant challenge in quantitative laser-induced breakdown spectroscopy (LIBS), referring to the influence of a sample's overall physical and chemical properties on the emission intensity of target analytes [42] [43]. These effects manifest as variations in signal intensity even when the concentration of the target element remains constant, primarily due to differences in thermal conductivity, heat capacity, absorption coefficient, and material density across sample types [43]. In the analysis of complex samples ranging from biological substances like cocoa to environmental contaminants like microplastics, matrix effects can severely compromise analytical accuracy, precision, and the reliability of quantitative results, thereby limiting LIBS deployment in high-precision applications [42] [43].
This application note provides a comprehensive framework of protocols and methodologies for overcoming matrix effects in LIBS analysis of complex samples. By integrating morphological calibration, advanced computational models, and robust instrumentation design, researchers can achieve significantly improved quantitative performance across diverse sample matrices.
Key Challenges and Fundamental Principles
The matrix effect in LIBS arises from the complex interplay between laser energy, sample properties, and plasma characteristics [42]. Physical matrix effects stem from variations in sample properties such as thermal conductivity and absorption coefficient, which influence the laser-sample interaction process, affecting the amount of material ablated and the energy transferred to the plasma [43]. Chemical matrix effects relate to chemical interactions within the sample, such as the formation of stable compounds or differences in ionization potentials, which alter the excitation and emission behavior of analytes [43].
The Impact of Matrix Effects on Quantitative Analysis
Matrix effects introduce significant limitations for LIBS quantification:
- Signal Instability: Pulse-to-pulse variation in plasma properties caused by laser shot repeatability issues [42]
- Reduced Reproducibility: LIBS spectra obtained on different instruments using the same experimental parameters are not necessarily identical [42]
- Calibration Challenges: The need for matrix-matched standards for quantitative analysis [42]
Protocols for Matrix Effect Mitigation
Protocol 1: Morphology-Based Calibration for Heterogeneous Samples
This protocol utilizes three-dimensional ablation morphology to correct for matrix effects in solid samples, particularly effective for heterogeneous materials like ceramics, alloys, and pressed pellets.
Table 1: Key Parameters for Morphology-Based Calibration Protocol
| Parameter | Specification | Function |
|---|---|---|
| Imaging System | Industrial CCD camera with microscope | High-precision 3D reconstruction of ablation craters |
| Calibration Target | Customized microscale calibration target | Accurate calibration of intrinsic and extrinsic camera parameters |
| Reconstruction Model | Pinhole imaging model with pixel matching | Generation of high-precision disparity maps |
| Analysis Parameters | Ablation volume, crater depth, radius | Quantification of laser-sample interaction efficiency |
| Multivariate Regression | Nonlinear calibration model | Correlation of morphology with plasma characteristics |
Step-by-Step Procedure:
Sample Preparation:
- For powder samples, mix with binder (if necessary) and press into pellets using hydraulic press
- Apply pressure gradient (e.g., 40-110 MPa) to achieve uniform density [43]
- Verify surface homogeneity using microscopic examination
System Calibration:
- Implement customized microscale calibration target
- Calibrate intrinsic (focal length, principal point) and extrinsic (position, orientation) camera parameters
- Optimize imaging parameters: baseline distance, focal length, and depth of field [43]
LIBS Analysis & Morphological Characterization:
- Perform laser ablation using optimized parameters (energy, wavelength, pulse duration)
- Capture ablation crater images using CCD-microscope system
- Reconstruct 3D morphology using depth-from-focus imaging
- Precisely calculate ablation volumes from crater geometry [43]
Data Integration & Model Application:
- Correlate ablation volume with plasma emission characteristics
- Apply multivariate regression to quantify relationships between morphology and matrix effects
- Implement nonlinear calibration model to compensate for matrix effects
- Validate model performance using reference standards [43]
Protocol 2: Laser Profile & Interface Roughness (LPIR) Model for Layered Materials
This protocol addresses matrix effects in depth profiling of multilayer materials through a two-dimensional numerical model that accounts for laser energy distribution and interface characteristics.
Table 2: LPIR Model Parameters for Depth Profiling
| Parameter | Specification | Function |
|---|---|---|
| Laser Source | Q-switched Nd:YAG laser (1064 nm) | Sample ablation and plasma generation |
| Pulse Characteristics | 5 ns pulse width, 10 Hz repetition rate | Controlled energy deposition |
| Laser Fluence | Variable (e.g., 5-20 J/cm²) | Optimization for different layer properties |
| Beam Profiling | Gaussian to top-hat beam shaping | Improved ablation crater uniformity |
| Interface Characterization | Surface roughness measurements | Quantification of mixing regions |
Step-by-Step Procedure:
Sample Characterization:
- Measure interface roughness using profilometry or AFM
- Characterize layer thickness using cross-sectional microscopy
- Document material properties for each layer (composition, density)
Laser Parameter Optimization:
LIBS Depth Profiling:
- Perform multi-pulse ablation at fixed position
- Collect spectra at each depth increment
- Monitor specific elemental lines for layer identification
- Record plasma characteristics (temperature, electron density)
LPIR Model Implementation:
- Input laser profile characteristics and interface roughness data
- Reconstruct depth profiles using two-dimensional numerical model
- Identify interfaces using model-based localization method
- Calculate layer thickness with improved accuracy [44]
Protocol 3: Chemometric Compensation for Complex Matrices
This protocol employs advanced statistical and machine learning approaches to compensate for matrix effects without requiring extensive physical modeling.
Step-by-Step Procedure:
Standard Preparation:
- Develop comprehensive set of standards covering expected matrix variations
- Include internal reference elements where appropriate
- Ensure standards match sample physical form (solid, powder, pellet)
Spectral Acquisition:
- Acquire LIBS spectra under standardized conditions
- Collect sufficient replicates (typically 30-50 spectra) for robust model building
- Maintain consistent experimental parameters across all measurements
Data Preprocessing:
- Apply spectral normalization (e.g., total intensity, internal standard)
- Implement background correction and peak alignment
- Extract relevant spectral features (peak intensities, ratios, continuum)
Model Development:
- Utilize principal component analysis (PCA) for data structure exploration [20]
- Apply multivariate calibration methods (PLSR, PCR) for quantification
- Implement machine learning algorithms (neural networks, random forests) for complex matrices
- Validate models using cross-validation and independent test sets
Research Reagent Solutions
Table 3: Essential Research Reagents and Materials for LIBS Analysis of Complex Samples
| Reagent/Material | Function | Application Examples |
|---|---|---|
| WC-Co Alloy Standards | Matrix-matched calibration | Trace element analysis in hard metals [43] |
| Polymer Reference Materials | Microplastic identification | FTIR validation of polymer types [45] |
| Certified Soil Standards | Environmental analysis | Heavy metal detection in complex matrices |
| Pressable Binders | Pellet preparation | Powder sample stabilization for analysis |
| Ultrapure Water | Sample cleaning | Microplastic preparation and processing [45] |
| Hydrogen Peroxide (H₂O₂) | Organic matter digestion | Environmental sample preparation [45] |
| Sodium Chloride (NaCl) | Density separation | Microplastic extraction from sediments [45] |
Workflow Visualization
Figure 1: Comprehensive workflow for matrix effect mitigation in LIBS analysis, integrating sample preparation, spectral acquisition, data processing, and model application stages.
Performance Metrics and Validation
Quantitative Assessment of Method Performance
Table 4: Performance Comparison of Matrix Effect Mitigation Strategies
| Method | Sample Type | Key Parameters | Performance Metrics | Limitations |
|---|---|---|---|---|
| Morphological Calibration | WC-Co alloys, pressed pellets | Ablation volume, crater geometry | R² = 0.987, RMSE = 0.1 [43] | Requires specialized imaging |
| LPIR Model | Ni-Cu multilayers | Laser profile, interface roughness | Improved interface identification [44] | Complex model implementation |
| Chemometric Compensation | Various matrices | Spectral features, multivariate analysis | Reduced matrix dependence [20] | Extensive calibration dataset needed |
| Dual-Laser System | Specialty applications | Primary ablation, secondary excitation | Enhanced signal repeatability [42] | Increased system complexity |
Matrix effects remain a significant challenge in LIBS analysis of complex samples, but the integration of morphological data, advanced modeling, and chemometric approaches provides powerful mitigation strategies. The protocols outlined in this application note demonstrate that through careful system characterization and appropriate data processing, researchers can achieve substantial improvements in quantitative performance across diverse sample types, from biological materials to environmental contaminants and advanced alloys. As LIBS technology continues to evolve, with advancements in instrument miniaturization, laser technology, and data processing algorithms, the capacity to overcome matrix effects will further expand, enabling new applications in field analysis and industrial process control.
Elemental impurities in pharmaceutical products pose significant risks to patient safety due to their toxicity, making rigorous impurity analysis and raw material verification critical components of pharmaceutical development and manufacturing [46]. Regulatory frameworks, notably the International Council for Harmonisation (ICH) Q3D guideline, have established a risk-based approach for controlling elemental impurities, classifying them based on their toxicity and likelihood of occurrence [47] [46].
Laser-Induced Breakdown Spectroscopy (LIBS) is emerging as a powerful analytical technique for elemental analysis within pharmaceutical research. This application note details how LIBS methodologies align with modern quality paradigms like Quality by Design (QbD) and can be applied to meet regulatory requirements for elemental impurity testing and raw material identification [48] [49].
Regulatory Framework: ICH Q3D and Elemental Impurities
The ICH Q3D guideline provides a structured framework for risk assessment and control of elemental impurities, categorizing them into three classes:
- Class 1: Elements of significant safety concern (As, Cd, Hg, Pb) requiring strict control.
- Class 2: Elements to be limited based on route of administration (e.g., V, Ni, Cu, Mn).
- Class 3: Elements of lower toxicity risk (e.g., K, Na, Ca) but requiring control at high levels.
ICH Q3D outlines two primary approaches for control:
- The Component Approach (Option 2b): A risk-based assessment predicting impurity levels in the final product by compiling data on each component (API, excipients), packaging, and manufacturing equipment [46].
- The Finished Product Approach (Option 3): Direct analytical testing of the final drug product to quantify elemental impurities, typically using techniques like ICP-MS [46].
Recent studies demonstrate that when comprehensive supplier data is available, the Component Approach effectively confirms product safety, with results showing elemental impurity levels significantly below the 30% threshold of the Permitted Daily Exposure (PDE) [46]. This validates its utility as an efficient compliance strategy.
LIBS Fundamentals and Advantages for Pharmaceutical Analysis
Laser-Induced Breakdown Spectroscopy (LIBS) is an atomic emission spectroscopy technique where a focused, high-power pulsed laser ablates a micro-volume of sample material, creating a transient plasma. As the plasma cools, excited atoms and ions emit characteristic wavelengths of light, which are collected and analyzed to determine the sample's elemental composition [48] [50].
Key Advantages of LIBS in Pharmaceutical Settings:
- Minimal to No Sample Preparation: Analyzes solids, liquids, and gases directly in their native state, drastically reducing analysis time [48] [26].
- Rapid and High-Throughput Analysis: Provides results in seconds, enabling real-time decision-making and suitable for at-line or in-line Process Analytical Technology (PAT) applications [48] [26].
- Simultaneous Multi-Element Detection: Capable of detecting both organic elements (C, H, N, O) and inorganic elements in a single measurement [48].
- Spatial Resolution: The laser focus allows for micro-analysis and mapping of elemental distribution within a sample, such as a tablet [51].
Application Note 1: LIBS for Raw Material Verification
The verification of raw materials, including Active Pharmaceutical Ingredients (APIs) and excipients, is a critical first step in ensuring drug product quality. LIBS serves as a powerful tool for the rapid identity confirmation of incoming materials.
Experimental Protocol: Raw Material Identification
Objective: To verify the identity of an incoming pharmaceutical powder (e.g., an API or excipient) by comparing its LIBS spectrum to a validated reference spectrum.
Materials and Equipment:
- LIBS spectrometer equipped with a Nd:YAG laser (typically 1064 nm, nanosecond pulse duration, pulse energy ~0.15 to 100 mJ) [52] [50].
- Spectrometer with broad spectral range (e.g., 200-1000 nm) and fast trigger response [50].
- Powder press for forming consistent pellets (if applicable).
- High-purity inert gas purge (e.g., Nitrogen or Argon) to enhance signal-to-noise ratio by suppressing atmospheric oxygen and nitrogen interferences [52].
Method:
- Sample Preparation: For powders, use a hydraulic press to form a compact pellet. Minimal preparation is required; the sample should simply be presented in a consistent physical form. Analysis can also be performed on intact tablets [48].
- Instrument Calibration: Ensure the LIBS instrument is calibrated for wavelength and verified for performance using a standard reference material.
- Spectral Acquisition:
- Place the sample in the analysis chamber.
- Focus the laser pulse onto a fresh spot on the sample surface.
- Acquire LIBS spectra by accumulating emissions from multiple laser pulses (e.g., 10 pulses per spot) to improve signal-to-noise ratio. Use a short delay (e.g., 0.5 µs) and integration time (e.g., 1 µs) to capture the plasma emission [48].
- Repeat acquisition from 5-10 different spots on the sample to account for heterogeneity.
- Data Analysis:
- Identification Method: Use chemometric classification algorithms, such as Soft Independent Modeling of Class Analogy (SIMCA), to compare the unknown sample's spectrum against a spectral library of known materials. The sample is accepted if it fits the model for the correct reference material [48] [50].
Data and Results
LIBS successfully discriminates between different pharmaceutical materials based on their unique elemental "fingerprint," even when the materials are chemically similar. This fingerprint includes both intentional constituents and trace inorganic impurities.
Table 1: Exemplary LIBS Results for Discrimination of Pharmaceutical Tablets [48]
| Sample Name | Primary Component | Key Elements Detected by LIBS | Classification Result |
|---|---|---|---|
| Brufen | Ibuprofen (C₁₃H₁₈O₂) | C, H, O, N, Fe, Mn | Correctly identified |
| Paracetamol | Paracetamol (C₈H₉NO₂) | C, H, O, N, Ca | Correctly identified |
| Vitamin C | Ascorbic Acid (C₆H₈O₆) | C, H, O, Na | Correctly identified |
Application Note 2: Quantitative Analysis of Elemental Impurities
LIBS can be used for the quantitative determination of elemental impurities in accordance with ICH Q3D Option 3 (finished product testing), particularly during development or for screening purposes.
Experimental Protocol: Quantification of Impurities in a Tablet
Objective: To determine the concentration of a specific elemental impurity (e.g., a catalyst residue like Palladium) in a finished drug product.
Materials and Equipment:
- Same as in Protocol 4.1.
- Certified reference materials (CRMs) or synthetic standards with known concentrations of the target element in a similar matrix for calibration.
Method:
- Calibration Curve Preparation:
- Prepare a series of standards by spiking the drug product placebo (matrix without API) with known concentrations of the target element(s).
- Form pellets of these standards and analyze them using the same LIBS parameters as the unknown samples.
- Sample Analysis:
- Analyze the finished drug product tablet or pellet directly as described in Section 4.1.
- Data Analysis:
- Quantification Method: Use a multivariate regression algorithm, such as Partial Least Squares Regression (PLSR), to build a model that correlates the intensity of multiple spectral lines for the target element with its known concentration in the standards [52].
- Apply this model to the spectrum of the unknown drug product to predict the concentration of the impurity.
Data and Results
With proper calibration and the use of chemometrics, LIBS can achieve quantitative results with sufficient precision for screening and control purposes. The following table summarizes performance characteristics for common elements.
Table 2: Quantitative Performance of LIBS for Elemental Analysis in Various Matrices
| Element | Matrix | Detection Limit | Quantitative Technique | Reference Technique Correlation |
|---|---|---|---|---|
| P, K, Mg, Ca, Zn | Plant Tissue (Wheat) | ppm range | PLSR | ICP-OES [52] |
| Al, Si | Aqueous Solution | ~100 µg/mL | Calibration Curve | AAS [53] |
| Cd, Pb | Soft Tissues | sub-ppm to ppm | Calibration-Free LIBS | ICP-MS [54] |
Integrating LIBS into a Quality by Design (QbD) Framework
The principles of Quality by Design (QbD) mandate that quality should be built into a product through rigorous design and understanding of both product and process [49]. LIBS aligns perfectly with this framework by enabling:
- Raw Material Control: As a Critical Material Attribute (CMA) verification tool, ensuring consistent quality of inputs.
- Process Understanding: As a Process Analytical Technology (PAT) tool, providing real-time, in-line data on elemental composition during manufacturing, which can be linked to Critical Quality Attributes (CQAs) [48].
- Control Strategy: Contributing to a real-time release testing paradigm by providing rapid verification of product quality.
Workflow and Signaling Pathways
The following diagram illustrates the logical workflow for implementing LIBS in pharmaceutical analysis, from risk assessment to final control, within a QbD framework.
The experimental workflow for a LIBS analysis, from sample preparation to final diagnosis or quantification, is standardized and follows the logical path below.
The Scientist's Toolkit: Key Research Reagent Solutions
Table 3: Essential Materials and Equipment for Pharmaceutical LIBS
| Item | Function/Description | Example/Note |
|---|---|---|
| Q-Switched DPSS Laser | Generates high-power, short-duration pulses to ablate sample and create plasma. | Nd:YAG laser (1064 nm, nanosecond pulse, up to 100 mJ pulse energy) [50]. |
| Spectrometer | Collects light from the plasma and disperses it to resolve characteristic atomic emission lines. | Requires broad spectral range (200-1000 nm) and precise synchronization (low jitter) with the laser pulse [48] [50]. |
| Certified Reference Materials (CRMs) | Used for instrument calibration and validation of quantitative methods. | Pharmaceutical-grade matrix-matched standards with certified concentrations of target elements. |
| Chemometric Software | Essential for analyzing complex, multivariate LIBS spectral data. | Software packages capable of Principal Component Analysis (PCA), PLSR, and SIMCA [48] [52]. |
| Sample Presentation Accessories | Ensure consistent and reproducible analysis. | Pellet presses for powders, motorized X-Y stages for automated spatial mapping [48]. |
| Inert Gas Purge System | Improves signal quality by reducing atmospheric interference in the plasma. | Nitrogen or Argon gas jet directed at the analysis point [52]. |
Laser-Induced Breakdown Spectroscopy (LIBS) represents a rapid, versatile, and information-rich analytical technique that is highly applicable to the modern pharmaceutical industry's needs for elemental impurity testing and raw material verification. Its minimal sample preparation requirements, speed, and ability to provide both identification and quantification make it a powerful tool for supporting risk-based approaches as defined by ICH Q3D and for integrating into Quality by Design (QbD) frameworks. When combined with robust chemometric analysis, LIBS offers a compelling solution for enhancing quality control, accelerating development, and ensuring patient safety.
Laser-Induced Breakdown Spectroscopy (LIBS) has emerged as a powerful analytical technique for rapid, multi-elemental analysis of environmental samples. This application note details standardized protocols for detecting heavy metal contaminants in water and soil matrices, supporting a broader thesis on LIBS for material analysis research. The methodologies outlined herein enable researchers to achieve parts-per-million (ppm) to parts-per-billion (ppb) level detection limits for environmentally significant heavy metals such as chromium (Cr), copper (Cu), lead (Pb), zinc (Zn), and cadmium (Cd) with minimal sample preparation [55] [56]. The integration of advanced substrate engineering and machine learning algorithms has significantly enhanced the accuracy, stability, and sensitivity of LIBS measurements, making it a compelling alternative to traditional laboratory-based techniques for environmental monitoring [55] [57].
Performance Metrics of LIBS for Heavy Metal Detection
The following table summarizes the quantitative performance of various LIBS techniques for detecting heavy metals in different environmental matrices.
Table 1: Quantitative Performance of LIBS Techniques for Heavy Metal Detection in Environmental Matrices
| Matrix | LIBS Technique | Target Elements | Limit of Detection (LOD) | Key Performance Metrics | Reference |
|---|---|---|---|---|---|
| Water | Polishing-assisted SE-LIBS | Cr, Cu, Pb | Cr: 1.02 ng/mL, Cu: 1.23 ng/mL, Pb: 3.26 ng/mL | Enhanced spectral stability, reduced coffee-ring effect [55] | |
| Water (Aerosols) | Spectral Screening-assisted LIBS (LGBM Algorithm) | Cu, Zn | Not Specified | RP² (Cu): 0.9876 (RFE-PLSR model); RP² (Zn): 0.9820 (RFE-PLSR model) [57] | |
| Soil | Solid-Phase Conversion LIBS (SC-LIBS) | Pb, Cr | Pb: 9.34 mg/kg, Cr: 3.60 mg/kg | Reduced RSD for Pb (71.4%) and Cr (53.4%) vs. conventional methods [56] | |
| Soil | Conventional LIBS (Pelletized) | Fe, Cr, Cu, Al, Cd, Mn | Not Specified | Successful qualitative detection of multiple heavy metals [58] | |
| General Mining/Solid | Portable/Online LIBS | Li, Co, Ni, Cu, Au | Li: 0.01-0.1%, Co: 10-100 ppm, Ni: 50-200 ppm, Au: 50-200 ppm | Typical analysis speed: 30-60 seconds; Precision: ±2-5% RSD for major elements [59] |
Experimental Protocols
Protocol 1: Ultra-Sensitive Detection of Heavy Metals in Water via Polishing-Assisted SE-LIBS
This protocol is designed for the trace-level analysis of heavy metals in aqueous solutions using a surface-enhanced approach with a modified metal substrate [55].
Workflow Diagram
Required Reagents and Equipment
Table 2: Essential Research Reagent Solutions for Polishing-Assisted SE-LIBS
| Item | Specification/Type | Function/Purpose |
|---|---|---|
| Metal Substrate | Aluminum alloy | Serves as the solid support for sample deposition and plasma generation. |
| Polishing Material | 2000 mesh sandpaper | Creates a uniform micro-textured surface on the substrate to minimize the coffee-ring effect and promote even analyte distribution. |
| Calibration Standards | Multi-element aqueous standards (Cr, Cu, Pb) | Used for constructing calibration curves for quantitative analysis. |
| Nd:YAG Laser | Wavelength: 1064 nm, Pulse width: ns range, Fixed pulse energy | Generates a high-energy pulse to ablate the sample and create a plasma plume. |
| Spectrometer | Multi-channel spectrometer with CCD/ICCD detector | Captures the time-resolved emission spectrum from the cooling plasma. |
Step-by-Step Procedure
- Substrate Preparation: Polish a flat aluminum substrate thoroughly using 2000 mesh sandpaper. This critical step creates a uniform micro-textured surface, which minimizes the "coffee-ring effect" by promoting a more even distribution of the aqueous sample as it dries, leading to improved spectral stability and reproducibility [55].
- Sample Deposition: Pipette a precise volume (typically microliters) of the filtered water sample or standard solution onto the pre-polished aluminum substrate. Allow the droplet to dry completely at room temperature or under a gentle stream of inert gas. The heavy metal analytes are thus concentrated on the substrate surface.
- LIBS Analysis: Place the prepared substrate in the LIBS sample chamber. Focus the pulsed Nd:YAG laser (1064 nm wavelength) onto the sample spot. Fire the laser at a predetermined pulse energy to generate plasma. A delay generator should be used to synchronize the laser pulse with the spectrometer's data acquisition to capture the elemental emission signals after the initial intense plasma continuum has decayed.
- Spectral Acquisition and Quantification: Collect the emitted light from the plasma using a spectrometer with a resolution of approximately 0.1 nm. Identify the characteristic emission lines for Cr, Cu, and Pb (e.g., Cr I: 425.43 nm, Cu I: 324.75 nm, Pb I: 405.78 nm). Construct a calibration curve using the standards and use it to quantify the heavy metal concentration in the unknown samples [55].
Protocol 2: Accurate Measurement of Heavy Metals in Soil Using Solid-Phase Conversion (SC)-LIBS
This protocol addresses the challenge of matrix effects in heterogeneous soil samples by converting the solid soil into a more uniform pellet, significantly improving measurement stability and accuracy [56].
Workflow Diagram
Required Reagents and Equipment
Table 3: Essential Research Reagent Solutions for Soil Analysis via SC-LIBS
| Item | Specification/Type | Function/Purpose |
|---|---|---|
| Soil Sieve | 75 μm mesh | Homogenizes soil particle size, which is critical for reducing variability in LIBS signals. |
| Hydraulic Press | 10-20 ton capacity | Compresses the powdered soil into a dense, uniform pellet for stable analysis. |
| Pellet Die | Standard geometry (e.g., 32 mm diameter) | Forms the soil powder into a pellet under pressure. |
| Binder | Cellulose powder or Boric acid (optional) | Enhances the cohesion and mechanical strength of the soil pellet. |
| Chemometric Software | PCA, PLSR, RFE algorithms | Processes complex spectral data, corrects for matrix effects, and builds quantitative models. |
Step-by-Step Procedure
- Sample Pretreatment: Air-dry the collected soil samples and sieve them through a 75 μm mesh to achieve consistent particle size. Studies show that finer grain sizes (e.g., 75 μm) yield higher LIBS emission intensity with lower relative standard deviations (RSD) compared to coarse grains (e.g., 2 mm) [60]. For optimal results, standardize the water content across all samples, as increasing water content can significantly quench the plasma and reduce emission intensity [60].
- Pellet Preparation: Mix the sieved soil powder thoroughly with a binder (such as cellulose powder) if necessary. Transfer the mixture into a pellet die and compress using a hydraulic press (e.g., at 10-15 tons for 1-2 minutes) to form a solid, homogeneous pellet.
- LIBS Analysis & Data Processing: Analyze the soil pellet using the LIBS system. The laser parameters (energy, spot size) should be optimized for soil matrix ablation. For quantitative analysis, employ chemometric methods like Partial Least Squares Regression (PLSR). The model can be further refined using algorithms like Recursive Feature Elimination (RFE) to select the most informative spectral variables, thereby enhancing prediction accuracy for elements like Pb and Cr [57] [56].
The Scientist's Toolkit: Critical Components for LIBS Analysis
A successful LIBS setup for environmental monitoring relies on several key components, from sample preparation to data analysis.
Table 4: Essential Components of a LIBS Research Toolkit
| Tool/Category | Specific Examples | Function & Importance |
|---|---|---|
| Sample Preparation Tools | 2000 mesh sandpaper, 75 μm sieve, hydraulic pellet press, drying oven | Standardizes sample physical properties (morphology, grain size, moisture), which is critical for mitigating matrix effects and improving reproducibility [55] [60] [56]. |
| Laser System | Q-switched Nd:YAG (1064 nm, 532 nm), ~50 mJ pulse energy, 1-10 Hz | Provides the high-energy source for ablating the sample and generating plasma. Stability and focusability are key for consistent results. |
| Spectrometer | CCD/ICCD detectors, 0.1 nm spectral resolution, wide wavelength range (UV-Vis-NIR) | Captures the time-resolved, element-specific emission spectrum from the plasma with high sensitivity and resolution. |
| Chemometric Algorithms | Principal Component Analysis (PCA), Partial Least Squares Regression (PLSR), Light Gradient Boosting Machine (LGBM), Convolutional Neural Networks (CNN) | Extracts meaningful information from complex spectra, identifies patterns, classifies samples, and builds robust quantitative calibration models, often achieving accuracy above 95% [57] [61]. |
| Reference Materials | Certified Reference Materials (CRMs) for soils and waters | Essential for calibration and validation of the LIBS method, ensuring analytical accuracy and traceability. |
Laser-Induced Breakdown Spectroscopy (LIBS) has emerged as a transformative analytical technique for the rapid identification and sorting of copper and copper alloys in recycling and industrial control applications. This technology addresses a critical need in the face of a looming global copper shortage, with projections indicating that by 2030, global copper mines will meet only 80% of the world's requirements [8]. The recycling industry has consequently become vital for bridging this supply gap, necessitating efficient and accurate methods for copper extraction and purification from complex scrap streams.
LIBS fulfills this need by providing rapid, precise, and non-destructive elemental analysis, making it an ideal tool for enhancing efficiency in metal recycling processes [8]. Its capability to perform real-time analysis without extensive sample preparation allows for high-throughput sorting of copper-containing materials, ensuring that only high-purity copper is selected for extraction and improving overall process efficiency. This application note details the principles, protocols, and practical implementation of LIBS for copper sorting and alloy identification within the broader context of advanced material analysis research.
Principles of LIBS Technology
Fundamental Mechanism
Laser-Induced Breakdown Spectroscopy is an atomic emission spectroscopy technique that utilizes a high-energy laser pulse to perform elemental analysis. The fundamental process involves several stages occurring within microseconds [8]:
- Laser Ablation: A focused, high-energy laser pulse interacts with the sample surface, vaporizing a microscopic amount of material (typically creating a crater of ~500 μm [62]) and forming a high-temperature plasma.
- Plasma Formation: The ablated material is heated to extreme temperatures ranging from 10,000 to 20,000 Kelvin, creating a transient plasma containing excited atoms and ions [63].
- Light Emission: As this plasma cools, the excited species emit photons at specific wavelengths characteristic of the elements present in the sample.
- Spectral Analysis: The emitted light is collected and dispersed by a spectrometer, producing a unique spectral fingerprint that identifies the elements present and can be used to quantify their concentrations [8].
The following diagram illustrates this fundamental LIBS process workflow:
Key System Components
A typical LIBS system for industrial copper sorting incorporates several essential components [8]:
- Laser Source: Commonly a Q-switched Nd:YAG laser operating at fundamental (1064 nm) or frequency-doubled (532 nm) wavelengths, delivering pulse energies typically ranging from 10-200 mJ with pulse durations of several nanoseconds [63].
- Optical System: Includes focusing lenses to direct the laser onto the sample and collection optics to gather the emitted light from the plasma.
- Spectrometer: Disperses the collected light to resolve element-specific emission lines across a broad wavelength range.
- Detector: An intensified CCD (ICCD) or other time-gated detector to capture the plasma emission with appropriate delay and gate width settings to optimize signal-to-noise ratio.
- Data Processing Unit: Applies algorithms for spectral analysis, element identification, quantification, and sort decision-making, often incorporating advanced multivariate analysis and machine learning techniques.
Experimental Protocols for Copper Analysis
Sample Preparation Protocol
Proper sample preparation is crucial for obtaining reliable and reproducible LIBS results, particularly for copper-bearing materials in recycling streams:
- Solid Scrap Metals: For bulk copper scrap, ensure a relatively flat surface for analysis by shearing or cutting when necessary. Remove excessive surface oxidation, dirt, or coatings that might interfere with analysis using mechanical abrasion or cleaning when practical [8].
- Mixed Metal Fragments: For shredded materials, standardize particle size where possible through screening (e.g., using 200-mesh screens as in rice analysis [64]) to minimize particle size effects.
- Powdered/Pelletized Samples: For reference materials or finely divided copper concentrates, prepare pellets using a tablet press applying approximately 25 kN pressure for 1 minute to create homogeneous, flat-surface samples [64].
- Surface Conditioning: Ensure consistent surface characteristics across samples, as surface roughness and orientation can affect plasma formation and analytical precision.
LIBS Instrumentation Parameters
Optimal experimental parameters must be established for copper analysis, with the following settings providing a starting point for method development:
Table 1: Typical LIBS Parameters for Copper Analysis
| Parameter | Recommended Setting | Range Tested | Application Context |
|---|---|---|---|
| Laser Energy | 80 mJ | 10-200 mJ | Copper ores [62] |
| Laser Wavelength | 532 nm | 1064 nm, 532 nm | General LIBS [63] |
| Spot Size | ~500 μm | 100-1000 μm | Copper ores [62] |
| Delay Time | 2 μs | 1-10 μs | Copper ores [62] |
| Gate Width | 10 μs | 1-20 μs | Rice analysis [64] |
| Laser Repetition Rate | 1 Hz | 1-100 Hz | Rice analysis [64] |
| Ambient Environment | Air at 1 atm | Air, Ar, He | General LIBS [64] |
Spectral Acquisition and Analysis
For copper analysis, specific spectral lines provide the most reliable identification and quantification:
Primary Copper Lines:
- 510.6 nm (transition: ( ^2P{3/2} \rightarrow ^2D{5/2} ))
- 515.3 nm (transition: ( ^2D{3/2} \rightarrow ^2P{1/2} ))
- 521.8 nm (transition: ( ^2D{5/2} \rightarrow ^2P{3/2} )) [62]
Data Collection:
- Acquire multiple spectra per sample (e.g., 16 spectra at different positions [64])
- Accumulate multiple laser pulses per spectrum (typically 3-5 pulses) [64]
- Average spectra to improve signal-to-noise ratio and minimize heterogeneity effects
- Include appropriate background subtraction and normalization procedures
Multivariate Analysis:
- Apply Principal Component Analysis (PCA) for unsupervised pattern recognition and classification [62]
- Utilize Partial Least Squares-Discrimination Analysis (PLS-DA) for supervised classification of copper alloys [62]
- Implement machine learning algorithms (e.g., Support Vector Machine Regression) for improved quantification [64]
Performance Metrics and Validation
Analytical Performance for Copper Detection
LIBS demonstrates excellent performance characteristics for copper analysis across various matrices, from pure metals to complex environmental samples:
Table 2: LIBS Performance for Copper Analysis Across Matrices
| Matrix | Detection Limit | Quantitative Precision (RSD) | Key Elements Detected | Reference |
|---|---|---|---|---|
| Rice | 5 ppm | 4-15% | Cu, Al, C, Fe, Mg, Ni, Si, Zn | [64] |
| Copper Ores | Not specified | Not specified | Cu, Al, C, Fe, Mg, Ni, Si, Zn | [62] |
| Archaeological Alloys | Not specified | Not specified | C, P, Mn, Fe | [65] |
| Recycled Metals | Not specified | Not specified | Cu, Al, Zn, Fe, Pb, Sn | [8] |
Industrial Sorting Performance
In operational recycling and mining environments, LIBS systems deliver substantial performance improvements:
- Throughput: 60-600 samples per minute in industrial applications [63]
- Belt Speeds: Capable of analyzing materials on conveyors moving at up to 3.5 meters per second [63]
- Analysis Density: 20-100 analysis points per second across conveyor widths [63]
- Accuracy: Over 95% accuracy in identifying different lithium-ion battery chemistries in e-waste applications [63]
- Economic Impact: Payback periods of 18-36 months with annual savings of €2-5 million for operations processing 5-10 million tonnes per year [63]
Implementation in Recycling and Industrial Control
Sorting System Integration
The integration of LIBS into industrial copper sorting operations follows a systematic process as illustrated below:
The Researcher's Toolkit: Essential Materials and Reagents
Successful implementation of LIBS for copper analysis requires specific reagents, reference materials, and equipment:
Table 3: Essential Research Reagents and Materials for LIBS Copper Analysis
| Item | Specification | Application Purpose | Critical Function |
|---|---|---|---|
| Reference Standards | Certified copper alloys with known compositions (e.g., brass, bronze) | Calibration and validation | Enables quantitative analysis by providing known reference materials for model development |
| Calibration Materials | Pure copper, pure alloying elements (Zn, Sn, Pb, Ni) | System calibration | Establishes correlation between spectral intensity and element concentration |
| Pellet Press | 10-25 ton capacity with die sets | Sample preparation | Creates homogeneous, flat-surface pellets from powdered materials for reproducible analysis |
| Nd:YAG Laser | 1064/532 nm, 10-200 mJ, 1-100 Hz | Plasma generation | Provides high-energy pulses for sample ablation and plasma formation |
| Spectrometer | Wide spectral range (200-800 nm), moderate resolution (~0.1 nm) | Spectral dispersion | Resolves element-specific emission lines for identification and quantification |
| Matrix-Matched Standards | Custom-blended materials matching sample composition | Quality control | Minimizes matrix effects in complex samples through similar physical/chemical properties |
Operational Advantages for Copper Recycling
The implementation of LIBS technology in copper recycling operations delivers significant advantages over traditional sorting methods:
- Non-Destructive Analysis: LIBS requires minimal sample preparation and does not damage the material, preserving its value for subsequent processing [8].
- Rapid Analysis: Results are obtained in microseconds, supporting high-throughput operations essential for economical recycling [8].
- Multi-Element Detection: Simultaneous detection of multiple elements provides comprehensive compositional data for accurate alloy identification [8].
- Versatility: Capability to analyze solids, liquids, and gases makes LIBS adaptable to various stages of the recycling process [8].
- Impurity Detection: High sensitivity for trace elements (e.g., lead, tin, sulfur) allows identification and removal of contaminated materials before processing [8].
Challenges and Mitigation Strategies
Despite its significant advantages, LIBS implementation faces several challenges that require appropriate mitigation strategies:
- Matrix Effects: The physical and chemical properties of samples can affect plasma formation and spectral accuracy. Mitigation includes using matrix-matched calibration standards and applying advanced chemometric methods [8] [64].
- Quantitative Precision: While excellent for qualitative analysis, achieving high quantitative accuracy requires robust calibration with appropriate reference materials and application of multivariate calibration techniques [8].
- Equipment Costs: High-quality LIBS systems represent significant capital investment, though this is offset by operational savings, improved efficiency, and reduced downstream processing costs [8] [63].
- Environmental Sensitivity: Industrial conditions including dust, humidity, and temperature variations can impact measurement reliability. Proper enclosure design and environmental controls address these challenges [8].
Laser-Induced Breakdown Spectroscopy offers a transformative approach to copper sorting and alloy identification in recycling and industrial control applications. Its ability to provide rapid, non-destructive, and versatile elemental analysis makes it an invaluable tool for addressing the growing demand for high-purity copper through efficient recycling processes. The protocols and application notes detailed herein provide researchers and industrial practitioners with comprehensive guidance for implementing LIBS technology effectively. As advancements in machine learning, miniaturization, and automation continue to enhance LIBS capabilities, its role in promoting sustainable resource management through efficient copper recycling will undoubtedly expand, contributing significantly to the circular economy while addressing the critical challenge of global copper supply.
Laser-Induced Breakdown Spectroscopy (LIBS) has emerged as a powerful analytical technique for the rapid elemental analysis of diverse materials, exhibiting particular utility in the evolving field of microplastic research. As environmental contamination by plastic particles represents a growing global concern, the need for analytical methods capable of characterizing both pristine and environmentally transformed microplastics has become increasingly pressing [66]. LIBS addresses this need through its capacity for rapid, in-situ analysis with minimal sample preparation, enabling researchers to investigate the complex transformations that microplastics undergo in environmental systems [17] [67].
This application note details standardized protocols for applying LIBS to the analysis of challenging microplastic samples, with particular emphasis on tracking aging processes and elemental alterations. The methodologies outlined herein are designed to support research within the broader context of LIBS for material characterization, providing reproducible experimental frameworks that yield reliable, interpretable data for the scientific community.
Technical Principles of LIBS Analysis
LIBS operates on the fundamental principle of using a high-energy laser pulse to generate a micro-plasma on the sample surface, followed by spectral analysis of the emitted light from the cooling plasma. The analytical process encompasses several distinct stages [17] [67]:
Laser Ablation: A focused, short-pulse laser beam interacts with the sample surface, removing a small quantity of material (typically nanograms to picograms) through both thermal and non-thermal mechanisms.
Plasma Formation: The ablated material further interacts with the trailing portion of the laser pulse, forming a high-temperature plasma (>15,000 K) containing excited atoms, ions, and free electrons.
Spectral Emission: As the plasma cools, electrons from excited atomic and ionic species return to lower energy states, emitting element-specific light at characteristic wavelengths.
Detection and Analysis: The emitted light is collected, dispersed by a spectrometer, and detected, generating a spectrum that serves as a unique elemental fingerprint for the analyzed material.
LIBS offers broad elemental coverage, including light elements such as carbon, hydrogen, oxygen, and nitrogen that constitute the backbone of polymeric materials, alongside heavy metals that may be present as additives or adsorbed contaminants [68] [17]. The technique is considered minimally destructive, as each laser pulse typically creates a crater of only 50-100 µm in diameter, preserving the majority of the sample for subsequent analysis [67].
Experimental Protocols
Microplastic Aging Simulation
Table 1: Experimental parameters for controlled microplastic aging
| Parameter | Abiotic Aging | Biotic Aging |
|---|---|---|
| Polymer Types | Polystyrene (PS), Polyethylene (PE), Polyvinyl chloride (PVC) [69] [70] | Polyamide (PA), PE, PET, PP, PVC [71] |
| Aging Duration | 1 and 6 weeks [69] | Controlled exposure to freshwater and wastewater [71] |
| Heavy Metal Exposure | Cadmium, Chromium, Lead ions [69] [72] | Environmentally relevant metal contaminants [71] |
| Key Assessments | Surface elemental changes, functional group formation [69] | Biofilm development (chlorophyll a measurement) [69] [70] |
Protocol 1: Controlled Aging of Microplastics
Sample Preparation: Select pristine microplastic particles (fragments, typically 1-1000 µm) of defined polymer types. Pre-clean particles to remove manufacturing residues if necessary.
Aging Chambers Setup:
- Abiotic Aging: Expose microplastics to simulated environmental conditions including UV radiation, thermal cycling, and mechanical abrasion in aqueous solutions containing heavy metal ions (Cd, Cr, Pb at environmentally relevant concentrations) for periods of 1 and 6 weeks [69] [70].
- Biotic Aging: Incubate microplastics in freshwater or wastewater systems to promote biofilm development. Monitor microbial colonization regularly [71].
Post-Aging Processing: After designated time periods, carefully retrieve microplastics. Gently rinse with deionized water to remove loosely attached material without disrupting formed biofilms or surface modifications. Air-dry under controlled conditions [69].
LIBS Analysis Procedure
Table 2: Instrumental parameters for LIBS analysis of microplastics
| Parameter | Typical Settings | Notes |
|---|---|---|
| Laser Type | Q-switched Nd:YAG | -- |
| Laser Wavelength | 1064 nm | Fundamental wavelength [73] |
| Pulse Energy | Several mJ per pulse | Adjust based on sample properties [67] |
| Spot Size | 50-100 µm | Affects spatial resolution and sensitivity [67] |
| Repetition Rate | 1-100 Hz | Balance between speed and signal quality [67] |
| Spectral Range | 190-950 nm | Enable detection of light & heavy elements [67] |
| Detection Delay | >1 µs after plasma formation | Reduces continuum background [17] |
| Atmosphere | Ambient air or Argon purge | Argon can enhance sensitivity for some elements [67] |
Protocol 2: LIBS Measurement of Pristine and Aged Microplastics
Sample Presentation: Mount microplastic particles on double-sided adhesive tape on a microscope slide or sample stub. Ensure flat surface presentation when possible to maintain consistent laser focus.
Instrument Calibration: Perform daily wavelength and intensity calibration using certified reference materials. For quantitative analysis, develop matrix-matched calibration curves using polymer standards with known elemental concentrations.
Data Acquisition:
- Program an automated stage to acquire spectra from multiple points (typically 10-30) per particle to account for heterogeneity.
- Set laser parameters according to Table 2, optimizing for each polymer type if necessary.
- Acquire multiple shots per location (typically 3-5), with the first shot often discarded to remove potential surface contaminants.
- For each spectrum, collect the full spectral range to capture both major and trace elements.
Quality Control: Include quality control samples (certified reference materials, if available) every 10-15 samples to monitor instrument performance. Replicate analysis of a representative sample should show relative standard deviations <10% for major elements.
Complementary Techniques for Validation
Protocol 3: Multi-Method Validation Approach
Raman Microscopy: Analyze the same particles (or adjacent areas) by Raman microscopy to confirm polymer identity and characterize molecular structural changes. Typical parameters: 532 nm or 785 nm laser, 1-10 µm spot size, spectral range 500-2000 cm⁻¹ [68] [74].
SEM-EDS: Following LIBS analysis, selected particles can be coated (if necessary) and imaged by Scanning Electron Microscopy to examine surface morphology changes. Energy Dispersive X-ray Spectroscopy provides elemental composition for comparison with LIBS results [68].
LA-ICP-MS: For enhanced trace metal sensitivity, employ Laser Ablation Inductively Coupled Plasma Mass Spectrometry. This is particularly valuable for detecting heavy metals at very low concentrations (ng g⁻¹ range) and mapping their spatial distribution [66] [71].
Analytical Workflow and Data Processing
The following workflow diagram illustrates the complete experimental procedure from sample preparation through data interpretation:
Figure 1: Comprehensive workflow for LIBS analysis of pristine and aged microplastics, including complementary validation techniques.
Data Processing Protocol:
Spectral Pre-processing: Apply background subtraction, normalization (typically to carbon line or total spectral intensity), and wavelength calibration to all acquired spectra.
Feature Selection: Identify characteristic elemental emission lines for analysis. Key lines for microplastics include:
- Polymer Matrix: C I (247.86 nm), H I (656.28 nm), N I (746.83 nm), O I (777.19 nm)
- Additives/Contaminants: Cd I (228.80 nm), Cr I (425.43 nm), Pb I (405.78 nm), Al I (396.15 nm), Zn I (213.86 nm) [68]
Multivariate Analysis: Employ Principal Component Analysis (PCA) to reduce data dimensionality and identify patterns distinguishing polymer types and aging states. The LIBS-PCA approach has been demonstrated to effectively differentiate between pristine and aged microplastics and among different polymer types and aging scenarios [69] [70] [72].
Expected Results and Data Interpretation
Elemental Signatures of Microplastics
Table 3: Characteristic elemental markers detected by LIBS in microplastics
| Element Category | Specific Elements | Origin/Purpose | Detection Range |
|---|---|---|---|
| Polymer Backbone | C, H, O, N | Primary polymer composition [17] | Major constituents |
| Heavy Metal Additives | Cd, Cr, Pb, Hg | Colorants, stabilizers, fillers [69] | Low ppm - % |
| Adsorbed Contaminants | Al, Ni, Co, Zn | Environmental adsorption [68] | ppm range |
| Nutrient Elements | Ca, Mg, K | Biofilm components [69] | Variable |
| Trace Elements | Rare Earth Elements | Specialized applications [73] | ppb - ppm |
Application of the described protocols typically yields distinct elemental profiles that enable:
Polymer Identification: Differentiation of common polymers (PE, PP, PET, PVC, PS) based on relative intensities of carbon, hydrogen, and heteroatom emission lines, as well as polymer-specific additives [68] [71].
Aging Assessment: Detection of elemental changes associated with environmental transformation, including:
Source Tracking: Identification of elemental markers that may help trace microplastics to specific sources or manufacturing processes based on characteristic additive profiles.
The Scientist's Toolkit: Essential Research Reagents and Materials
Table 4: Key research reagents and materials for LIBS analysis of microplastics
| Item | Specification/Function | Application Notes |
|---|---|---|
| Reference Polymer Materials | Certified pristine polymers (PE, PP, PET, PVC, PS); provide spectral reference baselines | Essential for method development and validation [69] |
| Heavy Metal Standards | Aqueous solutions of Cd, Cr, Pb for aging experiments; simulate environmental contamination [69] | Use environmentally relevant concentrations (ppb-ppm range) |
| Microplastic Sampling Kits | Stainless steel sieves (1mm, 5mm pore size), density separation solutions (ZnCl₂) [68] | Enable standardized collection and extraction from environmental matrices |
| Sample Mounting Substrates | Low-background adhesive tapes, microscope slides; secure samples during analysis | Ensure minimal elemental interference in LIBS spectra |
| Quality Control Materials | Certified reference materials (CRMs) with known elemental composition; monitor analytical performance | Use matrix-matched CRMs when available |
| Calibration Standards | Polymer standards with certified elemental additives; enable quantitative analysis | Critical for developing calibration curves |
Technical Specifications and Method Validation
The LIBS technique for microplastic analysis exhibits the following performance characteristics:
- Spatial Resolution: 25-100 µm, enabling analysis of individual microplastic particles [66] [67]
- Detection Limits: Vary by element but typically in the low ppm range for heavy metals (e.g., Cd, Pb, Cr) under optimal conditions [17]
- Analytical Precision: Typically 5-10% RSD for major elements when using optimized protocols [67]
- Sample Throughput: Rapid analysis (seconds per measurement point) enabling high-throughput screening [17]
Method validation studies have demonstrated strong correlation between LIBS data and results from established techniques including SEM-EDS, Raman spectroscopy, and LA-ICP-MS [68] [74]. The hyphenated LIBS-Raman approach has been shown to provide complementary molecular and elemental information from the same microplastic particle, offering a more comprehensive characterization [68].
The protocols detailed in this application note provide a robust framework for applying LIBS to the challenging analysis of pristine and aged microplastics. The method's strengths include minimal sample preparation, rapid analysis capability, and sensitivity to both light elements and heavy metals, making it particularly suitable for investigating the complex transformations microplastics undergo in environmental systems. When combined with multivariate statistical analysis and validated through complementary techniques, LIBS emerges as a powerful tool for advancing our understanding of microplastic aging, contaminant interactions, and environmental fate.
Enhancing LIBS Performance: Tackling Analytical Challenges and Implementing Solutions
Addressing Matrix Effects and Spectral Interferences in Complex Matrices
Laser-Induced Breakdown Spectroscopy (LIBS) is a versatile, rapid, and minimally destructive analytical technique capable of real-time, multi-elemental analysis with minimal sample preparation [14] [75]. Its applicability spans diverse fields, including geology, metallurgy, environmental science, and pharmaceuticals. However, the quantitative accuracy of LIBS is often compromised by matrix effects and spectral interferences, particularly when analyzing complex matrices [76] [77]. Matrix effects—changes in the LIBS signal caused by the sample's physical and chemical properties—and spectral interferences—the overlap of emission lines from different elements—fundamentally limit the technique's precision and accuracy [76] [78]. This application note details advanced protocols and data analysis strategies to overcome these challenges, enabling more reliable quantitative analysis within a research context.
Methodologies and Experimental Protocols
Protocol 1: Acoustic Signal Normalization for Physical Matrix Effect Suppression
This protocol uses the Laser-Induced Plasma Acoustic Signal (LIPAc) to correct for fluctuations in the ablation process caused by variations in sample surface condition, hardness, or thermal properties [76].
Materials and Equipment:
- Pulsed Nd:YAG laser (e.g., 1064 nm or 266 nm wavelength)
- LIBS spectrometer (e.g., echelle type with ICCD detector)
- Microphone (recommended: MEMS type for superior audio quality)
- Acoustic signal pre-amplifier and data acquisition system
- Three-axis motorized sample stage
- Computer with data acquisition and analysis software
Procedure:
- Setup: Integrate a MEMS microphone into the standard LIBS setup, positioning it at a fixed distance (e.g., 10-30 cm) and angle from the laser ablation point.
- Synchronization: Synchronize the data acquisition triggers for both the spectrometer and the acoustic recording system.
- Data Acquisition: For each laser pulse, simultaneously record:
- The full LIBS spectrum (intensity vs. wavelength).
- The acoustic waveform (sound pressure vs. time).
- Signal Processing: Extract the peak amplitude or integrated energy of the acoustic signal for each measurement.
- Normalization: Normalize the intensity of the analyte emission line(s) of interest by dividing it by the corresponding integrated acoustic signal amplitude.
Data Interpretation: A strong positive correlation between the acoustic signal amplitude and the ablated mass helps correct for pulse-to-pulse variations. This method effectively suppresses signal fluctuations arising from physical matrix differences, leading to more robust calibration models [76].
Protocol 2: Laser-Stimulated Absorption (LSA-LIBS) for Reducing Self-Absorption and Spectral Interference
This protocol employs a secondary, wavelength-tunable laser to depopulate lower energy levels of analyte atoms, thereby reducing self-absorption and enhancing line intensity to mitigate spectral interference [77].
Materials and Equipment:
- Primary ablation laser: Q-switched Nd:YAG laser (e.g., 532 nm, 7 ns, 10 Hz).
- Secondary excitation laser: Optical Parametric Oscillator (OPO) wavelength-tunable laser.
- Delay generator for precise temporal synchronization between the two lasers.
- Spectrometer with high spectral resolution.
- Beam combining optics (dichroic mirrors).
Procedure:
- Ablation: Focus the primary laser pulse onto the sample surface to generate the plasma.
- Excitation: After a optimized time delay (on the order of microseconds), irradiate the entire plasma plume with the secondary OPO laser, tuning its wavelength to match a specific absorption transition of the target element (e.g., Ni at 341.47 nm).
- Spectral Collection: Collect the plasma emission using a spectrometer gate delayed relative to the ablation pulse.
- Comparison: Acquire a reference spectrum under identical conditions but without the secondary OPO laser.
Data Interpretation: The LSA-LIBS process reduces the population of atoms in the lower energy state, thus diminishing self-absorption. This results in a narrower, more symmetric, and significantly more intense emission line, which improves the signal-to-noise ratio and helps resolve the line from overlapping spectral features of matrix elements (e.g., Fe in steel) [77].
Protocol 3: Transfer Learning for Quantitative Analysis in Heterogeneous Soils
This protocol uses the TrAdaBoost algorithm to transfer calibration models from controlled laboratory standards (e.g., pressed soil tablets) to more complex, real-world sample forms (e.g., soil particles), mitigating chemical matrix effects [78].
Materials and Equipment:
- LIBS system for spectral acquisition.
- Certified reference materials (CRMs) for soil.
- Powdered soil samples (tableted and loose particles).
- Computing environment with programming capabilities (e.g., Python, R).
Procedure:
- Training Set Preparation:
- Acquire a large number of LIBS spectra from well-characterized, pressed soil tablets (source domain).
- Acquire a smaller set of LIBS spectra from the actual heterogeneous soil particles of interest (target domain).
- Model Training: Apply the TrAdaBoost transfer learning algorithm. This algorithm iteratively re-weights the source domain data, reducing the influence of samples that are not representative of the target domain while boosting the importance of the limited target domain data.
- Model Validation: Validate the final model using a separate, independent set of soil particle spectra not used in training.
Data Interpretation: The transfer learning model adapts the calibration relationship from the homogeneous tablets to the heterogeneous particles, significantly improving prediction accuracy for heavy metals (e.g., Cu, Cr, Zn, Ni) in real soil samples compared to conventional calibration methods [78].
Results and Data Presentation
Performance Comparison of Mitigation Strategies
Table 1: Quantitative performance of different LIBS mitigation strategies on various sample types.
| Mitigation Technique | Sample Matrix | Analyte(s) | Key Performance Metric | Result with Conventional LIBS | Result with Mitigation Strategy |
|---|---|---|---|---|---|
| Acoustic Normalization [76] | Various minerals & surfaces | Atomic & ionic lines | Signal Stability (RSD) | High fluctuation (>20%) | Improved stability (<10%) |
| LSA-LIBS [77] | Alloy structural steel | Nickel (Ni) | Self-Absorption Factor | 0.468 (Severe self-absorption) | 0.071 (85% reduction) |
| Average Relative Error | 11.28% | 1.92% (83% reduction) | |||
| TrAdaBoost Transfer Learning [78] | Soil Particles | Copper (Cu) | R²p | Varies (Model dependent) | 0.9885 |
| RMSEP (mg kg⁻¹) | Varies (Model dependent) | 8.7812 | |||
| Chromium (Cr) | R²p | Varies (Model dependent) | 0.9473 | ||
| RMSEP (mg kg⁻¹) | Varies (Model dependent) | 5.8027 |
The Scientist's Toolkit: Essential Research Reagents and Materials
Table 2: Key reagents, materials, and equipment for implementing the described LIBS protocols.
| Item Name | Specification / Example | Critical Function in Protocol |
|---|---|---|
| OPO Tunable Laser | Litron Nano LG 200-20 (for LSA) [77] | Provides secondary resonant excitation to reduce self-absorption effects. |
| MEMS Microphone | e.g., Invensense INMP441 [76] | Records plasma shockwave for acoustic normalization of physical matrix effects. |
| Certified Reference Materials (CRMs) | OREAS soil standards [4] | Provides known composition for model calibration and transfer learning. |
| Echelle Spectrometer | Catalina Scientific EMU 65 [4] | Offers high resolution across a broad wavelength range for resolving spectral interferences. |
| Delay Generator | Stanford Research Systems DG535 | Precisely controls timing between lasers and detector gating for LSA-LIBS and plasma diagnostics. |
Workflow and Signaling Pathways
Integrated Workflow for Addressing LIBS Challenges
The following diagram outlines a decision-making workflow for selecting the appropriate mitigation strategy based on the primary challenge encountered in LIBS analysis of complex matrices.
Figure 1: Decision workflow for selecting LIBS mitigation strategies. This flowchart guides the researcher in selecting the most appropriate protocol based on the dominant type of interference observed in their LIBS data.
LSA-LIBS Experimental Setup and Process
The following diagram illustrates the core components and the physical process involved in the Laser-Stimulated Absorption technique for reducing self-absorption.
Figure 2: LSA-LIBS setup and process. The OPO laser's resonant pulse (1) promotes atoms in the cool plasma periphery to a higher state, reducing the population in the lower state and thus minimizing (2) re-absorption of light emitted from the hot plasma core.
Laser-Induced Breakdown Spectroscopy (LIBS) has emerged as a powerful analytical technique for elemental analysis across diverse fields, from biomedical research to industrial applications [79]. However, challenges in plasma stability and signal reproducibility often limit its precision and sensitivity. This application note introduces the use of annular beam configurations as an innovative approach to overcome these limitations. By providing a more controlled and stable plasma formation environment, annular beams enhance LIBS performance, leading to improved analytical figures of merit. The following sections detail the underlying theory, experimental protocols, and practical validation for implementing this advanced laser configuration in material analysis research.
Fundamentals of LIBS and the Plasma Stability Challenge
LIBS operates on the principle of using a high-power laser pulse to ablate a microscopic volume of material, creating a transient plasma. As this plasma cools, it emits element-specific atomic emission lines, which are spectrally resolved and detected to determine sample composition [79]. The analytical performance of LIBS is critically dependent on the stability and characteristics of the laser-induced plasma. Fluctuations in plasma properties—such as temperature, electron density, and lifetime—directly manifest as signal noise, reducing the reproducibility and accuracy of quantitative analyses [79].
The Annular Beam Advantage
An annular beam features a ring-shaped intensity profile, distinct from the conventional Gaussian profile. This configuration can be generated using axicons or spatial light modulators and offers several mechanistic advantages for plasma control:
- Confinement and Stabilization of the Plasma Plume: The ring-shaped ablation pattern creates a natural barrier that confines the expanding plasma, reducing its fluctuation and increasing its persistence time for more consistent signal acquisition.
- Enhanced Laser-Plasma Coupling: The central "hole" in the beam profile allows for more efficient interaction between the laser pulse and the expanding plasma plume, potentially leading to better plasma reheating and increased emission intensity.
- Reduced Sample Damage and Thermal Effects: By distributing the laser energy over a larger area initially, annular beams can mitigate the thermal stress on the sample, which is particularly beneficial for analyzing delicate biological tissues or thin coatings [79].
Table 1: Comparative Advantages of Laser Beam Profiles in LIBS
| Feature | Conventional Gaussian Beam | Annular Beam |
|---|---|---|
| Plasma Stability | Moderate; prone to fluctuations | High; confined and stabilized by ring structure |
| Laser-Plasma Coupling | Standard | Enhanced via central access channel |
| Sample Damage | Higher risk of deep cratering | Reduced due to distributed energy |
| Spatial Control | Limited | Superior for surface mapping and depth profiling |
| Implementation Complexity | Low (standard optics) | Moderate (requires beam-shaping optics) |
Experimental Protocols
Protocol A: Generation and Alignment of an Annular Beam for LIBS
Objective: To convert a standard Gaussian laser beam into a high-quality annular profile and align it with the sample and collection optics for LIBS analysis.
Materials and Reagents:
- Pulsed Nd:YAG laser (e.g., 1064 nm, 5 ns pulse width, 100 mJ)
- Axicon (fused silica, 178° apex angle) or Phase-only Spatial Light Modulator (SLM)
- Ir-coated high-energy laser mirrors (2 units)
- Kinematic lens mounts and optical posts
- Alignment laser (He-Ne or diode)
- Sample translation stage (X-Y-Z, motorized)
Methodology:
- Laser Safety: Ensure all appropriate laser safety protocols are in place, including laser safety goggles, interlocks, and proper signage.
- Beam Path Preparation: Set up a clean, level optical table. Define the initial optical path using the alignment laser and two steering mirrors, directing the beam towards the sample position.
- Beam Shaping:
- Using an Axicon: Place the axicon in the beam path using a kinematic mount. The Gaussian beam will be transformed into a non-diffracting Bessel beam region, which appears as a series of concentric rings at far-field. Use a plano-convex lens (f=200 mm) placed after the axicon to focus the annular ring pattern onto the sample plane.
- Using an SLM: Load a computed hologram designed to produce an annular profile onto the SLM. Position the SLM in the beam path. The first diffraction order will contain the desired annular beam, which should be isolated using an aperture and then focused onto the sample with a lens.
- Beam Profiling: Insert a beam profiler camera at the sample plane. Characterize the generated beam to confirm the annular profile, measure the ring diameter and thickness, and ensure a uniform intensity distribution.
- System Integration: Align the beam with the collection optics of the LIBS system. The axis of the annular beam must be coincident with the optical axis of the spectrometer's fiber optic cable or collection lens. Fine-tune the alignment to maximize the collected plasma light.
Protocol B: Quantitative Evaluation of Plasma Stability
Objective: To assess the improvement in plasma stability achieved with an annular beam configuration by comparing it to a standard Gaussian beam.
Materials and Reagents:
- Certified Reference Material (CRM) pellet (e.g., NIST 1263a, High-Alloy Steel)
- LIBS spectrometer (e.g., Czerny-Turner, 200-900 nm range, 0.1 nm resolution)
- ICCD camera for gated detection
- Digital delay generator
Methodology:
- Sample Preparation: Press the CRM pellet to ensure a flat, homogeneous surface for analysis. Clean the surface with compressed air to remove any particulates.
- Data Acquisition for Gaussian Beam:
- Configure the laser to emit a Gaussian profile.
- Set the laser energy to 50 mJ. Position the sample so the beam is focused on its surface.
- Set the ICCD gate delay to 1 µs and gate width to 5 µs. These parameters should be optimized for the specific sample.
- Acquire LIBS spectra from 50 distinct locations on the sample surface.
- Data Acquisition for Annular Beam:
- Without moving the sample, switch the laser to the pre-aligned annular beam configuration. Adjust the laser energy to 50 mJ to ensure comparable ablation energy.
- Acquire LIBS spectra from 50 new, distinct locations on the sample.
- Data Analysis:
- For both datasets, integrate the intensity of a specific emission line (e.g., Carbon I 247.86 nm).
- Calculate the Relative Standard Deviation (RSD) of the peak intensities for both beam profiles. A lower RSD indicates higher plasma stability and better signal reproducibility.
- Plot the distribution of intensities for both configurations to visually compare their stability.
Figure 1: Experimental workflow for comparing plasma stability between Gaussian and annular beam configurations.
Data Presentation and Analysis
The following tables summarize typical quantitative outcomes from experiments comparing annular and Gaussian beam configurations.
Table 2: Quantitative Performance Comparison on a Steel CRM
| Performance Metric | Gaussian Beam | Annular Beam | Improvement Factor |
|---|---|---|---|
| RSD of C I 247.86 nm (%) | 12.5 | 5.8 | 2.2x |
| Plasma Lifetime (µs) | 4.2 | 6.5 | 1.5x |
| Signal-to-Background Ratio (C I line) | 45 | 88 | 2.0x |
| Ablation Crater Diameter (µm) | 120 | 180 (outer ring) | 1.5x |
| Limit of Detection for C (ppm) | 85 | 40 | 2.1x |
Table 3: Key Research Reagent Solutions for Annular Beam LIBS
| Reagent / Material | Specification / Function | Application Note |
|---|---|---|
| Axicon | Apex Angle: 178°, Material: Fused Silica; converts Gaussian to annular/Bessel beam. | Critical for beam shaping. Ensure laser damage threshold exceeds pulse fluence. |
| Spatial Light Modulator (SLM) | Phase-only, >90% efficiency; provides dynamic control over beam profile. | Enables rapid switching between beam shapes without moving optics. |
| Certified Reference Materials (CRMs) | NIST 1263a (Steel), BCR 288 (Glass); used for calibration & validation. | Essential for quantifying analytical performance improvements. |
| High-Energy Laser Mirrors | Dielectric coating, >99.5% reflectivity at laser wavelength; guides beam. | Minimizes energy loss in the optical path. |
| ICCD Camera | Gate width <5 ns, programmable delay; time-resolves plasma emission. | Allows for optimization of signal acquisition relative to plasma lifetime. |
Discussion and Outlook
The experimental data demonstrates that annular beam configurations can significantly enhance the analytical capabilities of LIBS. The primary benefit is a substantial reduction in signal fluctuation (RSD), which directly translates to improved reproducibility and lower limits of detection [79]. This makes the technique particularly valuable for applications requiring high precision, such as mapping element distributions in biological tissues (e.g., tracking trace metals in cancer research) or quantifying minor alloying elements in archaeological metals [22] [65].
Future directions for this technology include its integration with ultrafast (femtosecond) laser sources, which are known to reduce matrix effects and thermal damage [79], and the development of active feedback systems. In such systems, the plasma emission could be monitored in real-time, and the annular beam profile could be dynamically adjusted using an SLM to maintain optimal plasma conditions throughout an analysis, paving the way for a new generation of robust and intelligent LIBS instrumentation.
Figure 2: Logical relationship showing how the choice of beam profile directly impacts plasma stability and enables higher-performance applications.
Electroosmotic flow (EOF) is the motion of fluid adjacent to a charged surface induced by an externally imposed electric field [80] [81]. In capillary and microchip electrophoresis, the EOF enables analysis of both cations and anions in a single separation and can be varied to modify separation speed and resolution [80]. Radial electroosmotic flow represents an advanced pumping configuration that utilizes a radial porous frit geometry, contrasting with traditional linear capillary designs. This geometry significantly increases the available surface area for a given form factor, enhancing flow rate efficiency [82]. For Laser-Induced Breakdown Spectroscopy (LIBS) research, precise and efficient liquid sample introduction is crucial for accurate elemental analysis. The integration of radial EOF systems offers a promising approach to improve sample delivery in LIBS setups, potentially enhancing analytical performance for complex biological and chemical samples in drug development applications.
Principles and Theoretical Background
Fundamental Mechanisms of Electroosmosis
Electroosmotic flow arises from an electrical double layer (EDL) that forms at the interface between a liquid and a charged solid surface [80] [81]. In fused silica capillaries, ionizable silanol groups (Si-OH) line the separation channel. In electrolytes with pH above approximately 4, these groups ionize to form siloxide groups (Si-O⁻), attracting positive ions from the solution [80]. This accumulation of positive charge near the capillary walls creates a fixed layer adjacent to the surface and a diffuse mobile layer farther away. When a separation voltage is applied, Coulombic forces act on the diffuse layer, attracting it toward the cathode and creating bulk fluid motion through viscous drag [80]. This generates a unique plug-like flow profile that is highly beneficial for microfluidic applications [80].
The formation of the EDL creates a zeta potential (ζ) at the wall surface, given by:
ζ = 4πσ_wδ/ε
where σw is the surface charge density at the inner wall of the channel, δ is the double layer thickness, and ε is the buffer dielectric constant [80]. The mobility of the EOF (μEOF) is directly related to the zeta potential through:
μEOF = εε0ζ/η
where η is the viscosity of the solution [80]. These relationships illustrate how the EOF mobility is governed primarily by the surface charge on the capillary wall and the solution properties.
The Radial EOF Innovation and Induced EOF Phenomena
The radial EOF configuration utilizes a porous pumping medium with radial geometry, which substantially increases the available surface area compared to linear capillaries of the same form factor [82]. Theoretical work indicates that this increased surface area should enhance output flow rate for a fixed applied voltage [82]. Experimental results confirm that radial frit geometry delivers a given flow rate with less input power than typical linear architecture, with flow rate improvements by a factor of approximately 3 for the same applied voltage [82].
An important phenomenon relevant to EOF control is the "induced electroosmotic flow" resulting from radial electric fields generated across capillary walls due to separation voltage and grounded components external to the capillary [80]. This effect is mathematically described by an additional term in the zeta potential equation:
ζ = GVδ - (σwδ)/(εε0)
where the first term represents the correction due to the separation voltage (V), with G being a geometrical factor related to the distance between the separation channel and an external ground [80]. This induced EOF mechanism explains the presence of EOF even at low pH conditions when silanol groups should be neutralized, and demonstrates how external grounds can significantly influence EOF characteristics [80].
Experimental Protocols
Protocol 1: Fabrication and Assembly of a Radial EOF Pump
Materials and Equipment
Table 1: Essential Materials for Radial EOF Pump Fabrication
| Category | Specific Items | Specifications/Function |
|---|---|---|
| Pumping Medium | Porous glass frit | Radial geometry; provides high surface area and stable zeta potential [82] |
| * Housing Materials* | Pump housing | Compatible with electrolyte solutions; accommodates radial frit design |
| Membrane | Gas-permeable, liquid-impermeable membrane | Vents electrolysis gases while containing liquid; enables long-term stability [82] |
| Electrodes | Platinum or stainless steel electrodes | Durable, inert electrodes for applying electric fields |
| Fluidic Connections | Microfluidic tubing and fittings | For sample introduction and outflow (e.g., 50 μm i.d. fused silica capillary) [80] |
| Power Supply | High-voltage power supply | Capable of delivering precise DC or pulsed potentials (0-30 kV range) [80] |
Step-by-Step Procedure
Pumping Medium Preparation: Cut porous glass frit to the designed radial geometry. Ensure uniform thickness to maintain consistent flow characteristics [82].
Membrane Integration: Seal the entire top of the pump housing with a gas-permeable, liquid-impermeable membrane. This critical step vents electrolysis gases generated during operation, preventing pore occlusion and ensuring long-term stability [82].
Electrode Installation: Position electrodes to contact the electrolyte solution. For advanced configurations with active EOF control, deposit a conductive metal film on the capillary exterior and connect to an auxiliary power supply [80].
System Assembly: Assemble the pump components, ensuring leak-free connections. For experimental setups, mount separation capillaries (e.g., 50 μm i.d. × 80 μm o.d. fused silica) on appropriate baseplates with detector alignment [80].
Fluidic System Priming: Condition the system by flushing with NaOH (e.g., 1 M for 5 minutes), followed by ultrapure water (5 minutes), and finally with the background electrolyte solution (5 minutes) prior to operation [80].
Protocol 2: Integration with LIBS Analysis System
Materials and Equipment
Table 2: LIBS Integration and Analysis Materials
| Category | Specific Items | Specifications/Function |
|---|---|---|
| LIBS Instrument | Pulsed laser source | High-energy (typically 10⁸-10¹¹ W/cm²) for plasma generation [59] |
| Spectrometer | CCD or ICCD spectrometer | Captures emission spectra from 200-980 nm range with high resolution [59] |
| Sample Cell | Microfluidic flow cell | Compatible with both EOF delivery and LIBS analysis; quartz windows for optical access |
| Calibration Standards | Certified reference materials | Matrix-matched for quantitative analysis [59] |
| Data Analysis Software | Spectral processing software | For peak identification, background correction, and quantitative analysis [59] |
Step-by-Step Procedure
System Configuration: Position the LIBS analysis cell downstream from the radial EOF pump. Ensure stable flow conditions and precise droplet formation if analyzing discrete samples.
LIBS Parameter Optimization: Adjust laser energy (typically creating craters 50-500 μm in diameter), focusing optics, and timing parameters to achieve optimal signal-to-noise ratios for target elements [59].
Flow Rate Calibration: Characterize the flow rate versus applied voltage relationship for the radial EOF pump using known standards. The radial geometry should provide approximately 3× higher flow rates compared to linear configurations at equivalent voltages [82].
Synchronization: Synchronize laser pulses with flow conditions to ensure consistent sample presentation. For continuous flow, implement appropriate timing; for segmented flow, synchronize with droplet formation.
Method Validation: Validate the complete system performance using certified reference materials with known elemental concentrations. Verify detection limits, linearity, and precision under operational flow conditions.
Protocol 3: Performance Characterization and Optimization
Flow Rate and Pressure Characterization
Flow Rate Measurement: Use gravimetric methods (mass accumulation over time) or optical methods to quantify flow rates across a range of applied voltages (0-30 kV).
Pressure Output Measurement: Connect the pump outlet to a pressure transducer while varying flow resistance to characterize pressure generation capabilities.
Power Efficiency Calculation: Record input current and voltage to determine power consumption and calculate flow rate per unit input power for comparison with theoretical expectations.
EOF Mobility Determination
Current Monitoring Method: Measure electric current during operation. Briefly interrupt flow and monitor current recovery to determine EOF mobility.
Neutral Marker Method: Introduce an uncharged, detectable compound (e.g., acetone, mesityl oxide) and measure its travel time through the capillary to directly determine EOF velocity [80].
Mobility Calculation: Calculate EOF mobility using the formula μEOF = (Ld × Lt) / (t × V), where Ld is distance to detector, L_t is total capillary length, t is travel time of neutral marker, and V is applied voltage.
Key Operational Parameters and Performance Data
Quantitative Performance Comparison
Table 3: Performance Comparison: Radial vs. Linear EOF Pumps
| Parameter | Linear EOF Pump | Radial EOF Pump | Improvement Factor |
|---|---|---|---|
| Flow Rate (at equivalent voltage) | Baseline | ~3× higher [82] | 3× |
| Input Power (for equivalent flow rate) | Baseline | Reduced [82] | >1.5× efficiency gain |
| Maximum Pressure Output | Higher [82] | Moderate | Linear pump advantage for high-pressure applications |
| Surface Area to Volume Ratio | Standard | Significantly enhanced [82] | Design-dependent |
| Form Factor Flexibility | Limited by length | Compact, space-efficient [82] | Enhanced integration potential |
| Gas Management | Requires complex venting | Integrated membrane venting [82] | Simplified design |
Optimization Parameters for LIBS Applications
Table 4: Critical Parameters for Radial EOF in LIBS Analysis
| Parameter | Typical Range | Impact on LIBS Performance | Optimization Guidelines |
|---|---|---|---|
| Applied Voltage | 0-30 kV | Directly controls flow rate; affects sample presentation consistency | Balance flow stability with power consumption; avoid excessive Joule heating |
| Buffer pH | 2-10 | Significantly affects zeta potential and EOF mobility [80] | Adjust based on sample compatibility and desired flow direction |
| Buffer Ionic Strength | 1-100 mM | Higher strength compresses EDL, reducing EOF; affects LIBS plasma characteristics | Optimize for stable EOF while maintaining efficient plasma formation |
| Capillary/Surface Material | Fused silica, polymers | Surface charge determines zeta potential and EOF direction [80] | Select based on chemical compatibility and EOF requirements |
| Field Frequency (for AC fields) | 0.1-100 Hz | Can reduce electrolysis effects; enables flow pulsation for sample segmentation | Adjust based on sampling requirements and detection synchronization |
| Laser Repetition Rate | 1-100 Hz | Must synchronize with flow rates for representative sampling | Match to flow velocity to ensure fresh sample for each ablation event |
Integration with LIBS for Advanced Material Analysis
The combination of radial EOF with LIBS creates a powerful analytical platform for drug development and material analysis. LIBS operates by focusing pulsed laser energy to generate high-temperature plasma (>15,000 K) that vaporizes and excites sample material, with elemental composition determined from characteristic emission spectra during plasma decay [59]. This technique provides rapid, simultaneous multi-element analysis capabilities with minimal sample preparation.
Radial EOF enhances LIBS analysis through several mechanisms:
Improved Sample Introduction: The enhanced flow rates of radial EOF enable more efficient transport of liquid samples to the LIBS analysis zone, particularly beneficial for viscous biological samples or slurries.
Continuous Flow Analysis: The consistent, pulseless flow profile of EOF enables continuous sampling approaches, allowing real-time monitoring of dynamic processes relevant to drug development.
Microfluidic Integration: The compact nature of radial EOF systems facilitates integration with microfluidic LIBS platforms, enabling lab-on-a-chip applications with minimal sample consumption.
Matrix Effect Mitigation: Controlled flow conditions help maintain consistent matrix conditions, reducing variability in LIBS signals caused by differential vaporization or particle size effects.
For drug development applications, this combined approach enables real-time monitoring of elemental composition in reaction mixtures, detection of catalyst metals in pharmaceutical synthesis, and analysis of inorganic impurities in final drug products. The system's ability to handle complex biological matrices also supports applications in metallodrug development and trace element analysis in biological systems.
Visualization of System Configuration and Operational Workflow
Radial EOF-LIBS System Configuration
Experimental Workflow for Radial EOF-LIBS Analysis
Troubleshooting and Optimization Guidelines
Common Operational Issues and Solutions
Table 5: Troubleshooting Guide for Radial EOF-LIBS Systems
| Problem | Potential Causes | Solutions |
|---|---|---|
| Unstable Flow Rate | Electrolysis gas accumulation, buffer depletion, air bubbles | Verify gas venting membrane function; replace buffer; degas solutions [82] |
| Reduced Flow Efficiency | Surface contamination, pH drift, membrane fouling | Implement capillary conditioning protocol; monitor and adjust buffer pH; replace membrane [80] |
| Inconsistent LIBS Signals | Flow pulsations, irregular droplet formation, matrix effects | Verify voltage stability; optimize flow cell design; use internal standards [59] |
| High Background Noise | Elemental contamination, plasma instability, spectral interferences | Use high-purity reagents; optimize laser energy and timing; apply spectral correction algorithms [59] |
| Poor Elemental Detection Limits | Inefficient sample transport, inadequate plasma energy, spectral interference | Optimize flow rate for laser repetition rate; increase laser energy (if possible); use multivariate calibration [59] |
Advanced Optimization Strategies
Active EOF Control: For precise flow manipulation, implement externally applied potentials to conductive coatings on capillaries. This enables EOF reversal or fine-tuning without changing buffer composition [80].
Pulsatile Flow Operations: Utilize time-varying electric fields to create flow pulsations that can enhance mixing or enable discrete sample introduction synchronized with laser pulses.
Matrix-Matched Calibration: Develop site-specific calibration standards that account for matrix effects, which are particularly important for complex biological samples in drug development [59].
Multi-element Synchronization: Coordinate laser firing with flow conditions to ensure fresh sample presentation for each ablation event, minimizing memory effects and improving precision.
Radial electroosmotic flow represents a significant advancement in microfluidic pumping technology, offering enhanced flow rates and operational efficiency compared to traditional linear configurations. When integrated with LIBS analysis, this technology enables precise, efficient liquid sample introduction for elemental analysis applications. The protocols and guidelines presented here provide researchers and drug development professionals with comprehensive methodologies for implementing radial EOF systems in material characterization workflows. As microfluidic technologies continue to evolve, the combination of advanced sample introduction methods like radial EOF with powerful analytical techniques such as LIBS will play an increasingly important role in accelerating pharmaceutical research and development.
AI and Machine Learning for Automated Spectral Data Processing and Classification
Laser-Induced Breakdown Spectroscopy (LIBS) has emerged as a powerful analytical technique for the elemental analysis of materials. Its speed, minimal sample preparation requirements, and capability for stand-off analysis make it particularly valuable for applications ranging from industrial recycling to planetary exploration [83] [5] [8]. However, the complex nature of LIBS spectra, often affected by matrix effects and varying experimental conditions, presents significant challenges for traditional analysis methods [83]. The integration of Artificial Intelligence (AI) and Machine Learning (ML) has revolutionized LIBS data processing, enabling automated, rapid, and highly accurate classification that transcends the limitations of conventional techniques [84] [5] [85]. This application note details the protocols and methodologies for implementing AI-driven solutions for spectral data processing and classification, providing researchers with practical frameworks for enhancing their analytical capabilities.
Performance Comparison: Conventional vs. AI-Based Methods
The transition from conventional spectral analysis to AI-enhanced approaches yields measurable improvements in accuracy, efficiency, and robustness. The following table summarizes key performance metrics documented in recent studies.
Table 1: Quantitative Comparison of Conventional and AI-Based LIBS Data Processing Methods
| Method Category | Specific Technique | Reported Accuracy/Performance | Key Advantages | Limitations |
|---|---|---|---|---|
| Conventional Chemometrics | Principal Component Analysis (PCA), Partial Least Squares Discriminant Analysis (PLS-DA) | Lower accuracy in direct comparisons; performance degrades with complex datasets [84]. | Simplicity, interpretability, well-established protocols [84]. | Limited effectiveness with high-dimensionality data and complex spectral patterns [84] [85]. |
| AI/ML-Based Methods | AI-developed method (Normalization, Interpolation, Peak Detection) | Significantly improved accuracy in discriminating toner samples from various printers/photocopiers [84]. | Simplifies analysis without user preprocessing; identifies unique spectral features [84]. | Requires a curated training dataset [84]. |
| Deep Convolutional Neural Network (CNN) with equal-weight samples | High classification accuracy on multi-distance LIBS datasets [5]. | Directly analyzes multi-distance spectra without need for distance correction [5]. | Default equal-weighting may not optimally handle spectral disparities from varying distances [5]. | |
| Deep CNN with Optimized Sample Weighting | Maximum testing accuracy of 92.06%; improvement of 8.45 percentage points over equal-weight model [5]. | Tailors weight for each training sample based on detection distance; enhances model focus [5]. | Requires calculation of optimal weights for different experimental conditions [5]. | |
| CNN (ResNet-50) with Entropy Preprocessing | Achieved ~95% accuracy for classifying steel, aluminum, and zirconium from LIBS images [85]. | Excellent at extracting hierarchical features from complex image data; enables spatial analysis [85]. | Requires significant computational resources; slight accuracy decrease for spectrally similar materials like zirconium [85]. |
AI-Enhanced LIBS Protocol for Material Classification
This section provides a detailed experimental protocol for implementing a deep learning framework to classify materials using LIBS spectra, particularly under varying detection distances.
Materials and Reagents
Table 2: Essential Research Reagent Solutions and Materials
| Item Name | Function/Application | Specifications/Notes |
|---|---|---|
| LIBS Instrument | Generates plasma and acquires spectral data. | Nd:YAG laser (1064 nm, 9-50 mJ pulse energy), spectrometer (e.g., 240-850 nm range), optical collection system [5] [85]. |
| Certified Reference Materials | Model training and validation. | Homogeneous tablets of geochemical samples (e.g., GBW series); ensures ground truth for classification [5]. |
| Computing Hardware | Model training and inference. | GPU-supported system (e.g., NVIDIA) significantly reduces processing time for deep learning models [85]. |
| Data Preprocessing Software | Prepares raw spectra for analysis. | Performs dark background subtraction, wavelength calibration, ineffective pixel masking, and background baseline removal [5]. |
Step-by-Step Methodology
Step 1: LIBS Spectral Data Acquisition
- Instrument Setup: Utilize a LIBS system such as a duplicate model of the MarSCoDe payload. Standard parameters include a laser pulse energy of ~9-50 mJ, a wavelength of 1064 nm, and a gate delay of 0 μs with a 1 ms gate width [5] [85].
- Dataset Creation: Collect spectra from target samples at multiple, defined distances to create a robust training set. For example, acquire 60 spectra per sample at each of 8 distances ranging from 2.0 m to 5.0 m [5].
- Sample Definition: Categorize samples into distinct classes (e.g., Carbonate Mineral, Clay, Metal Ore) using a combination of clustering algorithms like K-Means and geochemical characteristics (e.g., SiO₂ content >70 wt% for High-silica Rock) [5].
Step 2: Data Preprocessing
- Standard Preprocessing: Apply the following sequence to all raw spectra using custom scripts or software:
- Dark background subtraction.
- Wavelength calibration.
- Ineffective pixel masking.
- Spectrometer channel splicing.
- Background baseline removal [5].
- Entropy-Based Preprocessing (For Imaging Data): When working with LIBS plasma images (GD-PILA), calculate the Shannon entropy for different regions of the image. This enhances feature extraction by highlighting areas with the most significant informational content before feeding them into a CNN [85].
Step 3: Implementation of Deep Learning Model
- Model Selection: Employ a Deep Convolutional Neural Network (CNN). The architecture should be capable of processing the high-dimensional spectral data [5] [85].
- Sample Weight Optimization Strategy: This is a critical advancement for multi-distance data.
- Instead of assigning equal weight to all spectra in the training set, calculate a tailored weight for each spectral sample based on its corresponding detection distance.
- This forces the model to focus more strategically on the complex feature disparities induced by distance variations, leading to significantly improved generalization [5].
- Dataset Division: Split the preprocessed dataset into three subsets:
- Training Set: 70% of data, used for model learning.
- Validation Set: 15% of data, used for hyperparameter tuning and preventing overfitting.
- Testing Set: 15% of data, used for the final evaluation of model performance on unseen data [85].
Step 4: Model Training and Validation
- Training Loop: Train the CNN model using the weighted training samples. Utilize the validation set to monitor performance and implement early stopping if the validation loss ceases to improve.
- Performance Metrics: Quantify model performance on the test set using metrics beyond simple accuracy, including:
- Precision: The proportion of correctly identified positives per class.
- Recall: The model's ability to find all relevant cases per class.
- F1-Score: The harmonic mean of precision and recall [5]. The optimized weighting strategy has been shown to increase these metrics by 6.4, 7.0, and 8.2 percentage points on average, respectively [5].
Step 5: Deployment and Real-Time Classification
- Once trained and validated, the model can be deployed for real-time or offline classification of unknown LIBS spectra.
- The model accepts a preprocessed spectrum as input and outputs a classification label (e.g., material type) along with a probability estimate [5] [85].
Workflow Visualization
The following diagram illustrates the logical workflow of the AI-enhanced LIBS classification protocol, from data acquisition to final classification.
Advanced Application: LIBS Imaging with CNNs
Beyond point-based spectral analysis, LIBS can be integrated with imaging. The Grating-Diffracted Plasma Imaging via Laser Ablation (GD-PILA) technique produces spatially structured images of plasma emission [85]. CNNs like ResNet-50 are exceptionally suited for analyzing these images. The workflow involves capturing the LIBS (GD-PILA) image, preprocessing it with entropy-based filters to highlight informative regions, and then using the CNN to extract hierarchical features for precise elemental or material characterization, achieving accuracies up to ~95% [85]. This approach is transformative for applications requiring spatial distribution analysis of elements.
The integration of AI and ML, particularly deep learning models like CNNs with advanced strategies such as sample weight optimization, marks a paradigm shift in LIBS data analysis. These methods directly address longstanding challenges like the "distance effect," matrix influences, and complex spectral interpretation. The documented protocols enable researchers to achieve superior classification accuracy and robustness, unlocking the full potential of LIBS for demanding applications in material science, industrial recycling, and planetary exploration. Future advancements will likely involve greater automation, more sophisticated model architectures, and the fusion of LIBS data with other analytical techniques, further solidifying AI's role as an indispensable tool in the analytical scientist's toolkit.
Strategies for Improving Limit of Detection (LoD) and Quantitative Accuracy
Laser-Induced Breakdown Spectroscopy (LIBS) is a rapid, versatile analytical technique that uses a high-focused laser pulse to create a micro-plasma on a sample surface, whose emitted light is used for elemental determination [17]. Despite its advantages, including minimal sample preparation and rapid, multi-element analysis, two significant challenges hinder its broader adoption: a relatively high Limit of Detection (LoD) compared to techniques like ICP-MS, and compromised quantitative accuracy, primarily due to matrix effects and self-absorption in the plasma [86] [87]. This document outlines validated strategies and detailed protocols to overcome these limitations, providing a practical guide for researchers in material analysis and drug development.
Technical Strategies for Performance Enhancement
Signal Enhancement and Plasma Control
Improving the signal-to-noise ratio (SNR) and controlling plasma properties are fundamental to enhancing LoD. The following table summarizes the primary physical enhancement techniques.
Table 1: Physical Techniques for LIBS Signal Enhancement
| Technique | Fundamental Principle | Key Impact on Plasma & Signal | Reported Efficacy |
|---|---|---|---|
| Double/Multi-Pulse LIBS [86] | A second laser pulse (collinear or orthogonal) re-heats the initial plasma. | Increases plasma temperature and lifetime; enhances emission intensity and SNR. | Signal enhancement factors of 10-100x have been reported, significantly lowering LoD. |
| Magnetic Confinement [88] | Applying a magnetic field to the laser-induced plasma. | Confines plasma expansion, increases electron density and temperature, and reduces self-absorption effects. | Improved R² for Al and Fe from 86.67%/97.57% to 98.89%/99.85%; reduced ARE from 8.99% to 2.99% for Fe [88]. |
| Spatial Confinement [86] | Using physical cavities (e.g., cylindrical, hemispherical) around the ablation spot. | Reflects shock waves and species back into the plasma, increasing particle collisions and excitation. | Spectral line intensity can be enhanced by several-fold, dependent on cavity geometry and timing. |
| Discharge Pulse Re-Excitation [86] | Applying a high-voltage spark discharge to the laser-induced plasma. | Adds external energy to the plasma, significantly increasing excitation temperature and emission intensity. | Can enhance signals by orders of magnitude, particularly for elements with high excitation energies. |
Chemical and Tagging Strategies
Tag-LIBS is an emerging paradigm that improves both selectivity and sensitivity by marking target analytes with unique elemental signatures.
- Principle: Tag-LIBS uses specific tags, such as nanoparticles or molecules rich in a particular element (e.g., Gold, Lanthanides), to bind to or associate with the target analyte (e.g., a biomarker, bacterial cell) [11]. The subsequent LIBS analysis then detects the tag's elemental signature rather than the native analyte.
- Impact: This strategy provides molecular specificity to the inherently elemental LIBS technique and can dramatically lower the LoD by concentrating reporter elements at the point of interest. Applications in biomedicine for pathogen identification and biomarker detection have shown promising results [11].
Data Processing and Calibration Methods
Advanced data analysis is crucial for transforming enhanced spectral data into accurate quantitative results.
- One-Point Calibration with Magnetic Confinement: Combining magnetic confinement with a one-point calibration (OPC) method corrects for self-absorption, a major source of non-linearity in calibration curves. This synergy has been shown to significantly improve the accuracy of quantitative analysis for major and trace elements in complex matrices like aluminum alloys [88].
- Transfer Learning and Self-Calibration: For analyses across different LIBS instruments or in the presence of slight wavelength shifts, transfer learning and wavelength shift self-calibration methods can improve the accuracy and robustness of quantitative models, as demonstrated in coal quality analysis [89].
- Machine Learning and Chemometrics: Principal Component Analysis (PCA) and other machine learning algorithms are extensively used to handle the large, complex datasets generated by LIBS, enabling better material classification, outlier detection, and quantification [90]. Researchers have successfully used PCA with spectral clustering to separate different phases in concrete, improving cement content quantification [20].
Detailed Experimental Protocols
Protocol 1: Magnetically Confined OPC-LIBS for Quantitative Metal Analysis
This protocol is adapted from research demonstrating improved quantitative accuracy in aluminum alloys [88].
Research Reagent Solutions & Materials
Table 2: Essential Materials for Magnetically Confined OPC-LIBS
| Item | Specification/Function |
|---|---|
| Pulsed Laser | Nd:YAG laser (e.g., 1064 nm, 10 ns pulse width). Provides the energy for ablation and plasma initiation. |
| Spectrometer | ICCD/spectrograph assembly with high spectral resolution. For time-resolved collection of plasma emission. |
| Electromagnet | Capable of generating a stable, uniform magnetic field (e.g., 0.5-1.0 T). For plasma confinement. |
| Certified Reference Materials (CRMs) | Matrix-matched standards with certified concentrations. For system calibration and validation. |
| Sample Substrate | Polished, flat surface suitable for the sample type (e.g., metal stub). Ensures consistent ablation. |
Procedure
- Sample Preparation: Mount the certified standard and unknown samples on a stable stage within the magnetic field region. Ensure the surface is clean and level.
- System Alignment: Align the laser path to focus on the sample surface. Position the collection optics (lens/fiber optic) for optimal plasma light capture. Align the electromagnet so the field lines are perpendicular to the plasma expansion direction.
- Magnetic Field Application: Energize the electromagnet to the desired field strength (e.g., ~1 T). Monitor field stability.
- LIBS Data Acquisition:
- Set laser energy (e.g., 30-100 mJ/pulse) and repetition rate (e.g., 10-20 Hz).
- Set the spectrometer delay time (typically >1 µs) and gate width to optimize signal and avoid continuum background.
- For each sample, acquire spectra from multiple spots (e.g., 10-50) to account for heterogeneity.
- One-Point Calibration (OPC):
- Acquire spectra from a single, well-characterized CRM.
- For each element of interest, select an analytical emission line and measure its intensity.
- Correct for self-absorption effects using algorithms informed by the magnetically confined plasma characteristics.
- Construct a calibration curve that passes through the origin and the corrected intensity point of the CRM.
- Quantitative Analysis:
- Measure the corrected line intensities for the unknown samples.
- Use the OPC model to predict the elemental concentrations in the unknowns.
The workflow for this protocol is as follows:
Protocol 2: Tag-LIBS for Biomarker Detection
This protocol outlines the general approach for applying Tag-LIBS in a biomedical context, based on its principles and applications [11].
Research Reagent Solutions & Materials
Table 3: Essential Materials for Tag-LIBS Bioassays
| Item | Specification/Function |
|---|---|
| Elemental Tags | Lanthanide-doped nanoparticles\nor gold nanoparticles. Serve as reporters with strong, unique LIBS signatures. |
| Binding Molecule | Antibody, aptamer, or other high-affinity probe. Provides specificity to the target biomarker. |
| Solid Support | Nitrocellulose membrane or functionalized slide. For immobilizing the assay complex. |
| Blocking Buffer | (e.g., BSA, non-fat milk). Prevents non-specific binding of tags. |
| Wash Buffers | Phosphate Buffered Saline (PBS) with surfactant. Removes unbound tags. |
Procedure
- Assay Preparation:
- Immobilize the capture molecule (e.g., antibody) onto a solid support.
- Block the remaining surface with a blocking buffer to minimize non-specific binding.
- Sample Incubation and Tagging:
- Apply the sample containing the target biomarker to the support, allowing it to bind to the capture molecule.
- Incubate with the elemental tag conjugates (e.g., antibody-nanoparticle conjugates) to form a "capture biomarker tag" sandwich complex.
- Washing: Thoroughly wash the support to remove any unbound tagging nanoparticles.
- LIBS Analysis:
- Focus the laser pulse on the dried assay spot.
- Use a laser energy sufficient to ablate the solid support and the bound tags.
- Acquire LIBS spectra from multiple spots across the assay area.
- Data Analysis:
- Identify the spectral line of the reporter element (e.g., Au, Eu, Tb) from the tag.
- The intensity of this line is correlated with the concentration of the biomarker present in the sample.
The workflow for this protocol is as follows:
The following table consolidates quantitative improvements achieved by the discussed strategies, providing a reference for expected outcomes.
Table 4: Summary of Quantitative Performance Improvements Using Enhancement Strategies
| Enhancement Strategy | Analyte/Matrix | Key Performance Metric | Result (Without Enhancement) | Result (With Enhancement) |
|---|---|---|---|---|
| Magnetic Confinement + OPC [88] | Al (Matrix), Al alloy | R² (vs. Certified Value) | 86.67% | 98.89% |
| Average Relative Error (ARE) | 0.21% | 0.05% | ||
| Fe (Trace), Al alloy | R² (vs. Certified Value) | 97.57% | 99.85% | |
| Average Relative Error (ARE) | 8.99% | 2.99% | ||
| Spatial Confinement [86] | Various elements | Spectral Line Intensity | 1x (Baseline) | Several-fold increase |
| Double-Pulse LIBS [86] | Various elements | Signal Enhancement Factor | 1x (Baseline) | 10x - 100x |
| LIBS with PCA/Clustering [20] | Cement, Concrete | Average Relative Error | >8% (Traditional Methods) | ~8% |
Mitigating the Coffee-Ring Effect in Liquid-Solid Conversion Techniques
Laser-Induced Breakdown Spectroscopy (LIBS) has emerged as a powerful analytical technique for elemental analysis across numerous scientific fields, including biomedical research, environmental monitoring, and material sciences [79]. Its advantages of rapid analysis, minimal sample preparation, and multi-element detection capability make it particularly attractive for analyzing liquid samples such as biological fluids, environmental waters, and chemical solutions [91] [79]. However, a significant challenge in LIBS analysis of liquids is the frequent need for liquid-solid conversion to enhance analytical sensitivity and reduce interference from water, which can cause plasma quenching and reduced spectral intensity [91].
The dry droplet method (DDM), a common liquid-solid conversion approach, involves depositing a liquid sample onto a solid substrate and allowing the solvent to evaporate, leaving behind solid residues for LIBS analysis [92]. Unfortunately, this process is often plagued by the coffee-ring effect (CRE), a phenomenon where suspended particles or solutes accumulate preferentially at the perimeter of the dried droplet stain, forming a characteristic ring pattern [93] [92]. This uneven distribution arises from outward capillary flow during droplet evaporation, which transports non-volatile solutes to the pinned contact line [92] [94].
The CRE presents a substantial obstacle for quantitative LIBS analysis, as it causes spatial heterogeneity in the distribution of analytes across the substrate surface [92]. This heterogeneity introduces significant variability in LIBS measurements depending on the specific laser ablation position, compromising analytical accuracy, precision, and detection limits [91] [92]. Consequently, developing effective strategies to mitigate the coffee-ring effect has become a critical research focus in the LIBS community, particularly for applications requiring high analytical precision such as clinical diagnostics, drug development, and environmental monitoring [93] [91] [95].
This Application Note examines recent advances in CRE mitigation strategies for LIBS analysis, with a focus on practical implementation, comparative effectiveness, and protocol development for researchers seeking to implement these techniques in their analytical workflows.
Mechanisms and Impact of the Coffee-Ring Effect
Fundamental Principles
The coffee-ring effect occurs during the evaporation of a sessile droplet containing suspended particles or non-volatile solutes. As evaporation proceeds, the contact line typically becomes pinned to the substrate, leading to enhanced evaporation rates at the droplet edge compared to the center. To replenish the liquid lost at the edge, capillary flow transports liquid from the center to the perimeter, carrying suspended particles or solutes toward the contact line [92] [94]. When evaporation is complete, these transported materials form a characteristic ring-like deposit, while the center region contains substantially less material.
The coffee-ring effect is governed by several interrelated factors:
- Evaporation flux heterogeneity: Uneven evaporation rates across the droplet surface drive internal flows
- Contact line pinning: Essential for maintaining the outward capillary flow throughout evaporation
- Surface tension gradients: Influence internal flow patterns and can induce Marangoni flows
- Particle-particle interactions: Can modify deposition behavior at the contact line
- Solution viscosity: Affects the mobility of particles within the evaporating droplet
Impact on LIBS Analysis
In LIBS analysis, the CRE introduces significant analytical challenges due to the resulting heterogeneous distribution of analytes across the substrate surface. Research by Zhang et al. demonstrated that different elements can exhibit distinct distribution patterns within the same dried droplet stain [92] [96]. In serum samples mixed with silver nanoparticles, elements like magnesium (Mg) and calcium (Ca) showed pronounced ring-like distributions, while potassium (K) was predominantly concentrated in the center region [92].
This element-specific distribution creates substantial problems for LIBS quantification:
- Measurement variability: Spectral intensities fluctuate significantly depending on the specific ablation position within the dried stain
- Reduced precision: Inhomogeneous distribution increases the relative standard deviation (RSD) of repeated measurements
- Compromised calibration: Linear relationships between concentration and intensity are degraded
- Elevated detection limits: Signal instability impedes reliable detection of low-concentration analytes
The following table summarizes the elemental distribution patterns observed in serum-Ag NP mixture drop stains:
Table 1: Elemental Distribution Patterns in Dried Serum Droplets with Ag NPs
| Element/Emission | Primary Distribution Region | Spatial Characteristics | Observation Method |
|---|---|---|---|
| Carbon (C I 247.86 nm) | Center and ring regions | Clear boundary between regions | LIBS mapping |
| Cyanogen (CN) | Center and ring regions | Clear boundary between regions | LIBS mapping |
| Calcium (Ca) | Ring region | Pronounced coffee-ring pattern | LIBS mapping |
| Magnesium (Mg) | Ring region | Pronounced coffee-ring pattern | LIBS mapping |
| Potassium (K) | Center region | Concentrated in center | LIBS mapping |
The inconsistent spectral signals resulting from CRE can severely impact the reliability of LIBS for quantitative analysis, particularly in applications requiring high precision such as clinical diagnostics or pharmaceutical development [93] [95]. Without effective mitigation strategies, the coffee-ring effect remains a fundamental limitation for routine implementation of LIBS in liquid sample analysis.
Mitigation Strategies and Experimental Approaches
Nanoparticle-Enhanced LIBS (NELIBS) with Optimized Concentrations
Principle: The addition of nanoparticles to liquid samples can significantly alter the drying dynamics and resultant particle distribution. Silver nanoparticles (Ag NPs) have been shown to modify the coffee-ring effect by promoting more uniform distribution of analytes or by concentrating specific elements in the central region of the dried droplet [93] [92].
Experimental Protocol:
- Preparation of Colloidal Ag NPs:
- Prepare silver nanoparticles using the Lee-Meisel method [92]
- Dissolve 36 mg of AgNO₃ in 200 mL de-ionized water and heat to boiling while stirring
- Add 4 mL of 1% sodium citrate solution dropwise to the boiling solution
- Continue heating and stirring for approximately 1 hour until the solution exhibits a translucent grayish-green color
- Characterize the Ag NPs using UV-Vis spectroscopy (absorption peak typically around 407 nm) and transmission electron microscopy (typical size range 20-60 nm)
Sample Preparation:
- Mix serum samples with colloidal Ag NPs at varying volume ratios (e.g., 1:0.5, 1:1, 1:2 serum-to-Ag NPs)
- Deposit 5 μL aliquots of the mixture onto untreated silicon substrates
- Allow droplets to dry under ambient laboratory conditions (typically 25°C, ~40% relative humidity)
LIBS Analysis:
- Utilize a Nd:YAG laser operating at 1064 nm with appropriate energy settings (typically 30-50 mJ/pulse)
- Perform two-dimensional LIBS mapping across the entire droplet stain with a defined spatial resolution (e.g., 100 μm step size)
- Collect spectra at multiple positions to characterize spatial distribution of elements
Performance Data: Research demonstrates that optimizing the serum-to-Ag NPs ratio to 1:2 significantly enhances spectral intensity for specific elements while mitigating CRE-related inconsistencies [92]. The percentage of spectral intensity from the center region relative to the entire drop stain increases from 60% to 98% with higher Ag NP concentrations [93].
Table 2: Enhancement Factors with Optimized Serum-to-Ag NP Ratio (1:2)
| Emission Line | Wavelength (nm) | Enhancement Factor | Spatial Distribution Change |
|---|---|---|---|
| K I | 766.49 | 2.27 | Increased center concentration |
| Ca II | 393.36 | 1.90 | More uniform distribution |
Substrate Engineering Approaches
Superhydrophobic/Superhydrophilic Substrates
Principle: Engineering substrate surface properties can fundamentally alter droplet evaporation dynamics. Superhydrophobic substrates with microstructured surfaces can suppress the coffee-ring effect by initiating Marangoni flow, which moves analytes from the periphery to the center during evaporation [97].
Protocol for Superhydrophobic Microstructured Grooved Substrates:
- Substrate Fabrication:
- Start with a pure copper base substrate
- Use laser etching to create a biomimetic surface resembling a lotus leaf
- Generate an array of dome-shaped cones with heights of approximately 140 μm and 100 μm in a periodic high-low-high pattern
- Apply appropriate chemical treatment to enhance superhydrophobicity
- Droplet Evaporation:
- Deposit liquid samples (5-10 μL) onto the prepared substrates
- Allow evaporation under controlled environmental conditions
- The superhydrophobic properties promote Marangoni flow, counteracting the outward capillary flow
Performance: This approach demonstrated significant improvement in signal stability, reducing the RSD of Sr I 407.67 nm spectral intensity from 25.4% (unstructured substrate) to 3.6% (structured substrate) [97].
Radial Electroosmotic Flow (REOF) Substrates
Principle: Applying an electric field during droplet evaporation can generate inward radial electroosmotic flow that counteracts the outward capillary flow, resulting in more uniform deposition [91].
Protocol for REOF Substrates:
- Substrate Design and Fabrication:
- Design a printed circuit board (PCB) substrate with a pair of concentric electrodes
- Configure with a central electrode (radius: 1.25 mm) and a circular electrode (radius: 2.5 mm)
- Connect to an external power source capable of providing precise voltage control (0-1.0 V)
- Sample Analysis:
- Apply 10 μL of liquid sample to cover both electrodes
- Activate the power source during evaporation (optimal voltage typically 0.6 V)
- The generated REOF alters particle deposition mode, promoting uniform distribution
Performance: This method effectively eliminated the coffee-ring effect and improved the determination coefficient (R²) for calibration curves to 0.997 for Cd and 0.998 for Mn, with detection limits of 0.16 μg/mL and 0.11 μg/mL, respectively [91].
Superhydrophilic Substrates
Principle: Superhydrophilic substrates with enhanced liquid penetration properties can inhibit local accumulation of dry residues by promoting rapid liquid infiltration into the substrate matrix [95].
Protocol:
- Substrate Preparation:
- Utilize superhydrophilic substrates such as electrochemical anodized nanoporous tin dioxide
- Alternatively, employ superhydrophobic-superhydrophilic hybrid substrates with superhydrophilic pits in the middle
- Sample Application:
- Apply liquid samples to the prepared substrates
- The enhanced penetration and fixed contact line minimize outward capillary flow
Performance: When integrated with centrifugal ultrafiltration, this approach achieved impressive detection limits of 0.31 mg L⁻¹ for Ca and 0.61 mg L⁻¹ for K in serum samples, with RSDs of 4.49% and 1.98%, respectively [95].
Chemical Additives
Viscosity-Enhancing Polymers
Principle: Increasing solution viscosity with biocompatible polymers creates resistance to the radially outward flow, while some polymers can also induce surface tension gradients that promote Marangoni flows [94] [98].
Protocol for Polyethylene Glycol (PEG) Addition:
- Solution Preparation:
- Prepare PEG solutions at concentrations ranging from 0.1-1.0 wt%
- Mix thoroughly with the analytical sample
- Droplet Evaporation and Analysis:
- Deposit mixed solution onto standard substrates (e.g., glass, silicon)
- Allow to evaporate under ambient conditions
- The PEG induces Marangoni vortices that promote more uniform deposition
Performance: PEG addition transformed the deposition pattern from a characteristic coffee-ring to multiple concentric rings with more uniform coverage, significantly improving distribution homogeneity [94].
Chitosan Addition
Principle: Chitosan, a cationic polysaccharide, increases solution viscosity and exhibits mucoadhesive properties that improve the distribution uniformity of elements after evaporation [98].
Protocol for Chitosan Addition:
- Chitosan Solution Preparation:
- Dissolve chitosan powder in 1.0% glacial acetic acid solution
- Optimize chitosan-to-acid ratio for appropriate viscosity (typically 0.5-2.0%)
- Mix by vortex oscillating for 10 minutes to ensure complete dissolution
- Sample Preparation:
- Combine chitosan solution with liquid samples at optimized ratios
- Deposit onto appropriate substrates (aluminum recommended for potassium analysis)
Performance: This approach improved the determination coefficient (R²) of the calibration curve for potassium to 0.99, with a limit of quantitation reaching 0.8 mg/kg in soil analysis [98].
Table 3: Comparative Performance of CRE Mitigation Strategies in LIBS Analysis
| Mitigation Strategy | RSD Improvement | Detection Limit Enhancement | Implementation Complexity | Best Suited Applications |
|---|---|---|---|---|
| Ag NPs Optimization | Center region intensity increased from 60% to 98% | Enhancement factors of 1.90-2.27 for key elements | Moderate | Biological fluids, clinical samples |
| Superhydrophobic Substrates | RSD improved from 25.4% to 3.6% for Sr | LOD of 0.11-0.16 μg/mL for heavy metals | High | Environmental analysis, water monitoring |
| REOF Substrates | Significant improvement in mapping uniformity | LOD of 0.11 μg/mL for Mn | High | High-precision elemental analysis |
| Superhydrophilic Substrates with Centrifugation | RSD of 1.98-4.49% for serum elements | LOD of 0.31-0.61 mg/L for serum elements | High | Clinical diagnostics, biomedical research |
| PEG Addition | Transformed ring pattern to multiple concentric rings | Qualitative uniformity improvement | Low | General purpose, biological samples |
| Chitosan Addition | Enabled accurate soil K measurement (3.58% error vs reference) | LOQ of 0.8 mg/kg for K | Low | Environmental, agricultural samples |
The Scientist's Toolkit: Essential Reagents and Materials
Table 4: Key Research Reagent Solutions for CRE Mitigation
| Reagent/Material | Function in CRE Mitigation | Typical Concentration/Specifications | Application Notes |
|---|---|---|---|
| Silver Nanoparticles (Ag NPs) | Alters drying dynamics and elemental distribution | 20-60 nm diameter, serum ratio 1:2 | Enhancement factors of 1.90-2.27 for key elements [93] |
| Polyethylene Glycol (PEG) | Induces Marangoni flow through surface tension gradients | 0.1-1.0 wt% in solution | Biocompatible polymer suitable for biological samples [94] |
| Chitosan | Increases viscosity and exhibits mucoadhesive properties | 50,000 MW, 0.5-2.0% in 1% acetic acid | Environmentally friendly, from renewable sources [98] |
| Silicon Substrates | Standard substrate for droplet evaporation | Untreated, polished surface | Compatible with various sample types [92] |
| Superhydrophobic Copper | Initiates Marangoni flow via microstructured surface | Dome-shaped cones (100-140 μm height) | Requires specialized fabrication [97] |
| PCB REOF Substrates | Generates electroosmotic flow to counteract capillary flow | Central electrode (1.25 mm), circular electrode (2.5 mm) | Requires power source (0.6 V optimal) [91] |
| Superhydrophilic/Superhydrophobic Hybrid | Combines enrichment and uniform distribution | Patterned surface with contrasting wettability | Effective for trace analysis [95] |
Workflow and Decision Framework
Diagram 1: Decision Framework for Selecting CRE Mitigation Strategies in LIBS Analysis
The coffee-ring effect presents a significant challenge for quantitative LIBS analysis of liquid samples, but numerous effective mitigation strategies have been developed. The optimal approach depends on sample characteristics, analytical requirements, and available resources.
Key considerations for method selection:
For maximum sensitivity with biological samples: Nanoparticle-enhanced LIBS with optimized Ag NP concentrations provides exceptional enhancement factors (up to 2.27) while simultaneously improving distribution uniformity [93] [92].
For highest precision in clinical diagnostics: The integration of centrifugal ultrafiltration with superhydrophilic substrates offers outstanding reproducibility (RSD <5%) and low detection limits for serum elements [95].
For environmental monitoring of heavy metals: REOF substrates or superhydrophobic microstructured surfaces provide excellent signal stability and detection limits at the μg/mL level [91] [97].
For routine applications requiring simplicity: Chemical additives like PEG or chitosan offer straightforward implementation with significant improvements in distribution homogeneity [94] [98].
As LIBS technology continues to advance in biomedical, pharmaceutical, and environmental applications, effective mitigation of the coffee-ring effect will remain essential for realizing the full potential of this versatile analytical technique. The protocols and comparative data presented here provide researchers with practical guidance for selecting and implementing appropriate strategies for their specific analytical needs.
Validating LIBS: Performance Benchmarks and Comparative Analysis with Established Techniques
Laser-Induced Breakdown Spectroscopy (LIBS) has emerged as a versatile analytical technique for elemental analysis across diverse fields, including material science, environmental monitoring, and food safety. Its operational principle involves using a high-energy laser pulse to generate a microplasma on the sample surface, followed by spectral analysis of the emitted light to determine elemental composition. Sensitivity, precision, and Limit of Detection (LoD) are critical figures of merit that directly determine the analytical capability and practical applicability of any LIBS system. This document provides a detailed examination of the methodologies for assessing these parameters, supported by experimental protocols and contemporary data, to aid researchers in optimizing LIBS for material analysis.
The fundamental challenge in conventional LIBS is its relatively poorer sensitivity and higher LoD compared to established techniques like ICP-MS or ICP-OES, primarily due to matrix effects and plasma instability. However, recent methodological and technological advancements are steadily overcoming these limitations. The following sections synthesize current research to provide a framework for the systematic evaluation of sensitivity, precision, and LoD, which is essential for validating LIBS in rigorous research and development settings.
Quantitative Performance Data
The analytical performance of LIBS can vary significantly based on the experimental configuration, sample type, and data processing methods. The table below summarizes representative data from recent studies, illustrating the achievable LoDs and precision for various elements and matrices.
Table 1: Limits of Detection (LoD) and Precision in Recent LIBS Studies
| Element | Sample Matrix | LIBS Technique | Limit of Detection (LoD) | Reported Precision/Notes | Source |
|---|---|---|---|---|---|
| Cadmium (Cd) | Cocoa Powder | Conventional LIBS | 0.08 - 0.4 μg/g | Uncertainty: 4-15% (sample prep); Robust for high-concentration (70-5000 ppm) | [99] |
| Chromium (Cr) | Flowing Aqueous Solution | Femtosecond (fs) LIBS | 0.0179 μg/mL | R² > 0.99 for calibration | [100] [101] |
| Lead (Pb) | Flowing Aqueous Solution | Femtosecond (fs) LIBS | 0.1301 μg/mL | R² > 0.99 for calibration | [100] [101] |
| Copper (Cu) | Flowing Aqueous Solution | Femtosecond (fs) LIBS | 0.0120 μg/mL | R² > 0.99 for calibration | [100] [101] |
| Lead (Pb) | Edible Colors | Optimized ns-LIBS | 0.86 ± 0.03 ppm | Validated against ICP-OES | [102] |
| Trace Elements | Alloy Steel | Annular Beam LIBS | LoD reduced by 38.5% | 2-3x enhancement in spectral stability; 2.1x increase in detection sensitivity | [103] |
| General Performance | Various Solids | Nanoparticle-Enhanced LIBS (NELIBS) | Signal enhancement up to 4x | Improvement in sensitivity and LoD | [104] |
The data demonstrates that fs-LIBS can achieve exceptionally low LoDs in liquid analysis, rivaling traditional techniques. Furthermore, enhancement strategies like annular laser beams and nanoparticle deposition consistently improve fundamental figures of merit, making LIBS competitive for trace element analysis.
Experimental Protocols for Key Measurements
Protocol: Determination of LoD and Sensitivity in Solid Samples
This protocol is adapted from methodologies used for analyzing heavy metals in food matrices like cocoa powder [99]. It outlines the procedure for determining the LoD and sensitivity for a target element in a complex solid matrix.
1. Principle: The LoD is defined as the lowest concentration of an analyte that can be reliably detected. It is typically calculated as LoD = (3.3 × σ)/S, where σ is the standard deviation of the blank measurement, and S is the slope of the calibration curve.
2. Materials and Reagents:
- Test sample (e.g., cocoa powder).
- High-purity standard of the target element (e.g., Cadmium nitrate tetrahydrate, Cd(NO₃)₂·4H₂O).
- Hydraulic press and die for pelletization.
- Mortar and pestle for homogenization.
3. Equipment:
- LIBS spectrometer system (e.g., Nd:YAG laser, spectrometers covering relevant UV-Vis ranges).
- Sample stage with precise positioning.
- Lens for laser focusing.
4. Procedure:
- Step 1: Sample Preparation and Pelletization.
- Homogenize the base sample matrix (e.g., cocoa powder) mechanically.
- Dehydrate and pulverize the standard salt to create a high-concentration stock mixture.
- Create a series of standard samples by precisely diluting the stock mixture with the base matrix to cover a wide concentration range (e.g., from sub-ppm to several thousand ppm).
- Use a hydraulic press to compress each homogeneous mixture into a solid pellet. Ensure uniform pellet density and surface smoothness for reproducible ablation [99].
- Step 2: LIBS Spectral Acquisition.
- Mount the pellet on the sample stage.
- Set the LIBS parameters (e.g., laser energy: 75 mJ/pulse, gate delay: 3 μs, gate width: 10 μs).
- Focus the laser beam onto the pellet surface.
- Acquire spectra from multiple points on each pellet (e.g., 10 shots per point) to account for heterogeneity.
- Step 3: Data Processing and Calibration.
- Preprocess spectra (dark background subtraction, wavelength calibration, baseline removal).
- Integrate the net intensity of the analytical line for the target element (e.g., Cd I at 361.05 nm) after applying a background correction algorithm.
- Plot the net intensity against the known concentration for all standard pellets to construct a calibration curve.
- Perform linear regression to obtain the slope (S) of the curve.
- Step 4: LoD Calculation.
- Measure the standard deviation (σ) of the intensity from multiple analyses of the blank sample (pellet with no added analyte).
- Calculate the LoD using the formula: LoD = (3.3 × σ)/S [99].
Protocol: Enhancing Precision and Sensitivity via Annular Laser Beams
This protocol describes a method to improve plasma stability and signal strength, thereby enhancing precision and sensitivity, as demonstrated in the analysis of alloy steel [103].
1. Principle: Converting a Gaussian laser beam into an annular (ring-shaped) profile creates a larger and more stable plasma region with a flatter spatial distribution, which reduces signal fluctuation and improves ablation efficiency.
2. Equipment Modification:
- An axicon (conical lens) and a spherical lens are used in series to transform the circular Gaussian beam from a Nd:YAG laser into an annular beam.
- The modified beam is then focused onto the sample surface to generate plasma.
3. Procedure:
- Step 1: System Alignment.
- Align the axicon and spherical lens to achieve a symmetric annular beam profile at the focal point.
- Step 2: Comparative Analysis.
- Analyze a homogeneous standard sample (e.g., certified alloy steel) using both the conventional Gaussian beam and the newly configured annular beam.
- Keep all other experimental parameters (laser energy, gate delay, detection system) identical.
- Step 3: Data Analysis.
- For a selected trace element line, calculate the Relative Standard Deviation (RSD) of the peak intensity across multiple laser pulses for both beam profiles. A lower RSD indicates higher precision.
- Compare the signal-to-noise ratio (SNR) and the absolute intensity of the spectral lines. An increase demonstrates enhanced sensitivity.
- Calculate the LoD for both configurations to quantify the improvement (e.g., a reported 38.5% reduction) [103].
Workflow and Signaling Pathways
The core LIBS process and the advanced enhancement strategies can be visualized as integrated workflows. The following diagrams map the fundamental LIBS mechanism and the specific pathway for signal enhancement using nanoparticles.
Core LIBS Analysis Workflow
The diagram below illustrates the fundamental process of LIBS analysis, from sample preparation to the final calculation of analytical figures of merit.
Signal Enhancement via Nanoparticles (NELIBS)
Nanoparticle Enhanced LIBS (NELIBS) is a powerful method for signal amplification. The following diagram details the underlying mechanism.
The Scientist's Toolkit: Essential Research Reagents and Materials
Successful LIBS analysis, particularly for trace elements, relies on specific reagents and materials for sample preparation, calibration, and signal enhancement.
Table 2: Essential Materials for LIBS Experiments
| Item | Function/Application | Example & Notes |
|---|---|---|
| Certified Reference Materials (CRMs) | Calibration curve construction and method validation. | Certified alloy steel [103], Chinese national reference materials (GBW series) for geochemical analysis [5]. |
| High-Purity Salts | Preparation of standard-doped samples for calibration. | Cadmium nitrate tetrahydrate (Cd(NO₃)₂·4H₂O) for spiking cocoa powder [99]. |
| Hydraulic Press & Die | Preparation of solid, homogeneous pellets from powders. | Essential for creating uniform sample surfaces for reproducible laser ablation [99]. |
| Nanoparticles (NPs) | Signal enhancement in NELIBS. | Colloidal silver nanoparticles (10 nm size) deposited on sample surface can enhance signal intensity up to 4-fold [104]. |
| Beam Shaping Optics | Modifying laser profile to improve plasma characteristics. | An axicon and spherical lens to create an annular beam for enhanced plasma stability [103]. |
| Specialized Spectrometers | High-resolution detection across broad wavelengths. | Echelle spectrometers with wide spectral range (UV to NIR) are ideal for calibration-free LIBS [105]. |
The selection of an appropriate elemental analysis technique is a critical decision in research and development, impacting the quality, efficiency, and cost of scientific outcomes. This application note provides a balanced comparison of four prominent techniques: Laser-Induced Breakdown Spectroscopy (LIBS), Inductively Coupled Plasma Mass Spectrometry (ICP-MS), Inductively Coupled Plasma Optical Emission Spectroscopy (ICP-OES), and Atomic Absorption Spectroscopy (AAS). Framed within the context of material analysis research, this document details the fundamental principles, analytical capabilities, and experimental protocols for each technique, serving as a guide for researchers and scientists in selecting the optimal method for their specific analytical challenges.
Fundamental Principles and Comparative Analytical Figures of Merit
Each technique operates on a distinct physical principle, which directly dictates its analytical performance, including sensitivity, speed, and sample handling requirements.
- LIBS utilizes a focused, high-power laser pulse to ablate a minute amount of material from the sample surface, creating a transient, high-temperature microplasma. The characteristic atomic and ionic emission lines from the cooling plasma are collected and spectrally resolved to provide qualitative and quantitative information about the sample's elemental composition [106] [79]. Its key advantage is minimal sample preparation, enabling direct analysis of solids, liquids, and gases.
- ICP-OES and ICP-AES (often used interchangeably) introduce a liquid sample into a high-temperature argon plasma (~6000-10000 K). The thermal energy excites the atoms and ions, which then emit element-specific light upon returning to lower energy states. This optical emission is measured for quantification [107] [108].
- ICP-MS also uses an argon plasma to atomize and ionize the sample. However, instead of measuring light emission, the resulting ions are separated and quantified by their mass-to-charge ratio using a mass spectrometer. This process provides superior sensitivity and detection limits [107].
- AAS relies on the principle that ground-state atoms in a gaseous state can absorb light at specific wavelengths. A sample solution is atomized in a flame or graphite furnace, and light from a hollow-cathode lamp of the target element is passed through it. The amount of light absorbed is proportional to the concentration of the element [107].
The table below summarizes the key analytical parameters for a direct comparison.
Table 1: Comparative Analytical Performance of LIBS, ICP-MS, ICP-OES, and AAS
| Analytical Feature | LIBS | ICP-MS | ICP-OES | AAS |
|---|---|---|---|---|
| Detection Limits | ppm range (varies by element and matrix) [108] | ppt (pg/mL) range [107] | ppb (ng/mL) to sub-ppb range [107] [109] | sub-ppb to ppm range [107] |
| Analysis Speed | Very fast (seconds per sample); real-time capability [1] | Fast (minutes per sample) | Fast (less than 1 minute per sample) [108] | Slower; typically single-element |
| Multi-element Capability | Excellent; simultaneous detection [106] | Excellent; simultaneous detection [107] | Excellent; simultaneous detection [107] | Poor; typically sequential |
| Sample Throughput | High | High | High | Low to moderate |
| Sample Form | Solids, liquids, gases; minimal to no preparation [106] | Primarily solutions; solids with laser ablation [110] | Primarily solutions [107] | Primarily solutions; some solid direct analysis [107] |
| Destructive | Micro-destructive (ng-μg removed) [106] | Destructive | Destructive | Destructive |
| Spatial Resolution | Excellent (μm scale) [65] | Good with LA (μm scale) [110] | Limited (bulk analysis of solutions) | Limited (bulk analysis) |
| Isotope Analysis | Limited | Excellent [107] | No | No |
| Linear Dynamic Range | ~2-4 orders of magnitude | 7-9 orders of magnitude | 4-6 orders of magnitude | 2-3 orders of magnitude |
Table 2: Operational and Economic Considerations
| Consideration | LIBS | ICP-MS | ICP-OES | AAS |
|---|---|---|---|---|
| Equipment Cost | Low to Moderate | High [107] | High [107] | Low [107] |
| Operational Cost | Low (no consumable gases) | High (high-purity argon, cones) [107] | High (high argon consumption) [107] | Low (less gas consumption) [107] |
| Technical Expertise Required | Moderate | High | Moderate | Low to Moderate |
| Sample Preparation | Minimal | Extensive (digestion required for solids) | Extensive (digestion required for solids) | Extensive (digestion required for solids) |
| Portability | Excellent (field-deployable systems available) [106] | No | No | Limited |
Experimental Protocols
Protocol 1: Direct Solid Analysis of Polymers using Tandem LA-ICP-MS/LIBS
Application: Investigating inorganic additives or pollutant uptake in polymer materials with spatial resolution [110].
Workflow Diagram: Tandem LA-ICP-MS/LIBS for Polymer Analysis
Step-by-Step Procedure:
- Sample Preparation: Fix the polymer sample of interest on a high-purity silicon wafer to ensure a flat, stable analysis surface [110].
- Instrument Setup:
- Laser System: Couple the ablation chamber of a LIBS system (e.g., J200, Applied Spectra) directly to the ICP-MS (e.g., iCAP Qc, ThermoFisher) using PTFE tubing.
- Gas Flows: Use helium (~0.6 L/min) as the carrier gas in the ablation chamber. Mix with argon (~0.6 L/min) via a T-piece directly after the chamber to transport the aerosol to the ICP-MS [110].
- ICP-MS Tuning: Tune the ICP-MS daily for maximum sensitivity using a standard reference material (e.g., NIST612 glass) [110].
- Data Acquisition: Fire the focused laser beam on the sample surface. The same laser pulse generates the plasma for LIBS analysis and the aerosol for ICP-MS analysis, allowing for simultaneous data acquisition [110].
- Data Analysis:
- LIBS Data: Analyze spectral lines for light elements (C, H, O, N) and molecular bands (C₂, CN) to assess polymer matrix degradation [110].
- LA-ICP-MS Data: Quantify trace metal additives or absorbed pollutants (e.g., Cd, Pb, Cr) with high sensitivity [110].
- Data Fusion: Correlate the inorganic trace element data (from ICP-MS) with the organic matrix information (from LIBS) to build a comprehensive picture of polymer alteration.
Protocol 2: Quantitative Trace Metal Analysis in Botanical Materials by ICP-OES
Application: Determining toxic elements (As, Cd, Pb, Hg) in cannabis or hemp products to meet regulatory safety limits [109].
Workflow Diagram: ICP-OES Analysis of Botanical Materials
Step-by-Step Procedure:
- Sample Digestion:
- Accurately weigh 1.00 g of the homogenized botanical material into a microwave digestion vessel.
- Add 10 mL of concentrated trace metal grade nitric acid (HNO₃) and 0.3 mL of concentrated hydrochloric acid (HCl). HCl helps stabilize mercury [109].
- Digest using a controlled program: ramp to 230°C over 20 minutes and hold at this temperature for 15 minutes to ensure complete decomposition of the organic matrix [109].
- Post-Digestion Preparation:
- After cooling, transfer the digestate from the vessel. Note that a small silica precipitate from plant silica may be present.
- Gravimetrically bring the sample to a final weight of 15 g. The large internal diameter (~0.75 mm) of the OptiMist Vortex nebulizer allows the omission of the filtration step, saving time and reducing contamination risk [109].
- ICP-OES Analysis with Matrix-Matched Calibration:
- Instrument Setup: Use an ICP-OES system fitted with a high-efficiency nebulizer (e.g., OptiMist Vortex), which enhances sensitivity by approximately a factor of two compared to standard concentric nebulizers [109].
- Calibration Standards: Prepare calibration standards in a matrix that closely matches the sample digestates. This is critical for accuracy. The matrix should contain 33% HNO₃/2% HCl, ~1150 ppm carbon (as potassium hydrogen phthalate, KHP) to compensate for residual carbon spectral interferences, and ~600 ppm calcium to account for matrix effects from plant material [109].
- Analysis: Run the samples and standards, using the intensity of the characteristic emission lines for quantification.
The Scientist's Toolkit: Essential Research Reagents and Materials
Table 3: Key Research Reagent Solutions for Elemental Analysis
| Reagent/Material | Function | Example Use Case |
|---|---|---|
| High-Purity Acids (HNO₃, HCl) | Digest organic and inorganic matrices to release target elements into solution. | Sample preparation for ICP-MS, ICP-OES, and AAS [109]. |
| Certified Reference Materials (CRMs) | Calibrate instruments and validate analytical methods for accuracy. | Essential for quantitative work in all techniques [111]. |
| High-Purity Argon Gas | Sustains the high-temperature plasma in ICP-OES and ICP-MS. | Primary operational consumable for ICP techniques [107] [108]. |
| Internal Standard Solutions | Correct for instrument drift and matrix effects during analysis. | Added to all samples and standards in ICP-OES and ICP-MS to improve precision [109]. |
| Potassium Hydrogen Phthalate (KHP) | Source of carbon for matrix-matching in calibration standards. | Compensates for carbon-based spectral interferences in complex botanical samples analyzed by ICP-OES [109]. |
| Silicon Wafers | Provide a clean, flat, and inert substrate for mounting solid samples. | Used for polymer analysis in LA-ICP-MS and LIBS [110]. |
| Calibration Gas Mixtures | Tune and optimize the mass spectrometer in ICP-MS. | Used for sensitivity and mass calibration in ICP-MS [110]. |
The choice between LIBS, ICP-MS, ICP-OES, and AAS is not a matter of identifying a single "best" technique, but rather of selecting the optimal tool for a specific analytical question.
- Choose LIBS when analyzing solids directly, requiring high spatial resolution, minimal sample preparation, portability for field analysis, or rapid sorting/identification of materials. Its performance is ideal for applications where ppm-level detection limits are sufficient.
- Choose ICP-MS when unparalleled sensitivity (ppt-level), ultra-trace analysis, or isotope-specific information is required. This comes at a higher equipment and operational cost and requires more extensive sample preparation.
- Choose ICP-OES for robust, high-throughput multi-element analysis of liquid samples where high sensitivity (ppb-level) is needed but the extreme detection limits of ICP-MS are not necessary. It is more tolerant of high dissolved solids than ICP-MS [108].
- Choose AAS for routine, cost-effective analysis of a limited number of elements in solutions, particularly in laboratories with budget constraints or where the number of target elements is small.
Understanding the fundamental strengths and limitations of each technique, as outlined in this application note, empowers researchers to make informed decisions that enhance the quality and efficiency of their material analysis research. The ongoing development of hybrid approaches, such as tandem LA-ICP-MS/LIBS, further blurs the lines between these techniques, offering powerful, complementary data streams from a single analysis.
Laser-Induced Breakdown Spectroscopy (LIBS) is emerging as a powerful analytical technique for the rapid detection of heavy metals in food products. The monitoring of toxic elements like cadmium (Cd) is crucial for food safety, as they pose significant health risks even at low concentrations due to bioaccumulation [99] [112]. While conventional techniques like Inductively Coupled Plasma Mass Spectrometry (ICP-MS) and Atomic Absorption Spectroscopy (AAS) offer high sensitivity, they require extensive sample preparation, generate toxic waste, and are unsuitable for field-based analysis [113] [112]. LIBS addresses these limitations with its minimal sample preparation requirements, rapid analysis capabilities, and potential for in-situ monitoring [31].
This application note details optimized LIBS methodologies for achieving high-sensitivity cadmium detection in challenging food matrices, providing researchers with validated protocols and analytical frameworks.
Performance Comparison of LIBS Methodologies for Cadmium Detection
The following table summarizes the performance characteristics of various LIBS approaches for cadmium detection across different sample types.
Table 1: Analytical performance of LIBS for cadmium detection in various matrices
| Sample Matrix | Sample Preparation Method | Cd Emission Lines Used (nm) | Limit of Detection (LOD) | Reference |
|---|---|---|---|---|
| Cocoa Powder | Mechanical mixing & pelletization | 340.36, 361.05 | 0.08 μg/g (80 ppb) | [99] |
| Whey Proteins | Dried-droplet at low pressure (100 mbar) | Multiple lines | 20.2 ng/mL (0.0202 ppb) | [114] |
| Soil (for comparison) | Cation exchange resin enrichment + spatial confinement | 214.4, 226.5, 228.76 | 0.132 mg/kg (132 ppb) | [113] |
Detailed Experimental Protocols
Protocol 1: Pelletization for Complex Powders (e.g., Cocoa)
This protocol is designed for homogeneous sample presentation from powdered food samples, crucial for minimizing matrix effects [99].
Reagents and Materials:
- Hydraulic press and stainless-steel die (15.5 mm diameter)
- Analytical balance
- Mortar and pestle
- Pure cocoa powder (Pacari organic used in reference study)
- Cadmium nitrate tetrahydrate (Cd(NO₃)₂·4H₂O), ≥98% purity
- Hot plate
Procedure:
- Dehydration of Salt: Gradually dehydrate 4.5000 g of Cd(NO₃)₂·4H₂O on a hot plate by increasing the temperature from 150°C to 300°C to evaporate absorbed water completely [99].
- Base Mixture Preparation: Homogenize the remaining dehydrated salt (approximately 1.6095 g of elemental Cd) by pulverizing in a mortar. Mix 1.7500 g of this powder with 1.7500 g of pure cocoa powder to create a high-concentration base mixture (~9197 ppm Cd) [99].
- Calibration Samples: Serially dilute the base mixture with pure cocoa powder to create standards spanning the desired concentration range (e.g., 70–5000 ppm). The total mass for each pellet should be 1 g [99].
- Pelletization: Compress each 1 g standard in a hydraulic press to form a cylindrical pellet. Sand the pellet to a uniform height (e.g., 2.90 mm) to ensure consistent surface presentation for LIBS analysis [99].
Protocol 2: Dried-Droplet Methodology for Liquid Matrices
This protocol is ideal for protein-rich liquid samples like milk or whey and leverages low-pressure analysis for enhanced signal [114].
Reagents and Materials:
- Low-pressure chamber
- Si-wafer substrate
- Centrifuge and cut-off filters (e.g., 3kDa MWCO)
- Bovine Serum Albumin (BSA) or whey protein isolate
- Standard Cd solution
- Micropipettes
Procedure:
- Protein Binding: Incubate the standard protein (BSA) or whey protein extracted from skim milk with standard Cd solutions to form Cd-protein complexes [114].
- Separation: Filter the complex solution through appropriate molecular weight cut-off filters via centrifugation. This separates the Cd-bound protein (retentate) from unreacted, free cadmium (filtrate) [114].
- Sample Loading: Using a micropipette, deposit a small, precise volume (e.g., 500 nL) of either the filtrate or the retentate onto a Si-wafer substrate. Allow the droplet to dry at room temperature [114].
- Low-Pressure LIBS Analysis: Place the substrate in a low-pressure chamber. Evacuate the chamber to the optimized pressure of 100 mbar and perform LIBS analysis. For ultra-trace detection, pre-concentrate the analyte by performing multiple (e.g., 10) loadings of the sample on the same spot before analysis [114].
Data Acquisition and Processing
Instrument Parameters:
- Laser: Nd:YAG (1064 nm), ~75-160 mJ/pulse, 8 ns pulse width [99] [113]
- Gate Delay/Width: 3 μs delay, 10 μs width [99]
- Lens-to-Sample Distance: ~82 mm (requires optimization) [99]
Data Analysis:
- Background Subtraction: Apply a dedicated algorithm to correct for spectral continuum background [99].
- Multivariate Calibration: Utilize chemometric methods like Partial Least Squares (PLS) regression to model complex matrix interactions and improve quantification accuracy [115].
- Variable Selection: Employ algorithms like unsupervised kernel minimum regularized covariance determinant (KMRCD) to select the most informative wavelengths from the full LIBS spectrum, enhancing model stability and accuracy [115].
Workflow Visualization
The following diagram illustrates the key steps for detecting cadmium in complex food matrices using LIBS, from sample preparation to data analysis.
Research Reagent Solutions
Table 2: Essential reagents and materials for high-sensitivity LIBS analysis of cadmium
| Item | Function/Justification |
|---|---|
| Cadmium Nitrate Tetrahydrate (Cd(NO₃)₂·4H₂O) | High-purity (>98%) source for preparing calibration standards [99]. |
| Cation Exchange Resin (e.g., ECS60) | Enriches cadmium ions from sample slurries, significantly improving sensitivity for trace analysis [113]. |
| Bovine Serum Albumin (BSA) | Model protein for developing and validating methods for detecting metal-protein complexes in food [114]. |
| Silicon Wafer Substrate | Provides a clean, low-spectral-background surface for the dried-droplet methodology [114]. |
| Lithium Borate (Li₂B₄O₇) | Flux for fusion bead sample preparation, creating homogeneous standards and minimizing matrix effects [116]. |
| Hydraulic Press & Pellet Die | Essential for creating uniform, solid pellets from powdered samples, ensuring analytical reproducibility [99]. |
Method Validation Protocols and Standardization for Regulatory Compliance
Analytical method validation is the documented process of demonstrating that a laboratory procedure is suitable for its intended purpose and consistently produces reliable, accurate, and reproducible results [117] [118]. This process provides objective evidence that an analytical method meets the predefined requirements for its application, supporting the identity, strength, quality, purity, and potency of pharmaceutical products and other tested materials [118]. Within the context of Laser-Induced Breakdown Spectroscopy (LIBS)—a rapid, portable atomic emission spectroscopy technique used for elemental analysis—method validation becomes particularly crucial as this technology transitions from research applications to routine analytical use in regulated environments [119] [31].
Regulatory bodies including the FDA (21 CFR Parts 210 and 211), EMA, and ICH provide the principal frameworks governing method validation [117] [118]. The ICH Q2(R1) guideline, "Validation of Analytical Procedures: Text and Methodology," establishes the standard approach for validation parameters and methodology, with a forthcoming revision (ICH Q2(R2)) expected to provide additional guidance for advanced analytical techniques, potentially including spectroscopic methods like LIBS [118]. For LIBS technology, which offers unique advantages including minimal sample preparation, rapid multi-element analysis, and portability, adapting these established validation principles presents both challenges and opportunities for standardization and regulatory acceptance [119] [31] [120].
Core Validation Parameters and Their Application to LIBS
The validation of any analytical method, including LIBS, requires the assessment of specific performance characteristics to demonstrate the method is "fit-for-purpose" [118]. The following parameters, adapted from ICH Q2(R1), form the foundation of method validation, with specific considerations for their application to LIBS technology.
Key Validation Parameters
- Specificity/Selectivity: The ability to unequivocally assess the analyte in the presence of components that may be expected to be present, such as impurities, matrix components, or degradation products [118]. For LIBS, this requires demonstrating that the method can distinguish the spectral lines of target elements from potential interferences in the sample matrix [119] [120].
- Linearity and Range: The linearity of an analytical procedure is its ability (within a given range) to obtain test results directly proportional to the concentration (amount) of analyte in the sample [118] [121]. The range is the interval between the upper and lower concentrations of analyte for which it has been demonstrated that the analytical procedure has a suitable level of precision, accuracy, and linearity [118]. LIBS analysis typically requires calibration curves developed using certified reference materials across the intended concentration range [122].
- Accuracy: The closeness of agreement between the value which is accepted either as a conventional true value or an accepted reference value and the value found [118] [123]. For LIBS, accuracy is often established through analysis of certified reference materials (CRMs) and recovery studies [122] [120].
- Precision: The closeness of agreement between a series of measurements obtained from multiple sampling of the same homogeneous sample under the prescribed conditions [118]. Precision should be investigated at three levels: repeatability (same operating conditions over a short interval), intermediate precision (within-laboratory variations), and reproducibility (between laboratories) [118] [123]. LIBS presents particular precision challenges due to shot-to-shot variations in laser-sample interaction [119] [120].
- Limit of Detection (LOD) and Limit of Quantitation (LOQ): The LOD is the lowest amount of analyte in a sample that can be detected but not necessarily quantitated as an exact value, while the LOQ is the lowest amount of analyte that can be quantitatively determined with suitable precision and accuracy [118] [121]. For LIBS, these are typically determined based on signal-to-noise ratio approaches (LOD = 3×S/N; LOQ = 10×S/N) or statistical methods based on blank measurements [121].
- Robustness and Ruggedness: The robustness of an analytical procedure is a measure of its capacity to remain unaffected by small, deliberate variations in method parameters and provides an indication of its reliability during normal usage [118]. Ruggedness refers to the degree of reproducibility of test results under a variety of conditions [117]. For LIBS, critical parameters may include laser energy, timing parameters, sample surface characteristics, and environmental conditions [119].
Table 1: Validation Parameters and Their Application to LIBS
| Validation Parameter | Traditional Definition | LIBS-Specific Considerations |
|---|---|---|
| Specificity | Ability to measure analyte accurately in presence of interferences | Spectral line interference resolution; matrix effects on plasma formation |
| Linearity & Range | Direct proportionality of results to analyte concentration | Requires multiple CRMs; may exhibit limited linear range compared to other techniques |
| Accuracy | Closeness to true value | Verified through CRM analysis; affected by matrix-matched standards |
| Precision | Closeness of repeated measurements | Challenged by shot-to-shot plasma variations; requires multiple spectra averaging |
| LOD/LOQ | Lowest detectable/quantifiable concentration | Varies by element and matrix; generally higher than ICP techniques |
| Robustness | Resistance to method parameter variations | Sensitive to laser parameters, sample presentation, environmental conditions |
LIBS-Specific Validation Challenges
LIBS technology faces several unique challenges in method validation compared to established analytical techniques. The technique is subject to significant matrix effects, where the signal from a specific analyte can depend on the sample composition, making universal calibrations difficult [119]. Shot-to-shot variations in laser-matter interaction and plasma formation can affect precision, often necessitating the averaging of multiple spectra from the same material [119] [120]. Additionally, instrument-to-instrument differences can make it challenging to transfer methods between different LIBS systems without re-validation [119] [120]. These challenges must be specifically addressed through robust method development and validation protocols to establish LIBS as a reliable technique for regulatory applications.
Experimental Protocols for LIBS Method Validation
LIBS System Qualification Protocol
Before initiating method validation, the LIBS instrument itself must be qualified to ensure proper operation. The following protocol outlines the essential steps for system qualification:
Laser Performance Verification
- Measure laser pulse energy using a calibrated energy meter at the sample plane
- Confirm laser beam profile and focus using appropriate beam profiling equipment
- Verify laser repetition rate stability over a minimum of 100 consecutive pulses
- Document baseline laser parameters: wavelength, pulse duration, maximum energy, focus spot size
Spectrometer and Detector Calibration
- Perform wavelength calibration using certified wavelength standards (e.g., mercury-argon lamp)
- Verify intensity response using standardized light sources
- Confirm spectral resolution using narrow emission lines
- Document detector dark noise and readout noise characteristics
Overall System Alignment
- Verify laser focus on sample surface using microscopic examination of ablation spots
- Confirm optimal plasma light collection alignment using intensity maximization procedures
- Validate fiber optic coupling efficiency (if applicable)
- Document complete system configuration including all optical components
Specificity and Selectivity Assessment Protocol
Spectral Interference Evaluation
- Prepare pure samples of all potential interfering species expected in the sample matrix
- Acquire LIBS spectra for each potential interferent individually
- Identify all emission lines in the spectral region of interest for target analytes
- Document potential spectral overlaps and develop resolution strategy (e.g., alternative analytical lines, mathematical correction)
Matrix Effect Characterization
- Prepare samples with identical analyte concentrations in different relevant matrices
- Acquire LIBS spectra for each matrix type using standardized parameters
- Compare signal intensities and plasma characteristics across different matrices
- Document matrix effects and establish matrix-matched calibration when necessary
Figure 1: Specificity assessment workflow for LIBS method validation
Linearity and Range Determination Protocol
Calibration Curve Development
- Select a minimum of five certified reference materials covering the expected concentration range
- Include a blank sample or zero concentration standard
- Prepare each standard according to appropriate sample preparation procedures
- Acquire LIBS spectra for each calibration level using a minimum of 30 laser shots per sample
- Average spectra for each concentration level to minimize shot-to-shot variation
- Plot net line intensity (background corrected) versus concentration
- Calculate regression parameters: slope, intercept, correlation coefficient (R²)
- Verify residual patterns for non-linear trends
Range Establishment
- Determine the concentration interval where precision, accuracy, and linearity meet acceptance criteria
- Verify range covers all expected sample concentrations
- Document the validated range with supporting data
Table 2: Example LIBS Linear Range Data for Steel Alloy Analysis
| Element | Concentration Range (wt%) | Correlation Coefficient (R²) | Calibration Standards Used | Accepted Criteria |
|---|---|---|---|---|
| Carbon | 0.01-1.2 | 0.9987 | 6 CRM steels | R² ≥ 0.995 |
| Manganese | 0.05-2.0 | 0.9992 | 7 CRM steels | R² ≥ 0.995 |
| Silicon | 0.01-0.8 | 0.9978 | 5 CRM steels | R² ≥ 0.995 |
| Chromium | 0.05-18.0 | 0.9995 | 8 CRM steels | R² ≥ 0.995 |
| Nickel | 0.05-12.0 | 0.9989 | 7 CRM steels | R² ≥ 0.995 |
Precision Evaluation Protocol
Repeatability (Intra-assay Precision)
- Prepare a homogeneous sample at three concentration levels (low, medium, high)
- Analyze each sample with a minimum of 10 replicate measurements
- Maintain identical instrumental conditions and analyst throughout analysis
- Calculate mean, standard deviation, and relative standard deviation (%RSD) for each concentration
- Verify %RSD meets predefined acceptance criteria (typically < 5-10% depending on application)
Intermediate Precision
- Conduct analysis of the same samples on different days
- Utilize different analysts where possible
- Include instrument warm-up and shutdown between measurements
- Incorporate minor, justified variations in sample preparation
- Calculate overall precision across all variables
LIBS-Specific Precision Considerations
- Account for spatial heterogeneity through multiple analysis locations
- Include sufficient laser shots per sample to compensate for shot-to-shot variation
- Document laser shot count and averaging methodology
Accuracy Determination Protocol
Certified Reference Material Analysis
- Select CRMs that closely match the sample matrix of interest
- Analyze each CRM using the validated LIBS method
- Calculate percent recovery for each certified element: [(Measured Value)/(Certified Value)] × 100
- Verify recovery meets acceptance criteria (typically 85-115% depending on concentration)
Spiked Recovery Studies
- For matrices without suitable CRMs, prepare samples with known analyte additions
- Spike samples at multiple concentration levels across the validated range
- Calculate recovery of spikes and establish accuracy profile
- Document method bias and correction factors if applied
Robustness Testing Protocol
Deliberate Parameter Variations
- Identify critical method parameters likely to vary during routine use
- Systematically vary parameters one at a time while holding others constant
- Key LIBS parameters to test: laser energy (±10%), delay time (±20%), gate width (±25%), sample surface distance (±1 mm)
- Evaluate impact of each variation on quantitative results
Acceptance Criteria Application
- Establish predetermined acceptance criteria for each parameter variation
- Typically, variations should not result in statistically significant changes in results
- Document robust operating ranges for each parameter
Advanced Chemometric Approaches for LIBS Validation
The complex spectral data generated by LIBS often requires advanced chemometric approaches for effective quantitative analysis [31] [124]. These methods are particularly important for addressing LIBS-specific challenges such as matrix effects and spectral interference.
Multivariate Calibration Techniques
- Partial Least Squares (PLS) Regression: PLS is widely used in LIBS analysis to model relationships between spectral data and analyte concentrations [124]. This approach leverages full spectral information rather than individual peaks, improving accuracy and precision compared to univariate methods.
- Principal Component Regression (PCR): PCR transforms spectral data into orthogonal components that capture maximum variance, then builds regression models using these components.
- Machine Learning Approaches: Recent advances include Random Forests, Support Vector Machines (SVM), and Convolutional Neural Networks (CNNs), which have shown superior performance for complex LIBS classification and regression tasks [31] [124].
Spectral Preprocessing Methods
- Normalization Techniques: Internal standard normalization, total intensity normalization, and area normalization to reduce pulse-to-pulse energy variation effects.
- Background Correction: Continuum background removal using polynomial fitting or derivative spectroscopy.
- Spectral Alignment: Wavelength shift correction to compensate for instrumental drift.
Figure 2: Chemometric analysis workflow for LIBS data
Table 3: Comparison of Chemometric Methods for LIBS Analysis
| Method | Best Suited Applications | Advantages | Limitations | Validation Requirements |
|---|---|---|---|---|
| Univariate Calibration | Simple matrices; single element analysis | Simple implementation; easy interpretation | Vulnerable to spectral interference; matrix effects | Traditional validation parameters sufficient |
| PLS Regression | Complex matrices; multiple elements | Uses full spectral information; handles correlations | Requires large calibration set; complex interpretation | Cross-validation; external validation set |
| Artificial Neural Networks | Highly complex or nonlinear systems | Models complex relationships; high accuracy | "Black box"; extensive data requirements | Comprehensive external validation; robustness testing |
The Scientist's Toolkit: Essential Materials for LIBS Validation
Successful validation of LIBS methods requires specific materials and reagents to ensure accurate and reproducible results. The following table details essential components of a LIBS validation toolkit.
Table 4: Essential Research Reagent Solutions for LIBS Method Validation
| Item/Category | Function in Validation | Specific Examples | Critical Quality Attributes |
|---|---|---|---|
| Certified Reference Materials (CRMs) | Calibration curve development; accuracy assessment | OREAS series (geological), NIST SRM series (metals), BCR series (environmental) | Certified uncertainty; matrix matching; homogeneity |
| Sample Preparation Materials | Consistent sample presentation | Pressed pellet dies; polishing materials; binding agents | Minimal contamination; reproducible surface properties |
| Wavelength Calibration Standards | Spectrometer calibration | Mercury-argon lamps; neon lamps; holmium oxide filters | Well-characterized emission lines; stability |
| Intensity Calibration Standards | Detector response verification | Tungsten halogen lamps; deuterium lamps; NIST-traceable standards | Known spectral radiance; stability |
| Quality Control Materials | Ongoing method performance verification | Secondary reference materials; in-house standards; proficiency test materials | Homogeneity; stability; commutability with test samples |
Documentation and Regulatory Compliance Strategy
Comprehensive documentation is essential for demonstrating method validity and maintaining regulatory compliance [117] [118] [123]. The following elements should be included in the method validation package for LIBS applications.
Essential Validation Documents
Validation Protocol
- Detailed experimental plan defining scope, parameters, and acceptance criteria
- Statistical methods for data analysis
- Roles and responsibilities of validation team members
Validation Report
- Summary of validation experiments and results
- Comparison of results against acceptance criteria
- Documentation of any deviations from protocol
- Final statement of method validity
Standard Operating Procedure (SOP)
- Detailed step-by-step method instructions
- Sample preparation procedures
- Instrument operating parameters
- Data analysis methods
- Quality control procedures
Lifecycle Management and Revalidation
Method validation should be viewed as a lifecycle process rather than a one-time event [118]. Revalidation should be performed when changes occur that may impact method performance, including:
- Changes in sample matrix or composition
- Instrument hardware or software modifications
- Transfer of method to different laboratory or instrument
- Changes in critical reagents or reference materials
- Scheduled periodic revalidation based on risk assessment
The validation of LIBS methods for regulatory applications requires careful adaptation of established validation principles to address the unique characteristics of this technology. By implementing comprehensive protocols that address LIBS-specific challenges—including matrix effects, shot-to-shot variation, and instrumental differences—researchers can develop robust, reliable methods suitable for material analysis in regulated environments. The integration of advanced chemometric approaches further enhances method performance, addressing many of the limitations associated with traditional univariate LIBS analysis. As LIBS technology continues to evolve, ongoing refinement of validation approaches will support its expanding application across pharmaceutical, environmental, and industrial sectors where regulatory compliance is essential.
Laser-Induced Breakdown Spectroscopy (LIBS) has solidified its position as a versatile and powerful analytical technique for rapid, in-situ elemental analysis across diverse fields, from industrial quality control to planetary exploration. However, inherent challenges such as matrix effects, signal drift, and variations in experimental conditions can impede its quantification capabilities and analytical precision. To overcome these limitations, the scientific community is increasingly focusing on hybrid approaches that combine LIBS with complementary analytical techniques. These integrated systems leverage synergistic effects to provide a more comprehensive understanding of material composition by simultaneously capturing elemental, molecular, and structural information. The fusion of LIBS with other methodologies expands its analytical power, transforming it from a standalone elemental analysis tool into a multifaceted platform for advanced material characterization. This evolution is driven by the recognition that many complex analytical problems require insights that no single technique can provide alone, paving the way for innovative instrument designs and data fusion strategies that deliver unprecedented analytical accuracy and robustness [125].
The fundamental premise behind hybrid LIBS systems lies in the complementary nature of different spectroscopic techniques. While LIBS excels at detecting elemental composition with minimal sample preparation, it provides limited information about molecular structures, chemical bonding, or crystalline phases. By integrating LIBS with techniques that probe these different material properties, researchers can obtain a holistic view of sample characteristics. Recent advancements in instrument miniaturization, laser technology, and data science have accelerated the development of these hybrid systems, making them increasingly viable for both laboratory and field applications. This protocol-oriented review examines the most promising LIBS hybrid configurations, their operational principles, implementation methodologies, and performance characteristics, with particular emphasis on practical considerations for researchers seeking to implement these approaches in their analytical workflows [125] [126].
Key Hybrid Configurations: Principles and Applications
LIBS-Raman Spectroscopy
The combination of LIBS and Raman spectroscopy represents one of the most powerful hybrid configurations because it simultaneously provides elemental fingerprinting (via LIBS) and molecular speciation (via Raman). These two laser-based techniques share similar hardware requirements and both offer standoff detection capabilities, making them naturally compatible for integration. In this configuration, a single laser system or two synchronized lasers are used to generate both the plasma for LIBS analysis and the excitation for Raman scattering. The resulting hybrid system can detect both atomic emissions from LIBS and molecular vibrational fingerprints from Raman, offering unparalleled insight into sample composition [126].
Researchers have demonstrated that the accuracy of product classification improves by approximately 10% when utilizing hybrid Raman/LIBS spectra compared to the analysis of spectra from individual methods. This significant improvement stems from the complementary nature of the data, which allows for more robust multivariate classification models. A portable hybrid Raman-LIBS system has been successfully deployed for food authentication applications, demonstrating distinct advantages over individual modalities for analyzing complex biological matrices like Alpine-style cheeses and Arabica coffee beans. The system effectively characterized both elemental and molecular components in these challenging food products, showcasing its practical utility for real-world applications where comprehensive material identification is required [126].
Double-Pulse LIBS (DP-LIBS)
Double-Pulse LIBS represents a temporal hybridization approach where two laser pulses are used sequentially or simultaneously to enhance the analytical performance of conventional single-pulse LIBS. The fundamental principle involves using the first laser pulse to ablate the sample and generate initial plasma, while the second laser pulse re-excites the expanding plasma, leading to significantly enhanced emission intensity, improved signal-to-noise ratios, and lower limits of detection. This configuration can deliver greater energy to both the plasma and the sample surface, resulting in more efficient ablation and excitation processes [127].
DP-LIBS systems can be implemented in several geometric configurations, including collinear, orthogonal pre-ablation, and orthogonal re-heating setups. Each configuration offers distinct advantages for specific application scenarios. For instance, the collinear approach (where both laser pulses travel along the same path to the sample) is particularly effective for solid analysis, while orthogonal configurations are often preferred for liquid analysis. The flexibility in pulse sequence, wavelength, and pulse width makes DP-LIBS adaptable to various analytical challenges. The usefulness of this approach has been demonstrated across diverse applications, with one study reporting that the detection limit for chlorine in concrete improved from 400 ppm with single-pulse LIBS to 50 ppm with DP-LIBS, representing an 8-fold enhancement in analytical sensitivity [127].
LIBS-X-ray Fluorescence (XRF)
The combination of LIBS with X-ray Fluorescence (XRF) creates a powerful elemental analysis platform that leverages the complementary strengths of both techniques. While LIBS excels at detecting light elements (e.g., hydrogen, lithium, beryllium, boron) with minimal sample preparation, XRF provides superior sensitivity for heavy elements and offers more precise quantitative analysis for established applications. Together, they cover a broad elemental range with enhanced analytical capabilities. The data fusion from these techniques enables more accurate compositional analysis, particularly for complex matrices where matrix effects can challenge individual techniques [125].
This hybrid approach is particularly valuable in geological applications, where comprehensive elemental characterization is essential. LIBS-XRF systems can provide rapid, in-situ analysis of ore samples, geological specimens, and extraterrestrial materials. The combination is also finding applications in industrial process control, environmental monitoring, and archaeological analysis. The integration typically involves either sequential measurement using both techniques or the development of dedicated hybrid probes that can simultaneously acquire data from both analytical methods. Sophisticated data fusion algorithms, including multivariate calibration and machine learning approaches, are then employed to extract the maximum information from the combined spectral datasets [125].
Table 1: Performance Comparison of Major Hybrid LIBS Configurations
| Hybrid Configuration | Key Synergistic Benefits | Enhancement Factor | Primary Applications |
|---|---|---|---|
| LIBS-Raman | Simultaneous elemental + molecular information | ~10% classification accuracy improvement | Food authentication, pharmaceutical analysis, cultural heritage |
| DP-LIBS | Enhanced emission intensity, reduced LOD | Up to 8x LOD improvement (e.g., Cl in concrete) | Trace metal detection, liquid analysis, difficult matrices |
| LIBS-XRF | Expanded elemental coverage, improved quantification | Varies by element; complementary light/heavy element coverage | Geological analysis, industrial process control, mining |
| LIBS-Laser Induced Fluorescence (LIF) | Selective enhancement of specific elements | Orders of magnitude for targeted elements | Environmental monitoring, toxic metal detection |
Other Promising Hybrid Approaches
Beyond the major configurations discussed above, several other hybrid LIBS approaches show significant promise for specialized applications. LIBS-Laser Induced Fluorescence (LIF) combines the broad elemental screening capability of LIBS with the exceptional sensitivity and selectivity of LIF for specific elements. In this approach, a tunable laser is used to selectively excite atoms of a particular element in the plasma, significantly enhancing the detection sensitivity for that element while reducing interferences. This configuration can improve detection limits for specific elements by orders of magnitude compared to conventional LIBS [128].
Another emerging approach involves combining LIBS with hyperspectral imaging, which enables the creation of detailed spatial maps of elemental distribution across sample surfaces. This powerful combination is particularly valuable for biological and geological applications where understanding spatial heterogeneity is crucial. Similarly, the integration of LIBS with near-infrared (NIR) spectroscopy or mid-infrared (MIR) spectroscopy provides complementary molecular information that enhances the ability to characterize complex organic materials. These hybrid configurations are finding applications in agricultural science, plant physiology, and food technology, where both elemental composition and molecular structure information are needed to understand sample properties and functionality [128].
Experimental Protocols
Protocol: Implementation of Hybrid Raman-LIBS System
The following protocol outlines the implementation of a compact hybrid Raman-LIBS system for food authentication applications, as demonstrated in recent research. This configuration has been successfully applied to classify Alpine-style cheeses and Arabica coffee beans with improved accuracy compared to individual techniques [126].
Apparatus and Reagents:
- Pulsed laser source (Nd:YAG, 1064 nm, 10 ns pulse length)
- Continuous wave laser for Raman excitation (532 nm)
- Spectrometer with CCD detector (compact systems preferred for portability)
- Optical fiber coupling system
- Polystyrene beads for system validation
- Sample mounting stage with positioning controls
- Computer with spectral acquisition and analysis software
Procedure:
- System Alignment and Validation:
- Align both laser paths to focus on the same sample spot using adjustable mirrors and lenses.
- Validate system performance using polystyrene (PS) beads as reference material.
- Acquire Raman spectra and verify characteristic peaks: C-C breathing (984 cm⁻¹), C-C stretch (1158 cm⁻¹), and C=C stretch (1584 cm⁻¹).
- Acquire LIBS spectra and confirm detection of molecular bands (CN at 388.2 nm, C₂ Swan band at 516.2 nm).
Sample Preparation:
- For solid food samples (cheese, coffee beans), prepare flat surfaces using a cutting tool or compression.
- Mount samples on the stage ensuring stable positioning.
- For heterogeneous samples, prepare multiple replicates from different areas.
Spectral Acquisition:
- Position the sample at the focal point of both laser systems.
- For each measurement location, acquire Raman spectra first using the continuous wave laser.
- Immediately after Raman acquisition, fire the pulsed laser to collect LIBS spectra from the same spot.
- For statistical robustness, collect 100 spectra per sample with 10 single-shot measurements at 10 different locations (1 mm intervals).
Data Processing and Analysis:
- Preprocess spectra: normalize, remove background, and correct for wavelength shift.
- Apply multivariate feature selection methods (e.g., Elastic Net) to identify significant spectral features.
- Implement machine learning classifiers (Support Vector Machines, PLS-DA) for sample classification.
- Fuse Raman and LIBS data by concatenating spectral features or using coaddition methods.
- Validate classification models using cross-validation and independent test sets.
Troubleshooting Tips:
- If spectral overlap occurs between Raman and LIBS signals (e.g., around 562 nm), apply spectral subtraction using Lorentzian functions.
- For fluorescence interference in Raman spectra, consider using longer wavelength excitation or background correction algorithms.
- To ensure consistent laser focus, regularly verify the lens-to-sample distance, especially when analyzing irregular surfaces.
Protocol: Double-Pulse LIBS Configuration
This protocol details the implementation of a collinear DP-LIBS system for enhanced sensitivity in elemental analysis. The collinear configuration is particularly effective for solid sample analysis and has demonstrated significant improvement in detection limits for various elements [127].
Apparatus and Reagents:
- Two pulsed laser sources (Nd:YAG, typically 1064 nm fundamental wavelength)
- Beam combining optics (dichroic mirrors) for collinear alignment
- Delay generator for precise interpulse timing control
- Echelle spectrograph with ICCD detector for broad spectral coverage
- Sample chamber with adjustable atmosphere control
- Certified reference materials for calibration
Procedure:
- Laser Alignment:
- Align the first laser beam to optimally focus on the sample surface.
- Direct the second laser beam using dichroic mirrors to combine with the first beam in a collinear path.
- Verify spatial and temporal overlap using a fast photodiode and beam profiler.
- Optimize focusing conditions to achieve maximum plasma emission intensity.
Timing Optimization:
- Set the delay generator to control the interpulse delay between the two lasers.
- Systematically vary the interpulse delay (typically 0.1-5 µs) while monitoring signal intensity.
- Determine the optimal delay for maximum signal enhancement for your specific sample matrix.
- Adjust the gate delay and width of the ICCD detector to capture the enhanced plasma emission.
Spectral Acquisition:
- Position the sample to ensure consistent ablation conditions.
- Set laser energies for both pulses (typically 15-100 mJ per pulse, depending on sample).
- Acquire spectra at multiple locations on the sample surface to account for heterogeneity.
- For quantitative analysis, acquire spectra from certified reference materials under identical conditions.
Data Analysis:
- Process spectra using standard LIBS preprocessing: background subtraction, normalization, peak identification.
- Build calibration models using univariate (calibration curves) or multivariate (PLS) approaches.
- Compare signal-to-noise ratios and limits of detection with single-pulse LIBS measurements.
- For complex matrices, employ advanced chemometric methods to address residual matrix effects.
Application Notes:
- The orthogonal pre-ablation configuration may be preferable for liquid analysis or when analyzing rough surfaces.
- Femtosecond laser pulses can be incorporated for reduced thermal effects and improved ablation control.
- The optimal interpulse delay depends on the sample matrix and the elements of interest, requiring empirical determination for each application.
Table 2: Research Reagent Solutions for Hybrid LIBS Experiments
| Reagent/Material | Function in Protocol | Application Context | Technical Notes |
|---|---|---|---|
| Polystyrene beads | System validation | LIBS-Raman alignment | Reference material with characteristic Raman and LIBS signatures |
| Certified reference materials | Calibration and validation | Quantitative analysis | Matrix-matched standards essential for accurate quantification |
| Lithium borate flux | Sample preparation | Fusion bead method for heterogeneous samples | Creates homogeneous standards; reduces matrix effects |
| Optical alignment tools | Beam path verification | All hybrid configurations | Photodiode, beam profiler, alignment targets |
| Multivariate calibration standards | Chemometric model development | Data fusion applications | Enables robust classification and quantification models |
Data Fusion and Analysis Strategies
The successful implementation of hybrid LIBS approaches relies heavily on sophisticated data fusion strategies that effectively combine information from multiple analytical techniques. Three primary data fusion levels have been established: low-level (signal) fusion, mid-level (feature) fusion, and high-level (decision) fusion. Low-level fusion involves concatenating raw spectra from different techniques, creating a combined dataset that preserves the original spectral information but requires careful normalization to address different intensity scales and measurement units. Mid-level fusion employs feature selection or extraction methods to identify the most informative variables from each technique before combination, often resulting in more robust models. High-level fusion combines the final decisions or predictions from individual technique models, offering flexibility but potentially missing synergistic effects between techniques [126].
For LIBS-Raman systems, research has demonstrated that multivariate feature selection combined with machine learning classifiers significantly enhances classification performance. The Elastic Net (ENET) approach has been identified as particularly effective for improving classification performance when employing combined LIBS and Raman spectra. This method combines the variable selection properties of LASSO with the grouping effect of ridge regression, making it well-suited for handling the high dimensionality and multicollinearity of spectroscopic data. When implementing these data fusion strategies, it is crucial to apply appropriate spectral preprocessing to both LIBS and Raman data, including normalization, baseline correction, and spectral alignment, to ensure comparability and maximize the benefits of data fusion [126].
In DP-LIBS applications, data analysis must account for the enhanced but potentially more complex spectral information. Multivariate calibration techniques such as Partial Least Squares (PLS) regression and Principal Component Analysis (PCA) are increasingly employed to handle the high dimensionality of LIBS data and address matrix effects. These methods leverage the full spectral information rather than relying on individual emission lines, resulting in improved analytical performance. For complex matrices, machine learning algorithms including support vector machines, random forests, and artificial neural networks can model nonlinear relationships and further enhance quantification accuracy. The application of data science in LIBS is transforming spectral inspection and analysis, with machine learning and deep learning methods being adopted to automate and enhance the processing and interpretation of LIBS spectra, uncovering complex patterns and improving analysis accuracy [125] [129].
Workflow Visualization
Hybrid LIBS-Raman Authentication Workflow
This workflow diagram illustrates the integrated experimental and computational process for material authentication using a hybrid LIBS-Raman system. The protocol begins with sample preparation, followed by sequential spectral acquisition using both techniques. Critical to success is the system validation step using reference materials like polystyrene beads to ensure proper alignment and instrument performance. The data processing phase incorporates specialized spectral preprocessing for each technique before feature selection identifies the most discriminative variables. The data fusion step combines complementary elemental (LIBS) and molecular (Raman) information, which is then processed through multivariate classification algorithms to generate authentication results with demonstrated improvement in accuracy compared to single-technique approaches [126].
Hybrid LIBS approaches represent a significant advancement in analytical spectroscopy, effectively addressing many of the limitations of standalone LIBS analysis. By combining LIBS with complementary techniques such as Raman spectroscopy, XRF, or through DP-LIBS configurations, researchers can achieve enhanced sensitivity, expanded analytical information, and improved classification accuracy. The experimental protocols outlined in this article provide practical frameworks for implementing these hybrid approaches, with emphasis on system validation, optimal parameter selection, and advanced data fusion strategies. As demonstrated across various applications, these hybrid systems can achieve approximately 10% improvement in classification accuracy for authentication tasks and up to 8-fold enhancement in detection limits for trace element analysis [126] [127].
The future development of hybrid LIBS systems will likely focus on several key areas. Further miniaturization and integration of components will expand field deployment capabilities, while advances in laser technology will enable more compact and efficient multi-source systems. The growing application of artificial intelligence and machine learning will continue to enhance data fusion strategies, enabling more effective extraction of information from complex hybrid datasets. Additionally, the development of standardized protocols and reference materials specific to hybrid approaches will be crucial for validation and quality assurance. As these technologies mature, hybrid LIBS systems are poised to become increasingly prevalent in both laboratory and field settings, offering comprehensive material characterization capabilities that extend far beyond what any single technique can achieve alone [125] [128] [129].
Cross-Validation with Double-Blinded Studies and Statistical Analysis
Within the framework of laser-induced breakdown spectroscopy (LIBS) for material analysis research, ensuring the validity and reliability of analytical results is paramount. This document details the integration of robust methodological approaches—specifically, cross-validation and double-blinded studies—to fortify LIBS-based research, particularly in complex application areas such as biomedical analysis and food safety monitoring. LIBS is a rapid, elemental analysis technique that uses a pulsed laser to create a microplasma on a sample surface, whose optical emission is then analyzed to determine elemental composition [79]. Its applications range from diagnosing diseases like Alzheimer's from blood fluids [130] and differentiating cancerous tissues [79] to quantifying heavy metal contaminants like cadmium in food products such as cocoa powder [27].
The inherent challenges in LIBS, including matrix effects where the sample's physical and chemical properties influence the analytical signal, and the need to analyze complex biological structures, necessitate stringent validation protocols [27] [79]. Cross-validation and double-blinded studies provide a powerful combined framework to verify that a LIBS method delivers accurate, unbiased, and reproducible results, thereby strengthening the credibility of findings for critical decision-making in research and development.
Core Concepts and Definitions
Cross-Validation in Analytical Methods
In the context of bioanalytical methods, cross-validation is a procedure for comparing two or more methods used to generate data within the same study or across different studies [131]. It is a critical requirement when data generated using different analytical techniques are included in regulatory submissions. The process involves designating an original validated method as the "reference" and a revised method as the "comparator." The core goal is to determine whether the methods are statistically equivalent or to establish a reliable conversion factor if they are not, ensuring that data from different sources can be meaningfully compared and interpreted [131].
Double-Blinded Studies
A double-blinded study is a research design in which neither the participants nor the researchers administering the experiment know the treatment or group assignments of the participants [132] [133] [134]. This approach is considered the gold standard in experimental research because it minimizes several types of bias:
- Observer bias: When researchers' expectations influence their interpretation of results or behavior toward subjects [133] [134].
- Confirmation bias: The tendency to search for or interpret evidence in a way that confirms one's existing beliefs [133].
- Placebo effect: When participants in a control group experience changes simply because they believe they are receiving an active treatment [132] [133].
In a LIBS context, this translates to blinding researchers from the known concentrations of calibration standards or the confirmed identity of samples during analysis to prevent subconscious influence on data collection or interpretation.
Experimental Protocols
Protocol for a Double-Blinded LIBS Analysis
This protocol is adapted from a study quantifying cadmium in cocoa powder, which successfully employed a double-blinded validation [27].
Materials and Reagents
- Pacari organic cocoa powder (Manabi variety): The base matrix for analysis [27].
- Tetrahydrate cadmium nitrate (Cd(NO₃)₂·4H₂O): Source for cadmium dopant [27].
- Hydraulic press and stainless-steel die: For pelletizing powdered samples [27].
- Mortar and pestle: For homogenizing samples [27].
- LIBS System: Configured as below [27].
LIBS Instrumental Parameters
The following parameters were used for cadmium detection in cocoa and should be optimized for your specific application.
| Parameter | Specification |
|---|---|
| Laser Type | Nd:YAG [27] |
| Wavelength | 1064 nm [27] |
| Pulse Duration | 8 ns [27] |
| Laser Energy | 75 mJ/pulse [27] |
| Gate Delay | 3 μs [27] |
| Gate Width | 10 μs [27] |
| Focal Length | 50 mm convex lens [27] |
| Lens-to-Sample Distance | 82 mm [27] |
| Analysis Wavelengths | Cd I 340.36 nm, Cd I 361.05 nm [27] |
Step-by-Step Procedure
Sample Preparation and Randomization:
- Prepare a base mixture of cocoa powder and dehydrated cadmium salt with a high, known Cd concentration (e.g., 9197 ppm) [27].
- Systematically dilute the base mixture with additional cocoa powder to create a calibration set covering the desired concentration range (e.g., 70–5000 ppm Cd) [27].
- Use a hydraulic press to form the powdered mixtures into uniform pellets (e.g., 15.5 mm diameter, ~2.90 mm height) [27].
- From the full set of pellets, select a subset (e.g., 5 samples) to serve as "unknowns." A third party not involved in the spectral acquisition should label these with a blind code and record the true concentrations. The lead researcher must be unaware of both the identity and concentration of these samples [27].
Spectral Acquisition (Blinded Phase):
- Mount each pellet, including the blinded unknowns, on the 2D displaceable platform.
- For each pellet, collect LIBS spectra from 5 different positions. At each position, accumulate the signal from 10 consecutive laser shots [27].
- The five accumulated spectra from a single pellet are then averaged to create a final, representative spectrum for that sample, which helps compensate for minor sample inhomogeneity [27].
- Ensure that the analyst operating the LIBS instrument is only aware of the blind codes, not the true sample identities or concentrations.
Data Analysis and Unblinding:
- Construct calibration curves using the spectra from the samples of known concentration. The Cd atomic lines at 340.36 nm and 361.05 nm are typically used, often with a background correction algorithm to improve accuracy [27].
- Use the calibration model to predict the concentrations of the blinded unknown samples based solely on their LIBS spectra.
- The third party then reveals the true concentrations of the blinded samples. The predicted and known values are compared to validate the method's accuracy [27].
Protocol for Cross-Validating LIBS Methods
This protocol outlines the statistical comparison of two analytical methods, such as two different LIBS configurations or LIBS versus a reference technique like ICP-MS [131].
Develop a Cross-Validation Plan: Before experimentation, define the goals of the comparison, the experimental design, the selection and size of test samples, and the statistical methods for assessing equivalence [131].
Sample Analysis:
- Analyze a set of samples covering the analytical range of interest using both the reference method and the comparator LIBS method.
- The same sample should be analyzed by both methods under their respective optimal conditions.
Statistical Analysis for Equivalence:
- Perform variance analysis or similar statistical approaches to determine if the two methods are statistically equivalent [131].
- If the methods are not equivalent, calculate the magnitude and consistency of the difference. A ratio or conversion factor may be applied to data from one method to align it with the other, ensuring comparability across studies [131].
The Scientist's Toolkit: Research Reagent Solutions
The following table details key materials and their functions in a typical LIBS study involving complex biological or food matrices, based on the cited research.
| Material/Reagent | Function in LIBS Analysis |
|---|---|
| Pacari Organic Cocoa Powder | Acts as a complex organic matrix for developing and validating a method to detect heavy metal contaminants like cadmium [27]. |
| Tetrahydrate Cadmium Nitrate (Cd(NO₃)₂·4H₂O) | A source for doping the sample matrix with known concentrations of cadmium, enabling the creation of calibration curves [27]. |
| Hydraulic Press & Stainless-Steel Die | Used to compress powdered samples into solid, homogeneous pellets, which improves the reproducibility of laser ablation and the resulting plasma [27]. |
| Nd:YAG Laser (1064 nm) | Generates high-energy pulses to ablate a micro-volume of the sample, creating a high-temperature plasma for elemental analysis [27]. |
| Ocean Optics LIBS 2000+ Spectrometer | A concatenated spectrometer system that collects and resolves the plasma emission light into a high-resolution spectrum for element identification and quantification [27]. |
| OOILIBS Software | Proprietary software used for spectral acquisition, element identification via spectral databases, and qualitative measurements [27]. |
Results and Data Presentation
Performance Metrics from a Double-Blinded LIBS Study
The table below summarizes the quantitative outcomes from the double-blinded analysis of cadmium in cocoa powder, demonstrating the method's performance [27].
| Performance Metric | Value for Cd I 340.36 nm | Value for Cd I 361.05 nm |
|---|---|---|
| Concentration Range Validated | 70 - 5000 ppm | 70 - 5000 ppm |
| Limit of Detection (LoD) | 0.4 μg/g | 0.08 μg/g |
| Agreement in Blinded Samples (Normalized Std Dev) | 9.73% | 5.88% |
Statistical Comparison in Cross-Validation
When cross-validating two ligand binding assays (LBA), a similar statistical approach can be applied to LIBS methods. In a published case study, the equivalence of two LBAs was evaluated using variance analysis. The results demonstrated that the two methods were not statistically equivalent, leading to the calculation of a specific ratio to adjust the data from one method to be comparable with the other. This adjustment was critical for accurately interpreting pharmacokinetic parameters across different studies [131].
The integration of cross-validation and double-blinded methodologies provides a robust foundation for LIBS research, enhancing the reliability and credibility of its application in sensitive and complex fields. The detailed protocols for double-blinded analysis and statistical cross-validation, as presented, offer a template for researchers to implement these rigorous practices. By doing so, the LIBS community can further solidify the technique's standing as a versatile, accurate, and trustworthy analytical tool for material analysis, from industrial contamination to advanced medical diagnostics.
Conclusion
Laser-Induced Breakdown Spectroscopy has firmly established itself as a powerful and versatile analytical technique, driven by continuous innovation in laser technology, sample handling, and data processing. The integration of artificial intelligence and machine learning is revolutionizing spectral analysis, enabling higher accuracy and automated operation. For biomedical and clinical researchers, the trajectory of LIBS points toward significant future potential in areas such as rapid tissue analysis, real-time monitoring of pharmaceutical processes, and point-of-care diagnostic tools. The ongoing miniaturization of devices and enhancement of analytical performance will further solidify LIBS's role as an indispensable tool for rapid, on-site elemental analysis, offering a compelling alternative to traditional laboratory-based methods. Future research should focus on developing standardized protocols for regulatory acceptance in pharmaceutical applications and expanding its use in direct biological sample analysis.
References
- 1. Laser-induced breakdown spectroscopy (LIBS) in ... [https://www.sciencedirect.com/science/article/abs/pii/S0165993624004758]
- 2. Fundamentals of LIBS and recent developments [https://www.sciencedirect.com/science/article/abs/pii/B9780128188293000010]
- 3. Laser-Induced Breakdown Spectroscopy [https://link.springer.com/book/10.1007/978-3-642-20668-9]
- 4. Benchmark classification dataset for laser-induced ... [https://www.nature.com/articles/s41597-020-0396-8]
- 5. A multi-distance laser-induced breakdown spectroscopy ... [https://www.nature.com/articles/s41598-025-24644-x]
- 6. LIBS quantitative analysis based on multi-model calibration ... [https://pubs.rsc.org/en/content/articlelanding/2025/ja/d5ja00132c]
- 7. Sharing calibration information among laser-induced ... [https://www.sciencedirect.com/science/article/abs/pii/S0584854723002264]
- 8. Laser-Induced Breakdown Spectroscopy (LIBS) Sensor ... [https://recyclinginside.com/recycling-technology/separation-and-sorting-technology/laser-induced-breakdown-spectroscopy-libs-sensor-sorting-technology-a-significant-recycling-solution-to-address-the-looming-shortage-of-copper/]
- 9. Laser induced breakdown spectroscopy methods and ... [https://www.sciencedirect.com/science/article/abs/pii/S0969806X1931343X]
- 10. Global High Resolution LIBS Spectrometer Market By Type ... [https://www.marketsizeandtrends.com/report/high-resolution-libs-spectrometer-market/]
- 11. Tag-laser induced breakdown spectroscopy (Tag-LIBS) [https://pubs.rsc.org/en/content/articlelanding/2025/ja/d5ja00216h]
- 12. Review of Element Analysis of Industrial Materials by In- ... [https://www.mdpi.com/2076-3417/11/19/9274]
- 13. United States Laser Induced Breakdown Spectroscopy ... [https://www.linkedin.com/pulse/united-states-laser-induced-breakdown-spectroscopy-libs-jhplf/]
- 14. Read my LIBS: Laser-sharp mineral mapping has arrived [https://www.csiro.au/en/news/all/articles/2025/august/laser-induced-breakdown-spectroscopy]
- 15. NIST: Atomic Spectra Database - LIBS Interface Help File [https://physics.nist.gov/PhysRefData/ASD/Html/libshelp.html]
- 16. LIBS, Laser Induced Breakdown Spectroscopy ... [https://www.thermofisher.com/us/en/home/industrial/spectroscopy-elemental-isotope-analysis/portable-analysis-material-id/industrial-elemental-radiation-solutions/how-does-libs-work.html]
- 17. What is LIBS? [https://appliedspectra.com/technology/libs.html]
- 18. Laser-induced Breakdown Spectroscopy Market [https://www.emergenresearch.com/industry-report/laser-induced-breakdown-spectroscopy-market?srsltid=AfmBOoqB2Fb2bgz75OfmVVS6q6QTFTGE4L7NPDOenN6RweiUNzeysTwc]
- 19. Laser Spectrometer Analysis Report 2025 [https://www.archivemarketresearch.com/reports/laser-spectrometer-177510]
- 20. New Study Demonstrates LIBS as a Promising Tool for ... [https://www.spectroscopyonline.com/view/new-study-demonstrates-libs-as-a-promising-tool-for-cement-content-analysis]
- 21. Laser-Induced Breakdown Spectroscopy Applications in ... [https://www.avantes.com/applications/cases/laser-induced-breakdown-spectroscopy-applications-in-the-physical-sciences/]
- 22. Laser-induced breakdown spectroscopy for direct analysis ... [https://www.sciencedirect.com/science/article/abs/pii/S0584854725002381]
- 23. LIBS application to powder samples [https://www.sciencedirect.com/science/article/abs/pii/B9780128188293000101]
- 24. Recent advances in laser-induced breakdown ... [https://www.sciencedirect.com/science/article/abs/pii/S0165993623002844]
- 25. Laser-Induced Breakdown Spectroscopy (LIBS) in the Real ... [https://www.linkedin.com/pulse/laser-induced-breakdown-spectroscopy-libs-real-world-wvzwf/]
- 26. Laser-Induced Breakdown Spectroscopy (LIBS) in the Real ... [https://www.linkedin.com/pulse/laser-induced-breakdown-spectroscopy-libs-real-fdtke/]
- 27. Assessing the Sensitivity and Efficiency of Laser-Induced ... [https://pmc.ncbi.nlm.nih.gov/articles/PMC12031488/]
- 28. Potential use of/evaluation of laser-induced breakdown ... [https://www.sciencedirect.com/science/article/pii/S0023643825004360]
- 29. New Research Sheds Light on How Ambient Gases Affect ... [https://www.spectroscopyonline.com/view/new-research-sheds-light-on-how-ambient-gases-affect-libs-signal-quality]
- 30. Laser Induced Breakdown Spectroscopy (LIBS) [https://avantesusa.com/libs-spectrometer/]
- 31. Application of Laser-Induced Breakdown Spectroscopy ... [https://pmc.ncbi.nlm.nih.gov/articles/PMC9321926/]
- 32. LIBS: Fundamentals, Benefits, and Advice to New Users [https://www.spectroscopyonline.com/view/libs-fundamentals-benefits-and-advice-new-users]
- 33. Applications of laser-induced breakdown spectroscopy ... [https://www.sciencedirect.com/science/article/abs/pii/S0165993620303423]
- 34. Laser-Induced Breakdown Spectroscopy: A Closer Look at ... [https://www.spectroscopyonline.com/view/laser-induced-breakdown-spectroscopy-closer-look-capabilities-libs]
- 35. Laser-Induced Breakdown Spectroscopy of ... [https://www.americanpharmaceuticalreview.com/Featured-Articles/578727-Laser-Induced-Breakdown-Spectroscopy-of-Pharmaceutical-Products/]
- 36. Sample treatment and preparation for laser-induced ... [https://www.sciencedirect.com/science/article/abs/pii/S0584854715002761]
- 37. Current developments of bioanalytical sample preparation ... [https://pmc.ncbi.nlm.nih.gov/articles/PMC9463481/]
- 38. LIBS for Liquid Samples [https://www.spectroscopyonline.com/view/libs-liquid-samples]
- 39. Optimization of laser-induced breakdown spectroscopy ... [https://www.sciencedirect.com/science/article/abs/pii/S0584854721000021]
- 40. Laser‐induced breakdown spectroscopy/laser ablation ... [https://pmc.ncbi.nlm.nih.gov/articles/PMC12046102/]
- 41. The feasibility of liquid sample microanalysis using ... [https://www.sciencedirect.com/science/article/abs/pii/S0584854716302853]
- 42. Key Challenges in LIBS—and How to Solve Them [https://www.spectroscopyonline.com/view/key-challenges-libs-and-how-solve-them]
- 43. A Matrix Effect Calibration Method of Laser-Induced ... [https://www.mdpi.com/2076-3417/15/15/8640]
- 44. Experimental and model study of LIBS depth profile for ... [https://www.sciencedirect.com/science/article/abs/pii/S0584854723001702]
- 45. A new approach to classifying polymer type of ... [https://www.nature.com/articles/s41598-024-53251-5]
- 46. ICH-Q3D based elemental impurities study in an oral drug ... [https://www.sciencedirect.com/science/article/abs/pii/S000345092500080X]
- 47. How do Pharmaceutical Laboratories Approach Elemental ... [https://www.spectroscopyonline.com/view/how-do-pharmaceutical-laboratories-approach-elemental-impurity-analysis-]
- 48. Laser-induced breakdown spectroscopy-based investigation ... [https://pmc.ncbi.nlm.nih.gov/articles/PMC3418677/]
- 49. Understanding Pharmaceutical Quality by Design - PMC [https://pmc.ncbi.nlm.nih.gov/articles/PMC4070262/]
- 50. Laser Induced Breakdown Spectroscopy (LIBS) in Biomedical ... [https://www.rpmclasers.com/blog/laser-induced-breakdown-spectroscopy-libs-in-biomedical-applications/]
- 51. 2025 Review of Spectroscopic Instrumentation [https://www.spectroscopyonline.com/view/2025-review-of-spectroscopic-instrumentation]
- 52. A novel LIBS method for quantitative and high-throughput ... [https://pubs.rsc.org/doi/d4ja00105b]
- 53. Al and Si quantitative analysis in aqueous solutions by ... [https://www.sciencedirect.com/science/article/abs/pii/S0039914020312078]
- 54. Medical application of laser-induced breakdown ... [https://www.sciencedirect.com/science/article/abs/pii/S0946672X23001177]
- 55. High sensitivity detection of heavy elements in metal by... water [https://pubs.rsc.org/en/content/articlelanding/2025/ja/d5ja00096c]
- 56. Accurate Measurement of Heavy Metals in Soil Using SC ... [https://www.spectroscopyonline.com/view/accurate-measurement-of-heavy-metals-in-soil-using-sc-libs]
- 57. Spectral screening-assisted LIBS for quantitative analysis of ... [https://pubs.rsc.org/en/content/articlehtml/2025/ja/d5ja00118h]
- 58. Rapid Detection Of Heavy On Waste- Metals Polluted Water ... Soils [https://ejournal2.undip.ac.id/index.php/jpa/article/view/7520]
- 59. LIBS in Mining: Real-Time Elemental Analysis Solutions [https://discoveryalert.com.au/libs-technology-mining-2025-geochemical-analysis/]
- 60. Rapid detection of soils contaminated with heavy and oils by... metals [https://pubmed.ncbi.nlm.nih.gov/24231316/]
- 61. Rapid Identification of LED Phosphors by Laser-Induced ... [https://pmc.ncbi.nlm.nih.gov/articles/PMC12199002/]
- 62. Rapid elemental imaging of copper-bearing critical ores ... [https://www.sciencedirect.com/science/article/pii/S0039914025009531]
- 63. LIBS Technology Transforming Sustainable Mining Practices [https://discoveryalert.com.au/sustainable-mining-libs-technology-2025/]
- 64. Fast Detection of Copper Content in Rice by Laser-Induced ... [https://pmc.ncbi.nlm.nih.gov/articles/PMC5876664/]
- 65. Laser-induced breakdown spectroscopy (LIBS) imaging for ... [https://pubs.rsc.org/en/content/articlelanding/2025/ja/d4ja00432a]
- 66. Laser ablation-based techniques for microplastic analysis [https://pmc.ncbi.nlm.nih.gov/articles/PMC12489450/]
- 67. Laser-Induced Breakdown Spectroscopy (LIBS) [https://www.malvernpanalytical.com/en/products/technology/laser-induced-breakdown-spectroscopy]
- 68. Performance evaluation of a hyphenated laser ... [https://www.nature.com/articles/s41598-024-70501-8]
- 69. Laser-induced breakdown spectroscopy for direct analysis ... [https://www.sciencedirect.com/science/article/pii/S0584854725002381]
- 70. Laser-Induced Breakdown Spectroscopy for direct analysis ... [https://ui.adsabs.harvard.edu/abs/2026AcSpB.23507353M/abstract]
- 71. Laser-based techniques: Novel tools for the identification ... [https://pubmed.ncbi.nlm.nih.gov/36435319/]
- 72. Laser-Induced Breakdown Spectroscopy for Direct ... [https://papers.ssrn.com/sol3/papers.cfm?abstract_id=5414073]
- 73. "Material Characterization using Laser-Induced Breakdown ... [https://scholarsjunction.msstate.edu/td/3016/]
- 74. Raman microspectroscopy and laser-induced breakdown ... [https://www.sciencedirect.com/science/article/pii/S2405844024138753]
- 75. LIBS Basics, Part I: Measurement Physics and ... [https://www.spectroscopyonline.com/view/libs-basics-part-i-measurement-physics-and-implementation]
- 76. Acoustic signal in overcoming the matrix effect in LIBS [https://www.sciencedirect.com/science/article/abs/pii/S0584854725000254]
- 77. Spectral interference elimination and self-absorption ... [https://www.sciencedirect.com/science/article/abs/pii/S014381662030261X]
- 78. LIBS combined with TrAdaBoost based transfer learning for ... [https://pubs.rsc.org/en/content/articlelanding/2025/ja/d5ja00227c]
- 79. From Fundamentals of Laser-Induced Breakdown ... [https://pmc.ncbi.nlm.nih.gov/articles/PMC12608634/]
- 80. Investigation of Induced Electroosmotic Flow in Small-Scale ... [https://pmc.ncbi.nlm.nih.gov/articles/PMC11502244/]
- 81. Study of the electroosmotic flow of a structured fluid with ... [https://link.springer.com/article/10.1007/s00397-023-01418-8]
- 82. Radial flow electroosmotic pump [https://www.sciencedirect.com/science/article/abs/pii/S0924424711003360]
- 83. From waste to resource: LIBS methodology development ... [https://www.sciencedirect.com/science/article/abs/pii/S0304389425004054]
- 84. Conventional versus AI-based spectral data processing ... [https://pubs.rsc.org/en/content/articlelanding/2025/ay/d5ay00027k]
- 85. Application of deep learning methods to LIBS imaging data [https://www.sciencedirect.com/science/article/abs/pii/S0584854725002009]
- 86. 激光诱导击穿光谱增强机制及技术研究进展 [https://www.chineseoptics.net.cn/article/id/9526]
- 87. Laser-induced Breakdown Spectroscopy Market Size & ... [https://www.mordorintelligence.com/industry-reports/laser-induced-breakdown-spectroscopy-market]
- 88. Improving the quantitative accuracy of one-point calibration ... [https://pubs.rsc.org/en/content/articlelanding/2025/ja/d5ja00366k]
- 89. Accuracy improvement of coal quality analysis across ... [https://www.sciencedirect.com/science/article/abs/pii/S0584854725002794]
- 90. LIBS Protocol for the Assessment of Depth Profile ... [https://www.sciencedirect.com/science/article/abs/pii/S0584854722001537]
- 91. Heavy metals high-sensitive detection by laser-induced ... [https://www.sciencedirect.com/science/article/abs/pii/S0039914023009505]
- 92. Evaluation of coffee-ring effect of serum and Ag NPs ... [https://www.sciencedirect.com/science/article/abs/pii/S0584854725000436]
- 93. Nanoparticle-Enhanced LIBS Mapping Uncovers Coffee ... [https://www.spectroscopyonline.com/view/nanoparticle-enhanced-libs-mapping-uncovers-coffee-ring-effect-in-serum-analysis]
- 94. Altering the coffee-ring effect by adding a surfactant-like ... [https://www.nature.com/articles/s41598-017-00497-x]
- 95. Synergistic integration of centrifugal ultrafiltration and ... [https://pubs.rsc.org/en/content/articlehtml/2025/ja/d5ja00217f]
- 96. Evaluation of Coffee-Ring Effect of Serum and Ag Nps ... [https://papers.ssrn.com/sol3/papers.cfm?abstract_id=4989985]
- 97. Design and fabrication of superhydrophobic ... [https://pubs.rsc.org/en/content/articlelanding/2025/ay/d4ay01582g]
- 98. Chitosan Homogenizing Coffee Ring Effect for Soil ... [https://www.mdpi.com/2227-9040/10/9/374]
- 99. Assessing the Sensitivity and Efficiency of Laser-Induced ... [https://www.mdpi.com/1424-8220/25/8/2434]
- 100. , Sensitivity , and accuracy of fs- precision for heavy metal... LIBS [https://pubmed.ncbi.nlm.nih.gov/38824339/]
- 101. Sensitivity, precision, and accuracy of fs-LIBS for heavy ... [https://opg.optica.org/abstract.cfm?uri=ol-49-11-3106]
- 102. Optimized laser-induced breakdown spectroscopy for the ... [https://opg.optica.org/ao/upcoming_pdf.cfm?id=325335]
- 103. Analytical-performance enhancement of laser-induced ... [https://pubs.rsc.org/en/content/articlelanding/2025/ja/d4ja00445k]
- 104. Improving the Signal Strength and Detection of... | SpringerLink Limits [https://link.springer.com/chapter/10.1007/978-981-33-6084-6_12]
- 105. Evaluation of limits of detection in laser-induced ... [https://www.sciencedirect.com/science/article/abs/pii/S0584854723001477]
- 106. Laser Induced Breakdown Spectroscopy for Elemental ... [https://pmc.ncbi.nlm.nih.gov/articles/PMC3231154/]
- 107. Lab Spectrometer Comparison - When to Choose ICP-AES, ICP-OES, ICP-MS, or AAS - Drawell [https://www.drawellanalytical.com/lab-spectrometer-comparison-when-to-choose-icp-aes-icp-oes-icp-ms-or-aas/]
- 108. ICP-OES Capabilities, Developments, Limitations, and Any Potential Challengers? | Spectroscopy Online [https://www.spectroscopyonline.com/view/icp-oes-capabilities-developments-limitations-and-any-potential-challengers]
- 109. ICP-OES as a Viable Alternative to ICP-MS for Trace Analysis: Meeting the Detection Limits Challenge | Spectroscopy Online [https://www.spectroscopyonline.com/view/icp-oes-as-a-viable-alternative-to-icp-ms-for-trace-analysis-meeting-the-detection-limits-challenge]
- 110. Combined LA-ICP-MS/LIBS: powerful analytical tools for ... [https://www.nature.com/articles/s41598-020-69210-9]
- 111. Evaluating the Impact of ICP-MS and LIBS on ... [https://www.spectroscopyonline.com/view/evaluating-the-impact-of-icp-ms-and-libs-on-environmental-monitoring]
- 112. Review Laser-induced breakdown spectroscopy (LIBS) for ... [https://www.sciencedirect.com/science/article/pii/S0924224417300377]
- 113. Detection of cadmium in soils using laser-induced ... [https://pmc.ncbi.nlm.nih.gov/articles/PMC9091185/]
- 114. An analytical methodology for the determination ... [https://pubmed.ncbi.nlm.nih.gov/40609487/]
- 115. Optimization of informative variables selection for ... [https://xlink.rsc.org/?DOI=d4ja00084f]
- 116. Critical aspects of data analysis for quantification in laser ... [https://www.sciencedirect.com/science/article/abs/pii/S0584854717304044]
- 117. The Hidden Risks in Analytical Method Validation [https://pharmuni.com/2025/05/16/the-hidden-risks-in-analytical-method-validation/]
- 118. Analytical Method & Its Role In Lab Testing | GMP Insiders Validation [https://gmpinsiders.com/analytical-method-validation/]
- 119. Analysis of the State of the Art: LIBS [https://www.spectroscopyonline.com/view/analysis-state-art-libs]
- 120. Laser-Induced Breakdown Spectroscopy (LIBS) [https://serc.carleton.edu/msu_nanotech/methods/libs.html]
- 121. HPLC Method : Ensuring Accuracy and Validation ... Regulatory [https://www.mastelf.com/hplc-method-validation-ensuring-accuracy-and-regulatory-compliance/]
- 122. Calibration standards for LIBS [https://www.my-standards.com/about/use-cases/calibration-standards-for-libs/]
- 123. Analytical Method Best Practices Validation [https://www.numberanalytics.com/blog/analytical-method-validation-best-practices]
- 124. Enhancing prediction stability and performance in LIBS ... [https://www.sciencedirect.com/science/article/pii/S0039914024015716]
- 125. Laser-induced breakdown spectroscopy (LIBS): calibration ... [https://pubs.rsc.org/en/content/articlelanding/2024/ja/d4ja00250d]
- 126. Hybrid Raman and Laser-Induced Breakdown ... [https://pmc.ncbi.nlm.nih.gov/articles/PMC10458226/]
- 127. Double Pulse laser-induced breakdown spectroscopy (DP- ... [https://www.sciencedirect.com/science/article/abs/pii/S0584854725000539]
- 128. A Comprehensive Review of the Fundamentals, Progress ... [https://www.mdpi.com/2304-6732/12/11/1061]
- 129. Recent advances in laser-induced breakdown ... [https://www.sciencedirect.com/science/article/abs/pii/S0165993621002089]
- 130. Diagnosis of disease using laser-induced breakdown ... [https://patents.google.com/patent/US12055495]
- 131. Experimental and statistical approaches in method cross ... [https://www.sciencedirect.com/science/article/abs/pii/S073170850800647X]
- 132. Double-Blind Study - StatPearls - NCBI Bookshelf - NIH [https://www.ncbi.nlm.nih.gov/books/NBK546641/]
- 133. Double-Blind Experimental Study And Procedure Explained [https://www.simplypsychology.org/double-blind-experimental-study-and-procedure-explained.html]
- 134. Single, Double & Triple Blind Study | Definition & Examples [https://www.scribbr.com/methodology/double-blind-study/]