Light-Matter Interactions in Spectroscopy: From Quantum Principles to Pharmaceutical Applications
This article provides a comprehensive examination of light-matter interactions underpinning spectroscopic techniques, with specialized focus on pharmaceutical research and development.
Light-Matter Interactions in Spectroscopy: From Quantum Principles to Pharmaceutical Applications
Abstract
This article provides a comprehensive examination of light-matter interactions underpinning spectroscopic techniques, with specialized focus on pharmaceutical research and development. It explores fundamental quantum mechanisms including virtual charges and plasmonic effects, details methodological applications across drug discovery and quality control, addresses critical troubleshooting and optimization strategies for analytical challenges, and presents validation frameworks for technique selection. Designed for researchers, scientists, and drug development professionals, the content synthesizes recent scientific advances with practical implementation guidance to enhance spectroscopic analysis in biomedical contexts.
Quantum Foundations: How Light Probes Matter at the Atomic Scale
The electromagnetic (EM) spectrum encompasses the entire range of electromagnetic radiation, characterized by its wave-like properties as it travels through space. This radiation is a fundamental form of energy that manifests as synchronized oscillations of electric and magnetic fields, which are perpendicular to each other and to the direction of propagation [1]. From the longest radio waves to the shortest gamma rays, all forms of EM radiation share the common trait of traveling at the speed of light in a vacuum (approximately 2.998 × 10⁸ m/s), yet they interact with matter in profoundly different ways based on their energy, wavelength, and frequency [1] [2]. The framework governing the relationships between these properties not only provides a systematic way to categorize EM radiation but also serves as the foundation for understanding how light interacts with matter in spectroscopic research.
In the context of spectroscopy, which is a primary tool for probing molecular and atomic structures, the energy-wavelength relationship of electromagnetic radiation determines the specific quantum mechanical interactions that can occur. When light encounters matter, it may be transmitted, absorbed, reflected, refracted, or scattered, with each type of interaction providing unique information about the material under investigation [2]. The energy carried by EM radiation directly influences which electronic, vibrational, or rotational states in atoms and molecules can be excited, making the selection of specific spectral regions crucial for targeted spectroscopic analysis [3] [4]. This framework is particularly relevant in pharmaceutical research and drug development, where understanding molecular interactions at the quantum level can inform drug design, analysis, and validation processes.
Fundamental Physical Relationships
Core Mathematical Framework
The relationships between the velocity, wavelength, and frequency of electromagnetic radiation are governed by a fundamental equation:
c = λν
where:
- c represents the speed of light in a vacuum (2.998 × 10⁸ m/s)
- λ (lambda) represents the wavelength
- ν (nu) represents the frequency [1]
This equation highlights the inverse relationship between wavelength and frequency; as the wavelength decreases, the frequency increases proportionally to maintain the constant speed of light. This inverse proportionality has significant implications for the energy carried by electromagnetic waves, as described by the quantum mechanical perspective of light.
From the quantum perspective, electromagnetic energy is carried in discrete packets called photons. The energy of a single photon is directly proportional to its frequency and inversely proportional to its wavelength, as expressed by the equation:
E = hν = hc/λ
where:
- E represents the energy of a single photon
- h represents Planck's constant (4.14 × 10⁻¹⁵ eV·s or 6.63 × 10⁻³⁴ J·s) [4]
This relationship means that higher frequency (shorter wavelength) electromagnetic radiation carries more energy per photon than lower frequency (longer wavelength) radiation. This energy differential fundamentally determines how different types of EM radiation interact with matter, particularly in spectroscopic applications.
Quantitative Energy Relationships Across the Spectrum
Table 1: Photon Energy Relationships Across the Electromagnetic Spectrum
| Region | Wavelength Range | Frequency Range (Hz) | Photon Energy Range | Primary Molecular Interactions |
|---|---|---|---|---|
| Gamma Rays | < 0.01 nm | > 10²⁰ | > 100 keV | Nuclear reactions, ionization |
| X-Rays | 0.01 nm - 10 nm | 10¹⁶ - 10²⁰ | 100 eV - 100 keV | Inner electron excitation, ionization |
| Ultraviolet | 10 nm - 400 nm | 7.5×10¹⁴ - 10¹⁶ | 3 eV - 100 eV | Valence electron transitions |
| Visible | 400 nm - 700 nm | 4.3×10¹⁴ - 7.5×10¹⁴ | 1.7 eV - 3 eV | Valence electron transitions |
| Infrared | 700 nm - 1 mm | 3×10¹¹ - 4.3×10¹⁴ | 0.001 eV - 1.7 eV | Molecular vibrations |
| Microwaves | 1 mm - 30 cm | 1×10⁹ - 3×10¹¹ | 0.00001 eV - 0.001 eV | Molecular rotations |
| Radio Waves | > 30 cm | < 1×10⁹ | < 0.00001 eV | Nuclear spin transitions |
For practical calculations in spectroscopy, the following relationships are particularly useful:
- hc = 1240 eV·nm [4]
- E (eV) = 1240/λ (nm) for quick energy estimations
- 1 eV = 1.60 × 10⁻¹⁹ J for energy unit conversions
These quantitative relationships enable researchers to predict and interpret the interactions between electromagnetic radiation and matter, which is fundamental to spectroscopic analysis in chemical and pharmaceutical research.
Spectroscopic Regions and Molecular Interactions
The high-energy region of the electromagnetic spectrum, comprising ultraviolet (UV) and visible radiation, primarily interacts with the electronic structure of atoms and molecules. Photons in this energy range (approximately 1.7 eV to 100 eV) possess sufficient energy to promote valence electrons to higher energy states [4]. In molecular spectroscopy, this electronic excitation forms the basis for UV-Vis spectroscopy, where the specific wavelengths absorbed reveal information about electronic energy levels and molecular orbitals.
The energy required to ionize atoms or molecules typically falls in the range of 10 to 1000 eV, which corresponds to the upper end of the UV spectrum and extends into the X-ray region [4]. This ionization potential is particularly relevant in photoelectron spectroscopy, where the kinetic energy of ejected electrons is measured to determine binding energies. In pharmaceutical research, UV-Vis spectroscopy is routinely employed for quantitative analysis, purity assessment, and kinetic studies of drug compounds, as the conjugated π-systems in many organic drug molecules exhibit characteristic absorption profiles in this region.
Mid-Energy Regimes: Molecular Vibrations
The infrared (IR) region of the electromagnetic spectrum, with photon energies ranging from approximately 0.001 eV to 1.7 eV, corresponds to the natural vibrational frequencies of chemical bonds [4]. When the frequency of incident infrared radiation matches the natural vibrational frequency of a molecular bond, absorption occurs, leading to increased amplitude of bond stretching and bending vibrations. This resonant absorption forms the basis for infrared spectroscopy, a powerful technique for identifying functional groups and characterizing molecular structure.
The energy of molecular vibrations typically falls around 0.1 eV, placing them perfectly within the infrared region of the spectrum [4]. Different functional groups absorb at characteristic frequencies; for example, O-H stretches around 3600 cm⁻¹, C=O stretches around 1700 cm⁻¹, and C-H bends around 1450 cm⁻¹. In drug development, IR spectroscopy provides valuable information about the functional groups present in drug molecules, polymorph characterization, and studying drug-excipient interactions in formulation development.
Low-Energy Regimes: Rotational and Magnetic Transitions
The microwave and radiofrequency regions represent the lowest energy portion of the electromagnetic spectrum used in spectroscopic applications, with photon energies below 0.001 eV [4]. These low-energy photons interact with matter through different mechanisms than higher-energy radiation. Microwave radiation corresponds to the rotational transitions of molecules, particularly those with permanent dipole moments, while radiofrequency radiation aligns with the energy differences between nuclear spin states in magnetic fields.
The energy required for rotational transitions of molecules is approximately 10⁻⁵ eV, which falls squarely within the microwave region [4]. This forms the basis for microwave spectroscopy, used to study molecular geometry and dipole moments. Meanwhile, the even lower-energy radio waves (particularly in the 100-1000 MHz range) are employed in Nuclear Magnetic Resonance (NMR) spectroscopy, where the precise resonance frequencies provide detailed information about molecular structure, dynamics, and the local chemical environment. NMR spectroscopy has become indispensable in drug discovery for structure elucidation, conformational analysis, and studying ligand-receptor interactions.
Advanced Spectroscopic Techniques and Applications
Nonlinear and Time-Resolved Spectroscopy
Nonlinear spectroscopy represents an advanced approach where intense laser fields induce coherent responses in materials, leading to effects that depend nonlinearly on the incident light intensity [5]. When strong optical fields interact with molecules, they induce polarization of electron clouds. If a molecule's polarizability is asymmetrical along different axes, the optical field can align molecules along a preferred direction [5]. This alignment can be either adiabatic, where the laser pulse duration is longer than the rotational period of the molecules, or nonadiabatic, where shorter pulses create transient field-free alignment [5].
The combination of adiabatic and nonadiabatic alignment fields has been studied in molecular H₂ and shown to produce a higher degree of molecular alignment than achievable with either approach alone [5]. Recent research has demonstrated that utilizing excited valence states of molecules can achieve alignment at reduced laser intensities compared to ground electronic states. For hydrogen molecules in excited E,F electronic states, the polarization anisotropy was measured at (3.7 ± 1.2) × 10³ a.u., an order of magnitude larger than the most polarizable ground state molecules [5]. These advanced alignment techniques enable more precise control over molecular orientation, which is crucial for understanding reaction dynamics and molecular interactions in pharmaceutical research.
Correlated Multispectral Approaches
Recent advances in spectroscopy have focused on correlating light-matter interactions across different spectral regimes to gain more comprehensive molecular insights. One innovative approach uses mid-infrared plasmons to trigger visible surface-enhanced Raman spectroscopy (SERS) signals within specially designed nanocavities [6]. These nanocavities, often constructed from a metallic nano-sphere on a planar metal film separated by a monolayer of molecules, can concentrate optical fields into deep subwavelength volumes, creating significant localized-field enhancement known as "hot spots" [6].
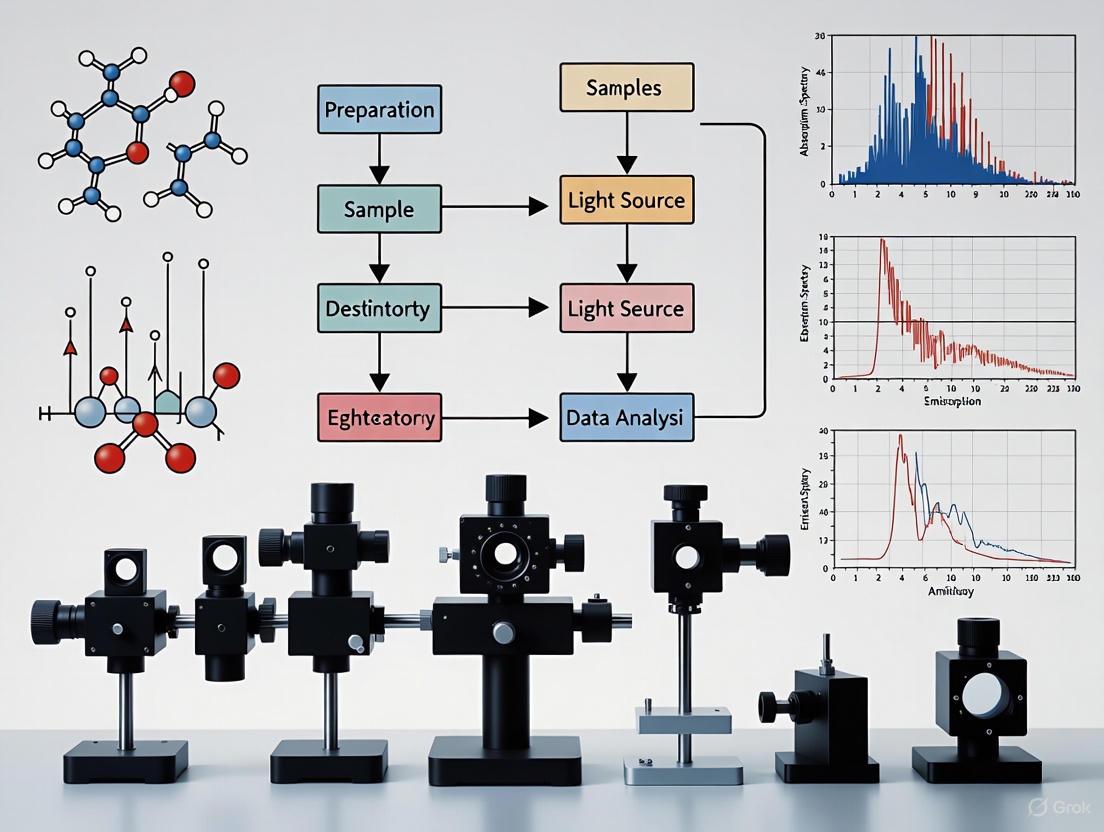
The experimental methodology for this correlated approach involves several key steps. First, a carefully designed optical system focuses both visible and mid-IR beams to excite plasmons within the nanogap. The mid-IR perturbation modulates the SERS signal at visible wavelengths emitted from molecules within the gap between the Au sphere and the planar film. Using advanced detection schemes like single-photon lock-in detection, researchers have observed the time-dependent rise and decay of SERS signals over a few hundred nanoseconds [6]. This approach opens new possibilities for manipulating optical signatures of chemical molecules from tiny volumes and studying quantum mechanical effects in light-matter interactions, with potential applications in drug development for sensitive detection and characterization of pharmaceutical compounds.
Diagram 1: Workflow for correlated visible and mid-infrared spectroscopy using plasmonic nanocavities.
Experimental Protocols and Methodologies
Plasmon-Enhanced Spectroscopy Protocol
Objective: To utilize mid-infrared plasmons to trigger and modulate visible SERS signals within a nanocavity structure for enhanced molecular detection [6].
Materials and Equipment:
- Metallic nano-sphere (typically Au or Ag)
- Planar metal film (Au or Ag)
- Monolayer of target molecules
- Visible and mid-IR laser sources
- High-numerical aperture focusing optics
- Single-photon lock-in detection system
- Vibration isolation table
- Atomic force microscope (for nanogap characterization) [6]
Procedure:
- Nanocavity Fabrication:
- Prepare a clean, flat metal film substrate (typically gold or silver) using physical vapor deposition.
- Deposit metallic nanospheres of controlled size (typically 50-100 nm diameter) onto the substrate.
- Functionalize the surface with a monolayer of target molecules using self-assembled monolayer techniques.
- Characterize the nanogap spacing using atomic force microscopy to ensure optimal plasmonic enhancement [6].
Optical Alignment:
- Align the visible and mid-IR laser beams co-linearly using dichroic mirrors.
- Focus both beams onto the nanocavity using a high-numerical aperture objective lens.
- Ensure precise spatial overlap of the focused spots at the sample plane [6].
Signal Modulation and Detection:
- Modulate the mid-IR beam at a specific frequency (typically kHz range).
- Detect the visible SERS signal using a single-photon avalanche diode.
- Use lock-in amplification referenced to the mid-IR modulation frequency to extract the modulated component of the SERS signal.
- Record the time-dependent rise and decay of the SERS signal with nanosecond resolution [6].
Data Analysis:
- Correlate the modulated SERS signal with the mid-IR perturbation.
- Analyze the temporal response to extract molecular dynamics information.
- Compare signal enhancement factors with theoretical predictions.
Troubleshooting Tips:
- If SERS enhancement is insufficient, verify nanogap dimensions and metal surface quality.
- If modulation depth is low, ensure precise spatial overlap of visible and mid-IR beams.
- For poor signal-to-noise ratio, optimize lock-in amplifier time constant and increase integration time.
Molecular Alignment Spectroscopy Protocol
Objective: To achieve and quantify precise alignment of molecules using intense laser fields for controlled spectroscopic investigations [5].
Materials and Equipment:
- High-power femtosecond/picosecond laser system (for nonadiabatic alignment)
- High-power nanosecond laser system (for adiabatic alignment)
- Vacuum chamber with molecular beam source
- Femtosecond/picosecond coherent anti-Stokes Raman scattering (CARS) detection system
- Precision delay stages for temporal synchronization
- Polarization optics (waveplates, polarizers) [5]
Procedure:
- Molecular Beam Preparation:
- Generate a supersonic molecular beam of the target species (e.g., H₂) in a vacuum chamber.
- Cool molecules to low rotational temperatures (typically 1-10 K) through adiabatic expansion.
- Characterize the molecular beam properties using time-of-flight mass spectrometry [5].
Laser Alignment:
- For nonadiabatic alignment: Use a femtosecond laser pulse (duration < rotational period) to create a coherent superposition of rotational states.
- For adiabatic alignment: Use a nanosecond laser pulse (duration > rotational period) to gradually align molecules along the laser polarization axis.
- For combined alignment: Implement both adiabatic and nonadiabatic fields sequentially for enhanced alignment [5].
Alignment Detection via CARS:
- Probe the degree of molecular alignment using femtosecond/picosecond CARS.
- Use multiple laser beams (pump, Stokes, and probe) with precise temporal delays.
- Measure the CARS signal intensity as a function of the probe polarization angle.
- Image the spatial distribution of alignment using 1D or 2D imaging detection [5].
Excited State Alignment (Optional):
- For enhanced polarizability, first excite molecules to valence-excited states (e.g., H₂ E,F state).
- Apply alignment laser pulses during the excited state lifetime.
- Measure the laser power dependence of alignment to determine polarization anisotropy [5].
Data Analysis:
- Quantify the degree of alignment using ⟨cos²θ⟩ parameters.
- Compare alignment dynamics with theoretical simulations.
- Extract molecular parameters such as polarizability anisotropy from power dependence measurements.
Research Reagents and Materials
Table 2: Essential Research Reagents and Materials for Advanced Spectroscopy
| Category | Specific Items | Function/Application | Technical Notes |
|---|---|---|---|
| Nanocavity Components | Gold nanospheres (50-100 nm) | Plasmonic enhancement in SERS | Size uniformity critical for resonance tuning |
| Silver and gold films | Substrate for nanocavity | Surface roughness < 1 nm for optimal performance | |
| Self-assembled monolayer molecules | Raman-active probe layers | Thiol-terminated for gold surfaces | |
| Laser Sources | Tunable visible lasers (e.g., Ti:Sapphire) | SERS excitation | Pulse duration from fs to ns depending on application |
| Mid-infrared quantum cascade lasers | Plasmonic perturbation | Wavelength tunability around molecular vibrations | |
| Nd:YAG lasers (1064 nm) | Molecular alignment | Nanosecond pulses for adiabatic alignment | |
| Detection Systems | Single-photon avalanche diodes | SERS signal detection | High quantum efficiency in visible range |
| Lock-in amplifiers | Signal extraction from noise | Reference to modulation frequency | |
| Spectrometers with CCD detectors | Spectral dispersion and recording | High groove density gratings for Raman | |
| Molecular Samples | Hydrogen (H₂) | Model system for alignment studies | Supersonic cooling for rotational states |
| Functionalized organic molecules | Pharmaceutical relevance | Conjugated systems for enhanced Raman |
The electromagnetic spectrum framework, governed by the fundamental relationships between energy, wavelength, and frequency, provides the scientific foundation for understanding and exploiting light-matter interactions in spectroscopic research. From the high-energy ionizing radiation that probes inner electronic structure to the low-energy radio waves that reveal nuclear spin environments, each region of the spectrum offers unique capabilities for interrogating molecular systems. The continued development of advanced spectroscopic techniques, including correlated multispectral approaches and nonlinear methods, promises to further expand our ability to probe and control matter at the molecular level. For researchers in drug development and pharmaceutical sciences, these spectroscopic tools provide invaluable insights into molecular structure, dynamics, and interactions that drive innovation in therapeutic design and development.
Spectroscopy is the field of study that measures and interprets electromagnetic spectra to investigate the composition, physical structure, and electronic structure of matter at atomic, molecular, and macroscopic scales [7]. These analyses are possible due to fundamental interactions between light and matter—primarily absorption, emission, and scattering. Each process provides unique information about the material under investigation, enabling researchers to identify substances, determine concentrations, and study molecular energy states [8] [9]. The predictability of these interactions forms the foundation for spectroscopic techniques used across scientific disciplines, from analytical chemistry and drug development to astronomy and materials science [10] [7].
Fundamental Principles of Light and Matter
The Nature of Light
Light, or electromagnetic radiation, exhibits dual wave-particle nature [10].
- Wave Properties: Light behaves as a wave consisting of oscillating electric and magnetic fields, characterized by its wavelength—the distance between successive peaks. Different wavelengths correspond to different colors in the visible spectrum and different regions of the electromagnetic spectrum, from gamma rays to radio waves [10].
- Particle Properties: Light also behaves as a stream of particles called photons. Each photon carries a discrete amount of energy quantized according to the formula E = hc/λ, where h is Planck's constant, c is the speed of light, and λ is the wavelength [10].
The Structure of Matter
Matter is composed of atoms and molecules that contain discrete energy levels [10].
- Atomic Structure: Atoms consist of a nucleus surrounded by electrons occupying specific energy levels or orbitals [10].
- Molecular Energy States: Molecules possess three types of quantized energy states: electronic (electron configurations), vibrational (atomic oscillations), and rotational (molecular spinning) [11] [7]. Transitions between these states require specific energy inputs corresponding to distinct regions of the electromagnetic spectrum [11].
Core Interaction Mechanisms
The three primary mechanisms of light-matter interaction in spectroscopy are absorption, emission, and scattering, each with distinct characteristics and underlying principles.
Absorption
Absorption occurs when a molecule or atom takes in energy from incident electromagnetic radiation, promoting it from a lower energy state to a higher energy state [8]. The energy of the absorbed photon must exactly match the energy difference between two quantum mechanical states of the material [9].
Theoretical Foundation Absorption lines correspond to transitions between specific quantum states [9]:
- Electronic Transitions: Involve promotion of electrons to higher orbitals, typically observed in UV-Vis regions [11].
- Vibrational Transitions: Involve changes in molecular vibrational states, typically observed in infrared regions [11].
- Rotational Transitions: Involve changes in molecular rotational states, typically observed in microwave regions [9].
The probability of absorption is determined by the transition dipole moment, which depends on the change in the electronic, vibrational, or rotational state of the molecule [8]. The intensity of absorbed radiation follows the Beer-Lambert Law: A = εcd, where A is absorbance, ε is the molar absorption coefficient, c is concentration, and d is path length [11].
Emission
Emission occurs when a molecule releases energy in the form of electromagnetic radiation, transitioning from a higher energy state to a lower energy state [8]. Materials can emit light through different mechanisms with varying timescales and characteristics.
Emission Mechanisms
- Spontaneous Emission: An excited molecule spontaneously decays to a lower energy state, emitting a photon with energy corresponding to the energy difference between states [8].
- Stimulated Emission: An incident photon interacts with a molecule in an excited state, causing it to emit an additional photon identical in energy, phase, and direction [8].
- Photoluminescence: Light emission following photon absorption, including fluorescence (fast, spin-allowed) and phosphorescence (slower, spin-forbidden) [11].
The Jablonski diagram illustrates these processes, showing ground and excited electronic states, vibrational energy levels, and transitions between them, including non-radiative processes like internal conversion and intersystem crossing [11].
Quantitative Relationships Emission intensity is proportional to the population of molecules in the higher energy state [8]. For fluorescence, the quantum yield (Φ) represents the efficiency: Φ = photons emitted / photons absorbed. The fluorescence lifetime (τ) is the time for emission intensity to decay to 1/e of its initial value [11].
Scattering
Scattering occurs when electromagnetic radiation interacts with a molecule and is deflected or redirected without being absorbed or emitted [8]. Unlike absorption and emission, scattering processes typically do not involve energy transfer to the molecule [8].
Elastic Scattering
- Rayleigh Scattering: Incident radiation interacts with a molecule, causing it to oscillate and re-emit radiation at the same frequency [8]. The intensity is proportional to the inverse fourth power of wavelength (I ∝ 1/λ⁴), explaining why shorter wavelengths (blue light) scatter more in the atmosphere [8].
Inelastic Scattering
- Raman Scattering: The incident radiation interacts with a molecule, causing a transition to a different vibrational or rotational state and re-emitting radiation at a different frequency [8].
- Brillouin Scattering: Involves interaction with acoustic phonons (collective vibrational modes) in a material, resulting in small frequency shifts determined by acoustic properties [8].
Factors Influencing Scattering Scattering intensity depends on molecular polarizability (how easily the electron cloud distorts) and changes in polarizability during molecular vibrations or rotations [8]. External factors like concentration, temperature, and intermolecular interactions also affect scattering properties [8].
Comparative Analysis of Interaction Mechanisms
The table below summarizes the key characteristics of the three core interaction mechanisms:
| Parameter | Absorption | Emission | Scattering |
|---|---|---|---|
| Energy Transfer | Energy from radiation to matter | Energy from matter to radiation | Typically no net energy transfer (except inelastic) |
| Spectral Characteristics | Discrete peaks at transition energies | Discrete peaks at transition energies | Continuous, less structured (Rayleigh); discrete shifts (Raman) |
| Intensity Dependence | Population of lower energy state | Population of higher energy state | Molecular polarizability |
| Primary Information Obtained | Energy level differences, concentration | Energy level differences, excited state dynamics | Molecular vibrations, rotations, material properties |
| Typical Experimental Measurement | Transmitted light intensity | Emitted light intensity | Scattered light intensity and wavelength |
Experimental Methodologies
Absorption Spectroscopy Protocols
UV-Vis Absorption Spectroscopy
- Instrumentation: Consists of broadband light source, dispersion element, wavelength selector, detector, and recorder [11].
- Sample Preparation: Samples are typically dissolved in transparent solvents and placed in cuvettes with precise path lengths [11].
- Measurement Protocol:
- Record baseline spectrum with reference solvent
- Measure sample spectrum
- Calculate absorbance: A = -log₁₀(I/I₀)
- Apply Beer-Lambert Law for quantification [11]
- Applications: Determining protein concentration by measuring absorption at 280 nm (aromatic amino acids) [11].
Emission Spectroscopy Protocols
Fluorescence Spectroscopy
- Instrumentation: Light source (broadband or laser), excitation monochromator, sample chamber, emission monochromator, detector [11].
- Measurement Geometries: Typically 90° detection relative to excitation to minimize background [11].
- Time-Resolved Measurements:
- Use pulsed laser excitation
- Detect time-dependent emission decay
- Fit to exponential decay: I(t) = I₀e^(-t/τ) to determine fluorescence lifetime [11]
- Specialized Techniques: Förster Resonance Energy Transfer (FRET) measures molecular proximity via distance-dependent energy transfer between fluorophores [11].
Scattering Spectroscopy Protocols
Raman Spectroscopy
- Instrumentation: Monochromatic laser source, high-throughput spectrometer, sensitive detector (CCD) [8].
- Sample Considerations: Minimize fluorescence interference; may require surface enhancement for weak signals.
- Measurement Protocol:
- Illuminate sample with monochromatic laser
- Collect scattered light at 90° or 180° geometry
- Filter out elastically scattered (Rayleigh) light
- Analyze frequency shifts corresponding to molecular vibrations [8]
The Scientist's Toolkit: Essential Research Reagents and Materials
The table below details key reagents and materials essential for spectroscopic experiments:
| Reagent/Material | Function | Application Examples |
|---|---|---|
| Cuvettes | Sample containment with precise path lengths | Absorption measurements across UV-Vis-IR [11] |
| Reference Standards | Instrument calibration and quantification | Beer-Lambert Law applications [11] |
| Deuterated Solvents | NMR-compatible solvents with minimal interference | Nuclear Magnetic Resonance spectroscopy [12] |
| Fluorescent Dyes | Molecular probes with specific excitation/emission | Biological imaging, FRET experiments [11] |
| Internal Standards | Signal normalization for quantitative accuracy | Mass spectrometry, chromatography [13] |
| ATR Crystals | Internal reflection elements | FTIR spectroscopy of solid samples [12] |
| Matrix Compounds | Energy absorption and transfer | MALDI mass spectrometry [13] |
Advanced Concepts and Recent Developments
Strong Coupling and Polaritons
Recent advances have enabled strong coupling regimes where light-matter interaction is so intense that new hybrid states called polaritons form [14]. These part-light, part-matter quasiparticles enable phenomena like room-temperature strong coupling and ultrafast "forbidden" transitions [14].
Photonic Quasiparticles
Photonic quasiparticles are quantized solutions of Maxwell's equations in complex media that can confine electromagnetic fields to nanoscale dimensions [14]. Examples include:
- Surface Plasmon-Polaritons: Confined electromagnetic waves at metal-dielectric interfaces [14]
- Phonon-Polaritons: Hybrid light-lattice vibration states [14]
- Exciton-Polaritons: Coupled light-electronic excitation states [14]
These quasiparticles enable unprecedented control over light-matter interactions, with applications in ultrafast electron microscopy, compact X-ray sources, and quantum information processing [14].
Quantitative Spectroscopic Techniques
Modern spectroscopy increasingly focuses on quantitative analysis, particularly in fields like pharmaceutical development and clinical analysis [13]. Techniques like quantitative mass spectrometry face challenges including ion suppression effects, need for internal standards, and signal variability [13]. Methodological improvements continue to enhance the precision and accuracy of spectroscopic quantification.
Spectroscopy is founded on the core quantum mechanical principle that the energy levels of atoms and molecules are quantized. When a quantum system—be it an atom, molecule, or nanostructure—interacts with light, it can undergo a transition between these discrete energy levels by absorbing or emitting a photon. The energy of this photon must exactly match the energy difference between the two levels, as given by the relation E = hν, where E is the energy difference, h is Planck's constant, and ν is the frequency of the photon [15]. This exact energy matching results in the unique spectral fingerprints that enable the identification of substances from simple gases to complex biomolecules and advanced nanomaterials [16] [17]. These fingerprints are not merely identifiers; they provide profound insights into molecular structure, dynamics, and the local environment, making spectroscopy an indispensable tool across the physical and life sciences.
Fundamental Quantum Principles
Quantized Energy States
The energy of an isolated atom or molecule is confined to specific, discrete values known as quantum states. Each quantum state has a definite energy, and transitions can occur only between these allowed states [15]. For the simplest atom, hydrogen, quantum theory predicts these energy levels with extraordinary precision, with calculations tested to an uncertainty of better than one part in 10¹¹. The complexity of calculation increases for many-electron atoms and molecules, but the fundamental principle of quantization remains [15].
Energy Level Transitions and Spectral Lines
When a quantum system transitions from a higher energy state, E_upper, to a lower one, E_lower, the energy difference ΔE = E_upper - E_lower is emitted as a photon of frequency ν = ΔE / h. Conversely, the system can be promoted to a higher energy state by absorbing a photon of the same frequency. The discrete nature of these transitions manifests in spectra as sharp spectral lines, which can be either emission lines (bright lines against a dark background) or absorption lines (dark lines against a continuous spectrum) [15]. The discovery and interpretation of these lines, such as the Fraunhofer lines in the solar spectrum, form the historical foundation of spectroscopic analysis [15].
The Rigid Rotor: A Quantum Model for Molecular Rotation
In molecular spectroscopy, the rigid rotor model provides a quantum mechanical description of a rotating diatomic molecule. The allowed rotational energy levels are given by:
where J is the rotational quantum number (J = 0, 1, 2, ...), and I is the molecule's moment of inertia [18]. These energy levels are typically expressed in wavenumbers (cm⁻¹) for practical spectroscopic use:
Here, B = h / (8π²I c) is the rotational constant, which is inversely proportional to the moment of inertia [18]. The quantized energy levels for N₂H⁺ (diazenylium), for example, show that the energy increases with J, and the levels are more widely spaced as J increases [18].
Table 1: Rotational Energy Levels of a Diatomic Molecule (Rigid Rotor Model)
| Quantum Number (J) | Energy Expression (ε_J) | Example: N₂H+ Relative Energy |
|---|---|---|
| 0 | 0 | 0 |
| 1 | 2B | ≈ 3 cm⁻¹ |
| 2 | 6B | ≈ 10 cm⁻¹ |
Selection Rules
Not all conceivable transitions between quantum states are allowed. Selection rules, derived from quantum mechanics, dictate the permissible transitions. For pure rotational spectroscopy in a diatomic molecule, the governing selection rule is ΔJ = ±1 [18]. This rule means that transitions can only occur between adjacent rotational levels. Applying this rule to the rigid rotor model, the wavenumber of the absorbed or emitted photon for a transition from level J to J+1 is:
This results in a spectrum composed of a series of equally spaced lines, each separated by 2B [18].
Advanced Spectroscopic Techniques and Applications
Vibrational Circular Dichroism (VCD)
Vibrational Circular Dichroism (VCD) is a sophisticated technique that measures the difference in absorption of left-handed versus right-handed circularly polarized light by chiral molecules in their vibrational transitions [19] [20]. Unlike traditional Circular Dichroism (CD) operating in the UV-visible range, VCD operates in the mid-infrared (MIR) region, probing vibrational transitions of chemical bonds and functional groups (e.g., the amide I band in proteins) [19]. This provides multidimensional structural information, making it particularly powerful for identifying protein secondary structures and detecting misfolded proteins associated with diseases like Alzheimer's and Parkinson's [19]. A key limitation of VCD is its inherently weak signal, typically on the order of 10⁻⁵, which is three orders of magnitude smaller than UV-visible CD signals [19] [20].
Surface-Enhanced Vibrational Circular Dichroism (SEVCD)
To overcome the inherent weakness of VCD signals, Surface-Enhanced Vibrational Circular Dichroism (SEVCD) has been developed using chiral plasmonic metamaterials [19] [20]. These engineered nanostructures, such as the reported infrared chiral plasmonic metamaterials (IRCPMs) made of perpendicular gold nanorods on an Al₂O₃-Au-Si substrate, create intense, localized optical fields [19]. They enhance the chiral light-matter interaction by leveraging both in-plane and out-of-plane symmetry-breaking structures, leading to a dramatic signal enhancement of up to six orders of magnitude compared to conventional VCD [19] [20]. This platform has demonstrated a detection limit down to ~23 zeptomoles for protein samples and enables the differentiation of mixing ratios in chiral mixtures, opening new pathways for pharmaceutical analysis and clinical diagnosis [19].
Table 2: Comparison of Chiroptical Spectroscopy Techniques
| Technique | Spectral Region | Signal Strength | Primary Information | Key Applications |
|---|---|---|---|---|
| Circular Dichroism (CD) | UV-Vis-NIR | Millidegree (mdeg) level | Handedness/Chirality | Determining chirality of molecules |
| Vibrational CD (VCD) | Mid-IR (MIR) | Microdegree (μdeg) level | Chirality + Molecular Structure (IR fingerprints) | Protein secondary structure analysis |
| Surface-Enhanced VCD (SEVCD) | Mid-IR (MIR) | Enhanced by 10⁶ over VCD | Enhanced chirality + structure | Sensing chiral mixtures, zeptomole-level detection |
Experimental Protocols and Methodologies
Protocol: Acquisition of a Rotational Microwave Spectrum
This protocol outlines the steps to obtain and analyze the rotational spectrum of a polar diatomic molecule like HCl or CO [18].
- Sample Preparation: Introduce the gaseous sample into a microwave spectrometer cell. The gas phase is essential to allow molecules to rotate freely without hindrance [18].
- Spectral Acquisition: Scan the microwave frequency while monitoring the absorption of radiation by the sample. The gross selection rule requires the molecule to possess a permanent electric dipole moment (e.g., heteronuclear diatomics like HCl, CO; homonuclear diatomics like O₂, N₂ are inactive) [18].
- Spectral Analysis:
- Observe a series of absorption lines with near-equal spacing.
- Measure the frequency or wavenumber (
Δν_exp) of each line. The separation between consecutive lines isΔν_exp ≈ 2B. - Calculate the rotational constant:
B = Δν_exp / 2.
- Molecular Property Calculation:
- Moment of Inertia: Calculate using
I = h / (8π²B c). - Bond Length: Using the reduced mass
μ = (m₁m₂)/(m₁+m₂), calculate the bond lengthRfrom the relationI = μR²[18].
- Moment of Inertia: Calculate using
Protocol: SEVCD Sensing of Protein Secondary Structures
This protocol describes the enhanced sensing of protein structures using chiral metamaterials, as detailed in recent research [19].
- Chip Fabrication: Fabricate the IRCPM sensor chip using a two-step lithography and metal lift-off process to create perpendicular gold nanorods of different thicknesses on a layered Al₂O₃-Au-Si substrate, ensuring both in-plane and out-of-plane asymmetry [19].
- Sample Deposition: Deposit a thin-film of the protein sample (e.g., BSA, β-lactoglobulin) in solution onto the sensor chip, targeting a volume as small as 1 μL [19].
- Reflection Measurement: Illuminate the sensor with mid-infrared left-handed circularly polarized (LCP) and right-handed circularly polarized (RCP) light. Measure the reflection spectrum (
R) for each polarization [19]. - Data Processing:
- Calculate absorption for each polarization:
A = 1 - R. - Determine the VCD signal, defined as
ΔA = A_L - A_R(the absorption difference between LCP and RCP) [19].
- Calculate absorption for each polarization:
- Signal Interpretation: Analyze the enhanced VCD signal in the amide I and II vibrational regions (1700–1600 cm⁻¹). The resulting spectral fingerprints allow for the identification of secondary structures like α-helices and β-sheets, and can differentiate between different proteins and their mixtures [19].
The Scientist's Toolkit: Key Research Reagents and Materials
Table 3: Essential Materials and Reagents for Advanced Spectroscopic Experiments
| Item | Function / Application |
|---|---|
| Polar Diatomic Gases (e.g., HCl, CO, NO) | Model systems for studying fundamental rotational spectroscopy and validating quantum mechanical models [18]. |
| Chiral Analytic Molecules (e.g., (R)- and (S)-1-phenylethylamine, proteins) | Essential for CD and VCD studies to investigate enantioselective interactions, chirality, and biomolecular structures [19] [20]. |
| Gold Nanorods & Chiral Metamaterials | Engineered nanostructures that act as the sensing platform in SEVCD, providing massive signal enhancement via plasmonic effects [19]. |
| Al₂O₃-Au-Si Substrate | A common multilayer substrate used for fabricating MIR metamaterials, serving as a reflector and support structure [19]. |
| Chinese Hamster Ovary (CHO) Cell Culture Media | Used in biopharmaceutical spectroscopy (e.g., with ICP-MS) to speciate and quantify metal impacts on monoclonal antibody production [21]. |
| Porous Agarose Bead Matrix | Used in UV-vis spectroscopic imaging to mimic human subcutaneous tissue for studying biotherapeutic transport [21]. |
| Carbon Nanotubes & 2D Semiconductors | Low-dimensional nanomaterials studied via photoluminescence and Raman spectroscopy for developing advanced optoelectronic devices [17]. |
Visualizing Quantum Transitions and Experimental Workflows
Quantum Energy Levels and Transitions
Diagram 1: Rotational energy levels and transitions. This diagram illustrates the quantized rotational energy levels (J=0,1,2) of a diatomic molecule, showing both absorption (red) and emission (green) transitions that obey the ΔJ=±1 selection rule [18].
SEVCD Enhanced Detection Workflow
Diagram 2: SEVCD protein detection workflow. The process involves fabricating a chiral metamaterial sensor, depositing the protein sample, measuring the differential absorption of LCP and RCP light, and calculating the VCD signal to analyze protein structure [19].
The quantum principles of energy level transitions and spectral fingerprints form the unshakable foundation of spectroscopy. From the well-defined rotational transitions of diatomic molecules to the complex vibrational modes of proteins, the quantized interaction of light with matter provides a powerful window into the structural and dynamic properties of materials. The ongoing innovation in spectroscopic methods, such as the metamaterial-enhanced SEVCD, continues to push the boundaries of sensitivity and selectivity. These advancements, underpinned by quantum mechanics, ensure that spectroscopy remains a cornerstone technique for driving progress in drug development, materials science, and clinical diagnostics.
The interaction of light with matter represents one of the most fundamental processes in physics, underlying technologies ranging from semiconductors to solar cells. For decades, our understanding of these interactions has been constrained by the temporal resolution of available measurement techniques, which could only access processes on the femtosecond (10⁻¹⁵ s) timescale—sufficient for tracking atomic motion but inadequate for capturing the dynamics of electrons. The development of attosecond (1 as = 10⁻¹⁸ s) spectroscopy has shattered this barrier, enabling direct observation of electronic processes in real time [22] [23]. This revolutionary capability has unveiled a previously hidden landscape of electron dynamics, particularly revealing the critical distinction between real and virtual charges in condensed matter systems.
Real charges involve actual electron excitation across band gaps, leading to measurable current and lasting material changes. In contrast, virtual charges exist only transiently during light illumination, leaving no net population of excited carriers yet profoundly influencing a material's optical response [24] [25]. The discovery and characterization of these virtual charges demand attosecond temporal resolution because their dynamics unfold during the optical cycle itself. This technical guide explores how attosecond spectroscopy has transformed our fundamental understanding of light-matter interactions by disentangling the roles of virtual and real charges, with profound implications for the development of next-generation petahertz optoelectronic devices [24].
Theoretical Foundation: Virtual vs. Real Charge Carriers
Fundamental Definitions and Characteristics
In strong-field light-matter interactions, the distinction between real and virtual charge carriers is fundamental:
Real Charges: These are electrons that gain sufficient energy from the light field to overcome the material's band gap, resulting in net population transfer from valence to conduction bands. Once excited, these carriers exhibit finite lifetimes, contribute to electrical conductivity, and can lead to permanent material modifications. Their excitation is governed by probability laws and photon energy requirements [24].
Virtual Charges: Unlike their real counterparts, virtual charges represent transient, field-induced perturbations that exist only during the illumination period without net population transfer. They do not contribute to DC conductivity but dominate the initial, reversible material response on sub-femtosecond timescales. Virtual charge dynamics encompass both intraband motion (acceleration of electrons within bands) and virtual interband transitions (transient coupling between bands) [24] [25].
Quantum Mechanical Framework
The theoretical description of virtual charges originates from time-dependent perturbation theory, where the light-matter interaction Hamiltonian induces transient polarization without permanent state occupation. When an intense light field interacts with a solid, it drives two primary classes of electronic processes:
Intraband motion: Refers to the acceleration of electrons within a single energy band, described by the Bloch acceleration theorem. This motion generates time-dependent currents that resculpt the energy bands adiabatically, manifesting as the dynamic Franz-Keldysh effect [24].
Interband transitions: Involve the coupling between different electronic bands. These can be either real transitions (with complete electron transfer between bands) or virtual transitions (where electrons only transiently sample adjacent bands before returning to their original state) [24].
Table: Comparative Properties of Real and Virtual Charges
| Property | Real Charges | Virtual Charges |
|---|---|---|
| Existence | Finite lifetime beyond pulse duration | Exist only during light illumination |
| Population | Net carrier excitation | No net population transfer |
| Conductivity | Contribute to DC and AC conductivity | No DC conductivity contribution |
| Timescale | Femtoseconds to nanoseconds | Attoseconds to femtoseconds |
| Primary Effects | Carrier heating, structural changes, photocurrent | Instantaneous polarization, nonlinear optics |
| Theoretical Description | Fermi's golden rule, rate equations | Time-dependent perturbation theory |
Experimental Methodologies in Attosecond Spectroscopy
Attosecond Transient Reflection Spectroscopy (ATRS)
The investigation of virtual charge dynamics demands techniques with both attosecond temporal resolution and sensitivity to subtle changes in optical properties. Attosecond transient reflection spectroscopy (ATRS) has emerged as a powerful method meeting these requirements. In a groundbreaking 2025 study on monocrystalline diamond, researchers implemented ATRS through the following experimental workflow [24]:
Pump Pulse: A few-femtosecond infrared laser pulse (center wavelength 800 nm, duration ~10 fs, peak intensity ~2.5×10¹³ W/cm²) initiates virtual charge dynamics in the diamond sample.
Probe Pulse: An attosecond extreme ultraviolet (XUV) pulse (spectral range 20-44 eV, generated via high-harmonic generation) probes the pump-induced changes with attosecond temporal resolution.
Beam Geometry: Both beams are linearly polarized along the [011] crystallographic direction and impinge on the sample at 44.6° relative to the surface normal ([100] direction), optimized for total external reflection around 40 eV to enhance sensitivity.
Detection System: Precision measurement of differential reflectivity (ΔR/R) with attosecond delay control between pump and probe pulses, enabled by an interferometric setup with active stabilization.
The ATRS technique provides direct access to the timing and adiabaticity of the crystal's optical response by measuring pump-induced modifications to the reflectivity across a broad photon energy range previously inaccessible in transmission measurements [24].
Complementary Attosecond Techniques
While ATRS provides exceptional insights into virtual charge dynamics, several complementary techniques have expanded the toolkit for attosecond spectroscopy:
Attosecond Streaking: Originally developed for gas-phase studies, this technique measures the energy modulation of photoelectrons emitted by an attosecond XUV pulse in the presence of a synchronized infrared field. It provides direct access to the temporal structure of attosecond pulses and has been adapted for condensed-phase studies [22] [23].
Attosecond Transient Absorption Spectroscopy (ATAS): Monitors pump-induced changes in the absorption spectrum of a material with attosecond temporal resolution. This method is particularly sensitive to excited state populations and coherence dynamics [26].
Time-Dependent Photoemission Spectroscopy: Measures the time-resolved energy distribution of electrons photoemitted from surfaces, revealing attosecond delays in photoemission from different electronic states [23].
Key Experimental Findings: The Crucial Role of Virtual Charges
Virtual Interband Transitions in Diamond
The 2025 diamond study provided compelling evidence that virtual interband transitions (VITs), often neglected in favor of intraband motion, play an indispensable role in strong-field-induced phenomena. Key findings include [24]:
Non-Trivial Phase Relationships: The experimental data revealed a complex phase delay dispersion between the 2ωIR oscillations in differential reflectivity and the squared vector potential of the pump field. This non-constant phase relationship contradicted models considering only intraband motion.
Band Structure Dependence: Theoretical calculations identified a reduced set of nine electronic subbands (four valence and five conduction bands) that dominate the optical response. Selective inclusion and exclusion of interband transitions between these bands demonstrated that VITs significantly affect both timing and adiabaticity of the system response.
Intensity Independence: The importance of VITs persisted across a relatively wide range of pump intensities, suggesting their fundamental nature rather than being a niche effect.
Validation of Macroscopic Laws: The measurements confirmed that macroscopic Fresnel equations governing light reflection remain valid even at attosecond timescales and nanometric length scales, bridging the gap between quantum dynamics and classical optics.
Table: Quantitative Parameters from Attosecond Spectroscopy of Diamond
| Parameter | Value | Significance |
|---|---|---|
| Pump Pulse Duration | ~10 fs | Encompasses few optical cycles at 800 nm |
| Pump Intensity | ~2.5×10¹³ W/cm² | Below damage threshold but sufficient for nonlinear effects |
| Probe Photon Energy Range | 20-44 eV | Accesses transitions deep into conduction bands |
| Temporal Resolution | ~200 as | Sufficient to resolve electron dynamics within optical cycle |
| Phase Delay Accuracy | ±200 as | Precision enabling direct comparison with theory |
| Oscillation Frequency | 2ωIR (∼750 THz) | Corresponds to petahertz-scale nonlinear response |
Methodological Validation Through Theoretical Comparison
A critical aspect of the diamond study was the independent calibration of the pump-probe delay axis, which enabled direct comparison with numerical calculations without free adjustment parameters. The research team employed two complementary theoretical approaches [24]:
Time-Dependent Density Functional Theory (TDDFT): First-principles calculations simulating the optical response of a diamond single-crystal cell probed by an ideal isolated attosecond pulse. Although requiring energy axis calibration due to known bandgap inaccuracies, TDDFT provided an ab initio benchmark.
Independent Particle (IP) Model with Houston States: Calculations based on 24 Houston states (time-dependent solutions to the Schrödinger equation in a periodic potential with external field) allowed selective inclusion or exclusion of specific transition types. This approach enabled researchers to isolate the contributions of virtual interband transitions versus intraband motion.
The remarkable agreement between experimental data and theoretical predictions—within the experimental error bars of approximately ±200 attoseconds—provided robust validation of both the measurements and the theoretical framework, confirming the essential role of virtual interband transitions [24].
Research Reagents and Experimental Toolkit
Table: Essential Research Reagents and Materials for Attosecond Spectroscopy
| Item | Function | Specifications |
|---|---|---|
| Monocrystalline Diamond | Prototype dielectric sample | High purity, specific crystallographic orientations ([100] surface normal) |
| Titanium:Sapphire Laser | Primary laser source | ~10 fs pulses, 800 nm center wavelength, kHz repetition rate |
| Gas Target (e.g., Neon, Argon) | High-harmonic generation medium | Generates attosecond XUV probe pulses |
| Multilayer XUV Mirrors | Beam steering and focusing | Specific coatings for XUV spectral range (20-44 eV) |
| Delay Stage | Pump-probe delay control | Attosecond precision, active stabilization |
| XUV Spectrometer | Spectral analysis of probe | Time-preserving design, CCD detection |
Signaling Pathways and Dynamic Processes in Virtual Charge Dynamics
The attosecond-scale dynamics of virtual charges in dielectrics like diamond involve multiple interconnected processes that unfold during the optical cycle. The diagram below illustrates the primary signaling pathways and their relationships:
Implications and Future Directions
Petahertz Optoelectronics
The recognition that virtual charges fundamentally influence material responses on attosecond timescales opens the pathway to petahertz (10¹⁵ Hz) optoelectronics—devices operating at frequencies approximately 1000 times faster than current electronics. By exploiting the reversible nature of virtual charge dynamics, researchers envision the development of [24] [25]:
Ultrafast optical switches based on virtual charge manipulation rather than real carrier excitation, potentially overcoming speed limitations imposed by recombination times.
Field-driven signal processing elements where information is encoded in the phase and amplitude of optical fields rather than charge populations.
Advanced light-field-driven devices that harness the complete waveform control of few-cycle laser pulses to steer electron motion on its natural timescale.
Theoretical and Computational Advances
The experimental validation of virtual charge dynamics necessitates advances in theoretical descriptions of strong-field light-matter interactions. Future developments must [24]:
Integrate beyond independent-particle models to account for electron-electron correlations in virtual charge dynamics.
Develop multiscale approaches bridging attosecond electron dynamics with longer-timescale phenomena like phonon coupling and heat transport.
Create efficient computational frameworks for designing virtual-charge-based devices, requiring new numerical methods beyond conventional semiconductor simulation tools.
Extended Applications Across Materials Classes
While the initial discoveries focused on prototypical dielectrics like diamond, the fundamental principles extend to diverse material systems [24] [26]:
Semiconductors and Nanostructures: Engineering virtual charge dynamics through band structure design and quantum confinement.
Molecular Systems and Photosynthetic Complexes: Understanding the role of virtual states in energy transfer processes with potential applications in photovoltaics and artificial photosynthesis.
Strongly Correlated Materials: Exploring how virtual charge dynamics influence phase transitions and emergent phenomena in complex oxides and other correlated systems.
Attosecond spectroscopy has fundamentally transformed our understanding of light-matter interactions by revealing the critical role of virtual charges in the earliest moments of these processes. The distinction between virtual and real charges—once a theoretical nuance—has emerged as a practical consideration with profound implications for ultrafast science and technology. Through techniques like attosecond transient reflection spectroscopy, researchers have established that virtual interband transitions significantly influence the timing and character of material responses to strong optical fields, even in regimes previously believed dominated by intraband motion.
These insights not only advance fundamental physics but also pave the way for technological revolutions in information processing, light-wave electronics, and ultrafast optoelectronics. As attosecond methodologies continue to mature and expand to more complex materials and device geometries, the deliberate exploitation of virtual charge dynamics may well define the next frontier in controlling matter with light.
The interaction between light and matter forms the cornerstone of spectroscopic research, providing critical insights into the electronic structure, dynamics, and quantum phenomena of materials. At the nanoscale, these interactions become profoundly enhanced and modified, leading to novel optical properties not observed in bulk systems. This whitepaper examines these phenomena through three strategically selected nanomaterial classes: carbon nanotubes (CNTs), metal halide perovskites, and two-dimensional (2D) heterostructures. Each system offers unique mechanisms for light-matter interaction that advance spectroscopic capabilities and enable transformative applications in photonics, optoelectronics, and sensing. Carbon nanotubes exhibit chirality-dependent optical transitions and environmentally sensitive photophysics. Lead halide perovskites demonstrate exceptional light absorption and emission properties alongside complex photo-induced behaviors. Two-dimensional heterostructures, assembled from various atomic layers, enable precise engineering of interlayer charge and energy transfer processes through van der Waals interactions. Understanding the fundamental spectroscopic principles governing these nanomaterials is essential for harnessing their potential in next-generation technologies, from high-performance photodetectors and solar cells to quantum information processing platforms. This technical guide provides researchers with a comprehensive framework for analyzing and manipulating light-matter interactions across these material systems, with emphasis on quantitative spectroscopic signatures, experimental methodologies, and emerging research directions.
Carbon Nanotubes: Chirality-Dependent Optical Phenomena
Single-walled carbon nanotubes (SWCNTs) represent a unique class of quasi-one-dimensional nanomaterials whose optical properties are fundamentally governed by their chirality, defined by the integer indices (n,m) that determine their atomic structure and electronic configuration. The interaction of light with CNTs produces distinctive spectroscopic signatures that enable precise structure-property characterization. When illuminated, CNTs exhibit resonance phenomena where specific photon energies match the energy gaps between their van Hove singularities—density-of-states peaks characteristic of their one-dimensional electronic structure. These resonances make optical spectroscopy particularly powerful for CNT characterization.
Advanced Spectroscopic Characterization Techniques
Polarization-based microscopy combined with supercontinuum laser illumination has emerged as a high-throughput technique for real-time optical imaging and broadband in situ spectroscopy of individual carbon nanotubes on various substrates and in functional devices [27]. This approach leverages the strongly polarized optical response of CNTs parallel to their tube axis, enabling simultaneous determination of nanotube orientation and chirality. The experimental configuration typically involves a supercontinuum laser source producing broad spectral output, a polarization-sensitive optical microscope with high numerical aperture objectives, and spectrometers equipped with low-noise CCD detectors for signal acquisition.
The protocol for high-throughput chirality mapping involves several critical steps: (1) Sample preparation with isolated, individually resolvable CNTs on optically transparent substrates (e.g., SiO₂/Si wafers with predefined markers); (2) Optical scanning with polarized light, rotating the polarization direction to maximize contrast for differently oriented nanotubes; (3) Hyperspectral data acquisition collecting full spectral information at each spatial position; (4) Resonance assignment by matching observed transition energies to established chirality-dependent optical transition databases; (5) Cross-validation with complementary techniques such as Raman spectroscopy or electron microscopy for selected specimens [27]. This methodology enables complete chirality profiling of hundreds of individual carbon nanotubes, both semiconducting and metallic, on growth substrates with statistical relevance.
Table 1: Characteristic Optical Transitions and Key Properties of Select Carbon Nanotube Chiralities
| Chirality (n,m) | Type | First Transition E₁₁ (eV) | Second Transition E₂₂ (eV) | Photoluminescence Quantum Yield | Environmental Sensitivity |
|---|---|---|---|---|---|
| (6,5) | Semiconductor | 1.27 | 2.19 | 0.001-0.01% | High (dielectric constant) |
| (7,6) | Semiconductor | 1.20 | 2.06 | 0.001-0.01% | High (dielectric constant) |
| (8,3) | Semiconductor | 1.53 | 2.47 | 0.001-0.01% | High (dielectric constant) |
| (10,2) | Semiconductor | 1.09 | 1.87 | 0.001-0.01% | High (dielectric constant) |
| (9,1) | Semiconductor | 1.41 | 2.33 | 0.001-0.01% | High (dielectric constant) |
Quantum Phenomena and Many-Body Effects
Beyond single-particle transitions, CNTs exhibit rich many-body physics including exciton formation with binding energies exceeding 300 meV, significantly influencing their optical response. In operational devices, electrostatic doping dramatically broadens high-order nanotube optical resonances, revealing strong interband electron–electron scattering processes that dominate ultrafast dynamics of excited states [27]. This doping-dependent broadening has important implications for CNT applications in electro-optic modulators and photodetectors, suggesting fundamental limits to modulation speeds and efficiencies. Additionally, environmental factors including dielectric screening from substrates and adsorbates, strain fields, and temperature variations significantly perturb optical transition energies and linewidths, complicating direct chirality assignment but providing opportunities for sensing applications.
Figure 1: Experimental workflow for high-throughput chirality mapping of individual carbon nanotubes using polarization-based microscopy.
Metal Halide Perovskites: Complex Photo-Induced Dynamics
Metal halide perovskites (MHPs) have emerged as exceptional semiconductor materials for photonic applications due to their unique optical properties, including strong light absorption, bright luminescence, and tunable bandgaps. Their interaction with light, however, induces complex dynamic processes that range from beneficial photobrightening to detrimental photo-decomposition, strongly influenced by environmental conditions.
Light-Induced Phenomena and Degradation Pathways
The photophysics of MHPs under illumination reveals several distinctive phenomena. In the presence of oxygen or moisture, light soaking at low intensities induces photoluminescence (PL) enhancement in methylammonium lead iodide (MAPbI₃) films, attributed to photo-passivation of trap states [28]. Conversely, at higher excitation intensities, PL quenching occurs alongside irreversible perovskite decomposition. For mixed-halide perovskites ((MA)Pb(BrₓI₁₋ₓ)₃), illumination induces reversible halide segregation, forming Br-rich and I-rich domains that create localized bandgap variations, fundamentally limiting color purity in light-emitting applications [28]. In controlled environments (vacuum or dry nitrogen), light exposure generally causes PL degradation due to defect formation, with high excitation fluxes leading to complete film decomposition even in the absence of environmental factors.
Table 2: Light-Induced Phenomena in Lead Halide Perovskites Under Different Environmental Conditions
| Environmental Condition | Low Light Intensity Effect | High Light Intensity Effect | Primary Mechanism | Reversibility |
|---|---|---|---|---|
| Vacuum/Dry N₂ | PL decrease | Film decomposition | Defect formation | Irreversible |
| Oxygen Presence | PL enhancement | PL quenching & decomposition | Trap passivation → Oxidation | Partially reversible |
| Moisture Presence | PL enhancement | Rapid decomposition | Trap passivation → Hydration | Irreversible |
| Mixed Halide System | Phase segregation | Phase segregation & decomposition | Halide migration | Partially reversible |
Experimental Protocols for Photostability Assessment
Standardized experimental protocols are essential for meaningful comparison of photostability across different perovskite compositions and morphologies. For quantifying photodegradation thresholds, researchers employ: (1) Sample preparation of uniform thin films (typically 300-500 nm thickness) with controlled crystallization conditions; (2) Environmental control using sealed cells with precise atmosphere regulation (O₂, N₂, or defined humidity levels); (3) Controlled illumination using monochromatic lasers (e.g., 405-532 nm) with calibrated power densities (1-1000 mW/cm²); (4) In situ PL monitoring with time-resolved detection to track evolution of intensity and spectral distribution; (5) Post-irradiation characterization using X-ray diffraction and microscopy to correlate optical changes with structural and morphological degradation [28].
For quantifying light-enhanced luminescence, a modified approach focuses on lower excitation densities (0.1-10 mW/cm²) and includes complementary measurements of trap density states through thermal admittance spectroscopy or time-resolved PL to correlate PL enhancement with reduction in non-radiative recombination centers. The kinetics of photo-brightening typically follow a bi-exponential recovery with characteristic timescales ranging from seconds to hours, dependent on perovskite composition, morphology, and illumination history.
2D Heterostructures: Engineered Interlayer Interactions
Two-dimensional van der Waals heterostructures (vdWHs) represent perhaps the most versatile platform for engineering light-matter interactions through precise layer-by-layer assembly of disparate atomic monolayers. These artificial quantum structures exhibit novel optical phenomena arising from interlayer coupling, including momentum-space indirect excitons, charge-transfer states, and interlayer energy transfer, none of which exist in the constituent layers individually.
Fabrication and Characterization Techniques
The fabrication of 2D heterostructures primarily employs two approaches: mechanical transfer for research-scale devices with customized layer sequences and orientations, and chemical vapor deposition (CVD) for scalable direct growth of in-plane and vertically stacked heterostructures [29]. Mechanical transfer involves sequential exfoliation or deterministic placement of individual 2D layers using viscoelastic stamps, followed by alignment and stacking under optimized temperature and pressure conditions to ensure clean interfaces with minimal contaminants. This approach enables precise control over the interlayer twist angle, which dramatically modifies the electronic and optical properties through moiré superlattice potentials.
Optical characterization of 2D heterostructures employs multiple complementary techniques. Micro-photoluminescence (μ-PL) spectroscopy reveals interlayer exciton formation, spectral shifts, and modified recombination dynamics. Transient absorption (TA) spectroscopy with femtosecond temporal resolution tracks ultrafast charge and energy transfer processes occurring at heterointerfaces [30]. Specifically, in type-II heterostructures such as MoS₂/WSe₂, TA measurements reveal sub-picosecond charge separation across the interface, with electrons transferring to one material and holes to the other, creating long-lived interlayer excitons with distinctive optical signatures.
Band Alignment and Charge Transfer Dynamics
The electronic band alignment at heterointerfaces fundamentally governs their optical behavior and device applications. Type-I (straddling) alignment confines both electrons and holes within the same layer, facilitating efficient light emission. Type-II (staggered) alignment spatially separates electrons and holes across different layers, enabling efficient charge separation for photodetection and photovoltaics. Type-III (broken-gap) alignment creates tunneling junctions for specialized device functions.
Table 3: Classification and Properties of 2D van der Waals Heterostructures Based on Stacking Configuration
| Stacking Configuration | Band Alignment | Characteristic Phenomenon | Typical Response Time | Primary Applications |
|---|---|---|---|---|
| Vertical Heterostructure | Type-I, II, or III | Interlayer exciton formation | Picoseconds to nanoseconds | LEDs, Photovoltaics |
| Laterally Strained Heterostructure | Type-I or II | Strain-induced polarization | Nanoseconds | Piezo-phototronics |
| Plasmonic Heterostructure | Surface plasmon coupling | Local field enhancement | Femtoseconds | SERS, Enhanced detection |
| Moiré Superlattice | Modified band structure | Moiré exciton trapping | Picoseconds to microseconds | Quantum emitters, Nonlinear optics |
In TA spectroscopy measurements of type-II WS₂/MoS₂ heterostructures, researchers observe an initial ultrafast decay component (100-500 fs) corresponding to interlayer charge transfer, followed by the emergence of a long-lived signal associated with spatially indirect excitons with lifetimes extending to nanoseconds [30]. The efficiency of these interlayer transfer processes approaches unity in optimized heterostructures with clean interfaces and minimal interlayer contaminants, highlighting the critical importance of fabrication quality. Additionally, the interlayer coupling strength exhibits strong dependence on the relative crystallographic orientation between layers, with specific twist angles yielding enhanced hybridization and modified optical selection rules.
Figure 2: Charge transfer dynamics in type-II van der Waals heterostructures following optical excitation.
The Scientist's Toolkit: Essential Research Reagents and Materials
Advanced research into nanomaterial-light interactions requires specialized materials and substrates optimized for specific spectroscopic techniques and material systems. The following table compiles essential research reagents and their functions based on current literature.
Table 4: Essential Research Reagents and Materials for Nanomaterial Spectroscopy
| Research Reagent/Material | Function/Application | Key Characteristics | Representative Examples |
|---|---|---|---|
| SiO₂/Si Substrates | Optical contrast enhancement | Thermally oxidized, specific thickness (90-300 nm) | Standard for mechanical exfoliation |
| Au/Ag Nanoparticles | Plasmonic enhancement for SERS | Controlled morphology (spheres, rods, stars) | SERS substrates, LSPR tuning |
| h-BN Crystals | Encapsulation layer for 2D materials | Atomically smooth, low defect density | Protection and dielectric screening |
| PDMS/PC Stamps | Deterministic transfer of 2D materials | Viscoelastic, optically transparent | Dry transfer manufacturing |
| Transition Metal Dichalcogenide Crystals | Building blocks for heterostructures | Semiconducting (MoS₂, WS₂, WSe₂) | Photoactive components |
| Metal Organic Frameworks | Porous substrates for sensing | High surface area, tunable porosity | Preconcentration of analytes |
| Cesium Lead Halide Nanocrystals | Model perovskite system | Cubic phase, high quantum yield | Model light-emitting system |
| Supercontinuum Laser Sources | Broadband spectroscopy | White light generation, high brightness | Chirality mapping of CNTs |
The systematic investigation of light-matter interactions in carbon nanotubes, metal halide perovskites, and 2D heterostructures continues to reveal fundamental new physics while driving technological innovation across optoelectronics, sensing, and quantum information science. Future research directions will likely focus on several emerging frontiers. For carbon nanotubes, achieving chirality-controlled growth coupled with advanced in situ spectroscopy during device operation will enable unprecedented control over their optoelectronic properties. In perovskite materials, understanding and mitigating light-induced degradation while harnessing beneficial photo-induced effects requires multiscale characterization techniques correlating atomic structure with optical response. For 2D heterostructures, controlling interlayer twist angles with precision and developing scalable direct-growth techniques will unlock novel quantum phenomena and device architectures.
The integration of artificial intelligence and machine learning with spectroscopic analysis is already accelerating materials discovery and optimization across all three material classes. Additionally, the development of multimodal characterization platforms combining optical spectroscopy with structural and electronic measurements will provide holistic understanding of complex light-matter interactions. As these nanomaterials continue to transition from laboratory curiosities to technologically viable materials, systematic investigation of their light-matter interactions will remain essential for unlocking their full potential in next-generation photonic and electronic technologies.
Spectroscopy research has long relied on the fundamental principles of light-matter interaction to probe molecular structures, dynamics, and reactions. The emergence of cavity quantum electrodynamics (cQED) has revolutionized this field by enabling unprecedented control over these interactions. When matter is confined inside an optical cavity, the interaction between photons and material excitations can become so strong that the system enters the strong coupling regime, leading to the formation of hybrid light-matter quasiparticles known as polaritons [31]. These hybrid states exhibit entirely new properties distinct from their constituent components, opening pathways to control chemical reactivity, modify material properties, and manipulate quantum information. This technical guide examines the core principles, experimental methodologies, and research applications of polaritons and strong coupling, providing spectroscopy researchers and drug development professionals with the foundational knowledge needed to leverage these advanced concepts in their work.
The unique property of polaritons is that they inherit characteristics from both light and matter: they can exhibit the mass and velocity of photons while maintaining the interaction capabilities of matter excitations. This duality enables novel phenomena not observed in uncoupled systems, including long-range energy transfer, modification of chemical reaction pathways, and collective quantum effects [32] [31]. For spectroscopy research, strong coupling offers a powerful tool to manipulate molecular energy landscapes and probe dynamical processes with unprecedented specificity.
Fundamental Principles and Theoretical Framework
Defining the Strong Coupling Regime
The transition from weak to strong coupling represents a fundamental shift in light-matter interaction dynamics. In the weak coupling regime, energy oscillates between light and matter states but rapidly decoheres due to losses, following Fermi's golden rule for transitions. When the coherent energy exchange between light and matter exceeds the system's dissipation rates, the system enters the strong coupling regime [31]. This occurs when the coupling strength (g) surpasses the average of the cavity photon decay rate (κ) and the material excitation dephasing rate (γ), satisfying the condition (g > \frac{1}{2}(κ + γ)).
In quantum mechanical terms, for a single emitter coupled to a single cavity mode described by the Jaynes-Cummings model, the strong coupling regime manifests through vacuum Rabi oscillations—coherent exchange of excitation between the emitter and cavity mode [31]. The spectral signature of strong coupling is the characteristic Rabi splitting (Ω) of the excitation spectrum into two distinct peaks corresponding to the upper and lower polariton branches, separated by energy (Ω = 2g\sqrt{N}) for N emitters [31].
Polariton Types and Classifications
Polaritons are classified based on the nature of the material excitation hybridized with light:
- Vibrational Polaritons: Formed when infrared-active molecular vibrations couple strongly to cavity modes. These are particularly relevant for modifying ground-state chemical reactivity and have demonstrated dramatic effects on reaction rates under vibrational strong coupling (VSC) conditions [33].
- Electronic Polaritons: Result from strong coupling between electronic transitions and optical modes. These can alter excited-state dynamics, energy transfer, and photochemical pathways [31].
- Plasmon Polaritons: Involve coupling between photons and collective electron oscillations in metals. These offer extreme field confinement but introduce significant losses [31].
- Rovibrational Polaritons: Recent advances have demonstrated strong coupling with combined rotational and vibrational transitions in gas-phase molecules, offering new degrees of quantum control [34].
Table 1: Classification of Polariton Types and Their Characteristics
| Polariton Type | Material Excitation | Typical Energy Scale | Key Applications |
|---|---|---|---|
| Vibrational Polariton | Molecular bond vibrations | 10-100 meV (IR) | Modifying chemical reactivity, bond-selective chemistry |
| Electronic Polariton | Electronic transitions | 1-10 eV (UV-Vis) | Polariton lasing, quantum information processing |
| Plasmon Polariton | Collective electron oscillations | 1-3 eV (Visible) | Sub-wavelength light confinement, enhanced sensing |
| Rovibrational Polariton | Combined rotation-vibration | 1-100 meV (IR-THz) | Quantum control of gas-phase reactions |
Theoretical Descriptions and Models
The theoretical framework for polaritonics spans multiple levels of complexity:
- Jaynes-Cummings Model: Describes the interaction between a single two-level quantum emitter and a single cavity mode under the rotating wave approximation. This model predicts the formation of dressed states with energy shifts determined by the coupling strength [31].
- Tavis-Cummings Model: Extends the Jaynes-Cummings model to N emitters collectively coupled to a single cavity mode, capturing collective enhancement effects where the Rabi splitting scales with (\sqrt{N}) [32].
- Rabi Model: Provides a more fundamental description without the rotating wave approximation, particularly important in the ultra-strong coupling regime where the coupling strength becomes comparable to the transition frequencies [32].
- Cavity-Born-Oppenheimer Methods: Emerging approaches that combine electronic structure theory with quantum electrodynamics to describe ab initio polaritonics for molecular ensembles [32].
For condensed matter systems embedded in cavities, theoretical frameworks must account for the collective, many-body nature of the strong coupling. Recent work has proposed that VSC with molecular ensembles may lead to the formation of a macroscopic quantum state analogous to a Bogoliubov quasiparticle condensate, providing a potential explanation for the dramatic changes in chemical reactivity observed experimentally [35].
Quantitative Framework and Key Parameters
Critical Parameters in Strong Coupling
The experimental realization and characterization of strong coupling depend on several quantitative parameters:
- Rabi Splitting (Ω): The energy separation between upper and lower polariton branches at resonance. For a single emitter, (Ω = 2g), while for N emitters, (Ω = 2g\sqrt{N}) collectively enhanced [31].
- Coupling Strength (g): Determined by the transition dipole moment (μ) of the material excitation and the vacuum electric field strength of the cavity mode, (g = \frac{μ·E{vac}}{\hbar}), where (E{vac} = \sqrt{\frac{\hbarωc}{2ε0V}}) for a cavity mode of frequency ωc and effective mode volume V [31].
- Cooperative Coupling (C): A dimensionless parameter defined as (C = \frac{g^2}{κγ}), which must exceed 1 for strong coupling to occur [31].
- Mode Volume (V): The effective volume within which the cavity field is confined. Minimizing V enhances the vacuum electric field and coupling strength [31].
- Quality Factor (Q): Dimensionless parameter representing the cavity's energy storage capability, defined as (Q = ω_c/κ), where κ is the cavity decay rate [33].
Table 2: Quantitative Parameters Governing Strong Coupling Experiments
| Parameter | Symbol | Definition | Experimental Control |
|---|---|---|---|
| Rabi Splitting | Ω | Energy separation between polariton branches | Molecular density, dipole strength, cavity design |
| Coupling Strength | g | (g = \frac{μ·E_{vac}}{\hbar}) | Transition dipole moment, mode volume |
| Cavity Decay Rate | κ | Photon loss rate from cavity | Mirror reflectivity, cavity design |
| Emitter Dephasing Rate | γ | Decoherence rate of material excitation | Molecular structure, temperature, matrix effects |
| Mode Volume | V | Effective confinement volume | Cavity geometry, plasmonic structures |
| Quality Factor | Q | (Q = ω_c/κ) | Cavity finesse, material absorption |
Polariton Dispersion and Tunability
The energy-momentum relationship of polaritons is described by their dispersion relation. For a simple coupled oscillator model with emitter frequency ω₀ and cavity frequency ωc, the upper and lower polariton frequencies are given by:
[ ω{UP,LP} = \frac{1}{2}\left[ωc + ω0 ± \sqrt{Ω^2 + (ωc - ω_0)^2}\right] ]
where the Rabi splitting (Ω = 2g\sqrt{N}) depends on the number of coupled emitters N [31]. This dispersion can be directly measured in angle-resolved spectroscopy experiments, where varying the incidence angle changes the in-plane wavevector and thus the effective cavity frequency.
Recent experiments with microwave helical resonators in tunable cavities have demonstrated that the topological properties of polaritonic systems can be fundamentally altered by modifying the cavity width, which controls the light-matter interaction strength without changing the material lattice structure [36]. This cavity-tunability represents a powerful new degree of freedom for controlling quantum phases of matter.
Experimental Methodologies and Protocols
Fabrication and Characterization of Cavity Systems
The experimental realization of strong coupling requires carefully engineered optical cavities and precise spectroscopic characterization:
Protocol 1: Fabry-Pérot Cavity Preparation for Vibrational Strong Coupling
Mirror Fabrication: Utilize distributed Bragg reflectors (DBRs) composed of alternating dielectric layers (e.g., SiO₂/TiO₂) or metallic mirrors with high reflectivity (>99.5%) in the target spectral range. For infrared VSC experiments, gold mirrors are typically employed due to their high IR reflectivity [33].
Cavity Assembly: Integrate mirrors with precisely controlled separation using piezoelectric spacers or fixed thickness spacers. The cavity length L determines the fundamental cavity mode frequency through the relation (ω_c = \frac{mπc}{nL}), where m is the mode order, c is the speed of light, and n is the refractive index of the intracavity medium [33].
Spacer Integration: Incorporate precisely machined spacers that define the cavity thickness. For microwave helical resonator experiments, metallic cavities with tunable widths have been implemented, where the cavity width Ly governs the strength of light-matter interactions [36].
Molecular Sample Loading: Introduce the molecular sample between the mirrors. Solutions are typically injected via capillary action, while solid films can be spin-coated directly onto mirror surfaces. For gas-phase experiments, specialized cells with optical access are employed [34].
Reflectivity/Transmission Measurement: Characterize the empty cavity quality factor by measuring the finesse (F = \frac{FSR}{Δω}), where FSR is the free spectral range and Δω is the linewidth of cavity resonances [33].
Strong Coupling Implementation and Validation
Protocol 2: Establishing and Characterizing Vibrational Strong Coupling
Sample Preparation: Prepare concentrated molecular solutions (typically 10-100 mM) with strong transition dipole moments in the spectral region of interest. For vibrational strong coupling, molecules with intense IR vibrations (e.g., C=O stretch at 1700 cm⁻¹, Si-C stretch at 1250 cm⁻¹) are ideal [33].
Cavity Tuning: Adjust the cavity length to bring the cavity mode frequency ωc into resonance with the target molecular vibration ω₀. This can be achieved mechanically with piezoelectric elements or by controlling the angle of incidence in angle-resolved measurements [33].
Polariton Spectroscopy: Measure the transmission or reflection spectrum of the coupled system. The signature of strong coupling is the appearance of two distinct peaks (upper and lower polaritons) separated by a minimum at the original resonance frequency—the avoided crossing characteristic of Rabi splitting [33] [34].
Dispersion Mapping: For fixed-length cavities, perform angle-resolved measurements to map the polariton dispersion relation. Vary the incidence angle from normal to oblique (typically 0-30°) and record spectra at each angle to observe the characteristic anti-crossing behavior [31].
Strong Coupling Validation: Confirm the system is in the strong coupling regime by verifying that the Rabi splitting exceeds the full width at half maximum (FWHM) of both the uncoupled cavity mode and molecular resonance: (Ω > \frac{1}{2}(γc + γm)) [31].
Advanced Implementation: Gas-Phase Strong Coupling
Recent breakthroughs have demonstrated strong coupling with gas-phase molecules, offering cleaner systems without solvent complications:
Protocol 3: Gas-Phase Rovibrational Strong Coupling
Cavity Design: Construct an optical cavity with centimeter-scale path length (e.g., 8.36 cm as demonstrated in recent work) to accommodate low-density gas samples. Employ high-reflectivity mirrors with broadband coatings appropriate for the target molecular vibrations [34].
Gas Handling System: Implement a temperature-controlled gas cell integrated within the optical cavity. Cool the molecular gas (e.g., methane to 77K) to populate lower quantum states and increase molecular density at the cavity antinodes [34].
In-Situ Spectroscopy: Utilize perpendicular optical access ports to perform direct absorption spectroscopy of the cavity-confined molecules independent of the cavity axis. This enables simultaneous characterization of molecular concentration and polariton formation [34].
Collective Coupling Optimization: Achieve the strong coupling regime despite low gas density by ensuring a sufficient product of molecular density and transition dipole moment to satisfy the collective coupling condition (g\sqrt{N} > \frac{1}{2}(κ + γ)) [34].
The Scientist's Toolkit: Essential Research Reagents and Materials
Table 3: Essential Materials and Equipment for Polaritonics Research
| Category | Specific Items | Function and Application |
|---|---|---|
| Cavity Components | Distributed Bragg Reflectors (DBRs) | High-finesse mirrors for Fabry-Pérot cavities |
| Metallic Mirrors (Au, Ag) | Broadband reflectors for IR and plasmonic cavities | |
| Piezoelectric Spacers | Precise cavity length control and tuning | |
| Microwave Helical Resonators | Microwave regime polariton studies [36] | |
| Molecular Systems | W(CO)₆, Si-C bearing molecules | Strong IR oscillators for vibrational polaritons |
| Organic dyes (Rhodamine, Cyanine) | Electronic transitions for exciton polaritons | |
| Metal-organic complexes | Strong spin-orbit coupling for triplet polaritons | |
| Characterization Tools | FTIR Spectrometers | Vibrational strong coupling characterization |
| Angle-Resolved Spectroscopy | Polariton dispersion measurement | |
| Pulse Delay Generators | Time-resolved polariton dynamics | |
| Specialized Systems | Low-Temperature Gas Cells | Gas-phase rovibrational strong coupling [34] |
| Microfluidic Integration | Flow systems for in-situ reaction monitoring [33] |
Applications in Spectroscopy and Chemical Reactivity
Modification of Chemical Reaction Rates
One of the most significant implications of vibrational strong coupling is the ability to modify chemical reactivity without external pumping:
Rate Enhancement Mechanisms: Under VSC conditions, the rate constant for chemical reactions can be enhanced through a resonance mechanism where the cavity mode promotes vibrational excitation. The rate enhancement follows a sharp resonance behavior, maximized when the cavity frequency ωc matches the vibration frequency ω₀ [33]. Theoretical models describe this enhancement as:
[ k{VSC} = ΩR^2 · \frac{τc^{-1}ωcω0}{(ωc^2 - ω0^2)^2 + τc^{-2}ω0^2} · n(ω0) ]
where ΩR is the Rabi splitting, τc is the cavity lifetime, and n(ω₀) is the thermal occupation number [33].
Reaction Suppression: Certain reactions demonstrate suppressed rates under VSC, potentially through selective stabilization of reactants or modification of the reaction pathway [33]. This has been demonstrated for bond-selective chemistry where competing reactions can be selectively inhibited.
Cavity Lifetime Dependence: The VSC effect on reaction rates exhibits a strong dependence on cavity lifetime (τc). Under lossy conditions ((τc ≪ ΩR^{-1})), the rate enhancement scales linearly with τc, while in the lossless regime ((τc ≫ ΩR^{-1})), it scales inversely with τc [33].
Spectroscopic Applications
Polariton formation creates new spectroscopic pathways with unique applications:
- Polariton-Enhanced Raman Scattering: The modified polarizabilities under strong coupling enable enhanced Raman signals through cavity-mediated enhancement mechanisms [32].
- Polaritonic Two-Dimensional Spectroscopy: Multidimensional spectroscopic techniques reveal polariton dynamics, coherence transfer, and vibronic coupling mechanisms not accessible through linear spectroscopy [31].
- Nonlinear Polaritonics: Strongly coupled systems exhibit enhanced nonlinear optical responses, enabling phenomena such as polariton-polariton scattering, blockade effects, and quantum optical applications [32].
Current Challenges and Emerging Research Directions
Despite significant progress, the field of polaritonics faces several challenges that represent active research frontiers:
- Reproducibility Concerns: Some reported VSC effects on chemical reactivity have proven difficult to reproduce, highlighting the need for standardized protocols and better mechanistic understanding [33].
- Theoretical Frameworks: A comprehensive analytic rate theory for VSC-modified chemistry remains elusive, with current models often limited to specific regimes or approximations [33].
- Quantum vs. Classical Effects: The relative importance of quantum effects in polariton-modified chemistry remains debated, with ongoing research to identify genuinely quantum mechanical manifestations [34].
- Multiscale Modeling: Bridging between microscopic quantum descriptions and macroscopic observables requires advanced theoretical methods that capture collective effects, disorder, and dissipation [31].
Emerging research directions include:
- Topological Polaritonics: Engineering polariton states with nontrivial topology for robust quantum states and devices [36].
- Gas-Phase Polariton Chemistry: Extending VSC to isolated molecules without solvent complications for cleaner mechanistic studies [34].
- Non-Hermitian Polaritonics: Exploiting engineered gain and loss in polariton systems for enhanced sensing and control [36].
- Quantum Information Processing: Utilizing polariton states as quantum bits and networks for quantum simulation and computation [32].
The integration of cavity quantum electrodynamics with spectroscopy research has unveiled a rich landscape of strong light-matter interactions with profound implications for both fundamental science and practical applications. Polaritons represent more than just hybrid states—they constitute a new phase of matter with tailored properties that transcend those of their constituents. For spectroscopy researchers and drug development professionals, understanding these advanced concepts opens possibilities for controlling molecular dynamics with unprecedented specificity, from modifying chemical reaction pathways to engineering quantum-enhanced sensing platforms. As the field continues to mature, with improved theoretical frameworks and more robust experimental demonstrations, polaritonics is poised to become an essential tool in the advanced spectroscopy toolkit, enabling new approaches to probe and control matter at the quantum level.
Spectroscopic Techniques in Pharmaceutical Research: From Discovery to Manufacturing
Ultraviolet-Visible (UV-Vis) spectroscopy is a foundational analytical technique in pharmaceutical research that probes the interaction of light with matter to quantify substances at the molecular level. This technique measures the amount of discrete wavelengths of UV or visible light that are absorbed by or transmitted through a sample in comparison to a reference or blank sample [37]. The absorption of this light energy corresponds to the excitation of outer electrons in molecules, promoting them from their ground state to higher energy excited states [38]. The specific wavelengths absorbed provide a characteristic profile for different chemical compounds, while the extent of absorption relates directly to their concentration through the Beer-Lambert law [39].
For drug development professionals, understanding these light-matter interactions is essential for accurately identifying and quantifying active pharmaceutical ingredients (APIs). The energy associated with UV-Vis radiation ranges from 300 to 600 kJ/mol (70-140 kcal/mol) for wavelengths between 200-400 nm (UV region), and 150 to 300 kJ/mol (35-70 kcal/mol) for wavelengths between 400-800 nm (visible region) [39]. This energy range corresponds precisely to the energy required to excite electrons in various molecular orbitals, making UV-Vis spectroscopy particularly suitable for analyzing pharmaceutical compounds containing chromophore groups.
Theoretical Foundations of Electronic Transitions
According to Molecular Orbital Theory, when molecules absorb ultraviolet or visible radiation, electrons are promoted from their ground state orbitals to excited state orbitals [38] [39]. These electronic transitions occur in specific molecular regions called chromophores, which typically contain double or triple bonds that can absorb energy to promote electrons from these molecular orbitals to excited states [39]. The possible electronic transitions in organic molecules relevant to pharmaceutical compounds include several distinct types with characteristic energy requirements and molar absorptivities.
Table: Electronic Transitions in UV-Vis Spectroscopy
| Transition Type | Energy Requirement | Wavelength Range | Molar Absorptivity (ε) | Example Compounds |
|---|---|---|---|---|
| σ → σ* | Very High | <200 nm | High | Alkanes, Methane |
| n → σ* | High | 150-250 nm | Low (10-300 L·mol⁻¹·cm⁻¹) | Trimethylamine, Saturated Halides |
| π → π* | Moderate | 200-700 nm | High (1000-10,000 L·mol⁻¹·cm⁻¹) | Alkenes, Carbonyls, Aromatics |
| n → π* | Low | 200-700 nm | Low (10-100 L·mol⁻¹·cm⁻¹) | Carbonyls, Nitro Compounds |
Chromophores and Auxochromes in Pharmaceutical Compounds
Chromophores are molecular regions with double or triple bonds that can absorb UV-Vis radiation [39]. Common chromophores in active pharmaceutical ingredients include carbonyl groups, aromatic rings, and azo groups (-N=N-). Auxochromes are functional groups such as amines (-NH₂), alcohols (-OH), or phenols that have free electron pairs and can reinforce absorption when bonded to chromophores [39]. When auxochromes are present, radiation absorption often occurs at longer wavelengths (a red shift) because n→π* transitions require less energy [39].
Conjugated systems, which contain alternating double bonds, exhibit particularly strong absorption in the UV-Vis region because their electron resonance requires less energy than isolated double bonds for electronic transitions to the π* antibonding level [39]. This principle is extensively utilized in drug analysis, as many pharmaceutical compounds contain conjugated aromatic systems that serve as natural chromophores.
Quantitative Analysis in Pharmaceutical Applications
Beer-Lambert Law and Quantitative Principles
The fundamental principle for quantification in UV-Vis spectroscopy is the Beer-Lambert law, which states that absorbance is directly proportional to the concentration of the absorbing species and the path length of light through the sample [37] [39]. The mathematical relationship is expressed as:
A = εbc
Where:
- A is the measured absorbance (no units)
- ε is the molar absorptivity or extinction coefficient (L·mol⁻¹·cm⁻¹)
- b is the path length of the sample cell (cm)
- c is the concentration of the absorbing species (mol·L⁻¹) [39]
The Beer-Lambert law is especially useful for obtaining the concentration of a substance when a linear relationship exists using a measured set of standard solutions containing the same substance [37]. For accurate quantification, absorbance values should generally be kept below 1, within the dynamic range of the instrument, as values higher than this can lead to detection reliability issues due to insufficient light reaching the detector [37].
Derivative Spectroscopy for Enhanced Specificity
Derivative UV-Vis spectroscopy can improve analytical specificity, particularly for analyzing complex pharmaceutical formulations where excipients might interfere with the API measurement. This approach involves mathematical processing of absorption spectra to generate derivative curves that enhance the resolution of overlapping absorption bands [40].
A 2020 study demonstrated the application of third-order derivative UV-Vis spectroscopy for quantifying active substances in commercial drugs including acetylsalicylic acid (ASA), meloxicam, and naproxen [40]. The analysis was performed on a Perkin-Elmer Lambda 25 spectrophotometer with absorption spectra recorded in the visible region (400-800 nm) for ASA and in the ultraviolet region (200-400 nm) for meloxicam and naproxen [40]. Third-order derivations were created using UV WinLab software, enabling accurate quantification of the active substances with deviations from declared values falling within acceptable limits set by the U.S. Pharmacopoeia [40].
Table: Pharmaceutical Quantification Using Derivative UV-Vis Spectroscopy
| Active Substance | Drug Product | Declared Value | Measured Content | Deviation | Compliance |
|---|---|---|---|---|---|
| Meloxicam | Melox (Nobel) | 100% | 92.27% | <10% | U.S. Pharm. Compliant |
| Naproxen | Nalgesin S (Krka) | 100% | 90.06% | <10% | U.S. Pharm. Compliant |
| Acetylsalicylic Acid | Aspirin Protect 100 (Bayer) | 100% | 89.56% | ~10% | Slightly Low |
Instrumentation and Experimental Methodology
UV-Vis Spectrophotometer Components
A UV-Vis spectrophotometer consists of several key components that work together to measure light absorption by samples [37] [39]:
Light Source: Provides radiation across the UV and visible wavelength ranges. Instruments may use a single xenon lamp or dual lamps (tungsten or halogen for visible light and deuterium for UV light) [37] [39]. Xenon lamps offer high intensity but higher cost and less stability compared to tungsten and halogen lamps [37].
Wavelength Selection: Monochromators containing diffraction gratings are most commonly used to separate light into narrow wavelength bands [37]. These diffraction gratings typically have 1200-2000 grooves per mm, with higher groove frequencies providing better optical resolution but narrower usable wavelength ranges [37].
Sample Holder: Cuvettes or sample containers, typically with a standard 1 cm path length. Quartz cuvettes are essential for UV analysis as glass and plastic absorb UV light [37]. Cuvette-free systems are also available for analyzing very small sample volumes, such as in DNA or RNA analyses [37].
Detection System: Convert light into electronic signals after it passes through the sample. Common detectors include photomultiplier tubes (PMT) based on the photoelectric effect, and semiconductor-based detectors such as photodiodes and charge-coupled devices (CCD) [37]. PMT detectors are especially useful for detecting very low light levels [37].
Figure 1: UV-Vis Instrumentation Workflow. The schematic illustrates the key components and signal pathway in a UV-Vis spectrophotometer.
Experimental Protocol for Drug Quantification
Standard Calibration Curve Method:
Preparation of Standard Solutions: Create a series of standard solutions with known concentrations of the reference standard API covering the expected concentration range of the samples.
Selection of Analytical Wavelength: Identify the wavelength of maximum absorption (λmax) for the API by scanning an appropriate standard solution across the UV-Vis range.
Blank Measurement: Measure the solvent or placebo formulation (containing all components except the API) to establish baseline correction.
Absorbance Measurement: Measure the absorbance of each standard solution at the predetermined λmax.
Calibration Curve Construction: Plot absorbance versus concentration for the standard solutions and determine the regression equation.
Sample Analysis: Measure the absorbance of prepared sample solutions and calculate concentrations using the regression equation from the calibration curve.
Quality Control Measures:
- Perform measurements in triplicate to ensure precision [40]
- Verify adherence to Beer-Lambert law through linearity of calibration curve (typically R² > 0.995)
- Include system suitability checks with quality control standards
Advanced Concepts in Light-Matter Interactions
Virtual Charge Dynamics in Ultrafast Spectroscopy
Recent advances in understanding light-matter interactions have revealed previously neglected aspects that influence material responses to light. A 2025 study published in Nature Photonics demonstrated the crucial role of virtual charges—charge carriers that exist only during interaction with light—in influencing a material's response to ultrashort light pulses [41].
Using attosecond-scale transient reflection spectroscopy on monocrystalline diamonds subjected to light pulses lasting a few attoseconds (billionths of a billionth of a second), researchers isolated the effect of virtual vertical transitions between electronic bands of the material [41]. This research changes perspectives on how light interacts with solids, showing that virtual carrier excitation, which develops in extremely short timescales, is indispensable for correctly predicting rapid optical responses in solids [41]. These findings have implications for developing ultra-fast optical devices such as switches and modulators capable of operating at petahertz frequencies [41].
Electronic Transition Diagrams
Figure 2: Electronic Transitions Diagram. Energy diagram showing possible electronic transitions in molecular orbitals with corresponding energy requirements, wavelength ranges, and typical molar absorptivities (ε).
The Scientist's Toolkit: Essential Research Reagents and Materials
Table: Essential Materials for UV-Vis Pharmaceutical Analysis
| Item | Function | Technical Specifications | Application Notes |
|---|---|---|---|
| Quartz Cuvettes | Sample holder for UV analysis | 1 cm path length (standard), transmission down to 200 nm | Essential for UV measurements; glass and plastic are inappropriate for UV [37] |
| Reference Standards | Calibration and method validation | Certified purity (>95%), traceable to reference standards | API-specific; required for accurate quantification [40] |
| HPLC-Grade Solvents | Sample dissolution and dilution | Low UV cutoff, high purity | Must be transparent at analytical wavelengths; common choices: methanol, water, buffer solutions |
| Buffer Systems | pH control for ionization state | Appropriate pKa relation to analyte | Affects absorption spectra; essential for reproducible results |
| Filters | Particulate removal | 0.45 μm or 0.2 μm pore size | Remove light-scattering particles that can affect absorbance measurements |
UV-Vis spectroscopy remains an indispensable technique in pharmaceutical analysis, leveraging well-characterized electronic transitions to enable precise quantification of active pharmaceutical ingredients. The fundamental principles of light-matter interactions, governed by Beer-Lambert law and molecular orbital theory, provide a robust framework for method development and validation. With advancements in derivative spectroscopy techniques and improved understanding of virtual charge dynamics, UV-Vis spectroscopy continues to evolve as a critical tool for drug development professionals requiring accurate, reliable, and efficient quantification of pharmaceutical compounds.
Infrared (IR) spectroscopy is a fundamental analytical technique that explores the interaction between light and matter by measuring how molecules absorb infrared radiation. This absorption occurs at specific frequencies that correspond to the vibrational energies of molecular bonds, creating a unique spectral fingerprint for each substance [42]. When infrared light interacts with a sample, the energy is absorbed, promoting vibrational transitions between quantized energy states [43]. The resulting spectrum provides a detailed view of molecular structure, enabling identification of functional groups and analysis of molecular composition [42].
Fourier Transform Infrared (FTIR) spectroscopy represents a significant advancement over traditional dispersive IR instruments, offering higher signal-to-noise ratios, better spectral resolution, and faster data collection [43]. The technique employs an interferometer and Fourier transformation mathematics to simultaneously measure all infrared frequencies, providing enhanced sensitivity and precision [43] [44]. This powerful approach has made FTIR indispensable across diverse scientific fields including materials science, chemistry, biopharmaceutical analysis, environmental monitoring, and food research [43].
Theoretical Foundations: Molecular Vibrations and IR Absorption
Principles of Molecular Vibrations
At the core of IR spectroscopy lies the excitation of molecular vibrations through infrared radiation. When IR light interacts with a sample, specific frequencies are absorbed that correspond to molecular bond vibrations, including stretching, bending, or twisting of dipoles [43]. These vibrations occur at characteristic frequencies determined by bond type, bond strength, atomic masses, and the surrounding chemical environment [45].
Infrared absorption requires a change in dipole moment during vibration, making polar bonds (C=O, O–H, N–H) typically strong IR absorbers, while homonuclear diatomic molecules (N₂, O₂) without dipole moment changes are IR inactive [43]. The technique detects two primary types of molecular vibrations: stretching (where atoms move along the bond axis) and bending (which includes motions like scissoring, rocking, wagging, and twisting) [42].
FTIR Instrumentation and Advantages
FTIR spectroscopy utilizes a Michelson interferometer containing a beam splitter and fixed and moving mirrors to create an interferogram—a complex pattern of constructive and destructive interference that encodes all spectral frequencies simultaneously [43]. This interferogram is then mathematically transformed by a fast Fourier transform (FFT) algorithm into a conventional intensity-versus-wavenumber spectrum [43].
The FTIR approach provides three fundamental advantages over dispersive instruments:
- Fellgett's (multiplex) advantage: Simultaneous measurement of all wavelengths improves signal-to-noise ratio [43]
- Jacquinot's (throughput) advantage: Fewer optical slits mean higher energy throughput [43]
- Connes' advantage: High precision of wavelength calibration derived from an internal laser reference [43]
These technical advantages have established FTIR as the dominant infrared spectroscopy technique in modern laboratories [43].
FTIR Spectral Interpretation: A Systematic Approach
Understanding the FTIR Spectrum
An FTIR spectrum graphically represents a sample's absorption of infrared light, with the x-axis showing wavenumbers (cm⁻¹) corresponding to energy levels, and the y-axis displaying absorbance or transmittance [45]. Peaks in the spectrum reflect specific molecular vibrations, with their position, intensity, and shape offering critical information for identifying compounds and functional groups [45].
Systematic interpretation of FTIR spectra involves analyzing several key aspects of the spectral data, which can be organized into distinct regions as shown in the following table:
Table 1: Characteristic FTIR Absorption Regions and Functional Groups
| Spectral Region (cm⁻¹) | Region Name | Key Functional Groups | Characteristics |
|---|---|---|---|
| 4000-2500 | Single-Bond Region | O–H, N–H, C–H | O–H broad (3300-3600 cm⁻¹); N–H and C–H sharper [45] |
| 2500-2000 | Triple-Bond Region | C≡C, C≡N | C≡C often weak; C≡N stronger absorption [45] |
| 2000-1500 | Double-Bond Region | C=O, C=C | Carbonyl strong (1680-1750 cm⁻¹); C=C in alkenes (1600-1680 cm⁻¹) [45] |
| 1500-500 | Fingerprint Region | C-C, C-O, C-N, C-X | Complex patterns unique to individual compounds [45] |
Stepwise Interpretation Methodology
Effective interpretation of FTIR spectra follows a systematic approach consisting of five key steps:
Determine the number of absorption bands: Simple spectra with fewer than five peaks typically correspond to small organic molecules, inorganic compounds, or simple salts, while complex spectra with more than five peaks suggest structurally diverse or high-molecular-weight compounds [45].
Identify key regions and functional groups: Analyze the spectrum through the four characteristic regions outlined in Table 1, focusing on characteristic absorption patterns for specific functional groups [45].
Analyze peak shape and intensity: Broad peaks between 3650 and 3250 cm⁻¹ typically indicate hydrogen bonding in hydroxyl or amine groups. Sharp peaks suggest isolated polar bonds, while strong peaks in the carbonyl region (1850-1650 cm⁻¹) indicate highly polar bonds [45].
Compare with reference spectra: Utilize established spectral databases to confirm the presence of specific functional groups, particularly in the fingerprint region (1500-500 cm⁻¹) which contains complex patterns unique to individual compounds [45].
Employ database and software tools: Complement FTIR analysis with additional techniques such as NMR spectroscopy or mass spectrometry, and use software tools for spectral matching and molecular structure identification [45].
The following workflow diagram illustrates the FTIR spectral interpretation process:
Experimental Methodologies in FTIR Spectroscopy
Sampling Techniques and Configurations
Modern FTIR instruments support several sampling geometries, each optimized for different sample types and analytical requirements:
Table 2: FTIR Sampling Techniques and Applications
| Technique | Principle | Sample Types | Advantages/Limitations |
|---|---|---|---|
| Transmission [43] | IR light passes through thin sample | Thin films, gas cells, KBr pellets | Suitable for transparent samples; requires careful thickness control |
| ATR [43] | Internal reflection element guides IR beam | Solids, liquids, gels | Minimal sample preparation; penetration depth ~1-2 µm |
| DRIFTS [43] | Collects scattered radiation from surfaces | Powders, rough solids, catalysts | Excellent for soils, catalysts, asphalt materials |
| Specular Reflection [43] | Measures reflected light from smooth surfaces | Thin films on reflective substrates | Ideal for surface studies and monolayers |
| Photoacoustic (FT-IR-PAS) [43] | Detects sound waves from heating | Strongly absorbing or heterogeneous samples | Suitable for dark, thick, or highly scattering materials |
| Microspectroscopy (μ-FT-IR) [43] | Combines microscopy with FTIR | Inhomogeneous or micro-scale samples | Enables analysis of small particles and spatial mapping |
Essential Research Reagents and Materials
Successful FTIR analysis requires specific reagents and materials tailored to the sampling technique and analytical goals:
Table 3: Essential Research Reagent Solutions for FTIR Analysis
| Reagent/Material | Function | Application Examples |
|---|---|---|
| Potassium Bromide (KBr) [43] | Transparent matrix for pellet preparation | Transmission measurements of solid powders |
| ATR Crystals (Diamond, ZnSe, Ge) [43] | Internal reflection element | Direct analysis of solids, liquids, pastes without preparation |
| Potassium Phthalimide Reagent [43] | Chemical derivatization for specific detection | Quantitative FFA analysis in edible oils without titration |
| Dry Air/Nitrogen Purge [45] | Reduces atmospheric interference | Minimizes water vapor and CO₂ absorption bands |
| Deuterated Triglycine Sulfate (DTGS) Detector [42] | Infrared radiation detection | General-purpose FTIR detection |
| Mercury Cadmium Telluride (MCT) Detector [42] | Infrared radiation detection | High-sensitivity applications requiring fast scanning |
Critical Experimental Considerations
Proper experimental design is essential for obtaining reliable FTIR results. Key considerations include:
- Background Referencing: A clean internal reflection element (IRE) or solvent reference should be recorded before each sample run to correct for atmospheric water vapor and CO₂ absorptions [43]
- Spectral Resolution: Typically 4 cm⁻¹ suffices for most analyses; overly high resolution increases noise without adding useful information [43]
- Sample Preparation: Inadequate sample thickness, uneven contact in ATR, or water contamination can distort spectra [43]
- Environmental Control: Water vapor and carbon dioxide in the atmosphere can introduce absorption bands near 3400 cm⁻¹ and 2300 cm⁻¹, requiring purging with dry air or nitrogen [45]
The following diagram illustrates the core components and process flow in an FTIR instrument:
Advanced Applications Across Disciplines
FTIR spectroscopy has evolved into a versatile analytical tool with sophisticated applications across numerous scientific and industrial fields:
Pharmaceutical and Biomedical Applications
In drug development and biomedical research, FTIR provides critical analytical capabilities for protein structural analysis, biomaterial characterization, and pharmaceutical quality control. Researchers have qualified FTIR for quantifying protein secondary structure, demonstrating >90% reproducibility in replicate spectra and sensitivity to conformational changes induced by pH or denaturants [43]. The technique has also been applied to verify immobilization of active molecules in catheter matrices, detecting functional groups indicative of both covalent and non-covalent interactions to confirm successful drug incorporation [43]. Furthermore, FTIR has emerged as a valuable tool for microbial identification and strain typing, with the ability to classify bacteria below the species level through spectral fingerprints [43].
Environmental and Industrial Monitoring
FTIR spectroscopy enables rapid compositional analysis in environmental and industrial settings. The technique has been extensively used to measure atmospheric gases such as CO₂, CH₄, and ozone using both open-path and extractive configurations [43]. Micro-FTIR (μ-FT-IR) has become a leading method for detecting microplastics in environmental matrices, with standardized reflection and transmission modes that provide superior accuracy for small particles [43]. In industrial applications, FTIR supports quality control through methods like free fatty acid (FFA) determination in edible oils using potassium phthalimide reagent, enabling quantitative analysis without traditional titration [43].
Materials Science and Polymer Characterization
Polymer scientists routinely employ FTIR to quantify crystallinity, detect oxidation, and monitor degradation processes. Research has demonstrated FTIR curve-fitting methods for determining crystallinity in poly(ε-caprolactone), achieving agreement with conventional techniques [43]. Similarly, FTIR has been used to characterize oxidation in reclaimed asphalt binders, identifying challenges in harmonizing index calculations across laboratories [43]. In nanomaterials research, FTIR has proven invaluable for analyzing surface chemistry, particularly for nanodiamond characterization where IR spectra show sensitivity to surface functional groups [43].
Emerging Techniques and Future Directions
Advanced FTIR methodologies continue to expand the technique's capabilities. Reaction-induced FTIR difference spectroscopy enables detection of structural changes in biomolecules with remarkable sensitivity, elucidating mechanisms in photosynthetic complexes and other redox proteins [43]. Operando FTIR techniques allow real-time monitoring of catalytic processes, while synchrotron-based microspectroscopy and nano-FT-IR bridge the gap between molecular spectroscopy and real-world problem solving [43]. The future trajectory of FTIR points toward miniaturization, integration with complementary techniques, refined data processing incorporating machine learning and artificial intelligence, and expanded contributions to green chemistry through real-time monitoring of chemical processes [46].
FTIR spectroscopy stands as a powerful manifestation of light-matter interactions, providing unparalleled insights into molecular structures through the detection of characteristic vibrational patterns. Its versatility across sample types—from gases to solids, and from microplastics to proteins—makes it indispensable in modern analytical laboratories. The technique's continued evolution, particularly through advanced methodologies like operando FTIR, synchrotron-based microspectroscopy, and nano-FT-IR, ensures its ongoing relevance in addressing complex analytical challenges. As FTIR instrumentation becomes increasingly sophisticated and integrated with computational analysis tools, this fundamental technique of probing molecular vibrations through light interaction will continue to illuminate molecular-level understanding across scientific disciplines.
Nuclear Magnetic Resonance (NMR) spectroscopy is a powerful analytical technique that leverages the interaction between radiofrequency light and atomic nuclei to determine the molecular structure of complex compounds. This technical guide details the principles, methodologies, and applications of NMR in structural elucidation, with a specific focus on its critical role in pharmaceutical research and development. The content is framed within the broader context of how light interacts with matter, positioning NMR as an essential tool in the spectroscopist's arsenal for probing molecular architecture and dynamics.
Spectroscopy fundamentally studies the interaction between electromagnetic radiation (light) and matter. Nuclear Magnetic Resonance (NMR) spectroscopy specifically utilizes radiofrequency waves, a low-energy form of light, to probe the local magnetic environments of atomic nuclei within a molecule [10] [47].
When placed in a strong external magnetic field, certain nuclei (such as ¹H and ¹³C) can absorb radiofrequency energy and undergo resonance. The precise frequency at which this resonance occurs provides detailed information about the chemical environment, connectivity, and three-dimensional structure of the molecule [48] [49]. Unlike techniques like UV-Vis or IR spectroscopy that probe electronic or vibrational transitions, NMR provides unparalleled atomic-level resolution for structure determination.
Fundamental Principles of NMR
The NMR Experiment and the Electromagnetic Spectrum
NMR spectroscopy operates within the radiofrequency region (60-900 MHz) of the electromagnetic spectrum [47]. The energy of the photons in this region is sufficient to cause nuclear spin transitions but is too low to cause electronic excitation or molecular damage, making NMR a non-destructive analytical technique [48].
The relationship governing the energy of the electromagnetic radiation is defined by E = hν, where E is energy, h is Planck's constant, and ν is frequency [47]. This equation highlights that the radiofrequency photons used in NMR possess specific energies that match the energy differences between nuclear spin states in a magnetic field.
Data Acquisition and Key Parameters
An NMR spectrum is a plot of resonance intensity against chemical shift (δ), measured in parts per million (ppm). The chemical shift provides critical insights into the electronic environment surrounding a nucleus. Key parameters derived from NMR spectra include [48] [49]:
- Chemical Shift (δ): Indicates the electronic environment of a nucleus (e.g., shielded or deshielded).
- Integration: The area under a resonance peak is proportional to the number of nuclei in that environment.
- J-coupling (Spin-Spin Splitting): Provides information about the number and type of neighboring nuclei through the n+1 rule.
- Relaxation Times: Reveal dynamic information about molecular motion.
Table 1: Key NMR Parameters for Structural Elucidation
| Parameter | Structural Information Provided | Example/Pattern |
|---|---|---|
| Chemical Shift (δ) | Electronic environment of the nucleus (e.g., electronegative atoms cause downfield shifts). | Aromatic H: 7-8 ppm; Aliphatic CH₃: 0.9 ppm. |
| Integration | Relative number of nuclei in each chemical environment. | Peak ratio of 3:2 indicates a CH₃ and CH₂ group. |
| Multiplicity (J-coupling) | Number of equivalent protons on adjacent atoms. | Triplet (CH₂ neighbor), Quartet (CH₃ neighbor). |
| Relaxation Times (T₁, T₂) | Molecular dynamics and mobility. | Shorter T₁ indicates faster molecular tumbling. |
Experimental Methodologies and Protocols
Standard NMR Experiments for Structural Elucidation
A comprehensive structural elucidation workflow employs a suite of one-dimensional (1D) and two-dimensional (2D) NMR experiments.
1D NMR Experiments:
- ¹H NMR: The most common experiment. Reveals the number, type, and environment of hydrogen atoms [48]. A high-resolution ¹H spectrum provides chemical shift, integration, and J-coupling information [49].
- ¹³C NMR: Reveals distinct carbon environments in a molecule. Due to the low natural abundance of ¹³C, it often requires longer acquisition times. DEPT editing (DEPT-45, DEPT-90, DEPT-135) further classifies carbons as CH₃, CH₂, CH, or quaternary (C) [48].
2D NMR Experiments: These experiments correlate nuclei across chemical bonds or through space, establishing connectivity.
- COSY (Correlation Spectroscopy): Identifies spin-spin couplings between protons that are 2-3 bonds apart (through-bond connectivity) [48].
- HSQC (Heteronuclear Single Quantum Coherence): Correlates a proton with its directly bonded carbon (¹H-¹³C). This is a one-bond correlation [48].
- HMBC (Heteronuclear Multiple Bond Correlation): Correlates a proton with a carbon that is 2-3 bonds away (long-range connectivity), crucial for assembling molecular fragments [48].
- NOESY/ROESY (Nuclear Overhauser Effect Spectroscopy): Provides information on protons that are close in space (through-space connectivity, typically <5 Å), which is essential for determining stereochemistry and 3D conformation [48].
Diagram 1: A logical workflow for NMR structure elucidation, showing the progression from simple 1D experiments to more complex 2D correlations.
Protocol: Structure Elucidation of an Unknown Small Molecule
1. Sample Preparation:
- Dissolve 2-10 mg of the purified compound in 0.6 mL of a deuterated solvent (e.g., CDCl₃, DMSO-d6).
- Transfer the solution to a clean 5 mm NMR tube.
2. Data Acquisition:
- Acquire a ¹H NMR spectrum.
- Acquire a ¹³C NMR spectrum.
- Acquire key 2D spectra: COSY, HSQC, and HMBC. A NOESY/ROESY experiment should be performed if stereochemical information is required.
3. Data Analysis and Structural Assignment:
- Step 1: Analyze the ¹H NMR spectrum. Note the chemical shifts, integrations, and multiplicity (splitting patterns) of all signals. Use the n+1 rule to identify neighboring protons [49].
- Step 2: Analyze the ¹³C NMR and DEPT spectra. Identify the number of unique carbon environments and classify them as CH₃, CH₂, CH, or quaternary carbon.
- Step 3: Use the HSQC spectrum to identify all direct ¹H-¹³C connections.
- Step 4: Use the COSY spectrum to establish the proton-proton connectivity network.
- Step 5: Use the HMBC spectrum to connect molecular fragments via long-range ¹H-¹³C couplings. This is often the critical step for assembling the overall carbon skeleton.
- Step 6: Integrate all data to propose a chemical structure. Validate the proposed structure by checking consistency across all spectra and, if available, by using computational prediction tools [50].
Research Reagent and Software Solutions
Table 2: Essential Tools for Modern NMR Spectroscopy
| Tool/Resource | Function/Purpose | Specific Example/Note |
|---|---|---|
| High-Field NMR Spectrometer | Core instrument for data acquisition. | 600 MHz systems are common for pharmaceutical R&D [48]. |
| Deuterated Solvents | Solvent for sample preparation without interfering signals. | CDCl₃, DMSO-d6, D₂O. |
| NMR Processing Software | Visualizing, processing, and analyzing raw NMR data (FID). | Mnova NMR, NMRView [51] [52], TopSpin. |
| Spectral Prediction Software | Predicting chemical shifts for structure verification. | Mnova NMRPredict (uses ML & HOSE codes) [50]. |
| Automated Assignment Tools | Accelerating data analysis for macromolecules. | NMRtist/ARTINA (AI-driven platform) [53]. |
| Chemical Shift Databases | Reference for known compounds. | Built-in databases in Mnova, public databases (e.g., SDBS). |
Comparison of Analytical Techniques
Table 3: NMR vs. Other Structural Elucidation Techniques
| Feature/Parameter | NMR | Mass Spectrometry (MS) | Infrared (IR) Spectroscopy |
|---|---|---|---|
| Structural Detail | Full molecular framework, stereochemistry, dynamics [48]. | Molecular weight, fragmentation pattern [48]. | Functional group identification only [48]. |
| Stereochemistry Resolution | Excellent (e.g., via NOESY) [48]. | Limited [48]. | Not applicable [48]. |
| Quantification | Accurate without external standards [48]. | Requires standards or internal calibrants [48]. | Limited [48]. |
| Impurity Identification | High sensitivity to positional and structural isomers [48]. | Sensitive to low-level impurities [48]. | May not detect low-level or structurally similar impurities [48]. |
| Sample Destructiveness | Non-destructive [48]. | Destructive. | Non-destructive. |
Applications in Pharmaceutical R&D
NMR spectroscopy is indispensable in drug discovery and development. Key applications include [48]:
- Identification of APIs and Impurities: Confirming the structure of Active Pharmaceutical Ingredients (APIs) and identifying isomeric impurities that LC-MS might miss [48].
- Structural Biology: Determining the 3D structure of proteins and other biologics in solution, and studying their interactions with drug candidates.
- Natural Products Chemistry: Elucidating the complex structures of bioactive molecules derived from natural sources.
- Metabolomics: Identifying and quantifying small-molecule metabolites in biological systems for biomarker discovery.
A case study involving a mid-sized pharmaceutical company illustrates its impact: NMR-based structural analysis revealed a critical stereochemical inversion in a cardiovascular drug candidate, leading to a correction in the synthesis. This resulted in a 30% reduction in development time and significant cost savings [48].
Advanced Topics and Future Directions
The field of NMR is evolving rapidly with the integration of artificial intelligence and automation.
- AI-Powered Analysis: Tools like ARTINA use deep learning for fully automated peak picking, chemical shift assignment, and protein structure determination from raw NMR spectra [53].
- Advanced Prediction Algorithms: Software such as Mnova NMRPredict combines machine learning with traditional HOSE-code and increments-based methods for highly accurate chemical shift predictions [50].
- Integration with In-Silico Models: New methods combine AlphaFold protein structure predictions with NMR data to achieve time-optimized and data-efficient NMR assignments [53].
Diagram 2: The core concept of NMR, showing the sequence from light-matter interaction to structural information.
NMR spectroscopy stands as a cornerstone technique for the structural elucidation of complex molecules. By harnessing the specific interactions between radiofrequency light and atomic nuclei, it provides unparalleled insights into molecular identity, connectivity, and three-dimensional conformation. Its continued evolution, particularly through integration with AI and machine learning, ensures its critical role in advancing scientific research, especially in the demanding and highly regulated field of pharmaceutical development.
The interaction of light with matter forms the cornerstone of spectroscopic analysis, with different techniques exploiting various aspects of this interaction to extract molecular information. While infrared (IR) spectroscopy relies on the absorption of photons that directly match vibrational energy differences, Raman spectroscopy utilizes the inelastic scattering of light to probe the same molecular vibrations. This complementary relationship arises from their different selection rules: IR absorption depends on a change in the permanent dipole moment during vibration, whereas Raman scattering requires a change in the polarizability of the electron cloud [54]. The Raman effect occurs when incident photons interact with molecules and are scattered with shifted frequencies corresponding to the molecule's vibrational energies, providing a structural fingerprint for identification [54] [55].
Despite its advantages, including minimal sample preparation and compatibility with aqueous solutions, conventional Raman spectroscopy suffers from an intrinsic limitation: extremely weak signal intensity, as only approximately 1 in 10⁷ photons undergoes inelastic scattering [56]. This inherent lack of sensitivity has historically restricted its application in trace analysis. Surface-Enhanced Raman Spectroscopy (SERS) overcomes this fundamental limitation by amplifying the Raman signal by factors of 10⁴ to 10⁸, and even up to 10¹⁴ in single-molecule detection, through strategic interactions between light, metallic nanostructures, and analyte molecules [57] [58] [59]. By exploiting plasmonic enhancements, SERS transforms Raman spectroscopy from a routine characterization tool into a powerful technique for detecting analytes at parts-per-billion (ppb) to parts-per-trillion (ppt) concentrations, enabling its application in fields ranging from pharmaceutical development to environmental monitoring [57] [59].
Fundamental Principles: From Raman to SERS
The Raman Effect
The Raman effect originates from the inelastic scattering of monochromatic light, typically from a laser. When photons interact with a molecule, most are elastically scattered (Rayleigh scattering) with unchanged energy. A tiny fraction, however, undergoes inelastic scattering (Raman scattering), resulting in energy shifts equal to the vibrational energy levels of the molecule [56]. When the scattered photon has less energy than the incident photon (Stokes shift), it indicates energy transfer to excite a molecular vibration. Conversely, when the scattered photon has more energy (anti-Stokes shift), it results from the molecule transferring vibrational energy to the photon [54].
The magnitude of this shift, measured in reciprocal centimeters (cm⁻¹), provides a characteristic vibrational fingerprint of the molecule. The Raman shift (Δν̃) is calculated using the formula:
Δν̃ (cm⁻¹) = [1/λ₀ (nm) - 1/λ₁ (nm)] × 10⁷
where λ₀ is the excitation laser wavelength and λ₁ is the wavelength of the Raman-scattered light [54].
SERS Enhancement Mechanisms
SERS achieves its remarkable signal enhancement through two primary mechanisms operating synergistically when analyte molecules are adsorbed onto or in close proximity to nanostructured metal surfaces (typically gold or silver).
Electromagnetic Enhancement (EM): This physical mechanism provides the majority of the signal enhancement (typically 10⁴-10⁸ factor). When laser light illuminates nanostructured metal surfaces with features smaller than the excitation wavelength, it excites collective oscillations of conduction electrons, known as localized surface plasmon resonances (LSPRs) [57] [59]. These resonances create dramatically enhanced localized electromagnetic fields, often at sharp tips or within narrow gaps between nanoparticles ("hot spots"). The Raman signal intensity is proportional to the fourth power of the local electric field enhancement (
I_SERS ∝ |E|⁴), explaining the enormous amplification possible [58] [59].Chemical Enhancement (CM): This mechanism contributes a more modest enhancement (typically 10-10³ factor). It involves chemical interactions between the analyte molecule and the metal surface, which may include charge transfer that alters the polarizability of the adsorbate. This effect requires direct contact or proximity between the molecule and the metal surface [58] [59].
The following diagram illustrates the relationship between the fundamental Raman effect and the enhancement mechanisms in SERS:
Diagram 1: Fundamental transition from Raman scattering to the SERS mechanism.
SERS Substrates and Instrumentation
Evolution of SERS Substrates
The reproducibility and enhancement factor of SERS measurements are critically dependent on the substrate design and fabrication. Early substrates based on electrodes roughened by oxidation-reduction cycles or aggregated colloidal nanoparticles suffered from poor reproducibility due to random hot-spot formation [57] [58]. Modern substrate engineering has focused on creating highly uniform and reproducible nanostructures.
Engineered SERS Substrates:
- Photonic Crystal Substrates: These combine periodic texturing with semiconductor manufacturing techniques to create substrates with precisely controlled feature dimensions. They act as optical antennae that concentrate and localize the electromagnetic field, while also serving as efficient transducers for coupling light in and out [57]. This design enables reproducible enhancements >10⁴ with relative standard deviations <5% across a substrate [57].
- Shell-Isolated Nanoparticle-Enhanced Raman Spectroscopy (SHINERS): This innovative approach uses gold or silver nanoparticles coated with an ultrathin, chemically inert shell (typically 2-4 nm of silica or alumina). The shell prevents direct contact between the analyte and metal core, eliminating chemical interactions that can interfere with signals while maintaining strong electromagnetic enhancement [58].
- Tip-Enhanced Raman Spectroscopy (TERS): TERS combines SERS with scanning probe microscopy by using a sharp metal tip to localize plasmonic enhancement at the nanoscale. This provides ultra-high spatial resolution below the diffraction limit, enabling chemical mapping at the single-molecule level [55].
The Scientist's Toolkit: Essential Reagents and Materials
Table 1: Key Research Reagent Solutions for SERS Experiments
| Item | Function | Key Considerations |
|---|---|---|
| Plasmonic Nanoparticles (Au, Ag) | Provide enhancement via LSPR | Gold: Biocompatible, 532-785 nm excitation; Silver: Higher enhancement, 400-600 nm excitation [59] |
| Engineered SERS Substrates (Klarite, etc.) | Reproducible, commercial platforms | Photonic crystal designs offer uniformity (<5% RSD); tunable for different lasers [57] |
| Functionalization Ligands | Promote selective analyte adsorption | Thiols for Au surfaces; silanes for oxides; target-specific aptamers/antibodies [57] [59] |
| Aggregation Agents (e.g., NaCl, MgSO₄) | Induce nanoparticle clustering for "hot spots" | Critical for colloidal SERS; concentration optimization essential [60] |
| Internal Standards (e.g., deuterated compounds, isotopically labeled analogs) | Enable signal normalization and quantification | Corrects for variations in enhancement factor and laser focus [60] |
Quantitative Performance and Detection Capabilities
The analytical performance of SERS is demonstrated through its exceptional sensitivity across various application domains. The following table summarizes quantitative detection capabilities for different analyte classes:
Table 2: Quantitative SERS Detection Performance for Various Analytes
| Analyte Class | Specific Analyte | Matrix | Limit of Detection (LOD) | Enhancement Factor |
|---|---|---|---|---|
| Drugs of Abuse | Cocaine | Aqueous solution | 30 ppb (ng/mL) | >10,000 [57] |
| Pharmaceuticals | Adenine | Buffer solution | Used in interlaboratory validation | Varies by substrate [60] |
| Biomarkers | Various proteins | Clinical samples | Sub-nanomolar | 10⁴-10⁶ [59] |
| Environmental Contaminants | Pesticides | Food products | Parts-per-billion (ppb) | 10⁵-10⁶ [59] |
| Foodborne Pathogens | E. coli, Salmonella | Food samples | Single-cell level | 10⁴-10⁵ [59] |
Recent interlaboratory studies have validated SERS for quantitative analysis, addressing historical concerns about reproducibility. A landmark study involving 15 laboratories demonstrated that with standardized protocols, SERS can achieve reproducibility standards compatible with regulatory requirements [60]. Key findings included that the precision of a SERS method depends more on the strict adherence to a detailed Standard Operating Procedure (SOP) than on the specific substrate type (colloidal vs. solid), provided the substrates are well-manufactured [60].
Experimental Protocols: From Substrate Preparation to Quantification
Protocol 1: Quantitative Analysis Using Commercial SERS Substrates
This protocol outlines the steps for determining analyte concentration using engineered photonic crystal substrates, ideal for applications in drug development quality control.
Step 1: Substrate Selection and Preparation
- Select a commercial SERS substrate (e.g., gold-coated photonic crystal) with plasmon resonance matching the planned laser excitation wavelength (e.g., 785 nm) [57].
- Handle substrates with clean tweezers and optionally plasma-clean for 1-2 minutes to remove organic contaminants and increase hydrophilicity.
Step 2: Calibration Curve Generation
- Prepare a minimum of five standard solutions of the target analyte (e.g., cocaine, adenine) in a suitable solvent, spanning the expected concentration range (e.g., 1 ppb to 100 ppm) [57] [60].
- Pipette 2-5 µL of each standard solution onto the active area of separate substrate wells. Allow to dry under ambient conditions or with a gentle nitrogen stream.
- For each concentration, acquire Raman spectra at multiple pre-defined locations (e.g., 5-10 spots) to account for spatial heterogeneity. Use consistent instrument parameters: laser power (1-10 mW), integration time (1-10 s), and spectral range [60].
Step 3: Data Analysis and Quantification
- Pre-process spectra: subtract baseline, normalize if using an internal standard, and vector-normalize [60].
- Select a characteristic, isolated Raman peak for quantification. Integrate the peak area or measure its height.
- Plot the mean intensity of the characteristic peak versus analyte concentration for the standards. Fit with a linear or logarithmic function to create the calibration model [60].
- Analyze unknown samples using the same procedure and determine concentration from the calibration curve.
Protocol 2: Trace Detection in Complex Matrices Using Functionalized Substrates
This protocol is designed for detecting specific targets (e.g., biomarkers, pathogens) in complex biological samples, requiring surface functionalization for selectivity.
Step 1: Substrate Functionalization
- Immerse the SERS substrate (e.g., Au nanoparticle array) in a 1-10 mM solution of a capture probe (e.g., thiolated antibody, DNA aptamer) for 1-12 hours at room temperature [59].
- Rinse thoroughly with buffer to remove physically adsorbed probes.
- Block non-specific binding sites by incubating with a blocking agent (e.g., 1% BSA, 2 mM 6-mercapto-1-hexanol for Au surfaces) for 1 hour [57].
Step 2: Sample Incubation and Washing
- Apply the complex sample (e.g., serum, urine, food extract) to the functionalized substrate and incubate in a humid chamber (30-60 minutes) to allow target binding.
- Gently rinse with an appropriate buffer (e.g., PBS) to remove unbound matrix components, which could otherwise cause non-specific interference.
Step 3: SERS Measurement and Identification
- If using a "label-free" approach, directly acquire the SERS spectrum of the captured analyte. The enhanced fingerprint spectrum allows for direct identification [59].
- For a "labeled" approach (often higher sensitivity), incubate with a SERS-active nanoparticle label (e.g., Au nanoparticle coated with Raman reporter and secondary antibody). After a second incubation and wash, measure the unique Raman signal of the reporter molecule [59].
- The workflow for this functionalized approach is summarized in the following diagram:
Diagram 2: Experimental workflow for SERS detection in complex matrices using functionalized substrates.
Comparison with Other Analytical Techniques
SERS occupies a unique position in the analytical toolbox, offering a balance of high sensitivity, molecular specificity, and minimal sample preparation.
Table 3: Comparison of SERS with Other Common Detection Methods
| Method | Principle | Typical LOD | Advantages | Limitations |
|---|---|---|---|---|
| SERS | Inelastic light scattering enhanced by nanostructures | ppb-ppt [59] | High sensitivity, molecular fingerprint, minimal sample prep, works in aqueous media | Substrate reproducibility, potential fluorescence interference |
| ELISA | Antibody-antigen interaction with enzyme-linked colorimetric readout | ppm-ppb [59] | High specificity, well-established, high-throughput | Requires multiple steps/labels, limited multiplexing, moderate sensitivity |
| PCR | Amplification of specific DNA sequences | ppb-ppt [59] | Extremely high sensitivity and specificity | Detects DNA only, not the chemical itself; prone to contamination |
| HPLC | Separation followed by various detection methods | ppb [59] | High precision and accuracy, quantitative, robust | Expensive instrumentation, lengthy analysis, skilled operation required |
| Traditional Raman | Inelastic light scattering | %-ppm [56] | Rich structural information, non-destructive, no sample prep | Very weak signal, not suitable for trace analysis |
Surface-Enhanced Raman Spectroscopy represents a powerful evolution in the toolkit for studying light-matter interactions, directly addressing the fundamental sensitivity limitations of spontaneous Raman scattering. By leveraging the plasmonic properties of metallic nanostructures, SERS enhances the inherent Raman effect by several orders of magnitude, enabling the detection and identification of chemical species at trace levels without sacrificing the rich molecular fingerprint information. The development of highly reproducible substrates and standardized protocols, as evidenced by recent interlaboratory validation studies, is transforming SERS from a specialized research technique into a robust analytical method ready for integration into regulated environments [60]. As substrate engineering and functionalization chemistry continue to advance, SERS is poised to play an increasingly critical role in addressing analytical challenges across drug development, clinical diagnostics, and food safety, providing scientists with an unparalleled tool for trace chemical analysis.
Process Analytical Technology (PAT) has been defined by the U.S. Food and Drug Administration (FDA) as a mechanism to design, analyze, and control pharmaceutical manufacturing processes through the measurement of Critical Process Parameters (CPPs) which affect the Critical Quality Attributes (CQAs) of the final product [61]. This framework represents a fundamental shift from traditional quality-by-testing to a more proactive quality-by-design (QbD) paradigm [62], enabling real-time monitoring and control throughout manufacturing.
The scientific foundation of PAT is deeply rooted in the principles of spectroscopy—the study of how light interacts with matter [16]. When electromagnetic radiation interacts with a material, photons can be absorbed, emitted, or scattered, with the specific interactions providing unique molecular fingerprints that reveal information about composition, structure, and behavior [47]. Understanding these light-matter interactions provides the fundamental basis for the sophisticated analytical techniques that make real-time process monitoring possible.
Theoretical Foundations: Light-Matter Interactions in Spectroscopy
The Electromagnetic Spectrum and Molecular Interactions
The electromagnetic spectrum encompasses all possible frequencies of electromagnetic radiation, from high-energy gamma rays to low-energy radio waves [47]. Each region of this spectrum interacts with matter in characteristic ways:
- Ultraviolet and Visible (UV-Vis) light (200-800 nm) possesses sufficient energy to promote electrons between molecular orbitals, enabling the study of electronic transitions in organic molecules and transition metal complexes [47].
- Infrared radiation (2.5-50 μm) excites molecular vibrations, including stretching and bending motions, providing insights into functional groups and overall molecular structure [47].
- Near-Infrared (NIR) region (0.78-2.5 μm) detects overtones and combination bands of fundamental vibrational transitions, offering deep sample penetration with minimal preparation requirements [47].
- Raman spectroscopy probes vibrational transitions through inelastic light scattering, complementing IR spectroscopy by detecting changes in polarizability rather than dipole moments [47].
These interactions are governed by fundamental quantum relationships, expressed by the equations E = hν and c = λν, where E is energy, h is Planck's constant, ν is frequency, c is the speed of light, and λ is wavelength [47]. These relationships demonstrate that shorter wavelengths correspond to higher frequencies and greater photon energies, making different spectral regions suitable for probing specific molecular features.
PAT Framework and Regulatory Context
PAT operates as an umbrella framework that integrates various analytical tools to enhance process understanding and control [63]. The FDA introduced PAT as part of the broader "Pharmaceutical cGMPs for the 21st Century - A Risk Based Approach" initiative [61], encouraging manufacturers to move beyond static batch processes to more dynamic, controlled operations.
The PAT framework encompasses three primary tool categories [61]:
- Multivariate data acquisition and analysis tools for design of experiments and statistical analysis
- Process analytical chemistry tools including various spectroscopic instruments
- Continuous improvement and knowledge management tools for accumulating quality control data
This systematic approach allows for real-time monitoring of CPPs, facilitating immediate adjustments to maintain CQAs within specified limits, thereby ensuring consistent product quality while reducing waste and overall costs [61].
PAT Implementation Framework
The implementation of PAT requires a systematic approach to integrating analytical technologies within manufacturing processes. The following diagram illustrates the core PAT framework and its relationship to light-based analysis:
PAT Measurement Approaches
PAT implementations can be categorized based on the relationship between the analytical measurement and the process stream [63] [64]:
- In-line measurements where the sensor is placed directly within the process stream without sample removal
- On-line measurements where samples are diverted from the manufacturing process and may be returned to the process stream
- At-line measurements where samples are removed and analyzed in close proximity to the process stream
- Off-line measurements where samples are removed and analyzed in a separate laboratory
The most advanced PAT implementations favor in-line and on-line approaches, which provide real-time data for immediate process control without interrupting manufacturing operations [64].
Critical Process Parameters and Quality Attributes
Successful PAT implementation requires identifying the relationship between CPPs and CQAs across various unit operations. The table below summarizes critical parameters for solid dosage form manufacturing:
Table 1: Critical Process Parameters and Quality Attributes in Pharmaceutical Manufacturing
| Process | Critical Process Parameters (CPPs) | Intermediate Quality Attributes (IQAs) | Impact on Final Product |
|---|---|---|---|
| Blending | Blending time, Blending speed, Order of input, Environment, Filling level [65] | Drug content, Blending uniformity, Moisture content [65] | Affects content uniformity and dissolution; separation may occur with improper blending time [65] |
| Granulation | Binder solvent amount, Binder solvent concentration, Impeller speed, Chopper speed, Addition rate [65] | Granule-size distribution, Granule strength, Flowability, Density [65] | Impacts tablet compressibility, weight variation, and dissolution profile; insufficient liquid forms weak granules [65] |
| Tableting | Compression force, Compression speed, Feeder speed, Turret speed [65] | Tablet hardness, Tablet thickness, Weight uniformity, Disintegration time [65] | Directly affects drug performance, stability, and patient compliance; improper compression causes capping or lamination [65] |
| Coating | Spray rate, Pan speed, Inlet air temperature, Air flow rate [65] | Coating thickness, Coating uniformity, Surface morphology [65] | Influences drug release profile, stability, and appearance; uneven coating causes variable drug release [65] |
Spectroscopic Techniques in PAT
Comparative Analysis of Spectroscopic Methods
Various spectroscopic techniques are employed in PAT applications, each with distinct advantages and applications. The table below provides a quantitative comparison of the primary spectroscopic methods used in pharmaceutical manufacturing:
Table 2: Spectroscopic Techniques for PAT Applications
| Technique | Spectral Range | Primary Interactions | Key Applications in PAT | Advantages |
|---|---|---|---|---|
| Raman Spectroscopy | Varies with laser source | Inelastic scattering of photons by molecular vibrations [66] | Monitoring of cell viability, nutrient consumption, metabolite production in bioreactors [66]; Protein quantification in downstream processing [66] | Non-destructive, non-invasive, minimal sample preparation, suitable for aqueous solutions [66] |
| Near-Infrared (NIR) Spectroscopy | 0.78-2.5 μm [47] | Overtone and combination bands of fundamental vibrational transitions [47] | Drug concentration monitoring in continuous manufacturing [67]; Blend homogeneity assessment [64] | Deep sample penetration, minimal preparation, compatible with fiber-optic probes [47] |
| UV-Vis Spectroscopy | 200-800 nm [47] | Electronic transitions between molecular orbitals [47] | Protein concentration measurement, DNA/RNA quantification, water quality monitoring [47] | High-throughput capability, quantitative analysis, relatively inexpensive instrumentation [47] |
| IR Spectroscopy | 2.5-50 μm [47] | Molecular vibrations (stretching, bending) [47] | Raw material identification, reaction monitoring, polymorph characterization [63] | Specific functional group information, well-established spectral libraries [47] |
Fiber Optic Integration in PAT
The integration of fiber optic probes has significantly advanced PAT capabilities by enabling remote spectroscopic sensing [64]. These probes utilize various spectroscopic principles (UV-VIS, NIR, Raman, or mid-IR spectroscopy) to transmit spectroscopic signals to and from the process stream [64]. For instance, mid-IR often employs ATR spectroscopy, while UV-VIS/NIR might use transmission for liquids or reflection for powders or solid samples [64].
This non-invasive approach to spectroscopic sensing facilitates in-line measurements, allowing for continuous monitoring of CPPs without compromising process integrity [64]. The ability of fiber optic probes to deliver and collect light from the material under examination makes real-time spectroscopic analyses possible directly within production environments [64].
Experimental Protocols and Methodologies
Raman Spectroscopy for Bioprocess Monitoring
The application of Raman spectroscopy as PAT in biopharmaceutical manufacturing involves specific experimental protocols for both upstream and downstream processing:
Upstream Bioreactor Monitoring Protocol [66]:
- Probe Installation: Insert a Raman probe assembly directly into the bioreactor vessel through standard ports.
- Calibration Model Development: Establish multivariate calibration models based on reference measurements of critical biomarkers (glucose, lactate, amino acids) at various process stages.
- Real-time Data Collection: Collect Raman spectra at predetermined intervals throughout the bioreactor run.
- Spectral Analysis: Process spectral data using chemometric techniques to determine component concentrations.
- Process Control Implementation: Use concentration data for feedback control, adjusting nutrient feeds or other parameters to maintain optimal process conditions.
Downstream Monitoring Protocol [66]:
- Flow Cell Integration: Install a flow cell arrangement in the process stream for continuous Raman measurement.
- Protein Quantification Calibration: Develop calibration models for protein concentration and impurities using reference standards.
- In-line Monitoring: Continuously monitor elution streams during chromatography steps.
- Quality Attribute Assessment: Analyze Raman spectra to assess critical quality parameters including protein secondary structure, aggregation, and glycosylation patterns.
The following workflow illustrates the implementation of Raman spectroscopy for bioprocess monitoring:
NIR Spectroscopy for Continuous Manufacturing
The implementation of NIR spectroscopy for monitoring continuous manufacturing of solid oral dosage forms follows a validated methodology [67]:
- Instrument Placement: Position NIR probes at strategic sampling locations within the continuous manufacturing line, typically after blending and before tableting.
- Method Validation: Perform comprehensive validation including accuracy, precision, linearity, and robustness tests.
- Repeatability Assessment: Conduct repeatability studies to differentiate process variability from sampling and analytical errors.
- Real-time Monitoring: Continuously collect NIR spectra to determine drug concentration and confirm products remain within specifications.
- Non-conforming Material Detection: Implement residence time distribution models coupled with PAT to detect and divert non-conforming material from the manufacturing process.
- Variographic Analysis: Apply variographic analysis to improve PAT implementation by quantifying overall process variability.
This approach has been successfully demonstrated in continuous manufacturing runs up to 120 hours, producing over 15 million tablets under a continuous state of control [67].
The Scientist's Toolkit: Essential Research Reagents and Materials
Successful implementation of PAT requires specific reagents, materials, and instrumentation. The table below details key components of the PAT research toolkit:
Table 3: Essential Research Reagents and Materials for PAT Implementation
| Tool/Reagent | Function/Application | Specific Examples |
|---|---|---|
| Raman Spectroscopy System | In-line monitoring of critical process parameters in bioreactors and downstream processing [66] | Probe assembly for bioreactor insertion; Flow cell for downstream monitoring [66] |
| NIR Spectroscopy with Fiber Optics | Real-time monitoring of drug concentration and blend homogeneity in continuous manufacturing [64] [67] | Fiber-optic probes for remote sensing; Chemometric software for spectral analysis [64] |
| Chemometric Software | Multivariate data analysis of spectral data for calibration model development and real-time prediction [66] [64] | Multivariate calibration algorithms; Real-time spectral processing tools [66] |
| Focused Beam Reflectance Measurement (FBRM) | In-line monitoring of particle size distribution through chord length measurement [63] | FBRM probes for crystallization monitoring; Data analysis software for particle characterization [63] |
| Fiber Optic Probes | Remote spectroscopic sensing in various process environments [64] | ATR probes for mid-IR spectroscopy; Reflection probes for powder analysis [64] |
| Reference Standards | Calibration and validation of PAT methods [66] [67] | Biomarker standards (glucose, lactate, amino acids) for bioreactor monitoring; API standards for concentration calibration [66] |
Process Analytical Technology represents a transformative approach to pharmaceutical manufacturing, enabled by fundamental principles of light-matter interactions. Through the strategic implementation of spectroscopic techniques such as Raman and NIR spectroscopy, PAT provides real-time monitoring and control of critical process parameters, ensuring consistent product quality while reducing waste and operational costs. The continued advancement of PAT frameworks, coupled with innovations in spectroscopic instrumentation and data analysis, promises to further enhance process understanding and control across the pharmaceutical industry and beyond. As these technologies evolve, they support the transition toward more efficient, quality-focused, and sustainable manufacturing paradigms.
Stability Studies and Degradation Pathway Analysis
Stability studies and degradation pathway analysis are fundamental to ensuring the safety, efficacy, and quality of pharmaceutical products. These studies are intrinsically linked to the principles of light-matter interaction, a core concept in spectroscopy. When light, a form of electromagnetic radiation, encounters a drug substance, the resulting interactions—whether absorption, emission, or scattering—can initiate or catalyze chemical degradation. Spectroscopy provides the foundational tools to monitor these changes, leveraging the predictable ways in which light and matter interact [10]. The energy of a photon is directly related to its wavelength (E = hν), meaning that different wavelengths can probe and drive different molecular transitions, from electronic excitations to vibrational modes [68] [10]. This guide details how these principles are applied in forced degradation studies to predict drug stability, identify degradation products, and validate analytical methods within a rigorous regulatory framework.
Theoretical Foundations: Light-Matter Interactions in Spectroscopy
The Nature of Light and Matter
Light, or electromagnetic radiation, exhibits both wave-like and particle-like properties. As a wave, it consists of oscillating electric and magnetic fields characterized by its wavelength (λ)—the distance between successive crests [68] [10]. The human eye perceives differences in wavelength as differences in color. As a particle, light is composed of photons, each carrying a discrete amount of energy (E = hν, where h is Planck's constant and ν is frequency) [10]. Matter, comprising atoms and molecules, possesses discrete energy levels. Electrons occupy specific orbitals around the nucleus and can transition between these levels by absorbing or emitting a photon of precisely the right energy [10].
Key Interaction Mechanisms
The interaction between light and matter is the cornerstone of spectroscopic analysis and drug degradation. The primary mechanisms include:
- Absorption: A molecule promotes an electron to a higher energy orbital by absorbing a photon. The specific wavelengths absorbed create a unique "fingerprint" for that substance [10]. This absorbed energy can also drive photochemical degradation reactions [69].
- Emission: When an excited electron returns to a lower energy level, it emits a photon of light [10].
- Reflection and Transmission: Light that is not absorbed may be reflected off a material or transmitted through it, both of which provide complementary information about the material's properties [10].
Advanced spectroscopic techniques exploit more complex interactions. In nonlinear spectroscopy, intense laser fields can induce a coherent response in a material, leading to phenomena like molecular alignment, where the optical field orients molecules in space [5]. Furthermore, virtual transitions, where short-lived electron-hole pairs are generated only during the light pulse, are now recognized as critically important for understanding a material's ultrafast optical response [41].
Forced Degradation Studies: Objectives and Regulatory Framework
Core Objectives
Forced degradation studies, also known as stress testing, involve subjecting a drug substance or product to harsh environmental conditions to deliberately induce degradation [70]. The primary objectives are [69] [70]:
- Identification of Degradants: To elucidate the structure of potential degradation products (DPs).
- Elucidation of Pathways: To understand the intrinsic stability of the drug molecule and its degradation pathways.
- Analytical Method Validation: To generate samples that prove the "stability-indicating power" of analytical methods, demonstrating they can accurately measure the active ingredient in the presence of its degradants [70].
Regulatory Guidelines
The International Council for Harmonisation (ICH) guidelines provide the global standard for these studies. ICH Q1A(R2) mandates stress testing to support regulatory submissions by providing data for identification of possible degradants, degradation pathways and intrinsic stability of the drug molecule and validation of stability indicating analytical procedures [69] [70]. ICH Q1B provides specific guidance on photostability testing [69]. These studies are a developmental activity, distinct from formal stability studies used to assign shelf-life, and are crucial for demonstrating the specificity of an analytical method as required by ICH Q2(R1) [70].
Experimental Design and Methodologies
Philosophy and Target Degradation
The goal of forced degradation is not to achieve maximum destruction but to induce controlled and relevant degradation. The generally accepted target is 5–20% degradation of the active pharmaceutical ingredient (API) [69] [70]. This range provides sufficient degradants to challenge the analytical method without generating secondary or tertiary artifacts that are unlikely to form under normal storage conditions. Over-stressing can produce these irrelevant degradants, while under-stressing may fail to reveal critical pathways [70].
Stress Condition Strategies
A systematic approach is applied to challenge the drug molecule under various conditions. The following table summarizes the standard stress conditions and their purposes.
Table 1: Standard Stress Conditions in Forced Degradation Studies
| Stress Condition | Typical Parameters | Primary Purpose | Common Degradation Mechanisms |
|---|---|---|---|
| Acid Hydrolysis | 0.1-1 M HCl, elevated temperature (e.g., 50-70°C) [69] [70] | Assess susceptibility to acidic conditions | Hydrolysis of labile bonds (e.g., esters, amides) [69] |
| Base Hydrolysis | 0.1-1 M NaOH, elevated temperature [69] [70] | Assess susceptibility to basic conditions | Hydrolysis, dehydrohalogenation, racemization [69] |
| Oxidative Stress | 0.1-3% H₂O₂, room temperature [69] [70] | Evaluate susceptibility to oxidation | Formation of N-oxides, sulfoxides, hydroxylamines [69] |
| Thermal Stress | 40-80°C (dry or at 75% RH) [69] [70] | Determine thermal stability in solid or solution state | Pyrolysis, dehydration, polymorphic changes [69] |
| Photolysis | ≥1.2 million lux hours (visible) & ≥200 W·h/m² (UV) per ICH Q1B [69] | Determine photosensitivity | Isomerization, dimerization, ring rearrangement, bond cleavage [69] |
The Scientist's Toolkit: Essential Reagents and Materials
The execution of forced degradation studies requires a suite of specific reagents and analytical tools.
Table 2: Key Research Reagent Solutions and Materials
| Item | Function/Explanation |
|---|---|
| Hydrochloric Acid (HCl) / Sodium Hydroxide (NaOH) | Standard reagents for acid and base hydrolysis studies, catalyzing the breakdown of ionizable functional groups [69]. |
| Hydrogen Peroxide (H₂O₂) | A common oxidizing agent used to simulate autoxidation pathways and identify oxidative degradants [69] [70]. |
| Stability Chambers | Precision ovens and humidity chambers that provide controlled thermal and humidity stress conditions [69]. |
| ICH Q1B Photostability Chamber | Calibrated chamber that provides the exact light exposure (visible and UV) mandated by regulatory guidelines [69]. |
| Metal Chelators (e.g., EDTA, DTPA) | Used in formulations to enhance stability by chelating metal ions that catalyze free radical oxidation [71]. |
| Radical Scavengers (e.g., Ethanol) | Compounds added to formulations to quench free radical reactions, thereby inhibiting oxidative degradation pathways [71]. |
| Hyphenated Analytical Systems (e.g., LC-MS) | Liquid Chromatography-Mass Spectrometry systems are critical for separating degradants and elucidating their structures [69]. |
Analytical Techniques and Degradation Pathway Elucidation
Stability-Indicating Methods and Spectroscopy
The primary goal of analytical monitoring in forced degradation is the development of stability-indicating methods—procedures that can accurately quantitate the active ingredient without interference from degradants, impurities, or excipients [70]. High-Performance Liquid Chromatography (HPLC) coupled with various detectors is the workhorse technique. The role of spectroscopy is integral:
- UV/Vis Spectrophotometry: Used as an HPLC detector (DAD/PDA) to assess peak purity and identity by comparing absorption spectra [69].
- Mass Spectrometry (MS): Hyphenated techniques like LC-MS are indispensable for identifying degradants by providing molecular weight and fragmentation patterns [69].
- Advanced Spectroscopies: Techniques like NMR, X-ray absorption, and non-linear optical methods are used for in-depth structural elucidation of complex degradants and for studying fundamental light-matter interactions in materials [5] [72].
Pathway Prediction and Case Study: Plasmid DNA
The process often begins with in-silico prediction of susceptible functional groups. A compelling case study involves plasmid DNA in pharmaceutical formulations [71]. Accelerated stability studies revealed that the primary degradation pathways for plasmid DNA are:
- Free Radical Oxidation: A major pathway involving the generation of hydroxyl radicals, leading to lesions like 8-hydroxydeoxyguanosine. This can be controlled by adding chelators (EDTA, DTPA) and radical scavengers (ethanol) [71].
- Depurination and Beta-Elimination: Hydrolytic pathways that become the dominant degradation mechanisms once oxidation is controlled. Their rate constants are pH and temperature-dependent, allowing for predictive modeling of storage stability [71].
The following diagram illustrates the experimental workflow for a forced degradation study, from stress to analysis.
Diagram 1: Forced Degradation Workflow
Mass Balance and Peak Purity
A critical concept in validating the analytical method is mass balance—the process of adding the assay value of the intact drug to the combined levels of all degradation products [69]. Good mass balance (e.g., 98-102%) indicates that all major degradants have been accounted for and that the method is truly stability-indicating. This is complemented by peak purity tests using diode array detectors (DAD), which confirm that the main drug peak is not co-eluting with a degradant by comparing its UV spectrum across the peak [69].
Visualization of Key Pathways and Interactions
Understanding the photodegradation pathway requires visualizing how light energy initiates molecular damage. The following diagram depicts this process.
Diagram 2: Photodegradation Pathway
Stability studies and degradation pathway analysis represent a critical application of light-matter interactions in pharmaceutical science. The principles of spectroscopy not only provide the analytical tools to detect and identify degradants but also help explain the fundamental chemical mechanisms by which light energy drives molecular degradation. Through a well-designed forced degradation study, which employs a range of stress conditions and sophisticated analytical techniques, scientists can predict the long-term stability of a drug product, develop validated stability-indicating methods, and ultimately ensure that patients receive safe and effective medicines. The field continues to evolve with advancements in predictive software, hyphenated analytical technologies, and a deeper understanding of ultrafast photochemical processes, promising ever more robust and efficient drug development in the future.
Spectroscopy research is undergoing a transformative shift, moving from ensemble-average measurements to the precise detection of individual molecules and the application of quantum mechanical principles to enhance spectroscopic capabilities. At the heart of this evolution lies a refined understanding of light-matter interactions, which form the fundamental basis for all spectroscopic techniques. Traditional spectroscopy operates primarily in the weak coupling regime, where light serves as a passive probe of material properties. However, emerging approaches are exploring strong coupling regimes where matter and light form hybrid states called polaritons, fundamentally altering the potential energy landscapes of molecular systems and opening new pathways for controlling chemical processes [73].
These advancements are enabled by sophisticated theoretical frameworks, particularly molecular quantum electrodynamics (QED), which provides a first-principles description of how charged particles (electrons, nuclei) interact with quantized electromagnetic fields [73]. The minimally coupled Coulomb Hamiltonian forms the foundation for understanding these interactions:
[ \hat{H} = \sum{i=1}^{Ne} \frac{1}{2mi} [\mathbf{\hat{p}}i - zi \mathbf{\hat{A}}(\mathbf{r}i)]^2 + \hat{V} + \sum{\alpha} \hbar \omega{\alpha} \left( \hat{a}{\alpha}^{\dagger} \hat{a}{\alpha} + \frac{1}{2} \right) ]
where (\mathbf{\hat{A}}) represents the vector potential of the quantized electromagnetic field, and (\hat{a}{\alpha}^{\dagger}) and (\hat{a}{\alpha}) are photon creation and annihilation operators [73]. This framework allows researchers to model and engineer light-matter interactions across different coupling strengths, from weak to strong, enabling the development of novel spectroscopic methods with unprecedented sensitivity and resolution.
Single-Molecule Detection: Techniques and Applications
Core Principles and Methodological Advances
Single-molecule detection techniques overcome the limitations of ensemble measurements by probing individual molecules, thereby revealing heterogeneities and transient states that would otherwise be averaged out. A groundbreaking advancement in this domain is the development of single-molecule-level detection of interfacial molecular structures and ultrafast dynamics through the integration of femtosecond sum-frequency generation vibrational spectroscopy (SFG-VS) with nanoparticle-on-mirror (NPoM) nanocavities [74]. This technique, termed NPoM-SFG-VS, leverages the extreme field confinement and enhancement provided by plasmonic nanocavities to achieve signal levels sufficient for detecting minute quantities of molecules.
The NPoM-SFG-VS platform has demonstrated remarkable sensitivity by identifying signals from self-assembled monolayers (SAMs) comprising approximately 60 molecules, effectively reaching single-molecule-level detection [74]. Using the symmetric stretching vibrational mode of para-nitrothiophenol (νNO₂) as a probe, researchers determined key dynamical parameters at the single-molecule level, with a dephasing time of (0.33 \pm 0.01) ps and vibrational relaxation time of (2.2 \pm 0.2) ps [74]. Furthermore, by controlling the solution concentration used to prepare SAMs ((C)), researchers established that single-molecule-level detection was achieved at (C \leq 10^{-10}) M [74]. This protocol also enables mapping of microregion distribution of interfacial molecule numbers using NPoM-SFG imaging, providing spatial information alongside dynamical data.
Experimental Protocol: NPoM-SFG-VS for Single-Molecule Detection
Sample Preparation:
- Substrate Functionalization: Prepare gold mirrors and nanoparticles for the NPoM cavity structure. Clean substrates thoroughly to ensure uniform molecular adsorption.
- Self-Assembled Monolayer Formation: Immerse substrates in solutions of para-nitrothiophenol (pNTP) at varying concentrations ((10^{-6}) M to (10^{-11}) M) for 12-24 hours to allow formation of self-assembled monolayers [74].
- Nanocavity Assembly: Precisely position gold nanoparticles (typically 80-100 nm diameter) onto the functionalized mirror surface using atomic force microscopy or capillary assembly techniques to form the NPoM structures.
Optical Setup and Measurement:
- Laser System: Employ a femtosecond laser system producing pulses with two synchronized beams: (1) a visible beam at 800 nm and (2) a tunable infrared beam covering the molecular vibrational frequencies (2000-4000 cm⁻¹) [74].
- Beam Geometry: Co-focus both beams onto the NPoM sample at incident angles optimized for phase-matching with precise spatial and temporal overlap.
- Signal Detection: Collect the generated sum-frequency signal in reflection geometry using a high-sensitivity CCD detector after filtering out the fundamental frequencies.
- Data Acquisition: Acquire spectra by scanning the IR frequency while keeping the visible frequency fixed. For dynamics measurements, introduce precise time delays between visible and IR pulses using a mechanical delay stage.
Data Analysis:
- Spectral Processing: Normalize SFG signals to reference spectra from known standards to account for laser fluctuations and system response.
- Dynamical Parameters: Extract dephasing times ((T2)) and vibrational relaxation times ((T1)) by fitting the time-dependent SFG signals to appropriate models [74].
- Molecular Counting: Correlate signal intensities with solution concentrations to establish detection limits and quantify molecule numbers in specific microregions.
Research Reagent Solutions for Single-Molecule Spectroscopy
Table 1: Essential Materials for Single-Molecule Detection Experiments
| Reagent/Material | Function | Specifications |
|---|---|---|
| Para-nitrothiophenol (pNTP) | Probe molecule | High purity (>99%), serves as model system with distinct NO₂ vibrational signature [74] |
| Gold Nanoparticles | Plasmonic nanocavity component | 80-100 nm diameter, spherical, citrate-stabilized for NPoM structures [74] |
| Gold Mirrors | Plasmonic substrate | Atomically flat, 100-200 nm gold film on silicon/mica substrate [74] |
| Solvents | Sample preparation | Anhydrous ethanol or methanol for SAM formation solutions |
| Reference Compounds | Signal calibration | Deuterated methanol, cyclohexane for frequency calibration |
Quantum-Enhanced Spectroscopy: Harnessing Quantum Optics
Theoretical Foundations and Key Techniques
Quantum-enhanced spectroscopy represents a paradigm shift that utilizes quantum properties of light, such as entanglement and photon correlations, to achieve measurement capabilities beyond classical limits. These approaches leverage advancements in quantum optics, including improved single-photon detectors and entangled photon sources, to extract information at the ultimate quantum limit [75]. The field encompasses two broad categories: (1) resolving temporal, spatial, and frequency photon correlations from sample emission or scattering, and (2) illuminating samples with quantum light of defined correlations [75].
A fundamental concept in quantum spectroscopy is the second-order photon correlation function, (g^{(2)}(\tau)), which measures the probability of detecting two photons with time delay (\tau):
[ g^{(2)}(\tau) = \frac{\langle \hat{I}(t)\hat{I}(t+\tau) \rangle}{\langle \hat{I}(t) \rangle^2} ]
where (\hat{I}(t)) represents the photon intensity at time (t) [75]. For single-photon emitters, this function exhibits antibunching ((g^{(2)}(0) < 1)), indicating the emission of individual photons, while bunching ((g^{(2)}(0) > 1)) can reveal cooperative emission phenomena or multi-exciton dynamics [75].
Recent technological innovations have expanded these measurements to higher-order correlations ((g^{(n)}) with (n > 2)) and multidimensional analyses combining temporal, spatial, and spectral information. Techniques like spectroSPAD utilize single-photon avalanche diode (SPAD) arrays with diffractive gratings to perform photon-number-resolved spectroscopy with spectral resolution, enabling detailed studies of biexciton-exciton emission cascades and many-body interactions in quantum dots and other nanoscale materials [75].
Experimental Protocol: Photon-Correlation Spectroscopy
Setup Configuration:
- Excitation Source: Select appropriate laser source (continuous wave or pulsed) depending on application. For quantum dot studies, use picosecond-pulsed lasers with repetition rates of 1-80 MHz.
- Hanbury Brown-Twiss Interferometer: Split emitted light using a 50:50 beam splitter to two single-photon detectors in a start-stop configuration [75].
- Single-Photon Detection: Use superconducting nanowire single-photon detectors (SNSPDs) or single-photon avalanche diodes (SPADs) with high detection efficiency (>70%) and low dark counts (<100 counts per second) [75].
- Correlation Electronics: Employ time-correlated single-photon counting (TCSPC) modules or time-tagging units with timing resolution <100 ps.
Measurement Procedure:
- Sample Mounting: Prepare dilute samples of emitters (e.g., quantum dots, molecules) on substrates to ensure isolation of individual emitters within the excitation volume.
- Alignment and Calibration: Precisely align optical path lengths to both detectors and calibrate system response using reference emitters with known (g^{(2)}(\tau)) profiles.
- Data Acquisition: Collect photon arrival times over sufficient duration (typically 1-10 minutes) to achieve adequate statistics, particularly for higher-order correlations.
- Noise Correction: Measure and subtract background counts and correct for detector afterpulsing and other artifacts.
Advanced Implementations:
- Higher-Order Correlations: For (g^{(3)}) and (g^{(4)}) measurements, incorporate additional detectors and more complex coincidence logic [75].
- Spectrally-Resolved Correlation: Combine with spectrometer and SPAD arrays to obtain wavelength-dependent photon correlations [75].
- Photon-Correlation-Enhanced Microscopy: Implement intensity correlation microscopy (ICM) and super-resolution optical fluctuation imaging (SOFI) for spatial super-resolution beyond the diffraction limit [75].
Research Reagent Solutions for Quantum-Enhanced Spectroscopy
Table 2: Essential Materials for Quantum-Enhanced Spectroscopy
| Reagent/Material | Function | Specifications |
|---|---|---|
| Single-Photon Emitters | Quantum light sources | CdSe/CdS/ZnS quantum dots, perovskite nanocrystals, diamond NV centers [75] |
| SPAD Array Detectors | Photon detection | 32x32 or larger arrays, time-tagging capability, <100 ps timing resolution [75] |
| Superconducting Nanowire SPDs | High-performance detection | >70% detection efficiency, <1 dark count per second, cryogenic cooling required [75] |
| Entangled Photon Sources | Quantum illumination | Spontaneous parametric down-conversion (SPDC) crystals (BBO, PPKTP) [75] |
| Blinking Fluorophores | SOFI super-resolution | ATTO dyes, semiconductor nanocrystals with controlled blinking kinetics [75] |
Comparative Analysis of Techniques and Applications
Performance Metrics and Applications
Table 3: Quantitative Comparison of Advanced Spectroscopic Techniques
| Technique | Sensitivity | Spatial Resolution | Temporal Resolution | Key Applications |
|---|---|---|---|---|
| NPoM-SFG-VS | ~60 molecules [74] | Diffraction-limited (~300 nm) | 0.33 ps dephasing time [74] | Interfacial molecular structure, ultrafast surface dynamics [74] |
| Photon Correlation Spectroscopy | Single photons [75] | Nanoscale (with super-resolution) [75] | Picoseconds [75] | Single-photon sources, multi-exciton dynamics, quantum emitters [75] |
| SpectroSPAD | Single photons [75] | Diffraction-limited | Nanoseconds | Biexciton binding energies, emission cascades in quantum dots [75] |
| Intensity Correlation Microscopy (ICM) | Single molecules [75] | 20-30 nm (super-resolution) [75] | Milliseconds | Subcellular structures, protein organization, nanomaterial characterization [75] |
Visualizing Experimental Workflows
The following diagrams illustrate key experimental setups and conceptual frameworks for the techniques discussed in this review.
Diagram 1: Single-molecule detection with NPoM-SFG-VS. This workflow shows how femtosecond laser pulses interact with molecules in plasmonic nanocavities to generate sum-frequency signals enabling single-molecule sensitivity [74].
Diagram 2: Quantum-enhanced spectroscopy setup. This Hanbury Brown-Twiss interferometer configuration measures photon correlations to reveal quantum optical properties of emitters, such as antibunching for single-photon sources [75].
The emerging applications of single-molecule detection and quantum-enhanced spectroscopy represent a significant advancement in our ability to probe and understand light-matter interactions at the most fundamental levels. By pushing sensitivity to single molecules and leveraging quantum properties of light, these techniques provide unprecedented insights into molecular structures, dynamics, and quantum phenomena in materials. The integration of theoretical frameworks from quantum electrodynamics with sophisticated experimental platforms enables researchers to not only observe but also control matter at previously inaccessible scales. As these technologies continue to mature, they hold tremendous promise for driving innovations across diverse fields including drug discovery, materials science, quantum information processing, and fundamental chemical physics. The ongoing convergence of spectroscopy with quantum optics and nanotechnology suggests that we are merely at the beginning of a new era in analytical science, where the quantum nature of light and matter becomes both the subject and tool of investigation.
Optimizing Spectroscopic Analysis: Overcoming Technical Challenges in Pharmaceutical Settings
The interaction of light with matter forms the foundational principle of many spectroscopic techniques used in analytical chemistry. Spectroscopy studies how electromagnetic radiation is absorbed, emitted, or scattered by substances, revealing critical information about their composition, structure, and physical properties [16]. In the context of drug development and bioanalysis, this fundamental interaction enables researchers to detect and quantify target analytes within complex biological matrices. However, the very matrices that house these analytes can significantly interfere with the light-matter interaction, leading to phenomena known as matrix effects that compromise analytical accuracy [76]. Understanding these effects within the theoretical framework of light-matter interaction is therefore essential for developing robust analytical methods.
Matrix effects represent a significant challenge in quantitative bioanalysis, particularly when using tandem mass spectrometry (MS/MS) coupled with separation techniques like liquid chromatography (LC) or gas chromatography (GC) [76]. These effects are defined as "the direct or indirect alteration or interference in response due to the presence of unintended analytes or other interfering substances in the sample" [77]. In practice, this manifests as a difference in mass spectrometric response for an analyte in standard solution versus the response for the same analyte in a biological matrix such as urine, plasma, or serum [76]. The guidance from the U.S. Food and Drug Administration emphasizes that appropriate steps must be taken to ensure the lack of matrix effects throughout method application, especially when matrix nature may change during validation [76].
This technical guide provides a comprehensive framework for selecting analytical methods based on analyte characteristics and matrix composition, with particular focus on mechanisms, assessment methodologies, and control strategies for matrix effects. By integrating fundamental principles of light-matter interaction with practical analytical protocols, we aim to equip researchers with systematic approaches for ensuring data accuracy in biomonitoring studies and drug development pipelines.
Theoretical Foundations: Spectroscopy and Matrix Interference Mechanisms
Fundamental Principles of Light-Matter Interaction in Spectroscopy
Spectroscopic techniques leverage the quantum mechanical principle that atoms and molecules possess discrete energy levels. When photons interact with matter, they can be absorbed or emitted as species transition between these energy levels at characteristic wavelengths, creating unique spectral fingerprints for different compounds [16]. These interactions form the basis for identifying and quantifying substances across various scientific domains, from astronomy to medical diagnostics [16].
In mass spectrometry, the light-matter interaction differs from optical spectroscopy as it involves the ionization of analytes and separation based on mass-to-charge ratios [16]. The ionization process—whether through electrospray ionization (ESI), atmospheric pressure chemical ionization (APCI), or other techniques—represents a critical juncture where matrix effects can significantly alter analytical outcomes [77]. The efficiency of this ionization process depends not only on the physico-chemical properties of the target molecule but also on conditions established in the ionization interface and the presence of co-eluting matrix components [77].
Mechanisms of Matrix Effects in Separation Science Coupled with MS
Matrix effects primarily arise from endogenous and exogenous substances present in biological samples. Endogenous components include salts, carbohydrates, amines, urea, lipids, peptides, and metabolites, while exogenous substances may comprise mobile phase additives, plasticizers like phthalates, and anticoagulants such as Li-heparin [76]. The specific mechanisms of interference vary depending on the ionization technique employed:
Electrospray Ionization (ESI) Mechanisms: In ESI, matrix components suppress analyte ion intensity through multiple pathways: (1) competing with the analyte for available charges in the liquid phase, (2) increasing droplet viscosity and surface tension, thereby reducing solvent evaporation rates and analyte transfer to the gas phase, and (3) gas-phase neutralization of analyte ions [76] [77]. The ESI process transforms the liquid eluent into charged droplets through nebulization, followed by gas-phase ion release when Coulombic forces overcome surface tension. Co-eluting matrix components disrupt this process by competing for charge and space at the droplet surface [77].
Atmospheric Pressure Chemical Ionization (APCI) Mechanisms: APCI generally demonstrates less susceptibility to matrix effects since ionization occurs primarily in the gas phase after evaporation, eliminating competition for charge in the liquid phase [76]. However, matrix effects can still occur through gas-phase proton transfer reactions where compounds with higher proton affinity deplete available charges [77]. The extent of suppression is typically less pronounced than in ESI but remains a relevant consideration for method validation [77].
Table 1: Composition of Biological Matrices and Common Matrix Effect Contributors
| Matrix Components | Plasma/Serum | Urine | Primary Matrix Effect Concerns |
|---|---|---|---|
| Ions | Na+, K+, Ca2+, Cl-, Mg2+, HCO3- | Na+, K+, Ca2+, Cl-, Mg2+, NH4+ | Signal suppression; altered ionization efficiency |
| Organic Molecules | Urea, Creatinine, Uric Acid, Amino Acids, Glucose | Urea, Creatinine, Uric Acid, Citrate | Ion competition in ESI; modified chromatographic behavior |
| Proteins | Albumins, Globulins, Fibrinogen | Immunoglobulins, Albumin | Column fouling; non-specific binding |
| Lipids | Phospholipids, Cholesterol, Triglycerides | - | Significant ion suppression, especially phospholipids in positive mode |
| Other Components | Water-soluble vitamins | - | Variable effects depending on concentration |
The complexity of matrix effects is compounded by their system-specific and compound-specific nature [76]. Each biological matrix possesses a unique composition that necessitates tailored management strategies, and each analytical method responds differently to various matrix components [76]. Phospholipids, particularly glycerophosphocholines, represent a major source of matrix effects in bioanalysis under positive ionization mode due to their quaternary nitrogen atoms that readily ionize [77].
Experimental Protocols for Matrix Effect Assessment
Quantitative Assessment of Matrix Effects
The foundational protocol for evaluating matrix effects was established by Buhrman et al. (1996) and later refined by Matuszewski et al. (2003) [77]. This approach involves comparing analyte responses under three different conditions to calculate matrix effect (ME), recovery (RE), and process efficiency (PE):
Preparation of Solutions:
- Solution A: Standard in neat solution (representing 100% response without matrix)
- Solution B: Blank biological matrix extracted and then spiked with standard (post-extraction spiking)
- Solution C: Blank biological matrix spiked with standard before extraction
Chromatographic Analysis:
- Analyze each solution using the proposed LC-MS/MS or GC-MS method
- Record chromatographic peak areas for the target analyte(s)
- Maintain consistent instrumental conditions across all analyses
Calculation of Parameters:
- Matrix Effect (ME) = (B/A) × 100%
- Recovery (RE) = (C/B) × 100%
- Process Efficiency (PE) = (C/A) × 100%
A matrix factor (MF) can be derived where MF = B/A. An MF of 1 indicates no matrix effect, MF < 1 indicates ion suppression, and MF > 1 indicates ion enhancement [77]. Matuszewski further differentiated between "absolute" matrix effect (difference between A and B) and "relative" matrix effect (variation of absolute matrix effect between different lots of the same matrix) [77].
Qualitative Assessment via Post-Column Infusion
For qualitative assessment of matrix effects throughout the chromatographic run, a post-column infusion experiment is recommended:
Experimental Setup:
- Prepare a concentrated solution of the target analyte in a suitable solvent
- Connect an infusion pump to deliver this solution post-column at a constant rate
- Inject extracted blank matrix samples while infusing the analyte
Interpretation:
- A stable baseline indicates no matrix effects at that retention time
- Signal suppression appears as a depression in the baseline
- Signal enhancement appears as a peak in the baseline
Application:
- Identify regions of significant matrix interference
- Optimize chromatographic separation to move analyte peaks away from suppression/enhancement regions
- Compare different sample preparation techniques for their effectiveness in removing interfering components
Diagram 1: Matrix effect assessment protocol workflow
Analytical Method Selection Framework
Systematic Method Optimization Based on Analyte and Matrix Properties
Selecting appropriate analytical methods requires systematic consideration of analyte characteristics, matrix composition, and available instrumentation. The following decision framework guides researchers through this selection process:
Table 2: Method Selection Based on Analyte Properties and Matrix Composition
| Analyte Characteristics | Matrix Complexity | Recommended Separation | Recommended Ionization | Justification |
|---|---|---|---|---|
| Polar, thermally labile | Low to moderate | HPLC | ESI | ESI effectively handles polar compounds; minimal matrix interference expected |
| Non-polar, volatile | High phospholipid content | GC | EI/CI | GC separation avoids LC-compatible phospholipids; volatility enables gas-phase analysis |
| Moderate polarity, stable | High salt content | HPLC with extensive cleanup | APCI | APCI less susceptible to salt-induced suppression; moderate polarity enables LC separation |
| Ionic, non-volatile | High protein content | HPLC with protein precipitation | ESI with careful optimization | ESI effective for ionic species; protein removal critical |
| Broad compound diversity | Variable (unknown) | Comprehensive 2D-LC or GC×GC | Multimode ionization | Increased separation power resolves diverse compounds; multiple ionization sources cover different chemistries |
Ionization Technique Selection Protocol
The choice between ESI, APCI, and other ionization techniques significantly impacts susceptibility to matrix effects. Use the following protocol to guide this selection:
Analyte Property Assessment:
- Determine molecular weight, polarity, and thermal stability
- Estimate gas-phase proton affinity and surface activity
Preliminary Ionization Testing:
- Analyze standards in neat solutions using both ESI and APCI
- Compare signal intensity, stability, and signal-to-noise ratios
- Evaluate adduct formation patterns in each ionization mode
Matrix Tolerance Evaluation:
- Analyze post-extraction spiked samples (Solution B from section 3.1) in both ionization modes
- Calculate matrix factors for each ionization technique
- Select the ionization method with MF closest to 1 and least variability
Cross-Validation:
- For critical applications, validate findings using post-column infusion experiments
- Confirm that selected ionization provides consistent response across multiple matrix lots
Research indicates that ESI is generally more susceptible to ion suppression than APCI due to differences in ionization mechanisms [76]. In ESI, ionization occurs in the liquid phase before droplets enter the mass spectrometer, allowing matrix components to compete for charge and space at the droplet surface. In contrast, APCI occurs in the gas phase after evaporation, reducing but not eliminating competition for charge [77]. The negative ionization mode is generally considered more specific and less subject to ion suppression than positive mode [76].
Advanced Visualization and Data Representation Techniques
Spectrally Encoded Enhanced Representations (SEER) for Complex Data
Hyperspectral imaging and advanced spectroscopic techniques generate complex, multidimensional datasets that challenge conventional visualization methods. The Spectrally Encoded Enhanced Representations (SEER) approach transforms wavelength space into information-rich color maps for intuitive RGB display visualization [78]. This technique is particularly valuable for interpreting subtle spectral differences during method development and validation.
The SEER methodology employs these key steps:
- Phasor Transformation: Apply sine and cosine Fourier transforms to convert spectral datasets into 2D phasor plots
- Histogram Analysis: Generate 2D histogram representations of phasor plots to identify spectral population distributions
- Spectral Denoising: Apply median filters in phasor space to reduce spectral scatter error while maintaining spatial coordinates
- Color Mapping: Assign RGB colors to phasor positions using reference maps optimized for specific spectral characteristics
- Image Remapping: Transform original datasets using SEER-derived color assignments to enhance spectral discrimination
This approach enables researchers to visualize subtle spectral variations that would remain hidden in conventional displays, facilitating more informed method selection and optimization decisions [78].
Diagram 2: SEER visualization workflow for complex spectral data
Data Visualization Best Practices for Analytical Chemistry
Effective data representation follows three core principles articulated by visual scholar Edward Tufte and extended in the Purdue OWL guidelines: efficiency, effectiveness, and ethical representation [79]. For analytical method development:
- Efficiency: Use color judiciously, employing white space strategically to direct attention to significant findings. Reserve bright, high-contrast colors for highlighting critical data points or regions of interest.
- Effectiveness: Ensure readers can easily correlate data visualizations with corresponding textual explanations. Visual elements should complement—not repeat or replace—textual information.
- Ethical Representation: Maintain fidelity to experimental results by avoiding visual distortions that might exaggerate or minimize trends. Use appropriate scaling and avoid misleading visual representations.
Color selection should consider both analytical purposes and accessibility requirements. The Google color palette (#4285F4, #EA4335, #FBBC05, #34A853, #FFFFFF, #F1F3F4, #202124, #5F6368) provides sufficient contrast when properly implemented, with explicit setting of text colors (fontcolor) to ensure legibility against background colors (fillcolor) [80] [81] [82].
Research Reagent Solutions and Essential Materials
Table 3: Essential Research Reagents and Materials for Matrix Effect Investigation
| Reagent/Material | Function/Purpose | Application Notes |
|---|---|---|
| Phospholipid Standards | Identification and quantification of phospholipid-mediated matrix effects | Use for method development; monitor elution times to avoid analyte co-elution |
| Stable Isotope-Labeled Internal Standards | Correction for matrix effects and variability | Should be as close as possible to analyte structure; elute at same retention time |
| Solid Phase Extraction (SPE) Cartridges | Sample clean-up to remove interfering matrix components | Select chemistry based on analyte and interference properties; mixed-mode useful for diverse compounds |
| Protein Precipitation Reagents | Rapid removal of proteins from biological matrices | Acetonitrile, methanol, or acetone; may not remove phospholipids effectively |
| Liquid-Liquid Extraction Solvents | Selective extraction of analytes away from matrix interferences | Hexane, ethyl acetate, methyl tert-butyl ether; optimize for partition coefficients |
| Matrix Effect Evaluation Kits | Standardized assessment of matrix effects | Include pre-characterized matrix samples with known interference profiles |
The interplay between analyte nature and matrix effects represents a critical consideration in analytical method development for spectroscopy-based applications. This framework systematically addresses this interplay through fundamental principles of light-matter interaction, practical assessment protocols, and strategic method selection criteria. By integrating rigorous matrix effect evaluation during method validation—using both quantitative approaches like matrix factor calculation and qualitative techniques like post-column infusion—researchers can develop more robust analytical methods that deliver accurate results even in complex biological matrices. The continuing advancement of visualization techniques like SEER and adherence to data representation best practices further supports the development of reliable analytical methods for drug development and biomonitoring applications.
The interaction between light and matter forms the very foundation of spectroscopy, a powerful technique used to determine material composition and structure. When atoms or molecules undergo transitions between energy levels, they absorb or emit photons at characteristic wavelengths, creating a unique "spectral fingerprint" for each substance [16]. However, in practical analytical applications, this ideal scenario is often complicated by spectral complexity, where the signals of interest are obscured by overlapping bands from other components or by non-specific background interference. These phenomena are direct consequences of the sample's matrix and the instrumental conditions affecting how light interacts with the complex material system. Addressing these challenges is not merely a procedural necessity but a fundamental requirement for achieving accurate quantitative and qualitative analysis across diverse fields including pharmaceutical development, environmental monitoring, and materials science [83] [84].
Theoretical Foundations: Light-Matter Interactions and Spectral Artifacts
Origins of Spectral Interferences
Spectral interferences arise from various physical processes that occur during the excitation and emission cycles in spectroscopic analysis. In techniques like ICP-OES, where samples are atomized in high-temperature plasma, the emitted radiation contains both element-specific spectral lines and element-non-specific background radiation. This background comprises structured molecular spectra and a continuum that spans the entire usable wavelength range, produced through mechanisms such as the recombination of argon ions with electrons and electron bremsstrahlung [85]. The fundamental challenge lies in distinguishing the discrete, characteristic photon emissions from electronic transitions of target elements from this broader background radiation and overlapping emissions from other sample components.
Classification of Spectral Interferences
Spectral interferences are primarily categorized into two distinct types, each requiring different correction approaches:
- Background Interference: This additive interference includes continuum radiation from plasma processes and structured background from the sample matrix. It manifests as elevated baseline radiation that requires accurate modeling and subtraction [86] [85].
- Spectral Overlap: This occurs when an emission or absorption line from an interfering species overlaps directly with the analyte line. The overlap can be a direct line coincidence or a partial wing overlap, both requiring mathematical correction or instrumental separation [86] [84].
Table 1: Types of Spectral Interferences and Their Characteristics
| Interference Type | Origin | Spectral Manifestation | Impact on Analysis |
|---|---|---|---|
| Background Radiation | Plasma continuum, recombination radiation, bremsstrahlung | Elevated, often curved baseline | Increases detection limits, requires background correction |
| Direct Spectral Overlap | Coinciding emission lines from different elements | Complete or near-complete peak coincidence | Causes false positive signals, necessitates correction algorithms |
| Wing Overlap | Line broadening effects from high-concentration elements | Partial overlap at line wings | Obscures analyte peaks, requires specialized background modeling |
| Molecular Band Interference | Diatomic molecular species (e.g., oxides, hydrides) | Structured band spectra | Creates complex overlapping patterns, challenging correction |
Methodological Approaches for Interference Mitigation
Background Correction Techniques
Background correction is a critical step in spectral data processing, with the choice of method depending on the nature and complexity of the background.
Traditional Background Modeling
For ICP-OES applications, background correction typically involves selecting background points or regions adjacent to the analyte peak and applying appropriate correction algorithms. The approach varies based on background curvature:
- Flat Background: Correction uses points on both sides of the peak, averaged and subtracted from the peak intensity [86].
- Sloping Background: Background points must be taken at equal distances from the peak center for accurate linear correction [86].
- Curved Background: Requires more sophisticated algorithms (e.g., parabolic fitting) to model the background accurately, particularly when the analytical line is near a high-intensity line [86].
Advanced Statistical Approaches
Recent advances in statistical processing have led to more robust background removal techniques, particularly for complex datasets like those in Surface-Enhanced Raman Spectroscopy (SERS). The SABARSI (Statistical Approach of BAckground Removal and Spectrum Identification) method combines information from multiple spectra and allows the background's overall strength to change arbitrarily while its shape changes at slow to moderate speeds. This approach has demonstrated superior performance compared to traditional methods like Polynomial Fitting (PF), Iterative Restricted Least Square (IRLS), and Noise Median Method (NMM), particularly in handling strong fluctuations in SERS spectra [87].
Strategies for Addressing Spectral Overlap
Avoidance and Instrumental Approaches
The most straightforward approach to spectral overlap is avoidance through line selection or instrumental resolution:
- Alternative Analytical Lines: Modern simultaneous ICP instruments can measure multiple lines for 70+ elements simultaneously, allowing analysts to select interference-free alternative lines [86].
- High-Resolution Systems: High-resolution spectrometers can physically separate closely spaced lines that would overlap in lower-resolution systems [88].
- Collision/Reaction Cells: In ICP-MS, these cells can destroy polyatomic interfering ions before they reach the detector [88].
Mathematical Correction Algorithms
When avoidance is not possible, mathematical corrections are employed:
- Interference Coefficient Method: This approach requires measuring the interfering element's concentration and applying a predetermined correction factor (counts/ppm) to subtract the interference contribution from the total signal [86].
- Derivative Spectroscopy: Measuring the first derivative of the transmission curve with respect to wavelength can facilitate detection of low-intensity bands overlapped by bands of higher intensity [89].
- Multivariate Curve Resolution: Chemometric techniques like MCR can resolve overlapping signals by decomposing the data into individual component spectra [84].
Table 2: Quantitative Impact of Spectral Overlap Correction on Detection Limits
| Cd Concentration (ppm) | As:Cd Concentration Ratio | Uncorrected Relative Error (%) | Best-Case Corrected Relative Error (%) |
|---|---|---|---|
| 0.1 | 1000 | 5100 | 51.0 |
| 1 | 100 | 541 | 5.5 |
| 10 | 10 | 54 | 1.1 |
| 100 | 1 | 6 | 1.0 |
Note: Data illustrates the interference of 100 ppm As on the Cd 228.802 nm line in ICP-OES. Even with correction, high interferent-to-analyte ratios significantly impact measurement accuracy [86].
Experimental Protocols and Workflows
Comprehensive Spectral Interference Assessment Protocol
A systematic approach to identifying and quantifying spectral interferences involves these critical steps:
- Collection of Reference Spectra: Acquire high-quality spectra for all potential analytes at multiple concentrations prior to routine analysis. This library serves as a reference for line selection and interference prediction [86].
- Interference Screening: Analyze high-purity solutions of suspected interferents to identify potential overlaps with analyte lines of interest.
- Correction Coefficient Determination: For each identified interference, determine the correction factor by measuring the signal contribution of the interferent at the analyte wavelength across a concentration series.
- Method Validation: Analyze quality control samples containing known concentrations of analytes and interferents to verify correction accuracy.
- Continuous Monitoring: Implement ongoing quality checks to detect changes in interference patterns due to instrumental drift or sample matrix variations.
Advanced Background Correction Methodology
The statistical SABARSI approach implements background removal through this refined procedure:
- Data Organization: Compile multiple spectra collected across time points or technical replicates into a structured dataset.
- Window Size Selection: Set appropriate window sizes for both time and frequency channels (typically 50 points each) to capture local background variations without incorporating signal regions.
- Background Modeling: Apply the statistical algorithm that models the background without assuming temporal invariance, allowing both strength and shape to vary appropriately.
- Background Subtraction: Subtract the modeled background from the raw spectra to isolate the analyte signal.
- Signal Identification: Implement automated signal detection using statistical significance testing to distinguish real analyte signals from residual noise.
- Spectrum Matching: Apply similarity metrics that account for systematic experimental differences to match signals across replicates or to reference libraries [87].
Diagram 1: Spectral Interference Mitigation Workflow
The Scientist's Toolkit: Essential Research Reagents and Materials
Successful implementation of spectral complexity solutions requires specific materials and reagents carefully selected for their analytical properties and compatibility with the sample matrix and instrumentation.
Table 3: Essential Research Reagent Solutions for Spectral Analysis
| Reagent/Material | Function | Application Context | Considerations |
|---|---|---|---|
| High-Purity Single-Element Standards | Interference coefficient determination; calibration | ICP-OES, ICP-MS | Purity critical to avoid introducing additional interferences |
| Matrix-Matched Calibration Standards | Compensation for matrix effects | Quantitative OES/MS analysis | Must mimic sample composition without target analytes |
| Collision/Reaction Gases | Polyatomic interference reduction | ICP-MS with collision/reaction cells | Gas selection depends on specific interferences (e.g., He, H₂, NH₃) |
| Chromatographic Separation Materials | Physical separation of interferents prior to analysis | LC-ICP-MS, HPLC-UV | Select stationary phase based on analyte/interferent chemistry |
| Derivatization Reagents | Chemical modification to alter spectral properties | UV-Vis, fluorescence spectroscopy | Must produce predictable, reproducible spectral changes |
| Plasma Gases | Sample atomization/ionization | ICP-OES, ICP-MS | High-purity argon essential to minimize background from impurities |
Data Processing and Computational Approaches
Modern Spectral Preprocessing Framework
Contemporary spectroscopy is undergoing a transformative shift driven by computational advances, with intelligent preprocessing pipelines significantly enhancing data quality. A hierarchy-aware framework typically includes these sequential steps:
- Localized Artifact Removal: Cosmic ray and spike filtering using methods like moving average filters or wavelet transformations [83].
- Baseline Correction: Low-frequency drift suppression through techniques including morphological operations, spline fitting, or statistical approaches [83].
- Scattering Correction: Addresses light scattering effects particularly in particulate samples [83].
- Intensity Normalization: Mitigates systematic errors from instrumental variations [83].
- Noise Filtering and Smoothing: Improves signal-to-noise ratio while preserving critical spectral features [83].
- Feature Enhancement: Spectral derivatives and advanced chemometric techniques to resolve overlapping features [83] [84].
Chemometric Methods for Spectral Resolution
When traditional correction approaches are insufficient, multivariate statistical methods provide powerful alternatives:
- Principal Component Analysis: Dimensionality reduction technique that identifies patterns and trends in complex spectral data [84].
- Partial Least Squares Regression: Builds models between spectral data and analyte concentrations while handling collinear variables [84].
- Multivariate Curve Resolution: Resolves overlapping signals by decomposing data into pure component spectra and concentration profiles [84].
Diagram 2: Spectral Data Processing Pipeline
Spectral complexity arising from overlapping bands and background interference presents significant challenges in spectroscopic analysis, but a systematic approach combining appropriate instrumentation, mathematical corrections, and advanced data processing can effectively address these issues. The fundamental understanding of light-matter interactions informs the development of increasingly sophisticated solutions, from traditional background correction methods to emerging statistical and machine learning approaches. As spectroscopic techniques continue to evolve toward higher sensitivity and broader application, robust interference mitigation strategies will remain essential for extracting accurate chemical information from complex spectral data.
In spectroscopic research, the interaction between light and matter is the fundamental process that reveals detailed chemical and physical properties of a sample. Conventional optical spectroscopy faces inherent limitations, particularly the diffraction limit of light, which restricts the spatial resolution and sensitivity of measurements. Plasmonic nanostructures and advanced cavity designs have emerged as transformative approaches to overcome these barriers by manipulating light at subwavelength scales. These technologies work by confining and enhancing electromagnetic fields, dramatically increasing the interaction strength between light and matter. This enhancement enables the detection of minute quantities of analytes, including single molecules, and provides unprecedented spatial resolution for investigating biological systems and materials at the nanoscale. The integration of these approaches is pushing the boundaries of spectroscopic sensitivity and opening new possibilities for analytical science [90] [91] [92].
Core Enhancement Mechanisms
Plasmonic Field Confinement and Enhancement
Plasmonic nanostructures, typically made from noble metals like gold and silver, concentrate optical energy into nanoscale volumes far below the diffraction limit. This concentration creates intensely localized electromagnetic fields known as "hot spots."
- Gap-Mode Plasmonic Nanocavities: These systems are formed when metallic nanoparticles are separated from a metallic film by a nanoscale gap. This configuration squeezes light into the gap region, creating a massive enhancement of the local electromagnetic field. For instance, embedding a monolayer of MoS₂ (a transition metal dichalcogenide) within such a gap resulted in a photoluminescence (PL) enhancement factor of up to 2800 times [91].
- Purcell Effect: The enhanced local density of optical states (LDOS) in these nanocavities accelerates the spontaneous emission rate of nearby quantum emitters (e.g., molecules, quantum dots, or excitons in 2D materials). This effect, known as the Purcell effect, not only increases the brightness of the emission but also allows for higher photon detection rates [91] [92].
- Coupling Regimes: The light-matter interaction in these systems can be tuned between the weak and strong coupling regimes. In the weak coupling regime, the emission rate is enhanced. In the strong coupling regime, new hybrid energy states called "plexcitons" are formed, characterized by a measurable Rabi splitting. The system's position within these regimes depends on the relationship between the coupling strength and the loss rates of the system [91].
Cavity Design for Background Suppression and Signal Collection
While plasmonic structures enhance signals, sophisticated cavity designs are crucial for mitigating background noise, which is essential for achieving high signal-to-background ratios (SBR) at physiologically relevant analyte concentrations.
- Antenna-in-Box (AiB) Platforms: This design integrates a signal-enhancing nanoantenna (e.g., a bowtie nanoantenna) within a background-screening nanoaperture. The nanoantenna creates the hot spot for signal enhancement, while the surrounding aperture evanescently confines the excitation light, drastically reducing the large excitation volume that contributes to background fluorescence. This combination enables single-molecule detection at micro- to millimolar concentrations [92].
- Hybrid Material Cavities: Recent advances involve using different materials for the antenna and the aperture to optimize both enhancement and screening. For example, a gold bowtie nanoantenna inside an aluminum aperture (Au-Al-AiB) leverages gold's excellent plasmonic properties in the visible spectrum while utilizing aluminum's lower optical transmission to better screen out background noise. Computational optimizations show that these hybrid AiBs can outperform all-gold AiBs in excitation enhancement, fluorescence enhancement, and SBR [92].
- Off-Axis Integrated Cavity Output Spectroscopy (OA-ICOS): In a different spectroscopic context, off-axis alignment in optical cavities eliminates the need to couple light into a specific cavity mode. This makes the system more robust and easier to align while allowing for very long effective absorption path lengths (kilometers), thereby greatly enhancing sensitivity for gas-phase absorption measurements [93].
Quantitative Performance of Plasmonic Systems
The performance of various plasmonic and cavity-based enhancement systems can be quantitatively compared across several key metrics, as summarized in the table below.
Table 1: Performance Metrics of Plasmonic and Cavity-Enhanced Systems
| System Design | Enhancement Factor / Sensitivity | Key Performance Metric | Application Context |
|---|---|---|---|
| Gap-Mode Plasmonic Nanocavity [91] | PL Enhancement: 2,800x | Purcell effect and high LDOS | Enhancing exciton emission in monolayer MoS₂ |
| Optimized Plasmonic Nanopipette [90] | Maximum SERS/TERS enhancement with 10 nm Au coating | Optimal gold-sputtering condition | Near-field spectroscopy in electrolytic environments |
| Hybrid Au-Al AiB [92] | Higher GI, GF, and GSBR vs. all-gold AiB | Improved excitation, fluorescence, and SBR | Single-molecule fluorescence detection at high concentrations |
| OA-ICOS System [93] | Sensitivity: ~1.6×10⁻⁸ cm⁻¹ Hz⁻¹/² | Noise Equivalent Absorption | Trace gas detection (e.g., CH₄, N₂O, H₂O isotopologues) |
Detailed Experimental Protocols
Fabrication and Optimization of Plasmonic Nanopipettes
The following protocol details the creation of plasmonic nanopipettes for techniques like tip-enhanced Raman spectroscopy (TERS).
- Materials: Borosilicate glass capillaries, gold sputtering target, sputtering system.
- Methodology:
- Pipette Pulling: Fabricate initial nanopipettes from borosilicate glass capillaries using a commercial laser pipette puller to achieve a desired tip aperture (typically < 100 nm).
- Gold Sputtering: Coat the nanopipettes with a thin layer of gold using a sputtering system. Systematic testing is required to determine the optimal thickness. Tareq et al. found that a 10-nanometer gold coating provided the maximum plasmonic enhancement [90].
- Performance Evaluation: Evaluate the optimized probes using Surface-Enhanced Raman Spectroscopy (SERS) to quantify the enhancement factor. The performance is highly dependent on the gold film's thickness and morphology.
- Application in TERS: Implement the optimized nanopipette in scanning ion-conductance microscopy coupled with TERS. This allows for topographical imaging and chemical analysis with high spatial resolution in electrolytic environments, ideal for studying biological interfaces or electrocatalytic systems [90].
- Simulation Support: Employ finite-difference time-domain (FDTD) or other sophisticated simulations to model the electromagnetic field distribution around the coated tip and aid in the interpretation of the experimental spectra [90].
Construction and Tuning of a Gap-Mode Plasmon-Exciton System
This protocol describes building a system to study strong light-matter coupling between plasmonic cavities and quantum emitters.
- Materials: Ultrasmooth Au film, Ag nanocubes (e.g., 80 ± 3 nm), monolayer MoS₂, polymer electrolyte (PE).
- Methodology:
- Substrate Preparation: Begin with an ultrasmooth Au film (roughness ~0.5 nm).
- Spacer Deposition: Deposit a layer of polymer electrolyte (PE) onto the Au film. The thickness of this spacer is a critical tuning parameter. Repeat to build multilayers (e.g., 1-PE to 11-PE, corresponding to ~1.0 nm to ~14.8 nm) [91].
- Emitter Transfer: Transfer a monolayer of MoS₂ onto the PE layers.
- Nanocube Assembly: Deposit one additional PE layer as an adhesion layer, then assemble Ag nanocubes on top.
- Spectral Characterization: Use dark-field scattering spectroscopy to measure the plasmon resonance of the constructed nanocavities. As the PE spacer thickness increases, the plasmon resonance will blue-shift.
- Coupling Strength Analysis: When the plasmon resonance energy (Esp) overlaps with the MoS₂ A exciton energy (Eex), observe the scattering spectrum for a characteristic dip or anti-crossing behavior, indicating strong coupling. Fit the spectra using a coupled harmonic oscillator model (CHOM) to extract the coupling strength (g) and Rabi splitting (Ω = 2g). A system with a Rabi splitting of 62 meV has been demonstrated [91].
Fabrication of Hybrid Antenna-in-Box (AiB) Platforms
This protocol outlines a two-step electron beam lithography process for creating high-performance, reproducible hybrid AiBs.
- Materials: Substrate (e.g., BK7 glass), electron-beam resist (e.g., PMMA), chromium (adhesion layer), gold, aluminum.
- Methodology:
- Computational Optimization: Prior to fabrication, use FDTD simulations to optimize the geometry (e.g., bowtie nanoantenna dimensions, aperture diameter) and materials for the target excitation and emission wavelengths. For a bowtie with length=65 nm, height=50 nm, and gap=20 nm, simulations show an optimal nanoaperture diameter exists that maximizes excitation enhancement [92].
- First Lithography Step (Aperture): Pattern the circular nanoaperture into the resist on the substrate. For a hybrid AiB, deposit and lift-off an aluminum film to form the aperture.
- Second Lithography Step (Nanoantenna): Using a high-precision overlay, pattern the bowtie nanoantenna (BNA) inside the pre-defined aperture. Deposit a thin chromium adhesion layer followed by a gold film, then perform lift-off to form the gold BNA.
- Planarization: Spin-coat a layer of PMMA (e.g., 70 nm thick) over the entire structure to planarize it, which is crucial for studies involving lipid bilayers or cell membranes to avoid diffusion artifacts [92].
- Experimental Validation: Characterize the fabricated AiBs by measuring their transmission cross-section spectra and performing fluorescence correlation spectroscopy (FCS) or lifetime measurements with a target fluorophore (e.g., Alexa Fluor 647) to quantify fluorescence enhancement factors and signal-to-background ratios [92].
Visualization of Concepts and Workflows
Plasmon-Exciton Coupling Workflow
The following diagram illustrates the experimental workflow for constructing and analyzing a gap-mode plasmon-exciton coupling system.
Diagram Title: Plasmon-Exciton Coupling Workflow
Hybrid AiB Design and Function
The diagram below outlines the structure and functional advantages of a hybrid Antenna-in-Box platform.
Diagram Title: Hybrid AiB Structure and Output
The Scientist's Toolkit: Essential Research Reagents and Materials
Table 2: Essential Materials for Plasmonic-Enhanced Spectroscopy Experiments
| Material / Reagent | Function and Role in Experiment |
|---|---|
| Gold (Au) and Silver (Ag) [90] [91] | Primary materials for plasmonic nanostructures (nanoparticles, films, nanocubes) due to their strong plasmonic resonances in the visible/near-IR spectrum. |
| Aluminum (Al) [92] | Used in hybrid AiB platforms to form the nanoaperture. Provides superior background screening compared to gold due to lower optical transmission in the visible range. |
| Monolayer MoS₂ [91] | A model 2D semiconductor that hosts robust A excitons at room temperature, used as a quantum emitter for studying strong plasmon-exciton coupling. |
| Polymer Electrolyte (PE) Spacers [91] | Dielectric layers of precisely controlled thickness (1-15 nm) used to tune the distance and thus the coupling strength between plasmonic nanostructures and emitters. |
| Polyvinylpyrrolidone (PVP) [91] | A coating on Ag nanocubes that stabilizes them and defines a nanoscale gap when assembled on the spacer layer. |
| Chromium (Cr) [92] | A thin (~2 nm) adhesion layer used to improve the bonding of gold nanostructures to substrate surfaces. |
| PMMA [92] | Used as an electron-beam resist during fabrication and as a planarizing coating over finished nanostructures for biological compatibility. |
The fundamental principle underlying all spectroscopic techniques is the interaction between light and matter. When light, a form of electromagnetic radiation, encounters a material, several specific and predictable interactions can occur, including absorption, reflection, and transmission [10]. These interactions provide the foundational data for analyzing biological samples. Spectroscopy works precisely because light and matter interact in these characteristic ways, with the resulting spectral data serving as a fingerprint that reveals the chemical composition and physical properties of the sample being analyzed [10].
In biological analysis, these interactions become considerably more complex. Biological matrices represent challenging environments composed of intricate mixtures of proteins, lipids, carbohydrates, salts, and other organic molecules, all frequently suspended in an aqueous solution [76]. The aqueous environment itself presents significant analytical hurdles, particularly because water strongly absorbs infrared light, which can overshadow the signal from target analytes [94] [95]. This creates a persistent challenge for researchers and drug development professionals who must select analytical techniques that can distinguish subtle spectroscopic signals of target compounds amidst the complex background interference. This technical guide explores these challenges and provides strategic frameworks for selecting appropriate spectroscopic techniques for analyzing biological matrices in aqueous environments.
Fundamental Principles of Light-Matter Interactions in Spectroscopy
The Dual Nature of Light and Matter
Light exhibits both wave-like and particle-like properties. As a wave, light is characterized by its wavelength—the distance between successive peaks—which determines its position on the electromagnetic spectrum and is perceived by human eyes as color [10]. As a particle, light consists of discrete packets of energy called photons, with each photon carrying a specific amount of energy inversely related to its wavelength [10]. Shorter wavelengths correspond to higher energy photons, which is why ultraviolet light carries more energy than infrared radiation.
Matter, comprising all physical substances, is composed of atoms and molecules that contain electrons occupying specific energy levels [10]. The interaction between light (photons) and these electrons forms the basis of spectroscopic analysis. When a photon with energy matching the difference between two electron energy levels interacts with an atom, the photon may be absorbed, promoting the electron to a higher energy state [10]. This selective absorption of specific wavelengths produces the characteristic absorption spectra that enable material identification and quantification.
Primary Interaction Mechanisms
The following diagram illustrates the fundamental processes governing how light interacts with matter at the molecular level, which forms the theoretical foundation for all spectroscopic techniques:
The diagram above shows that when light encounters matter, four primary interactions can occur, each generating distinct analytical signals:
- Absorption: Photons with specific energies are absorbed by molecules, promoting electrons to higher energy states. The pattern of absorbed wavelengths creates an absorption spectrum unique to the molecular composition [10].
- Reflection: Incident light bounces off the material surface without being absorbed. The efficiency of reflection at different wavelengths provides information about surface properties [10].
- Transmission: Light passes through the material without significant interaction. The degree of transmission at different wavelengths indicates sample transparency and can reveal concentration information [10].
- Emission: After absorbing energy, materials may re-emit light at characteristic wavelengths, producing emission spectra that are highly specific to molecular structure [10].
In biological matrices, these fundamental interactions are complicated by the presence of water, which absorbs strongly in specific regions of the electromagnetic spectrum, particularly in the infrared region, potentially obscuring signals from target analytes [94].
Analytical Challenges in Aqueous Biological Matrices
Water Interference and Matrix Effects
The aqueous nature of biological samples presents two primary challenges for spectroscopic analysis. First, water molecules exhibit strong absorption across broad regions of the electromagnetic spectrum. In the infrared region, water absorption is particularly pronounced, which can severely limit the sensitivity of techniques like FTIR and NIR spectroscopy for detecting target molecules in solution [94]. This strong water absorption can mask the weaker signals from analytes of interest, such as proteins, lipids, and glucose, reducing detection sensitivity [94].
Second, biological matrices contain numerous compounds that can cause matrix effects—phenomena where co-eluting matrix components alter the ionization efficiency or spectroscopic response of target analytes [76]. These effects are particularly problematic in mass spectrometry-based methods but also influence optical spectroscopy. Endogenous substances including salts, phospholipids, metabolites, and proteins can contribute to these interference effects, potentially leading to ion suppression or enhancement in MS-based detection, or spectral overlapping in optical techniques [76].
Table 1: Common Interfering Components in Biological Matrices
| Matrix Component | Source | Impact on Spectroscopic Analysis |
|---|---|---|
| Phospholipids | Cell membranes | Cause ion suppression in LC-MS; spectral interference |
| Salts | Physiological fluids | Alter ionic strength; affect signal intensity |
| Proteins | Serum, tissues | Scatter light; bind analytes; background absorption |
| Carbohydrates | Biological fluids | Contribute to complex matrices; vibrational interference |
| Urea/Creatinine | Urine | Strong UV absorption; matrix effects |
Technical Limitations of Conventional Approaches
Traditional spectroscopic methods face significant limitations when applied to aqueous biological samples. Raman spectroscopy, while insensitive to water absorption, generates extremely weak signals that often require long acquisition times or signal enhancement techniques [94]. Fourier Transform Infrared (FT-IR) spectroscopy struggles with aqueous samples because water strongly absorbs infrared light, making it unsuitable for in-vivo monitoring in aqueous media [95]. Similarly, optoacoustic spectroscopy in the infrared range is limited by strong water absorption which reduces detection sensitivity for target molecules in biological solutions [94].
These challenges necessitate either sophisticated technical workarounds or the strategic selection of alternative techniques better suited to aqueous environments.
Strategic Technique Selection and Methodologies
Comparative Analysis of Spectroscopic Techniques
Table 2: Strategic Selection of Spectroscopic Techniques for Aqueous Biological Matrices
| Technique | Principle | Advantages | Limitations in Aqueous Matrices | Optimal Use Cases |
|---|---|---|---|---|
| UV-Visible Spectroscopy | Electronic transitions | Rapid; cost-effective; minimal water interference in UV-Vis range; works with microvolumes [96] [97] | Limited to chromophores; spectral overlapping | Quantifying nanoplastics [96]; pigment analysis in microalgae [95] |
| Cooled IR Optoacoustic Spectroscopy (CIROAS) | Light absorption → sound waves | Reduces water background via temperature control (4°C) [94] | Requires precise temperature control; specialized equipment | Proteins, lipids, glucose in aqueous solution [94] |
| Near-Infrared (NIR) Spectroscopy | Overtone vibrations | Penetrates samples deeply; minimal sample prep | Water absorption requires chemometrics [98] | Plant-based medicine analysis [98] |
| Raman Spectroscopy | Inelastic scattering | Insensitive to water; molecular fingerprints | Weak signal; fluorescence background [94] | When combined with surface enhancement |
| FT-IR Spectroscopy | Fundamental vibrations | Rich chemical information | Strong water absorption [95] | Dried samples or with advanced background subtraction |
Advanced Methodologies and Experimental Protocols
UV-Visible Spectroscopy with Machine Learning for Contamination Detection
The integration of UV-visible spectroscopy with machine learning represents an advanced approach for detecting biological contamination in microalgae cultures, demonstrating how conventional techniques can be enhanced with computational analysis [95]. The experimental workflow involves:
Sample Preparation: Cultivate microalgae species (e.g., Chlorella vulgaris) under controlled conditions. Introduce specific contaminants such as the flagellate Poterioochromonas malhamensis or the rotifer Brachionus plicatilis to establish contaminated samples [95].
Instrumentation Setup: Utilize a UV-visible light source covering 200-1000 nm wavelengths, a 10-mm cuvette holder for consistent path length, and a handheld spectrometer for data collection. The microvolume capability preserves scarce samples for additional analyses [95].
Data Acquisition: Collect spectra from both uncontaminated and contaminated cultures under various conditions, including salt-stressed media that alters pigment balance and creates spectral challenges [95].
Machine Learning Analysis: Apply Principal Component Analysis (PCA) to classify spectral differences. The ML algorithms leverage natural pigment chemistry (chlorophylls, carotenoids, lipids) that produce distinct spectral fingerprints, enabling identification of subtle contamination even in complex cultures [95].
This methodology enables rapid, automated contamination detection that reduces reliance on labor-intensive traditional techniques like microscopy and flow cytometry [95].
Cooled IR Optoacoustic Spectroscopy (CIROAS)
CIROAS addresses the fundamental challenge of water interference in infrared spectroscopy by exploiting the unique thermal properties of water [94]. The experimental protocol involves:
Theoretical Basis: The technique utilizes the temperature dependence of the optoacoustic signal, governed by the Grueneisen parameter (Γ). Water exhibits a unique thermal expansion coefficient (β) that becomes zero at 4°C, effectively muting its contribution to the optoacoustic signal at this temperature [94].
Experimental Setup: Prepare aqueous solutions containing target analytes (proteins, lipids, or glucose). Place samples in a temperature-controlled chamber capable of maintaining precisely 4°C. Utilize a pulsed laser source in the short-wavelength infrared region (900-1,900 nm) where biomolecules exhibit strong optoacoustic signals [94].
Data Collection: Record optoacoustic spectra at different temperatures, observing the signal reduction as samples approach 4°C. The signal polarity reverses below 4°C as the thermal expansion coefficient of water becomes negative [94].
Analysis: Analyze the temperature dependence of the optoacoustic signal, which varies with solute concentration according to Despretz law (ΔT = K·c, where K is the Despretz constant and c is solute concentration). This relationship enables quantification of solute concentration based on muting temperature shifts [94].
This method demonstrates marked sensitivity improvements for detecting proteins, lipids, and glucose in aqueous solutions compared to conventional optoacoustic or IR spectroscopy [94].
The following workflow diagram illustrates the key decision points when selecting and applying spectroscopic techniques to aqueous biological samples:
Essential Research Reagent Solutions
Successful spectroscopic analysis of biological matrices requires specific reagents and materials to address the challenges of aqueous environments. The following table details essential research tools for this field:
Table 3: Essential Research Reagents and Materials for Spectroscopic Analysis of Biological Matrices
| Reagent/Material | Function | Application Example |
|---|---|---|
| Microvolume Cuvettes | Enables analysis of small sample volumes (1-2 µL), preserving scarce materials | UV-vis analysis of nanoplastic suspensions [96] |
| Temperature-Controlled Chambers | Maintains precise sample temperature (e.g., 4°C for CIROAS) | Muting water contributions in optoacoustic spectroscopy [94] |
| Chemometric Software | Processes complex spectral data; multivariate analysis | PCA for contamination detection in microalgae [95] |
| Reference Standards | Calibration and method validation | Plant-based medicine quantification [98] |
| Specialized Buffers | Controls matrix effects; maintains physiological conditions | Biomolecular interaction studies [76] |
The strategic selection of spectroscopic techniques for analyzing biological matrices in aqueous environments requires a fundamental understanding of light-matter interactions and the specific challenges posed by these complex systems. Techniques such as UV-visible spectroscopy with machine learning integration and cooled IR optoacoustic spectroscopy demonstrate how innovative approaches can overcome traditional limitations posed by water interference and matrix effects. As spectroscopic technologies continue to evolve alongside advanced computational analysis, researchers will be better equipped to extract meaningful chemical information from even the most challenging biological samples, advancing drug development and biomedical research. The key to success lies in matching the fundamental strengths of each spectroscopic technique to the specific analytical challenge while implementing appropriate methodological adjustments to mitigate the inherent complexities of aqueous biological matrices.
The fundamental principle of spectroscopy hinges on the predictable ways light and matter interact [10]. When light—electromagnetic radiation—encounters a material, several key processes occur: absorption, where photons transfer energy to excite atoms or molecules to higher energy states; emission, where excited species return to lower states and release photons; and scattering, where light is redirected, sometimes with energy changes [99]. These interactions create a "spectral fingerprint," a unique pattern of absorbed, emitted, or scattered wavelengths that reveals the sample's molecular composition and structure [16].
However, modern spectroscopic techniques, especially when applied to complex biological or multicomponent mixtures, generate vast, intricate datasets where these chemical signatures are often subtle and overlapping [100] [101]. Interpreting this data requires sophisticated mathematical tools. This is the domain of chemometrics—the chemical discipline that uses mathematical and statistical methods to extract meaningful chemical information from analytical data [102] [100]. The integration of Machine Learning (ML) and Artificial Intelligence (AI) represents a paradigm shift in chemometrics, moving beyond classical linear models to powerful algorithms capable of automated feature extraction, nonlinear calibration, and handling of unstructured data like hyperspectral images [102] [103]. This guide explores these advanced data analysis frameworks, all built upon the foundational physical phenomena of light-matter interaction.
Foundational Concepts: From Spectra to Insights
Core Data Concepts in Chemometrics
Effective analysis of spectral data requires an understanding of a few key statistical concepts used to describe and relate variables (e.g., spectral intensities at different wavelengths) [100].
- Mean: The average intensity value for a specific wavelength across all measured spectra.
- Standard Deviation (SD): A measure of the spread or variability of the spectral intensities at a given wavelength.
- Variance: The square of the standard deviation, another measure of spread.
- Covariance: A measure of the linear association between the intensities at two different wavelengths. It indicates whether they increase or decrease together.
- Correlation: A unitless, scaled measure of the linear dependency between two spectral variables, ranging from -1 (perfect negative correlation) to +1 (perfect positive correlation) [100].
The Chemometrician's Toolkit: Essential Algorithms
The field of chemometrics employs a diverse set of algorithms, ranging from classical multivariate methods to modern machine learning techniques.
Table 1: Core Chemometric and Machine Learning Algorithms for Spectroscopy
| Algorithm Category | Key Examples | Primary Use in Spectroscopy | Key Advantages |
|---|---|---|---|
| Unsupervised Learning | Principal Component Analysis (PCA) | Exploratory analysis, outlier detection, dimensionality reduction | Identifies latent patterns and reduces data complexity without prior knowledge of sample classes [102] [100]. |
| Classical Supervised Calibration | Partial Least Squares (PLS) Regression | Quantitative calibration, predicting analyte concentration | Robust for collinear spectral data and when predictors are numerous and highly correlated [102] [103]. |
| Nonlinear Machine Learning | Random Forest (RF) | Classification (e.g., authentication), regression | Reduces overfitting, handles nonlinearities, provides feature importance rankings [102]. |
| Support Vector Machine (SVM) | Classification, nonlinear regression | Effective with limited samples and many wavelengths; uses kernels for nonlinear separation [102]. | |
| XGBoost | Classification, complex regression | High predictive accuracy for nonlinear relationships; computationally efficient [102]. | |
| Deep Learning | Convolutional Neural Networks (CNN) | Classification, feature extraction from raw spectra/images | Automates feature extraction, reduces need for rigorous preprocessing [102] [103]. |
Machine Learning and AI-Driven Methodologies
Machine Learning Paradigms in Spectroscopy
Modern ML techniques applied to spectroscopy fall into three main paradigms [102]:
- Supervised Learning: Models are trained on labeled data (e.g., spectra with known analyte concentrations or class memberships) to perform regression or classification tasks. Examples include PLS, SVM, and Random Forest.
- Unsupervised Learning: Algorithms discover latent structures in unlabeled data. PCA is the most common example, used for exploratory analysis and clustering.
- Reinforcement Learning: Though less common, this is being explored for adaptive calibration and autonomous spectral optimization, where an algorithm learns optimal actions by maximizing cumulative rewards in a dynamic environment.
Experimental Protocol: Building a Robust Spectroscopic Model
The following workflow outlines a standard methodology for developing and validating a chemometric or ML model for spectral analysis, integrating best practices from the literature [102] [100] [103].
Step 1: Data Collection and Preprocessing Raw spectral data is often contaminated with unwanted signals like noise, fluorescence backgrounds, and baseline shifts. Preprocessing is critical to enhance the discriminating features.
- Experimental Procedure:
- Acquire Spectra: Collect a representative set of spectra (e.g., using Raman, IR, or NIR spectrometers) with a sufficient sample size.
- Perform Baseline Correction: Apply algorithms (e.g., asymmetric least squares) to remove shifting baselines.
- Execute Scatter Correction: Use Standard Normal Variate (SNV) or Multiplicative Scatter Correction (MSC) to correct for light scattering effects.
- Smooth Data: Apply Savitzky-Golay or other smoothing filters to reduce high-frequency noise.
- Standardize Data: Use mean-centering or autoscaling to standardize the data, which is often crucial for many ML algorithms.
Step 2: Data Splitting To test the model's performance on unseen data and avoid overfitting, the dataset must be split.
- Experimental Procedure:
- Randomly divide the preprocessed dataset into a training set (typically 70-80%) and a test set (20-30%).
- The training set is used for model building and parameter tuning.
- The test set is held back and used only once for the final evaluation of the model's generalization ability.
Step 3: Model Training and Validation This is the core of the analytical process where the algorithm learns from the data.
- Experimental Procedure:
- Select Algorithm: Choose an appropriate algorithm based on the problem (e.g., PLS for quantitative analysis, Random Forest or CNN for classification).
- Hyperparameter Tuning: Use cross-validation on the training set (e.g., 5-fold or 10-fold cross-validation) to find the optimal model parameters (e.g., number of latent variables for PLS, number of trees for Random Forest, learning rate for XGBoost).
- Train Model: Train the final model using the entire training set and the optimized hyperparameters.
Step 4: Model Evaluation and Interpretation The final model is evaluated for its predictive power and interpretability.
- Experimental Procedure:
- Predict on Test Set: Use the finalized model to make predictions on the untouched test set.
- Calculate Performance Metrics: Determine metrics such as Root Mean Square Error (RMSE) for regression models or Accuracy, Precision, and Recall for classification models.
- Interpret Model: Use tools like variable importance plots (for Random Forest), coefficient plots (for PLS), or explainable AI (XAI) techniques like SHAP (for complex models like XGBoost and neural networks) to identify which wavelengths contribute most to the prediction, thereby preserving chemical interpretability [102].
The following diagram illustrates this structured workflow.
Advanced Applications and Visualization
Case Studies: AI and ML in Action
The theoretical framework of these algorithms is best understood through their practical, high-impact applications.
Biomedical Diagnostics with Raman Spectroscopy: Research has demonstrated the use of Raman spectroscopy combined with PCA and Linear Discriminant Analysis (LDA) to classify breast cancer tissue subtypes (Luminal A, Luminal B, etc.) with accuracy rates ranging from 70% to 100% for different subtypes [103]. The AI system in this context automated noise filtering and fluorescence background correction, showcasing a complete analytical pipeline from raw spectral acquisition to diagnostic decision-making.
Food and Beverage Authentication with FT-Raman and ML: A 2022 study used FT-Raman spectroscopy combined with Machine Learning to authenticate the trademark and geographical origin of fruit spirits. The optimized ML model achieved a classification accuracy of 96.2% for trademark identification, demonstrating the power of these techniques for non-invasive food authenticity testing [103].
Nonlinear Calibration with Deep Learning: In a comparison of a simple Convolutional Neural Network (CNN) against classical PLS for classifying vibrational spectroscopy data, the CNN significantly outperformed PLS on non-preprocessed data (86% vs. 62% accuracy). Even with preprocessed data, the CNN achieved a higher accuracy (96% vs. 89%), demonstrating that deep learning can reduce the dependency on meticulous data preprocessing while providing superior performance [103].
The Scientist's Toolkit: Key Reagents and Materials
Table 2: Essential Research Reagents and Tools for Spectroscopic Analysis
| Item / Solution | Function in Analysis |
|---|---|
| Standard Reference Materials | Used for instrument calibration and validation to ensure analytical accuracy and traceability [101]. |
| Chemometric Software Platforms (e.g., LabSpec 6) | Advanced software that provides integrated environments for performing multivariate data analysis and chemometrics on spectral data [104]. |
| Preprocessing Algorithms (SNV, MSC, Derivatives) | Mathematical reagents essential for correcting physical light artifacts (scatter) and enhancing chemical signal in raw spectra [100] [103]. |
| Synthetic Data (from Generative AI) | Used to augment limited experimental datasets, balance class distributions, and enhance the robustness of calibration models [102]. |
The Integrated Framework: From Light to Decision
The entire analytical journey, from the fundamental light-matter interaction to the final data-driven decision, can be visualized as an integrated framework. This showcases how raw physical phenomena are transformed through data processing into actionable scientific and business intelligence.
The synergy between the fundamental science of light-matter interaction and the advanced mathematics of machine learning and chemometrics has revolutionized analytical spectroscopy. While classical methods like PCA and PLS remain vital for foundational data exploration and linear calibration, the advent of AI-driven frameworks like Random Forest, XGBoost, and Deep Learning has unlocked new capabilities for analyzing complex, nonlinear systems with unprecedented accuracy and automation [102] [103]. As these technologies continue to evolve, particularly with the rise of explainable AI and generative models for data augmentation, their role in driving innovation across drug development, materials science, and clinical diagnostics will only become more profound, offering researchers a powerful toolkit to decode the information hidden within light.
Surface-enhanced Raman spectroscopy (SERS) represents a transformative advancement in vibrational spectroscopy, leveraging the unique properties of metallic and semiconductor nanomaterials to overcome the intrinsic sensitivity limitations of conventional Raman techniques. This technical guide explores the fundamental light-matter interactions that enable SERS, focusing specifically on how nanomaterial substrates generate exceptional signal-to-noise ratio (SNR) enhancements through localized surface plasmon resonance and charge transfer mechanisms. For researchers and drug development professionals, we provide detailed experimental protocols, quantitative performance data, and essential reagent solutions to facilitate implementation of these powerful analytical techniques. The strategic application of SERS substrates demonstrates remarkable capability in boosting SNR through electromagnetic and chemical enhancement pathways, enabling single-molecule detection and expanding analytical possibilities across physical, chemical, and biological research domains.
Spectroscopy fundamentally investigates how light and matter interact, providing critical information about material composition, structure, and dynamics. When light encounters matter, several key interactions can occur: absorption, where photons transfer energy to the material; emission, where materials release energy as photons; and scattering, where photons change direction, sometimes with altered energy [10]. These interactions produce characteristic spectral fingerprints that form the basis for material identification and analysis.
In conventional Raman spectroscopy, the inherent inefficiency of Raman scattering presents significant analytical challenges—approximately only 1 in 10⁷ incident photons undergoes inelastic Raman scattering [105]. This results in weak signals that often border on or fall below detection thresholds, particularly for nanomaterials and trace analyses. The signal-to-noise ratio (SNR) quantifies our ability to resolve a desired signal from background noise, with SNR values of approximately 3 considered minimally "visible" for distinguishing signals from noise [106].
Nanomaterial-enhanced spectroscopy strategically overcomes these limitations by engineering substrates that dramatically amplify the fundamental light-matter interactions. Through precise nanoscale structural design, these substrates create localized electromagnetic hotspots and facilitate charge transfer processes that intensify Raman scattering signals by factors ranging from 10³ to 10⁸, effectively transforming SNR from a limiting factor into an enabling advantage [107] [105].
Fundamental Enhancement Mechanisms
Electromagnetic Enhancement
The primary amplification mechanism in SERS originates from the localized surface plasmon resonance (LSPR) exhibited by metallic nanoparticles, particularly silver, gold, and copper [107] [105]. When incident light frequency matches the collective oscillation frequency of conduction electrons in these nanomaterials, a resonant enhancement of the local electromagnetic field occurs.
Key characteristics of electromagnetic enhancement:
- Field Amplification: Metallic nanostructures with specific roughness features act as optical antennas, concentrating incident electromagnetic fields into nanoscale volumes, creating "hotspots" where Raman signals can be enhanced by factors up to 10⁸ [107] [105].
- Distance Dependence: Enhancement effects decay rapidly with distance from the nanoparticle surface (approximately with r⁻¹² dependence for Raman signals), requiring analyte molecules to be positioned within nanometers of the enhancing surface [105].
- Material and Morphology Dependence: Enhancement factors strongly depend on nanoparticle composition, size, shape, and arrangement. Aggregated nanospheres and nanoshells often produce significantly greater enhancement than isolated particles due to coupled plasmon resonances [105].
Chemical Enhancement
The chemical enhancement mechanism involves electronic interactions between the analyte molecules and the substrate surface, typically enhancing signals by factors of 10-10³ [105]. This mechanism operates through several pathways:
- Charge-Transfer Complexes: When molecules adsorb to metal surfaces, their electronic states can hybridize with metal states, creating new electronic transitions that resonate with incident light [105].
- Resonance Effects: The formation of adsorbate-surface complexes can lower the energy required for electronic transitions, enabling resonance Raman conditions that selectively enhance specific vibrational modes [107].
Table: Comparison of SERS Enhancement Mechanisms
| Characteristic | Electromagnetic Enhancement | Chemical Enhancement |
|---|---|---|
| Enhancement Factor | 10⁴-10⁸ | 10-10³ |
| Range Dependence | Long-range (~30 nm) | Short-range (<1 nm) |
| Material Dependence | Noble metals (Ag, Au, Cu) | Metals and semiconductors |
| Substrate Requirement | Nanoscale roughness | Chemical adsorption sites |
| Specificity | Universal for nearby molecules | Molecule-specific |
| Theoretical Understanding | Well-established | Not fully understood |
Nanomaterial Substrates for SERS
Metallic Nanostructures
Metallic nanoparticles provide the most effective SERS substrates due to their strong plasmonic responses. Gold and silver nanoparticles typically yield the highest enhancement factors, with silver often demonstrating superior performance but gold offering better biocompatibility and chemical stability [107] [105].
Synthesis and Functionalization:
- Colloidal Nanoparticles: Solution-based synthesis allows controlled size and shape tuning, with spherical nanoparticles (~30-100 nm) optimized for specific laser excitation wavelengths [105].
- Aggregated Nanospheres: Intentional aggregation induced by salts like NaCl creates interparticle "hotspots" that dramatically enhance signals compared to isolated particles [105].
- Nanoshells: Dielectric-core metallic-shell structures enable precise tuning of plasmon resonances into biological tissue optical windows (650-900 nm) for biomedical applications [105].
Semiconductor Substrates
Semiconductor materials including metal oxides and chalcogenides offer alternative SERS substrates with complementary enhancement mechanisms [107]. While generally providing lower enhancement factors than metallic substrates, semiconductor platforms enable photoinduced charge transfer processes that can yield valuable chemical information about molecule-substrate interactions.
Hybrid Nanomaterials
Advanced hybrid structures combining metallic and semiconductor components leverage both electromagnetic and charge-transfer enhancement mechanisms [107]. These systems can be engineered to create synergistic effects, such as plasmon-mediated resonance energy transfer, further boosting SNR while providing additional analytical dimensions through stimulus-responsive behavior.
Quantitative SNR Enhancement Data
The effectiveness of nanomaterial-enhanced spectroscopy is quantitatively demonstrated through measurable improvements in signal-to-noise ratios across various experimental configurations.
Table: Quantitative SNR Enhancements in Nanomaterial-Enhanced Spectroscopy
| Nanomaterial System | Enhancement Factor | Application Context | Key Performance Metrics |
|---|---|---|---|
| Roughened Ag Surfaces | 10³-10⁸ [105] | General SERS substrate | Baseline enhancement for adsorbed molecules |
| Single Au Nanospheres (30nm) | Moderate [105] | Single-particle SERS | Excitation at 514.5nm near absorption peak (517nm) |
| Aggregated Au Nanospheres | Significant increase vs single [105] | Colloid aggregation SERS | NaCl-induced aggregation creates hotspots |
| Paramagnetic PFC Nanoemulsions | 3-5× SNR increase [106] | ¹⁹F MRI | Fe³⁺ complex with β-diketone functionalized PFC |
| Tip-Enhanced Raman Spectroscopy | >2500× signal amplification [105] | Nano-Raman imaging | <15nm spatial resolution |
| Iron Oxide Nanoparticles | <5% concentration error [108] | Diffuse reflectance spectroscopy | Real-time monitoring in tissue models |
SNR Optimization Strategies:
- Signal Averaging: Multiple acquisitions improve SNR by reducing random noise components, though this increases total measurement time [106].
- Paramagnetic Enhancement: Incorporation of paramagnetic metal atoms (Gd³⁺, Fe³⁺, Mn²⁺) shortens longitudinal relaxation time (T₁), enabling more acquisitions within fixed timeframes while potentially compromising signal through T₂ shortening effects [106].
- Molecule-Substrate Optimization: Molecules with carbon double bonds, nitrogen, sulfur, or benzene structures often yield higher Raman intensities when adsorbed to enhancing substrates [105].
Experimental Protocols
Standard SERS Substrate Preparation
Materials Required:
- Gold or silver nanoparticle colloid (e.g., 30-60nm diameter)
- Analyte molecules in appropriate solvent
- Salt solution (e.g., NaCl, 1mM) for controlled aggregation
- Silicon or glass substrate for deposition
- Centrifuge for nanoparticle concentration
Procedure:
- Substrate Cleaning: Sonicate silicon/glass substrates in acetone, isopropanol, and deionized water (10 minutes each), then treat with oxygen plasma for 5 minutes to ensure clean, hydrophilic surfaces.
- Nanoparticle Deposition: Incubate cleaned substrates in concentrated nanoparticle solution for 2-12 hours to form a monolayer through self-assembly, optimizing surface density for maximum enhancement.
- Analyte Adsorption: Immerse nanoparticle-functionalized substrates in analyte solution (typically 1µM-1mM concentration) for 1-24 hours, depending on adsorption kinetics.
- Controlled Aggregation (if required): For colloid-based SERS, add salt solution (final concentration 0.1-10mM) to induce controlled nanoparticle aggregation, monitoring color change indicating plasmon coupling.
- Rinsing and Drying: Gently rinse substrates with appropriate solvent to remove unbound analyte, then dry under nitrogen stream to prevent contamination and nanoparticle rearrangement.
Real-Time Nanoparticle Concentration Monitoring
This protocol adapts diffuse reflectance spectroscopy for quantifying nanoparticle concentrations in biological tissue models using a simplified two-wavelength approach [108].
Materials Required:
- Standard or low-cost spectroscopy platform (530nm and 630nm LEDs)
- Fiber optic probe (illumination and collection fibers)
- Tissue-mimicking phantoms or ex vivo tissue samples
- Iron oxide nanoparticles (0-20µg/ml concentration range)
- Calibration standards with known optical properties
Procedure:
- System Calibration: Measure dark current and reference standard reflectance to establish baseline instrument response, ensuring linear detection across expected signal range.
- Baseline Measurement: Acquire diffuse reflectance spectra (Rbaseline) of tissue samples before nanoparticle introduction at both 530nm (absorption-dominant, λa) and 630nm (scattering-dominant, λs) wavelengths.
- Nanoparticle Introduction: Introduce nanoparticles at biologically relevant concentrations (0-20µg/ml) through injection, perfusion, or mixing with tissue phantoms.
- Post-Injection Monitoring: Measure diffuse reflectance (Rnano) at the same wavelength pairs immediately after nanoparticle introduction and at regular time intervals.
- Concentration Calculation: Apply the derived spectroscopic model to calculate nanoparticle concentrations in near real-time:
- Validation: Compare optically determined concentrations with known administered doses or independent measurement techniques to verify accuracy, typically achieving <5% error with proper calibration [108].
Research Reagent Solutions
Successful implementation of nanomaterial-enhanced spectroscopy requires specific materials and reagents optimized for each application context.
Table: Essential Research Reagents for Nanomaterial-Enhanced Spectroscopy
| Reagent Category | Specific Examples | Function and Application Notes |
|---|---|---|
| Plasmonic Nanoparticles | 30-60nm Au colloid, Ag nanocubes, Au/Ag nanoshells | Primary enhancing substrates; size, shape, and composition tune plasmon resonance [105] |
| Semiconductor Substrates | TiO₂ nanoparticles, ZnO nanowires, MoS₂ flakes | Charge-transfer enhancement; complementary to metallic substrates [107] |
| Paramagnetic Additives | Gd³⁺, Fe³⁺, Mn²⁺ complexes | T₁ reduction agents for increased acquisition rates in MRI applications [106] |
| Surface Functionalization | Thiol-PEG compounds, silane coupling agents | Improve nanoparticle stability and specific analyte adsorption [107] |
| Calibration Standards | Rhodamine 6G, crystal violet, benzenethiol | Well-characterized SERS references for system validation [105] |
| Biological Compatible PFCs | Perfluoro-15-crown-5-ether (PFCE) | ¹⁹F MRI agents with identical fluorine atoms minimizing chemical shift artifacts [106] |
| Tissue Phantom Materials | Lipids, hemoglobin, intralipid suspensions | Mimic tissue optical properties for method validation [108] |
Advanced Techniques and Applications
Tip-Enhanced Raman Spectroscopy (TERS)
TERS represents the cutting edge of nanomaterial-enhanced spectroscopy by combining scanning probe microscopy with plasmonic enhancement, achieving exceptional spatial resolution below 15nm [105]. This technique utilizes a sharp, laser-illuminated metal tip (typically gold or silver) held at constant height (~2nm) above the sample surface using a tuning-fork feedback mechanism. The tip acts as a nanoscale "light source" creating intense electromagnetic confinement at its apex, enabling signal amplifications exceeding 2500× compared to conventional Raman measurements while maintaining nanoscale spatial resolution [105].
Biomedical Implementation
Nanomaterial-enhanced spectroscopy has demonstrated particular utility in biomedical contexts, enabling real-time monitoring of nanoparticle delivery in biological tissue models with high accuracy (<5% error) using simplified optical approaches [108]. The development of low-cost compact spectroscopy devices utilizing specific wavelength pairs (530nm and 630nm) facilitates point-of-care monitoring of nanoparticle concentrations in tissue-mimicking phantoms and ex vivo samples, significantly advancing translational nanomedicine applications in cancer research and targeted drug delivery [108].
Visualizations
SERS Enhancement Mechanisms
Experimental Workflow for SERS
Nanomaterial-enhanced spectroscopy represents a paradigm shift in analytical science, fundamentally transforming the signal-to-noise ratio limitations that have historically constrained conventional spectroscopic methods. Through precisely engineered nanostructures that amplify intrinsic light-matter interactions, these approaches enable unprecedented detection sensitivity down to single-molecule levels. The continuing refinement of metallic, semiconductor, and hybrid substrates promises further advancements in SNR capabilities while expanding application domains across materials characterization, biomedical research, and pharmaceutical development. As theoretical understanding deepens and nanofabrication techniques evolve, nanomaterial-enhanced spectroscopy will increasingly become an indispensable tool in the researcher's analytical toolkit, pushing detection boundaries and unlocking new possibilities for scientific discovery.
Terahertz (THz) spectroscopy operates within the 0.1–10 THz region of the electromagnetic spectrum (3–333 cm⁻¹), residing between microwave and infrared radiation [109]. This positioning is significant for investigating solid dosage forms because the low-energy photons (approximately 4 meV) generated are non-ionizing and inherently sensitive to the weak collective forces that govern the solid-state structure of pharmaceuticals [110] [109]. Unlike mid-infrared or Raman spectroscopy, which primarily probe intramolecular covalent bonds, THz radiation directly excites intermolecular vibrations, such as hydrogen bonding, van der Waals forces, and crystalline phonon modes [110] [111]. When a pulsed THz wave interacts with a molecular crystal, the electric field of the light induces motions of entire molecules relative to one another. The resulting time-domain waveform, which records both the amplitude and phase of the transmitted or reflected pulse, captures a unique fingerprint of the crystal's lattice dynamics [110] [112]. This physical signature provides a powerful, non-destructive means to characterize critical quality attributes of solid dosage forms, including polymorph identity, crystallinity, and coating structure, directly impacting drug performance, stability, and bioavailability [110] [113].
Fundamental Principles of Light-Matter Interaction in the Terahertz Regime
The interaction between THz light and pharmaceutical solids is fundamentally different from that observed in higher-energy spectroscopic methods. The core mechanism involves the excitation of low-frequency lattice vibrations [110]. In a crystalline solid, molecules are arranged in a periodic lattice, and they can undergo collective oscillatory motions around their equilibrium positions. The energies of these correlated motions—including torsion, rotation, and translation—fall precisely within the THz frequency range [114] [112].
The ability of a crystal to absorb THz radiation at specific frequencies is a direct consequence of its unique spatial arrangement and the intermolecular forces that maintain this arrangement. For instance, different polymorphs of the same active pharmaceutical ingredient (API), such as carbamazepine or sulfathiazole, exhibit distinct THz absorption spectra because their different crystal packings create different potential energy landscapes for lattice vibrations [110] [114]. This principle is illustrated in the following workflow for a typical THz-TDS transmission measurement.
Figure 1: Terahertz Time-Domain Spectroscopy (THz-TDS) Workflow. A femtosecond laser beam is split into a pump beam (red) that generates a THz pulse and a probe beam (blue) that gates the detector. The THz pulse interacts with the sample, and the resulting waveform is Fourier-transformed to yield the absorption spectrum [110] [109].
A critical manifestation of these interactions is the stark contrast between the spectra of crystalline and amorphous materials. Crystalline APIs display sharp, characteristic absorption peaks due to their long-range order and well-defined phonon modes [110]. In contrast, amorphous solids, which lack this periodicity, typically exhibit broad, featureless absorption spectra that increase monotonically with frequency [110] [114]. This difference forms the basis for qualitative identification and quantitative analysis of solid-state forms within dosage forms.
Technical Methodologies and Experimental Protocols
Core Spectroscopic Techniques: TPS and TPI
Two primary techniques constitute most pharmaceutical THz applications: Terahertz Pulsed Spectroscopy (TPS) and Terahertz Pulsed Imaging (TPI). Both are built around the same core technology of a photoconductive antenna gated by a femtosecond laser but are configured for different analytical purposes [110].
Terahertz Pulsed Spectroscopy (TPS) is primarily used to acquire physical and chemical information from a bulk sample or a specific spot. As shown in Figure 1, it measures the changes in a THz pulse after transmission through (or reflection from) a sample. The direct measurement of the electric field's amplitude and phase allows for the simultaneous calculation of the absorption coefficient and refractive index without relying on the Kramers-Kronig relationships [110] [109]. A typical experimental protocol for a transmission TPS measurement involves:
- Sample Preparation: For APIs in powder form, the sample may be diluted in an inert matrix like polyethylene (PE) and compressed into a pellet. Intact tablets can often be analyzed directly with minimal preparation [115] [116].
- Data Acquisition: A time-domain waveform is acquired for both the sample and a reference (e.g., empty chamber or pure PE pellet). Each waveform measurement can be very fast, with acquisition times as low as 30 ms [110].
- Data Processing: The sample and reference waveforms are Fourier-transformed to the frequency domain. The complex transmission/reflection function is calculated, from which the optical parameters of the sample are derived [109].
Terahertz Pulsed Imaging (TPI) extends this principle to create 2D or 3D spatial maps. It operates in reflection mode, utilizing the time-delay between pulses reflected from different interfaces within a sample (e.g., the air/coating and coating/core interfaces of a tablet) to resolve depth information [110].
- Imaging Protocol: The sample is raster-scanned point-by-point, and a full time-domain waveform is collected at each pixel [110].
- Data Processing: The time-domain data for each pixel is analyzed to extract parameters like layer thickness or spectral features. 3D models of the sample's internal structure can be reconstructed from this data, as shown in studies of trilayered tablets [110].
- Chemical Imaging: Furthermore, by applying a Fourier transform to the waveform at each pixel, a fourth dimension (frequency) is added, enabling the creation of chemical maps based on spectral fingerprints at specific THz frequencies [110].
The Scientist's Toolkit: Essential Research Reagent Solutions
Successful application of THz spectroscopy in pharmaceutical analysis relies on a set of key materials and computational tools.
Table 1: Key Research Reagents and Materials for THz Pharmaceutical Analysis
| Item | Function & Application | Example Usage |
|---|---|---|
| Polyethylene (PE) Matrix | A transparent, inert medium for diluting strongly absorbing APIs; allows pellet preparation for transmission TPS [115]. | Creating 10-20% w/w API/PE mixtures for polymorph quantification studies [115]. |
| Reference Drugs (Polymorphs) | High-purity, well-characterized crystalline standards for building spectral libraries and calibration models [110] [114]. | Used as references to identify polymorphic forms in unknown samples (e.g., Carbamazepine Forms I and III) [114]. |
| Blister Packaging Materials | Transparent polymers (e.g., polyethylene) used to demonstrate non-destructive, through-package analysis [110]. | Enables quality control testing of tablets without removing them from their packaging [110]. |
| Density Functional Theory (DFT) Software | Computational tool for modeling crystal lattices and simulating their low-frequency vibrational spectra [111] [112]. | Assigning observed THz absorption peaks to specific intermolecular vibrations in a crystal lattice [111]. |
Key Pharmaceutical Applications and Quantitative Data
Polymorph Identification and Quantification
Polymorphism is a critical issue in pharmaceutical development, as different crystal forms can possess different bioavailability, stability, and processability. THz spectroscopy is an excellent tool for differentiating and quantifying polymorphs due to its direct sensitivity to the crystal lattice [110] [114]. A seminal study by Strachan et al. (2005) demonstrated this capability on several systems [114]. The following table summarizes quantitative data from such studies.
Table 2: Quantitative Analysis of Solid-State Forms Using Terahertz Pulsed Spectroscopy
| API / System | Solid-State Forms Analyzed | Analytical Goal | Limit of Detection (LOD) | Key Quantitative Finding |
|---|---|---|---|---|
| Carbamazepine [114] | Polymorphs (Forms I & III) | Quantification of one polymorph in the other | ~1.80% | LOD as low as 1.80% w/w in binary mixtures. |
| Indomethacin [114] | Crystalline vs. Amorphous | Degree of crystallinity | ~1.05% | LOD for crystallinity in an amorphous background was 1.05%. |
| Fenoprofen Calcium [114] | Crystalline vs. Liquid Crystal | Quantification of liquid crystalline form | Not Specified | Successful quantification of liquid crystalline content in mixtures. |
| Norfloxacin [116] | Crystalline in Paper Tablets | Detection of crystallinity after wet granulation | Superior to XRD | THz-TDS detected minor crystallinity changes post-granulation that XRD could not. |
The process of using THz spectroscopy for quantitative analysis typically involves chemometric techniques, as shown in the following workflow for quantifying polymorphic impurities.
Figure 2: Workflow for Quantitative Analysis of Polymorphs. A calibration set of known mixtures is used to build a predictive model, typically using Partial Least Squares (PLS) regression, which can then quantify unknown samples [115] [114].
Coating and Dosage Form Imaging
TPI provides a unique, non-destructive method for analyzing the internal structure of solid dosage forms. A major application is the measurement of coating thickness and uniformity on pharmaceutical tablets [110] [113]. The principle relies on the time-of-flight measurement of the THz pulse: the time delay between the reflection from the coating surface and the coating-core interface is directly proportional to the coating thickness, given the refractive index of the coating material [110]. This allows for rapid (a single waveform can be acquired in less than 20 ms), high-resolution mapping of the entire tablet surface, generating detailed 2D and 3D images of coating thickness that are invaluable for quality control and process optimization [110].
Monitoring Dynamic Processes
The rapid acquisition speed of THz-TDS makes it suitable for monitoring dynamic solid-state transformations in real-time. A landmark study demonstrated its use in quantitatively monitoring mechanochemical cocrystal formation [112]. By tracking the disappearance of reactant peaks (phenazine and mesaconic acid) and the emergence of new cocrystal peaks in the THz spectrum during grinding, researchers were able to monitor the reaction progress without stopping the process or invasive sampling [112]. This application highlights the potential of THz spectroscopy as a powerful Process Analytical Technology (PAT) tool for guiding and controlling pharmaceutical manufacturing processes.
Comparative Advantages and Validation
The value of THz spectroscopy is clearest when compared to established techniques. For instance, in a 2023 study on norfloxacin-loaded paper tablets, THz-TDS provided a "more straightforward crystallinity assessment than XRD" and was able to detect minor crystallinity changes induced by wet granulation that were not detectable by XRD, the traditional gold standard [116]. This underscores THz spectroscopy's superior sensitivity to certain types of long-range order.
Its key advantages include:
- Non-destructiveness: Allows for analysis of intact dosage forms, enabling further testing on the same sample [110] [116].
- Minimal Sample Preparation: Intact tablets can often be analyzed directly [110].
- Through-Package Analysis: Ability to probe samples through plastic blister packs, ideal for in-line PAT applications [110].
- 3D Chemical Imaging: Unique capability to probe subsurface features and internal layer composition not possible with surface-sensitive techniques like Raman or IR [110].
- Sensitivity to Lattice Dynamics: Direct probing of intermolecular vibrations provides information complementary to the structural snapshot provided by XRD [111] [112].
Terahertz spectroscopy has firmly established itself as a powerful analytical technique for the investigation of solid dosage forms. By exploiting the fundamental interaction between low-energy light and the phonon modes of crystalline lattices, it provides unique insight into the intermolecular forces that dictate critical pharmaceutical properties. Its capabilities in polymorph identification and quantification, coating analysis, and real-time process monitoring offer significant advantages for drug development and quality control. As the technology continues to mature, with ongoing improvements in instrumentation, data analysis, and theoretical modeling, its role in ensuring the safety, efficacy, and quality of pharmaceutical products is poised to expand further, bridging the gap between fundamental molecular-level understanding and industrial application.
Technique Validation and Selection: Ensuring Regulatory Compliance and Analytical Precision
Spectroscopy is fundamentally the study of how light interacts with matter [10]. When light, or electromagnetic radiation, encounters a material, several specific interactions can occur: it may be absorbed, reflected, or transmitted [10]. The particular wavelengths of light that a molecule absorbs or emits provide a distinctive fingerprint, enabling the identification of chemical structures and the quantification of substance concentration [10].
The analytical performance of any spectroscopic technique is governed by the nature of these light-matter interactions. Sensitivity is determined by how efficiently a material absorbs light and how effectively the instrument can detect these absorption events, particularly at low concentrations [117]. Specificity arises because different chemical bonds and molecular structures interact with light at characteristically different wavelengths and energies, allowing one substance to be distinguished from another in a complex mixture [21] [10]. This guide provides a technical comparison of major spectroscopic techniques based on these core principles, with a special focus on applications in pharmaceutical research and drug development.
Comparative Performance Analysis of Spectroscopic Techniques
The following matrix summarizes the key performance characteristics and operational requirements of prevalent spectroscopic methods used in pharmaceutical and biopharmaceutical applications. Data is synthesized from current literature, instrument specifications, and application notes [21] [117] [118].
Table 1: Performance and Operational Comparison of Spectroscopic Techniques
| Technique | Typical Sensitivity Range | Key Specificity Drivers | Pharmaceutical Application Examples |
|---|---|---|---|
| ICP-MS | sub-ppb to ppt [21] | Elemental mass-to-charge ratio [21] | Trace metal analysis in biologics; metal speciation in cell culture media [21] |
| NMR Spectroscopy | μM to mM [21] | Molecular structure & nuclear spin environment [21] | Protein higher-order structure analysis; protein-excipient interactions [21] |
| Raman Spectroscopy | Varies with enhancement (e.g., SERS) [119] | Molecular vibrational fingerprint [21] [119] | Real-time monitoring of product aggregation in bioprocessing [21] |
| FT-IR Spectroscopy | Varies with technique | Molecular vibrational fingerprint [21] | Drug stability studies; secondary protein structure analysis [21] |
| UV-Vis Spectroscopy | nM to μM [21] | Electronic transitions in chromophores [21] | Protein A affinity chromatography monitoring in mAb purification [21] |
| Fluorescence Spectroscopy | pM to nM (single-molecule possible) [21] | Excitation/Emission spectra of fluorophores [21] | In-vial protein denaturation monitoring; high-producing strain screening [21] |
Table 2: Operational and Workflow Requirements
| Technique | Sample Preparation Complexity | Analysis Speed | Primary Operational Costs |
|---|---|---|---|
| ICP-MS | High (digestion, dilution) [21] | Fast | High capital investment; high-purity gases [21] |
| NMR Spectroscopy | Low to Moderate | Slow to Moderate | Very high capital investment; cryogens [118] |
| Raman Spectroscopy | Low (often non-destructive) [119] | Fast (especially with automation) [21] | High capital investment for advanced systems [118] |
| FT-IR Spectroscopy | Low to Moderate | Fast | Moderate capital investment [118] |
| UV-Vis Spectroscopy | Low | Very Fast | Low capital investment [118] |
| Fluorescence Spectroscopy | Low to Moderate | Fast | Low to moderate capital investment [118] |
Experimental Protocols for Key Techniques
Protocol: iMRM Mass Spectrometry for Thyroglobulin Quantification
This protocol for a targeted mass spectrometry assay exemplifies a method designed for high specificity and sensitivity in a complex clinical matrix [120].
- Sample Preparation: Serum samples are aliquoted. Internal standards (stable isotope-labeled thyroglobulin or signature peptides) are added to account for sample preparation variability and ionization efficiency [120].
- Immunoaffinity Enrichment: Peptide-specific antibodies are used to selectively capture tryptic peptides derived from thyroglobulin. This critical step enhances sensitivity and specificity by isolating target analytes from the complex serum matrix and mitigating interference from autoantibodies [120].
- Liquid Chromatography (LC): The enriched peptide mixture is separated using a reversed-phase LC column. This step reduces ion suppression by separating the target peptides from other co-eluting substances [120].
- Multiple Reaction Monitoring (MRM) Mass Spectrometry: The eluting peptides are ionized and introduced into the triple quadrupole mass spectrometer.
- Q1: Selects the precursor ion (the specific peptide of interest).
- Q2 (Collision Cell): Fragments the precursor ion.
- Q3: Selects a characteristic fragment ion. This two-stage mass selection provides exceptional specificity. Quantification is achieved by integrating the chromatographic peak areas of the target peptides and comparing them to a calibration curve prepared with external standards [120].
- Quality Control: CLIA-compliant workflows require rigorous quality control, including calibration verification, control samples, and participation in proficiency testing programs to ensure accuracy and reproducibility [120].
Protocol: Inline Raman Spectroscopy for Bioprocess Monitoring
This protocol highlights the use of spectroscopy for real-time, non-destructive monitoring [21].
- Calibration and Chemometric Modeling: A calibration model is developed using a set of samples with known concentrations of critical components (e.g., nutrients, metabolites). This model correlates spectral features with reference analytical data [21].
- Probe Sterilization and Installation: A robust, sterilizable Raman probe is inserted directly into the bioreactor [21].
- Inline Measurement: The laser is directed through the probe onto the sample. The scattered Raman light is collected by the probe and transmitted to the spectrometer. This process is continuous or performed at frequent intervals (e.g., every 38 seconds) [21].
- Data Processing and Modeling: Acquired spectra are processed (e.g., for noise reduction, background subtraction) and analyzed using the pre-developed chemometric model to predict component concentrations in real-time [21].
- Automation and Control: The output can be integrated into a process control system to maintain optimal culture conditions or trigger interventions based on the measured parameters [21].
Visualizing Light-Matter Interactions and Experimental Workflows
Fundamentals of Light-Matter Interaction in Spectroscopy
The following diagram illustrates the core physical processes that underpin all spectroscopic techniques, from absorption to emission.
Workflow for a Targeted MS-Based Clinical Assay
This workflow details the stringent, multi-stage process for developing and running a clinical-grade mass spectrometry assay, such as the thyroglobulin iMRM test.
The Scientist's Toolkit: Essential Research Reagents and Materials
The reliability of spectroscopic analysis depends on the quality and consistency of reagents and materials used.
Table 3: Essential Reagents and Materials for Spectroscopic Analysis
| Item | Function | Technical Considerations |
|---|---|---|
| Stable Isotope-Labeled Internal Standards | Quantification in MS; corrects for sample prep losses and ion suppression [120]. | Essential for CLIA-compliant MS assays; must be chromatographically separated from native analyte. |
| Peptide-Specific Antibodies | Immunoaffinity enrichment of target peptides in iMRM assays [120]. | Enhances sensitivity and specificity by reducing matrix interference. |
| Certified Reference Materials | Instrument calibration and method validation [120]. | Provides traceability and ensures analytical accuracy. |
| Mobile Phase Solvents (LC-MS Grade) | Liquid chromatography elution [120]. | High purity is critical to minimize background noise and maintain instrument performance. |
| Quality Control (QC) Materials | Monitoring assay precision and accuracy during analysis [120]. | Used to construct control charts; essential for clinical lab quality management. |
| Raman Probes (Sterilizable) | For inline monitoring of bioprocesses [21]. | Must be compatible with steam-in-place (SIP) sterilization and designed for robust operation in bioreactors. |
The fundamental principles of light-matter interactions form the bedrock of modern pharmaceutical analysis. When light interacts with a molecule, the resulting absorption, emission, or scattering provides a characteristic fingerprint that can be used to identify substances and determine their concentration [121]. These predictable interactions, governed by the energy transitions of electrons and the vibrational states of molecular bonds, enable spectroscopic techniques to deliver rapid, non-destructive insights into the composition and structure of pharmaceutical substances [10]. However, for these analytical methods to be trusted for the release of medicines to the public, they must undergo a rigorous validation process to prove their reliability. The ICH Q2(R1) guideline provides the internationally accepted framework for this validation, ensuring that analytical procedures based on light-matter interactions are scientifically sound and fit for their intended purpose in the pharmaceutical industry [122].
Fundamental Spectroscopy: How Light Interacts with Matter
The Electromagnetic Spectrum and Molecular Phenomena
Light-matter interactions are associated with specific atomic or molecular-scale phenomena depending on the energy of the incident photons. The analytical signals produced provide two key types of information: chemical structure (via the spectral position of the signal) and quantity (via the signal amplitude) [121]. The table below summarizes these interactions across the electromagnetic spectrum.
Table 1: Light-Matter Interactions Across the Electromagnetic Spectrum
| Spectral Regime | Wavelength Range | Frequency Range | Primary Molecular Phenomena | Common Analytical Techniques |
|---|---|---|---|---|
| X-ray | 0.1 nm – 100 nm | 3×10⁶ – 3×10³ THz | Electron excitation, ionization | X-ray absorption, X-ray fluorescence |
| UV/Visible | 100 nm – 1 µm | 3×10³ – 300 THz | Electronic transitions in chromophores | UV-Vis Spectroscopy, Fluorescence |
| Infrared | 1 µm – 30 µm | 300 – 10 THz | Molecular vibrations (normal & overtone) | FTIR, NIR, ATR-FTIR |
| Terahertz | 30 µm – 3000 µm | 10 – 0.1 THz | Intermolecular bond vibrations | Terahertz Spectroscopy |
| Microwave | 3 mm – 300 mm | 0.1 – 0.001 THz | Molecular rotations | Microwave Spectroscopy |
Key Interaction Mechanisms
The primary mechanisms by which light interacts with matter in pharmaceutical analysis include:
- Absorption: Occurs when a photon's energy matches the energy difference between two molecular or atomic states (e.g., electronic, vibrational). The measured transmission is plotted as a function of wavelength to yield a spectrum containing molecular fingerprints of all species exhibiting a dipole moment [121].
- Emission: Processes like fluorescence involve photon absorption followed by emission after the atom or molecule undergoes non-radiative internal energy conversion (typically on pico- to microsecond timescales) [121].
- Scattering: An instantaneous process (within femtoseconds) where the direction or energy of photons changes upon interaction with a polarizable molecule. Elastic scattering is called Rayleigh or Mie scattering, while inelastic scattering is referred to as Raman scattering [121].
Figure 1: Fundamental light-matter interaction pathways relevant to pharmaceutical analysis.
ICH Q2(R1) Validation Framework for Analytical Procedures
Objective and Scope
The ICH Q2(R1) guideline, titled "Validation of Analytical Procedures: Text and Methodology," provides a unified framework for the validation of analytical methods used in pharmaceutical registration applications [122]. The primary objective of analytical procedure validation is to demonstrate that the procedure is fit for its intended purpose [123]. This guideline applies specifically to analytical procedures used for the release and stability testing of commercial drug substances and products, and it can be extended to other procedures within the control strategy following a risk-based approach [123].
Validation Characteristics and Acceptance Criteria
The guideline describes various validation parameters that must be considered based on the type of analytical procedure. These characteristics ensure that methods based on light-matter interactions produce reliable, accurate, and reproducible results.
Table 2: ICH Q2(R1) Validation Characteristics for Spectroscopic Methods
| Validation Characteristic | Definition | Typical Validation Approach for Spectroscopy |
|---|---|---|
| Specificity/Selectivity | Ability to assess analyte in presence of expected impurities | Verify unique spectral signature; spike with impurities |
| Accuracy | Closeness to true value | Comparison with reference standard; spike recovery (80-120%) |
| Precision | Closeness of series of measurements | Repeatability (multiple prep.), Intermediate Precision (different days) |
| Linearity | Direct proportional relationship | Calibration curve with 5+ concentrations (r² > 0.998) |
| Range | Interval between upper and lower levels | Concentrations with acceptable precision, accuracy, linearity |
| Detection Limit (LOD) | Lowest detectable amount | Signal-to-noise (3:1) or standard deviation of blank |
| Quantification Limit (LOQ) | Lowest quantifiable amount | Signal-to-noise (10:1) or standard deviation of response/slope |
| Robustness | Capacity to remain unaffected by small parameter changes | Deliberate variations (wavelength, pathlength, temp) |
Method Selection and Experimental Protocols
Selecting the Appropriate Spectroscopic Technique
Choosing the right spectroscopic method requires careful consideration of multiple factors to ensure the technique matches the analytical requirement [121]:
- Nature of the Analyte: Whether the compound is organic or inorganic, small or large molecule, and its physical state (solid, liquid, gas). Some compounds may degrade under light, heat, or air exposure.
- Type of Analysis Required: Qualitative identification, quantitative determination, structural analysis, or purity/impurity analysis.
- Sensitivity and Detection Limits: The method must be sufficiently sensitive to detect the analyte at the required concentration (from bulk content to trace ppm or ppb levels).
- Sample Preparation Requirements: Some techniques require extensive preparation, while others can be applied inline with a production process.
- Regulatory Compliance: Methods must comply with pharmacopeial standards and be validatable per ICH Q2(R1) guidelines.
Detailed Experimental Protocol: Quantitative Analysis via UV-Vis Spectroscopy
Objective: To validate a UV-Vis spectroscopic method for the quantification of an active pharmaceutical ingredient (API) in a solution, according to ICH Q2(R1) guidelines.
Materials and Equipment:
- Double-beam UV-Vis spectrophotometer with matched quartz cuvettes
- Certified reference standard of the API
- Appropriate solvent of spectroscopic grade
- Volumetric flasks, pipettes, and analytical balance
Procedure:
Preparation of Standard Solutions:
- Accurately weigh 100 mg of API reference standard and dissolve in solvent to make 100 mL of stock solution (1 mg/mL).
- Prepare a series of at least five standard solutions covering the expected concentration range (e.g., 10%, 25%, 50%, 75%, 100%, 125% of target concentration).
Spectral Acquisition:
- Scan the standard solutions across the appropriate wavelength range (e.g., 200-400 nm) to identify the wavelength of maximum absorption (λmax).
- Measure the absorbance of each standard solution at λmax against a solvent blank.
Calibration Curve:
- Plot absorbance versus concentration for the standard solutions.
- Calculate the regression line (y = mx + c) and correlation coefficient (r²).
- The method is considered linear if r² ≥ 0.998.
Validation Experiments:
- Accuracy: Prepare and analyze three sets of samples at 80%, 100%, and 120% of target concentration in triplicate. Calculate percentage recovery (should be 98-102%).
- Precision:
- Repeatability: Analyze six independent preparations at 100% of test concentration. Calculate %RSD (should be ≤ 2.0%).
- Intermediate Precision: Repeat the analysis on a different day, with different analyst/instrument. Compare results.
- Specificity: Analyze placebo, blank, and samples spiked with potential impurities to demonstrate no interference at the analyte retention time.
- LOD/LOQ: Prepare progressively diluted standards until signal-to-noise ratios of 3:1 (LOD) and 10:1 (LOQ) are achieved.
Figure 2: ICH Q2(R1) analytical method validation workflow.
Advanced Technique: Surface-Enhanced Raman Spectroscopy (SERS)
Advanced spectroscopic techniques continue to push the boundaries of sensitivity. In Surface-Enhanced Raman Spectroscopy (SERS), metallic nanostructures concentrate incident optical fields into deep subwavelength volumes, creating significant localized-field enhancement known as "hot spots" [124]. This enhancement can be exploited to detect trace levels of analytes. Recent research has demonstrated the ability to correlate light-matter interactions across different spectral regimes, such as using mid-infrared plasmons to trigger visible SERS signals within a nanocavity [124]. This combination of engineered nano/micro-structures with optimized macro-optical systems represents the cutting edge of spectroscopic sensitivity.
The Scientist's Toolkit: Essential Research Reagent Solutions
Table 3: Essential Materials and Reagents for Spectroscopic Analysis
| Item | Function | Application Notes |
|---|---|---|
| Certified Reference Standards | Provides analytical benchmark with known purity and identity | Essential for method validation, calibration, and system suitability |
| Spectroscopic Grade Solvents | Minimum UV absorption; high purity | Minimizes background interference in UV-Vis and fluorescence |
| ATR Crystals (Diamond, ZnSe) | Internal reflection element for FTIR | Enables direct solid/liquid analysis without extensive preparation |
| Metallic Nanoparticles (Au, Ag) | Plasmonic enhancement for SERS | Increases sensitivity for trace analysis; requires characterization |
| NMR Solvents (e.g., DMSO-d₆, CDCl₃) | Deuterated solvents for NMR | Minimizes proton interference in NMR spectroscopy |
| Calibration Standards (e.g., Polystyrene) | Wavelength and intensity verification | Ensures instrument performance and data integrity |
| Stable Isotope-Labeled Compounds | Internal standards for mass spectrometry | Improves quantification accuracy in LC-MS and GC-MS |
Data Analysis and Regulatory Documentation
Spectroscopic Data Analysis Techniques
Spectroscopic data can be analyzed through various approaches depending on complexity [121]:
- Qualitative Analysis: Typically achieved by cross-correlating a measured spectrum with a database of reference spectra.
- Quantitative Analysis:
- Univariate Approaches: A single spectral signature is assigned to the parameter of interest, enabling simple calibration (e.g., Beer-Lambert law for absorption).
- Multivariate Techniques: For complex situations with overlapping spectral signatures, techniques like Partial Least-Squares Regression (PLSR), Support Vector Machines (SVM), and Artificial Neural Networks (ANN) are employed.
Documentation for Regulatory Compliance
For regulatory submissions, analytical procedure validation data should be presented in the corresponding sections of the Common Technical Document (ICH M4Q) [123]. The submission must include:
- Complete validation protocol and methodology
- Relevant data for all relevant validation characteristics
- Statistical analysis and acceptance criteria justification
- Demonstration that the procedure is suitable for its intended purpose
The integration of fundamental light-matter interactions with the rigorous framework of ICH Q2(R1) validation creates a powerful paradigm for pharmaceutical analysis. Understanding the principles of spectroscopy enables scientists to select appropriate techniques, while adherence to regulatory guidelines ensures these methods produce reliable, accurate data for critical quality decisions. As spectroscopic technologies continue to advance, with innovations in nano-photonics and multivariate analysis pushing detection limits further, the foundational principles of validation remain essential for translating these technological advances into regulatory-approved analytical procedures that ensure drug safety and efficacy.
In the realm of scientific research, the choice between destructive and non-destructive analytical techniques represents a fundamental trade-off between the depth of information required and the imperative to preserve sample integrity. This balance is critically examined through the lens of light-matter interactions, the core physical principle underpinning many spectroscopic methods. When light impinges upon a material, its photons can be absorbed, emitted, or scattered in ways that reveal the material's chemical composition, molecular structure, and physical properties [5] [124]. Non-destructive techniques capitalize on elastic or inelastic scattering processes and non-absorbed photon emissions to gather information without altering the sample. In contrast, destructive techniques often involve more intense energy input or sample consumption to achieve their results, rendering the sample unusable for future analysis. This dichotomy is particularly acute in fields such as pharmaceutical development and cultural heritage conservation, where sample preservation is either a regulatory requirement or an ethical imperative. This article provides a technical guide to these methodologies, framed within the fundamental context of how light interacts with matter, to empower researchers in making informed analytical decisions.
Fundamental Light-Matter Interactions in Spectroscopy
The interaction between light (electromagnetic radiation) and matter is a quantum mechanical process that provides the foundational basis for all spectroscopic techniques. The specific nature of this interaction determines both the information that can be gleaned and the potential impact on the sample.
Non-Destructive Interactions typically involve low-energy, non-invasive probes. Techniques like Raman spectroscopy rely on inelastic scattering, where a photon excites a molecule to a virtual energy state, and the subsequently emitted photon has a different energy, providing a vibrational fingerprint of the molecule without causing permanent change [125]. Similarly, Nuclear Magnetic Resonance (NMR) spectroscopy uses radiofrequency waves within a strong magnetic field to perturb the spins of atomic nuclei, which then emit radiation as they return to equilibrium, revealing detailed structural and environmental information [126].
Destructive Interactions involve processes that permanently alter or consume the sample. In mass spectrometry (MS), a destructive technique often coupled with chromatography, the sample is ionized, often breaking chemical bonds and fragmenting molecules. These ions are then separated by their mass-to-charge ratio. While not purely a light-matter interaction, it often follows a spectroscopic separation step. Other techniques may require the sample to be vaporized (as in some atomic absorption spectrometry) or ground and pressed for analysis, which is destructive by preparation [127] [128].
The following diagram illustrates the decision-making workflow for selecting an analytical technique based on information needs and sample preservation requirements.
The selection of an analytical technique requires a nuanced understanding of capabilities, limitations, and operational requirements. The following tables provide a structured comparison of key destructive and non-destructive methods.
Table 1: Non-Destructive Spectroscopic Techniques
| Technique | Fundamental Light-Matter Interaction | Key Information Obtained | Typical Applications | Key Advantages |
|---|---|---|---|---|
| Raman Spectroscopy [21] [125] | Inelastic scattering of monochromatic light | Molecular fingerprints, crystalline phases, stress | Drug polymorph screening, cell culture monitoring, pigment ID | Non-contact, minimal sample prep, works in aqueous environments |
| FTIR Spectroscopy [21] [129] | Absorption of IR light by molecular bonds | Functional groups, chemical bonds | Polymer identification, protein secondary structure, stability testing | High specificity for organic functional groups, fast analysis |
| NMR Spectroscopy [21] [126] | Absorption/re-emission of RF radiation by atomic nuclei in a magnetic field | Molecular structure, conformation, dynamics, protein-ligand interactions | Drug discovery, fragment-based screening, structural biology | Atomic-level structural detail, can study interactions in solution |
| XRF Spectroscopy [127] | Emission of secondary X-rays after electron excitation | Elemental composition (qualitative/semi-quantitative) | Pigment analysis in heritage objects, metal contamination | Rapid analysis, can be portable for in-situ use |
Table 2: Destructive and Micro-Destructive Techniques
| Technique | Fundamental Interaction & Destructive Nature | Key Information Obtained | Typical Applications | Key Limitations |
|---|---|---|---|---|
| ICP-MS [21] [128] | Atomization/ionization in plasma; consumes sample | Ultra-trace elemental composition and speciation | Metal-protein interactions in biologics, quantifying Mn/Mo in plants | Requires sample digestion, destroys sample |
| Atomic Absorption Spectrometry (AAS) [128] | Absorption of light by free gaseous atoms; consumes sample | Quantitative trace metal analysis | Drug quality control, antibacterial research, plant mineral studies | Typically analyzes one element at a time, requires liquid sample |
| Chromatography-MS (e.g., SEC-ICP-MS) [21] | Separation followed by ionization; consumes sample | Separation and identification of complex mixtures | Speciation of metals in cell culture media, protein aggregation | Complex sample preparation, destructive |
| Laboratory XRF [127] | X-ray excitation; can require grinding/pelletizing | High-sensitivity quantitative elemental data | High-precision analysis of robust artifacts | Sample preparation can be destructive for fragile items |
Experimental Protocols in Practice
Protocol 1: Non-Destructive Analysis of Architectural Pigments using XRF
Application Context: In-situ analysis of ancient architectural pigments for cultural heritage conservation [127].
- Site Selection & Preparation: Visually inspect the architectural surface (e.g., temple wall, grotto sculpture) to identify distinct color regions. Clean the measurement area gently with a soft brush, if necessary and safe, to remove loose surface debris without altering the pigment layer.
- Instrument Calibration: Calibrate the portable XRF spectrometer using certified standard reference materials with known elemental compositions that are similar to the expected pigments.
- Data Acquisition: Position the XRF probe securely and perpendicular to the pigment surface. For a portable system, ensure a consistent measurement distance as per manufacturer guidelines. Acquire spectra for a minimum of 30-60 seconds per point to ensure sufficient signal-to-noise ratio. Multiple points per color region should be analyzed to account for heterogeneity.
- Data Analysis: Process the spectra to identify characteristic elemental peaks (e.g., Hg and S for vermilion red; Cu for azurite blue). Compare the elemental signatures with historical and scientific databases of known pigments to make an identification.
Protocol 2: Destructive Speciation of Metals in Cell Culture Media using HPLC-ICP-MS
Application Context: Monitoring metal speciation in Chinese hamster ovary (CHO) cell culture media during monoclonal antibody production to optimize process productivity and critical quality attributes [21].
- Sample Preparation: Withdraw a small volume (e.g., 1-2 mL) of cell culture media at various time points during the production cycle. Centrifuge the sample to remove cells and other particulates. The supernatant may require filtration (e.g., 0.2 µm filter) and dilution with a compatible mobile phase. This preparation consumes and alters the sample.
- Chromatographic Separation: Inject the prepared sample into a High-Performance Liquid Chromatography (HPLC) system. Use a suitable column (e.g., size exclusion or ion-exchange) and mobile phase to separate different metal-containing species based on their size or charge.
- Element-Specific Detection: The effluent from the HPLC column is directly introduced into the inductively coupled plasma (ICP) of the ICP-MS. The plasma atomizes and ionizes the metal-containing species. The MS detector is set to monitor specific isotopes of the target metals (e.g., Mn, Fe, Co, Cu, Zn).
- Data Analysis & Quantification: The resulting chromatogram shows peaks corresponding to different metal species, identified by their retention time. The intensity of the signal is used to quantify the concentration of each metal species by comparison with calibrated standards.
Protocol 3: Real-Time Monitoring of Bioprocesses using AI-Enhanced Raman Spectroscopy
Application Context: Inline, non-destructive monitoring of product aggregation and fragmentation during clinical bioprocessing [21] [119].
- Probe Integration & Calibration: Sterilize and integrate a Raman immersion probe directly into the bioreactor. The system is calibrated using a combination of hardware automation and machine learning to reduce manual effort. A baseline spectrum of the culture media is collected.
- Spectral Acquisition: The Raman probe continuously emits a laser into the bioprocess and collects the inelastically scattered light. Spectral data is acquired at high frequency (e.g., every 38 seconds) [21].
- AI-Enhanced Data Processing: Acquired spectra are streamed to a processing unit. A pre-trained deep learning model, such as a Convolutional Neural Network (CNN), automatically processes the high-dimensional data, filtering noise and identifying complex patterns related to critical quality attributes like protein aggregation and fragmentation.
- Real-Time Feedback: The output of the model provides a near real-time measurement of product quality. This data can be used to create control charts and trigger process interventions if anomalies are detected, ensuring consistent product quality.
The Scientist's Toolkit: Essential Research Reagent Solutions
The following table details key reagents, materials, and instrumental components essential for the experimental workflows described in this guide.
Table 3: Key Research Reagent Solutions and Materials
| Item | Function/Application | Technical Context |
|---|---|---|
| Chinese Hamster Ovary (CHO) Cell Culture Media | Cell growth medium for monoclonal antibody (mAb) production | Used in HPLC-ICP-MS protocol; its metal content impacts process productivity and critical quality attributes (CQAs) [21]. |
| Size Exclusion Chromatography (SEC) Column | Separates molecules in a liquid sample by their size/hydrodynamic radius | A key component in the HPLC-ICP-MS system for separating different metal-protein complexes in culture media [21]. |
| Certified Reference Materials (CRMs) | Calibration and validation standards for spectroscopic techniques | Essential for quantitative XRF and ICP-MS analysis to ensure accuracy; include pure elements and matrix-matched standards [127]. |
| Raman Immersion Probe | A fiber-optic probe for inserting into a reaction vessel for in-situ analysis | Enables non-destructive, real-time monitoring of bioprocesses like cell cultures within a bioreactor [21] [119]. |
| Monolayer of Probe Molecules (e.g., Bipyridine) | Molecules placed within a plasmonic nanocavity for enhanced spectroscopy | Used in advanced SERS studies to investigate light-matter interactions and signal enhancement mechanisms [124]. |
| Fragment Libraries | Collections of low molecular weight compounds for drug discovery screening | Used in NMR-based fragment screening to identify initial hits that bind to a target protein [126]. |
| Paramagnetic Tags | Tags containing unpaired electrons used in NMR spectroscopy | Leveraged in paramagnetic NMR to provide long-range structural constraints and enhance NMR signals for studying protein-ligand interactions [126]. |
The choice between destructive and non-destructive analytical techniques is a strategic decision that balances information depth against sample preservation, all governed by the fundamental principles of light-matter interaction. Non-destructive techniques like Raman, FTIR, NMR, and portable XRF are indispensable when sample integrity is paramount, enabling in-situ analysis, continuous monitoring, and the preservation of irreplaceable materials. Conversely, destructive techniques like ICP-MS and AAS offer unparalleled sensitivity, specificity, and the ability to conduct speciation analysis, which is often necessary for answering the most complex chemical questions. The future of analytical science lies not in choosing one over the other, but in their intelligent integration. The emergence of AI-powered data analysis is enhancing the speed and interpretability of non-destructive methods [119], while hyphenated techniques (e.g., HPLC-ICP-MS) combine separation and detection to extract maximum information from a single, consumed sample. By understanding the physical interactions at play and the requirements of their specific application, researchers can effectively navigate this landscape to select the optimal toolkit for their scientific challenges.
Vibrational spectroscopy, encompassing both Infrared (IR) and Raman techniques, provides a unique window into molecular structure by probing the fundamental vibrational modes of chemical bonds. The interaction between light and matter is the cornerstone of these analytical methods, though the underlying physical mechanisms differ significantly. IR spectroscopy operates on the principle of absorption, where molecules directly absorb incident IR radiation, which corresponds to the energy required to excite vibrational transitions [130]. In contrast, Raman spectroscopy is based on inelastic scattering of light, where photons exchange energy with the vibrating molecules, resulting in a shift in the photon's frequency that provides vibrational information [131] [130]. These techniques are fundamentally complementary; IR absorption requires a change in the dipole moment during vibration, making it highly sensitive to polar functional groups, while Raman scattering depends on a change in the molecular polarizability during vibration, making it particularly effective for studying non-polar bonds and symmetric molecular vibrations [132] [130].
The synergy created by combining these approaches overcomes the inherent limitations of each technique when used independently. This complementary relationship allows researchers to obtain a more complete vibrational profile of complex systems, from pharmaceutical compounds to biological matrices, enabling more accurate identification and quantification of chemical species in challenging analytical scenarios.
Theoretical Foundations and Complementary Selection Rules
Quantum Mechanical Framework of IR and Raman Spectroscopy
The interaction of light with molecular vibrations follows distinct quantum mechanical selection rules that govern the probability of a transition between vibrational energy states. In IR spectroscopy, the transition probability is directly proportional to the square of the transition dipole moment derivative with respect to the normal coordinate [133]. This relationship explains why asymmetric vibrations of polar bonds (such as O-H and C=O stretches) produce strong IR signals [130].
For Raman spectroscopy, the scattering intensity depends on the change in polarizability of the electron cloud during vibration. The Raman polarizability derivative (αρσ)mn determines the intensity of Raman scattering, with vibrations that significantly distort the electron cloud (such as C=C, C≡C, and S-S stretches) generating strong Raman signals [133] [130]. This fundamental difference in selection rules is why homonuclear bonds that are silent in IR spectra often produce strong Raman signals, making the techniques intrinsically complementary.
Jablonski Diagram for Vibrational Transitions
The following diagram illustrates the quantum energy transitions involved in IR absorption and Raman scattering processes, highlighting their different pathways for probing molecular vibrations.
Vibrational Transition Pathways:
This Jablonski diagram visualizes the distinct light-matter interactions in IR and Raman spectroscopy. The IR absorption pathway (yellow arrows) shows direct promotion from the ground vibrational state to an excited vibrational state when energy from incident IR radiation matches the vibrational energy gap. The Raman scattering pathways demonstrate two scenarios: Stokes Raman (green arrow), where the scattered photon has less energy than the incident photon after transferring energy to the molecule; and anti-Stokes Raman (red arrow), where the scattered photon gains energy from molecules already in an excited vibrational state. The virtual energy state represents a short-lived, unobservable quantum state that enables the Raman scattering process [130].
Data Fusion Strategies and Methodological Frameworks
Data Fusion Approaches for Enhanced Analytical Capability
Combining IR and Raman spectroscopy involves sophisticated data fusion strategies that integrate information from both techniques to improve analytical outcomes. Research demonstrates three primary fusion approaches, each with distinct advantages for specific applications:
Low-Level (Hybrid) Fusion: This approach involves concatenating raw spectral data from both IR and Raman measurements into a single composite dataset before analysis. The hybrid fusion strategy preserves all original spectral information but requires careful preprocessing to address differences in scale and measurement units between the techniques [134].
Mid-Level Fusion: In this strategy, features are extracted separately from each spectral dataset using appropriate algorithms, then combined into a unified feature set for model building. This approach allows for dimensionality reduction and focuses on the most diagnostically valuable features from each technique [134].
High-Level Fusion: This method involves building separate classification or regression models for each technique and then combining their predictions through a weighted voting or averaging scheme. The high-level approach effectively leverages the complementary strengths of each technique, as demonstrated in a study on xylazine detection where Raman data received a 90% voting weight while maintaining 92% prediction accuracy when combined with IR data [134].
Experimental Workflow for Combined IR-Raman Analysis
Implementing a successful combined IR-Raman analysis requires a systematic workflow that ensures data compatibility and maximizes synergistic effects. The following diagram outlines a generalized experimental protocol for complementary vibrational analysis.
Experimental Workflow for Combined Analysis:
This workflow illustrates the integrated process for combining IR and Raman spectroscopy. The protocol begins with sample preparation, which varies significantly based on the analytical technique and sample state. For IR spectroscopy, this may involve preparing KBr pellets for solid samples [135], while Raman analysis may require minimal preparation beyond ensuring proper focus and laser alignment. Following simultaneous or sequential data acquisition, spectral preprocessing addresses technical variations through normalization, baseline correction, and wavelength alignment. The feature extraction phase identifies diagnostically valuable peaks and patterns, followed by the implementation of an appropriate data fusion strategy. The process concludes with model building using chemometric approaches and final interpretation of the combined results.
Research Reagent Solutions and Essential Materials
Successful implementation of combined IR-Raman methodologies requires specific reagents and materials optimized for each technique. The following table details essential components for vibrational spectroscopy research.
Table 1: Essential Research Reagents and Materials for IR-Raman Spectroscopy
| Item | Function & Application | Technical Considerations |
|---|---|---|
| FTIR Spectrometer | Measures infrared absorption spectra using interferometry for high signal-to-noise ratio [135]. | Essential for SEIRA studies; often used with ATR accessories for minimal sample prep [133]. |
| Raman Spectrometer | Measures inelastically scattered light using laser excitation sources [135]. | Confocal microscopes enable mapping; 532nm and 785nm lasers balance signal and fluorescence [135]. |
| SERS/SEIRA Substrates | Nanostructured metal surfaces (Au, Ag) that enhance signals via plasmonic effects [133]. | Create "hot spots" for extreme field enhancement; critical for trace analysis [134] [133]. |
| ATR Crystals | Enable sample analysis without extensive preparation through internal reflection [133]. | Diamond, ZnSe, and Ge crystals offer different IR ranges and durability for various applications. |
| KBr (Potassium Bromide) | IR-transparent matrix for preparing solid sample pellets for transmission measurements [135]. | Hygroscopic; requires drying and handling under controlled conditions to avoid moisture absorption. |
| Bioorthogonal Tags | Synthetic Raman-active labels with silent cellular background for tracking molecules [131]. | Enable specific detection of small molecules in biological systems without interference [131]. |
Performance Comparison and Analytical Metrics
The complementary nature of IR and Raman spectroscopy becomes quantitatively evident when examining their performance across different analytical scenarios. The following table summarizes key comparative metrics based on recent research applications.
Table 2: Quantitative Performance Comparison of IR and Raman Techniques in Combined Applications
| Application Context | Technique & Modality | Key Performance Metrics | Optimal Data Fusion Strategy |
|---|---|---|---|
| Xylazine in Illicit Opioids [134] | IR + SERS with Random Forest | Sensitivity: 96%, Specificity: 88%, Accuracy: 92% (high-level fusion) | High-level fusion (90% Raman voting weight) |
| Chlorogenic Acid in Sunflower Meal [135] | FTIR Spectroscopy | Limit of Detection (LOD): 0.75 wt% | Not specified (individual technique optimization) |
| Chlorogenic Acid in Protein Matrices [135] | Raman Spectroscopy | Limit of Detection (LOD): 1.0 wt% | Not specified (individual technique optimization) |
| Small Molecules in Cellular Environments [131] | Stimulated Raman Scattering | Higher acquisition speed and spatial resolution vs. spontaneous Raman | Bioorthogonal tags for enhanced detection specificity |
Advanced Applications and Case Studies
Pharmaceutical and Biomedical Applications
The combination of IR and Raman spectroscopy has proven particularly valuable in pharmaceutical research and drug development, where understanding molecular interactions and distributions is critical. Stimulated Raman scattering (SRS) microscopy has emerged as a powerful platform for tracking small molecule drugs and their metabolites within cellular environments without the need for fluorescent labels that can perturb biological activity [131]. This label-free approach provides invaluable information about drug uptake, retention, and metabolism in complex disease models, potentially improving the robustness of preclinical studies.
The enhanced detection capability of combined vibrational spectroscopy approaches is especially relevant for analyzing complex pharmaceutical formulations and biological samples. Surface-enhanced techniques (SERS and SEIRA) have demonstrated remarkable sensitivity in detecting trace analytes in challenging matrices. In one application focused on detecting xylazine in illicit opioids, the hybrid approach achieved 92% prediction accuracy through optimized machine learning integration of both spectroscopic datasets [134]. This capability for trace analysis in complex mixtures has significant implications for pharmaceutical quality control and forensic analysis.
Food Science and Agricultural Applications
The complementary IR-Raman approach has shown significant utility in food science applications, particularly for quality control and component analysis. Research on sunflower meal demonstrates the practical advantage of this dual methodology, where FTIR spectroscopy achieved a lower detection limit (0.75 wt%) for chlorogenic acid compared to Raman spectroscopy (1.0 wt%) in protein matrices [135]. This differential sensitivity highlights how the techniques can be selectively applied based on analytical requirements.
The non-destructive nature of combined vibrational spectroscopy makes it ideal for analyzing agricultural products and food ingredients without complex sample preparation. Unlike traditional methods that require extraction and purification, the IR-Raman combination enables direct measurement of phenolic compounds in plant materials, significantly streamlining the analytical process while maintaining accuracy comparable to reference methods like HPLC [135]. This approach aligns with green analytical principles while providing rapid, real-time analysis capabilities for quality assessment in food production systems.
Computational Support and Theoretical Modeling
Computational quantum chemistry methods provide essential theoretical support for interpreting combined IR and Raman spectroscopic data. First-principles calculations using software such as Quantum ESPRESSO enable researchers to calculate theoretical IR and Raman spectra from first principles, providing valuable reference data for experimental peak assignment [136]. These calculations employ density functional perturbation theory (DFPT) to compute phonon frequencies and intensities, generating theoretical spectra that can be directly compared with experimental measurements.
The integration of computational and experimental approaches is particularly valuable for analyzing complex crystalline materials and their vibrational properties. For example, studies of beryllium oxide (BeO) have demonstrated how group theory and symmetry considerations can predict which vibrational modes will be IR-active, Raman-active, or active in both techniques [136]. This theoretical framework enhances the interpretation of experimental data and provides deeper insight into the relationship between molecular structure and spectroscopic observables.
The strategic combination of IR absorption and Raman scattering spectroscopy represents a powerful paradigm in analytical chemistry, leveraging the fundamental complementarity of these light-matter interactions to overcome the limitations of either technique used independently. Through appropriate data fusion strategies and optimized experimental protocols, this dual approach provides enhanced sensitivity, specificity, and analytical coverage for a wide range of applications from pharmaceutical development to food science. As computational methods and enhancement techniques continue to advance, the synergistic potential of combined vibrational spectroscopy will likely expand, offering new opportunities for unraveling complex molecular systems and solving challenging analytical problems across scientific disciplines.
Spectroscopy research is fundamentally the study of the interaction between light and matter [10]. These interactions occur in specific and predictable ways, forming the basis for all spectroscopic techniques. When light—encompassing a broad range of electromagnetic radiation including gamma rays, X-rays, ultraviolet, visible light, infrared, microwaves, and radio waves—encounters matter, several key processes can occur: absorption, reflection, and transmission [10]. The specific wavelengths of light that are absorbed, reflected, or transmitted provide a unique fingerprint for the material under investigation. This fingerprint arises because matter is composed of atoms and molecules, and the electrons within them occupy distinct energy levels. These electrons can absorb energy from incoming light photons, jumping to higher energy levels, and subsequently emit light as they drop back to lower levels [10]. It is these intricate interactions between light and matter that spectroscopic instrumentation is designed to detect and measure.
The central challenge in modern spectroscopy, however, lies in the inherent limitations of any single analytical technique. Different spectroscopic methods probe different aspects of molecular structure and dynamics. For instance, Ultraviolet-Visible (UV-Vis) spectroscopy primarily examines electronic transitions, while Infrared (IR) spectroscopy investigates vibrational modes. Consequently, the data from one technique provides only a partial view of the system's complete physicochemical profile. Cross-technique correlation is the methodological framework that addresses this challenge by systematically linking spectral data acquired from different instruments. This integration provides a more holistic and validated understanding of complex molecular systems, which is paramount in fields like pharmaceutical development where comprehensive material characterization is critical.
Theoretical Framework: Principles of Cross-Correlation
Fundamentals of Dual-Channel Correlation Spectroscopy
The conceptual foundation for linking spectral data is powerfully illustrated by Dual-Color Fluorescence Cross-Correlation Spectroscopy (dcFCCS). In dcFCCS, the cross-correlation function, G~rg~(τ), between the fluorescence signals from two spectrally separated detection channels is calculated to analyze molecular interactions [137]. In an ideal scenario, free from artifacts, the amplitude of the cross-correlation curve at time zero, G~rg~(0), relative to the autocorrelation amplitudes of the individual channels, directly quantifies the fraction of double-labeled, and therefore bound, particles [137]. This is represented by the relationship:
X = G~rg~(0) / G~g~(0) = N~RG~ / N~R~
where N~RG~ is the number of double-labeled particles and N~R~ is the total number of particles carrying the red label. This principle of quantifying the correlation between two distinct signals can be abstracted and applied to the broader challenge of correlating data from disparate spectroscopic techniques.
The Pervasive Challenge of Spectral Cross-Talk
A major obstacle in implementing any form of cross-correlation is the risk of artifactual, false-positive correlation amplitudes arising from spectral cross-talk [137]. Cross-talk occurs when the signal from one channel (or technique) "bleeds through" and is partially detected in another channel, creating an artificial correlation that does not represent a true underlying relationship. This is particularly problematic when the dyes or spectral features used have overlapping profiles, which is often unavoidable [137]. The severity of the artifact depends on the bleed-through ratio (κ), which is the brightness of a probe in its non-primary channel divided by its brightness in its primary channel [137]. Cross-talk can be mitigated through careful experimental design, such as selecting probes with minimal spectral overlap, or corrected post-measurement using mathematical procedures that account for the known bleed-through ratio [137].
Methodological Framework for Cross-Technique Correlation
The following workflow outlines the core process for establishing robust correlations between two different spectroscopic techniques, designated here as Technique A and Technique B.
Experimental Protocols for Correlation
Protocol 1: Sample Preparation for Multi-Technique Analysis
- Standardization: Prepare a single set of samples that is suitable for analysis by all techniques to be correlated. This eliminates batch-to-batch variability.
- Concentration Series: Create a dilution series of the analyte (e.g., 5-7 concentration points) to provide a range of signal intensities for building the correlation model.
- Controls: Include appropriate controls, such as a blank solvent and a stable reference standard, in the sample set.
- Replication: Prepare and analyze each concentration point in triplicate to ensure statistical robustness and account for instrumental noise.
Protocol 2: Data Acquisition and Pre-processing for UV-Vis and IR Correlation
- Technique A (UV-Vis Spectrophotometry):
- Instrument Calibration: Perform a baseline correction with the blank solvent.
- Acquisition: Acquire absorption spectra for all samples in the concentration series across a relevant wavelength range (e.g., 200-800 nm). Use consistent parameters: bandwidth 1 nm, data interval 1 nm, and a minimum of 3 scans per sample to average.
- Technique B (Fourier-Transform Infrared Spectroscopy):
- Instrument Calibration: Perform a background scan and ensure the instrument is purged with dry air to minimize CO~2~ and water vapor interference.
- Acquisition: Acquire spectra for all samples (e.g., in ATR mode). Use consistent parameters: resolution 4 cm^-1^, 64 scans per sample, and a spectral range of 4000-400 cm^-1^.
- Data Alignment: The key challenge is that UV-Vis and IR data exist on different scales (wavelength vs. wavenumber). The correlation is not between specific X-axis values but between the intensities of key features. The datasets must be aligned by sample identity (i.e., the absorbance value for Sample 1 at its λ~max~ is linked to the absorbance value for Sample 1 at a specific IR peak). This is typically managed within data analysis software.
Protocol 3: Cross-Talk Assessment and Correction (Adapted from dcFCCS) For techniques where signal interference is a concern, a quantitative correction is essential [137].
- Bleed-Through Calibration: Analyze a sample containing only the analyte specific to Technique A using the setup for Technique B. The bleed-through ratio, κ, is calculated as the signal in Technique B divided by the signal in Technique A [137]. κ = Brightness~A in B~ / Brightness~A in A~
- Correction Calculation: The true cross-correlation amplitude can be calculated from the apparent (measured) amplitudes, the bleed-through ratio (κ), and the apparent count-rate/brightness ratios obtained from the measurement [137]. This correction is crucial for obtaining accurate binding data or, by analogy, accurate correlations between techniques.
Quantitative Data Integration and Analysis
The core of cross-technique correlation lies in the mathematical and statistical treatment of the integrated data. The table below summarizes key parameters and their significance in building a correlation model.
Table 1: Key Parameters for Cross-Technique Data Integration
| Parameter | Description | Role in Correlation |
|---|---|---|
| Bleed-Through Ratio (κ) | Ratio of a signal's intensity in its non-primary channel/technique to its primary one [137]. | Quantifies spectral cross-talk; essential for correcting artifactual correlation. |
| Apparent Correlation (X~app~) | The raw, measured correlation amplitude before correction [137]. | The starting point for analysis; represents the observed relationship between datasets. |
| True Correlation (X~true~) | The correlation amplitude after correction for cross-talk and other artifacts [137]. | Represents the genuine underlying relationship between the properties measured by the two techniques. |
| Brightness Ratio | Ratio of the signal intensities per particle/analyte from the two different techniques [137]. | Informs on the relative sensitivity of each technique to the analyte, affecting the correlation strength. |
| Cross-Correlation Function | A mathematical function (e.g., G~rg~(τ)) that measures the correlation between two signals as a function of time or another variable [137]. | The primary tool for quantifying the degree and dynamics of the relationship between two data streams. |
The Scientist's Toolkit: Essential Research Reagents and Materials
Successful cross-technique analysis relies on a carefully selected set of reagents and materials. The following table details key components for a typical workflow involving fluorescence and absorbance spectroscopy.
Table 2: Essential Research Reagent Solutions for Cross-Technique Studies
| Item | Function / Explanation |
|---|---|
| High-Purity Fluorophores (e.g., Alexa Fluor 488, Cy5) | Bright, photostable dyes for labeling. Their spectral properties (excitation/emission) must be compatible with all instruments used, minimizing cross-talk [137]. |
| Buffer Solutions (e.g., PBS, Tris-HCl) | To maintain a consistent and physiologically relevant pH and ionic strength for all measurements, ensuring sample stability across different instrumental analyses. |
| Reference Standards (e.g., NIST-traceable materials) | To calibrate each instrument, ensuring that intensity readings and spectral positions are accurate and comparable between different techniques and across time. |
| Cleanroom-Grade Solvents (e.g., HPLC-grade water, DMSO) | To minimize background fluorescence and absorbance (from impurities) that could interfere with the signal of interest and introduce noise into the correlation. |
| Functionalized Nanoparticles / Beads | Can be used as a scaffold to bind multiple analytes or as a calibration standard for instrument alignment and for determining detection volume sizes in light-based techniques. |
| Stable Cell Lines (for live-cell studies) | Expressing fluorescently tagged proteins of interest (e.g., eGFP, mCherry) for intracellular cross-correlation studies, ensuring consistent and reproducible expression levels [137]. |
Visualization of Data Relationships and Workflows
A critical step in cross-technique correlation is understanding how raw data is transformed into a validated model. The following diagram illustrates the logical flow and decision points in this process.
Cross-technique correlation, grounded in the fundamental principles of light-matter interactions, represents a powerful paradigm for enhancing the rigor and information content of spectroscopic analysis. By systematically linking data from different instruments—while rigorously accounting for and correcting artifacts like spectral cross-talk—researchers can construct a more complete and validated picture of molecular systems. The methodologies and frameworks outlined herein, from standardized experimental protocols to quantitative data integration strategies, provide a roadmap for implementing this approach. In complex, high-stakes fields such as drug development, where comprehensive characterization is non-negotiable, mastering cross-technique correlation is not merely an advanced skill but an essential component of modern analytical science.
Quality by Design (QbD) represents a systematic, risk-based framework for pharmaceutical development that emphasizes predefined objectives, product and process understanding, and robust control strategies [138]. This paradigm shifts quality assurance from traditional retrospective testing to proactive quality integration throughout the product lifecycle. Concurrently, spectroscopic techniques provide the analytical foundation for this approach by exploiting fundamental light-matter interactions to deliver precise, real-time molecular data essential for informed decision-making [16].
Spectroscopy fundamentally studies how molecules absorb, emit, or scatter electromagnetic radiation. When light interacts with matter, the resulting spectrum provides a unique "molecular fingerprint" based on quantum energy level transitions within atoms and molecules [16]. This fingerprint enables precise identification, quantification, and structural analysis of pharmaceutical compounds, making spectroscopy indispensable for modern pharmaceutical development aligned with QbD principles [139].
Theoretical Foundations: Light-Matter Interactions in Pharmaceutical Analysis
The theoretical basis for spectroscopic applications in pharmaceutics rests on the quantum mechanical principles governing how molecules interact with specific light energies. When photons encounter molecules, they may be absorbed, promoting electrons to higher energy states or increasing molecular vibrational and rotational energies [16]. The specific wavelengths absorbed or emitted reveal critical information about molecular composition, structure, and environment.
Spectroscopic Techniques and Their Information Domains
Different spectroscopic techniques probe distinct aspects of molecular structure and behavior by leveraging various regions of the electromagnetic spectrum:
- Vibrational Spectroscopy (Raman, FT-IR): Measures energy changes associated with molecular vibrations and rotations, providing information about functional groups, crystallinity, and hydrogen bonding [21] [139].
- Nuclear Magnetic Resonance (NMR) Spectroscopy: Utilizes radio waves in strong magnetic fields to probe the magnetic properties of atomic nuclei (e.g., ¹H, ¹³C), revealing detailed molecular structure, conformation, and dynamics [21] [126].
- Electronic Spectroscopy (UV-Vis, Fluorescence): Examines electronic transitions between molecular orbitals, useful for concentration measurements, protein aggregation studies, and monitoring molecular interactions [21].
- Atomic Spectroscopy (ICP-MS, ICP-OES): Excites valence electrons to produce plasma for precise elemental analysis and trace metal detection [21].
Table 1: Spectroscopic Techniques and Their Pharmaceutical Applications
| Technique | Light-Matter Interaction Principle | Key Pharmaceutical Applications |
|---|---|---|
| Raman Spectroscopy | Inelastic scattering of light revealing molecular vibrations [21] | Real-time monitoring of protein aggregation and cell culture processes [21] |
| FT-IR Spectroscopy | Absorption of IR radiation exciting molecular vibrations [21] [139] | Identification of chemical bonds, protein secondary structure analysis in stability studies [21] |
| NMR Spectroscopy | Absorption of radio waves by atomic nuclei in magnetic fields [21] [126] | Protein higher-order structure analysis, ligand-binding interactions, drug discovery [21] [126] |
| UV-Vis Spectroscopy | Absorption of UV/visible light promoting electronic transitions [21] | Protein concentration assays, monitoring chromatography elution profiles [21] |
| Fluorescence Spectroscopy | Emission of longer-wavelength light after photon absorption [21] | Protein denaturation studies, monitoring molecular interactions and dynamics [21] |
| ICP-MS | Ionization of elements followed by mass-to-charge separation [21] | Trace metal analysis in biotherapeutic manufacturing, metal speciation in cell culture [21] |
The QbD Framework: A Systematic Approach to Pharmaceutical Development
The QbD methodology provides a structured framework for ensuring quality throughout the pharmaceutical development lifecycle. This systematic approach moves beyond traditional quality assurance methods to build quality directly into processes and products.
Core Principles and Implementation Pathway
QbD implementation follows a defined pathway with specific outputs at each stage, as illustrated below. This pathway ensures a science-based, risk-managed approach to pharmaceutical development.
The QbD workflow begins with defining the Quality Target Product Profile (QTPP) which outlines the desired safety, efficacy, and quality characteristics of the final drug product [140] [138]. From this profile, Critical Quality Attributes (CQAs) are identified as measurable properties that must remain within defined limits to ensure final product quality [141] [142]. Risk assessment tools such as Failure Mode and Effects Analysis (FMEA) then systematically evaluate potential impacts of material attributes and process parameters on CQAs [140] [138].
Through Design of Experiments (DoE), multivariate relationships between process parameters and quality attributes are quantified to establish a design space—the multidimensional combination of input variables proven to ensure quality [140] [142]. A robust control strategy with real-time monitoring using Process Analytical Technology (PAT) ensures consistent quality during manufacturing [143] [138]. This approach culminates in continuous lifecycle management with ongoing method refinement based on performance data [140] [142].
Integrating Spectroscopic Techniques within the QbD Workflow
Spectroscopy serves as the analytical backbone for QbD implementation, providing essential data at each development stage. The integration of various spectroscopic techniques throughout the pharmaceutical development lifecycle creates a comprehensive analytical framework supporting QbD principles.
Spectroscopic Methods Across Development Stages
Different spectroscopic techniques provide critical analytical capabilities throughout the QbD pharmaceutical development process, from initial formulation design through manufacturing and lifecycle management.
Real-time Monitoring and Process Analytical Technology
The integration of spectroscopy with Process Analytical Technology (PAT) represents a cornerstone of QbD implementation, enabling real-time quality assurance during pharmaceutical manufacturing [143]. Raman spectroscopy has emerged as a particularly powerful PAT tool due to its non-invasive nature and molecular specificity [21]. Recent advances demonstrate its application in real-time monitoring of protein aggregation and fragmentation during clinical bioprocessing, with measurements captured every 38 seconds using automated systems with machine learning integration [21].
Similarly, inline UV-vis spectroscopy has been successfully implemented for monitoring Protein A affinity chromatography during monoclonal antibody purification, enabling real-time optimization of separation conditions to achieve 95.92% antibody recovery while reducing host cell proteins by nearly 50% [21]. Fluorescence spectroscopy also offers innovative PAT applications, including non-invasive in-vial protein denaturation monitoring without compromising sterility [21].
Experimental Protocols: Spectroscopy-enabled QbD Implementation
Protocol: QbD-driven HPLC Method Development with Spectroscopic Detection
This protocol exemplifies the AQbD (Analytical QbD) approach for developing a robust HPLC method with spectroscopic detection for simultaneous assay of curcuminoids and doxorubicin in liposomal formulations [141].
Step 1: Define Analytical Target Profile (ATP) The ATP specified simultaneous quantification of curcuminoids (CUR, DMC, BDMC) and doxorubicin (DOX) with resolution >2.0, retention time between 2-10 minutes, and peak symmetry between 0.8-1.5 [141].
Step 2: Identify Critical Method Parameters Risk assessment using Ishikawa diagrams identified mobile phase composition, gradient profile, column temperature, and pH as high-impact factors affecting Critical Quality Attributes (peak resolution, symmetry, and retention time) [141].
Step 3: Design of Experiments (DoE) A Central Composite Design (CCD) was employed with two factors (mobile phase ratio and pH) at three levels each. The experimental domain included 13 randomized runs with center point replication to estimate experimental error [141].
Step 4: Response Surface Analysis & Design Space Mathematical models correlating factors to responses were developed. The design space was established as the multidimensional region where probability of meeting all ATP criteria exceeded 95% [141].
Step 5: Control Strategy System suitability tests were implemented to verify method performance before each analysis, monitoring resolution between CUR and DMC peaks, tailing factor, and retention time reproducibility [141].
Table 2: Key Reagent Solutions for QbD-driven HPLC with Spectroscopic Detection
| Reagent/Material | Function in Experimental Protocol | Specifications/Quality Requirements |
|---|---|---|
| Zorbax SB C18 Column | Chromatographic separation of analytes | 100 × 3 mm, 3.5 μm particle size [141] |
| Acetonitrile (HPLC Grade) | Organic mobile phase component | Low UV cutoff, low particulate matter [141] |
| Triethylamine | Mobile phase modifier to improve peak symmetry | Concentration: 0.01% in aqueous phase [141] |
| Phosphoric Acid | pH adjustment of aqueous mobile phase | Suitable for HPLC, to achieve pH 3.0-5.0 [141] |
| Reference Standards | Method calibration and quantification | Curcuminoids (CUR, DMC, BDMC) and doxorubicin of known purity [141] |
Protocol: Real-time Bioprocess Monitoring Using Raman Spectroscopy
This protocol outlines the implementation of Raman spectroscopy as a PAT tool for real-time monitoring of cell culture processes in biopharmaceutical manufacturing [21].
Step 1: Instrument Configuration and Calibration Install immersion probe directly into bioreactor. Perform instrument calibration using polystyrene standard. Establish spectral acquisition parameters: 785 nm laser, 400 mW power, 10-second integration time [21].
Step 2: Anomalous Spectrum Identification Implement automated algorithm to identify and exclude anomalous spectra caused by bubbles or particles, ensuring data quality for model development [21].
Step 3: Multivariate Model Development Collect Raman spectra with parallel offline reference measurements for 27 cell culture components (e.g., glucose, lactate, amino acids). Apply partial least squares (PLS) regression to develop predictive models with Q² values >0.8 [21].
Step 4: Real-time Monitoring and Control Deploy models for real-time prediction of critical process parameters. Implement control charts to detect normal and abnormal process conditions, including potential contamination events [21].
Step 5: Continuous Improvement Regularly update models with new process data to enhance predictive accuracy and adapt to process changes throughout product lifecycle [21].
Advanced Applications and Recent Technological Advances
Innovative Spectroscopic Applications in Pharmaceutical QbD
Recent research demonstrates expanding applications of spectroscopy within QbD frameworks across diverse pharmaceutical development scenarios:
NMR in Biologics Formulation: Advanced NMR techniques, including 1D NMR for monitoring monoclonal antibody structural changes and 2D NMR (XL-ALSOFAST-[1H–13C]-HMQC) for detecting higher-order structural alterations, provide critical insights for biologics formulation development within QbD paradigms [21].
FT-IR with Hierarchical Cluster Analysis: FT-IR spectroscopy combined with Python-based hierarchical cluster analysis (HCA) enables efficient stability assessment of protein drugs by evaluating secondary structure similarity across different storage conditions [21].
ICP-MS for Metal Speciation: HPLC-ICP-MS methodologies enable speciation and quantification of transition metals (Mn, Fe, Co, Cu, Zn) in cell culture media, addressing critical quality attributes affected by metal-protein interactions during biotherapeutic production [21].
Fluorescence Polarization for Protein Stability: Non-invasive in-vial fluorescence polarization analysis monitors heat- and surfactant-induced protein denaturation, providing a cost-effective, portable quality control solution from production through patient administration [21].
Emerging Trends and Future Directions
The convergence of spectroscopy with QbD continues to evolve through technological innovations that enhance pharmaceutical development capabilities:
High-Field NMR Spectrometers: Advanced NMR systems with improved resolution and sensitivity enable detailed analysis of large biomolecules and their interactions with potential drug candidates, accelerating structure-based drug discovery [126].
Enhanced Raman Techniques: Surface-enhanced Raman spectroscopy (SERS) and tip-enhanced Raman spectroscopy (TERS) provide dramatically improved sensitivity for analyzing protein dynamics and aggregation mechanisms under physiological conditions [21].
Integration with Machine Learning: Automated robotic systems with machine learning algorithms reduce calibration efforts and increase data throughput for spectroscopic PAT applications, enabling real-time quality measurements every 38 seconds during bioprocessing [21].
Paramagnetic NMR Spectroscopy: Utilization of paramagnetic properties of metal ions enhances NMR signals for studying protein-ligand interactions, providing valuable insights into spatial arrangements within molecular complexes [126].
The strategic integration of spectroscopy within the Quality by Design framework represents a transformative approach to pharmaceutical development. By leveraging fundamental light-matter interactions, spectroscopic techniques provide the molecular-level understanding essential for science-based quality decisions throughout the product lifecycle. This synergy enables a paradigm shift from traditional quality verification to proactive quality assurance, where critical process parameters are continuously monitored and controlled using robust PAT strategies. As spectroscopic technologies continue to advance alongside computational capabilities, their role in QbD implementation will further expand, driving innovation in pharmaceutical development while ensuring consistent product quality, regulatory compliance, and enhanced patient outcomes.
In spectroscopic research, the fundamental investigation of how light interacts with matter is directly constrained by the analytical capabilities of available instrumentation. The relationship between equipment investment and scientific output represents a critical consideration for research institutions, particularly in fields such as pharmaceutical development where analytical precision determines regulatory success and innovation potential. Spectroscopy, which studies the interaction between electromagnetic radiation and matter [16], provides the foundational framework for this analysis. Every element or molecule possesses a unique "spectral fingerprint" [16], but the ability to resolve these signatures depends heavily on instrumental sophistication. This technical guide examines the cost-benefit considerations underlying strategic investments in spectroscopic equipment, providing researchers and laboratory managers with a structured framework for evaluating how financial allocations translate directly into expanded analytical capabilities within the context of light-matter interaction research.
Spectroscopy Market Landscape: Costs and Performance Metrics
The global spectroscopy market continues to exhibit robust growth, with the process spectroscopy segment alone projected to expand from US$ 23.2 billion in 2024 to US$ 53.8 billion by 2033, representing a compound annual growth rate (CAGR) of 9.8% [144]. This growth trajectory underscores the increasing importance of spectroscopic techniques across industrial and research applications. The broader molecular spectroscopy market demonstrates a steady expansion from US$ 3,807.30 million in 2022 to an anticipated US$ 5,586.37 million by 2030 (CAGR of 4.9%) [145], while the overall spectroscopy equipment market (including accessories) is projected to grow from $15,160 million in 2025 at a CAGR of 1.6% through 2033 [146].
Table 1: Global Spectroscopy Market Outlook (2024-2033)
| Market Segment | 2024 Value | 2033 Projection | CAGR | Dominant Region/Application |
|---|---|---|---|---|
| Process Spectroscopy | US$ 23.2 billion [144] | US$ 53.8 billion [144] | 9.8% [144] | North America (47%) [144] |
| Molecular Spectroscopy | US$ 3,807.30 million (2022) [145] | US$ 5,586.37 million (2030) [145] | 4.9% [145] | Pharmaceutical Applications (42%) [147] |
| Spectroscopy Equipment & Accessories | $15,160 million (2025) [146] | Projected growth to 2033 [146] | 1.6% [146] | Pharmaceutical & Biotechnology [146] |
Different spectroscopic techniques offer varying capability-to-cost ratios, with mass spectroscopy dominating the molecular spectroscopy market at approximately 36% market share in 2024 [147]. The pharmaceutical sector represents the largest application segment, accounting for approximately 42% of the molecular spectroscopy market share in 2024 [147] and projected to command 38.9% of molecular spectroscopy revenue share in 2025 [144]. This dominance reflects the critical role of spectroscopic techniques in drug development, where they are employed for molecular bond strength analysis, specific bond identification, and pharmacological purity assessment [147].
Table 2: Spectroscopy Technique Market Share and Pharmaceutical Applications
| Technique | Market Share (2024) | Key Pharmaceutical Applications | Performance Characteristics |
|---|---|---|---|
| Mass Spectroscopy | 36% [147] | Drug discovery, proteomics analysis [147] | High sensitivity and accuracy in compound identification [147] |
| NMR Spectroscopy | Rapidly evolving segment [147] | Molecular structure elucidation [147] | Non-destructive with detailed structural information [147] |
| Raman Spectroscopy | Prominent in materials science [147] | Studying structural activity relationships [147] | Non-destructive with minimal sample preparation [147] |
| IR Spectroscopy | Valuable in material identification [147] | Identifying compounds via molecular vibrations [147] | Effective for polymer analysis and material characterization [147] |
Fundamental Principles: Light-Matter Interaction in Spectroscopy
Spectroscopy is fundamentally concerned with the interaction between electromagnetic radiation and matter [16]. When light encounters a material, several phenomena can occur, including absorption, emission, or scattering, each providing distinct information about the sample's molecular composition, structure, and dynamic properties [16]. The theoretical foundation for these interactions lies in quantum mechanics, which describes the discrete energy levels that atoms and molecules can occupy [16]. Transitions between these energy states result in the absorption or emission of photons at characteristic wavelengths, creating the unique spectral fingerprints that enable material identification and analysis [16].
Diagram 1: Fundamental light-matter interaction processes in spectroscopy.
The specific type of spectroscopic technique employed determines which aspects of light-matter interaction are measured. Absorption spectroscopy (including UV-Vis and IR techniques) measures the wavelengths of light absorbed by a material as electrons transition to higher energy states [16]. Emission spectroscopy analyzes the light emitted when excited atoms or molecules return to lower energy states [16]. Raman spectroscopy measures the inelastic scattering of light, which provides information about molecular vibrations [16], while Nuclear Magnetic Resonance (NMR) spectroscopy utilizes magnetic fields and radio waves to probe nuclear spin transitions in a powerful technique for molecular structure determination [16].
Cost-Benefit Analysis Framework for Spectroscopy Investments
A well-constructed cost-benefit analysis (CBA) provides a systematic approach for evaluating the financial implications of spectroscopic equipment investments by comparing costs and benefits to determine whether potential benefits justify the investment [148]. According to the National Research Council, a proper CBA should provide "a convincing narrative involving all relevant costs and benefits" to justify program expenditures [149], particularly when direct financial returns may be insufficient to warrant investment alone.
Cost Components
Spectroscopy investments encompass multiple cost categories that must be considered in a comprehensive analysis:
- Direct Costs: Include initial instrument acquisition expenses, which can range from tens of thousands of dollars for basic UV-Vis systems to millions for high-field NMR spectrometers [146]. Additional direct costs include installation, validation, and ongoing maintenance contracts, which can represent 10-15% of the initial purchase price annually [144].
- Indirect Costs: Encompass facility modifications, utility consumption (particularly for cryogenically-cooled systems), administrative overhead, and specialized storage requirements [148].
- Personnel Costs: Include technical operator training and the significant challenge of securing skilled technicians, with over 1,500 new job postings for process analytical chemists appearing in a single year [144].
- Opportunity Costs: Represent the potential benefits lost when choosing one investment over alternatives, such as selecting a mid-range instrument that may become obsolete more quickly versus a higher-end platform with greater longevity [148].
Benefit Considerations
The benefits of spectroscopic investments extend beyond simple financial returns to encompass several critical dimensions:
- Direct Benefits: Include increased analytical throughput, with modern systems offering significantly faster data acquisition speeds [150], and reduced reagent consumption through miniaturized platforms. These translate to quantifiable cost savings per sample analyzed.
- Indirect Benefits: Encompass improved data quality that enhances research publication potential, regulatory compliance capabilities particularly in pharmaceutical applications where 65% of manufacturers have integrated Process Analytical Technology (PAT) tools [144], and strengthened competitive positioning for research funding.
- Intangible Benefits: Include expanded research capabilities that enable investigations previously beyond institutional capacity, enhanced cross-disciplinary collaboration opportunities, and long-term workforce development through exposure to cutting-edge technologies.
Diagram 2: Cost-benefit analysis framework for spectroscopy equipment investment.
Financial Calculation Methods
The financial evaluation of spectroscopy equipment investments employs several quantitative measures:
Net Present Value (NPV): Calculated as the difference between the present value of benefits and the present value of costs, with positive NPV indicating financial viability [148]. The formula for NPV is:
NPV = PV of Benefits - PV of Costs [148]
Cost-Benefit Analysis (CBA) Ratio: Determined by dividing the total present value of benefits by the total present value of costs, with ratios greater than 1.0 indicating beneficial investments [148]:
CBA Ratio = PV of Benefits / PV of Costs [148]
Present Value (PV) Calculation: Future costs and benefits must be discounted to present values using the formula:
PV = FV / (1 + r)ⁿ [148]
where FV is future value, r is the discount rate, and n is the number of periods.
Experimental Protocols: Methodologies for Spectroscopy Applications
The application of spectroscopic techniques follows standardized experimental protocols tailored to specific analytical requirements. The following section outlines detailed methodologies for key applications in pharmaceutical research and development.
Protein Characterization Using NMR Spectroscopy
Objective: Determine three-dimensional protein structure and dynamics for drug target identification [147].
Protocol:
- Sample Preparation: Purified protein solution (0.1-1.0 mM) in appropriate buffer with 5-10% D₂O for signal locking [147]. Sample volume typically 500-600 μL for standard 5mm NMR tubes.
- Instrument Setup: Field strength of 600 MHz or higher recommended for sufficient resolution [150]. Temperature control to 25°C or 37°C depending on protein stability requirements.
- Data Acquisition:
- Collect ¹H one-dimensional spectrum for initial assessment
- Perform 2D experiments including ¹H-¹⁵N HSQC for backbone assignment
- Implement ¹H-¹³C HSQC for sidechain characterization
- Acquire NOESY spectra for distance constraints (mixing time 80-150 ms)
- Data Processing: Apply apodization functions (typically exponential for ¹H, squared sine-bell for multidimensional data), Fourier transformation, and baseline correction.
- Structure Calculation: Iterative computational approach using programs like CYANA or XPLOR-NIH incorporating distance and dihedral constraints.
Table 3: Research Reagent Solutions for Protein NMR Spectroscopy
| Reagent/Material | Function | Specifications |
|---|---|---|
| Deuterated Solvents | Signal reduction for lock substance | D₂O (99.9% deuterated) for aqueous buffers [147] |
| NMR Tubes | Sample containment | Standard 5mm diameter, high-quality glass [151] |
| Buffer Components | pH and ionic strength maintenance | Phosphate or Tris buffers with minimal proton content |
| Reference Compounds | Chemical shift calibration | DSS or TSP at 0.1-0.5 mM concentration |
Drug Compound Analysis Using Raman Spectroscopy
Objective: Monitor solid-state transformations in final dosage forms and study structural activity relationships [147].
Protocol:
- Sample Presentation: Solid powder compressed into pellet or positioned in specialized holders. For tablet analysis, direct surface scanning with appropriate positioning.
- Instrument Configuration:
- Wavelength: 785 nm or 1064 nm laser to minimize fluorescence [150]
- Resolution: 4 cm⁻¹ or better
- Spectral range: 200-2000 cm⁻¹
- Laser power: 10-100 mW at sample to prevent degradation
- Data Collection:
- Acquisition time: 10-30 seconds per spectrum
- Number of accumulations: 16-64 scans for improved signal-to-noise
- Background collection: Dark spectrum and substrate reference
- Quality Controls:
- Daily instrument calibration using silicon wafer (peak at 520.7 cm⁻¹)
- Intensity standardization with NIST-traceable reference material
- Data Analysis:
- Preprocessing: Cosmic ray removal, baseline correction, vector normalization
- Multivariate analysis: Principal Component Analysis (PCA) for clustering
- Spectral interpretation: Band assignment reference to known standards
Real-Time Reaction Monitoring Using FT-IR Spectroscopy
Objective: Monitor chemical reactions in situ for kinetic analysis and endpoint determination [144].
Protocol:
- Experimental Setup: Reactor equipped with attenuated total reflection (ATR) crystal interface or flow cell with IR-transparent windows (e.g., CaF₂, ZnSe).
- System Configuration:
- Resolution: 4 cm⁻¹
- Spectral range: 4000-650 cm⁻¹
- Scanner velocity: 10-20 kHz for rapid-scan applications
- Data Acquisition Parameters:
- Time resolution: 1-30 seconds per spectrum depending on reaction kinetics
- Co-added scans: 16-32 for acceptable signal-to-noise ratio
- Background collection: Prior to reactant introduction
- In-situ Monitoring:
- Continuous collection throughout reaction progression
- Temperature monitoring synchronized with spectral acquisition
- Automated sampling triggered by spectral changes
- Data Treatment:
- Spectral subtraction to remove solvent contributions
- Peak height/area integration for quantitative analysis
- Multivariate curve resolution for complex reaction mixtures
Diagram 3: Standardized workflow for spectroscopic analysis with quality control checkpoints.
Emerging Trends and Future Outlook
The spectroscopy landscape continues to evolve with several transformative trends reshaping the relationship between equipment investment and analytical capability:
Technological Innovations
Miniaturization and Portability: The development of compact, field-deployable instruments represents a significant trend, with Bruker Corporation dedicating $20 million to portable device R&D for 2025 [144]. Handheld Raman and NIR spectrometers enable real-time decision-making in manufacturing and field applications, with the US-based refinery implementation of Thermo Scientific's process Raman analyzer dramatically reducing time to market for gasoline products [144].
AI and Automation Integration: Artificial intelligence and machine learning are transforming spectroscopic data analysis, enhancing predictive capabilities and enabling automated interpretation [145]. Major manufacturers are introducing AI-enabled platforms, with Thermo Fisher Scientific and Bruker Corporation both unveiling compact spectrometers featuring AI-enabled analytics in 2024 [144].
Hybrid and Hyphenated Techniques: The combination of multiple analytical techniques provides complementary data streams, with systems integrating chromatography, spectroscopy, and mass spectrometry gaining prominence [146]. This approach offers more comprehensive analytical solutions for complex samples.
Market Dynamics
The competitive landscape features established players like Thermo Fisher Scientific, Agilent Technologies, and Bruker Corporation dominating through extensive product portfolios and global service networks [144]. These companies are pursuing aggressive research and development strategies, with over 150 patents filed for miniaturized hardware in the U.S. in 2024 alone [144]. Concurrently, strategic mergers and acquisitions are reshaping the market, as demonstrated by Bruker's purchase of Tornado Spectral Systems Inc. in January 2024 [144].
Regionally, North America maintains dominance with 47% of the process spectroscopy market share in 2024 [144], while the Asia-Pacific region emerges as the fastest-growing market, fueled by expanding economies and increasing R&D spending [146]. This global expansion reflects the increasingly essential role of spectroscopic analysis across research and industrial applications.
Strategic investment in spectroscopic equipment requires careful consideration of both quantitative financial metrics and qualitative scientific capabilities within the framework of how light interacts with matter. The cost-benefit analysis must extend beyond simple financial calculations to encompass the enhanced research capacity, improved data quality, and expanded application potential that advanced instrumentation enables. As technological innovations continue to transform the spectroscopy landscape through miniaturization, AI integration, and hybrid techniques, the fundamental relationship between investment and analytical capability remains central to research advancement. Institutions that systematically evaluate these factors within the context of their specific research objectives will position themselves to maximize returns from spectroscopic equipment investments while advancing our understanding of light-matter interactions across scientific disciplines.
Conclusion
The sophisticated understanding of light-matter interactions continues to revolutionize spectroscopic applications in pharmaceutical research and development. From fundamental quantum principles revealing the critical role of virtual charges to advanced nanomaterial engineering that amplifies these interactions, spectroscopy provides an indispensable toolbox for drug discovery, quality control, and manufacturing optimization. The integration of machine learning with spectroscopic data analysis, coupled with emerging techniques capable of probing quantum regimes and achieving single-molecule sensitivity, points toward a future of unprecedented analytical precision. For biomedical research, these advancements promise accelerated drug development cycles, enhanced product quality, and new diagnostic capabilities, ultimately strengthening the foundation of pharmaceutical science and patient care through deeper insights into molecular behavior and interactions.
References
- 1. Nature of Wave Radiation Explained Electromagnetic [https://www.vedantu.com/chemistry/electromagnetic-radiation-wave-nature]
- 2. The Electromagnetic Spectrum Video Series & Companion Book - NASA Science [https://science.nasa.gov/ems/]
- 3. - Light - Faculty of Chemistry and Pharmacy Matter Interaction [https://www.chemie.uni-wuerzburg.de/en/research/key-research-interests/light-matter-interaction/]
- 4. Photon Energies and the Electromagnetic | Physics Spectrum [https://courses.lumenlearning.com/suny-physics/chapter/29-3-photon-energies-and-the-electromagnetic-spectrum/]
- 5. and Spectroscopy - Light – Combustion... Matter Interactions [https://crf.sandia.gov/research/chemical-physics/spectroscopy-and-light-matter-interactions/]
- 6. Correlate light – matter in different spectral regimes interactions [https://www.nature.com/articles/s41377-022-00724-9?error=cookies_not_supported&code=d1001677-f02d-4dee-ad8b-66e8735d096e]
- 7. Spectroscopy [https://en.wikipedia.org/wiki/Spectroscopy]
- 8. 7.2 Absorption, emission, and scattering processes [https://fiveable.me/molecular-physics/unit-7/absorption-emission-scattering-processes/study-guide/wzTHOTcyEdht7BAH]
- 9. Absorption spectroscopy [https://en.wikipedia.org/wiki/Absorption_spectroscopy]
- 10. 101 – Spectroscopy and Light - NASA Science Matter [https://science.nasa.gov/mission/webb/science-overview/science-explainers/spectroscopy-101-light-and-matter/]
- 11. Important Spectroscopic Techniques and Examples [https://andor.oxinst.com/learning/view/article/fundamentals-of-spectroscopy-history-explanations-and-applications]
- 12. Spectroscopy Data and Information: Home - Research Guides [https://researchguides.library.wisc.edu/spectra]
- 13. Quantitative mass spectrometry: an overview - PMC [https://pmc.ncbi.nlm.nih.gov/articles/PMC5031646/]
- 14. – Light photonic... | Nature Reviews Physics matter interactions with [https://www.nature.com/articles/s42254-020-0224-2?error=cookies_not_supported]
- 15. - Atomic Structure, Light, Wavelengths | Britannica Spectroscopy [https://www.britannica.com/science/spectroscopy/Basic-properties-of-atoms]
- 16. : The Science of Spectroscopy and Light Matter Interaction [https://www.scitechnol.com/peer-review/spectroscopy-the-science-of-light-and-matter-interaction-yTpS.php?article_id=27752]
- 17. Doctoral defence of Valentina Eremina, MSc, 26.11. : Probing... [https://www.uef.fi/en/article/doctoral-defence-of-valentina-eremina-msc-26112025-probing-light-matter-interactions-in-hybrid]
- 18. /Rotational Spectroscopy - Wikiversity spectroscopy [https://en.wikiversity.org/wiki/Spectroscopy/Rotational_spectroscopy]
- 19. Expanding chiral metamaterials for retrieving fingerprints via vibrational circular dichroism | Light: Science & Applications [https://www.nature.com/articles/s41377-023-01186-3]
- 20. Vibrational circular dichroism unveils hidden clues | Light: Science & Applications [https://www.nature.com/articles/s41377-023-01239-7]
- 21. A Review of the Latest Spectroscopic Research in Pharmaceutical and Biopharmaceutical Applications | Spectroscopy Online [https://www.spectroscopyonline.com/view/review-latest-spectroscopic-research-pharmaceutical-and-biopharmaceutical-applications]
- 22. Attosecond spectroscopy in condensed matter - PubMed [https://pubmed.ncbi.nlm.nih.gov/17960239/]
- 23. Attosecond spectroscopy in condensed matter | Nature [https://www.nature.com/articles/nature06229]
- 24. Attosecond virtual charge dynamics in dielectrics | Nature Photonics [https://www.nature.com/articles/s41566-025-01700-6]
- 25. Scientists Discover “Virtual Charges” That Exist Only When Light Hits [https://scitechdaily.com/scientists-discover-virtual-charges-that-exist-only-when-light-hits/]
- 26. Attosecond Molecular Dynamics and Spectroscopy - ScienceDirect [https://www.sciencedirect.com/science/chapter/edited-volume/abs/pii/B978012817234600009X]
- 27. High-throughput optical imaging and spectroscopy of individual... [https://www.nature.com/articles/nnano.2013.227?error=cookies_not_supported&code=c533bc03-a01a-4358-84f4-592211d9d93d]
- 28. of Interaction with lead halide light : A review perovskites [https://systems.enpress-publisher.com/index.php/CAN/article/view/813]
- 29. Two Dimensional Heterostructures for Optoelectronics: Current Status and Future Perspective - PMC [https://pmc.ncbi.nlm.nih.gov/articles/PMC10005545/]
- 30. Ultrafast Photophysics of 2D Semiconductors and Related Heterostructures - ScienceDirect [https://www.sciencedirect.com/science/article/abs/pii/S2589597419301911]
- 31. A Theoretical Perspective on Molecular Polaritonics - PMC [https://pmc.ncbi.nlm.nih.gov/articles/PMC9204811/]
- 32. Molecular Polaritonics 2025: Program [https://molecularpolaritonics.org/program]
- 33. Resonance theory of vibrational strong coupling enhanced ... [https://www.nature.com/articles/s43246-024-00551-y]
- 34. Weichman Lab First to Strongly Couple Gas-Phase ... [https://chemistry.princeton.edu/news/weichman-lab-first-to-strongly-couple-gas-phase-molecules-to-optical-cavity/]
- 35. Vibrational Strong Coupling in Cavity QED forms a ... [https://chemrxiv.org/engage/chemrxiv/article-details/68e9945e5dd091524fdf4fbb]
- 36. Observation of cavity-tunable topological phases ... [https://www.nature.com/articles/s41467-025-61121-5]
- 37. - UV : Principle, Strengths and... | Technology Networks Vis Spectroscopy [https://www.technologynetworks.com/analysis/articles/uv-vis-spectroscopy-principle-strengths-and-limitations-and-applications-349865]
- 38. - UV Absorption Vis - Theory Spectroscopy [https://teaching.shu.ac.uk/hwb/chemistry/tutorials/molspec/uvvisab1.htm]
- 39. -Visible Spectrophotometry: Introduction, UV ... Quantification [https://www.intechopen.com/chapters/1201950]
- 40. of Active Substances in Some Quantification Using by... Drugs [https://www.springerprofessional.de/en/quantification-of-active-substances-in-some-drugs-using-by-deriv/16716456]
- 41. New perspectives on light-matter interaction: innovative research focused on ultra-fast electronics | EurekAlert! [https://www.eurekalert.org/news-releases/1099944]
- 42. What Is Infrared Spectroscopy? Fundamentals & Applications [https://www.excedr.com/blog/what-is-infrared-spectroscopy]
- 43. FT-IR Spectroscopy Mini-Tutorial: Principles, Practice, and Applications Across Disciplines | Spectroscopy Online [https://www.spectroscopyonline.com/view/ft-ir-spectroscopy-mini-tutorial-principles-practice-and-applications-across-disciplines]
- 44. (PDF) Exploring Functional and Groups Structures... Molecular [https://www.academia.edu/121919040/Exploring_Functional_Groups_and_Molecular_Structures_A_Comprehensive_Analysis_using_FTIR_Spectroscopy]
- 45. How to Interpret FTIR Results: A Beginner's Guide [https://www.azooptics.com/Article.aspx?ArticleID=2756]
- 46. Comprehensive Insights into Infrared Spectroscopy | SpringerLink [https://link.springer.com/chapter/10.1007/978-981-96-5996-8_4]
- 47. The Role of Light in Spectroscopy [https://www.azooptics.com/Article.aspx?ArticleID=2822]
- 48. Pharma Trends: 2025 services by Structure elucidation NMR [https://resolvemass.ca/structure-elucidation-services-by-nmr/]
- 49. High Resolution Proton NMR Spectra - Chemistry LibreTexts [https://chem.libretexts.org/Bookshelves/Physical_and_Theoretical_Chemistry_Textbook_Maps/Supplemental_Modules_(Physical_and_Theoretical_Chemistry)/Spectroscopy/Magnetic_Resonance_Spectroscopies/Nuclear_Magnetic_Resonance/NMR:_Structural_Assignment/High_Resolution_Proton_NMR_Spectra]
- 50. Download NMR Predict - Mestrelab [https://mestrelab.com/main-product/nmr-predict]
- 51. Using NMRView to Visualize and Analyze the NMR ... | SpringerLink [https://link.springer.com/protocol/10.1385/1-59259-809-9:313]
- 52. Mnova NMR Software for 1D and 2D NMR Data - Mestrelab [https://mestrelab.com/main-product/nmr]
- 53. NMRtist [https://nmrtist.org/]
- 54. Raman spectroscopy [https://en.wikipedia.org/wiki/Raman_spectroscopy]
- 55. Raman Techniques: Fundamentals and Frontiers - PMC [https://pmc.ncbi.nlm.nih.gov/articles/PMC6626094/]
- 56. Guide to Raman Spectroscopy [https://www.bruker.com/en/products-and-solutions/raman-spectroscopy/raman-basics/what-is-raman-spectroscopy.html]
- 57. Applications of Reproducible SERS Substrates for Trace ... [https://www.spectroscopyonline.com/view/applications-reproducible-sers-substrates-trace-level-detection]
- 58. Surface-enhanced Raman spectroscopy: a half-century ... [https://pubs.rsc.org/en/content/articlehtml/2025/cs/d4cs00883a]
- 59. Recent Progress in Nanomaterial-Based Surface-Enhanced ... [https://pmc.ncbi.nlm.nih.gov/articles/PMC11547707/]
- 60. Surface Enhanced Raman Spectroscopy for Quantitative ... [https://pmc.ncbi.nlm.nih.gov/articles/PMC7997108/]
- 61. Process analytical technology - Wikipedia [https://en.wikipedia.org/wiki/Process_analytical_technology]
- 62. The Power of PAT in Pharmaceutical Manufacturing [https://www.news-medical.net/life-sciences/The-Power-of-Process-Analytical-Technology-(PAT)-in-Pharmaceutical-Manufacturing.aspx]
- 63. Process Analytical Technology - an overview | ScienceDirect Topics [https://www.sciencedirect.com/topics/chemistry/process-analytical-technology]
- 64. Fiber Optic Probes in PAT : Enhancing Real - Time Process Analytics [https://www.findlight.net/blog/fiber-optic-probes-in-pat-enhancing-real-time-process-analytics/]
- 65. Process Analytical Technology Tools for Monitoring Pharmaceutical Unit Operations: A Control Strategy for Continuous Process Verification - PMC [https://pmc.ncbi.nlm.nih.gov/articles/PMC8234957/]
- 66. Application of Raman Spectroscopy as Process Analytical Technology... [https://www.thermofisher.com/blog/behindthebench/application-of-raman-spectroscopy-as-process-analytical-technology-pat-in-biopharmaceutical-manufacturing/]
- 67. PAT for monitoring the state of control in continuous manufacturing of solid oral dosage forms - PubMed [https://pubmed.ncbi.nlm.nih.gov/40689949/]
- 68. Spectroscopy | Definition, Types, & Facts | Britannica [https://www.britannica.com/science/spectroscopy]
- 69. FORCED DEGRADATION AND STABILITY TESTING... | PharmaTutor [https://www.pharmatutor.org/articles/forced-degradation-stability-testing-strategies-analytical-perspectives]
- 70. Forced Degradation as per... - ResolveMass Laboratories Inc. Study [https://resolvemass.ca/forced-degradation-study-ich-guideline/]
- 71. Evaluation of degradation for plasmid DNA in... pathways [https://pubmed.ncbi.nlm.nih.gov/10664540/]
- 72. Light Matter Interaction Group | Laboratory for Materials Simulations | PSI [https://www.psi.ch/en/lms/lmi-group]
- 73. Theory and modeling of light-matter interactions in chemistry: current and future - Physical Chemistry Chemical Physics (RSC Publishing) DOI:10.1039/D3CP01415K [https://pubs.rsc.org/en/content/articlehtml/2023/cp/d3cp01415k]
- 74. - Single -level molecule of interfacial molecular structures... detection [https://pubs.rsc.org/en/content/articlelanding/2025/sc/d4sc07863b]
- 75. and microscopy with emerging Enhancing in... spectroscopy methods [https://www.nature.com/articles/s41565-025-01992-3?error=cookies_not_supported&code=c6e0194a-e8eb-4fb7-8009-8b0171e73a47]
- 76. Biological Matrix in Quantitative Tandem Mass... Effects [https://pmc.ncbi.nlm.nih.gov/articles/PMC4695332/]
- 77. in Mass Matrix Combined with... | IntechOpen Effects Spectrometry [https://www.intechopen.com/chapters/45040]
- 78. Pre-processing visualization of hyperspectral fluorescent data with Spectrally Encoded Enhanced Representations | Nature Communications [https://www.nature.com/articles/s41467-020-14486-8]
- 79. Data Visualization Best Practices - Purdue OWL [https://owl.purdue.edu/owl/general_writing/visual_rhetoric/data_visualization/index.html]
- 80. Color palette - Partner Marketing Hub [https://partnermarketinghub.withgoogle.com/brands/google-news/visual-identity/color-palette/]
- 81. 137+ Google Color Palettes: Hex Codes, RGB & Meaning [https://theapplaunchpad.com/color-palettes/google]
- 82. Google New Color Palette [https://www.color-hex.com/color-palette/51381]
- 83. A review on spectral data preprocessing techniques for machine learning and quantitative analysis - PMC [https://pmc.ncbi.nlm.nih.gov/articles/PMC12221524/]
- 84. Mastering Spectral Overlap [https://www.numberanalytics.com/blog/mastering-spectral-overlap-instrumental-analysis]
- 85. US7847934B2 - Method for correcting spectral in ICP... interference [https://patents.google.com/patent/US7847934B2/en]
- 86. : Types, Avoidance and Correction Spectral Interference [https://www.inorganicventures.com/icp-guide/spectral-interference:-types-avoidance-and-correction]
- 87. A Statistical Approach of Background Removal and Spectrum Identification for SERS Data | Scientific Reports [https://www.nature.com/articles/s41598-020-58061-z]
- 88. Strategies to overcome spectral in ICP-MS detection interference [https://pubs.rsc.org/en/content/articlelanding/2016/ja/c5ja00497g]
- 89. The Analysis of Overlapping Absorption Spectral by Derivative... Bands [https://opg.optica.org/as/abstract.cfm?uri=as-9-2-78]
- 90. Optimizing plasmonic nanopipettes to enhance spectroscopic ... [https://www.aip.org/scilights/optimizing-plasmonic-nanopipettes-to-enhance-spectroscopic-sensitivity]
- 91. Manipulating the light - matter in interactions nanocavities... plasmonic [https://pmc.ncbi.nlm.nih.gov/articles/PMC9325739/]
- 92. Hybrid Plasmonic for Enhanced Single-Molecule... Nanostructures [https://pmc.ncbi.nlm.nih.gov/articles/PMC10173688/]
- 93. [PDF] Design considerations in high- sensitivity ... | Semantic Scholar [https://www.semanticscholar.org/paper/Design-considerations-in-high-sensitivity-off-axis-Moyer-Sayres/ead4c693e4ac268e927f8bd50c7c618e0035fbff]
- 94. Short-wavelength optoacoustic spectroscopy based on water muting - PMC [https://pmc.ncbi.nlm.nih.gov/articles/PMC7049157/]
- 95. New UV–Visible Spectroscopy Method Harnesses Machine Learning to Detect Contamination in Microalgae Cultures | Spectroscopy Online [https://www.spectroscopyonline.com/view/new-uv-visible-spectroscopy-method-harnesses-machine-learning-to-detect-contamination-in-microalgae-cultures]
- 96. Quantitative evaluation of true-to-life nanoplastics using UV-visible... [https://pubs.rsc.org/en/content/articlehtml/2025/en/d5en00502g]
- 97. Spectrophotometry - an overview | ScienceDirect Topics [https://www.sciencedirect.com/topics/earth-and-planetary-sciences/spectrophotometry]
- 98. Infrared spectroscopy technique for quantification of compounds in plant-based medicine and supplement - PMC [https://pmc.ncbi.nlm.nih.gov/articles/PMC7832193/]
- 99. of radiation with Interaction | matter Class Notes Spectroscopy [https://fiveable.me/spectroscopy/unit-1/interaction-radiation-matter/study-guide/sYamh7OdU4KqMukp]
- 100. Review of multidimensional data processing approaches for Raman and infrared spectroscopy | EPJ Techniques and Instrumentation | Full Text [https://epjtechniquesandinstrumentation.springeropen.com/articles/10.1140/epjti/s40485-015-0018-6]
- 101. for optical spectral analysis of multicomponent mixtures Chemometrics [https://hum-ecol.ru/0044-4502/article/view/692360]
- 102. Recent Research in Chemometrics and AI for... | Spectroscopy Online [https://www.spectroscopyonline.com/view/recent-research-in-chemometrics-and-ai-for-spectroscopy-part-i-foundations-definitions-and-the-integration-of-artificial-intelligence-in-chemometric-analysis]
- 103. Artificial Intelligence in Analytical Spectroscopy, Part II: Examples in Spectroscopy | Spectroscopy Online [https://www.spectroscopyonline.com/view/artificial-intelligence-in-analytical-spectroscopy-part-ii-examples-in-spectroscopy]
- 104. Unlocking Insights: Multivariate Data Analysis (MVA) and... - HORIBA [https://www.horiba.com/gbr/company/news/detail/news/2/2025/unlocking-insights-multivariate-data-analysis-mva-and-chemometrics-on-raman-spectroscopy-data-with-labspec-6/]
- 105. Raman spectroscopy for nanomaterials | PPT [https://www.slideshare.net/slideshow/raman-spectroscopy-for-nanomaterials/39462768]
- 106. Signal-to-Noise Ratio - an overview | ScienceDirect Topics [https://www.sciencedirect.com/topics/chemistry/signal-to-noise-ratio]
- 107. Metallic and semiconductor nanomaterials for surface- enhanced ... [https://pubs.rsc.org/en/content/articlelanding/2025/cc/d5cc02022k]
- 108. Low-cost compact optical spectroscopy and novel spectroscopic algorithm for point-of-care real-time monitoring of nanoparticle delivery in biological tissue models - PMC [https://pmc.ncbi.nlm.nih.gov/articles/PMC9635618/]
- 109. Progress in application of terahertz time-domain spectroscopy for pharmaceutical analyses - PMC [https://pmc.ncbi.nlm.nih.gov/articles/PMC10393043/]
- 110. for the analysis of Terahertz applications solid dosage forms [https://www.pharmtech.com/view/terahertz-applications-analysis-solid-dosage-forms]
- 111. Interrogation of the Intermolecular Forces That Drive Bulk Properties... [https://pubmed.ncbi.nlm.nih.gov/40491562/]
- 112. time-domain Terahertz and the... | Nature Materials spectroscopy [https://www.nature.com/articles/nmat1848?error=cookies_not_supported]
- 113. pulsed Terahertz and imaging in the pharmaceutical... spectroscopy [https://pubmed.ncbi.nlm.nih.gov/17270075/]
- 114. Using terahertz pulsed spectroscopy to quantify pharmaceutical polymorphism and crystallinity - PubMed [https://pubmed.ncbi.nlm.nih.gov/15736195/]
- 115. Chemometric Evaluation of THz Spectral Similarity for the Selection of Early Drug Candidates | Scientific Reports [https://www.nature.com/articles/s41598-017-14819-6]
- 116. Terahertz Spectroscopy for Non-Destructive Solid-State Investigation of Norfloxacin in Paper Tablets after Wet Granulation - PMC [https://pmc.ncbi.nlm.nih.gov/articles/PMC10386691/]
- 117. Frontiers | Towards Higher Sensitivity of Mass Spectrometry ... [https://www.frontiersin.org/journals/chemistry/articles/10.3389/fchem.2021.813359/full]
- 118. Molecular Spectroscopy Market to Reach $6.4 billion, Globally, by 2034 at 5% CAGR: Allied Market Research [https://www.prnewswire.co.uk/news-releases/molecular-spectroscopy-market-to-reach-6-4-billion-globally-by-2034-at-5-cagr-allied-market-research-302611536.html]
- 119. AI-Powered Raman Spectroscopy Signals New Era for Drug Development and Disease Diagnosis [https://www.spectroscopyonline.com/view/ai-powered-raman-spectroscopy-signals-new-era-for-drug-development-and-disease-diagnosis]
- 120. Lessons learned: establishing a CLIA-equivalent laboratory for targeted... [https://clinicalproteomicsjournal.biomedcentral.com/articles/10.1186/s12014-024-09455-y]
- 121. Comparison of Optical Spectroscopy Techniques for Pharmaceutical... [https://www.americanpharmaceuticalreview.com/Featured-Articles/618205-Comparison-of-Optical-Spectroscopy-Techniques-for-Pharmaceutical-Analysis/]
- 122. ( ICH ) Validation of Analytical Procedures: Text and Methodology... Q 2 R 1 [https://www.gmp-compliance.org/guidelines/gmp-guideline/ich-q2r1-validation-of-analytical-procedures-text-and-methodology]
- 123. ICH q 2 [https://www.xinfuda-group.com/news/ich-q2.html]
- 124. Correlate light–matter interactions in different spectral regimes | Light: Science & Applications [https://www.nature.com/articles/s41377-022-00724-9]
- 125. Comparing Raman Spectroscopy with Other Techniques [https://www.azom.com/article.aspx?ArticleID=16152]
- 126. NMR Spectroscopy Revolutionizes Drug Discovery | Spectroscopy Online [https://www.spectroscopyonline.com/view/nmr-spectroscopy-revolutionizes-drug-discovery]
- 127. Review of in-situ non - and micro- destructive for pigment... techniques [https://www.nature.com/articles/s40494-025-01675-1?error=cookies_not_supported&code=0234eee7-917d-4ed0-a5ae-6275cb04d5ae]
- 128. Molecules | Special Issue : Application of Spectroscopy for Drugs [https://www.mdpi.com/journal/molecules/special_issues/TB698458HZ]
- 129. Material Survey in the Modern and Contemporary Collections... :: SSRN [https://papers.ssrn.com/sol3/papers.cfm?abstract_id=5249981]
- 130. An Introduction to IR and Raman : Harnessing the... Spectroscopy [https://www.triprinceton.org/post/ir-and-raman-spectroscopy-harnessing-the-power-of-light-in-molecular-analysis]
- 131. Stimulated Raman scattering microscopy: an emerging tool for drug discovery - PMC [https://pmc.ncbi.nlm.nih.gov/articles/PMC4839273/]
- 132. Difference in raman spectroscopy and ir spectroscopy | PPTX [https://www.slideshare.net/slideshow/difference-in-raman-spectroscopy-and-ir-spectroscopy/238621739]
- 133. Advances of surface-enhanced Raman and IR : from... spectroscopies [https://www.nature.com/articles/s41377-021-00599-2?error=cookies_not_supported]
- 134. Optimized machine learning approaches to combine surface-enhanced... [https://pubs.rsc.org/en/content/articlelanding/2025/an/d4an01496k]
- 135. Frontiers | Raman and IR as a promising approach to... spectroscopy [https://www.frontiersin.org/journals/chemistry/articles/10.3389/fchem.2025.1543663/full]
- 136. Quantum ESPRESSO: Calculating IR and Raman Spectra — Tutorials... [https://www.scm.com/doc/Tutorials/ExternalPrograms/QEIRRamanSpectra.html]
- 137. Correcting for Spectral -Talk in Dual-Color Fluorescence... Cross [https://pmc.ncbi.nlm.nih.gov/articles/PMC3495304/]
- 138. : Unlocking Precision in Spectroscopy ... Quality by Design Pharma [https://www.americanpharmaceuticalreview.com/Specialty/Spectroscopy/Featured-Articles/609722-Quality-by-Design-Unlocking-Precision-in-Pharma-Formulation/]
- 139. Spectroscopy | American Pharmaceutical Review [https://www.americanpharmaceuticalreview.com/APR-Spectroscopy/]
- 140. A Beginner’s Guide to Quality by Design (QbD) for HPLC Method Development | Separation Science [https://www.sepscience.com/a-beginners-guide-to-quality-by-design-qbd-for-hplc-method-development-11307]
- 141. A Quality by Design (QbD) approach to the development of a gradient high-performance liquid chromatography for the simultaneous assay of curcuminoids and doxorubicin from long-circulating liposomes - ScienceDirect [https://www.sciencedirect.com/science/article/abs/pii/S0731708518304953]
- 142. QbD approach to HPLC method development and validation of ceftriaxone sodium | Future Journal of Pharmaceutical Sciences | Full Text [https://fjps.springeropen.com/articles/10.1186/s43094-021-00286-4]
- 143. (PDF) Pharmaceutical manufacturing and the quality ... by design [https://www.academia.edu/86849455/Pharmaceutical_manufacturing_and_the_quality_by_design_QBD_process_analytical_technology_PAT_approach]
- 144. Process Spectroscopy Market to Worth Over US$ 53.8 Billion By 2033 | Astute Analytica [https://www.globenewswire.com/news-release/2025/08/27/3140007/0/en/Process-Spectroscopy-Market-to-Worth-Over-US-53-8-Billion-By-2033-Astute-Analytica.html]
- 145. Exploring the Future of Molecular Spectroscopy Market: Trends Shaping Analytical Science by 2030 [https://www.openpr.com/news/4229624/exploring-the-future-of-molecular-spectroscopy-market-trends]
- 146. Spectroscopy Equipment and Accessories 1.6 CAGR Growth Outlook 2025-2033 [https://www.datainsightsmarket.com/reports/spectroscopy-equipment-and-accessories-1534616]
- 147. Molecular Spectroscopy Market - Size, Share & Industry Analysis [https://www.mordorintelligence.com/industry-reports/molecular-spectroscopy-market]
- 148. - Cost : Step-by-Step Guide & Examples Benefit Analysis [https://www.rippling.com/blog/cost-benefit-analysis-example]
- 149. 4 Cost - Benefit | Evaluating Testing, Costs, and Benefits of... Analysis [https://nap.nationalacademies.org/read/12699/chapter/7]
- 150. 2025 Review of Spectroscopic Instrumentation [https://www.spectroscopyonline.com/view/2025-review-of-spectroscopic-instrumentation]
- 151. What Type of Equipment Is Used in Chemistry Research? [https://www.excedr.com/blog/what-type-of-equipment-is-used-in-chemistry-research]