Mastering Spectral Overlap: Strategies for High-Parameter Flow Cytometry Panel Design
This article provides a comprehensive guide for researchers and drug development professionals on managing spectral overlap in flow cytometry.
Mastering Spectral Overlap: Strategies for High-Parameter Flow Cytometry Panel Design
Abstract
This article provides a comprehensive guide for researchers and drug development professionals on managing spectral overlap in flow cytometry. It covers the fundamental principles of spectral flow cytometry, detailing how full-spectrum detection and unmixing algorithms overcome the limitations of conventional compensation. The content explores practical methodologies for panel design, reagent selection, and blocking protocols, alongside advanced troubleshooting techniques for common errors. Finally, it examines validation frameworks and the comparative advantages of spectral cytometry in clinical and translational research, offering a complete resource for developing robust, high-parameter assays.
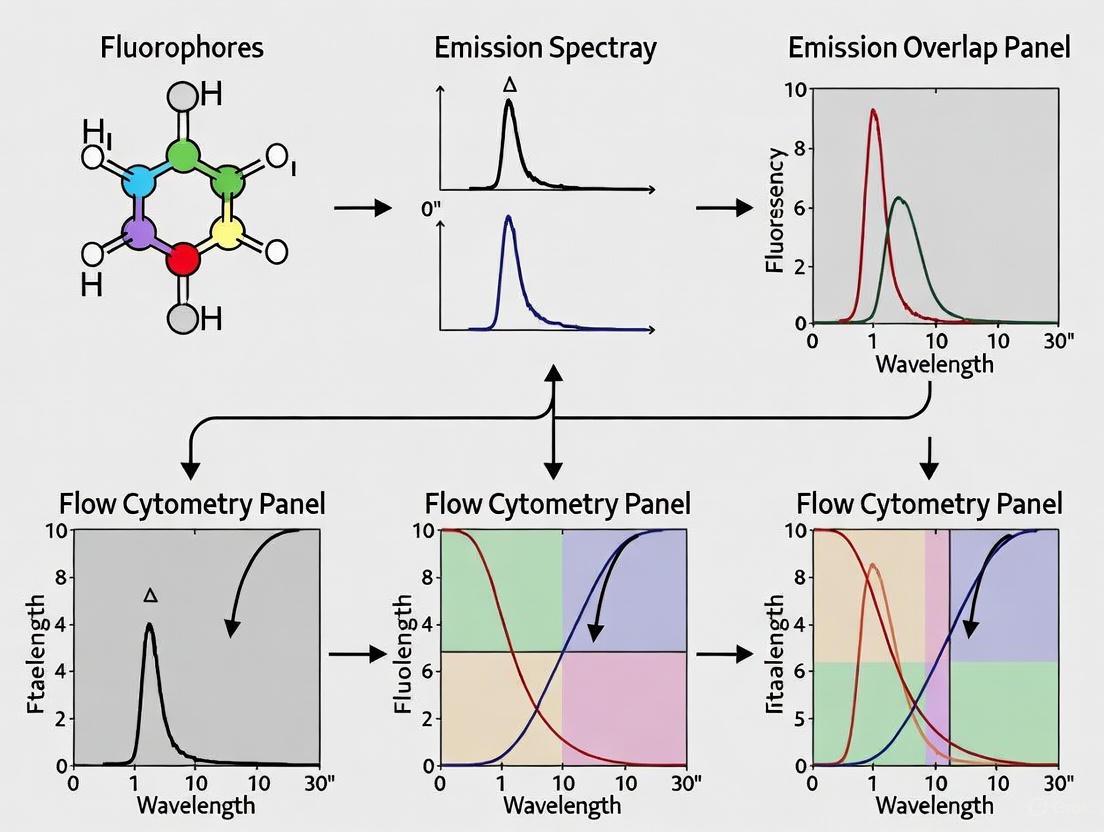
Understanding Spectral Overlap: From Conventional Limits to Spectral Solutions
Fundamental Definitions
What are spectral overlap and spillover in flow cytometry?
Spectral Overlap is the phenomenon where the emission spectrum (the range of light wavelengths a fluorophore emits) of one fluorophore overlaps with the emission spectrum of another [1]. Spillover is the concrete result of this overlap: the fluorescent signal from one fluorophore is detected in the optical channel (photodetector) intended for a different fluorophore [2] [3] [1].
This occurs because fluorophores do not emit light at a single, precise wavelength. Instead, they emit across a broad range of wavelengths [4]. When using multiple fluorophores in a single panel, their broad emission spectra inevitably overlap, causing one fluorophore's signal to "spill over" into another's detector [2].
Why is correcting for spillover so critical for accurate data?
Without correction, spillover can lead to false-positive results, making it appear that a cell expresses a marker that it does not [1]. This compromises the accuracy and reliability of your data [2]. The process of compensation is a mathematical correction applied to raw flow cytometry data to subtract the spillover signal from secondary channels, ensuring that the signal in each detector accurately reflects the expression of its intended target [1] [4].
The diagram below illustrates the core concepts and their relationships:
Troubleshooting FAQs
The Problem: My fluorescence-minus-one (FMO) control shows a spread-out negative population, making it hard to set a clear gate. What is happening? This is likely spillover spreading, a phenomenon where the process of compensating for spillover introduces increased variance, causing the negative population to widen [3] [5]. This is not an error but a fundamental property of the compensation mathematics and the measurement error inherent in detecting fluorescence [5]. It is most pronounced when a bright fluorophore with high spillover is paired with a dim marker [3].
The Solution:
- Panel Redesign: For future experiments, use a spillover spreading matrix (SSM) during panel design to identify and avoid fluorophore combinations with high spillover, especially for co-expressed markers [3].
- Gating Adjustment: When analyzing current data, gate conservatively by following the contour of the spread population in your FMO control rather than drawing a tight gate that may include false positives.
The Problem: After compensation, my fully stained sample shows a population that is negative for all markers. Did I over-compensate? Yes, this is a classic sign of over-compensation [1]. This occurs when the software subtracts too much signal from a channel, creating artificial negative values [1].
The Solution:
- Verify Control Brightness: Ensure your single-stained compensation controls are at least as bright as, or brighter than, the sample you are compensating [2] [4]. Dim controls can lead to incorrect spillover calculations.
- Re-run Compensation: If controls are adequate, re-run the compensation calculation using automatic compensation tools if available, or manually adjust the over-compensated value downward [1].
The Problem: My data shows "smeared" populations that diagonal, and I cannot resolve clear positive and negative cells. This indicates under-compensation, where not enough spillover signal has been subtracted from the affected channel [1]. Residual spillover creates a correlated signal between two channels, causing the population to smear along a diagonal axis [4].
The Solution:
- Check Control Specificity: Confirm that your single-stain controls are pure and specific. A control contaminated with another fluorophore will provide an incorrect spillover value.
- Increase Compensation: Increase the compensation value for the culprit fluorophore into the affected channel until the median fluorescence of the positive and negative populations is aligned vertically (or horizontally) on the bi-axial plot [1].
Experimental Protocols
Protocol 1: Calculating and Applying Compensation Using Single-Stain Controls
Objective: To correct for spectral spillover in a multicolor flow cytometry experiment using single-stain controls.
Materials:
- Research Reagent Solutions:
- Single-Stain Controls: Cells or antibody-capture beads stained individually with each fluorophore-conjugated antibody used in your panel [1] [6].
- Unstained Control: Cells or beads with no fluorescent stain to measure autofluorescence and background [1] [6].
- Viability Dye: A fixable viability dye to exclude dead cells, which exhibit high nonspecific binding [7] [6].
- Fc Receptor Blocking Solution: To reduce nonspecific antibody binding [7] [6].
Methodology:
- Prepare Controls: For each fluorophore in your panel, prepare a dedicated tube of cells or compensation beads stained with only that fluorophore [1] [6].
- Match Experimental Conditions: Treat your compensation controls exactly like your experimental samples (same fixation, permeabilization, incubation time, and lot of reagents) [2] [1].
- Acquire Data: Run each single-stain control and the unstained control on the flow cytometer. Collect a sufficient number of events (at least 5,000 positive events for each control) for a statistically robust calculation [6].
- Perform Compensation: Use your flow cytometry software's automatic compensation tool. The software will calculate a spillover coefficient (the proportion of signal measured in a secondary detector relative to the primary detector) for each fluorophore pair and generate a compensation matrix [2] [1].
- Apply to Experimental Data: Apply the calculated compensation matrix to your fully stained experimental samples [1].
Protocol 2: Utilizing a Spillover Spreading Matrix (SSM) for Panel Design
Objective: To proactively assess and minimize the impact of spillover spreading during the design phase of a high-parameter flow cytometry panel.
Materials:
- Software Tool: A panel design platform with an integrated Spectra Viewer and SSM calculator (e.g., FluoroFinder, BD Spectrum Viewer) [3] [8].
Methodology:
- Input Instrument Configuration: Select your specific flow cytometer model within the software to define its laser and detector configuration [3] [8].
- Assign Fluorophores: Add the fluorophores you are considering for your panel to the virtual worksheet.
- Generate SSM: The software will generate an SSM, a table where each value represents the standard deviation of the spillover spreading error for each fluorophore pair [3].
- Analyze the Matrix:
- Identify combinations with high spillover spreading values (a general threshold is >10) [3].
- Avoid assigning high-spreading fluorophore pairs to markers that are co-expressed on the same cell population [3].
- Reassign fluorophores to minimize high values, prioritizing the separation of bright fluorophores from dim or co-expressed markers [3].
Advanced Concepts: The Shift to Spectral Flow Cytometry
How does spectral flow cytometry handle spillover differently? Conventional flow cytometry uses compensation to correct spillover after detection, while spectral flow cytometry uses spectral unmixing to identify fluorophores based on their full spectral signature [9].
- Conventional Cytometry: Uses optical filters to direct a limited portion of a fluorophore's emission to a single detector. Spillover is corrected mathematically via compensation [9].
- Spectral Cytometry: Collects the full emission spectrum (from ~350-900 nm) of every fluorophore across an array of detectors [9]. The instrument then uses a reference library of each fluorophore's unique spectral signature to "unmix" the combined signal from a cell, assigning the correct intensity for each fluorophore [9]. This allows for better resolution of fluorophores with overlapping peak emissions and can separate cellular autofluorescence as a distinct signal [9].
Essential Research Reagent Solutions
| Item | Function in Managing Spectral Overlap |
|---|---|
| Antibody-Capture Beads | Provide a uniform, cell-free substrate for generating consistent single-stain compensation controls, eliminating biological variability [1]. |
| Fixable Viability Dyes | Allow for the identification and exclusion of dead cells during analysis, which reduces high background fluorescence that complicates spillover correction [7] [6]. |
| Fc Receptor Blocking Reagent | Minimizes nonspecific antibody binding to Fc receptors on cells, reducing background signal and leading to cleaner compensation [7] [6]. |
| Tandem Dyes | Enable the use of more fluorophores on an instrument with a limited number of lasers by creating a distinct emission peak via FRET. Note: They can be prone to degradation and increased spillover [3]. |
| Spectra Viewer & Panel Builder | Online tools that allow visualization of fluorophore excitation/emission spectra and calculate spillover/spreading to optimize panel design before purchasing reagents [3] [8]. |
In conventional flow cytometry, the accurate detection of multiple fluorochromes is fundamentally challenged by spectral overlap. This occurs because fluorochromes emit light across a broad range of wavelengths, and their emission spectra frequently overlap. While compensation is a standard mathematical correction for this spillover, it has inherent limitations that can compromise data accuracy, especially in complex multicolor panels. Understanding these limitations and their associated troubleshooting strategies is crucial for researchers and drug development professionals relying on high-quality flow cytometry data.
FAQ: Understanding Compensation and Its Pitfalls
What is compensation and why is it necessary?
Compensation is a mathematical correction required in conventional flow cytometry to account for fluorescence spillover—the phenomenon where the emission of one fluorochrome is detected in the detector of another. This is necessary because fluorochromes do not emit light at a single perfect wavelength. Instead, they have an emission spectrum, often with a long "tail" that can be detected by photomultiplier tubes (PMTs) assigned to other fluorochromes [10]. For example, fluorescein (FITC) has a maximal emission at 524 nm, but its emission tail can extend beyond 600 nm, leading to detectable signal in the PE or other channels if not corrected [10]. Without compensation, it is impossible to make an accurate measurement of a single fluorochrome in the presence of multiple labels [10].
What are the most common errors that occur during compensation?
Common compensation errors often stem from issues with the single-color controls used to calculate the spillover values [11]. Key problems include:
- Inadequate Controls: Using controls that do not match the experimental samples, for example, using beads instead of cells, or using fixed controls for unfixed samples (and vice versa) [11].
- Poor Signal: Controls with weak positive signals or an insufficient number of positive events can lead to inaccurate compensation calculations [11].
- Autofluorescence: Cell autofluorescence, particularly in certain channels, can mix with the fluorophore signal and create a hybrid signal that is not properly accounted for during compensation [11] [12].
- Tandem Dye Degradation: Tandem dyes (e.g., PE-Cy7) can break down, causing a blue-shift in their emission spectrum. If the single-color control has not undergone the same degradation, the compensation matrix will be incorrect [11].
How can I identify a compensation error in my data?
The most characteristic visual signature of a compensation error is a skewed or correlated population in a two-parameter plot [11]. This often manifests as a "leaning" cloud of positive events, where an increase in fluorescence in one channel is accompanied by an artificial increase or decrease in another channel. A specific and common artifact is "hyper-negative" populations, where a compensated population appears below zero on the axis [11]. This is biologically implausible and indicates an over-correction for spillover.
What is "spreading error" and how is it different from a compensation error?
It is critical to distinguish between an incorrect compensation and spreading error.
- Compensation Error: A mistake in the calculation or application of the spillover correction, resulting in skewed or correlated data. This is often fixable with better controls [11].
- Spreading Error: An inherent, unavoidable consequence of the physics of fluorescence detection and the compensation process itself. It refers to the increase in the variance (spread) of a negative population in a detector that is receiving a large compensation value from a bright fluorochrome in another detector [12]. Unlike a compensation error, spreading error is symmetrical and cannot be eliminated by perfect compensation; it must be managed through careful panel design [11].
Troubleshooting Guide: Common Compensation-Related Issues
| Problem | Possible Cause | Diagnostic Clues | Solution |
|---|---|---|---|
| No or Weak Signal [13] [14] [15] | Incorrect PMT voltage/Gain | All fluorochromes appear dim; signal is close to axis. | Run positive control and adjust voltage/gain. |
| Antibody degradation or incorrect storage | Signal is weak despite correct instrument settings. | Titrate antibody; use fresh aliquots. | |
| Inadequate permeabilization (intracellular staining) | Surface markers work, but intracellular do not. | Validate permeabilization protocol; include Triton X-100 [13]. | |
| High Background/Non-specific Staining [16] [14] | Overcompensation | Populations appear "hyper-negative". | Recalculate compensation with better single-stain controls [11]. |
| Fc receptor binding or antibody trapping | High background in multiple channels. | Add Fc receptor blocking step; optimize wash steps with detergent [16] [14]. | |
| Excessive antibody concentration | High fluorescence intensity but poor resolution. | Titrate antibodies to find optimal concentration. | |
| Skewed Populations (Compensation Error) [11] | Mismatched single-stain controls | Controls (beads/cells) do not match sample treatment. | Use biological single-stain controls that match sample prep. |
| Autofluorescence interference | High background in channels ~450-500nm and ~650-750nm. | Use FMO controls; consider automated autofluorescence extraction on spectral cytometers [12]. | |
| Tandem dye degradation | Sudden appearance of spillover errors in a previously working panel. | Use fresh tandem dyes; protect from light. | |
| Poor Resolution of Rare Populations [16] | Spreading error | Negative population is broadened in a channel receiving high compensation from a bright marker. | Re-design panel to avoid large compensation values on rare population markers. |
| Insufficient event collection | Statistics on rare population are noisy. | Acquire more total events; use high cell-loading concentrations. | |
| High background from dead cells/debris | False positives from autofluorescent debris. | Gate out dead cells and debris rigorously [16]. |
Experimental Protocols for Accurate Compensation
Protocol 1: Generating Reliable Single-Color Controls
A robust compensation matrix hinges on high-quality single-color controls [10] [11].
Materials:
- Research Reagent Solutions:
- Viability Dye: To exclude dead cells (e.g., DAPI, Propidium Iodide).
- Fc Receptor Blocking Solution: To reduce non-specific binding (e.g., purified human or mouse IgG).
- UltraComp eBeads: Alternatively, compensation beads for surface markers.
- Positive Control Cells: Cells known to express the target antigen at a high level.
- Fixation/Permeabilization Buffer: If staining intracellular targets.
Methodology:
- Match Your Samples: Controls must be subject to the exact same protocols as test samples, including fixation, permeabilization, and incubation times [11].
- Use Biological Controls: While beads are stable, single-stained cells are often preferable as they account for cell autofluorescence and antibody-specific binding characteristics [11].
- Ensure Brightness: The positive population in the control should be several logs brighter than the negative population to ensure an accurate calculation of the spillover value [11].
- Acquire Sufficient Events: Collect enough positive events (at least a few hundred) for a robust statistical calculation [11].
- Avoid Mix-Ups: Carefully label all controls to prevent using the wrong single-color control for a channel.
Protocol 2: Using FMO Controls to Validate Gating and Reveal Spreading Error
Fluorescence Minus One (FMO) controls are essential for setting gates for dim markers and visualizing the effects of spreading error [11].
Methodology:
- Prepare the Control: Stain the sample with all antibodies in the panel except one.
- Set Gates: Use the FMO control to set the positive gate for the omitted antibody. This reveals how spreading error and background affect the negative population in a real-sample context.
- Troubleshoot: If the staining in the full panel does not match the pattern expected from the FMO, this indicates a potential panel design flaw or compensation issue.
The Scientist's Toolkit: Key Reagents for Managing Spectral Overlap
| Item | Function in Experiment | Application Note |
|---|---|---|
| Compensation Beads | Provide a uniform, bright positive signal for setting compensation without using cells. | Ideal for stable surface markers. Cannot account for cellular autofluorescence [11]. |
| Fc Receptor Blocking Solution | Blocks non-specific antibody binding to Fc receptors on immune cells, reducing background. | Critical for staining immune cells from blood, spleen, or lymph nodes [16]. |
| Viability Dye | Distinguishes live from dead cells. Dead cells have high autofluorescence and non-specific antibody binding. | Essential for gating and excluding artifacts that complicate compensation [16]. |
| Bright Fluorophores (e.g., PE, APC) | Used for detecting markers with low expression levels. | Pairing a dim marker with a bright fluorophore improves resolution and simplifies compensation [13]. |
| Tandem Dyes (e.g., PE-Cy7, APC-Cy7) | Combine a donor fluorophore with an acceptor to create new emission profiles, expanding panel size. | Prone to degradation; batch variability and instability can cause major compensation shifts [11]. |
| FMO Controls | Used to accurately set gates for dim markers and visualize the impact of spreading error. | The gold standard for validating gating strategies in multicolor panels [11]. |
Visualizing the Compensation Process and Its Challenges
The following diagram illustrates the core principles of fluorescence spillover and the mathematical compensation process in conventional flow cytometry.
Figure 1. The principle of fluorescence spillover and compensation. Fluorophores emit light across a broad spectrum, leading to spillover into non-primary detectors. The observed signal is a mixture, which compensation aims to correct using a spillover matrix to calculate the actual fluorescence.
The limitations of filter-based detection and compensation become especially apparent when compared to the spectral approach, as shown below.
Figure 2. A comparison of conventional and spectral flow cytometry architectures. The conventional system's filter-based detection and "one detector-one fluorophore" model is inherently limited and prone to spreading error. In contrast, spectral cytometry captures the full emission spectrum, enabling superior unmixing of complex fluorophore combinations.
Core Concepts FAQ
What constitutes the fundamental difference between spectral and conventional flow cytometry?
The fundamental difference lies in how fluorescence signals are detected and resolved. Conventional flow cytometry uses a limited number of detectors per laser to measure only the peak emission of each fluorochrome. Its ability to multiplex dyes with overlapping emission spectra is restricted and complicated by compensation procedures [17]. In contrast, spectral flow cytometry uses multiple detectors to capture the entire fluorescence emission spectrum for each fluorochrome across multiple laser lines. This allows for more precise signal unmixing via algorithms, even between dyes with highly overlapping emissions, enabling the simultaneous analysis of a greater number of parameters [17].
How does algorithmic unmixing enhance the detection of dimly expressed markers?
Algorithmic unmixing enhances detection by characterizing and extracting autofluorescence (AF) signals using the same linear unmixing algorithms employed in fluorochrome identification [17]. The extraction of AF minimizes background noise compared to conventional flow cytometry. Furthermore, the integration of more sensitive detectors in spectral technologies significantly enhances the resolution of cell populations in multiparametric assays. This combined approach improves the overall accuracy and clarity of results, which is particularly beneficial for detecting markers expressed at low levels [17].
What are the primary clinical and research applications empowered by this technology?
Spectral flow cytometry is redefining clinical diagnostics and research, particularly in hematologic malignancies and immunological disorders [17].
- Minimal Residual Disease (MRD) Detection: It allows for high-resolution quantification of leukemic burden with high sensitivity using single-tube assays, which is critical for risk assessment and guiding treatment decisions [17].
- Comprehensive Immune Profiling: Its high-parameter capability supports deep phenotyping for biomarker discovery and therapy monitoring, such as tracking CAR-T cell kinetics and profiling T-cell exhaustion in immuno-oncology [17].
- Drug Discovery & Clinical Trials: Pharma and CROs use it for enhanced pharmacodynamic biomarker monitoring and discovery, especially in scenarios with limited specimen availability like bone marrow aspirates or pediatric biopsies [17].
Troubleshooting Guides
Issue: Poor Resolution after Unmixing (High Background/Spreading)
| Potential Cause | Recommended Solution | Underlying Principle |
|---|---|---|
| High Autofluorescence | Use fresh cells or cells fixed for a short period. Run matching unstained cells to assess autofluorescence levels [18]. | Autofluorescence from aged or poorly handled cells contributes significantly to background noise, interfering with unmixing algorithms. |
| Spectral Spillover Spreading | Utilize a spectrum viewer during panel design to select fluorochromes with minimal spectral overlap. Pair dim markers with bright fluorochromes and highly expressed antigens with dimmer fluorochromes [18] [19] [20]. | Spillover spreading is caused by measurement errors from multiple fluorochromes spilling into each other's detectors, which can mask dim positive populations [18]. |
| Inadequate Controls for Unmixing | Ensure single-stained controls for each fluorochrome are as bright or brighter than the fully stained sample. Use the same fluorophore in controls and experiments, and treat them identically (e.g., same fixative) [21]. | The unmixing algorithm relies on reference controls to build a spectral library. Incorrect controls lead to inaccurate unmixing and data artifacts. |
| Polymer Dye Instability | When using more than one polymer dye (e.g., Brilliant Violet dyes), include a specific polymer stain buffer in your staining protocol to prevent dye-dye interactions [21]. | Without a stabilizer, some polymer dyes can stick together, forming aggregates that alter their spectral signature and cause unmixing errors. |
Spectral Unmixing Troubleshooting Workflow
Issue: Weak or Absent Fluorescence Signal
| Potential Cause | Recommended Solution | Underlying Principle |
|---|---|---|
| Low Antigen Abundance or Accessibility | For intracellular targets, ensure adequate fixation and permeabilization. For surface antigens, keep cells on ice during processing to prevent internalization. Use a Golgi-block step (e.g., Brefeldin A) for secreted proteins like cytokines [18] [15]. | The target protein may not be present, may be expressed at low levels, or may be inaccessible to the antibody due to its subcellular location. |
| Suboptimal Antibody Titration | Titrate the antibody concentration for your specific cell type and experimental conditions. A concentration that is too low will yield a weak signal [18]. | Although an antibody may be validated for flow cytometry, the optimal concentration can vary based on cell type and antigen density. |
| Fluorochrome-Conjugate Issues | For intracellular staining, use fluorochromes with a low molecular weight to improve cell entry. Protect samples from light to prevent photobleaching [15]. | Large fluorochrome conjugates can reduce antibody motility, preventing access to intracellular epitopes. Fluorochromes can fade upon light exposure. |
| Instrument Laser Misalignment | Run calibration beads to check instrument performance. Ensure lasers are aligned correctly for optimal excitation [18] [15]. | Misaligned lasers result in inefficient excitation of fluorochromes, leading to a weak emitted signal. |
Issue: Unmixing Errors and Data Artifacts
This issue manifests as events appearing below zero on plots or populations skewed into the negative region [21].
Diagnostic Protocol:
- Identify Error Scope: Determine if the unmixing error exists in both the fully stained tube and the single-stained control tube, or only in the fully stained tube [21].
- If errors exist in both controls and full stains:
- Recalculate Unmixing: The most likely cause is an error in setting up the unmixing algorithm. Revisit the software setup to ensure the correct single-stained controls are assigned to their corresponding fluorochrome channels and that gating for the calculation was accurate [21].
- Verify Control Quality: Ensure the autofluorescence of the positive particles in the control is appropriately matched to the negatives, especially when using a mix of cells and beads [21].
- If errors exist only in full stains:
- Check Control Brightness: The single-stained control must be as bright or brighter than the corresponding signal in the fully stained sample. Compare the median fluorescence intensity (MFI) [21].
- Ensure Treatment Consistency: The single-stained controls and fully stained samples must be treated identically (e.g., the same fixation protocol, same buffer additives). Fixative can slightly alter a fluorophore's emission spectrum [21].
- Inspect Polymer Dyes: If using polymer dyes without a dedicated stain buffer, dye-dye interactions may be causing aggregation and spectral shifts, not a pure unmixing error [21].
Resolution: For errors related to control setup or treatment inconsistency, new controls must be made that strictly follow the rules. For polymer dye aggregation, new samples must be stained with the appropriate stain buffer added [21].
Experimental Protocols & Data
Standard Operating Procedure: High-Parameter Intracellular Cytokine Staining
This protocol is typical for immune functional assays, such as characterizing T-cell responses [22].
Intracellular Staining Workflow
Detailed Methodology:
Cell Stimulation & Secretion Block:
Surface Antigen Staining:
- Harvest and wash cells.
- Block Fc Receptors to prevent non-specific antibody binding using a commercial blocking reagent [18] [20].
- Stain with a cocktail of fluorochrome-conjugated antibodies against surface markers (CD3, CD4, CD8, etc.).
- Keep cells on ice and use ice-cold buffers during this and all subsequent steps to halt internalization and modulation of surface antigens [18] [15].
Fixation & Permeabilization:
- Fix cells with a formaldehyde-based fixative (e.g., 4% formaldehyde for no more than 30 minutes). Over-fixation can diminish fluorescence signals [18].
- Permeabilize cells using a mild detergent (e.g., Saponin, Triton X-100) to allow antibodies access to the interior of the cell. For nuclear antigens, more vigorous detergents may be required [18].
Intracellular Staining:
- Stain with a cocktail of fluorochrome-conjugated antibodies against intracellular targets (e.g., cytokines like IFN-γ, IL-17, or transcription factors).
- Use low molecular weight fluorochromes (e.g., Alexa Fluor dyes) for better intracellular mobility [15].
- Include adequate washing steps with permeabilization buffer to remove trapped, unbound antibody [18].
Data Acquisition:
- Acquire data on a spectral flow cytometer.
- Use calibration beads to ensure optimal instrument performance before running samples [18].
Quantitative Data from Clinical Applications
The table below summarizes the performance of spectral flow cytometry in detecting Minimal Residual Disease (MRD) across various hematologic malignancies, demonstrating its high sensitivity and clinical utility [17].
| Disease | SFC Panel Design | Achieved MRD Sensitivity | Key Clinical Advantage |
|---|---|---|---|
| B-Cell Acute Lymphoblastic Leukemia (B-ALL) | 23-color panel | ~10⁻⁵ (0.001%) | Enhanced detection of dim antigens and CD19-negative leukemic clones post-therapy [17]. |
| Acute Myeloid Leukemia (AML) | 24-color to 27-color single-tube assay | Down to 0.02% | High-resolution profiling of blast maturation; eliminates need for sample splitting [17]. |
| Chronic Lymphocytic Leukemia (CLL) & Lymphoma | Panels with CD5, CD19, CD20, CD23, CD79b, ROR1 | As low as 0.005% | Increased specificity and improved detection of rare malignant clones [17]. |
| Multiple Myeloma | EuroFlow NGF markers in a single-tube assay | ~10⁻⁶ (0.0001%) | Clear distinction of clonal vs. normal plasma cells; supports standardized MRD endpoints [17]. |
The Scientist's Toolkit: Essential Research Reagents
| Item | Function & Application | Key Considerations |
|---|---|---|
| Fc Receptor Blocking Reagent | Reduces non-specific antibody binding via Fc receptors on myeloid cells and others, lowering background [18] [20]. | Essential for staining in human samples and highly recommended for mouse samples to improve signal-to-noise ratio. |
| Protein Transport Inhibitors (Brefeldin A/Monensin) | Blocks Golgi-mediated export, trapping secreted proteins (e.g., cytokines) inside the cell for intracellular detection [18] [22]. | Required for any intracellular cytokine staining (ICS) assay. |
| Viability Dye | Distinguishes live from dead cells. Dead cells bind antibodies non-specifically, contributing to high background [18]. | Crucial for accurate analysis, especially when processing tissue samples or using cryopreserved cells. |
| Polymer Stain Buffer | Prevents non-specific interactions and aggregation between polymer-based dyes (e.g., Brilliant Violet dyes) when used in the same panel [21]. | Mandatory when using two or more polymer dyes in a single panel to avoid aberrant data. |
| Antibody Capture Compensation Beads | Used to generate consistent and bright single-stained controls for setting up unmixing/compensation, especially for rare markers [18]. | Ensure the beads are compatible with the antibody host species. Treat beads with the same fixative as samples. |
Frequently Asked Questions (FAQs)
Q1: What is the fundamental difference between a spectral flow cytometer and a conventional one? The core difference lies in the detection system. Conventional flow cytometers use optical filters and dichroic mirrors to direct narrow bands of light, typically matching a fluorophore's emission peak, to dedicated detectors (the "one detector–one fluorophore" approach). In contrast, spectral cytometers collect the full emission spectrum of every fluorophore across a wide wavelength range. They use a prism or diffraction grating to scatter the light, which is then captured by an array of detectors (often 32-64 or more) [23] [24]. This allows spectral cytometry to distinguish fluorophores based on their entire spectral "fingerprint," not just a single peak.
Q2: How does spectral cytometry improve resolution and facilitate high-parameter panels? Spectral cytometry enhances resolution through spectral unmixing. This computational process analyzes the full spectrum from each cell and deconvolutes the individual contributions of all fluorophores present, even if their emission spectra significantly overlap [23]. This capability directly enables high-parameter flexibility, as it allows researchers to use many more fluorophores in a single panel—up to 40 or more—by leveraging dyes with overlapping but distinct spectral profiles that would be impossible to separate on a conventional cytometer [23] [24].
Q3: Can spectral flow cytometry really extract and use autofluorescence? Yes, this is a significant advantage. All cells have endogenous autofluorescence, primarily from molecules like NADH and FAD, which have characteristic spectral signatures [25]. In conventional cytometry, this autofluorescence contributes broadly to background noise. Spectral cytometry can unmix and subtract this autofluorescence signal from the total signal, improving the signal-to-noise ratio for specific markers [25]. Furthermore, researchers can now probe these intrinsic autofluorescence signals to gain direct insights into cellular metabolic states [25].
Q4: Why do I see unexpected signals or errors in my high-parameter spectral data? Even with spectral unmixing, data quality can be affected by several factors related to reagent interactions:
- Dye-Dye Interactions: Polymer dyes (e.g., Brilliant Violet stains) can stick together, creating aberrant signals. This is mitigated by using specific polymer stain buffers [26] [21].
- Tandem Dye Degradation: Tandem dyes are prone to breakdown, which can cause the acceptor fluorophore to detach. This leads to erroneous signals from the donor fluorophore alone, which can be misassigned to a different marker in your panel [26] [24].
- Fc Receptor Binding: Antibodies can bind non-specifically to Fc receptors on cells, increasing background. This is reduced by blocking with normal serum from the same species as the staining antibodies [26].
Troubleshooting Guide
Issue 1: High Background or Non-Specific Staining
| Possible Cause | Solution | Principle |
|---|---|---|
| Fc Receptor Mediated Binding | Incubate cells with a blocking solution containing normal serum (e.g., rat and mouse serum) for 15 minutes at room temperature before adding staining antibodies [26]. | Blocks low-affinity interactions between antibodies and Fc receptors on immune cells, improving specificity [26]. |
| Polymer Dye Interactions | Include a commercial Brilliant Stain Buffer or similar in your surface antibody master mix when using two or more polymer dyes [26] [21]. | Prevents dye-dye interactions that cause non-specific signal and data skewing [26]. |
| Tandem Dye Instability | Use tandem stabilizer in your staining buffer and resuspension buffer. Protect stained samples from light [26]. | Stabilizes the chemical bond between the donor and acceptor fluorophores in tandem dyes, preventing degradation and spectral spillover [26]. |
| Inadequate Washing | Ensure thorough washing steps with buffers that may include detergents (e.g., Tween) to remove excess, unbound antibody [15]. | Removes trapped or unbound antibody that contributes to high background, particularly in intracellular staining [15]. |
Issue 2: Poor Unmixing Quality or Incorrect Population Identification
| Possible Cause | Solution | Principle |
|---|---|---|
| Inadequate Single-Color Controls | Use single-color controls that are at least as bright as your fully stained sample and are treated identically (including fixation). Always use the exact same antibody-fluorophore conjugate for the control as in your panel [21]. | The unmixing algorithm requires a high-quality reference spectrum from each fluorophore. Dim or improperly treated controls provide a poor reference, leading to unmixing errors [21]. |
| Spectral Spillover from Autofluorescence | When designing your panel, account for cell autofluorescence. Use the autofluorescence signal as a separate "fluorophore" during unmixing to subtract it from your specific signals [25]. | Treating autofluorescence as a defined component allows the software to mathematically separate it from the signals of your specific markers, improving accuracy [25]. |
| Tandem Dye Breakdown | Check the integrity of your tandem dyes. If breakdown is suspected, replace the reagent and ensure proper handling and storage [26]. | A degraded tandem dye emits a spectrum that no longer matches its reference control, causing the unmixing algorithm to fail and assign signal to the wrong channel [26]. |
The Scientist's Toolkit: Key Research Reagent Solutions
The following table details essential reagents for optimizing spectral flow cytometry experiments, as referenced in the protocols and troubleshooting guides above.
| Reagent | Function | Key Consideration |
|---|---|---|
| Normal Sera (e.g., Rat, Mouse) | Blocks non-specific binding via Fc receptors to reduce background staining [26]. | The serum should ideally be from the same species as the host of your primary antibodies [26]. |
| Brilliant Stain Buffer (BSB) | Prevents non-specific interactions between polymer dyes (e.g., Brilliant Violet dyes) in a panel [26] [21]. | Essential when using more than one polymer dye in a panel. Not required for single-stain controls [26]. |
| Tandem Stabilizer | Protects susceptible tandem dyes from degradation during staining and sample acquisition [26]. | Improves data quality and reproducibility by maintaining the spectral integrity of tandem dyes [26]. |
| CellBlox | A blocking buffer specifically formulated for use with NovaFluor dyes [26]. | We do not cover its optimized usage here, as it requires specific optimization per manufacturer instructions [26]. |
| Sodium Azide | Prevents internalization and modulation of surface antigens, preserving fluorescence intensity [15]. | Highly toxic. Requires appropriate safety handling. Can be omitted for short-term protocols [26] [15]. |
Workflow and Signaling Pathways
Diagram: Spectral Unmixing Workflow
Strategic Panel Design and Practical Protocols for Minimizing Spillover
In multicolor flow cytometry, the accurate resolution of distinct cell populations hinges on a core principle: the careful pairing of fluorophore properties with the biological characteristics of the target antigens. Two factors are paramount: matching the brightness of the fluorophore to the abundance of the antigen, and ensuring spectral distinguishability between all fluorophores in the panel. Neglecting these principles can lead to poor resolution, inaccurate data, and failed experiments. This guide provides troubleshooting advice and FAQs to help you navigate these critical aspects of panel design.
Fluorophore Brightness and Antigen Abundance: A Quantitative Guide
The key to maximizing signal resolution is to assign the brightest fluorophores to antibodies targeting low-abundance antigens, and weaker fluorophores to highly expressed markers. This strategy prevents weak signals from being lost and avoids saturation of detectors by very strong signals.
The table below summarizes the relative brightness of common fluorescent proteins and organic dyes as reported in the literature, providing a reference for your panel design.
Table 1: Relative Brightness of Example Fluorophores for Flow Cytometry
| Fluorophore | Type | Excitation Laser (nm) | Emission Peak (nm) | Relative Brightness/Notes |
|---|---|---|---|---|
| Venus | Fluorescent Protein | 488-514 | 528 | High signal-to-noise ratio; suitable for low-level expression [27] |
| mTagBFP2 | Fluorescent Protein | 405 | 454 | High signal-to-noise ratio; minimal spectral overlap [27] |
| TagRFP657 | Fluorescent Protein | 561-640 | 657 | High signal-to-noise ratio; compatible with NIR detection [27] |
| EGFP | Fluorescent Protein | 488 | 507 | Gold standard; widely used but may be superseded by newer proteins [27] |
| tdTomato | Fluorescent Protein | 561 | 581 | Very bright; but is a tandem dimer, not a monomer [27] |
| Spark PLUS Dyes | Organic Dye | Varies by specific dye | Varies by specific dye | Designed for enhanced brightness [23] |
| Brilliant Violet 421 | Polymer Dye | 405 | 421 | Very bright; common choice for high-impact markers [28] |
| APC | Phycobiliprotein | 640 | 660 | Bright; common choice for high-impact markers [28] |
| FITC | Organic Dye | 488 | 519 | Less bright; suitable for highly expressed antigens [28] [23] |
The Scientist's Toolkit: Essential Research Reagent Solutions
Table 2: Key Reagents for Fluorophore Selection and Panel Validation
| Reagent / Material | Function | Example Use-Case |
|---|---|---|
| Monomeric Fluorescent Proteins | Genetic reporters for knock-in gene-expression or fusion-protein constructs [27]. | Creating stable cell lines or reporter mice for multicolor tracking. |
| Viability Dyes | Distinguish and exclude dead/dying cells from analysis to prevent nonspecific antibody binding [28]. | Live/dead discrimination in immunophenotyping panels (e.g., LIVE/DEAD Fixable Dead Cell stains). |
| Amine-Reactive Barcoding Dyes | Label individual cell samples for pooling, reducing staining variation and acquisition time [29]. | Multiplexing multiple samples in a single tube for phospho-flow or cytokine staining. |
| Tandem Dyes | Conjugates of a donor fluorophore and an acceptor molecule that allow for large Stokes shifts [23]. | Expanding the palette of colors available for a single laser line (e.g., PE-Cy7, APC-Cy7). |
| Single Color Reference Controls | Individually stained samples used to create spectral signatures for unmixing or compensation [30]. | Essential for setting up both spectral unmixing and conventional compensation. |
| Fixatives | Preserve cell state and stabilize fluorescent signals for later analysis [30]. | Preparing fixed single-color controls; 0.5% formaldehyde may stabilize some tandems for up to 5 days. |
Experimental Protocol: A Step-by-Step Guide to Panel Assembly and Validation
The following workflow provides a systematic methodology for designing, testing, and troubleshooting a multicolor flow cytometry panel.
Step-by-Step Procedure:
- Define Panel and Tier Antigens: List all target antigens and categorize them into tiers based on their expression levels (low/rare, medium, high/abundant) on your specific cell type [28].
- Theoretical Fluorophore Assignment:
- Assign your brightest fluorophores (e.g., BV421, APC) to detect low-abundance antigens [28].
- Assign medium-brightness fluorophores to antigens with medium expression.
- Assign your dim fluorophores (e.g., FITC) to detect highly abundant antigens [28].
- Use panel builder tools (e.g., FluoroFinder, instrument manufacturers' software) to visualize potential spectral conflicts and check reagent availability [28] [2].
- Experimental Validation:
- Prepare Single-Color Controls: For each fluorophore-antibody conjugate in your panel, stain cells or compensation beads to create a single-color control. Use a brightly stained population for accurate calculations [2] [30].
- Stain a Full-Panel Sample: Stain a test sample (e.g., PBMCs) with the complete antibody mixture.
- Data Acquisition and Analysis:
- Acquire data for all single-color controls and the full-panel sample on your flow cytometer.
- For conventional cytometers: Use the single-color controls to calculate spillover coefficients and apply compensation [2].
- For spectral cytometers: Use the single-color controls to create reference spectra and perform spectral unmixing [9] [30].
- Troubleshoot and Iterate: Evaluate the resolution of your populations. If resolution is poor (e.g., dim populations are not distinct from negative, or spillover is high), return to Step 2 and reassign problem fluorophores to different channels or to markers that are not co-expressed [28].
Frequently Asked Questions (FAQs)
1. Why is it critical to match fluorophore brightness to antigen density? Matching brightness to abundance ensures optimal resolution of your target populations. A dim fluorophore on a low-abundance antigen will produce a weak signal that may be indistinguishable from background autofluorescence. Conversely, a very bright fluorophore on a highly expressed antigen can produce such a strong signal that it overwhelms the detector, causing excessive spillover into other channels and degrading the resolution of other markers in your panel [28].
2. On a spectral cytometer, can I use fluorophores with highly overlapping emission spectra? Yes, but with a crucial caveath. Spectral flow cytometry can distinguish fluorophores based on their entire spectral signature, not just their peak emission. However, the algorithms still require the signatures to be unique enough to be mathematically separated. If two fluorophores have near-identical spectra across all detection channels, unmixing will fail. Always check the spectral similarity score in your panel design software; fluorophore combinations with lower similarity are ideal [9] [23].
3. My tandem dye is giving inconsistent results. What could be wrong? Tandem dyes (e.g., PE-Cy7, APC-Cy7) are prone to degradation because they consist of two fluorophores coupled together. If this bond breaks, the donor fluorophore's signal will increase, radically shifting the spectral signature and causing massive spillover. To prevent this:
- Protect from light: Always store conjugated antibodies and stained samples in the dark.
- Avoid freeze-thaw cycles: Aliquot antibodies.
- Use fresh fixative: Some fixatives can accelerate tandem degradation. Test different fixatives; 0.5% formaldehyde has shown better stability for some tandems than stronger alternatives [30].
4. How long can I use my single-color reference controls for spectral unmixing? With proper preparation and storage, single-color controls can be stable for extended periods, but this requires validation. One study found that when using the same antibody lot and proper fixation (e.g., 0.5% formaldehyde), controls could effectively unmix data acquired one to two months later [30]. However, tandem dye controls are less stable and may need to be remade every few days. Always check the stability of your specific controls under your storage conditions.
5. What is the best way to handle cellular autofluorescence in my experiment? Spectral flow cytometry offers a significant advantage here. Because it records a full spectrum, cellular autofluorescence can often be identified as a distinct "signature" and subtracted during the unmixing process. Many spectral analyzers allow you to include autofluorescence as a separate "fluorophore" in your unmixing algorithm, which can dramatically improve the resolution of dimly expressed markers [9] [31].
FAQs on Tandem Dye Stability and Breakdown
What are tandem dyes and why is their stability a concern?
Tandem dyes are composed of two fluorophores—a donor and an acceptor—covalently bound together. They function through Förster Resonance Energy Transfer (FRET), where the donor fluorophore absorbs light and transfers the energy to the acceptor, which then emits light at a longer wavelength. This process allows you to get multiple distinct readouts from a single laser, greatly increasing panel flexibility [32] [33].
The primary concern is their tendency to break down or decouple, a process where the chemical linkage between the two fluorophores degrades. When this happens, the energy transfer fails, and you primarily detect light emission from the donor fluorophore (e.g., PE or APC). This breakdown creates spillover-like artifacts and false-positive signals in your data, which can lead to biological misinterpretation [34] [33].
What specific factors cause tandem dye breakdown?
Tandem dye degradation is influenced by several factors, which can act alone or in combination [34]:
- Light: Exposure to light, especially during sample preparation, can photobleach the donor and acceptor molecules [32].
- Temperature: Higher temperatures accelerate the breakdown process. It is crucial to keep antibody stocks and staining mixes cold [34].
- Fixatives: Formaldehyde-based fixatives generally cause manageable but noticeable degradation. Harsher fixatives like methanol can severely degrade the protein portion of the tandem dye [34].
- Time: Older vials of tandem dyes and master mixes containing them will show more degradation [34].
- Cellular Enzymes: A critical factor is a cell-dependent degradation mechanism. Metabolically active cells, particularly myeloid cells like monocytes and macrophages, contain enzymes that catalytically break down tandems. This means breakdown can be highly variable between different cell types in the same sample [34] [35].
How can I design my panel to minimize the impact of tandem breakdown?
Strategic panel design is your first line of defense against tandem dye breakdown artifacts [34] [33]:
- Avoid tandems on widely expressed markers. This prevents breakdown signals from appearing across many cell populations.
- Do not assign the tandem dye and its parent fluorophore to markers expressed on the same cell type. For example, avoid using a PE-based tandem and a plain PE antibody on markers co-expressed on T cells.
- Match antigen density with fluorophore brightness. Avoid using a very bright tandem dye on a highly expressed marker if you are using the parent fluorophore for a dim marker. Breakdown signal from the bright tandem can overwhelm the authentic dim signal.
- Consider newer, more stable dyes. Dyes like BioLegend's Fire dyes (excluding Fire 810), Bio-Rad's StarBright, or BD's RealBlue dyes are engineered for higher stability and can be excellent alternatives [33].
What are the best practices for handling tandem dyes during experiments?
Proper handling from staining to acquisition is essential [34] [36] [33]:
- Work quickly and keep samples in the dark. Use foil to cover tubes and plates as much as possible.
- Keep things cold. Store antibodies and perform staining steps on ice or in a cold room when feasible.
- Prepare master mixes fresh. Do not make master mixes containing tandems too far in advance.
- Use a Tandem Stabilizer. Commercial additives like BioLegend's Tandem Stabilizer can significantly reduce breakdown. It is recommended to add it to your master mix, perm/wash buffers, and the final sample resuspension buffer prior to acquisition [34] [26].
- Match your controls to your samples. Your single-color controls for unmixing/compensation must be treated identically to your experimental samples (same light, temperature, fixation, and time conditions). If staining a cell type known to cause breakdown, use cells—not beads—as your controls [34].
Troubleshooting Guide
| Problem | Potential Cause | Recommended Solution |
|---|---|---|
| False positive signal in a channel corresponding to a parent fluorophore (e.g., PE or APC). | Breakdown of a tandem dye (e.g., PE-Cy7) into its constituent parts. | Verify panel design rules; use Tandem Stabilizer; ensure proper handling to limit light/heat exposure [34] [33]. |
| Variable false positives between different cell types in the same sample. | Cell-dependent enzymatic degradation, often worse in myeloid cells. | Use a Tandem Stabilizer; for intracellular staining, add stabilizer to perm/wash buffers; use cells (not beads) for single-color controls [34] [35]. |
| High background or spreading error across multiple channels. | Excessive tandem breakdown and/or spectral spillover from a high-expression marker. | Titrate antibodies; review panel design to avoid bright tandems on abundant targets; use FMO controls to set gates [36]. |
| Weak or lost signal in the tandem channel. | General photobleaching or severe dye degradation. | Protect samples from light; use fresh antibody aliquots; check antibody expiration dates [36]. |
| Poor resolution of a dim marker. | The marker is assigned to a parent fluorophore (e.g., PE) and a bright tandem (e.g., PE-Cy7) is breaking down into it. | Re-design the panel to assign the dim marker to a non-tandem dye and the bright marker to a more stable fluorophore [33]. |
Research Reagent Solutions
The following table details key reagents used to manage tandem dye stability.
| Reagent | Function | Example Use Case |
|---|---|---|
| Tandem Stabilizer [34] [26] [32] | Commercial additive to reduce decoupling of tandem dyes. | Add at a 1:1000 dilution to staining master mixes, wash buffers, and sample storage buffer. |
| Fc Receptor Blocking Reagent [26] [32] | Blocks non-specific binding of antibodies to Fc receptors on cells. | Incubate cells with purified anti-CD16/32 antibodies or normal serum for 15 minutes prior to surface staining. |
| Brilliant Stain Buffer [26] | Prevents dye-dye interactions between polymer-based "Brilliant" dyes (e.g., Brilliant Violet). | Add at up to 30% (v/v) to surface antibody staining master mixes. |
| CellBlox [26] | Prevents non-specific interactions for NovaFluor dyes. | Use according to manufacturer's instructions for panels containing NovaFluor dyes. |
| Vitamin C [34] [35] | An antioxidant that can antagonize the cell-dependent degradation of tandems. | Can be tested as an alternative to commercial stabilizers (concentration requires optimization). |
Experimental Protocol: Surface Staining with Tandem Stabilization
This protocol provides an optimized workflow for surface staining that incorporates steps to minimize tandem dye breakdown, adapted from a published method [26].
Materials
- Cells (e.g., murine splenocytes or human PBMCs)
- FACS Buffer (PBS with 0.5-1% BSA or FBS, optional 0.1% sodium azide)
- Mouse Serum (e.g., Thermo Fisher, cat. no. 10410)
- Rat Serum (e.g., Thermo Fisher, cat. no. 10710C)
- Tandem Stabilizer (BioLegend, cat. no. 421802)
- Brilliant Stain Buffer (BD Biosciences, cat. no. 566385)
- Surface antibodies
- 96-well V-bottom plates
Workflow
Procedure
Prepare Blocking Solution: Create a mixture containing mouse serum, rat serum, and Tandem Stabilizer in FACS buffer. A sample formulation is [26]:
- Mouse Serum: 300 µL
- Rat Serum: 300 µL
- Tandem Stabilizer: 1 µL
- 10% Sodium Azide: 10 µL (optional, for short-term use)
- FACS Buffer: 389 µL
- Total Volume: 1 mL
Plate and Wash Cells: Dispense your cells into a V-bottom 96-well plate. Centrifuge the plate at 300 × g for 5 minutes (at 4°C or room temperature) and carefully decant the supernatant.
Block Cells: Resuspend the cell pellet in 20 µL of the prepared blocking solution. Incubate for 15 minutes at room temperature, protected from light.
Prepare Staining Mix: While blocking, prepare the surface antibody master mix. For each sample, combine:
- Tandem Stabilizer: 1 µL
- Brilliant Stain Buffer: 30 µL (or a volume up to 30% of the total mix)
- Titrated surface antibodies: As required
- FACS Buffer: to a final volume of 100 µL
Stain Cells: Add 100 µL of the surface staining mix to each well. Mix thoroughly by pipetting. Incubate for 1 hour at room temperature in the dark.
Wash Cells: Add 120 µL of FACS buffer to each well. Centrifuge at 300 × g for 5 minutes and discard the supernatant. Repeat this wash step with a larger volume of 200 µL FACS buffer.
Resuspend for Acquisition: Resuspend the final cell pellet in FACS buffer containing Tandem Stabilizer at a 1:1000 dilution. Your samples are now ready for acquisition on the flow cytometer [34] [26].
The effectiveness of Tandem Stabilizer is demonstrated by reduced false-positive signals. The table below summarizes key quantitative findings from validation experiments [34].
| Condition | False PE Signal (a.u.) | False APC Signal (a.u.) | Data Quality |
|---|---|---|---|
| No Stabilizer | High | High | Poor: Significant false positives and skewing. |
| Stabilizer in Final Buffer Only | Medium | Medium | Moderate: Reduced but persistent artifacts. |
| Stabilizer Throughout Protocol | Low | Low | Good: Cleanest data with minimal breakdown. |
Troubleshooting Guides & FAQs
Common Staining Problems and Solutions
| Problem | Possible Cause | Recommended Solution |
|---|---|---|
| High Background Fluorescence | Fc receptor-mediated non-specific antibody binding on monocytes, macrophages, or B cells [26] [37] [38] | Implement Fc receptor blocking with serum or specific blocking antibodies prior to antibody incubation [26] [37] [39]. |
| Non-specific binding from dead cells or cellular debris [40] [38] | Include a viability dye to gate out dead cells during analysis; ensure high cell viability (>90%) before staining [37] [38]. | |
| Unexpected Positive Signals or "Spreading" | Polymer dye interactions (e.g., Brilliant Violet, Super Bright) when multiple dyes are used without a stabilizer [26] [21] | Use a commercial polymer dye stain buffer (e.g., Brilliant Stain Buffer) in the staining mix [26] [21]. |
| Tandem dye degradation, leading to emission in the channel of the constituent fluorophore [26] | Include tandem stabilizer in staining and resuspension buffers; protect tandem dyes from light [26]. | |
| Weak or No Signal | Low antigen abundance paired with a dim fluorophore [40] [38] | Pair low-density targets with bright fluorophores (e.g., PE) and high-density targets with dimmer ones (e.g., FITC) [38]. |
| Inadequate antibody titration or inappropriate instrument settings [40] [38] | Titrate all antibodies to determine the optimal concentration; verify cytometer laser and detector settings [38]. | |
| Compensation/Unmixing Errors in Full Stains | Single-stained controls are less bright than the fully stained sample [21] | Ensure positive signals in single-stain controls are at least as bright as in the experimental sample [21]. |
| Fluorophore in the control does not match the one in the panel (e.g., using FITC control for a GFP sample) [21] | Use the exact same fluorophore for the control and the full stain [21]. |
Frequently Asked Questions (FAQs)
Q1: Why is Fc receptor blocking critical for immunophenotyping? Fc receptors naturally bind to the constant region (Fc) of antibodies, independent of the antigen-binding site. This can cause non-specific staining, obscuring true positive signals and increasing background, particularly on immune cells like monocytes, macrophages, and B cells. Blocking these receptors ensures that antibody binding is specific to its target antigen [26] [37].
Q2: When should I use a polymer dye stain buffer? You must use a polymer stain buffer (e.g., BD Brilliant Stain Buffer or Thermo Fisher SuperBright Stain Buffer) anytime your panel contains two or more antibodies conjugated to polymer dyes, such as the Brilliant Violet (BV) or Super Bright families. These dyes are prone to hydrophobic interactions, which can cause them to stick together and generate erroneous signals. The buffer contains components that prevent these interactions, preserving data integrity [26] [21].
Q3: Can I use the same blocking serum for all my experiments? No. For best results, the blocking serum should match the host species of the primary antibodies you are using. For example, if you are staining mouse cells with primarily rat-derived antibodies, you should use normal rat serum. Avoid using serum from the same species as your cells if you are staining for immunoglobulins [26].
Q4: My single-stain controls look fine, but my full-panel stains show errors. Why? This is a common issue that indicates your single-stain controls did not perfectly mimic your full stain. The most frequent reasons are:
- The fluorescence intensity in the single-stain control was lower than in the full stain [21].
- You used compensation beads for controls but cells for your experiment, and their autofluorescence differs [21].
- You forgot to add polymer dye buffer to your full stain, causing dye-dye interactions that aren't present in the single stains [21].
Research Reagent Solutions
The following table lists key reagents essential for implementing optimized staining protocols in high-parameter flow cytometry.
| Reagent | Function | Application Notes |
|---|---|---|
| Normal Serum (e.g., Rat, Mouse) [26] | Blocks non-specific binding via Fc receptors. | Match the host species of your staining antibodies for most effective blocking [26]. |
| Fc Receptor Blocking Antibodies (e.g., anti-CD16/32) [39] | Specifically blocks common low-affinity Fcγ receptors. | An alternative to serum; often used for mouse cells [39]. |
| Brilliant Stain Buffer [26] | Prevents hydrophobic interactions between polymer dyes. | Mandatory for panels with multiple Brilliant Violet or similar dyes; use at up to 30% (v/v) of staining mix [26] [21]. |
| Tandem Stabilizer [26] | Prevents degradation of tandem dyes. | Add to staining buffer and final resuspension buffer to preserve tandem dye integrity [26]. |
| Flow Cytometry Staining Buffer [39] | Provides a protein-rich, isotonic medium for antibody staining and washing. | Typically contains BSA and sodium azide; reduces non-specific binding and maintains cell viability [39]. |
Detailed Experimental Protocols
Basic Protocol 1: Surface Staining with Integrated Blocking
This protocol provides an optimized, general-use approach for reducing non-specific interactions when staining cell surface markers [26].
Materials
- Blocking Solution: Comprising 30% mouse serum, 30% rat serum, 0.1% tandem stabilizer, and the remainder FACS buffer [26].
- Surface Staining Master Mix: Contains antibodies, 30% Brilliant Stain Buffer (or 4x less if using Brilliant Stain Buffer Plus), 0.1% tandem stabilizer, and FACS buffer [26].
- Other: V-bottom 96-well plates, centrifuge, pipettes.
Procedure
- Prepare Cells: Dispense cells into a V-bottom 96-well plate. Centrifuge at 300 × g for 5 minutes and decant the supernatant [26].
- Block: Resuspend the cell pellet in 20 µL of blocking solution. Incubate for 15 minutes at room temperature in the dark [26].
- Stain: Without washing, add 100 µL of the surface staining master mix directly to the cells. Mix well by pipetting [26].
- Incubate: Incubate for 60 minutes at room temperature in the dark [26].
- Wash: Add 120 µL of FACS buffer, centrifuge, and discard the supernatant. Repeat the wash with 200 µL of FACS buffer [26].
- Resuspend: Resuspend the cells in FACS buffer containing a 1:1000 dilution of tandem stabilizer [26].
- Acquire: Analyze the samples on a flow cytometer [26].
Basic Protocol 2: Fc Receptor Blocking for Human Cells
This protocol is specifically optimized for blocking Fc receptors on human cells, such as peripheral blood mononuclear cells (PBMCs) [37].
Materials
Procedure
- Prepare Cells: Wash cells and resuspend at 10⁷ cells/mL in cold staining buffer. Cell viability should exceed 90% [37].
- * Aliquot:* Add 50 µL of cell suspension (500,000 cells) to a tube [37].
- Block: Add 50 µL of HAB to the tube, mix, and incubate for approximately 1 minute at room temperature [37].
- Stain: Add the directly conjugated antibodies to the tube. incubate for 30 minutes at 4°C in the dark [37].
- Wash: Wash cells twice with 1 mL of buffer and resuspend for acquisition [37].
Workflow Visualization
The following diagram illustrates the logical workflow for selecting and applying the appropriate blocking and stabilization strategies in a flow cytometry experiment.
Key Technical Notes
- Serum Selection: The efficacy of Fc receptor blocking is highly dependent on using the correct serum. Always use serum from the same species as your staining antibodies for optimal results [26].
- Buffer Compatibility: Note that NovaFluor dyes may require a specific blocking reagent called CellBlox, which has a different optimization process than Brilliant Stain Buffer [26].
- Safety: Many fixatives contain paraformaldehyde and should be handled in a fume hood. Sodium azide, a common buffer additive, is highly toxic and must be handled according to its safety data sheet [26].
Technical Support Center
Troubleshooting Guides
Issue 1: High Background Fluorescence in Backbone Panel
Problem: Excessive background noise compromises the resolution of core cell populations defined by backbone markers like CD45, CD3, CD19 [41].
Potential Causes and Solutions:
| Potential Cause | Recommended Solution | Principle |
|---|---|---|
| High Autofluorescence | Use fresh cells; avoid over-fixation; include unstained control; employ viability dyes [40] [42]. | Reduces non-specific signal from dead/damaged cells. |
| Fc Receptor Binding | Implement Fc receptor blocking step during staining protocol [40] [42]. | Prevents non-specific antibody binding. |
| Insufficient Washing | Increase wash buffer volume, number, or duration of washes [40] [42]. | Removes unbound antibody. |
| Spillover Spreading | Use multicolor panel builder tools to minimize emission spectrum overlap; optimize compensation [42]. | Corrects for fluorescence spillover between channels. |
Issue 2: Low Signal Intensity on Critical Backbone Markers
Problem: Weak or absent detection signal for key lineage-defining markers (e.g., CD4, CD8, CD14, CD16 [41]), hindering major population identification.
Potential Causes and Solutions:
| Potential Cause | Recommended Solution | Principle |
|---|---|---|
| Low Antigen Expression | Pair low-abundance targets with bright fluorophores (e.g., PE, APC) [43]. | Maximizes signal-to-noise ratio. |
| Suboptimal Antibody Titer | Titrate all antibody reagents to determine optimal concentration for specific cell types [40] [42]. | Ensures optimal antibody binding. |
| Fluorophore Handling | Protect fluorophores from light; avoid prolonged exposure to fixatives, especially for tandem dyes [42] [44]. | Prevents photobleaching and dye degradation. |
| Incorrect Laser/Filter Setup | Verify instrument configuration matches fluorophore requirements [43] [42]. | Ensures proper laser excitation and signal detection. |
Issue 3: Poor Resolution of Major Immune Populations Across Sites
Problem: Inconsistent gating of major immune cell subsets (T cells, B cells, monocytes, NK cells) when the same backbone panel is used across different instruments or locations [45].
Potential Causes and Solutions:
| Potential Cause | Recommended Solution | Principle |
|---|---|---|
| Instrument Variability | Use standardized workflows and validate the backbone panel on the specific instrument[scitation:1]. | Controls for technical variation. |
| Compensation Errors | Use bright, single-stained controls (cells or beads) for each fluorophore; avoid reusing compensation matrices [44]. | Accurately corrects spectral overlap. |
| Sample Processing Differences | Standardize sample handling, fixation, and staining protocols across all sites [45]. | Minimizes pre-analytical variation. |
Experimental Protocol: Backbone Panel Optimization and Drop-In Modification
This protocol outlines the steps for qualifying a modified backbone flow cytometry panel, based on a case study where a single antibody was replaced for a Phase II oncology study [45].
Workflow for Backbone Panel Modification
Context: A 19-color spectral flow cytometry backbone panel for human whole blood required the replacement of one antibody to detect a specific cell therapy [45].
Step 1: Titration of Replacement Antibody
- Prepare an appropriately stained whole blood sample.
- Titrate the new replacement antibody in the context of the core antibody set.
- Select the concentration that provides optimal staining index and separation [45].
Step 2: Method Optimization
- Conduct optimization studies using the selected antibody concentration.
- Ensure all other assay components remain identical [45].
Step 3: Method Qualification (Fit-for-Purpose)
- Perform a targeted qualification based on the degree of change and context of use.
- Key Assessments [45]:
- Limit of Blank (LOB) / Limit of Detection (LOD): Determine the lowest signal distinguishable from background.
- Lower Limit of Quantitation (LLOQ): Establish the lowest concentration that can be reliably measured.
- Stability: Evaluate sample stability under various conditions.
- Precision: Assess intra-assay, inter-operator, and inter-instrument variability.
Outcome: The case study achieved assay readiness in approximately 8 weeks, meeting sponsor deadlines and ensuring robustness for a global Phase II study [45].
Frequently Asked Questions (FAQs)
Q1: What exactly is a backbone flow cytometry panel? A backbone panel is a well-characterized, optimized, or validated set of core markers used to define major cell populations of interest, such as T cells, B cells, monocytes, and NK cells [45]. It provides a consistent framework with flexible "drop-in" channels, allowing researchers to add custom markers without rebuilding the entire assay [45] [46].
Q2: How does the backbone approach improve data comparability in multi-center clinical trials? The backbone approach ensures cross-site reproducibility by using stable population definitions over time and location [45]. It employs standardized workflows, sample handling methods, and data analysis strategies, which reduce assay variability and make it easier to merge data collected from different cohorts, sites, or time points [45] [41].
Q3: When should I use a bright fluorophore versus a dim one for my backbone markers? As a general rule, use the brightest fluorophores for low-abundance antigens or rare cell populations [43]. Dimmer fluorophores are suitable for highly expressed antigens. For example, a bright fluorophore like PE or APC is recommended for detecting a sparsely expressed marker, whereas a dimmer fluorophore can be used for a ubiquitous marker like CD45 [43].
Q4: What are the critical controls for properly gating a high-parameter backbone panel?
- Fluorescence Minus One (FMO) Controls: Tubes containing all fluorophores except one. These are essential for accurately setting positive/negative gates, especially for emergent markers or rare populations [44].
- Single-Stained Controls: Necessary for calculating compensation for each fluorophore. These can be cells or compensation beads, but the carrier should be consistent for each channel [44].
- Unstained Cells: To assess autofluorescence [42].
Q5: Can I reuse a compensation matrix from a previous experiment for my backbone panel? It is not recommended. The best practice is to run compensation controls fresh for each experiment. Tandem dyes are particularly susceptible to degradation over time, which changes their spectral properties. Furthermore, instrument sensitivity can drift, making a previously calculated matrix inaccurate [44].
The Scientist's Toolkit: Key Research Reagent Solutions
| Item | Function in Backbone Panels |
|---|---|
| Viability Dye | Critical for excluding dead cells from analysis, which reduces background and improves data quality [45]. |
| Fc Receptor Blocking Reagent | Minimizes non-specific antibody binding, a common source of high background [40] [42]. |
| Compensation Beads | Provide a consistent, uniform population for setting up compensation controls and instrument calibration [44]. |
| Antibody Capture Beads | Useful for creating bright, single-positive compensation controls, especially for markers that are not well-expressed on available cells [44]. |
| Cell Stabilization Reagents | Preserve sample integrity, crucial for multi-site trials where samples may be shipped [47]. |
| Pre-validated Backbone Panels | Offer a standardized starting point for immunophenotyping, saving time and resources in panel development [45] [47]. |
Logical Framework for Addressing Spectral Overlap in Backbone Panels
Spectral Overlap Management Workflow
Advanced Troubleshooting: Identifying and Correcting Unmixing Errors
FAQ: Why is my negative population not round and showing asymmetric spread?
An asymmetrical or "swooping" negative population is a classic sign of an unmixing error. It occurs when the reference control used to create the spectral signature does not accurately match the conditions of that fluorophore in your full panel sample [48] [49].
- Root Cause: The most common reason is a mismatch between your single-color control and your multi-color sample. This can be due to differences in autofluorescence, fluorophore brightness, or the cellular environment (e.g., fixation) [48].
- The "Like-With-Like" Rule: The autofluorescence of the positive cells in your control must be identical to the autofluorescence of the negative cells. Violating this rule, for example, by using unstained live cells as a negative for a viability dye stained on dead cells (which are more autofluorescent), will introduce error [48].
Diagnostic Table: Common Unmixing Error Patterns
| Observed Pattern | Likely Cause | How to Investigate |
|---|---|---|
| Asymmetrical "swooping" or "banana-shaped" positive populations [48] | Inaccurate spectral signature from reference control; spillover from other fluorophores not properly subtracted [48] [49] | Plot all fluorophores on NxN plots to find the interfering channel [48]. |
| Non-round negatives and ultra-negative events [48] [49] | Spillover errors causing a spread in the data, leading to events with negative values after unmixing [48]. | Check for positive correlations between markers that are not biologically linked [49]. |
| Multiple positive peaks where only one is expected [48] | Breakdown of tandem dyes (e.g., APC-Cy7) or contamination of the control with another fluorophore. | Inspect the reference control histogram for multiple peaks; ensure tandem dyes are from the same lot and protected from light and fixatives [48]. |
| Massive spreading in the negative, making it hard to gate [49] | High panel complexity or a poorly designed panel with fluorophores that have very similar spectra (high similarity index). | Calculate the panel's complexity index; aim to use fluorophores with a similarity index of <0.98 [48]. |
| The staining pattern is different from previous experiments [49] | Incorrect unmixing/compensation, or a change in the reference controls over time (e.g., degraded tandem dyes in a stored reference library). | Re-validate reference library controls; ensure consistent sample processing protocols [48]. |
FAQ: My data shows "hypernegative" events. What does this mean?
The presence of distinct ultra-negative populations is a clear indicator of significant spillover error from an incorrectly unmixed fluorophore [49]. Unlike the symmetrical spread of a true negative population, these errors create a distinct, asymmetrical population that leans negative as fluorescence in the interfering channel increases [49].
Protocol: Systematic Validation of High-Sensitivity Panels
Following established guidelines like CLSI H62 ensures reliable detection of rare populations and minimizes unmixing errors [50].
Precision Evaluation:
- Intra-assay Precision: Run three replicates of the same sample in a single acquisition. Calculate the %CV for the population of interest.
- Inter-assay Precision: Run three replicates of the same sample across four different runs (e.g., different days). Express precision as the mean %CV of all runs.
- Acceptance Criteria: For rare cell populations (<0.1%), a %CV of 30–35% can be considered acceptable [50].
Sample Stability Assessment:
- Divide a sample into aliquots and treat them with a stabilizer (e.g., TransFix).
- Store samples at room temperature and analyze them at multiple time points (e.g., 0, 4, 24, 48 hours).
- Calculate the relative difference between results at each time point and the baseline (0-hour). A relative difference of <20% indicates acceptable stability [50].
Establishing the Lower Limit of Quantification (LLOQ):
- Use a sample with a known low frequency of the target population.
- The LLOQ is the lowest level at which the analyte can be reliably quantified with acceptable precision and accuracy. This is critical for validating assays designed to detect rare events [50].
Table: Example Precision Validation Data for a Rare Cell Population (Tfh cells)
| Precision Type | Sample | Absolute Count of Tfh cells (/μL)* | %CV (Tfh cells) | %CV (Tfh1 cells) | %CV (Tfh17 cells) |
|---|---|---|---|---|---|
| Intra-assay | 1 | 1,186 | 1.67 | 3.57 | 7.64 |
| 2 | 130 | 0.56 | 0.82 | 1.34 | |
| 3 | 29 | 1.29 | 0.21 | 4.68 | |
| Inter-assay | 1 | 1,068 | 2.19 | 8.53 | 16.0 |
| 2 | 128 | 3.13 | 4.99 | 10.17 | |
| 3 | 29 | 6.51 | 7.13 | 9.48 |
Data adapted from a validation study on follicular helper T (Tfh) cells [50].
Troubleshooting Guide: A Step-by-Step Workflow
This workflow diagram outlines the logical process for diagnosing and resolving common unmixing errors.
The Scientist's Toolkit: Essential Reagent Solutions
Table: Key Research Reagents for Optimal Unmixing
| Item | Function & Importance in Spectral Unmixing |
|---|---|
| Single-Stained Cells (Primary Control) [48] [49] | Provides the most accurate spectral signature. Must be treated identically to the full-panel sample (same antibody, buffer, fixation, and cell type) to be a "true reflection" of the signature. |
| Compensation Beads (Compromise Control) [49] | A less accurate alternative to cells. Can be used for a few markers in a large panel but may produce inaccurate unmixing, especially for tandem dyes and on large panels. |
| Viability Dye (e.g., Fixable Viability Stain) [48] [51] | Critical for excluding dead cells, which are highly autofluorescent and cause nonspecific binding. Must be used with a correctly prepared control (e.g., heat-killed cells). |
| Fc Receptor Blocking Reagent [51] | Reduces nonspecific antibody binding, leading to cleaner signals and more accurate spectral signatures by minimizing background. |
| Stabilizer (e.g., TransFix) [50] | Stabilizes epitopes and fluorescent signals, allowing for batch analysis and reducing variability in longitudinal studies. |
| Titrated Antibodies [52] [53] | Using an optimal antibody concentration maximizes the stain index (signal-to-noise ratio), preventing both weak signals and high background, which distort spectral signatures. |
Experimental Protocol: Preparing Optimal Single-Color Controls
The quality of your single-color controls is the most critical factor for accurate spectral unmixing [48]. This protocol ensures your controls meet the "Five Rules" [48].
Detailed Methodology:
Cell Source Selection:
- Ideal: Use the same cells as in your full-panel experiment. If your marker is only expressed after stimulation or in a specific tissue, prepare and freeze these cells for future control use [49].
- Alternative: If the specific cell type is unavailable, use a different antibody conjugated to the same fluorophore from the same manufacturer, targeting a bright, common antigen (e.g., CD4 or CD8) on an accessible cell type [49].
Staining Procedure:
- Use the exact same clone, fluorophore, and lot number of antibody as in your full panel [48].
- Use the previously determined optimal titration to ensure a bright signal without background [52] [53].
- Maintain identical staining conditions: cell count, antibody volume, staining buffer, and incubation time [48] [49].
Post-Staining Handling:
Acquisition and Gating:
- During acquisition, draw a tight, accurate gate.
- Exclude doublets (they have variable fluorescence) and gate on a homogeneous population (e.g., lymphocytes for a T-cell marker) to minimize variation in autofluorescence and MFI [48].
- For dim markers, gate on the brightest, most homogeneous population to extract a clean spectral signature [49].
Why is it critical for single-stain controls to be as bright or brighter than the fully stained sample?
In flow cytometry, compensation is the mathematical process used to correct for spectral overlap, where a fluorophore's emission is detected in a detector other than its primary one [54]. The accuracy of this correction is entirely dependent on the quality of your single-stain controls.
The fundamental rule is: A single-stain control must be as bright or brighter than the fully stained sample in the same channel [21]. If the positive signal in your control is dimmer than the signal in your full panel sample, the calculated compensation value will be incorrect. This results in over-compensation, visually apparent as populations appearing artificially negative or "below zero" on your plots [21]. This error can obscure truly positive populations and lead to misinterpretation of your data.
How can I detect a violation of this rule in my data?
Troubleshooting this issue involves a direct comparison of your controls and your fully stained sample.
- Visual Inspection in Analysis Software: The most straightforward method is to use an overlay histogram. Plot the channel of the fluorophore in question (e.g., PE) for both the single-stain control and the fully stained sample. The median fluorescence intensity (MFI) of the positive population in the single-stain control should be equal to or greater than the MFI of the corresponding population in the full stain [21].
- Check for Compensation Artifacts: If you have already applied compensation and you see populations that are sharply skewed into the negative region (below zero on the axis), it is a strong indicator that your compensation is incorrect, potentially due to using an inadequate single-stain control [21].
The diagram below illustrates the diagnostic and resolution workflow for this common issue.
What are the best practices for preparing high-quality single-stain controls?
Preparing reliable controls requires careful planning and execution. The following table compares the two primary methods for preparing single-stain controls and outlines key considerations.
| Control Material | Advantages | Disadvantages | Best Used For |
|---|---|---|---|
| Cells [55] [54] | - Autofluorescence and light scatter properties match the experimental sample. | - Can be wasteful of precious cells.- Biological smearing can make positive/negative separation unclear [54]. | - When studying rare cell populations where bead brightness may not be representative.- When cell autofluorescence is a major concern. |
| Antibody-Capture Beads [55] [54] | - Provide consistent, bright staining with a clear negative population [54].- Economical; preserves valuable cells for experiments. | - Do not replicate cellular autofluorescence or light scatter [54]. | - Recommended for most scenarios to ensure a bright, distinct positive peak for accurate compensation [54]. |
Experimental Protocol: Establishing High-Quality Controls
- Titration: Before creating controls, titrate each antibody-conjugate on your target cells to find the optimal, saturating concentration that provides the best stain index (separation between positive and negative signals) [55] [53]. Using too much antibody can increase background, while too little will reduce brightness [53].
- Preparation:
- For Bead Controls: Follow the manufacturer's instructions. Typically, you will incubate a small volume of beads with the same concentration of antibody you determined from titration.
- For Cell Controls: Use the same cell type as your experiment. Stain an aliquot of cells with a single antibody-conjugate per tube, using the titrated concentration.
- Consistent Treatment: Process your single-stain controls through the exact same protocol as your fully stained samples. This includes fixation, permeabilization, and washing steps, as these treatments can alter a fluorophore's emission spectrum [21].
- Verify Brightness: After acquisition, immediately compare the brightness of each single-stain control to the corresponding population in the fully stained sample using an overlay histogram to ensure the rule has been met.
Scientist's Toolkit: Essential Reagents for Reliable Controls
| Item | Function | Technical Note |
|---|---|---|
| Antibody-Capture Beads | Serves as a consistent, non-cellular particle for generating bright single-stain controls [54]. | Choose beads that are compatible with the antibody host species (e.g., anti-mouse Ig κ) for reliable capture. |
| Fc Receptor Blocking Reagent | Reduces non-specific antibody binding via Fc receptors, lowering background in both controls and experimental samples [55] [53]. | Essential for staining immune cells like macrophages and monocytes. |
| Viability Dye | Allows gating on live cells, preventing confounding signals from dead cells which can exhibit high autofluorescence and non-specific binding [56]. | Use a fixable viability dye if your protocol includes intracellular staining and fixation. |
| Polymer Stain Buffer | Prevents hydrophobic interactions between polymer-based dyes (e.g., Brilliant Violet dyes) that can cause fluorophores to stick together, creating artificial signals [21]. | Mandatory when using more than one polymer dye in a panel. |
Frequently Asked Questions (FAQs)
Q: My single-stain controls look perfect, but my fully stained tube still has compensation errors. What happened? A: This is a classic sign that the "brightness rule" has been violated [21]. The most common causes are:
- You used compensation beads for controls but your experimental sample has dimmer expression of the target antigen.
- You used a different fluorophore in the control versus the full stain (e.g., using a FITC control to compensate for GFP) [21].
- Fixative was added to the full stain but not the controls, altering the fluorescence emission [21].
Q: Can I use an isotype control instead of a single-stain control to set compensation? A: No. Isotype controls are designed to assess non-specific antibody binding, not to calculate spectral spillover. For compensation, you must use a bright, specific positive signal from a single-stain control to accurately measure how much spillover needs to be subtracted [53].
Q: Are FMO controls a substitute for proper single-stain controls? A: No, they serve different purposes. Single-stain controls are technical controls required for the instrument to perform compensation or unmixing. FMO controls are experimental controls used for accurate gating, especially for dim markers or to account for spread error in multicolor panels. Both are essential for high-quality data [55] [53].
In high-parameter flow cytometry, the integrity of data is paramount for accurate interpretation of complex cellular populations. Non-specific antibody binding presents a significant challenge, compromising data quality by increasing background noise and reducing the signal-to-noise ratio essential for detecting authentic biological signals. This technical guide addresses the critical roles of serum blocking and specialized stain buffers in mitigating these unwanted binding events, providing researchers with practical methodologies to enhance assay specificity and sensitivity.
FAQ: Understanding and Preventing Non-Specific Binding
What causes non-specific antibody binding in flow cytometry?
Non-specific binding occurs when antibodies bind to cells through mechanisms other than the specific epitope-antibody interaction. The primary causes include:
- Fc receptor binding: Fc regions of antibodies bind to Fc receptors expressed on immune cells like neutrophils, monocytes, macrophages, B-cells, NK cells, and some T-cell subsets [57]. This represents a high-affinity specific interaction that creates background staining in assays.
- True non-specific interactions: These include electrostatic interactions, hydrophobic binding, and other low-affinity interactions with cellular components [58].
- Dead cells: Non-viable cells exhibit "sticky" properties due to exposed DNA and damaged membranes, leading to non-specific antibody adherence [57] [58].
- Polymer dye interactions: Dyes like Brilliant Violet, Super Bright, and NovaFluor dyes are prone to dye-dye interactions that can cause non-specific signal [26].
- Excessive antibody concentration: When antibody concentrations are too high, they bind to lower-affinity targets, increasing background fluorescence [57].
- Insufficient protein in buffers: Lack of protein in washing and staining solutions allows antibodies to bind non-specifically to cells [57].
How does serum blocking reduce non-specific staining?
Serum blocking works through multiple mechanisms to minimize non-specific interactions:
- Fc receptor saturation: Normal serum from appropriate species contains immunoglobulins that compete for and block Fc receptors, preventing subsequent binding of staining antibodies via their Fc portions [59] [26].
- Non-specific site occupation: Serum proteins occupy non-specific binding sites on cells through electrostatic and hydrophobic interactions, reducing background staining [58].
- Species compatibility: For optimal blocking, use normal sera from the same species as your staining antibodies (e.g., rat serum if staining mouse samples with rat antibodies) [26].
When should I use specialized stain buffers?
Specialized stain buffers address specific non-specific interaction mechanisms:
- Brilliant Stain Buffer/Brilliant Stain Buffer Plus: Essential when using antibodies conjugated to polymer dyes (Brilliant Violet, Brilliant Ultra Violet, Super Bright dyes) to prevent dye-dye interactions [59] [26] [60].
- Super Bright Complete Staining Buffer: Reduces background when using multiple polymer dye-conjugated antibodies simultaneously [59].
- CellBlox Blocking Buffer: Required when using NovaFluor dyes or cyanine-based dyes to prevent non-specific dye interactions [59].
- Standard staining buffers with protein: Always use buffers containing BSA (0.5-1%) or FBS (5-10%) to cover non-specific protein binding sites [57] [39].
How do I design an effective blocking strategy for my panel?
An integrated blocking strategy addresses multiple sources of non-specific binding simultaneously. The following workflow outlines a comprehensive approach:
What are the best practices for minimizing non-specific binding in multicolor panels?
Implement these evidence-based practices to optimize your staining protocol:
- Antibody titration: Always titrate antibodies to determine the optimal concentration that provides the best signal-to-noise ratio [57] [60].
- Viability staining: Include a fixable viability dye in every experiment to exclude dead cells during analysis [57] [60] [61].
- Order of operations: Perform live/dead staining before fixation and before surface staining [61].
- Buffer composition: Ensure all washing and staining buffers contain protein (BSA or FBS) at appropriate concentrations [57] [39].
- Control experiments: Include appropriate controls such as fluorescence minus one (FMO) and isotype controls to establish background levels [39] [62].
- Simultaneous blocking: Use a combination blocking solution containing sera from multiple species when working with antibodies from different hosts [26].
Troubleshooting Guide: Common Non-Specific Binding Issues
High Background Fluorescence Across Multiple Channels
| Possible Cause | Solution | Reference |
|---|---|---|
| Excessive antibody concentration | Titrate antibodies to determine optimal concentration | [57] [62] |
| Inadequate Fc receptor blocking | Implement Fc blocking with species-specific serum or anti-FcR antibodies | [57] [59] [39] |
| Dead cells in sample | Include viability dye and gate out dead cells during analysis | [57] [60] [61] |
| Insufficient protein in buffers | Add BSA (0.5-1%) or FBS (5-10%) to all washing and staining buffers | [57] [39] |
| Inadequate washing | Increase wash steps and volumes (2mL per tube for 5x10^5 - 1x10^6 cells) | [59] [39] |
Specific Population Background or Unexpected Staining
| Problem | Possible Cause | Solution | |
|---|---|---|---|
| High background on monocytes/macrophages | High Fc receptor expression | Use Fc receptor blocking reagent specific for CD16/CD32 | [57] [58] |
| Appears undercompensated despite compensation | Dye-dye interactions between polymer dyes | Add Brilliant Stain Buffer or Super Bright Complete Staining Buffer | [59] [26] |
| Specific marker shows high background | Antibody cross-reactivity or lot-specific issues | Try different antibody clone or perform additional validation | [62] |
| Increased autofluorescence in certain channels | Cell-intrinsic properties (e.g., neutrophils) | Use brighter fluorophores or shift to red-shifted channels | [62] |
Experimental Protocols
Basic Protocol: Comprehensive Blocking for Surface Staining
This protocol provides an optimized approach for reducing non-specific interactions in high-parameter flow cytometry when performing surface staining [26].
Materials Required
- Mouse serum (e.g., Thermo Fisher, cat. no. 10410)
- Rat serum (e.g., Thermo Fisher, cat. no. 10710C)
- Tandem stabilizer (e.g., BioLegend, cat. no. 421802)
- Brilliant Stain Buffer (Thermo Fisher, cat. no. 00-4409-75) or BD Horizon Brilliant Stain Buffer Plus (BD Biosciences, cat. no. 566385)
- FACS buffer (PBS with 0.5-1% BSA or 5-10% FBS)
- Sterilin clear microtiter plates, 96-well V-bottom (Fisher Scientific, cat. no. 1189740)
Step-by-Step Procedure
Prepare blocking solution using the following formulation:
Reagent Volume for 1mL mix Mouse serum 300μL Rat serum 300μL Tandem stabilizer 1μL 10% Sodium azide (optional) 10μL FACS buffer Remaining volume to 1mL Dispense cells into V-bottom 96-well plates (0.5-1x10^6 cells/well in 50-100μL).
Centrifuge at 300-500 × g for 5 minutes at 4°C and carefully remove supernatant.
Resuspend cells in 20μL blocking solution per sample.
Incubate 15 minutes at room temperature in the dark.
Prepare surface staining master mix containing:
- Tandem stabilizer (1:1000 dilution)
- Brilliant Stain Buffer (up to 30% of total volume)
- Titrated antibodies at predetermined optimal concentrations
- FACS buffer to volume
Add 100μL surface staining mix to each sample and mix gently by pipetting.
Incubate 30-60 minutes at 2-8°C or room temperature in the dark.
Wash cells with 120-200μL FACS buffer, centrifuge at 300-500 × g for 5 minutes, and discard supernatant.
Repeat wash with 200μL FACS buffer.
Resuspend samples in FACS buffer containing tandem stabilizer at 1:1000 dilution.
Acquire samples on flow cytometer within 3 days if fixed, or immediately if live cells.
Protocol Modifications for Different Sample Types
| Sample Type | Blocking Modification | Stain Buffer Consideration | |
|---|---|---|---|
| Human PBMCs | Use human Fc receptor blocker or 2% mouse serum | Brilliant Stain Buffer required for polymer dyes | [59] [26] |
| Mouse splenocytes | Use anti-mouse CD16/32 (clone 2.4G2) | CellBlox required for NovaFluor dyes | [59] [58] |
| Whole blood | Fc block before staining, lyse RBCs after staining | Consider lyse/wash buffer compatibility with dyes | [59] [60] |
| Tissue digests | Increased viability staining critical; may require additional blocking | Higher background may necessitate increased stain buffer | [60] |
The Scientist's Toolkit: Essential Reagents for Minimizing Non-Specific Binding
| Reagent Category | Specific Examples | Function | Application Notes | |
|---|---|---|---|---|
| Fc Blocking Reagents | Anti-mouse CD16/32 (clone 2.4G2), anti-human CD16/CD32, normal serum | Blocks Fc-mediated binding to Fcγ receptors on immune cells | Species-specific blocking critical; use sera matching antibody host | [57] [59] [39] |
| Polymer Dye Stain Buffers | Brilliant Stain Buffer, Brilliant Stain Buffer Plus, Super Bright Complete Staining Buffer | Prevents dye-dye interactions between polymer-based fluorophores | Essential when using ≥2 Brilliant Violet, Super Bright, or similar dyes | [59] [26] [60] |
| Protein Buffers | FACS buffer with 0.5-1% BSA or 5-10% FBS | Occupies non-specific protein binding sites on cells | Should be used in all wash and staining buffers | [57] [39] [61] |
| Viability Dyes | Fixable viability dyes (LIVE/DEAD, Zombie dyes), 7-AAD, PI | Identifies dead cells for exclusion during analysis | Fixable dyes required for intracellular staining; DNA dyes for surface only | [57] [60] [61] |
| Tandem Stabilizers | Commercial stabilizers | Prevents degradation of tandem dyes | Particularly important for PE-Cy7, APC-Cy7, and other tandems | [26] |
Advanced Considerations for Spectral Flow Cytometry
The principles of blocking non-specific binding remain critical in spectral flow cytometry, though the manifestation of issues may differ from conventional flow cytometry. In spectral cytometry, the impact of non-specific binding extends beyond increased background to potentially affecting the entire fluorescence signature used for unmixing. Fc-mediated binding and dye interactions can introduce errors during the unmixing process, leading to misassignment of signals and inaccurate population identification. Therefore, the blocking strategies outlined in this guide are equally, if not more, important in spectral applications to ensure pure reference spectra and accurate unmixing of complex datasets.
Effective management of non-specific binding through strategic use of serum blocking and specialized stain buffers is fundamental to achieving high-quality flow cytometry data. By implementing the comprehensive troubleshooting guide, experimental protocols, and reagent strategies outlined in this technical resource, researchers can significantly enhance the specificity and sensitivity of their flow cytometry assays, leading to more accurate and reproducible results in complex multicolor panels.
FAQs: Fixation, Handling, and Spectral Data Quality
How do different fixatives affect fluorophore spectra and autofluorescence?
Different fixatives chemically alter samples in ways that can significantly impact fluorescence. Aldehyde-based fixatives like formaldehyde and formalin create cross-links between proteins, preserving cellular structure but potentially generating unwanted autofluorescent by-products in the 350-550 nm range [63]. Research on tissue samples indicates that formalin is the least disruptive fixative for fluorescence properties, having only a weak effect on two-photon fluorescence spectroscopy [64] [65]. In contrast, alcohol-based fixatives like methanol and ethanol dehydrate samples, causing protein denaturation. Methanol has been shown to have a significant influence on autofluorescence peaks and can denature sensitive fluorescent proteins like PE, APC, and PerCP [64] [65] [63].
Can fixation alter the spectral signature of a fluorophore enough to affect unmixing?
Yes. If you add fixative to your fully stained samples but not to your single-stain controls, it can slightly alter the fluorophore's emission spectrum [21]. This change can modify the amount of spillover into detectors, meaning the compensation or unmixing matrix calculated from your controls will not accurately represent the spillover in your experimental samples. Always treat your controls and experimental samples identically regarding fixation to ensure accurate spectral unmixing [21].
What are the best practices for sample handling before fixation to ensure data fidelity?
Sample handling significantly impacts fluorescence. While one study on mouse skeletal muscle found that two handling processes (sectioning immediately or after freezer storage) yielded similar spectral information [64], consistency is critical. More generally, to preserve antigen integrity and viability:
- Keep cells on ice or at 4°C to halt internalization of surface antigens [15].
- Use protein transport inhibitors like sodium azide to prevent antigen modulation [15].
- For cell lines, avoid harsh detachment methods like trypsin, which can induce internalization of surface proteins [15].
How does fixation impact the selection and performance of fluorophores?
Fixation can diminish or destroy the signal of certain fluorophores. Fluorescent proteins (e.g., PE, APC, PerCP) are particularly susceptible to denaturation by alcohol-based solvents [63]. Most synthetic fluorescent dyes are more robust and can withstand these reagents [63]. When working with fixed samples, especially those fixed with aldehydes that increase background autofluorescence, select fluorophores with longer emission wavelengths (e.g., red and infrared) to avoid the autofluorescence spectrum [63].
Troubleshooting Guides
Problem: High Background or Unusually Dim Staining in Fixed Samples
Potential Causes and Solutions:
| Cause | Solution |
|---|---|
| Autofluorescence from aldehyde fixation | Use fluorophores with emissions >550 nm; include an unstained control for every condition to measure autofluorescence [66] [63]. |
| Epitope damage from fixation | Optimize fixation time and temperature; perform antigen retrieval if needed [63]. |
| Inadequate washing post-fixation | Ensure thorough washing to remove excess fixative and reduce trapped reagents that cause background [15]. |
| Fixative incompatibility with fluorophore | Check antibody datasheets for fixation validation; avoid alcohols for sensitive fluorophores [63]. |
Problem: Compensation/Unmixing Errors After Fixation
Potential Causes and Solutions:
| Error Type | Solution |
|---|---|
| Errors in both controls and full stains | Verify correct gate placement on single-stained controls; ensure the autofluorescence of negative particles is matched [21]. |
| Errors only in full stains, not controls | Ensure single-stain controls are brighter than or equal to experimental samples and treated with the same fixative [21]. |
Problem: Loss of Cell Surface Marker Staining
Potential Causes and Solutions:
- Cause: Chemical cross-linking from aldehyde fixation can mask epitopes.
- Solution: Implement a "surface stain before fixation" protocol. Stain live cells for surface markers first, then wash, fix, and permeabilize for intracellular staining if needed [63].
- Cause: Internalization of surface antigens due to improper handling.
- Solution: Perform all staining steps on ice with ice-cold buffers and include sodium azide [15].
Experimental Protocols for Validating Fixation
Protocol: Titrating Antibodies for Fixed Cells
Antibody concentrations optimized for live cells may not be optimal for fixed cells due to altered antigen accessibility and background.
- Prepare a cell pellet identical to your experimental condition.
- Create a series of 2-3-fold dilutions of the antibody in staining buffer.
- Stain separate cell aliquots with each dilution, following your standard staining and fixation protocol.
- Run samples on the cytometer and analyze the Stain Index (SI) for each dilution.
SI = (Median Fluorescence Positive - Median Fluorescence Negative) / (2 × SD of Negative) - Select the antibody concentration that yields the highest Stain Index, indicating the best separation between positive and negative populations [66].
Protocol: Validating Unmixing Controls with Your Fixation Method
This protocol ensures your single-stain controls accurately represent the spectral signatures of your fixed samples.
- Prepare your single-stain controls (using beads or cells) and split each into two tubes.
- Fix one tube from each pair using your standard fixation protocol. Leave the other tube unfixed.
- Acquire all controls on your spectral cytometer.
- Compare the full emission spectrum of the fixed versus unfixed control for each fluorophore.
- Result: If the spectra are identical, your unfixed controls are valid. If significant differences are noted, you must use fixed controls for accurate unmixing of fixed samples.
The Scientist's Toolkit: Essential Reagents
| Research Reagent | Function |
|---|---|
| Formalin/Formaldehyde | Aldehyde-based fixative; cross-links proteins, preserving structure with minimal impact on many fluorophore spectra [64] [65] [63]. |
| Methanol | Alcohol-based fixative; denatures and precipitates proteins; can significantly alter autofluorescence and destroy sensitive fluorescent proteins [64] [65] [63]. |
| Triton X-100 | Non-ionic detergent for permeabilizing all lipid bilayers after aldehyde fixation [63]. |
| Saponin | Mild detergent for permeabilizing plasma membranes without disrupting internal organelle membranes; often used for intracellular cytokine staining [63]. |
| BD Horizon Brilliant Stain Buffer | Polymer dye stain buffer; prevents aggregation of polymer-based dyes (BUV, BV, BB) which can cause false-positive signals and unmixing errors [60] [21]. |
| Fc Blocking Reagent | Blocks non-specific binding of antibodies to Fc receptors on immune cells, reducing background staining [66]. |
| Amine-Reactive Viability Dyes | Distinguishes live from dead cells; critical as fixation kills cells and dead cells exhibit non-specific staining [67]. |
Workflow and Relationship Diagrams
Figure 1. Experimental workflow for handling and fixation in flow cytometry.
Figure 2. Fixation impacts on data and solutions.
Validation Frameworks and Clinical Applications of Spectral Cytometry
Fit-for-purpose (FFP) validation is a fundamental principle in ensuring that flow cytometry assays, including complex spectral panels, produce reliable, accurate, and reproducible data suitable for their specific intended use [68]. This approach recognizes that the extent and rigor of validation should be driven by the assay's Context of Use (COU)—the specific role the data will play in research or decision-making [69] [68]. The CLSI H62 guideline provides a standardized framework for validating flow cytometry assays, addressing the unique challenges of cellular analysis that are not fully covered by guidance for soluble analytes [70] [71].
Spectral flow cytometry (SF) dramatically expands analytical capabilities by measuring the full emission spectrum of fluorophores, enabling highly multiparametric panels. However, this power introduces unique validation challenges, including managing complex spectral overlap, sophisticated unmixing algorithms, and high-dimensional data analysis [72]. Applying a fit-for-purpose approach to spectral panels ensures that these technical challenges are adequately addressed in a way that is proportionate to the assay's goals, whether for basic research, translational studies, or clinical trials [71] [73].
Core Principles of CLSI H62 and Spectral Flow Cytometry
Understanding CLSI H62 Framework
The CLSI H62 guideline, titled "Validation of Assays Performed by Flow Cytometry," provides critical validation strategies specifically designed for cellular analysis [71]. Its scope encompasses pre-examination, examination, and post-examination phases, covering:
- Instrument qualification and standardization
- Assay optimization and validation
- Quality control procedures and data management
A key strength of the H62 framework is its flexibility; it provides specific recommendations for the appropriate analytical method validation approach based on the intended use of the data and any associated regulatory requirements [71]. This makes it particularly valuable for spectral flow cytometry applications, where technological complexity demands a tailored approach.
Fundamentals of Spectral Flow Cytometry
Spectral flow cytometry differs fundamentally from conventional flow cytometry in its technical approach. While conventional cytometers use optical filters to direct specific wavelength ranges to detectors, spectral cytometers control only the excitation and collect the entire emission spectrum across all wavelengths for each cell [72]. This requires a unique data processing step called "spectral unmixing," which decomposes the total spectral signature into its individual fluorophore components [72].
The table below summarizes key technological differences and their validation implications:
Table: Spectral vs. Conventional Flow Cytometry: Technical Comparison
| Feature | Conventional Flow Cytometry | Spectral Flow Cytometry |
|---|---|---|
| Light Detection | Uses filters and mirrors to direct specific wavelength bands to detectors | Collects full emission spectrum across multiple detectors |
| Spillover Correction | Compensation | Spectral unmixing |
| Key Advantage | Well-established, simpler data analysis | Higher multiplexing capability, improved signal-to-noise |
| Validation Focus | Compensation accuracy, filter configuration | Unmixing accuracy, reference library quality |
Implementing Fit-for-Purpose Validation for Spectral Panels
Defining Context of Use (COU)
The foundation of any fit-for-purpose validation is a precisely defined Context of Use [68]. The COU statement should clearly articulate how the biomarker data will support specific research or regulatory decisions. For spectral flow panels, consider:
- Exploratory Research: Early-phase discovery where data informs internal decisions only. Validation can focus on basic precision and reproducibility.
- Translational Studies: Supporting preclinical to clinical transition. Requires more rigorous validation, including cross-site reproducibility.
- Clinical Trial Endpoints: Supporting regulatory submissions. Demands comprehensive validation meeting regulatory standards.
As emphasized in workshop reports, "no context, no validated assay" – without a clear understanding of the intended use of the data, it is not possible to properly validate the assay [68].
The Backbone Panel Approach for Efficient Validation
A backbone panel strategy provides significant efficiency for validating and implementing spectral flow assays, particularly in clinical-stage programs [45]. This approach uses a well-characterized, optimized core set of markers that define major cell populations, with flexible "drop-in" channels for study-specific targets.
The backbone approach offers several key benefits:
- Cross-site reproducibility through standardized population definitions
- Faster deployment with shorter assay optimization timelines
- Enhanced data comparability for longitudinal and multi-cohort analyses
- More efficient validations through targeted, iterative approach [45]
Key Validation Parameters for Spectral Panels
Based on CLSI H62 recommendations and spectral-specific considerations, the table below outlines core validation parameters and their FFP application:
Table: Fit-for-Purpose Validation Parameters for Spectral Flow Cytometry
| Validation Parameter | Exploratory COU | Translational COU | Clinical/Regulatory COU |
|---|---|---|---|
| Precision (Repeatability) | Intra-assay, 3 replicates | Intra- & inter-assay, 3-5 replicates | Intra-, inter-assay, inter-operator, inter-site |
| Accuracy/Specificity | Comparison to known positive/negative cells | Include biological negative controls | Extensive testing with true positive/negative cell types [69] |
| Sensitivity (LOB/LOD) | Estimate from negative population | Formal LOB/LOD determination | Full LOB/LOD/LLOQ characterization [45] |
| Stability | Short-term sample stability | Extended stability under various conditions | Comprehensive pre-analytical variable assessment [68] |
| Spectral Unmixing Validation | Single-color controls with beads | Single-color controls with cells | Full validation with biological controls and system suitability tests |
Experimental Protocols for Spectral Panel Validation
Protocol: Validating Spectral Unmixing Performance
Purpose: To ensure accurate separation of fluorophore signals in spectral panels.
Materials:
- Single-color controls for each fluorophore in panel
- Compensation beads OR biological negative control cells
- Viability dye (for live/dead discrimination)
- Spectral flow cytometer with appropriate lasers
Procedure:
- Prepare single-color controls: Stain separate aliquots of cells or beads with each individual fluorophore-conjugated antibody used in the panel.
- Include biological controls: Use unstained cells and autofluorescence controls to account for cellular background [72].
- Acquire reference spectra: Run each single-color control separately, collecting sufficient events for high-quality reference spectra.
- Validate unmixing accuracy: Create defined mixtures of two or three fluorophores with known ratios to test unmixing performance.
- Assess spillover spreading: Compare the variance in positive populations before and after unmixing to evaluate signal-to-noise improvement.
Troubleshooting Tip: When unmixing artifacts occur, verify that reference spectra match the experimental conditions exactly, particularly for tandem dyes that may degrade over time [72] [2].
Protocol: Panel Titration and Optimization
Purpose: To determine optimal antibody concentrations for spectral panels.
Procedure:
- Prepare a dilution series for each antibody (e.g., undiluted, 1:2, 1:5, 1:10, 1:20 of manufacturer's recommended concentration).
- Stain replicate samples with each antibody dilution in the context of the full panel.
- Analyze using standardized instrument settings and unmixing parameters.
- Calculate the staining index for each dilution: (Medianpositive - Mediannegative) / (2 × SD_negative)
- Select the concentration that provides ≥80% of maximum staining index without increasing background signal.
Validation Consideration: For backbone panels, complete titration is only required when introducing new markers to the established core [45].
Troubleshooting Guides for Spectral Panel Validation
Common Spectral Flow Issues and Solutions
Table: Spectral Flow Cytometry Troubleshooting Guide
| Problem | Possible Causes | Recommended Solutions |
|---|---|---|
| Poor resolution after unmixing | Inadequate reference spectra; fluorophore degradation; excessive background | Use cellular single-color controls; check fluorophore stability; include autofluorescence compensation [72] |
| High background across multiple channels | Cell autofluorescence; dead cells; over-fixation | Use viability dyes; employ red-shifted fluorophores; optimize fixation protocol [74] |
| Unexpected population spreading | Spectral spillover; insufficient detector resolution; poor voltage optimization | Review panel design to minimize major peak overlap; optimize PMT voltages; check instrument calibration [72] [2] |
| Day-to-day variability | Instrument drift; reagent lot changes; inconsistent unmixing | Daily calibration beads; establish reference standards; document all QC metrics [72] [75] |
| Weak or no signal | Target abundance too low; dim fluorophore-choice; instrument issues | Pair low-abundance targets with bright fluorophores; verify laser alignment and detector sensitivity [74] |
Addressing Spectral Panel-Specific Challenges
Spectral Spillover and Unmixing Artifacts Even with advanced unmixing algorithms, spectral overlap can cause challenges. To minimize these issues:
- Panel Design: Spread fluorophores across as many lasers and detectors as possible [2]
- Fluorophore Selection: Prioritize bright fluorophores for low-abundance targets [74]
- Reference Controls: Always use biological controls (cells) rather than beads for generating reference spectra when possible, as they better capture cellular autofluorescence [72]
Data Visualization and Analysis Challenges The high-dimensional nature of spectral flow data presents unique analysis hurdles:
- Visualization Limitations: Traditional bi-dimensional plots are impractical for panels exceeding 20 markers [72]
- Normalization Requirements: Implement batch effect correction algorithms like CytoNorm when collecting data across multiple days or sites [72]
- Computational Resources: Develop proficiency in R or Python for advanced analysis of high-dimensional spectral data [72]
Frequently Asked Questions (FAQs)
Q1: How does validation differ for spectral versus conventional flow cytometry? A1: The core validation principles remain consistent, but spectral flow requires additional focus on:
- Validation of spectral unmixing algorithms and reference libraries
- Assessment of autofluorescence compensation in high-parameter panels
- Verification of panel performance with all fluorophores combined
- Implementation of specialized normalization for high-dimensional data [72]
Q2: What are the minimum validation requirements for an exploratory spectral panel? A2: For exploratory COU, focus on:
- Basic precision (intra-assay variability)
- Specificity using known positive/negative biological controls
- Verification of spectral unmixing with single-color controls
- Limited stability assessment under expected handling conditions
- Determination of approximate detection limits [70] [68]
Q3: How should we handle assay modifications to validated spectral panels? A3: CLSI H62 provides guidance on modification validation strategies. The extent of revalidation depends on the modification type:
- Minor change (e.g., same antibody clone, different lot): Limited verification
- Moderate change (e.g., new antibody with same specificity): Partial revalidation
- Major change (e.g., new fluorophore, new marker): Extensive revalidation Recent publications build on H62 to provide specific recommendations for different modification types [70] [45].
Q4: What controls are essential for validating spectral unmixing? A4:
- Single-color controls for every fluorophore in the panel
- Unstained cells to establish autofluorescence baseline
- Biological negative controls (cells lacking target antigen)
- Fully stained samples to verify combined performance
- Compensation beads for instrument performance tracking [72] [2]
Q5: How can we improve reproducibility of spectral assays across multiple sites? A5:
- Implement standardized backbone panels with defined core markers [45]
- Establish centralized instrument calibration protocols
- Use shared reference samples for cross-site normalization
- Develop detailed SOPs for sample processing and analysis
- Conduct regular cross-site proficiency testing [45]
Essential Research Reagent Solutions
The table below summarizes key reagents and materials critical for successful spectral panel validation:
Table: Essential Research Reagents for Spectral Flow Cytometry Validation
| Reagent/Material | Function in Validation | Key Considerations |
|---|---|---|
| Viability Dyes | Distinguish live/dead cells; reduce non-specific binding | Use fixable viability dyes for intracellular staining [74] |
| Reference Standard Cells | Establish positive/negative populations; generate reference spectra | Use well-characterized cell lines or primary cells with known marker expression [69] |
| Calibration Beads | Instrument performance tracking; daily QC | Include beads with multiple intensity levels for linearity assessment |
| Titration Reference Materials | Antibody concentration optimization | Use biological samples representing experimental conditions |
| Stability Reference Samples | Assess pre-analytical variables | Prepare aliquots from single source for consistency |
| FC Receptor Blocking Reagent | Reduce non-specific antibody binding | Particularly important for primary human samples [74] |
Flow cytometry has become an indispensable technology in modern clinical hematology, providing critical tools for detecting minimal residual disease (MRD) in hematologic malignancies and monitoring innovative cellular immunotherapies like CAR-T cells. These applications demand exceptional technical precision, as they involve identifying rare cell populations and characterizing complex cellular phenotypes. The foundation of success in these areas relies on properly configured instrumentation, optimized panel design, and rigorous sample handling to overcome challenges such as spectral overlap in multicolor panels. This technical support center addresses the specific experimental issues researchers encounter when working in these advanced clinical applications, providing troubleshooting guidance and methodological frameworks to ensure reliable, reproducible results.
Frequently Asked Questions (FAQs)
Q1: What are the critical sample collection requirements for reliable MRD detection in acute myeloid leukemia (AML)?
Proper bone marrow sampling is the most fundamental requirement for accurate MRD assessment. The sample must be obtained from the first pull of a bone marrow aspirate (recommended volume <5 mL) to prevent dilution from peripheral blood, a phenomenon known as hemodilution. MRD levels in peripheral blood are approximately 1-log lower than in bone marrow, making diluted samples prone to false-negative results. To assess sample quality, you can evaluate mast cell populations (CD117hi cells ≤0.002% suggests contamination), determine the proportion of mature neutrophils (above 90% indicates hemodilution), or use specialized formulas requiring matched peripheral blood samples. EDTA is the most commonly recommended anticoagulant, though laboratories must validate their chosen anticoagulant as some (like heparin) may be preferable for certain markers such as CD11b [76].
Q2: What sensitivity level is required for clinically meaningful MRD detection, and how is this achieved technically?
For prognostically significant MRD detection in hematological malignancies like AML, a sensitivity of 0.01% (10⁻⁴) or lower is required. This sensitivity is governed by Poisson statistics, with precision directly dependent on the total number of cells collected and analyzed. Achieving this sensitivity requires:
- Acquisition of sufficient cell numbers (typically millions of cells)
- Antibody panels that define a consistent "fingerprint" to identify abnormal populations
- Approaches that detect populations phenotypically "different from normal"
- Optimization of signal-to-noise ratio through improved fluorochromes, particularly those excited by violet lasers [77]
Q3: What are the key differences between flow cytometry and molecular methods for CAR-T cell monitoring?
Flow cytometry and digital PCR (dPCR) provide complementary information for CAR-T cell monitoring, each with distinct advantages and limitations as summarized in the table below.
Table 1: Comparison of CAR-T Cell Monitoring Methods
| Parameter | Flow Cytometry | Digital PCR (dPCR) |
|---|---|---|
| Measured Parameter | CAR protein expression on cell surface | Integrated CAR vector at genomic level |
| Sensitivity | Lower (reliability weak below 0.5% of T cells) | Extremely sensitive |
| Additional Information | Phenotypic characterization (T-cell subsets, differentiation, exhaustion markers) | No information on CAR expression |
| Turnaround Time | Rapid (real-time results) | Requires specialized assay design |
| Primary Clinical Use | Early expansion monitoring (peak expansion, AUC₀₋₂₈) | Long-term persistence tracking |
For clinical monitoring, flow cytometry is recommended two or three times weekly for the first two weeks after CAR-T cell infusion, then on days 21 and 28, monthly until 3 months, and every 3 months until 1 year [78].
Q4: How does spectral flow cytometry address panel design challenges compared to conventional flow cytometry?
Spectral flow cytometry fundamentally differs from conventional flow cytometry in its approach to fluorescence detection and spillover correction as detailed in the table below.
Table 2: Spectral vs. Conventional Flow Cytometry for Clinical Applications
| Feature | Conventional Flow Cytometry | Spectral Flow Cytometry |
|---|---|---|
| Detection Method | Single detector per fluorophore collecting emission near maxima | Multiple detectors capturing full emission spectrum (~350-900 nm) |
| Spillover Correction | Compensation | Spectral unmixing |
| Fluorophore Selection Limits | Limited by optical configuration | Limited by uniqueness of spectral signature |
| Autofluorescence Handling | Not separately quantifiable | Can be extracted as a separate parameter |
| Panel Complexity | Limited by filter configuration | High (≥40 parameters possible) |
Spectral flow cytometry provides greater flexibility in panel design by distinguishing fluorophores with similar peak emissions but different off-peak spectral signatures, enabling more comprehensive immunophenotyping panels [9].
Troubleshooting Guides
Problem: High Background and/or Non-Specific Staining
Potential Causes and Solutions:
- Cause: Suboptimal sample viability leading to increased cellular debris and non-specific antibody binding.
- Solution: Always assess viability using viability dyes or by examining forward scatter (FSC) versus side scatter (SSC) properties. For samples older than 72 hours, viability assessment is critical. If viability is poor based on debris in FSC/SSC plots, request a new sample [76] [79].
- Cause: Inadequate washing steps or improper lysis procedures.
- Solution: Compare stain-lyse-wash (SLW) versus lyse-wash-stain-wash (LWSW) procedures. SLW typically provides clearer separation between positive and negative events, while LWSW may offer higher reproducibility. Add human serum albumin (0.1%) to PBS washing buffers to prevent cell clumping, especially in older samples [76].
- Cause: Antibody concentration issues or suboptimal clone selection.
- Solution: Titrate all antibodies and validate clones for specific applications. Consult resources like the ICCS Quality & Standards Committee modules for antibody validation guidance [80].
Problem: Loss or Lack of Expected Signal in CAR-T Cell Detection
Potential Causes and Solutions:
- Cause: Insensitive CAR detection reagents.
- Solution: Utilize multiple detection approaches. For commercial CD19 CAR-T cells, implement a two-step staining protocol using biotinylated CD19-Fc proteins followed by fluorochrome-conjugated anti-biotin antibodies. Alternatively, use antibodies directly recognizing the CAR idiotype or linker regions [78].
- Cause: Instrument sensitivity issues or suboptimal photomultiplier tube (PMT) settings.
- Solution: Perform regular instrument optimization using standardized calibration particles. Adjust PMT voltages to ensure optimal resolution of dim populations while maintaining bright populations within the dynamic range. Implement daily quality control procedures to monitor instrument performance [80].
- Cause: Phenotypic changes in CAR-T cells due to exhaustion or activation.
- Solution: Include markers for T-cell exhaustion (PD-1, TIM-3, LAG-3) and differentiation (CD45RA, CD62L, CCR7) in monitoring panels to identify functionally relevant subpopulations [81] [78].
Problem: Inconsistent MRD Results Between Timepoints
Potential Causes and Solutions:
- Cause: Sample quality variability, particularly hemodilution differences between collections.
- Solution: Implement standardized hemodilution assessment for all samples. Use consistent criteria for sample rejection (e.g., mast cells ≤0.002%, mature neutrophils >90%). When documented hemodilution occurs, request repeat bone marrow evaluation within 2 weeks [76].
- Cause: Changes in antigen expression patterns on tumor cells between treatment timepoints.
- Solution: Employ a "different from normal" approach rather than relying solely on leukemia-associated immunophenotypes (LAIPs), which can evolve. Include backbone markers (CD45, CD34, CD117, CD13, CD33, HLA-DR) in all tubes to enable consistent population identification across panels [77] [76].
- Cause: Day-to-day instrument or reagent variability.
- Solution: Implement rigorous standardization procedures including daily quality control, lot-to-lit reagent validation, and periodic proficiency testing. For complex panels, use standardized antibody cocktails with validated stability profiles [80].
Workflow Diagrams
Figure 1: MRD Detection Workflow from Sample to Analysis
Figure 2: Comprehensive CAR-T Cell Monitoring Protocol
Research Reagent Solutions
Table 3: Essential Reagents for MRD and CAR-T Cell Monitoring
| Reagent Category | Specific Examples | Clinical/Research Application |
|---|---|---|
| Backbone Markers | CD45, CD34, CD117, CD33, HLA-DR | Population identification in MRD panels [76] |
| CAR Detection Reagents | CD19-Fc fusion proteins, anti-idiotype antibodies | CAR-T cell identification and enumeration [78] |
| T Cell Phenotyping Markers | CD3, CD4, CD8, CD45RA, CCR7, PD-1, TIM-3, LAG-3 | CAR-T cell differentiation and exhaustion status [81] [78] |
| Viability Dyes | Fixable viability dyes (e.g., Zombie, LIVE/DEAD) | Exclusion of dead cells in analysis [76] |
| Lysing Reagents | Ammonium chloride, Commercial lysing buffers | Erythrocyte removal while preserving leukocytes [76] |
| Standardization Tools | Calibration beads, Reference controls | Instrument quality control and standardization [80] |
Technical Notes
Optimizing Spectral Panel Design
When designing spectral flow cytometry panels for rare event detection, focus on the uniqueness of spectral signatures rather than just emission maxima. Utilize tools like the BD Spectrum Viewer to assess potential spillover and optimize fluorophore combinations. For high-parameter panels (>15 colors), include a "blank" channel for autofluorescence extraction and validate all new fluorophore combinations with control samples [9] [8].
Critical Validation Parameters for MRD Assays
For clinical MRD assay validation, establish and document the following performance characteristics:
- Limit of blank (LOB): Determined using negative control samples
- Limit of detection (LOD): Lowest MRD level reliably distinguished from background
- Lower limit of quantification (LLOQ): Level at which quantitative results meet precision standards
- Linear range: MRD levels across which quantitative results are reliable
- Intra- and inter-assay precision: Coefficient of variation at critical decision points [76]
Adherence to these technical standards ensures that both MRD detection and CAR-T cell monitoring provide clinically actionable results that can reliably guide treatment decisions and improve patient outcomes in hematologic malignancies.
In the age of big data, the need for deep immunophenotyping in research and drug development is paramount [23]. A core challenge in flow cytometry panel design is managing the spectral overlap of fluorophores, which can compromise data resolution and lead to misinterpretation [23] [82]. This technical support center focuses on the comparative analysis of conventional and spectral flow cytometry, providing targeted troubleshooting guides to help researchers navigate the distinct methodologies of each platform. Understanding how each technology handles spectral overlap is crucial for optimizing data quality and making informed decisions about sample consumption.
Technology Comparison: Resolution and Consumption
Core Technological Differences
The fundamental difference between conventional and spectral flow cytometry lies in their detection systems [23] [83].
- Conventional Flow Cytometry employs a "one detector–one fluorophore" approach. It uses optical filters to direct a narrow band of light, approximating the emission peak of a fluorophore, to a specific detector [23]. This system is physically limited by the number of filters and detectors that can be installed, making the optical path complex [23].
- Spectral Flow Cytometry captures the full emission spectrum of every fluorophore on a cell. Using a prism or diffraction grating, the emitted light is scattered and captured by a large array of detectors, creating a unique "spectral fingerprint" for each dye [23] [83]. This eliminates the need for a complex filter system and is the foundation for its superior multiplexing capability [23].
Quantitative Comparison Table
The table below summarizes the key differences between the two technologies, focusing on data resolution and sample consumption.
| Feature | Conventional Flow Cytometry | Spectral Flow Cytometry |
|---|---|---|
| Detection Principle | Filter-based; one detector per fluorophore [23] | Full-spectrum capture; array of detectors [23] [83] |
| Typical Max Parameters | ~15-30 parameters [82] | 40+ parameters [23] [84] [82] |
| Spectral Overlap Management | Compensation corrects for spillover [82] | Algorithmic "unmixing" of full spectra [23] [82] |
| Data Resolution | Limited by spillover spreading, especially in high-parameter panels [85] [82] | Higher resolution; can differentiate dyes with near-identical peaks [84] [82] |
| Impact on Sample Consumption | High; may require multiple tubes/panels to assess many targets, splitting precious samples [84] | Low; maximizes data per sample run, ideal for low-cell-count or precious samples [84] |
| Autofluorescence Handling | Can obscure specific signals, increasing background [85] [40] | Can be algorithmically extracted and subtracted to improve signal clarity [82] |
Troubleshooting Guides & FAQs
Frequently Asked Questions (FAQs)
Q1: My spectral unmixing results look poor. What are the primary causes? Poor unmixing is often traced to panel design or control setup. Ensure your single-stained controls are brighter than your fully stained sample and that you use the exact same fluorophore in controls and experiments [21]. For polymer dyes, always use an appropriate stain buffer to prevent dye aggregation [21].
Q2: Can I use the same fluorophores on both conventional and spectral cytometers? Yes, almost all fluorescent dyes, including fluorescent proteins, small organic dyes, quantum dots, and tandem dyes, are suitable for spectral cytometry [23]. The key advantage is that spectral cytometry allows for the use of fluorophores with highly overlapping spectra that would be incompatible on a conventional instrument [84] [82].
Q3: Why is my data resolution poor on a conventional cytometer even with a well-designed panel? In conventional cytometry, "spillover spreading" is a major cause of resolution loss. This is a natural phenomenon caused by measurement errors from multiple fluorochromes spilling into each other's detectors [85]. It is particularly problematic for detecting dim markers and becomes worse as more parameters are added [85] [82].
Q4: Is spectral flow cytometry only beneficial for high-parameter (30+) panels? No. Spectral flow offers advantages even for low-parameter panels. The simplicity of automated unmixing versus manual compensation, the ability to use "problematic" dim or overlapping dyes, and the future-proofing of your data are valuable for routine experiments as well [82].
Troubleshooting Flowchart: Resolving Unmixing and Compensation Errors
This flowchart guides you through diagnosing and fixing common data resolution issues in both conventional (compensation) and spectral (unmixing) workflows. The process is based on a systematic approach to error identification [21].
Troubleshooting Common Experimental Issues
The table below addresses specific experimental problems, their potential sources, and recommended solutions.
| Issue | Potential Source | Recommended Solution |
|---|---|---|
| Weak or No Signal | Antibody concentration too low; low antigen expression; inaccessible intracellular antigen; photobleaching [85] [86]. | Titrate antibodies [85] [86]; pair rare proteins with bright fluorochromes [85]; optimize fixation/permeabilization [85] [86]; protect samples from light [85]. |
| High Background Fluorescence | Autofluorescence from dead/over-fixed cells; non-specific Fc receptor binding; poor compensation/unmixing [85] [86] [40]. | Use viability dyes [85] [40]; employ Fc receptor blocking [85] [40]; run fresh cells/unstained controls [85]; verify compensation controls [85]. |
| High Fluorescent Intensity / Saturation | Antibody concentration too high; bright fluorochrome paired with high-abundance antigen; PMT voltage too high [86]. | Titrate antibodies [86]; pair high-expression antigens with dimmer fluorochromes [86] [40]; optimize PMT voltage with controls [86]. |
| Abnormal Event Rate | Clogged sample line; incorrect cell concentration; sample clumping [86] [40]. | Unclog line with bleach/water [86]; dilute cell count to ~1x10⁶/ml [86]; sieve cells to remove debris [86]. |
Essential Protocols & Reagent Solutions
The Scientist's Toolkit: Key Research Reagent Solutions
| Item | Function & Explanation |
|---|---|
| Viability Dyes (e.g., PI, 7-AAD) | Distinguish live from dead cells. Dead cells bind antibodies non-specifically, increasing background; gating them out is crucial for clean data [85] [40]. |
| Fc Receptor Blocking Reagent | Blocks non-specific antibody binding via Fc receptors on immune cells (e.g., macrophages, dendritic cells), reducing high background staining [85] [86]. |
| Compensation Beads / Capture Beads | Used to create consistent and bright single-stained controls for setting up compensation on conventional cytometers or building a spectral library [85] [21]. |
| Brilliant Stain Buffer | Prevents aggregation of polymer dyes (e.g., Brilliant Violet dyes) when multiple are used in a single panel, which can cause unmixing errors and poor data [21]. |
| Fixation & Permeabilization Buffers | Enable intracellular staining. Fixation stabilizes cells; permeabilization allows antibodies to access intracellular targets. Protocols must be optimized for the target [85]. |
Experimental Workflow for Optimal Panel Design
The following diagram outlines the critical steps for designing and validating a flow cytometry panel, highlighting key decision points to ensure high data resolution.
Troubleshooting Guides & FAQs
Frequently Asked Questions
Q1: What is the single most critical factor for ensuring reproducible data in multi-center spectral flow cytometry?
A: The consistent generation and application of high-quality single-color reference controls across all sites. The spectral unmixing algorithm relies entirely on these controls to deconvolute the complex signal from your multi-color panel. If the reference controls are not a true reflection of the fluorescence in your full-stain sample, it will lead to unmixing errors, false positives, and irreproducible data between sites [48].
Q2: Our multi-center study shows high data variation for a specific marker. How can we troubleshoot this?
A: Follow this systematic approach:
- Verify Antibody Lots: Confirm all sites are using antibodies from the same clone and the same manufacturer lot, especially for tandem dyes which are prone to lot-to-lot variation [48].
- Check Staining Protocols: Ensure staining procedures, including incubation times, temperatures, and buffer formulations (particularly the use of fixatives), are identical. Even minor protocol deviations can alter fluorescence spectra [48].
- Review Gating Strategies: Inconsistent gating, such as including doublets or mixed cell populations with varying autofluorescence, can increase data variation. Standardize gating strategies across all sites [48].
Q3: Can we reuse a compensation matrix or reference library to save time?
A: Reusing a compensation matrix from a previous session is generally not recommended for conventional flow cytometry, as instrument sensitivity and fluorophore properties (especially tandem dyes) can change [44]. For spectral cytometry, you can create a reference library of single-color controls for reuse, but you must rigorously validate its stability over time. The general rule of thumb is to revalidate the library every month, but this should be empirically determined by your lab by monitoring for changes in the spectral overlay over time [48].
Q4: Should we use beads or cells for our single-color reference controls in spectral flow cytometry?
A: The golden rule is that the reference spectra must be a true reflection of the signature in your multi-color sample. While beads are convenient and provide a clean signal, the spectra of a fluorophore can differ when bound to a bead versus when it is bound to an antibody on a cell. It is best practice to optimize your single-color controls on cells. Record each control on both beads and cells and overlay the normalized spectra. If they differ, you must use cells for that specific fluorophore in your reference control [48].
Troubleshooting Common Problems
| Problem | Possible Cause | Solution |
|---|---|---|
| "Swooping" or non-round negative populations | Unmixing errors due to poor reference controls [48]. | Re-make single-color controls, ensuring they are bright and matched to your sample (see FAQ above). |
| High background or "ultra-negative" populations | Spectral spreading or autofluorescence not being properly accounted for [48]. | Ensure the autofluorescence of your positive and negative control populations is identical. For complex samples, consider extracting an autofluorescence signature. |
| Poor separation between positive and negative populations | The fluorophore's similarity index (SI) with another dye in the panel is too high [48]. | Re-design the panel, replacing one of the fluorophores with a dye that has a lower SI (<0.98 is recommended). |
| Unexpected positive signal in a single-color control | Contamination from another fluorophore or breakdown of a tandem dye [48]. | Always perform quality control on your controls. Do not use controls with multiple peaks; remake them with fresh reagents. |
Experimental Protocols & Standardization
Protocol 1: Generating Perfect Single-Color Reference Controls
This protocol is essential for accurate spectral unmixing and must be standardized across all trial sites [48].
Key Materials:
- Fresh or properly frozen cell samples of the relevant type (e.g., PBMCs)
- Titrated antibodies for each fluorophore in the panel
- Staining buffers (PBS, FBS, etc.)
- Viability dye (if used)
- Flow cytometry staining tubes
Methodology:
- Preparation: For each fluorophore in your panel, prepare one tube of cells.
- Staining: Stain each tube with a single, titrated antibody. Use the same antibody clone, fluorophore, and manufacturer lot as in the full-panel staining.
- Viability Stain Control (Special Case):
- Do not use stained dead cells as positive and unstained live cells as negative, as their autofluorescence differs.
- Instead, heat-kill a portion of your cells.
- Split the heat-killed cells into two aliquots.
- Stain one aliquot with the viability dye (positive control).
- Leave the second aliquot unstained (negative control with matched autofluorescence).
- Data Acquisition: Acquire data for each single-color control on your spectral cytometer. Adhere to the standardized instrument settings (laser power, gain) defined for the entire study.
- Gating for Clean Spectra: When analyzing the controls, gate tightly on the population of interest. Avoid doublets and use a narrow gate on the top half of the positive peak and the lower half of the negative peak to minimize variation in the median fluorescence intensity (MFI), resulting in a cleaner spectral signature [48].
Protocol 2: Panel Design and Validation for Multi-Center Studies
Objective: To design a spectral panel that minimizes complexity and ensures robust performance across multiple instruments and sites [23] [48].
Workflow: The following diagram outlines the critical steps for designing and validating a multi-center spectral flow cytometry panel.
Key Concepts:
- Similarity Index (SI): A measure of how similar the full emission spectra of two fluorophores are, on a scale from 0 (unique) to 1 (identical). Any two fluorophores with an SI of less than 0.98 can be spectrally unmixed and used together [48].
- Complexity Index: A measure of the overall similarity of all fluorophores in the panel. A well-designed 10-color panel should have a complexity index of 2-3, while a 40-color panel might be 40-50 [48].
Protocol 3: Standardized Instrument Setup and Quality Control
Objective: To minimize inter-instrument and inter-site variability through daily quality control and calibration.
Methodology:
- Daily QC: Each site must run the same quality control beads (e.g., CS&T beads, SpectroFlo QC beads) daily to monitor laser power, detector sensitivity, and fluidic stability.
- Standardized Settings: Create a standardized instrument setting template (laser powers, detector gains) for the study. These settings should be loaded and used by all sites for data acquisition.
- Cross-Validation: Periodically, all sites should acquire data from the same stabilized biological sample (e.g., frozen PBMCs stained with a core panel) to check for data concordance.
Data Presentation: Quantitative Specifications
Table 1: Key Quantitative Metrics for Spectral Panel Validation
| Metric | Target Value | Purpose & Rationale |
|---|---|---|
| Similarity Index (SI) | < 0.98 for any fluorophore pair [48] | Ensures the algorithm can distinguish between two fluorophores. A higher SI leads to unmixing errors. |
| Panel Complexity Index | ~2-3 for a 10-color panel; ~40-50 for a 40-color panel [48] | Measures the overall spectral complexity of the panel. Lower is better for cleaner unmixing. |
| Contrast Ratio (Accessibility) | At least 3:1 for graphical objects and UI components [87] | Critical for accessibility in data visualization and software interfaces, ensuring information is perceivable by all users. |
| Text Contrast Ratio (Accessibility) | At least 4.5:1 for small text; 3:1 for large text (18pt+ or 14pt+bold) [88] | Ensures text in presentations and publications is readable by individuals with low vision. |
The Scientist's Toolkit: Essential Research Reagents & Materials
Table 2: Key Reagent Solutions for Spectral Flow Cytometry
| Item | Function | Critical Specification |
|---|---|---|
| Titrated Antibodies | To specifically bind to and label cellular markers. | Use the same clone, fluorophore, and manufacturer lot across all sites to ensure identical spectral signatures [48]. |
| Viability Dye | To distinguish between live and dead cells during analysis. | Follow the specialized protocol for reference controls using heat-killed cells to match autofluorescence [48]. |
| UltraComp eBeads / Compensation Beads | To create consistent positive and negative signals for some fluorophore controls. | Use to create controls, but validate against cell-based controls. Do not mix beads and cells for the same control [44] [48]. |
| QC Beads (e.g., CS&T) | For daily instrument performance tracking and standardization. | The same beads and lot should be used by all sites to align instrument performance [44]. |
| Reference Library | A stored set of pre-recorded single-color control data for reuse. | Can save time but requires validation for stability over time (e.g., monthly). Never use a library built from poor controls [48]. |
Conclusion
Effectively managing spectral overlap is fundamental to unlocking the full potential of high-parameter flow cytometry. By adopting spectral technology with its full-spectrum unmixing, researchers can design more robust panels that provide superior resolution for complex cellular phenotypes. The implementation of strategic panel design, meticulous blocking protocols, and rigorous validation frameworks ensures the generation of high-quality, reproducible data. As the field advances, the integration of spectral flow cytometry into clinical trials and diagnostic workflows promises to accelerate biomarker discovery, enhance patient stratification, and refine therapeutic monitoring, solidifying its role as an indispensable tool in modern biomedical research and personalized medicine.
References
- 1. Spectral Overlap | Cytometry [https://cytometry.mlsascp.com/spectral-overlap.html]
- 2. Introduction to Spectral Overlap and Compensation in Flow ... [https://fluorofinder.com/newsletter-introduction-to-spectral-overlap-and-compensation-in-flow-cytometry/]
- 3. Spectral Spillover in Flow Cytometry [https://fluorofinder.com/spectral-spillover/]
- 4. An Introduction to Spectral Overlap and Compensation ... [https://bitesizebio.com/13696/introduction-to-spectral-overlap-and-compensation-flow-cytometry-protocol/]
- 5. How to Measure "Spillover Spread" [https://pubmed.ncbi.nlm.nih.gov/38526782/]
- 6. Flow Cytometry Troubleshooting Guide [https://www.novusbio.com/support/support-by-application/flow-cytometry/troubleshooting?srsltid=AfmBOoqFIz2pR9bO9xQaE0sZ3WE0I2kppCgZN9r556lUyF2McbrQ5eM3]
- 7. Flow Cytometry Troubleshooting Guide [https://www.cellsignal.com/learn-and-support/troubleshooting/flow-cytometry-troubleshooting-guide?srsltid=AfmBOopuitHj6yMcpzsLuNhagMhQbx1wBPJbdWUEW96kH1n39zQiLAae]
- 8. BD® Spectrum Viewer | Spectral Analyzer [https://www.bdbiosciences.com/en-us/resources/bd-spectrum-viewer]
- 9. Spectral Flow Cytometry Fundamentals [https://www.thermofisher.com/us/en/home/life-science/cell-analysis/flow-cytometry/flow-cytometry-learning-center/flow-cytometry-resource-library/flow-cytometry-methods/spectral-flow-cytometry-fundamentals.html]
- 10. Best Practices In Flow Cytometry Compensation Methodologies [https://expertcytometry.com/best-practices-in-flow-cytometry-compensation-methodologies/]
- 11. Identifying and fixing errors in flow data | Colibri Cytometry [https://www.colibri-cytometry.com/post/identifying-and-fixing-errors-in-flow-data]
- 12. Beyond the Limits: How Is Spectral Flow Cytometry ... [https://www.mdpi.com/2073-4409/14/13/997]
- 13. Flow Cytometry Troubleshooting | Tips & Tricks [https://www.stressmarq.com/support/technical-support/troubleshooting/flow-cytometry-troubleshooting/?srsltid=AfmBOooZOb0j0VPhvHidyqERIfaHRY_SCZFUGc4Fa_ZJUp-Z_qbEeuLW]
- 14. Troubleshooting Flow Cytometry [https://www.hycultbiotech.com/flow-cytometry/troubleshooting/]
- 15. Flow cytometry troubleshooting [https://www.abcam.com/en-us/technical-resources/applications/flow-cytometry/troubleshooting]
- 16. & Fixes [Complete List] Flow Cytometry Failures [https://www.linkedin.com/pulse/flow-cytometry-failures-fixes-complete-list-wildtypeone-vq2oe]
- 17. Beyond the Limits: How Is Spectral Flow Cytometry ... [https://pmc.ncbi.nlm.nih.gov/articles/PMC12248732/]
- 18. Flow Cytometry Troubleshooting Guide [https://www.novusbio.com/support/support-by-application/flow-cytometry/troubleshooting?srsltid=AfmBOoo5H6jv_vRcRcqaYqq3B0_Y7_fITlxeKgjFcSlqchx7rZ4mU9K5]
- 19. Panel Design [https://www.bdbiosciences.com/en-us/resources/panel-design]
- 20. Building Successful and Complex Panels in Flow Cytometry [https://www.technologynetworks.com/analysis/articles/building-successful-and-complex-panels-in-flow-cytometry-396730]
- 21. How to Fix Flow Cytometry Compensation Errors (and ... [https://voices.uchicago.edu/ucflow/2021/08/09/how-to-fix-compensation-errors-and-unmixing-errors-bad-data-part-4/]
- 22. Validated Flow Cytometry Services | Custom Panel Design [https://www.championsoncology.com/flow-cytometry-services]
- 23. Spectral Flow Cytometry: The Current State and Future of ... [https://pmc.ncbi.nlm.nih.gov/articles/PMC12193525/]
- 24. Spectral Flow Cytometry: The Current State and Future of ... [https://www.mdpi.com/1422-0067/26/12/5911]
- 25. Autofluorescence in Flow Cytometry [https://fluorofinder.com/autofluorescence-in-flow-cytometry/]
- 26. Optimization of the Blocking and Signal Preservation ... [https://pmc.ncbi.nlm.nih.gov/articles/PMC12462741/]
- 27. A Guide to Choosing Fluorescent Protein Combinations ... [https://pmc.ncbi.nlm.nih.gov/articles/PMC8008483/]
- 28. Spectral Flow Cytometry Panel Design [https://www.thermofisher.com/us/en/home/life-science/cell-analysis/flow-cytometry/flow-cytometry-learning-center/flow-cytometry-resource-library/flow-cytometry-methods/spectral-flow-cytometry-panel-design.html]
- 29. A simple versatile antibody-based barcoding method for ... [https://pmc.ncbi.nlm.nih.gov/articles/PMC4992625/]
- 30. How to Optimize Unmixing in Spectral Flow Cytometry [https://kcasbio.com/blogs/all-mixed-up-implementing-best-practices-for-unmixing-in-spectral-flow-cytometry/]
- 31. taking advantage of novel fluorescent proteins with Flow ... [https://www.sonybiotechnology.com/blog/spectral-flow-cytometry-allows-use-novel-fluorescent-proteins]
- 32. 5 Recipes for Flow Buffers - FluoroFinder Cytometry [https://fluorofinder.com/flow-cytometry-buffers/]
- 33. Tips & Tricks: Dealing with tandems [https://www.colibri-cytometry.com/post/tips-tricks-dealing-with-tandems]
- 34. blog providing technical tips & tricks Flow cytometry [https://www.colibri-cytometry.com/post/blocking-tandem-breakdown]
- 35. APC- Flow are degraded through... cytometry tandem dyes [https://pubmed.ncbi.nlm.nih.gov/19739089/]
- 36. Flow Cytometry Troubleshooting Guide [https://www.novusbio.com/support/support-by-application/flow-cytometry/troubleshooting?srsltid=AfmBOooVy-1W3E10P1ez7O886HlUtHLMTMx1PLcdlhLjtcPOlYKfNTMJ]
- 37. Blocking of FC-Receptor Binding [https://cyto.med.ucla.edu/lab-information/lab-protocols/blocking-of-fc-receptor-binding]
- 38. Flow Cytometry Troubleshooting Guide [https://www.cellsignal.com/learn-and-support/troubleshooting/flow-cytometry-troubleshooting-guide?srsltid=AfmBOoo-tLxjII8TnFmJ7eUcThmPGwosfSDTIxk-6WPlZmM1dcNY7-sG]
- 39. Flow Cytometry Protocol for Cell Surface Markers [https://www.rndsystems.com/resources/protocols/flow-cytometry-protocol-staining-membrane-associated-proteins-suspended-cells]
- 40. Flow Cytometry Troubleshooting Guide [https://fluorofinder.com/flow-cytometry-troubleshooting/]
- 41. ICCS Hybrid Meeting [https://www.cytometry.org/virtual/index.php?page=presentation&session_id=18&presentation_id=96]
- 42. Flow Cytometry Troubleshooting Guide [https://www.novusbio.com/support/support-by-application/flow-cytometry/troubleshooting?srsltid=AfmBOopOs9LUoGK9C8iLjLmKZjJI4_7KjRDN3gM8VvbVwfVUMjTGcHzm]
- 43. Designing a multicolour flow protocol | Abcam cytometry [https://www.abcam.com/en-us/technical-resources/guides/flow-cytometry-guide/designing-a-multicolor-protocol]
- 44. 5 Common Flow Cytometry Questions, Answered [https://expertcytometry.com/5-common-flow-cytometry-questions-answered/]
- 45. The Backbone Advantage: Smarter Flow Cytometry for ... [https://kcasbio.com/blogs/the-backbone-advantage-smarter-flow-cytometry-for-translational-and-clinical-research/]
- 46. Development of a customizable mouse backbone spectral ... [https://pmc.ncbi.nlm.nih.gov/articles/PMC11008467/]
- 47. Human Maxpar Direct Immune Profiling System [https://www.standardbio.com/area-of-interest/immune-profiling/maxpar-direct-immune-profiling-system]
- 48. Spectral Unmixing in Flow Cytometry: 7 Top Tips for Success [https://bitesizebio.com/70438/spectral-unmixing-in-flow-cytometry/]
- 49. Tips & Tricks: Optimizing Unmixing [https://www.colibri-cytometry.com/post/tips-and-tricks-optimizing-unmixing]
- 50. Validation of High-sensitivity Flow Cytometry for Reliable ... [https://pmc.ncbi.nlm.nih.gov/articles/PMC10345173/]
- 51. Flow Cytometry Troubleshooting Guide [https://www.cellsignal.com/learn-and-support/troubleshooting/flow-cytometry-troubleshooting-guide?srsltid=AfmBOor7l35ti-vcdr_DcapGm8vSEO4Zwj6ZDNX0p-1wS4WPo5Itipc7]
- 52. Design and validation of novel flow cytometry panels to ... [https://www.frontiersin.org/journals/immunology/articles/10.3389/fimmu.2024.1432816/full]
- 53. Principles of Advanced Flow Cytometry: A Practical Guide [https://pmc.ncbi.nlm.nih.gov/articles/PMC10802916/]
- 54. Compensation in Spectral | Proteintech Group Flow Cytometry [https://www.ptglab.com/news/blog/spectral-compensation-in-flow-cytometry/]
- 55. Panel Spectral and Sample Preparation Flow Cytometry Controls [https://www.thermofisher.com/ru/ru/home/life-science/cell-analysis/flow-cytometry/flow-cytometry-learning-center/flow-cytometry-resource-library/flow-cytometry-methods/spectral-flow-cytometry-panel-controls-sample-preparation.html]
- 56. Flow Cytometry Troubleshooting Guide [https://www.cellsignal.com/learn-and-support/troubleshooting/flow-cytometry-troubleshooting-guide?srsltid=AfmBOoqZzcSiJQqbpR_J7N9DSJgTLPz_JiOmgn3kfWVAp_0hLR2kiEj_]
- 57. What causes non-specific antibody binding and how can it ... [https://www.cytometry.org/web/q_view.php?id=153&filter=Analysis%20Techniques]
- 58. Artifacts and non-specific staining in flow cytometry, Part I [https://sanguinebio.com/pbmc-basics/artifacts-and-non-specific-staining-in-flow-cytometry-part-i/?srsltid=AfmBOor7TlTq4cJuTjIFKjV_LJf0kMzNz-U3q-BBkLBqoLXVtKirh3qg]
- 59. Staining Cell Surface Targets for Flow Cytometry [https://www.thermofisher.com/us/en/home/references/protocols/cell-and-tissue-analysis/protocols/staining-cell-surface-targets-flow-cytometry.html]
- 60. 7 Tips for Optimizing Your Flow Cytometry Experiments [https://www.bdbiosciences.com/en-us/learn/science-thought-leadership/blogs/optimizing-tips-flow-cytometry-experiments]
- 61. Flow Cytometry Protocol | Abcam [https://www.abcam.com/en-us/technical-resources/protocols/flow-cytometry-for-intracellular-and-extracellular-targets]
- 62. Flow Cytometry Troubleshooting Guide [https://www.cellsignal.com/learn-and-support/troubleshooting/flow-cytometry-troubleshooting-guide?srsltid=AfmBOooSW32mSthFPLg_6xbnXHLlbVWEsVCyTwai6DvlVULQkdykPazG]
- 63. Guide to Fixation and Permeabilization [https://fluorofinder.com/guide-to-fixation-and-permeabilization/]
- 64. Effect of handling and fixation processes on fluorescence ... [https://opg.optica.org/abstract.cfm?uri=ao-39-34-6312]
- 65. Effect of handling and fixation processes on fluorescence ... [https://pubmed.ncbi.nlm.nih.gov/18354640/]
- 66. Spectral Flow Cytometry Panel Controls and Sample ... [https://www.thermofisher.com/us/en/home/life-science/cell-analysis/flow-cytometry/flow-cytometry-learning-center/flow-cytometry-resource-library/flow-cytometry-methods/spectral-flow-cytometry-panel-controls-sample-preparation.html]
- 67. Compensation in Flow Cytometry [https://fluorofinder.com/compensation-flow-cytometry/]
- 68. Best practices for the development and fit-for-purpose ... [https://aapsopen.springeropen.com/articles/10.1186/s41120-021-00050-1]
- 69. A call to adopt a “fit for purpose” approach to antibody ... [https://pmc.ncbi.nlm.nih.gov/articles/PMC6879911/]
- 70. Flow cytometry assay modifications: Recommendations for method validation based on CLSI H62 guidelines - PubMed [https://pubmed.ncbi.nlm.nih.gov/39165120/]
- 71. H62 | Validation of Assays Performed by Flow Cytometry [https://clsi.org/standards/products/hematology/documents/h62/]
- 72. A practitioner's view of spectral flow cytometry - PMC [https://pmc.ncbi.nlm.nih.gov/articles/PMC10991079/]
- 73. Validating Assays in Flow Cytometry [https://www.bdbiosciences.com/en-us/learn/science-thought-leadership/events/validating-assays-in-flow-cytometry]
- 74. Flow Cytometry Troubleshooting Guide [https://www.cellsignal.com/learn-and-support/troubleshooting/flow-cytometry-troubleshooting-guide?srsltid=AfmBOoo4_OUuogmGnIh8G_gZoGfH-IWV-yyC2BdNPMqhD4_7SbfEdRVk]
- 75. Flow Cytometry Troubleshooting Guide [https://www.sigmaaldrich.com/US/en/technical-documents/technical-article/protein-biology/flow-cytometry/flow-cytometry-troubleshooting-guide?srsltid=AfmBOoojcyf_Nv0eQ2s-VShVNBRcoiwm2DSeTGrmgI4NPlnBb-54QW-i]
- 76. Technical Aspects of Flow Cytometry-based Measurable ... [https://pmc.ncbi.nlm.nih.gov/articles/PMC8701786/]
- 77. Technical issues: flow cytometry and rare event analysis [https://pubmed.ncbi.nlm.nih.gov/23590661/]
- 78. Immune Monitoring - The EBMT/EHA CAR-T Cell Handbook [https://www.ncbi.nlm.nih.gov/books/NBK584155/]
- 79. Flow Cytometry Troubleshooting Guide [https://www.sigmaaldrich.com/US/en/technical-documents/technical-article/protein-biology/flow-cytometry/flow-cytometry-troubleshooting-guide?srsltid=AfmBOoqWR2OGTEwzeW4FDhSlBCJQGEXR2aRShPnj0637JsFRSwLhWJbW]
- 80. ICCS Quality & Standards Committee Modules [https://www.cytometry.org/web/quality.php]
- 81. CAR T Cell Characterization With Flow Cytometry [https://www.thermofisher.com/us/en/home/life-science/cell-analysis/flow-cytometry/research-areas-methods-flow-cytometry/immuno-oncology-research-using-flow-cytometry/car-t-cell-characterization-flow-cytometry.html]
- 82. 5 Reasons to Try Spectral for Both Low and High Parameter Flow ... [https://www.thermofisher.com/blog/life-in-the-lab/5-reasons-to-try-spectral-for-both-low-and-high-parameter-flow-cytometry/]
- 83. Spectral vs. Conventional Flow Cytometry: Key Differences [https://kcasbio.com/blogs/unveiling-the-future-of-flow-cytometry-conventional-vs-spectral-flow/]
- 84. Flow vs. spectral vs. mass cytometry: What's the difference? [https://www.teiko.bio/article/flow-vs-spectral-vs-mass-cytometry-whats-the-difference]
- 85. Flow Cytometry Troubleshooting Guide [https://www.novusbio.com/support/support-by-application/flow-cytometry/troubleshooting?srsltid=AfmBOoqYKzkNh4StOrkXW4rMz4iGGOr5gCA2iEkkTS6bQVYWsCX0PVzw]
- 86. Troubleshooting Flow Cytometry Issues [https://www.bosterbio.com/protocol-and-troubleshooting/flow-cytometry-troubleshooting?srsltid=AfmBOorBbjJwqSVZP8DK_EVYCUH5BiXiYuQYjrHZ8kXANgL_tNU-RKCt]
- 87. Understanding Success Criterion 1.4.11: Non-text Contrast [https://www.w3.org/WAI/WCAG22/Understanding/non-text-contrast.html]
- 88. Understanding WCAG 2 Contrast and Color Requirements [https://webaim.org/articles/contrast/]