Molecular Vibrations and Rotations in Infrared Spectroscopy: Principles, Applications, and Clinical Innovations
This article provides a comprehensive examination of molecular vibrations and rotations as the fundamental principles underlying infrared spectroscopy.
Molecular Vibrations and Rotations in Infrared Spectroscopy: Principles, Applications, and Clinical Innovations
Abstract
This article provides a comprehensive examination of molecular vibrations and rotations as the fundamental principles underlying infrared spectroscopy. Tailored for researchers, scientists, and drug development professionals, it bridges theoretical foundations with cutting-edge applications across biomedical and pharmaceutical domains. The content systematically explores core vibrational theory and selection rules, details advanced methodological implementations including FT-IR and ATR techniques, offers practical troubleshooting and optimization strategies for complex samples, and presents rigorous validation through comparative analysis with mass spectrometry and other techniques. By synthesizing current research trends, technological advancements, and real-world case studies, this resource serves as both an educational foundation and practical guide for implementing infrared spectroscopy in research and development workflows.
The Fundamental Principles of Molecular Vibrations and Rotations in Infrared Spectroscopy
Infrared (IR) spectroscopy represents a cornerstone analytical technique in modern chemical research, providing unparalleled insights into molecular structure through the measurement of infrared radiation's interaction with matter [1]. This technique exploits the fundamental principle that molecules absorb specific frequencies of infrared light that correspond directly to the vibrational energies of their chemical bonds [1] [2]. The resulting infrared spectrum serves as a unique molecular fingerprint, plotting absorbance against frequency or wavenumber, typically expressed in reciprocal centimeters (cm⁻¹) [1] [3]. For researchers in drug development and related fields, IR spectroscopy offers a powerful tool for identifying functional groups, characterizing new materials, verifying known and unknown samples, and monitoring reaction progress [1] [4].
The theoretical foundation of infrared spectroscopy rests on the quantum mechanical understanding that molecular vibrations are quantized [1] [2]. When infrared radiation interacts with a molecule, the absorbed energy promotes vibrational transitions from ground states to excited states, but only if specific selection criteria are met. The primary requirement for IR activity is that the vibration must produce a change in the molecular dipole moment [1] [5]. This dipole moment change creates an oscillating electric field that can interact with the electric field component of the infrared radiation, leading to absorption [2]. Molecules without a dipole moment change during vibration, such as homonuclear diatomic molecules like N₂ or O₂, are IR inactive and do not produce absorption spectra [5].
The infrared region of the electromagnetic spectrum is conventionally divided into three main areas: the near-IR (14,000–4,000 cm⁻¹), mid-IR (4,000–400 cm⁻¹), and far-IR (400–10 cm⁻¹) [1]. The mid-IR region is particularly valuable for analytical chemistry as it contains the fundamental vibrational transitions associated with most chemical functional groups [1] [5]. The energy of IR radiation is sufficient to excite molecular vibrations and rotations but is weaker than visible and ultraviolet radiation, making it non-destructive and ideal for studying a wide range of molecular species [2].
Fundamental Theory of Molecular Vibrations
The Harmonic Oscillator Model
The initial theoretical approach to understanding molecular vibrations employs the harmonic oscillator model, which approximates chemical bonds as simple springs obeying Hooke's law [2]. In this classical mechanical treatment, the vibrational frequency (ν) of a diatomic molecule can be described by the equation:
[ \nu = \frac{1}{2\pi}\sqrt{\frac{k}{\mu}} ]
where k represents the force constant of the bond (related to bond strength), and μ is the reduced mass of the two atoms [5]. This relationship reveals two fundamental principles: stronger bonds (higher k) result in higher vibrational frequencies, and bonds between lighter atoms (lower μ) vibrate at higher frequencies [6] [5]. For example, a C-H bond vibrates at approximately 3000 cm⁻¹, while a C-D bond (with deuterium having approximately double the mass of hydrogen) vibrates at around 2100 cm⁻¹, despite having the same force constant [5].
In the quantum mechanical harmonic oscillator model, vibrational energy is quantized according to the equation:
[ E_v = h\nu\left(v + \frac{1}{2}\right) ]
where v is the vibrational quantum number (v = 0, 1, 2, ...), h is Planck's constant, and ν is the vibrational frequency [1]. The selection rule for the harmonic oscillator dictates that only transitions with Δv = ±1 are allowed, meaning vibrational transitions typically occur from the ground state (v = 0) to the first excited state (v = 1) [1]. While the harmonic oscillator model provides a useful starting point, real molecules deviate from perfect harmonic behavior, necessitating a more sophisticated approach to accurately interpret experimental spectra.
Anharmonicity and Mode-Coupling
Real molecules exhibit anharmonicity, meaning that the potential energy curve is not perfectly parabolic like a harmonic oscillator, but rather flattens out as the bond approaches dissociation [7]. This anharmonicity leads to deviations from the ideal harmonic behavior, including overtones (Δv = ±2, ±3, ...) and combination bands that result from the simultaneous excitation of multiple vibrational modes [7]. Additionally, mode-coupling occurs when different vibrational modes interact with each other, leading to complex resonance phenomena such as Fermi resonances, where a fundamental vibration interacts with an overtone or combination band of similar energy [7].
These anharmonic effects present both challenges and opportunities for researchers. While they complicate spectral interpretation beyond the simple harmonic model, they also provide more detailed information about molecular structure and potential energy surfaces [7]. Modern theoretical approaches, including variational treatments and vibrational configuration interaction (VCI) methods, explicitly account for anharmonicity and mode-coupling, enabling more accurate prediction and interpretation of experimental IR spectra [7] [8].
Normal Modes of Vibration
For polyatomic molecules containing N atoms, the vibrational complexity increases significantly. Such molecules possess 3N - 6 vibrational degrees of freedom for nonlinear molecules, or 3N - 5 for linear molecules [1] [9] [6]. These fundamental vibrations are known as normal modes—collective, coordinated motions of atoms in which all atoms move in phase with the same frequency [9] [6]. Each normal mode represents an independent vibration that does not couple with other modes under the harmonic approximation [9].
The concept of normal modes allows researchers to decompose complex molecular vibrations into simpler, fundamental components. For example, a simple triatomic nonlinear molecule like water (H₂O) has 3 normal modes (3×3 - 6 = 3): symmetric stretch, asymmetric stretch, and bending (scissoring) [6]. In contrast, linear carbon dioxide (CO₂) has 4 normal modes (3×3 - 5 = 4): symmetric stretch, asymmetric stretch, and two bending modes (in-plane and out-of-plane) [1] [6]. The symmetric stretch of CO₂ is IR inactive due to no net change in dipole moment, demonstrating how molecular symmetry affects spectroscopic observation [6] [5].
Table 1: Number of Vibrational Normal Modes for Different Molecular Structures
| Molecular Structure | Number of Atoms | Formula | Number of Normal Modes |
|---|---|---|---|
| Diatomic | 2 | 3(2)-5 = 1 | 1 |
| Linear (e.g., CO₂) | 3 | 3(3)-5 = 4 | 4 |
| Nonlinear (e.g., H₂O) | 3 | 3(3)-6 = 3 | 3 |
| Benzene (C₆H₆) | 12 | 3(12)-6 = 30 | 30 |
Types of Molecular Vibrations
Stretching Vibrations
Stretching vibrations involve rhythmic changes in the interatomic distance between two bonded atoms along the bond axis [3]. These vibrations are characterized by the periodic elongation and contraction of chemical bonds while maintaining the bond direction. Stretching vibrations typically require more energy and therefore appear at higher frequencies in the IR spectrum compared to bending vibrations [5]. There are two primary types of stretching vibrations:
Symmetric stretching: All bonded atoms move in phase, with bonds lengthening and shortening simultaneously while maintaining molecular symmetry [6]. In carbon dioxide, for example, the symmetric stretch involves both oxygen atoms moving away from and toward the central carbon atom in unison [6].
Asymmetric stretching: Atoms move out of phase, with some bonds lengthening while others shorten [6]. In CO₂, the asymmetric stretch involves one oxygen moving toward the carbon while the other moves away, breaking the molecular symmetry during the vibration [6].
The exact frequency of a stretching vibration depends on the bond strength and the masses of the atoms involved. Triple bonds typically vibrate at higher frequencies than double bonds, which in turn vibrate higher than single bonds [5]. For instance, a C≡C triple bond stretches around 2150 cm⁻¹, C=C double bond around 1650 cm⁻¹, and C-C single bond around 1000-1200 cm⁻¹ [5].
Bending Vibrations
Bending vibrations involve changes in bond angles without altering bond lengths, often described as deformation vibrations [3]. These motions require less energy than stretching vibrations and consequently appear at lower frequencies in the IR spectrum [5]. Bending vibrations can be further categorized into several specific types:
Scissoring: Two atoms move toward and away from each other with a changing bond angle, much like the opening and closing of scissors [1] [6]. In water molecules, the H-O-H bond angle periodically decreases and increases during the scissoring vibration [6].
Rocking: The movement of atoms in the same direction, causing the functional group to rock back and forth [1].
Wagging: Two atoms move together up and down, out of the molecular plane [1]. This is analogous to the wagging motion of a dog's tail [6].
Twisting: One atom moves up while another moves down in opposite directions, creating a twisting motion around a bond [1].
For complex molecules, bending vibrations can involve the motion of multiple atoms and provide crucial information about molecular geometry and substituent effects. The fingerprint region of the IR spectrum (1500-400 cm⁻¹) is particularly rich in bending vibrations and serves as a unique identifier for molecular compounds [5].
Rotational Transitions
While pure rotational transitions occur in the far-IR and microwave regions of the spectrum, rotational-vibrational transitions significantly influence the appearance of IR spectra in the mid-IR region [1] [2]. When molecules vibrate, they can simultaneously undergo rotational transitions, leading to the characteristic band structure observed in high-resolution IR spectra [2].
For diatomic and linear polyatomic molecules, rotational-vibrational transitions create a series of closely spaced lines known as the P-branch (ΔJ = -1), Q-branch (ΔJ = 0, when allowed), and R-branch (ΔJ = +1), where J represents the rotational quantum number [10] [8]. The specific pattern and spacing of these rotational lines provide information about molecular geometry, bond lengths, and rotational constants [8].
The energy required for pure rotational transitions is significantly less than that needed for vibrational transitions, which is why they appear in the far-IR and microwave regions [1]. However, the coupling between rotational and vibrational motions is a critical consideration for high-resolution spectroscopic studies, particularly in gas-phase analysis [10] [8].
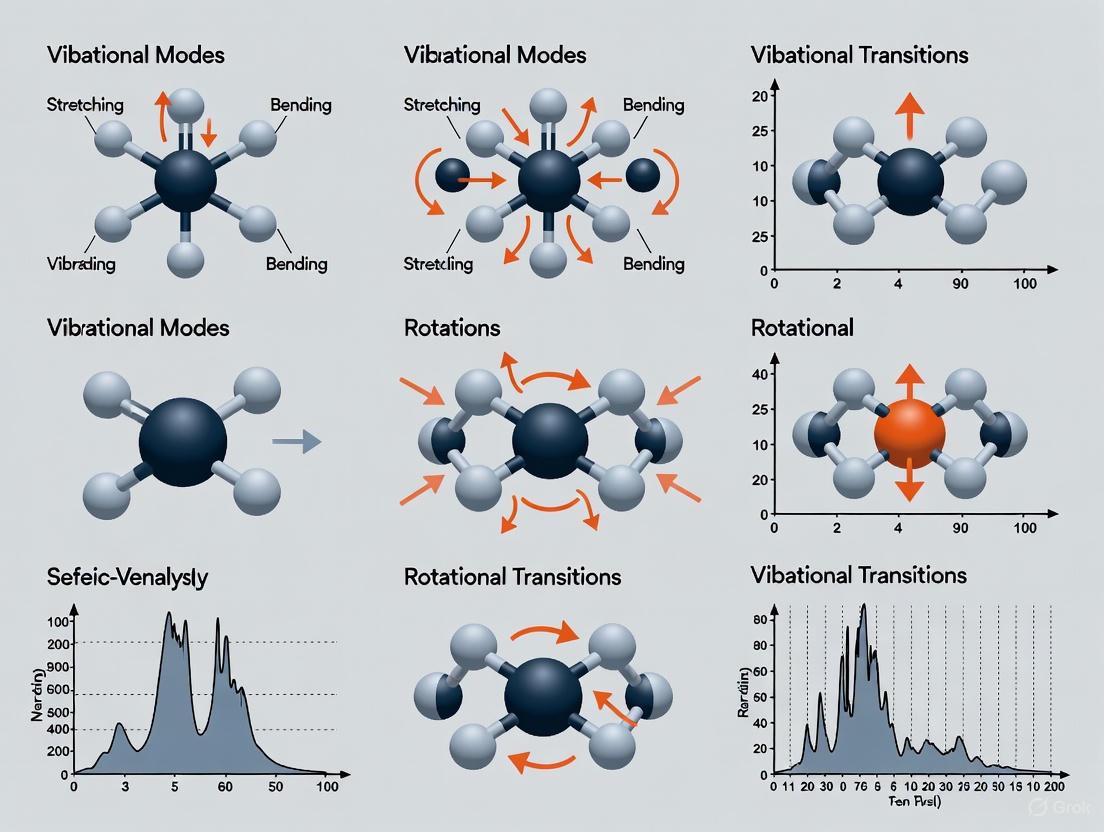
Diagram 1: Molecular vibration types and their relationships with energy requirements and spectral regions.
Experimental Methodologies in IR Spectroscopy
Fourier Transform Infrared (FTIR) Spectroscopy
Fourier Transform Infrared (FTIR) spectrometry represents the modern standard for high-resolution infrared spectroscopy across research and industrial applications [1] [4]. Unlike dispersive instruments that measure one wavelength at a time, FTIR spectrometers employ an interferometer to simultaneously collect spectral data across the entire IR range, then use Fourier transformation to convert the interferogram into a conventional spectrum [4]. This multiplex advantage (Fellgett's advantage) provides significantly higher signal-to-noise ratios and faster acquisition times compared to dispersive instruments [3] [4].
A typical FTIR instrument consists of several key components: an IR light source (typically a Globar silicon carbide or Nernst glower), an interferometer with moving and stationary mirrors, a sample compartment, a detector (such as mercury cadmium telluride (MCT) or deuterated triglycine sulfate (DTGS)), and a computer for Fourier transformation and data processing [3] [8]. The core of the system is the Michelson interferometer, where infrared radiation is split into two paths, reflected back, and recombined to create an interference pattern that encodes spectral information [4].
The experimental protocol for FTIR analysis involves several critical steps: (1) collecting a background spectrum without the sample to characterize instrument and environmental contributions; (2) introducing the sample into the IR beam path; (3) recording the interferogram with the sample present; (4) Fourier transformation of both sample and background interferograms; and (5) ratioing the sample spectrum against the background to obtain the final transmittance or absorbance spectrum [8]. Modern FTIR instruments can achieve resolutions up to 0.0021 cm⁻¹, enabling the detection of fine rotational-vibrational structure in gas-phase samples [8].
Sample Preparation Techniques
Proper sample preparation is crucial for obtaining high-quality IR spectra, with specific methodologies tailored to different sample states:
Gaseous samples: Require specialized cells with long path lengths (typically 10 cm to multiple meters) to compensate for low molecular density [1]. Multi-pass cells with mirrored interiors can effectively achieve path lengths up to hundreds of meters through multiple reflections, essential for detecting trace gases or weak absorbers [8]. Gas pressure must be carefully controlled to balance signal intensity and resolution, as pressure broadening can obscure fine spectral features [8].
Liquid samples: Can be analyzed as neat liquids between IR-transparent windows (such as NaCl or KBr) with precisely controlled path lengths (typically 0.015-1 mm), or as solutions in appropriate solvents [1]. Careful solvent selection is critical, as solvents like CCl₄ and CS₂ have relatively few IR absorptions and are preferred for solution spectroscopy [1]. The Attenuated Total Reflectance (ATR) technique has revolutionized liquid analysis by allowing direct measurement without complex cell assemblies [3].
Solid samples: Can be prepared using several methods, including KBr pellets (where 1-2 mg sample is mixed with 100-200 mg dried KBr and pressed under high pressure), mulls (mineral oil suspensions), or deposition on appropriate substrates [1]. ATR-FTIR has become particularly valuable for solid samples, enabling analysis with minimal preparation by pressing the sample against a high-refractive-index crystal (such as diamond, ZnSe, or Ge) and measuring the attenuated reflected beam [3].
Table 2: Common IR Transparent Materials and Their Properties
| Material | Transparency Range (cm⁻¹) | Advantages | Limitations |
|---|---|---|---|
| Sodium Chloride (NaCl) | 5000–650 | Wide range, inexpensive | Soluble in water, attacked by alcohols and amines |
| Calcium Fluoride (CaF₂) | 4200–1300 | Insoluble in water, durable | Limited spectral range, relatively expensive |
| Silver Chloride (AgCl) | 5000–500 | Wide range, malleable | Darkens with exposure to light, attacked by amines |
| Potassium Bromide (KBr) | 5000–400 | Wide range, pellet preparation | Hygroscopic, requires careful drying |
| Diamond (ATR) | 4000–400 | Extremely durable, chemical inert | Highest cost, limited penetration depth |
Advanced IR Techniques
Several specialized IR techniques have been developed to address specific analytical challenges:
Attenuated Total Reflectance (ATR): Allows direct analysis of solids, pastes, and viscous liquids without extensive sample preparation [3]. This technique exploits the phenomenon of total internal reflection, where an IR beam reflects inside a high-refractive-index crystal, generating an evanescent wave that penetrates a short distance (typically 0.5-5 μm) into the sample in contact with the crystal [3]. ATR has become particularly valuable for analyzing biological samples, polymers, and materials that are difficult to prepare by traditional methods.
Matrix Isolation IR Spectroscopy: Involves trapping molecules in an inert gas matrix (such as argon or neon) at cryogenic temperatures (typically 10-20 K) [7]. This technique effectively isolates individual molecules, eliminating intermolecular interactions and reducing rotational broadening, resulting in exceptionally sharp spectral features ideal for studying reactive intermediates, conformational isomers, and weak vibrational transitions [7]. Matrix isolation was crucial for unraveling complex spectral features in methanol and other organic molecules with significant anharmonicity [7].
Two-Dimensional IR (2D-IR) Spectroscopy: An advanced nonlinear technique analogous to 2D-NMR that correlates vibrational modes and reveals couplings and energy transfer pathways between vibrations [1]. By using ultrafast IR pulses, 2D-IR can probe molecular dynamics on picosecond to nanosecond timescales, making it valuable for studying protein folding, hydrogen bonding dynamics, and chemical kinetics [1].
Diagram 2: FTIR instrument workflow showing the pathway from source to spectrum.
Spectral Interpretation and Data Analysis
Characteristic Functional Group Frequencies
The interpretation of IR spectra relies heavily on recognizing characteristic absorption patterns associated with specific functional groups. These group frequencies arise because particular bond types vibrate within relatively consistent wavenumber ranges, largely independent of the rest of the molecule [5]. The mid-IR region (4000-400 cm⁻¹) contains most of these diagnostically useful absorptions, which can be broadly divided into the functional group region (4000-1500 cm⁻¹) and the fingerprint region (1500-400 cm⁻¹) [5].
The functional group region contains stretching vibrations of common heteroatomic bonds, which typically yield sharper, more easily identifiable peaks [5]. Key functional group absorptions include:
O-H stretching: Appears as a broad, intense band in the 3200-3600 cm⁻¹ range due to hydrogen bonding [5]. Free O-H groups (in dilute solutions) produce sharper bands at higher frequencies (3600-3650 cm⁻¹), while hydrogen-bonded O-H groups show broader bands shifted to lower frequencies [5].
N-H stretching: Primary amines exhibit two medium-strength bands at 3300-3500 cm⁻¹, while secondary amines show a single band in the same region [5]. The N-H stretching bands are generally sharper than O-H bands and lack the pronounced broadening associated with hydrogen bonding.
C-H stretching: Alkyl C-H stretches appear between 2850-3000 cm⁻¹, with symmetric stretches at lower frequencies and asymmetric stretches at higher frequencies [5]. Aromatic and vinylic C-H stretches typically occur above 3000 cm⁻¹, providing useful information about hybridization and substitution patterns.
Carbonyl (C=O) stretching: One of the most diagnostically useful absorptions, appearing as a strong, sharp band between 1650-1800 cm⁻¹ [5]. The exact position provides information about the carbonyl environment: acid chlorides (1800 cm⁻¹), esters (1735 cm⁻¹), aldehydes (1725 cm⁻¹), ketones (1715 cm⁻¹), carboxylic acids (1710 cm⁻¹), and amides (1680 cm⁻¹) [5].
The fingerprint region (1500-400 cm⁻¹) contains a complex pattern of bending vibrations, skeletal vibrations, and single-bond stretches that collectively provide a unique identifier for specific compounds [5]. While more challenging to interpret systematically, this region is invaluable for compound identification and verification through spectral matching with reference databases [5].
Table 3: Characteristic IR Absorption Frequencies of Common Functional Groups
| Functional Group | Vibration Type | Frequency Range (cm⁻¹) | Intensity & Notes |
|---|---|---|---|
| O-H (alcohol) | Stretching | 3200-3600 | Broad, strong (H-bonded) |
| O-H (carboxylic acid) | Stretching | 2500-3300 | Very broad, medium |
| N-H (amine) | Stretching | 3300-3500 | Medium, sharp (doublet for 1°) |
| C-H (alkane) | Stretching | 2850-3000 | Medium to strong |
| C-H (alkene) | Stretching | 3010-3100 | Medium |
| C≡N (nitrile) | Stretching | 2200-2260 | Medium, sharp |
| C=O (ketone) | Stretching | 1705-1725 | Very strong |
| C=O (aldehyde) | Stretching | 1720-1740 | Very strong |
| C=O (ester) | Stretching | 1735-1750 | Very strong |
| C=C (alkene) | Stretching | 1620-1680 | Variable |
| C-O (alcohol) | Stretching | 1050-1200 | Strong |
| C-Cl | Stretching | 600-800 | Strong |
Spectral Pre-processing and Data Analysis
Modern IR spectroscopy increasingly relies on sophisticated data processing techniques to extract meaningful information from complex spectra, particularly for biological samples and complex mixtures [4]. Spectral pre-processing aims to remove instrumental artifacts and enhance chemically relevant information before interpretation or modeling [4]. Common pre-processing steps include:
Exclusion/cleaning: Identification and removal of spectral outliers caused by instrumental errors, environmental factors, or sample inconsistencies [4]. Methods based on signal-to-noise ratio (SNR) thresholds or principal component analysis (PCA) are commonly employed to detect anomalous spectra [4].
Filtering: Application of digital filters to reduce noise and enhance spectral features [4]. The Savitzky-Golay filter is particularly widely used as it simultaneously performs smoothing and derivative calculation while preserving peak shape and height [4]. Other filtering approaches include mean/median filtering and Fourier self-deconvolution (FSD) for resolving overlapping bands [4].
Baseline correction: Removal of slow, nonlinear background shifts caused by light scattering, particle size effects, or instrumental drift [4]. Techniques include polynomial fitting, asymmetric least squares, and rolling-ball algorithms [4].
Normalization: Scaling spectra to compensate for concentration variations or path length differences [4]. Common approaches include vector normalization, area normalization, and peak height normalization to an internal standard [4].
For complex analytical problems, multivariate statistical methods and machine learning approaches are increasingly employed. Principal Component Analysis (PCA) reduces spectral dimensionality while preserving variance, facilitating pattern recognition and outlier detection [4]. Partial Least Squares (PLS) regression correlates spectral features with reference values for quantitative analysis, while advanced deep learning approaches including convolutional neural networks (CNNs) and autoencoders can model complex nonlinear relationships in spectral data [4].
Research Applications and Case Studies
Pharmaceutical and Biomedical Applications
IR spectroscopy has become an indispensable tool in pharmaceutical research and drug development, with applications spanning from compound identification to quality control and metabolic studies [3]. The technique's fingerprinting capability enables rapid identification of active pharmaceutical ingredients (APIs), excipients, and their polymorphic forms, which is crucial for ensuring product efficacy and consistency [3]. In biomedical research, IR spectroscopy has demonstrated remarkable potential for disease diagnosis, particularly through the analysis of biofluids and tissues [4].
The application of IR spectroscopy to cancer diagnosis represents a particularly promising frontier. Research has shown that IR spectral fingerprints of serum samples can distinguish between healthy individuals and cancer patients with high accuracy [4]. These approaches capitalize on the fact that malignant transformations induce subtle but detectable changes in the biochemical composition of biofluids and tissues, which are reflected in their IR spectra [4]. The combination of IR spectroscopy with advanced machine learning algorithms has enabled the development of diagnostic models for various cancers, including breast, prostate, and colorectal cancers [4].
Another significant application involves antimicrobial susceptibility testing, where IR spectroscopy coupled with machine learning can potentially reduce the time required for determining appropriate antibiotic treatments [1]. By analyzing the spectral changes in bacteria exposed to antimicrobial agents, researchers can distinguish between susceptible and resistant strains, addressing the critical need for rapid diagnostics in clinical microbiology [1].
Environmental and Industrial Monitoring
Infrared spectroscopy plays a vital role in environmental monitoring and industrial process control, particularly through the development of specialized gas analyzers [1]. These instruments exploit the characteristic rotational-vibrational spectra of gas molecules to detect and quantify specific compounds in complex mixtures [1]. Notable applications include:
Greenhouse gas monitoring: Long-term unattended measurement of CO₂ concentrations in greenhouses and growth chambers using infrared gas analyzers [1]. High-resolution FTIR systems can simultaneously monitor multiple greenhouse gases (CO₂, CH₄, N₂O) in atmospheric samples, providing valuable data for climate research [1].
Gas leak detection: Specialized IR-based devices such as the DP-IR and EyeCGAs detect hydrocarbon gas leaks in natural gas transportation and crude oil facilities [1]. These systems typically monitor characteristic C-H stretching vibrations around 2900-3000 cm⁻¹ to identify methane and other hydrocarbon leaks [1].
Plastic recycling: IR spectroscopy provides a convenient stand-off method to sort household waste plastics by polymer type (PET, HDPE, etc.) [1]. Rapid identification enables automated sorting systems that significantly improve recycling efficiency and purity [1].
Catalysis research: In situ IR spectroscopy monitors reaction progress and detects intermediates in catalytic processes, providing insights into reaction mechanisms [1]. Specialized reactor cells allow researchers to collect time-resolved spectra under realistic temperature and pressure conditions, facilitating catalyst development and optimization [1].
Advanced Research Case Studies
Recent research demonstrates the expanding capabilities of IR spectroscopy for addressing complex chemical problems:
Methanol spectroscopy: A comprehensive 2024 study combined matrix-isolation IR spectroscopy with anharmonic computational methods to unravel the complex vibrational spectrum of methanol, a molecule that has challenged spectroscopists for nearly a century [7]. By isolating single methanol molecules in solid argon and neon matrices at cryogenic temperatures, researchers obtained exceptionally sharp spectra free from intermolecular interactions [7]. Coupled with vibrational configuration interaction (VCI) calculations that explicitly account for anharmonicity and mode-coupling, this approach enabled unambiguous assignment of all fundamentals and resonances in methanol's mid-IR spectrum [7]. The study particularly highlighted how strategic deuteration (replacing H with D) lifts resonances and aids in band assignment, while also revealing the limitations of conventional vibrational notations for describing complex anharmonic systems [7].
Silane bending dyad analysis: A 2025 investigation provided a complete quantitative analysis of the bending region (830-1150 cm⁻¹) in silane (SiH₄), a molecule important for semiconductor manufacturing and astrophysical studies [8]. Using high-resolution FTIR spectroscopy with a resolution of 0.0021 cm⁻¹, researchers recorded the complex rotational-vibrational structure of the interacting ν₂/ν₄ bending dyad [8]. By applying advanced theoretical models based on tensorial formalism and effective Hamiltonian approaches, they achieved precise modeling of both line positions and absolute intensities, creating a reliable database (SiCaSDa) for future applications in silicon isotopic separation and astronomical detection [8].
Acetylene isotopologues: High-resolution studies of partially deuterated acetylene isotopologues (H¹²C¹³CD and H¹³C¹²CD) have provided fundamental insights into anharmonic force fields by analyzing bending states up to v₄ + v₅ = 2 [10]. These asymmetric isotopologues are particularly valuable because they lack the anharmonic perturbations that complicate the spectra of symmetric acetylene molecules, enabling determination of unperturbed spectroscopic parameters [10]. Such studies provide benchmark data for testing theoretical models and understanding isotopic effects on molecular vibrations [10].
The Scientist's Toolkit: Essential Research Reagents and Materials
Table 4: Key Research Reagent Solutions for IR Spectroscopy
| Reagent/Material | Function/Application | Technical Specifications | Research Considerations |
|---|---|---|---|
| Alkali Halide Salts (KBr, NaCl) | IR-transparent window and pellet material | purity >99%, hygroscopic, transmission range: KBr (5000-400 cm⁻¹), NaCl (5000-650 cm⁻¹) | Must be thoroughly dried and stored in desiccator; KBr pellets require 1-2 mg sample per 100-200 mg KBr |
| Inert Matrix Gases (Ar, Ne) | Matrix isolation spectroscopy | High purity (99.999%), cryogenic temperatures (10-20 K) | Enables study of reactive intermediates and eliminates rotational broadening; sample concentration typically 1:1000 to 1:10000 in matrix gas |
| Deuterated Solvents (CDCl₃, D₂O) | Solvent for solution-phase IR | Isotopic purity >99%, transmission windows vary by solvent | Minimizes interference from C-H and O-H stretches; requires correction for solvent absorption bands |
| Silicon Carbide (Globar) | IR light source | Temperature ~1500 K, broadband emission from 5000-50 cm⁻¹ | Requires water cooling; provides stable, continuous spectrum; superior to Nernst glower for far-IR region |
| Mercury Cadmium Telluride (MCT) Detector | IR radiation detection | Requires liquid N₂ cooling, high sensitivity, fast response | Spectral range depends on Hg:Cd ratio; more sensitive than DTGS detectors but requires precise temperature control |
| ATR Crystals (Diamond, ZnSe, Ge) | Attenuated Total Reflectance | Different refractive indices and chemical resistance | Diamond: most durable, broadest range; ZnSe: good general purpose; Ge: high refractive index for strong absorbers |
| Calibration Gases (OCS, CO) | Wavenumber calibration | High purity, specific rotational-vibrational lines | OCS provides multiple sharp lines between 830-1100 cm⁻¹ for precise calibration [8] |
Molecular vibration fundamentals provide the theoretical foundation for understanding and applying infrared spectroscopy across diverse scientific disciplines. The intricate relationships between stretching, bending, and rotational transitions manifest in characteristic spectral patterns that serve as powerful analytical tools for structural elucidation, compound identification, and process monitoring. While the harmonic oscillator model offers an accessible entry point for conceptualizing molecular vibrations, real-world applications increasingly require consideration of anharmonicity, mode-coupling, and rotational-vibrational interactions to fully exploit the information content of IR spectra.
Contemporary research demonstrates that advances in computational methods, particularly those incorporating anharmonic effects through variational treatments and vibrational configuration interaction approaches, are significantly enhancing our ability to interpret complex spectral features [7]. Simultaneously, technological innovations in instrumentation, such as high-resolution FTIR spectroscopy and matrix isolation techniques, continue to push the boundaries of detection sensitivity and spectral resolution [7] [8]. For drug development professionals and researchers, these developments translate to increasingly powerful capabilities for characterizing molecular structures, monitoring reactions, and understanding biological systems at the molecular level.
The integration of IR spectroscopy with machine learning and artificial intelligence represents perhaps the most promising frontier, enabling the extraction of subtle but diagnostically significant information from complex spectral datasets [1] [4]. As these computational approaches continue to evolve alongside experimental methodologies, infrared spectroscopy will undoubtedly maintain its position as an indispensable technique in the molecular scientist's analytical arsenal, providing unique insights into the vibrational dynamics that underlie molecular structure and function.
Infrared (IR) spectroscopy is a pivotal analytical technique used primarily for determining molecular structures and identifying chemical compounds. Its effectiveness stems from the interaction between IR radiation and molecular vibrations, which provides a characteristic fingerprint for a vast array of substances [2]. The foundational principle governing this interaction is the selection rule for IR activity: a molecular vibration will be IR active only if it results in a change in the dipole moment of the molecule [2]. This rule is what makes IR spectroscopy particularly sensitive to polar functional groups and crucial for studies in chemistry, biology, material science, and drug development.
This guide delves into the core principle of dipole moment change, exploring the theoretical framework behind vibrational transitions and the critical limitations of the harmonic approximation. It further examines advanced anharmonic treatments and experimental methodologies, providing researchers with a comprehensive technical resource framed within the broader context of molecular vibration and rotation research.
Fundamental Principles of Infrared Absorption
The Nature of Vibrational Transitions
The absorption of IR radiation by a molecule leads to a transition between vibrational energy levels. For a simple diatomic molecule, this can be modeled as two atoms connected by a spring, vibrating with a fundamental frequency [2]. The energy of IR radiation is sufficient to cause these vibrational transitions, which have higher energy separations than rotational transitions but lower than electronic transitions [2].
A critical criterion for this absorption to occur is a net change in the dipole moment of the molecule during its vibration or rotation. As a molecule vibrates, the fluctuation in its dipole moment creates an oscillating electric field that can interact with the electric field of the incident IR radiation. If the frequency of the radiation matches the natural vibrational frequency of the molecule, energy is absorbed, altering the amplitude of the molecular vibration [2]. Molecules with no permanent dipole moment, or whose vibrational motions do not cause a change in that dipole (such as O₂, N₂, or Br₂), cannot absorb IR radiation and are thus IR inactive [2].
The Harmonic Oscillator Model and Its Limitations
The harmonic oscillator model, based on Hooke's law, provides a starting point for understanding molecular vibrations [2]. In this model, the potential energy of a vibrating diatomic molecule is a parabolic function of the displacement from equilibrium. However, this model has significant quantitative and qualitative limitations [7].
Quantitatively, the harmonic approximation overestimates vibrational wavenumbers. For example, in CO₂, the harmonic wavenumber for one mode overestimates the experimental value by approximately 45 cm⁻¹ [7]. Qualitatively, the harmonic model fails to explain the appearance of bands that violate the simplistic 3N-6 rule of normal modes, such as the two bands observed in the Raman spectrum of CO₂ where only one is predicted. These observations necessitate the introduction of concepts like Fermi resonance to explain quasi-degeneracies between fundamentals and overtones or combination bands [7].
Advanced Theoretical Framework: Beyond the Harmonic Approximation
Anharmonicity and Mode-Coupling
The real behavior of molecules deviates from the harmonic model due to two key factors: anharmonicity and mode-coupling.
- Anharmonicity: Real chemical bonds can be dissociated. The potential energy curve flattens out as the bond length increases toward the dissociation energy, unlike the parabolic curve of a harmonic oscillator [7]. This anharmonicity leads to overtones and means that the wavenumbers of these transitions are not simple integer multiples of the fundamental frequency.
- Mode-Coupling: In polyatomic molecules, vibrational motions are not independent. The potential energy must be modeled simultaneously for multiple normal modes, as their motions can be coupled [7].
Variational approaches, such as the vibrational self-consistent field and vibrational configuration interaction (VSCF/VCI), are used to solve the vibrational Schrödinger equation on an N-mode expansion of the potential energy surface, thereby incorporating both anharmonicity and mode-coupling [7]. These methods provide a more rigorous theoretical model while attempting to retain the ease of interpretation offered by conventional vibrational notations.
The Challenge of Resonances and Interpretive Tools
The interaction between nearly degenerate vibrational states, known as resonances, complicates the interpretation of IR spectra. A Fermi resonance occurs when there is a quasi-degeneracy between a fundamental and a first overtone or a binary combination band. More complex quasi-degeneracies are termed Darling-Dennison resonances [7].
To demystify these debated resonances, researchers are moving beyond conventional notations. Sankey diagrams can be used to visualize the static mapping from a vibrational "label" to a computed wavenumber, unambiguously showing how multiple labels contribute to a single observed spectral feature [7]. This is particularly useful for molecules like methanol, where resonances arise from various stretches and deformations of the methyl and hydroxyl groups [7].
Quantitative Analysis and the Lambert-Beer Law
The basis for quantitative analysis using IR spectroscopy is the Lambert-Beer Law. It states that the absorbance of light at any wavenumber is directly proportional to the concentration of the component and the path length of the sample [11].
For a single solute, the absorbance A(ν) is given by: A(ν) = a(ν) * b * c where a(ν) is the absorption coefficient at wavenumber ν, b is the optical path length, and c is the sample concentration [11].
For a mixture of N components, the total absorbance at a given wavenumber is the sum of the individual absorbances, making the law additive [11]. It is crucial to note that this law applies to absorbance spectra, not transmittance. Therefore, for quantitative work, transmittance spectra must be converted into absorbance spectra [11].
Table 1: Key Aspects of Quantitative Infrared Analysis
| Aspect | Description | Considerations |
|---|---|---|
| Measurement Methods | Peak Height or Peak Area [11] | Peak area is generally more accurate as it is less affected by instrumental and sample-related factors [11]. |
| Baseline Correction | Essential for accurate measurement of absorbance/area [12]. | Methods vary (e.g., tangent between troughs); consistency within an analysis is critical [11]. |
| Spectral Overlap | Challenge in multi-component mixtures [12]. | Requires advanced chemometrics (e.g., PLS, PCR) or variable selection with neural networks [12]. |
| Molar Absorptivity | Absorption coefficient at a specific wavenumber [11]. | Varies for different vibrational modes; polar groups (C=O, O-H) typically have large absorptivities [11]. |
Computational and Experimental Methodologies
Computational Workflows for IR Spectrum Prediction
Accurately predicting IR spectra requires computational methods that go beyond the harmonic approximation. Ab-initio molecular dynamics (AIMD) treats nuclei classically and naturally includes anharmonic effects by simulating dynamics on the potential energy surface, with the IR spectrum derived from the dipole moment autocorrelation function [13]. While more accurate than harmonic calculations, AIMD is computationally expensive.
Recent advancements use machine-learned interatomic potentials (MLIPs) to dramatically accelerate these calculations. The PALIRS framework employs an active learning strategy to efficiently build training datasets for MLIPs, which are then used for molecular dynamics simulations to predict IR spectra with accuracy comparable to AIMD but at a fraction of the cost [13]. The workflow involves:
- Training an MLIP on an initial set of molecular geometries.
- Using active learning to iteratively expand the training set with high-uncertainty configurations from MLMD simulations.
- Training a separate ML model for dipole moment prediction.
- Running production MLMD simulations and calculating the IR spectrum from the dipole moment autocorrelation function [13].
Computational Workflow for ML-Enhanced IR Prediction
Experimental Protocols and Baseline Correction
In experimental FTIR spectroscopy, a common challenge is baseline drift, often caused by environmental variations, fluctuations in the infrared light source temperature, or instrumental artifacts [12]. Uncorrected baseline drift leads to significant inaccuracies in quantitative concentration estimates.
A robust method for correction is the adaptive smoothness parameter penalized least squares (asPLS) method [12]. The procedure is as follows:
- Spectral Acquisition: Collect spectral data using an FTIR spectrometer. For gas analysis, parameters might include a spectral resolution of 1 cm⁻¹, a range of 400–4000 cm⁻¹, and multiple scans (e.g., 8) to minimize random noise [12].
- Baseline Modeling: The asPLS algorithm iteratively fits a baseline to the measured spectrum. It minimizes a cost function that balances the fit to the data with the smoothness of the baseline.
- Baseline Subtraction: The fitted baseline is subtracted from the original spectrum, yielding a corrected spectrum with a flat baseline, which is essential for reliable quantitative analysis [12].
The Scientist's Toolkit: Essential Research Reagents and Materials
Table 2: Key Materials and Reagents for Infrared Spectroscopy Research
| Item | Function/Application |
|---|---|
| FTIR Spectrometer | Core instrument for measuring infrared absorption spectra; often equipped with a DTGS detector for general use [12]. |
| Gas Cell | A chamber of fixed path length (e.g., 10 cm) for holding gaseous samples during analysis [12]. |
| Certified Standard Gas Mixtures | Calibration standards with known concentrations of target analytes (e.g., CH₄, CO, CO₂), traceable to national standards, for building quantitative models [12]. |
| Deuterated Triglycine Sulfate (DTGS) Detector | A common, robust thermal detector used in FTIR spectrometers for measuring the complete radiation power across the IR spectrum [12]. |
| Solid Substrates (e.g., KBr Pellets) | A method for preparing solid samples for analysis by dispersing them in an IR-transparent salt matrix [11]. |
| PALIRS Software Package | An open-source active learning framework for efficiently generating training data and predicting IR spectra using machine-learned interatomic potentials [13]. |
| VSCF/VCI Computational Code | Software for performing vibrational self-consistent field and configuration interaction calculations to include anharmonicity and mode-coupling in spectral predictions [7]. |
The principle that a changing dipole moment is required for IR absorption remains the cornerstone of interpreting infrared spectra. While the harmonic oscillator model provides an introductory framework, modern research into molecular vibrations and rotations must account for the complex realities of anharmonicity, mode-coupling, and vibrational resonances. Advanced computational methods, including anharmonic VSCF/VCI calculations and machine learning-accelerated molecular dynamics, are now bridging the gap between theory and experiment. Furthermore, robust experimental protocols and quantitative analysis techniques ensure that IR spectroscopy continues to be an indispensable tool for researchers and scientists, enabling precise molecular insight in fields ranging from fundamental chemistry to drug development.
Infrared (IR) spectroscopy is a powerful analytical technique that probes molecular structures through their inherent vibrational and rotational motions. The technique operates on the fundamental principle that covalent bonds in molecules are not rigid but behave like springs, continuously stretching, bending, and twisting [14]. The energy associated with these molecular vibrations is quantized, meaning molecules can only absorb radiation at specific frequencies that match the energy difference between their vibrational and rotational states [14] [15].
The infrared region of the electromagnetic spectrum is divided based on the characteristic molecular interactions it induces: the Near-Infrared (NIR), Mid-Infrared (MIR), and Far-Infrared (FIR). Each region corresponds to different types of molecular transitions, making them uniquely suited for specific applications across chemical analysis, pharmaceutical development, and biomedical diagnostics [16] [17] [18]. This guide provides a technical overview of these spectral regions, emphasizing their foundational principles and contemporary applications for researchers and drug development professionals.
Fundamental Principles: From Molecular Motions to Spectral Data
The Physics of Molecular Vibrations and Rotations
The core of infrared spectroscopy lies in understanding molecular vibrations. For a simple diatomic molecule, the vibration can be modeled as two atoms connected by a spring, obeying Hooke's law [2]. The natural frequency of this vibration depends on the bond strength and the reduced mass of the atoms [14] [18].
For a vibrational mode to be infrared active, it must result in a periodic change in the dipole moment of the molecule. The greater the polarity of the bond, the stronger its IR absorption. For example, the highly polar carbonyl bond (C=O) absorbs IR radiation very strongly [14]. In contrast, non-polar bonds like those in homonuclear diatomic molecules (O₂, N₂) do not absorb IR radiation, as their dipole moment does not change during vibration or rotation [2].
When molecules are in the gas phase, vibrational transitions are accompanied by rotational transitions, leading to rovibrational spectra. These spectra display a characteristic structure: the R-branch (ΔJ = +1), the Q-branch (ΔJ = 0, when allowed), and the P-branch (ΔJ = -1), where J is the rotational quantum number [15].
Technological Foundations: From FT-IR to Advanced Detectors
Fourier Transform Infrared (FT-IR) spectroscopy has revolutionized the field. FT-IR spectrometers use an interferometer to simultaneously collect spectral data across a wide range, providing high sensitivity and resolution [17] [18]. Key advancements include:
- Attenuated Total Reflection (ATR): Allows for direct analysis of solids and liquids with minimal sample preparation [17].
- Focal Plane Array (FPA) Detectors: Enable high-speed chemical imaging, mapping the distribution of chemical components across a sample surface [18].
- Synchrotron Radiation Sources: Provide high brightness for microspectroscopy, surpassing the limitations of conventional thermal sources [18].
The following workflow illustrates a typical FT-IR experiment, from sample preparation to data analysis:
Comparative Analysis of Infrared Spectral Regions
The following table summarizes the core characteristics, molecular origins, and primary applications of the three main infrared spectral regions.
Table 1: Comparative Analysis of Near-IR, Mid-IR, and Far-IR Spectral Regions
| Parameter | Near-IR (NIR) | Mid-IR (MIR) | Far-IR (FIR) |
|---|---|---|---|
| Spectral Range | 12,800–4,000 cm⁻¹ | 4,000–400 cm⁻¹ | 400–50 cm⁻¹ |
| Wavelength | 780 nm – 2.5 µm | 2.5 – 25 µm | 25 – 200 µm |
| Primary Molecular Transitions | Overtone & combination bands of C-H, N-H, O-H | Fundamental vibrations of functional groups | Skeletal vibrations, heavy atom stretches, lattice modes |
| Information Depth | High penetration | Surface-sensitive (in ATR mode) | Varies |
| Key Applications | Pharmaceutical QA, disease diagnosis, food analysis [16] [19] [20] | Molecular structure elucidation, biomedical imaging, hydrogen bonding studies [17] [18] | Inorganic compound analysis, polymer studies, semiconductor research |
Detailed Analysis by Spectral Region
Near-Infrared Spectroscopy
Fundamental Principles and Applications
NIR spectroscopy probes overtone and combination bands of fundamental vibrations, primarily those involving C-H, N-H, and O-H bonds [16] [19]. Its high penetration depth and non-destructive nature make it ideal for analyzing bulk materials.
In biomedical fields, NIR has emerged as a revolutionary tool. Its applications range from cancer diagnosis to wound detection [19]. A 2025 review highlighted its transformative potential in enabling low-cost, non-invasive diagnostic systems, which is particularly beneficial for developing countries [16] [19].
Pharmaceutical and Personalized Medicine
The pharmaceutical industry leverages NIR for raw material identification, quality control, and counterfeit drug detection [19] [21]. A significant advancement is its integration into personalized medicine. A 2025 study combined NIR with machine learning to quantify doses in highly porous, inkjet-printed drug formulations [20]. The researchers used support vector regression models, which reduced prediction errors by 19% compared to traditional linear methods, paving the way for accurate, small-batch manufacturing of patient-specific antidepressants [20].
Mid-Infrared Spectroscopy
Fundamental Principles and Applications
MIR spectroscopy is the most information-rich region, as it directly probes the fundamental vibrational modes of molecules. Each functional group absorbs within a specific frequency range, creating a unique spectral fingerprint. For instance, a ketone's carbonyl stretch appears around 5.11-5.18 x 10¹³ Hz (1710-1720 cm⁻¹) [14].
FT-IR microscopy combines FT-IR spectroscopy with optical microscopy, allowing for chemical characterization at the micron scale. This is invaluable for analyzing heterogeneous materials like biological tissues [18]. Recent breakthroughs, such as mid-infrared photothermal (MIP) microscopy, have overcome the diffraction limit, achieving a spatial resolution of 300–600 nm and enabling sub-cellular chemical imaging [18].
Experimental Protocol: FT-IR Microspectroscopy of Biological Tissues
The following is a generalized protocol for FT-IR imaging of formalin-fixed tissue sections [17] [18]:
- Sample Preparation: Cut thin tissue sections (4-10 µm thick) and mount onto IR-transmissive windows or specific substrates for ATR analysis. For formalin-fixed tissues, wash in water and dehydrate.
- Data Acquisition: Place the sample in the FT-IR microscope. For transmission mode, IR light is passed through the sample. For ATR mode, the tissue is pressed against a high-refractive-index crystal (e.g., germanium). Define the measurement area and aperture size. Collect spectra typically over the range of 4000-700 cm⁻¹ at a resolution of 4-8 cm⁻¹.
- Spectral Preprocessing: Process raw spectra to remove artifacts. Common steps include atmospheric correction (removal of CO₂ and H₂O vapor bands), baseline correction, and normalization.
- Chemometric Analysis: Use multivariate analysis techniques to extract meaningful information.
- Principal Component Analysis (PCA): An unsupervised method used to reduce data dimensionality and identify major spectral patterns or outliers.
- Partial Least Squares - Discriminant Analysis (PLS-DA): A supervised method used to build classification models that can discriminate between tissue types or disease states based on their spectral fingerprints [17].
Far-Infrared Spectroscopy
The Far-IR region is sensitive to skeletal vibrations, lattice modes in crystals, and vibrations involving heavy atoms [21]. While less commonly discussed than NIR and MIR, it is crucial for studying inorganic compounds, polymers, and intermolecular interactions in crystalline materials. Technological advancements are steadily expanding its applications in material science and fundamental physics.
The Scientist's Toolkit: Essential Reagents and Materials
Table 2: Key Research Reagent Solutions for Infrared Spectroscopy
| Item | Function/Application |
|---|---|
| ATR Crystals (Germanium) | High-refractive-index crystals used in ATR-FTIR for surface analysis of solids and liquids; ideal for studying cells in aqueous environments [18]. |
| IR-Transmissive Windows (CaF₂, KBr) | Windows for transmission cells that are transparent in the IR region, allowing precise pathlength control for liquid samples. |
| Freeze-Dried Polymeric Modules | Used in the development of personalized, inkjet-printed drug formulations for dose calibration via NIRS [20]. |
| Commercial Lipid Standards (PE, PC, PI, etc.) | Pure standards of phosphatidylethanolamine (PE), phosphatidylcholine (PC), and others used as references for characterizing lipid composition in cells via FT-IR [17]. |
| Synchrotron Radiation Source | A high-brightness light source used in FT-IR microspectroscopy to achieve higher signal-to-noise ratios and spatial resolution at the diffraction limit [18]. |
| Focal Plane Array (FPA) Detector | A multi-channel detector that enables high-speed FT-IR chemical imaging, allowing simultaneous collection of thousands of spectra from a sample surface [18]. |
The field of infrared spectroscopy is dynamically evolving. Key future trends include:
- Miniaturization and Portability: The development of handheld NIR and FT-IR spectrometers is decentralizing analysis, enabling real-time quality control in pharmaceuticals and on-site environmental monitoring [16] [22].
- Integration of Artificial Intelligence: Machine learning and AI are dramatically enhancing the quantification and classification capabilities of IR spectroscopy, moving beyond traditional chemometrics [20].
- Spatial Resolution Breakthroughs: Techniques like MIP microscopy are pushing the boundaries of spatial resolution, opening new frontiers for nanoscale chemical analysis in biology and materials science [18].
- Expansion in Biomedicine: The proven utility of IR spectroscopy for rapid diagnosis of diseases like fibromyalgia and COVID-19 is driving efforts to bridge the gap between research and clinical practice [17].
The global IR spectroscopy market, valued at USD 1.40 billion in 2025 and projected to grow at a CAGR of 7.3%, is a testament to the technique's expanding utility [21]. This growth is largely driven by the pharmaceutical and biotechnology industries' demand for robust analytical tools [21].
In conclusion, the distinct yet complementary nature of NIR, MIR, and FIR spectroscopy provides scientists with a powerful suite of tools. From fundamental research into molecular vibrations and rotations to applied uses in drug development and clinical diagnostics, the continued advancement of these technologies promises to further transform scientific discovery and industrial practice.
Infrared (IR) spectroscopy is a powerful analytical technique that provides unique insights into molecular structure by probing the vibrational motions of covalently bonded atoms. When IR radiation is applied to a sample, molecules absorb specific frequencies that correspond to the vibrational energy differences of their chemical bonds. This absorption creates a spectrum that serves as a molecular "fingerprint," revealing the presence of characteristic functional groups through their absorption signatures. The fundamental principle underlying this technique is that these vibrational frequencies are determined by two key factors: the masses of the component atoms and the strength of the bonds connecting them. This relationship allows researchers to deduce structural information by analyzing the positions, intensities, and shapes of absorption bands within an IR spectrum.
The infrared region most useful for analyzing organic compounds spans from 2,500 to 16,000 nanometers, with corresponding frequencies from 1.9×10^13 to 1.2×10^14 Hertz. Photon energies within this range (1-15 kcal/mole) are insufficient to excite electrons but can induce vibrational excitation in covalently bonded atoms and groups. These bonds are not rigid but behave like stiff springs that can stretch and bend, giving rise to a variety of vibrational motions characteristic of their component atoms. A molecule composed of n-atoms possesses 3n-6 degrees of vibrational freedom (3n-5 if linear), encompassing various modes such as stretching, bending, scissoring, rocking, and twisting. The exact frequency at which a given vibration occurs provides critical information about bond strength and atomic composition, forming the basis for functional group identification.
Fundamental Principles of IR Absorption
Molecular Vibrations and Rotations
The interaction between infrared radiation and matter arises from molecular vibrations and rotations that produce a changing dipole moment. When the frequency of infrared radiation matches the natural vibrational frequency of a chemical bond, absorption occurs, leading to transitions between vibrational energy levels. These molecular vibrations are generally classified into two main categories: stretching vibrations (which involve changes in bond length) and bending vibrations (which involve changes in bond angle). Stretching vibrations require more energy and consequently appear at higher wavenumbers compared to bending vibrations. Additionally, bonds to hydrogen have higher stretching frequencies than those to heavier atoms, and triple bonds exhibit higher stretching frequencies than corresponding double bonds, which in turn have higher frequencies than single bonds.
The intensity of IR absorption bands depends primarily on the magnitude of dipole moment change during vibration. Bonds with significant polarity differences between atoms (such as C=O and O-H) produce intense absorption bands, while symmetrical bonds (such as C=C in symmetric alkenes) may show weak or undetectable absorption. This variation in intensity provides valuable supplementary information to frequency data when interpreting spectra. The absorption process follows the selection rule that a change in dipole moment must occur for a vibration to absorb infrared energy, making IR spectroscopy particularly sensitive to asymmetric vibrational modes in polar bonds.
Spectral Regions and Their Significance
An IR spectrum is typically divided into distinct regions that provide different types of structural information. The region from 4000 to 1450 cm⁻¹ is known as the group frequency region, where stretching vibrations of diatomic units appear. These bands are often characteristic of specific functional groups, making this region highly valuable for initial structural assessment. Below 1450 cm⁻¹ lies the fingerprint region (1500-500 cm⁻¹), which contains a complex series of absorptions primarily due to bending vibrations and single-bond stretching. This region is unique for every compound and provides a distinctive pattern that can be used for identity confirmation, much like a human fingerprint.
The complexity of infrared spectra in the fingerprint region results from the combination of various vibrational modes and interactions that are highly sensitive to the overall molecular structure. While absorption bands in the group frequency region can often be assigned to specific bond vibrations, the fingerprint region contains overlapping absorptions that are challenging to assign individually but collectively create a pattern characteristic of the entire molecule. This makes the fingerprint region particularly valuable for comparing unknown compounds with reference spectra to establish identity, even when the group frequency region appears similar between compounds.
Characteristic Absorption Bands of Functional Groups
Hydrocarbon Functional Groups
Table 1: Characteristic IR Absorptions of Hydrocarbon Functional Groups
| Functional Group | Vibration Mode | Frequency Range (cm⁻¹) | Intensity | Comments |
|---|---|---|---|---|
| Alkanes | C-H stretch | 2850-3000 | Strong | 2-3 bands [23] [24] |
| C-H bend/scissoring | 1470-1450 | Medium | [23] | |
| C-H rock, methyl | 1370-1350 | Medium | [23] | |
| C-H rock, methyl (long chain) | 725-720 | Weak | [23] | |
| Alkenes | =C-H stretch | 3100-3000 | Medium | Above 3000 cm⁻¹ [23] [25] |
| C=C stretch | 1680-1640 | Variable | Symmetry reduces intensity [23] [24] | |
| =C-H bend | 1000-650 | Strong | [23] | |
| Alkynes | ≡C-H stretch | 3300-3270 | Strong | Sharp [23] [24] |
| C≡C stretch | 2260-2100 | Variable | Symmetry reduces intensity [23] [24] | |
| ≡C-H bend | 700-610 | Strong | [23] | |
| Aromatic compounds | C-H stretch | 3100-3000 | Medium | [23] |
| C-C stretch (in-ring) | 1600-1585, 1500-1400 | Variable | 2-3 bands if conjugated [23] [24] | |
| C-H "oop" | 900-675 | Strong | [23] |
The IR spectra of hydrocarbons provide fundamental information about carbon-carbon and carbon-hydrogen bonding environments. The C-H stretching region around 3000 cm⁻¹ serves as an important diagnostic tool: absorption above 3000 cm⁻¹ indicates the presence of alkene or aromatic C-H bonds, while absorption below 3000 cm⁻¹ is characteristic of alkane C-H bonds. This distinction provides a quick method for assessing the presence of unsaturation in an unknown compound. For aromatic compounds, the out-of-plane C-H bending vibrations between 900-675 cm⁻¹ are particularly useful for determining substitution patterns on the aromatic ring, as different substitution patterns produce characteristic absorption patterns in this region.
Functional Groups Containing Oxygen
Table 2: Characteristic IR Absorptions of Oxygen-Containing Functional Groups
| Functional Group | Vibration Mode | Frequency Range (cm⁻¹) | Intensity | Comments |
|---|---|---|---|---|
| Alcohols | O-H stretch | 3200-3600 | Strong, broad | Hydrogen-bonded [23] [26] [25] |
| C-O stretch | 1260-1050 | Strong | [23] [24] | |
| Carboxylic Acids | O-H stretch | 2500-3300 | Very broad | Very broad, overlaps C-H [24] [25] |
| C=O stretch | 1705-1720 | Strong | [24] | |
| C-O stretch | 1210-1320 | Medium-Strong | [24] | |
| Aldehydes | C=O stretch | 1720-1740 | Strong | [24] |
| Aldehyde C-H stretch | 2690-2840 | Medium | Two bands [24] | |
| Ketones | C=O stretch | 1710-1720 | Strong | [24] |
| α,β-unsaturated | 1685-1666 | Strong | [23] | |
| Esters | C=O stretch | 1735-1750 | Strong | [24] |
| C-O stretch | 1000-1300 | Strong | Two bands [24] |
Oxygen-containing functional groups produce some of the most distinctive and easily recognizable signals in IR spectroscopy. The carbonyl (C=O) stretch is particularly important, appearing as a strong, sharp peak between 1630-1830 cm⁻¹. The exact position within this range provides information about the specific type of carbonyl group: aldehydes, ketones, carboxylic acids, esters, and amides each have characteristic C=O stretching frequencies. For example, saturated aliphatic ketones absorb at approximately 1715 cm⁻¹, while esters absorb at slightly higher frequencies (1735-1750 cm⁻¹). Conjugation with double bonds or aromatic rings typically lowers the C=O stretching frequency by 15-30 cm⁻¹ due to resonance effects.
The O-H stretching vibration is another diagnostically valuable absorption, appearing as a broad, strong band in the 3200-3600 cm⁻¹ region for alcohols and phenols. The breadth of this band results from hydrogen bonding, which creates a distribution of O-H bond strengths in the sample. For carboxylic acids, the O-H stretch is even broader and extends from 2500-3300 cm⁻¹, often overlapping with C-H stretches. This exceptionally broad appearance, sometimes described as a "hairy beard," is characteristic of the dimeric hydrogen-bonded structure of carboxylic acids.
Functional Groups Containing Nitrogen and Other Heteroatoms
Table 3: Characteristic IR Absorptions of Nitrogen-Containing and Other Functional Groups
| Functional Group | Vibration Mode | Frequency Range (cm⁻¹) | Intensity | Comments |
|---|---|---|---|---|
| Amines | N-H stretch (1°) | 3400-3500 | Weak | Two bands [24] |
| N-H stretch (2°) | 3300-3400 | Weak | One band [24] | |
| N-H bend (1°) | 1550-1650 | Medium-Strong | [24] | |
| C-N stretch | 1000-1250 | Medium | [24] | |
| Amides | C=O stretch | 1640-1690 | Strong | Amide I band [24] |
| N-H stretch | 3200-3400 | Medium | [24] | |
| N-H bend (1°) | 1500-1560 | Medium | Amide II band [24] | |
| Nitriles | C≡N stretch | 2240-2260 | Medium | Sharp [24] [25] |
Nitrogen-containing functional groups exhibit characteristic absorptions that facilitate their identification. Primary amines show two medium-intensity N-H stretching bands in the 3400-3500 cm⁻¹ region, while secondary amines display a single band. The N-H stretching vibrations typically appear as sharper peaks compared to O-H stretches, though they may still be broadened by hydrogen bonding. The carbonyl stretching vibration in amides (amide I band) generally appears at lower frequencies (1640-1690 cm⁻¹) compared to other carbonyl compounds due to resonance effects that reduce double-bond character. Nitriles exhibit a characteristic sharp C≡N stretching absorption around 2240-2260 cm⁻¹, which is particularly valuable for identification because few other functional groups absorb in this region.
The region between 2200-2050 cm⁻¹ is especially useful for detecting triple bonds, with both nitriles (C≡N) and alkynes (C≡C) absorbing in this range. Terminal alkynes can be distinguished by the presence of an additional ≡C-H stretching band around 3300 cm⁻¹. The combination of absorptions in these specific regions provides a reliable method for identifying compounds with triple bonds, which are less common in organic molecules.
The Fingerprint Region: Detailed Analysis and Applications
Definition and Significance
The fingerprint region of the infrared spectrum, spanning from approximately 1500 to 500 cm⁻¹, contains a complex series of absorptions primarily resulting from bending vibrations and single-bond stretching motions within the molecule. This region is characterized by its complexity, with multiple overlapping absorption bands that are unique to each compound. While absorption bands in the group frequency region (4000-1450 cm⁻¹) can often be assigned to specific bond vibrations, the fingerprint region contains combinations and overtones of various vibrational modes that are highly sensitive to the overall molecular structure. This complexity makes the fingerprint region exceptionally valuable for confirming the identity of unknown compounds by comparison with reference spectra, as even structurally similar isomers produce distinct patterns in this region.
The uniqueness of the fingerprint region arises from the coupling of vibrational modes and the presence of skeletal vibrations that involve the molecule as a whole rather than individual bonds. Slight changes in molecular structure, such as branching, ring size, or substitution patterns, can significantly alter the absorption pattern in this region. For example, the IR spectra of propan-1-ol and propan-2-ol, which contain identical functional groups, are virtually identical in the group frequency region but show completely different patterns in the fingerprint region between 1500 and 500 cm⁻¹. This distinctive feature enables unambiguous identification of specific compounds, making the fingerprint region indispensable for analytical applications.
Analytical Applications in Research and Industry
The fingerprint region finds extensive application across various scientific disciplines for material identification and characterization. In pharmaceutical research, IR spectroscopy and specifically the fingerprint region are used for polymorph identification, as different crystalline forms of the same drug substance produce distinct fingerprint patterns. This application is crucial because polymorphs can exhibit different bioavailability, stability, and processing characteristics. A 2025 study on elastic polymer composites demonstrated that significant spectral shifts within the fingerprint region of FTIR spectra could reveal subtle structural variations in polymer-solvent systems, advancing materials analysis and providing a robust framework for future FTIR-based diagnostics and material characterization [27].
In environmental science, the fingerprint region enables the identification of carbonate polymorphs (calcite, aragonite, vaterite, and amorphous phases) and the monitoring of their phase transformation kinetics. The relative intensities of the ν1 (∼1100 cm⁻¹) and ν4 (∼700 cm⁻¹) bands and the splitting of the ν4 and ν3 (1400-1500 cm⁻¹) vibrations can be used to distinguish between different calcium carbonate varieties [28]. This information is valuable for understanding biomineralization processes and developing CO₂ capture and storage technologies. Additionally, the fingerprint region has been used to determine carbonate content in arid soil samples, though the presence of other soil components with similar spectral features (such as illite and chlorite) can complicate quantification.
Experimental Protocols and Methodologies
Sample Preparation Techniques
Proper sample preparation is critical for obtaining high-quality IR spectra with well-resolved absorption bands. The appropriate technique depends on the physical state and properties of the sample:
Liquid Samples: Pure liquids are commonly examined as a thin film sandwiched between two polished salt plates (typically NaCl or KBr, as glass absorbs infrared radiation). This method produces spectra with sharp, well-defined bands suitable for detailed analysis. For volatile liquids, sealed liquid cells with fixed pathlengths prevent evaporation during measurement.
Solid Samples: Several techniques are available for solid samples. The potassium bromide (KBr) disk method involves grinding the sample with pure KBr powder and pressing the mixture under high pressure to form a transparent pellet. Alternatively, solids can be mixed with a little non-volatile liquid (such as Nujol) and ground to a paste (or mull) that is smeared between salt plates. The attenuated total reflectance (ATR) technique has gained popularity as it requires minimal sample preparation—solids are simply pressed against a crystal surface, and the evanescent wave penetrates a short distance into the sample.
Gaseous Samples: Gases are analyzed using specialized gas cells with long pathlengths (typically 10 cm or more) to compensate for the low sample density. These cells feature reflective internal surfaces to multiply the pathlength through multiple reflections.
For solution-phase analysis, care must be taken to select solvents that do not absorb strongly in regions of interest. Perchlorinated solvents such as carbon tetrachloride, chloroform, and tetrachloroethene are commonly used because they have relatively simple IR spectra with minimal interference in the fingerprint region.
Instrumentation and Measurement Parameters
Modern FTIR spectrometers offer various accessories and configuration options optimized for different sample types and analytical requirements. The Nicolet iS50 spectrometer equipped with an ATR accessory, as used in a 2025 polymer study, represents a typical configuration for materials analysis [27]. Key measurement parameters that affect spectral quality include:
- Spectral Range: Most routine measurements cover 4000-400 cm⁻¹, encompassing both the group frequency and fingerprint regions.
- Resolution: Standard measurements use 4 cm⁻¹ resolution, though higher resolution (1-2 cm⁻¹) may be necessary to resolve closely spaced absorption bands.
- Number of Scans: 32 scans per sample are typically adequate for most applications, providing a good signal-to-noise ratio while maintaining reasonable measurement times.
- Apodization Function: Different apodization functions (such as Happ-Genzel or Norton-Beer) can be applied to interferograms before Fourier transformation to optimize resolution and line shape.
Advanced spectral processing techniques, including wavelet-based noise reduction, can significantly enhance the signal-to-noise ratio. A 2025 study demonstrated that such techniques reduced baseline standard deviation by over 90%, enabling the detection of subtle structural variations in polymer-solvent systems that are typically masked by conventional FTIR techniques [27].
Figure 1: IR spectrum interpretation workflow following the systematic approach to identify functional groups and confirm compound identity.
The Scientist's Toolkit: Essential Materials and Reagents
Table 4: Essential Research Reagents and Materials for IR Spectroscopy
| Item | Function/Application | Key Characteristics |
|---|---|---|
| Potassium Bromide (KBr) | Preparation of pellets for solid samples | IR-transparent, forms clear pellets under pressure [24] |
| Sodium Chloride (NaCl) plates | Windows for liquid and gas cells | Transparent to IR radiation, soluble in water [24] |
| Attenuated Total Reflectance (ATR) crystal | Sample interface for ATR-FTIR | Diamond, ZnSe, or Ge crystals with high refractive indices [28] [27] |
| Perchlorated solvents (CCl₄, CHCl₃) | Solvents for solution IR | Minimal IR absorption in fingerprint region [24] |
| Poly(vinyl butyral) (PVB) | Polymer matrix for composite studies | Contains hydroxyl and carbonyl groups for interaction studies [27] |
| Polyethylene glycol (PEG 400) | Hydrogen-bonding modifier in polymers | Induces spectral shifts in O–H and C=O regions [27] |
| Nujol (mineral oil) | Mulling agent for solid samples | Non-volatile, convenient for quick sample preparation [24] |
The selection of appropriate materials and reagents is crucial for successful IR spectroscopic analysis. Salt plates (typically NaCl or KBr) are essential for liquid sample containment, as they are transparent to infrared radiation unlike conventional glass. For solid samples, high-purity potassium bromide is necessary for preparing transparent pellets under high pressure. The recent development of ATR accessories has simplified sample preparation significantly, allowing direct analysis of solids and liquids without extensive preparation. Diamond ATR crystals offer durability for analyzing hard materials, while ZnSe and Ge crystals provide different refractive indices optimized for specific sample types.
Specialized polymer systems such as poly(vinyl butyral) and polyethylene glycol serve as valuable model compounds for investigating hydrogen-bonding interactions and solvent effects in FTIR studies. As demonstrated in a 2025 investigation, these materials enable systematic analysis of polymer-solvent interactions, with PEG 400 inducing pronounced spectral changes including shifts in the C=O stretching band (from 1740 to 1732 cm⁻¹) and significant broadening/downshifting of the O–H band to around 3300 cm⁻¹, reflecting strong hydrogen-bonding interactions [27]. Such model systems facilitate the development of enhanced analytical methodologies, including noise-enhanced FTIR recognition models that integrate baseline noise metrics to improve detection sensitivity.
Infrared spectroscopy remains an indispensable analytical technique for identifying functional groups and characterizing molecular structure through the interpretation of characteristic absorption bands. The group frequency region (4000-1450 cm⁻¹) provides valuable information about specific bond vibrations, while the fingerprint region (1500-500 cm⁻¹) offers unique patterns that enable compound identification. A systematic approach to spectral interpretation—focusing initially on key diagnostic regions such as the O-H and C=O stretching regions—facilitates efficient structural elucidation.
Advances in FTIR instrumentation and computational analysis continue to expand the applications of infrared spectroscopy in research and industry. The integration of noise reduction algorithms and the development of enhanced recognition models, as demonstrated in recent polymer studies, enable the detection of subtle spectral variations that were previously masked. These advancements, combined with established methodologies for sample preparation and spectral interpretation, ensure that IR spectroscopy will maintain its critical role in molecular characterization across diverse scientific disciplines, from pharmaceutical development to materials science and environmental analysis.
In the field of infrared spectroscopy research, the analysis of molecular vibrations and rotations provides a fundamental window into molecular structure, dynamics, and intermolecular interactions. The precise frequencies at which molecules vibrate are not random; they are intrinsic properties determined by a set of quantifiable physical factors. For researchers and drug development professionals, understanding these factors is paramount for interpreting spectroscopic data, identifying chemical substances, and elucidating molecular behavior in complex systems. This whitepaper provides an in-depth technical examination of the core principles governing vibrational frequencies, focusing on the triumvirate of bond strength, atomic mass, and molecular environment. We will explore the theoretical underpinnings, present consolidated quantitative data, and detail experimental protocols for modern investigation, framing this discussion within the context of advanced spectroscopic applications in chemical and pharmaceutical research.
Fundamental Principles of Molecular Vibrations
The Harmonic Oscillator and Normal Modes
Molecular vibrations can be modeled, to a first approximation, as simple harmonic motion, akin to a spring connecting two masses. In this model, the vibrational frequency is determined by the stiffness of the spring (the bond force constant) and the masses at its ends [6]. For a diatomic molecule, this relationship is encapsulated by the fundamental equation derived from Hooke's law:
[ \omega = \frac{1}{2\pi c} \sqrt{\frac{K}{\mu}} ]
where ( \omega ) is the fundamental vibrational frequency in cm⁻¹, ( c ) is the speed of light, ( K ) is the force constant of the bond, and ( \mu ) is the reduced mass of the system [6]. The reduced mass is calculated as ( \mu = \frac{m1 m2}{m1 + m2} ), where ( m1 ) and ( m2 ) are the masses of the two atoms.
For polyatomic molecules containing N atoms, the situation is more complex, yielding multiple vibrational frequencies known as normal modes. These are the inherent patterns of collective atomic motion in which all atoms oscillate with the same frequency and phase. The total number of these fundamental vibrational modes depends on the molecule's geometry: linear molecules possess 3N – 5 normal modes, while non-linear molecules possess 3N – 6 [6] [1]. For example, a linear CO₂ molecule (N=3) has 4 normal modes, whereas a non-linear H₂O molecule (N=3) has 3 [6].
Infrared Activity and the Dipole Moment Requirement
A crucial concept for infrared spectroscopy is that not all vibrational modes are "IR active." For a vibration to be observed in an IR spectrum, it must result in a change in the molecular dipole moment [6] [1]. The intensity of an IR absorption band is proportional to the square of the change in dipole moment with respect to the change in bond length (( d\mu/dx )) during the vibration [6]. Vibrations that do not alter the dipole moment, such as the symmetric stretch of CO₂, are infrared inactive and will not appear in the spectrum, though they may be observable by other techniques like Raman spectroscopy [6] [1].
Core Factors Influencing Vibrational Frequencies
Bond Strength (Force Constant)
The bond strength, quantified by the force constant ( K ), is a direct measure of the bond's stiffness. Stronger chemical bonds have higher force constants and consequently vibrate at higher frequencies. This is evident when comparing triple, double, and single bonds between carbon atoms. A carbon-carbon triple bond, with its greater electron density and shorter bond length, is significantly stronger and has a much higher stretching frequency (around 2150 cm⁻¹) compared to a double bond (around 1650 cm⁻¹) or a single bond (around 1150 cm⁻¹) [6]. The force constant is thus the primary determinant of the intrinsic vibrational frequency of a bond.
Atomic Mass (Reduced Mass)
The masses of the atoms involved in the vibration are equally critical. According to the harmonic oscillator model, the vibrational frequency is inversely proportional to the square root of the reduced mass (( \omega \propto 1/\sqrt{\mu} )) [6] [29]. This means that bonds involving lighter atoms will vibrate at higher frequencies. A classic illustration is the O-H stretch, which appears around 3600 cm⁻¹, while the S-H stretch is found near 2600 cm⁻¹. The vibrational modes of bonds to hydrogen are typically the highest frequency stretches in a molecule precisely because of hydrogen's low mass.
Table 1: Effect of Atomic Mass and Bond Order on Characteristic Stretching Frequencies
| Bond | Approximate Reduced Mass (AMU) | Bond Order | Characteristic Stretching Frequency (cm⁻¹) |
|---|---|---|---|
| O-H | ~0.94 | 1 | 3200-3600 [30] |
| C-H | ~0.92 | 1 | 2850-3000 [6] |
| C≡N | ~6.46 | 3 | ~2250 [6] |
| C=O | ~6.86 | 2 | 1650-1750 [6] |
| C-C | ~6.00 | 1 | ~1150 [6] |
Molecular Environment and Coupling Effects
Beyond the intrinsic properties of a bond, the surrounding molecular environment exerts a profound influence on its vibrational frequency. These effects are critical for accurate spectral interpretation in complex systems like pharmaceutical compounds.
- Electronic Effects: The presence of electron-withdrawing or electron-donating groups can alter the electron density of a bond, thereby changing its force constant and vibrational frequency. For instance, a carbonyl group (C=O) adjacent to an electron-withdrawing group, as in a carboxylic acid or ester, will have a higher stretching frequency than a carbonyl in an aldehyde or ketone.
- Hydrogen Bonding: The formation of hydrogen bonds, particularly with O-H and N-H groups, leads to a significant broadening and shifting to lower frequencies (red-shift) of the stretching band [30]. This is due to the weakening of the O-H or N-H bond force constant upon complexation.
- Vibrational Coupling: When two vibrations in a molecule share a common atom and have similar energies, they can interact or "couple," resulting in a shift in their frequencies. This is common with symmetric and asymmetric stretches in methylene (CH₂) and methyl (CH₃) groups [1].
- Physical State and Environment: Vibrational frequencies can shift between gas, liquid, and solid phases due to varying degrees of intermolecular interactions. Furthermore, the local chemical environment within a protein binding pocket or a polymer matrix can cause specific frequency shifts that report on the molecular surroundings [31].
Table 2: Impact of Molecular Environment on Carbonyl Stretching Frequencies
| Compound Class | Typical C=O Stretch Range (cm⁻¹) | Primary Environmental Influence |
|---|---|---|
| Ketone | 1710-1715 | Base value, minimal electronic effects |
| Ester | 1735-1750 | Inductive effect of electron-withdrawing oxygen |
| Carboxylic Acid | 1710-1760 | Hydrogen bonding and dimerization |
| Amide | 1640-1690 | Resonance conjugation with the nitrogen lone pair |
Experimental and Computational Methodologies
Protocol: Fourier-Transform Infrared (FTIR) Spectroscopy
FTIR is the standard laboratory technique for acquiring high-quality infrared spectra [1].
- Sample Preparation:
- Solids: May be ground with potassium bromide (KBr) and pressed into a pellet, or diluted in a mull (e.g., Nujol). KBr is transparent to IR radiation in the mid-IR region [1].
- Liquids: A drop can be placed between two KBr or NaCl plates to form a thin film. NaCl plates are suitable for the mid-IR range but are dissolvable in water [1].
- Gases: Contained in a cell with a long pathlength (e.g., 10 cm) to compensate for low sample density.
- Data Collection: The prepared sample is placed in the path of the IR beam. An interferometer in the FTIR instrument modulates the light, and an interferogram is collected. A Fourier transform algorithm converts this raw data into a spectrum of intensity (absorbance or transmittance) versus wavenumber (cm⁻¹).
- Analysis: The resulting spectrum is analyzed by assigning peaks to specific functional groups based on their position (frequency), intensity, and shape. Comparison to spectral libraries is used for identification.
Protocol: Computational Determination of Vibrational Frequencies
Quantum chemical calculations are indispensable for predicting and assigning vibrational spectra, especially for novel molecules [32].
- Geometry Optimization: The molecular structure is first optimized to its minimum energy configuration using a method such as Density Functional Theory (DFT) with a functional like PBEPBE and a basis set like 6-31 G [32]. This finds the equilibrium geometry on the potential energy surface.
- Frequency Calculation: A single-point frequency calculation is performed on the optimized geometry. This computes the second derivatives of the energy with respect to the nuclear coordinates, yielding the harmonic vibrational frequencies, IR intensities, and Raman activities.
- Data Extraction: The output includes a list of all vibrational frequencies, their reduced masses (( M )), force constants (( F )), and IR intensities (( I_{IR} )) [32]. This data can be visualized as a simulated spectrum and used for direct comparison with experimental results.
Diagram 1: Experimental and computational workflow for vibrational analysis
Advanced Techniques and Research Applications
Ultrafast 2D IR Spectroscopy and Microscopy
Going beyond conventional FTIR, ultrafast two-dimensional infrared (2D IR) spectroscopy is a powerful technique for studying molecular dynamics and environments. This method uses femtosecond laser pulses to correlate different vibrational frequencies, revealing how vibrations couple and how energy flows through a molecule [31]. A recent advancement is the integration of 2D IR with microscopy. This hybrid technique provides spatial resolution on the scale of microns (the size of a human skin cell) while retaining the rich molecular information of IR spectroscopy [31]. It functions by measuring the vibrational relaxation rate of a molecule, which depends on its neighbors' ability to accept energy. This allows researchers to directly visualize microscopic variations in chemical environments, such as those within a single biological cell [31].
Near-Infrared (NIR) Spectroscopy and Overtone Bands
Near-infrared spectroscopy (wavelengths 780-2500 nm) probes molecular vibrations differently than mid-IR. Instead of fundamental transitions, NIR primarily measures overtone and combination bands [30] [1]. An overtone is a multiple of a fundamental frequency (e.g., v=0 → v=2), while a combination band involves the sum or difference of two fundamental frequencies. These bands are much weaker than fundamental bands, which allows for the direct analysis of thicker, more concentrated samples without dilution. NIR is widely used in pharmaceutical, food, and agricultural industries for rapid, non-destructive quality control and analysis [30] [16]. The complex NIR spectra are often interpreted using advanced chemometrics and machine learning algorithms [30].
Table 3: The Scientist's Toolkit: Key Reagents and Materials for IR Spectroscopy
| Item | Function / Application | Key Characteristics |
|---|---|---|
| Potassium Bromide (KBr) | Windows and pellet matrix for solid samples [1]. | Transparent across the mid-IR range (5000-650 cm⁻¹); hygroscopic. |
| Sodium Chloride (NaCl) | Windows for liquid sample cells [1]. | Common and inexpensive; attacked by water and alcohols. |
| Calcium Fluoride (CaF₂) | Windows for IR cells [1]. | Insoluble in water; useful range of 4200-1300 cm⁻¹. |
| Fourier-Transform IR (FTIR) Spectrometer | Core instrument for acquiring infrared spectra. | Uses an interferometer for high sensitivity and speed. |
| Pulse Shaper (for 2D IR) | Modulates ultrafast laser pulses for advanced spectroscopy [31]. | Enables precise control of pulse phase and timing. |
| Quantum Chemistry Software (e.g., Gaussian09) | Computes optimized geometries and vibrational frequencies [32]. | Uses methods like DFT to predict IR and Raman spectra. |
Diagram 2: Logical relationship between core factors and spectral output
The vibrational frequencies observed in infrared spectroscopy are a direct and sensitive reporter on molecular identity and structure. As detailed in this guide, these frequencies are principally governed by the quantifiable factors of bond strength (force constant) and atomic mass (reduced mass), as described by the harmonic oscillator model. However, a complete and accurate interpretation, especially for complex systems in drug development and materials science, requires a deep appreciation for the subtler effects of the molecular environment, including hydrogen bonding, electronic effects, and vibrational coupling. Modern research leverages a synergy between advanced experimental techniques like 2D IR microscopy and powerful computational chemistry to move beyond simple identification toward a dynamic understanding of molecular behavior in situ. By mastering the principles outlined in this technical guide, researchers can fully exploit vibrational spectroscopy as a robust tool for probing the molecular world.
Within infrared (IR) spectroscopy research, understanding molecular vibrations and rotations is fundamental for elucidating molecular structure and dynamics. The theoretical foundation for interpreting these vibrational frequencies is provided by the application of Hooke's Law, which models chemical bonds as simple springs. This framework allows researchers to predict and rationalize the absorption of infrared light by molecules, forming the basis for a powerful analytical technique used extensively in chemical identification and quantitative analysis [33] [34]. For drug development professionals, this is indispensable for characterizing compounds, confirming synthetic pathways, and understanding intermolecular interactions.
The core principle treats a covalently bonded molecule as two masses (atoms) connected by a spring (the chemical bond) [33] [35]. When infrared light interacts with a molecule, the energy absorbed excites these vibrational modes, provided the light's frequency matches the natural vibrational frequency of the bond. The resulting IR spectrum is a unique "chemical fingerprint" used to identify functional groups, distinguish isomers, and determine sample composition [3] [34].
The Harmonic Oscillator Model
Fundamental Equation
The ball-and-spring model of a diatomic molecule leads to a mathematical formulation derived from Hooke's Law that predicts the vibrational frequency. The key equation for the harmonic oscillator model is [33]:
[ \tilde{\nu} = \frac{1}{2\pi c} \sqrt{\frac{k}{\mu}} ]
Where:
- (\tilde{\nu}) is the fundamental vibrational frequency in wavenumbers (cm⁻¹)
- (c) is the speed of light
- (k) is the force constant of the bond
- (\mu) is the reduced mass of the system
This equation shows that the vibrational frequency is directly proportional to the bond's force constant and inversely proportional to the reduced mass of the vibrating atoms [35].
Conceptual Diagram of the Model
The following diagram illustrates the core Hooke's Law model for a vibrating diatomic molecule, which forms the theoretical basis for interpreting infrared spectra.
Quantitative Relationships and Vibrational Modes
Force Constants and Atomic Mass Effects
The harmonic oscillator equation reveals two critical relationships for interpreting IR spectra. The force constant (k) represents bond strength, with stronger bonds (higher k) vibrating at higher frequencies. The reduced mass (μ) means bonds between heavier atoms vibrate at lower frequencies than those between lighter atoms [35]. Isotopic substitution provides direct experimental validation; replacing ¹H with ²H (deuterium) in a C-H bond significantly lowers its stretching frequency because the increased mass raises the reduced mass μ [36].
Table 1: Relationship Between Bond Order, Force Constant, and Vibrational Frequency for Carbon-Carbon Bonds
| Bond Type | Bond Order | Approximate Force Constant (N/m) | Typical Vibrational Frequency (cm⁻¹) |
|---|---|---|---|
| C-C | Single | ~500 | 1200 |
| C=C | Double | ~1000 | 1650 |
| C≡C | Triple | ~1500 | 2150 |
Source: Data adapted from JoVE Science Education [35].
Molecular Vibrations in IR Spectroscopy
Real molecules exhibit complex vibrations beyond simple diatomic stretches. Polyatomic molecules have multiple vibrational modes, categorized as stretching (symmetric and asymmetric) and bending (scissoring, rocking, wagging, twisting) [34]. A non-linear molecule with N atoms has 3N-6 fundamental vibrational modes, while a linear molecule has 3N-5 [33]. Bending vibrations generally require less energy and occur at lower wavenumbers than stretching vibrations for the same atoms involved [35].
Table 2: Characteristic IR Stretching Frequencies of Common Functional Groups
| Functional Group | Bond Type | Typical Vibrational Frequency Range (cm⁻¹) | Influence of Reduced Mass (μ) |
|---|---|---|---|
| O-H | Single | 2700-3700 (Broad) | Very low μ (O and H) = High Frequency |
| N-H | Single | ~3350 (Sharper) | Low μ (N and H) = High Frequency |
| C-H | Single | 2850-3000 | Low μ (C and H) = High Frequency |
| C=O | Double | 1650-1750 | High k dominates over moderate μ |
| C≡C | Triple | 2150 | Very high k = Very High Frequency |
| C-Cl | Single | 600-800 | High μ (C and Cl) = Low Frequency |
Source: Data synthesized from multiple sources [33] [3] [35].
Experimental Protocols in IR Spectroscopy
Measurement Techniques and Workflow
Translating the theoretical framework into practical data requires specific instrumentation and methodologies. Fourier Transform Infrared (FT-IR) spectrometers have largely replaced older dispersive instruments due to their speed, accuracy, and superior signal-to-noise ratio [34]. These instruments use an interferometer to simultaneously collect data across all wavelengths, which is then converted into a conventional spectrum via a Fourier Transform [34].
Sample Preparation Methodologies
The choice of measurement technique depends on sample properties and research goals. The three main techniques are:
Transmission IR Spectroscopy: The "original" technique where IR light passes through the sample. Requires significant sample preparation: solids must be ground and mixed with KBr to form a pellet; liquids require dilution with a non-absorbing solvent like CCl₄. This method is time-consuming and destructive but used for specific applications like polymer films and FT-IR microscopy [34].
Attenuated Total Reflectance (ATR): Now the primary measurement technique. The sample is placed on a crystal (e.g., diamond). IR light passes through the crystal, interacts minimally with the sample, and is detected. Requires little to no sample preparation, is non-destructive, and produces high-quality spectra. Spectral differences from transmission can be corrected with software [34].
Reflection Spectroscopy: Detects IR light reflected off the sample surface. Useful for analyzing solid samples difficult to study with transmission or ATR. Includes reflection-absorption, specular reflection, and diffuse reflectance (DRIFTS). The latter requires careful sample preparation but yields excellent quantitative results for solids like soils and catalysts [34].
The Scientist's Toolkit: Essential Research Reagents and Materials
Table 3: Key Research Reagent Solutions for IR Spectroscopy
| Item | Function/Brief Explanation | Common Examples |
|---|---|---|
| ATR Crystals | Provides internal reflection element for sample interaction; different materials offer varying hardness and IR transmission ranges. | Diamond, Germanium, Zinc Selenide |
| Potassium Bromide (KBr) | IR-transparent matrix used to dilute solid samples for transmission measurements; forms clear pellets under pressure. | KBr Powder (FT-IR Grade) |
| IR-Transparent Solvents | Diluents for liquid samples in transmission cells that have minimal interference in the mid-IR region. | Carbon Tetrachloride (CCl₄), Chloroform |
| FT-IR Spectrometer | Primary instrument; uses an interferometer for simultaneous data collection across the spectrum, later converted via Fourier Transform. | Various commercial manufacturers |
| Calibration Standards | Polystyrene films used for wavelength accuracy verification and instrument performance validation. | Polystyrene Film |
| Spectral Libraries | Databases of known compound spectra for automated matching and compound identification. | Commercial & NIST Databases |
Source: Information synthesized from multiple sources [3] [34].
Advanced Considerations and Research Implications
Beyond the Harmonic Approximation
The harmonic oscillator model is a simplification. Real chemical bonds exhibit anharmonicity, meaning the restoring force is not perfectly proportional to displacement at larger amplitudes. This becomes significant at higher vibrational energy levels. Furthermore, the model's assumption of isolated bonds is imperfect; in molecules, vibrations are coupled, leading to normal modes where groups of atoms vibrate in concert [33]. Advanced interpretation and computational chemistry methods like molecular orbital calculations are often employed to predict and assign these complex spectra [36].
Peak Characteristics in Spectral Interpretation
An IR spectrum contains three key pieces of information: position, height, and width [33]. While Hooke's Law primarily explains peak position, height (absorbance) relates to concentration via Beer's Law (A = εlc) and the change in dipole moment during vibration [33]. Peak width provides information about the molecular environment; for instance, O-H stretching peaks are characteristically broader than N-H stretches due to stronger hydrogen bonding in alcohols [33]. For drug development professionals, this framework enables the identification of polymorphs, monitoring of reaction kinetics, and characterization of protein-ligand interactions, making it a cornerstone of modern analytical chemistry.
Advanced FT-IR Techniques and Biomedical Applications in Drug Development
Fourier Transform Infrared (FT-IR) spectroscopy stands as a pivotal analytical technique in modern scientific research, enabling the precise characterization of molecular structures through their vibrational and rotational signatures. The foundation of this technology traces back to Albert Abraham Michelson's late 19th-century invention of the interferometer, an instrument that would not only revolutionize physics through the famous Michelson-Morley experiment but also lay the essential groundwork for contemporary spectroscopic analysis [37]. The core principle of FT-IR spectroscopy involves measuring all wavelengths of infrared light simultaneously using an interferometer, followed by a mathematical Fourier transform to decode this information into a recognizable spectrum [34]. This methodology represents a significant advancement over traditional dispersive spectroscopy, offering superior speed, sensitivity, and spectral accuracy.
The operation of FT-IR spectroscopy is intrinsically linked to the fundamental principles of molecular vibrations and rotations. When molecules are exposed to infrared radiation, they absorb energy at specific frequencies corresponding to their natural vibrational frequencies, which include bond stretching, bending, and rotational motions [2]. Each molecular bond vibrates at a characteristic frequency that depends on the masses of the atoms and the bond strength, creating a unique "chemical fingerprint" that enables precise material identification [38]. For researchers and drug development professionals, understanding the evolution from basic Michelson interferometers to sophisticated modern configurations provides critical insights into instrument capabilities, operational principles, and methodological applications across diverse scientific domains.
Historical Foundation: The Michelson Interferometer
Basic Configuration and Operating Principles
The classic Michelson interferometer, invented in 1881, employs a remarkably elegant optical configuration that remains fundamentally unchanged in modern FT-IR instruments. The apparatus minimally consists of a coherent light source, a beam splitter, two mirrors (one fixed and one movable), and a detector [39]. The operational principle begins when light from the source strikes the beam splitter, which divides the beam into two paths: one transmitted toward the movable mirror and the other reflected toward the fixed mirror. After reflecting from their respective mirrors, the two beams recombine at the beam splitter and interfere constructively or destructively based on their relative phase differences before reaching the detector [39].
This interference pattern, known as an interferogram, encodes spectral information as a function of the movable mirror's position. When the path lengths of both arms are identical, constructive interference occurs for all wavelengths. As the movable mirror travels, the path difference creates an interference pattern where the central burst corresponds to zero path difference, and the modulated signal contains information about all infrared frequencies absorbed by the sample [39] [37]. Michelson's original design demonstrated extraordinary precision in measuring wavelength and coherence properties of light, capabilities that directly translate to modern FT-IR spectroscopy.
The Michelson-Morley Experiment and Its Legacy
In 1887, Michelson collaborated with Edward Morley to employ the interferometer in what would become one of history's most famous physics experiments – the attempt to detect the "luminiferous aether," a hypothetical medium through which light waves were presumed to propagate. The experimental setup used quasi-monochromatic light for initial alignment before switching to white light to precisely equalize the interferometer's arm lengths, enabling detection of the absolute point of phase equalization rather than phase modulo 2π [39]. The null result of this experiment, demonstrating no detectable difference in the speed of light relative to Earth's motion, fundamentally challenged contemporary physics and paved the way for Einstein's special theory of relativity [39] [37].
Beyond its revolutionary implications for physics, this experiment showcased the interferometer's extraordinary sensitivity to minute path length differences – a characteristic that would later prove invaluable for spectroscopic applications. Michelson's precise optical engineering and his measurement of spectral lines to define length standards directly contributed to the reliability of modern spectroscopic techniques [37]. In 2015, this legacy reached another milestone when advanced Michelson interferometers at LIGO (Laser Interferometer Gravitational-Wave Observatory) first detected gravitational waves, confirming a key prediction of general relativity and demonstrating the ongoing evolution and application of Michelson's foundational design [39].
Fundamental Principles of FT-IR Spectroscopy
From Interferogram to Spectrum: The Fourier Transform
The transformation of raw interferometric data into an interpretable spectrum represents the core innovation of FT-IR spectroscopy. Unlike dispersive instruments that measure intensity at individual wavelengths sequentially, an FT-IR spectrometer collects an interferogram containing information across all wavelengths simultaneously [34] [38]. This interferogram appears as a complex signal with a characteristic central burst (at zero path difference) flanked by symmetric oscillations decaying as the mirror moves [38].
The mathematical operation of Fourier transformation decodes this time-domain interferogram into a frequency-domain spectrum, representing the familiar plot of absorbance or transmittance versus wavenumber (cm⁻¹) [38]. This process confers significant advantages over dispersive methods, including the Fellgett advantage (multiplex advantage) whereby all frequencies are measured simultaneously, resulting in faster acquisition and better signal-to-noise ratio; the Jacquinot advantage (throughput advantage) due to the absence of narrow slits, allowing more light to reach the detector; and superior wavelength accuracy conferred by the laser reference channel [39] [34].
Table 1: Key Advantages of FT-IR Spectroscopy Over Dispersive Methods
| Advantage | Technical Principle | Practical Benefit |
|---|---|---|
| Fellgett (Multiplex) Advantage | Simultaneous measurement of all wavelengths | Higher signal-to-noise ratio and faster acquisition |
| Jacquinot (Throughput) Advantage | No energy-limiting slits | Increased sensitivity, especially for weak signals |
| Connes (Accuracy) Advantage | Laser reference for mirror position | Superior wavenumber precision and reproducibility |
| Stray Light Rejection | Modulation of frequencies | Reduced spectral contamination |
Molecular Vibrations and Rotations: The Theoretical Framework
The analytical power of FT-IR spectroscopy stems from the quantum mechanical principles governing molecular motions. When molecules absorb infrared radiation, they undergo transitions between discrete vibrational and rotational energy levels [2] [15]. The total internal energy of a molecule can be approximated as the sum of electronic (Eₑₗₑc), vibrational (Eᵥᵢᵦ), and rotational (Eᵣₒₜ) components:
[ E{total} = E{elec} + E{vib} + E{rot} ]
For infrared spectroscopy, the most relevant transitions occur between vibrational levels, typically in the mid-infrared region (4000-400 cm⁻¹) where photon energies correspond to natural molecular vibration frequencies [34]. These vibrations include stretching motions (symmetrical and asymmetrical) that change bond lengths, and bending motions (scissoring, rocking, wagging, twisting) that alter bond angles [2]. Each vibration occurs at a frequency characteristic of specific chemical bonds and functional groups, creating a unique spectral fingerprint for every compound [34].
For gas-phase molecules, rotational transitions superimpose fine structure on vibrational bands, resulting in rovibrational spectra characterized by P-branches (ΔJ = -1), Q-branches (ΔJ = 0), and R-branches (ΔJ = +1), where J represents the rotational quantum number [15]. The precise wavenumber of transitions depends on molecular rotational constants (B′, B″) for excited and ground vibrational states, respectively, enabling determination of molecular parameters such as bond lengths [15].
Evolution of FT-IR Instrumentation
From Michelson to Modern Interferometers
The journey from Michelson's original design to contemporary FT-IR instruments has involved numerous refinements while maintaining the fundamental interferometric principle. Early commercial FT-IR systems faced significant challenges, including the need for precise mirror movement, computational requirements for Fourier transformation, and sensitivity to environmental disturbances [39]. The adoption of cube corner retroreflectors instead of flat mirrors represented an important innovation, as these components maintain beam alignment even with minor mirror tilt, enhancing mechanical stability [39].
The development of the Twyman-Green interferometer, a variant specifically designed for testing optical components, addressed some limitations of the original Michelson configuration [39]. However, Michelson himself criticized this design as unsuitable for testing large optical components due to coherence length constraints requiring a reference mirror equal in size to the test mirror [39]. Decades later, the advent of laser light sources resolved these coherence limitations, enabling the Laser Unequal Path Interferometer (LUPI) that permits economical testing of large optical components by allowing unequal path lengths in test and reference arms [39].
Table 2: Evolution of Interferometer Configurations in FT-IR
| Interferometer Type | Key Characteristics | Typical Applications |
|---|---|---|
| Classical Michelson | Basic two-arm configuration with planar mirrors | Fundamental physics experiments, educational demonstrations |
| Twyman-Green | Monochromatic point source, collimator | Testing of optical components, lens systems |
| Laser Unequal Path (LUPI) | Coherent laser source, unequal path lengths | Testing large optical components, high-precision optics |
| Modern FT-IR | Cube corner retroreflectors, laser reference, rapid-scanning | Routine analytical spectroscopy, research applications |
Key Components of Modern FT-IR Systems
Contemporary FT-IR spectrometers integrate refined versions of Michelson's original components with advanced electronic and computational systems:
Infrared Source: Modern instruments typically use electrically heated filaments that emit broadband infrared radiation (approximately 4000-400 cm⁻¹) [38]. Globar sources (silicon carbide elements) and mercury arc lamps provide stable, continuous emission across the mid-infrared region.
Interferometer: At the heart of the system, the interferometer features a beam splitter that divides incoming IR radiation, typically composed of germanium deposited on potassium bromide (KBr) or calcium fluoride (CaF₂) for optimal mid-IR performance [38]. The moving mirror assembly incorporates precision bearings and magnetic drives for smooth, controlled motion.
Detector Systems: Various detector types cater to different application needs. Pyroelectric deuterated triglycine sulfate (DTGS) detectors offer room-temperature operation for routine analysis, while photoconductive mercury cadmium telluride (MCT) detectors provide enhanced sensitivity for demanding applications but require cryogenic cooling [34].
Laser Reference: A helium-neon laser beam traverses the same interferometer path, generating a precise interference pattern that controls mirror position and triggers data acquisition at exact displacement intervals, ensuring exceptional wavenumber accuracy [39].
The following diagram illustrates the workflow from infrared source to final spectrum in a modern FT-IR instrument:
Modern FT-IR Configurations and Sampling Techniques
Sampling Accessories and Measurement Modes
Modern FT-IR spectroscopy offers multiple sampling techniques to accommodate diverse sample types and analytical requirements:
Transmission Spectroscopy: The fundamental measurement mode where IR radiation passes directly through the sample [34]. Solid samples often require grinding and mixing with potassium bromide (KBr) to form transparent pellets, while liquids can be analyzed between salt windows [34]. This technique provides excellent spectral quality but demands careful sample preparation to avoid excessive absorption (total absorbance) [34].
Attenuated Total Reflectance (ATR): Currently the most prevalent sampling method, ATR enables direct analysis of solids and liquids with minimal preparation [34]. The technique employs a high-refractive-index crystal (diamond, germanium, or zinc selenide) where IR light undergoes multiple internal reflections, generating an evanescent wave that penetrates slightly into the sample placed in contact with the crystal [34] [17]. ATR has largely superseded transmission for routine analysis due to its simplicity and non-destructive nature.
Reflectance Spectroscopy: This approach detects IR light reflected from a sample surface, particularly useful for analyzing large, opaque, or difficult-to-prepare specimens [34]. Specific techniques include:
- Specular reflection: Measures light bounced off reflective surfaces, applicable for polymer films, gemstones, and artwork analysis [34].
- Diffuse reflectance (DRIFTS): Captures scattered light from powder surfaces, valuable for analyzing soils, catalysts, and solid formulations despite more demanding sample preparation requirements [34].
- Reflection-absorption (transflectance): Directs IR light through thin samples onto reflective substrates, suitable for tissue sections and coatings [34].
Table 3: Comparison of Modern FT-IR Sampling Techniques
| Technique | Sample Preparation | Best For | Limitations |
|---|---|---|---|
| Transmission | Extensive (KBr pellets, thin sections) | Polymer films, proteins, oil-in-water samples [34] | Time-consuming preparation, destructive |
| ATR | Minimal (direct placement) | Routine analysis, high-concentration samples, fragile materials [34] [40] | Spectral differences vs. transmission (corrected by software) |
| Specular Reflection | None for large objects | Polymers, gemstones, artwork restoration [34] | Requires reflective surface |
| Diffuse Reflection (DRIFTS) | Moderate (grinding, dilution) | Powders, soils, catalysts [34] | Quantitative analysis requires careful preparation |
| Microscopy | Sectioning (if opaque) | Forensic analysis, microplastics, tissue samples [34] [17] | Small sampling area |
Advanced and Specialized FT-IR Configurations
Technological advancements have yielded specialized FT-IR configurations tailored to specific analytical challenges:
FT-IR Microscopy: Combining optical microscopy with FT-IR spectroscopy enables spatially resolved chemical analysis down to approximately 10-20μm resolution [34] [17]. This powerful approach finds application in forensic science, microplastic identification, tissue characterization, and pharmaceutical research where correlation between morphological features and chemical composition provides critical insights [34] [17].
FT-IR Imaging: Emerging as a transformative advancement, FT-IR imaging employs focal plane array (FPA) detectors to simultaneously collect thousands of spectra across a sample area, generating chemical composition maps [40]. Recent innovations include microfluidic channel integration for in-line monitoring of protein formulations during biopharmaceutical processing and multi-channel designs for high-throughput measurements that reduce experimental variability [40].
Portable and Handheld FT-IR: The development of compact, ruggedized instruments has extended FT-IR analysis from traditional laboratories to field applications [17]. These devices enable real-time screening of pharmaceutical products, on-site environmental monitoring, and in-clinic medical diagnostics, with demonstrated effectiveness in identifying active pharmaceutical ingredients and diagnosing conditions like fibromyalgia through bloodspot analysis [17].
Experimental Protocols in Modern FT-IR Research
Sample Preparation and Analysis Methodologies
ATR-FTIR Analysis of Protein Formulations (Adapted from Kazarian et al.):
Objective: In-line monitoring of protein stability during bioprocessing using ATR-FTIR spectroscopic imaging [40].
Materials:
- FT-IR spectrometer with ATR imaging capability
- Diamond ATR crystal
- Microfluidic channel system
- Protein solution (e.g., monoclonal antibodies)
- Temperature control unit
Procedure:
- Fabricate microfluidic channels compatible with the spectroscopic accessory
- Introduce IgG formulation at low pH under continuous flow conditions
- Implement temperature control using heating elements
- Collect time-series spectral data during flow and heating
- Employ multivariate analysis (PCA, PLS) to identify spectral changes indicative of protein aggregation or degradation
- Correlate spectral features with protein stability parameters
This protocol enables real-time assessment of biopharmaceutical quality during purification processes, with particular utility for analyzing high-concentration protein formulations (up to ~200 mg/mL) used in patient self-administration [40].
FT-IR Analysis of Lipid Components in Cellular Research:
Objective: Characterization of phospholipids and sphingolipids in biological samples to understand cellular responses to disease and environmental factors [17].
Materials:
- FT-IR spectrometer with ATR accessory
- Commercial lipid standards (PE, PC, PI, PS, Cer, C1P, S1P, SM)
- Biological samples (cell cultures, tissue extracts)
- Solvent evaporation system
Procedure:
- Prepare lipid extracts from human cells using standard extraction protocols
- Analyze commercial lipid standards to establish reference spectral libraries
- Apply samples to ATR crystal and acquire spectra in mid-IR region (4000-400 cm⁻¹)
- Identify distinctive infrared signatures associated with hydrocarbon chains and polar head groups
- Compare spectra from disease-affected versus healthy cells
- Interpret changes in lipid composition and structure relative to cellular functions
This methodology provides insights into lipid involvement in cellular processes including membrane formation, cell adhesion, and DNA damage response [17].
The Researcher's Toolkit: Essential Materials and Reagents
Table 4: Key Research Reagent Solutions for FT-IR Spectroscopy
| Reagent/Material | Function | Application Notes |
|---|---|---|
| Potassium Bromide (KBr) | Matrix for transmission measurements; IR-transparent | Mix with samples (~1-2% sample concentration) for pellet preparation [34] |
| ATR Crystals (Diamond, Ge, ZnSe) | Internal reflection element | Diamond: durable, chemical-resistant; Germanium: high refractive index; ZnSe: general purpose [34] |
| Solvent Standards (CCl₄, CHCl₃) | Dilution medium for liquid samples | IR-transparent in specific regions; avoid overlapping absorption with analyte [34] |
| Calibration Standards (Polystyrene) | Wavenumber accuracy verification | Thin film with characteristic peaks at 1601 cm⁻¹, 3060 cm⁻¹, etc. |
| Background Materials (KBr, Air) | Reference spectrum | Match matrix conditions for accurate background subtraction |
Applications in Pharmaceutical and Biomedical Research
FT-IR spectroscopy has become indispensable in pharmaceutical research and drug development, offering versatile solutions for multiple stages of the discovery and development pipeline. In early-stage research, FT-IR facilitates drug polymorph screening, a critical consideration since different crystalline forms can significantly alter a drug's bioavailability, stability, and processing characteristics [17]. The technique's sensitivity to molecular structure enables rapid identification of polymorphic forms through their distinctive spectral signatures.
For biopharmaceuticals, FT-IR provides valuable insights into protein structure and stability. Recent advances include monitoring monoclonal antibody formulations during chromatographic purification steps, with ATR-FTIR imaging enabling in-line measurement of IgG eluates under various pH and temperature conditions [40]. This real-time monitoring capability supports Quality by Design (QbD) principles in bioprocessing and contributes to improved Process Analytical Technology (PAT) frameworks for manufacturing consistency [40].
In clinical diagnostics, FT-IR shows emerging potential for rapid disease detection and monitoring. Portable FT-IR instruments combined with chemometric analysis have demonstrated accurate classification of fibromyalgia syndrome and related rheumatologic disorders using bloodspot samples, achieving high sensitivity and specificity (Rcv > 0.93) [17]. The technique detects subtle biochemical alterations in biofluids including blood, saliva, and urine, offering a non-invasive approach for conditions including oral cancer, kidney dysfunction, and infectious diseases [17]. The identification of specific biomarker signatures, particularly in the amide bands (protein backbone) and aromatic amino acid regions, enables disease discrimination based on molecular-level changes rather than symptomatic presentation.
Future Perspectives and Emerging Trends
The evolution of FT-IR instrumentation continues with several promising directions enhancing its analytical capabilities. The integration of quantum cascade laser (QCL) sources represents a significant advancement, offering higher brightness and spectral power density compared to conventional thermal sources [40]. This innovation improves signal-to-noise ratios and enables faster data acquisition, particularly beneficial for imaging applications and analysis of highly absorbing samples.
The ongoing development of portable and handheld FT-IR instruments expands the technique's applicability beyond traditional laboratory settings. These devices enable real-time, in-field analysis for applications including pharmaceutical screening at international mail facilities, on-site environmental monitoring, and point-of-care clinical diagnostics [17]. When combined with robust chemometric models, portable FT-IR has demonstrated remarkable accuracy in identifying active pharmaceutical ingredients and classifying medical conditions, suggesting a future where spectroscopic analysis becomes increasingly decentralized and accessible.
Advanced computational approaches, particularly machine learning and artificial intelligence, are poised to transform FT-IR data interpretation. These technologies automate spectral analysis, enhance pattern recognition capabilities, and enable prediction of material properties directly from spectral data [40]. The combination of FT-IR imaging with machine learning algorithms facilitates high-throughput screening applications in pharmaceutical development and biomedical research, where rapid assessment of multiple formulations or cellular responses accelerates the discovery process [40].
Emerging applications in toxic metal profiling demonstrate FT-IR's expanding role in environmental and food safety monitoring. While FT-IR does not directly quantify metal concentrations, it identifies functional groups involved in metal binding and detects metal-induced biochemical alterations in various matrices [41]. This capability, combined with the technique's rapid, non-destructive nature, positions FT-IR as a valuable screening tool for regulatory compliance and quality control in food production systems, complementing traditional elemental analysis techniques like ICP-MS and AAS [41].
In conclusion, FT-IR instrumentation has evolved remarkably from Michelson's original interferometer to sophisticated analytical systems that continue to expand their capabilities and applications. The fundamental connection between interferometric measurement and molecular vibrations remains central to this technology, enabling researchers across diverse fields to probe molecular structures with exceptional precision and efficiency. As innovations in source technology, detector design, and data processing continue to emerge, FT-IR spectroscopy will maintain its essential role in scientific research and industrial analysis, built upon the enduring foundation of Michelson's revolutionary invention.
Infrared (IR) spectroscopy is a fundamental analytical technique that probes the vibrational and rotational states of molecules. When infrared light interacts with a sample, its energy can be absorbed to excite molecular vibrations, provided the frequency of the light matches the natural vibrational frequency of a chemical bond and there is a net change in the dipole moment of the molecule [2]. The mid-infrared region (MIR, 4000–200 cm⁻¹) is particularly useful as it excites fundamental molecular vibrations, creating a unique "chemical fingerprint" that can be used to identify and characterize a wide range of chemical species [34] [42].
Fourier Transform Infrared (FTIR) spectroscopy has superseded traditional dispersive IR spectroscopy by using an interferometer to simultaneously collect all wavelengths of IR light, followed by a Fourier transform mathematical operation to convert the data into a conventional spectrum [34]. This process results in a faster, more accurate technique with a better signal-to-noise ratio. The core of any FTIR analysis lies in how the IR light is delivered to and collected from the sample. This guide provides an in-depth comparison of the four principal sampling techniques: Transmission, Attenuated Total Reflection (ATR), Diffuse Reflectance Infrared Fourier Transform Spectroscopy (DRIFTS), and Specular Reflection, framing them within the context of molecular vibration analysis for research and industrial applications.
Theoretical Foundation: Probing Molecular Vibrations
At the heart of IR spectroscopy is the interaction between light and the vibrational modes of molecules. A simple diatomic molecule can be modeled as two atoms connected by a spring, vibrating at a frequency dependent on the bond strength and the masses of the atoms [2]. Polyatomic molecules have more complex, multi-atom vibrations.
Types of Molecular Vibrations
The key vibrational modes detected in the mid-IR region include:
- Stretching vibrations: Symmetric and asymmetric stretching of bonds along the bond axis.
- Bending vibrations: Rocking, scissoring, wagging, and twisting motions that change the bond angle.
For a vibration to be IR-active, it must result in a change in the dipole moment of the molecule. The alternating electric field of the IR radiation interacts with the molecular dipole, and when the radiation frequency matches the vibrational frequency, energy is absorbed, increasing the amplitude of the molecular vibration [2]. The resulting spectrum plots the absorbed frequencies, providing direct information about the molecular structure and chemical bonds present in the sample.
Diagram 1: Fundamental process of infrared absorption leading to a spectrum.
Core Sampling Techniques
The method by which IR radiation is presented to the sample and the resulting signal is collected significantly impacts the quality of the spectral data, the required sample preparation, and the applicability to different sample types.
Transmission FTIR
Transmission is the original and most straightforward IR technique. IR light is directed through the sample, and the transmitted light is detected [43] [44]. The sample must be thin enough (typically <15 µm for solids) to prevent total absorption of the IR beam, which would result in poor spectral quality [34].
- Sample Preparation: Solid samples are often ground and mixed with a non-absorbing matrix like Potassium Bromide (KBr) and pressed into a pellet. Liquids may be analyzed between two IR-transparent windows (e.g., NaCl, CaF₂) to form a thin film [43] [34].
- Spectral Quality: Produces high-quality spectra with a strong signal-to-noise ratio, and there are extensive spectral libraries available for comparison [43].
Attenuated Total Reflection (ATR)
ATR has become the dominant sampling technique for most solid and liquid samples. It involves pressing the sample against a high-refractive-index crystal, known as an Internal Reflection Element (IRE) [43] [44]. The IR beam is directed into the crystal where it undergoes total internal reflection, generating an evanescent wave that protrudes a few micrometers (typically 0.5-2 µm) into the sample, attenuating at the frequencies where the sample absorbs [43] [42].
- Sample Preparation: Minimal to none. Solids and liquids are typically placed directly onto the crystal, often with a clamp to ensure good contact [43] [44].
- Spectral Quality: Spectra are highly reproducible and of high quality. However, they exhibit slight shifts in peak position and intensity compared to transmission spectra, particularly for carbonyl bands, due to optical effects related to the refractive index [43] [34]. These differences can be corrected with software.
Diffuse Reflectance (DRIFTS)
DRIFTS is an external reflection technique used for analyzing scattering samples, especially powders. Incident IR light penetrates the powder particles, is scattered in all directions, and the diffusely reflected light is collected for analysis [45] [46].
- Sample Preparation: Samples must be ground to a fine, uniform powder and are often diluted in a non-absorbing powder like KBr to increase penetration and reduce specular reflection, which can distort the spectrum [45].
- Spectral Quality: The resulting spectrum differs from a transmission spectrum and requires transformation, typically using the Kubelka-Munk function, to produce a spectrum that resembles a transmission spectrum for library matching and quantification [45].
Specular Reflection
Specular reflection involves measuring the IR light that is reflected directly off a smooth, flat sample surface, with the angle of incidence equal to the angle of reflection [45] [46]. It is particularly useful for analyzing thin films on reflective surfaces, bulk materials, and smooth polymers.
- Sample Preparation: Minimal for bulk materials; thin films require deposition on a reflective substrate.
- Spectral Quality: The raw spectra are heavily influenced by the refractive index of the sample and require mathematical processing using the Kramers-Kronig transformation (KKT) to convert them into an absorbance-like spectrum comparable to transmission data [45] [46]. A variation called reflection-absorption or "transflectance" is used for very thin samples on a reflective substrate, where the beam passes through the sample twice, and the resulting spectrum is similar to transmission without further processing [45].
Diagram 2: Fundamental optical pathways for the four primary FTIR sampling techniques.
Comparative Analysis of Sampling Techniques
The choice of sampling technique is critical and depends on factors such as sample physical state, analytical requirements, and necessary throughput.
Table 1: Comparative Overview of FTIR Sampling Techniques
| Feature | Transmission | ATR | DRIFTS | Specular Reflection |
|---|---|---|---|---|
| Principle | Light passes through the sample [43] | Evanescent wave absorption at crystal interface [43] | Light scattering from rough surfaces/powders [45] [46] | Direct reflection from smooth surfaces [45] [46] |
| Sample Types | Gases, liquids, solids (thin films/KBr pellets) [44] | Solids, liquids, pastes, gels [43] | Powders, rough solids, textiles [45] [46] | Thin films on reflective substrates, smooth surfaces, coatings [44] |
| Sample Prep | Extensive (grinding, pellet making, dilution) [34] | Minimal (direct placement on crystal) [44] | Moderate (grinding, dilution with KBr) [45] | Minimal for bulk; specific for thin films |
| Destructive? | Often (pellet preparation destroys sample) [34] | Non-destructive [43] [44] | Non-destructive | Non-destructive [46] |
| Depth of Penetration | Entire sample thickness (microns) | Shallow (0.5-2 µm) [42] | Several microns into powder | Varies with angle; can be very shallow |
| Spectral Quality | High quality, strong signal [43] | High quality, reproducible [43] | Requires Kubelka-Munk transform [45] | Requires Kramers-Kronig transform [45] |
| Primary Use | High-quality reference spectra, gases [44] | Routine analysis, qualitative ID [43] | Powder analysis, catalysts, soils [45] | Coatings, monolayer analysis, polymers [46] |
Table 2: Experimental Considerations and Data Processing
| Technique | Key Experimental Parameters | Data Processing Required | Key Advantages | Key Limitations |
|---|---|---|---|---|
| Transmission | Sample thickness, particle size in KBr, hygroscopicity of KBr [43] | Baseline correction, sometimes normalization [47] | Gold standard for spectral libraries, high-quality data [43] | Time-consuming preparation, hygroscopic KBr, difficult for strongly absorbing samples [43] |
| ATR | Crystal material (Diamond, ZnSe, Ge), applied pressure for solids [43] [44] | ATR correction (software) to mimic transmission spectrum [34] | Minimal prep, rapid analysis, wide range of samples, good for aqueous solutions [43] | Slight peak shifts vs. transmission, requires good crystal contact, crystal can be damaged [43] |
| DRIFTS | Particle size, packing density, dilution ratio with KBr [45] | Kubelka-Munk transformation for quantitative analysis [45] | Excellent for difficult powders, in-situ studies possible | Intensive sample prep, spectrum sensitive to particle size/sample packing [45] |
| Specular Reflection | Angle of incidence, surface smoothness [46] | Kramers-Kronig transformation to get absorption spectrum [45] | Analysis of coatings and thin films, no contact needed | Limited to smooth, reflective surfaces; complex data processing [45] |
Experimental Protocols and Data Analysis
Detailed Methodologies
Protocol for Transmission FTIR (KBr Pellet Method for Solids) [48]
- Sample Preparation: Remove any fatty tissues, bones, or connective tissues from the sample.
- Grinding and Mixing: Precisely weigh ~500 mg of the homogenized sample and mix with 1.5 g of spectroscopic-grade KBr in an agate mortar.
- Drying: Place the mixture under a vacuum for approximately 150 minutes to remove moisture.
- Pellet Formation: Transfer ~80 mg of the dried mixture to a hydraulic press and compress at high pressure (typically 8-10 tons) for a few minutes to form a transparent pellet.
- Spectral Acquisition: Place the pellet in the FTIR spectrometer's sample holder. Collect spectra over the range of 4000–400 cm⁻¹ at a resolution of 4 cm⁻¹, averaging 100 scans for a good signal-to-noise ratio.
Protocol for ATR-FTIR Analysis of Solids [48]
- Crystal Preparation: Clean the ATR crystal (commonly diamond) with a suitable solvent and dry.
- Background Measurement: Collect a background spectrum with the clean crystal exposed.
- Sample Loading: Place a small amount of the solid sample (e.g., 10 mg of homogenized, vacuum-dried meat paste) directly onto the crystal.
- Clamping: Lower the clamping arm to apply consistent pressure, ensuring intimate contact between the sample and the crystal.
- Spectral Acquisition: Collect the sample spectrum using the same instrumental parameters as the background (e.g., 4000–400 cm⁻¹, 4 cm⁻¹ resolution, 100 scans).
Data Pre-processing and Chemometrics
Raw IR spectra are often contaminated by effects like light scattering, baseline drift, and noise, which must be corrected before interpretation [47].
- Common Pre-processing Steps [47]:
- Baseline Correction: Removes constant offset or piecewise linear/polynomial baselines arising from instrumental and scattering effects.
- Smoothing (e.g., Savitzky-Golay filter): Reduces high-frequency noise while preserving the shape of the spectral bands.
- Derivative Spectroscopy (1st or 2nd derivative): Enhances resolution of overlapping peaks and suppresses baseline effects.
- Standard Normal Variate (SNV) or Multiplicative Scatter Correction (MSC): Corrects for additive and multiplicative scattering effects.
- Data Modeling: Multivariate analysis techniques are often employed to extract meaningful information.
- Principal Component Analysis (PCA): An unsupervised method used to reduce data dimensionality, identify patterns, and detect outliers [48] [47].
- Partial Least Squares Regression (PLS-R) and Artificial Neural Networks (ANN): Supervised methods used for quantitative analysis. For instance, in meat adulteration studies, ANN models have demonstrated superiority over PLS-R with a coefficient of determination (R²) of 0.999 [48].
The Scientist's Toolkit: Essential Research Reagents and Materials
Table 3: Key Research Reagent Solutions and Materials
| Item | Function and Application |
|---|---|
| Potassium Bromide (KBr) | A non-absorbing matrix used for preparing solid samples in Transmission and DRIFTS. It is pressed into pellets that are transparent to IR light [43] [48]. |
| ATR Crystals (Diamond, ZnSe, Ge) | High-refractive-index Internal Reflection Elements (IREs). Diamond is robust and chemically inert, ZnSe is for routine analysis, and Germanium is for high refractive index samples or surface studies due to its shallow depth of penetration [43] [44]. |
| IR-Transparent Windows (NaCl, CaF₂) | Used to hold liquid samples or make thin solid films for transmission. CaF₂ is water-tolerant, while NaCl windows are fogged by aqueous samples [43]. |
| Hydraulic Press | Essential for producing uniform, transparent KBr pellets for transmission measurements by applying high pressure [48]. |
| Chemometric Software | Software packages (often integrating with MATLAB or Python) for performing essential pre-processing (SNV, MSC, derivatives) and multivariate data modeling (PCA, PLS-R, ANN) to interpret complex spectral data [48] [47]. |
The selection of an appropriate FTIR sampling technique is a critical step that directly influences the quality and interpretability of vibrational data. While Transmission FTIR remains the benchmark for high-quality reference spectra, ATR has become the workhorse for most routine analyses due to its minimal sample preparation and versatility. DRIFTS is the preferred method for analyzing powdered materials, whereas Specular Reflection is indispensable for studying smooth surfaces, thin films, and coatings.
Understanding the underlying principles of molecular vibrations and rotations allows researchers to not only operate these techniques but also to critically interpret the resulting spectral data. As FTIR technology continues to evolve, its integration with advanced chemometric models and hybrid analytical systems is pushing the boundaries of sensitivity and specificity, solidifying its role as an indispensable tool in modern chemical analysis, quality control, and research [41] [42].
The principles of molecular vibrations and rotations form the cornerstone of modern spectroscopic techniques used for pharmaceutical quality control. When molecules interact with infrared light, their chemical bonds undergo characteristic stretching and bending motions, absorbing energy at specific frequencies unique to their molecular structure and environment [33]. This fundamental relationship is described by the harmonic oscillator model, where the vibrational frequency is a function of the bond force constant (k) and the reduced mass (μ) of the atoms involved, expressed as W = (1/2πc)√(k/μ) where W is the wavenumber of absorption, c is the speed of light, k is the force constant, and μ is the reduced mass [33].
In the pharmaceutical industry, this molecular fingerprinting capability is harnessed through two primary techniques: Fourier Transform Near-Infrared (FT-NIR) and Mid-Infrared (IR) spectroscopy. NIR spectroscopy measures overtones and combination bands of fundamental vibrations from the mid-infrared region, making it particularly sensitive to both chemical composition and physical properties [49] [50]. These techniques have become indispensable for raw material verification and process monitoring, providing rapid, non-destructive analysis while meeting stringent regulatory requirements [49] [51] [52].
Theoretical Framework: Molecular Vibrations and Spectral Interpretation
Fundamental Vibration-Rotation Interactions
The information contained within an infrared spectrum extends beyond simple identification, providing insights into molecular concentration, condition, and intermolecular interactions. As defined by Beer's Law (A = εlc), absorbance (A) is proportional to concentration (c), pathlength (l), and the absorptivity (ε) [33]. This absorptivity is matrix-sensitive, changing with temperature, pressure, concentration, and sample composition, which means peak heights and positions can vary with the sample's chemical environment [33].
The analysis of pyrazole demonstrates how high-resolution infrared spectroscopy reveals complex vibration-rotation interactions. The gas-phase rotational spectrum from 85 to 750 GHz and high-resolution infrared spectrum show distinct patterns for the ground state and vibrationally excited states lying below 1300 cm⁻¹ [53]. For pyrazole, the four lowest-energy fundamental states (ν₂₁, ν₂₀, ν₁₉, and ν₁₈) are sufficiently separated in energy to be treated by single-state Hamiltonians, while higher-energy states (ν₁₇, ν₁₆, ν₁₅, and ν₁₄) form a Coriolis-coupled tetrad requiring a four-state model with six Coriolis interactions [53]. This detailed understanding of molecular vibrations enables precise predictions of spectroscopic behavior essential for method development.
Spectral Interpretation and Band Assignments
Infrared spectra contain three critical pieces of information: peak positions, peak heights, and peak widths [33]. While peak positions indicate specific functional groups, the width and shape of absorption bands provide additional structural information. For example, O-H and N-H stretches both appear around 3350 cm⁻¹, but O-H stretching peaks are significantly broader (approximately 1000 cm⁻¹ wide) compared to N-H stretches (approximately 200 cm⁻¹ wide) due to differences in hydrogen bonding strength [33].
Table 1: Characteristic Infrared Absorption Frequencies for Common Functional Groups [54] [55]
| Frequency Range (cm⁻¹) | Intensity | Bond | Functional Group |
|---|---|---|---|
| 3550-3200 | strong, broad | O-H stretch | alcohols (intermolecular bonded) |
| 3500-3400 | medium | N-H stretch | primary amines |
| 3100-3000 | medium | =C-H stretch | alkenes, aromatics |
| 3000-2840 | medium | C-H stretch | alkanes |
| 1760-1665 | strong | C=O stretch | carbonyls (general) |
| 1750-1735 | strong | C=O stretch | esters, saturated aliphatic |
| 1725-1705 | strong | C=O stretch | aliphatic ketones |
| 1720-1706 | strong | C=O stretch | carboxylic acids (dimer) |
| 1650-1580 | medium | N-H bend | primary amines |
| 1600-1585 | medium | C=C stretch (in-ring) | aromatics |
| 1470-1450 | medium | C-H bend | alkanes |
| 1360-1290 | medium | N-O symmetric stretch | nitro compounds |
| 1320-1000 | strong | C-O stretch | alcohols, carboxylic acids, esters, ethers |
| 1000-650 | strong | =C-H bend | alkenes |
| 900-675 | strong | C-H "oop" | aromatics |
Experimental Methodologies for Raw Material Verification
FT-NIR Spectroscopy for Raw Material Identification
Fourier Transform Near-Infrared (FT-NIR) spectroscopy has become a well-established tool for raw material identification in pharmaceutical quality control [49] [50]. The experimental workflow typically involves presenting the sample in a disposable glass vial or Petri dish placed on an NIR reflectance module, with spectra collected across the NIR range (4000-10000 cm⁻¹) [49]. This approach requires no sample preparation or dilution, and measurements can be performed directly through glass vials, making it ideal for rapid analysis in regulated environments [49].
For material identification, the acquired spectrum is compared against a library of reference spectra using algorithms that measure spectral correlation. A perfect match returns a score of 1, while no correlation yields a score of 0 [49]. Pass-fail thresholds are typically set with correlation values around 0.98 and discrimination values of approximately 0.05 to ensure correct material identification without false positives [49]. Mathematical filters are applied to minimize contributions from sampling errors, varying baselines, and non-uniform noise distribution, thereby enhancing material-specific spectral features [49].
Figure 1: FT-NIR Raw Material Verification Workflow
Advanced Algorithmic Approaches
When analyzing chemically similar materials or different grades of the same excipient, more sophisticated chemometric approaches are required. The Soft Independent Modeling of Class Analogies (SIMCA) algorithm creates principal component models that account for variation within reference spectra for a given material while maximizing separation between different materials [49]. This approach is particularly valuable for distinguishing between different physical forms of the same chemical compound.
In one demonstrated application, SIMCA successfully separated seven different grades of Avicel (microcrystalline cellulose) that differed only in particle size and moisture content [49]. While the COMPARE algorithm correctly identified all materials as Avicel, it could not discriminate between grades, whereas SIMCA showed clear separation in the principal component scores plot with no overlaps between grades [49]. This capability is crucial for pharmaceutical manufacturing where particle size variations can significantly impact flow properties, compression behavior, and final product quality.
Mid-IR Spectroscopy with ATR Technology
Mid-IR spectroscopy utilizing Attenuated Total Reflectance (ATR) technology offers another powerful approach for raw material verification [52]. The experimental protocol involves placing a small amount of sample (a few milligrams for solids or a single drop for liquids) directly onto the ATR crystal, with analysis typically completed within 2-3 minutes [52]. The instrument scans the mid-infrared range (4000-400 cm⁻¹), recording absorption peaks that correspond to specific molecular vibrations [52].
The acquired spectrum is then compared to reference libraries, with advanced matching algorithms requiring at least 90% similarity for confirmation [52]. Many quality control laboratories maintain custom reference libraries built using authenticated raw materials analyzed under consistent conditions with the same instruments, providing more reliable matching than commercial databases [52]. For contaminant detection, spectral subtraction techniques compare the test spectrum to a pure reference spectrum, with any extra or shifted peaks indicating potential contamination or substitution [52].
Quality Control Applications in Pharmaceutical Manufacturing
Raw Material Verification and Qualification
Infrared spectroscopy serves as the first line of defense in pharmaceutical quality control by ensuring the identity and purity of incoming raw materials. This process is essential for compliance with USP (United States Pharmacopeia) standards and other regulatory requirements [52]. Beyond simple identification, IR spectroscopy can detect subtle differences in molecular structure that impact drug performance, such as polymorphic forms of active pharmaceutical ingredients (APIs) [52].
The power of NIR spectroscopy to qualify materials for manufacturing suitability is demonstrated in its ability to detect physical property variations that affect process performance. In one case, NIR spectra revealed significant differences between API batches from a traditional European source and a new Asian supplier [50]. The Asian sample showed both smaller particle size and less defined peaks in the second derivative spectra, suggesting polymorphic changes [50]. These physical differences resulted in poor blending performance and content uniformity issues in the final product, highlighting how raw material quality verification extends beyond chemical identity to physical characteristics critical to manufacturing success [50].
Table 2: Discrimination Capabilities of IR Spectroscopy for Pharmaceutical Raw Materials
| Analysis Type | Spectral Technique | Algorithm | Key Measurable Parameters |
|---|---|---|---|
| Chemical Identity | FT-NIR / Mid-IR | COMPARE / Correlation | Functional group presence, Molecular structure |
| Polymorph Detection | FT-NIR | SIMCA / Principal Components | Crystal structure, Hydration state |
| Particle Size Variation | FT-NIR Reflectance | Spectral Distance Matching | Light scattering, Baseline shift |
| Moisture Content | NIR / Mid-IR | Quantitative Calibration | O-H absorption bands |
| Counterfeit Detection | Mid-IR ATR | Library Search | Adulterants, Impurity peaks |
| Supplier Verification | FT-NIR | SIMCA | Batch-to-batch consistency |
Process Analytical Technology (PAT) and Continuous Manufacturing
Near-infrared spectroscopy has gained a pivotal role in Process Analytical Technology (PAT), optimizing manufacturing processes and ensuring consistent product quality for real-time release [51]. The remarkable versatility of NIR spectroscopy enables both qualitative and quantitative analysis across various pharmaceutical unit operations, including granulation, drying, tableting, and coating [51].
The application of NIR as a PAT tool begins with raw material quality assurance but extends throughout the manufacturing process. With the advent of portable NIR instruments, real-time monitoring of continuous manufacturing processes becomes feasible, allowing for immediate corrective actions when deviations from quality specifications are detected [51]. This continuous quality assurance approach represents a significant advancement over traditional end-product testing, building quality into the manufacturing process rather than merely testing for it after completion.
Research Reagent Solutions and Essential Materials
Table 3: Essential Research Materials for Pharmaceutical IR Spectroscopy
| Item | Function / Application | Technical Specifications |
|---|---|---|
| FT-NIR Spectrometer | Primary instrument for raw material identification | Spectral range: 4000-10000 cm⁻¹, Resolution: 4-16 cm⁻¹, NIR reflectance module |
| ATR-FTIR Spectrometer | Mid-IR analysis of raw materials | ATR crystal (diamond, ZnSe, or Ge), Spectral range: 4000-400 cm⁻¹ |
| Certified Reference Materials | Library development and method validation | USP/EP grade APIs and excipients with certificates of analysis |
| Disposable Glass Vials | Sample presentation for FT-NIR | Clear glass, consistent thickness for reproducible reflectance measurements |
| Microcrystalline Cellulose | Method development excipient | Various particle sizes (50-180μ) for discrimination studies |
| Spectral Library Software | Material identification and verification | COMPARE, SIMCA, and Search algorithms with database management |
| Validation Samples | Method performance verification | Povidone, Avicel, calcium ascorbate, HPMC, magnesium stearate |
| Pharmaceutical Spectral Databases | Unknown identification | Commercial libraries (e.g., 1300+ spectra of excipients and APIs) |
Method Validation and Data Integrity
Reference Library Development and Validation
Building a reliable spectral library begins with authenticated samples analyzed under conditions that match routine testing protocols [52]. Documentation of key parameters—including sample preparation, instrument settings, and environmental factors—ensures traceability and regulatory compliance [52]. For robust method development, the number of reference batches should reflect the analysis complexity: typically 3-5 batches for simple identification purposes, expanding to 10-30 batches for quality checking that includes physical property discrimination [50].
Instrument performance verification and regular calibration are essential for maintaining spectral integrity over time [52]. Variations in sample presentation, particularly for powdered materials, can introduce significant spectral artifacts, which is why disposable glass vials provide more reproducible results than fiber optic probes that may compress samples inconsistently [50]. Environmental factors such as temperature and humidity must be controlled, as they can affect both the sample and instrument performance, particularly for hygroscopic materials where moisture interference can obscure important spectral features [52].
Limitations and Complementary Techniques
While infrared spectroscopy offers numerous advantages for pharmaceutical quality control, understanding its limitations is crucial for appropriate method application. IR spectroscopy faces challenges with complex mixtures where overlapping peaks from multiple compounds can obscure individual components [52]. Dark-colored materials or those containing metals (e.g., carbon black, iron oxides) may produce saturated, uninformative spectra due to excessive absorption or scattering [52].
Water interference presents another common challenge, as its broad absorption bands in the 3200-3600 cm⁻¹ range can mask important functional group peaks [52]. Additionally, IR spectroscopy has limited sensitivity for trace impurities, typically detecting contaminants only at concentrations above 1-5%, necessitating complementary techniques like chromatography for parts-per-million detection levels [52]. These limitations underscore the importance of method validation and the potential need for orthogonal techniques to address specific analytical challenges.
Figure 2: PAT Implementation Strategy for Quality Control
Infrared spectroscopy, grounded in the fundamental principles of molecular vibrations and rotations, provides pharmaceutical manufacturers with powerful tools for ensuring raw material quality and process consistency. From the theoretical relationship between molecular structure and absorption frequencies to practical implementation in quality control laboratories, these techniques deliver rapid, non-destructive analysis while meeting rigorous regulatory standards.
The continuing evolution of IR spectroscopic applications—from simple identity verification to comprehensive quality qualification—supports the pharmaceutical industry's transition toward Quality by Design and real-time release. As molecular vibration research advances, further enhancements in spectral interpretation, chemometric modeling, and portable instrumentation will expand the role of infrared spectroscopy in pharmaceutical quality assurance, ultimately ensuring the production of safer, more effective medicines for patients worldwide.
The analysis of protein secondary structure is a cornerstone of molecular biophysics, essential for understanding biological function, stability, and molecular mechanisms in health and disease. At the heart of many analytical techniques lie the fundamental principles of molecular vibrations and rotations, particularly as probed by infrared (IR) spectroscopy. The polypeptide backbone of proteins gives rise to characteristic vibrational modes, with the amide I band (approximately 1600–1700 cm⁻¹) being most prominent. This band, primarily arising from C=O stretching vibrations of the peptide backbone, is exquisitely sensitive to secondary structure due to differences in hydrogen bonding and dihedral angles [56] [57]. The precise frequency and line shape of this absorption provide a spectroscopic fingerprint that can be deconvoluted to quantify α-helix, β-sheet, turn, and random coil components within a protein's architecture.
Recent technological advancements have significantly enhanced our ability to probe these molecular vibrations with greater sensitivity, resolution, and under biologically relevant conditions. This guide details these modern methodologies—Microfluidic Modulation Spectroscopy (MMS), advanced Circular Dichroism (CD) spectroscopy via the BeStSel algorithm, hyperspectral Stimulated Raman Scattering (SRS) microscopy, and Fourier-Transform IR (FT-IR) spectroscopy—providing a comprehensive technical resource for researchers requiring quantitative analysis of protein secondary structure and its conformational transitions.
Core Analytical Techniques and Principles
Microfluidic Modulation Spectroscopy (MMS)
Microfluidic Modulation Spectroscopy (MMS) represents a significant leap in label-free IR spectroscopy for analyzing proteins in their native aqueous solutions. Traditional FT-IR is hampered by strong water absorption, often necessitating deuterated solvents that can alter protein behavior. MMS overcomes this by employing an alternating-flow design that rapidly switches between protein sample and a matched buffer reference flowing through a microfluidic chamber. This real-time subtraction cancels out the intense solvent background, yielding a clear, high-fidelity amide I spectrum directly in H₂O with microliter-volume samples and sub-minute acquisition times [56].
The quantum-cascade laser light source in MMS provides high brightness, enabling the detection of subtle structural shifts often missed by conventional IR or Circular Dichroism (CD). The resulting amide I spectrum can be decomposed to quantify secondary structure components, as the vibrational frequencies of the peptide bond are directly correlated with specific structural motifs: α-helices (~1650–1658 cm⁻¹), β-sheets (~1620–1640 cm⁻¹), and turns/unordered structures (~1660–1680 cm⁻¹) [56] [58].
Advanced Circular Dichroism (CD) with BeStSel Analysis
Circular Dichroism (CD) spectroscopy in the far-UV region (190–250 nm) measures differential absorption of left- and right-handed circularly polarized light by chiral elements in the protein backbone, providing insights into secondary structure. The BeStSel (Beta Structure Selection) web server addresses a long-standing challenge in protein CD spectroscopy: the significant spectral variability of β-structures. It distinguishes eight secondary structure components: regular α-helix (Helix1), distorted α-helix (Helix2), parallel β-sheet, and three sub-classes of antiparallel β-sheets based on their twist (left-twisted Anti1, relaxed Anti2, and right-twisted Anti3), plus turns and "other" structures [59].
Instead of using fixed basis spectra, BeStSel employs optimized "basis matrices" that handle spectral contributions based on the protein's location in the secondary structure space, improving accuracy. Furthermore, it can predict protein folds according to the CATH classification by identifying structures with similar secondary structure compositions in a pre-computed database of single-domain proteins [59].
Hyperspectral Stimulated Raman Scattering (SRS) Microscopy
While IR spectroscopy relies on absorption, Stimulated Raman Scattering (SRS) microscopy is a label-free optical technique that probes molecular vibrations based on inelastic scattering. It offers high spatial resolution (sub-micron) and is fully compatible with aqueous environments, as water exhibits a weak Raman scattering background. Hyperspectral SRS imaging across the amide I region (1600–1700 cm⁻¹) allows for in situ quantification and visualization of secondary structure distribution within complex samples, such as protein condensates or cellular aggregates [60].
Characteristic Raman shifts have been consistently identified for four key structural elements: random coil (1635–1650 cm⁻¹), α-helix (1654–1662 cm⁻¹), β-sheet (1665–1676 cm⁻¹), and extended structure (1680–1689 cm⁻¹). A linear unmixing algorithm applied to images acquired at five strategic wavenumbers enables the quantitative mapping of these structures with an uncertainty of <5% [60].
Fourier-Transform IR (FT-IR) Spectroscopy
FT-IR is a well-established workhorse for protein structural analysis. The amide I band is most commonly used, but other regions like the amide VI band (590–490 cm⁻¹) can also provide rich structural information. The amide VI band arises from out-of-plane bending vibrations and can be used to track conformational changes. To resolve overlapping bands in the primary absorption spectrum, the second derivative is routinely employed. This mathematical transformation sharpens the spectral features, allowing for the identification of constituent peaks corresponding to different secondary structures. Subsequent curve-fitting analysis (using Lorentzian/Gaussian functions) of the original spectrum, guided by the second-derivative peak positions, enables quantitative estimation of the area percentage belonging to each structural type [57].
Table 1: Core Techniques for Secondary Structure Quantification
| Technique | Probed Signal | Key Advantag es | Typical Sample Volume | Spatial Resolution | Primary Output |
|---|---|---|---|---|---|
| Microfluidic Modulation Spectroscopy (MMS) | IR Absorption (Amide I) | Excellent for aqueous solutions, high sensitivity, rapid | Microliters | N/A (Bulk measurement) | Secondary structure fractions |
| Circular Dichroism (BeStSel) | Differential UV Absorption | Detailed β-sheet analysis, fold prediction, stability studies | 10s of microliters | N/A (Bulk measurement) | 8 secondary structure components, fold classification |
| Hyperspectral SRS Microscopy | Raman Scattering (Amide I) | Label-free in situ imaging, high spatial resolution | N/A (Imaging) | Sub-micron | Spatially resolved secondary structure maps |
| FT-IR Spectroscopy | IR Absorption (Amide I-VII) | Wide applicability, various physical states of sample | Microliters (solns) to mg (solids) | N/A (Bulk measurement) | Secondary structure fractions |
Experimental Protocols for Key Techniques
Protein Stability Analysis via CD Thermal Denaturation
CD spectroscopy is ideal for monitoring protein unfolding transitions as a function of temperature. The BeStSel server includes a module for calculating protein stability from such thermal denaturation profiles [59].
Detailed Protocol:
- Sample Preparation: Prepare a protein solution in a desired buffer (e.g., 20 mM phosphate buffer, pH 7.0) with a concentration that gives a high-quality CD signal in the far-UV region (typically 0.1–0.5 mg/mL). Filter the solution (0.22 µm) and degas to avoid bubble formation during heating.
- Data Collection: Using a CD spectropolarimeter equipped with a Peltier temperature controller:
- Place the sample in a quartz cuvette with a path length of 0.1 cm or 1.0 cm.
- Set the instrument to monitor the CD signal at a single wavelength sensitive to structural changes (e.g., 222 nm for α-helical proteins or 218 nm for β-sheet proteins).
- Equilibrate the sample at a starting low temperature (e.g., 20°C).
- Ramp the temperature at a constant, slow rate (e.g., 1°C/min) while continuously recording the CD signal.
- Continue heating until the protein is fully unfolded (e.g., 95°C).
- Data Analysis in BeStSel:
- The software analyzes the resulting sigmoidal denaturation curve.
- It fits the pre- and post-transition baselines and the transition region to determine the midpoint of denaturation (melting temperature, Tₘ) and the Gibbs free energy of unfolding (ΔG) using standard thermodynamic models.
Secondary Structure Analysis of Intrinsically Disordered Proteins (IDPs) via MMS
MMS is particularly powerful for studying IDPs, which exhibit dynamic structural ensembles and are challenging for classical high-resolution methods.
Detailed Protocol:
- Protein Preparation and Quantification:
- Purify the protein of interest (e.g., Tau protein). For IDPs, a heat treatment step (e.g., 85–95°C for 30 minutes) can be used to eliminate contaminants [56].
- Determine protein concentration spectrophotometrically using the Edelhoch method. Denature an aliquot in 6 M guanidinium hydrochloride and measure absorbance at 280 nm. Calculate concentration using the Beer-Lambert law with the protein's extinction coefficient [56].
- Dilute the protein to the working concentration (e.g., 0.1 mg/mL for IDPs like Tau) in the desired aqueous buffer.
- MMS Measurement:
- Load the protein sample and an exact matched buffer blank into the MMS instrument (e.g., AuroraTX).
- The microfluidic system automatically alternates the flow of sample and buffer through the detection chamber.
- Set the instrument to acquire spectra over the amide I region (e.g., 1600–1700 cm⁻¹) with a sufficient number of modulation cycles to achieve a high signal-to-noise ratio (typically sub-minute acquisition).
- Spectral Deconvolution:
- The instrument software outputs a solvent-subtracted amide I spectrum.
- This spectrum is analyzed by a built-in algorithm that deconvolutes the band into its secondary structure components (α-helix, β-sheet, turn, unordered) based on reference spectra, providing quantitative fractions for each.
In Situ Structural Imaging of Protein Condensates via Hyperspectral SRS
This protocol enables direct visualization of secondary structure within biomolecular condensates, a context where traditional structural biology methods fail.
Detailed Protocol:
- Sample Preparation for In Vitro Condensates:
- Dilute the protein of interest (e.g., FUS, ATXN2) into a phase-separation buffer (e.g., containing crowding agents like PEG).
- Incubate the mixture on a coverslip to allow for condensate formation.
- Hyperspectral SRS Data Acquisition:
- Use a hyperspectral SRS microscope equipped with a tunable laser source.
- Acquire SRS images of the protein condensates at five key wavenumbers: 1638 cm⁻¹ (random coil), 1657 cm⁻¹ (α-helix), 1672 cm⁻¹ (β-sheet), 1689 cm⁻¹ (extended structure), and 1730 cm⁻¹ (water reference/O-H bending) [60].
- Linear Unmixing and Quantitative Imaging:
- Apply a linear unmixing algorithm using a pre-determined five-by-five mixing matrix (P₅ₓ₅) that incorporates the characteristic Raman spectra of the four secondary structures and water.
- This process generates quantitative, pseudo-colored images for each secondary structure type.
- The percentage of each structure in a region of interest is calculated by dividing the average intensity in its specific image by the sum of the average intensities from all four structural images [60].
Data Presentation and Comparative Analysis
Quantitative Comparison of Technique Performance
Table 2: Secondary Structure Quantification Accuracy Across Techniques
| Protein / System | Technique Used | α-Helix (%) | β-Sheet (%) | Turn/Unordered (%) | Validation / Reference Method |
|---|---|---|---|---|---|
| Bovine Serum Albumin (BSA) | MMS [56] | High content reported | Low content reported | - | Agreement with X-ray reference (<2.5 Å) |
| Lysozyme Fibril | Hyperspectral SRS [60] | Drastic reduction | ~60% increase | Corresponding reduction | Consistent with amyloid fibril structure |
| Ovalbumin (OV) at pH 7 | Hyperspectral SRS [60] | 32 | 27 | 41 (Turn+RC+Ext) | Consistent with known mixed α/β structure |
| Ovalbumin + Xylitol at pH 2 | FT-IR (Amide VI) [57] | Decrease | Increase (vs. α) | - | Ultrasonic and viscosity data |
| Tau protein (pH 7 → pH 2.5/10) | MMS [56] | Decrease | - | Increase | Detection of charge-mediated destabilization |
| Hyperphosphorylated Tau (monomer → aggregate) | MMS [56] | Decrease | Dramatic gain | Loss | Confirmation of amyloid formation |
Visualizing Experimental Workflows and Data Analysis
The following diagrams illustrate the logical flow and key relationships in the primary techniques discussed.
Diagram 1: MMS workflow for label-free solution analysis.
Diagram 2: SRS imaging for spatial structure mapping.
The Scientist's Toolkit: Essential Research Reagents and Materials
Table 3: Key Reagent Solutions for Protein Structure Analysis
| Reagent / Material | Function / Application | Example Use Case |
|---|---|---|
| Phosphate Buffers (various pH) | Provide a stable ionic environment for proteins; pH variation probes charge-dependent stability. | Studying pH-driven conformational changes in ovalbumin [57] and Tau protein [56]. |
| Xylitol (Cosolvent) | A polyhydric alcohol that modulates protein-solvent interactions, often stabilizing structures via preferential exclusion. | Investigating cosolvent-driven α-helix to β-sheet transitions in ovalbumin [57]. |
| Guanidinium Hydrochloride (GdnHCl) | A strong denaturant used to unfold proteins completely; essential for accurate concentration determination via the Edelhoch method. | Denaturing proteins like Tau for accurate UV concentration measurement before MMS analysis [56]. |
| Heparin Sepharose | An affinity chromatography resin used for the purification of specific proteins, such as Tau, which binds heparin. | FPLC purification of recombinant Tau protein [56]. |
| Sodium Chloride (NaCl) | Modulates ionic strength, affecting electrostatic interactions within and between proteins, influencing stability and phase separation. | Used in purification and buffer conditions for mCherry and Tau protein studies [56]. |
The precise quantification of protein secondary structure and the monitoring of conformational changes have been profoundly enhanced by techniques that leverage the fundamental molecular vibrations of the polypeptide backbone. Methods like MMS and advanced FT-IR directly probe the amide I IR absorption with unprecedented sensitivity in aqueous environments. In parallel, the BeStSel algorithm has revolutionized the analysis of CD data, providing unparalleled detail on β-sheet architecture and fold prediction. Furthermore, hyperspectral SRS microscopy has broken new ground by adding a spatial dimension, enabling the visualization of structural heterogeneity and transitions within biologically relevant contexts like phase-separated condensates and cellular aggregates.
Together, this suite of tools provides a powerful and complementary arsenal for researchers and drug development professionals. Their ability to operate under native conditions, require small sample volumes, and deliver quantitative, high-fidelity structural data makes them indispensable for validating protein therapeutics, probing the mechanisms of aggregation in neurodegenerative diseases, screening for stabilizing compounds, and fundamentally advancing our understanding of protein structure-dynamics-function relationships.
The field of advanced healthcare biomaterials has witnessed remarkable progress, particularly in surface functionalization and controlled drug delivery, which are pivotal for developing implantable medical devices and targeted therapeutic systems [61]. The permanent need to both restore and maintain human bodily functions has led to the study and development of a wide variety of natural, synthetic, or hybrid biomaterials [62]. These biomaterials are engineered to come in contact with the human body without inducing toxic reactions while delivering enhanced functionality [62].
The critical linkage between material performance and molecular structure necessitates sophisticated characterization methodologies, with infrared spectroscopy emerging as a powerful analytical tool. This technical guide frames biomaterial characterization within the context of molecular vibrations and rotations, providing researchers with the theoretical foundation and practical protocols to advance this interdisciplinary field.
Theoretical Foundation: Molecular Vibrations and Rotations in Infrared Spectroscopy
Principles of Molecular Vibrations
Covalent bonds in molecules are not rigid structures but behave more like springs, constantly in motion at room temperature as their bonds stretch, bend, and twist [14]. These complex vibrations can be broken down mathematically into individual vibrational modes, with energy levels that are quantized rather than continuous [14]. This quantization means molecules can only vibrate at specific 'allowed' frequencies, and when exposed to matching electromagnetic radiation, they absorb energy and transition to higher vibrational states.
The energy of molecular vibration is proportional to the frequency of radiation absorbed, with the infrared region of the electromagnetic spectrum (2,500 to 16,000 nm) containing frequencies corresponding to the vibrational frequencies of organic bonds [14] [24]. Photon energies in this region (1-15 kcal/mole) are insufficient to excite electrons but can induce vibrational excitation of covalently bonded atoms and groups [24].
Rotational-Vibrational Coupling
For molecules in the gas phase, rotational energy levels accompany each vibrational state, leading to rotational-vibrational (rovibrational) spectroscopy [15]. This branch of molecular spectroscopy deals with infrared and Raman spectra of molecules, where transitions involve changes in both vibrational and rotational states [15]. Since rotational energy changes are typically smaller than vibrational energy changes, they create fine structure in the vibrational spectrum, appearing as distinct P- and R-branches surrounding the central Q-branch [15].
The strength of infrared absorption depends on the number of molecules in initial vibrational and rotational states and the transition probability, which requires a periodic change in the dipole moment of the molecule—a condition known as infrared activity [14]. Generally, the greater the bond polarity, the stronger its IR absorption [14].
Characteristic Group Frequencies
The power of infrared spectroscopy in biomaterial analysis stems from the observation that different functional groups have characteristic absorption frequencies, creating identifiable spectral fingerprints [14]. Table 1 summarizes key infrared absorption ranges for functional groups commonly encountered in biomaterials.
Table 1: Characteristic Infrared Absorption Frequencies for Biomaterial Functional Groups
| Functional Group | Bond Type | Stretching Frequency Range (cm⁻¹) | Vibration Type | Intensity |
|---|---|---|---|---|
| Hydroxyl (alcohol) | O-H | 3200-3550 (H-bonded) | Stretching | Strong, broad |
| Carbonyl (ketone) | C=O | 1710-1720 (saturated) | Stretching | Very strong |
| Carbonyl (aldehyde) | C=O | 1720-1740 (saturated) | Stretching | Very strong |
| Carbonyl (ester) | C=O | 1735-1750 | Stretching | Very strong |
| Amide | C=O | 1630-1680 (Amide I) | Stretching | Very strong |
| Amine | N-H | 3300-3500 (1°-amines) | Stretching | Medium |
| Methyl | C-H | 2850-3000 | Stretching | Medium |
| Methylene | C-H | 2850-2950 | Stretching | Medium |
| Alkene | C=C | 1630-1680 | Stretching | Variable |
| Aromatic | C=C | 1600 & 1500 (ring) | Stretching | Medium-weak |
The region from 1450 to 600 cm⁻¹, known as the fingerprint region, provides unique patterns that are characteristic of entire molecules, while the group frequency region (4000-1450 cm⁻¹) contains absorptions typically due to stretching vibrations of specific diatomic units [24].
Infrared Spectroscopy in Biomaterial Surface Characterization
Surface Functionalization Techniques
Surface functionalization determines the response of the biological environment to implanted materials and is a promising solution for increasing implant success rates [62]. Various deposition mechanisms have been employed for thin films with improved physical-chemical and biological features, including solvent casting, pulsed laser deposition (PLD), matrix-assisted pulsed laser evaporation (MAPLE), 3D printing, dip-coating, and sol-gel methods [62].
Infrared spectroscopy plays a crucial role in characterizing these functionalized surfaces, verifying successful modification, quantifying functional group density, and monitoring surface stability under physiological conditions. For instance, zwitterionic coatings assisted by dopamine with metal-phenolic networks on titanium substrates have demonstrated improved biocompatibility and antibacterial properties for artificial heart implants [61]. IR spectroscopy can confirm the presence of specific functional groups in such coatings, including sulfobetaine methacrylate units responsible for antifouling properties.
Case Study: Cyclodextrin-Functionalized Breast Implants
A specific application involves the functionalization of breast implants using cyclodextrin in-situ polymerization as a local drug delivery system [61]. This approach addresses limitations and complications associated with silicone implants, such as capsular contracture formation.
The characterization protocol involves:
- Surface Analysis: FTIR spectroscopy verifies successful cyclodextrin grafting onto silicone surfaces through characteristic hydroxyl and ether bond vibrations.
- Drug Loading Confirmation: IR spectra confirm drug incorporation within cyclodextrin cavities through shifts in characteristic absorption bands.
- Release Monitoring: Time-dependent IR spectroscopy tracks drug release and surface stability in physiological conditions.
Figure 1 illustrates the relationship between molecular vibrations, surface functionalization, and biological response characterization:
Figure 1: Interrelationship between molecular vibrations, surface characterization, and biological response in functionalized biomaterials.
Advanced Infrared Techniques in Drug Delivery Systems
Controlled Release Biomaterials
Controlled drug delivery systems address limitations of conventional methods, such as fluctuating drug concentrations that lead to side effects and reduced therapeutic efficacy [61]. Biomaterials enabling controlled release must satisfy requirements of biocompatibility, non-toxicity, and appropriate capacity for bio-elimination [62].
Infrared spectroscopy provides critical insights into:
- Polymer-Drug Interactions: Shifts in characteristic bands indicate molecular-level interactions affecting drug release profiles.
- Degradation Monitoring: Changes in ester, amide, or other functional group intensities track biomaterial breakdown.
- Release Mechanism Elucidation: Time-dependent spectral changes reveal diffusion, swelling, or erosion-controlled release.
Research Applications: Hydrogel Systems
Hydrogel systems represent a promising approach for targeted cancer therapy due to their high drug-carrying capacity and controlled release capabilities [61]. These systems can deliver chemotherapeutic drugs, radionuclides, immunosuppressants, hyperthermia agents, and phototherapeutic agents while responding intelligently to environmental changes [61].
IR spectroscopy characterizes:
- Cross-linking Density: Through analysis of vinyl group consumption or new bond formation.
- Stimuli-Responsiveness: Spectral changes in response to pH, temperature, or enzyme exposure.
- Drug-Polymer Compatibility: Shifts in vibrational modes indicating favorable or unfavorable interactions.
Near-Infrared (NIR) Spectroscopy Applications
Near-infrared spectroscopy (12,500-4000 cm⁻¹) investigates chemical-physical properties by measuring overtones and combinations of fundamental vibrations, particularly of functional groups like -CH, -NH, -OH, and -SH [63]. This non-destructive technique offers advantages in speed, minimal sample preparation, and suitability for online monitoring [63].
NIR applications in biomaterials include:
- Process Analytical Technology: Real-time monitoring of polymer synthesis and drug loading processes.
- Counterfeit Identification: Verification of authentic pharmaceutical products.
- Quality Control: Assessment of intermediate and final product consistency.
Table 2 compares key infrared spectroscopy techniques for biomaterial characterization:
Table 2: Infrared Spectroscopy Techniques for Biomaterial Characterization
| Technique | Spectral Range (cm⁻¹) | Information Obtained | Sample Preparation | Biomaterial Applications |
|---|---|---|---|---|
| Mid-FTIR | 4000-400 | Fundamental vibrations, functional groups | Moderate (KBr pellets, thin films) | Chemical structure verification, degradation studies |
| Near-Infrared (NIR) | 12500-4000 | Overtone and combination bands | Minimal (direct analysis possible) | Process monitoring, quality control, counterfeit detection |
| ATR-FTIR | 4000-400 | Surface-specific functional groups | Minimal (direct contact required) | Surface functionalization, protein adsorption, biofilm formation |
| Photoacoustic FTIR | 4000-400 | Bulk material characterization | Minimal (powders directly analyzed) | Drug distribution in matrices, degradation profiling |
Experimental Protocols for Biomaterial Characterization
Sample Preparation Methods
Proper sample preparation is critical for obtaining high-quality infrared spectra:
- Thin Films: Sandwiched between two polished salt plates (NaCl or KBr) for liquid samples [24].
- KBr Pellets: Solids incorporated in potassium bromide disks prepared under high pressure (1-2 mg sample per 100 mg KBr) [24].
- Mulls: Solids mixed with non-volatile liquid (e.g., Nujol) and ground to a paste smeared between salt plates [24].
- ATR (Attenuated Total Reflectance: Minimal preparation; samples placed in direct contact with crystal surface.
For biomaterials in physiological environments, specialized cells with controlled temperature and humidity capabilities enable characterization under biologically relevant conditions.
Protocol: Surface Functionalization Analysis
Objective: Verify successful surface functionalization of titanium implant with antibacterial zwitterionic coating [61].
Materials:
- Titanium substrates
- Dopamine hydrochloride
- Sulfobetaine methacrylate (SBMA)
- Copper ions (Cu²⁺)
- Buffer solutions (pH 7.4)
Procedure:
- Surface Preparation: Clean titanium substrates with sequential sonication in acetone, ethanol, and deionized water.
- Coating Application: Immerse substrates in dopamine solution (2 mg/mL in 10 mM Tris buffer, pH 8.5) with added SBMA (10 mg/mL) and Cu²⁺ (1 mM) for 24 hours.
- Rinsing: Thoroughly rinse coated substrates with deionized water to remove unbound components.
- FTIR-ATR Analysis:
- Collect background spectrum of clean ATR crystal.
- Place coated titanium substrate in contact with ATR crystal.
- Acquire spectrum with 4 cm⁻¹ resolution, 64 scans.
- Analyze for characteristic bands: carbonyl stretch (~1720 cm⁻¹), sulfonate groups (~1040 cm⁻¹, 1170 cm⁻¹).
Data Interpretation: Successful coating evidenced by appearance of sulfonate vibrations and changes in amine/ hydroxyl regions compared to unmodified titanium.
Protocol: Drug Release Monitoring from Hydrogels
Objective: Monitor vancomycin release from silk fibroin microspheres in injectable hydrogel system [61].
Materials:
- Vancomycin-loaded silk fibroin microspheres
- Injectable hydrogel precursor solution
- Phosphate buffered saline (PBS), pH 7.4
- Diffusion cells with IR-transparent windows
Procedure:
- Hydrogel Formation: Incorporate vancomycin-loaded microspheres into hydrogel matrix and crosslink.
- Release Study: Place hydrogel in diffusion cell filled with PBS maintained at 37°C.
- Time-Dependent FTIR:
- Collect spectra at predetermined time points (0, 1, 2, 4, 8, 12, 24, 48 hours).
- Monitor vancomycin-specific bands (amide I, II, III) and hydrogel matrix bands.
- Calculate drug release percentage based on calibration curve of peak areas.
- Data Analysis: Plot release profile and determine release mechanism (Fickian diffusion, anomalous transport, etc.).
Advanced Analysis: 2D correlation spectroscopy to identify sequential events in drug release process.
The Scientist's Toolkit: Essential Research Reagents and Materials
Successful biomaterial characterization requires specific reagents and analytical tools. Table 3 details essential research solutions for infrared spectroscopy characterization of functionalized biomaterials and drug delivery systems.
Table 3: Essential Research Reagents and Materials for Biomaterial Characterization
| Category | Specific Items | Function/Application | Key Characterization Parameters |
|---|---|---|---|
| Polymer Systems | Chitosan, PLGA, PLA, Silk fibroin, Alginate, Cellulose derivatives | Drug delivery matrix, surface coating | Biodegradability, biocompatibility, drug release profile [64] |
| Surface Modification Agents | Dopamine, silanes, zwitterionic compounds (SBMA), cyclodextrins | Improve biocompatibility, add functionality | Contact angle, protein adsorption, cell adhesion [61] |
| Cross-linking Agents | Glutaraldehyde, genipin, carbodiimides, UV initiators | Control hydrogel formation, modify mechanical properties | Swelling ratio, mesh size, mechanical strength |
| Spectroscopy Standards | Polystyrene film, KBr pellets, background reference materials | Instrument calibration, method validation | Signal-to-noise ratio, wavelength accuracy, resolution |
| Cell Culture Components | Fibroblasts, osteoblasts, endothelial cells, culture media | Biocompatibility assessment, functional testing | Cell viability, proliferation, differentiation, inflammatory response [61] |
| Antibacterial Testing | S. aureus, E. coli, bacterial culture media, live/dead staining | Evaluate antimicrobial efficacy | Zone of inhibition, MIC, biofilm formation [61] |
Data Interpretation and Analysis
Spectral Analysis Workflow
Interpreting infrared spectra of biomaterials requires a systematic approach:
- Quality Assessment: Verify acceptable signal-to-noise ratio, proper baselines, and absence of saturation artifacts.
- Major Band Identification: Locate and assign strongest absorptions to specific functional groups.
- Fingerprint Region Analysis: Examine 1500-500 cm⁻¹ region for unique pattern matching.
- Spectral Subtraction: Remove contributions from solvents or known components when applicable.
- Quantitative Analysis: Measure peak areas/heights for concentration determination using established calibration curves.
Figure 2 illustrates the decision pathway for interpreting infrared spectra of functionalized biomaterials:
Figure 2: Decision pathway for systematic interpretation of infrared spectra of functionalized biomaterials.
Multivariate Analysis for Complex Systems
For complex biomaterial systems, multivariate statistical methods enhance information extraction from spectral data:
- Principal Component Analysis (PCA): Identifies patterns and groupings in spectral datasets, reducing dimensionality while preserving relevant information [63].
- Partial Least Squares (PLS) Regression: Correlates spectral features with material properties for quantitative prediction.
- Hierarchical Cluster Analysis (HCA): Groups similar samples based on spectral similarities.
These techniques are particularly valuable for monitoring process consistency, classifying material types, and predicting performance properties based on spectral features.
Infrared spectroscopy, grounded in the fundamental principles of molecular vibrations and rotations, provides indispensable capabilities for characterizing advanced biomaterials for surface functionalization and drug delivery. The technique offers unique insights into molecular structure, functional group composition, dynamic processes, and structure-property relationships critical to biomaterial performance.
As the field advances toward increasingly sophisticated biomaterial systems, infrared spectroscopic methods continue to evolve, with techniques like NIR, ATR-FTIR, and hyperspectral imaging providing new dimensions of analytical capability. By integrating these characterization approaches with biological performance assessment, researchers can establish robust structure-function relationships that accelerate the development of next-generation biomaterials for healthcare applications.
The continued refinement of infrared spectroscopic methods, combined with advanced data analysis approaches, promises to further bridge the gap between basic research and clinical applications in biomaterials science, ultimately contributing to improved therapeutic outcomes for patients.
Fourier-transform infrared (FTIR) spectroscopy has emerged as a powerful analytical technique in clinical diagnostics, leveraging the fundamental principles of molecular vibrations and rotations to detect disease-specific biomarkers and metabolic profiles. When infrared radiation interacts with molecular bonds, the absorbed energy causes vibrations (stretching and bending) that generate a unique biochemical fingerprint spectrum for each sample [65]. This fingerprint contains detailed information about the molecular composition of biofluids or tissues, enabling non-invasive, rapid diagnostic testing. The technique is increasingly being applied to diagnose various conditions, including cancer, metabolic disorders, and bacterial infections, by identifying characteristic spectral pattern alterations associated with pathological states [66] [67] [65].
The clinical value of FTIR spectroscopy lies in its ability to provide a reagent-free, rapid analytical method that requires minimal sample preparation. Unlike traditional methods that often rely on specific reagents and lengthy processing times, FTIR spectroscopy can simultaneously analyze multiple biochemical components from minimal sample volumes, making it particularly suitable for screening applications and resource-limited settings [68]. The technique's capacity for high-throughput analysis combined with advanced computational methods positions it as a transformative tool in modern precision medicine and clinical diagnostics.
Fundamental Principles of FTIR Spectroscopy in Biomarker Detection
Molecular Basis of Spectral Features
Infrared spectroscopy operates on the principle that covalent molecular bonds absorb specific frequencies of infrared radiation corresponding to their natural vibrational frequencies [65]. The mid-infrared region (400-4,000 cm⁻¹) is particularly valuable for clinical diagnostics as it captures the fundamental vibrational modes of major biomolecules, including proteins, lipids, carbohydrates, and nucleic acids [67]. Each biomolecule produces characteristic absorption bands: proteins exhibit strong amide I and II bands (approximately 1650 cm⁻¹ and 1550 cm⁻¹, respectively) primarily from C=O stretching and N-H bending vibrations; lipids show C-H stretching bands (2800-3000 cm⁻¹) and carbonyl ester bands (approximately 1740 cm⁻¹); while nucleic acids display phosphate asymmetric stretching bands (approximately 1240 cm⁻¹) [66].
The resulting infrared spectrum serves as a molecular snapshot of the sample's biochemical composition. In pathological conditions, quantitative and qualitative changes in biomolecule concentration and structure manifest as spectral alterations in peak position, intensity, and shape [66]. For example, cancer-induced metabolic reprogramming may decrease lipid band intensity due to increased membrane lipid utilization for energy needs, while protein profile alterations may shift amide band positions [66]. These subtle spectral changes, often undetectable by visual inspection, can be extracted through multivariate analysis and machine learning algorithms, enabling highly sensitive and specific disease detection.
Table 1: Key Infrared Spectral Regions for Major Biomolecules in Clinical Diagnostics
| Biomolecule | Spectral Region (cm⁻¹) | Vibrational Mode Assignment | Diagnostic Significance |
|---|---|---|---|
| Proteins | 1650-1660 | Amide I (C=O stretch) | Protein secondary structure changes in disease |
| 1540-1550 | Amide II (N-H bend, C-N stretch) | Total protein content indicator | |
| Lipids | 1740-1750 | C=O stretch (esters) | Lipid metabolism disorders |
| 2800-3000 | C-H stretch (CH₂, CH₃) | Membrane fluidity alterations | |
| Nucleic Acids | 1080-1090 | PO₂⁻ symmetric stretch | Cellular proliferation markers |
| 1230-1240 | PO₂⁻ asymmetric stretch | DNA/RNA content in cancer | |
| Carbohydrates | 1020-1040 | C-O stretch | Glycogen storage diseases |
Technical Advantages in Clinical Settings
FTIR spectroscopy offers several technical advantages over conventional clinical diagnostic methods. The Fellgett (multiplex) advantage enables simultaneous measurement across the entire spectral range, significantly improving signal-to-noise ratio compared to dispersive instruments [67]. Modern FTIR spectrometers can achieve a signal-to-noise ratio (SNR) improvement of 10-fold or more by recording and averaging multiple scans (SNR ∝ √N, where N is the number of scans) [67]. This high sensitivity is crucial for detecting low-abundance biomarkers in complex biological matrices.
The minimal sample preparation required, particularly with attenuated total reflectance (ATR) accessories, allows rapid analysis of diverse sample types, including blood serum, plasma, saliva, tissue sections, and bacterial cultures [66] [67]. ATR-FTIR spectroscopy involves simply placing the sample in contact with an infrared-transparent crystal (e.g., diamond, ZnSe), enabling measurement of highly absorbing biological samples without extensive processing [67]. This simplicity facilitates high-throughput screening and reduces the potential for pre-analytical errors, making FTIR spectroscopy particularly valuable for time-sensitive diagnostic applications.
Experimental Methodologies and Workflows
Sample Preparation and Measurement Protocols
Standardized sample preparation is critical for generating reproducible, high-quality FTIR spectra in clinical applications. For biofluid analysis (serum, plasma, saliva), protocols typically involve minimal dilution or direct application of 10-50 µL aliquots onto infrared-transparent substrates followed by drying at room temperature or controlled temperature (37°C) [68] [66] [65]. For serum analysis, samples are often applied to zinc selenide substrates and dried for 60 minutes at 37°C before spectral acquisition [68]. This process creates a uniform film for transmission measurements, while ATR accessories allow direct analysis of liquid samples with minimal preparation.
For microbiological applications such as urinary tract infection (UTI) pathogen identification, bacterial cultures are grown in standard media (e.g., Trypticase Soy Yeast Extract Broth) at 37°C for 24-48 hours [69]. The volatile metabolic profile (headspace) is collected using specialized sampling apparatus involving glass syringes and TEDLAR bags, with careful water vapor suppression through cold traps (-60°C) to eliminate spectral interference from water absorption bands [69]. This approach enables detection of pathogen-specific volatile organic compounds (VOCs) that serve as metabolic fingerprints for different bacterial species.
Table 2: Essential Research Reagent Solutions for FTIR-Based Clinical Diagnostics
| Reagent/Material | Function/Application | Technical Specifications | References |
|---|---|---|---|
| Zinc Selenide (ZnSe) Substrates | Transmission measurement windows | IR-transparent, suitable for 500-4000 cm⁻¹ range | [68] |
| Diamond ATR Crystals | Attenuated total reflectance sampling | Chemically inert, durable, high refractive index | [66] [67] |
| Freeze-Dried Control Sera | Method validation and calibration | Certified for multiple biochemical parameters | [68] |
| Trypticase Soy Broth | Bacterial culture for metabolic profiling | Standardized growth medium for pathogen cultivation | [69] |
| Potassium Bromide (KBr) | Pellet preparation for solid samples | IR-transparent matrix material | [67] |
Spectral Acquisition Parameters
Optimal spectral acquisition requires careful parameter selection to balance signal quality, resolution, and measurement time. Most clinical applications utilize the mid-infrared region (4000-400 cm⁻¹) with a resolution of 4 cm⁻¹, which provides sufficient detail for biomolecule discrimination while maintaining acceptable signal-to-noise ratios [66] [65]. Typically, 32-64 scans are co-added for each measurement, significantly improving SNR through signal averaging [66] [65]. For ATR measurements, consistent pressure must be applied to ensure proper crystal contact, while transmission measurements require appropriate pathlengths to avoid saturation of strong absorption bands.
Background spectra are collected immediately before sample measurements under identical conditions (same crystal, humidity, temperature) to correct for instrument and environmental effects [66]. The entire spectral acquisition process for a single sample, including background measurement, can be completed in 2-5 minutes, making FTIR spectroscopy considerably faster than many conventional diagnostic methods such as bacterial culture (requiring 72 hours for UTI pathogens) or chromatographic techniques [69].
Data Processing and Analysis Workflow
Raw spectral data requires preprocessing to remove physical artifacts and enhance chemical information before biomarker detection. Standard preprocessing includes baseline correction to eliminate scattering effects, smoothing (e.g., Savitzky-Golay filters) to reduce high-frequency noise, and normalization (e.g., vector normalization) to correct for sample quantity variations [66] [65]. Second-derivative processing is often applied to resolve overlapping bands and identify subtle spectral features [65].
Multivariate analysis techniques are essential for extracting diagnostic information from complex spectral data. Principal Component Analysis (PCA) reduces data dimensionality while preserving maximum variance, enabling visualization of natural clustering patterns between sample groups (e.g., healthy vs. disease) [66] [65]. Supervised methods such as Partial Least Squares-Discriminant Analysis (PLS-DA) and Linear Discriminant Analysis (LDA) build classification models using known sample categories, optimizing spectral features that best differentiate between groups [66] [65]. These chemometric approaches can achieve exceptional classification accuracy, with studies reporting 100% successful discrimination of gastric cancer cases from controls using LDA applied to blood serum, plasma, and saliva spectra [66].
Key Clinical Applications
Cancer Diagnostics
FTIR spectroscopy has demonstrated remarkable potential in cancer detection through biofluid analysis. In gastric cancer diagnostics, research has identified significant spectral alterations in blood serum, plasma, and saliva between cancer patients and healthy controls [66]. These changes reflect increased energy metabolism requirements in cancer cells, manifesting as decreased lipid content (reduced C-H stretching bands at 2800-3000 cm⁻¹) and protein structure alterations (shifted amide I and II bands) [66]. Multivariate analysis of these spectral features enabled 100% discrimination of cancer cases from controls using LDA classification models [66]. The technique shows particular promise for early cancer detection when traditional methods may lack sensitivity, with spectral histopathology (SHP) emerging as a valuable complementary approach to conventional histopathology.
The diagnostic process involves acquiring mid-IR spectra from patient biofluids using ATR accessories with diamond/ZnSe crystals, typically recording 3351 scans at room temperature after nitrogen purging to eliminate atmospheric water vapor interference [66]. The resulting spectra are analyzed in the full infrared region (4000-650 cm⁻¹) or selected wavenumbers corresponding to key biomolecule vibrations, with statistical significance determined through two-sample t-tests and normality assessment using Shapiro-Wilk and Kolmogorov-Smirnov tests [66]. This objective, quantitative approach reduces interpreter variability associated with traditional pathological examination.
Metabolic and Surgical Monitoring
FTIR spectroscopy effectively monitors biochemical changes following surgical interventions such as Roux-en-Y gastric bypass (RYGB) [65]. Studies analyzing serum samples before and two months after RYGB identified significant correlations between specific spectral regions and biochemical parameters, particularly in the lipid-specific region (1796-1685 cm⁻¹) that showed strong correlation with serum triglyceride levels [65]. This application demonstrates the technique's utility for tracking metabolic improvements following bariatric surgery, including significant decreases in triglycerides, total cholesterol, and LDL cholesterol.
The experimental protocol involves pipetting 10 µL of serum onto aluminum plates, drying at room temperature for two hours, and acquiring spectra using ATR-FTIR spectrometers with diamond crystals [65]. Multivariate analysis using PLS-DA with Variable Importance in Projection (VIP) scores identified spectral regions most responsible for classifying pre- and post-surgical samples, with models typically achieving high accuracy, sensitivity, and specificity [65]. This approach enables rapid assessment of surgical outcomes and metabolic improvements without extensive biochemical testing.
Infectious Disease Diagnostics
FTIR spectroscopy offers a culture-free alternative for rapid pathogen identification, particularly for urinary tract infections (UTIs) [69]. By analyzing volatile metabolic products (VOCs) from bacterial cultures, the technique can differentiate between ten common uropathogens based on their unique metabolic fingerprints within a multidimensional metabolic space [69]. This approach significantly reduces identification time compared to conventional culture methods (24-48 hours versus 72 hours), enabling more timely targeted antibiotic therapy.
The methodology involves culturing bacterial isolates in standardized media, collecting headspace samples using specialized apparatus, and concentrating volatile metabolites while suppressing water vapor interference through cryogenic focusing [69]. The resulting VOC profiles are analyzed using FTIR spectroscopy, with numerous spectral features corresponding to distinct metabolites enabling accurate bacterial identification [69]. This platform holds potential for future development of breath-based or urine headspace diagnostics for rapid UTI pathogen identification without bacterial culture.
Table 3: Quantitative Performance of FTIR Spectroscopy in Clinical Applications
| Clinical Application | Sample Type | Analytical Method | Performance Metrics | References |
|---|---|---|---|---|
| Gastric Cancer Detection | Blood serum, plasma, saliva | LDA classification | 100% discrimination accuracy | [66] |
| Post-Bariatric Surgery Monitoring | Serum | PLS-DA with VIP scores | Significant correlation with lipid parameters (p<0.05) | [65] |
| UTI Pathogen Identification | Bacterial headspace | Metabolic fingerprinting | Unique profiles for 10 species | [69] |
| Blood Serum Analysis | Model serum solutions | Regression modeling | <0.1% error for 38 components | [68] |
Data Analysis and Chemometric Methods
Multivariate Classification Techniques
Effective analysis of FTIR spectral data for clinical diagnostics relies heavily on multivariate classification techniques that extract meaningful patterns from complex spectral datasets. Principal Component Analysis (PCA) serves as an unsupervised method for exploring natural clustering in data and identifying outliers [66] [65]. By transforming original variables into a smaller set of uncorrelated principal components that explain maximum variance, PCA reduces data dimensionality while preserving essential information for sample differentiation.
Supervised methods such as Linear Discriminant Analysis (LDA) and Partial Least Squares-Discriminant Analysis (PLS-DA) build classification models using known sample categories [66]. These techniques weight spectral features to maximize separation between predefined groups (e.g., diseased vs. healthy), creating decision boundaries for classifying new samples. PLS-DA is particularly effective for handling highly correlated variables in spectral data and provides Variable Importance in Projection (VIP) scores to identify spectral regions most responsible for class separation [65]. Typical model development involves randomly dividing data into training (70%) and test (30%) sets, with cross-validation to determine optimal model complexity and avoid overfitting [65].
Regression and Quantitative Analysis
Beyond classification, FTIR spectroscopy enables quantitative analysis of biochemical components through regression modeling. Studies using model serum solutions demonstrate the ability to simultaneously determine concentrations of 38 components with errors less than 0.1% by analyzing specific absorption band characteristics [68]. Key parameters include absorbance at 1717 cm⁻¹ and 3903 cm⁻¹, and absorption band areas at 616 cm⁻¹, 3750 cm⁻¹, and 3903 cm⁻¹ [68].
Regression models are developed by solving nonlinear problems using the generalized reduced gradient method, with weighted coefficients optimized to minimize deviation between predicted and actual concentrations [68]. The fundamental quantitative relationship follows the Beer-Lambert law, where absorption band intensity correlates with analyte concentration, though complex biological matrices require sophisticated chemometric approaches to account for overlapping spectral features and matrix effects [68]. This quantitative capability extends the utility of FTIR spectroscopy beyond disease detection to monitoring disease progression and treatment response.
Future Perspectives and Implementation Challenges
Clinical Translation and Standardization
Despite its considerable potential, several challenges remain for widespread implementation of FTIR spectroscopy in clinical diagnostics. Standardization of protocols across different instruments and laboratories is essential to ensure reproducible results [68] [67]. Variations in sample preparation, measurement parameters, and data processing can significantly impact spectral features and analytical outcomes, necessitating standardized operating procedures and reference materials for method validation [68]. Additionally, analysis of real patient samples in large-scale clinical trials is required to establish disease-specific spectral signatures and validate diagnostic accuracy before routine clinical implementation [68].
Instrument miniaturization and development of point-of-care devices represent promising directions for expanding clinical applications. Current research focuses on developing portable, user-friendly instruments that could enable rapid screening in primary care settings, emergency departments, and resource-limited environments [69] [70]. The technique's minimal reagent requirements, rapid analysis time, and capacity for multi-parameter assessment make it ideally suited for decentralized testing scenarios once technical and validation hurdles are overcome.
Integration with Other Analytical Platforms
The future of FTIR spectroscopy in clinical diagnostics likely involves integration with complementary analytical techniques to provide comprehensive diagnostic information. Combining vibrational spectroscopy with genomic, proteomic, and metabolomic approaches could enhance diagnostic specificity and provide deeper insights into disease mechanisms [66]. Furthermore, incorporating artificial intelligence and deep learning algorithms for spectral analysis may improve pattern recognition capabilities beyond traditional chemometric methods, potentially identifying subtle spectral markers invisible to conventional analysis [71].
The application of FTIR spectroscopy in therapeutic drug monitoring represents another promising direction, with studies demonstrating quantitative analysis of various pharmaceutical compounds including antibiotics, antivirals, and anti-inflammatory drugs [67]. This application could optimize dosing regimens for individualized therapy, particularly for drugs with narrow therapeutic windows. As the field advances, FTIR spectroscopy is poised to become an invaluable tool in the clinical laboratory, complementing existing methodologies and enabling new diagnostic capabilities through its unique ability to provide comprehensive molecular fingerprints rapidly and non-invasively.
The analysis of biological tissues and cells relies fundamentally on the ability to resolve structural and molecular features with high fidelity. Within infrared spectroscopy research, the core principle underpinning this capability lies in probing molecular vibrations and rotations, which provide distinctive spectroscopic fingerprints for different biochemical constituents. When combined with microscopy, these vibrational signatures enable the spatially resolved characterization of samples, creating the field of microspectroscopy. The spatial resolution of an imaging system—the minimum distance at which two distinct points can be recognized as separate—directly determines the level of morphologic heterogeneity that can be observed in cells and tissues [72]. Consequently, the relentless drive for higher spatial resolution is not merely a technical pursuit but a fundamental requirement for accurately characterizing the complex architecture of biological systems, from subcellular organelles to functional tissue units.
This technical guide examines contemporary advances in microspectroscopy and imaging technologies that are pushing the boundaries of spatial resolution. We focus specifically on methods that leverage molecular vibrations, such as infrared and Raman spectroscopy, as well as cutting-edge super-resolution fluorescence imaging techniques that provide complementary morphological context. The integration of these approaches, often enhanced by sophisticated computational algorithms, is creating unprecedented opportunities for deciphering biomolecular landscapes in situ. We present quantitative comparisons of resolution capabilities, detailed experimental methodologies, and essential reagent toolkits to provide researchers with a practical framework for selecting and implementing these technologies in biomedical research and drug development.
Core Principles: Spatial Resolution in Vibrational Microspectroscopy
In infrared and Raman microspectroscopy, spatial resolution is governed by the fundamental diffraction limit of light, which relates to the wavelength (λ) of the incident radiation and the numerical aperture (NA) of the objective lens. For conventional infrared microspectroscopy, the practical spatial resolution typically ranges from 3-20 μm, while confocal Raman microspectroscopy can achieve sub-micrometer resolution (approximately 250-500 nm laterally) due to the shorter wavelengths involved [73].
The concept of spatial resolution in infrared imaging is inseparable from contrast, which determines how effectively subtle morphological differences can be visualized [72]. The biochemical basis for this contrast stems from the characteristic vibrational energies of molecular bonds. In Fourier-transform infrared (FT-IR) spectroscopy, molecules absorb specific frequencies of infrared light corresponding to vibrational transitions between quantized energy states, with polar bonds (C=O, O-H, N-H) producing particularly strong absorptions [74]. Similarly, Raman spectroscopy probes molecular vibrations through inelastic (Stokes and anti-Stokes) scattering of light by molecules, resulting in energy shifts that correspond to molecular vibrational states [73].
Table 1: Major Raman Scattering Techniques in Biomedical Imaging
| Technique | Fundamental Principle | Spatial Resolution | Key Applications |
|---|---|---|---|
| Spontaneous Raman Scattering | Inelastic scattering causing energy shifts matching molecular vibrations | ~250-500 nm (confocal) | Label-free imaging of biological samples |
| Stimulated Raman Scattering (SRS) | Coherent process where pump and Stokes beams enhance Raman signals | ~300-500 nm | High-speed imaging of biomolecules |
| Coherent Anti-Stokes Raman Scattering (CARS) | Four-wave mixing process generating anti-Stokes signals | ~300-500 nm | Label-free live-cell imaging |
| Surface-Enhanced Raman Scattering (SERS) | Signal enhancement via plasmonic nanostructures | <100 nm | Trace detection of DNA and pathogens |
| Tip-Enhanced Raman Scattering (TERS) | Combination with scanning probe microscopy | 10-30 nm | Imaging of single DNA/RNA strands |
The information content in vibrational spectra is typically divided into specific spectral regions. The fingerprint region (600-1800 cm⁻¹) is rich in biochemical information including signatures associated with proteins, lipids, and DNA, while the high wavenumber region (2500-3800 cm⁻¹) captures molecular vibrations of lipids, proteins, and water [73]. Computational methods such as 3D-Fourier self-deconvolution (FSD) have been demonstrated to improve effective spatial resolution in infrared microspectroscopic imaging by enhancing contrast [72].
Advanced Imaging Modalities: Breaking the Resolution Barrier
Super-Resolution Fluorescence Microscopy Techniques
While vibrational spectroscopy provides inherent chemical specificity, fluorescence microscopy offers superior resolution and sensitivity for structural analysis. Recent advances have dramatically overcome the diffraction limit in deep tissue imaging. The novel Confocal² Spinning-Disk Image Scanning Microscopy (C2SD-ISM) system integrates a spinning-disk confocal microscope with a digital micromirror device (DMD) for sparse multifocal illumination and a dynamic pinhole array pixel reassignment algorithm [75]. This dual-confocal configuration achieves remarkable spatial resolution of 144 nm laterally and 351 nm axially, while maintaining an imaging depth of up to 180 μm in tissue samples—addressing the critical challenge of background interference that typically compromises fidelity in deep-tissue imaging [75].
The system's programmability enables seamless integration with structured illumination microscopy (SIM) modalities, offering exceptional versatility. Compared to computational out-of-focus removal methods, the physical elimination of out-of-focus signals by the spinning disk preserves the original intensity distribution even at increasing penetration depths [75]. Furthermore, the dynamic pinhole array pixel reassignment algorithm effectively corrects for Stokes shifts, optical aberrations, and other non-ideal conditions, achieving a linear correlation of up to 92% between original confocal and reconstructed images [75].
For large-scale tissue imaging, Multiscale Cleared Tissue Axially Swept Light-Sheet Microscopy (MCT-ASLM) bridges subcellular to tissue-level scales by combining cm-scale field of view (up to 21 mm) imaging with targeted high-resolution interrogation. This platform can achieve isotropic resolution approaching ~300 nm in targeted imaging mode, enabling detailed studies of hierarchical organization in neuronal circuits, glomerular innervation in kidneys, and metastatic tumor microenvironments [76] [77].
Diagram 1: MCT-ASLM multi-scale imaging workflow.
Expansion-Enhanced Mass Spectrometry Imaging
A groundbreaking approach to overcoming spatial resolution limitations combines physical sample expansion with mass spectrometry imaging (MSI). Tissue Expansion-enhanced Mass-spectrometry Imaging (TEMI) represents a methodological innovation that decodes biomolecular landscapes without requiring hardware modification [78]. By physically expanding tissue samples prior to analysis, TEMI effectively increases spatial resolution for label-free profiling of thousands of biomolecules, including proteins, peptides, lipids, metabolites, and glycans.
When applied to matrix-assisted laser desorption/ionization (MALDI) MSI, this technique shows potential for reaching subcellular-level spatial resolution through improved expansion factors. The integration of spatial transcriptomic profiling with TEMI further enables characterization of mechanistic relationships between gene expression and metabolic outcomes [78].
Quantitative Comparison of Spatial Resolution Across Modalities
Table 2: Spatial Resolution Capabilities of Contemporary Microspectroscopy and Imaging Platforms
| Technology | Lateral Resolution | Axial Resolution | Imaging Depth | Key Applications |
|---|---|---|---|---|
| Confocal Raman Microspectroscopy | 250-500 nm | 500-1000 nm | 10-50 μm | Spatially resolved molecular characterization of tissue sections [73] |
| C2SD-ISM | 144 nm | 351 nm | 180 μm | High-fidelity deep-tissue super-resolution imaging [75] |
| MCT-ASLM (Targeted Mode) | ~300 nm | ~300 nm | Full tissue volume (cm-scale) | Mapping neuronal circuits, tumor microenvironments [76] [77] |
| FT-IR Microspectroscopy | 3-20 μm | 5-30 μm | Thin sections | Biochemical fingerprinting of cells and tissues [72] [74] |
| TEMI (Expansion MSI) | Effective resolution dependent on expansion factor (potentially subcellular) | - | Tissue sections | High-throughput multi-omics analysis [78] |
Experimental Protocols for High-Resolution Tissue Imaging
C2SD-ISM Super-Resolution Imaging Protocol
The C2SD-ISM system implementation involves several critical steps to achieve optimal super-resolution performance in tissue imaging [75]:
System Configuration: Align the spinning disk (SD) confocal microscope on the sample conjugate plane. Ensure proper conjugation between the sample focal plane, SD pinhole array, DMD, and sCMOS sensor plane.
Illumination Optimization: Select a high-power multi-mode laser source coupled with a square homogenizing fiber to achieve speckle-free, uniform illumination well-matched to the DMD plane. Set the incidence angle to 26.3° to achieve >95% diffraction efficiency for multicolor imaging (405 nm, 488 nm, 561 nm).
DMD Pattern Generation: Design the multifocal illumination mask as a periodic lattice with each element consisting of a square aperture formed by 4×4 "ON" state DMD pixels. This creates an excitation spot size of 216 nm under a 100× objective. Shift the multifocal pattern by two DMD pixels at a time (108 nm sample plane step size) to achieve twice the diffraction-limited sampling rate.
Image Acquisition: Employ a 4:12 mask ratio (squared aperture side length to periodicity) requiring only 6×6 raw images—significantly reducing acquisition time compared to conventional MSIM. Coordinate DMD pattern switching with SD rotation and camera exposure using precise timing sequences.
Super-Resolution Reconstruction: Apply the Dynamic Pinhole Array Pixel Reassignment (DPA-PR) algorithm to raw image data. This algorithm corrects for Stokes shifts, optical aberrations, and other non-ideal conditions while reassigning pixels to reconstruct super-resolution images with minimal artifacts.
Diagram 2: C2SD-ISM optical configuration and workflow.
Confocal Raman Microspectroscopy for Tissue Analysis
The experimental workflow for spatially resolved tissue characterization using confocal Raman microspectroscopy involves [73]:
Sample Preparation: Prepare thin tissue sections (typically 5-20 μm thickness) from fresh-frozen or formalin-fixed paraffin-embedded samples on appropriate substrates (e.g., calcium fluoride or barium fluoride slides for IR compatibility).
Spectral Acquisition: Define measurement points or areas for mapping. Set laser wavelength (commonly 532 nm or 785 nm to reduce fluorescence), laser power (optimized to avoid sample damage), integration time (typically 0.1-10 seconds per spectrum), and spectral resolution (usually 2-8 cm⁻¹).
Data Pre-processing: Apply essential preprocessing steps including:
- Denoising using kernel smoothing or Savitzky-Golay differentiation
- Baseline removal with morphological weighted penalized least squares or standard normal variate correction
- Cosmic ray removal through sharp/abnormal spike detection
- Normalization by peak intensity or total spectral intensity
Spectral Analysis and Classification: Employ multivariate statistical techniques such as:
- Principal component analysis (PCA) for exploratory data analysis
- Hierarchical cluster analysis (HCA) or k-means clustering for unsupervised pattern recognition
- Linear discriminant analysis (LDA) or support vector machines (SVM) for supervised classification
- Partial least squares discriminant analysis (PLS-DA) for biomarker identification
Validation: Implement cross-validation strategies (leave-one-out or random subsets) and permutation tests to validate classification models. Generate confusion matrices and receiver operator characteristic curves to assess performance.
The Scientist's Toolkit: Essential Research Reagents and Materials
Table 3: Essential Research Reagent Solutions for Advanced Microspectroscopy
| Reagent/Material | Function | Application Notes |
|---|---|---|
| Spinning Disk with Multi-concentric Spiral Design | Physical elimination of out-of-focus signals via pinhole array | Enables full FOV coverage with uniform illumination; superior to single-spiral design [75] |
| Digital Micromirror Device (DMD) | Programmable generation of multifocal illumination patterns | Enables sparse illumination with 108 nm step size; diffraction efficiency >95% at 26.3° incidence [75] |
| Square Homogenizing Fiber | Creation of speckle-free, uniform illumination | Well-matched to DMD plane; essential for consistent multifocal pattern generation [75] |
| Internal Reflection Elements (IRE) | Attenuated Total Reflectance (ATR) elements for FT-IR | Diamond, ZnSe, or Ge crystals with 1-2 μm penetration depth; minimal sample preparation required [74] |
| Tissue Expansion Hydrogels | Physical sample expansion for enhanced resolution | Enables improved effective resolution in mass spectrometry imaging [78] |
| Plasmonic Nanostructures (Gold/Silver Nanoparticles) | Surface-enhanced Raman scattering (SERS) substrates | Signal enhancement up to 10¹¹ for trace detection of biomolecules [73] |
Computational Methods for Resolution Enhancement and Spectral Analysis
Computational approaches play an indispensable role in both enhancing effective spatial resolution and extracting meaningful information from complex spectral data. For infrared microspectroscopy, 3D-Fourier self-deconvolution (FSD) represents a proven computational procedure for improving spatial resolution by enhancing contrast in acquired data [72].
In Raman microspectroscopy, the analytical pipeline encompasses multiple computational stages [73]:
Pre-processing Algorithms: Denoising using kernel smoothing or Savitzky-Golay differentiation; baseline removal with morphological weighted penalized least squares; cosmic ray removal through spike detection; and various scaling methods including normalization and mean-centering.
Pattern Recognition: Unsupervised methods (principal component analysis, hierarchical cluster analysis, k-means) for exploratory analysis; supervised methods (linear discriminant analysis, support vector machines, neural networks) for classification; and multivariate curve resolution for quantification.
Deep Learning Applications: Convolutional neural networks (CNNs) for spectral denoising using ResUNet architecture; 1D-CNN models for classification tasks; ResNet architectures to mitigate vanishing gradient issues; and generative adversarial network-based augmentation methods for data enhancement.
The growing importance of computational approaches is further evidenced by recent efforts to create extensive datasets of Raman and infrared spectra for training next-generation models. These resources enable the development of algorithms capable of inferring substructures from spectroscopic fingerprints and predicting spectra for novel molecules [79].
The field of microspectroscopy and imaging continues to evolve rapidly, with spatial resolution remaining a central focus for technological innovation. The integration of physical background rejection strategies—as exemplified by the dual-confocal approach in C2SD-ISM—with computational resolution enhancement techniques represents a powerful paradigm for achieving high-fidelity imaging in complex tissue environments. Similarly, the combination of physical sample expansion with established analytical techniques like mass spectrometry imaging demonstrates how creative sample preparation can overcome inherent limitations of analytical instrumentation.
Future advancements will likely focus on the seamless integration of complementary imaging modalities, enabling correlative analysis that leverages the respective strengths of different technologies. The development of more sophisticated computational algorithms, particularly deep learning approaches, will further enhance our ability to extract meaningful biological insights from complex spectral and imaging data. As these technologies mature and become more accessible, they will undoubtedly transform our understanding of cellular and tissue organization in both health and disease, ultimately accelerating drug development and diagnostic applications.
Optimizing IR Spectral Quality: Sample Preparation, Data Processing, and Error Mitigation
In Fourier Transform Infrared (FT-IR) spectroscopy, the fundamental principle underpinning analysis is the absorption of infrared radiation by molecules undergoing vibrational transitions between quantized energy states [5] [74]. When IR radiation interacts with a sample, specific frequencies are absorbed that correspond to molecular bond vibrations, including stretching, bending, or twisting of chemical bonds [5]. The resulting spectrum provides a molecular fingerprint that enables identification of functional groups and elucidation of molecular structures [2] [80]. However, the quality and interpretability of this vibrational data are profoundly influenced by sample preparation techniques, with improper preparation potentially obscuring or distorting the crucial vibrational information [81] [82].
The interaction between infrared light and molecular vibrations follows strict selection rules, primarily requiring a change in the dipole moment during vibration for a mode to be IR-active [5]. Sample preparation pitfalls can disrupt the accurate measurement of these vibrational modes in several ways: excessive sample thickness can lead to complete absorption of IR light, preventing detection of meaningful spectral data; moisture contamination introduces strong O-H stretching and bending vibrations that mask analyte signals; and poor contact in techniques like Attenuated Total Reflectance (ATR) creates inconsistent path lengths, distorting band intensities [81] [83] [84]. These issues are particularly problematic because they directly impact the linear relationship between absorption and concentration described by the Beer-Lambert law, compromising both qualitative and quantitative analysis [74].
This technical guide examines three fundamental sample preparation challenges—thickness control, moisture effects, and contact issues—within the framework of molecular vibration theory, providing researchers with detailed methodologies to overcome these obstacles and obtain reliable, reproducible spectroscopic data.
Thickness Control in FT-IR Sampling
Fundamental Principles and Challenges
In transmission FT-IR spectroscopy, sample thickness directly influences the intensity of absorption bands according to the Beer-Lambert law, which states that absorbance (A) is proportional to the path length (b) and analyte concentration (c): A = εbc [5] [74]. Excessive sample thickness can lead to total absorption of IR radiation in characteristic spectral regions, resulting in saturated peaks where the detector receives insufficient light, producing flattened, uninterpretable bands [83] [74]. Conversely, excessively thin samples yield weak absorption signals that may disappear into spectral noise, particularly for minor components in a mixture [82]. The optimal absorbance range for most FT-IR measurements falls between 0.1 and 1.0 absorbance units, requiring careful thickness control to maintain linear response while preserving adequate signal intensity [74].
The challenge is compounded by the wavelength-dependent nature of absorption coefficients across the mid-IR spectrum (4000-400 cm⁻¹). A thickness that produces ideal absorbance for C-H stretching bands around 3000 cm⁻¹ might be too thin for weaker fingerprint region vibrations below 1500 cm⁻¹ [83]. This necessitates compromise settings or different preparation techniques for comprehensive spectral analysis.
Practical Thickness Control Methodologies
Table 1: Recommended Thickness Ranges for Common FT-IR Sampling Techniques
| Technique | Recommended Thickness | Optimal Absorbance Range | Primary Applications |
|---|---|---|---|
| Transmission (KBr Pellets) | 0.1-1 mm | 0.2-0.8 AU | Organic compounds, pharmaceuticals, polymers |
| Transmission (Liquid Cells) | 0.015-0.1 mm | 0.3-0.7 AU | Soluble analytes, quantitative analysis |
| ATR | Effective path: 0.5-5 µm | 0.1-1.0 AU | Solids, liquids, pastes, surface analysis |
| Thin Films | 1-50 µm | 0.2-0.9 AU | Polymer coatings, self-supporting films |
For transmission measurements with KBr pellets, the ideal pellet thickness typically falls between 0.1-1.0 mm, achieved by using 1-2 mg of sample mixed with 100-200 mg of dried KBr powder pressed at 8-12 tons of pressure for 1-5 minutes [83]. For liquid samples between NaCl or KBr plates, precise path length control is achieved using sealed cells with Teflon spacers of defined thickness (typically 0.015-0.1 mm) [83] [82]. Modern ATR accessories largely circumvent thickness issues through their limited depth of penetration (typically 0.5-5 µm at 2000-650 cm⁻¹), making them ideal for thick, strongly absorbing samples [81] [80].
The following workflow outlines a systematic approach to optimizing sample thickness:
Diagram 1: Sample Thickness Optimization Workflow
For polymer films and self-supporting solid samples, thickness can be controlled using precision spacers or micrometers during casting or compression molding. Semi-crystalline polymers particularly require uniform thickness to prevent orientation effects that can alter relative band intensities [74]. When optimal thickness cannot be achieved physically, spectral correction algorithms like baseline correction or spectral subtraction may be applied, though these introduce their own potential artifacts and should be used judiciously [85] [80].
Moisture Effects in FT-IR Analysis
Molecular Origins of Water Interference
Water molecules present significant challenges in FT-IR spectroscopy due to their strong, broad absorption bands arising from fundamental vibrational modes [85] [80]. The O-H stretching vibration produces a broad, intense band between 3700-3000 cm⁻¹, while H-O-H bending appears as a strong band around 1640 cm⁻¹ [5]. These water absorptions can overlap with crucial analyte vibrations, including amide I bands in proteins (1640-1660 cm⁻¹), O-H and N-H stretches in various functional groups (3200-3600 cm⁻¹), and C=O stretches that may appear near the water bending region [5] [80].
The interference is particularly problematic in biological samples, where water is a major component, and in hygroscopic materials like KBr or certain pharmaceuticals that readily absorb atmospheric moisture [85] [80]. The presence of water not creates overlapping absorption bands but can also induce spectral changes through hydrogen bonding, which shifts vibrational frequencies and alters band shapes [5]. In quantitative analysis, variable water content introduces uncontrolled variance that compromises calibration models and prediction accuracy [85].
Experimental Protocols for Moisture Management
Table 2: Moisture Effects and Mitigation Strategies in FT-IR Spectroscopy
| Moisture Effect | Spectral Manifestation | Impact on Analysis | Recommended Solution |
|---|---|---|---|
| Water Vapor in Atmosphere | Sharp peaks at 3900-3500 cm⁻¹ and 1900-1300 cm⁻¹ | Obscures C-H, O-H, N-H regions; interferes with quantitative analysis | Purge instrument with dry N₂ for 15-30 min pre- and during analysis |
| Water in Solvents | Broad O-H stretch (~3400 cm⁻¹), bend (~1640 cm⁻¹) | Overlaps with analyte peaks; saturates detector | Use anhydrous solvents; employ deuterated solvents when possible |
| Hygroscopic Samples | Variable water bands between runs | Reduces reproducibility; compromises quantitative results | Dry samples in desiccator or oven; use controlled humidity environment |
| Hydration State Changes | Shifts in O-H and affected bands | Alters molecular vibrations; causes band position instability | Standardize drying protocol; monitor consistency via stable reference peaks |
For solid samples, drying in a desiccator over appropriate desiccants (e.g., P₂O₅ for complete dehydration, silica gel for mild drying) or in a temperature-controlled oven (typically 55-105°C depending on sample stability) effectively reduces water content [85] [80]. For KBr pellet preparation, drying both sample and KBr powder at 105°C for several hours before pressing, followed by immediate analysis, minimizes moisture uptake [83]. Liquid samples can be treated with molecular sieves or dried over anhydrous salts, though caution is needed to prevent adsorption of analytes [82].
Instrument purging with dry, CO₂-scrubbed nitrogen gas is essential for reducing atmospheric water vapor interference. Optimal purging requires 15-30 minutes before analysis and continuous flow during measurement, with flow rates typically between 10-30 L/min depending on instrument design [74]. The effectiveness of purging can be monitored by observing the characteristic sharp rotational-vibrational water vapor lines around 3900-3500 cm⁻¹ and 1900-1300 cm⁻¹, which should significantly diminish with proper purging [74].
In ATR analysis, water interference can be particularly challenging with aqueous solutions. Using specialized liquid cells with controlled path lengths (typically 5-50 µm) prevents total absorption while allowing collection of analyte signals above the strong water background [80]. Advanced spectral processing techniques, such as subtracting a reference water spectrum or applying multivariate algorithms like Partial Least Squares (PLS) regression, can mathematically separate water contributions from analyte signals [85].
Contact Issues in ATR and Reflection Measurements
The Physics of Sample-ATR Crystal Interaction
Attenuated Total Reflectance (ATR) spectroscopy operates on the principle of total internal reflection, where an infrared beam travels through an internal reflection element (IRE) with a high refractive index (e.g., diamond, ZnSe, or Ge) and generates an evanescent wave that penetrates 0.5-5 µm into the sample in contact with the crystal [81] [80]. The depth of penetration (dₚ) is wavelength-dependent and calculated as:
[dp = \frac{\lambda}{2\pi n1\sqrt{\sin^2\theta - (n2/n1)^2}}]
Where λ is the wavelength, n₁ is the refractive index of the IRE, n₂ is the refractive index of the sample, and θ is the angle of incidence [81]. Incomplete contact between the sample and ATR crystal disrupts this evanescent wave interaction, leading to distorted band intensities, reduced signal-to-noise ratio, and erroneous relative peak heights across the spectrum [81] [84].
The contact quality is influenced by several factors, including sample hardness, surface roughness, crystal cleanliness, and applied pressure. Hard, rigid samples like polymers and crystalline materials often require higher pressure for optimal contact, achieved through specialized clamping devices or pressure applicators [81] [84]. Powders and soft materials may form adequate contact with moderate pressure, but excessive force can damage the crystal or alter the sample morphology [84].
Methodologies for Ensuring Optimal Sample Contact
For solid samples, several protocols ensure reproducible contact with ATR crystals. The sample should be positioned to cover the entire crystal surface, and consistent, firm pressure should be applied using the instrument's pressure clamp or an integrated torque wrench for reproducible force application [81] [84]. For irregularly shaped or hard samples, flattening the contact surface with a blade or preparing a smooth cross-section improves contact area [81]. The following workflow outlines a systematic approach to troubleshooting contact issues:
Diagram 2: ATR Contact Issue Troubleshooting Workflow
Powdered samples present unique contact challenges. Fine grinding (<75 µm) improves crystal contact, and for difficult materials, a uniform film created by pressing the powder against the crystal with a flat surface enhances signal quality [82]. For completely intractable solids, alternative techniques like diffuse reflectance (DRIFTS) may be preferable, though these introduce their own preparation considerations [74].
ATR crystal maintenance is crucial for consistent contact performance. Regular cleaning with appropriate solvents (e.g., water, methanol, or isopropanol) followed by gentle drying removes residue that creates microscopic standoff distances between sample and crystal [81] [84]. A contaminated crystal is readily identified by negative absorbance peaks in sample spectra, indicating the sample has less of certain components than the "dirty" background reference [81] [84]. Verification of crystal integrity and cleanliness should be performed regularly by collecting a background spectrum and inspecting for unexpected absorption features before sample analysis [81].
The Scientist's Toolkit: Essential Research Reagents and Materials
Table 3: Key Research Reagent Solutions for FT-IR Sample Preparation
| Reagent/Material | Technical Function | Application Context | Critical Considerations |
|---|---|---|---|
| Potassium Bromide (KBr) | IR-transparent matrix material | Transmission pellet preparation for solids | Must be spectroscopic grade; hygroscopic - requires drying at 105°C before use |
| Diamond ATR Crystals | Internal Reflection Element (IRE) | ATR measurements of hard/abrasive samples | Chemically inert, durable; limited to ~2200-200 cm⁻¹ range; expensive |
| ZnSe ATR Crystals | Internal Reflection Element (IRE) | ATR measurements for general applications | Wider spectral range (20000-650 cm⁻¹) than diamond; attacked by acids and strong oxidizers |
| Anhydrous Solvents | Moisture-free media for sample preparation | Liquid sample analysis; cleaning crystals | Deuterated solvents (CDCl₃) preferred for minimal IR absorption; store with molecular sieves |
| Hydraulic Pellet Press | Application of high pressure (5-15 tons) | Production of KBr pellets for transmission | Uniform pressure distribution critical for consistent pellet thickness |
| Desiccants | Atmospheric moisture control | Sample storage and preparation | Silica gel (indicator type) for moderate drying; P₂O₅ for complete dehydration |
Effective FT-IR analysis requires not only the spectrometer itself but also specialized materials and reagents that enable proper sample preparation. Potassium bromide (KBr) remains the most common matrix material for transmission measurements due to its transparency across most of the mid-IR region (40000-400 cm⁻¹) and ability to form clear pellets under pressure [83]. For ATR accessories, diamond crystals offer exceptional durability for analyzing hard materials, while ZnSe provides a broader spectral range but requires more careful handling [83] [80].
Sample preparation tools include hydraulic presses capable of applying 8-12 tons of pressure for producing KBr pellets, precision micrometers or spacers for controlling liquid cell path lengths, and grinding equipment for reducing particle size and creating homogeneous samples [82]. Desiccators and drying ovens maintain moisture-sensitive materials in an appropriate state, while high-purity solvents enable cleaning of optical elements without introducing contamination [83] [82].
Proper sample preparation is not merely a procedural prerequisite but a fundamental aspect of obtaining meaningful vibrational spectroscopic data. The interplay between sample thickness, moisture content, and physical contact with measurement accessories directly influences the accurate detection of molecular vibrations that form the basis of FT-IR analysis [81] [5]. By implementing the systematic approaches outlined in this guide—controlling thickness to maintain optimal absorbance, eliminating moisture interference through appropriate drying techniques, and ensuring proper sample contact through standardized protocols—researchers can overcome the most prevalent preparation pitfalls [81] [85] [84].
These methodologies enable the collection of reproducible, high-quality spectra that faithfully represent the molecular vibrations of interest, supporting both accurate qualitative identification and robust quantitative analysis across diverse fields including pharmaceuticals, materials science, and biological research [74] [80]. As FT-IR techniques continue to evolve toward more advanced applications, including microspectroscopy and operando analysis, the foundational principles of proper sample preparation remain essential for extracting maximum information from molecular vibrational data.
Infrared (IR) spectroscopy serves as a powerful analytical technique for molecular characterization by measuring how molecules interact with infrared light, providing a unique vibrational fingerprint of samples. However, IR spectroscopy is susceptible to various interfering factors such as scattering, reflection, and instrumental artifacts, which manifest as baseline distortions and intensity changes in measured spectra. These perturbations significantly degrade measurement accuracy and impair machine learning-based spectral analysis by introducing artifacts and biasing feature extraction. This technical guide provides an in-depth examination of four essential spectral preprocessing techniques—Savitzky-Golay (SG) smoothing, Multiplicative Scatter Correction (MSC), Standard Normal Variate (SNV), and Derivative Transformations—within the context of molecular vibration theory. The comprehensive review includes quantitative performance comparisons, detailed experimental protocols, and practical implementation guidelines tailored for researchers, scientists, and drug development professionals working with spectroscopic data.
Theoretical Foundation of Molecular Vibrations in IR Spectroscopy
Infrared spectroscopy measures the interaction between infrared light and matter, specifically targeting the vibrational characteristics of molecules. When infrared radiation interacts with a sample, molecules can absorb this energy to reach higher vibrational energy levels. The mid-IR region (4000–200 cm⁻¹) is particularly valuable for analytical applications as it probes fundamental molecular vibrations including stretching and bending motions of chemical bonds. Different vibration types detected include symmetric and asymmetric stretching, scissoring, rocking, wagging, and twisting motions, each occurring at characteristic energy levels that provide molecular identification capabilities [4].
The resulting IR spectrum visualizes absorbance of IR radiation against wavenumber (cm⁻¹), creating a unique vibrational fingerprint of the sample. However, the heterogeneous nature of biological and chemical systems means IR spectra represent the summation of contributions from various biomolecules, including proteins, lipids, nucleic acids, and carbohydrates. Additionally, physical effects like scattering, reflection, and interference produce baseline distortions and intensity changes that obscure the genuine molecular vibration information [4]. These challenges necessitate sophisticated preprocessing techniques to extract meaningful chemical information from raw spectral data.
The Critical Role of Preprocessing in Spectral Analysis
Spectral preprocessing serves as the essential bridge between raw spectral acquisition and meaningful chemometric modeling. Without proper preprocessing, even the most sophisticated multivariate algorithms may misinterpret irrelevant variations—such as baseline drifts or scattering effects—as genuine chemical information [86]. The fundamental objectives of spectral preprocessing include:
- Noise Reduction: Minimizing random variations from instrumental, environmental, or sample sources
- Scatter Correction: Compensating for light scattering effects caused by sample heterogeneity or particle size variations
- Baseline Correction: Removing background drifts caused by reflection, refraction, or instrumental artifacts
- Intensity Standardization: Normalizing spectra to compensate for pathlength differences or sample concentration variations
- Resolution Enhancement: Improving separation of overlapping peaks to reveal hidden spectral features
The transformative potential of proper preprocessing is evidenced by applications achieving unprecedented detection sensitivity at sub-ppm levels while maintaining >99% classification accuracy in pharmaceutical quality control, environmental monitoring, and remote sensing diagnostics [87].
Core Preprocessing Techniques
Savitzky-Golay Smoothing
Theoretical Principles
The Savitzky-Golay method is a common smoothing technique based on local polynomial regression. This approach applies a moving window across spectral data, fitting a polynomial of specified degree to the points within each window using least squares optimization. The central point in the window is then replaced by the smoothed value from the polynomial fit. This process preserves higher-order moments like peak shape and width better than simple averaging techniques, making it particularly valuable for maintaining spectral fidelity while reducing noise [88] [4].
Parameter Optimization
The performance of SG smoothing depends critically on two parameters: polynomial order and window size. The polynomial order determines the flexibility of the fit—lower orders (2–3) provide stronger smoothing, while higher orders (4–5) preserve spectral features better. The window size (number of points) controls the smoothing extent, with larger windows increasing smoothing but potentially obscuring genuine spectral features. Recent research has demonstrated how application of the Nyquist theorem allows calculation of the optimal window size parameter for SG smoothing of bio-optical signals, providing a mathematical foundation rather than empirical determination [88].
Table 1: Savitzky-Golay Filter Parameters and Performance Characteristics
| Polynomial Order | Window Size (Points) | Smoothing Intensity | Feature Preservation | Optimal Application |
|---|---|---|---|---|
| 2 | 5–9 | High | Low | Strong noise reduction |
| 3 | 7–11 | Moderate | Moderate | General purpose |
| 4 | 9–15 | Low | High | Peak resolution critical |
| 5 | 11–17 | Very Low | Very High | Subtle feature detection |
Experimental Protocol
- Data Preparation: Ensure spectra are evenly spaced in the spectral domain (wavenumber or wavelength)
- Parameter Selection: Determine optimal polynomial order (typically 2–3) and window size based on Nyquist theorem considerations [88]
- Application: Apply SG filter across entire spectral range using the selected parameters
- Validation: Visually inspect smoothed spectra to ensure genuine peaks are preserved while noise is reduced
- Model Assessment: Evaluate preprocessing effectiveness through subsequent chemometric model performance
For mid-IR glucose absorption and cervical spine X-ray images, derivative-based analysis following SG smoothing has been shown to effectively determine regions of interest for further study [88].
Multiplicative Scatter Correction (MSC)
Theoretical Principles
Multiplicative Scatter Correction addresses additive and multiplicative scattering effects in spectral data. These effects commonly arise from sample heterogeneity, particle size variations, and surface roughness, particularly in diffuse reflectance measurements. MSC operates by comparing each sample spectrum to a reference spectrum (typically the mean spectrum of the dataset) and performing a linear correction based on this comparison [89].
The mathematical foundation of MSC involves estimating correction coefficients for each spectrum:
- ( a ): Additive scattering component (baseline shift)
- ( b ): Multiplicative scattering component (scale factor)
The correction is applied as: ( X{corr} = (X - a)/b ), where ( X ) is the raw spectrum and ( X{corr} ) is the corrected spectrum.
Application Scenarios
MSC has proven particularly effective for sparse infrared spectral data, where it corrects for detrimental interactions of infrared radiation with the sample. In studies comparing preprocessing strategies for sparse infrared spectroscopy of bovine and human cartilage, MSC emerged as a top-performing method, especially when combined with baseline offset correction [89].
Experimental Protocol
- Reference Selection: Calculate the mean spectrum from all samples in the dataset
- Regression Analysis: For each sample spectrum, perform linear regression against the reference spectrum: ( Xi = a + b \times X{ref} + e )
- Correction Application: Apply the calculated coefficients to correct each spectrum: ( X{corr,i} = (Xi - a)/b )
- Validation: Assess correction effectiveness through visual inspection of corrected spectra and evaluation of reduced scattering effects
MSC is particularly valuable in biomedical applications where sample heterogeneity is unavoidable, such as in cartilage degeneration diagnostics using FTIR-ATR spectroscopy [89].
Standard Normal Variate (SNV)
Theoretical Principles
Standard Normal Variate is a normalization method that transforms each individual spectrum to have a mean of 0 and a standard deviation of 1. The transformation is calculated as:
( Z = (X - μ)/σ )
Where:
- ( Z ) is the transformed spectrum
- ( X ) is the original spectrum
- ( μ ) is the mean of the spectrum
- ( σ ) is the standard deviation of the spectrum
SNV operates on each spectrum independently, making it particularly useful when no ideal reference spectrum is available. The method effectively reduces scatter and enhances important signals while minimizing the impact of unwanted artifacts [90].
Comparative Advantages
Unlike MSC, which corrects spectra relative to a common reference, SNV standardizes each spectrum independently. This makes SNV particularly valuable for datasets with significant biological variability or when no clear reference standard exists. SNV has demonstrated effectiveness in forensic applications such as bloodstain deposition time estimation, where it enhances spectral clarity and improves predictive model performance [90] [91].
Experimental Protocol
- Spectrum Mean Calculation: For each spectrum, calculate the mean absorbance value across all wavelengths
- Standard Deviation Calculation: Compute the standard deviation of absorbance values for the spectrum
- Transformation Application: Apply the SNV formula to each point in the spectrum
- Dataset Validation: Ensure transformed spectra cluster appropriately in subsequent multivariate analysis
Figure 1: SNV Transformation Workflow
Derivative Transformations
Theoretical Principles
Derivative spectroscopy is a powerful technique for enhancing the separation of overlapping peaks and removing baseline effects. The first derivative eliminates constant baseline offsets, while the second derivative removes both constant and linear baseline variations. Additionally, second derivative transformation sharpens spectral features and resolves overlapping bands, providing improved molecular specificity [92] [4].
In Fourier-transform infrared spectroscopy, specialized data acquisition techniques using graded time intervals rather than uniform sampling can improve the signal-to-noise ratio of derivative spectroscopy by 15% for first-derivative and 34% for second-derivative applications [93].
Resolution Enhancement Mechanisms
Derivative transformations act as high-pass filters, emphasizing rapid changes in the signal while reducing slower intensity fluctuations. This property makes them exceptionally effective for:
- Baseline Removal: Eliminating gradual background shifts
- Peak Resolution: Separating overlapping absorption bands
- Feature Enhancement: Highlighting subtle spectral features obscured by broader peaks
In articular cartilage analysis, second derivative spectroscopy has demonstrated superior specificity for identifying tissue components like collagen and proteoglycans compared to standard absorption spectrum analysis [92].
Experimental Protocol
- Smoothing Preprocessing: Apply initial smoothing (e.g., SG filter) to reduce noise amplification
- Derivative Order Selection: Choose between first derivative (baseline removal) or second derivative (peak resolution)
- Transformation Application: Compute derivatives using Savitzky-Golay differentiation or similar methods
- Interpretation: Analyze derivative spectra noting that peak positions correspond to zero-crossings in first derivative and minima in second derivative
Table 2: Derivative Transformation Applications and Performance
| Derivative Order | Primary Application | Baseline Correction | SNR Impact | Key Identifying Features |
|---|---|---|---|---|
| First | Baseline offset removal | Constant | -15% | Zero-crossings at peak centers |
| Second | Peak separation | Constant + Linear | -34% | Minima at peak centers |
| Second (enhanced) | Overlapping peaks | Constant + Linear | Variable | Enhanced hidden peak revelation |
Comparative Analysis and Implementation Guidelines
Performance Comparison Across Applications
The effectiveness of preprocessing techniques varies significantly based on application domain, sample characteristics, and analytical objectives. Studies comparing preprocessing strategies for sparse infrared spectroscopy in discriminating healthy and damaged cartilage found that the optimal pipeline combined baseline offset correction at 1800 cm⁻¹ followed by peak normalization at 850 cm⁻¹ and MSC preprocessing [89].
In forensic applications for bloodstain deposition time estimation, SNV preprocessing combined with polynomial feature-based PLS regression significantly enhanced prediction performance, achieving root mean square errors of prediction of 8.15 days for NIR spectra [91].
Integrated Preprocessing Workflows
For complex analytical challenges, sequential application of multiple preprocessing techniques often yields superior results compared to individual methods. A typical integrated workflow might include:
- Noise Reduction: SG smoothing to minimize high-frequency noise
- Scatter Correction: MSC or SNV to address light scattering effects
- Baseline Correction: Derivative transformation to remove baseline variations
- Normalization: Vector normalization to standardize spectral intensity
Figure 2: Integrated Preprocessing Workflow
The Scientist's Toolkit: Essential Research Reagents and Materials
Table 3: Essential Materials for Spectral Analysis Experiments
| Material/Reagent | Function in Spectral Analysis | Application Example |
|---|---|---|
| ATR Crystals (Diamond, ZnSe) | Internal reflection elements for sample measurement | FTIR-ATR spectroscopy of cartilage [89] |
| Quantum Cascade Lasers | Infrared light sources for specific wavelength ranges | Sparse spectral data collection [89] |
| Formalin-Fixed Tissue Sections | Sample preservation for histological correlation | Bovine articular cartilage analysis [92] |
| Phosphate Buffered Saline | Biological sample hydration maintenance | Biomedical sample preparation [89] |
| Carboxylic Acid Standards | Model systems for method validation | Functional transformation development [94] |
Spectral preprocessing techniques represent fundamental tools for transforming raw, artifact-laden spectral data into chemically meaningful information. Savitzky-Golay smoothing, Multiplicative Scatter Correction, Standard Normal Variate, and Derivative Transformations each address specific challenges in spectral analysis, from noise reduction and scatter correction to baseline removal and peak resolution. The optimal selection and sequencing of these techniques depends critically on sample characteristics, analytical objectives, and the specific molecular vibrations of interest. As the field advances toward context-aware adaptive processing, physics-constrained data fusion, and intelligent spectral enhancement, these core preprocessing methods will continue to form the foundation for extracting maximal information from spectroscopic measurements across pharmaceutical, biomedical, environmental, and forensic applications. Future developments should focus on standardized evaluation metrics and automated tools to guide optimal preprocessing selection, ensuring IR spectroscopy reaches its full potential as a reliable, high-throughput analytical tool across disciplines.
The accurate measurement of atmospheric carbon dioxide (CO2) is paramount for climate science, environmental monitoring, and the validation of emission reduction policies. Infrared (IR) spectroscopy serves as a cornerstone technology for these measurements, leveraging the fundamental principle that greenhouse gases absorb IR radiation at specific wavelengths corresponding to their molecular vibrational and rotational energy transitions [95]. However, the presence of water vapor (H2O) introduces significant interference, challenging the accuracy of CO2 quantification. This guide details the theoretical underpinnings of this interference and presents advanced correction strategies essential for researchers and professionals in spectroscopy and drug development who require high-fidelity gas concentration data.
Molecular Foundations of Infrared Absorption
The interaction of infrared radiation with molecular gases is governed by quantum mechanics. Molecules possess discrete vibrational and rotational energy states. Vibrational transitions involve the stretching and bending of chemical bonds, while rotational transitions involve the tumbling of the entire molecule. When the frequency of incident IR radiation matches the energy difference between these states, photons are absorbed, promoting the molecule to a higher energy level [95].
The absorption of radiation at a specific frequency (ν) is described by the absorption coefficient, k(ν), which for an individual absorption line follows a Lorentzian line shape:
k(ν) = (S / π) * [α / ((ν - ν₀)² + α²)] [95]
Here, S is the line strength, ν₀ is the line center frequency, and α is the absorption line half-width. The total absorption across a band is the integral of absorption across all constituent lines [95]. The width of these spectral lines is not fixed; it is broadened by collisions between molecules, a phenomenon known as collisional or pressure broadening [95]. The line half-width α is theoretically described by:
α ∝ ρ_i * D_{a,i}² * (1/m_a + 1/m_i)^{1/2} [95]
where ρ_i is the number density of perturbing molecules, D_{a,i} is the sum of the optical collision diameters, and m_a and m_i are the masses of the absorber and perturbing molecules, respectively. Since ρ_i is a function of pressure and temperature (via the Ideal Gas Law), spectral line widths are directly influenced by the atmospheric state and composition [95].
Water Vapor Interference Mechanisms
Water vapor interferes with CO2 measurement through two primary mechanisms: absorption band broadening and direct instrumental cross-sensitivity.
Absorption Band Broadening
As established, the width of a spectral line depends on the frequency of collisions with other molecules. Water vapor has a particularly strong broadening effect on CO2 absorption lines. The total "effective pressure" (P_E) experienced by CO2 in moist air is given by:
P_E = p_a + a_w * p_w [95]
where p_a is the partial pressure of dry air, p_w is the partial pressure of water vapor, and a_w is the broadening coefficient for water vapor relative to dry air. This effective pressure is always greater than the dry air pressure, leading to broader CO2 absorption lines. As these lines broaden, they overlap more significantly, increasing the total integrated absorption of the band [95]. This effect causes an overestimation of the apparent CO2 mole fraction if left uncorrected. A 2024 study on spaceborne lidar data found that this broadening effect introduced an annual average bias of 0.42 ppm in column-averaged CO2 (XCO2), with biases exceeding 1 ppm in regions of high humidity [96].
Instrumental Cross-Sensitivity
This form of interference arises from the design of non-dispersive infrared (NDIR) analyzers. These instruments use optical filters to isolate specific absorption bands for CO2 and H2O. If the filter for the CO2 channel has any transmission in a region where water vapor absorbs, the instrument will exhibit cross-sensitivity, leading to an overestimation of CO2 in humid air [95]. Furthermore, some analyzer designs, particularly those using cavity ring-down spectroscopy (CRDS), have shown a sensitivity of the cavity pressure to water vapor. Errors in the internal pressure sensor reading can lead to biases in reported CO2 and CH4 mole fractions, especially at low water vapor mole fractions (below 0.5%) [97].
Table 1: Summary of Water Vapor Interference Mechanisms and Their Impacts on CO2 Measurement.
| Interference Mechanism | Physical Basis | Effect on CO2 Measurement | Typical Magnitude of Error |
|---|---|---|---|
| Absorption Band Broadening | H2O collisions broaden CO2 absorption lines, increasing integrated absorption. | Overestimation of CO2 concentration. | Global average: 0.42 ppm [96] |
| Direct Instrument Cross-Sensitivity | Overlap of optical filter bands; H2O absorbs light in the CO2 measurement channel. | Overestimation of CO2 concentration. | Varies by instrument; can be several ppm [95] |
| Cavity Pressure Sensitivity | H2O affects cavity pressure sensor readings in CRDS analyzers. | Bias in CO2 concentration, largest at low H2O levels. | Significant fraction of WMO goals [97] |
Correction Strategies and Methodologies
Theoretical Correction for Band Broadening
The band broadening effect can be corrected by incorporating the effective pressure into the calibration function of the gas analyzer. For LI-COR analyzers, the correction is applied as a function of the water vapor mole fraction (X_w) and total pressure (P):
P_E = P * (1 + (a_w - 1) * X_w) [95]
This correction is embedded in the calibration algorithms of sophisticated gas analyzers. The value of the broadening coefficient a_w is determined empirically for each instrument model due to differences in optical design and filter characteristics [95].
Empirical Correction for Low-Cost Sensors
For lower-cost NDIR sensors, which lack built-in advanced corrections, multivariate linear regression can be used to develop a post-processing correction. A study on SenseAir K30 sensors demonstrated that correcting for environmental variables (temperature, pressure, humidity) significantly improved accuracy. The root mean square error (RMSE) compared to a research-grade analyzer improved from a median of 9.6 ppm for off-the-shelf sensors to 1.9 ppm after correction [98].
Experimental Protocol: Sensor Correction Calibration [98]
- Co-locate the low-cost NDIR sensor with a research-grade gas analyzer (e.g., a cavity-enhanced laser absorption spectrometer).
- Simultaneously log data from both the sensor under test and the reference analyzer over a range of naturally occurring or artificially induced CO2 concentrations, temperatures, and relative humidities.
- Record the sensor's raw CO2 output, internal temperature, and any measured humidity/pressure, alongside the reference CO2 dry mole fraction.
- Develop a model (e.g., multivariate linear regression) where the reference CO2 is the dependent variable, and the sensor's raw output and environmental readings are the independent variables.
- Apply the derived coefficients to future measurements from the low-cost sensor to correct its output.
Correction for Cavity Ring-Down Spectroscopy (CRDS) Analyzers
The standard water correction for Picarro CRDS analyzers uses a parabolic function to account for dilution and line shape effects [97]:
c_dry = c_wet(h) / (1 + a_c * h + b_c * h²) [97]
However, this model fails to correct for biases caused by cavity pressure sensitivity to water vapor. A modified approach is required.
Experimental Protocol: CRDS Water Correction [97]
- Humidification Setup: Use a system that generates stable water vapor levels. Split a dry air stream from a calibrated tank, saturate one line using a gas washing bottle, and then recombine the streams using mass flow controllers to precisely set the final H2O mole fraction.
- Dense Sampling: Ensure dense sampling at low water vapor mole fractions (below 0.5% H2O), where the bias is most pronounced but was historically undersampled.
- Independent Pressure Monitoring: Monitor the cavity pressure with an external, highly accurate pressure sensor to confirm the H2O-dependent drift of the internal sensor.
- Develop Modified Correction: Based on the data, modify the standard water correction function to account for the cavity pressure sensitivity, deriving new, instrument-specific coefficients.
The Scientist's Toolkit: Essential Research Reagents and Materials
Table 2: Key Materials and Equipment for Atmospheric CO2 Measurement and Correction Studies.
| Item | Function / Description | Example Use Case |
|---|---|---|
| Research-Grade GHG Analyzer | CRDS or CEAS-based instrument for high-precision reference measurements (<1% uncertainty) [98]. | Serves as the "truth" data source for calibrating lower-cost sensors [98]. |
| Low-Cost NDIR Sensor | Low-cost, portable CO2 sensor (e.g., SenseAir K30) for dense spatial monitoring [98]. | Target for environmental correction; used in distributed sensor networks. |
| Calibrated Gas Standards | NIST-traceable compressed gas cylinders with known CO2 concentrations [98]. | Calibrating research-grade analyzers and validating sensor accuracy. |
| Multi-Pass Cell FTIR Spectrometer | Fourier-transform infrared spectrometer with a long-path cell for high-resolution spectroscopy [99]. | Measuring fundamental spectroscopic parameters (e.g., H2O continuum, line shapes). |
| Gas Washing Bottle / Humidifier | Device to saturate a dry air stream with water vapor [97]. | Creating stable humidified air streams for water correction experiments. |
| Mass Flow Controllers (MFCs) | Precision devices to control and mix gas flow rates [97]. | Precisely blending dry and humid air to achieve specific, stable H2O mole fractions. |
| Cavity Pressure Monitor | External, high-accuracy pressure sensor (e.g., GE Druck DPI 142) [97]. | Independently verifying cavity pressure in CRDS analyzers to diagnose H2O sensitivity. |
| Quantum Chemistry Software | Software like Gaussian09 for computing theoretical IR/Raman spectra [32]. | Predicting molecular vibrational frequencies and absorption intensities for novel molecules. |
Workflow and System Diagrams
The following diagram illustrates the logical workflow for diagnosing and selecting an appropriate water vapor correction strategy for CO2 measurements, based on the instrument technology in use.
The diagram below outlines the experimental setup required for characterizing and correcting the cavity pressure sensitivity in CRDS analyzers, a key advanced methodology.
In the field of infrared (IR) spectroscopy, the analysis of molecular vibrations and rotations provides a fundamental window into molecular structure and dynamics. The utility of this analytical technique for research and drug development hinges on the quality of the spectral data acquired. Two of the most critical parameters determining data quality are spectral resolution and signal-to-noise ratio (SNR). These factors exist in a fundamental tension; while higher resolution can reveal finer spectral details, it often comes at the cost of a lower SNR, requiring longer acquisition times to maintain data quality.
For decades, the selection of spectral resolution in Fourier transform infrared (FT-IR) spectroscopy has been influenced by historical technical limitations, often defaulting to values that are powers of two (e.g., 4, 8, or 16 cm⁻¹) [100]. However, contemporary instrumentation and a deeper understanding of condensed-phase systems call for a more nuanced, evidence-based approach. This guide synthesizes recent research to provide scientists and drug development professionals with a framework for optimizing spectral resolution to maximize information content while maintaining an excellent SNR for efficient data acquisition.
Theoretical Foundations: Molecular Vibrations, Resolution, and Noise
Molecular Vibrations and the IR Spectrum
Infrared spectroscopy probes the vibrational and rotational energy levels of molecules. When infrared light interacts with a chemical compound, energy is absorbed at specific frequencies that match the natural vibrational frequencies of its chemical bonds, such as stretching and bending motions [34]. A plot of this absorption as a function of frequency (or wavenumber, in cm⁻¹) produces an IR spectrum, which serves as a unique "chemical fingerprint" for identification and quantification [34].
Defining Spectral Resolution and Signal-to-Noise Ratio (SNR)
- Spectral Resolution: This parameter defines the ability of a spectrometer to distinguish between two closely spaced spectral features. In FT-IR spectroscopy, it is determined by the maximum optical path difference (OPD) the moving mirror travels in the interferometer [101]. A smaller resolution number (e.g., 2 cm⁻¹) indicates a higher, finer resolution.
- Signal-to-Noise Ratio (SNR): SNR is a measure that compares the level of a desired signal to the level of background noise. It is defined as the ratio of signal power to noise power, often expressed in decibels (dB) [102]. A high SNR means the signal is clear and easy to interpret, whereas a low SNR means the signal is obscured by noise. In the context of UX design, "signal" is the relevant information users seek, while "noise" is any irrelevant or distracting information [103] [104]. The principle is directly transferable to analytical spectroscopy: the "signal" is the meaningful absorbance from a molecular vibration, and the "noise" is the random fluctuation in the detector or instrument.
The core relationship between these parameters is governed by the physics of FT-IR spectrometers. Achieving a higher spectral resolution requires the moving mirror to travel a longer distance, which increases the scan time per individual measurement. For a fixed total acquisition time, this means fewer scans can be co-averaged, resulting in a lower final SNR in the spectrum.
Quantitative Analysis of Condensed-Phase Bandwidths
The intrinsic width of absorption bands in a sample is the primary physical determinant of the required spectral resolution. Collecting data at a resolution significantly finer than the natural width of a band yields no new information and unnecessarily compromises the SNR. A recent 2024 study provides a comprehensive quantitative analysis of the intrinsic peak widths for solids and liquids, offering a data-driven basis for resolution selection [100].
The study analyzed a total of 4,237 peaks from 61 liquids and 70 solids spectra in the 4000-400 cm⁻¹ range. The key findings on peak width distributions are summarized in the table below.
Table 1: Statistical Distribution of Peak Widths in Condensed Phases [100]
| Statistic | Liquids (1765 bands) | Solids (2472 bands) |
|---|---|---|
| Mean Width | 24.7 cm⁻¹ | 22.2 cm⁻¹ |
| Median Width | 13.7 cm⁻¹ | 11.2 cm⁻¹ |
| Peaks < 5 cm⁻¹ | 27 | 39 |
| Resolution to Capture 95% of Bands | 5.7 cm⁻¹ | 5.3 cm⁻¹ |
The data reveals a skewed distribution for both solids and liquids, where the median width is substantially smaller than the mean. This indicates that while most bands are relatively narrow, a smaller number of very broad bands pull the average upwards. Consequently, a resolution of approximately 6.0 cm⁻¹ is proposed as optimal for general condensed-phase studies, as it would capture the native linewidth for 91% of all bands, with only 9% of the narrowest bands experiencing minor instrumental broadening [100]. This setting provides an excellent balance, offering high specificity with a significant gain in SNR compared to using unnecessarily high resolutions.
Impact of Resolution on Positional Accuracy and Precision
Beyond simply resolving peaks, spectral resolution can influence the accuracy and precision of peak position determination, which is critical for identifying subtle structural changes, such as crystal polymorphism in pharmaceuticals.
A 2024 experimental study systematically evaluated this effect using polystyrene and acetaminophen, assessing wavenumber accuracy across different instruments and resolutions [105]. The findings contradict some older, more conservative estimates and provide modern benchmarks for researchers.
Table 2: Effect of Resolution on Peak Position Accuracy (Wavenumber Uncertainty) [105]
| Spectral Resolution | Wavenumber Accuracy (Instrument Variation) |
|---|---|
| 4 cm⁻¹ | Within 1.1 cm⁻¹ |
| 8 cm⁻¹ | Within 2.2 cm⁻¹ |
| 16 cm⁻¹ | Within 4.7 cm⁻¹ |
| 32 cm⁻¹ | Within 10.4 cm⁻¹ |
The study concluded that for well-resolved, non-saturated peaks, instrument-to-instrument variation results in a wavenumber accuracy within 1.1 cm⁻¹ for resolutions of 4 cm⁻¹ or higher, an order of magnitude better than some historical USP guidance suggested [105]. This high level of precision validates the use of FT-IR for detecting subtle spectral shifts. The data also shows that while 8 cm⁻¹ resolution is often sufficient, moving to very low resolutions like 16 or 32 cm⁻¹ leads to a significant and potentially unacceptable loss in positional accuracy.
Experimental Protocols for Resolution Optimization
Workflow for Method Development
The following diagram illustrates a systematic workflow for determining the optimal spectral resolution for a new study.
Detailed Methodology for Key Experiments
Protocol 1: Establishing the Minimum Required Resolution for a Solid API This protocol is designed to determine the resolution needed to resolve critical peaks, such as those distinguishing between polymorphs.
- Sample Preparation: For an ATR measurement, simply place a small amount of the pure Active Pharmaceutical Ingredient (API) powder on the diamond crystal and apply consistent pressure using the instrument's anvil [34]. For transmission measurement, grind 1-2 mg of the API with approximately 200 mg of potassium bromide (KBr) and press into a pellet using a hydraulic press at 10,000 lbs [105].
- Data Acquisition: Acquire a high-quality reference spectrum at a high resolution (e.g., 2 cm⁻¹) with a sufficient number of scans to achieve an excellent SNR (>100:1).
- Peak Width Analysis: In the spectral analysis software, identify the narrowest band that is critical for your analysis (e.g., a band known to shift between polymorphic forms). Measure its Full Width at Half Maximum (FWHM).
- Resolution Setting: Set the instrument resolution to a value between one-half and one times the measured FWHM. For instance, if the FWHM is 8 cm⁻¹, test resolutions of 4 cm⁻¹ and 8 cm⁻¹.
Protocol 2: Balancing SNR and Resolution for Quantitative Analysis This protocol optimizes the efficiency of data collection for quantitative measurements.
- Fixed-Time Experiment: Prepare a representative sample, such as a diluted mixture in KBr or a uniform film.
- Spectral Collection: Collect a series of spectra at different resolutions (e.g., 2, 4, 8, 16 cm⁻¹), keeping the total acquisition time constant for each. This will demonstrate the natural decrease in SNR with increasing resolution.
- SNR Calculation: For each spectrum, calculate the SNR by selecting a region of a strong, isolated peak (signal) and a region where there is no absorption (noise). SNR can be calculated as the ratio of the peak height (or RMS amplitude) to the standard deviation of the noise [102].
- Optimization: Identify the resolution where the SNR remains acceptable and the spectral features of interest are still adequately resolved. The recent study suggests 6.0 cm⁻¹ is a strong starting point for condensed-phase systems [100].
The Scientist's Toolkit: Essential Research Reagents and Materials
Table 3: Key Materials for FT-IR Spectroscopy in Pharmaceutical Research
| Item | Function & Rationale |
|---|---|
| ATR Crystal (Diamond) | Enables analysis of solids and liquids with minimal sample preparation. Diamond is chemically inert and robust, suitable for a wide range of API samples [34]. |
| Potassium Bromide (KBr) | A transparent IR material used to prepare pellets for transmission analysis of solid samples, diluting the sample to avoid total absorbance [34]. |
| Polystyrene Film Standard | A NIST-traceable standard used for instrument performance validation, ensuring wavenumber accuracy and precision across instruments [105]. |
| Acetaminophen (Form I) | A well-characterized model compound with known polymorphic forms, useful for method development and validation in pre-formulation studies [105]. |
The legacy practice of defaulting to resolution settings based on powers of two is no longer supported by empirical evidence. Optimization of spectral resolution is a critical step in modern FT-IR method development. The following diagram synthesizes the core principles of this optimization into a single, actionable framework.
For researchers in drug development, implementing these findings means:
- For routine identification and quality control of APIs and excipients, a resolution of 6.0 cm⁻¹ is highly recommended as a starting point, offering an excellent balance for most condensed-phase systems [100].
- When detecting subtle spectral shifts, such as during polymorph screening or salt/cocrystal formation, a higher resolution of 4 cm⁻¹ is advisable to ensure wavenumber accuracy better than 1.1 cm⁻¹ [105].
- For quantitative methods where SNR is paramount and the target analytes have broad bands, a resolution of 8 cm⁻¹ may be optimal, providing high SNR with minimal loss of critical information.
By adopting this evidence-based framework, scientists can move beyond historical conventions and optimize their FT-IR methods to generate higher quality data more efficiently, accelerating research and development timelines.
Quantitative analysis using infrared (IR) spectroscopy represents a cornerstone technique for researchers, scientists, and drug development professionals seeking to characterize chemical compounds and quantify analytes within complex matrices. This methodology provides a low-cost, non-invasive alternative to electrode-based approaches, enabling both qualitative and quantitative interpretation of spectroscopic data based on the fundamental principles of molecular vibrations and rotations [106] [107]. The success of infrared spectroscopy applications for quantitative analysis of compounds in complex matrices such as plant-based medicine and supplements is well-established, supported by chemometrics techniques that extract meaningful information from spectral data [108]. The technique is considered fast, time-saving, cost-effective, accurate, and nondestructive, making it particularly valuable for pharmaceutical, food industry, agriculture, and biological applications where traditional methods like HPLC, LC-MS, and GC-MS may be costly, time-consuming, or require significant solvent consumption [108].
The foundation of all quantitative infrared spectroscopy applications rests upon the Bouguer-Beer-Lambert (BBL) law, which provides the theoretical framework relating light absorption to the properties of the material through which light is traveling [109] [110]. For IR spectroscopists working with molecular vibrations, understanding both the capabilities and limitations of this fundamental law is essential for accurate quantitative interpretation of spectral data. When applied to infrared spectroscopy specifically, the absorbance at any wavenumber for a single solute in a non-absorbing solvent is governed by the Lambert-Beer law, which states that the absorption intensity (absorbance) of light at any wavelength is directly proportional to the concentration of each component in the sample and to the path length (sample thickness) [11]. This relationship serves as the fundamental principle enabling the quantification of molecular species based on their vibrational signatures.
Theoretical Foundation: The Beer-Lambert Law
Historical Development and Fundamental Principles
The Beer-Lambert law has evolved through centuries of scientific inquiry, beginning with Pierre Bouguer's astronomical observations in 1729, where he discovered that light intensity had an exponential dependence on the path length traveled through the atmosphere [110]. Johann Heinrich Lambert later expressed this relationship in mathematical form in his 1760 work Photometria, proposing that the loss of light intensity when propagating through a medium is directly proportional to intensity and path length [110]. The law achieved its modern form through August Beer's contribution in 1852, when he recognized that colored solutions also exhibited similar attenuation behavior, and that absorption depended on the concentration of the solute [110] [107].
The modern formulation of the Beer-Lambert law states that the absorbance (A) of a solution is directly proportional to the concentration (c) of the absorbing species and the path length (l) of the light through the sample [109]. This relationship is mathematically expressed as:
[A = \log{10} \left( \frac{I0}{I} \right) = \epsilon l c]
Where:
- (A) is the dimensionless absorbance
- (I_0) and (I) are the intensity of the incident and transmitted light, respectively
- (\epsilon) is the molar absorptivity or molar decadic extinction coefficient (typically with units of L·mol⁻¹·cm⁻¹)
- (l) is the optical path length (cm)
- (c) is the concentration of the absorbing species (mol·L⁻¹)
For a mixture of N components, the total absorbance at a given wavenumber (ν) is the sum of the individual absorbances [11]:
[A(\nu) = \sum{i=1}^{N} ai(\nu) b c_i]
Where (ai(\nu)) represents the absorption coefficient for component i at wavenumber ν, b is the optical path length, and (ci) is the concentration of component i.
Limitations and Deviations from the Beer-Lambert Law
While the Beer-Lambert law serves as the fundamental principle for quantitative spectroscopy, researchers must recognize its limitations and potential deviations. The linear relationship between absorbance and concentration postulates one of the fundamental assumptions that much of optical spectroscopy literature is based upon [106]. However, deviations can occur under several conditions:
- Non-monochromatic light sources: Polychromatic light can cause deviations as the absorption coefficient varies with wavelength [106]
- High analyte concentrations: At very high concentrations, the assumption of linearity may break down [106] [107]
- Scattering media: Highly scattering matrices can introduce significant nonlinearities [106]
- Electromagnetic effects: Band shifts and intensity changes can arise exclusively from optical conditions, the measurement method, substrate, and sample form [107]
- Chemical interactions: Molecular interactions such as hydrogen bonding, dimerization, or solvent effects can alter absorption characteristics [107]
Mayerhöfer et al. [107] emphasize that errors arising from strict application of the Beer-Lambert law can exceed an order of magnitude compared to the exact solution of Maxwell's equations, particularly when dealing with strong absorption bands or samples with significant reflection losses. Planck himself recognized that for strong absorption, Beer's law cannot hold [107], a finding that has sometimes been overlooked in modern spectroscopic practice.
Table 1: Common Limitations of the Beer-Lambert Law in Practical Applications
| Limitation Type | Underlying Cause | Impact on Quantitative Analysis |
|---|---|---|
| Optical Effects | Non-monochromatic light, scattering, reflection losses | Non-linear calibration curves, inaccurate concentration estimates |
| Sample Effects | High concentrations, molecular interactions, complex matrices | Deviation from linear absorbance-concentration relationship |
| Instrumental Effects | Insufficient resolution, detector nonlinearity, stray light | Spectral distortions and inaccurate absorbance measurements |
| Electromagnetic Effects | Dispersion, wave optics phenomena | Band shifts and intensity changes unrelated to chemical factors |
Calibration Methodologies for Quantitative Analysis
Experimental Design and Sample Preparation
The foundation of reliable quantitative analysis in infrared spectroscopy begins with robust experimental design and appropriate sample preparation techniques. For liquid samples, the path length b in the Beer-Lambert equation is typically expressed in cm, while the sample concentration c is expressed in mol/L, yielding molar absorptivity with units of L/(cm·mol) [11]. For samples prepared using the halide pellet method, the product bc is expressed in terms of sample mass, whereas for thin films of pure samples (such as pure organic liquid films or polymer films), the product bc relates to the thickness of the film [11].
Both solid and liquid samples can be analyzed quantitatively using IR spectroscopy, but reference or standard samples are essential for accurate quantification [11]. Without appropriate standards, only rough estimations are possible. The expected accuracy is approximately 1% for single-component analysis and around 5% for multicomponent analyses [11], though these values can vary significantly based on matrix complexity and the specific methodology employed.
Key considerations for sample preparation include:
- Path length consistency: Maintaining consistent and appropriate path lengths for all samples in a calibration set
- Matrix matching: Ensuring calibration standards closely match the sample matrix to minimize interferences
- Homogeneity: Verifying sample homogeneity to prevent scattering effects or uneven distribution of analytes
- Reference materials: Using certified reference materials when possible to establish method accuracy
Spectral Preprocessing Techniques
Spectral preprocessing is a critical step in quantitative IR analysis that can significantly impact the accuracy and precision of resulting models [108]. Various preprocessing techniques address different spectral artifacts and enhance the relevant chemical information:
- Multiplicative Scatter Correction (MSC): Corrects for scattering effects, particularly important for powdered or heterogeneous samples
- Standard Normal Variate (SNV): Normalizes spectra to account for path length differences and scattering effects
- Derivative Spectroscopy: First and second derivatives help resolve overlapping peaks and eliminate baseline offsets
- Smoothing: Reduces high-frequency noise while preserving meaningful spectral features
- Normalization: Scales spectra to a standard range, often used with ATR techniques to correct for contact variations
The effectiveness of different preprocessing methods varies depending on the specific application and sample type. For instance, research on quantifying total flavonoid content in Ginkgo biloba leaf by NIR found SNV to be the superior pretreatment technique, while analysis of rosmarinic acid in rosmarini leaves found that MSC followed by the 2nd derivative method provided the best results [108].
Variable Selection Methods
Variable selection techniques play a crucial role in building robust calibration models, particularly for near-infrared data where spectra contain extensive multivariate information [108]. These methods help identify the most informative spectral regions while reducing model complexity and minimizing the risk of overfitting:
- Wavenumber Point Selection: Focuses on specific, discrete wavenumbers with high analyte sensitivity
- Wavenumber Interval Selection: Uses contiguous spectral regions that contain relevant chemical information
- Genetic Algorithms (GA): Employs evolutionary computation to identify optimal spectral variables
- Competitive Adaptive Reweighted Sampling (CARS): Selects key wavelengths based on their importance in calibration models
- Interval Partial Least Squares (iPLS): Divides spectra into intervals and selects the most informative regions
Research has demonstrated that optimized variable selection can significantly improve model performance. For example, in the quantification of EGCG in green tea using FT-NIR, the combination of SNV preprocessing and siPLS-GA variable selection produced the best calibration model with the lowest RMSEC and RMSEP, and highest R² value [108].
Table 2: Common Chemometric Methods for Quantitative Infrared Spectroscopy
| Method Category | Specific Techniques | Typical Applications | Advantages |
|---|---|---|---|
| Preprocessing | MSC, SNV, Derivatives, Smoothing | All quantitative IR applications | Corrects scattering, removes baseline effects, reduces noise |
| Variable Selection | GA, CARS, iPLS, RF | NIR spectroscopy, complex mixtures | Reduces model complexity, improves prediction accuracy |
| Linear Regression | PLS, PCR, MLR | Single and multi-component analysis | Handles collinearity, works with many variables |
| Nonlinear Regression | ANN, SVR, Random Forest | Scattering media, complex interactions | Captures nonlinear relationships, improved performance in some cases |
Multivariate Calibration Models
Linear Regression Methods
Multivariate calibration forms the backbone of modern quantitative infrared spectroscopy, particularly for complex mixtures where spectral bands extensively overlap. The most widely used linear methods include:
Partial Least Squares (PLS) Regression has become the workhorse of quantitative spectroscopic analysis due to its ability to handle collinear variables and extract latent factors that maximize covariance between spectral data and analyte concentrations [106]. PLS is particularly valuable in situations characterized by the "large p, small n" problem, where the number of spectral variables (p) far exceeds the number of samples (n) [106]. The method works by finding the axes of maximal covariance between the independent variables (spectra) and the dependent variable (concentration) [106].
Principal Component Regression (PCR) employs a similar approach but first reduces spectral data dimensionality by finding axes of maximal variance in the independent variable space before building the regression model [106]. While interpretation of latent variables differs between PCR and PLS, both methods often deliver similar predictive performance, with minor improvements sometimes possible with PLS when noise constitutes much of the variance in the spectral data [106].
The linearity assumption underlying these methods is justified by the Beer-Lambert law, which postulates a linear relationship between the absorbance of monochromatic light and the concentration of absorbing species [106]. This fundamental principle, combined with the presence of redundant variables and multicollinearity in spectral data, makes multivariate linear approaches particularly suitable for quantitative spectroscopic applications.
Nonlinear Regression Methods
While linear models typically serve as the starting point for quantitative IR analysis, nonlinear methods have gained prominence for addressing situations where deviations from the Beer-Lambert law are significant. Empirical investigations have demonstrated that nonlinearities may be present in scattering media, justifying the use of more complex, nonlinear models [106].
Common nonlinear approaches include:
- Support Vector Regression (SVR): Applies kernel functions to model nonlinear relationships, with radial basis function (RBF), quadratic, cubic, and quartic kernels offering different capabilities for capturing complex spectral-concentration relationships [106]
- Artificial Neural Networks (ANN): Utilizes interconnected nodes in layered architectures to learn complex mappings between spectral inputs and concentration outputs
- Random Forests (RF): Ensemble method that combines multiple decision trees to improve predictive performance and robustness
The selection between linear and nonlinear approaches should be guided by the specific characteristics of the analytical problem. Research comparing linear and nonlinear models for lactate estimation in different matrices found that while linear models performed well in simple matrices like phosphate buffer solution even at high concentrations (0-600 mmol/L), nonlinearities became more significant in scattering media such as human serum, whole blood, and in vivo transcutaneous measurements [106].
Model Validation and Performance Metrics
Robust validation of calibration models is essential for ensuring reliable quantitative results. The standard practice involves using separate sets of samples for calibration (training) and validation (testing) to assess predictive performance objectively [111] [106]. Common validation approaches include:
- Cross-validation: Iteratively partitions data into training and validation sets, with root mean square error of cross-validation (RMSECV) and coefficient of determination (R²CV) serving as key performance indicators [106]
- External validation: Uses completely independent sample sets not included in model development
- Nested cross-validation: Embeds hyperparameter optimization within the model evaluation loop to minimize the risk of overfitting and provide more realistic performance estimates [106]
Key performance metrics for evaluating calibration models include:
- Root Mean Square Error of Calibration (RMSEC): Measures fit between model predictions and known values for calibration samples
- Root Mean Square Error of Prediction (RMSEP): Assesses prediction error for independent validation samples
- Coefficient of Determination (R²): Quantifies the proportion of variance explained by the model
- Ratio of Performance to Deviation (RPD): Compares the standard deviation of reference values to the standard error of prediction
ASTM International provides standardized practices for infrared multivariate quantitative analysis (ASTM E1655-17) that outline procedures for collecting and treating data for developing IR calibrations, with criteria for validating calibration model performance [111]. These practices can be used to establish the validity of results obtained by an IR spectrometer at the time the calibration is developed and provide ongoing validation of estimates produced by analysis of unknown samples [111].
Advanced Applications in Pharmaceutical and Biomedical Research
Drug Development and Quality Control
Infrared spectroscopy has become an indispensable tool in pharmaceutical development and quality control, where it enables rapid, non-destructive quantification of active pharmaceutical ingredients (APIs), excipients, and potential contaminants. The technique is particularly valuable for:
- Raw material verification: Rapid identification and quantification of incoming raw materials
- Process monitoring: Real-time or near-real-time assessment of chemical composition during manufacturing
- Final product testing: Quantification of API content in finished dosage forms
- Counterfeit detection: Identification of substandard or falsified pharmaceutical products
In industrial laboratories, quantitative IR analysis is most frequently requested for specific products where speed and efficiency provide significant advantages over traditional chromatographic methods [11]. The ability to analyze samples with minimal preparation makes IR spectroscopy particularly valuable for high-throughput environments.
Biomedical Analysis and Disease Diagnostics
The application of infrared spectroscopy in biomedical research has expanded significantly, with particular promise in disease diagnosis and prognosis. Recent advances include:
- Cancer detection: IR spectroscopy combined with machine learning has shown exceptional promise in detecting head and neck precancers and cancers, with reported sensitivities and specificities reaching 100% in some studies, and area under the curve scores as high as 0.99 [112]
- Metabolite monitoring: Quantification of important biomarkers like lactate in various biological matrices, including phosphate buffer solution, human serum, sheep blood, and in vivo transcutaneous measurements [106]
- Therapeutic drug monitoring: Measurement of drug concentrations in biological fluids for personalized dosing regimens
These applications typically combine IR spectroscopy with advanced machine learning methods, including linear discriminant analysis (LDA), principal component analysis with LDA (PCA-LDA), partial least squares discriminant analysis (PLS-DA), support vector machines (SVM), and deep reinforcement neural networks [112]. The integration of spectroscopic data with these computational approaches has opened new possibilities for non-invasive diagnostics and precision medicine.
Experimental Protocols and Workflows
Standard Quantitative Analysis Protocol
A robust experimental protocol for quantitative IR analysis should include the following key steps:
Sample Preparation
- Select appropriate sampling technique (transmission, ATR, diffuse reflectance) based on sample properties
- Prepare calibration standards covering the expected concentration range
- Ensure matrix matching between standards and unknown samples
- Verify homogeneity and appropriate particle size for solid samples
Spectral Acquisition
- Establish optimal instrument parameters (resolution, number of scans, gain)
- Collect background spectra regularly to account for environmental changes
- Acquire spectra for all calibration standards and unknown samples
- Maintain consistent sampling conditions throughout measurement series
Data Preprocessing
- Select and apply appropriate preprocessing techniques based on data characteristics
- Validate preprocessing effectiveness through visual inspection and model performance
- Perform variable selection if applicable to focus on informative spectral regions
Model Development
- Split data into calibration and validation sets using appropriate strategy
- Select modeling approach (linear vs. nonlinear) based on data characteristics
- Optimize model parameters using cross-validation
- Validate model performance with independent test set
Unknown Sample Analysis
- Apply established model to predict concentrations in unknown samples
- Assess prediction reliability using model statistics and spectral residuals
- Report results with appropriate confidence intervals
Method Validation Protocol
For methods intended for regulatory submission or quality control applications, comprehensive validation is essential:
Specificity
- Demonstrate ability to quantify analyte in presence of potential interferents
- Verify selectivity through examination of spectral loadings and regression coefficients
Linearity
- Establish linear range using minimum of 5 concentration levels
- Evaluate residuals for systematic patterns indicating nonlinearity
Accuracy
- Assess recovery for quality control samples at multiple concentration levels
- Compare results with reference method when available
Precision
- Determine repeatability through multiple measurements of same sample
- Evaluate intermediate precision using different days, analysts, or instruments
Robustness
- Test method performance under deliberate variations of critical parameters
- Identify control ranges for method parameters to ensure reliability
Table 3: Essential Research Reagent Solutions for Quantitative IR Spectroscopy
| Reagent/Material | Function in Quantitative IR Analysis | Application Examples |
|---|---|---|
| Potassium Bromide (KBr) | Matrix for pellet preparation for transmission measurements | Solid powder analysis, minimal spectral interference |
| ATR Crystals (diamond, ZnSe, Ge) | Internal reflection element for ATR measurements | Liquid and solid analysis, minimal sample preparation |
| Certified Reference Materials | Calibration standards with known purity and concentration | Method development and validation |
| Solvents (CDCl₃, DMSO, ACN) | Dissolution medium for liquid samples | Solution-phase analysis, sample homogenization |
| Background Materials | Reference for background spectrum collection | Instrument calibration, background correction |
| Calibration Standards | Known concentration samples for model development | Establishment of concentration-absorbance relationship |
Future Perspectives and Emerging Trends
The field of quantitative infrared spectroscopy continues to evolve, with several emerging trends shaping future applications:
- Miniaturization and portability: Development of handheld and portable IR spectrometers enables field-based quantitative analysis for pharmaceutical screening, agricultural testing, and environmental monitoring [22] [16]
- Advanced machine learning integration: Deep learning and other sophisticated algorithms offer new capabilities for modeling complex spectral-concentration relationships, particularly for biological samples with significant scattering [106] [112]
- Hyperspectral imaging: Combining spatial and spectral information provides new dimensions for quantitative analysis of heterogeneous samples
- Terahertz spectroscopy: Expansion into far-infrared and terahertz regions opens new possibilities for quantifying crystalline forms and low-frequency molecular vibrations
- Process analytical technology (PAT): Increased implementation of IR spectroscopy for real-time monitoring and control of manufacturing processes
These advancements, combined with a deeper understanding of the fundamental principles and limitations of the Beer-Lambert law, will continue to expand the applications and improve the reliability of quantitative infrared spectroscopy across diverse scientific and industrial fields.
For researchers, scientists, and drug development professionals, mastering both the theoretical foundations and practical implementation of quantitative IR methods remains essential for leveraging the full potential of this powerful analytical technique in the study of molecular vibrations and rotations. As the technology continues to evolve, the integration of robust calibration methodologies with advanced computational approaches will further enhance our ability to extract meaningful quantitative information from infrared spectra.
The study of molecular vibrations and rotations forms the cornerstone of infrared (IR) spectroscopy research. When molecules interact with infrared radiation, they undergo vibrational transitions that provide characteristic fingerprints of their chemical structure and composition [2] [113]. These fundamental vibrations, including stretching, bending, scissoring, and twisting motions, occur at frequencies determined by bond strengths and atomic masses, following the harmonic oscillator model where the exact vibration frequency is governed by the equation W = (1/2πc)(K/MR)¹ᐧ⁵, where K represents the force constant and MR the reduced mass of the system [6]. For a molecule with N atoms, 3N-6 possible vibrational modes exist (3N-5 for linear molecules), though not all are IR-active due to selection rules requiring a net change in dipole moment during vibration [2] [24].
In contemporary analytical chemistry, extracting meaningful information from these vibrational signatures requires sophisticated computational approaches. The integration of machine learning with chemometric analysis has revolutionized this field, enabling researchers to transform complex spectral data into accurate predictive models for material characterization, quality control, and pharmaceutical development [114]. This technical guide examines the strategic integration of Bayesian optimization with chemometric modeling, presenting a structured framework for enhancing model performance while maintaining scientific rigor within the context of molecular vibration research.
Table 1: Fundamental Molecular Vibration Types and Their Spectral Characteristics
| Vibration Type | Spectral Region (cm⁻¹) | Physical Motion Description | IR Activity Requirement |
|---|---|---|---|
| Stretching | 2850-3700 | Bond length changes along bond axis | Change in dipole moment |
| Bending | 400-1600 | Bond angle changes | Change in dipole moment |
| Scissoring | 1400-1600 | Two bonds moving toward/away | Change in dipole moment |
| Rocking | 1000-1300 | Bonds moving in-plane together | Change in dipole moment |
| Twisting | 1250-1350 | Bonds moving out-of-phase | Change in dipole moment |
| Wagging | 500-1000 | Bonds moving perpendicular to molecular plane | Change in dipole moment |
Bayesian Optimization in Chemometrics: Theoretical Foundation
The Challenge of Spectral Preprocessing and Model Optimization
Vibrational spectra obtained from IR and Raman spectroscopy inherently contain complex, overlapping absorption bands alongside various noise sources and experimental artifacts. Mid-infrared (MIR) spectra of biological samples like milk, for instance, exhibit convolution from overlapping absorption bands of constituents including fats (C-H stretching at 2922 cm⁻¹ and 2852 cm⁻¹), proteins (amide I band at ~1635 cm⁻¹ and amide II at ~1548 cm⁻¹), and carbohydrates (C-O stretching in lactose at ~1077 cm⁻¹) [115]. These analytical challenges necessitate robust preprocessing pipelines incorporating techniques such as Savitzky-Golay (SG) smoothing, Standard Normal Variate (SNV), Multiplicative Scatter Correction (MSC), and derivative transformations (1D, 2D) to mitigate noise, baseline drift, and scattering effects [116] [115].
Traditional approaches to preprocessing and model parameter selection have relied heavily on empirical trial-and-error or grid search methods, which introduce subjectivity and are often computationally intensive. Grid search methods exhaustively explore predefined parameter combinations but become prohibitively time-consuming when navigating high-dimensional optimization spaces [117]. This limitation is particularly pronounced in complex spectral datasets where optimal preprocessing strategies are highly dataset-specific, with techniques like MSC developed for NIR spectra potentially failing when directly transferred to FTIR applications [115].
Bayesian Optimization Framework
Bayesian optimization (BO) offers a principled, probabilistic framework for efficiently navigating complex parameter spaces. Unlike grid or random search methods, BO employs surrogate models—typically Gaussian processes or Tree-structured Parzen Estimators—to approximate the objective function and guide the search toward promising regions [115] [117]. The algorithm balances exploration (testing uncertain regions) and exploitation (refining known good regions) using an acquisition function, enabling faster convergence to optimal solutions with fewer iterations.
In chemometric applications, BO has demonstrated remarkable efficiency improvements, reducing model optimization time by approximately 90% compared to traditional grid search while simultaneously enhancing predictive accuracy [117]. This approach is particularly valuable for automating the selection of optimal spectral preprocessing pipelines, hyperparameter tuning for machine learning models, and identifying informative spectral regions for analysis.
Table 2: Bayesian Optimization Performance Metrics in Spectroscopic Applications
| Application Domain | Traditional Method | Bayesian Optimization | Performance Improvement |
|---|---|---|---|
| Milk Constituent Analysis [115] | Literature-derived preprocessing | Automated pipeline optimization | Improved RMSEP for protein (0.054) and lactose (0.026) |
| Near-Infrared Spectroscopy [117] | Grid search (313 min) | Bayesian search (31 min) | 90% reduction in optimization time |
| Adulteration Detection [116] | Manual parameter tuning | Bayesian hyperparameter optimization | Enhanced model stability and accuracy |
| PLSR Modeling [118] | Limited parameter search | Expanded parameter space exploration | 26.1% RMSE reduction in testing |
Experimental Protocols and Methodologies
Spectral Data Acquisition and Preprocessing
Sample Preparation and Spectral Collection: For milk powder adulteration studies, prepare authentic camel milk powder alongside potential adulterants (goat milk powder, cow milk powder, soy protein). Weigh samples to create adulteration series (0%, 10%, 20%, 30%, 40%, 50% adulterant concentrations). For liquid samples, utilize appropriate cell pathlengths and ensure consistent temperature control during measurement. Acquire spectra using FTIR or NIR instruments, recording multiple scans per sample to improve signal-to-noise ratio [116] [115].
Spectral Preprocessing Techniques:
- Savitzky-Golay Smoothing: Apply convolution with polynomial fitting to reduce high-frequency noise while preserving spectral features. Typical parameters: 2nd-order polynomial, 9-15 point window.
- Standard Normal Variate (SNV): Normalize each spectrum to zero mean and unit variance to correct for pathlength effects and scatter.
- Multiplicative Scatter Correction (MSC): Model and remove scattering effects based on mean spectrum reference.
- Derivative Transformations: Compute 1st and 2nd derivatives using Savitzky-Golay algorithms to resolve overlapping peaks and remove baseline effects.
- Baseline Correction: Identify and subtract polynomial baselines to eliminate fluorescence and background effects [116] [115].
Bayesian Optimization Implementation
Defining the Search Space: Establish comprehensive parameter domains for preprocessing sequences, machine learning hyperparameters, and feature selection options. For preprocessing, include options for scaling methods, smoothing parameters, derivative orders, and wavelength selection ranges. For machine learning models such as Support Vector Machines (SVM), Gradient Boosting Machines (GBM), Random Forest (RF), and Partial Least Squares Regression (PLSR), define relevant hyperparameter ranges (e.g., regularization parameters, learning rates, number of components) [116] [115] [117].
Objective Function Specification: Implement k-fold cross-validation (typically k=5 or k=10) to evaluate each parameter configuration, using performance metrics such as Root Mean Square Error of Cross-Validation (RMSECV) or coefficient of determination (R²) as optimization targets. Employ group-aware splitting strategies when dealing with replicated measurements to prevent data leakage [115].
Optimization Execution: Initialize with random parameter combinations, then iteratively evaluate promising configurations guided by the acquisition function. Continue until convergence criteria are met (e.g., minimal improvement over successive iterations or maximum evaluation budget). The output is the parameter set maximizing predictive performance on validation data [115] [117].
Model Validation and Stacking Protocols
Validation Framework: Implement rigorous train-test splits using group-aware variations of the Kennard-Stone algorithm to ensure representative sampling. Allocate approximately 70% of samples to training and 30% to testing. For calibration models, report Root Mean Square Error of Prediction (RMSEP), R² values, and bias statistics on independent test sets [115].
Model Stacking Methodology: Develop stacked ensembles by combining predictions from multiple top-performing models optimized through Bayesian methods. Implement a meta-learner (often linear regression or simple neural network) to optimally weight individual model predictions. This approach leverages diverse model strengths, typically resulting in enhanced robustness and predictive performance compared to single-model approaches [117].
The Scientist's Toolkit: Essential Research Reagents and Materials
Table 3: Essential Materials and Computational Tools for Chemometric Research
| Item Name | Specification/Type | Primary Function in Research |
|---|---|---|
| FTIR Spectrometer | ATR-FTIR or transmission mode | Molecular vibration measurement via infrared absorption |
| Reference Materials | Pure chemical standards | Spectral calibration and method validation |
| Potassium Bromide (KBr) | FTIR grade, purified | Preparation of pellets for solid sample analysis |
| Spectral Preprocessing Software | Python (Scikit-learn, SciPy) or MATLAB | Implementation of SNV, MSC, SG smoothing, derivatives |
| Bayesian Optimization Libraries | Scikit-optimize, BayesianOptimization | Automated hyperparameter tuning and pipeline optimization |
| Chemometric Modeling Tools | PLS toolbox, custom Python/R code | Multivariate calibration and classification model development |
| Portable NIR Spectrometers | NeoSpectra Scanner, MEMS-based systems | Field-based analysis and rapid screening applications |
Advanced Integration: From Molecular Vibrations to Predictive Analytics
The integration of molecular vibration theory with machine learning creates a powerful analytical framework where physical principles guide computational approaches. The characteristic absorption frequencies of functional groups—C=O stretches at 1700-1750 cm⁻¹, O-H stretches at 3200-3600 cm⁻¹, and C-H stretches at 2800-3000 cm⁻¹—provide the fundamental features that machine learning models leverage for prediction [24]. Advanced AI architectures, including graph neural networks and physics-informed machine learning, now enable more accurate prediction of vibrational spectra and dynamics without exhaustive quantum mechanical calculations [114].
The integration of multiple spectroscopic techniques (IR, Raman, NIR) through data fusion approaches further enhances analytical capabilities by capturing complementary vibrational information. IR spectroscopy detects vibrations with dipole moment changes, while Raman is sensitive to polarizability changes, providing orthogonal data dimensions that, when combined, offer a more comprehensive molecular view [116] [114].
Future Perspectives and Emerging Trends
The fusion of Bayesian optimization with chemometric modeling represents a paradigm shift in spectroscopic analysis, moving from heuristic approaches to data-driven, automated workflows. Emerging trends include the development of foundation models reusable across spectroscopic tasks, physics-informed machine learning that incorporates known scientific constraints, and Bayesian inference methods that provide confidence metrics alongside predictions [114]. These advancements promise to further democratize advanced spectroscopic analysis, making robust chemometric modeling accessible to non-specialists while accelerating research in pharmaceutical development, food quality monitoring, and materials characterization.
As these methodologies continue to evolve, the fundamental connection between molecular vibrations and spectral signatures will remain the physical foundation supporting increasingly sophisticated computational approaches. This synergy between physical chemistry and machine learning continues to expand the boundaries of what can be determined from the interaction of light with matter.
In infrared spectroscopy research, the precise analysis of molecular vibrations and rotations is foundational to understanding molecular structure and dynamics. The integrity of this data is inextricably linked to the operational state of the instrumentation. This guide details the essential maintenance protocols for Attenuated Total Reflectance (ATR) crystals, desiccant systems, and spectral alignment verification. Adherence to these procedures ensures the accuracy and reproducibility of spectroscopic data, thereby upholding the scientific rigor of research and drug development workflows.
ATR Crystal Care and Selection
Fundamentals of ATR Operation
Attenuated Total Reflectance (ATR) is the predominant sampling technique in modern FT-IR spectroscopy. Its operation relies on the principle of internal reflection. An infrared beam is directed through an ATR crystal, which has a high refractive index, at an angle that causes the light to be internally reflected when it encounters a sample with a lower refractive index [119] [120]. During each reflection, an evanescent wave penetrates a short distance (typically 0.5 to 2 microns) into the sample, where it is absorbed by the molecular constituents [119]. This interaction generates the absorption spectrum. The key advantage of ATR is its minimal sample preparation requirement for analyzing solids, liquids, pastes, and films, making it a versatile and non-destructive technique [119].
ATR Crystal Material Selection
Choosing the appropriate crystal material is critical for successful analysis and instrument longevity. Each material offers a unique combination of physical and optical properties suited for different sample types [119].
Table 1: Comparison of Common ATR Crystal Materials
| Property | Diamond (Di) | Germanium (Ge) | Zinc Selenide (ZnSe) |
|---|---|---|---|
| Accessible Spectral Range (cm⁻¹) | 45,000 - 10 | 5,000 - 600 | 20,000 - 500 [119] |
| Hardness (Knoop) | 9,000 | 550 | 130 [119] |
| Refractive Index | 2.40 | 4.01 | 2.43 [119] |
| Penetration Depth (µm) | 1.66 | 0.65 | 1.66 [119] |
| Chemical/Physical Inertness | Very High | Medium-High | Low [119] |
| Best For | Universal use, hard solids, high-pressure accessories | Strongly absorbing materials, high refractive index samples (e.g., carbon-filled rubber), surface analysis of thin films | General purpose use with non-reactive samples [119] [120] |
| Key Limitations | Higher cost; not suitable for very high refractive index samples | Narrow spectral range; fragile and easily scratched; weaker signal | Low chemical resistance; damaged by acids (pH<5) and strong bases (pH>9); can produce toxic gas [119] [120] |
ATR Crystal Cleaning and Handling Protocols
Proper cleaning is essential to prevent cross-contamination and maintain signal quality.
- Routine Cleaning: After analysis, gently wipe the crystal surface with a soft, lint-free cloth moistened with a mild solvent such as isopropyl alcohol [119]. For stubborn residues, a soft cloth with a small amount of detergent can be used, followed by a rinse with deionized water and a final wipe with alcohol.
- Handling Precautions: Avoid using sharp objects that could scratch the crystal. Apply only sufficient pressure to ensure good optical contact with the sample, especially when using a pressure clamp [119].
- Material-Specific Warnings:
- Zinc Selenide (ZnSe): This crystal is particularly susceptible to damage from acids and strong bases. Exposure to acidic conditions (pH < 5) can produce hydrogen selenide (SeH₂), a toxic and flammable gas [119]. Always verify sample compatibility.
- Germanium (Ge): Handle with care to avoid scratches and dents from harder samples due to its relative softness [119].
- Diamond: While extremely durable, it is not indestructible and should still be treated with care.
Desiccant Replacement and Humidity Control
The Critical Role of Desiccation
FT-IR spectrometers are highly sensitive to atmospheric moisture. Water vapor absorbs infrared radiation strongly, leading to interfering absorption bands that can obscure sample signals and degrade data quality. More critically, hygroscopic optics within the interferometer can be permanently damaged upon exposure to humid air, leading to costly repairs and downtime [121]. Maintaining a dry internal environment with desiccant is therefore a fundamental aspect of instrument preservation.
Desiccant Replacement Procedure
The following consolidated protocol is based on standard manufacturer procedures [121] [122].
Table 2: Essential Materials for Desiccant Replacement
| Item | Function |
|---|---|
| Molecular Sieve (Recommended) or Silica Gel | Primary desiccant material that adsorbs water vapor [121]. |
| Dry Nitrogen Gas (Optional but Recommended) | Creates a positive pressure purge to protect hygroscopic optics during the replacement procedure [121]. |
| New Humidity Indicator Card | Monitors the internal humidity level; typically changes color (e.g., from blue to pink) when saturated [122]. |
| New O-Ring | Ensures an airtight seal for the desiccant compartment [122]. |
| Tools: Phillips screwdriver, hex key | For accessing and servicing the desiccant assembly [121] [122]. |
Experimental Protocol:
Preparation:
- If available, connect a dry nitrogen purge line to the instrument's purge port and begin a slow flow (approximately 5 standard cubic feet per hour) to protect the optics [121].
- For systems without a purge, it is recommended to leave the spectrometer powered on to keep the optics warm, which provides some protection against condensation [121].
- Gather all required tools and replacement materials.
Removal of Old Desiccant:
- Locate and remove the desiccant cartridge or module from the side of the interferometer case, typically by loosening captive screws or unscrewing the module counterclockwise [121] [122].
- If no purge is in use, temporarily seal the opening on the instrument with tape to minimize humidity ingress [121].
- Dismantle the desiccant module, discard the old O-ring, and pour out the saturated desiccant for proper disposal [122].
Installation of New Desiccant:
- Fill the clean desiccant tube with fresh desiccant. Molecular sieve is highly recommended for its superior adsorption capacity [121].
- Peel the old humidity indicator from its window and replace it with a new one, handling it with gloves to avoid contamination [122].
- Reassemble the module with a new O-ring to ensure a proper seal [122].
Re-installation and Verification:
- Re-insert the desiccant cartridge into the instrument, ensuring the O-ring is correctly seated. Tighten the screws to secure it [122].
- If a nitrogen purge was used, continue purging for several minutes after re-installation before disconnecting [121].
- Power on the spectrometer and verify that the new humidity indicator shows a dry condition (e.g., blue) [122].
Alignment Verification and Performance Qualification
The Necessity of X-Axis Alignment
The accuracy of the wavelength or wavenumber (x-axis) is a foundational assumption in all qualitative and quantitative spectroscopic analyses [123]. Misalignment can lead to incorrect peak assignments, faulty compound identification, and inaccurate quantitative results. Regular verification using certified reference materials is therefore essential for data integrity.
Standard Reference Materials and Experimental Protocols
A variety of stable reference materials are used to verify and calibrate the x-axis across different spectral regions [123].
Table 3: Common Wavelength/Wavenumber Reference Standards
| Standard Material | Spectral Region | Certified Peak Locations (Examples) | Experimental Protocol |
|---|---|---|---|
| Holmium Oxide Solution or Glass [123] | Ultraviolet-Visible (UV-Vis) | Multiple sharp peaks between 240-650 nm (e.g., 241.5 nm, 287.5 nm) [123] | Place the sealed quartz cell (solution) or glass filter in the sample beam and acquire a transmission spectrum. Compare peak maxima to certified values. |
| Polystyrene Film [123] [122] | Near-Infrared (NIR) & Mid-Infrared | Multiple sharp peaks, e.g., 1028.0 cm⁻¹, 1155.3 cm⁻¹, 1601.8 cm⁻¹, 1946.0 nm, 2166.0 nm [123] | Place the film in the sample compartment. Acquire a transmission or reflectance spectrum. Use the known peak positions to verify instrument calibration. |
| NIST SRM 2036 (Glass Filter) [123] | Visible to Near-Infrared | 11 characterized peaks in the visible region (e.g., 334 nm, 536 nm) [123] | Place the standard in the sample compartment for a reflectance measurement. Acquire a spectrum and verify peak positions against the certificate. |
Workflow for Instrument Performance Verification: Modern FT-IR instruments often include automated software workflows for performance qualification [122]. The general procedure involves:
- System Preparation: Ensure the instrument is powered on and thermally stabilized (which can take up to 12 hours for highest accuracy). Ensure no sampling accessory is installed in the main compartment [122].
- Optical Alignment: Execute the software's alignment routine (e.g., via
Acquire Data > Diagnostics > Align Spectrometer) to optimize signal throughput [122]. - Laser Calibration: Perform the laser calibration routine (e.g.,
Acquire Data > Diagnostics > Laser Calibration) to ensure the precision of the interferometer's internal laser [122]. - Qualification with Reference Material: Run a factory qualification workflow (e.g.,
Nicolet FTIR - Factory Qualification) using a polystyrene reference material positioned inside the spectrometer. This automated workflow runs a series of tests to verify x-axis accuracy, photometric linearity, and other critical performance parameters [122].
The Scientist's Toolkit: Essential Research Reagents and Materials
Table 4: Key Materials for FT-IR Instrument Maintenance and Operation
| Item | Function/Benefit |
|---|---|
| Diamond ATR Crystal | A universal, highly durable, and chemically resistant crystal ideal for a vast range of samples, minimizing the need for multiple crystal types [119] [120]. |
| Molecular Sieve Desiccant | Preferred desiccant for its high adsorption capacity and efficiency in maintaining a dry environment within the spectrometer optics cavity [121]. |
| Certified Polystyrene Film | A stable and widely used reference material for verifying wavenumber accuracy and performing routine instrument qualification in the mid-IR and NIR regions [123] [122]. |
| Holmium Oxide Wavelength Standard | Traceable to NIST SRM 2034, this standard (in liquid or glass form) is essential for calibrating and verifying the x-axis accuracy of UV-Vis and UV-Vis-NIR spectrophotometers [123]. |
| Isopropyl Alcohol & Lint-Free Wipes | Essential for safe and effective cleaning of ATR crystals without introducing scratches or fibrous contaminants [119]. |
The fidelity of data in infrared spectroscopy, which probes the fundamental molecular vibrations and rotations that form a material's identity, is directly dependent on instrument health. A disciplined maintenance regimen encompassing appropriate ATR crystal care, proactive control of the internal environment through desiccant replacement, and regular verification of spectral alignment forms the cornerstone of reliable spectroscopic research. For scientists in drug development and materials characterization, where results must be both precise and reproducible, these procedures are not merely optional upkeep but are integral to ensuring scientific rigor and data integrity.
Appendix: Maintenance Workflow Diagram
The following diagram illustrates the logical relationship and recommended frequency for the key maintenance activities detailed in this guide.
Validation Frameworks and Comparative Analysis: IR Spectroscopy vs Complementary Techniques
Fourier transform infrared (FT-IR) spectroscopy has become one of the most widely used analytical methods in modern laboratories because virtually all molecules absorb some infrared (IR) radiation in characteristic ways [74]. This guide establishes method validation protocols specifically for FT-IR spectroscopy within the broader research context of molecular vibrations and rotations. When IR radiation interacts with a sample, specific frequencies are absorbed that correspond to molecular bond vibrations, such as stretching, bending, or twisting of dipoles [74]. Successful validation ensures that the data collected on these molecular vibrations—whether for basic research, material characterization, or pharmaceutical development—are reliable, reproducible, and fit for purpose.
The energy of IR radiation is weaker than that of visible and ultraviolet radiation, and absorption of IR radiation is typical of molecular species that have a small energy difference between the rotational and vibrational states [2]. A criterion for IR absorption is a net change in dipole moment in a molecule as it vibrates or rotates [2]. For a vibrational mode to be IR-active and thus detectable, there must be a change in the dipole moment of the molecule during the vibration [5]. This fundamental principle underpins all subsequent validation efforts, as the intensity of an absorption band is proportional to the square of the change in the dipole moment during the vibration [5].
Core Validation Parameters in FT-IR Spectroscopy
Defining Reproducibility, Precision, and Sensitivity
For FT-IR spectroscopy methods, validation requires demonstrating that the protocols consistently produce results that accurately reflect the molecular vibrations and chemical composition of samples. The three core parameters discussed herein form the foundation of method validity:
- Reproducibility refers to the agreement between results obtained from the same method applied to the same samples under different conditions (different instruments, operators, laboratories, or time periods).
- Precision quantifies the degree of agreement among independent test results obtained under stipulated conditions, typically measured as repeatability (same conditions) and intermediate precision (different days, analysts, or instruments).
- Sensitivity encompasses the method's ability to detect small changes in analyte concentration or structural features, typically defined via detection limit (LOD) and quantification limit (LOQ).
These parameters are particularly crucial when FT-IR is deployed for quantitative analysis, such as in pharmaceutical quality control or environmental monitoring, where the absorbance of IR radiation follows the Beer-Lambert law [74] [5].
Key Advantages of FT-IR for Quantitative Analysis
Compared with dispersive IR instruments, FT-IR spectrometers offer higher signal-to-noise ratios, better spectral resolution, faster data collection, and more reliable calibration transfer [74]. These advantages stem from three fundamental principles of the Fourier transform approach:
- Fellgett's (multiplex) advantage: Simultaneous measurement of all wavelengths improves signal-to-noise ratio [74].
- Jacquinot's (throughput) advantage: Fewer optical slits mean higher energy throughput [74].
- Connes' advantage: High precision of wavelength calibration derived from an internal laser reference [74].
These inherent benefits provide FT-IR with a solid foundation for method validation, particularly for precision and reproducibility measurements across different instrument platforms.
Experimental Protocols for Validation
Protocol for Reproducibility Assessment
Reproducibility assessment evaluates the method's robustness across different instruments, operators, and laboratories. The following protocol provides a systematic approach:
- Sample Preparation: Prepare a standardized validation sample set using certified reference materials with known spectral characteristics. For protein studies, Jiang and coauthors qualified FT-IR for quantifying protein secondary structure using standardized protein solutions [74]. Similarly, for polymer analysis, He and Inoue demonstrated an FT-IR curve-fitting method for determining crystallinity in poly(ε-caprolactone) [74].
- Cross-Laboratory Testing: Distribute identical sample sets to multiple laboratories (at least 3), analysts, and instrument platforms. Ensure all participants follow the identical standardized protocol.
- Data Collection: Collect spectra using consistent parameters:
- Spectral resolution: Typically 4 cm⁻¹ suffices for most analyses [74]
- Number of scans: 32-64 scans provide optimal signal-to-noise balance
- Spectral range: 4000-400 cm⁻¹ for mid-IR region
- Sampling technique: Consistent across all tests (e.g., ATR with same crystal material)
- Data Analysis: Calculate reproducibility using statistical measures:
- Interlaboratory standard deviation (sR)
- Relative standard deviation for reproducibility (RSDR)
- Coefficient of variation (CV) between instruments
Table 1: Acceptance Criteria for Reproducibility Assessment
| Parameter | Acceptance Criterion | Typical Range in FT-IR |
|---|---|---|
| Peak Position Reproducibility | ≤ ±2 cm⁻¹ | ±1-2 cm⁻¹ for sharp bands |
| Absorbance Reproducibility | RSD ≤ 5% | 2-5% for most applications |
| Spectral Shape Consistency | Visual match >95% | Quantitative similarity index |
Protocol for Precision Measurement
Precision evaluation focuses on the method's variability under same conditions (repeatability) and with minor changes (intermediate precision):
Repeatability Assessment:
- Analyze a minimum of 6 replicates of the same sample homogenate
- Maintain identical conditions: same instrument, same analyst, same day
- Prepare samples independently from the same homogeneous batch
- Calculate mean, standard deviation, and relative standard deviation (RSD)
Intermediate Precision:
- Conduct analyses over different days (at least 3) with different analysts
- Use different instruments of the same model and configuration
- Incorporate minor deliberate variations in sample preparation
- Apply statistical analysis using one-way ANOVA to separate components of variance
Data Quality Metrics:
- Monitor signal-to-noise ratio at characteristic frequencies
- Track baseline stability and water vapor/CO₂ interference levels
- Document any spectral artifacts or anomalies
In practical applications, such as protein structural analysis, researchers have demonstrated >90% reproducibility in replicate spectra and sensitivity to conformational changes due to pH or denaturants [74]. This level of precision enables detection of subtle structural changes in biomolecules.
Protocol for Sensitivity Determination
Sensitivity assessment establishes the method's detection and quantification capabilities:
Detection Limit (LOD) Determination:
- Prepare a series of standard solutions with decreasing concentrations
- Analyze a minimum of 10 blank samples to establish baseline noise
- Calculate LOD using the formula: LOD = 3.3 × σ/S
- Where σ is the standard deviation of the blank response and S is the slope of the calibration curve
Quantification Limit (LOQ) Determination:
- Use the calibration curve methodology with low-concentration standards
- Calculate LOQ using the formula: LOQ = 10 × σ/S
- Verify LOQ by analyzing samples at the calculated concentration with precision ≤20% RSD
Signal-to-Noise Optimization:
- Implement signal averaging through multiple scans
- Optimize aperture settings for throughput/resolution balance
- Use appropriate apodization functions to minimize spectral artifacts
The NIST Quantitative Infrared Database provides absorption coefficient spectra of volatile organic compounds with detailed uncertainty estimates, serving as a valuable reference for sensitivity assessments [124]. The database includes uncertainty estimates for absorption coefficients, which can be used to establish confidence intervals for detection and quantification limits [124].
The Scientist's Toolkit: Essential Research Reagent Solutions
Successful FT-IR method validation requires specific materials and reagents tailored to different sample types and analytical questions. The selection of appropriate tools directly impacts the quality and reliability of vibrational data.
Table 2: Essential Materials for FT-IR Method Validation
| Item Name | Function/Application | Key Considerations |
|---|---|---|
| ATR Crystals (Diamond, ZnSe, Ge) | Enables direct analysis of solids, liquids, and gels without extensive preparation [74] | Diamond: durable, chemical inert; ZnSe: wider spectral range; Ge: high refractive index |
| KBr Plates | Creation of pellets for transmission measurements of solid samples [24] | Must be kept dry; hygroscopic; excellent transmission in mid-IR region |
| NIST Traceable Standards | Instrument calibration and method validation [124] | Provides quantitative reference with uncertainty estimates |
| Perchlorinated Solvents (CCl₄, CHCl₃) | Solvent for dissolution of organic compounds for transmission IR [24] | Minimal IR absorption in fingerprint region; appropriate safety precautions needed |
| Background Reference Materials | For proper background correction [74] | Clean IRE or solvent reference; essential for correcting atmospheric water vapor and CO₂ |
| Protein Stability Standards | Validation of biomolecular FT-IR methods [74] | Well-characterized proteins with stable secondary structure |
Workflow Visualization for Method Validation
The following workflow provides a systematic approach to FT-IR method validation, integrating all aspects of reproducibility, precision, and sensitivity assessment:
Data Analysis and Acceptance Criteria
Statistical Treatment of Validation Data
Proper statistical analysis is essential for demonstrating method validity. The following approaches are recommended for FT-IR method validation:
- Variance Component Analysis: Separate and quantify sources of variability (instrument, operator, day-to-day) using ANOVA techniques.
- Correlation Analysis: Assess linear relationship between expected and observed values for quantitative methods.
- Control Charting: Implement statistical process control for ongoing method verification.
- Uncertainty Budgeting: Combine all uncertainty components following ISO guidelines as demonstrated in the NIST database, where uncertainty is expressed as an expanded uncertainty U = kuc, with the combined standard uncertainty uc determined from experimental standard uncertainties, and a coverage factor of k = 2 [124].
Establishing Acceptance Criteria
Validation criteria should be established based on the method's intended use and analytical requirements:
Table 3: Summary of Validation Acceptance Criteria
| Validation Parameter | Specific Measurements | Typical Acceptance Criteria |
|---|---|---|
| Precision | Repeatability (RSD) | ≤5% for absorbance measurements |
| Intermediate Precision (RSD) | ≤10% across days/analysts | |
| Reproducibility | Cross-instrument peak position | ≤±2 cm⁻¹ |
| Cross-laboratory quantitation | RSD ≤15% | |
| Sensitivity | Detection Limit (LOD) | Signal-to-noise ≥3:1 |
| Quantification Limit (LOQ) | Signal-to-noise ≥10:1, RSD ≤20% | |
| Linearity | Correlation coefficient (R²) | ≥0.995 across working range |
Advanced Considerations in FT-IR Validation
Method Transfer and Harmonization
When transferring validated methods between laboratories or implementing standardized protocols, additional considerations emerge:
- Calibration Transfer: Ensure consistent wavelength and intensity calibration across instruments using certified standards [124].
- Harmonization Challenges: As demonstrated in studies of oxidation in reclaimed asphalt binders, challenges can arise in harmonizing index calculations across laboratories [74].
- Data Processing Consistency: Standardize baseline correction, normalization, and peak-picking algorithms to minimize inter-laboratory variability.
Troubleshooting Common Validation Failures
Common issues in FT-IR method validation and their solutions include:
- Poor Reproducibility: Often caused by inconsistent sample preparation, environmental factors, or instrumental drift. Solution: Implement stricter control of sample preparation protocols and environmental conditions.
- Insufficient Sensitivity: May result from suboptimal sampling technique or inadequate signal averaging. Solution: Evaluate alternative sampling methods (e.g., transmission vs. ATR) and optimize measurement parameters.
- Spectral Artifacts: Caused by water vapor, CO₂ interference, or detector nonlinearities. Solution: Implement proper purging, background correction, and validate detector linearity.
Proper background referencing is essential for minimizing atmospheric interference. A clean internal reflection element (IRE) or solvent reference should be recorded before each sample run to correct for atmospheric water vapor and CO₂ absorptions [74].
Comprehensive validation of FT-IR methods ensuring reproducibility, precision, and sensitivity is fundamental to generating reliable data in vibrational spectroscopy research. The protocols outlined in this guide provide a framework for establishing method validity across diverse applications—from pharmaceutical analysis to environmental monitoring and materials characterization. As FT-IR techniques continue to evolve with advancements in microspectroscopy, synchrotron-based methods, and computational analysis, rigorous validation remains the cornerstone of scientific credibility. By implementing these systematic validation approaches, researchers can ensure their FT-IR methods produce data of sufficient quality to draw meaningful conclusions about molecular structures and interactions, ultimately advancing scientific understanding across multiple disciplines.
The core principle of infrared spectroscopy lies in probing molecular vibrations and rotations, which serve as a unique fingerprint for chemical and biological structures. When molecules are exposed to infrared radiation, they absorb energy at specific frequencies corresponding to the natural vibrations of their chemical bonds. These vibrations include stretching (symmetrical and asymmetrical) and bending motions, which are precisely determined by atomic masses, bond strengths, and molecular geometry. Fourier-transform infrared (FT-IR) spectroscopy capitalizes on this fundamental phenomenon by measuring the absorption of infrared light as a function of wavelength, producing a spectrum that reflects the complete molecular composition of a sample. In clinical diagnostics, this molecular "fingerprint" provides a powerful tool for detecting disease-specific changes in biofluids and tissues, enabling non-destructive, rapid analysis that complements traditional analytical techniques like mass spectrometry (MS).
Mass spectrometry operates on fundamentally different principles, separating ions based on their mass-to-charge ratio rather than probing vibrational characteristics. However, the growing integration of these platforms in clinical settings warrants a detailed comparison of their respective strengths, limitations, and diagnostic performance. This technical review examines the comparative utility of FT-IR spectroscopy and mass spectrometry for clinical diagnostic applications, with a specific focus on their operational parameters, performance metrics, and implementation requirements within the framework of molecular vibration-based analysis.
Theoretical Foundations and Diagnostic Principles
FT-IR Spectroscopy: Capturing Molecular Vibrational Signatures
FT-IR spectroscopy measures the absorption of infrared radiation by molecular bonds within a sample, resulting in vibrational transitions that provide detailed chemical structure information. The technique operates on the principle that different functional groups absorb characteristic mid-infrared frequencies, creating a spectral "fingerprint" that is highly sensitive to molecular changes caused by disease states. In clinical applications, FT-IR analysis of biofluids (e.g., plasma, serum) detects subtle biochemical alterations in proteins, lipids, carbohydrates, and nucleic acids that occur during pathological processes. The diagnostic approach typically employs pattern recognition algorithms and machine learning to classify samples based on their spectral signatures rather than targeting specific individual biomarkers.
The clinical workflow for FT-IR spectroscopy involves several standardized steps: sample preparation typically includes drying thin films of biofluids on infrared-transpatible substrates, spectral acquisition across the mid-infrared range (400-4,000 cm−1), preprocessing (normalization, baseline correction, and noise reduction), and multivariate statistical analysis for diagnostic classification. This methodology provides a comprehensive snapshot of the sample's biochemical composition without requiring extensive sample preparation or labeling, making it particularly suitable for rapid screening applications in resource-limited settings [125] [126] [38].
Mass Spectrometry: Targeted and Untargeted Biomarker Analysis
Mass spectrometry, particularly liquid chromatography-mass spectrometry (LC-MS/MS), identifies and quantifies specific molecules based on their mass and fragmentation patterns. Unlike FT-IR's vibrational approach, MS provides structural information by measuring the mass-to-charge ratio of ionized molecules and their fragments. Clinical applications predominantly use targeted MS for precise quantification of known biomarkers or untargeted proteomic/metabolomic approaches for biomarker discovery. Tandem mass tag (TMT) LC-MS/MS enables multiplexed protein quantification across multiple samples, facilitating comprehensive proteomic profiling that can identify disease-specific protein signatures and pathway alterations.
The MS clinical workflow is typically more complex, involving protein extraction, digestion, purification, chromatographic separation, ionization, mass analysis, and data processing. This multi-step process provides exceptional specificity and sensitivity for biomarker detection but requires more extensive sample preparation and longer analysis times compared to FT-IR approaches. The technique excels at identifying specific molecular entities and their modifications, offering complementary advantages to vibrational spectroscopy methods in comprehensive diagnostic platforms [125] [127].
Comparative Performance Analysis
Diagnostic Performance Metrics
Recent clinical studies directly comparing FT-IR spectroscopy and mass spectrometry provide valuable insights into their relative performance characteristics. The table below summarizes quantitative performance metrics from a controlled study evaluating both techniques for fracture-related infection (FRI) diagnosis:
Table 1: Direct Performance Comparison of FT-IR and Mass Spectrometry for FRI Diagnosis [125] [128]
| Performance Metric | FT-IR Spectroscopy | Mass Spectrometry |
|---|---|---|
| Area Under ROC (AUROC) | 0.803 (CI95: 0.8-0.81) | 0.735 (CI95: 0.732-0.737) |
| Sensitivity | 0.755 (CI95: 0.75-0.76) | 0.74 (CI95: 0.739-0.747) |
| Specificity | 0.677 (CI95: 0.672-0.682) | 0.653 (CI95: 0.649-0.656) |
| Sample Size (FRI/Control) | 13/13 | 13/13 |
| Analysis Approach | Spectral pattern recognition | Protein abundance ratios |
In this head-to-head comparison, FT-IR demonstrated moderately superior performance across all metrics, suggesting its strong potential for diagnostic classification applications. The pattern recognition approach of FT-IR effectively captured the systemic biochemical changes associated with infection without requiring prior knowledge of specific biomarkers.
Additional studies support the robust diagnostic capability of FT-IR spectroscopy in other clinical contexts. Research on arboviral infections (dengue and chikungunya) demonstrated exceptional classification performance with FT-IR, achieving an AUC of 1.000, sensitivity of ≥0.989, and specificity of ≥0.989 when combined with support vector machine models. This performance substantially exceeded traditional ELISA and RT-PCR methods while providing results in under 30 minutes without reagents [126].
Operational and Implementation Characteristics
Beyond diagnostic accuracy, practical implementation factors significantly influence technique selection for clinical applications:
Table 2: Operational Characteristics Comparison for Clinical Deployment
| Parameter | FT-IR Spectroscopy | Mass Spectrometry |
|---|---|---|
| Sample Preparation | Minimal (dilution, drying) | Extensive (digestion, purification) |
| Analysis Time | Minutes per sample | Hours to days |
| Cost Per Sample | Low | Moderate to High |
| Throughput | High | Moderate |
| Required Expertise | Moderate | Advanced |
| Biomarker Specificity | Pattern-based | Molecular-level |
| Regulatory Status | Emerging | Established |
FT-IR offers significant advantages in speed, cost, and operational simplicity, making it particularly suitable for screening applications and resource-limited settings. Mass spectrometry provides unparalleled molecular specificity and established regulatory pathways for clinical validation, advantageous for definitive diagnostic testing where specific biomarker quantification is required [125] [126] [127].
Experimental Protocols and Methodologies
FT-IR Spectroscopy Protocol for Plasma Analysis
The following detailed methodology is adapted from standardized protocols for clinical FT-IR analysis of plasma samples [125] [129]:
Sample Preparation:
- Thaw frozen plasma samples at room temperature (22°C)
- Dilute samples with potassium thiocyanate (KSCN) internal standard in a 2:1 ratio (sample:KSCN)
- Deposit three 8μL replicates of each diluted sample onto a 96-welled silicon microplate
- Air-dry samples at room temperature (20-22°C) for minimum 2 hours to form homogeneous films
Spectral Acquisition:
- Load microplate into FT-IR spectrometer with multi-sampler attachment (e.g., Bruker INVENIO S)
- Acquire mid-infrared absorption spectra in wavenumber range 400-4,000 cm−1
- Use OPUS software (version 6.5 or compatible) for instrument control
- Collect 512 interferograms per spectrum, Fourier transformed to 4 cm−1 resolution
- Measure background spectrum using empty well on each plate
Data Preprocessing:
- Normalize spectra to total area under the curve
- Apply additive log-ratio normalization to KSCN peak (≈2050 cm−1)
- Implement Savitzky-Golay filtering for baseline correction and noise reduction
- Remove KSCN spectral region
- Apply discrete cosine transform (DCT) to convert data to frequency domain
- Use principal component analysis (PCA) for dimensionality reduction
Pattern Recognition Analysis:
- Divide dataset into training and validation subsets (typical 70:30 ratio)
- Develop predictive models using machine learning algorithms (support vector machines, random forest, or neural networks)
- Optimize model parameters through cross-validation
- Validate model performance on independent test set
- Calculate performance metrics (AUROC, sensitivity, specificity) with confidence intervals
Mass Spectrometry Protocol for Plasma Proteomics
The following TMT LC-MS/MS methodology enables comprehensive proteomic analysis for diagnostic applications [125] [127]:
Sample Preparation and Protein Digestion:
- Extract proteins from plasma samples using appropriate lysis buffer
- Quantify protein concentration with bicinchoninic acid (BCA) assay
- Reduce disulfide bonds with 5mM dithiothreitol (37°C, 60 minutes)
- Alkylate cysteine residues with 15mM iodoacetamide (room temperature, 30 minutes in dark)
- Digest proteins with sequencing-grade trypsin (1:50 enzyme-to-protein ratio, 37°C, 16 hours)
- Desalt peptides using C18 solid-phase extraction cartridges
Tandem Mass Tag Labeling:
- Reconstitute dried peptide samples in 50mM HEPES buffer (pH 8.5)
- Label peptides with TMT reagents (incubate at room temperature for 1 hour)
- Quench reaction with 5% hydroxylamine (15 minutes)
- Combine labeled samples in equal ratios
- Desalt pooled sample using C18 cartridge
LC-MS/MS Analysis:
- Separate peptides using reverse-phase nano-liquid chromatography (e.g., 2-hour gradient)
- Ionize peptides using nanospray source
- Acquire mass spectra on Orbitrap mass analyzer (resolution: 120,000 for MS1)
- Select top 20 most intense ions for fragmentation via higher-energy collisional dissociation (HCD)
- Acquire MS2 spectra at resolution 50,000
- Implement real-time search exclusion for selected ions
Data Processing and Statistical Analysis:
- Process raw files using proteomic software (MaxQuant, Proteome Discoverer)
- Search spectra against human protein database
- Apply false discovery rate threshold of 1% at protein and peptide levels
- Normalize protein abundance values across samples
- Perform statistical analysis (t-tests, ANOVA) to identify differentially abundant proteins
- Conduct pathway analysis using databases (Reactome, KEGG) to identify affected biological processes
Visualizing Analytical Workflows
Essential Research Reagent Solutions
Table 3: Key Research Reagents and Materials for Clinical Spectroscopy Applications
| Reagent/Material | Function | Application Examples |
|---|---|---|
| Potassium Thiocyanate (KSCN) | Internal standard for spectral normalization | FT-IR plasma analysis [125] |
| Tandem Mass Tags (TMT) | Multiplexed protein quantification | LC-MS/MS proteomics [125] [127] |
| Sequencing-grade Trypsin | Protein digestion to peptides | Sample preparation for MS [125] |
| EDTA Plasma Collection Tubes | Sample collection and preservation | Standardized biofluid sampling [125] [129] |
| C18 Solid-Phase Extraction Cartridges | Peptide cleanup and desalting | MS sample preparation [127] |
| Silicon Microplates | FT-IR sample substrate | Spectral acquisition of dried films [125] |
| HEPES Buffer | pH control for labeling reactions | TMT labeling protocol [127] |
| Dithiothreitol (DTT) | Disulfide bond reduction | Protein denaturation for MS [125] |
Discussion and Future Perspectives
The comparative analysis of FT-IR spectroscopy and mass spectrometry reveals complementary strengths that position these technologies for different roles within clinical diagnostics. FT-IR's pattern-based approach, rapid analysis time, and lower operational costs make it ideally suited for screening applications where high throughput and early disease detection are priorities. The technique's exceptional performance in classifying arboviral infections and fracture-related infections demonstrates its capacity to capture systemic biochemical changes without requiring specific biomarker identification [125] [126].
Mass spectrometry provides unparalleled molecular specificity and established validation pathways, making it indispensable for definitive diagnosis, biomarker validation, and therapeutic monitoring. The technology's capacity to identify and quantify specific proteins, metabolites, and pathways offers deeper biological insights that can guide treatment decisions and drug development. The ongoing development of high-throughput MS systems, such as the Orbitrap Astral mass spectrometer, continues to address limitations in analysis time and throughput [127].
Future developments will likely focus on integrating these complementary technologies into unified diagnostic platforms, leveraging FT-IR for rapid initial screening followed by targeted MS confirmation for positive cases. Advances in machine learning and artificial intelligence will enhance the discriminatory power of both techniques, potentially enabling earlier disease detection and more precise classification. The growing emphasis on point-of-care testing will likely drive miniaturization and automation of both FT-IR and MS systems, expanding their accessibility in resource-limited settings.
The fundamental distinction between these techniques—vibrational spectroscopy versus mass-based analysis—underscores their complementary nature in clinical applications. FT-IR captures the collective vibrational signatures of molecular structures, providing a holistic view of biochemical composition, while MS delivers precise molecular identification and quantification. This synergistic relationship, rather than direct competition, will likely define their future roles in advancing clinical diagnostics and personalized medicine.
In the field of molecular spectroscopy, the detailed analysis of molecular vibrations and rotations provides a foundational understanding of material properties. Infrared (IR) spectroscopy, a classic technique for probing these vibrations, excels at detecting polar bonds and functional groups through the absorption of IR radiation due to changes in dipole moment [2] [130]. However, no single analytical technique can provide a complete picture of complex materials. The limitations of any one method create a powerful impetus for hyphenated approaches that combine the strengths of complementary techniques.
This whitepaper explores the synergistic integration of Raman spectroscopy, X-ray diffraction (XRD), and chromatography with core vibrational spectroscopy. These combinations address the inherent blind spots of individual methods, providing researchers and drug development professionals with a multidimensional framework for comprehensive material characterization. The integration of these techniques is a key trend, moving the field from isolated measurements to a more holistic, data-rich analytical paradigm [131].
The Analytical Foundation: Vibrational Spectroscopy and Its Complements
Core Principles of Vibrational and Rotational Analysis
The theoretical basis for these complementary techniques lies in the quantized energy levels of molecules. Infrared spectroscopy is sensitive to vibrations that involve a change in the dipole moment of a molecule, making it particularly effective for analyzing polar bonds like O-H and C=O [2] [130]. For gas-phase molecules, this expands into rotational-vibrational spectroscopy, where transitions between vibrational energy levels are accompanied by changes in rotational states, leading to the characteristic P- and R-branches that flank the central Q-branch in spectra [15].
Raman spectroscopy provides a complementary view, relying on the inelastic scattering of light and depending on a change in the polarizability of a molecule during vibration [130]. This fundamental difference in physical mechanism is what makes Raman and IR spectroscopy so powerfully complementary: Raman is often more sensitive to homonuclear bonds in symmetric molecular structures, while IR excels with heteronuclear functional groups.
The table below summarizes the primary roles and strengths of the core techniques discussed in this whitepaper.
Table 1: Comparison of Key Analytical Techniques and Their Synergies
| Technique | Primary Role | Key Strengths | Common Synergies |
|---|---|---|---|
| Infrared (IR) Spectroscopy | Identifies functional groups and polar bonds through IR absorption [2]. | Sensitive to organic and polar bonds; Widely used for qualitative and quantitative analysis [2] [132]. | Combined with Raman for complete vibrational profile; Integrated with XRD for molecular/crystal analysis [131]. |
| Raman Spectroscopy | Analyzes molecular structure and bonding via light scattering [130]. | Non-destructive; minimal sample prep; sensitive to homonuclear bonds (C-C, C=C); effective for aqueous samples [130]. | Complements and extends IR data; Combined with XRD for crystallinity and polymorphism studies [131] [130]. |
| X-Ray Diffraction (XRD) | Determines crystal structure, phase composition, and crystallinity [131]. | High-precision identification of crystal phases and lattice parameters [131]. | Integrated with Raman and FTIR for correlated structural & molecular data [131]. |
| Chromatography (LC, GC) | Separates complex mixtures into individual components. | High-resolution separation; enables identification and quantification of mixture components [133] [134]. | Hyphenated with mass spectrometry (LC-MS, GC-MS); FTIR used as detector for structural ID [133]. |
Methodologies for Integrated Analysis
Integrating XRD with Raman and FTIR Spectroscopy
The combination of XRD with vibrational spectroscopies is particularly powerful for materials science and pharmaceutical development, providing a complete picture of both crystalline structure and molecular chemistry.
Experimental Protocol: Correlated Structural and Chemical Mapping
- Sample Preparation: A single sample, often in powdered, thin-film, or pellet form, is prepared for analysis across all techniques. For spatially correlated results, meticulous alignment is required. Universal sample holders are beneficial to minimize changes between measurements [131].
- Data Acquisition:
- Begin with XRD analysis to identify the crystal structure, phases present, and degree of crystallinity [131].
- Subsequently, analyze the same sample region with Raman microscopy to obtain information on molecular bonding, polymorphism, and chemical identity based on molecular vibrations. Raman can detect signals regardless of crystallinity, thus revealing amorphous phases [131] [130].
- Finally, employ FTIR spectroscopy on the identical region to identify polar functional groups and complement the Raman data. FTIR in reflectance mode can be adapted for integrated chambers [131].
- Data Correlation and Analysis: Advanced software tools are used to overlay the XRD, Raman, and FTIR datasets. Chemometrics and multivariate analysis help correlate diffraction patterns with vibrational spectra, identifying relationships between crystal structure and molecular chemistry that would be impossible to discern with a single technique [131].
Table 2: Essential Research Reagents and Materials for Integrated Analysis
| Item | Function |
|---|---|
| Universal Sample Holder | Maintains consistent sample position and orientation across different instruments for spatially correlated analysis [131]. |
| KBr (Potassium Bromide) Discs | A standard matrix for preparing solid samples for traditional FTIR transmission analysis [130]. |
| ATR (Attenuated Total Reflectance) Crystal | Enables FTIR analysis of samples with minimal preparation by measuring the interaction of light evanescently with the sample surface [130]. |
| Microfluidic Chip-Based Columns | Provide high-precision and reproducible separation for chromatographic workflows, especially in proteomics [134]. |
| In-Situ Environmental Chambers | Allow for controlled temperature, pressure, or humidity during analysis, enabling the study of phase transitions and material behavior in real-time [131]. |
The following diagram illustrates the workflow for this integrated approach:
Hyphenated Techniques: Chromatography with Spectroscopic Detection
Chromatography separates components, while spectroscopy identifies them. This combination is a cornerstone of modern analytical laboratories, particularly in pharmaceuticals and environmental analysis.
Experimental Protocol: LC-FTIR for Complex Mixture Analysis
- Chromatographic Separation:
- The sample mixture is injected into a liquid chromatography (LC) system. Recent trends utilize microfluidic chip-based columns for higher throughput and reproducibility [134].
- Components are separated as they elute from the column at different retention times, driven by a mobile phase.
- Flow-Cell Analysis and Fraction Trapping:
- The eluent from the LC column is directed through a specialized flow-cell housed within an FTIR spectrometer.
- Alternatively, specific peaks of interest can be automatically collected as fractions as they elute from the column.
- FTIR Identification:
- In the flow-cell approach, FTIR spectra are acquired in near-real-time as each component passes through the cell.
- For collected fractions, the solvent may be evaporated, and the residue analyzed by FTIR (often using an ATR accessory) to obtain a high-quality spectrum for unambiguous identification of functional groups.
- Data Interpretation: The resulting data provides a powerful link between a compound's retention time (related to its physicochemical properties) and its IR spectral fingerprint (revealing its molecular structure).
Market Context and Current Trends
The analytical instrument sector, including these complementary techniques, is experiencing robust growth, driven by demand from pharmaceutical, environmental, and chemical industries [133]. The infrared spectroscopy market alone is projected to reach $625.6 million in 2025, growing at a CAGR of 5.8% [132]. This growth is fueled by the need for precise, rapid analytical techniques and advancements in technology itself [132].
Key vendors such as Thermo Fisher Scientific, Agilent, Waters, and Bruker are shaping the landscape through continuous innovation and strategic partnerships [132] [133]. Major trends include:
- Miniaturization and Portability: Development of compact, handheld IR and portable GC systems for on-site analysis [132] [134].
- Automation and AI Integration: Use of artificial intelligence to automate instrument calibration, optimize system performance, and interpret complex spectral data [132] [134].
- Sustainability Focus: A strong emphasis on reducing solvent consumption, energy usage, and operational costs across chromatographic and spectroscopic workflows [134].
- Cloud Connectivity: Cloud-based solutions are transforming laboratories by enabling remote monitoring, seamless data sharing, and consistent global workflows [134].
The synergy between Raman spectroscopy, XRD, chromatography, and foundational IR techniques represents a paradigm shift in molecular analysis. By overcoming the limitations of any single method, these integrated workflows provide a multidimensional understanding of materials, from their crystalline architecture and molecular vibrations to their behavior in complex mixtures. For researchers and drug development professionals, leveraging these complements is no longer optional but essential for driving innovation, ensuring quality, and solving the complex analytical challenges of today and the future.
Fracture-related infection (FRI) represents a significant challenge in orthopedic trauma surgery, with an incidence of 5–10% among postoperative patients [125] [129]. The diagnosis of FRI is particularly challenging in early stages and in patients presenting without definitive clinical signs, often leading to delays in appropriate treatment [125]. Traditional biomarkers like white blood cell (WBC) count, erythrocyte sedimentation rate (ESR), and C-reactive protein (CRP) have demonstrated insufficient accuracy for reliable FRI prediction [125] [129]. This diagnostic uncertainty necessitates more advanced analytical approaches that can detect subtle molecular changes associated with infection.
Within this context, Fourier-transform infrared (FTIR) spectroscopy and mass spectrometry (MS) have emerged as powerful analytical techniques capable of detecting signature molecular patterns associated with FRI [125] [128]. FTIR spectroscopy probes the vibrational and rotational transitions of molecular bonds when exposed to infrared radiation, providing a comprehensive "fingerprint" of the sample's molecular composition [2]. The technique detects absorption resulting from molecular vibrations and rotations when molecules are exposed to infrared radiation, with the absorption frequency depending on the masses of the atoms, the strength of their bonds, and the molecular geometry [2] [15]. Mass spectrometry complements this approach by enabling precise quantification of protein abundance ratios in biological samples, offering a quantitative perspective on the host response to infection [125].
This case study examines the application of these complementary technologies for developing predictive models to discriminate between FRI and control samples, framing the discussion within the broader context of molecular vibration and rotation principles in infrared spectroscopy research.
Theoretical Foundation: Molecular Vibrations and Rotations in Infrared Spectroscopy
Infrared spectroscopy is based on the principle that molecules absorb specific frequencies of infrared radiation that correspond to the energy differences between their vibrational and rotational states [2]. When IR radiation interacts with a molecule, photons are absorbed if their energy matches the energy required to promote the molecule to a higher vibrational-rotational state [15].
The total energy of a molecule can be approximated as the sum of electronic, vibrational, and rotational energy: [E{\text{total}} = E{\text{electronic}} + E{\text{vibrational}} + E{\text{rotational}}] For infrared active vibrations, a net change in the dipole moment must occur during the vibration [2]. In the gas phase, rotational-vibrational transitions give rise to a characteristic band structure consisting of P, Q, and R branches, which correspond to ΔJ = -1, 0, and +1, respectively, where J is the rotational quantum number [15].
The appearance of rotational fine structure in vibrational spectra is determined by molecular symmetry, with molecules classified as linear, spherical tops, symmetric tops, or asymmetric tops [15]. For biological samples in the condensed phase, such as plasma films used in FRI diagnostics, rotational fine structure is typically not resolved, but the overall absorption pattern still provides a composite fingerprint of all infrared-active molecular vibrations in the sample [125] [129].
Table 1: Fundamental Vibrational Modes in Biological Samples Relevant to FRI Diagnostics
| Vibrational Mode | Wavenumber Range (cm⁻¹) | Molecular Assignment | Biological Significance |
|---|---|---|---|
| O-H Stretch | 3600-3200 | Water, alcohols | Hydration status |
| N-H Stretch | 3500-3300 | Proteins, amines | Protein content |
| C-H Stretch | 3000-2800 | Lipids, carbohydrates | Membrane composition |
| C=O Stretch | 1750-1650 | Esters, amides | Lipids, proteins |
| Amide I | 1650-1600 | Protein backbone | Secondary structure |
| Amide II | 1570-1510 | Protein backbone | Secondary structure |
| C-H Bending | 1500-1300 | Lipids, proteins | Molecular conformation |
| P=O Stretch | 1300-1200 | Phospholipids | Membrane composition |
| C-O-C Stretch | 1200-1000 | Carbohydrates | Energy metabolism |
Experimental Design and Methodologies
Patient Cohort and Sample Collection
A prospective case-control study was conducted at a level 1 trauma center over a nine-month period [125] [129]. The study included 13 patients with confirmatory FRI criteria and 13 matched controls without infection, with matching based on age (±15 years), time after surgery (±2 weeks), and fracture region [125].
Peripheral venous blood samples (approximately 5 mL) were collected from FRI patients preoperatively on the day of surgical intervention for infection, and from control patients during routine fracture care follow-up visits [125] [129]. Blood was collected in EDTA tubes, centrifuged at 1500 g for 10 minutes, with plasma subsequently extracted, aliquoted, and stored at -80°C until batch analysis [129].
FTIR Spectroscopy Protocol
FTIR spectroscopy was performed using the following detailed methodology [125] [129]:
- Sample Preparation: Thawed plasma samples were diluted with potassium thiocyanate (KSCN) as an internal control in a 2:1 ratio.
- Film Deposition: Three 8 μL replicates of each sample were applied to a 96-welled silicon microplate and dried at room temperature for a minimum of two hours.
- Spectral Acquisition: Microplates were placed in an HTS-XT multi-sampler attachment of an INVENIO S FTIR spectrometer. Mid-infrared absorbance spectra in the wavenumber range of 400-4,000 cm⁻¹ were recorded using OPUS software (version 6.5).
- Measurement Parameters: For each sample evaluation, 512 interferograms were signal averaged and Fourier transformed to produce a nominal resolution of 4 cm⁻¹.
FTIR Data Preprocessing Pipeline
The raw FTIR data underwent comprehensive preprocessing [129]:
- Normalization to the area under the curve
- Normalization to the KSCN peak using the additive log-ratio method
- Application of Savitzky-Golay filter to remove baseline drift and noise
- Removal of the KSCN peak
- Transformation using discrete cosine transform (DCT) to convert data into the frequency domain
Mass Spectrometry Protocol
Quantitative proteomic analysis was performed using tandem mass tag liquid chromatography-mass spectrometry (TMT LC-MS/MS) [125] [129]:
- Sample Processing: Plasma proteins were digested and labeled with TMT reagents.
- LC Separation: Labeled peptides were separated by liquid chromatography.
- MS Analysis: Analysis was performed using a high-resolution mass spectrometer.
- Protein Quantification: Protein abundance ratios between FRI and control samples were compared.
Predictive Modeling
Multivariate analysis-based predictive models were developed separately for FTIR spectral data and MS-based protein ratio data [125]. The performance of these models was evaluated using receiver operating characteristic (ROC) analysis, with calculation of area under the ROC curve (AUROC), sensitivity, and specificity [128].
Diagram 1: Experimental workflow for FRI diagnosis study.
Results and Performance Metrics
Predictive Model Performance
The predictive models developed from FTIR spectroscopy and mass spectrometry data demonstrated distinct performance characteristics in discriminating between FRI and control samples [125] [128].
Table 2: Comparative Performance of FTIR and MS Predictive Models for FRI Diagnosis
| Performance Metric | FTIR Spectroscopy Model | Mass Spectrometry Model |
|---|---|---|
| AUROC | 0.803 (CI95: 0.8-0.81) | 0.735 (CI95: 0.732-0.737) |
| Sensitivity | 0.755 (CI95: 0.75-0.76) | 0.74 (CI95: 0.739-0.747) |
| Specificity | 0.677 (CI95: 0.672-0.682) | 0.653 (CI95: 0.649-0.656) |
| Analytical Approach | Qualitative pattern recognition | Quantitative protein abundance |
| Sample Throughput | High | Moderate |
| Cost per Sample | Low | High |
Key Analytical Findings
FTIR spectroscopy detected systemic alterations in the molecular composition of plasma in FRI patients, reflected in the mid-infrared absorption patterns [125]. The specific spectral regions that contributed most significantly to discrimination between FRI and control samples included the amide I and II bands (1700-1500 cm⁻¹), lipid absorption regions (3000-2800 cm⁻¹), and carbohydrate absorption regions (1200-900 cm⁻¹) [129].
Mass spectrometry analysis revealed significant differences in abundance ratios in 32 out of more than 1000 measured proteins, with systemic activation of the complement and coagulation cascades representing a prominent feature of the FRI proteomic profile [125].
The Scientist's Toolkit: Essential Research Reagents and Materials
Table 3: Key Research Reagent Solutions for FRI Diagnostic Studies
| Reagent/Material | Specifications | Primary Function |
|---|---|---|
| EDTA Blood Collection Tubes | BD Vacutainer Purple Top | Anticoagulant-treated blood collection |
| Potassium Thiocyanate (KSCN) | SigmaUltra Grade, ≥99% | Internal standard for FTIR spectroscopy |
| Silicon Microplates | 96-well, Bruker Scientific | Sample substrate for FTIR analysis |
| TMT Label Reagents | 10-plex or 16-plex | Multiplexed protein quantification in MS |
| Trypsin | Sequencing Grade | Protein digestion for proteomic analysis |
| LC Separation Columns | C18, 2μm particle size | Peptide separation prior to MS analysis |
| FTIR Spectrometer | INVENIO S, Bruker Scientific | Mid-infrared spectral acquisition |
| Mass Spectrometer | High-resolution LC-MS/MS system | Protein identification and quantification |
Discussion
Technical Advantages and Implementation Considerations
The superior performance of FTIR spectroscopy (AUROC ≈0.803) compared to mass spectrometry (AUROC ≈0.735) for FRI diagnosis highlights the potential of pattern recognition approaches in complex biological samples [125] [128]. FTIR spectroscopy offers several practical advantages for clinical translation, including rapid analysis time, minimal sample preparation, and lower operational costs [129]. The technique's sensitivity to the overall molecular composition of plasma makes it particularly suitable for detecting the systemic inflammatory response associated with FRI.
Mass spectrometry, while slightly less discriminatory in this specific application, provides valuable complementary information through identification of specific proteins and pathways involved in the host response to FRI [125]. The identification of complement and coagulation cascade activation provides mechanistic insights into the pathophysiology of FRI and suggests potential targets for future therapeutic interventions.
Diagram 2: Comparative analysis of FTIR and MS techniques.
Integration with Clinical Diagnostics
The integration of FTIR-based predictive models into clinical diagnostic algorithms for FRI has significant potential to improve early detection, particularly in cases lacking confirmatory criteria [125] [129]. The FTIR methodology aligns well with the need for rapid, minimally invasive tests that can be implemented at the point of care. The technique's ability to detect molecular changes before overt clinical manifestations appear could substantially reduce diagnostic delays.
Future development should focus on validating these findings in larger multicenter cohorts, refining predictive models through advanced machine learning approaches, and developing standardized protocols for clinical implementation [125]. The combination of FTIR spectroscopy with targeted mass spectrometry assays may offer an optimal balance between diagnostic performance and mechanistic insight.
This case study demonstrates that both FTIR spectroscopy and mass spectrometry can develop predictive models capable of discriminating between FRI and control plasma samples, with FTIR showing marginally superior performance in this specific application. The vibrational spectral patterns obtained by FTIR spectroscopy provide a sensitive indicator of the systemic molecular alterations associated with FRI, while mass spectrometry offers complementary quantitative protein data.
These analytical approaches represent promising candidate diagnostic biomarkers for FRI that warrant further validation in larger clinical studies. Their implementation could significantly improve the diagnostic accuracy for challenging FRI cases, particularly those presenting without confirmatory criteria, ultimately enabling earlier intervention and improved patient outcomes. The success of these techniques underscores the value of molecular vibration and rotation principles as applied through infrared spectroscopy in addressing complex diagnostic challenges in orthopedic trauma.
In the modern pharmaceutical landscape, regulatory compliance is intrinsically linked to advanced analytical technologies. Infrared (IR) spectroscopy serves as a critical bridge between the fundamental molecular sciences and stringent quality requirements, providing a window into molecular structure and behavior through the detection of bond vibrations and rotations upon absorption of infrared light [135]. As regulatory bodies worldwide intensify their focus on data integrity, real-time monitoring, and lifecycle-based validation, pharmaceutical manufacturers are increasingly leveraging IR spectroscopy's capabilities to ensure product quality, safety, and efficacy. This technical guide examines current regulatory expectations for 2025 and beyond, detailing how high-resolution IR spectroscopic techniques and robust validation frameworks form the foundation of modern pharmaceutical quality systems.
The Evolving Regulatory Landscape for 2025
Key Regulatory Shifts and Emphasis Areas
The regulatory environment for pharmaceutical validation is undergoing significant transformation, moving from static, document-heavy approaches to dynamic, data-driven quality assurance.
- From Static to Continuous Validation: The U.S. Food and Drug Administration (FDA) now emphasizes a lifecycle approach to process validation, with Stage 3: Continued Process Verification (CPV) requiring real-time monitoring and verification to demonstrate ongoing control [136]. This shift demands continuous data collection from integrated analytical technologies rather than periodic point-in-time assessments.
- Data Integrity Focus: With the FDA's "Data Integrity and Compliance with cGMP" guidance, regulators expect Part 11-compliant electronic systems that ensure secure audit trails, role-based access control, and tamper-proof records [136]. Paper-based validation systems are being rapidly phased out in favor of digital solutions.
- Risk-Based Approaches: A risk-based validation methodology prioritizes resources on critical systems, processes, and equipment that most significantly impact product quality. Tools like Failure Modes and Effects Analysis (FMEA) are essential for identifying and mitigating potential risks [137].
Global Standardization and Compendial Standards
Harmonization of global standards continues to advance, with compendial bodies like the United States Pharmacopeia (USP) playing a critical role in establishing public quality standards that support regulatory predictability [138]. These universally recognized standards are essential tools for the design, manufacture, testing, and regulation of drug substances and products, helping to ensure quality throughout the product lifecycle.
Table: Key Regulatory Guidelines Impacting Pharmaceutical Validation in 2025
| Regulatory Guideline | Focus Area | Key Requirement |
|---|---|---|
| FDA Process Validation Guidance | Process Validation Lifecycle | Stage 3: Continued Process Verification (CPV) for ongoing monitoring [136] |
| FDA Data Integrity Guidance | Electronic Records | Compliance with 21 CFR Part 11 for electronic records and signatures [136] |
| ICH Q8 | Pharmaceutical Development | Quality by Design (QbD) principles for building quality into products [139] |
| ICH Q10 | Pharmaceutical Quality Systems | Process Analytical Technology (PAT) for real-time quality monitoring [139] |
| GAMP 5 | Computerized Systems | Risk-based approach to computer system validation [136] |
Molecular Foundations: Vibrational Spectroscopy in Pharmaceutical Analysis
Fundamental Principles of Infrared Spectroscopy
At the molecular level, infrared spectroscopy detects molecular bond vibrations and rotations when molecules absorb infrared light [135]. The specific frequencies at which absorption occurs create a "chemical fingerprint" that reveals information about molecular structure, composition, and environment. These vibrational signatures provide the scientific foundation for numerous pharmaceutical applications, from raw material identification to polymorph characterization.
Different chemical functional groups absorb IR light at characteristic frequencies, enabling precise structural elucidation. For example, in the high-resolution study of 1H-pyrazole, researchers analyzed the gas-phase rotational spectrum from 85-750 GHz and high-resolution infrared spectrum, measuring over 4400 transitions for the ground state alone [53]. This detailed vibrational profiling allows scientists to distinguish between closely related molecular structures and detect subtle variations in solid forms that can significantly impact drug performance.
Advanced IR Spectroscopic Techniques
The technological landscape of infrared spectroscopy in pharmaceuticals is characterized by continuous innovation, with several advanced modalities offering specific advantages for pharmaceutical analysis:
- Near-Infrared (NIR) Spectroscopy: Valued for its non-destructive testing capabilities and suitability for real-time analysis during manufacturing processes [139]. The market for NIR in pharmaceuticals is projected to grow significantly, with the broader infrared spectroscopy market anticipated to reach USD 22.36 billion by 2033 [140].
- High-Resolution Infrared Spectroscopy: Provides detailed rotational-vibrational spectral data for fundamental molecular characterization, as demonstrated in the analysis of 1H-pyrazole's ground and vibrationally excited states [53].
- Fourier-Transform Infrared (FTIR) Spectroscopy: FT-NIR technology held approximately 57.0% market share in 2024, reflecting its importance in high-precision pharmaceutical applications [141].
Implementation Framework: IR Spectroscopy in Pharmaceutical Quality Systems
Integrated Quality Assurance and Quality Control
Quality Assurance (QA) and Quality Control (QC) represent distinct but interconnected components of pharmaceutical quality systems. QA is a proactive, systematic approach focused on preventing defects through robust processes, while QC is reactive, concerned with detecting defects in materials and products [142]. IR spectroscopy serves both functions through various applications:
- Raw Material Verification: NIR spectroscopy enables at-line or inline identity verification of Active Pharmaceutical Ingredients (APIs) and excipients, comparing incoming materials against spectral libraries to ensure consistency and prevent adulteration [139].
- Process Monitoring: During granulation and drying processes, NIR technology provides real-time monitoring of moisture content and API distribution, ensuring powders meet optimal pressability criteria before tablet compression [139].
- Finished Product Testing: The pharmaceutical industry is shifting toward Real-Time Release Testing (RTRT) strategies, where NIR spectroscopy allows confirmation of drug product quality inline, reducing batch release times [139].
Validation Methodologies for Spectroscopic Systems
Implementing IR spectroscopy in regulated environments requires rigorous validation approaches to ensure data integrity and regulatory compliance.
- Computer System Validation (CSV): For digital spectroscopic systems, CSV ensures that software and hardware consistently produce results meeting predetermined specifications. This includes installation qualification (IQ), operational qualification (OQ), and performance qualification (PQ) [136].
- Analytical Method Validation: Spectroscopic methods must be validated to demonstrate accuracy, precision, specificity, linearity, range, and robustness according to regulatory guidelines.
- Continuous Calibration Verification: Regular calibration checks using standardized reference materials ensure ongoing analytical accuracy, with documentation maintained for audit purposes.
Table: Essential Research Reagent Solutions for Pharmaceutical IR Spectroscopy
| Material/Reagent | Function in Pharmaceutical Analysis | Application Example |
|---|---|---|
| Standard Reference Materials | Instrument calibration and method validation | USP compendial standards for verifying spectroscopic accuracy [138] |
| Chemometric Software | Spectral data processing and multivariate analysis | Partial Least Squares (PLS) regression models for API content prediction [139] |
| Spectral Libraries | Compound identification and verification | Reference spectra for raw material identity testing [139] |
| Validation Protocols | System and method qualification | Documented procedures for IQ/OQ/PQ of spectroscopic equipment [137] |
Experimental Protocols: IR Spectroscopic Analysis in Pharmaceutical Applications
High-Resolution IR Spectral Analysis of Fundamental Molecular States
The analysis of 1H-pyrazole demonstrates a comprehensive approach to characterizing molecular vibrations and rotations [53]:
Experimental Methodology:
- Sample Preparation: Pyrazole vapor was introduced into a 2-meter multipass White cell at controlled pressures (3, 9, and 18 mTorr) with a total path length of 32 meters.
- Spectral Acquisition: Infrared spectra were collected using a Bruker IFS 125 HR FTIR spectrometer equipped with a KBr beamsplitter and helium-cooled Ge:Cu detector at the Canadian Light Source Far-Infrared Beamline.
- Measurement Parameters: Data obtained through filters with bandpasses of 350-750 cm⁻¹ and 400-1200 cm⁻¹ at an instrumental resolution of 0.00096 cm⁻¹.
- Data Analysis: N₂O calibration spectra were obtained for frequency reference. Kisiel's AABS software and Western's PGOPHER were used to visualize, measure, and record transitions in the high-resolution infrared spectra.
Technical Implementation: The ground-state rotational spectrum was analyzed using a complete sextic centrifugally distorted-rotor Hamiltonian model. Vibrationally excited states were treated with different approaches based on their complexity: well-separated fundamental states used single-state Hamiltonians, while Coriolis-coupled states required multi-state models with explicit Coriolis interactions [53].
Near-Infrared Spectroscopy for Pharmaceutical Process Monitoring
Real-time Monitoring of Granulation and Drying [139]:
- Instrument Configuration: NIR spectrometer installed in at-line or inline configuration with appropriate fiber optic probes for non-contact measurement.
- Model Development: Using Partial Least Squares (PLS) regression to correlate spectral data with critical quality attributes (moisture content, API concentration).
- Validation: Model validated for accuracy with low error rates demonstrated for granulated samples.
- Implementation: Real-time monitoring of granulation endpoints and moisture content during drying to ensure powders meet optimal tableting criteria.
(Diagram: IR Method Development Workflow)
Technological Advancements and Future Directions
Emerging Trends in Pharmaceutical IR Spectroscopy
The field of infrared spectroscopy continues to evolve with several significant trends shaping its pharmaceutical applications:
- Miniaturization and Portability: Shipments of portable and handheld NIR devices grew by 28% between 2021-2024, enabling field-level testing and decentralized quality control [141]. MEMS-based micro-spectrometers represented 21% of new product launches between 2023-2024 [141].
- Integration with Digital Technologies: Technological convergence with IoT and cloud-based analytics increased by 15% in vendor portfolios during 2023 [141]. This integration facilitates real-time data sharing and remote monitoring capabilities.
- AI-Enhanced Spectral Analysis: Machine learning algorithms are increasingly employed for spectral interpretation, enabling more accurate and predictive modeling of complex pharmaceutical systems [140].
- Hybrid Analytical Systems: Emerging trends include the adoption of hybrid systems that combine infrared spectroscopy with other spectroscopic and chromatographic techniques, providing comprehensive analytical insights [140].
Advanced Implementation Framework
The future of pharmaceutical validation and quality control lies in the seamless integration of spectroscopic technologies within Industry 4.0 and Pharma 4.0 frameworks:
(Diagram: Quality Assurance Integration)
The convergence of infrared spectroscopy's molecular insights with robust validation frameworks creates a powerful paradigm for modern pharmaceutical quality assurance. As regulatory expectations continue to evolve toward digital compliance, continuous verification, and data-driven decision making, the fundamental understanding of molecular vibrations and rotations provided by IR spectroscopy becomes increasingly valuable. Pharmaceutical manufacturers who successfully integrate these advanced analytical technologies within lifecycle-based validation approaches will achieve not only regulatory compliance but also enhanced operational efficiency, reduced time-to-market, and superior product quality. The future of pharmaceutical quality lies in this strategic fusion of molecular science, analytical technology, and adaptive regulatory frameworks, ensuring both patient safety and manufacturing excellence in an increasingly complex global market.
Limitations and Strengths Analysis: Addressing Rotational Ambiguity and Sensitivity Constraints
Infrared (IR) spectroscopy remains a cornerstone technique for probing molecular vibrations and rotations, yet it grapples with fundamental constraints. This analysis examines the core challenges of rotational ambiguity in spectral interpretation and inadequate sensitivity for trace-level detection, contextualizing them within modern research on molecular vibrations. The whitepaper details advanced methodologies—including anharmonic computational approaches and plasmon-enhanced spectroscopy—that are pushing the boundaries of the technique. Furthermore, it provides structured quantitative data, detailed experimental protocols, and essential resource guidelines to equip researchers with the tools to overcome these limitations in pharmaceutical and chemical research.
Infrared (IR) spectroscopy provides a direct window into molecular structure by measuring the absorption of infrared radiation by chemical bonds as they undergo vibrational and rotational transitions [2]. The resulting spectrum is a fingerprint unique to a molecule's chemical composition and structure. The technique's principle strength lies in its sensitivity to functional groups; however, its utility in advanced research, particularly in drug development, is constrained by two persistent and interconnected challenges.
First, rotational ambiguity and spectral misinterpretation arise from the limitations of the harmonic approximation and conventional vibrational notations. This model, which treats molecular vibrations as uncoupled harmonic oscillators, fails to account for anharmonicity and mode-coupling, leading to the misassignment of complex spectral features like Fermi resonances [7]. Second, inherent sensitivity constraints limit the detection of analytes at low concentrations. The intrinsic weakness of the interaction between IR photons and chemical bonds, combined with the low quantum efficiency of mid-IR detectors, creates a significant barrier to studying dilute systems or trace analytes, such as low-concentration protein aggregates or biomarkers [143] [144]. This whitepaper analyzes these limitations within the context of molecular vibration research and presents a strategic overview of the advanced methodologies and tools being developed to address them.
Quantitative Analysis of Limitations and Technological Strengths
The evolution of IR spectroscopy can be tracked by comparing the performance metrics of its core limitations against the strengths of emerging technological solutions. The following tables provide a consolidated summary of these parameters, offering a clear, data-driven perspective on the current state of the field.
Table 1: Quantitative Analysis of Core Limitations in IR Spectroscopy
| Limitation Parameter | Typical Value / Constraint | Impact on Research & Analysis |
|---|---|---|
| Detection Sensitivity | Limited to ~millimolar (mM) levels with conventional FTIR [143] | Hinders analysis of trace analytes, low-abundance biomarkers, and dilute protein solutions [144]. |
| Spatial Resolution (Far-Field) | Confined to the mid-IR diffraction limit (∼3-10 μm) [143] | Precludes detailed chemical imaging at subcellular or nanoscale levels. |
| Protein Concentration Limit | ≥10 mM for FTIR, leading to aggregation [144] | A significant portion of non-membrane proteins are insoluble at these concentrations, limiting study. |
| Anharmonicity Error | Harmonic approximation overestimates wavenumbers (e.g., by ~45 cm⁻¹ for CO₂) [7] | Leads to inaccurate prediction of overtones and combination bands, causing misassignment. |
Table 2: Performance Metrics of Advanced and Emerging IR Methodologies
| Methodology / Technology | Enhancement / Capability | Key Performance Metric |
|---|---|---|
| Mid-Infrared Photothermal Plasmonic Scattering (MIP-PS) | Pushes detection limit toward ~100 molecules [143] | IR field enhancement factor of ~1,000 [143]. |
| Surface-Enhanced IR Absorption (SEIRA) | Amplifies IR field at localized "hot spots" [143] | Field enhancement on the order of 10⁴ [143]. |
| 2D IR Spectroscopy | Advances sensitivity for protein dynamics studies [144] | Enables study of proteins at concentrations as low as 0.1 mM [144]. |
| FT-NIR Spectroscopy | Rapid, non-destructive analysis for industrial quality control [145] [146] | Global market size for NIR spectroscopy estimated at USD 610 million in 2024 [146]. |
Addressing Rotational Ambiguity: From Anharmonicity to Unambiguous Assignment
The conventional interpretation of IR spectra, rooted in the harmonic approximation, often stumbles when faced with the complex reality of molecular vibrations. This model's simplification results in rotational ambiguity, where a single spectral feature cannot be uniquely assigned to one vibrational mode due to resonances and mode-coupling [7].
The Core Problem: Fermi Resonances and Label Failure
A quintessential example is the Fermi resonance in carbon dioxide (CO₂). The harmonic approximation predicts a single symmetric stretching vibration, yet the experimental Raman spectrum shows two bands. Fermi resolved this by positing a quasi-degeneracy between the symmetric stretch and the first overtone of the bending vibration [7]. The resulting "mixing" produces two observed frequencies, making the assignment of a single vibrational notation to either band ambiguous. This phenomenon is pervasive in molecules with X-H bonds (X = O, C, N), such as methanol, where historical assignments of bands to specific methyl or hydroxyl groups have been vague and debated [7].
Strategic Solution: VSCF/VCI Calculations and Sankey Diagrams
To overcome this ambiguity, a robust two-part methodology is employed:
- Advanced Theoretical Calculations: Moving beyond the harmonic approximation is critical. Vibrational Self-Consistent Field/Vibrational Configuration Interaction (VSCF/VCI) approaches are used. These methods compute the molecular potential energy surface (PES) using an N-mode expansion that incorporates both anharmonicity and mode-coupling, providing a more accurate prediction of wavenumbers [7].
- Clear Visual Assignment with Sankey Diagrams: The output of VSCF/VCI calculations allows for the creation of Sankey diagrams. These diagrams visually map the contribution of different harmonic "labels" (e.g., fundamentals, overtones) to the anharmonically computed wavenumbers. This makes the ambiguous, mixed nature of the vibrational states clear and unambiguous, moving beyond misleading single-label assignments [7].
Experimental Protocol: Resolving Methanol's IR Spectrum
Objective: To unambiguously assign the fundamental, overtone, and combination bands in the mid-IR spectrum of methanol, resolving historical debates over resonances.
- Sample Preparation: Isolate single methanol molecules in an inert solid matrix (Argon or Neon) at low temperatures (e.g., 10 K). This minimizes intermolecular interactions and band broadening, yielding sharper spectral features [7].
- Isotopic Labeling: Record spectra of methanol in its natural isotopic composition (CH₃OH) and with partial (CH₃OD) and full deuteration (CD₃OD). Deuteration shifts vibrational frequencies and lifts resonances, serving as a critical tool for unique band assignment [7].
- Data Acquisition: Collect high-resolution IR absorption spectra across the mid-infrared region using a Fourier Transform Infrared (FTIR) spectrometer.
- Computational Analysis:
- Perform VSCF/VCI calculations on an N-mode PES expansion for all methanol isotopologues.
- Compare computed anharmonic wavenumbers and intensities with the experimental matrix-isolation IR spectra.
- Construct Sankey diagrams to visualize the contribution of harmonic labels to the final anharmonic vibrational states.
The following workflow diagram illustrates the integrated experimental and computational process for resolving rotational ambiguity.
Diagram 1: Workflow for resolving rotational ambiguity in IR spectra.
Overcoming Sensitivity Constraints: Enhancing the IR Signal
The detection of trace analytes is a major hurdle, as the inherent small absorption cross-sections of chemical bonds (on the order of 10⁻²⁰ to 10⁻¹⁶ cm²) limit traditional FTIR to millimolar concentrations [143]. This section outlines strategies to overcome this barrier.
Plasmonic Nanocavity Enhancement
A transformative approach involves using plasmonic nanostructures to dramatically enhance the local electromagnetic field. The Mid-Infrared Photothermal Plasmonic Scattering (MIP-PS) technique exemplifies this strategy.
- Principle: A plasmonic nanocavity, such as a gold nanoparticle on a gold film (NPoF), creates a nanogap with extreme field confinement. Analyte molecules placed within this gap experience a massively enhanced IR field (~1000x enhancement), boosting their absorption [143].
- Transduction Mechanism: The IR absorption causes molecular vibration and photothermal expansion, which modulates the nanogap's spacing. This change alters the visible plasmonic scattering of the nanocavity, which is exquisitely sensitive to the gap distance. By monitoring this visible scattering, the IR absorption is read out with ultra-high sensitivity [143].
- Performance: This method has demonstrated detection of nitrile or nitro groups in approximately 130 molecules, pushing the detection limit toward nearly a hundred molecules in the nanocavity [143].
Advanced Methodologies for Biological Applications
In biological sciences, sensitivity constraints are often related to protein solubility.
- 2D IR Spectroscopy: This technique, analogous to 2D NMR, provides enhanced sensitivity for studying protein dynamics. A key advancement is the use of site-specific isotope labeling, such as replacing a carbon atom in a carbonyl group with ¹³C¹⁸O. This shifts the vibrational frequency of a specific amino acid, creating a localized reporter that can be monitored against the complex protein background, effectively boosting the functional sensitivity for specific sites [144].
- SEIRA and Optical Cavities: Other enhancement routes include Surface-Enhanced IR Absorption (SEIRA) with metasurfaces and the use of optical cavities like whispering gallery mode (WGM) microresonators, which prolong the light-matter interaction to boost absorption [143].
Experimental Protocol: MIP-PS for Ultrasensitive Detection
Objective: To detect and identify chemical bonds from a trace amount of analyte using MIP-PS spectroscopy.
- Sensor Fabrication:
- Fabricate a smooth gold nanofilm on a substrate.
- Functionalize the gold surface with a linker molecule to create a self-assembled monolayer (SAM).
- Immobilize gold nanoparticles (e.g., 50 nm diameter) onto the SAM, creating the NPoF nanocavity with the analyte molecules in the nanogap [143].
- Optical Setup:
- Pump Beam: Employ a tunable mid-IR quantum cascade laser (QCL) focused onto the nanocavity. The wavelength is scanned across the vibrational resonance of the target chemical bond (e.g., C≡N stretch).
- Probe Beam: Use a stable, monochromatic visible laser (e.g., a He-Ne laser or diode laser) tuned to a sensitive wavelength of the NPoF scattering spectrum. A high-numerical-aperture objective is used to illuminate the nanoparticles and collect the back-scattered light [143].
- Signal Acquisition and Analysis:
- Detect the scattered visible light with a highly sensitive spectrometer or single-photon detector.
- Modulate the IR pump beam and employ lock-in amplification to isolate the small photothermal modulation signal from the strong static scattering background.
- Record the modulation depth of the visible scattering signal as a function of the IR wavelength to generate the photothermal IR spectrum.
The logical relationship between the core components and the signal generation pathway in MIP-PS is shown below.
Diagram 2: Logical diagram of the MIP-PS signal generation pathway.
The Scientist's Toolkit: Essential Research Reagents and Materials
Success in advanced IR spectroscopy requires a specific set of reagents and materials. The following table details key components for the experiments cited in this guide.
Table 3: Research Reagent Solutions for Advanced IR Spectroscopy
| Item / Reagent | Function & Application |
|---|---|
| Isotopically Labeled Compounds (e.g., CD₃OD, ¹³C¹⁸O-labeled amino acids) | Serves as a frequency-shifted vibrational label to isolate specific molecular vibrations from the complex background, enabling site-specific probing in proteins and unambiguous band assignment [7] [144]. |
| Plasmonic Nanocavity Components (Gold nanoparticles, smooth gold nanofilms) | Forms the core of enhancement structures (e.g., NPoF cavities) that provide extreme electromagnetic field confinement, boosting IR absorption and enabling single-molecule level detection [143]. |
| Matrix Isolation Materials (High-purity Argon/Neon gas, cryogenic cooling system) | Creates an inert, rigid environment at low temperatures (~10K) to isolate individual molecules, reducing spectral broadening and simplifying the spectrum for fundamental vibrational studies [7]. |
| Functionalization Linkers (e.g., thiol-based self-assembled monolayer (SAM) reagents) | Chemically anchors analyte molecules or nanoparticles to metal surfaces in a controlled manner, which is critical for constructing SEIRA and MIP-PS sensors [143]. |
| Tunable Mid-IR Laser (e.g., Quantum Cascade Laser) | Provides an intense, tunable source of mid-IR radiation that is essential for pump-probe techniques like MIP-PS and for achieving high signal-to-noise ratio in sensitive measurements [143]. |
The field of IR spectroscopy is in a dynamic state of transformation, directly addressing its historical weaknesses. The limitations of rotational ambiguity and sensitivity constraints are being systematically overcome through the integration of advanced anharmonic theory and nanophotonic engineering. Methodologies such as VSCF/VCI calculations and plasmon-enhanced MIP-PS spectroscopy are providing researchers with a more powerful and precise toolkit. For professionals in drug development and chemical research, the adoption of these sophisticated approaches enables unprecedented insights into molecular structure and dynamics, from unambiguous assignment of complex spectral features to the monitoring of trace biological analytes, thereby solidifying the role of IR spectroscopy as an indispensable analytical technique in modern science.
The comprehensive analysis of complex, heterogeneous materials presents a significant challenge in analytical chemistry. Single analytical techniques often provide limited perspectives, capturing only specific aspects of a sample's chemical composition, molecular structure, or physical properties. Spectral fusion has emerged as a powerful methodology that addresses these limitations by combining data from multiple spectroscopic sensors to leverage their complementary strengths [147]. This approach is particularly valuable within the context of molecular vibrations and rotations, which form the fundamental basis of infrared and Raman spectroscopy and provide unique fingerprints for chemical identification [148].
The underlying principle of spectral fusion rests on the fact that different spectroscopic techniques probe different aspects of molecular systems. Infrared (IR) spectroscopy measures absorption resulting from molecular vibrational transitions that involve a change in dipole moment, making it particularly sensitive to polar functional groups [147]. In contrast, Raman spectroscopy relies on inelastic scattering of light and is more sensitive to symmetric covalent bonds and non-polar groups [147]. When used in combination, these techniques provide a more complete picture of molecular structure and dynamics, including insights into both vibrational and rotational energy levels as observed in high-resolution studies of molecules like 1H-pyrazole [53].
For researchers in pharmaceutical development and material science, spectral fusion methodologies enhance the accuracy of material identification, improve detection of adulterants or impurities, and provide more robust quantitative analysis [147] [149]. The fusion of complementary datasets creates a synergistic analytical framework where the combined information exceeds what can be derived from each technique independently, ultimately leading to more confident characterization of complex material systems.
Theoretical Foundations: Molecular Vibrations and Rotations
The theoretical basis for spectral fusion approaches in material characterization lies in the fundamental principles of molecular spectroscopy, particularly the quantized nature of molecular vibrations and rotations. When electromagnetic radiation interacts with matter, specific frequencies are absorbed or scattered, corresponding to transitions between discrete rotational and vibrational energy levels. These transitions provide detailed information about molecular structure, bonding, and dynamics.
Infrared spectroscopy probes molecular vibrations that involve a change in the dipole moment of the molecule. When the frequency of infrared radiation matches the natural vibrational frequency of a chemical bond, absorption occurs, resulting in characteristic peaks in the IR spectrum. The energy of these vibrations depends on factors including bond strength and atomic masses, with typical vibrational frequencies for organic molecules ranging from 500 to 4000 cm⁻¹ [148]. In parallel, rotational spectroscopy examines pure rotational transitions in the microwave region (85-750 GHz), providing precise information about molecular geometry, as demonstrated in studies of 1H-pyrazole [53].
Raman spectroscopy complements IR spectroscopy by measuring inelastically scattered light, which provides information about vibrational modes that involve a change in polarizability rather than dipole moment. The complementary nature of these techniques arises from their different selection rules: vibrational modes that are strong in IR may be weak in Raman, and vice versa [147]. For instance, symmetric vibrations typically produce strong Raman signals but weak IR signals, while asymmetric vibrations often show the opposite behavior.
High-resolution infrared studies can resolve rotational-vibrational transitions, where both vibrational and rotational quantum numbers change simultaneously. This is exemplified by research on 1H-pyrazole, where analyzing transitions for the ground and vibrationally excited states lying below 1300 cm⁻¹ revealed complex coupling patterns between different vibrational states [53]. Such detailed molecular-level understanding forms the critical foundation for effective spectral fusion strategies, as it enables researchers to interpret combined datasets in the context of fundamental molecular processes.
Complementary Spectroscopic Techniques
The power of spectral fusion approaches stems from the complementary information provided by different analytical techniques. Each method offers unique insights into specific aspects of material composition and structure, and their strategic combination creates a more comprehensive analytical picture than any single technique can provide independently.
Infrared and Raman Spectroscopy
Fourier-Transform Infrared (FTIR) and Raman spectroscopy represent a powerful complementary pair for molecular characterization. FTIR spectroscopy excels at detecting polar functional groups through absorption measurements, with characteristic peaks revealing specific molecular vibrations. For example, in the analysis of Cymbopogon citratus essential oil, FTIR identified peaks at 842 cm⁻¹ (=C-H vibration of aromatic rings), 983 cm⁻¹ (C-H bending of alkenes), and between 1121-1194 cm⁻¹ (C-O stretching of phenolics) [147]. These vibrational signatures provide specific information about the oxygen-containing functional groups present in the essential oil components.
Raman spectroscopy offers complementary insights by probing different molecular vibrations. In the same essential oil study, Raman spectroscopy revealed distinct peaks at 1615 cm⁻¹ (C=C stretching of alkenes), between 1442-1472 cm⁻¹ (C-H bending), and 1001 cm⁻¹ (C-C stretching) [147]. The combination of both techniques enabled more comprehensive profiling of the essential oil's chemical composition, enhancing the ability to detect adulterants that might escape detection using either method alone.
Table 1: Comparative Analysis of FTIR and Raman Spectroscopy
| Parameter | FTIR Spectroscopy | Raman Spectroscopy |
|---|---|---|
| Physical Principle | Absorption of infrared radiation | Inelastic scattering of light |
| Sensitivity | Polar functional groups | Non-polar bonds, symmetric vibrations |
| Spectral Range | 500-4000 cm⁻¹ | 100-4000 cm⁻¹ |
| Sample Preparation | Often requires specific sampling accessories | Minimal preparation; can use glass containers |
| Water Compatibility | Problematic due to strong water absorption | Minimal interference from water |
| Key Applications | Identification of functional groups, quantitative analysis | Crystal forms, carbon structures, inorganic compounds |
Advanced Technique Combinations
Beyond the core FTIR-Raman combination, researchers have successfully fused data from additional spectroscopic methods to address specific characterization challenges:
Laser-Induced Breakdown Spectroscopy (LIBS) provides elemental composition data by analyzing atomic emission lines from laser-induced plasma. When combined with Raman spectroscopy, this creates a powerful approach for comprehensive material characterization, as demonstrated in mineral identification studies where LIBS-based classification of Li-bearing minerals showed significant improvement when fused with Raman data [149].
X-ray Photoelectron Spectroscopy (XPS) offers surface-specific quantitative chemical information with high spatial resolution. Researchers have fused XPS data with Atomic Force Microscopy (AFM) and Confocal Microscopy (CM) to create correlated multi-modal visualizations of heterogeneous materials [150]. This approach enables the correlation of surface chemistry with topological features, providing insights into material heterogeneity and domain structures in complex polymer blends.
The synergy created by combining these techniques enables researchers to overcome the inherent limitations of individual methods. For instance, while Raman spectroscopy may struggle with fluorescent samples, and LIBS may face challenges with matrix effects or saturation, their strategic fusion mitigates these limitations and enhances overall analytical capabilities [149].
Experimental Design and Methodologies
Implementing successful spectral fusion approaches requires careful experimental design, including appropriate sample preparation, data acquisition parameters, and processing workflows. The following methodologies have been validated in recent research studies and provide robust frameworks for multi-technique material characterization.
Sample Preparation Protocols
Essential Oil Authentication Study: For the analysis of Cymbopogon citratus essential oil, researchers prepared adulterated samples by mixing pure essential oil with vegetable oils (castor, groundnut, sunflower) and synthetic adulterants (polyethylene glycol-400 and diethyl phthalate) at varying concentration levels [147]. This systematic approach to sample preparation enabled the development of chemometric models capable of detecting and quantifying adulteration levels based on fused spectral data.
Polymer Blend Characterization: In studies of heterogeneous polymer systems, researchers created thin films of polymer blends (including PVC/PMMA, PS/PB, and PS/PMMA) using solvent casting techniques [150]. Solutions were prepared at 2% (w/v) concentration in appropriate solvents (tetrahydrofuran or toluene), allowed to equilibrate for 24 hours, then deposited onto substrates including silicon wafers, Teflon watch glasses, or cleaned glass slides. Films were air-dried for 24-48 hours before analysis, ensuring consistent sample morphology for correlative analysis across multiple techniques.
Data Acquisition Parameters
FTIR and Raman Spectroscopy: For essential oil characterization, researchers collected FTIR spectra using Attenuated Total Reflectance (ATR) mode with specific instrumental parameters [147]. Raman spectra were acquired using appropriate laser wavelengths and power settings to optimize signal while avoiding sample degradation. Multiple spectra were collected for each sample to ensure statistical reliability.
High-Resolution IR and Rotational Spectroscopy: In the 1H-pyrazole study, researchers obtained high-resolution infrared spectra using an FTIR spectrometer with a resolution of 0.00096 cm⁻¹, collecting multiple scans at different pressures (3, 9, and 18 mTorr) to optimize signal-to-noise ratio for both strong and weak transitions [53]. Rotational spectra were collected from 80 to 750 GHz using a broadband instrument with nearly continuous coverage, acquired automatically over approximately 14 days with specific sweep rates and modulation parameters.
XPS and Confocal Microscopy: For polymer blend characterization, XPS images and spectra were acquired using a monochromatic Al Kα source operating at 300W, with specific binding energy ranges and acquisition times for different elements [150]. Confocal images were obtained using appropriate lasers and objectives, with depth series collected at 0.5-2 micron steps to create three-dimensional representations of sample features.
Data Fusion Workflows
The general workflow for spectral fusion involves multiple stages from data acquisition to final interpretation:
Diagram 1: Spectral Fusion Methodology Workflow
Data Processing and Chemometric Analysis
The successful implementation of spectral fusion approaches relies heavily on advanced data processing and chemometric techniques that transform raw spectral data into meaningful chemical information. These mathematical approaches enable researchers to extract relevant features, reduce dimensionality, and build predictive models from complex multi-technique datasets.
Feature Extraction and Dimensionality Reduction
Principal Component Analysis (PCA) serves as a fundamental tool for exploring spectral data and identifying inherent patterns or clusters. PCA reduces the dimensionality of complex datasets while preserving maximum variance, enabling visualization of sample groupings and detection of outliers [147]. In essential oil authentication studies, PCA applied to fused FTIR-Raman data effectively revealed clustering patterns that distinguished pure from adulterated samples, providing visual evidence of the fusion approach's enhanced discrimination power [147].
Competitive Adaptive Reweighted Sampling (CARS) represents a more sophisticated feature selection technique that identifies the most informative variables or spectral regions for classification or quantification tasks [147]. By iteratively selecting subsets of variables based on their importance, CARS improves model performance while reducing complexity, which is particularly valuable when dealing with high-dimensional fused datasets from multiple spectroscopic techniques.
Classification and Quantification Methods
One-Class Classifiers including Data Driven-Soft Independent Modelling of Class Analogy (DD-SIMCA) have proven effective for authentication problems where the focus is on verifying whether a sample belongs to a target class (e.g., pure essential oil) [147]. DD-SIMCA creates a PCA-based model of the target class and establishes critical limits for classifying new samples as members or non-members. This approach achieved high sensitivity (89.8%) and specificity (93%) in authenticating Sacha Inchi oil using NIR spectroscopy, demonstrating its robustness for quality control applications [147].
Partial Least Squares Regression (PLSR) provides a powerful framework for quantifying analyte concentrations or adulteration levels based on spectral data [147]. PLSR is particularly well-suited for spectroscopic applications because it handles multicollinearity effectively by projecting both predictor (spectral data) and response (concentration) variables into a new latent variable space that maximizes covariance. This approach has been successfully applied to determine concentrations of adulterants in various matrices, including the quantification of adulterants in Indonesian coffee varieties [147].
Table 2: Chemometric Techniques for Spectral Data Analysis
| Technique | Primary Function | Advantages | Typical Applications |
|---|---|---|---|
| Principal Component Analysis (PCA) | Dimensionality reduction, exploratory analysis | Identifies patterns, clusters, and outliers; Unsupervised approach | Initial data exploration, quality control, sample grouping |
| Competitive Adaptive Reweighted Sampling (CARS) | Variable selection | Identifies most informative spectral regions; Improves model performance | Feature selection prior to regression or classification |
| DD-SIMCA | One-class classification | High sensitivity and specificity; Robust to outliers | Authentication, quality control, adulteration detection |
| Partial Least Squares Regression (PLSR) | Quantitative modeling | Handles multicollinearity; Works with many variables | Concentration prediction, calibration models |
| Multiple Exposure Fusion | Image enhancement | Improves dynamic range; Reduces saturation effects | LIBS and Raman imaging enhancement |
Multi-Condition Image Fusion
For spectral imaging techniques such as LIBS and Raman mapping, multi-condition fusion approaches inspired by high-dynamic-range (HDR) photography have been developed to enhance data quality [149]. These methods acquire datasets under distinct conditions (e.g., different exposure times or laser energies) and merge them using weight maps based on exposure and contrast metrics. This process reduces problems associated with signal saturation in high-intensity regions and poor signal-to-noise ratio in low-intensity regions, ultimately improving overall image quality and analytical performance [149].
Research Reagent Solutions and Materials
The implementation of spectral fusion methodologies requires specific materials and reagents that ensure analytical consistency and enable valid cross-technique comparisons. The following table summarizes key materials used in representative studies.
Table 3: Essential Research Materials for Spectral Fusion Studies
| Material/Reagent | Specifications | Function/Application | Source Example |
|---|---|---|---|
| Cymbopogon citratus EO | Pure, authentic standard | Reference material for authentication studies | CSIR-CIMAP, Lucknow [147] |
| Polymer Standards | PVC, PMMA, PS, PB | Model systems for heterogeneous material studies | Scientific Polymer Products [150] |
| Deuterated Solvents | HPLC-grade tetrahydrofuran, toluene | Sample preparation for polymer films | Commercial suppliers [150] |
| Synthetic Adulterants | Diethyl phthalate (DEP), Polyethylene glycol-400 (PEG-400) | Model adulterants for method validation | Sigma-Aldrich [147] |
| Vegetable Oils | Castor, groundnut, sunflower oil | Model adulterants for essential oil studies | Commercial food grade [147] |
| Fluorescent Labels | Rhodamine dye, Fluorescein-labeled PS | Contrast agents for confocal microscopy | Polysciences, Inc. [150] |
| Reference Materials | NIST-traceable standards | Instrument calibration and validation | Various standards organizations |
| Si Wafers/Glass Slides | Optically flat substrates | Sample mounting for correlative microscopy | Commercial suppliers [150] |
Applications in Pharmaceutical and Material Science
Spectral fusion methodologies have demonstrated significant utility across various domains of pharmaceutical development and material science. The enhanced characterization capabilities provided by multi-technique approaches address critical challenges in quality control, formulation development, and material performance assessment.
Pharmaceutical Quality Control and Authentication
In the pharmaceutical industry, spectral fusion has proven particularly valuable for the authentication of natural products and detection of adulterants in complex mixtures. The study on Cymbopogon citratus essential oil exemplifies this application, where FTIR and Raman spectroscopy were combined with chemometric analysis to detect and quantify adulteration with vegetable oils and synthetic compounds [147]. This approach successfully identified adulterants including castor oil, groundnut oil, sunflower oil, polyethylene glycol-400, and diethyl phthalate, which are commonly used to extend more expensive essential oils while reducing production costs.
The fusion of FTIR and Raman data provided superior authentication performance compared to either technique alone, with improved sensitivity and specificity in classification models [147]. For pharmaceutical quality control, this enhanced detection capability ensures the therapeutic efficacy and safety of natural product formulations, addressing both economic and health hazards associated with adulterated products. The methodology has potential for broader application in quality assurance of active pharmaceutical ingredients (APIs), excipients, and finished dosage forms.
Advanced Material Characterization
In material science, spectral fusion enables comprehensive characterization of complex heterogeneous systems. Research on polymer blends demonstrates how combining XPS, confocal microscopy, and AFM provides insights into surface chemistry, three-dimensional morphology, and topological features that would be difficult to obtain with individual techniques [150]. This multi-modal approach reveals domain structures, concentration gradients, and surface segregation phenomena that critically influence material performance.
For functional materials such as organic semiconductors and nanocomposites, the correlation of molecular structure (from vibrational spectroscopy) with elemental composition (from techniques like LIBS) and morphological features (from microscopy) enables rational design of structure-property relationships [149]. The fusion of LIBS and Raman imaging has shown particular promise for mineral identification and classification, with significant improvements in classification accuracy compared to single-technique approaches [149].
Diagram 2: Key Application Areas for Spectral Fusion
Spectral fusion represents a paradigm shift in material characterization, moving beyond the limitations of single-technique analysis toward a more comprehensive, integrated approach. By combining complementary spectroscopic methods such as FTIR and Raman spectroscopy, researchers can obtain a more complete understanding of complex material systems, from natural products like essential oils to sophisticated polymer blends and pharmaceutical formulations [147] [150].
The theoretical foundation of these approaches in the principles of molecular vibrations and rotations ensures that the fused data provides meaningful insights into chemical structure and dynamics [53] [148]. When implemented with appropriate experimental design and chemometric analysis, spectral fusion methodologies enhance detection capabilities, improve quantification accuracy, and enable more confident material identification and classification [147] [149].
As analytical technologies continue to advance, spectral fusion approaches are likely to incorporate more diverse technique combinations, including hyperspectral imaging, terahertz spectroscopy, and spatially resolved mass spectrometry. The integration of machine learning and artificial intelligence with spectral fusion will further enhance pattern recognition capabilities, enabling real-time material classification and predictive modeling in both research and industrial settings. For pharmaceutical development and material science, these advances promise accelerated characterization workflows, improved quality control, and ultimately, more efficient development of novel materials and therapeutic products.
Conclusion
Infrared spectroscopy, grounded in the fundamental principles of molecular vibrations and rotations, has evolved into an indispensable analytical tool with profound implications for biomedical research and pharmaceutical development. The integration of advanced FT-IR methodologies with robust sampling techniques and machine learning-driven data analysis has significantly enhanced its capabilities for structural elucidation, quality control, and clinical diagnostics. As evidenced by comparative studies with mass spectrometry and other techniques, IR spectroscopy provides complementary insights that strengthen analytical conclusions when deployed within validated frameworks. Future directions point toward increased miniaturization for point-of-care applications, enhanced computational integration through AI and machine learning algorithms, and expanded clinical utility through standardized spectral libraries and validated diagnostic models. The ongoing technological advancements in portable instrumentation, hyperspectral imaging, and multi-technique integration promise to further establish infrared spectroscopy as a cornerstone technique for addressing complex analytical challenges in drug development, personalized medicine, and clinical diagnostics, ultimately bridging the gap between molecular spectroscopy and real-world biomedical problem-solving.
References
- 1. Infrared spectroscopy [https://en.wikipedia.org/wiki/Infrared_spectroscopy]
- 2. Infrared Spectroscopy [https://chem.libretexts.org/Bookshelves/Physical_and_Theoretical_Chemistry_Textbook_Maps/Supplemental_Modules_(Physical_and_Theoretical_Chemistry)/Spectroscopy/Vibrational_Spectroscopy/Infrared_Spectroscopy/Infrared_Spectroscopy]
- 3. What Is Infrared Spectroscopy? Fundamentals & Applications [https://www.excedr.com/blog/what-is-infrared-spectroscopy]
- 4. Exploring the Steps of Infrared (IR) Spectral Analysis [https://www.mdpi.com/1420-3049/28/19/6886]
- 5. 8.2 Infrared spectroscopy and vibrational spectra [https://fiveable.me/molecular-physics/unit-8/infrared-spectroscopy-vibrational-spectra/study-guide/10X9rz3reafGQ3b8]
- 6. The Big Review III: Molecular Vibration Theory [https://www.spectroscopyonline.com/view/the-big-review-iii-molecular-vibration-theory]
- 7. How Vibrational Notations Can Spoil Infrared Spectroscopy [https://pmc.ncbi.nlm.nih.gov/articles/PMC11613289/]
- 8. New Experimental Spectra and Quantitative Modeling of the ... [https://pmc.ncbi.nlm.nih.gov/articles/PMC12073690/]
- 9. Molecular Vibration - an overview [https://www.sciencedirect.com/topics/chemistry/molecular-vibration]
- 10. High resolution infrared spectroscopy of H 12 C 13 CD and ... [https://www.sciencedirect.com/science/article/abs/pii/S0022285211001706]
- 11. Quantitative Analysis by Infrared Spectroscopy: Methods ... [https://tcalab.alfa-chemistry.com/quantitative-analysis-by-infrared-spectroscopy-methods-and-procedures.html]
- 12. Research on Quantitative Analysis Method of Infrared ... [https://pmc.ncbi.nlm.nih.gov/articles/PMC12299426/]
- 13. Leveraging active learning-enhanced machine ... [https://pmc.ncbi.nlm.nih.gov/articles/PMC12571885/]
- 14. 20.2: Vibrations and Rotations of Molecules: Infrared and ... [https://chem.libretexts.org/Bookshelves/General_Chemistry/Map%3A_Principles_of_Modern_Chemistry_(Oxtoby_et_al.)/Unit_5%3A_Rates_of_Chemical_and_Physical_Processes/20%3A_Molecular_Spectroscopy_and_Photochemistry/20.2%3A_Vibrations_and_Rotations_of_Molecules%3A_Infrared_and_Microwave_Spectroscopy]
- 15. Rotational–vibrational spectroscopy [https://en.wikipedia.org/wiki/Rotational%E2%80%93vibrational_spectroscopy]
- 16. Unveiling the transformative power of near-infrared ... [https://www.sciencedirect.com/science/article/pii/S0928098725001745]
- 17. A Review of the Latest Research Applications Using FT-IR ... [https://www.spectroscopyonline.com/view/a-review-of-the-latest-research-applications-using-ft-ir-spectroscopy]
- 18. Mid-infrared Spectroscopy and Its Applications in ... [https://www.sciencedirect.com/science/article/abs/pii/S0006291X25016067]
- 19. Unveiling the Transformative Power of Near-Infrared ... [https://pubmed.ncbi.nlm.nih.gov/40555299/]
- 20. Advancing Near-Infrared Spectroscopy and Machine ... [https://www.spectroscopyonline.com/view/advancing-near-infrared-spectroscopy-and-machine-learning-for-personalized-medicine]
- 21. Global IR Spectroscopy Market Size & Analysis, 2025-2032 [https://www.coherentmarketinsights.com/industry-reports/global-ir-spectroscopy-market]
- 22. 2025 Review of Spectroscopic Instrumentation [https://www.spectroscopyonline.com/view/2025-review-of-spectroscopic-instrumentation]
- 23. 12.8: Infrared Spectra of Some Common Functional Groups [https://chem.libretexts.org/Bookshelves/Organic_Chemistry/Organic_Chemistry_(Morsch_et_al.)/12%3A_Structure_Determination_-_Mass_Spectrometry_and_Infrared_Spectroscopy/12.08%3A_Infrared_Spectra_of_Some_Common_Functional_Groups]
- 24. Infrared Spectroscopy [https://www2.chemistry.msu.edu/faculty/reusch/virttxtjml/spectrpy/infrared/infrared.htm]
- 25. Infrared (IR) Spectroscopy: A Quick Primer On Interpreting ... [https://www.masterorganicchemistry.com/2016/11/23/quick_analysis_of_ir_spectra/]
- 26. 6.3: IR Spectrum and Characteristic Absorption Bands [https://chem.libretexts.org/Bookshelves/Organic_Chemistry/Organic_Chemistry_I_(Liu)/06%3A_Structural_Identification_of_Organic_Compounds-_IR_and_NMR_Spectroscopy/6.03%3A_IR_Spectrum_and_Characteristic_Absorption_Bands]
- 27. Identification of Hydroxyl and Polysiloxane Compounds via ... [https://pmc.ncbi.nlm.nih.gov/articles/PMC12157987/]
- 28. Infrared spectroscopy at the surface of carbonates [https://pubs.rsc.org/en/content/articlehtml/2025/cp/d5cp02197a]
- 29. Infrared spectroscopy as a tool to study the vibrational ... [https://www.sciencedirect.com/science/article/abs/pii/S0022286024001030]
- 30. Molecular Vibrations with NIR: A Detailed Exploration [https://www.nirlab.com/molecular-vibrations-with-nir-a-detailed-exploration/]
- 31. New microscopy technique maps chemical environments via ... [https://news.uchicago.edu/story/new-microscopy-technique-maps-chemical-environments-molecular-vibrations]
- 32. A Dataset of Raman and Infrared Spectra as an Extension ... [https://pmc.ncbi.nlm.nih.gov/articles/PMC12137555/]
- 33. Infrared Spectral Interpretation, In The Beginning I [https://www.spectroscopyonline.com/view/infrared-spectral-interpretation-in-the-beginning-i-the-meaning-of-peak-positions-heights-and-widths]
- 34. Guide to FT-IR Spectroscopy [https://www.bruker.com/en/products-and-solutions/infrared-and-raman/ft-ir-routine-spectrometer/what-is-ft-ir-spectroscopy.html]
- 35. Video: IR Spectroscopy: Hooke's Law Approximation of ... [https://www.jove.com/science-education/v/13029/ir-spectroscopy-hooke-s-law-approximation-of-molecular-vibration]
- 36. Isotopes in assigning Vibrational Spectra [https://sites.science.oregonstate.edu/~gablek/CH335/Chapter10/bare_Isotopes.htm]
- 37. Albert A. Michelson: Precisely Measuring the Speed of Light [https://www.spectroscopyonline.com/view/albert-a-michelson-precisely-measuring-the-speed-of-light]
- 38. Fourier transform infrared spectroscopic technique for analysis ... [https://pubs.rsc.org/en/content/articlehtml/2025/na/d5na00522a]
- 39. Michelson interferometer [https://en.wikipedia.org/wiki/Michelson_interferometer]
- 40. The Future of FT-IR Imaging [https://www.spectroscopyonline.com/view/the-future-of-ft-ir-imaging]
- 41. Emerging roles of FTIR spectroscopy in toxic metal profiling [https://foodsafetyandrisk.biomedcentral.com/articles/10.1186/s40550-025-00119-9]
- 42. Some Applications of Vibrational Spectroscopy for the ... [https://www.mdpi.com/2073-4360/11/7/1159]
- 43. FTIR: Transmission vs ATR spectroscopy | Animated Guides [https://specac.com/theory-articles/transmission-vs-atr-spectroscopy-animated-guides/]
- 44. Common Sampling Techniques of FTIR Spectroscopy [https://www.edinst.com/resource/common-sampling-techniques-of-ftir-spectroscopy/]
- 45. Reflectance Infrared (FT-IR) Spectroscopy [https://www.bruker.com/en/products-and-solutions/infrared-and-raman/ft-ir-routine-spectrometer/what-is-ft-ir-spectroscopy/reflectance-infrared-spectroscopy.html]
- 46. FTIR – Diffuse and Specular reflectance techniques [https://specac.com/theory-articles/animated-guides/diffuse-and-specular-reflectance-techniques/]
- 47. Exploring the Steps of Infrared (IR) Spectral Analysis [https://pmc.ncbi.nlm.nih.gov/articles/PMC10574384/]
- 48. Comparison of transmission FTIR and ATR spectra for ... [https://pmc.ncbi.nlm.nih.gov/articles/PMC7054551/]
- 49. Verification of Pharmaceutical Raw Materials Using FT-NIR ... [https://www.spectroscopyonline.com/view/verification-pharmaceutical-raw-materials-using-ft-nir-spectroscopy]
- 50. Ensuring raw material quality [https://www.pharmtech.com/view/ensuring-raw-material-quality]
- 51. Recent applications of near infrared to pharmaceutical ... [https://pubmed.ncbi.nlm.nih.gov/40413709/]
- 52. How IR Spectroscopy Ensures Raw Material Quality [https://allanchem.com/how-ir-spectroscopy-ensures-raw-material-quality/]
- 53. Millimeter-Wave and High-Resolution Infrared ... [https://pmc.ncbi.nlm.nih.gov/articles/PMC12598870/]
- 54. Infrared Spectroscopy Absorption Table [https://chem.libretexts.org/Ancillary_Materials/Reference/Reference_Tables/Spectroscopic_Reference_Tables/Infrared_Spectroscopy_Absorption_Table]
- 55. IR Chart [https://orgchemboulder.com/Spectroscopy/specttutor/irchart.shtml]
- 56. Sensing Protein Structural Transitions with Microfluidic ... [https://pmc.ncbi.nlm.nih.gov/articles/PMC12190510/]
- 57. FT-IR Analysis of pH and Xylitol Driven Conformational ... [https://www.spectroscopyonline.com/view/ft-ir-analysis-of-ph-and-xylitol-driven-conformational-changes-of-ovalbumin-amide-vi-band-study]
- 58. Protein Structure Analysis via Microfluidic IR Spectroscopy [https://www.redshiftbio.com/resources/protein-structure-analysis-via-microfluidic-ir-spectroscopy]
- 59. BeStSel: analysis site for protein CD spectra—2025 update [https://pmc.ncbi.nlm.nih.gov/articles/PMC12230724/]
- 60. In situ secondary structure imaging of protein phase ... [https://www.nature.com/articles/s41467-025-63894-1]
- 61. Editorial: Advanced healthcare biomaterials for surface ... [https://pmc.ncbi.nlm.nih.gov/articles/PMC10621969/]
- 62. Advanced healthcare biomaterials for surface ... [https://www.frontiersin.org/research-topics/47102/advanced-healthcare-biomaterials-for-surface-functionalization-and-controlled-drug-delivery/magazine]
- 63. The potential of near infrared (NIR) spectroscopy coupled ... [https://www.nature.com/articles/s41598-025-17598-7]
- 64. A comprehensive review of the biomaterial-based ... [https://www.sciencedirect.com/science/article/abs/pii/S1773224723008420]
- 65. Application of fourier transform infrared vibrational ... [https://bmcsurg.biomedcentral.com/articles/10.1186/s12893-024-02707-6]
- 66. Biospectroscopy screening and molecular fingerprinting of ... [https://www.nature.com/articles/s41598-025-09912-0]
- 67. Recent applications of quantitative analytical FTIR spect... [https://www.degruyterbrill.com/document/doi/10.1515/revac-2022-0030/html?lang=en&srsltid=AfmBOorHEn2AU3lvRGq5cENqKD7-HfKcn1TQHQyPFKw-Ut5R9sO39BCI]
- 68. Application of FTIR Spectroscopy for Quantitative Analysis ... [https://pmc.ncbi.nlm.nih.gov/articles/PMC8700755/]
- 69. Infrared Spectroscopic Profiling of Volatile Metabolites from ... [https://pmc.ncbi.nlm.nih.gov/articles/PMC12509185/]
- 70. INCREASING THE USE OF FT-IR SPECTROSCOPY AS ... [https://opg.optica.org/viewmedia.cfm?uri=ECBO-2025-Tu1A.4&seq=0]
- 71. Scaling laws for Haralick texture features of linear gradients [https://peerj.com/articles/cs-2856/]
- 72. Spatial resolution in infrared microspectroscopic imaging of ... [https://www.sciencedirect.com/science/article/pii/S0005273606002197]
- 73. Confocal Raman microspectroscopy for spatially resolved ... [https://pmc.ncbi.nlm.nih.gov/articles/PMC12463705/]
- 74. FT-IR Spectroscopy Mini-Tutorial: Principles, Practice, and ... [https://www.spectroscopyonline.com/view/ft-ir-spectroscopy-mini-tutorial-principles-practice-and-applications-across-disciplines]
- 75. High-fidelity tissue super-resolution imaging achieved with ... [https://www.nature.com/articles/s41377-025-01930-x]
- 76. Feature-driven whole-tissue imaging with subcellular ... [https://pubmed.ncbi.nlm.nih.gov/40902591/]
- 77. Feature-driven whole-tissue imaging with subcellular ... [https://www.sciencedirect.com/science/article/pii/S2667237525001845]
- 78. Tissue expansion-enhanced mass-spectrometry imaging ... [https://www.nature.com/articles/s41580-025-00931-3]
- 79. A Dataset of Raman and Infrared Spectra as an Extension ... [https://www.nature.com/articles/s41597-025-05289-x]
- 80. Exploring Fourier Transform Infrared (FTIR) spectroscopy ... [https://pmc.ncbi.nlm.nih.gov/articles/PMC11182784/]
- 81. Common Problems with FT-IR Instruments and How to ... [https://www.spectroscopyonline.com/view/common-problems-with-ft-ir-instruments-and-how-to-avoid-them]
- 82. Spectroscopic Sample Preparation: Techniques for ... [https://www.metkon.com/spectroscopic-sample-preparation/]
- 83. 4.2: IR Spectroscopy [https://chem.libretexts.org/Bookshelves/Analytical_Chemistry/Physical_Methods_in_Chemistry_and_Nano_Science_(Barron)/04%3A_Chemical_Speciation/4.02%3A_IR_Spectroscopy]
- 84. FT-IR Troubleshooting Guide: How to Solve Common ... [https://www.spectroscopyonline.com/view/ftir-troubleshooting-guide-how-to-solve-common-problems-in-infrared-spectroscopy]
- 85. Effects of Moisture and Particle Size on Quantitative ... [https://pmc.ncbi.nlm.nih.gov/articles/PMC5677457/]
- 86. Mini-Tutorial: Cleaning Up the Spectrum Using ... [https://www.spectroscopyonline.com/view/mini-tutorial-cleaning-up-the-spectrum-using-preprocessing-strategies-for-ft-ir-atr-analysis]
- 87. A review on spectral data preprocessing techniques for ... [https://www.sciencedirect.com/science/article/pii/S258900422501020X]
- 88. Nyquist-Shannon theorem application for Savitzky-Golay ... [https://www.sciencedirect.com/science/article/pii/S2211379718314761]
- 89. Preprocessing Strategies for Sparse Infrared Spectroscopy [https://pmc.ncbi.nlm.nih.gov/articles/PMC8839829/]
- 90. Standard Normal Variate (SNV) Signal Processing for Near ... [https://medium.com/@chrisjpulliam/standard-normal-variate-snv-signal-processing-for-near-ir-data-f9bb7a96a42d]
- 91. Comparative analysis of hyperspectral and near-infrared ... [https://pubs.rsc.org/en/content/articlelanding/2025/ay/d4ay02167c]
- 92. Application of second derivative spectroscopy for ... [https://www.sciencedirect.com/science/article/pii/S1063458412000349]
- 93. Fourier-transform infrared derivative spectroscopy with an ... [https://opg.optica.org/abstract.cfm?uri=ol-30-17-2311]
- 94. Functional transformation of Fourier-transform mid-infrared ... [https://pmc.ncbi.nlm.nih.gov/articles/PMC6047484/]
- 95. The Importance of Water Vapor Corrections [https://www.licor.com/support/AppNotes/irg4110-h2o-measurement.html]
- 96. Evaluating the impact of water vapor for aerosol and ... [https://opg.optica.org/oe/abstract.cfm?uri=oe-32-27-48340]
- 97. Correcting atmospheric CO 2 and CH 4 mole fractions ... [https://amt.copernicus.org/articles/12/1013/2019/]
- 98. Evaluation and environmental correction of ambient CO2 ... [https://pmc.ncbi.nlm.nih.gov/articles/PMC6463532/]
- 99. Water vapor self-continuum measurements in the infrared ... [https://www.sciencedirect.com/science/article/pii/S002240732500264X]
- 100. Optimal Spectral Resolution for Infrared Studies of Solids ... [https://pubmed.ncbi.nlm.nih.gov/38404070/]
- 101. ExperimentIRSpectroscopy Documentation [https://www.emeraldcloudlab.com/helpfiles/experimentirspectroscopy]
- 102. Signal-to-noise ratio [https://en.wikipedia.org/wiki/Signal-to-noise_ratio]
- 103. Signal–to–Noise Ratio [https://www.nngroup.com/articles/signal-noise-ratio/]
- 104. What is Signal-to-Noise Ratio in UX and Why Does it Matter? [https://dovetail.com/ux/signal-to-noise-ratio/]
- 105. An evaluation of resolution, accuracy, and precision in FT- ... [https://www.sciencedirect.com/science/article/abs/pii/S138614252400711X]
- 106. An empirical investigation of deviations from the Beer ... [https://www.nature.com/articles/s41598-021-92850-4]
- 107. The Bouguer‐Beer‐Lambert Law: Shining Light on the ... [https://pmc.ncbi.nlm.nih.gov/articles/PMC7540309/]
- 108. Infrared spectroscopy technique for quantification of ... [https://pmc.ncbi.nlm.nih.gov/articles/PMC7832193/]
- 109. The Beer-Lambert Law [https://chem.libretexts.org/Bookshelves/Physical_and_Theoretical_Chemistry_Textbook_Maps/Supplemental_Modules_(Physical_and_Theoretical_Chemistry)/Spectroscopy/Electronic_Spectroscopy/Electronic_Spectroscopy_Basics/The_Beer-Lambert_Law]
- 110. Beer–Lambert law [https://en.wikipedia.org/wiki/Beer%E2%80%93Lambert_law]
- 111. Standard Practices for Infrared Multivariate Quantitative ... [https://www.astm.org/e1655-17.html]
- 112. A Scoping Review of Infrared Spectroscopy and Machine ... [https://pubmed.ncbi.nlm.nih.gov/40075644/]
- 113. Infrared (IR) Spectroscopy Theory – Organic Chemistry [https://open.maricopa.edu/fundamentalsoforganicchemistry/chapter/6-2-infrared-ir-spectroscopy/]
- 114. AI Shakes Up Spectroscopy as New Tools Reveal the ... [https://www.spectroscopyonline.com/view/ai-shakes-up-spectroscopy-as-new-tools-reveal-the-secret-life-of-molecules]
- 115. Automated Spectral Preprocessing via Bayesian ... [https://www.mdpi.com/2304-8158/14/17/2996]
- 116. Optimization of convenient infrared spectroscopy detection ... [https://www.sciencedirect.com/science/article/abs/pii/S0889157525010105]
- 117. A synergistic approach through Bayesian optimization and ... [https://www.sciencedirect.com/science/article/abs/pii/S1386142524006589]
- 118. A synergistic approach through Bayesian optimization and ... [https://pubmed.ncbi.nlm.nih.gov/38815299/]
- 119. Attenuated Total Reflectance (ATR) [https://www.bruker.com/en/products-and-solutions/infrared-and-raman/ft-ir-routine-spectrometer/what-is-ft-ir-spectroscopy/atr-attenuated-total-reflectance.html]
- 120. Attenuated Total Reflectance ATR-FTIR Spectroscopy ... [https://specac.com/theory-articles/introduction-to-atr-ftir-spectroscopy-part-1-the-basics/]
- 121. AERI Desiccant Replacement Procedure [https://www.ssec.wisc.edu/aeri/kb/procedures/maintenance/aeri-desiccant-replacement-procedure/]
- 122. Replace the desiccant - Thermo Fisher Knowledge Base [https://knowledge1.thermofisher.com/Molecular_Spectroscopy/Molecular_Spectroscopy_Media_and_Document_Repository/Nicolet_Summit_and_Nicolet_Summit_PRO_User_Guide/Replace_the_desiccant]
- 123. Using Reference Materials, Part I: Standards for Aligning ... [https://www.spectroscopyonline.com/view/using-reference-materials-part-i-standards-aligning-x-axis]
- 124. Quantitative Infrared Database - the NIST WebBook [https://webbook.nist.gov/chemistry/quant-ir/]
- 125. Comparison of mass spectrometry and fourier transform ... [https://pmc.ncbi.nlm.nih.gov/articles/PMC12453239/]
- 126. FTIR-based molecular fingerprinting for the rapid ... [https://pmc.ncbi.nlm.nih.gov/articles/PMC12274937/]
- 127. MSACL 2025 | Thermo Fisher Scientific - US [https://www.thermofisher.com/us/en/home/about-us/events/industrial/msacl-us.html]
- 128. Comparison of mass spectrometry and fourier transform ... [https://pubmed.ncbi.nlm.nih.gov/40982412/]
- 129. Comparison of mass spectrometry and fourier transform ... [https://journals.plos.org/plosone/article?id=10.1371/journal.pone.0330743]
- 130. Why we use Raman spectroscopy [https://www.renishaw.com/en/why-we-use-raman-spectroscopy--25803?srsltid=AfmBOoqRZ7a_33jdrJ4ItalLiRneM1h0OQQbH_Ni0akELP6oDCPxcryI]
- 131. The Integration of XRD with Raman and FTIR Spectroscopy [https://www.drawellanalytical.com/the-integration-of-xrd-with-raman-and-ftir-spectroscopy/]
- 132. Infrared Spectroscopy 2025 Trends and Forecasts 2033 [https://www.archivemarketresearch.com/reports/infrared-spectroscopy-502263]
- 133. Analytical Instrument Vendors Post Strong Q2 2025 Growth ... [https://www.chromatographyonline.com/view/analytical-instrument-vendors-q2-2025-pharma-chemical-growth]
- 134. Chromatography 2025: The Trends Transforming ... [https://www.sepscience.com/chromatography-2025-the-trends-transforming-laboratories-11149]
- 135. Infrared spectroscopy - Latest research and news [https://www.nature.com/subjects/infrared-spectroscopy]
- 136. The Future of US FDA Pharmaceutical Validation Services ... [https://confiancapharmazon.com/future-us-fda-pharmaceutical-validation-services-2025/]
- 137. How to be prepared for Pharmaceutical Validation in 2025 [https://www.gillsprocess.com/blog-1/2024/12/11/how-to-be-prepared-for-pharmaceutical-validation-in-2025]
- 138. Quality and Regulatory Predictability: Shaping USP ... [https://www.fda.gov/drugs/news-events-human-drugs/quality-and-regulatory-predictability-shaping-usp-standards-12112025]
- 139. Safeguarding product quality in drug manufacturing with ... [https://galaxy-scientific.com/ensuring-product-integrity-drug-manufacturing-nir-spectroscopy/]
- 140. Infrared Spectroscopy For Pharmaceutical Market ... [https://www.linkedin.com/pulse/infrared-spectroscopy-pharmaceutical-market-overview-aocbe]
- 141. Near Infrared Spectroscopy Market Size [https://www.360researchreports.com/market-reports/near-infrared-spectroscopy-market-203360]
- 142. QA and QC Standards in Pharma Industry (Updated for 2025) [https://www.compliancequest.com/bloglet/quality-assurance-in-pharmaceutical-industry/]
- 143. Ultrasensitive infrared spectroscopy via vibrational modulation ... [https://pmc.ncbi.nlm.nih.gov/articles/PMC11661430/]
- 144. Fast infrared spectroscopy of protein dynamics [https://www.sciencedirect.com/science/article/abs/pii/S0959440X15000391]
- 145. A review on near-infrared spectroscopy for rapid detection ... [https://www.sciencedirect.com/science/article/pii/S0022030225008471]
- 146. Near-infrared Spectroscopy Market Set to Surge by 2025, ... [https://www.openpr.com/news/4268768/near-infrared-spectroscopy-market-set-to-surge-by-2025-key]
- 147. Multi-spectral sensor fusion methodology for the quality ... [https://www.sciencedirect.com/science/article/abs/pii/S0026265X25012329]
- 148. Introduction to Infrared and Raman Spectroscopy [http://www.sciencedirect.com/book/9780121825546/introduction]
- 149. Enhancing spectral imaging with multi-condition image fusion [https://www.nature.com/articles/s41598-024-84058-z]
- 150. Multitechnique Fusion of Imaging Data for Heterogeneous ... [https://www.intechopen.com/chapters/15848]