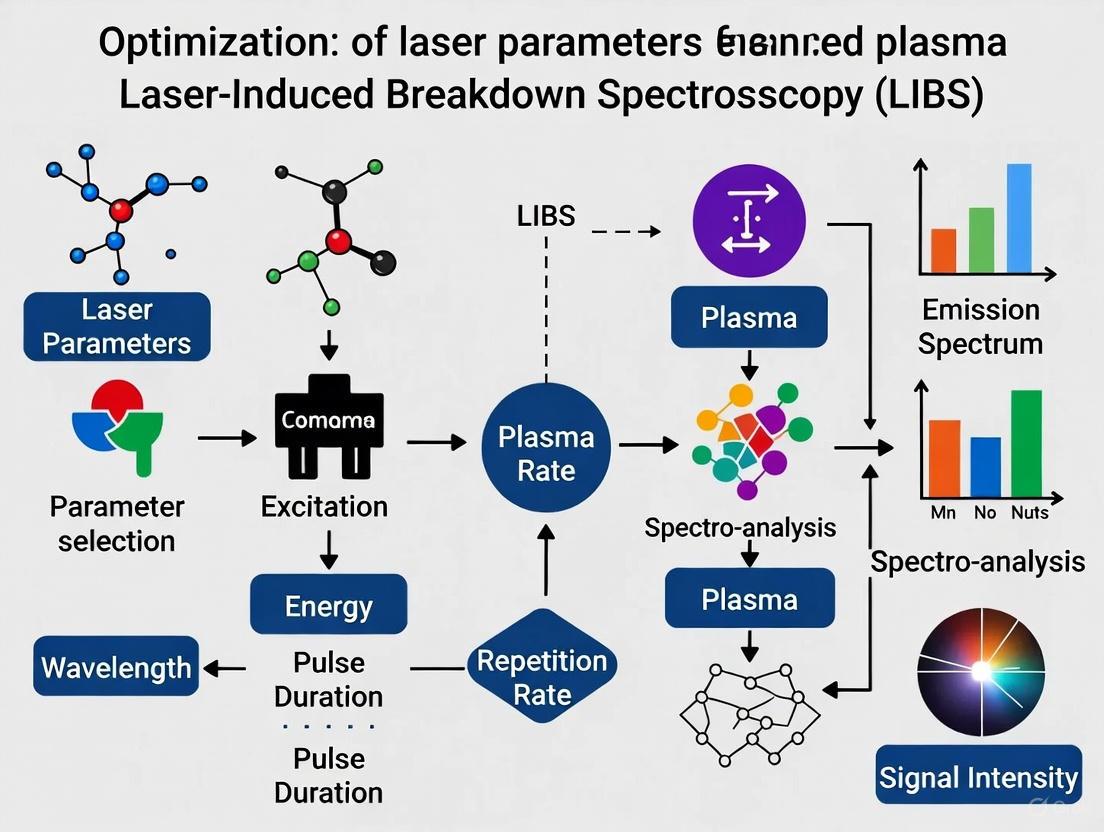
Optimizing Laser Parameters for Enhanced LIBS Plasma Generation: A Guide for Biomedical Researchers
This article provides a comprehensive guide for researchers and drug development professionals on optimizing laser parameters to improve plasma generation in Laser-Induced Breakdown Spectroscopy (LIBS).
Optimizing Laser Parameters for Enhanced LIBS Plasma Generation: A Guide for Biomedical Researchers
Abstract
This article provides a comprehensive guide for researchers and drug development professionals on optimizing laser parameters to improve plasma generation in Laser-Induced Breakdown Spectroscopy (LIBS). Covering foundational principles to advanced applications, it explores how laser wavelength, pulse duration, and energy influence plasma characteristics, data analysis methodologies, and signal robustness. The content details practical optimization strategies for challenging biological samples, addresses common pitfalls like matrix effects, and validates approaches through comparative analysis of nanosecond and femtosecond LIBS systems. By integrating insights from recent studies and artificial intelligence (AI) models, this resource aims to enhance the precision and reliability of LIBS for biomedical applications, including cancer diagnosis and calcified tissue analysis.
Understanding LIBS Plasma Fundamentals and the Impact of Laser Parameters
How Laser Wavelength Influences Photon Absorption and Plasma Emission
FAQs: Laser Wavelength and LIBS Performance
Q1: How does laser wavelength affect the initial photon absorption and ablation process? Shorter laser wavelengths (e.g., 266 nm, 355 nm) are generally more efficiently absorbed by solid samples because they have higher photon energy. This leads to a greater ablation rate and more material being removed from the sample surface [1] [2]. The absorption mechanism is also influenced by the material's properties, and shorter wavelengths often couple more effectively with the target, minimizing reflective losses [2].
Q2: What is the relationship between wavelength and the plasma emission intensity? Research indicates that breakdown induced emission is significantly stronger at shorter laser wavelengths compared to longer wavelengths when compared at the same laser intensity [3]. Furthermore, studies on nanoparticle-enhanced LIBS (NELIBS) show that enhanced laser-plasma coupling at any wavelength can lead to a higher population of emitting species (ions and atoms), which directly boosts spectral emission intensity [4].
Q3: Why are shorter wavelengths often recommended for analyzing delicate materials or for reduced fractionation? Shorter wavelengths (e.g., UV) are associated with reduced elemental fractionation—a non-stoichiometric ablation of the sample. This is due to reduced plasma shielding and enhanced laser-target coupling at shorter wavelengths, leading to a more representative sampling of the material [2]. This is particularly critical for applications like LA-ICP-MS and the analysis of complex pharmaceutical or geological samples [2] [5].
Q4: How does wavelength selection influence the required laser energy (fluence)? The ablation threshold—the minimum energy needed to initiate material removal—is lower for shorter wavelengths [2]. For instance, a 400 nm femtosecond laser was found to have a lower ablation threshold than an 800 nm laser under the same conditions [2]. This means less pulse energy is required to achieve ablation when using UV wavelengths compared to IR.
Q5: Does the optimal laser wavelength depend on the sample's state of matter? Yes, the optimal wavelength can vary. While nanosecond pulses at 1064 nm are commonly used for solids, the laser energy threshold required to induce breakdown in a gas is higher than in a solid [3]. Shorter wavelengths can facilitate easier breakdown in gaseous media, making them a suitable choice for analyzing gases or particles in a gas stream [3].
Troubleshooting Guides
Problem: Weak or No Plasma Emission
- Potential Cause 1: Laser fluence (energy per area) is below the ablation threshold for the selected wavelength and material.
- Potential Cause 2: The laser wavelength is poorly absorbed by the sample material.
Problem: Excessive Sample Damage or Unstable Plasma
- Potential Cause: Thermal effects are dominating the ablation process, which is common with nanosecond pulses in the IR.
- Solution: For thermally sensitive samples (e.g., biological tissues, certain polymers), use shorter pulse durations (femtosecond or picosecond) to minimize thermal damage [1]. Alternatively, a shorter wavelength can also help by coupling energy more efficiently and reducing the heat-affected zone.
Problem: Poor Analytical Precision and Signal-to-Noise Ratio
- Potential Cause 1: The gate delay time on the detector is not optimized for the plasma evolution, which is influenced by the laser parameters.
- Potential Cause 2: The laser wavelength and fluence are leading to an unstable or optically thick plasma.
- Solution: Optimize the laser fluence. Research shows that NELIBS, for example, maintains an optically thin plasma for a longer duration, which improves signal quality [4]. Using a shorter wavelength can also contribute to a more stable plasma formation.
Quantitative Data on Laser Wavelength Effects
Table 1: Comparative Ablation and Emission Characteristics for Different Wavelengths
| Laser Parameter | 1064 nm (NIR) | 532 nm (Visible) | 355 nm (UV) | Key Experimental Findings |
|---|---|---|---|---|
| Photon Energy | Lower | Intermediate | Higher | Higher energy photons at shorter wavelengths directly break atomic bonds [1]. |
| Ablation Threshold | Higher | Intermediate | Lower | 400 nm fs-LA had a lower threshold than 800 nm; similar trend applies to ns-pulses [2]. |
| Ablation Rate | Lower | Higher | Highest | Shorter wavelengths produce higher mass ablation rates [2]. |
| Plasma Shielding | More significant | Reduced | Least significant | Reduced plasma shielding at shorter wavelengths improves laser-target coupling [2]. |
| Emission Intensity | Lower | Higher | Highest | Significantly stronger breakdown emission at shorter wavelengths for the same intensity [3]. |
| Fractionation Effects | More pronounced | Reduced | Least pronounced | Shorter wavelengths in ns-LA produce a more representative aerosol, reducing fractionation [2]. |
Table 2: Femtosecond Laser Ablation: 400 nm vs. 800 nm Wavelength (Study on NIST Glass)
| Performance Metric | 400 nm Femtosecond Laser | 800 nm Femtosecond Laser | Experimental Context |
|---|---|---|---|
| Ablation Threshold | Lower | Higher | Measured on NIST 610 glass; lower energy required for initiation at 400 nm [2]. |
| ICP-MS Signal Intensity | Higher at lower energies | Approximately equal at higher energies | Analysis of multiple isotopes (e.g., Fe-56, Sr-88, U-238) in standard reference materials [2]. |
| Detection Limits | Lower at lower laser energies | Higher at lower laser energies | Beneficial for applications where lower laser energies are preferred [2]. |
| Particle Size Distribution | Similar | Similar | Distributions were very similar for both wavelengths [2]. |
| Particle Counts | Differed significantly at similar fluence | Lower counts at similar fluence | Higher counts observed for 400 nm ablation, indicating more efficient aerosol generation [2]. |
Experimental Protocol: Wavelength Comparison for Plasma Optimization
Aim: To systematically evaluate the effect of laser wavelength on photon absorption efficiency and plasma emission characteristics.
Materials:
- Pulsed laser system with harmonic generator (e.g., Nd:YAG laser providing 1064 nm, 532 nm, 355 nm, and 266 nm).
- High-resolution spectrometer with gated detector (e.g., ICCD).
- Standard reference material (e.g., NIST 610 glass or a pure metal tablet).
- Neutral density filters for energy adjustment.
- Beam profiler and energy meter.
Methodology:
- Sample Setup: Mount the standard reference material in the ablation chamber. Ensure the surface is clean and perpendicular to the laser beam.
- Laser Configuration: Start with the fundamental wavelength (e.g., 1064 nm). Set a fixed pulse duration and repetition rate (e.g., 5 ns, 10 Hz).
- Energy Calibration: For each wavelength, measure the pulse energy before the focusing lens. Use neutral density filters to create an energy series (e.g., 1, 5, 10, 20, 30 mJ).
- Focusing: Focus the laser beam to a consistent spot size on the sample surface for all wavelengths. A beam profiler can verify spot size uniformity.
- Spectral Acquisition:
- Set the spectrometer gate delay to 1 µs and gate width to 5 µs as a starting point.
- For each wavelength and energy level, acquire at least 10 spectra from fresh sample spots.
- Record the intensity of specific elemental lines (e.g., Si I at 288.16 nm, Ca II at 393.37 nm) and the continuum background.
- Data Analysis:
- Ablation Threshold Calculation: Plot the ablated crater volume or mass against laser fluence for each wavelength. The ablation threshold is the fluence where the trend line intersects the x-axis.
- Signal-to-Background Ratio (S/B): Calculate S/B for a selected emission line:
S/B = (Peak Line Intensity - Background Intensity) / Background Intensity. - Plasma Temperature: Use the Boltzmann plot method with multiple emission lines from the same species to compare plasma temperatures across wavelengths.
Experimental Workflow for Wavelength Comparison
Advanced Enhancement Strategy: Nanoparticle-Enhanced LIBS (NELIBS)
For researchers seeking to dramatically improve signal intensity irrespective of the laser wavelength, Nanoparticle-Enhanced LIBS (NELIBS) presents a powerful strategy.
Mechanism: A sample surface is coated with metallic nanoparticles (e.g., 20 nm Au NPs). When the laser pulse arrives, the Localized Surface Plasmon Resonance (LSPR) effect of the nanoparticles creates a highly enhanced local electromagnetic field. This leads to a much more efficient and explosive ablation process from the surface, increasing the density of ablated material and excited species in the plasma [4].
Key Findings from NELIBS Research:
- Enhanced Laser-Plasma Coupling: Nanoparticles drastically improve the efficiency of laser energy absorption and plasma formation [4].
- Higher Emitting Species: NELIBS shows increased absolute populations of both ions and neutral atoms, which is the primary source of signal enhancement [4].
- Improved Plasma Stability: The NELIBS plasma remains in a more optically thin state for a longer duration, which is ideal for spectroscopic analysis as it minimizes self-absorption [4].
- Superior Ablation: Microscopic images confirm that NELIBS results in smoother and more uniform ablation craters, indicating a modified and more efficient ablation mechanism shifting toward "normal evaporation" [4].
NELIBS Signal Enhancement Pathway
The Scientist's Toolkit: Essential Research Reagents and Materials
Table 3: Key Reagents and Materials for LIBS Wavelength Studies
| Item | Function / Purpose | Example Specifications / Notes |
|---|---|---|
| Nd:YAG Laser System | Primary ablation source. Its harmonics provide key wavelengths for study. | Fundamental 1064 nm, with 2nd (532 nm), 3rd (355 nm), and 4th (266 nm) harmonics [1]. |
| Standard Reference Materials (SRMs) | Certified materials for instrument calibration, method validation, and ablation rate studies. | NIST 610, 612, 614 glass series; pure metal tablets (e.g., Cu, Al) [2] [7]. |
| Metallic Nanoparticles | For NELIBS experiments to enhance plasma emission signal. | 20 nm spherical Gold nanoparticles (Au-NPs), suspended in solution for coating [4]. |
| High-Resolution Spectrometer | To resolve closely spaced atomic emission lines and capture weak signals. | Czerny-Turner or Echelle spectrograph with wide wavelength coverage [1] [6]. |
| Gated Detector (ICCD) | To temporally resolve the plasma emission, rejecting early continuum background. | Must be triggerable with low jitter for precise delay/gate width control [6] [8]. |
| Beta Barium Borate (BBO) Crystal | Frequency doubling crystal to generate shorter wavelengths (e.g., 400 nm from 800 nm). | Used in ultrafast laser systems to compare wavelength effects [2]. |
Troubleshooting Guides
FAQ: How does laser pulse duration fundamentally alter the ablation mechanism?
Answer: The primary difference lies in the laser's interaction with the evolving plasma and the subsequent material response.
Femtosecond (fs) Lasers: The ultra-short pulse (e.g., 180 fs) concludes before significant mass removal begins. This prevents laser-plasma coupling, leading to a minimal Heat-Affected Zone (HAZ) of only about 4 nm. Energy deposition occurs through nonlinear processes like multiphoton absorption, resulting in a "cold" ablation process with ions that have higher initial velocities but lower temperatures [9] [10].
Nanosecond (ns) Lasers: The longer pulse (e.g., 1–6 ns) continues to irradiate the sample after the initial plasma forms. This leads to significant laser-plasma coupling, where the laser energy heats the expanding plasma. This creates a larger HAZ (≈1000 nm for a 6 ns pulse) and generates a hotter plasma that emits slower ions over a prolonged duration (tens of nanoseconds) [9] [10].
Table: Fundamental Differences in Ablation Mechanisms
| Characteristic | Femtosecond Laser | Nanosecond Laser |
|---|---|---|
| Laser-Plasma Coupling | Negligible | Significant |
| Heat-Affected Zone (HAZ) | ~4 nm | ~1000 nm |
| Ion Velocity | Higher initial velocity | Slower ions |
| Ion Temperature | Lower temperature | Hotter plasma |
| Ion Emission Duration | Instantaneous; no continuous emission | Continuous for tens of nanoseconds |
FAQ: My LIBS signal is weak. How can pulse duration and other parameters enhance it?
Answer: A weak signal can be addressed by optimizing laser parameters and considering advanced setups.
Pulse Duration Selection: For a more robust and persistent plasma that is often better for LIBS emission, nanosecond lasers are typically preferred due to plasma heating effects [10]. However, fs lasers offer superior ablation stoichiometry with less thermal damage.
Nanoparticle Enhancement (NELIBS): Coating your sample with nanoparticles (e.g., 20 nm Au nanoparticles) can dramatically enhance signal. NELIBS improves laser-energy coupling via localized surface plasmon resonance (LSPR), leading to a higher density of emitting species, more efficient ablation, and a plasma that remains optically thin for longer, improving signal quality [4].
Background Environment: The ambient environment around the sample affects plasma dynamics. Using a low-pressure Ar plasma ambient (as opposed to simple Ar gas) can increase continuous radiation background and ionic line intensity due to higher radiative recombination losses [11].
FAQ: Why is my calibration inaccurate, and how can pulse duration affect it?
Answer: Inaccuracy often stems from non-stoichiometric ablation, where the ablated mass does not perfectly represent the bulk sample composition.
Nanosecond Laser Pitfall: The significant thermal effects and larger HAZ of ns lasers can cause elemental fractionation—the preferential vaporization of certain elements—which compromises analytical accuracy [10].
Femtosecond Laser Advantage: The minimal HAZ and limited thermal diffusion of fs lasers make them superior for achieving stoichiometric ablation, which is crucial for accurate quantitative analysis, especially when using non-matrix-matched standards [10].
Spectral Identification: Always use multiple spectral lines to confirm the presence of an element. A minimal calibration shift can misidentify common elements (e.g., Calcium) for exotic ones (e.g., Cadmium) [12].
Experimental Protocols & Data Interpretation
Protocol: Time-of-Flight (TOF) Mass Spectrometer for Ion Dynamics
This protocol is used to analyze the velocity and temperature of ions ablated by different laser pulses, as detailed in [9] [13].
1. Objective: To characterize the dynamic properties (velocity, temperature, emission duration) of ions emitted from materials irradiated by fs and ns lasers.
2. Materials & Setup:
- Laser Sources: Ti:sapphire femtosecond laser (180 fs, 800 nm) and Nd:YAG nanosecond laser (1 ns, 355 nm).
- Sample: CsI (Cesium Iodide) deposits.
- Key Instrument: A developed Time-of-Flight (TOF) Mass Spectrometer.
- Detection Range: Laser pulse energies from 400 nJ to 1000 nJ.
3. Procedure:
- Irradiate the CsI sample with a single pulse from either the fs or ns laser.
- Guide the ablated ions through the field-free drift tube of the TOF spectrometer.
- Measure the time taken for ions to reach the detector, creating a TOF profile.
- Repeat for both laser types across the energy range.
- Analyze the TOF profiles using an ion trajectory simulation that incorporates a shifted Maxwell–Boltzmann initial velocity distribution and a model for continuous ion emission.
4. Data Interpretation:
- Faster Arrival Time indicates higher initial ion velocity.
- Profile Shape reveals ion temperature and whether emission was instantaneous or prolonged.
- The need for a "continuous ion emission" model in the simulation confirms prolonged emission for ns lasers, unlike fs lasers.
Protocol: Nanoparticle-Enhanced LIBS (NELIBS)
This protocol outlines the method for achieving signal enhancement using nanoparticles, based on [4].
1. Objective: To enhance LIBS spectral emissions by modifying the laser-sample interaction with metallic nanoparticles.
2. Materials & Setup:
- Sample: A solid sample (e.g., titanium).
- Nanoparticles: 20 nm spherical Gold Nanoparticles (Au-NPs).
- Laser: A standard LIBS laser (typically ns-pulsed).
- Spectrometer: A system capable of temporal resolution to monitor plasma evolution.
3. Procedure:
- Coat the sample surface with a layer of Au-NPs under optimized conditions.
- Irradiate the coated sample with the laser pulse.
- Record the temporal evolution of the spectral intensity and plasma properties (temperature and electron density).
- Compare the results (signal intensity, crater morphology, plasma lifetime) with LIBS performed on an uncoated sample.
4. Data Interpretation:
- Higher and longer-lasting spectral emission indicates successful NELIBS enhancement.
- A smoother and more uniform ablation crater observed under microscopy confirms superior and more efficient ablation.
- A lower plasma temperature coupled with higher electron density at early times suggests modified and more efficient plasma conditions.
The Scientist's Toolkit: Essential Research Reagents & Materials
Table: Key Materials for Laser Ablation and Plasma Research
| Item | Function / Application |
|---|---|
| CsI (Cesium Iodide) Deposits | A sample material used in fundamental studies to investigate ion emission dynamics using Time-of-Flight mass spectrometry [9]. |
| Au Nanoparticles (20 nm, spherical) | Coated onto samples for Nanoparticle-Enhanced LIBS (NELIBS); enhances laser-energy coupling via Localized Surface Plasmon Resonance (LSPR) [4]. |
| NIST SRM610 Glass | A standard reference material with known trace element concentrations (e.g., 425 ppm Rb, 461 ppm K); used for calibration and method validation [14]. |
| Time-of-Flight (TOF) Mass Spectrometer | An instrument designed to measure the time ions take to travel a fixed distance, used for analyzing the velocity and temperature of ablated species [9]. |
| Low-pressure Ar Plasma Chamber | A controlled environment to study the spatio-temporal evolution of laser ablation plasma under different background ambients, relevant for diagnostics in fields like tokamak research [11]. |
Visualization of Ablation Dynamics
The following diagram illustrates the fundamental differences in the ablation processes between femtosecond and nanosecond lasers, integrating concepts from laser-plasma interaction, ion emission, and the resulting crater morphology.
Frequently Asked Questions (FAQs)
Q1: What are the key characteristics of a laser-induced plasma and why are they important? The key characteristics include the plasma's formation time, lifetime, size, and fundamental diagnostic parameters like electron temperature and electron density. These are crucial because they directly influence the quality and stability of the LIBS spectral signal, which in turn determines the accuracy and precision of your chemical analysis. Controlling these parameters helps mitigate the well-known signal instability issues in LIBS [15] [16].
Q2: How long does a typical laser-induced plasma last? The plasma lifetime is on the order of tens of microseconds [17]. The plasma cools rapidly from its initial temperature, which can exceed 30,000 K [18], and the characteristic decay of plasma emission and expansion can be described by a power law and a drag model, respectively [19].
Q3: What is the significance of the "delay time" and "gate width" in LIBS measurements? The delay time (the time between the laser pulse and the start of spectral acquisition) and gate width (the duration of spectral acquisition) are critical for signal quality [20] [17].
- Delay Time: At very short delays (<1 µs), the plasma is very hot and dense, dominated by intense background continuum radiation. A delay of 1-3 µs is often necessary to satisfy Local Thermodynamic Equilibrium (LTE) conditions and allow ionic lines to be observed. The optimal delay is element-dependent [20] [17] [12].
- Gate Width: A longer gate width increases the signal-to-noise ratio (SNR) by collecting more light. Research shows that measured plasma temperature and electron density do not significantly vary with gate width, meaning long integration times (up to 1 ms) can be used to boost SNR without compromising the ability to apply LTE concepts, provided an appropriate delay time is used [17] [7].
Q4: What are the typical ranges for electron temperature and density in a LIBS plasma? The plasma parameters change rapidly after the laser pulse:
- Electron Temperature: Can be very high at plasma onset (>20,000 K) and cools rapidly over microseconds [17].
- Electron Density: Also very high at onset (>1×10¹⁹ cm⁻³) and decays as the plasma expands and cools [17]. These parameters must be measured using time-resolved spectrometers with gate times typically lower than 1 µs for accurate assessment [12].
Q5: What is "Local Thermodynamic Equilibrium" (LTE) and why does it matter?
LTE is an approximation where atoms, ions, and electrons in a small plasma volume are in thermodynamic equilibrium, describable by a single temperature. It is fundamental for quantitative methods like Calibration-Free LIBS (CF-LIBS). The McWhirter criterion is a necessary condition for LTE, requiring a sufficiently high electron density [21] [12]:
ne > 1.6 × 10^12 * T^(1/2) * (ΔE_max)^3
LTE is typically satisfied with delay times of a few microseconds (1-3 µs). With longer delays, electron density drops, and LTE can be compromised [17] [12].
Q6: How do atmospheric conditions affect the plasma? Atmospheric conditions have a strong influence on plasma size and emission. Instruments must be specifically designed and optimized for their operational environment (e.g., Earth, Mars, vacuum). In contrast, sample lithology and laser irradiance within typical ranges play a comparatively minor role [19].
Troubleshooting Guides
Problem 1: Poor Spectral Signal-to-Noise Ratio (SNR)
| Symptom | Possible Cause | Solution |
|---|---|---|
| Weak, noisy spectral lines | Sub-optimal acquisition timing | Increase the gate width (e.g., up to 1 ms) to collect more emission light and improve SNR [17] [7]. |
| Ensure the delay time is set to allow the intense continuum background to decay (typically >1 µs) [20] [18]. | ||
| Low laser energy | Optimize laser fluence on the target. For one study, 95 mJ was an optimal value [15]. |
Problem 2: Inconsistent Quantitative Results
| Symptom | Possible Cause | Solution |
|---|---|---|
| Large pulse-to-pulse variation | Unstable plasma formation | Use a Dynamic Vision Sensor (DVS) or similar imaging to monitor plasma morphology (e.g., plasma area) in real-time and use the data for spectral correction [15]. |
| Matrix effects from sample heterogeneity | Use chemometric methods like Partial Least Squares (PLS) and ensure your calibration standards are matrix-matched to your samples [20] [22]. | |
| Invalid calibration-free model | Plasma not in LTE | Verify LTE conditions by measuring electron density and temperature. Use a sufficient delay time (e.g., 1-3 µs) to ensure McWhirter criterion is met [17] [12]. |
Problem 3: Spectral Line Distortion (Self-Absorption)
| Symptom | Possible Cause | Solution |
|---|---|---|
| Calibration curves saturate at high concentrations; line centers appear dipped. | High concentration of the analyte in the plasma, leading to re-absorption of emitted light. | For high-concentration analytes, use analytical lines that are not ending on the ground state, as they are less susceptible to self-absorption [20]. |
| Use methods to evaluate and correct for self-absorption rather than treating it as an unmanageable problem [12]. |
Experimental Data and Protocols
This data shows the strong influence of the surrounding environment on plasma characteristics.
| Atmospheric Condition | Sample Type | Key Plasma Characteristics |
|---|---|---|
| Earth | Basalt, Soapstone, Lunar Simulants | Plasma size and emission strongly influenced by atmosphere. |
| Martian | Basalt, Soapstone, Lunar Simulants | Plasma size and emission strongly influenced by atmosphere. |
| Airless (Moon) | Basalt, Soapstone, Lunar Simulants | Plasma size and emission strongly influenced by atmosphere. |
These parameters are highly dependent on delay time after the laser pulse.
| Parameter | Typical Range | Measurement Method |
|---|---|---|
| Electron Temperature (Te) | > 20,000 K at onset, cooling rapidly | Saha-Boltzmann plot [17]. |
| Electron Density (ne) | > 1×10¹⁹ cm⁻³ at onset, decaying rapidly | Stark broadening of spectral lines [21]. |
A summary of common experimental approaches to improve spectral quality.
| Optimization Scenario | Method | Principle |
|---|---|---|
| Energy Injection | Double-Pulse LIBS | The first pulse creates a favorable environment; the second pulse generates a more robust analytical plasma [16] [12]. |
| Spatial Confinement | Spatial Confinement | Using physical cavities or magnetic fields to confine the plasma, increasing its density and lifetime [16]. |
| Technology Fusion | DVS-enhanced LIBS | Using a high-speed vision sensor to capture plasma morphology for real-time spectral correction [15]. |
Objective: To obtain high-quality LIBS signals by optimizing laser and plasma imaging parameters, and to establish a correction model for improved spectral stability.
Materials and Reagents:
- LIBS system with a pulsed laser (e.g., Nd:YAG)
- Dynamic Vision Sensor (DVS) with microsecond temporal resolution
- Spectrometer
- Standard samples (e.g., copper alloys, carbon steel)
Procedure:
- Spectral Analysis for LIBS Optimization:
- Ablate standard samples using a range of laser energies and delay times.
- Acquire spectra and analyze the signal intensity and stability.
- Determine the optimal LIBS parameters that yield the highest quality spectra. The cited study found 95 mJ laser energy and a 1.5 µs delay time to be optimal.
DVS Parameter Optimization:
- Position the DVS to capture the plasma optical signal. Use event frame reconstruction and statistical analysis to find the best DVS configuration.
- The cited study optimized for an F2.0 aperture, 5 cm collection distance, and a 0° collection angle.
Spectral Correction Model (DVS-SC):
- Use the DVS to extract key plasma parameters for each laser shot, specifically the plasma area and the number of "On" events (pixels triggered by increased light intensity).
- Establish a mathematical model that uses these DVS-extracted parameters to correct the intensities in the corresponding LIBS spectrum.
Expected Outcome: This method has shown to significantly improve the R² values of calibration curves (e.g., improvements of 61.1% for Cu) and reduce the relative standard deviation (RSD) of measurements, demonstrating greatly enhanced quantitative analysis performance [15].
Objective: To experimentally verify whether a laser-induced plasma is in Local Thermodynamic Equilibrium, a prerequisite for calibration-free quantitative analysis.
Materials and Reagents:
- LIBS system with time-resolved spectrometer (e.g., ICCD camera)
- Sample with multiple known emission lines (e.g., pure titanium or a sample mixed with TiO₂ and CuSO₄)
Procedure:
- Set Acquisition Parameters:
- Use a delay time of at least 1 µs to allow the plasma to cool slightly and move away from the initial non-LTE state. Avoid very short delays (< 1 µs).
- A gate width of 1 µs is sufficient for this diagnostic measurement.
Measure Plasma Temperature:
- Record the spectrum from your sample.
- Construct a Boltzmann plot using multiple emission lines from the same species (e.g., Ti I). The slope of the plot gives the plasma temperature.
- For higher accuracy, construct a Saha-Boltzmann plot that incorporates both atomic and ionic lines, corrected with methods like the one-point calibration (OPC).
Measure Electron Density:
- Measure the Stark broadening of a well-isolated spectral line. The full width at half maximum (FWHM) of the line profile is related to the electron density.
Apply the McWhirter Criterion:
- Use the measured electron density (ne) and temperature (T) in the McWhirter formula:
n_e > 1.6 × 10^12 * T^(1/2) * (ΔE_max)^3. - Calculate the right-hand side of the inequality. If your measured ne is greater than this value, the necessary condition for LTE is satisfied.
- Use the measured electron density (ne) and temperature (T) in the McWhirter formula:
Expected Outcome: A confirmation that for your specific experimental setup and delay time, the plasma meets the minimum criteria to be treated as in Local Thermodynamic Equilibrium, validating the use of CF-LIBS or other temperature-based models [17].
The Scientist's Toolkit: Essential Research Reagents and Materials
| Item | Function in LIBS Research |
|---|---|
| Certified Reference Materials (CRMs) | Essential for building calibration curves and validating quantitative methods. Used as standardized samples to ensure analytical accuracy [7]. |
| Dynamic Vision Sensor (DVS) | A vision sensor with high temporal resolution used to capture plasma morphology (size, shape, intensity) in real-time for advanced spectral correction [15]. |
| Nd:YAG Laser | The most common laser source for LIBS, typically operating at 1064 nm fundamental wavelength, providing high-power pulses for plasma generation [7]. |
| Time-Resolved Spectrometer (e.g., ICCD) | A spectrometer coupled with an intensified camera that can be gated with nanosecond precision. Crucial for studying plasma evolution and isolating atomic emission from continuum background [20] [12]. |
Workflow and Relationship Diagrams
Addressing Matrix Effects in Complex Biological Tissues
FAQ: Understanding and Overcoming Matrix Effects
What are matrix effects in LIBS analysis of biological tissues? Matrix effects are phenomena where the physical and chemical properties of the sample influence the LIBS signal, making quantitative analysis challenging. In complex biological tissues, these effects arise from variations in water content, density, elemental composition, and tissue heterogeneity, which alter the laser-sample interaction and plasma characteristics [23] [22].
Why are biological tissues particularly prone to matrix effects? Biological tissues are highly heterogeneous, composed of various cell types, extracellular matrix, and fluids with different optical and thermal properties. This complexity causes uneven laser ablation and plasma formation, leading to signal fluctuations and quantification inaccuracies [24].
What are the most effective strategies to mitigate matrix effects? Advanced calibration methods, such as delocalized calibration supported by micro-XRF, and signal normalization techniques using acoustic data or plasma parameters, have shown significant promise. Employing machine learning models that can learn from multi-distance or multi-matrix spectra is also a powerful approach [23] [24] [7].
Troubleshooting Guides
Problem: Poor Quantification Accuracy in Plant Tissue Analysis
Symptoms: High quantification error for target elements (e.g., Cd), with Mean Absolute Percentage Error (MAPE) exceeding 40% [24].
Solution: Implement a delocalized calibration strategy.
- Acquire paired data: Analyze the same set of tissue samples using both LIBS and micro-XRF at identical spatial resolutions [24].
- Spectral clustering: Apply a clustering algorithm (like K-Means) to the LIBS spectra to group them based on their matrix characteristics, not their spatial location [24].
- Build calibration models: Develop a separate calibration model for each identified spectral cluster using the accurate quantitative data from micro-XRF [24].
- Apply models: For a new LIBS spectrum, assign it to the closest cluster and use the corresponding calibration model for quantification.
Expected Outcome: This method has been shown to reduce the MAPE for Cadmium from over 40% to 8.7%, and for Calcium to 1.1% [24].
Problem: Signal Fluctuations Due to Variable Detection Distances
Symptoms: LIBS spectral profiles and intensities vary even for the same sample when the laser-to-target distance changes, complicating model performance [7].
Solution: Utilize a multi-distance deep learning model with an optimized sample weighting strategy.
- Data Collection: Build a training dataset by collecting LIBS spectra from your target samples at multiple, known distances [7].
- Model Training: Train a Deep Convolutional Neural Network (CNN) directly on the mixed-distance spectra. Instead of weighting all samples equally, assign optimized weights to each spectral sample based on its acquisition distance [7].
- Validation: Test the model on a separate set of multi-distance spectra.
Expected Outcome: This approach has achieved a classification accuracy of 92.06% for geochemical samples, with significant improvements in precision, recall, and F1-score compared to models without the weighting strategy [7].
Problem: Inconsistent Ablation and Plasma Formation
Symptoms: Unstable plasma, high signal pulse-to-pulse variation, and inaccurate results due to physical matrix effects [23] [22].
Solution: Normalize the LIBS optical signal using the accompanying Laser-Induced Plasma Acoustic Signal (LIPAc).
- Setup Integration: Equip your LIBS system with a microphone (MEMS microphones are superior) to capture the acoustic shockwave generated during laser ablation [23].
- Data Acquisition: Simultaneously collect the optical emission spectrum and the acoustic signal for each laser pulse.
- Signal Normalization: Use the amplitude of the acoustic signal to normalize the intensities of the LIBS spectral lines. The acoustic signal is proportional to the ablated mass, which helps correct for fluctuations in laser-sample coupling efficiency [23].
Expected Outcome: This method helps eliminate discrepancies between atomic and ionic emission lines and reduces signal fluctuations caused by sample surface roughness and compositional differences [23].
Experimental Protocols for Key Methodologies
Protocol 1: Acoustic Signal Normalization for Homogeneous Plasma Generation
Objective: To mitigate physical matrix effects and stabilize the LIBS signal for more reliable quantification [23].
Materials and Equipment:
- Pulsed Nd:YAG Laser (e.g., 1064 nm or 266 nm)
- Spectrometer with detection gates
- MEMS or Electret Microphone
- Oscilloscope
- Data acquisition system
Procedure:
- Setup: Align the laser, sample, and spectrometer optics. Position the microphone at a fixed distance and angle relative to the plasma generation point.
- Synchronization: Connect the microphone output to the oscilloscope and synchronize the trigger with the laser pulse and spectrometer.
- Data Collection: For each laser shot, record:
- The full optical emission spectrum.
- The time-domain acoustic waveform.
- Processing: Extract the peak amplitude or integrated energy of the acoustic signal for each shot.
- Normalization: Divide the intensity of the target LIBS emission line (e.g., Cu(I) 324.74 nm) by the corresponding acoustic signal amplitude.
Protocol 2: Matrix-Matched Calibration for Heterogeneous Tissue
Objective: To achieve accurate quantification of elements in a complex, heterogeneous biological matrix (e.g., plant leaf) [24].
Materials and Equipment:
- LIBS instrument
- micro-XRF instrument
- Cryo-microtome for thin-sectioning
- Clustering software (e.g., Python with scikit-learn)
Procedure:
- Sample Preparation: Freeze the plant tissue and use a cryo-microtome to prepare thin sections (e.g., 10-20 µm thick) to be mounted on slides.
- Coarse Analysis: First, use micro-XRF to perform a coarse scan of the tissue section to identify regions with varying matrix compositions.
- Paired Data Acquisition: Perform high-resolution LIBS imaging and micro-XRF analysis on the exact same regions of interest.
- Data Fusion & Clustering: Use the K-Means clustering algorithm on the entire set of LIBS spectra to group them based on their spectral characteristics.
- Model Building: For each cluster, build a calibration curve that maps the normalized LIBS intensity of the target element (e.g., Cd) to its concentration as determined by micro-XRF.
- Validation: Validate the model on a new tissue section not used in the training process.
Data Presentation
Table 1: Comparison of Methods for Mitigating Matrix Effects in LIBS
| Method | Key Principle | Best For | Reported Improvement/Performance |
|---|---|---|---|
| Acoustic Signal Normalization [23] | Uses shockwave amplitude to normalize for ablated mass | Correcting for physical matrix effects (surface roughness, hardness) | Eliminates discrepancy between atomic and ionic line intensities; reduces ablation fluctuations. |
| Delocalized Calibration [24] | Pairs LIBS with micro-XRF and uses clustering for matrix-specific models | Quantitative imaging of heterogeneous biological tissues (e.g., Cd in plants) | Reduced MAPE for Cd from >40% to 8.7%; for Ca to 1.1%. |
| Deep CNN with Sample Weighting [7] | Neural network trained on multi-distance data with distance-based weights | Classification and analysis when working at variable stand-off distances | Achieved 92.06% classification accuracy on an 8-distance dataset. |
| Calibration-Free LIBS (CF-LIBS) [22] | Calculates concentration from spectral intensities and modeled plasma parameters | Situations where standards are unavailable; multi-element analysis | Provides semi-quantitative results without calibration standards; accuracy is less than calibrated methods. |
Table 2: Key Laser Parameters for Optimizing Plasma in Biological Tissues
| Parameter | Consideration | Impact on Plasma & Matrix Effects |
|---|---|---|
| Laser Wavelength [23] | UV (e.g., 266 nm) vs. IR (e.g., 1064 nm) | UV light often couples more efficiently with biological tissue and produces less thermal damage, potentially reducing chemical matrix effects. |
| Laser Fluence [23] [25] | Must be carefully optimized (e.g., 3.9-7.8 J/cm²) | Fluence significantly above the ablation threshold can make the acoustic (and thus LIBS) response more uniform across different materials. Too high fluence can damage substrates [25]. |
| Gate Delay & Width [25] | Short delay (e.g., 50 ns), optimized width | A short gate delay can help reduce continuum background radiation, improving the signal-to-noise ratio of ionic and atomic lines. |
| Spot Size | Smaller for spatial resolution, larger for representative sampling | A larger spot size can ablate a more representative volume of heterogeneous tissue, averaging out local variations. |
Signaling Pathways and Workflows
Matrix Effect Mitigation Workflow
This diagram outlines the strategic pathways for addressing matrix effects in LIBS analysis of biological tissues, moving from the initial problem to a reliable analytical outcome.
The Scientist's Toolkit: Research Reagent Solutions
Table 3: Essential Materials and Reagents for LIBS of Biological Tissues
| Item | Function | Application Note |
|---|---|---|
| Certified Reference Materials (CRMs) [7] | For calibration and validation of the LIBS method. | Use matrix-matched CRMs (e.g., GBW series) where possible. Essential for building robust calibration curves. |
| Pulsed Nd:YAG Laser [23] [25] [7] | The excitation source for generating plasma. | Key parameters are wavelength (1064 nm, 266 nm), pulse energy (e.g., 9 mJ), and pulse width (ns). |
| MEMS Microphone [23] | To capture the Laser-Induced Plasma Acoustic Signal (LIPAc). | Superior for recording plasma shockwaves. Used for signal normalization to correct for ablation fluctuations. |
| Cryo-microtome [24] | To prepare thin, consistent sections of biological tissue. | Enables flat surfaces for stable ablation and allows for correlative imaging with techniques like micro-XRF. |
| micro-XRF Instrument [24] | Provides quantitative elemental data to support LIBS calibration. | Used in a "delocalized" strategy to build high-accuracy calibration models for different tissue matrices. |
Advanced Methodologies and Biomedical Applications of Optimized LIBS
Troubleshooting Guide: Common Experimental Issues and Solutions
Why are my CN and C2 band intensities inconsistent across repeated measurements?
Inconsistent molecular band intensities often stem from fluctuations in laser energy delivery or improper timing of spectral acquisition relative to plasma formation.
- Root Cause: LIBS plasmas are highly dynamic, with molecular emissions evolving rapidly during plasma expansion and cooling. The distribution of CN vibrational emissions is strongly time-dependent [26].
- Solutions:
- Implement time-resolved spectroscopy with gate delays optimized for molecular detection. For CN bands, larger differences in vibrational emission typically occur at early stages after plasma ignition [26].
- Ensure laser pulse energy stability. Use a power meter to verify consistent laser output and check for gradual energy depletion in flashlamps.
- Control laser irradiance on the sample surface, as it significantly affects the vibrational distribution of CN molecules [26].
What causes weak or absent CN/C2 molecular band signals despite strong atomic lines?
This discrepancy typically indicates suboptimal conditions for molecular formation or detection within the laser-induced plasma.
- Root Cause: Molecular formation competes with atomic processes in the plasma. The detected CN can originate from direct fragmentation of native carbon-nitrogen bonds in the sample or from secondary recombination of carbon and nitrogen atoms in the plasma plume [26] [27].
- Solutions:
- Verify atmospheric composition. CN formation requires a nitrogen source. Ensure your analysis is conducted in air or a nitrogen-containing gas environment [26].
- Adjust temporal gating parameters. Molecular bands often appear strongest during later plasma stages compared to ionic atomic lines. Experiment with delay times from 1-5 µs.
- Confirm spectral resolution. Molecular bands consist of numerous rotational-vibrational lines. Ensure your spectrometer has sufficient resolution (typically <0.1 nm) to resolve these features.
How can I distinguish between CN originating from sample composition versus atmospheric nitrogen?
Determining the origin of CN signals is crucial for accurate material identification, especially when analyzing organic compounds.
- Root Cause: CN molecules in the plasma can form through two primary pathways: direct fragmentation of native C-N bonds in the sample ("native CN"), or reactive recombination of carbon atoms from the sample with nitrogen from the surrounding atmosphere [26].
- Solutions:
- Analyze time-resolved spectral evolution. Native CN from the sample structure typically appears earlier in the plasma evolution, while recombined CN from the atmosphere manifests later [26].
- Experiment with different ambient gases. Compare spectra obtained in nitrogen versus inert argon atmospheres. CN signal reduction in argon indicates significant atmospheric contribution [27].
- Examine C2/CN ratios. The relative intensities of C2 to CN bands can help distinguish between different organic materials, as their formation mechanisms are linked to the original molecular structure [27].
Why do my calibration curves for molecular bands show poor linearity?
Non-linear calibration curves for molecular species often result from self-absorption effects or complex formation mechanisms.
- Root Cause: Self-absorption occurs when photons emitted by excited molecules in the plasma are re-absorbed by other molecules of the same species in cooler outer plasma regions [12] [28].
- Solutions:
- Implement plasma spatial modulation. Using geometrical constraints to create a flatter, thinner plasma can reduce self-absorption by shortening the photon path length [28].
- Apply self-absorption correction algorithms. Methods like the Curve-of-Growth (COG) or Self-Absorption Coefficient (SA) can mathematically compensate for these effects [28].
- Optimize plasma conditions. Ensure the plasma is optically thin by adjusting laser energy, using dual-pulse configurations, or employing nanoparticle enhancement (NELIBS) to create more uniform plasma conditions [4] [22].
Frequently Asked Questions (FAQs)
Q: What is the optimal gate delay and width for capturing CN and C2 molecular bands?
Molecular bands typically require longer delay times compared to ionic lines because they form as the plasma cools. The optimal timing depends on your specific experimental setup and laser parameters, but generally:
- CN bands: Begin detection 1-2 µs after plasma formation with gate widths of 2-5 µs.
- C2 bands: Similar timing to CN, but may vary based on the carbon structure in the sample.
- Critical consideration: Always perform temporal optimization for your specific system and samples, as the time evolution of molecular emissions is sample-dependent [26].
Q: How do laser parameters (wavelength, pulse duration, energy) affect molecular fragmentation patterns?
Laser parameters significantly influence fragmentation pathways and molecular band intensities:
- Pulse duration: Femtosecond lasers typically produce more controlled ablation with less thermal effects compared to nanosecond lasers, potentially preserving more molecular structure information [22].
- Laser wavelength: UV lasers (e.g., 266 nm) are often more efficient at breaking molecular bonds directly, while IR lasers (e.g., 1064 nm) cause more thermal effects.
- Laser energy: Higher irradiance typically increases fragmentation, potentially reducing molecular band intensities while enhancing atomic lines. There is an optimal range for molecular detection that should be determined empirically [26].
Q: Can LIBS reliably distinguish between different organic compounds with similar elemental composition?
Yes, through careful analysis of molecular band features and their temporal evolution. Key strategies include:
- Vibrational distribution analysis: The relative intensities of different vibrational transitions within the CN band can serve as a fingerprint for different organic materials [26].
- Temporal profiling: Different compounds may show distinct temporal evolution of their C2/CN ratios [27].
- Multivariate analysis: Apply chemometric methods like principal component analysis (PCA) to spectral data containing both atomic and molecular features for improved discrimination [12].
Q: What are the most effective methods to enhance weak molecular band signals?
Several signal enhancement strategies can improve molecular band detection:
- Double-pulse LIBS: Using two sequential laser pulses can enhance signals by 10-100 times by creating a more favorable environment for the second plasma [12].
- Nanoparticle-Enhanced LIBS (NELIBS): Depositing nanoparticles (e.g., 20nm Au) on the sample surface can significantly improve plasma coupling and emission intensity [4] [22].
- Spatial confinement: Using physical cavities or magnetic fields to constrain the plasma can increase signal intensity and reduce self-absorption [28] [16].
- Atmosphere control: Performing analysis in controlled gases (e.g., argon instead of air) can sometimes enhance specific molecular transitions [27].
Experimental Protocols & Data Presentation
Standard Protocol for Time-Resolved CN/C2 Analysis
This protocol provides a methodology for obtaining reproducible molecular band spectra from organic materials.
Materials Needed:
- Pulsed laser system (Nd:YAG, typically 1064 nm or harmonics)
- Time-gated spectrometer with adequate resolution (<0.1 nm)
- Precision translation stage for sample movement
- Gas chamber with atmosphere control (optional but recommended)
Step-by-Step Procedure:
- Sample Preparation: For solid samples, ensure flat, homogeneous surfaces. For powders, press into pellets. Consider nanoparticle coating for NELIBS enhancement [4].
- Laser Alignment: Focus laser to achieve power density of 1-10 GW/cm² on sample surface. Verify focus with beam profiler if available.
- Atmosphere Control: For controlled studies, purge chamber with desired gas (N₂, Ar, or air) for 5-10 minutes before analysis.
- Temporal Optimization: Acquire spectra at delay times from 0.1-10 µs with 0.5-1 µs increments to identify optimal molecular emission window.
- Spectral Acquisition: Collect 10-50 spectra from different sample locations to account for heterogeneity.
- Data Processing: Normalize spectra, subtract background, and integrate molecular band areas for quantitative analysis.
Quantitative Comparison of Signal Enhancement Techniques
Table 1: Performance comparison of different LIBS enhancement methods for molecular detection
| Method | Signal Enhancement Factor | Effect on CN/C2 Bands | Implementation Complexity | Key Considerations |
|---|---|---|---|---|
| Double-Pulse LIBS [12] | 10-100x | Extends molecular emission lifetime | Medium | Optimal inter-pulse delay critical (typically 1-5 µs) |
| NELIBS [4] | 5-50x | Improves band resolution and intensity | Low-Medium | Nanoparticle size and distribution crucial |
| Spatial Confinement [28] | 3-10x | Reduces self-absorption in bands | Low | Cavity geometry affects enhancement |
| Atmosphere Control [27] | 2-5x | Alters CN/C2 ratio based on origin | Medium | Helps distinguish native vs. atmospheric species |
CN and C2 Molecular Band Spectral Features
Table 2: Characteristic spectral properties of CN and C2 molecular bands in LIBS
| Parameter | CN Violet System | C2 Swan System |
|---|---|---|
| Electronic Transition | B²Σ⁺ → X²Σ⁺ | d³Πg → a³Πu |
| Strongest Band Head | 388.3 nm (Δν=0) | 516.5 nm (Δν=0) |
| Typical Lifetime in Plasma | 2-8 µs | 1-6 µs |
| Formation Mechanisms | Direct fragmentation of C-N bonds; recombination of C with atmospheric N [26] [27] | Direct fragmentation of C-C bonds; recombination of carbon atoms [27] |
| Dependence on Molecular Structure | Strong - varies with native C-N content | Strong - varies with carbon structure and bonding |
Visualization: Experimental Workflows and Formation Pathways
CN and C2 Formation Pathways in Laser-Induced Plasma
Time-Resolved LIBS Experimental Workflow
The Scientist's Toolkit: Essential Research Reagents & Materials
Table 3: Key research reagents and materials for LIBS studies of molecular bands
| Item | Function/Application | Technical Specifications |
|---|---|---|
| Gold Nanoparticles [4] | Signal enhancement in NELIBS | 20nm spherical particles, optimized coating density |
| Reference Polymers [26] | Method validation and calibration | Nylon, Teflon, Polystyrene, Polypropylene, PVC |
| Spectroscopic Gases [27] | Atmosphere control for mechanism studies | High-purity N₂, Ar, O₂, or custom mixtures |
| Ceramic Constraints [28] | Plasma spatial confinement for self-absorption reduction | Hemispherical cavities with 1-3mm gaps |
| Standard Reference Materials | Quantitative calibration | NIST-traceable materials with certified CN/C content |
Elemental Imaging of Pathological Tissues with Femtosecond LIBS
Technical Support & Troubleshooting Hub
This guide provides targeted support for researchers using Femtosecond Laser-Induced Breakdown Spectroscopy (fs-LIBS) for elemental imaging of pathological tissues, within the broader context of optimizing laser parameters for plasma generation.
Frequently Asked Questions (FAQs)
Q1: Our spectra show unexpected silicon lines, overwhelming the signal from thin tissue sections. What is the cause and solution? This is typically caused by incomplete ablation or laser penetration through the sample, resulting in ablation of the substrate. The solution involves several optimization steps:
- Verify Sample Thickness and Laser Focus: For thin sections (e.g., 10 µm), ensure the laser focal plane is precisely on the tissue surface and that the ablation crater depth is less than the sample thickness. Femtosecond lasers offer high precision, with reported ablation depths of ~6 µm in liver tissue, which helps avoid substrate interaction [29] [30].
- Use High-Purity Substrates: Employ high-purity quartz glass substrates. While they have a silicon emission line, this signal is minimal and easily identified and removed from analysis if it dominates, indicating an issue with the measurement [29].
- Optimize Laser Fluence: Adjust the laser pulse energy to be well above the tissue ablation threshold but below the level that causes excessive penetration. A peak intensity of about
5×10^14 W/cm²has been successfully used for high spatial resolution with minimal substrate contribution [29].
Q2: Our classification models for healthy vs. cancerous tissue are inaccurate and not generalizing. What could be wrong? This common issue often stems from poor data quality or unintended experimental bias.
- Ensure Histological Validation: Use a standard protocol where serial tissue sections are analyzed. Adjacent slices should be stained (e.g., with H&E) to provide a definitive pathological reference for identifying the tissue type corresponding to each fs-LIBS spectrum [29].
- Check for Data Leakage: When training machine learning models, ensure that spectra from the same patient are not split across training and validation sets. Test your model's generalizability on tissue samples from entirely different patients [29].
- Confirm Signal Reprodubility: Poor plasma stability leads to inconsistent spectra. Using femtosecond lasers can improve reproducibility due to reduced laser-plasma interaction and thermal effects. Also, verify that your acquisition parameters (delay, gate time) are optimized to capture the elemental emission lines clearly [29] [30] [22].
Q3: We are experiencing low signal-to-noise ratio and high shot-to-shot spectral variation. How can we improve signal stability? Signal uncertainty is a central challenge in LIBS. For fs-LIBS on tissues, focus on:
- Temporal Gating: Use a delayed, gated detector (e.g., an ICCD camera). A typical setting is a 23 ns delay after the laser pulse and a 500 ns gate time to suppress the continuous broadband background and capture the sharper atomic emission lines [29].
- Spatial Resolution Control: The high spatial resolution of fs-lasers (e.g., 3.5 µm beam radius) reduces sampling heterogeneity. Ensure your spot-to-spot distance (e.g., 25 µm) is appropriate to avoid re-sampling ablated areas [29].
- Laser Parameter Stability: Ensure your laser system delivers consistent pulse energy. Fluctuations in energy directly translate to plasma variations [16] [22].
Troubleshooting Guide: Common Errors and Solutions
Table 1: Common Experimental Errors and Their Solutions in fs-LIBS of Pathological Tissues
| Error Symptom | Potential Cause | Recommended Solution |
|---|---|---|
| Weak or no plasma emission | Laser fluence below ablation threshold | Increase pulse energy; verify focus on sample surface. |
| Broad, featureless spectrum | Incorrect ICCD gate timing | Shorten gate width (<1 µs) and introduce a delay (tens of ns) to avoid continuum radiation [12] [30]. |
| Misidentification of elements | Uncalibrated spectrometer or spectral shift | Use a calibration lamp (e.g., Hg(Ar)) for wavelength calibration. Never identify an element based on a single emission line [29] [12]. |
| High carbon background from sample | Sample preparation residues (paraffin) | Follow standard deparaffinization protocols using xylene and alcohol to remove embedding materials [29]. |
| Inconsistent ablation craters | Unstable laser mode or energy | Check laser performance; use high-quality, stable laser systems. Femtosecond lasers provide more controlled ablation [30] [22]. |
| Matrix effects; quantification fails | Sample heterogeneity (inherent in tissues) | Apply machine learning models (Random Forests, ANNs) designed for complex, multivariate data instead of univariate calibration [29] [31]. |
Experimental Protocols & Workflows
This section provides detailed methodologies for key experiments cited in fs-LIBS research for tissue analysis.
Detailed Protocol: fs-LIBS Analysis of Fixed Tissue Sections
This protocol is adapted from a study demonstrating high-accuracy identification of tumor tissue in liver and breast samples [29].
1. Sample Preparation
- Tissue Processing: Use formalin-fixed and paraffin-embedded (FFPE) tissue samples. Prepare serial sections of 10 µm thickness using a microtome.
- Deparaffinization: Remove paraffin by sequentially dissolving it in xylene, alcohol, and water, following standard pathological protocols [29].
- Mounting: Mount the deparaffinized tissue slices on high-purity quartz glass microscopy slides to minimize spectral interference from the substrate.
- Histological Reference: Stain the outermost slices of the serial section stack with Hematoxylin and Eosin (H&E). These slides serve as the gold standard for pathological identification of healthy and cancerous regions, which are then mapped onto the adjacent unstained slices used for fs-LIBS.
2. Instrument Setup and Parameters
- Laser System: Use a femtosecond laser system (e.g., Ti:Sapphire, 30 fs pulse duration, 1 kHz repetition rate). The pulse energy should be tunable.
- Beam Delivery: Focus the laser beam using a microscope objective (e.g., 10X, NA 0.28) to a small spot size (e.g., 3.5 µm radius).
- Energy & Intensity: Set the pulse energy to
7 ± 0.5 µJ, yielding a peak intensity of ~5×10^14 W/cm². - Data Acquisition: Synchronize the system to operate in a single-shot regime. Use an ICCD spectrometer for detection. Key acquisition parameters include:
- Delay Time: 23 ns after the laser pulse.
- Gate Width: 500 ns.
- Spatial Mapping: Program an XYZ stage to ablate a grid pattern (e.g., 10x10 matrix) with a step size of 25 µm between points.
3. Data Analysis and Machine Learning
- Data Labeling: Label each recorded spectrum based on the tissue type (healthy/tumor) as determined from the H&E-stained reference slide.
- Pre-processing: Remove any spectra with strong silicon lines from the substrate, as this indicates incomplete ablation.
- Model Training: Train machine learning algorithms (e.g., Artificial Neural Networks, Random Forest) on the pre-processed and labeled spectral data.
- Validation: Validate the model's performance using cross-validation and, critically, by testing it on fs-LIBS data obtained from tissue samples of different patients.
Workflow Visualization
The following diagram illustrates the logical workflow for the fs-LIBS tissue analysis experiment, from sample preparation to diagnosis.
The Scientist's Toolkit: Essential Research Reagents & Materials
Table 2: Key Research Reagent Solutions for fs-LIBS of Pathological Tissues
| Item | Function / Role in Experiment | Critical Specifications / Notes |
|---|---|---|
| High-Purity Quartz Substrate | Provides a low-spectral-background support for thin tissue sections. | The substrate should have minimal elemental impurities to avoid spectral contamination. Silicon emission is acceptable and identifiable [29]. |
| Formalin (10% Neutral Buffered) | Standard tissue fixative. Preserves tissue architecture and prevents decay. | Essential for creating FFPE blocks, which are the standard in pathology. |
| Paraffin | Embedding medium for microtomy. Allows for precise cutting of thin sections. | Must be fully removed with xylene before analysis to avoid spectral interference [29]. |
| Hematoxylin & Eosin (H&E) | Histological stains. Provide the reference standard for identifying tissue types (healthy vs. cancerous). | Stained adjacent sections are crucial for accurate labeling of LIBS spectral data for machine learning [29]. |
| Xylene & Ethanol | Used for deparaffinization and dehydration of tissue sections post-microtomy. | Standard pathology protocol must be followed to ensure no residues affect the LIBS plasma [29]. |
| Calibration Lamp (Hg/Ar) | Wavelength calibration of the spectrometer. | Critical for correct identification of elemental emission lines and avoiding misidentification [29] [12]. |
Optimizing Laser Parameters for Plasma Generation
The core thesis of optimizing laser parameters is critical for generating a clean, analytically useful plasma. The choice of ultrashort pulses is a key differentiator.
The Role of Femtosecond Pulses
Femtosecond lasers offer significant advantages over nanosecond lasers for analyzing delicate biological tissues:
- Reduced Thermal Damage: The ultrashort pulse duration (e.g., 30 fs) deposits energy faster than the rate of energy transfer to the surrounding lattice, drastically minimizing the heat-affected zone (HAZ) [30] [22].
- Absence of Laser-Plasma Interaction: The plasma forms after the femtosecond pulse has ended. This avoids complex laser-plasma interactions (like plasma shielding) that occur with nanosecond pulses, leading to more reproducible ablation and spectra [29] [30].
- High Spatial Resolution: The minimal thermal diffusion and precise ablation allow for craters with diameters on the order of microns, enabling cellular-level spatial resolution in elemental imaging [29] [32].
Laser Parameter Optimization Logic
The following diagram outlines the decision-making process for optimizing key laser parameters to achieve specific plasma and analytical outcomes.
Table 3: Summary of Optimized fs-LIBS Parameters for Pathological Tissue Analysis
| Parameter | Typical Optimized Value | Impact on Plasma & Analysis |
|---|---|---|
| Pulse Duration | 30 - 150 fs | Drastically reduces thermal damage, improves ablation precision, and suppresses matrix effects [29] [30]. |
| Laser Wavelength | 785 nm, 343 nm, 266 nm | Shorter wavelengths (UV) can provide better absorption in biological tissue and smaller spot sizes [30] [32]. |
| Pulse Energy | ~7 µJ | Must be above ablation threshold but controlled to avoid penetrating thin samples. Balances signal strength and spatial resolution [29]. |
| Laser Fluence / Intensity | ~5 × 10^14 W/cm² | High intensity ensures efficient ablation and plasma formation. Critical for a strong analytical signal [29]. |
| Spatial Resolution | 3.5 µm - 40 µm | Dictated by laser spot size. Finer resolution enables cellular-level imaging but requires thinner samples and more measurement points [29] [32]. |
Frequently Asked Questions (FAQs)
Q1: What are the most significant challenges when applying LIBS to heterogeneous biological tissues like cancer samples?
The primary challenges stem from the biological matrix effect and signal reproducibility. Cancer tissues are inherently heterogeneous, containing varied cell types, structural components, and fluid content. This variation leads to inconsistent laser ablation, fluctuating plasma properties (temperature and electron density), and consequently, poor spectral reproducibility. Furthermore, the organic matrix of soft tissues interacts complexly with the laser-induced plasma, influencing the formation and extinction of chemical species and introducing significant spectral interferences. [33]
Q2: How can we enhance the weak and variable LIBS signals from thin or low-density tissue sections?
Several signal enhancement (SE) methodologies have been developed. A prominent approach is the use of external electric fields. Applying an electrostatic field to the laser-induced plasma can modify its properties, leading to increased electron density, temperature, and excitation states, which boosts spectral emission intensity. Another effective method is target pre-heating, which can improve ablation rates, reduce surface reflectivity, and enhance plasma emission intensity by up to 6000%. [34] These techniques are valued for their simplicity, cost-effectiveness, and significant impact on LIBS performance.
Q3: Our LIBS data for cancer classification is complex and high-dimensional. What analytical approaches are recommended?
Leveraging Artificial Intelligence (AI) and Machine Learning (ML) models is now standard for analyzing LIBS data from biological samples. These models can effectively handle the high-dimensional spectral data to differentiate between malignant and normal tissues and even classify cancer stages and types based on elemental or spectral fingerprints. For enhanced performance, especially with multi-institutional data, Federated Learning frameworks allow collaborative model training without sharing raw patient data, ensuring privacy. Combining these with Explainable AI (XAI) tools like SHAP provides insights into the model's predictions, helping researchers understand which spectral features contribute most to classification. [33] [35]
Q4: How do we ensure our LIBS plasma conditions are optimal for quantitative analysis of biological samples?
Ensuring the plasma is in Local Thermodynamic Equilibrium (LTE) is a fundamental prerequisite for quantitative analysis. This requires careful plasma characterization by diagnosing its temperature and electron density. The McWhirter criterion is a common starting point, but it is not the only condition for LTE. [36] [37] Furthermore, using time-resolved spectroscopy or advanced methods that can infer temporal evolution from time-integrated spectra (like the Bredice 3D-Boltzmann plot technique) allows you to gate your detection when the plasma is in a state suitable for analysis, minimizing continuum background and improving signal-to-noise ratio. [37]
Troubleshooting Guides
Issue: Poor Spectral Reproducibility Across Tissue Samples
| Symptom | Possible Cause | Solution |
|---|---|---|
| High variance in spectral line intensities from the same tissue type. | Biological matrix effects from heterogeneous tissue composition (e.g., varying fat, water, and mineral content). | - Implement robust sample preparation protocols like mechanical homogenization and pelletization. [36] - Apply advanced background correction algorithms to mitigate spectral interferences. [36] |
| Inconsistent plasma formation and ablation craters. | Varied laser-matter interaction due to differences in tissue density and optical properties. | - Optimize laser parameters (wavelength, pulse duration, energy) for soft tissue. Consider ultra-short (fs) laser pulses to reduce the heat-affected zone and improve ablation efficiency. [33] - Use an internal standard element, if possible, to normalize signal fluctuations. [38] |
Issue: Low Sensitivity for Trace Element Detection
| Symptom | Possible Cause | Solution |
|---|---|---|
| Inability to detect trace metals relevant to cancer metabolism at low concentrations. | Inefficient ablation and weak plasma emission from the biological matrix. | - Employ signal enhancement techniques such as double-pulse LIBS, magnetic confinement, or the use of nanoparticles. [39] - Integrate LIBS with a more sensitive technique like Laser Ablation Inductively Coupled Plasma Mass Spectrometry (LA-ICP-MS) for complementary, highly sensitive trace element analysis. [38] |
| High background continuum obscuring characteristic emission lines. | Suboptimal detection timing (gate delay and width). | - Perform a temporal evolution study of the plasma. Use a time-gated detector to apply a delay, allowing the intense background continuum to decay before collecting the atomic/ionic emission. [39] |
Issue: Difficulty in Classifying Cancer Stages or Types
| Symptom | Possible Cause | Solution |
|---|---|---|
| ML models fail to generalize or show low accuracy in distinguishing tissue types. | High-dimensional spectral data with redundant information and low signal-to-noise ratio. | - Apply feature selection and dimensionality reduction techniques like Principal Component Analysis (PCA) to identify key discriminating spectral features. [38] - Utilize deep learning models (e.g., Convolutional Neural Networks) that can directly process raw or preprocessed spectra and are robust to spectral variations, such as those induced by different experimental setups. [7] |
Experimental Protocols & Data Presentation
Detailed Methodology: LIBS Analysis of Pellets from Powdered Tissues
This protocol, adapted from work on cocoa powder, is highly relevant for preparing homogeneous tissue samples. [36]
- Sample Homogenization: Mechanically homogenize the freeze-dried and powdered tissue sample (e.g., 1.7500 g) to ensure a uniform matrix.
- Doping (Optional): For calibration, create a base mixture by homogenizing the tissue powder with a known amount of a standard salt (e.g., dehydrated cadmium nitrate). Serial dilution with additional tissue powder can create a range of concentrations.
- Pelletization: Compress the homogenized powder (e.g., 1 g) into a sturdy pellet using a hydraulic press and a stainless-steel die (e.g., 15.5 mm diameter). Sand the pellet to a uniform height (e.g., 2.90 mm).
- LIBS Analysis:
- Laser Parameters: Nd:YAG laser (1064 nm, 8 ns, 75 mJ/pulse).
- Optics: Focus the beam onto the pellet surface with a convex lens (e.g., 50 mm focal length).
- Detection: Use a spectrometer with a gate delay of 3 µs and a gate width of 10 µs.
- Ablation: Irradiate multiple spots on the pellet (e.g., 10 shots per spot) to account for micro-heterogeneity.
Quantitative Data: Representative Plasma Parameters
The following table summarizes typical plasma parameters achievable under optimized LIBS conditions, which are crucial for ensuring data quality. [40]
Table 1: Measured LIBS Plasma Parameters for a Zinc Target
| Laser Pulse Energy (mJ) | Electron Temperature (eV) | Electron Density (x10¹⁷ cm⁻³) | Plasma Frequency (Hz) | Debye Length (m) |
|---|---|---|---|---|
| 300 | 0.613 | 7.273 | 7.659 | 9.20x10⁻¹¹ |
| 500 | 0.661 | 8.182 | 8.125 | 8.75x10⁻¹¹ |
| 700 | 0.693 | 9.091 | 8.571 | 8.25x10⁻¹¹ |
Workflow Visualization: LIBS-Based Cancer Diagnostic Pathway
The Scientist's Toolkit: Research Reagent Solutions
Table 2: Essential Materials for LIBS-based Cancer Tissue Analysis
| Item | Function/Benefit | Application Context |
|---|---|---|
| Certified Reference Materials (CRMs) | Matrix-matched standards for calibration and validation of quantitative results. | Essential for setting up calibration curves (CC-LIBS) and verifying analytical accuracy. [7] [38] |
| Hydraulic Press & Pellet Die | Creates uniform, solid pellets from powdered tissues, improving ablation stability and signal reproducibility. | Standard sample preparation for solid analysis, as used in geochemical and food matrix studies. [36] [7] |
| Nd:YAG Laser (ns & fs pulsed) | The primary ablation source. fs pulses reduce heat-affected zone, offering better spatial resolution for micro-analysis. | ns lasers are workhorses; fs lasers are for high-resolution cellular-level profiling. [33] |
| Time-Gated Spectrometer (ICCD) | Allows precise control over when signal is collected, enabling temporal resolution of plasma emission to improve SNR. | Critical for discriminating early plasma continuum from later atomic line emission. [39] |
| Electric Field Electrodes | Simple external hardware to apply an electrostatic field, enhancing plasma emission and signal intensity. | Used in Electric Field-Assisted LIBS (EF-LIBS) for signal enhancement. [41] [34] |
Precision Analysis of Calcified Tissues and Bone Composition
Troubleshooting Guide: LIBS Analysis of Calcified Tissues
FAQ 1: Why is my LIBS signal from bone and tooth samples inconsistent? Inconsistent signals in calcified tissue analysis often stem from matrix effects and sample heterogeneity. Biological tissues like bones and teeth have complex structures where the physical and chemical properties of the sample itself influence the plasma formation and emission intensity, independent of the elemental concentration [30]. To address this:
- Standardize Sample Preparation: Use a consistent method for sample handling. For quantitative calibration, research has successfully used pressed pellets with a calcified tissue-equivalent material (a CaCO₃ matrix) to mimic the physical properties of hydroxyapatite [42].
- Employ Signal Enhancement Techniques: Methodologies such as double-pulse LIBS or spatial confinement can significantly improve the signal-to-noise ratio and plasma stability [43].
- Leverage Advanced Data Processing: Utilize artificial intelligence (AI) and machine learning models to classify spectra and compensate for matrix-related variations and signal fluctuations [30].
FAQ 2: How can I achieve better spatial resolution for mapping element distribution? Spatial resolution is critical for mapping trace elements across growth rings in bones or between enamel and dentin in teeth.
- Optimize Laser Focusing: The laser should be tightly focused on the sample surface. The quality of the laser beam directly defines the minimum achievable spot size and, therefore, the pixel size of your elemental map [44].
- Consider Ultrafast Lasers: Femtosecond (fs) laser pulses offer higher ablation efficiency and lower ablation thresholds than nanosecond (ns) pulses. This reduces the heat-affected zone and allows for more precise ablation, enabling in-depth multi-elemental profiling at a cellular spatial resolution [30].
- Use High-Repetition Rate Lasers: For high-resolution µ-LIBS imaging over large areas, lasers with multi-kHz repetition rates can drastically reduce acquisition time, making it feasible to collect the millions of spectra needed for detailed maps [44].
FAQ 3: What are the best practices for quantitative analysis of trace elements like strontium or lead? Accurate quantification in a complex matrix like hydroxyapatite requires a robust calibration strategy.
- Use Matrix-Matched Standards: Prepare calibration curves using synthetic reference pellets whose physical properties (e.g., density, hardness) closely resemble hydroxyapatite. Studies have shown success with a CaCO₃ matrix doped with known concentrations of the target elements (e.g., Al, Sr, Pb in the range of 100–10,000 ppm relative to calcium) [42].
- Cross-Validate with Another Technique: Validate your LIBS quantification results against a established method like Atomic Absorption Spectroscopy (AAS) to ensure accuracy [42].
- Apply Calibration-Free LIBS (CF-LIBS): In cases where standard references are unavailable, the CF-LIBS approach can be employed to determine elemental concentration without the need for a calibration curve, though it requires the plasma to satisfy the Local Thermodynamic Equilibrium (LTE) condition [30].
Experimental Protocols & Data
Protocol: Quantitative Mapping of Trace Elements in Teeth
This protocol is adapted from research on quantifying metal accumulation in teeth [42].
- Sample Preparation: Section the tooth to expose a clean cross-section of interest (e.g., from enamel to pulp). Embed and polish the surface to optical flatness to ensure consistent laser ablation.
- Calibration Pellet Preparation: Create pressed pellets from a CaCO₃ base, doped with a series of known concentrations of the target trace elements (e.g., Sr, Pb).
- LIBS Analysis:
- Laser Parameters: Use an Nd:YAG laser at 1064 nm, 10 Hz repetition rate, with pulse energy around 100 mJ [42].
- Data Acquisition: Raster the laser beam across the sample surface in a predefined grid. Collect a spectrum at each point.
- Spectral Lines: Monitor specific atomic emission lines for quantitative analysis, such as the Sr I 460.73 nm line [42].
- Data Processing:
- Generate calibration curves from the reference pellets.
- Apply the calibration to the spectra collected from the tooth sample.
- Reconstruct one- or two-dimensional concentration profiles and maps for the target elements.
Laser Parameters for Calcified Tissue Analysis
The table below summarizes key laser parameters and their influence on the analysis of calcified tissues.
| Laser Parameter | Consideration for Calcified Tissues | Typical Range / Example |
|---|---|---|
| Wavelength | Affects absorption by the hydroxyapatite matrix. Fundamental IR wavelengths (1064 nm) are commonly used. | 1064 nm (Nd:YAG) [42] |
| Pulse Duration | Shorter pulses (fs) reduce thermal damage and improve spatial resolution. | Nanosecond (ns) to Femtosecond (fs) [30] |
| Pulse Energy | Must be sufficient to ablate the hard tissue. Energy density (fluence) is a critical parameter. | ~100 mJ/pulse (for ns-LIBS on teeth) [42] |
| Repetition Rate | Determines data acquisition speed. High rates (>7 kHz) enable fast, high-resolution imaging. | 10 Hz (standard); >7 kHz (for imaging) [44] |
| Spot Size | Directly determines the spatial resolution of the analysis. | ~50-100 µm (handheld); can be reduced to ~10 µm for imaging [45] [44] |
Analytical Performance for Trace Elements
The following table presents quantitative data for trace element analysis in calcified tissues using LIBS, based on calibration with synthetic pellets [42].
| Element | Analytical Spectral Line | Concentration Range in Pellets | Detection Limit in Tissue | Notes / Application |
|---|---|---|---|---|
| Strontium (Sr) | Sr I 460.73 nm | 100 - 10,000 ppm (rel. to Ca) | A few ppm | Linked to environmental exposure and diet. |
| Lead (Pb) | Not specified | 100 - 10,000 ppm (rel. to Ca) | A few ppm | Accumulation of toxic lead. |
| Aluminum (Al) | Not specified | 100 - 10,000 ppm (rel. to Ca) | A few ppm | Potential negative effects on organs. |
The Scientist's Toolkit: Research Reagent Solutions
| Item / Reagent | Function in LIBS Experiment |
|---|---|
| Calcified Tissue-Equivalent Pellets (CaCO₃ matrix) | Serves as a quantitative calibration standard, mimicking the physical properties of hydroxyapatite for accurate trace element analysis [42]. |
| High-Purity Doping Compounds (e.g., SrCl₂, Pb salts) | Used to spike the calibration pellets with known concentrations of specific trace elements for building calibration curves [42]. |
| Polishing Suspensions (e.g., Alumina, Diamond) | For preparing flat, smooth surfaces on hard tissue samples (teeth, bone), which is crucial for consistent laser ablation and reproducible signals. |
| Embedding Resin (e.g., Epoxy) | Used to support fragile or irregularly shaped calcified tissue samples during sectioning and polishing. |
| Ultrafast Laser System (fs-laser) | Provides high spatial resolution and reduced thermal damage for precise elemental mapping and analysis of pathological tissues [30]. |
Workflow Diagram: LIBS Analysis of Calcified Tissues
The diagram below illustrates the core workflow for LIBS analysis, from sample preparation to data interpretation, highlighting key steps for optimizing plasma generation.
LIBS Analysis Workflow for Calcified Tissues
Key Technical Takeaways
- Matrix Effects are a Primary Challenge: The heterogeneous nature of calcified tissues significantly influences LIBS signals. Using matrix-matched standards like CaCO₃ pellets is crucial for reliable quantification [30] [42].
- Laser Choice Dictates Capability: The selection between ns- and fs-lasers represents a trade-off between practicality and precision. Fs-lasers offer superior spatial resolution for cellular-level mapping, which is valuable for pathological studies [30].
- Signal Enhancement is Available: Techniques like spatial confinement and double-pulse LIBS can be integrated into experiments to improve signal quality and stability, directly aiding in plasma optimization [43].
- Data Analysis is Key: Modern LIBS relies heavily on advanced data processing, including AI and machine learning models, to extract meaningful biological and medical insights from complex spectral data [30].
Real-Time Feedback Systems for Surgical and Diagnostic Procedures
Technical Support Center: Troubleshooting LIBS Plasma Generation
This technical support center provides solutions for common challenges in Laser-Induced Breakdown Spectroscopy (LIBS) experiments, specifically within the context of optimizing laser parameters for enhanced plasma generation.
Frequently Asked Questions (FAQs)
Q1: My LIBS spectral signals are weak and inconsistent. Which key parameters should I optimize first? The core parameters to optimize are delay time, laser energy, and gate width [46]. For a river sediment sample, using a 1064 nm laser, the optimal ranges were found to be 1.0-1.5 μs for delay time and 4.0-6.0 μs for gate width [46]. Laser energy had a smaller effect, so using the lowest feasible energy within your system is recommended to start [46].
Q2: How does ambient pressure affect my LIBS plasma, and what are the optimal conditions for analyzing fusion wall materials like tungsten? Ambient gas pressure significantly influences plasma plume expansion, confinement, and spectral emission intensity [47]. For diagnosing tungsten impurities in a tokamak-like environment, the optimal pressure range is 10–100 Pa, combined with a delay time of 200–500 ns [47]. At pressures below ~1 Pa, the ambient pressure's influence becomes negligible [47].
Q3: What is Double-Pulse LIBS (DP-LIBS) and how can it enhance my signal? DP-LIBS uses a second laser pulse to re-heat and re-excite the plasma, leading to significant increases in plasma temperature, electron density, and spectral emission intensity [48] [49]. Configurations include collinear, orthogonal preheating, and orthogonal reheating [49]. The inter-pulse delay is a critical parameter; for boron plasma in an annular-point configuration, a delay of 20 ns resulted in electron temperatures 1.7–2.2 times higher than a single pulse [48].
Q4: My machine learning model for LIBS classification performs poorly on data collected at different distances. How can I improve its robustness? Spectral profiles can vary considerably with changes in detection distance [7]. Instead of applying distance correction, you can train your model directly on multi-distance spectral data. Using a deep Convolutional Neural Network (CNN) trained on a dataset spanning eight distances (from 2.0 m to 5.0 m) achieved a classification accuracy of over 92% without any pre-correction of the distance effect [7].
Troubleshooting Guides
Issue: Low Signal-to-Noise Ratio (SNR) in Spectra A low SNR obscures characteristic spectral lines, hindering both qualitative and quantitative analysis.
- Potential Cause 1: Suboptimal temporal parameters.
- Potential Cause 2: Inefficient plasma generation or short lifetime.
Issue: Poor Performance of Quantitative or Classification Models The model performs well on training data but fails on new spectral data.
- Potential Cause 1: Matrix effects and unaccounted-for experimental variability (e.g., distance).
- Solution: Incorporate variability into your training set. Collect LIBS spectra under all expected conditions (e.g., multiple distances) and use them to train a robust model like a CNN [7].
- Potential Cause 2: High prediction error in quantitative analysis.
- Solution: Implement a residual compensation algorithm. This technique incorporates environmental and sample parameters into the model, which can reduce the mean absolute error of prediction (MAEP) by over 43% compared to standard models like Support Vector Regression (SVR) or Partial Least Squares Regression (PLSR) [50].
Experimental Protocols for Key Investigations
Protocol 1: Optimizing LIBS Parameters using Design of Experiments (DOE)
This methodology efficiently finds the optimal combination of parameters that affect the LIBS signal, avoiding the need to test every possible combination [46].
- Define Factors and Responses: Identify key parameters (e.g., Laser Energy, Delay Time, Gate Width) as factors. Define your response variable (e.g., Signal-to-Noise ratio of a specific elemental line) [46].
- Screening with Fractional Factorial Design: If many factors exist, first use a fractional factorial design to identify which factors have the most significant effects [46].
- Optimization with Central Composite Design (CCD): For the critical factors, apply a CCD. This design fits a second-order model, allowing you to find the parameter set that maximizes or minimizes your response [46].
- Model Fitting and Validation: Use statistical software to fit a model to your data and validate the predicted optimum with a confirmation experiment [46].
Protocol 2: Implementing a Double-Pulse LIBS Configuration
This protocol outlines steps to set up a DP-LIBS system for signal enhancement [48] [49].
- Laser Selection: Use two nanosecond pulsed lasers (e.g., Nd:YAG, 1064 nm). While one laser can be split, two independent lasers offer greater flexibility [49].
- Choose Configuration: Select a geometry based on your goal.
- Synchronize Pulses: Use a digital delay generator to control the inter-pulse delay time with nanosecond precision. For annular-point boron plasma, a 20 ns delay was optimal [48].
- Data Acquisition: Set your spectrometer's gate delay relative to the second laser pulse. Acquire spectra while systematically varying the inter-pulse delay to find the optimum for your sample.
Data Presentation
Table 1: Optimal Single-Pulse LIBS Parameters for River Sediment Analysis [46]
| Parameter | Studied Range | Optimal Value (1064 nm laser) | Influence on S/N Ratio |
|---|---|---|---|
| Laser Energy | 30 - 90 mJ | Lowest value in range | Very small / Negligible |
| Delay Time | 0.5 - 2.5 μs | 1.0 - 1.5 μs | High (for most elements) |
| Gate Width | 1.0 - 6.0 μs | 4.0 - 6.0 μs | High |
| Accumulated Pulses | 10 - 100 | Maximum value in range | Positive |
Table 2: Signal Enhancement from Double-Pulse LIBS Configurations
| Configuration | Target Material | Key Finding | Performance Improvement |
|---|---|---|---|
| Annular-Point DP [48] | Boron | 20 ns inter-pulse delay is optimal. | Electron temperature 1.7-2.2x higher than Single-Pulse LIBS. |
| Orthogonal Reheating [49] | Iron | Use of different wavelength combinations (e.g., 532 nm & 1064 nm). | Maximum signal enhancement factor of 30. |
| Long-Short DP [49] | Steel (Mn) | Uses a μs-width laser as the second pulse. | R² of calibration curve improved from 0.810 (SP) to 0.988 (DP). |
The Scientist's Toolkit: Essential Research Reagents & Materials
Table 3: Key Materials for LIBS Experiments in Fusion Research
| Item | Function | Example Application |
|---|---|---|
| Certified Reference Materials (GBW series) | Provide a standardized matrix with known elemental concentrations for calibration and validation of LIBS models [7]. | Used as pressed pellets to classify geochemical samples (e.g., Carbonate Mineral, Clay) [7]. |
| Boron Planar Target | Acts as a low-Z coating on plasma-facing components in fusion devices; a key sample for analyzing co-deposition layers [48]. | Simulating and analyzing boron films in tokamak wall diagnostics [48]. |
| Tungsten Target | Serves as a high-Z plasma-facing component material in tokamaks; its analysis is crucial for monitoring impurity influx [47]. | Diagnosing tungsten erosion and redeposition in fusion devices [47]. |
| Inert Gases (Argon, Helium) | Control the atmospheric environment around the plasma, which can confine the plume and enhance spectral intensity [49]. | Signal intensity of Al I increased by 6 times in an Ar environment at 0.5 MPa [49]. |
Workflow and System Diagrams
LIBS Signal Optimization Workflow
Troubleshooting ML Models for LIBS
Troubleshooting Plasma Generation and Optimizing Laser Settings
Mitigating Signal Fluctuations and Ensuring Reproducibility
This technical support guide addresses common challenges in Laser-Induced Breakdown Spectroscopy (LIBS) research, providing targeted troubleshooting advice to help you achieve stable plasma generation and reliable, reproducible results.
Troubleshooting Guides & FAQs
Why are my LIBS spectral signals so unstable from pulse to pulse?
Poor spectral signal stability is primarily caused by spatiotemporal inhomogeneity of the plasma between pulses. Spatial fluctuation of the plasma is a direct cause of this instability [51].
Solution: Implement a multi-directional plasma emission collection method. This technique suppresses differences caused by plasma spatial fluctuation by increasing the acquisition range and size [51].
Experimental Protocol: Multi-Directional Collection Setup
- Configure multiple collection fibers around the plasma plume. Research setups have used combinations including single coaxial, single lateral, four lateral, and coaxial-lateral combined arrangements [51].
- Collect plasma emission spectra from standard samples using these different collection schemes.
- Compare the spectral intensity and relative standard deviation (RSD) across schemes.
- Expected Outcome: One study reported that the mean RSD for multiple-directional collection (1.95%) was significantly lower than single lateral (4.31%) or single coaxial (4.16%) methods [51].
How can I improve the long-term reproducibility of my quantitative LIBS models over days or weeks?
Long-term reproducibility is affected by instrument drift, laser energy fluctuations, and changes in experimental environment over time, which cause established calibration models to become unreliable [52] [53].
Solution: Employ a Multi-Period Data Fusion Calibration method using machine learning [52] [54].
Experimental Protocol: Multi-Period Model Building
- Data Collection: Collect LIBS spectra from your set of standard samples once per day over an extended period (e.g., 10-20 days) [52] [54].
- Model Training: Fuse the spectral data from the first 10 days to create a robust training set. Do not rely on data from a single day.
- Algorithm Selection: Establish a calibration model using a Genetic Algorithm-based Back-Propagation Artificial Neural Network (GA-BP-ANN). This incorporates time-varying factors into the model [52] [54].
- Validation: Use data collected from subsequent days (e.g., days 11-20) as a test set to validate the model's long-term performance [52].
What is a quick computational method to correct for instrument drift in existing data?
Instrument drift introduces systematic error into quantitative predictions over time.
Solution: Apply the Kalman filtering algorithm to correct predictions from an existing calibration model [53].
Experimental Protocol: Kalman Filter Correction
- Establish an internal calibration curve for your elements of interest using standard samples.
- Use this model to predict element concentrations in test samples over multiple days.
- Apply a Kalman filter to the sequence of predicted concentrations. This algorithm recursively estimates and corrects for the drift-induced error.
- Expected Outcome: This method has shown to reduce the RSD of predicted contents for elements like Mn, Si, and Cr from over 35-63% down to 11-21% over a 10-day period [53].
How can I use plasma properties themselves to correct for spectral fluctuations?
Fluctuations in plasma morphology and intensity directly cause spectral instability.
Solution: Integrate a Dynamic Vision Sensor (DVS) to capture key plasma parameters for real-time correction [15].
Experimental Protocol: DVS-Assisted LIBS
- Integrate a DVS into your LIBS system to capture plasma optical signals with high temporal resolution.
- Optimize DVS parameters (aperture, collection distance, angle) for clear plasma imaging.
- Extract features from the DVS data, such as plasma area and the number of "On" events generated by increased light intensity.
- Establish a spectral correction model (DVS-SC) that uses these extracted features to correct the spectral signal intensity [15].
- Expected Outcome: This approach has been shown to significantly improve the R² of calibration curves for various elements and reduce their average RSDs [15].
The table below summarizes the performance improvements achieved by the methods discussed.
Table 1: Efficacy of Different Signal Stabilization Methods in LIBS
| Method | Key Performance Metric | Before Improvement | After Improvement |
|---|---|---|---|
| Multi-Directional Collection [51] | Mean Relative Standard Deviation (RSD) | 4.16% - 4.31% (single direction) | 1.95% |
| Kalman Filtering [53] | RSD of Predicted Content (e.g., Mn, Si, Cr) | 35% - 63% | 11% - 21% |
| Dynamic Vision Sensor (DVS) Correction [15] | Calibration Curve R² (e.g., Cu I 327.396 nm) | R² = 0.586 | R² = 0.944 |
| Multi-Period Data Fusion [52] | Average Relative Error (ARE) & Standard Deviation (ASD) | Higher (IS-1 model) | Lowest (GA-BP-ANN model) |
Experimental Workflow for Signal Optimization
The following diagram illustrates a logical workflow for diagnosing and mitigating LIBS signal fluctuations, integrating the methods described in this guide.
The Scientist's Toolkit: Key Research Reagent Solutions
Table 2: Essential Materials and Methods for LIBS Reproducibility Research
| Item / Method | Function in Research | Specific Application Example |
|---|---|---|
| Multi-Fiber Optical Setup | Enables simultaneous collection of plasma light from multiple angles to average out spatial inhomogeneity. | Used to implement the multi-directional collection scheme, combining coaxial and lateral views [51]. |
| Certified Reference Materials (CRMs) | Provides a reliable ground truth for building and validating quantitative calibration models over time. | Used as standard samples (e.g., GBW series, alloy steel, brass) for daily data collection in multi-period studies [52] [7] [55]. |
| Genetic Algorithm BP-ANN | A machine learning algorithm that fuses multi-day data to build robust models that account for time-varying factors. | Creates a calibration model resistant to long-term drift [52] [54]. |
| Dynamic Vision Sensor (DVS) | A vision sensor with high dynamic range and temporal resolution to capture fast plasma evolution for correction. | Extracts plasma area and "On" events to correct spectral intensity fluctuations [15]. |
| Kalman Filter Algorithm | A computational algorithm that optimally estimates and corrects for systematic drift in a time series of data. | Corrects predictions from a calibration model that has degraded over time [53]. |
Optimizing Pulse Energy and Wavelength for Specific Molecular Bonds
Frequently Asked Questions (FAQs)
FAQ 1: How do I select the optimal laser wavelength for breaking specific bonds in polymers? The optimal wavelength depends on the bond type and the desired fragmentation pathway. Research on high-density polyethylene (HDPE) shows that the fourth harmonic (266 nm, UV) is most effective for directly breaking C–H bonds, evident from a prominent Hα peak at 656.3 nm. Ultraviolet photons possess higher individual energy, which is crucial for surpassing the dissociation energy of strong bonds (e.g., 4.2 eV for C–H) [56]. Furthermore, for analyzing plastics via Laser-Induced Breakdown Spectroscopy (LIBS), using a 532 nm laser can enhance the emission intensity of diatomic molecules like CN and C₂, providing a robust basis for organic material analysis and classification [57].
FAQ 2: What pulse energy should I use to break bonds without excessive sample ablation? The required pulse energy is material-specific, but studies provide concrete thresholds. For HDPE, effective bond breaking was observed with pulse energies between 3–10 mJ for the 266 nm laser and 5–40 mJ for 1064 nm and 532 nm lasers [56]. It is critical to find a balance; excessive energy leads to wide craters and non-selective ablation, while insufficient energy will not surpass the bond dissociation threshold. Start at the lower end of these ranges and incrementally increase energy while monitoring the target emission line (e.g., Hα for C–H breakage) to optimize for your specific sample [56].
FAQ 3: Why does my LIBS spectrum show inconsistent molecular emission lines? Poor signal stability is a common challenge in LIBS. This can be caused by fluctuations in plasma properties. A proven correction method involves using a Dynamic Vision Sensor (DVS) to capture plasma parameters like plasma area and optical intensity changes. By integrating these parameters into a spectral correction model, the stability and quality of calibration curves can be significantly improved, with R² values increasing by over 60% for some elements [15]. Ensuring consistent laser parameters and a stable experimental environment is also crucial.
FAQ 4: Can ultrashort laser pulses control complex fragmentation into multiple moieties? Yes, laser pulse duration is a critical parameter for controlling fragmentation pathways. Experiments on ethylene (C₂H₄) demonstrate that the pulse duration can determine whether the molecule breaks into two or three fragments. Shorter pulses (<5 fs) favor concerted three-body fragmentation, while longer pulses (>12 fs), on the order of molecular vibration periods, increase the probability of two-body fragmentation by almost an order of magnitude. This is due to the interplay between the fast dynamics of electron removal and slower nuclear motion [58].
FAQ 5: Are there methods to reduce the laser energy required for photodissociation? Emerging research on coupling molecules to an infrared nanocavity shows promise for dramatically reducing dissociation energy. For a CS₂ molecule strongly coupled to a cavity, driving the cavity field directly instead of the molecular vibration led to dissociation with two orders of magnitude less laser energy. This enhancement is a quantum effect arising from the modified ladder-climbing dynamics on hybrid light-matter potential energy surfaces [59].
Troubleshooting Guides
Problem: Inefficient Bond Breaking in Polymers
- Symptoms: Weak or absent emission lines from target bond fragmentation (e.g., Hα at 656.3 nm for C–H); minimal sample modification.
- Potential Causes and Solutions:
- Insufficient Photon Energy: The laser wavelength may not provide enough energy per photon to break the target bond.
- Solution: Switch to a shorter wavelength (higher photon energy). For breaking C–H bonds in HDPE, 266 nm UV light has proven most effective [56].
- Pulse Energy Below Threshold: The laser fluence is too low.
- Solution: Systematically increase the pulse energy. Refer to established thresholds (e.g., 3-10 mJ for 266 nm on HDPE) and monitor the characteristic emission line intensity [56].
- Suboptimal Plasma Conditions: The laser parameters do not generate a plasma with sufficient temperature and lifetime.
- Solution: Optimize parameters like laser energy and delay time for LIBS detection. For example, a delay time of 1.5 μs and laser energy of 95 mJ were found optimal for stable copper alloy spectra [15].
- Insufficient Photon Energy: The laser wavelength may not provide enough energy per photon to break the target bond.
Problem: Poor Reproducibility and Stability in LIBS Signals
- Symptoms: High variance in spectral line intensities between laser shots; poor performance of quantitative calibration models.
- Potential Causes and Solutions:
- Uncorrected Plasma Fluctuations: Natural variations in the laser-induced plasma are directly affecting the emission signal.
- Solution: Implement a Dynamic Vision Sensor (DVS) for real-time plasma monitoring. Use extracted parameters like plasma area and "On" events to build a correction model, which can drastically improve the Relative Standard Deviation (RSD) [15].
- Varying Detection Distance: In stand-off LIBS, changes in distance alter the laser spot size and collection efficiency.
- Solution: Use a chemometric model trained explicitly on multi-distance data. A deep Convolutional Neural Network (CNN) can directly process spectra from varying distances, achieving high classification accuracy (>90%) without traditional distance correction [7].
- Inconsistent Laser-Matter Interaction:
- Solution: Consider using femtosecond lasers. Due to their shorter pulse duration, they interact with matter before significant plasma expansion, leading to excellent signal reproducibility and reduced thermal effects, albeit sometimes with lower classification accuracy than nanosecond lasers for some tasks [57].
- Uncorrected Plasma Fluctuations: Natural variations in the laser-induced plasma are directly affecting the emission signal.
Problem: Inability to Control Fragmentation Pathways
- Symptoms: Inability to steer a molecular reaction towards a specific fragmentation channel (e.g., two-body vs. three-body breakup).
- Potential Causes and Solutions:
- Pulse Duration Mismatch: The laser pulse duration may not be synchronized with the nuclear dynamics of the target fragmentation pathway.
- Solution: Tune the laser pulse duration. For controlling the branching ratio of ethylene trication fragmentation, increasing the pulse duration from 4.5 fs to 12 fs significantly increased the yield of two-body fragmentation channels [58].
- Lack of Strong Coupling to Vacuum Field: In free space, overcoming vibrational anharmonicity for dissociation requires high intensities.
- Solution (Advanced): Place the molecule inside an infrared nanocavity resonant with the vibrational frequency. This can strongly modify the potential energy landscape, allowing for control over bond breaking with vastly reduced laser intensities by driving the cavity mode directly [59].
- Pulse Duration Mismatch: The laser pulse duration may not be synchronized with the nuclear dynamics of the target fragmentation pathway.
Data Presentation
Table 1: Optimized Laser Parameters for Bond Breaking and Analysis in Selected Materials
| Material / Target | Optimal Wavelength | Pulse Duration | Pulse Energy / Fluence | Key Outcome / Emission | Citation |
|---|---|---|---|---|---|
| HDPE (C–H Bond) | 266 nm (4th Harmonic) | Nanosecond | 3-10 mJ | Prominent Hα peak at 656.3 nm; most effective for direct bond breaking. | [56] |
| Plastics (CN/C₂ Bands) | 532 nm | Nanosecond | Not Specified | Boosted CN & C₂ emission; achieved 96.35% classification accuracy with SVM. | [57] |
| Copper Alloys (LIBS) | 1064 nm | Nanosecond | 95 mJ | High-quality spectral signals when used with 1.5 μs delay time. | [15] |
| Ethylene (Fragmentation Control) | ~800 nm (Ti:Sapphire) | 4.5 fs vs 12+ fs | Intensity: ~8x10¹⁴ W/cm² | Shorter pulses favor 3-body; longer pulses increase 2-body fragmentation yield. | [58] |
| CS₂ (Cavity-Enhanced Dissociation) | Infrared (resonant) | Not Specified | Reduced by 2 orders of magnitude | Direct cavity driving requires far less energy than molecular driving for dissociation. | [59] |
Table 2: Essential Research Reagent Solutions and Materials
| Item | Function / Application | Example / Specification |
|---|---|---|
| High-Purity Polymer Samples | Used as model systems for studying laser-polymer interactions and bond-breaking mechanisms. | High-Density Polyethylene (HDPE) [56]. |
| Certified Reference Materials | Essential for calibrating LIBS systems and developing quantitative analytical models. | Chinese national reference materials (GBW series) in pellet form [7]. |
| FeMnCoCr High-Entropy Alloy Powder | Used in laser cladding studies to create coatings with unique properties; a model for complex material analysis. | Fe₅₀Mn₃₀Co₁₀Cr₁₀ composition, specific particle size distribution [60]. |
| Anodized Aluminum 6061 | A standard substrate for developing and testing laser engraving and surface processing parameters. | Used for color engraving optimization with a 30W fiber laser [61]. |
Experimental Protocols
Protocol 1: Optimizing LIBS for Bond Breaking in HDPE
- Objective: To investigate the breaking of C–H and C–C bonds in High-Density Polyethylene using different laser harmonics.
- Materials: HDPE sample, Nd:YAG laser system (capable of 1064 nm, 532 nm, 266 nm), spectrometer, open-air environment.
- Methodology:
- Sample Preparation: Secure the HDPE sample in the laser path.
- Laser Setup: Configure the laser to the desired harmonic (1st: 1064 nm, 2nd: 532 nm, 4th: 266 nm). Set the repetition rate to 20 Hz.
- Energy Calibration: For 1064 nm and 532 nm, use pulse energies from 5 to 40 mJ. For 266 nm, use 3 to 10 mJ.
- Spectral Acquisition: Focus the laser on the sample surface. Collect the emitted plasma light with a spectrometer. Use a suitable gate delay and width for the ICCD detector.
- Data Analysis: Identify the characteristic emission lines, particularly the Hα line at 656.3 nm, which indicates the breaking of C–H bonds. Compare the intensity of this peak across different wavelengths and pulse energies to determine the most efficient parameters [56].
Protocol 2: Enhancing LIBS Spectral Stability with a Dynamic Vision Sensor (DVS)
- Objective: To correct for plasma fluctuations and improve the quantitative performance of LIBS.
- Materials: LIBS system, Dynamic Vision Sensor (DVS), metal samples (e.g., copper alloy, carbon steel).
- Methodology:
- System Integration: Mount the DVS to capture the plasma optical signal simultaneously with spectral acquisition. Optimize DVS parameters (aperture F2.0, 5 cm collection distance, 0° collection angle) [15].
- Signal Acquisition: Collect a dataset of LIBS spectra alongside the DVS events ("On" events from increasing light) and plasma morphology data.
- Model Building: Extract features from the DVS data, such as the total plasma area and the number of "On" events. Establish a correction model (DVS-SC) that relates these plasma optical features to the spectral intensity.
- Validation: Apply the correction model to new spectral data. Validate the improvement by comparing the R² values of calibration curves and the Relative Standard Deviation (RSD) of measurements before and after correction [15].
Visualization of Workflows and Relationships
Laser Parameter Optimization Logic
LIBS with DVS Correction Workflow
Managing Thermal Effects and Carbonization in Organic Samples
Troubleshooting Guide: FAQs on Thermal Challenges in LIBS
1. How do I reduce excessive carbonization and blackening around the laser ablation site on my organic samples?
Excessive carbonization is typically caused by accumulated thermal energy. To mitigate this:
- Use a defocused beam: Operating slightly outside the focal plane can distribute energy over a larger area, reducing power density and instantaneous heating [62].
- Implement dual-pulse LIBS: The first laser pulse creates a favorable low-density environment, allowing the second pulse to generate analytical plasma with less thermal load on the sample [12].
- Optimize spot overlapping: Research on carbon composites shows that specific spot overlap ratios can cause thermal-mechanical ablation, efficiently removing material before excessive heating occurs. Experiment with different hatch distances to find this critical value [62].
- Employ gas assistance: Using helium as an ambient gas can improve plasma conditions and carry away heat more effectively [63] [22].
2. Why is my LIBS signal unstable when analyzing heat-sensitive organic compounds, and how can I improve reproducibility?
Signal instability in organic samples stems from irregular material removal and plasma fluctuations due to thermal decomposition:
- Control laser parameters: Use lower energy densities (3.9-7.8 J/cm² has been effective for thin films) to minimize uncontrolled thermal degradation [25].
- Implement pit restriction: By consistently ablating within laser-generated pits of specific dimensions (0.400-0.443 mm² area, 0.357-0.412 mm depth), plasma confinement improves signal stability [63].
- Apply advanced normalization: Use the multi-line internal standard method rather than single-line normalization to compensate for plasma fluctuations [63].
- Ensure proper gating: Use time-resolved spectrometers with gate times <1 µs to capture plasma emission at consistent time intervals [12].
3. What laser parameters most significantly influence thermal damage in organic samples?
Laser parameters interact complexly with material properties, but these factors are most critical:
- Power density: Higher densities (≥2000 W) promote sublimation, while lower densities (≤1000 W) favor oxidative processes that generate more heat [64].
- Spot overlapping: Excessive overlap increases heat accumulation, while insufficient overlap creates uneven ablation [62].
- Pulse duration: Shorter pulses (nanosecond vs. continuous wave) reduce heat conduction to surrounding material [62] [65].
- Wavelength: Shorter wavelengths (UV) are often absorbed more efficiently, requiring less energy and generating less thermal diffusion [62].
4. How can I distinguish between thermal decomposition products and actual sample composition in LIBS spectra?
Matrix effects and thermal alteration of samples pose significant interpretation challenges:
- Employ calibration-free LIBS (CF-LIBS): This method based on plasma properties and spectral line intensities can help compensate for matrix effects [12] [22].
- Validate with multiple lines: Never identify elements based on a single spectral line; use the multiplicity of emission lines for each element to confirm presence [12].
- Analyze temporal evolution: Monitor spectral changes during the first few laser pulses to distinguish surface contaminants from bulk material [25].
- Utilize reference samples: When possible, use standards with similar matrix composition to improve quantification accuracy [12].
Experimental Protocols for Thermal Management
Protocol 1: Optimizing Laser Parameters to Minimize Thermal Damage
This methodology systematically identifies laser parameters that minimize thermal effects while maintaining analytical signal quality.
Materials and Equipment:
- Nd:YAG laser (1064 nm typical for organic samples)
- Spectrometer with time resolution <1 µs
- Automated translation stage for sample positioning
- Gas delivery system for environmental control
- Confocal microscope for crater analysis
Procedure:
- Prepare sample substrates: Ensure consistent surface properties and mounting.
- Establish parameter ranges:
- Laser energy density: 3-8 J/cm² (based on successful thin film studies [25])
- Spot size: 50-200 µm diameter
- Repetition rate: 1-10 Hz (initially)
- Number of pulses: 10-100 per location
- Execute matrix experiment: Systemically vary parameters and analyze:
- Ablation crater morphology (using confocal microscopy)
- Spectral signal-to-noise ratio
- Relative standard deviation of line intensities
- Visual inspection for carbonization
- Identify optimal conditions: Select parameters that balance signal quality with minimal thermal damage.
- Validate with reference materials: Confirm performance on samples with known composition.
Table 1: Laser Parameters and Their Effect on Thermal Properties
| Parameter | Effect on Thermal Load | Recommended Range for Organics | Optimization Strategy |
|---|---|---|---|
| Power Density | Directly controls heating rate | 3.9-7.8 J/cm² [25] | Start low, increase until signal stable |
| Spot Overlap | Higher values increase heat accumulation | 30-70% [62] | Find critical value where removal rate peaks |
| Pulse Duration | Shorter pulses reduce thermal diffusion | Nanosecond domain [62] | Use shortest pulse width available |
| Wavelength | Shorter wavelengths often absorbed better | UV-VIS (1064-532 nm) [62] | Match to sample absorption properties |
| Ambient Gas | Affects plasma cooling and sample oxidation | Helium or Argon [63] | Helium for better heat transfer |
Protocol 2: Signal Stabilization Through Ablation Pit Confinement
This technique utilizes the natural confinement of laser-generated pits to stabilize plasma and improve signal reproducibility.
Materials and Equipment:
- LIBS system with precision focusing
- Laser confocal microscope
- Digital delay generator
- Multiple representative samples
Procedure:
- Characterize pit formation dynamics:
- Fire 1-200 pulses at fixed parameters on representative location
- After specific pulse counts (10, 20, 50, 100, 200), analyze pit dimensions
- Measure diameter, depth, and volume using confocal microscopy
- Correlate with plasma parameters:
- At each pulse count interval, record plasma temperature and electron density
- Calculate relative standard deviation (RSD) of line intensities
- Identify stability window:
- Find pulse count range where RSD is minimized (typically at specific pit dimensions of 0.400-0.443 mm² area, 0.357-0.412 mm depth based on research [63])
- Implement optimized method:
- Pre-ablate analysis locations to reach stable pit dimensions
- Conduct analytical measurements within this stability window
- Move to fresh locations once pit dimensions exceed optimal range
Table 2: Research Reagent Solutions for LIBS Analysis of Organic Samples
| Material/Reagent | Function | Application Notes |
|---|---|---|
| T700/BA9916 composite laminates | Reference material for carbon-based samples | Useful for method development [64] |
| White SMC high-pressure insulating board | Insulating organic composite | Contains various elements (C, O, Na, Mg, Al, Si, etc.) for calibration [63] |
| Boron films on molybdenum tiles (30-300 nm) | Model system for thin organic layers | Validates thickness-dependent effects [25] |
| Pulse deposition system | Creates uniform thin films | Enables preparation of standardized samples [25] |
| Unsaturated resin with fiberglass | Representative organic matrix | Models challenging insulating materials [63] |
Workflow Visualization
The Role of Stand-off Distance and Its Real-Time Adaptive Control
Frequently Asked Questions (FAQs)
FAQ 1: What is the primary impact of changing the stand-off distance in LIBS? Changing the stand-off distance significantly alters key experimental conditions, leading to considerable spectral profile discrepancies. These include variations in laser spot size and energy density on the target, modifications to the geometric configuration of the plasma generation zone, and changes in how the environmental media absorbs or scatters the excitation laser and subsequent emission light. Consequently, even for the same sample, variations in distance can cause intensity variations in characteristic spectral lines, shifts in the continuum background baseline, and altered ratios between different elemental peaks, which complicates quantitative and qualitative analysis [7].
FAQ 2: What is real-time adaptive control in the context of LIBS, and why is it needed? Real-time adaptive control is a method where the control system modifies its own parameters to adapt to a controlled system with varying or initially uncertain conditions [66]. In LIBS, this is crucial because optimal laser parameters (like laser energy, delay time, and gate width) can vary with the sample matrix [67] [22]. Furthermore, in field applications like planetary exploration, the detection distance naturally varies, inducing the "distance effect" that can weaken the performance of analytical models. An adaptive control strategy can compensate for the deviation between predicted (day-ahead scheduling) and actual energy flow or experimental conditions, improving system reliability and analytical performance without requiring prior information about the bounds of these uncertain parameters [66] [68].
FAQ 3: How can I mitigate the plasma self-absorption effect in my stand-off LIBS setup? Self-absorption is an intrinsic phenomenon in LIBS plasmas and should not be treated solely as a problem but as a effect that can be evaluated and compensated for. A common error is to ignore the main strategies available for this. Several methods exist to evaluate self-absorption, and it is inappropriate to present it as an insurmountable issue without mentioning them. It is also critical not to confuse self-absorption, which is always present, with self-reversal, which manifests as a narrow dip at the center of the spectral line and occurs only when the plasma is non-homogeneous (colder at the borders) [12].
Troubleshooting Guides
Troubleshooting Table: Common Stand-off LIBS Issues and Solutions
| Problem Symptom | Potential Cause | Recommended Solution |
|---|---|---|
| Weak or low-intensity emission signals at longer distances. | Signal attenuation due to increased distance; lower laser energy density on target. | Use a larger aperture telescope to collect more light [69]. Ensure superior laser beam quality (e.g., M² < 2) for a tighter focus at a distance [70]. |
| High pulse-to-pulse variation (poor reproducibility). | Fluctuations in laser-sample interaction; unstable plasma; inhomogeneous samples. | Record and average multiple spectra from different sample regions [71] [67]. For bulk analysis, ensure a sufficient number of accumulated pulses [67]. |
| Poor quantitative analysis results and low model performance with varying distance. | The "distance effect" causes spectral profile discrepancies not accounted for in the model. | Train chemometric models directly on multi-distance spectral data instead of relying on data from a single fixed distance [7]. |
| Difficulty in quantifying elements without standard reference materials (SRMs). | Matrix effects and lack of matrix-matched calibration standards. | Apply the Calibration-Free LIBS (CF-LIBS) technique, which uses plasma parameters (temperature, electron density) and the Boltzmann plot for quantification, bypassing the need for SRMs [71]. |
| Misidentification of spectral lines. | Minimal wavelength shift misinterpreted; reliance on a single emission line for identification. | Never identify an element based on a single spectral line. Exploit the multiplicity of information from different emission lines of the same element to confirm its presence [12]. |
Advanced Troubleshooting: Adaptive Control for Distance Variation
Challenge: A LIBS system deployed for planetary exploration or field monitoring encounters unpredictable changes in detection distance, leading to unreliable classification of geological samples.
Solution Protocol: A Multi-Distance Deep Learning Approach
- Data Acquisition: Collect a comprehensive LIBS spectral dataset from all target samples (e.g., 37 geochemical reference materials) across the entire expected range of operational distances. For example, acquire 60 spectra per sample at each distance, with distances categorized as short (e.g., 2.0 m, 2.3 m, 2.5 m), medium (e.g., 3.0 m, 3.5 m, 4.0 m), and long-range (e.g., 4.5 m, 5.0 m) [7].
- Data Preprocessing: Subject all raw spectra to a standard preprocessing chain. This includes dark background subtraction, wavelength calibration, ineffective pixel masking, spectrometer channel splicing, and background baseline removal [7].
- Model Selection and Training: Implement a deep Convolutional Neural Network (CNN) model architecture capable of processing the full spectral range. Instead of traditional "distance correction," train the CNN model directly on the mixed multi-distance dataset. To enhance performance, employ an optimized sample weighting strategy during training that assigns tailored weights to spectral samples based on their corresponding detection distance, rather than treating all samples equally [7].
- Validation: Validate the trained model's classification accuracy on an external testing set of multi-distance spectra that were not used during training. This approach has been shown to achieve high classification accuracy (>92%) on complex geochemical samples across varying distances, effectively acting as an adaptive control system within the data processing software [7].
Experimental Protocols for Key Studies
Protocol 1: Stand-off Monitoring of Air Pollutants using CF-LIBS
This protocol outlines the methodology for detecting and quantifying pollutants in ambient air at a stand-off distance, using a calibration-free approach [71].
- Objective: To qualitatively and quantitatively analyze the composition of ambient air and detect added pollutants like chalk powder (Ca), zinc powder (Zn), and incense smoke (S, K) without using calibration standards.
- Key Equipment:
- Q-switched Nd:YAG laser (1064 nm wavelength).
- Beam expander and Newtonian telescope integrated into the sensor design.
- LIBS2500+ spectrometer.
- Software: NIST database for line identification; MATLAB for spectral processing and CF-LIBS analysis.
- Procedure:
- Setup: Configure the stand-off LIBS sensor at a fixed distance of 2 m from the sampling point (ambient laboratory air).
- Contamination: Introduce specific pollutants (e.g., chalk powder, zinc powder, incense smoke) into the air volume to be analyzed.
- Plasma Generation & Data Collection: Fire the laser to produce plasma in the contaminated air. Record the plasma emission spectra. Multiple spectra should be recorded and only those with visibly close focus points should be considered to minimize signal fluctuations.
- Qualitative Analysis: Identify the emission lines of elements (H, N, O, Ca, Zn, S, K) by comparing them with the NIST database.
- Quantitative Analysis (CF-LIBS):
- Assume the plasma is optically thin and in Local Thermal Equilibrium (LTE).
- Determine plasma parameters (electron temperature and electron density).
- Use the Boltzmann plot method to calculate the concentration of each element based on the intensity of its emission lines and its plasma parameters.
- Expected Outcome: Successful detection of air constituents (N, O, H) and added pollutants. CF-LIBS quantification should yield percentage concentrations for these elements, for example, Nitrogen at 75.4-78.19%, Oxygen at 18.95-20.98%, and trace amounts of Calcium, Sulfur, and Potassium from pollutants [71].
Protocol 2: Optimization of LIBS Parameters using Design of Experiments (DOE)
This protocol uses a statistical approach to optimize LIBS parameters for complex samples like river sediments, which is a prerequisite for developing effective adaptive control logic [67].
- Objective: To systematically optimize key LIBS parameters (Laser Energy, Delay Time, Gate Width, Accumulated Pulses) for multi-element qualitative analysis to maximize the Signal-to-Noise (S/N) ratio.
- Key Equipment: LIBS system with configurable parameters; pelletized sediment sample.
- Procedure:
- Screening (Fractional Factorial Design): If many factors are involved, first use a fractional factorial design to identify which parameters (e.g., laser energy, delay time, gate width, inter-pulse delay for DP-LIBS) have the most significant effects on the S/N ratio.
- Optimization (Central Composite Design - CCD): Use a Central Composite Design to fit a second-order model for the significant parameters. This design efficiently explores the parameter space and their interactive effects without the need to test all possible combinations.
- Data Analysis: Analyze the results to find the parameter values that maximize the S/N ratio for the elements of interest. The study found that for a river sediment sample, delay time and gate width were generally more influential than laser energy, and maximum accumulated pulses and gate width were typically optimal [67].
- Expected Outcome: A set of optimized instrumental parameters tailored to the specific sample matrix, providing a robust foundation for consistent analysis and informing the bounds of an adaptive control system.
Signaling Pathways and Workflows
Stand-off LIBS Adaptive Control Workflow
The following diagram illustrates the integrated workflow for a LIBS system with adaptive control capabilities, combining insights from parameter optimization and real-time data processing.
The Scientist's Toolkit: Essential Research Reagents & Materials
Table: Key Equipment and Consumables for Stand-off LIBS Experiments
| Item | Function & Application |
|---|---|
| Q-switched Nd:YAG Laser | The primary excitation source. The fundamental wavelength (1064 nm) is most common for stand-off LIBS due to better atmospheric transmission and ability to generate plasma on various targets [71] [7] [70]. |
| Beam Expander | Integrated into the sensor to extend the Rayleigh range of the laser beam, allowing it to remain focused over longer stand-off distances [71]. |
| Newtonian or Schmidt-Cassegrain Telescope | Used to collect the faint plasma emission light from a distance. A larger aperture (e.g., 8", 14") is critical for gathering sufficient light for analysis at stand-off ranges above 10-20 meters [71] [70]. |
| Gated Spectrometer (ICCD/CCD) | Essential for time-resolved analysis of the transient plasma emission. A short gate width (<1 µs) is necessary to capture the plasma signal while excluding the continuous background radiation, which is vital for applying CF-LIBS [12] [70]. |
| Certified Reference Materials (CRMs) | Homogeneous, pelletized geochemical reference materials (e.g., GBW series, USGS standards) are used for developing and validating classification and quantification models, especially for complex samples like soils and sediments [67] [7] [69]. |
| Design of Experiments (DOE) Software | Statistical software used to plan and analyze parameter optimization experiments (e.g., Fractional Factorial, Central Composite Design), saving time and revealing interactive effects between parameters like laser energy and delay time [67]. |
Data Pre-processing and Dimensionality Reduction for Complex Spectra
Troubleshooting Guides & FAQs
Frequently Asked Questions
Q1: The calibration curves for my LIBS quantitative analysis are highly non-linear. What pre-processing steps can help? A primary cause of non-linear calibration curves in LIBS is the self-absorption effect, where photons emitted by the plasma are re-absorbed by cooler atoms at its periphery [28]. To mitigate this:
- Investigate Plasma Modulation: Recent research demonstrates that plasma spatial modulation, which uses a geometric constraint to flatten the plasma plume, can significantly reduce self-absorption. This passive correction method has been shown to achieve calibration curves for elements like Cr and Ni with correlation coefficients (R²) greater than 0.99 [28].
- Evaluate Algorithmic Correction: If hardware modification is not feasible, self-absorption can be treated as a nonlinear data problem. Employ machine learning models like Convolutional Neural Networks (CNNs) which are capable of learning and correcting for these complex nonlinearities, including self-absorption and matrix effects [72] [73].
Q2: How do I choose the best pre-processing method for my specific dataset? There is no universal "best" pre-processing method; the optimal choice depends on your specific spectral data and the component you are predicting [74].
- Systematic Trial Approach: A proven strategy is to systematically test a sequence of pre-processing methods. One study combined 10 common techniques (e.g., derivatives, MSC, SNV, SG smoothing) in 120 different排列组合 (permutations and combinations) and selected the one that yielded the lowest Root Mean Square Error of Prediction (RMSEP) for a Partial Least Squares (PLS) model [74].
- Leverage Deep Learning: To avoid the tedious process of manual pre-processing selection, use a Convolutional Neural Network (CNN). CNNs can automatically extract features from raw or minimally pre-processed spectra, learning the most relevant patterns for quantification directly from the data [72].
Q3: My LIBS spectra have significant baseline drift and high noise. How can I improve the signal quality for analysis? Baseline drift and noise are common issues that can be addressed through spectral pre-processing.
- For Baseline Correction: Techniques like Standard Normal Variate (SNV), Multiplicative Scatter Correction (MSC), and derivatives (1st Der, 2nd Der) are effective for removing baseline shifts and slopes [74].
- For Noise Filtering: Savitzky-Golay (SG) smoothing is a widely used and effective method for reducing high-frequency noise while preserving the shape of the spectral peaks [74].
- Advanced Combination: Continuous Wavelet Transform (CWT) is a powerful technique that can simultaneously handle both baseline correction and noise filtering [74]. The systematic trial approach mentioned above is recommended to find the best combination for your data.
Q4: How can I analyze LIBS data where the components have complex, non-linear relationships with the spectral intensity? Traditional linear methods like PLS often fail with highly non-linear data. The solution is to use machine learning models designed for non-linear regression.
- Deep Learning for Non-linear Mapping: Artificial Neural Networks (ANNs), particularly Back Propagation ANN (BPANN) and Convolutional Neural Networks (CNNs), excel at tracking and identifying non-linear characteristics. They can adaptively learn from LIBS spectral features and screen out interference information, effectively correcting for non-linear effects like self-absorption and matrix effects [73]. A dedicated CNN-based patent exists for the simultaneous quantitative inversion of multiple components from LIBS spectra [72].
Key Experiments & Protocols
Experiment 1: Protocol for Plasma Spatial Modulation to Reduce Self-Absorption
- Objective: To improve the linearity of LIBS calibration curves by physically constraining the plasma to an optically thinner state [28].
- Laser Parameters:
- Laser Type: Q-switched Nd:YAG pulsed laser.
- Wavelength: 532 nm.
- Pulse Energy: 70 mJ.
- Repetition Rate: 10 Hz [28].
- Methodology:
- Setup: Design constraint cavities (e.g., simple apertures) with varying gap sizes.
- Alignment: Focus the laser beam through the constraint cavity onto the surface of a standard sample (e.g., stainless steel).
- Data Collection: Acquire LIBS spectra for elements of interest (e.g., Cr, Ni) using different constraint sizes.
- Analysis: For each constraint condition, plot the intensity of characteristic emission lines against the known concentration of standard samples to generate calibration curves.
- Expected Outcome: The optimal constraint condition (e.g., a 2.0 mm gap) will produce a flatter, more spatially uniform plasma, leading to calibration curves with higher linearity (R² > 0.99) and a lower cross-validation root mean square error [28].
Experiment 2: Protocol for a CNN-Based Multi-Component Quantitative Analysis
- Objective: To simultaneously quantify the concentration of multiple elements in an unknown sample using a pre-trained Convolutional Neural Network, minimizing the need for manual pre-processing [72].
Network Architecture: The following table outlines a CNN structure suitable for LIBS spectral analysis [72].
Methodology:
- Preparation: Prepare or obtain a set of standard samples with known chemical compositions.
- Spectral Acquisition: Collect a large number of LIBS spectra from these standard samples to form a training set.
- CNN Training:
- Input the raw or minimally pre-processed spectra from the training set into the CNN.
- The network automatically performs feature extraction and deep learning through its convolutional and pooling layers.
- The model's weights are adjusted to minimize the prediction error against the known concentrations.
- Validation: Use a separate set of validation samples to test the network's prediction accuracy and prevent overfitting.
- Prediction: Input the LIBS spectrum of an unknown sample into the trained CNN to obtain simultaneous predictions for the concentrations of its multiple chemical components [72].
Data Presentation
Table 1: Comparison of Common Spectral Pre-processing Methods and Their Impact on PLS Model Performance (RMSEP) [74]
| Pre-processing Category | Example Methods | Primary Function | Typical Impact on RMSEP |
|---|---|---|---|
| Scattering Correction | MSC, SNV | Corrects for light scattering effects and baseline shift. | Often significantly reduces RMSEP for solid samples. |
| Derivative | 1st Der, 2nd Der | Removes baseline drift and enhances resolution of overlapping peaks. | Can greatly improve RMSEP, but may increase noise if not combined with smoothing. |
| Smoothing | SG Smoothing | Reduces high-frequency random noise. | Generally reduces RMSEP by improving signal-to-noise ratio. |
| Scaling | Mean Centering, Auto Scaling | Adjusts data variance to give all variables equal weight. | Effect is data-dependent; often used as a final step before modeling. |
| Advanced Combination | CWT (Continuous Wavelet Transform) | Simultaneously performs baseline correction and noise filtering. | Can be one of the most effective methods, leading to the lowest RMSEP for some datasets [74]. |
Table 2: Overview of Artificial Neural Network Models Applied to LIBS Data Analysis [73]
| ANN Model | Key Features | Typical Application in LIBS | Advantages & Caveats |
|---|---|---|---|
| BPANN (Back Propagation ANN) | Basic, multi-layer network using gradient descent. | Most widely used for data classification and concentration prediction. | Advantage: Simple, widely applicable. Caveat: Slow convergence, prone to local minima [73]. |
| RBFNN (Radial Basis Function NN) | Uses radial basis functions as activation functions. | Solving nonlinear problems in LIBS data. | Maps nonlinear problems to high-dimensional space for linear solution [73]. |
| WNN (Wavelet Neural Network) | Combines wavelet analysis for feature extraction. | Analysis of signals with significant noise interference. | Strong time-frequency feature extraction; good for non-linear prediction [73]. |
| CNN (Convolutional Neural Network) | Features convolutional and pooling layers for automated feature learning. | Quantitative inversion of multi-component from complex, high-noise spectra. | Advantage: Automatic feature extraction, high accuracy, robust to noise and shift [72] [73]. |
Workflow Visualization
The Scientist's Toolkit: Research Reagent & Solutions
Table 3: Essential Materials and Computational Tools for LIBS Research
| Item | Function in LIBS Research | Application Context |
|---|---|---|
| Standard Reference Materials | Certified samples used for calibration and validation of quantitative models. | Essential for building both traditional calibration curves and for generating training data for machine learning models [72]. |
| Constraint Cavities / Apertures | Simple geometric devices used for plasma spatial modulation. | Placed in front of the sample to physically shape the plasma, reducing self-absorption effects and improving linearity [28]. |
| Convolutional Neural Network (CNN) Software | A deep learning framework (e.g., TensorFlow, PyTorch) for building and training quantitative models. | Used to create models that directly map raw LIBS spectra to component concentrations, handling non-linearities and complex matrix effects [72] [73]. |
| Spectral Pre-processing Software | Software or coding libraries (e.g., in Python, MATLAB) that implement algorithms like SNV, derivatives, and SG smoothing. | Critical for preparing raw, noisy spectral data before input into classical linear models or to supplement deep learning approaches [74]. |
| High-Performance Computing Workstation | A computer with a powerful GPU (Graphics Processing Unit). | Significantly accelerates the training process of deep learning models like CNNs, which are computationally intensive [72]. |
Validating Performance and Comparative Analysis of LIBS Systems
In Laser-Induced Breakdown Spectroscopy (LIBS) research, the optimization of laser parameters is crucial for generating high-quality plasma, which directly influences the reliability of elemental analysis. Evaluating the performance of classification or quantification models in this context requires a robust set of statistical metrics. Accuracy, Precision, Recall, and the F1-Score provide a comprehensive framework for assessing how well your model identifies and categorizes spectral data from plasma emissions. These metrics are particularly vital when differentiating between similar alloy compositions or detecting minor impurities, where model errors can lead to significant analytical inaccuracies. A study on classifying functional alloy materials using LIBS and machine learning demonstrated the importance of these metrics, achieving a model accuracy of approximately 98.89% using the Random Forest technique [75].
The following table defines these core metrics and their specific relevance to LIBS experiments.
Table 1: Core Performance Metrics for LIBS Model Evaluation
| Metric | Mathematical Definition | Interpretation in LIBS Context |
|---|---|---|
| Accuracy | (TP + TN) / (TP + TN + FP + FN) | Overall effectiveness at classifying spectra or identifying correct laser parameter sets across all classes. |
| Precision | TP / (TP + FP) | Reliability of the model when it predicts a specific elemental line or material class; a low precision indicates many false alarms. |
| Recall | TP / (TP + FN) | Ability to correctly identify all instances of a specific element or material class present in the sample; a low recall means many targets were missed. |
| F1-Score | 2 * (Precision * Recall) / (Precision + Recall) | Single metric balancing the trade-off between Precision and Recall, useful when you need a harmonic mean for class-imbalanced LIBS data. |
TP: True Positive, TN: True Negative, FP: False Positive, FN: False Negative
Experimental Protocols for Performance Benchmarking
Protocol: Model Training and Validation for Material Classification
This protocol is based on a study that successfully classified functional alloy materials with high accuracy [75].
- Objective: To train and validate a machine learning model for classifying different alloy samples based on their LIBS spectra.
- Materials & Setup:
- LIBS System: A Q-switched Nd:YAG laser (wavelength: 532 nm, pulse duration: 5 ns) focused on a pelletized sample to generate plasma [75].
- Spectrometer: A set of compact Avantes spectrometers with a CCD array, set at a 2 μs gate delay for spectrum recording [75].
- Samples: Nine pelletized alloy samples with varying concentrations of Al, Cu, Pb, Si, Sn, and Zn [75].
- Methodology:
- Data Acquisition: Collect a minimum of 400 LIBS spectra from the samples. Ensure each spectrum is labeled with the correct sample identity [75].
- Data Splitting: Divide the dataset into a training set (e.g., 320 spectra) and a testing set (e.g., 80 spectra). The training set develops the model, while the testing set evaluates its predictive performance [75].
- Model Training: Employ a classification algorithm like the Random Forest Technique (RFT). Optimize parameters (e.g., number of trees) using methods like Out-of-Bag (OOB) estimation [75].
- Performance Validation: Use a 10-fold cross-validation technique on the testing set. Calculate Accuracy, Precision, Recall, and F1-Score for each fold and report the mean values [75].
Protocol: Hybrid Parameter Optimization for Laser Cutting Quality
This protocol outlines a hybrid method for optimizing laser parameters, a concept that can be adapted for LIBS plasma generation [76].
- Objective: To optimize laser process parameters using a hybrid physical and data-driven model to improve outcomes (e.g., plasma stability, cut quality).
- Materials & Setup:
- Laser Processing System: A laser cutting or LIBS experimental platform.
- Sensors: Equipment for monitoring quality indicators (e.g., spectrometer for plasma temperature, camera for cut quality).
- Simulation Software: COMSOL Multiphysics or similar for building a physical model of the process (e.g., temperature field) [76].
- Methodology:
- Experimental Design: Use a full factorial design (e.g., five factors, three levels) to systematically collect data on various laser parameter combinations (e.g., power, speed, pulse energy) and the corresponding quality metrics [76].
- Physical Modeling: Construct a detailed physical model (e.g., in COMSOL) to simulate key physical phenomena, such as the temperature field during laser-material interaction. This provides supplemental "mechanistic feature" data [76].
- Neural Network Training: Design a Physics-Informed Neural Network (PINN) with two input branches. One branch processes the experimental laser parameters, and the other processes the simulated physical data (e.g., temperature field). The network uses an attention mechanism in the fusion layer to integrate the most relevant features [76].
- Optimization and Validation: Use a Clustering-assisted Non-dominated Sorting Genetic Algorithm II (CA-NSGA-II) with the trained PINN as a surrogate model to find the Pareto-optimal set of laser parameters. Validate the optimized parameters through actual experiments and compare the results against traditional methods [76].
Table 2: Example Quantitative Results from Hybrid Optimization in Laser Cutting
| Optimization Method | R² Value Improvement | Reduction in Dross | Key Advantage |
|---|---|---|---|
| Hybrid (PINN + CA-NSGA-II) | 15.6% higher than baseline | 32.4% | Integrates physical mechanisms for reliable predictions |
| Traditional SVR | R² < 0 on test set | N/A | Poor performance with complex, noisy data |
| Traditional RR | R² < 0 on test set | N/A | Poor performance with complex, noisy data |
Troubleshooting Guides & FAQs
FAQ 1: My model achieves high accuracy but poor precision for a specific elemental class. What is the issue and how can I resolve it?
- Problem Interpretation: High accuracy with low precision for a class indicates that while your model is generally correct, it has many False Positives (FP) for that particular element. In LIBS, this is often due to spectral interference, where emission lines from other elements are mistakenly identified as belonging to the target element, or an inadequately tuned model that is too "liberal" in its assignment.
- Resolution Steps:
- Re-examine Preprocessing: Ensure rigorous spectral preprocessing. Check the background subtraction and normalization steps. Using the integrated intensity of a persistent line like Al II at 281.62 nm for normalization can improve consistency [75].
- Refine Feature Selection: Manually curate the emission lines used for model training. Select lines with minimal self-absorption and spectral interference. The study on functional alloys used specific lines like Al (I) at 309.27 nm and Zn (I) at 577.21 nm for this reason [75].
- Adjust the Decision Threshold: For the problematic class, increase the classification decision threshold. This makes the model more conservative, reducing False Positives at the potential cost of slightly lower Recall.
- Review Training Data: Check if the training data for the element with low precision is representative and sufficiently large. Augment the dataset with more samples if necessary.
FAQ 2: During the optimization of laser parameters for plasma generation, the process is computationally expensive and slow. How can I improve efficiency?
- Problem Interpretation: Traditional optimization methods like brute-force search or standard genetic algorithms can require a prohibitive number of experimental runs or simulation cycles, creating a bottleneck in research.
- Resolution Steps:
- Implement a Surrogate Model: Adopt a hybrid mechanism and data-driven approach. Train a machine learning model (e.g., a Physical-Informed Neural Network) on your initial experimental data to act as a fast, approximate predictor of plasma quality based on laser parameters. This surrogate can then be used in place of most slow simulations or experiments during the optimization loop [76].
- Use an Advanced Optimization Algorithm: Employ a Clustering-assisted NSGA-II (CA-NSGA-II). This algorithm uses clustering on historical data to guide the search for optimal parameters, significantly improving optimization efficiency compared to standard methods [76].
- Simplify Dominant Parameters: For initial experiments, reduce the parameter space. A method used in laser cleaning identifies "dominant control parameters" like single-pulse energy and spot overlap, from which other parameters (scan speed, fill spacing) can be derived. This simplifies the setup and reduces the number of variables to optimize [77].
FAQ 3: The recall for a critical trace element in my LIBS analysis is consistently low. How can I improve its detection?
- Problem Interpretation: Low Recall means your model is missing a significant number of true instances of the trace element (high False Negatives). This is common with weak plasma emission signals from low-concentration elements or an imbalanced dataset where the trace element class is underrepresented.
- Resolution Steps:
- Optimize Plasma Generation: Ensure the laser parameters are tuned to maximize the signal for the trace element. Systematically optimize parameters like laser pulse energy and wavelength to enhance plasma conditions and the signal-to-noise ratio for that element.
- Enhance Signal Detection: Verify that the spectrometer's gate delay and width are optimally set to capture the atomic emission of the trace element, which may appear at different times in the plasma decay compared to major elements.
- Address Class Imbalance: If using a classification model, employ techniques to handle the imbalanced data. This can include oversampling the trace element class in the training set, using algorithmic approaches that penalize misclassifying the minority class more heavily, or leveraging ensemble methods like Random Forest which can be more robust to imbalances [75].
The Scientist's Toolkit: Research Reagent Solutions
Table 3: Essential Materials and Equipment for LIBS Experiments
| Item | Function/Description | Example from Literature |
|---|---|---|
| Q-switched Pulsed Laser | Generates high-energy, short-duration pulses to ablate material and create high-temperature plasma. | Nd:YAG laser, 532 nm wavelength, 5 ns pulse duration [75]. |
| Spectrometer with CCD | Captures the time-resolved emission spectrum from the plasma for elemental analysis. | Avantes spectrometers with linear CCD array, 2 μs gate delay [75]. |
| Pelletized Sample | A homogeneous, solid sample form that ensures consistent laser ablation and plasma generation. | Alloy powders pressed into pellets with varying concentrations of Al, Cu, Pb, Si, Sn, Zn [75]. |
| Physics Simulation Software | Models the physical interactions (e.g., temperature fields) to provide mechanistic insights for hybrid models. | COMSOL Multiphysics for simulating laser cutting temperature fields [76]. |
| Random Forest Algorithm | A powerful, modern machine learning classifier that helps avoid overfitting and achieves high accuracy. | Used for classifying functional alloy materials with ~98.89% accuracy [75]. |
Technical Support and Troubleshooting Hub
This technical support center is designed within the broader context of a thesis focused on optimizing laser parameters for enhanced plasma generation. The following guides address common experimental challenges, providing solutions to improve the accuracy and robustness of your Laser-Induced Breakdown Spectroscopy (LIBS) research.
Troubleshooting Guide: Common LIBS Experimental Challenges
Problem 1: Poor Signal-to-Noise Ratio and Weak Emission Intensity
- Symptoms: Low peak intensities in spectra, difficulty distinguishing element peaks from background noise, poor limits of detection.
- Potential Causes & Solutions:
- Insufficient Laser Energy: For nanosecond (ns)-LIBS, ensure laser fluence is above the ablation threshold of the material. For complex matrices like river sediments, a screening design of experiments (DOE) can identify if laser energy is a significant factor [67].
- Suboptimal Timing Parameters: Use time-gated detection. Adjust the delay time (typically 0.5–1 µs for ns-LIBS) to allow the intense continuum background to decay, and set an adequate gate width (e.g., 1–10 µs) to collect sufficient atomic emission light [30] [78]. A Central Composite Design (CCD) can systematically optimize these parameters [67].
- Sample Heterogeneity: For inhomogeneous samples (e.g., soils, biological tissues), collect a large number of spectra (tens to hundreds) from different sample regions to average out matrix effects and improve measurement precision [22] [67].
Problem 2: Non-Stoichiometric Ablation and Matrix Effects
- Symptoms: Calibration curves are non-linear; quantitative results are inaccurate and highly dependent on the sample's physical properties.
- Potential Causes & Solutions:
- Thermal Damage with ns-LIBS: ns-laser pulses have a longer thermal penetration depth, causing melting, preferential vaporization of elements, and a larger Heat-Affected Zone (HAZ). This leads to non-stoichiometric ablation [10].
- Solution: Femtosecond (fs) Lasers: fs-laser pulses ablate material before significant energy transfer to the sample lattice, drastically reducing the HAZ and thermal effects. This promotes stoichiometric ablation and minimizes matrix dependence, favoring more accurate quantitative analysis [30] [10].
- Alternative: Hybrid Techniques: If an fs-laser is unavailable, employ signal enhancement methods like Double-Pulse LIBS (DP-LIBS) or Nanoparticle-Enhanced LIBS (NELIBS) to improve sensitivity and mitigate matrix effects [30] [22] [12].
Problem 3: Self-Absorption in Spectral Lines
- Symptoms: Reduction in peak intensity, saturation of calibration curves at high concentrations, and in severe cases, a dip in the center of the peak (self-reversal) [12].
- Potential Causes & Solutions:
- High Ablated Mass Density: A dense plasma causes photons emitted from its hot core to be re-absorbed by cooler atoms of the same element in the plasma periphery [79].
- Reduce Ablated Mass: For fs-LIBS and high-repetition rate fiber lasers, self-absorption can increase with higher laser power and single-pulse ablation area (SPAA). Optimize these parameters to a lower level to reduce the effect [79].
- Spatially Selective Light Collection: Collect plasma emission from its outer, cooler regions where self-absorption is less pronounced [12].
- Use Intensity Ratios: Instead of absolute intensities, use the ratio of an ionic to an atomic line of the same element (e.g., Zr II/Zr I), which can show a strong, predictable correlation with experimental conditions and reduce self-absorption impact [80].
Problem 4: Lack of Reproducibility and Plasma Instability
- Symptoms: High pulse-to-pulse variation in spectral intensity, even on a homogeneous sample.
- Potential Causes & Solutions:
- Laser Fluctuations: ns-lasers, especially low-repetition rate Nd:YAG, can suffer from unstable output power. Consider more stable laser sources like fiber lasers for long-term operation [79].
- Plasma-Photon Interaction in ns-LIBS: The trailing part of a ns-laser pulse interacts with and reheats the expanding plasma, making the process highly sensitive to small fluctuations. In fs-LIBS, the pulse ends before the plasma forms, leading to a more reproducible and controlled plasma evolution [30] [10].
- Strict Environmental Control: Shield the ablation region from air currents and ensure a consistent atmosphere (e.g., use argon flush) to stabilize the plasma [22].
Frequently Asked Questions (FAQs)
FAQ 1: For a new application, should I choose a nanosecond or femtosecond LIBS system? The choice involves a trade-off between analytical performance, cost, and robustness. Nanosecond-LIBS systems are more mature, commercially available, cost-effective, and produce a robust, long-lived plasma suitable for many applications. However, they are prone to matrix effects and non-stoichiometric ablation. Femtosecond-LIBS systems offer superior analytical performance with minimal thermal damage, reduced matrix dependence, and higher spatial resolution, but they come with higher cost, complexity, and are less common in commercial systems [30] [10]. For a new application where cost is a primary concern and matrix-matched standards are available, ns-LIBS is a good starting point. For applications requiring the highest spatial resolution and minimal sample damage (e.g., biological tissues, cultural heritage), fs-LIBS is superior.
FAQ 2: How can I quickly optimize my LIBS parameters for a new sample type? Instead of a time-consuming one-factor-at-a-time approach, use statistical Design of Experiments (DOE). Start with a Fractional Factorial Design to screen which parameters (e.g., laser energy, delay time, gate width) have the most significant effect on your signal. Follow this with a Central Composite Design (CCD) to model the complex interactions between these key parameters and find their optimal settings [67].
FAQ 3: Can I perform quantitative analysis without matrix-matched standards? Yes, but it is challenging. The Calibration-Free LIBS (CF-LIBS) approach can be used, which relies on measuring spectral line intensities and plasma properties (temperature and electron density) to calculate elemental concentrations without calibration curves. However, this method requires the plasma to be in Local Thermodynamic Equilibrium (LTE), which must be verified using time-resolved spectroscopy. It is also highly sensitive to self-absorption effects [30] [12].
FAQ 4: My classification model works well on training data but fails on new samples. What is wrong? This is a common error in LIBS chemometrics. The issue often lies in overfitting or systematic biases.
- Solution 1: Ensure your training dataset is large enough and includes the full natural variability of the sample type. Validate your model on an external dataset that was not used in training.
- Solution 2: Randomize the order of analysis to avoid confounding the model with instrumental drift or other time-dependent effects.
- Solution 3: Before using complex machine learning models (e.g., neural networks), demonstrate that simpler methods like univariate calibration or Partial Least Squares (PLS) regression are insufficient [12].
Comparative Performance Data
Table 1: Direct Comparison of Nanosecond and Femtosecond LIBS Characteristics
| Parameter | Nanosecond (ns) LIBS | Femtosecond (fs) LIBS |
|---|---|---|
| Pulse Duration | ~1–20 ns | ~30–500 fs |
| Ablation Mechanism | Thermal (melting, vaporization) | Non-thermal (Coulomb explosion, photomechanical) |
| Heat-Affected Zone (HAZ) | Large (~1 µm for a 6 ns pulse) [10] | Very small (< 10 nm) [10] |
| Ablation Stoichiometry | Often non-stoichiometric due to preferential vaporization [10] | Highly stoichiometric [30] [10] |
| Plasma-Laser Interaction | Significant; trailing pulse reheats plasma ("plasma shielding") [30] [78] | Negligible; pulse ends before plasma forms [30] [10] |
| Matrix Effects | Strong, calibration is highly matrix-dependent [22] | Reduced, less dependent on sample matrix [30] |
| Spatial Resolution | Lower (micrometer scale) | Higher (sub-micrometer to cellular scale, ~15 µm demonstrated) [30] |
| Cost & Complexity | Lower, widely commercially available | Higher, primarily a research tool |
| Typical Plasma Lifetime | Microseconds (µs) [30] | Hundreds of nanoseconds (ns) [30] |
Table 2: Analytical Performance in Different Sample Matrices
| Sample Matrix | ns-LIBS Performance & Considerations | fs-LIBS Performance & Considerations |
|---|---|---|
| Metals/Alloys | Robust plasma, well-established for sorting and identification. Prone to self-absorption. | High spatial resolution for mapping, minimal elemental migration. Less plasma reheating. |
| Biological Tissues | Significant matrix effects, tissue decomposition due to heat. Challenging for soft tissues [30]. | Reduced matrix effects, minimal thermal damage. Enables cellular-level mapping (e.g., skin cancer) [30]. |
| Calcified Tissues (Bone, Teeth) | Effective for inspecting minerals like hydroxyapatite. Thermal effects can alter local chemistry [30]. | Reduced damage to dental tissues and surrounding structures. Allows for precise caries removal [30]. |
| Complex Powders (e.g., Sediments) | Matrix effects are pronounced. Requires many spectra and careful parameter optimization via DOE [67]. | Less selective ablation, reduced dependence on material matrix, favorable for complex samples [30]. |
Experimental Protocols for Parameter Optimization
Protocol 1: Optimizing LIBS Parameters Using Design of Experiments (DOE)
This methodology is efficient for maximizing signal-to-noise (S/N) ratio in complex samples like river sediments [67].
- Sample Preparation: For solid powders, homogenize, sieve, and press into pellets using a hydraulic press (e.g., 5 tons for 1 minute).
- Screening Experiment:
- Factors: Select factors to test: Laser Energy (LE), Delay Time (DT), Gate Width (GW), and Number of Accumulated Pulses (AP).
- Design: Run a Fractional Factorial Design (e.g., a 2^(4-1) design) to identify which factors have the most significant effect on your response (e.g., S/N ratio of a key element line).
- Optimization Experiment:
- Design: For the significant factors identified in the screening step, run a Central Composite Design (CCD).
- Analysis: Use the CCD data to build a second-order response surface model. This model will show the interaction between parameters and pinpoint the optimal settings for maximizing S/N ratio.
- Verification: Run a validation experiment at the predicted optimal parameters to confirm the improvement.
Protocol 2: Establishing a Calibration Curve and Determining LOD/LOQ
A rigorous approach to quantitative analysis, avoiding common errors [12].
- Standard Preparation: Use a series of standard reference materials with known concentrations of the analyte, spanning a range that includes the expected concentration in unknowns.
- Blank Measurement: Include a blank sample (with no or negligible analyte content). Measure it at least 10 times independently to determine the standard deviation (σ) of the background signal.
- Spectral Acquisition: Acquire LIBS spectra for all standards and the blank under identical, optimized conditions. For heterogeneous samples, collect many spectra from different locations.
- Data Processing: Integrate the net peak area (after background subtraction) for the analyte line in each spectrum.
- Calibration & Calculation:
- Plot the average net peak intensity vs. concentration for each standard to create the calibration curve.
- Perform a linear fit to obtain the slope (b).
- Limit of Detection (LOD): Calculate as 3σ/b.
- Limit of Quantification (LOQ): Calculate as 10σ/b.
Signaling Pathways and Experimental Workflows
The Scientist's Toolkit: Essential Research Reagents & Materials
Table 3: Key Reagents and Materials for LIBS Experiments
| Item | Function/Description | Application Example |
|---|---|---|
| Certified Reference Materials (CRMs) | Matrix-matched standards used to build calibration curves for quantitative analysis, ensuring accuracy. | Analyzing metal content in soil; using sediment CRMs with known elemental concentrations [67]. |
| Pellet Die & Hydraulic Press | Used to compress powdered samples into solid, homogeneous pellets, improving surface consistency for ablation. | Preparing pellets from powdered biological samples, soils, or sediments for analysis [67]. |
| High-Purity Inert Gases (Argon, Helium) | Flushing the ablation chamber to create a controlled atmosphere, which can enhance signal intensity and reduce oxidation. | Using helium to suppress the self-absorption effect in plasma (LIPS-He*) [12]. |
| Nanoparticles (e.g., Au, Ag) | Deposited on sample surface to enhance the local electromagnetic field, significantly boosting signal intensity (NELIBS). | Sensitivity enhancement for trace element detection in biomedical or environmental samples [22]. |
| Polishing Supplies | Creating a flat, uniform sample surface is critical for reproducible ablation and consistent signal. | Polishing metal alloys or sintered ceramic pellets (e.g., ZrC) to a mirror finish before analysis [80]. |
Validating AI and Machine Learning Models for Spectral Classification
This technical support center provides troubleshooting guides and FAQs for researchers validating AI and Machine Learning (ML) models in Laser-Induced Breakdown Spectroscopy (LIBS), framed within the broader context of optimizing laser parameters for enhanced plasma generation.
Frequently Asked Questions (FAQs)
Q1: My AI model performs well on validation data but fails on new spectral data collected on a different day. What could be the cause?
- A: This is often a data drift issue, frequently caused by uncontrolled variations in laser parameters or environmental conditions. The core laser energy density directly influences plasma temperature and stability, which in turn affects the intensities and signal-to-noise ratio of your spectral lines [25].
- Troubleshooting Steps:
- Audit Laser Parameters: Systematically check and record laser energy density, focus spot size, and temporal profile for consistency between data collection sessions. Even minor, unrecorded fluctuations can induce significant spectral shifts [25].
- Implement Advanced Preprocessing: For challenges like varying detection distances, consider using a multi-distance training dataset. Research shows that Deep Convolutional Neural Networks (CNNs) can be trained to directly process spectra from multiple distances, achieving over 92% accuracy without conventional distance correction by learning to be invariant to these changes [7].
- Augment Your Training Data: Use data augmentation techniques that simulate spectral variations (e.g., adding noise, simulating baseline shifts) to make your model more robust to real-world fluctuations.
Q2: How can I select the best machine learning algorithm for classifying LIBS spectra from complex geological samples?
- A: The optimal algorithm depends on your dataset size and spectral complexity. Benchmarking several algorithms is highly recommended. A study on classifying e-waste plastics via LIBS evaluated eight ML algorithms and found that Neural Network Multilayer Perceptron (NNMLP) and Support Vector Machine (SVM) consistently delivered top performance, achieving 92-94% accuracy on test data and up to 96% on unseen datasets [81].
- Recommendation: Start with SVM for smaller datasets and NNMLP (a type of deep learning) for larger, more complex datasets. The same study also found K-Nearest Neighbors (KNN) to be a strong performer [81].
Q3: My model's predictions lack consistency, and performance metrics fluctuate. How can I improve its reliability?
- A: Inconsistent performance can stem from high variance in the model's predictions. You can address this by:
- Using Ensemble Methods: Algorithms like Random Forest (which builds multiple decision trees) naturally reduce variance and can provide more stable predictions [82].
- Optimizing the Training Process: For deep learning models, a tailored sample weighting strategy during training can significantly enhance performance. One study improved CNN testing accuracy for LIBS classification by 8.45 percentage points by assigning optimized weights to spectral samples based on their acquisition distance, rather than treating all samples equally [7].
- Quantifying Uncertainty: Implement Uncertainty Quantification (UQ) methods, such as Monte Carlo dropout, to evaluate the reliability of each prediction. This helps identify where the model is uncertain, which is crucial for high-stakes applications [83].
Q4: What is the most critical step in preparing LIBS spectral data before training an AI model?
- A: Consistent and thorough data preprocessing is foundational. The choice of preprocessing method can significantly impact model performance.
- Methodology: A comparative study highlights a robust AI-developed approach that combines normalization, interpolation, and peak detection. This pipeline simplifies the spectral analysis and helps in identifying unique features without the need for manual user preprocessing [84]. When benchmarking, it's also critical to compare different normalization techniques (e.g., min-max normalization vs. other methods) to determine what works best for your specific data [81].
Protocol 1: Benchmarking ML Algorithms for Spectral Classification
This protocol is adapted from a study on classifying plastic resins from e-waste [81].
- Sample Preparation: Prepare a diverse set of samples representing all target classes (e.g., six resin types, including those with brominated flame retardants).
- LIBS Data Acquisition:
- Laser Parameters: Use a Nd:YAG laser (1064 nm wavelength). Laser pulse energy and focus should be optimized to generate a stable plasma without damaging the sample.
- Spectral Collection: Collect multiple spectra from different spots on each sample to account for heterogeneity. Conduct both static measurements and dynamic tests to simulate real-world sorting conditions.
- Data Preprocessing:
- Apply dark background subtraction and wavelength calibration.
- Compare preprocessing methods such as min-max normalization and other standard normal variate (SNV) techniques.
- Split data into training, validation, and unseen test sets.
- Model Training & Evaluation:
- Train a suite of ML algorithms (e.g., NNMLP, SVM, KNN).
- Evaluate models based on accuracy, precision, recall, and F1-score on the test sets. Use k-fold cross-validation for robust performance estimation.
Table 1: Performance of ML Algorithms in E-Waste Plastic Classification (Static LIBS Data) [81]
| Machine Learning Algorithm | Reported Test Accuracy | Key Strengths |
|---|---|---|
| Neural Network MLP (NNMLP) | 92-94% | High accuracy for complex patterns |
| Support Vector Machine (SVM) | 92-94% | Effective in high-dimensional spaces |
| K-Nearest Neighbors (KNN) | >90% | Simple, often strong performance |
| Other Tested Algorithms (e.g., LDA, Logistic Regression) | Lower than above | Baseline performance |
Protocol 2: Validating Models with Multi-Distance LIBS Spectra
This protocol is based on work for planetary exploration where distance varies [7].
- Dataset Construction: Acquire LIBS spectra from the same set of geochemical targets (e.g., Carbonate Mineral, Clay, Metal Ore) at multiple, precise stand-off distances (e.g., from 2.0 m to 5.0 m).
- Data Preprocessing: Create a mixed-distance dataset. Preprocess spectra (background subtraction, etc.) but deliberately do not apply distance correction.
- CNN Model Training with Sample Weighting:
- Control Training: Train a Deep CNN model using a default equal-weighting scheme for all training samples.
- Optimized Training: Train the same model architecture using a proposed spectral sample weight optimization strategy, where each training sample is assigned a specific weight based on its detection distance.
- Performance Comparison: Compare the testing accuracy, precision, recall, and F1-score of the two models on a held-out multi-distance test set.
Table 2: Impact of Sample Weight Optimization on CNN Model Performance [7]
| Performance Metric | Equal-Weight CNN Model | Optimized-Weight CNN Model | Improvement |
|---|---|---|---|
| Testing Accuracy | 83.61% | 92.06% | +8.45 pp |
| Precision | Baseline | Average +6.4 pp | - |
| Recall | Baseline | Average +7.0 pp | - |
| F1-Score | Baseline | Average +8.2 pp | - |
Workflow Visualization
AI Model Validation Workflow for LIBS Spectral Classification
Advanced Training: Distance-Invariant CNN with Sample Weighting
The Scientist's Toolkit: Research Reagent Solutions
Table 3: Essential Materials and Computational Tools for AI-Enhanced LIBS
| Item / Solution | Function in Experiment | Specification / Notes |
|---|---|---|
| Nd:YAG Laser | Generates plasma from the sample. | Typical specs: 1064 nm wavelength, 4-8 ns pulse width, 1-3 Hz repetition rate. Pulse energy must be stable and reproducible [81] [7]. |
| Spectrometer System | Detects plasma emission and records spectrum. | Multi-channel to cover a broad wavelength range (e.g., 240-850 nm). Requires high resolution and sensitivity [7]. |
| Certified Reference Materials | Calibration and validation of the LIBS system and AI model. | e.g., GBW series geochemical standards or known plastic resins. Critical for quantitative analysis and class definition [7]. |
| Python with Scikit-learn & TensorFlow/PyTorch | Platform for implementing ML algorithms and deep learning models. | Provides libraries for SVM, KNN, and building NNMLP/CNN models [81] [7]. |
| Uncertainty Quantification (UQ) Tools | Evaluates prediction reliability. | e.g., Monte Carlo Dropout. Helps identify where the model's predictions are less certain [83]. |
Comparative Analysis of Signal Enhancement Methodologies
Technical Support Center
Frequently Asked Questions (FAQs)
Q: What are the main causes of signal instability in LIBS analysis? A: LIBS signal instability stems from multiple factors including fluctuations in laser parameters (energy, beam profile), matrix effects where the sample's physical and chemical properties influence ablation efficiency, self-absorption effects where re-absorption of emitted light occurs, and variations in plasma characteristics (temperature and electron density) due to changing laser-sample interaction conditions [16] [63] [85].
Q: How can I quickly improve the signal-to-noise ratio in my LIBS setup without major hardware changes? A: Utilizing spatial confinement via an appropriately sized cavity or leveraging naturally formed laser ablation craters can significantly enhance signal stability. One study found stable plasma conditions within crater areas of 0.400 mm² to 0.443 mm² and depths of 0.357 mm to 0.412 mm, which significantly reduced the relative standard deviation (RSD) of spectral line intensity [63]. Additionally, ensuring proper sample preparation by removing surface contaminants like paint, rust, or oils is crucial for consistent results [86].
Q: My LIBS system will be used at varying distances. How can I mitigate the "distance effect"? A: The distance effect, where spectral profiles change with varying detection distances, can be addressed through computational approaches. Implement a deep convolutional neural network (CNN) model trained with multi-distance spectral data. Recent research shows that employing an optimized sample weighting strategy during CNN training can achieve testing accuracy up to 92.06% on eight-distance LIBS datasets, significantly outperforming models using equal-weight schemes [7].
Q: Are there cost-effective methods for real-time plasma monitoring and signal correction? A: Yes, dynamic vision sensors (DVS) offer a cost-effective solution (costing only a few thousand dollars) for real-time plasma monitoring. DVS captures plasma optical signals and extracts features like the number of events and plasma area, which characterize plasma temperature and total particle number density. The DVS-T1 correction model developed from this data has reduced signal RSD by up to 82.7% for carbon steel and brass samples [87].
Q: When should I consider arc discharge assistance for LIBS enhancement? A: Arc discharge-assisted LIBS (AD-LIBS) is particularly beneficial when working with lower laser energies or when enhanced detection sensitivity is required. This method features a simple design, low cost, and minimal safety concerns. Research demonstrates that AD-LIBS significantly improves spectral intensity and SNR in both nanosecond and femtosecond LIBS modes, with more pronounced SNR enhancement at lower energies in fs-LIBS [88].
Signal Enhancement Methodologies: Comparative Analysis
Table 1: Performance Comparison of Major LIBS Signal Enhancement Techniques
| Methodology | Key Mechanism | Signal Improvement | RSD Reduction | Implementation Complexity | Best Application Context |
|---|---|---|---|---|---|
| Arc Discharge (AD-LIBS) | Additional energy injection sustains plasma | Significant intensity enhancement | Quantitative data not provided | Medium (requires electrode setup) | Low-energy fs-LIBS; sensitivity-critical applications [88] |
| Spatial Confinement (Crater Method) | Shockwave reflection compresses plasma | Improved stability | Significant RSD reduction demonstrated | Low (uses natural ablation features) | Field applications where equipment simplicity is crucial [63] |
| Dynamic Vision Sensor (DVS) | Event-driven correction based on plasma morphology | Improved quantitative accuracy | 32.9%-82.7% reduction vs. original data | Medium (sensor integration + model) | Real-time correction; complex sample matrices [87] |
| Multi-Distance CNN with Weight Optimization | Distance-invariant feature learning through AI | 92.06% classification accuracy | 8.45 percentage point accuracy improvement vs. baseline | High (computational resources needed) | Planetary exploration; varying stand-off detection [7] |
| Handheld LIBS (Commercial) | Argon purge & optimized hardware | ~10 second analysis time | Managed via daily standardization | Low (commercial system) | Material verification; carbon detection in metals [86] |
Table 2: Plasma Characteristic Changes with Enhancement Methods
| Methodology | Effect on Plasma Temperature | Effect on Electron Density | Effect on Signal-to-Noise Ratio |
|---|---|---|---|
| Arc Discharge (ns & fs LIBS) | Increased with arc discharge applied; slightly higher in fs-LIBS | Increased with arc discharge applied | Significantly improved in both ns and fs LIBS modes [88] |
| Spatial Confinement | Increased temperature due to compressed plasma | Increased electron density due to higher collision frequency | Improved stability and intensity [63] |
| Dynamic Vision Sensor | Monitored via event count data | Characterized via FWHM of spectral lines | Correction model enhances effective SNR [87] |
Detailed Experimental Protocols
Protocol 1: Arc Discharge-Assisted LIBS (AD-LIBS)
Principle: Additional energy from an arc discharge sustains and re-heats the laser-produced plasma, enhancing spectral intensity and signal-to-noise ratio [88].
Materials:
- Pulsed laser (ns or fs capability)
- Arc discharge electrodes (simple design, low cost)
- High-voltage power supply for arc generation
- Spectrometer with appropriate temporal gating
- Sample mounting system
Methodology:
- Align the laser focusing system to ensure proper ablation of the target sample.
- Position arc discharge electrodes proximate to the expected plasma formation region.
- Synchronize the arc discharge to trigger shortly after laser ablation (typically microsecond delay).
- For ns-LIBS operations: Optimize laser energy between 50-100 mJ per pulse.
- For fs-LIBS operations: Lower energy regimes show more pronounced enhancement.
- Acquire spectra with appropriate gate delay and width settings for your spectrometer.
- Compare spectral intensity, plasma temperature, and electron density with and without arc discharge.
Expected Outcomes: Significant improvement in spectral intensity and SNR in both ns and fs LIBS modes, with more pronounced SNR enhancement at lower energies in fs-LIBS. Both electron density and plasma temperature will be higher when arc discharge is applied [88].
Protocol 2: Crater-Confined LIBS for Enhanced Stability
Principle: Utilizes ablation craters formed by successive laser pulses to naturally confine subsequent plasma, improving signal stability through shockwave reflection that compresses the plasma [63].
Materials:
- Nanosecond Nd:YAG laser (1064 nm wavelength)
- Digital delay generator
- Spectrometer with fiber optic coupling
- Laser confocal microscope for crater characterization
- Sample materials
Methodology:
- Focus the laser beam on the sample surface.
- Fire multiple laser pulses at the same location (typically 10-50 pulses depending on material).
- Use a laser confocal microscope to measure crater dimensions after specific pulse counts.
- Identify the pulse count that produces optimal crater dimensions (0.400-0.443 mm² area, 0.357-0.412 mm depth based on research).
- Calculate plasma temperature using multiple elemental spectral lines for reliability.
- Perform electron density calculations based on spectral data.
- Analyze the RSD of elemental spectral line intensities at different pulse counts.
Expected Outcomes: Significant reduction in the RSD of LIBS spectral line intensity within specified crater dimensions, indicating improved signal stability without additional laboratory equipment [63].
Protocol 3: DVS-Based Signal Correction
Principle: Uses a dynamic vision sensor to capture plasma morphology characteristics that correlate with plasma temperature and particle density, enabling event-driven signal correction [87].
Materials:
- Standard LIBS system (laser, spectrometer, delay generator)
- Dynamic vision sensor (DVS)
- Data acquisition system for synchronized collection
- Carbon steel and brass samples for validation
Methodology:
- Integrate the DVS into the LIBS setup with proper alignment to view the plasma region.
- Synchronize DVS data acquisition with laser firing.
- Capture event data from the DVS during plasma formation and evolution.
- Extract features from event data: number of events (correlates with plasma temperature) and plasma area (correlates with total particle number density).
- Measure FWHM of spectral lines to characterize electron density.
- Develop the DVS-T1 correction model using these parameters.
- Apply the model to correct spectral intensities for elements of interest.
- Validate using reference materials.
Expected Outcomes: Dramatic reduction in signal fluctuations (RSD reduced by 32.9%-82.7%) and improved quantitative analysis accuracy with R² values up to 0.999 for calibration curves [87].
Experimental Workflow Visualization
LIBS Enhancement Methodology Selection Workflow
DVS-Based Signal Correction Process
The Scientist's Toolkit: Essential Research Reagents & Materials
Table 3: Key Research Reagent Solutions for LIBS Enhancement Studies
| Item | Function/Purpose | Application Context | Specification Notes |
|---|---|---|---|
| Nd:YAG Laser | Plasma generation through ablation | Fundamental to all LIBS processes | 1064 nm wavelength, ns/fs pulse width, 1-10 Hz repetition rate [63] [87] |
| Arc Discharge Electrodes | Provides additional energy injection | AD-LIBS enhancement | Simple design, low cost, minimal safety concerns [88] |
| Dynamic Vision Sensor (DVS) | Captures plasma morphology in real-time | DVS-T1 correction method | High temporal resolution, event-based output, ~$1000-5000 cost [87] |
| Argon Purge Gas | Enhances signal sensitivity in handheld LIBS | Commercial handheld LIBS systems | Reduces atmospheric interference; cartridges last ~200 measurements [86] |
| Certified Reference Materials | Validation and calibration | Method development and verification | GBW series for geochemical samples; crucial for accuracy assessment [7] |
| Spatial Confinement Cavities | Plasma compression via shockwave reflection | Signal stability enhancement | Aluminum cavities (4mm diameter optimal); or natural ablation craters [63] |
| Digital Delay Generator | Precise timing control | Synchronization of laser, spectrometer, and accessories | 5 ps delay resolution; 8-channel capability for complex setups [63] [87] |
FAQs: Addressing Core Challenges in Multi-Distance LIBS
Q1: What is the "distance effect" in LIBS, and why is it a major challenge for analysis? The distance effect refers to the significant spectral profile discrepancies that occur even when the same target sample is analyzed by a fixed LIBS system at varying distances. Changes in detection distance alter key parameters including laser spot size and energy distribution, the geometric configuration of plasma generation zones, and plasma temperature and electron density. These collective variations cause intensity fluctuations in characteristic spectral lines, continuum background baseline shifts, and altered elemental peak intensity ratios. This effect weakens the performance of conventional chemometrics models, which typically require abundant LIBS data collected under identical experimental conditions for reliable results [89].
Q2: How does a Convolutional Neural Network (CNN) mitigate the need for explicit distance correction? Unlike traditional methodologies that require designing specific correction models for each element, a deep CNN can directly analyze LIBS multi-distance mixed spectra. CNNs inherently learn to extract robust, distance-invariant features from the raw spectral data through their convolutional layers. This eliminates the need for laborious, element-specific distance correction protocols, which lack a universal framework and are time-consuming to develop. A properly trained CNN model can achieve high classification accuracy on a multi-distance dataset without any pre-applied distance correction [89].
Q3: What are the limitations of a default equal-weight training scheme for a CNN on multi-distance data, and how can they be overcome? Employing a uniform sample weighting strategy during CNN training fails to account for the spectral feature disparities induced by varying distances. This can limit the model's ultimate performance. An optimized strategy involves tailoring a specific weight value for every training spectral sample based on its corresponding detection distance. This approach has been shown to improve testing accuracy significantly (e.g., by over 8 percentage points), alongside increases in precision, recall, and F1-score, without substantially increasing the training time per epoch [89].
Q4: What are the key advantages of using CNNs over other neural network models like BPNN for LIBS analysis? CNNs offer several distinct advantages for LIBS analysis:
- Feature Extraction: They automatically extract relevant features from the raw or minimally pre-processed spectra, reducing the need for manual feature engineering and complex pre-processing steps like principal component analysis [72] [73].
- Efficiency and Robustness: The principle of weight sharing in convolutional layers drastically reduces the number of parameters that need to be trained compared to fully-connected BPNN, lowering training difficulty and time. This also contributes to better generalization and robustness against spectral noise, peak shifts, and line shape distortions [72] [73].
- Handling Complex Data: CNNs are particularly suited for analyzing spectra with high complexity, large interference noise, and for the simultaneous prediction of multiple chemical components [72].
Troubleshooting Guides
Table 1: Troubleshooting Common Issues in Multi-Distance LIBS-CNN Experiments
| Problem Symptom | Potential Root Cause | Recommended Solution |
|---|---|---|
| Low model accuracy on test distance data | Overfitting to the training set distances; poor generalization. | Implement a sample weight optimization strategy that assigns tailored weights based on detection distance. Incorporate data augmentation and Dropout regularization techniques during training [89] [90]. |
| High training loss and slow convergence | Inadequate network architecture; suboptimal learning rate; poorly prepared input data. | Validate the CNN architecture (e.g., number of layers/filters). Ensure input spectra are consistently pre-processed (e.g., normalized). Adjust hyperparameters and consider using a adaptive learning rate optimizer [72] [73]. |
| Poor performance for specific elements | Strong matrix effects from the sample background influencing elemental emission lines. | Employ a pre-classification strategy. Use a model like kNN or SVM to first classify the sample's matrix, then use a dedicated, matrix-specific CNN quantitative model for analysis [91]. |
| Inconsistent plasma generation at different distances | Variations in laser energy density on target due to defocusing. | Systematically optimize laser parameters (e.g., pulse energy, focus) using Design of Experiments (DOE) approaches for different distance ranges to maintain plasma stability [92]. |
Table 2: Essential Research Reagent Solutions & Materials
| Item Name | Function / Explanation | Example Specification / Note |
|---|---|---|
| Certified Reference Materials (CRMs) | Used for calibration, validation, and quality control of the LIBS-CNN model. Provide known elemental concentrations to train and test the analytical accuracy. | Chinese national reference materials (GBW series) are commonly used. Sample types include clay, basalt, shale, and various sediments [89]. |
| Nd:YAG Laser | The excitation source that generates the laser pulse to ablate the sample and create plasma. | Typical parameters: 1064 nm wavelength, 4-10 ns pulse width, pulse energy up to several hundred mJ, 1-10 Hz repetition rate [93] [89]. |
| Spectrometer System | Captures the light emitted by the cooling plasma and disperses it into a spectrum for analysis. | A multi-channel spectrometer is often used to cover a broad wavelength range (e.g., 190-850 nm) with adequate resolution [89]. |
| Powder Pelletizing Press | Prepares solid and powdered samples (like soils and rocks) into homogeneous, flat-surface tablets. | This ensures consistent laser-sample interaction and improves spectral reproducibility. Pressures of 6-20 MPa are typical [90]. |
| Argon Gas Purging System | Creates an inert atmosphere around the plasma. | Enhances signal intensity by reducing the quenching effect of atmospheric oxygen and nitrogen, particularly for elements like carbon [45]. |
Experimental Protocols
Protocol 1: Building a Multi-Distance LIBS Dataset for CNN Training
This protocol is adapted from methodologies used for planetary exploration instrumentation like MarSCoDe [89].
Sample Preparation:
- Select a set of certified reference materials (CRMs) covering the expected sample types.
- For solid powders, use a standardized compression molding process. Weigh a consistent mass (e.g., 2.0g) and press into tablets at a defined pressure (e.g., 8 MPa) to ensure homogeneity and surface uniformity [90].
LIBS Data Acquisition:
- Use a LIBS instrument where the detection distance can be precisely controlled and varied. The setup should include a pulsed laser (e.g., Nd:YAG, 1064 nm) and a spectrometer with a broad spectral range.
- Define a set of distinct detection distances (e.g., from 1.6 m to 7.0 m) to simulate field conditions.
- For each sample at each distance, collect multiple spectra from different spots on the pellet surface (e.g., 3-5 spots) with multiple laser pulses per spot (e.g., 4 pulses) to account for shot-to-shot variability. The final dataset for each sample-distance combination should be an aggregate of these measurements.
Data Preprocessing & Labeling:
- Assemble the raw spectral data, which typically consists of intensity values across thousands of wavelength pixels.
- Normalize the spectra to mitigate the effects of pulse energy fluctuation. Common methods include vector normalization or normalization to the total spectral intensity.
- Assign each spectrum a label corresponding to its sample class (for classification) or elemental concentration values (for quantification), as defined by the CRM certificates.
Protocol 2: Implementing a Spectral Sample Weight Optimization Strategy for CNN Training
This protocol details the advanced weighting strategy proven to enhance model performance on multi-distance data [89].
Baseline Model Training:
- Begin by training your chosen CNN architecture on the multi-distance dataset using a default equal-weight scheme for all training samples. This establishes a baseline performance level.
Weight Calculation:
- Develop a function to assign a non-uniform weight to each spectral sample in the training set. The weight should be inversely proportional to the prevalence or representation of its corresponding detection distance in the overall training dataset. The goal is to prevent the model from being biased towards the most common distances.
Optimized Model Training:
- Retrain the CNN model using the same architecture and hyperparameters, but incorporate the custom sample weights into the loss function. This forces the model to pay more attention to under-represented distances during the learning process.
Performance Evaluation:
- Compare the performance of the optimized-weight model against the baseline equal-weight model on a held-out test set. Use metrics such as classification accuracy, precision, recall, and F1-score to validate the improvement.
Workflow Visualization
Diagram 1: Multi-Distance LIBS-CNN Analysis Workflow
Diagram 2: CNN Architecture for LIBS Spectral Analysis
Conclusion
Optimizing laser parameters is paramount for unlocking the full potential of LIBS in biomedical research. The synergy between advanced laser technology, particularly the robustness of femtosecond systems and the classification accuracy of nanosecond lasers, and sophisticated AI data analysis creates a powerful toolkit for drug development and clinical diagnostics. Future directions point toward the increased use of real-time adaptive control systems, hybrid analytical techniques to compensate for matrix effects, and the development of robust, multi-distance classification models. These advancements promise to solidify LIBS as an indispensable tool for early cancer detection, precise tissue analysis, and personalized medicine, ultimately leading to improved patient diagnostics and therapeutic outcomes.
References
- 1. Laser Induced Breakdown Spectroscopy (LIBS) [https://integratedoptics.com/libs]
- 2. The effect of ultrafast laser wavelength on ablation ... [https://pmc.ncbi.nlm.nih.gov/articles/PMC4668957/]
- 3. Laser-Induced Breakdown Spectroscopy [https://pcrf.princeton.edu/capabilities/diagnostics/laser-induced-breakdown-spectroscopy/]
- 4. Insights into nanoparticle enhanced laser induced ... [https://www.sciencedirect.com/science/article/abs/pii/S0584854725002435]
- 5. Advancing Laser-Ablation ICP-MS [https://www.spectroscopyonline.com/view/advancing-laser-ablation-icp-ms]
- 6. An Introduction To Laser Induced Breakdown ... [https://andor.oxinst.com/learning/view/article/libs-an-overview-of-andors-solutions-for-libs]
- 7. A multi-distance laser-induced breakdown spectroscopy ... [https://www.nature.com/articles/s41598-025-24644-x]
- 8. Laser Induced Breakdown Spectroscopy (LIBS) in Biomedical ... [https://www.rpmclasers.com/blog/laser-induced-breakdown-spectroscopy-libs-in-biomedical-applications/]
- 9. Comparative study of ablation processes using ... [https://www.sciencedirect.com/science/article/pii/S2211379725003092]
- 10. Femtosecond vs. Nanosecond Laser Pulse Duration for ... [https://www.spectroscopyonline.com/view/femtosecond-vs-nanosecond-laser-pulse-duration-laser-ablation-chemical-analysis]
- 11. Spatio-temporal evolution of laser W ablation under... plasma [https://pubs.rsc.org/en/content/articlelanding/2025/ja/d4ja00326h]
- 12. Seven Common Errors to Avoid in LIBS Analysis [https://www.spectroscopyonline.com/view/seven-common-errors-avoid-libs-analysis]
- 13. Comparative study of ablation processes using ... [https://ui.adsabs.harvard.edu/abs/2025ResPh..7608415W/abstract]
- 14. Dual-comb spectroscopy of laser -induced plasmas [https://www.nature.com/articles/s41467-018-03703-0?error=cookies_not_supported&code=80229fd6-95f6-49d8-8c54-70217087a97c]
- 15. Dynamic vision sensor enhanced laser-induced ... [https://pubs.rsc.org/en/content/articlelanding/2025/ja/d5ja00318k]
- 16. Methods for optimization of the original signal in laser ... [https://www.sciencedirect.com/science/article/abs/pii/S0584854724001265]
- 17. Study of the effects of detection times in laser-induced ... [https://www.sciencedirect.com/science/article/abs/pii/S0584854722000532]
- 18. What is LIBS? [https://appliedspectra.com/technology/libs.html]
- 19. Lifetime, size and emission of laser-induced plasmas for in- ... [https://www.sciencedirect.com/science/article/pii/S0019103524004366]
- 20. LIBS Basics, Part III: Deriving the Analytical Answer [https://www.spectroscopyonline.com/view/libs-basics-part-iii-deriving-analytical-answer-calibrated-solutions-libs]
- 21. Laser-Induced Breakdown Spectroscopy for Determination ... [https://www.mdpi.com/2076-3417/10/14/4973]
- 22. Key Challenges in LIBS—and How to Solve Them [https://www.spectroscopyonline.com/view/key-challenges-libs-and-how-solve-them]
- 23. Acoustic signal in overcoming the matrix effect in LIBS [https://www.sciencedirect.com/science/article/abs/pii/S0584854725000254]
- 24. 利用基于基质的校准方法,结合微X射线荧光光谱技术 [https://www.ebiotrade.com/newsf/2025-11/20251114004114573.htm]
- 25. 激光诱导击穿光谱技术在测量钼片上超薄硼膜厚度中的应用 [https://www.ebiotrade.com/newsf/2025-11/20251127011008034.htm]
- 26. Vibrational emission analysis of the CN molecules in laser-induced breakdown spectroscopy of organic compounds - ScienceDirect [https://www.sciencedirect.com/science/article/abs/pii/S0584854713002279]
- 27. CN and C2 formation mechanisms in fs-laser induced breakdown of nitromethane in Ar or N2 atmosphere - ScienceDirect [https://www.sciencedirect.com/science/article/abs/pii/S0304389420303848]
- 28. 基于等离子体空间调制的激光诱导击穿光谱中自吸收的减少 [https://www.ebiotrade.com/newsf/2025-11/20251119003736818.htm]
- 29. Identification of tumor tissue in thin pathological samples ... [https://www.nature.com/articles/s41598-023-36155-8]
- 30. From Fundamentals of Laser-Induced Breakdown ... [https://pmc.ncbi.nlm.nih.gov/articles/PMC12608634/]
- 31. Application of Laser-Induced Breakdown Spectroscopy ... [https://pmc.ncbi.nlm.nih.gov/articles/PMC9321926/]
- 32. Elemental Imaging of Biological Samples Using J200 ... [https://appliedspectra.com/quantitative-elemental-imaging-of-biological-samples-using-j200-tandem-la-libs.html]
- 33. From Fundamentals of Laser-Induced Breakdown ... [https://www.mdpi.com/1420-3049/30/21/4176]
- 34. Enhanced laser-induced breakdown spectroscopy by pre ... [https://ui.adsabs.harvard.edu/abs/2025JOpt..tmp..242A/abstract]
- 35. Enhancing cancer detection in medical imaging through ... [https://www.sciencedirect.com/science/article/pii/S1110866525001446]
- 36. Assessing the Sensitivity and Efficiency of Laser-Induced ... [https://www.mdpi.com/1424-8220/25/8/2434]
- 37. A new method for calibration-free analysis by Laser- ... [https://www.sciencedirect.com/science/article/pii/S0584854724000478]
- 38. ‐induced breakdown spectroscopy/ Laser ablation coupled to... laser [https://pmc.ncbi.nlm.nih.gov/articles/PMC12046102/]
- 39. Optimization of laser-induced breakdown spectroscopy for ... [https://opg.optica.org/oe/fulltext.cfm?uri=oe-33-16-34893]
- 40. Calculating plasma for Zn target using parameters -induced... laser [https://link.springer.com/article/10.1007/s12596-025-02644-4]
- 41. External electric field assisted laser -induced plasma and bubble... [https://pubs.rsc.org/en/content/articlelanding/2025/ja/d4ja00163j]
- 42. Quantitative laser-induced breakdown spectroscopy ... [https://www.sciencedirect.com/science/article/abs/pii/S0584854701001987]
- 43. 激光诱导击穿光谱增强机制及技术研究进展 [https://www.chineseoptics.net.cn/article/id/9526]
- 44. Lasers for LIBS [https://hubner-photonics.com/applications/lasers-for-libs/]
- 45. 激光诱导击穿光谱技术(LIBS) [https://www.malvernpanalytical.com.cn/products/technology/laser-induced-breakdown-spectroscopy]
- 46. Optimization of laser-induced breakdown spectroscopy ... [https://www.sciencedirect.com/science/article/pii/S0584854721000021]
- 47. Parameter optimization of the spectral emission of laser- ... [https://pubs.rsc.org/en/content/articlelanding/2021/ja/d1ja00009h]
- 48. Numerical simulation of spatial and temporal evolution of ... [https://www.sciencedirect.com/science/article/abs/pii/S0584854725002265]
- 49. Improving the Detection Sensitivity for Laser-Induced ... [https://www.frontiersin.org/journals/physics/articles/10.3389/fphy.2020.00068/full]
- 50. Residual compensation algorithm for machine learning ... [https://opg.optica.org/ol/abstract.cfm?uri=ol-50-17-5354]
- 51. Improving signal stability and analysis accuracy in laser ... [https://www.sciencedirect.com/science/article/abs/pii/S0584854723002057]
- 52. Long-term reproducibility improvement of LIBS quantitative ... [https://www.sciencedirect.com/science/article/abs/pii/S0039914024016114]
- 53. Long-term reproducibility detection method for quantitative ... [https://pubs.rsc.org/en/content/articlelanding/2023/ja/d3ja00275f]
- 54. Long-term reproducibility improvement of LIBS quantitative ... [https://pubmed.ncbi.nlm.nih.gov/39577385/]
- 55. Improvement of Laser-Induced Breakdown Spectroscopy ... [https://www.mdpi.com/2227-9040/12/12/277]
- 56. Investigating laser-induced bond breaking in high-density ... [https://pubs.rsc.org/en/content/articlehtml/2025/ra/d5ra02920a]
- 57. Study on the influence of molecular structures and laser ... [https://www.sciencedirect.com/science/article/abs/pii/S0584854725002654]
- 58. Duration of an intense laser pulse can determine the ... [https://www.nature.com/articles/srep12877]
- 59. Enhancing Infrared Laser Dissociation of Molecules with ... [https://arxiv.org/html/2511.17278v1]
- 60. Optimizing laser cladding process parameters for ... [https://www.sciencedirect.com/science/article/abs/pii/S0257897224011678]
- 61. Advanced Parameter Optimization for Laser Engraving ... [https://www.mdpi.com/2076-3417/15/22/11925]
- 62. 碳纤维复合材料激光热-机械剥蚀机制研究-中国光学期刊网 [https://www.opticsjournal.net/Articles/OJcff4caf2445c94f0/FullText]
- 63. Research on Enhancement of LIBS Signal Stability Through the Selection of Spectral Lines Based on Plasma Characteristic Parameters [https://www.mdpi.com/2227-9040/13/2/42]
- 64. Study on the laser ablation behavior of carbon fiber ... [https://www.nature.com/articles/s41598-025-18643-1]
- 65. Laser Ablation Mechanism and Performance of Carbon Fiber ... [https://pmc.ncbi.nlm.nih.gov/articles/PMC9269289/]
- 66. Adaptive control [https://en.wikipedia.org/wiki/Adaptive_control]
- 67. Optimization of laser-induced breakdown spectroscopy ... [https://www.sciencedirect.com/science/article/abs/pii/S0584854721000021]
- 68. A coordinated predictive scheduling and real-time adaptive ... [https://www.sciencedirect.com/science/article/pii/S0960148124021153]
- 69. Stand-off laser-induced breakdown spectroscopy of ... [https://www.sciencedirect.com/science/article/abs/pii/S058485471400113X]
- 70. Current Status of Standoff LIBS Security Applications at the ... [https://www.spectroscopyonline.com/view/current-status-standoff-libs-security-applications-united-states-army-research-laboratory]
- 71. Standoff laser-induced breakdown spectroscopy sensor [https://www.sciencedirect.com/science/article/abs/pii/S2950631X25000139]
- 72. 基于深度学习卷积神经网络的libs多成分定量反演方法 [https://patents.google.com/patent/CN110705372B/zh]
- 73. 人工神经网络在激光诱导击穿光谱数据分析中的应用进展 [https://www.opticsjournal.net/Articles/OJe948f30274e3d5f8/FullText]
- 74. 光谱预处理方法选择研究 [http://dianda.cqvip.com/Qikan/Article/Detail?id=7002835652&from=Qikan_Article_Detail]
- 75. Laser-Based Characterization and Classification of ... [https://www.mdpi.com/1996-1944/18/9/2092]
- 76. 激光切割中工艺参数的混合机制与数据驱动优化方法 [https://www.ebiotrade.com/newsf/2025-10/20251011112018086.htm]
- 77. 一种基于激光清洗参数优化的激光控制方法及系统 [https://patents.google.com/patent/CN113263027B/zh]
- 78. LIBS Basics, Part I: Measurement Physics and ... [https://www.spectroscopyonline.com/view/libs-basics-part-i-measurement-physics-and-implementation]
- 79. Experimental Investigation of the Self-Absorption Effect in ... [https://www.spectroscopyonline.com/view/experimental-investigation-of-the-self-absorption-effect-in-laser-induced-breakdown-spectroscopy-based-on-fiber-laser-ablation]
- 80. Machine learning-assisted laser-induced breakdown ... [https://pubs.rsc.org/en/content/articlehtml/2025/ja/d4ja00437j]
- 81. AI-enabled spectral classification of plastic resins from E- ... [https://www.sciencedirect.com/science/article/pii/S0921344925005373]
- 82. 基于人工智能的故障处理方法、装置、电子设备及介质 [https://patents.google.com/patent/CN114201328B/zh]
- 83. [论文审查] Machine Learning-Integrated Hybrid Fluid- ... [https://www.themoonlight.io/zh/review/machine-learning-integrated-hybrid-fluid-kinetic-framework-for-quantum-electrodynamic-laser-plasma-simulations]
- 84. Conventional versus AI-based spectral data processing ... [https://pubs.rsc.org/en/content/articlelanding/2025/ay/d5ay00027k]
- 85. LIBS: Fundamentals, Benefits, and Advice to New Users [https://www.spectroscopyonline.com/view/libs-fundamentals-benefits-and-advice-new-users]
- 86. FAQs - Niton Apollo Handheld LIBS Analyzer [https://www.thermofisher.com/us/en/home/industrial/spectroscopy-elemental-isotope-analysis/portable-analysis-material-id/industrial-elemental-radiation-solutions/niton-apollo-handheld-libs-analyzer-faqs.html]
- 87. An event-driven correction method for enhancing signal ... [https://www.sciencedirect.com/science/article/abs/pii/S0263224125021414]
- 88. Spectral signal enhancement in laser-induced breakdown ... [https://pubs.rsc.org/en/content/articlelanding/2025/ja/d5ja00222b]
- 89. A multi-distance laser-induced breakdown spectroscopy ... [https://pmc.ncbi.nlm.nih.gov/articles/PMC12630780/]
- 90. CN109975273A - 一种基于激光诱导击穿光谱的岩石分类方法 [https://patents.google.com/patent/CN109975273A/zh]
- 91. 基于预分类策略的激光诱导击穿光谱技术用于岩石样品定量分析 [https://www.cgsjournals.com/article/doi/10.15898/j.ykcs.202212190234]
- 92. Optimization of laser-induced breakdown spectroscopy ... [https://ui.adsabs.harvard.edu/abs/2021AcSpB.17706066D/abstract]
- 93. 激光诱导击穿光谱技术在气体检测中的研究综述-中国光学期刊网 [https://www.opticsjournal.net/Articles/OJ4451ef399c54930a/FullText]