Optimizing Your Lab's Sustainability: A Practical Guide to Reducing Analytical Eco-Scale Penalty Points
This article provides a comprehensive guide for researchers and pharmaceutical development professionals seeking to improve the environmental footprint of their analytical methods.
Optimizing Your Lab's Sustainability: A Practical Guide to Reducing Analytical Eco-Scale Penalty Points
Abstract
This article provides a comprehensive guide for researchers and pharmaceutical development professionals seeking to improve the environmental footprint of their analytical methods. Focusing on the Analytical Eco-Scale (AES) metric, we explore its foundational principles and scoring methodology. The content delivers actionable, step-by-step strategies for identifying and troubleshooting high-penalty areas, from hazardous reagent substitution and waste minimization to energy consumption optimization. Furthermore, we demonstrate how to validate improvements using complementary green assessment tools like AGREE and BAGI, ensuring that enhanced sustainability does not compromise analytical performance. This practical framework supports the industry's drive towards greener laboratories and sustainable drug development.
Understanding the Analytical Eco-Scale: Principles, Penalties, and Pharmaceutical Impact
Core Principles of the Analytical Eco-Scale (AES) Scoring System
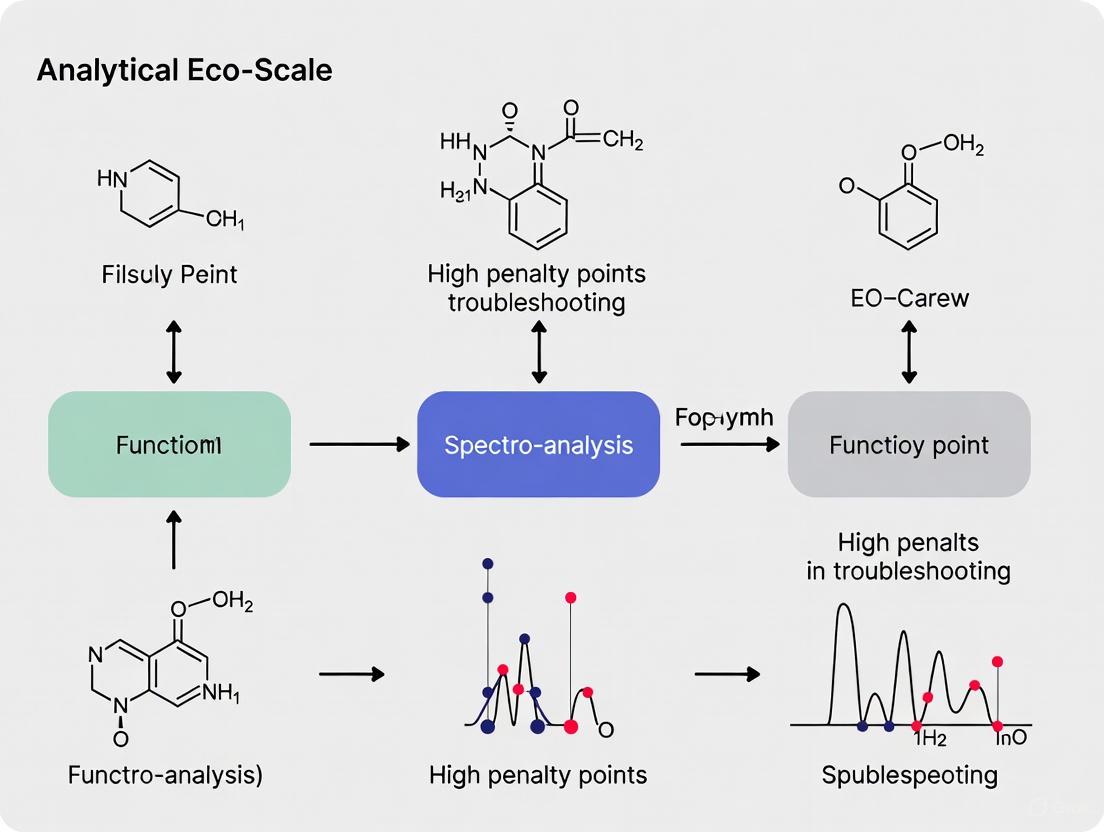
The Analytical Eco-Scale (AES) is a semi-quantitative tool for promoting sustainable chemistry by quantifying and comparing the environmental impacts of different analytical processes [1]. It helps researchers identify areas for optimization to reduce harmful emissions, waste, and resource consumption [1]. This scoring system provides a transparent and straightforward method for evaluating the greenness of analytical procedures, making it particularly valuable for comparing methods and driving environmental improvements in laboratory practices [2] [3].
AES Scoring System: A Detailed Breakdown
The Analytical Eco-Scale methodology assigns penalty points to various non-green aspects of an analytical method. The calculation begins with a base score of 100 points, from which penalties are subtracted based on the quantities of hazardous reagents used, energy consumption, waste generation, and other environmental and safety parameters [2] [3].
Penalty Points Structure
Table 1: Analytical Eco-Scale Penalty Points Structure
| Parameter Category | Specific Criteria | Penalty Points | Remarks |
|---|---|---|---|
| Reagents | Hazardous substances (>100 mL) [2] | Penalty applied [3] | Amount and toxicity determine penalty |
| Particularly hazardous reagents [4] | Penalty applied [4] | Based on mass/volume used | |
| Energy Consumption | High energy demand [2] | Penalty applied [2] | Points subtracted for non-green attributes |
| Waste Generation | >10 mL per sample [2] | Penalty applied [2] | Includes management and disposal |
| Special disposal regulations [4] | Penalty applied [4] | For plastic, packaging, glassware | |
| Other Factors | Operator safety & vapor emissions [2] | Penalty applied [2] | General safety considerations |
Final Score Interpretation
Table 2: Analytical Eco-Scale Score Interpretation
| Final Score | Greenness Level | Method Evaluation |
|---|---|---|
| >75 | Excellent green analysis | Environmentally friendly method |
| 50-75 | Acceptable green analysis | Moderate environmental impact |
| <50 | Insufficient green analysis | Significant environmental concerns |
Frequently Asked Questions (FAQs)
What is the fundamental principle behind the Analytical Eco-Scale scoring system?
The AES is based on a penalty point system that starts with a perfect base score of 100 [2]. Points are subtracted for each parameter that deviates from ideal green conditions, including the use of hazardous chemicals, excessive energy consumption, and waste generation [2] [3]. The final score provides a quantitative measure of the method's environmental friendliness, with higher scores indicating greener analytical procedures.
How do I calculate penalty points for reagent hazard and quantity?
While exact penalty values for specific reagents are not detailed in the available literature, the AES applies penalties based on both the amount and environmental impact of reagents used [4] [3]. You should assign higher penalties to reagents classified as particularly hazardous and to methods using larger volumes of such reagents [4]. The total penalty increases with both the volume used and the toxicity level of the chemicals.
What are the most common causes of high penalty points in AES assessments?
The most significant penalties typically result from:
- Using large volumes of organic solvents (>10 mL per sample) [2]
- Employing toxic and flammable solvents [2]
- Generating substantial waste without proper treatment strategies [2]
- High energy consumption without using renewable sources [2]
- Lack of operator safety measures and vapor emission controls [2]
How can I improve a method with an insufficient AES score (<50)?
To improve your AES score, focus on:
- Reagent substitution: Replace hazardous solvents with safer alternatives like ionic liquids (IL) or deep eutectic solvents (DES) [3]
- Method miniaturization: Reduce solvent consumption to less than 10 mL per sample [2]
- Waste management: Implement recycling or treatment procedures for generated waste [2]
- Energy optimization: Use energy-efficient equipment and renewable energy sources where possible [4]
How does AES compare to other green assessment tools like GAPI or AGREE?
Unlike GAPI's pictogram approach or AGREE's circular diagram, AES provides a straightforward numerical score [2]. While GAPI and AGREE offer more visual representations of greenness, AES's semi-quantitative nature makes it easier for direct comparison between methods [3]. For a comprehensive evaluation, researchers are increasingly using multiple assessment tools simultaneously to compensate for the limitations of individual metrics [4].
Troubleshooting High Penalty Points
Problem: Excessive Penalties from Hazardous Reagents
Solution: Implement green chemistry principles by replacing toxic reagents with safer alternatives.
- Experiment Protocol: Systematically evaluate substitute reagents using the following workflow:
Problem: High Energy Consumption Penalties
Solution: Optimize equipment usage and implement energy-saving protocols.
- Detailed Methodology:
- Direct Measurement: Use a wattmeter to measure actual energy consumption of specific instruments during complete analytical cycles [4]
- Process Mapping: Document energy-intensive steps in your analytical procedure (e.g., lengthy extraction, high-temperature incubation)
- Parameter Optimization: Systematically reduce temperatures, shorten times, or eliminate unnecessary heating/cooling cycles
- Equipment Sharing: Coordinate with other researchers to maximize instrument utilization and reduce per-sample energy footprint
Problem: Significant Waste Generation Penalties
Solution: Implement waste reduction strategies and proper disposal protocols.
- Experiment Protocol:
- Waste Audit: Quantify total mass/volume of waste generated per analysis, including preparation reagents, calibration materials, and post-analysis waste [4]
- Miniaturization: Scale down method volumes - transition from macroscale to microextraction techniques consuming <10 mL per sample [2]
- Recycling Implementation: Establish procedures for solvent recovery and reuse where analytically feasible
- Waste Segregation: Separate hazardous from non-hazardous waste to reduce special disposal volumes [4]
Research Reagent Solutions
Table 3: Green Alternatives for Common Analytical Reagents
| Traditional Reagent | Green Alternative | Function | Environmental Benefit |
|---|---|---|---|
| Acetonitrile (ACN) | Methanol [1] | Mobile phase in HPLC | Reduced toxicity and environmental impact |
| Chloroform | Ionic Liquids (IL) [3] | Extraction solvent | Biodegradable, recyclable options |
| Traditional solvents | Deep Eutectic Solvents (DES) [3] | Sample preparation | Low toxicity, renewable materials |
| Hazardous catalysts | Bio-based reagents [3] | Reaction catalysis | Reduced waste, safer handling |
Best Practices for AES Implementation
Rule 1: Use Quantitative, Empirical Data
Instead of relying solely on estimates, directly measure key parameters including:
- Electricity consumption using a wattmeter for specific instruments [4]
- Exact volumes of reagents and waste generated [4]
- Carbon footprint calculations based on actual energy usage and local emissivity data (gCO2 kW−1h−1) [4]
Rule 2: Combine AES with Other Assessment Tools
Since no single metric provides a complete picture, supplement AES evaluation with:
- AGREE for comprehensive coverage of the 12 principles of green analytical chemistry [2]
- GAPI for visual identification of high-impact stages within a method [2]
- BAGI for assessing practical applicability and throughput [1]
Rule 3: Transparent Reporting
Document all assumptions, measurement methods, and calculation parameters to ensure:
- Reproducibility of your assessment by other researchers
- Accurate comparison between different analytical methods
- Identification of specific areas for greenness improvement
Advanced Troubleshooting Workflow
For methods with persistently low AES scores, implement this comprehensive optimization approach:
By systematically addressing each component of the Analytical Eco-Scale assessment, researchers can significantly improve the environmental profile of their analytical methods while maintaining scientific validity and practical utility.
Troubleshooting Guides
Guide to Troubleshooting High Penalty Points from Hazardous Reagents
Problem: Your Analytical Eco-Scale score is penalized due to the use of hazardous reagents.
Solution: Implement a systematic approach to replace or minimize hazardous substances.
- Issue: Reagents with high toxicity.
- Troubleshooting Steps:
- Consult Hazard Pictograms: Identify reagents classified as Toxic (T) or Extremely Toxic (T+), which carry penalty points of 5 and 10, respectively [5].
- Research Safer Alternatives: Investigate bio-based reagents, less toxic catalysts, or alternative synthetic pathways that avoid hazardous substances [2].
- Validate Method Performance: Ensure the alternative reagent does not compromise the method's accuracy, precision, or detection limits.
- Troubleshooting Steps:
- Issue: Reagents that are dangerous for the environment.
- Troubleshooting Steps:
- Check for Environmental Hazard Symbol: Reagents labeled as dangerous for the environment (N) incur a 5-point penalty [5].
- Avoid PBT Chemicals: Replace reagents listed as persistent, bioaccumulative, and toxic (PBT) [6].
- Utilize Green Solvent Selection Guides: Follow established guides to choose environmentally benign solvents.
- Troubleshooting Steps:
- Issue: Use of flammable or explosive materials.
- Troubleshooting Steps:
- Identify Hazard Symbols: Reagents marked Highly Flammable (F) or Explosive (E) are penalized 5 points; Extremely Flammable (F+) is penalized 10 points [5].
- Consider Physical Form: Switching to a less volatile or more stable form of a reagent can mitigate physical hazards.
- Explore Aqueous Systems: Where possible, replace organic solvents with aqueous solutions to reduce flammability risk.
- Troubleshooting Steps:
Guide to Troubleshooting High Penalty Points from Energy Consumption
Problem: Your analytical method consumes excessive energy, leading to a lower Eco-Scale score.
Solution: Optimize instrument parameters and explore ambient or low-energy methodologies.
- Issue: High energy consumption from lengthy analysis times.
- Troubleshooting Steps:
- Benchmark Energy Use: The ideal green analysis consumes less than 0.1 kWh per sample [6]. Calculate your method's energy use (instrument power in kW × run time in hours ÷ number of samples).
- Optimize Chromatographic Methods: Shorten run times by using shorter columns, faster gradients, or columns with smaller particle sizes [7].
- Increase Sample Throughput: Use autosamplers to run methods outside of peak working hours or develop methods that analyze multiple samples simultaneously.
- Troubleshooting Steps:
- Issue: Energy-intensive sample preparation steps.
- Troubleshooting Steps:
- Eliminate Heating/Cooling Steps: Operations like cooling below 0°C can incur a 5-point penalty [5]. Use room-temperature protocols where feasible.
- Adopt Miniaturized Techniques: Methods like microextraction often require less or no energy for heating or cooling [2].
- Avoid Unconventional Techniques: Techniques requiring microwave or ultrasound activation may add penalty points [5]. Evaluate if conventional alternatives are sufficient.
- Troubleshooting Steps:
Guide to Troubleshooting High Penalty Points from Waste Generation
Problem: The waste generated by your analytical procedure is reducing the Eco-Scale score.
Solution: Focus on waste prevention, miniaturization, and proper treatment.
- Issue: Total waste volume exceeds acceptable limits.
- Troubleshooting Steps:
- Quantify Waste: The ideal green analysis produces no waste, while a common benchmark is to stay below 50 g of waste per analytical run [6].
- Implement Miniaturization: Reduce the scale of your analysis. Using smaller sample volumes and micro-extraction techniques can drastically cut solvent consumption and waste [2] [7]. Aim for solvent consumption below 10 mL per sample [2].
- Solvent and Reagent Recovery: Implement procedures to recover and purify solvents for reuse where possible.
- Troubleshooting Steps:
- Issue: Waste is hazardous and requires special disposal.
- Troubleshooting Steps:
- On-line Decontamination: Integrate steps for on-line recycling, degradation, or passivation of wastes within the analytical process [8].
- Neutralization: If waste is corrosive (pH < 2 or > 12), consider neutralization steps to reduce its environmental impact [6].
- Replace Hazardous Components: The most effective strategy is to replace the source of hazardous waste with safer alternatives.
- Troubleshooting Steps:
The following workflow outlines a systematic strategy for addressing high penalty points in your Analytical Eco-Scale assessment.
Frequently Asked Questions (FAQs)
Q1: What is the Analytical Eco-Scale, and how is the score calculated? The Analytical Eco-Scale is a semi-quantitative tool to evaluate the greenness of analytical procedures. It starts with a base score of 100 points, representing an ideal green analysis. Penalty points are then subtracted for non-ideal parameters related to reagents, energy consumption, and waste generation. The final score is calculated as: Eco-Scale = 100 - sum of all penalty points [8] [5] [6].
Q2: What is considered a "good" Eco-Scale score? Scores above 75 are considered excellent green methods. Scores below 50 are generally regarded as unacceptable from an environmental perspective [7]. A higher score indicates a greener analytical method.
Q3: How are penalty points for hazardous reagents assigned? Penalties are based on the type and quantity of hazardous substances used. The penalty points for reagent hazards are [5]:
- 10 points: Extremely Toxic (T+), Extremely Flammable (F+), Explosive (E)
- 5 points: Toxic (T), Highly Flammable (F), Dangerous for the Environment (N)
Q4: My method requires a liquid-liquid extraction step. How many penalty points will this add? Liquid-liquid extraction typically incurs a 3-point penalty in the "Workup and Purification" category [5]. You can mitigate this by exploring alternative, greener sample preparation techniques like solid-phase microextraction (SPME).
Q5: Besides the Analytical Eco-Scale, what other tools can I use to assess my method's greenness? Several other metrics exist, each with strengths and weaknesses. Common tools include [2] [6]:
- NEMI: A simple pictogram with four criteria.
- GAPI: A comprehensive, color-coded pictogram for the entire analytical process.
- AGREE: Provides a unified score (0-1) based on the 12 principles of Green Analytical Chemistry.
- AGREEprep: Specifically designed for evaluating sample preparation steps.
Q6: How can I reduce penalty points from my HPLC method? Key strategies include [9]:
- Replace solvent systems: Use ethanol or water instead of acetonitrile or methanol in the mobile phase.
- Shorten run time: Optimize gradients and use shorter or monolithic columns to reduce solvent consumption and energy use.
- Miniaturize: Use UPLC or HPLC systems that operate at lower flow rates.
The following tables summarize the key penalty point criteria and scoring benchmarks for the Analytical Eco-Scale.
Table 1: Penalty Points for Reagent Hazards and Technical Setup
| Category | Parameter | Penalty Points |
|---|---|---|
| Reagent Hazards [5] | Toxic (T) / Flammable (F) / Dangerous for environment (N) | 5 |
| Extremely Toxic (T+) / Extremely Flammable (F+) | 10 | |
| Explosive (E) | 10 | |
| Technical Setup [5] | Unconventional activation (microwave, ultrasound) | 2 |
| Pressure equipment (> 1 atm) | 3 | |
| Cooling to < 0°C | 5 |
Table 2: Penalty Points for Operational Factors and Waste
| Category | Parameter | Penalty Points / Benchmark |
|---|---|---|
| Temperature/Time [5] | Heating for > 1 hour | 3 |
| Cooling to < 0°C | 5 | |
| Workup & Purification [5] | Liquid-liquid extraction | 3 |
| Classical chromatography | 10 | |
| Energy & Waste | High energy consumption (> 0.1 kWh/sample) [6] | Penalty applied |
| High waste generation (> 50 g) [6] | Penalty applied | |
| Solvent Consumption | High solvent use (> 10 mL per sample) [2] | Penalty applied |
Table 3: Analytical Eco-Scale Scoring Benchmarks
| Eco-Scale Score | Greenness Assessment |
|---|---|
| > 75 [7] | Excellent green method |
| Between 75 and 50 [7] | Moderately green / acceptable method |
| < 50 [7] | Insufficient greenness |
The Scientist's Toolkit: Key Research Reagent Solutions
Table 4: Essential Materials and Strategies for Greener Analysis
| Item / Strategy | Function / Rationale |
|---|---|
| Alternative Solvents (e.g., Ethanol, Water) | Replaces more hazardous solvents like acetonitrile or chlorinated hydrocarbons in mobile phases and extractions, reducing toxicity penalties [9]. |
| Micro-Extraction Techniques | Minimizes solvent consumption to below 10 mL per sample, significantly reducing waste generation and associated penalty points [2]. |
| Short or Monolithic HPLC Columns | Reduces analysis run time and mobile phase consumption, lowering both energy use and waste [9]. |
| Direct Sample Analysis Techniques | Avoids extensive sample preparation, thereby eliminating penalties from reagents, energy, and waste from those steps [6]. |
| Automation and Semi-Automation | Improves throughput and can optimize reagent use, contributing to lower waste per sample and better energy efficiency [2]. |
The Business and Environmental Case for Greener Analytical Methods in Pharma
Technical Support Center: Troubleshooting High Penalty Points in Analytical Eco-Scale Research
This technical support center provides targeted troubleshooting guides and FAQs to help researchers, scientists, and drug development professionals identify and resolve common issues that lead to high penalty points in Analytical Eco-Scale assessments. Implementing these solutions supports both environmental sustainability and business objectives by reducing operational costs, minimizing waste, and improving safety.
Frequently Asked Questions (FAQs)
FAQ 1: What are the most common factors causing high penalty points in an Analytical Eco-Scale evaluation? High penalty points typically result from the use of hazardous reagents (e.g., toxic, corrosive, or environmentally dangerous solvents), large solvent volumes generating significant waste, and high energy consumption due to lengthy or energy-intensive procedures like extended heating or cooling [5] [6]. The Analytical Eco-Scale assigns penalty points based on the quantity and hazard level of reagents, the amount of waste generated, and energy consumption [6].
FAQ 2: How can I reduce waste generation in my analytical method? The most effective strategy is miniaturization of the method. Techniques such as micro-extraction, use of micro-sensors, and switching to on-line or in-line analysis can drastically reduce solvent and reagent consumption, thereby cutting waste below the 50 g threshold that incurs penalties in metrics like NEMI [2] [6]. Furthermore, exploring ways to recycle solvents or implement waste treatment protocols can further improve your greenness score [2].
FAQ 3: My method requires a specific toxic reagent for the reaction to work. How can I mitigate its environmental impact? If a toxic reagent is unavoidable, you can minimize its penalty by reducing the amount used to the absolute minimum. Furthermore, you should explore substitution with a safer alternative; for instance, the 12 principles of Green Analytical Chemistry (GAC) encourage the use of reagents from natural sources or those with lower environmental toxicity [10] [6]. Using a bio-based or less hazardous reagent, even in small quantities, can significantly reduce your overall penalty points [5].
FAQ 4: Are there comprehensive metrics that provide a more detailed assessment than the Analytical Eco-Scale? Yes, several advanced metrics offer more detailed insights. The AGREE (Analytical Greenness) calculator evaluates methods against all 12 principles of GAC, providing a unified score between 0 and 1 and a visual pictogram [11] [2] [12]. The GAPI (Green Analytical Procedure Index) offers a detailed color-coded pictogram that assesses the environmental impact of each stage in the analytical process, from sample collection to detection [10] [2] [12]. For a holistic view that balances greenness with analytical practicality and performance, the White Analytical Chemistry (WAC) framework is recommended [13] [12].
Troubleshooting Guides
Troubleshooting Guide 1: High Penalty Points Due to Reagent Toxicity
Symptoms: Your method uses reagents classified with hazard symbols (e.g., T, T+, N, C, F) leading to significant penalties [5] [6].
Investigation and Resolution:
- Step 1: Audit Reagents - Create an inventory of all reagents used and consult their Safety Data Sheets (SDS) to identify those with the highest hazard ratings.
- Step 2: Research Safer Alternatives - Investigate scientific literature for methods that use less toxic solvents (e.g., ethanol, acetone, ethyl acetate) or reagents to achieve similar analytical outcomes. The principles of GAC explicitly recommend choosing safer chemicals [10].
- Step 3: Optimize and Reduce - If substitution is not feasible, optimize the method to use the smallest possible quantity of the hazardous reagent. Even a reduction in concentration or volume can lower the penalty [5].
Troubleshooting Guide 2: High Penalty Points Due to Excessive Waste
Symptoms: Your waste generation per analysis exceeds 50 g, leading to penalties in the Analytical Eco-Scale and a non-green score in the NEMI metric [6].
Investigation and Resolution:
- Step 1: Calculate Mass Intensity - Determine the total mass of all inputs (solvents, reagents, etc.) per unit of product or per sample analyzed. This identifies the main contributors to waste [5].
- Step 2: Implement Micro-Scale Techniques - Transition from traditional large-scale methods (e.g., classical liquid-liquid extraction) to miniaturized approaches like Single-Drop Microextraction or Micro-Solid Phase Extraction [2]. This directly reduces solvent consumption and waste.
- Step 3: Integrate Steps - Develop an on-line or in-line analysis system that eliminates the need for separate sample preparation steps, thereby reducing or even eliminating waste generation from those steps [2].
Troubleshooting Guide 3: High Penalty Points Due to Energy-Intensive Operations
Symptoms: Your method requires prolonged heating, cooling below 0°C, or uses energy-intensive equipment, accruing temperature and setup penalties [5].
Investigation and Resolution:
- Step 1: Evaluate Temperature and Time - Challenge the necessity of extreme temperatures and long reaction/analysis times. Can room temperature incubation with a longer wait time achieve the same result? Often, method conditions are inherited and not re-optimized.
- Step 2: Employ Alternative Activation Techniques - While techniques like microwave irradiation or ultrasound may incur a small penalty for an "unconventional setup," they can dramatically reduce overall reaction time and temperature, leading to a net reduction in energy penalty [5].
- Step 3: Automate for Efficiency - While automation may have a initial setup penalty, it can improve reproducibility and allow for running methods outside of standard hours, potentially reducing the overall environmental footprint of the laboratory's operations [2].
The table below summarizes key tools for evaluating the greenness of analytical methods. Using multiple metrics provides a comprehensive view of a method's environmental impact.
Table 1: Comparison of Widely Used Green Analytical Chemistry (GAC) Assessment Tools
| Metric Name | Type of Output | Key Criteria Assessed | Primary Advantage | Primary Limitation |
|---|---|---|---|---|
| Analytical Eco-Scale [5] [6] | Semi-quantitative score (0-100) | Reagent toxicity & quantity, energy consumption, waste generated. | Simple calculation, easy comparison between methods. | Relies on expert judgment for penalties; no visual output. |
| NEMI [11] [6] | Qualitative pictogram (4 quadrants) | PBT chemicals, hazardous waste, corrosivity, waste amount. | Very simple visual snapshot. | Binary (green/white); limited detail; not quantitative. |
| GAPI [2] [12] | Semi-quantitative color pictogram | Entire process: sampling, storage, transport, preparation, detection. | Visualizes impact across all stages of analysis. | No single final score; some subjectivity in color assignment. |
| AGREE [11] [2] [12] | Quantitative score (0-1) & pictogram | All 12 principles of GAC. | Comprehensive, user-friendly software, easy comparison. | Does not deeply cover pre-analytical processes (e.g., reagent synthesis). |
| White Analytical Chemistry (WAC) [13] [12] | Holistic assessment | Balances Green (environmental), Red (analytical performance), and Blue (practicality) criteria. | Avoids sub-optimization by ensuring method is environmentally sound, practical, and effective. | More complex to apply and balance all three dimensions. |
The Scientist's Toolkit: Key Reagent Solutions
Table 2: Essential Materials and Strategies for Greener Pharmaceutical Analysis
| Item or Strategy | Function/Description | Green Benefit |
|---|---|---|
| Bio-Based Reagents (e.g., ethanol, citric acid) | Solvents and reactants derived from renewable biological sources [10]. | Reduced toxicity and environmental persistence compared to petrochemical-based reagents. |
| Miniaturized Extraction Devices (e.g., micro-SPE cartridges) | Devices designed for small-scale sample preparation [2]. | Drastically reduces solvent consumption and waste generation. |
| Alternative Solvents (e.g., water, supercritical CO2, ionic liquids) | Replacing hazardous organic solvents like chloroform or hexane [10] [6]. | Lower toxicity, flammability, and environmental impact. |
| Direct Analysis Techniques (e.g., near-infrared spectroscopy) | Techniques that require minimal or no sample preparation [6]. | Eliminates waste from sample preparation steps. |
| Automated & On-Line Systems | Systems that integrate sample preparation with analysis [2]. | Improves precision, reduces human error, and minimizes solvent use and exposure. |
Experimental Workflow for Improving Your Analytical Eco-Scale Score
The following diagram outlines a logical, step-by-step protocol for troubleshooting and enhancing the greenness of an analytical method, directly addressing the core requirements of a thesis on reducing penalty points.
Diagram 1: Workflow for method greening.
Troubleshooting High Penalty Points in Analytical Eco-Scale Research
Frequently Asked Questions (FAQs)
Q1: What is the Analytical Eco-Scale (AES) and how is its score calculated? The Analytical Eco-Scale (AES) is a semi-quantitative assessment tool used to evaluate the greenness of analytical procedures. It operates on a scale from 0 to 100. A score of 100 represents an ideal green analysis. The final score is calculated by starting from this perfect score and subtracting penalty points for each aspect of the analytical procedure that has a negative environmental, safety, or practical impact. The penalties are assigned based on several criteria, including the hazard of reagents, energy consumption, and waste generation [13] [8].
Q2: My method received a "Non-Eco-Friendly" score (<50). What are the most common reasons for such a low rating? A score below 50 typically indicates significant environmental and safety drawbacks. The most common sources of high penalty points are:
- Hazardous Reagents: The use of large quantities of reagents classified as toxic (T, T+), dangerous for the environment (N), or explosive (E) [5].
- High Energy Consumption: Employing lengthy heating or cooling steps below 0°C for extended periods [8] [5].
- Complex Workup and Purification: Utilizing waste-intensive purification techniques, with classical chromatography being a major contributor due to its high penalty point assignment [5].
- Significant Waste Generation: Procedures that generate a large amount of waste relative to the analyte, which is a core consideration in green chemistry metrics [8].
Q3: How can I reduce penalties related to my HPLC method's mobile phase? A key strategy is to substitute hazardous solvents with their safer equivalents. For example, you can often replace acetonitrile with alternatives like methanol or ethanol, which may have lower environmental and safety penalties. Another effective approach is to use ethanol-water or methanol-water mixtures instead of pure organic solvents, which can reduce toxicity and waste. The method detailed in Section 1.3 demonstrates the use of an acetonitrile–ammonium acetate mobile phase, but exploring greener alternatives for your specific application is encouraged [14].
Q4: What is the difference between a "green" (≥75) and "acceptable" (50-74) method in practice? The distinction often lies in the cumulative impact of several minor improvements rather than a single major change. A "green" method (≥75) will typically feature a combination of the following: safer solvents, miniaturized or automated sample preparation to reduce reagent volumes, minimal or simple purification steps, and ambient temperature analysis. An "acceptable" method might use a moderately hazardous reagent but compensate with a high yield, or it might use a safer solvent but require a complex, high-energy workup procedure [8] [5].
Q5: How does the Analytical Eco-Scale compare to other green assessment tools like GAPI or AGREE? The Analytical Eco-Scale is a semi-quantitative tool that provides a final composite score, which is useful for a straightforward comparison of methods. In contrast, other tools like the Green Analytical Procedure Index (GAPI) and the Analytical GREEnness (AGREE) index often provide a more detailed pictorial representation. GAPI uses a colored pentagon to visualize impacts across different stages of the analytical process, while AGREE provides a composite score based on all 12 principles of Green Analytical Chemistry. The Eco-Scale is particularly valued for its simplicity and transparency in assigning penalty points [13].
Troubleshooting Guide: Identifying and Fixing High Penalty Areas
Use the following flowchart to diagnose and address the most common issues that lead to a low AES score.
Experimental Protocol: Example of an Eco-Friendly HPLC-PDA Method
The following is a summarized protocol for a developed HPLC method that was assessed as eco-friendly, based on a study for quantifying Seliciclib in plasma [14].
1. Instrumentation:
- HPLC System: Shimadzu Corporation HPLC system.
- Detector: Photodiode array (PDA) detector, set at 230 nm.
- Column: Zorbax Eclipse Plus C18 (150 mm x 4.6 mm, 5 µm).
- Guard Column: Macherey-Nagel GmbH & Co. guard column.
- Software: LCsolution (version 1.25) for data acquisition.
2. Materials & Reagents:
- Standards: Seliciclib (SEL) and Linifanib (LIN) as an internal standard (IS), purity >99%.
- Solvents: Acetonitrile and methanol of HPLC grade.
- Other Reagents: Ammonium acetate for buffer preparation (analytical grade).
- Biological Matrix: Human plasma.
3. Chromatographic Conditions:
- Mobile Phase: Acetonitrile–Ammonium acetate buffer (pH 5.0) in a ratio of 50:50 (v/v).
- Flow Rate: 1.0 mL/min.
- Injection Volume: 10 µL.
- Mode: Isocratic elution.
4. Sample Preparation (Protein Precipitation):
- Spike blank human plasma with SEL and IS working standards.
- Add an equal volume of methanol to the plasma sample.
- Vortex the mixture for 30 seconds.
- Centrifuge at 13,000 rpm for 10 minutes.
- Filter the supernatant through a 0.2 µm membrane filter.
- Inject the resulting clear solution into the HPLC system.
5. Method Validation: The method was validated as per International Council for Harmonisation (ICH) guidelines, demonstrating linearity in the range of 50-1000 ng mL⁻¹, and meeting required criteria for accuracy, precision, and specificity [14].
Quantitative Data: Analytical Eco-Scale Penalty Points
The tables below summarize common penalties based on the AES methodology [8] [5]. Use these to identify weaknesses in your analytical procedure.
Table 1: Penalty Points for Reagents and Technical Setup
| Category | Parameter | Penalty Points |
|---|---|---|
| Reagent Hazard | Toxic (T) / Dangerous for Environment (N) | 5 [5] |
| Extremely Toxic (T+) / Explosive (E) | 10 [5] | |
| Technical Setup | Inert gas atmosphere | 1 [5] |
| Unconventional activation (e.g., microwave) | 2 [5] | |
| Pressure equipment (> 1 atm) | 3 [5] |
Table 2: Penalty Points for Temperature, Time, and Workup
| Category | Parameter | Penalty Points |
|---|---|---|
| Temperature/Time | Heating, > 1 hour | 3 [5] |
| Cooling to 0°C | 4 [5] | |
| Cooling, < 0°C | 5 [5] | |
| Workup & Purification | Simple Filtration | 0 [5] |
| Crystallization & Filtration | 1 [5] | |
| Liquid-Liquid Extraction / Solid Phase Extraction (SPE) | 2-3 [5] | |
| Classical Chromatography | 10 [5] |
The Scientist's Toolkit: Key Research Reagent Solutions
Table 3: Essential Materials for Greener Analytical Chemistry
| Item | Function & Green Consideration |
|---|---|
| Alternative Solvents (e.g., Methanol, Ethanol) | Used as less toxic replacements for solvents like acetonitrile in mobile phases or extraction. Reduces reagent hazard penalties [14]. |
| Ammonium Acetate Buffer | Provides a buffered mobile phase environment in HPLC. Aqueous-based buffers are generally preferred over purely organic systems from a green perspective [14]. |
| Solid Phase Extraction (SPE) Cartridges | Used for sample clean-up and concentration. While it carries a penalty, it can be a greener alternative to traditional liquid-liquid extraction by using less solvent [5]. |
| Zorbax Eclipse Plus C18 Column | A standard reverse-phase HPLC column used for separation. Selecting efficient columns can help optimize methods to reduce runtime and solvent consumption [14]. |
| Protein Precipitation Agents (e.g., Methanol) | A simple and effective sample preparation technique to remove proteins from plasma. It often carries a lower penalty than more complex extraction methods [14] [5]. |
Technical Support Center: Troubleshooting Guides and FAQs
Frequently Asked Questions (FAQs)
1. What are the most significant environmental concerns associated with traditional liquid chromatography (LC) methods? The primary environmental concerns are high solvent consumption, substantial energy use, and the generation of hazardous waste. Traditional LC often uses large volumes of organic solvents like acetonitrile and methanol, which are toxic and pose disposal challenges [15] [16]. Chromatography instruments, especially in high-throughput labs, consume significant energy as they often run for extended periods. Furthermore, the solvent waste generated is hazardous and harmful to the environment if not managed properly [15].
2. How can I reduce the environmental impact of my chromatographic methods without compromising analytical performance? You can adopt several strategies to green your methods while maintaining performance:
- Transition to UHPLC: Ultra-High-Performance Liquid Chromatography (UHPLC) uses columns with smaller particle sizes, which operate at lower flow rates and reduce solvent consumption while maintaining or improving separation quality [15].
- Use Smaller Dimension Columns: Switching from a standard column (e.g., 25 cm x 4.6 mm) to a smaller one (e.g., 10 cm x 2.1 mm) can reduce solvent usage by nearly 90% [16].
- Adopt Green Solvents: Replace hazardous solvents like acetonitrile with more environmentally friendly alternatives such as ethanol or bio-based solvents where methodologically feasible [15] [16].
- Optimize Sample Preparation: Implement miniaturized, solvent-free sample preparation techniques like solid-phase microextraction (SPME) to drastically cut down on reagent use [16].
3. My Analytical Eco-Scale score is too low (high penalty points). What are the most common factors contributing to this? The Analytical Eco-Scale Assessment (ESA) assigns penalty points to parameters that deviate from ideal green conditions [17]. Common high-penalty factors include:
- High volumes of hazardous reagents/solvents: Using large quantities of toxic solvents (e.g., acetonitrile, methanol) incurs significant penalties [17] [18].
- High energy consumption: Using energy-intensive equipment like LC-MS when LC-UV would suffice increases penalty points [16].
- Large amounts of waste generated: Methods that are not optimized for miniaturization produce more hazardous waste, leading to higher penalties [15] [17].
- Use of corrosive reagents: Employing strong acids or bases can contribute to a lower score [18].
4. What are the key differences between the various greenness assessment tools (NEMI, ESA, GAPI, AGREE)? Different tools assess ecological impact with varying levels of detail:
- NEMI (National Environmental Methods Index): A simple, pictogram-based tool that provides a quick visual comparison but offers the least detailed information [17].
- ESA (Eco-Scale Assessment): An excellent digitally-presented tool that assigns penalty points for hazards (reagents, energy, waste) and calculates a final score out of 100. A score above 75 is considered excellent green [17] [18].
- GAPI (Green Analytical Procedure Index): A comprehensive pictogram that provides a detailed overview of the environmental impact of an analytical method across all steps, from sampling to final determination [17].
- AGREE (Analytical Greenness Metric): A modern, digitally-presented tool that is highly recommended for its user-friendliness and comprehensive evaluation [17].
The table below summarizes a quantitative comparison of solvent and energy consumption for different chromatographic approaches, which directly influences their greenness scores.
Table 1: Quantitative Environmental Impact of Chromatographic Approaches
| Chromatographic Approach | Typical Solvent Consumption per Run | Key Environmental & Performance Factors | Estimated Impact on Eco-Scale Penalty Points |
|---|---|---|---|
| Traditional HPLC | High (e.g., 1-2 mL/min flow rate) | High solvent waste, lower efficiency [15] | High |
| UHPLC | Low (Reduced by ~50-90% vs. HPLC) | Smaller column particles, lower flow rates, faster analysis [15] | Lower |
| GC with Helium | N/A (uses carrier gas) | Consumes finite helium resource [16] | Moderate (resource depletion) |
| SFC | Very Low | Uses supercritical CO₂ as primary mobile phase [15] | Lowest |
| Method with Miniaturized Column | Very Low (e.g., ~10% of standard column) | Columns with smaller internal diameter (e.g., 2.1 mm vs. 4.6 mm) [16] | Lower |
Troubleshooting Guides
Problem 1: High Solvent Consumption and Waste Generation
- Symptoms: Your method uses large volumes of organic solvent, leading to frequent waste disposal and high reagent costs. This results in high penalty points in the "Reagents" and "Waste" categories of the Eco-Scale Assessment [15] [17].
- Investigation & Resolution:
- Check Column Dimensions: Are you using a standard 4.6 mm internal diameter column? Solution: Switch to a column with a smaller internal diameter (e.g., 2.1 mm) and/or a shorter length. This can reduce solvent consumption by up to 90% [16].
- Check Flow Rate: Is your flow rate higher than necessary? Solution: If possible, optimize the method to use the lowest effective flow rate without compromising separation.
- Check for Solvent Mismatch: Can you replace hazardous solvents? Solution: Explore substituting acetonitrile with less toxic alternatives like ethanol or isopropanol, if compatible with your detection method and separation chemistry [15] [16].
- Check Analysis Time: Can the run time be shortened? Solution: Use UHPLC or optimize the gradient to decrease the analysis time, directly reducing solvent use [15].
Problem 2: High Energy Consumption
- Symptoms: Laboratory energy bills are high, and equipment generates excess heat. This contributes to penalties in the "Energy" category of the Eco-Scale [16].
- Investigation & Resolution:
- Check Instrument Type: Are you using an LC-MS system for an application that could be performed with an LC-UV system? Solution: Reserve LC-MS for applications where its sensitivity and compound identification capabilities are essential. Use LC-UV for simpler, routine analyses to save energy [16].
- Check Instrument Idling: Do instruments run or remain in standby mode 24/7? Solution: Utilize built-in energy-saving features and power down instruments when not in use for extended periods [15].
- Check for Older Equipment: Is the instrumentation outdated? Solution: When acquiring new equipment, consider the ACT label from My Green Lab, which helps compare the energy consumption of different instruments [16].
Problem 3: Poor Peak Shape (Tailing or Fronting) in Greener Methods
- Symptoms: After modifying a method to be greener (e.g., changing solvent or column), peaks become asymmetrical, which can affect resolution and quantification [19].
- Investigation & Resolution:
- Check Sample Load: Solution: Reduce the injection volume or dilute the sample. Overloading the column is a common cause of tailing and fronting [19].
- Check Solvent Compatibility: Solution: Ensure the sample is dissolved in a solvent that is not stronger than the initial mobile phase composition. A mismatch can cause peak distortion [19].
- Check Column Chemistry: Solution: Secondary interactions with the stationary phase (e.g., with residual silanols) can cause tailing. Consider using a more inert or specifically end-capped column [19].
- Check for Physical Column Damage: Solution: A collapsed column bed or blocked inlet frit can cause peak tailing. Examine the column inlet or replace the guard cartridge. Flushing or reversing the column may help [19].
Problem 4: Ghost Peaks in the Chromatogram
- Symptoms: Unexpected peaks appear in blank injections, complicating data interpretation [19].
- Investigation & Resolution:
- Check for Carryover: Solution: Perform a thorough cleaning of the autosampler, including the injection needle and loop. Run blank injections to confirm the issue is resolved [19].
- Check Mobile Phase and Solvents: Solution: Prepare fresh mobile phase from high-quality solvents. Check for contamination in solvent bottles or the water purification system [19].
- Check the Column: Solution: Column bleed or degradation of the stationary phase can cause ghost peaks, especially at high temperatures or extreme pH. Replace the column if it is old or has been used outside its specified limits [19].
Experimental Protocols for Key Green Chromatography Practices
Protocol 1: Method Transfer from HPLC to UHPLC for Solvent Reduction
- Objective: Reduce solvent consumption and analysis time by transferring an existing HPLC method to a UHPLC system while maintaining chromatographic resolution [15].
- Materials: UHPLC system, UHPLC column (e.g., with sub-2µm particles), original HPLC method parameters.
- Methodology:
- Scale Flow Rate: Calculate the scaled flow rate for UHPLC based on the column dimensions. The formula is:
Flow_UHPLC = Flow_HPLC × ( (ID_UHPLC)² / (ID_HPLC)² ), where ID is the column's internal diameter. - Scale Gradient Time: Adjust the gradient time to maintain the same number of column volumes. The formula is:
t_G_UHPLC = t_G_HPLC × (Flow_UHPLC / Flow_HPLC) × (L_UHPLC / L_HPLC), where L is the column length. - Adjust Injection Volume: Scale the injection volume proportionally to the column volume change.
- Optimize: Perform initial runs and fine-tune the gradient program and flow rate to achieve optimal separation.
- Scale Flow Rate: Calculate the scaled flow rate for UHPLC based on the column dimensions. The formula is:
- Validation: System suitability tests should be performed to ensure the UHPLC method meets all required performance criteria (resolution, precision, tailing factor) as per ICH guidelines.
Protocol 2: Implementing an Analytical Eco-Scale Assessment (ESA)
- Objective: Quantitatively evaluate the greenness of an analytical method to identify areas for improvement [17] [18].
- Materials: Details of the analytical method (reagents, volumes, energy use, waste amount), ESA penalty table.
- Methodology:
- Record Method Parameters: Document all reagents (type and amount), energy consumption of instruments, and the total amount of waste generated.
- Assign Penalty Points: For each parameter, assign penalty points based on the ESA criteria:
- Reagents: Penalties are based on hazard and quantity.
- Occupational Hazard: Penalties for required personal protective equipment (PPE).
- Energy: Penalties for consumption above 0.1 kWh per sample.
- Waste: Penalties based on the total amount and hazard of waste generated.
- Calculate Total Score: Subtract the total penalty points from a base score of 100.
Eco-Scale Score = 100 - Total Penalty Points.
- Interpretation:
- > 75: Excellent green method.
- > 50: Acceptable green method.
- < 50: Inadequate green method [17].
Visual Workflow: Systematic Troubleshooting for High Eco-Scale Penalties
The following diagram outlines a logical workflow for diagnosing and resolving common issues that lead to a poor Analytical Eco-Scale score.
The Scientist's Toolkit: Essential Reagents and Materials for Greener Chromatography
Table 2: Key Research Reagent Solutions for Sustainable Chromatography
| Item | Function & Rationale | Key Considerations |
|---|---|---|
| Ethanol (Bio-based) | A greener alternative to acetonitrile and methanol. Less toxic, biodegradable, and can be produced from renewable resources [15] [16]. | Higher viscosity can cause high backpressure; may require column heating or monolithic columns. Higher UV cutoff can limit use with UV detection [16]. |
| UHPLC Columns | Columns packed with smaller particles (<2µm) enable higher efficiency separations at lower flow rates and with shorter run times, drastically reducing solvent consumption [15]. | Requires a UHPLC instrument capable of withstanding high pressures. Method transfer from HPLC may be necessary. |
| Miniaturized Columns | Columns with smaller internal diameters (e.g., 2.1 mm vs. 4.6 mm) drastically reduce mobile phase consumption and sample loading [16]. | May require instrument modifications (e.g., reduced extra-column volume) to maintain performance. |
| Guard Columns/In-Line Filters | Protect the analytical column from contaminants and particulates, extending column lifetime and reducing the frequency of column replacement and associated waste [15] [19]. | A small, cost-effective investment that preserves the performance and longevity of more expensive analytical columns. |
| Supercritical CO₂ | The primary mobile phase in Supercritical Fluid Chromatography (SFC). It is non-toxic, non-flammable, and can be sourced as a by-product from other industries, making it an excellent green solvent [15]. | Requires specialized SFC instrumentation. Often used with small percentages of organic co-solvents (modifiers). |
A Step-by-Step Methodology for Assessing Your Method's Eco-Scale Score
Frequently Asked Questions (FAQs)
1. How can poor inventory management specifically affect the Eco-Scale score of my research?
Inefficient inventory management directly increases the penalty points on the Analytical Eco-Scale, lowering your overall score. Using expired reagents can compromise yield, leading to the yield penalty: (100 - %yield)/2 [5]. Disposing of expired, unused stock represents a waste of often expensive materials, incurring price penalties[cite:8][cite:9]. Furthermore, time wasted searching for materials or repeating experiments due to expired reagents falls under inefficient "Temperature/time" and "Workup and purification" steps, which carry their own penalties[cite:8][cite:9].
2. What is the most common source of error in laboratory processes that I should focus on? Evidence indicates that the vast majority of laboratory errors, up to 68.2%, occur in the preanalytical phase, which includes test selection and sample collection[cite:10]. While this data comes from medical laboratories, the principle translates to research settings: errors in initial steps like selecting the wrong reagent or using a compromised consumable can invalidate all subsequent analytical work. Focusing on systematic data collection and management at the inventory stage is a proactive way to prevent these early, high-impact errors[cite:10].
3. What are the first steps to transitioning from a manual to a digital inventory system? Begin by conducting a complete physical audit of all existing reagents, solvents, and consumables, recording their identities, quantities, and expiration dates [20]. Then, choose a system that uses digital data capture, such as RFID labels, which encode data on opening/expiration dates and location [20]. The key is to start with a core set of critical materials and scale up, ensuring the system you select can integrate with your existing workflows and provides features like automatic expiry alerts to prevent future waste and errors [20].
Troubleshooting Guides
Problem 1: High Penalty Points from Reagent Cost and Waste
- Problem Description: The "Price of reaction components" and "Workup and purification" categories on the Analytical Eco-Scale are accruing high penalty points due to expired reagents and wasteful practices [5].
- Identification: Physical audit reveals expired or degraded reagents. Financial records show significant spending on disposables and frequent overnight shipping for replacement items [20].
- Solution:
- Implement a Digital Inventory System: Use a system with RFID or barcode labels to track reagents in real-time, providing automatic alerts for low stock and upcoming expirations [20].
- Adopt "First-In, First-Out" (FIFO): The system should guide reagent selection based on the FIFO principle to ensure older stock is used first, preventing expiration [20].
- Centralize Safety Data: Ensure the digital system provides instant access to Safety Data Sheets (SDS), promoting safe handling and proper disposal to avoid environmental penalties [20].
Problem 2: Yield Penalties from Degraded or Incorrect Reagents
- Problem Description: Reaction yields are inconsistent or low, leading to the yield penalty in the Eco-Scale calculation:
(100 - %yield)/2[5]. This is traced back to the use of degraded or misidentified reagents. - Identification: Experimental results are not reproducible. Containers are mislabeled, or reagents have been stored beyond their expiration date [20] [21].
- Solution:
- Enforce Standardized Labeling: Use a standardized protocol for labeling all in-house prepared reagents and stock solutions, including identity, concentration, date of preparation, and expiration date.
- Define and Monitor Quality Indicators (QIs): Establish and track QIs for your inventory, such as "rate of reagent expiration" or "frequency of incorrect reagent use," to objectively measure performance and identify areas for improvement [21].
- Systematic Reagent Logging: Maintain a mandatory log for each experiment that records the specific batch numbers of all reagents and consumables used. This enables rapid backtracking if a batch is found to be faulty.
Quantitative Data on Laboratory Processes
Table 1: Analytical Eco-Scale Penalty Points for Common Inventory & Process Issues [5]
| Parameter | Specific Issue | Penalty Points |
|---|---|---|
| Yield | 80% Yield (vs. Ideal 100%) | 10 points |
| Price of Components | Very expensive reagent (> $50 for 10 mmol product) | 5 points |
| Safety | Use of Toxic (T) reagents | 5 points |
| Technical Setup | Requirement for an inert gas atmosphere | 1 point |
| Temperature/Time | Reaction requiring cooling below 0°C | 5 points |
| Workup/Purification | Purification requiring classical chromatography | 10 points |
Table 2: Error Frequencies in the Total Testing Process (Illustrative for Broader Lab Work) [21]
| Process Phase | Frequency of Errors |
|---|---|
| Preanalytical (test selection, sample collection) | 61.9% - 68.2% |
| Postanalytical (reporting, interpretation) | 18.5% - 23.1% |
| Analytical (actual analysis) | 13.3% - 15.0% |
Detailed Experimental Protocols
Protocol 1: Implementing a Digital Inventory Management System
Objective: To transition from a manual, paper-based inventory system to a smart digital data capture system to reduce waste, prevent errors, and improve Eco-Scale scores.
- Initial Audit and Data Collection:
- Designate a centralized location for the inventory.
- Handle all containers and visually inspect each item for existing labels, quantity, and physical state.
- Record the following data for each item: Chemical Name, CAS Number, Supplier, Batch Number, Date Received, Opening Date, Expiration Date, and Storage Location.
- Selection and Implementation of a Digital Platform:
- Choose a vendor-neutral digital platform that supports a broad consumables database.
- Generate unique RFID or barcode labels for each item. The system should encode critical data like opening/expiration dates [20].
- Affix the new labels to the corresponding containers and enter all collected data into the system's database.
- Integration into Workflows and Training:
- Install the associated web and mobile application for all team members.
- Train personnel to use the app to scan labels for real-time data on quantity, location, and expiry, and to check SDS before use [20].
- Establish a protocol for the system to automatically alert a designated "Inventory Manager" for low-stock and expiry warnings.
Protocol 2: Quality Control and Monitoring via Quality Indicators (QIs)
Objective: To proactively identify and reduce errors in the reagent inventory management process by defining and tracking specific Quality Indicators.
- Definition of QIs:
- Define a set of Key Performance Indicators (KPIs) for your inventory. Examples include:
- Reagent Expiration Rate: (Number of expired reagents per month / Total number of reagents in inventory) * 100.
- Rate of Incorrect Reagent Use: Number of experiments compromised due to a wrong or degraded reagent.
- Time Spent Searching for Materials: Average time spent by researchers locating materials for experimental setup.
- Define a set of Key Performance Indicators (KPIs) for your inventory. Examples include:
- Data Collection and Analysis:
- Utilize the digital inventory system to automatically log data for these QIs where possible (e.g., expiration alerts).
- For other indicators, like incorrect use, implement a simple mandatory log for researchers to report any such incidents.
- On a monthly basis, collate and analyze the QI data to calculate performance metrics and identify trends.
- Review and Corrective Action (PDCA Cycle):
- Review the analyzed QI data with the research team.
- If a QI shows unsatisfactory performance (e.g., a high expiration rate), develop and implement a corrective action plan (e.g., better enforcing FIFO, adjusting purchasing volumes).
- Continuously monitor the QIs to check the effectiveness of the corrective actions, completing the Plan-Do-Check-Act (PDCA) cycle [21].
The Scientist's Toolkit: Research Reagent Solutions
Table 3: Essential Materials and Digital Tools for Inventory Management
| Item/Tool | Function | Relevance to Eco-Scale |
|---|---|---|
| Digital Inventory System (e.g., LANEXO) | A cloud-based platform using RFID labels for real-time tracking of consumables data, location, and expiry dates [20]. | Directly reduces penalties from expired reagents (cost, yield) and saves time (temperature/time). |
| RFID Smart Labels | Labels encoded with consumable data; scanned via a mobile app to instantly access all stored information [20]. | Prevents use of wrong or expired reagents, safeguarding yield and ensuring safety compliance. |
| Standardized Labeling Protocol | A lab-defined template for labeling in-house prepared reagents, ensuring all critical information is consistently recorded. | Prevents misidentification, reduces errors that affect yield, and improves reproducibility. |
| Quality Indicator (QI) Dashboard | A tool for defining, tracking, and benchmarking performance metrics for laboratory processes [21]. | Enables systematic monitoring and reduction of error-prone steps that lead to penalty points. |
| Safety Data Sheet (SDS) Digital Library | Instant, mobile access to SDS for all chemicals and reagents in the inventory [20]. | Ensures safe handling and disposal, avoiding safety penalties and environmental harm. |
Workflow and Relationship Diagrams
Systematic Troubleshooting Workflow for Eco-Scale Improvement
Relationship Between Inventory Problems and Eco-Scale Penalties
Applying GHS Classifications to Calculate Reagent and Solvent Penalties
Frequently Asked Questions
1. Why are my Analytical Eco-Scale penalty points so high, and how do GHS classifications relate to this? High penalty points directly result from using hazardous reagents and solvents. The Analytical Eco-Scale assigns penalty points based on the quantity and inherent hazard of each chemical used, which is determined by its GHS classification. More severe GHS hazard categories (e.g., "Danger" signal words, Hazard Statements like H330 for "Fatal if inhaled") incur higher penalties. Effectively interpreting GHS information from Safety Data Sheets (SDS) is the first step to mitigating these penalties [22] [23].
2. How do I classify a mixture when its SDS doesn't list GHS hazards for the mixture itself? For untested mixtures, the GHS provides "Bridging Principles" to extrapolate hazard data from similar, tested mixtures or from the mixture's individual ingredients [23]. The logical workflow is:
3. What is the difference between a GHS cut-off value and a concentration limit? In the core GHS system, these terms are often used interchangeably to mean the minimum concentration of a hazardous ingredient that triggers the classification of the mixture for a specific hazard class [23]. However, some regulations like the EU CLP differentiate them:
- Cut-off value: The minimum concentration for a substance to be considered for classification (may not necessarily trigger classification).
- Concentration limit: The minimum concentration that definitively triggers the mixture's classification [23]. Always consult your regional regulations for precise definitions.
4. When can I use the additivity principle for GHS mixture classification? The additivity principle applies when a mixture contains two or more ingredients that contribute to the same type of hazard. Their concentrations are added (often weighted by potency) to determine the overall hazard [23]. This principle is used for:
| Additive Hazards | Non-Additive Hazards |
|---|---|
| Acute toxicity [23] | Skin and respiratory sensitisers [23] |
| Skin corrosion/irritation [23] | Germ cell mutagenicity [23] |
| Serious eye damage/eye irritation [23] | Carcinogenicity [23] |
| Specific target organ toxicity (STOT) - Single exposure, Category 3 (Respiratory tract irritation) [23] | Reproductive toxicity [23] |
| Specific target organ toxicity (STOT) - Single exposure, Category 3 (Narcotic effects) [23] | STOT - Single/Repeated exposure, Categories 1 & 2 [23] |
| Acute and chronic aquatic hazards [23] | Aspiration hazard [23] |
5. My reagent is an aerosol. How does this affect its GHS classification and penalty? Aerosols are classified separately based on their flammability and spray characteristics [24]. A mixture in an aerosol form is generally considered to have the same health and environmental hazard classification as its non-aerosolized form, provided the propellant does not alter those hazards [23]. However, the aerosol itself will receive additional GHS physical hazard classifications (e.g., "Flammable Aerosol"), which can contribute significantly to penalty points due to the high hazard level of pressurized containers [22] [24].
Experimental Protocol: Determining GHS-Based Penalty Points for a Reagent
Objective: To systematically determine the correct GHS hazard classifications and corresponding Analytical Eco-Scale penalty points for a chemical reagent using its Safety Data Sheet (SDS).
Materials:
- Safety Data Sheet (SDS): For the reagent in question, preferably from a reliable supplier.
- Analytical Eco-Scale Penalty Points Table: A reference table linking GHS hazards to penalties.
- GHS Classification Criteria Guide: A summary of the classification criteria for all health, physical, and environmental hazard classes [24].
Methodology:
Step 1: Identify Hazard Information from SDS Locate Section 2 (Hazard Identification) of the SDS. Record all of the following for the reagent:
- Signal Word: "Danger" (higher penalty) or "Warning" (lower penalty) [22].
- Hazard Pictograms: e.g., Flame, Skull and Crossbones, Corrosion [22].
- Hazard Statements (H-codes): e.g., H225 (Highly Flammable liquid and vapor), H318 (Causes serious eye damage), H411 (Toxic to aquatic life) [22].
- Precautionary Statements (P-codes): These indicate the safe handling procedures [22].
Step 2: Map Hazards to Penalty Points Consult your Analytical Eco-Scale reference table to assign penalty points based on the identified GHS classifications. The table below provides a generalized example.
Table 1: Example GHS Hazard to Penalty Point Mapping
| Hazard Category | Example GHS Hazard Statement | Signal Word | Typical Penalty Points |
|---|---|---|---|
| Extremely Flammable Liquid | H224: Extremely flammable liquid and vapor [22] | Danger | High (e.g., 4) |
| Acute Toxicity (Oral, Category 3) | H301: Toxic if swallowed [24] | Danger | High (e.g., 4) |
| Skin Corrosion (Category 1) | H314: Causes severe skin burns and eye damage [24] | Danger | High (e.g., 4) |
| Acute Toxicity (Category 5) | H303: May be harmful if swallowed [24] | Warning | Medium (e.g., 2) |
| Skin Irritation (Category 2) | H315: Causes skin irritation [24] | Warning | Medium (e.g., 2) |
| Eye Irritation (Category 2) | H319: Causes serious eye irritation [24] | Warning | Medium (e.g., 2) |
| Aquatic Chronic Hazard (Category 2) | H411: Toxic to aquatic life with long-lasting effects [22] | Warning | Medium (e.g., 2) |
Step 3: Factor in Quantity and Concentration The final penalty is often calculated as: Penalty Points = Base Hazard Penalty × Quantity Factor. Higher amounts of a reagent lead to a greater total penalty. For mixtures, the concentration of hazardous ingredients must be considered against GHS cut-off values to determine if the mixture itself must be classified and penalized [23].
Step 4: Calculate Total Penalty Sum the penalty points for all hazards associated with the reagent to get its total contribution to the Analytical Eco-Scale score for your method.
The Scientist's Toolkit: Key Research Reagent Solutions
Table 2: Essential Resources for GHS Classification and Green Chemistry Assessment
| Item | Function in This Context |
|---|---|
| UN GHS Purple Book | The definitive international reference providing the complete set of GHS classification criteria and hazard communication elements [23]. |
| Safety Data Sheet (SDS) | The primary source of GHS hazard information for a specific substance or mixture, used to identify H/P-codes, pictograms, and signal words [22] [23]. |
| Bridging Principles Guide | A structured decision tool for classifying untested mixtures based on data from similar tested mixtures or ingredients, saving time and resources [23]. |
| Cut-off Value & Concentration Limit Tables | Reference tables that specify the minimum concentration of a hazardous ingredient required to trigger the classification of a mixture, crucial for accurate mixture assessment [23]. |
| Analytical Eco-Scale Calculator | A scoring sheet or software used to assign penalty points based on GHS hazards, reagent quantity, energy consumption, and waste generation, resulting in a final greenness score [11] [25]. |
Quantifying Energy Penalties from Instrumentation and Workflow Duration
Troubleshooting Guides
Guide 1: Troubleshooting High Energy Penalty Points in Analytical Eco-Scale
Problem: Your analytical method is receiving high penalty points for energy consumption during Analytical Eco-Scale assessment.
Explanation: The Analytical Eco-Scale is a greenness assessment tool that assigns penalty points based on environmental impact, including energy usage. An "ideal green analysis" consumes less than 0.1 kWh per sample [6]. Higher energy usage results in more penalty points, lowering your overall greenness score.
Diagnosis and Solutions:
Troubleshooting Steps:
Measure Actual Energy Consumption
- Use an energy meter to quantify kWh per sample
- Calculate total energy: (instrument power × runtime) ÷ number of samples
- Compare against the ideal green threshold of 0.1 kWh/sample [6]
Optimize Instrument Runtime
- Develop faster chromatographic methods (e.g., UPLC instead of HPLC)
- Reduce equilibrium times and gradient delays
- Implement method stacking to maximize instrument utilization
Evaluate Alternative Techniques
- Consider ambient mass spectrometry to eliminate chromatographic separation
- Explore direct analysis techniques requiring less energy
- Assess microfluidic platforms with lower power requirements
Verification Protocol: After optimization, recalculate Analytical Eco-Scale points. Energy penalty should decrease proportionally to kWh reduction. A score above 75 is considered excellent greenness [6].
Guide 2: Minimizing Workflow Duration Penalties
Problem: Extended workflow duration is contributing to high penalty points and reduced method greenness.
Explanation: Longer workflows consume more energy, require more reagents, and generate additional waste - all factors penalized in greenness assessments like Analytical Eco-Scale, GAPI, and AGREE [2].
Workflow Optimization Strategy:
Optimization Methods:
Sample Preparation Intensification
- Implement micro-solid-phase extraction (μ-SPE) instead of conventional SPE
- Adopt dispersive liquid-liquid microextraction (DLLME) for faster processing
- Use direct sample introduction techniques where feasible
Analytical Phase Optimization
- Develop ultra-fast chromatography methods
- Implement parallel analysis capabilities
- Optimize temperature programming to reduce runtime
Process Integration
- Combine sample preparation and analysis steps
- Implement on-line sample preparation coupled directly to analysis
- Use automated sample handlers to reduce manual intervention time
Validation Requirement: After optimization, verify that method validation parameters (precision, accuracy, LOD, LOQ) remain within acceptable limits while achieving at least 30% reduction in total workflow duration.
Frequently Asked Questions
FAQ 1: How exactly are energy penalties calculated in Analytical Eco-Scale?
Q: What is the specific calculation method for energy penalty points in Analytical Eco-Scale assessment?
A: The Analytical Eco-Scale assigns penalty points for energy consumption based on the following quantitative scale [6]:
Table: Analytical Eco-Scale Energy Penalty Points
| Energy Consumption | Penalty Points | Assessment Criteria |
|---|---|---|
| < 0.1 kWh per sample | 0 points | Ideal green analysis threshold |
| 0.1-1.0 kWh per sample | 1 point | Moderate energy usage |
| > 1.0 kWh per sample | 2-3 points | High energy consumption |
The total penalty points are subtracted from a base score of 100. Methods scoring below 50 are considered inadequate greenness, 50-75 represent acceptable greenness, and above 75 indicate excellent green analytical methods [6].
FAQ 2: Which analytical techniques typically receive the highest energy penalties?
Q: Are there specific instrumentation types that consistently score poorly on energy metrics in greenness assessments?
A: Yes, certain techniques typically incur higher energy penalties [2]:
Table: Energy Consumption Profiles of Common Analytical Techniques
| Technique | Typical Energy Range | Greenness Impact | Alternative Approaches |
|---|---|---|---|
| Traditional HPLC | 1-2 kWh/sample | High penalty | UPLC, capillary LC |
| GC-MS with cryocooling | 1.5-3 kWh/sample | Very high penalty | MS-only methods |
| ICP-MS | 2-4 kWh/sample | Highest penalty | Microplasma techniques |
| Ambient MS | 0.05-0.2 kWh/sample | Low penalty | Direct analysis |
| Microfluidic systems | 0.02-0.1 kWh/sample | Minimal penalty | Lab-on-chip platforms |
FAQ 3: How does workflow duration specifically affect greenness metrics?
Q: Beyond direct energy consumption, how does the total analysis time impact greenness scores?
A: Workflow duration affects multiple greenness assessment categories simultaneously [2]:
- Direct Energy Impact: Longer runtimes equal higher kWh consumption
- Reagent Consumption: Extended methods typically use more solvents and chemicals
- Waste Generation: Longer workflows produce more waste streams
- Operator Safety: Extended exposure to hazards and chemicals
The AGREE metric specifically evaluates the entire analytical workflow across 12 principles of Green Analytical Chemistry, where time-intensive methods typically score lower due to cumulative environmental impacts [13] [2].
FAQ 4: Can you provide a case study showing successful penalty reduction?
Q: Are there documented examples of methods that successfully reduced energy and workflow penalties while maintaining analytical quality?
A: A case study evaluating a sugaring-out liquid-liquid microextraction (SULLME) method demonstrated how complementary greenness assessments identify improvement areas [2]:
Original Method Profile:
- AGREE score: 56/100
- Energy consumption: 0.1-1.5 kWh/sample
- Sample throughput: 2 samples/hour
- Waste generation: >10 mL/sample
Optimization Strategies Implemented:
- Semi-automation to reduce manual handling time
- Solvent reduction to <10 mL/sample
- Improved batch processing to increase throughput
Results: The multi-metric assessment (using AGREE, MoGAPI, AGSA, CaFRI) provided a comprehensive sustainability profile and guided targeted improvements across energy, workflow, and waste metrics [2].
The Scientist's Toolkit: Research Reagent Solutions
Table: Essential Materials for Green Analytical Method Development
| Reagent/ Material | Function | Greenness Considerations |
|---|---|---|
| Biobased Extraction Solvents | Sample preparation | Renewable sources, lower toxicity [2] |
| Supported Liquid Membranes | Sample pre-concentration | Minimal solvent usage, reusability |
| Molecularly Imprinted Polymers | Selective extraction | Reusable, reduced waste generation |
| Micro-SPE Cartridges | Sample clean-up | Reduced solvent consumption (<10 mL) [2] |
| Green Derivatization Reagents | Analyte modification | Biodegradable, less hazardous |
| Room-Temperature Ionic Liquids | Alternative solvents | Low vapor pressure, reusable |
| Microfluidic Chips | Miniaturized analysis | Reduced reagent and energy needs |
Experimental Protocols
Protocol 1: Analytical Eco-Scale Assessment Methodology
Purpose: To quantitatively evaluate the greenness of analytical methods using the Analytical Eco-Scale metric [6].
Procedure:
- Establish Baseline: Begin with a perfect score of 100 points
- Assess Reagents: Subtract points for hazardous reagents (1-3 points based on toxicity and quantity)
- Quantify Energy: Subtract 1 point for energy >0.1 kWh/sample, 2-3 points for >1.0 kWh/sample
- Evaluate Waste: Subtract 1 point for 1-10 mL waste/sample, 2-3 points for >10 mL waste/sample
- Calculate Final Score: Total score = 100 - sum of all penalty points
Interpretation:
- >75 points: Excellent green method
- 50-75 points: Acceptable green method
- <50 points: Inadequate green method [6]
Protocol 2: Instrumentation Energy Consumption Measurement
Purpose: To accurately quantify energy usage for penalty point assessment in greenness metrics.
Materials: Energy meter (watt-hour meter), analytical instrument, notebook for recording measurements.
Method:
- Connect Measurement Device: Install energy meter between instrument and power source
- Measure Baseline: Record energy consumption in standby mode (kWh)
- Run Analysis: Execute complete method including equilibration, separation, and shutdown
- Record Total Energy: Note total kWh consumption for entire workflow
- Calculate per Sample: Divide total energy by number of samples processed
- Compare to Standards: Assess against the 0.1 kWh/sample green threshold [6]
Validation: Repeat measurements across multiple runs to establish typical consumption profile. Compare alternative methods to identify energy optimization opportunities.
Calculating Waste Penalties and Evaluating Management Strategies
Frequently Asked Questions (FAQs)
What is the Analytical Eco-Scale and how are penalty points calculated? The Analytical Eco-Scale is a semi-quantitative tool to evaluate the greenness of analytical procedures. It starts with a base score of 100 points for an ideal green analysis and subtracts penalty points for hazardous reagents, energy consumption, and waste generation. The final score indicates method greenness: >75 represents excellent green analysis, 50-75 represents acceptable green analysis, and <50 represents inadequate green analysis [8] [6].
How is waste specifically penalized in the Analytical Eco-Scale? Waste generation directly reduces your Eco-Scale score. An ideal green analysis produces no waste (0 penalty points). In practice, penalty points are assigned based on waste quantity and hazardousness. The exact penalty depends on the amount and nature of waste produced [8] [6].
What are the most common factors leading to high penalty points in analytical methods? Common issues include using large volumes of hazardous organic solvents, employing toxic reagents, high energy consumption equipment, and generating significant waste without treatment strategies. Sample preparation is often a major contributor to penalties [2] [26].
How can I reduce waste penalties in my analytical method? Strategies include: miniaturizing methods to reduce solvent volumes, replacing hazardous solvents with greener alternatives, implementing waste treatment procedures, optimizing methods to eliminate unnecessary steps, and using direct analysis techniques when possible [2].
What's the difference between Analytical Eco-Scale and other green assessment tools? Unlike binary tools like NEMI, the Analytical Eco-Scale provides a semi-quantitative score. It differs from GAPI and AGREE by using a penalty point system rather than colored diagrams. Each tool has strengths: Eco-Scale offers straightforward scoring, while GAPI and AGREE provide more visual workflow assessments [6] [2].
Troubleshooting Guides
Problem: High Solvent and Waste Penalties
Symptoms:
- Using >10 mL of organic solvents per sample
- Generating waste without treatment strategies
- High penalty points for reagent hazard and quantity
Solution: Implement Micro-Scale and Solvent-Free Techniques
- Evaluate solvent replacement options: Replace hazardous solvents (chlorinated, toxic) with greener alternatives (water, ethanol, acetone) [6] [2].
- Miniaturize methods: Scale down extraction and separation volumes. Liquid-liquid microextraction can reduce solvent consumption to <1 mL per sample [2].
- Implement solvent recycling: Install systems to recover and purify solvents for reuse.
- Explore direct analysis: Use methods like voltammetry that may eliminate extensive sample preparation [26].
Table: Solvent Waste Penalty Assessment
| Waste Volume per Sample | Hazard Level | Typical Penalty Points | Green Alternatives |
|---|---|---|---|
| >50 mL | High | 10-15 | Microextraction techniques |
| 10-50 mL | Moderate | 5-10 | Miniaturized chromatography |
| <10 mL | Low | 0-5 | Direct injection methods |
| None with treatment | None | 0 | Solvent recovery systems |
Problem: High Energy Consumption Penalties
Symptoms:
- Using energy-intensive equipment (HPLC, GC)
- Long analysis times (>1 hour per sample)
- Special temperature requirements (heating/cooling)
Solution: Optimize Energy Efficiency
- Method transfer: Convert traditional HPLC to UPLC methods to reduce run time and solvent consumption [6].
- Temperature optimization: Conduct analyses at room temperature when possible [5].
- Energy monitoring: Install power meters to quantify energy use and identify improvement areas.
- Batch processing: Group samples to maximize instrument utilization and reduce standby energy.
Experimental Protocol: Energy Reduction Assessment
- Baseline current method energy usage with a power meter
- Modify method parameters (temperature, flow rate, run time)
- Measure energy consumption after optimization
- Calculate penalty point reduction using Eco-Scale criteria
- Verify analytical performance maintains required precision and accuracy
Problem: Hazardous Reagent Penalties
Symptoms:
- Using toxic, corrosive, or environmentally hazardous reagents
- Multiple hazard warning symbols on chemicals
- High penalty points for reagent safety
Solution: Green Reagent Substitution and Modification
- Reagent hazard assessment: Classify all reagents using NFPA or GHS hazard codes [5].
- Safer alternatives: Replace toxic reagents with biodegradable or less hazardous options.
- Catalyst optimization: Use minimal amounts of catalysts rather than stoichiometric reagents.
- Electrochemical methods: Consider voltammetric techniques that use mild supporting electrolytes instead of hazardous derivatization reagents [26].
Table: Research Reagent Solutions for Greener Analysis
| Reagent Type | Traditional Hazardous Options | Green Alternatives | Function |
|---|---|---|---|
| Organic Solvents | Chloroform, hexane, methanol | Ethanol, water, acetone | Extraction, separation |
| Catalysts | Heavy metal catalysts | Biocatalysts, organocatalysts | Reaction acceleration |
| Derivatization Agents | Toxic halogenated compounds | Mild aqueous reagents | Analyte detection |
| Supporting Electrolytes | Toxic metal salts | Biodegradable buffers | Electrochemical analysis |
Symptoms:
- Moderate penalties across multiple categories
- Difficulty achieving excellent green analysis score (>75)
- Need to balance greenness with analytical performance
Solution: Comprehensive Method Greenness Assessment
- Holistic evaluation: Use multiple assessment tools (Eco-Scale, GAPI, AGREE) to identify weaknesses [6] [2].
- Waste hierarchy implementation: Focus on waste prevention first, then reuse, recycling, and treatment.
- Lifecycle thinking: Consider environmental impact beyond immediate laboratory waste.
- Performance integration: Balance green improvements with maintained or enhanced analytical quality.
Experimental Protocols
Protocol 1: Waste Penalty Calculation for Analytical Methods
Purpose: Quantify waste-related penalty points in Analytical Eco-Scale assessment [8] [6].
Materials:
- Laboratory notebook or electronic documentation system
- Safety Data Sheets for all chemicals
- Graduated cylinders or scales for waste measurement
- Analytical Eco-Scale worksheet
Procedure:
- Document all inputs: Record type and volume of all solvents, reagents, and materials used per sample.
- Characterize waste: Identify and measure all waste streams generated, including hazardous categories.
- Assign hazard penalties: Consult Safety Data Sheets and assign penalty points based on:
- Toxicity (T, T+): 5-10 points
- Environmental hazard (N): 5 points
- Flammability (F, F+): 5-10 points
- Explosiveness (E): 10 points
- Calculate quantity penalties: Assign points based on waste volume and concentration.
- Sum waste penalties: Total all points from hazard and quantity assessments.
Calculation Example: Table: Waste Penalty Calculation Example
| Waste Component | Volume per Sample | Hazard Category | Hazard Penalty | Quantity Penalty | Total Penalty |
|---|---|---|---|---|---|
| Acetonitrile waste | 15 mL | Flammable (F) | 5 | 3 | 8 |
| Chloroform residue | 5 mL | Toxic (T) | 5 | 2 | 7 |
| Acidic aqueous waste | 20 mL | Corrosive | 3 | 3 | 6 |
| Total Waste Penalty | 21 |
Protocol 2: Waste Minimization Method Modification
Purpose: Systematically reduce waste generation in existing analytical methods [2] [26].
Materials:
- Current analytical method documentation
- Micro-scale lab equipment (micro-syringes, small-volume vessels)
- Alternative green solvents
- Method validation supplies
Procedure:
- Baseline assessment: Calculate current waste penalties using Protocol 1.
- Identify major contributors: Pinpoint steps generating the most hazardous or voluminous waste.
- Modify method parameters:
- Reduce sample size if detection limits allow
- Scale down solvent volumes proportionally
- Replace hazardous solvents with greener alternatives
- Implement in-line waste treatment if elimination isn't possible
- Validate modified method: Verify analytical performance meets requirements.
- Re-assess waste penalties: Calculate new Eco-Scale score and compare to baseline.
Validation Parameters:
- Accuracy and precision compared to original method
- Detection and quantification limits
- Linearity and range
- Specificity/selectivity
Workflow Diagrams
Waste Penalty Reduction Workflow
Analytical Eco-Scale Calculation Process
Frequently Asked Questions
Q1: What is the Analytical Eco-Scale (AES) and what is its primary purpose? The Analytical Eco-Scale (AES) is a semi-quantitative metric tool designed to assess the environmental impact of analytical chemistry procedures [27]. It helps researchers evaluate and minimize the environmental footprint of their laboratory methods by assigning penalty points for hazardous reagents, waste generation, and high energy consumption, with the goal of promoting more sustainable practices [27].
Q2: My assessment resulted in a high penalty score. What are the most common causes? High penalty points in AES assessments are typically caused by a few key factors [27]:
- Toxic or Hazardous Reagents: Using substances that are persistent, bioaccumulative, and toxic (PBT), corrosive, or otherwise hazardous.
- Excessive Waste Generation: Procedures that produce large quantities of chemical waste.
- High Energy Consumption: Methods that require significant amounts of energy, such as those needing prolonged heating or cooling.
Q3: How can I improve (lower) my AES score? Improving your score focuses on addressing the sources of penalties [27]:
- Substitute Reagents: Replace toxic or hazardous solvents and chemicals with safer, greener alternatives.
- Miniaturize and Reduce: Scale down the procedure to use smaller quantities of all materials.
- Optimize Energy Use: Reduce operation times, lower temperatures, or employ energy-efficient equipment where possible.
Q4: How does the AES compare to other greenness assessment tools like GAPI or AGREE? The AES is known for its simplicity and semi-quantitative nature, using a penalty points system [27]. In contrast, GAPI uses a pentagram pictogram with green, yellow, and red colors for a semi-quantitative comparison [27]. AGREE is a more comprehensive and flexible tool that uses software to generate a clock-like pictogram and a final score from 0 to 1, based on all 12 principles of Green Analytical Chemistry (GAC) [27].
Troubleshooting High Penalty Points
Problem: Excessive Penalty Points from Toxic Reagents
Issue: The solvents or chemicals used in your method are classified as toxic, persistent, bioaccumulative, or hazardous, leading to a high penalty score [27].
Solution:
- Consult Solvent Selection Guides: Refer to established guides like the CHEM-1 tool, which uses safety data sheets to calculate hazard values for solvents [27].
- Identify Safer Alternatives: Replace high-penalty reagents (e.g., chloroform, hexane) with safer options (e.g., ethanol, ethyl acetate).
- Validate the New Method: Ensure that the substitution does not compromise the analytical performance (accuracy, precision) of your method.
Problem: High Penalty from Waste Generation
Issue: Your analytical procedure generates a large volume of waste, incurring significant penalty points [27].
Solution:
- Method Miniaturization: Scale down the sample size and volumes of all reagents used.
- Implement Micro-Extraction Techniques: Utilize modern approaches like liquid-phase microextraction or solid-phase microextraction, which drastically reduce solvent consumption [27].
- Explore Automation and On-Line Analysis: Automated systems and on-line measurements can significantly reduce the waste generated per analysis [27].
Problem: Elevated Energy Consumption Penalties
Issue: Your method requires high energy input, for example, from lengthy heating, cooling, or other energy-intensive processes [27].
Solution:
- Optimize Temperature and Time: Systematically reduce the operating temperature and time to find the minimum energy requirement that still delivers valid results.
- Use Ambient Temperature Procedures: Where possible, develop or adapt methods that work efficiently at room temperature.
- Employ Energy-Efficient Equipment: Switch to modern instruments designed for lower power consumption.
Experimental Protocols for Key AES Experiments
Protocol 1: Reagent Substitution and Evaluation
Objective: To reduce AES penalty points by replacing a hazardous solvent with a greener alternative without sacrificing analytical quality.
Methodology:
- Baseline Assessment: Perform the original analytical method and record the AES score, noting the penalty points from the hazardous solvent.
- Alternative Selection: Research and select a potential green alternative solvent using a GAC metric tool like CHEM-1 [27].
- Method Adaptation: Modify the original method to incorporate the new solvent. This may require adjusting extraction times, pH, or other parameters.
- Comparative Analysis: Run the new method and the original method in parallel, comparing both the AES score and key analytical performance metrics (e.g., recovery, sensitivity).
Protocol 2: Waste Minimization through Method Miniaturization
Objective: To lower the AES waste penalty by reducing the scale of the analytical procedure.
Methodology:
- Volume Audit: Identify the steps in the procedure that use the largest volumes of solvents and samples.
- Scaled-Down Method Development: Systematically reduce volumes (e.g., from mL to µL scale) in these steps. This often involves using different labware (e.g., 96-well plates instead of test tubes) and instrumentation (e.g., micro-syringes).
- Validation: Confirm that the miniaturized method maintains linearity, detection limits, and accuracy compared to the original scale.
- Impact Assessment: Calculate and compare the AES scores for both the original and miniaturized methods, focusing on the reduction in waste penalty points.
Research Reagent Solutions
The table below lists common reagents and their functions, with suggestions for greener alternatives to improve your AES score.
| Reagent / Material | Common Function | Greener Alternative & Function |
|---|---|---|
| Chloroform | Extraction solvent for organic compounds [27] | Cyclopentyl methyl ether (CPME) or Ethyl Acetate; Less toxic, biodegradable solvents for extraction [27]. |
| n-Hexane | Solvent for extraction and chromatography | Heptane or 2-MethylTHF; Safer profile with similar solubility properties. |
| Acetonitrile | Mobile phase in HPLC | Methanol or Ethanol; Less toxic and often derived from renewable resources. |
| Strong Acids (e.g., HCl) | Digestion, pH adjustment, catalysis | Weaker acids (e.g., Citric Acid) or Solid-phase acidulants; Reduces corrosivity and hazard [27]. |
| Solid-Phase Extraction (SPE) Sorbent | Sample clean-up and analyte pre-concentration | Biosorbents (e.g., chitosan, silica); Utilizes renewable materials for extraction [27]. |
Experimental Workflow and Signaling Pathways
AES Assessment Workflow
Green Chemistry Principles Signaling Pathway
Strategic Troubleshooting: Proven Tactics to Slash High Penalty Points
Troubleshooting Guides and FAQs
Frequently Asked Questions
Q1: My reaction yield drops significantly when I switch from DMF to a greener solvent. What could be the cause? A drop in yield can occur due to solubility issues or incorrect processing. First, ensure your reagents are adequately soluble in the new solvent; you may need to gently heat the mixture or use a co-solvent. Second, confirm that your workup and purification methods are appropriate for the new solvent. For instance, a switch from DMF to 2-MeTHF may require adjusting extraction techniques, as 2-MeTHF is immiscible with water, unlike DMF [28].
Q2: How can I quickly assess if my solvent substitution has improved the greenness of my analytical method? Use the Analytical Eco-Scale, a semi-quantitative metric that assigns penalty points to hazardous or environmentally damaging aspects of your method. Calculate your score by starting from 100 and subtracting penalty points for dangerous reagents, energy consumption, and waste. A higher score (closer to 100) indicates a greener method. Compare the Eco-Scale score of your old and new methods to quantify your improvement [29].
Q3: Are there any general rules for selecting a benign solvent for a reaction that traditionally uses dichloromethane (DCM)? Yes, several effective substitutes for DCM exist. Common alternatives include ethyl acetate (EtOAc), 2-methyltetrahydrofuran (2-MeTHF), and cyclopentyl methyl ether (CPME). These solvents often provide similar performance for reactions like amide couplings and extractions but with improved environmental, health, and safety profiles. Always consult a solvent selection guide to verify your choice [28].
Q4: Can water really be used as a solvent for organic reactions? Absolutely. Water can be used effectively in two main ways: "in-water" for homogeneous systems where reactants are soluble, and "on-water" for heterogeneous systems where reactions are accelerated at the interface of insoluble organic compounds and water. Notable examples with enhanced reaction rates include Diels-Alder cycloadditions and Suzuki couplings [30].
Q5: What is a major advantage of using computational tools like SYNTHIA for solvent substitution? Tools like SYNTHIA can integrate solvent considerations directly into the retrosynthetic planning stage. You can configure the software to exclude hazardous solvents outright and prioritize pathways that use solvents classified as "preferred" in green chemistry guides, saving time and embedding sustainability from the blueprint stage [28].
Troubleshooting Common Experimental Issues
Issue: Failed Solvent Swap for Chromatography Purification
- Problem: The separation is poor or the compound does not elute when replacing a traditional DCM/methanol mixture with a greener alternative.
- Solution:
- Adjust Polarity Gradually: Use a mixture of ethyl acetate and ethanol or an ester-alcohol system to mimic the polarity of the original blend [28].
- Modify Gradient: A slower gradient may be required to achieve the same resolution with the new solvent system.
- Test on Small Scale: Always perform a small-scale test run on a TLC plate or a short column before committing a valuable sample.
Issue: Low Conversion in "On-Water" Reaction
- Problem: The reaction rate is slow when attempting an "on-water" reaction with water-insoluble substrates.
- Solution:
- Increase Surface Area: Improve mixing efficiency by using vigorous stirring or a homogenizer to create a finer suspension and increase the interfacial area between the organic phase and water [30].
- Verify Reactant Purity: Ensure that reactants are not contaminated with species that disrupt the water-reactant interface.
Issue: High Penalty Points on the Analytical Eco-Scale Due to Solvent Waste
- Problem: The E-Factor (kg waste/kg product) for your process is too high, leading to a poor Eco-Scale score.
- Solution:
- Solvent Recovery: Implement a solvent recovery system to distill and reuse solvents, dramatically reducing waste [29].
- Switch to Catalytic Systems: Where possible, use catalytic instead of stoichiometric processes to reduce the amount of reagent-derived waste.
- Consider Solvent-Free Conditions: Explore if the reaction can be performed using mechanochemistry (grinding or milling) or thermal methods without any solvent [31].
Experimental Protocols for Key Solvent Substitutions
Protocol 1: Substituting DCM with 2-MeTHF in a Liquid-Liquid Extraction
This protocol is applicable for the extraction of organic compounds from aqueous solutions.
1. Materials and Equipment:
- Separatory funnel
- Aqueous solution containing the product
- 2-MeTHF
- Saturated sodium chloride (brine) solution
- Anhydrous sodium sulfate (or other suitable drying agent)
2. Procedure:
- Transfer the aqueous mixture to a separatory funnel.
- Add a volume of 2-MeTHF approximately equal to the volume of the aqueous phase.
- Stopper the funnel and shake gently, venting frequently to release pressure. (Note: 2-MeTHF has a lower volatility than DCM, but pressure can still build up.)
- Allow the phases to separate completely. 2-MeTHF is less dense than water and will form the top layer.
- Drain the lower aqueous layer from the funnel.
- If performing a back-extraction, add a fresh portion of the aqueous solution to the funnel containing the 2-MeTHF layer and repeat steps 3-5.
- Drain the 2-MeTHF layer (now containing the extracted product) into a clean flask.
- Add a small amount of anhydrous sodium sulfate to the 2-MeTHF solution and swirl until it flows freely, indicating the water has been removed.
- Filter the solution to remove the drying agent.
- Remove the solvent by rotary evaporation to isolate the product. 2-MeTHF typically has a boiling point of 78-80°C [28].
Protocol 2: Performing a Diels-Alder Reaction "On-Water"
This protocol demonstrates a solvent-free approach for accelerated cycloaddition reactions.
1. Materials and Equipment:
- Round-bottom flask or vial with a tight-fitting seal
- Magnetic stir bar
- Diene reagent
- Dienophile reagent
- Deionized water
2. Procedure:
- Combine the diene and dienophile reagents in the reaction vessel. If the reagents are solids, they may be used as-is or lightly ground together.
- Add water to the vessel. The volume of water should be sufficient to create a stirred suspension; the organic compounds should not dissolve.
- Seal the vessel and stir the heterogeneous mixture vigorously at room temperature. The reaction rate is highly dependent on the increased interfacial area created by mixing.
- Monitor the reaction progress by TLC or another analytical method. "On-water" conditions often lead to dramatically enhanced reaction rates compared to organic solvents, with some reactions completing in minutes [30].
- Upon completion, extract the product using a suitable solvent like 2-MeTHF or ethyl acetate (see Protocol 1), or isolate it by filtration if it is a solid.
Quantitative Data for Solvent Assessment
Table 1: Green Chemistry Metrics for Solvent Evaluation
This table summarizes key metrics used to quantify the environmental impact of solvent use, which directly affects the Analytical Eco-Scale score.
| Metric | Formula / Description | Interpretation | Ideal Value |
|---|---|---|---|
| E-Factor [29] | Total mass of waste (kg) / Mass of product (kg) | Measures process waste generation. Lower is better. | ~0 |
| Analytical Eco-Scale [29] | 100 - Total penalty points | A semi-quantitative greenness score for analytical methods. Higher is better. | 100 (ideal) |
| Atom Economy | (MW of desired product / Σ MW of reactants) x 100% | Theoretical efficiency; fraction of atoms from reactants ending up in the product. | 100% |
| Solvent Selection Guide Rating | Categorization (e.g., Preferred, Usable, Undesirable) | Based on health, safety, and environmental criteria. | "Preferred" |
Table 2: Penalty Points for Common Solvents on the Analytical Eco-Scale
This table provides examples of how different solvents are penalized, aiding in the selection of greener alternatives to improve your overall score.
| Solvent | Hazard / Property | Typical Penalty Points (Example) | Greener Alternative (Lower Penalty) |
|---|---|---|---|
| Dichloromethane (DCM) | Halogenated, toxic [28] | High | Ethyl Acetate [28] |
| N,N-Dimethylformamide (DMF) | Toxic, high boiling [28] | High | 2-MeTHF or CPME [28] |
| Benzene | Carcinogenic [28] | Very High (likely excluded) | Toluene or Cyrene [28] |
| Water | Non-toxic, safe [30] | 0 (unless high energy for removal) | N/A |
| Ethanol | Low toxicity, renewable [28] | Low | N/A |
Visual Workflows for Solvent Substitution Strategy
Solvent Selection Logic
On-Water Reaction Workflow
The Scientist's Toolkit: Research Reagent Solutions
Table 3: Essential Materials for Green Solvent Substitution
| Item | Function / Application |
|---|---|
| 2-Methyltetrahydrofuran (2-MeTHF) | A renewable, biomass-derived solvent used as a substitute for THF and DCM in extractions and reactions like Grignard and amide couplings [28]. |
| Cyclopentyl Methyl Ether (CPME) | A versatile ether solvent with high stability, low water solubility, and excellent resistance to peroxide formation, used as a replacement for THF and 1,4-dioxane [28]. |
| Ethyl Lactate | A bio-based, biodegradable solvent derived from corn, suitable for applications in extraction, chromatography, and as a replacement for halogenated solvents [32]. |
| Deep Eutectic Solvents (DESs) | Mixtures that form a eutectic with a melting point lower than that of each individual component; used as designer solvents for extractions and chemical synthesis [32]. |
| Supercritical CO₂ (scCO₂) | A non-toxic, non-flammable alternative to organic solvents used in extraction and reaction engineering, which leaves no residue upon depressurization [32]. |
| Solvent Selection Guides | Documents (e.g., from ACS GCI) that categorize solvents based on comprehensive EHS criteria, providing a quick reference for identifying preferred alternatives [28]. |
Miniaturization and Micro-Scale Techniques to Reduce Consumption
The Analytical Eco-Scale is a semi-quantitative tool used to evaluate the greenness of analytical procedures. An ideal green analysis starts with a score of 100 points. Penalty points are subtracted for the use of hazardous reagents, excessive energy consumption, and waste generation. A higher final score indicates a greener method, with scores above 75 considered excellent, and scores below 50 representing an insufficient green approach [33].
Miniaturized techniques are strategic for improving this score because they directly reduce the consumption of solvents and samples, minimize waste, and often lower energy requirements, thereby avoiding significant penalty points [34] [35].
Frequently Asked Questions
Q1: My sample preparation is causing high penalty points due to solvent use. How can miniaturization help? Traditional sample preparation, like liquid-liquid extraction (LLE), often uses large volumes of hazardous solvents, incurring high penalty points on the Eco-Scale. Miniaturized liquid-phase techniques directly address this issue [35].
- Strategy: Transition from conventional LLE to Liquid-Phase Microextraction (LPME) or related methods.
- Benefit: These techniques are distinguished by minimal use of organic solvents and sample volumes, drastically reducing the penalty points assigned for hazardous reagents and waste [35].
Table: Comparison of Conventional vs. Miniaturized Liquid-Based Sample Preparation
| Feature | Conventional LLE | Liquid-Phase Microextraction (LPME) |
|---|---|---|
| Typical Solvent Volume | 100-1000 mL [35] | < 100 µL (DLLME); ~1-3 µL (HF-LPME) [35] |
| Solvent Hazard Penalty | High | Significantly Reduced |
| Waste Generation | High (> 50 g, penalty on NEMI) [6] | Very Low |
| Key Advantage | Well-established | Versatile designs, can be integrated with online systems [35] |
Q2: How can I reduce waste and energy consumption from solid-phase extraction? Solid-phase extraction (SPE) can be resource-intensive. Evolving this technique into miniaturized solid-phase-based approaches offers a greener pathway [35].
- Strategy: Implement Microextraction by Packed Sorbent (MEPS) or Dispersive µ-Solid Phase Extraction (D-µSPE).
- Benefit: These methods drastically reduce the amount of sorbent required and the solvent needed for elution. They can also be automated and integrated with analytical instruments, reducing analysis time and energy consumption per sample [35] [36].
Table: Comparison of Conventional vs. Miniaturized Solid-Based Sample Preparation
| Feature | Conventional SPE | MEPS / D-μSPE |
|---|---|---|
| Sorbent Mass | 100-1000 mg | ≤ 10 mg [35] |
| Eluent Volume | 5-10 mL | ~100 µL [35] |
| Automation & Integration | Possible, but complex | More easily automated and integrated online [35] |
| Analysis Time | Longer | Shorter |
| Energy Consumption per Sample | Higher | Lower [36] |
Q3: I need to analyze complex samples like food or pharmaceuticals. Are miniaturized techniques robust enough? Yes. Both liquid- and solid-based miniaturized approaches have proven to be valuable for complex matrices like food, biological fluids, and pharmaceutical products [34] [35].
- Strategy: Select a technique based on your analyte and matrix.
- Guidance:
- For ionic or ionizable analytes, techniques like Electromembrane Extraction (EME) offer high selectivity [35].
- For complex solid samples (e.g., food, soil), Dispersive µ-SPE is highly effective due to the direct contact between the sorbent and the sample [35].
- For chiral separation of active pharmaceutical ingredients (APIs), miniaturized capillary electrophoresis techniques are highly effective and versatile [34].
Q4: My analytical method validation shows poor sensitivity after miniaturization. What can I do? A common pitfall is overlooking the importance of pre-concentration. A key advantage of most microextraction techniques is their inherent ability to pre-concentrate the analyte during the extraction process [35].
- Troubleshooting Steps:
- Review Extraction Parameters: Ensure factors like extraction time, solvent/sorbent type, and sample pH are optimized for your specific analyte to maximize extraction efficiency and pre-concentration.
- Confirm Pre-concentration Factor: Calculate the pre-concentration factor of your method. A well-optimized miniaturized method should yield a significant pre-concentration factor, offsetting the reduced sample volume and improving overall sensitivity [35].
Q5: How do I convince my lab to transition from a standard method to a miniaturized one? Frame the argument around performance, cost, and sustainability.
- Justification:
- Performance: Miniaturized techniques often provide superior selectivity, faster analysis times, and compatibility with modern instrumentation (e.g., LC-MS, capillary LC) [34] [35].
- Economic & Safety: They lower costs for solvents and waste disposal and enhance operator safety by reducing exposure to hazardous chemicals [36].
- Regulatory Trends: Highlight that regulatory agencies are increasingly assessing the environmental impact of standard methods, creating a need for greener alternatives [36].
Experimental Protocol: Hollow Fiber Liquid-Phase Microextraction (HF-LPME)
This protocol provides a detailed methodology for implementing a miniaturized, low-waste sample preparation technique suitable for liquid samples [35].
1. Principle A supported liquid membrane (SLM) is immobilized in the pores of a hollow fiber, which separates the aqueous sample (donor phase) from the acceptor phase inside the fiber lumen. Analytes are extracted from the sample, through the SLM, and into the acceptor phase based on pH control and partitioning [35].
2. Workflow Diagram
3. Step-by-Step Procedure
- Step 1: Prepare Hollow Fiber: Cut a short piece (e.g., 1-3 cm) of porous hollow fiber (e.g., polypropylene).
- Step 2: Immobilize Solvent: Dip the fiber into a water-immiscible organic solvent (e.g., dihexyl ether, 1-octanol) to immobilize it in the pore structure, creating the Supported Liquid Membrane (SLM). Gently wipe away excess solvent.
- Step 3: Load Acceptor Phase: Using a micro-syringe, fill the lumen (inner cavity) of the fiber with a small volume (typically 10-30 µL) of an aqueous acceptor solution. The pH of this solution must ensure the analyte becomes ionized and trapped upon entry.
- Step 4: Assemble Device: Seal the ends of the fiber and place it into the vial containing the aqueous sample (donor phase). The sample pH should be adjusted so the analyte is in its neutral form, allowing it to partition into the SLM.
- Step 5: Extract: Agitate the vial for a predetermined extraction time (e.g., 15-45 minutes) to facilitate mass transfer.
- Step 6: Analyze: After extraction, retract the acceptor phase back into the syringe. This concentrated extract is now ready for direct injection into an analytical instrument like HPLC or LC-MS.
The Scientist's Toolkit: Key Reagent Solutions
Table: Essential Materials for Miniaturized Methods
| Item | Function / Application |
|---|---|
| Hollow Fibers (Polypropylene) | The physical support for the liquid membrane in HF-LPME; provides a high surface area for extraction while protecting the acceptor phase [35]. |
| Selective Liquid Membrane Solvents | Forms the SLM in HF-LPME; choice of solvent (e.g., 1-octanol, dihexyl ether) is critical for achieving high selectivity and extraction efficiency for target analytes [35]. |
| Novel Sorbent Materials | Used in µ-SPE techniques; includes materials like molecularly imprinted polymers (MIPs) for high selectivity, or green sorbents like cyclodextrins, which improve method greenness [35]. |
| Ionic Liquids | Used as green solvent alternatives in some LPME configurations due to their low volatility and tunable physicochemical properties [35]. |
| Novel Chiral Selectors | Used in miniaturized separation techniques like Capillary Electrophoresis or Nano-LC for the enantiomeric separation of chiral active pharmaceutical ingredients (APIs) [34]. |
Optimizing Instrument Parameters for Energy and Time Efficiency
Troubleshooting Guides
How can I reduce solvent-related penalty points in my HPLC method?
Issue: High penalty points from hazardous solvent use and waste generation in High-Performance Liquid Chromatography (HPLC).
Solution: Implement strategies to replace, reduce, and recycle solvents.
- Replace with Greener Solvents: Substitute traditional solvents like acetonitrile with safer, bio-based alternatives. Ethanol is a non-toxic, biodegradable, and bio-renewable option. Water, especially superheated water chromatography (75–180°C), can significantly reduce or eliminate organic solvent requirements [37].
- Reduce Solvent Consumption: Scale down your method. Using columns with smaller inner diameters and smaller particles (e.g., in UHPLC systems) can reduce solvent consumption by over 80% while maintaining resolution and sensitivity [38] [37].
- Recycle Solvent Waste: For isocratic methods, implement solvent recovery systems. Techniques like membrane filtration (e.g., Organic Solvent Nanofiltration) or density-based recirculation can purify and recycle solvents, reducing waste and raw material costs [37] [39].
What instrument adjustments decrease energy consumption during long screening runs?
Issue: Excessive energy use from prolonged operation, especially in high-throughput screening (HTS) and chromatography.
Solution: Optimize run parameters and leverage modern instrument features.
- Shorten Run Times: In HPLC/UHPLC, use shorter columns packed with smaller or superficially porous particles. This allows for faster separations and higher throughput, reducing energy use per sample [37]. In Gas Chromatography (GC), using hydrogen as a carrier gas can enable faster separations than nitrogen or helium, shortening run times [38].
- Lower Operational Temperatures: Optimize methods to run at lower temperatures. Reducing the need for high-temperature operation in GC and HPLC directly lowers energy consumption [38].
- Utilize Automation and AI: Employ instruments with smart automation that can optimize separation conditions in real-time or enter low-power standby modes when idle. AI-driven software can predict optimal conditions, minimizing trial-and-error experiments that consume energy [38].
How can I improve time efficiency in High-Throughput Screening (HTS) without compromising data quality?
Issue: HTS processes are time-consuming, and inefficiencies can lead to bottlenecks in drug discovery.
Solution: Enhance efficiency through automation, advanced assay design, and data handling.
- Implement Quantitative HTS (qHTS): This paradigm generates full concentration-response curves for each compound in a single primary screen, providing richer data (EC50, maximal response) upfront and reducing the need for lengthy follow-up confirmation assays [40].
- Automate Workflows: Integrated robotic systems can transport assay microplates through all steps—sample addition, incubation, and readout—without manual intervention, drastically increasing throughput [40].
- Employ Robust Hit-Selection Metrics: Use advanced statistical methods for quality control and hit selection. Metrics like the Z-factor and Strictly Standardized Mean Difference (SSMD) help identify high-quality assays and true "hits" more reliably, reducing time wasted on false positives [40] [41].
Frequently Asked Questions (FAQs)
The most significant penalties typically come from hazardous reagents (highly toxic or environmentally dangerous solvents), energy-intensive techniques (prolonged heating/cooling, high-pressure systems), and wasteful workflows (high solvent consumption, poor mass intensity, and complex purification like classical chromatography) [8] [5]. Focusing mitigation efforts here yields the greatest improvement in your Eco-Scale score.
Can I make my method greener without re-validation?
It is challenging but possible. Significant changes to mobile phase composition typically require full re-validation according to pharmacopoeias [37]. However, you can adopt "greener equipment" and optimize existing method parameters without altering the core chemistry. This includes using solvent recyclers for isocratic runs, switching to a column with smaller dimensions (reducing flow rates and solvent use), or using a column chiller to efficiently manage temperature [37].
How does miniaturization contribute to a greener Eco-Scale profile?
Miniaturization directly reduces the consumption of all materials—reagents, solvents, and samples. Techniques like microfluidic chromatography (lab-on-a-chip) or using 384- or 1536-well microtiter plates in HTS work with ultra-low volumes [38] [40]. This leads to a lower Environmental Factor (E-factor) by minimizing waste generation, reduces hazardous exposure, and can lower energy requirements, all of which decrease penalty points [5].
Are there green alternatives to silica-based chromatography columns?
Yes, research is ongoing into more sustainable stationary phases. Cellulose-based materials are derived from renewable sources and offer more sustainable disposal options [38]. Metal-Organic Frameworks (MOFs) show promise due to their high porosity, tunable selectivity, and potential for recyclability [38]. Furthermore, techniques like Centrifugal Partition Chromatography (CPC) eliminate the solid support altogether, using a liquid-liquid system and thereby generating no solid waste from spent columns [39].
The following tables summarize key metrics and strategies for optimizing instrument parameters to improve Eco-Scale scores.
Table 1: Eco-Scale Penalty Points for Common Instrumental Parameters [5]
| Parameter | Condition | Penalty Points |
|---|---|---|
| Technical Setup | Common setup | 0 |
| Unconventional activation (e.g., microwave, ultrasound) | 2 | |
| Pressure equipment > 1 atm | 3 | |
| Temperature/Time | Room temperature, < 1 h | 0 |
| Room temperature, < 24 h | 1 | |
| Heating, < 1 h | 2 | |
| Heating, > 1 h | 3 | |
| Cooling to 0°C | 4 | |
| Cooling, < 0°C | 5 | |
| Workup & Purification | Simple filtration / Solvent removal (bp < 150°C) | 0 |
| Crystallization and filtration | 1 | |
| Liquid-liquid extraction / Distillation | 3 | |
| Classical chromatography | 10 |
Table 2: Optimization Strategies for Reduced Eco-Scale Penalties
| Optimization Goal | Strategy | Estimated Improvement & Impact |
|---|---|---|
| Reduce Solvent Hazard | Replace acetonitrile with ethanol or water [37] | Eliminates penalties for toxic (T) solvents (5 pts) and reduces environmental (N) impact. |
| Reduce Solvent Consumption | Switch from HPLC (4.6 mm ID) to UHPLC (2.1 mm ID) [38] [37] | Can reduce solvent use by >80%, directly lowering waste and cost. |
| Decrease Energy/Time | Use shorter, more efficient columns; lower GC temperatures [38] [37] | Reduces "Heating, >1 h" penalty (3 pts) and operational energy costs. |
| Minimize Waste | Adopt solvent recycling (e.g., nanofiltration) [39] | Lowers E-factor (waste-to-product mass ratio) and environmental impact. |
| Avoid High-Penalty Purification | Replace classical chromatography with CPC or simpler methods [5] [39] | Avoids the 10-point penalty for classical chromatography. |
Experimental Protocols
Protocol 1: Transitioning a HPLC Method to a Greener Solvent System
Objective: Modify an existing reversed-phase HPLC method to replace acetonitrile with ethanol, reducing toxicity penalty points.
Materials:
- HPLC/UHPLC system
- C18 column (e.g., 150 x 4.6 mm, 5 µm for HPLC; or 100 x 2.1 mm, 1.7 µm for UHPLC)
- Stock solutions of analytes
- Acetonitrile (HPLC grade), Ethanol (absolute, HPLC grade), Water
Methodology:
- Initial Profiling: Run the original method with acetonitrile-water to establish a baseline chromatogram (retention times, resolution, peak shape).
- Direct Substitute: Prepare a mobile phase using ethanol as a direct substitute for acetonitrile, maintaining the same organic-to-aqueous ratio. Note: Ethanol is more viscous than acetonitrile, which will increase system backpressure.
- Method Adjustment:
- To compensate for viscosity: Gradually increase the column temperature (e.g., from 25°C to 40-60°C) to lower backpressure and improve efficiency [37].
- To adjust selectivity: Slightly modify the percentage of ethanol in the mobile phase (e.g., ±5-10%) to achieve a similar retention profile to the original method. Ethanol's elution strength differs from acetonitrile.
- Validation: Once optimal separation is achieved, validate the new method for critical performance attributes including resolution, precision, and accuracy.
Protocol 2: Implementing a Microfluidic HTS Assay for Cytoprotection
Objective: Establish a miniaturized, cell-based HTS assay to identify neuroprotective compounds, reducing reagent consumption and waste.
Materials:
- 384-well or 1536-well microtiter plates
- Robotic liquid handling system
- Primary neurons or relevant neuronal cell line
- Compound library (e.g., in DMSO)
- Fluorescent viability dye (e.g., Calcein AM)
- Fluorescent plate reader
Methodology:
- Plate Seeding: Using an automated dispenser, seed cells uniformly into the microtiter plates at an optimized density and culture until adherent.
- Compound Transfer: Pin-transfer or acoustically dispense nanoliter volumes of compounds from the library onto the cells. Include controls (e.g., DMSO-only for negative control, a known toxin for positive control of death).
- Incubation & Induction: Incubate plates to allow compound interaction. Induce neurodegeneration using a specific stressor (e.g., oxidative stress, toxin).
- Viability Staining and Readout: After an appropriate period, add a fluorescent viability dye. Incubate and then measure fluorescence intensity with a plate reader. Live cells will convert the non-fluorescent dye into a fluorescent product.
- Data Analysis:
- Calculate the Z'-factor for the assay to confirm robustness
Z' = 1 - [3*(σ_positive + σ_negative) / |μ_positive - μ_negative|]. A Z'>0.5 is excellent for HTS [40]. - Normalize compound well data to controls (0% death for negative, 100% death for positive).
- Identify "hits" as compounds that show a statistically significant increase in cell viability compared to the positive control.
- Calculate the Z'-factor for the assay to confirm robustness
Methodology Visualization
HTS Cytoprotection Screening Workflow
Green HPLC Method Transition
The Scientist's Toolkit: Research Reagent Solutions
Table 3: Essential Materials for Green Analytical Method Development
| Item | Function | Green Rationale |
|---|---|---|
| Ethanol (Bio-based) | Green mobile phase substitute for acetonitrile in reversed-phase HPLC [37]. | Non-toxic, biodegradable, and produced from renewable bio-waste, reducing hazardous waste penalties. |
| Water (Superheated) | Mobile phase for high-temperature liquid chromatography [37]. | Eliminates organic solvent use entirely. The most benign solvent with zero environmental penalty. |
| Supercritical CO₂ | Primary mobile phase for Supercritical Fluid Chromatography (SFC) [38] [37]. | Non-toxic, non-flammable, and easily recycled. SFC drastically reduces organic solvent waste. |
| UHPLC System | Instrumentation for high-pressure, fast separations [38]. | Enables use of smaller column dimensions and particles, reducing solvent consumption by over 80%. |
| Cellulose-based Stationary Phases | Chromatographic column packing material [38]. | Derived from renewable sources, offering a more sustainable alternative to traditional silica. |
| Microtiter Plates (1536-well) | Assay plates for High-Throughput Screening [40]. | Enables miniaturization, drastically reducing volumes of reagents, samples, and solvents per data point. |
| Hydrogen Generator | On-demand source of carrier gas for Gas Chromatography [38]. | Provides hydrogen for faster GC separations than nitrogen, saving time and energy. Eliminates cylinder waste. |
Implementing Waste Recycling and Treatment Protocols
Frequently Asked Questions (FAQs)
Q1: What is the Analytical Eco-Scale, and why is it important for my research? The Analytical Eco-Scale is a semi-quantitative tool that evaluates the greenness of analytical procedures. It starts with a base score of 100, representing an ideal green analysis, and subtracts penalty points for the use of hazardous reagents, high energy consumption, and waste generation. It is crucial for researchers as it provides a clear, numerical score to assess and improve the environmental sustainability of their analytical methods, aligning with the principles of Green Analytical Chemistry (GAC) [8] [6] [42].
Q2: My method received a low Eco-Scale score due to "waste." What does this mean? In the Analytical Eco-Scale, penalty points for waste are assigned based on the amount produced per analysis. Producing more than 10 grams of waste typically incurs penalty points. A low score indicates that the waste generated by your method is significant and its environmental impact needs to be mitigated through recycling, treatment, or source reduction [6] [42].
Q3: Are there other greenness metrics besides the Analytical Eco-Scale? Yes, numerous GAC metrics have been developed. Common tools include the National Environmental Methods Index (NEMI), the Green Analytical Procedure Index (GAPI), and the analytical greenness calculator (AGREE). Each has different strengths; for instance, AGREE provides a comprehensive visual based on the 12 principles of GAC, while NEMI offers a simple pass/fail pictogram. Using multiple metrics can give a more complete picture of your method's environmental impact [11] [43] [6].
Q4: What is considered an acceptable Analytical Eco-Scale score? Scores are generally interpreted as follows [42]:
- ≥ 75: Excellent green analysis.
- Between 50 and 74: Acceptable green analysis.
- < 50: Insufficient green analysis.
Q5: How can I reduce penalty points related to reagents and solvents? The key strategies are [8] [43]:
- Replacement: Switch to safer, less hazardous solvents (e.g., ethanol or water-based systems instead of acetonitrile).
- Reduction: Miniaturize the method to reduce volumes or implement on-line recycling.
- Treatment: Implement on-line decontamination (degradation, passivation) of wastes before disposal.
Troubleshooting Guide: High Penalty Points in Analytical Eco-Scale
This guide helps diagnose and resolve common issues that lead to a low Analytical Eco-Scale score.
Waste Generation and Management
Problem: Excessive waste generation per analysis. Waste generation is a critical parameter in greenness assessment. The ideal green analysis produces no waste, but this is rarely achievable. Penalty points are assigned as the amount of waste increases [8] [42].
Solutions and Protocols:
- Source Reduction: The most effective strategy is to reduce waste at the source.
- Protocol for Method Miniaturization: Scale down your analytical method. For liquid chromatography, transition from a conventional 4.6 mm internal diameter (ID) column to a narrow-bore (e.g., 2.1 mm ID) or capillary column (e.g., 0.3 mm ID). This can reduce mobile phase consumption and waste generation by over 90% without compromising chromatographic performance. Ensure the instrument flow path and detector cell are compatible with the reduced flow rates.
- Protocol for Solvent-Less or Solvent-Free Techniques: For sample preparation, replace liquid-liquid extraction with solid-phase microextraction (SPME) or stir bar sorptive extraction (SBSE). These techniques can eliminate the use of extraction solvents entirely, drastically reducing hazardous waste [43].
- Waste Recycling and Treatment:
- Protocol for On-Site Solvent Recycling: For mixed organic wastes like acetonitrile/water or methanol/water from HPLC, implement a fractional distillation system. Collect waste mobile phase in a dedicated, labeled container. Using a laboratory-scale distillation apparatus, the mixture can be separated, and the high-purity organic solvent can be recovered for reuse in non-critical applications like glassware washing or as a starting point for preparing new mobile phases. Caution: Only attempt this with wastes containing compatible solvents and ensure no hazardous or reactive contaminants are present.
- Protocol for On-Line Waste Degradation: For wastes containing trace toxic analytes or reagents, set up an on-line treatment step. This involves passing the effluent from your instrument through a photochemical reactor (e.g., containing UV lamps and a TiO₂ catalyst) before disposal. This can degrade many organic pollutants, reducing the toxicity of the waste stream and its environmental impact [8].
Hazardous Reagents and Solvents
Problem: High penalty points from hazardous chemicals. The Analytical Eco-Scale assigns penalty points based on the type and quantity of reagents used. More hazardous chemicals (e.g., carcinogenic, toxic, corrosive) incur higher penalties [42].
Solutions and Protocols:
- Reagent Substitution:
- Protocol for Safer Solvent Assessment: Use the Solvent Selection Guide from the ACS Green Chemistry Institute or a similar tool to evaluate your current solvents. Replace high-penalty solvents like chloroform, hexane, or acetonitrile with greener alternatives such as ethanol, acetone, or ethyl acetate. For example, in reversed-phase HPLC, acetonitrile can often be substituted with ethanol, though this may require method re-optimization due to changes in viscosity and elution strength [44].
- Reagent Reduction:
- Protocol for Derivatization Minimization: Avoid derivatization steps whenever possible by choosing an alternative detection technique (e.g., mass spectrometry instead of UV/Vis). If derivatization is unavoidable, use the smallest possible reagent volume and the least hazardous agent available [43].
High Energy Consumption
Problem: Penalty points from high energy use. Energy consumption greater than 0.1 kWh per sample incurs penalty points. Energy-intensive equipment like gas chromatographs or long analytical runs contribute to this [8] [6].
Solutions and Protocols:
- Instrument and Method Optimization:
- Protocol for Reducing HPLC Run Time: Use a method development tool like a Design of Experiment (DoE) approach to optimize chromatographic conditions. Factors like column temperature, flow rate, and gradient steepness can be varied to find the shortest possible runtime that maintains resolution. Reducing a 30-minute run to 10 minutes cuts energy consumption and waste by two-thirds.
- Protocol for Instrument Downtime Management: Implement a standard operating procedure (SOP) to power down or switch instruments to low-energy "standby" modes during extended periods of non-use (e.g., overnight, weekends).
The following table summarizes the main penalty areas and corrective actions in the Analytical Eco-Scale.
Table: Troubleshooting High Penalty Points in Analytical Eco-Scale Assessment
| Penalty Category | Common Causes | Corrective Actions & Protocols | Expected Outcome |
|---|---|---|---|
| Reagents | Use of chlorinated solvents (e.g., chloroform), toxic derivatization agents. | Substitution: Replace with safer solvents (e.g., ethyl acetate, ethanol). Reduction: Miniaturize sample preparation [43]. | Lower hazard penalty, reduced waste volume. |
| Waste | >10g of waste per analysis; untreated hazardous waste. | Source Reduction: Method miniaturization (e.g., capillary LC). Recycling/Treatment: On-site solvent recovery; on-line degradation [8]. | Drastic reduction in waste penalty points. |
| Energy | Long analytical runtimes; energy-intensive techniques (e.g., GC-MS). | Optimization: Shorten run times via DoE. Automation: Batch processing to reduce idle time. | Energy consumption below 0.1 kWh/sample penalty threshold. |
Research Reagent and Material Solutions
This table details key materials and their functions in developing greener analytical methods.
Table: Essential Reagents and Materials for Sustainable Analytical Methods
| Item | Function in Green Method Development | Example & Rationale |
|---|---|---|
| Safer Solvents | To replace hazardous solvents in extraction and chromatography. | Ethanol or acetone as a replacement for acetonitrile in HPLC; less toxic and bio-based sources available [44]. |
| Micro-Extraction Devices | To enable miniaturized, solvent-less sample preparation. | Solid-Phase Microextraction (SPME) fibers; eliminate use of organic solvents for extraction, integrating sampling and concentration [43]. |
| Narrow-Bore HPLC Columns | To reduce mobile phase consumption and waste generation. | A 2.1 mm ID column vs. a standard 4.6 mm ID column; reduces solvent use and waste by approximately 80% at the same flow path linear velocity. |
| On-Line Degradation Reactor | To treat hazardous waste streams before disposal. | A UV/TiO₂ photochemical reactor; placed in the waste line of an HPLC to break down toxic organic analytes and reduce effluent toxicity [8]. |
Workflow and Relationship Diagrams
The following diagram illustrates the logical decision process for improving an analytical method's Eco-Scale score, focusing on waste management.
Diagram 1: Waste Management Strategy for Eco-Scale Improvement
The following diagram shows the hierarchy and focus of major Green Analytical Chemistry (GAC) metrics, placing the Analytical Eco-Scale in context.
Diagram 2: A Landscape of Common Green Analytical Chemistry Metrics
Integrating Automation and Green Sample Preparation (GSP) Principles
The Analytical Eco-Scale is a semi-quantitative tool used to assess the greenness of analytical methods. It assigns a starting score of 100 points to an ideal green analysis, from which penalty points are subtracted for hazardous reagents/solvents, energy consumption, waste generation, and other environmental and safety concerns [6]. A higher final score indicates a greener method. This technical support center addresses how integrating automation with the Ten Principles of Green Sample Preparation (GSP) can systematically reduce these penalty points, aiding researchers in developing more sustainable methodologies [45].
Troubleshooting High Penalty Points in Analytical Eco-Scale
This section addresses common experimental issues that lead to high penalty points, providing root-cause analyses and solutions grounded in GSP principles and automation.
High Penalty from Hazardous Solvent Use
- Problem: My method uses chlorinated solvents (e.g., chloroform), incurring high penalty points.
- Root Cause: Traditional Liquid-Liquid Extraction (LLE) often defaults to historically effective but highly toxic solvents. Chloroform is persistent, bioaccumulative, and toxic, leading to significant penalties [6].
- Solution:
- Substitute with Greener Solvents: Replace chlorinated solvents with safer alternatives like ethyl acetate or cyclopentyl methyl ether (CPME) [6].
- Automate Solvent Switching: Implement an automated solvent selection system that prioritizes pre-vetted green solvents from a database, eliminating manual error.
- Apply GSP Principle 1: "Use safe, renewable, and biodegradable solvents and reagents" [45].
High Penalty from Excessive Waste Generation
- Problem: My sample preparation generates over 50 g of waste per sample, resulting in a penalty.
- Root Cause: Conventional extraction techniques (e.g., classic LLE or Soxhlet) use large volumes of solvents and single-use materials [6].
- Solution:
- Automate Miniaturized Techniques: Transition to automated Micro-Solid Phase Extraction (μ-SPE) or liquid-phase microextraction devices that consume microliters of solvent [6].
- Implement Solvent Recycling Loops: Integrate an in-line distillation or purification unit within an automated workflow to recover and reuse solvents.
- Apply GSP Principle 4: "Minimize waste generation" and Principle 2: "Use renewable, recycled, and reusable materials" [45].
High Penalty from High Energy Consumption
- Problem: My sample preparation requires prolonged heating or cooling, increasing energy use above 0.1 kWh per sample.
- Root Cause: Energy-intensive steps like evaporation under a nitrogen stream, sonication, or lengthy incubations [6].
- Solution:
- Automate Room-Temperature Protocols: Develop and automate methods that utilize enzymatic digestion or efficient magnetic stirring at ambient temperature.
- Optimize Energy Use with Sensors: Use automated systems with in-line sensors to apply energy (heat, ultrasound) only for the minimum required duration, avoiding idle consumption.
- Apply GSP Principle 5: "Minimize energy demand" [45].
High Penalty from Low Sample Throughput and Manual Labor
- Problem: My method is slow and labor-intensive, limiting the number of samples processed per day and increasing procedural risks.
- Root Cause: Reliance on manual, sequential sample processing steps such as centrifugation, phase separation, and solvent transfer [6].
- Solution:
- Implement Automated Parallel Processing: Use a robotic liquid handler capable of processing 96- or 384-well plates simultaneously.
- Create Integrated Workflows: Automate the entire sequence from sample weighing and derivation to extraction and injection into the analysis instrument.
- Apply GSP Principle 7: "Enable high sample throughput" and Principle 8: "Automate" [45].
The table below summarizes common penalty points in the Analytical Eco-Scale and their automated, GSP-based solutions [6].
Table 1: Troubleshooting High Penalty Points in the Analytical Eco-Scale
| Penalty Category | Specific Issue | Penalty Points | Automated GSP Solution | Principle Addressed |
|---|---|---|---|---|
| Reagents & Solvents | Use of chloroform | >5 | Automated solvent switcher to ethyl acetate | GSP Principle 1 [45] |
| Use of strong acid (>0.1 M) | 3-5 | Automated pH-controlled dilution | GSP Principle 1 [45] | |
| Energy Consumption | >1.5 kWh per sample | 5 | Automated room-temperature protocols | GSP Principle 5 [45] |
| 0.1 - 1.5 kWh per sample | 1-4 | In-line sensors for optimized energy use | GSP Principle 5 [45] | |
| Waste Generation | >10 g per sample | 3-5 | Automated µ-SPE | GSP Principle 4 [45] |
| Occupational Hazard | Manual, open-system handling | 2-3 | Robotic liquid handling in enclosed space | GSP Principle 9 [45] |
| Throughput | <10 samples per hour | Implicit | Parallel processing in 96-well format | GSP Principle 7 [45] |
Experimental Protocol: Automating a Greener Sample Preparation
This protocol details the transition from a manual, high-penalty LLE to an automated, greener Solid-Phase Extraction (SPE) method for determining compounds in plasma [6].
Original Manual LLE Method (High Penalty)
- Objective: Extract guaifenesin and bromhexine from human plasma.
- Procedure:
- Alkalinization: Mix 1 mL plasma with 0.5 mL of 0.1 M NaOH.
- Extraction: Add 5 mL of chloroform, vortex mix for 5 minutes.
- Centrifugation: Centrifuge at 4000 rpm for 10 minutes.
- Evaporation: Manually transfer the organic layer and evaporate to dryness under a nitrogen stream at 50°C.
- Reconstitution: Reconstitute the residue with 200 µL of mobile phase.
- Analysis: UPLC-MS/MS [6].
Automated GSP-Based µ-SPE Method (Low Penalty)
- Objective: Achieve the same extraction with reduced penalties via automation and GSP.
- Equipment & Reagents:
- Robotic Liquid Handler (e.g., Hamilton Microlab STAR)
- 96-well µ-SPE plates (C18 stationary phase)
- Positive Pressure Manifold
- Greener Solvents: Ethanol, water, ethyl acetate.
- Procedure:
- Protein Precipitation: The robot aliquots 200 µL of plasma into a 96-well plate and adds 400 µL of ice-cold ethanol. The plate is sealed, mixed, and centrifuged.
- Conditioning: The µ-SPE plate is automatically conditioned with 200 µL of methanol and equilibrated with 200 µL of water.
- Sample Loading: The supernatant from step 1 is transferred to the µ-SPE plate.
- Washing: The sorbent is washed with 300 µL of a 5:95 ethanol/water mixture.
- Elution: Analytics are eluted with 150 µL of ethyl acetate into a collection plate.
- Evaporation & Reconstitution: The collection plate is evaporated in a gentle, automated nitrogen evaporator and reconstituted with 50 µL of mobile phase.
- Analysis: UPLC-MS/MS.
The Scientist's Toolkit: Key Research Reagent Solutions
Table 2: Essential Materials for Automated Green Sample Preparation
| Item | Function & Green Justification |
|---|---|
| Robotic Liquid Handler | Automates liquid transfers, dispensing, and aspiration; enables miniaturization, high throughput, and improves operator safety (GSP Principle 9) [45]. |
| 96-well µ-SPE Plates | Miniaturized format for parallel processing; drastically reduces solvent consumption and waste generation (GSP Principles 4 & 7) [45]. |
| Cyclopentyl Methyl Ether (CPME) | A greener, bio-based solvent with low toxicity and excellent environmental profile; ideal for replacing ethers and chlorinated solvents (GSP Principle 1) [6]. |
| Ethyl Lactate | A non-toxic, biodegradable solvent derived from corn; suitable for liquid-liquid extractions and cleaning protocols (GSP Principle 1) [6]. |
| Magnetic Stirring & Heating | Provides efficient, controlled mixing and heating with lower energy consumption compared to sonication or oil baths (GSP Principle 5) [45]. |
| In-line pH & Mass Sensors | Provide real-time feedback for automated process control, ensuring optimal conditions and minimizing reagent excess (GSP Principles 5 & 6) [45]. |
Workflow Diagram: A Systematic Path to Lower Penalty Points
The following diagram visualizes the decision-making process for troubleshooting high penalty points using automation and GSP principles.
Beyond the Eco-Scale: Validating Improvements with AGREE, BAGI, and White Analytical Chemistry
Using AGREE and AGREEprep for a Holistic Greenness Profile
Frequently Asked Questions (FAQs)
Q1: What is the core difference between AGREE and AGREEprep?
AGREE provides a comprehensive greenness assessment of the entire analytical procedure based on the 12 principles of Green Analytical Chemistry (GAC). In contrast, AGREEprep is a specialized tool designed to evaluate only the sample preparation step, based on the 10 principles of Green Sample Preparation (GSP) [46] [47] [25]. AGREEprep offers a more granular assessment for this critical, often high-impact step.
Q2: How are the overall scores interpreted in these metrics?
Both tools provide a score from 0 to 1, displayed in the center of a circular pictogram. A score closer to 1 (and a darker green color) indicates a greener method or sample preparation procedure [25]. For AGREEprep, a score of 1 can also represent a procedure with no sample preparation [46].
Q3: Why does my method receive a low score in the "Reagents and Materials" section, even when using small amounts?
The score is influenced by both the quantity and the inherent hazard of the substances used. Using even small volumes of highly toxic, corrosive, or environmentally dangerous solvents or reagents will result in significant penalty points and a lower score [46] [25]. The tool assesses the safety and environmental impact, not just the volume.
Q4: Can I adjust the importance of different criteria in the assessment?
Yes, a key feature of both AGREE and AGREEprep is the flexibility to assign different weights to the assessment criteria. This allows you to tailor the evaluation to your specific analytical goals and priorities, emphasizing factors that are most critical in your context [46] [25].
Q5: What is the most common cause of high penalty points related to energy consumption?
Techniques that require prolonged heating, cooling below 0°C, or that use energy-intensive instrumentation (e.g., microwave digestion, certain chromatographic systems) typically incur higher penalties [46] [5]. The ideal is to use room temperature and short preparation times.
Troubleshooting High Penalty Points
This section diagnoses common sources of high penalty points in greenness assessments and provides targeted strategies for improvement, directly supporting thesis research on troubleshooting Analytical Eco-Scale penalties.
Table 1: Troubleshooting Common High Penalty Points in AGREE and AGREEprep
| Problem Area | Root Cause | Corrective Action |
|---|---|---|
| High Waste Generation | Use of large solvent volumes (e.g., traditional Liquid-Liquid Extraction). Multi-step procedures generating waste at each stage [46] [2]. | Transition to micro-extraction techniques (e.g., SPME, LLME) using < 1 mL of solvent [46] [2]. Automate and integrate steps to minimize transfers and consumables [46]. |
| Hazardous Reagents & Solvents | Use of chlorinated solvents (e.g., dichloromethane), strong acids/bases, or toxic reagents [46] [48]. | Replace with safer, bio-based, or renewable alternatives (e.g., ethanol, cyclopentyl methyl ether, water) [46] [48]. If replacement is impossible, miniaturize to reduce the absolute amount used [47]. |
| Excessive Energy Consumption | Lengthy procedures requiring heating or cooling (e.g., Soxhlet extraction), or use of energy-intensive equipment [46] [5]. | Optimize methodology to reduce time and operate at ambient temperature [46]. Explore alternative unconventional activation techniques like ultrasound or microwave that can be more efficient [5]. |
| Low Sample Throughput | Manual, batch-based techniques that process few samples per hour, increasing resource use per sample [46] [47]. | Automate the process or adapt methods to allow for parallel processing of multiple samples [46]. On-line or in-line analysis can drastically increase throughput [25]. |
| Poor Performance in "Directness" | Use of off-line sample preparation and analysis when a more direct technique is available [25]. | Investigate possibilities for on-line or at-line analysis to eliminate or integrate the sample preparation step [25]. Explore direct analytical techniques where feasible [46]. |
Experimental Protocols for Greenness Assessment
Standard Operating Procedure for AGREEprep Assessment
This protocol provides a step-by-step methodology for evaluating a sample preparation procedure using the AGREEprep metric [46] [47].
1. Principle AGREEprep calculates a greenness score based on ten criteria corresponding to the 10 principles of GSP. Input data is converted to a sub-score between 0 and 1 for each criterion, which are then combined into a final overall score [46].
2. Materials and Software
- Computer with internet access.
- AGREEprep software (freely available online).
- Data on the sample preparation method to be assessed.
3. Procedure 1. Gather Data: Collect all quantitative and qualitative data for the sample preparation method. 2. Access Software: Download and open the AGREEprep software. 3. Input Parameters: Enter data into the ten input fields: - Criterion 1 (In-situ): Select whether preparation is ex-situ or in-situ. - Criterion 2 (Solvents/Reagents): Input the type and total volume/mass of all solvents and reagents used per sample. - Criterion 3 (Materials): Report the type and mass of all non-renewable, non-reusable materials (e.g., sorbents, filters, pipette tips). - Criterion 4 (Waste): Calculate the total mass of waste generated per sample (sum of Criterion 2 and 3). - Criterion 5 (Miniaturization): Input the sample size (in mL or g). - Criterion 6 (Throughput): Calculate the number of samples processed per hour. - Criterion 7 (Integration): Select the level of integration/automation. - Criterion 8 (Energy): Calculate the energy consumed per sample in Watt-hours (Wh). - Criterion 9 (Post-Preparation): Select the greenness of the analytical technique used after preparation. - Criterion 10 (Operator Safety): Indicate the presence of significant physical or chemical hazards. 4. Assign Weights (Optional): Adjust the default weight for each criterion if certain principles are more important for your assessment. 5. Generate Pictogram: Run the calculation to produce the final score and pictogram. 6. Interpret Results: Analyze the pictogram to identify poorly performing segments (yellow/red) as targets for improvement.
Workflow for a Combined AGREE and AGREEprep Assessment
The following diagram illustrates the logical workflow for conducting a holistic greenness profile using both AGREE and AGREEprep, helping to structure research and identify the root of penalty points.
Research Reagent Solutions & Essential Materials
Table 2: Key Reagents and Materials for Greener Sample Preparation
| Item | Function | Green Alternative / Strategy |
|---|---|---|
| Organic Solvents | Extraction, dilution, cleaning. | Cyclohexane, Heptane, Ethyl Acetate, Ethanol. Replace chlorinated solvents (DCM) and other hazardous solvents (e.g., hexane, acetonitrile) with safer options [48]. |
| Sorbents | Solid-phase extraction, dispersive SPE for clean-up and enrichment. | Biosorbents (e.g., from olive stones, coconut shells), reusable materials, or sustainable synthetics [46]. |
| Acids/Bases | pH adjustment, digestion, derivatization. | Use milder concentrations or alternative buffers. Explore in-situ generation to reduce handling and storage risks [46]. |
| Derivatization Reagents | Chemical modification of analytes for detection. | Where possible, avoid derivatization. If essential, choose less toxic reagents and minimize volumes [25]. |
| Single-Use Consumables | Pipette tips, vials, filters, cartridges. | Miniaturize to reduce size/volume needed. Select suppliers with recycling programs for specific plastic waste [46]. |
In the pursuit of sustainable science, Analytical Eco-Scale has emerged as a valuable semi-quantitative tool to assess the environmental impact of analytical methods. It assigns penalty points to parameters like hazardous reagents, energy consumption, and generated waste, with an ideal green analysis scoring 100 [6]. However, researchers often face a critical challenge: troubleshooting methods with high penalty points can lead to impractical protocols that, while green, are not feasible for routine application. This is where the Blue Applicability Grade Index (BAGI) becomes indispensable.
Introduced in 2023, BAGI is a metric tool designed to evaluate the practicality and economic aspects of an analytical method [49] [50]. It serves as a crucial counterbalance to green metrics. While the Analytical Eco-Scale focuses on environmental impact, BAGI ensures that a method is also rapid, economical, simple to operate, and utilizes readily available instrumentation [49]. By integrating BAGI into your troubleshooting workflow, you can optimize methods to be not only environmentally friendly but also highly practical for real-world applications in drug development and other scientific fields.
FAQs: Integrating BAGI with Analytical Eco-Scale Troubleshooting
FAQ 1: How can BAGI help me troubleshoot a method that received high penalty points on the Analytical Eco-Scale for lengthy sample preparation?
A low score on the Analytical Eco-Scale due to a time- and energy-intensive sample preparation step indicates poor greenness. BAGI provides a direct framework for improvement through its evaluation of sample throughput (Criterion 6) and degree of automation (Criterion 9) [49] [50].
- BAGI-Based Solution: To address this, explore high-throughput techniques. BAGI favors methods that can prepare more than 95 samples simultaneously and achieve a throughput of over 10 samples per hour [49]. Furthermore, automating the sample preparation process, for instance by using an autosampler, can significantly boost your BAGI score by improving the practicality score for Criterion 9, while also reducing the manual labor penalty in Analytical Eco-Scale [49].
FAQ 2: My green method uses a highly specialized, non-toxic solvent that is difficult to source. This seems to hurt its practicality. How does BAGI address reagent and material availability?
This is a common conflict where green goals can compromise practicality. The Analytical Eco-Scale penalizes hazardous reagents, but does not account for their availability [5] [6]. BAGI directly evaluates this through Criterion 7: Availability of reagents and materials [50].
- BAGI-Based Solution: BAGI promotes the use of "common commercially available reagents" [49]. When troubleshooting, if a green solvent is causing practical bottlenecks, use BAGI's scoring for this criterion as a justification to investigate alternative, equally benign solvents that are more readily available in most laboratories, thereby improving the method's blue character without sacrificing its greenness.
FAQ 3: I am developing a multi-analyte method, but the sample pre-concentration step is complex and increases waste. How can BAGI guide my optimization?
Complex pre-concentration steps often incur penalty points in Analytical Eco-Scale for waste generation and use of additional reagents [5]. BAGI assesses this through Criterion 8: Need for pre-concentration and Criterion 2: Type and number of analytes [49] [50].
- BAGI-Based Solution: BAGI rewards methods that avoid additional pre-concentration steps [49]. Since your method is multi-analyte, it already scores well on Criterion 2. Focus your troubleshooting on simplifying or eliminating the pre-concentration. Could you use a more sensitive detector instead? Could you optimize the extraction to be efficient without a subsequent concentration? Success here would reduce Analytical Eco-Scale penalties and increase your BAGI score, enhancing both greenness and practicality.
FAQ 4: My method requires a very small sample amount, but the instrumentation is expensive and rarely found in common labs. How do I balance this with BAGI's principles?
Using a small sample size is beneficial for both Analytical Eco-Scale (less waste) and BAGI (Criterion 10: Sample amount) [5] [49]. However, BAGI also evaluates Criterion 3: Analytical technique based on the complexity and availability of the required instrumentation [49] [50].
- BAGI-Based Solution: BAGI favors "simple, in operation portable instrumentation" and equipment "commonly found in analytical chemistry laboratories" [49]. During troubleshooting, if the core innovation requires specialized equipment, use BAGI's low score in Criterion 3 to identify this as a key practicality limitation. For broader application, consider whether a more common analytical technique could be validated for your purpose, thereby significantly boosting the method's blueness and adoption potential.
Troubleshooting Guide: High Penalty Points to High Practicality
The following table outlines common high-penalty scenarios in Analytical Eco-Scale and maps them to targeted BAGI-based troubleshooting strategies.
Table 1: Troubleshooting Guide for Common High-Penalty Scenarios
| Analytical Eco-Scale Penalty Point Source | Impact on Greenness & Practicality | BAGI-Based Troubleshooting Strategy | Expected Outcome |
|---|---|---|---|
| Lengthy, multi-step sample preparation [5] | High energy use; low sample throughput; increased operator time. | Simplify workflow. Automate steps (Criterion 9). Use parallel processing (Criterion 6) [49]. | Reduced time/energy penalties; higher BAGI score (>60); improved robustness. |
| Use of expensive/hard-to-source reagents [5] | Increased cost; method not easily replicated in other labs. | Substitute with common, commercially available alternatives (Criterion 7) [49]. | Improved method accessibility and practicality; higher BAGI score. |
| Low sample throughput (< few samples/hour) [6] | Inefficient for routine analysis (e.g., in drug development). | Optimize chromatographic run times or use faster detection techniques. Implement batch preparation [49]. | Increased throughput (BAGI Criterion 6); more practical for high-volume labs. |
| Specialized, non-portable instrumentation [5] | Limits method deployment and increases capital cost. | Evaluate if analysis can be adapted for more common lab equipment (Criterion 3) [49]. | Enhanced method applicability across different labs; higher BAGI score. |
| Large sample volume requirement [5] | Not feasible for precious samples (e.g., clinical trials). | Transition to miniaturized systems (e.g., micro-extraction) [49] [7]. | Reduced waste penalty; aligns with BAGI Criterion 10 for small sample size. |
Experimental Protocol for a Holistic Method Assessment
When developing or troubleshooting an analytical method, follow this integrated protocol to balance sustainability and practicality:
- Initial Method Development: Design your analytical procedure based on scientific objectives.
- Greenness Assessment:
- Calculate the Analytical Eco-Scale score. Begin with an ideal score of 100 and subtract penalty points for reagents, energy, and waste [6].
- Identify the primary sources of penalty points (e.g., hazardous solvent, high energy consumption).
- Practicality Assessment:
- Integrated Troubleshooting:
- Use Table 1 to map your high penalty points from Step 2 to specific BAGI criteria.
- Systematically experiment with the troubleshooting strategies to optimize both the green and blue characters of your method.
- Iterative Re-assessment: Re-calculate both the Analytical Eco-Scale and BAGI scores after modifications until a satisfactory balance is achieved.
The diagram below illustrates this workflow and the relationship between the different metrics within the White Analytical Chemistry (WAC) framework.
The Scientist's Toolkit: Essential Reagents and Materials
When optimizing methods for both greenness (Analytical Eco-Scale) and practicality (BAGI), having the right tools is crucial. The following table details key solutions for your research.
Table 2: Key Research Reagent Solutions for Green and Practical Methods
| Reagent/Material | Function in Method Optimization | Relevance to BAGI & Analytical Eco-Scale |
|---|---|---|
| Common Laboratory Solvents (e.g., ethanol, acetone) | Less toxic alternatives for extraction and chromatography. | Reduces penalty for hazardous reagents [5]; improves BAGI "reagent availability" score [49]. |
| Micro-Extraction Devices (e.g., SPME fibers) | Miniaturized sample preparation to reduce solvent volume. | Drastically reduces waste penalty [5]; aligns with BAGI preference for minimal sample prep [49]. |
| Automated Equipment (e.g., autosamplers, robotic liquid handlers) | Standardizes and accelerates sample preparation and analysis. | Reduces operator time and error; directly improves BAGI "automation" score [49] [50]. |
| Readily Available Sorbents (e.g., C18, silica) | Common materials for sample clean-up and separation. | Ensures method transferability between labs, boosting BAGI "reagent availability" [49]. |
| Portable or Common Instrumentation (e.g., standard HPLC, UV-Vis) | Ensures the method can be deployed in most quality control labs. | Critical for a high BAGI score in "analytical technique" criterion [49]; avoids penalties for specialized setups [5]. |
White Analytical Chemistry (WAC) represents an advanced, holistic framework for evaluating analytical methods that balances environmental impact, analytical performance, and practical considerations. Developed to address the limitations of Green Analytical Chemistry (GAC), WAC employs an RGB color model where green represents environmental sustainability, red signifies analytical performance, and blue covers practical and economic aspects [7]. The ideal "white" method achieves a harmonious balance between these three dimensions [51]. This technical support center focuses on troubleshooting a key challenge within this framework: resolving high penalty points in Analytical Eco-Scale research. The Analytical Eco-Scale is a semi-quantitative assessment tool that penalizes methods for factors such as low yield, expensive reagents, safety hazards, complex technical setups, extreme temperature conditions, and cumbersome purification processes [5]. When Eco-Scale penalties accumulate, they indicate problems that directly conflict with WAC principles, necessitating systematic troubleshooting across all three RGB dimensions to achieve methodologies that are simultaneously environmentally sound, analytically robust, and practically feasible.
Core Principles of White Analytical Chemistry
The WAC framework is built on the integration of three critical dimensions, analogous to the RGB color model:
The Green Dimension: This dimension focuses on environmental and safety parameters, directly incorporating the principles of Green Analytical Chemistry (GAC) [7]. It addresses factors such as waste generation, energy consumption, and the toxicity of solvents and reagents [51]. Troubleshooting this dimension is essential for reducing Eco-Scale penalties related to safety hazards and environmental impact [5].
The Red Dimension: This component encompasses analytical performance characteristics, ensuring that methods are fit-for-purpose. Key parameters include sensitivity, selectivity, precision, accuracy, and robustness [52]. A method cannot be considered sustainable or practical if it fails to produce reliable analytical results, making the red dimension a fundamental prerequisite [52].
The Blue Dimension: This dimension evaluates practical and economic factors, including cost, analysis time, ease of use, and potential for automation [7]. Troubleshooting blue aspects often focuses on simplifying procedures to reduce time and resource commitments without compromising performance or greenness.
The following diagram illustrates the interconnected relationship between these dimensions and the pathway toward achieving an optimal "white" method, which is the core objective of troubleshooting high Eco-Scale penalties.
Troubleshooting Guides: Resolving High Penalty Points in Analytical Eco-Scale
The following guides address common high-penalty areas in Analytical Eco-Scale assessments [5], organized by the WAC dimension they most impact. Each guide provides the underlying issue, a step-by-step diagnostic procedure, and proven solutions to reduce penalties and improve overall method "whiteness."
Troubleshooting Guide #1: High Penalties from Toxic Reagents and Solvents (Green Dimension)
- Problem: The method uses reagents or solvents classified with hazard symbols (e.g., T, T+, N, E, F), incurring safety penalties of 5-10 points each on the Eco-Scale [5]. This also negatively impacts the green component of WAC.
- Diagnostic Steps:
- List all chemicals, solvents, and reagents used in the analytical procedure.
- Consult Safety Data Sheets (SDS) to identify and note all hazard symbols for each substance.
- Sum the total penalty points from the Eco-Scale safety table (T, N, F = 5 points; E, F+, T+ = 10 points) [5].
- Solutions:
- Substitution: Replace hazardous solvents with safer alternatives. For example, replace toluene (toxic) with heptane or cyclohexane where chromatographic selectivity allows. Replace chlorinated solvents like dichloromethane with alternatives such as ethyl acetate or acetone in extraction procedures [7].
- Miniaturization: If substitution is not feasible, scale down the method to use minimal volumes of the hazardous substance, thereby reducing overall risk and waste. Employ micro-extraction techniques like Fabric Phase Sorptive Extraction (FPSE) or capsule phase microextraction (CPME) [7].
- Waste Management: Implement a dedicated neutralization or recycling protocol for the hazardous waste generated, turning a penalty into a minor procedural point.
Troubleshooting Guide #2: High Penalties from Complex Workup and Purification (Blue/Green Dimension)
- Problem: The sample preparation involves lengthy, multi-step workup and purification, such as classical liquid-liquid extraction (3 points) or chromatography (10 points), leading to high Eco-Scale penalties and poor practicality (blue score) [5].
- Diagnostic Steps:
- Map the sample preparation workflow, identifying every transfer, separation, and purification step.
- Assign Eco-Scale penalty points for each workup and purification step (e.g., liquid-liquid extraction = 3, classical chromatography = 10) [5].
- Identify the step with the highest penalty that is also the most time-consuming.
- Solutions:
- Simplify or Eliminate: Evaluate if the purification step is essential. For relatively clean matrices, a "dilute-and-shoot" approach may be viable, eliminating extraction penalties entirely [7].
- Modern Techniques: Replace classical liquid-liquid extraction with solid-phase microextraction (SPME) or other modern micro-extraction techniques that reduce solvent use and procedural steps [7].
- Automate: Implement automated sample preparation systems (e.g., robotic liquid handlers) to reduce manual labor time and improve precision, enhancing the blue score even if the penalty points remain.
Troubleshooting Guide #3: Poor Analytical Performance (Red Dimension)
- Problem: The method suffers from poor precision, low recovery, or inadequate sensitivity (high LOD/LOQ), leading to an unreliable process and a low score in the red dimension. This may not be a direct Eco-Scale penalty but is a critical failure in WAC.
- Diagnostic Steps:
- Perform a full method validation, measuring key parameters like repeatability, intermediate precision, trueness (recovery%), and LOQ.
- Use the Red Analytical Performance Index (RAPI) tool to obtain a quantitative score (0-100) and visual pictogram of the method's performance weaknesses [52] [53].
- Identify the specific validation parameter with the lowest RAPI sub-score.
- Solutions:
- For Low Precision (Repeatability): Investigate and control sources of variability. This may involve ensuring more consistent sample injection volumes, controlling ambient temperature during analysis, or using internal standards to correct for instrumental drift.
- For Low Recovery (Trueness): Optimize extraction conditions (e.g., solvent strength, pH, time, temperature). For complex matrices, investigate and mitigate the matrix effect by using matrix-matched calibration or standard addition methods [52].
- For Inadequate Sensitivity (High LOQ): Pre-concentrate the sample during the extraction step or transition to a more sensitive detection system (e.g., MS/MS instead of UV).
Assessment Tools for WAC and Eco-Scale Optimization
To systematically troubleshoot and improve methods, scientists should use standardized assessment tools. The table below summarizes the key metrics for evaluating each dimension of the WAC framework.
Table 1: Key Assessment Tools for the White Analytical Chemistry Framework
| WAC Dimension | Assessment Tool | Primary Function | Output Format | Ideal Outcome |
|---|---|---|---|---|
| Green | Analytical Eco-Scale [5] | Evaluates environmental impact & safety based on yield, cost, safety, technical setup, temperature, and workup. | Numerical score (0-100); higher is better. | Score > 75 [5] |
| Green | AGREE (Analytical GREEnness) [7] [53] | Assesses method alignment with the 12 principles of Green Analytical Chemistry. | Pictogram with a score (0-1). | Score close to 1.0 |
| Red | RAPI (Red Analytical Performance Index) [52] [53] | Quantifies analytical performance across 10 validation parameters (precision, accuracy, LOQ, etc.). | Score (0-100) and star pictogram; higher is better. | Score > 75 [52] |
| Blue | BAGI (Blue Applicability Grade Index) [7] [53] | Assesses practicality and economical aspects (cost, time, ease of use, automation). | Score (25-100) and pictogram; higher is better. | Score > 75 [53] |
| White (Holistic) | RGB Model [7] [51] | Integrates scores from the Green, Red, and Blue dimensions into a unified visual assessment. | Radar chart or mixed color. | Balanced, "white" profile |
Frequently Asked Questions (FAQs)
FAQ 1: My method has an excellent Analytical Eco-Scale score (>80), but its Red Analytical Performance Index (RAPI) is poor (<50). What should I prioritize, and how can I improve the red score without destroying the green score?
- Answer: A high Eco-Scale score with a low RAPI score indicates an environmentally friendly but analytically unreliable method, which is not fit-for-purpose. Prioritize improving the red score. Strategies that can enhance performance without severely impacting greenness include using a more selective detector (e.g., MS/MS) to improve sensitivity and selectivity without changing solvents, employing an internal standard to correct for losses and improve precision, or optimizing pH or timing in the sample preparation to enhance recovery. The goal is a balanced improvement, not a trade-off.
FAQ 2: I need to use a toxic reagent for my derivatization reaction to achieve sufficient detectability. This incurs a high safety penalty on the Eco-Scale. How can I make my method more "white" given this constraint?
- Answer: When a hazardous substance is unavoidable, mitigate its impact in other areas. You can: a) Miniaturize the derivatization reaction scale to use a minimal amount of the toxic reagent, reducing waste and exposure. b) Contain and Recycle the waste stream from this reagent specifically, demonstrating controlled handling. c) Excel in other dimensions to compensate; ensure your method has outstanding practicality (blue) with full automation and high throughput, and superior analytical performance (red) with excellent precision and accuracy. A method can still be "white" if one dimension is slightly weaker but compensated by exceptional performance in others.
FAQ 3: What is the most efficient way to compare two different methods in the context of WAC and identify which one is more balanced?
- Answer: The most efficient and holistic approach is to use a combination of the tools listed in Table 1. First, evaluate both methods using the Green (e.g., AGREE or Eco-Scale), Red (RAPI), and Blue (BAGI) tools. Then, integrate these results using an RGB model sheet or the HEXAGON method [53]. This side-by-side comparison provides a visual and quantitative representation of each method's strengths and weaknesses across all critical dimensions, allowing you to objectively select the method with the most balanced "white" profile for your specific application.
FAQ 4: Classical chromatography during sample cleanup gives me a penalty of 10 points on the Eco-Scale. What are my alternatives?
- Answer: This is a major penalty that severely impacts the green and blue scores. Modern alternatives focus on simplification and miniaturization. You can explore:
- Dilute-and-shoot: If the matrix and sensitivity allow, this eliminates the cleanup step [7].
- Solid-Phase Microextraction (SPME): Eliminates solvent use and simplifies the workflow.
- Fabric Phase Sorptive Extraction (FPSE) or Magnetic Spe: These techniques are efficient, use minimal solvents, and can be easily automated [7]. Replacing classical chromatography with any of these techniques will dramatically reduce your Eco-Scale penalty.
The Scientist's Toolkit: Essential Research Reagent Solutions
Table 2: Key Reagents and Materials for Troubleshooting Eco-Scale Penalties and Advancing WAC
| Item / Technique | Function / Role | Troubleshooting Application |
|---|---|---|
| Green Solvents (Cyclohexane, Heptane, Ethanol, Ethyl Acetate) | Safer replacements for hazardous solvents like hexane, toluene, or chlorinated solvents. | Reducing safety penalties (T, N) on the Eco-Scale [5]. |
| Micro-extraction Devices (SPME Fibers, FPSE Membranes) | Miniaturized extraction phases for concentrating analytes from samples with minimal or no solvent consumption. | Reducing solvent volume penalties and eliminating complex liquid-liquid extraction (3 pts) or classical chromatography (10 pts) penalties [7]. |
| Internal Standard (IS) | A compound added in a constant amount to samples and standards to correct for analyte loss and instrumental fluctuation. | Improving the precision and accuracy (trueness) of the method, directly boosting the RAPI score [52]. |
| Automated Liquid Handler / Robotic Platform | Instrumentation for performing liquid transfers, dilutions, and extractions with high precision and without manual intervention. | Enhancing method practicality (Blue score) by reducing hands-on time and improving repeatability, while also enabling miniaturization. |
| Magnetic Nanoparticles | A substrate for magnetic solid-phase extraction (MSPE), allowing for rapid separation using an external magnet without centrifugation. | Simplifying sample cleanup (reducing workup penalties) and reducing solvent consumption, benefiting both Green and Blue scores [7]. |
High-performance liquid chromatography (HPLC) is indispensable in pharmaceutical laboratories for quality control, stability testing, and impurity profiling. However, conventional methods traditionally prioritize analytical performance with minimal consideration of their environmental footprint, often consuming large volumes of hazardous solvents and generating substantial chemical waste [54] [55]. The principles of Green Analytical Chemistry (GAC) provide a framework for addressing these issues, advocating for the reduction of hazardous chemical use, minimized waste generation, and lower energy consumption without compromising the quality of analytical data [55].
This case study demonstrates how a comparative greenness assessment, centered on the Analytical Eco-Scale, can identify environmental "penalty points" in existing HPLC methods and guide the development of more sustainable alternatives for pharmaceutical analysis. Troubleshooting these high-penalty points is not merely an ecological consideration but a fundamental aspect of modern, responsible method development that aligns with the broader thesis of achieving analytical sustainability while maintaining rigorous performance standards [36].
Case Study: Clidinium Bromide/Chlordiazepoxide Hydrochloride Analysis
Methodology and Experimental Protocol
A validated green HPLC method was developed for the simultaneous determination of clidinium bromide and chlordiazepoxide hydrochloride and compared against a reported conventional method [54]. The core strategy involved redesigning the analytical workflow to eliminate or reduce the sources of environmental impact.
- Green Method Design: The method was explicitly designed to use green mobile phases and short run times. This approach aimed to avoid harmful chemicals and minimize waste production, making it suitable for routine analysis without harming the environment [54].
- Validation Parameters: To ensure analytical performance was not compromised, the green method was rigorously validated with respect to linearity, precision, accuracy, system suitability, and robustness [54].
- Comparative Framework: The greenness profiles of the developed green method and the conventional method were systematically compared using assessment tools to quantify their environmental impact [54].
Results and Greenness Comparison
The study demonstrated that the green method could successfully replace the conventional one. A side-by-side comparison of key parameters highlights the advantages of the green approach.
Table 1: Comparative Analysis of Conventional vs. Green HPLC Method
| Parameter | Conventional Method | Green HPLC Method |
|---|---|---|
| Analytical Performance | Meets validation criteria | Meets validation criteria (linearity, precision, accuracy) [54] |
| Environmental Profile | Higher environmental impact | Greener profile; reduced waste and hazard [54] |
| Operational Efficiency | Longer run times; higher solvent consumption | Short run times; solvent-saving [54] |
The findings confirmed that the conventional method could be replaced by a greener one without sacrificing analytical parameters. The suggested methods were found to be greener and more time- and solvent-saving than the reported ones, making them suitable for routine analysis without detrimental environmental effects [54].
The Green Metrics Toolkit: Quantifying Environmental Impact
To objectively evaluate and compare the greenness of analytical methods, several metrics have been developed. These tools help researchers identify specific penalty points and quantify the overall environmental friendliness of a procedure.
Table 2: Key Greenness Assessment Tools for Analytical Methods
| Metric Name | Type of Output | Key Assessment Criteria | Primary Application |
|---|---|---|---|
| Analytical Eco-Scale [55] [29] | Semi-quantitative score (penalty points) | Reagent toxicity, energy consumption, waste generation, occupational hazards | Routine analysis; provides a total score based on deviations from ideal green method. |
| Green Analytical Procedure Index (GAPI) [55] [11] | Visual (color-coded pictogram) | Entire analytical workflow, from sample collection to final determination | Quick visual identification of environmental impact across all method steps. |
| AGREE Metric [55] [11] | Quantitative score (0-1) & circular graphic | All 12 principles of GAC into a single, comprehensive algorithm | Holistic method evaluation and benchmarking; provides an intuitive, easy-to-interpret output. |
| E-Factor [29] | Quantitative (mass of waste per product) | Total weight of waste generated per kilogram of product or analyte | Evaluating waste production efficiency in processes, including analytical preparations. |
The Analytical Eco-Scale is particularly useful for troubleshooting, as it assigns penalty points for each element of an analytical procedure that is not environmentally ideal. A higher score (closer to 100) indicates a greener method, while a lower score pinpoints areas needing improvement based on the number and severity of penalties [55] [29].
Troubleshooting Guide: Resolving High Penalty Points in HPLC Methods
This section provides a targeted question-and-answer format to help scientists diagnose and resolve common issues that contribute to a poor Eco-Scale score.
Mobile Phase and Solvent Selection
Q: What is the most significant source of penalty points in a conventional reversed-phase HPLC method, and how can it be mitigated? A: The use of hazardous organic solvents like acetonitrile and methanol is a primary source of penalties. Mitigation strategies include:
- Solvent Replacement: Substitute with greener alternatives such as ethanol or water-based mobile phases where chromatographically feasible [55].
- Solvent Reduction: Employ miniaturized techniques (e.g., micro-HPLC) or method optimization to significantly reduce the total volume of solvent consumed per analysis [55].
Q: How can waste generation be minimized? A: Waste is directly linked to solvent consumption and run time.
- Shorten Run Times: Optimize gradient programs or use columns with smaller particle sizes for faster separations [54].
- Maximize Throughput: Develop methods that allow for the processing of several samples in parallel, reducing the environmental cost per sample [36].
Sample Preparation
Q: My sample preparation uses large volumes of toxic solvents for liquid-liquid extraction. What are greener alternatives? A: Traditional extraction methods are major penalty point contributors.
- Adopt Miniaturized Techniques: Implement modern approaches like Solid Phase Microextraction (SPME) or the QuEChERS method, which are designed to be quick, easy, and use minimal solvents [55].
- Automate and Integrate: Automation saves time, lowers reagent consumption, and reduces waste generation while minimizing human exposure to hazards [36].
Energy Consumption and Operational Efficiency
Q: How does energy consumption factor into the Eco-Scale, and how can it be reduced? A: Energy-intensive processes contribute to penalty points.
- Reduce Analysis Time: Faster separations directly lower the energy used by pumps, column ovens, and detectors [54].
- Use Energy-Efficient Instrumentation: Newer, more efficient instruments and adopting room-temperature analyses where possible can reduce the energy footprint [55].
The Scientist's Toolkit: Essential Reagents and Materials for Green HPLC
Transitioning to greener HPLC methods often involves using specific reagents, columns, and materials. The following table details key solutions for optimizing methods for sustainability.
Table 3: Research Reagent Solutions for Green HPLC Optimization
| Item/Category | Function in Green HPLC | Example & Notes |
|---|---|---|
| Green Solvents | Replacing hazardous mobile phase components | Ethanol, water, acetone, ethyl acetate [55] [29]. Use HPLC-grade for reproducibility. |
| High-Efficiency Columns | Reducing run time and solvent consumption | Columns packed with <2µm particles for fast separations. Use guard columns to extend lifespan [56] [57]. |
| Alternative Stationary Phases | Mitigating peak tailing, allowing for low-toxicity mobile phases | Type B (high-purity) silica to minimize interactions of basic compounds with residual silanol groups [57]. |
| Buffers & Additives | Enhancing separation with lower environmental impact | Competing bases like triethylamine (TEA) to reduce peak tailing; buffers of high ionic strength (not for LC/MS) [57]. |
| Sample Prep Materials | Enabling miniaturized, solvent-free sample preparation | SPME fibers, QuEChERS kits for efficient extraction with minimal solvent use [55]. |
FAQs on Green HPLC Implementation
Q: Won't switching to a greener HPLC method compromise our analytical performance and data quality? A: No. The case study and numerous other publications demonstrate that methods can be redesigned to be greener without compromising linearity, precision, accuracy, or system suitability. The goal of GAC is to achieve sustainability while maintaining rigorous analytical performance [54] [55].
Q: What is the "rebound effect" in Green Analytical Chemistry? A: The rebound effect refers to an unintended consequence where the environmental benefits of a greener method are offset by its increased use. For example, a cheap, fast microextraction method might lead laboratories to perform significantly more analyses, ultimately increasing total chemical use and waste. Mitigation requires mindful laboratory practices and optimizing testing protocols to avoid redundant analyses [36].
Q: Our lab is regulated by pharmacopoeial methods. Can we still adopt green HPLC practices? A: Yes. While official methods from pharmacopoeias (e.g., USP, Ph. Eur.) are often based on older, resource-intensive techniques, there is a growing recognition of the need for modernized standards. A recent evaluation of 174 standard methods revealed that 67% scored poorly on greenness metrics. Regulatory agencies are increasingly encouraged to assess environmental impact and provide timelines for phasing out low-performing methods. Furthermore, you can often optimize in-house methods for greenness and use green principles for research and development [36].
This case study underscores that a comparative greenness assessment is a powerful tool for troubleshooting the environmental inefficiencies of pharmaceutical HPLC methods. By applying metrics like the Analytical Eco-Scale, scientists can systematically identify and mitigate high penalty points related to toxic solvents, waste generation, and energy use. The transition to greener HPLC is not only an ethical and ecological imperative but also a practical pathway to more efficient and cost-effective analytical operations in drug development.
The following workflow diagram summarizes the logical process for troubleshooting and optimizing an HPLC method based on greenness assessment:
Establishing a Multi-Metric Validation Protocol for Robust Sustainability Reporting
Frequently Asked Questions
Q1: Our Analytical Eco-Scale penalty points are high due to solvent use. How can we reduce them? High penalty points for solvents are common. The Analytical Eco-Scale assigns penalty points for hazardous, toxic, or environmentally damaging solvents [8]. To reduce your score:
- Substitute Hazardous Solvents: Replace solvents with high penalty points (e.g., acetonitrile, methanol) with safer alternatives like water or ethanol where method performance allows [44].
- Miniaturize and Reduce Volumes: Scale down your methods. Use micro-extraction techniques or reduce chromatographic flow rates to decrease solvent consumption per analysis [2].
- Implement Solvent Recycling: Investigate on-line recycling or passivation of solvents used in sample preparation to minimize waste [8].
Q2: What are the most common pitfalls when designing company-specific sustainability metrics, and how can we avoid them? When developing management-specified criteria for sustainability reporting, common pitfalls relate to the characteristics of suitable criteria [58]:
- Pitfall: Criteria are not measurable. Avoid vague language and forward-looking statements. Clearly define the measurement method, data sources, and reporting boundaries.
- Pitfall: Criteria lack completeness. Ensure your criteria include all relevant factors, such as the reporting timeline, treatment of acquisitions/disposals, and basis for any significant judgments made during preparation.
- Pitfall: Criteria are not neutral. Design criteria to cover both favorable and unfavorable performance. Do not arbitrarily change criteria between reporting periods to remove negative results.
Q3: How can we effectively use multiple greenness assessment tools together? No single metric provides a perfect assessment. Using a multi-metric protocol offers a balanced view [2]. For example:
- Use the Analytical Eco-Scale for a quick, semi-quantitative score to track improvements over time [8].
- Apply the AGREE tool for a comprehensive, principle-based evaluation that provides a visual output [2].
- Leverage the Analytical Method Greenness Score (AMGS) for a detailed analysis of chromatographic methods, including instrument energy consumption [44]. A multi-metric approach helps identify a method's weaknesses from different angles and prevents over-reliance on a single scoring system.
Q4: Our method's energy consumption is leading to high penalty points. What can we do? Energy-intensive equipment is a key factor in energy penalties [8]. Mitigation strategies include:
- Method Transfer: Transfer methods to lower-energy instrumentation where feasible (e.g., from HPLC to UPLC) [44].
- Optimize Run Times: Shorten chromatographic run times and develop methods that use gradient elution efficiently to reduce instrument-on time.
- Equipment Policies: Establish lab policies to power down instruments when not in use for extended periods.
Experimental Protocols for Method Greenness Assessment
Protocol 1: Calculating the Analytical Eco-Scale Score
- Principle: This tool provides a semi-quantitative score by assigning penalty points to non-green parameters in an analytical method. A perfect green method scores 100 [8].
- Procedure:
- Start with a base score of 100.
- Subtract penalty points for each reagent, chemical, or energy input based on its amount, hazard (e.g., toxicity, flammability), and waste generation.
- Refer to the literature for standard penalty values; for example, a hazardous reagent may incur a penalty of 5-20 points [8].
- The final score is calculated as: 100 - Total Penalty Points.
- Interpretation: A score above 75 is considered excellent greenness, while a score below 50 indicates an insufficient green profile.
Protocol 2: Implementing a Multi-Metric Assessment (Eco-Scale, AGREE, and AMGS)
- Principle: To gain a holistic understanding of a method's environmental impact by evaluating it through complementary metrics [2].
- Procedure:
- Analytical Eco-Scale: Perform the calculation as described in Protocol 1. This gives an initial, straightforward score.
- AGREE Calculator: Use the available online AGREE calculator [2]. Input data for all 12 principles of Green Analytical Chemistry, such as waste amount, reagent toxicity, and energy consumption. The tool will generate a pictogram and a score from 0-1.
- Analytical Method Greenness Score (AMGS): Input your chromatographic method parameters (e.g., solvent type and volume per run, instrument type, runtime) into the AMGS tool [44]. It will calculate scores for solvent safety, solvent energy, and instrument energy.
- Triangulate Results: Compare the outputs. A method with a high Eco-Scale score, a high AGREE score, and low AMGS sub-scores is a robust, green method. Discrepancies between scores can pinpoint specific areas for improvement.
The table below summarizes the core metrics used in a multi-metric validation protocol.
| Metric Name | Type of Output | Key Parameters Assessed | Primary Use Case |
|---|---|---|---|
| Analytical Eco-Scale [8] | Semi-quantitative score (0-100) | Reagent hazards, quantity, energy consumption, waste | Quick, comparative assessment and tracking method improvements over time. |
| AGREE (Analytical GREEnness) [2] | Pictogram & numerical score (0-1) | All 12 principles of Green Analytical Chemistry | Comprehensive, principle-based evaluation of the entire analytical workflow. |
| AMGS (Analytical Method Greenness Score) [44] | Numerical sub-scores | Solvent EHS, solvent energy, instrument energy | Detailed, in-depth analysis of the environmental impact of chromatographic methods. |
| GAPI (Green Analytical Procedure Index) [2] | Color-coded pictogram | Five stages of the analytical procedure | Visual identification of the least green steps in a multi-stage analytical process. |
The Scientist's Toolkit: Research Reagent & Material Solutions
This table details key materials and strategies for developing greener analytical methods.
| Item or Solution | Function / Purpose | Considerations for Greenness |
|---|---|---|
| Safer Solvent Alternatives | To replace hazardous solvents in extraction and chromatography. | Substituting acetonitrile with ethanol or water reduces toxicity and penalty points [44]. |
| Micro-Extraction Devices | To minimize solvent volumes in sample preparation. | Using <10 mL of solvent per sample significantly improves greenness scores [2]. |
| Energy-Efficient Chromatographs | To perform separations with lower power consumption. | UPLC systems often use less energy and solvent than traditional HPLC for the same analysis [44]. |
| On-Line Waste Decontamination | To treat hazardous analytical waste before disposal. | Systems for recycling, degradation, or passivation of wastes ameliorate hazard and reduce environmental impact [8]. |
| Method Miniaturization & Automation | To reduce reagent use and increase throughput with minimal analyst intervention. | Semiautomation and reduced procedural steps align with GAC principles and improve AGREE scores [2]. |
Workflow for a Multi-Metric Validation Protocol
The following diagram illustrates the logical workflow for establishing and using a multi-metric protocol to troubleshoot and improve analytical method greenness.
Conclusion
Mastering the Analytical Eco-Scale is not merely an academic exercise but a critical competency for modern, environmentally conscious laboratories. By systematically understanding the sources of penalty points, applying targeted troubleshooting strategies, and validating improvements with a suite of complementary tools like AGREE and BAGI, researchers can significantly enhance the sustainability of their analytical methods. This journey from high-penalty to high-performance green methods directly supports the pharmaceutical industry's ambitious goals, such as achieving carbon-zero labs. The future of analytical chemistry lies in this balanced integration of uncompromising analytical quality with robust ecological responsibility, paving the way for greener biomedical research and a more sustainable clinical pipeline.
References
- 1. A validated RP-HPLC method for the estimation of Cinnarizine in tablet... [https://fjps.springeropen.com/articles/10.1186/s43094-025-00888-2]
- 2. Assessing the Environmental Impact of Analytical Methods [https://www.chromatographyonline.com/view/the-green-component-assessing-the-environmental-impact-of-analytical-methods]
- 3. Journal of Chemistry-Section A - Articles List Advanced [https://www.ajchem-a.com/?_action=article&kw=461009&_kw=Analytical+Eco-Scale+%28AES%29]
- 4. How to correctly evaluate greenness, whiteness and other ... [https://pubs.rsc.org/en/content/articlehtml/2025/gc/d5gc00615e]
- 5. EcoScale, a semi-quantitative tool to select an organic ... [https://pmc.ncbi.nlm.nih.gov/articles/PMC1409775/]
- 6. Green analytical chemistry metrics for evaluating the ... [https://pmc.ncbi.nlm.nih.gov/articles/PMC11697060/]
- 7. White Analytical Chemistry: Balancing Performance ... [https://www.chromatographyonline.com/view/white-analytical-chemistry-balancing-performance-sustainability-and-practicality-in-modern-methods]
- 8. Analytical Eco-Scale for assessing the greenness of ... [https://www.sciencedirect.com/science/article/abs/pii/S0165993612001525]
- 9. Analytical Eco-Scale for Assessing the Greenness of a ... [https://pubmed.ncbi.nlm.nih.gov/27492952/]
- 10. Green Analytical Chemistry: A Comprehensive Review ... [https://jddtonline.info/index.php/jddt/article/view/7089]
- 11. Green analytical chemistry metrics for evaluating the ... [https://www.sciencedirect.com/science/article/pii/S2095177924001102]
- 12. Tools to Evaluate the Eco-efficiency of Analytical Methods ... [https://pubmed.ncbi.nlm.nih.gov/37877508/]
- 13. Green metrics and green analytical applications [https://www.sciencedirect.com/science/article/pii/S2772577424000685]
- 14. Development and Validation of a New Eco-Friendly HPLC ... [https://www.mdpi.com/1648-9144/60/10/1686]
- 15. Green Chromatography: Reducing Environmental Impact ... [https://www.sepscience.com/green-chromatography-reducing-environmental-impact-in-lab-practices-11323]
- 16. Chromatography and Sustainability: A Path Forward [https://www.technologynetworks.com/analysis/blog/chromatography-and-sustainability-a-path-forward-395775]
- 17. The ecological impact of liquid chromatographic methods ... [https://pmc.ncbi.nlm.nih.gov/articles/PMC9643294/]
- 18. Green analytical methods for simultaneous determination ... [https://pmc.ncbi.nlm.nih.gov/articles/PMC7494460/]
- 19. LC Troubleshooting Essentials: A Guide to Common ... [https://www.chromatographyonline.com/view/lc-troubleshooting-essentials-a-guide-to-common-problems-and-solutions-for-peak-tailing-ghost-peaks-and-pressure-spikes]
- 20. Digital Inventory Management for Enhanced Lab Efficiency [https://www.labmanager.com/digital-inventory-management-for-enhanced-lab-efficiency-23661]
- 21. Errors within the total laboratory testing process, from test ... [https://pmc.ncbi.nlm.nih.gov/articles/PMC7271754/]
- 22. GHS Classification Summary - PubChem [https://pubchem.ncbi.nlm.nih.gov/ghs/]
- 23. GHS Classification of Mixture [http://chemsafetypro.com/Topics/GHS/GHS_classification_mixture.html]
- 24. GHS Classification Criteria in A Single Page [https://www.chemsafetypro.com/Topics/GHS/GHS_Classification_Criteria.html]
- 25. AGREE—Analytical GREEnness Metric Approach and ... [https://pmc.ncbi.nlm.nih.gov/articles/PMC7588019/]
- 26. Analytical Eco-Scale for Evaluating the Uniqueness of ... [https://link.springer.com/article/10.1007/s12678-022-00751-5]
- 27. Guidelines on the proper selection of greenness and ... [https://www.sciencedirect.com/science/article/abs/pii/S0003267025004465]
- 28. Benign Solvent Selection in Retrosynthesis Analysis [https://www.synthiaonline.com/resources/articles/benign-solvent-selection-retrosynthesis]
- 29. Green Chemistry Metrics with Special Reference to Green Analytical ... [https://pmc.ncbi.nlm.nih.gov/articles/PMC6272361/]
- 30. How water could replace some organic solvents and make ... [https://www.cas.org/resources/cas-insights/organic-solvents]
- 31. The Solvent-Free Revolution: Redefining Green Chemistry ... [https://pharmafeatures.com/the-solvent-free-revolution-redefining-green-chemistry-in-pharmaceuticals/]
- 32. Eco-friendly alternatives to conventional solvents [https://www.sciencedirect.com/science/article/pii/S2772826925000859]
- 33. (PDF) Analytical Eco-Scale for assessing the greenness of analytical ... [https://www.academia.edu/96644570/Analytical_Eco_Scale_for_assessing_the_greenness_of_analytical_procedures]
- 34. Miniaturization in action: High-resolution, low-cost ... [https://www.sciencedirect.com/science/article/pii/S2949771X25000404]
- 35. Exploring trends and guiding developments in miniaturized ... [https://www.sciencedirect.com/science/article/abs/pii/S0165993625002444]
- 36. HPLC 2025 Preview: The Road To Sustainable Analytical ... [https://www.chromatographyonline.com/view/hplc-2025-preview-the-road-to-sustainable-analytical-chemistry]
- 37. HPLC Tips & Tricks: Getting Greener in HPLC [https://www.sigmaaldrich.com/US/en/technical-documents/technical-article/analytical-chemistry/small-molecule-hplc/getting-greener-in-hplc?srsltid=AfmBOoqZK5Weg_Ll07hnoSnB7IEWNSWGZLAzt_q2l84aaXPSyavKlyK4]
- 38. How Green is the Future of Chromatography? [https://www.chromatographyonline.com/view/how-green-is-the-future-of-chromatography-]
- 39. Optimizing Solvent Consumption for Your ... [https://rotachrom.com/optimizing-solvent-consumption-for-your-chromatographic-solution-2/]
- 40. High-throughput screening [https://en.wikipedia.org/wiki/High-throughput_screening]
- 41. High-Throughput Screening Platforms in the Discovery of ... [https://pmc.ncbi.nlm.nih.gov/articles/PMC7926814/]
- 42. greenness assessment of HPLC methods for paclitaxel [https://link.springer.com/article/10.1007/s44371-025-00166-3]
- 43. Greenness evaluation metric for analytical methods and ... [https://pmc.ncbi.nlm.nih.gov/articles/PMC12318332/]
- 44. Utilisation of Analytical Method Greenness Score to drive ... [https://pubs.rsc.org/pt-br/content/articlehtml/2025/gc/d5gc01574j]
- 45. The ten principles of green sample preparation [https://researchprofiles.ku.dk/en/publications/the-ten-principles-of-green-sample-preparation]
- 46. AGREEprep – Analytical greenness metric for sample ... [https://www.sciencedirect.com/science/article/abs/pii/S016599362200036X]
- 47. A Tutorial on AGREEprep an Analytical Greenness Metric ... [https://www.academia.edu/84760830/A_Tutorial_on_AGREEprep_an_Analytical_Greenness_Metric_for_Sample_Preparation]
- 48. Green Strategies toward Eco-Friendly HPLC Methods in ... [https://www.intechopen.com/chapters/85926]
- 49. The Blue Component of Analytical Chemistry: Assessing ... [https://www.chromatographyonline.com/view/the-blue-component-of-analytical-chemistry-assessing-the-practicality-of-analytical-methods]
- 50. Blue Applicability Grade Index (BAGI) and Software - CoLab [https://colab.ws/articles/10.1039/d3gc02347h]
- 51. Green and White Analytical Chemistry [https://pubmed.ncbi.nlm.nih.gov/40998048/]
- 52. The Red Component of Analytical Chemistry: Assessing ... [https://www.chromatographyonline.com/view/the-red-component-of-analytical-chemistry-assessing-the-performance-of-analytical-methods]
- 53. Red analytical performance index (RAPI) and software [https://pubs.rsc.org/en/content/articlehtml/2025/gc/d4gc05298f]
- 54. Validated green high-performance liquid chromatographic methods for the determination of coformulated pharmaceuticals: a comparison with reported conventional methods - PubMed [https://pubmed.ncbi.nlm.nih.gov/25545351/]
- 55. Green Approaches in High-Performance Liquid Chromatography for Sustainable Food Analysis: Advances, Challenges, and Regulatory Perspectives [https://www.mdpi.com/1420-3049/30/17/3573]
- 56. Troubleshooting and Performance Improvement for HPLC [https://www.aurigeneservices.com/blogs/troubleshooting-and-performance-improvement-for-hplc]
- 57. HPLC Troubleshooting | Thermo Fisher Scientific - US [https://www.thermofisher.com/us/en/home/industrial/chromatography/chromatography-learning-center/high-performance-liquid-chromatography-hplc-support/hplc-troubleshooting.html]
- 58. Sustainability Spotlight — Designing Suitable Management ... [https://dart.deloitte.com/USDART/home/publications/deloitte/sustainability-spotlight/2025/sustainability-reporting-guide-for-management-specific-criteria]