Portable LIBS for Mineral Prospecting and Ore Processing: A Comprehensive Guide to Real-Time Geochemical Analysis
This article provides a thorough examination of Laser-Induced Breakdown Spectroscopy (LIBS) as a transformative technology for mineral exploration and ore processing.
Portable LIBS for Mineral Prospecting and Ore Processing: A Comprehensive Guide to Real-Time Geochemical Analysis
Abstract
This article provides a thorough examination of Laser-Induced Breakdown Spectroscopy (LIBS) as a transformative technology for mineral exploration and ore processing. It covers the fundamental principles of LIBS, its distinct advantages for detecting critical light elements like lithium, and practical methodologies for field deployment from outcrop sampling to downhole analysis. The content addresses key technical challenges such as matrix effects and quantification, offering proven optimization strategies and data processing techniques. By comparing LIBS performance against traditional methods like XRF and laboratory analysis, this guide equips geoscientists and mining professionals with the knowledge to implement portable LIBS for accelerated, data-driven decision-making throughout the mining value chain.
Understanding Portable LIBS: Fundamental Principles and Technological Advantages for Geoscience
Laser-Induced Breakdown Spectroscopy (LIBS) is an advanced atomic emission spectrometry technique that uses a high-energy laser pulse to generate a microplasma on a sample surface, enabling direct elemental analysis. The core principle involves using laser energy to atomize and excite a microscopic amount of material, then measuring the characteristic wavelengths of light emitted as excited electrons return to lower energy states [1] [2].
This technology provides rapid, stand-off chemical analysis capability with minimal to no sample preparation, making it particularly valuable for applications where traditional laboratory analysis is impractical or too time-consuming [3]. In mineral prospecting and ore processing research, LIBS has emerged as a transformative tool for real-time geochemical analysis, enabling immediate decision-making in field operations [4] [5].
The LIBS process encompasses three fundamental stages: laser-material interaction and plasma formation; plasma cooling and atomic emission; and spectral collection and analysis. Each stage contributes to the technique's overall analytical performance and application potential.
The Physics of Laser-Generated Plasma
Laser-Material Interaction Mechanism
When a focused, high-energy laser pulse strikes a sample surface, it delivers extreme energy densities ranging from 10⁸ to 10¹¹ watts per square centimeter [4]. This concentrated energy rapidly heats, vaporizes, and atomizes a microscopic amount of material (typically 1-10 micrograms per pulse) [4]. The resulting vapor cloud undergoes further ionization through inverse bremsstrahlung absorption and collisional processes, creating a plasma consisting of free electrons, excited atoms, and ions [4] [6].
The laser-induced plasma exhibits extreme temperatures, initially reaching 15,000 Kelvin or higher [4]. At these temperatures, molecular bonds are broken, and constituent elements are reduced to their atomic forms. The initial plasma state is characterized by intense continuum radiation resulting from electron-ion recombination and bremsstrahlung effects.
Plasma Expansion and Cooling Dynamics
Following the laser pulse (typically lasting nanoseconds), the plasma begins to expand outward and cool rapidly. Within 1-10 microseconds, the plasma temperature decreases sufficiently for distinctive atomic emissions to dominate over continuum radiation [4]. During this critical cooling phase, excited electrons in atoms and ions undergo spontaneous transitions to lower energy states, emitting photons at wavelengths characteristic of each specific element [1] [3].
The temporal evolution of the plasma directly impacts analytical performance. Most LIBS systems employ time-gated detection to collect spectra during the optimal window when elemental emission lines are strong and background continuum radiation has sufficiently diminished.
Table 1: Key Parameters in Laser-Generated Plasma Formation
| Process Parameter | Typical Range/Value | Analytical Significance |
|---|---|---|
| Laser Pulse Energy | 1-100 mJ (often ~9 mJ for portable systems) [3] | Determines ablation yield and plasma temperature |
| Pulse Duration | Nanoseconds (e.g., 4 ns [3]) | Affects peak power and sample heating mechanism |
| Power Density | 10⁸ - 10¹¹ W/cm² [4] | Must exceed material ablation threshold |
| Plasma Temperature | >15,000 K (initial) [4] | Governates atomization and excitation efficiency |
| Plasma Lifetime | Microseconds to milliseconds [6] | Dictates optimal detection timing |
Atomic Emission and Spectral Analysis
Principles of Atomic Emission Spectroscopy
As the laser-generated plasma cools, the excited atoms and ions emit electromagnetic radiation at discrete wavelengths during electron transition events. Each element produces a unique "fingerprint" spectrum based on its electronic energy level structure [3]. According to quantum mechanics, the wavelength (λ) of emitted photons correlates with the energy difference (ΔE) between electronic states through the relation ΔE = hc/λ, where h is Planck's constant and c is the speed of light [6].
Emission lines in LIBS spectra appear as sharp peaks superimposed on a diminishing background continuum. The intensity of these characteristic lines relates to the concentration of the corresponding element in the sample, enabling both qualitative identification and quantitative analysis [3].
Spectral Detection and Elemental Coverage
Advanced optical spectrometers equipped with charge-coupled device (CCD) or intensified CCD cameras capture the emission signatures across wavelengths spanning from ultraviolet through near-infrared regions (typically 190-950 nm) [4] [5]. The wide spectral coverage enables simultaneous detection of elements from hydrogen through uranium on the periodic table [4].
LIBS exhibits particular strength for detecting light elements such as lithium, boron, beryllium, and carbon that present analytical challenges for other field-portable techniques like X-ray fluorescence (XRF) [4] [5]. This capability has profound implications for critical mineral exploration, especially lithium and rare earth element detection essential for energy transition technologies [4].
Table 2: Representative Elemental Detection Performance of LIBS
| Element Category | Specific Elements | Typical Detection Limits | Primary Mining Application |
|---|---|---|---|
| Critical Battery Metals | Lithium, Cobalt, Nickel | 0.01-0.1% (Li), 10-200 ppm (Co, Ni) [4] | Battery mineral exploration, recycling |
| Precious Metals | Gold, Silver, Platinum Group | 50-200 ppm [4] | Precious metal mining, processing |
| Light Elements | Carbon, Boron, Beryllium, Sodium | 0.01-0.5% [4] | Advanced materials, specialty minerals |
| Rock-Forming Elements | Silicon, Magnesium, Calcium, Iron | 0.1-1% [4] | Geological mapping, ore characterization |
Experimental Protocols for Mineral Analysis
Standardized LIBS Analysis Procedure
The following protocol details a standardized methodology for quantitative elemental analysis in mineral samples using LIBS, compiled from recent research applications [1] [5] [2]:
Sample Preparation:
- For powdered samples: Create homogeneous tablets using standardized compression molding processes [3] [5].
- For solid rock samples: Ensure a flat and smooth surface is available; minimal preparation is required beyond surface cleaning [5] [2].
- Note: Sample heterogeneity can significantly affect measurement reproducibility, particularly in coarse-grained materials [4].
Instrument Setup:
- Laser Parameters: Nd:YAG laser (1064 nm wavelength), pulse energy of ~9 mJ, pulse width of 4 ns, repetition rate of 1-3 Hz [3].
- Detection Geometry: Set detection distance (typically 1.6-7 m for stand-off systems) and ensure proper focus [3].
- Timing Parameters: Configure gate delay (0 μs to several hundred ns) and gate width (typically 1 ms) to optimize signal-to-noise ratio [3].
- Calibration: Utilize site-specific certified reference materials that accurately represent actual ore compositions [4] [5].
Spectral Acquisition:
- Acquire multiple spectra (typically 10-60) from different locations on each sample to account for heterogeneity [3] [2].
- For each measurement point, accumulate multiple laser pulses (3-5) to improve signal quality.
- Include background/dark spectra for subtraction during data processing.
Data Preprocessing:
- Apply dark background subtraction and wavelength calibration.
- Remove ineffective pixel data and splice spectrometer channels if multiple channels are used.
- Perform background baseline removal and normalize spectra if required [3] [2].
Quantitative Analysis Methodology
For quantitative analysis, implement the following specialized protocol adapted from the Beauvoir granite case study [5]:
Reference Sample Selection:
- Choose reference samples directly from the deposit under study to minimize matrix effects.
- Ensure reference materials cover the expected concentration range for target elements.
- Validate reference materials using conventional laboratory analysis.
Spectral Data Processing:
- Select appropriate spectral intervals devoid of interferences from matrix elements.
- For lithium quantification, utilize the characteristic emission line at 670.8 nm [4].
- Employ multivariate calibration models (partial least squares regression is common).
- Apply principal component analysis (PCA) combined with density-based spectral clustering for phase separation [1].
Quality Control:
- Analyze certified reference materials as unknown samples to validate method accuracy.
- Monitor plasma conditions through temperature-sensitive emission line ratios.
- Evaluate precision through repeated measurements of homogeneous samples.
This methodology has demonstrated the ability to quantify critical elements like lithium and rubidium in granite samples with mean absolute errors of 0.043 wt% and 0.068 wt% respectively compared to laboratory reference methods [5].
Technological Workflows and Data Processing
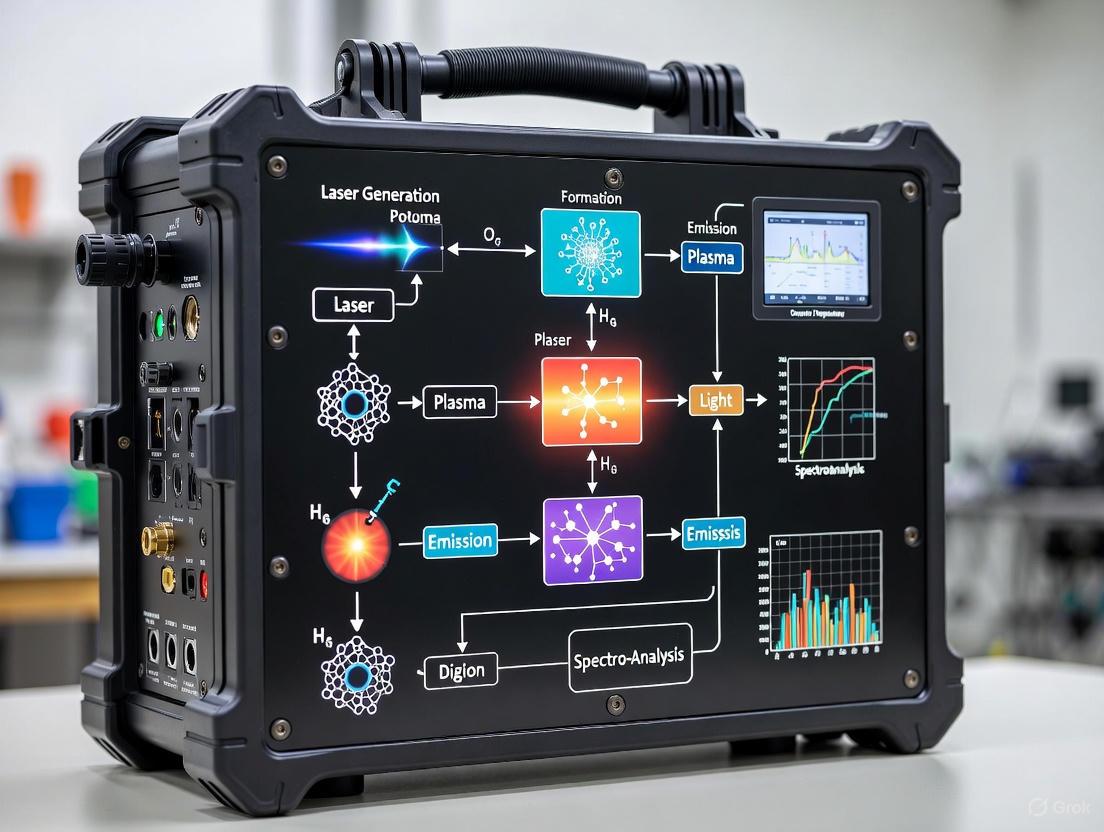
The complete LIBS analytical workflow integrates several stages from plasma generation to final elemental quantification. The diagram below illustrates this process, highlighting the critical steps where specific parameters must be controlled to ensure analytical quality.
Advanced Data Processing with Machine Learning
Modern LIBS analysis increasingly incorporates machine learning algorithms to enhance classification accuracy and quantitative performance:
Spectral Classification:
- Apply principal component analysis (PCA) for dimensionality reduction and feature extraction [3] [2].
- Implement algorithms such as XGBoost, which has demonstrated 98.57% accuracy in rock classification [2].
- Utilize convolutional neural networks (CNN) capable of directly processing multi-distance spectra, achieving 92.06% accuracy even without distance correction [3].
Multi-Technique Data Fusion:
- Combine LIBS with Raman spectroscopy to integrate elemental and molecular information [7].
- Employ t-distributed stochastic neighbor embedding (t-SNE) for visualization of fused data in low-dimensional space [7].
- Apply kernel extreme learning machine (K-ELM) models to fused LIBS-Raman data, achieving classification accuracies up to 98.4% for mineral identification [7].
The Scientist's Toolkit: Research Reagent Solutions
Table 3: Essential Materials and Equipment for LIBS Research
| Item Category | Specific Examples | Function/Purpose |
|---|---|---|
| Reference Materials | Certified Chinese national reference materials (GBW series) [3], NIST SRM 610 and 612 [8] | Calibration, method validation, quality control |
| Sample Preparation | Eichrom pre-packed cartridges (UTEVA, TEVA resins) [8], compression molding equipment | Matrix separation, sample homogenization, tablet preparation |
| Laser Systems | Nd:YAG lasers (1064 nm) [3], portable/handheld LIBS units | Plasma generation, field deployment |
| Detection Systems | Spectrometers with CCD/ICCD detectors [4], three-channel spectrometer systems [3] | Spectral acquisition across UV-VIS-NIR ranges |
| Data Processing Tools | Python with scikit-learn, specialized LIBS software, convolutional neural network algorithms [3] | Spectral preprocessing, multivariate analysis, machine learning |
Comparative Analytical Performance
Advantages Over Conventional Techniques
LIBS offers distinct advantages for mineral prospecting and ore processing research compared to conventional analytical techniques:
Versus Spark OES and Glow Discharge OES:
- Requires no electrical contact with the sample [6]
- Capable of stand-off analysis at distances up to several meters [3]
- Minimal to no sample preparation required [4]
- Suitable for non-conducting materials without special preparation [6]
Versus X-Ray Fluorescence (XRF):
- Superior sensitivity for light elements (lithium, beryllium, boron) [4] [5]
- Capability to detect all elements from hydrogen to uranium [4]
- Does not require radioactive source licensing
Operational Advantages:
- Analysis time of 30-60 seconds per measurement point [4]
- Minimal sample consumption (1-10 micrograms per pulse) [4]
- Capacity for depth profiling by repeated laser pulses at the same location
Limitations and Mitigation Strategies
Despite its significant advantages, LIBS technology presents specific challenges that require careful management:
Matrix Effects: Complex mineral matrices can cause significant variations in measurement accuracy due to elemental interference [4]. Mitigation includes using site-specific calibration standards [5] and advanced chemometric methods [3].
Precision Limitations: Relative standard deviation typically ranges from 2-5% for major elements but increases to 10-20% for trace elements [4]. This can be addressed through multiple measurements and robust calibration strategies.
Detection Limit Challenges: For certain trace elements, detection limits may approach practical thresholds for geological applications [4]. Combining LIBS with complementary techniques like Raman spectroscopy can enhance overall analytical performance [7].
Laser-generated plasma technology represents a paradigm shift in atomic emission spectroscopy for mineral prospecting and ore processing research. The fundamental physical processes of laser ablation, plasma formation, and atomic emission provide a robust foundation for rapid, in-situ elemental analysis. While challenges remain in quantification precision and matrix effects, ongoing advances in instrumentation standardization, reference materials, and machine learning data processing continue to expand LIBS applications in geoscience. The technology's unique capabilities for stand-off analysis, light element detection, and field deployment position it as an indispensable tool for modern mineral exploration and processing optimization.
Laser-Induced Breakdown Spectroscopy (LIBS) is a rapid chemical analysis technology that uses a short, focused laser pulse to create a micro-plasma on a sample surface, enabling determination of its elemental composition [9]. As an atomic emission spectroscopy technique, LIBS is distinguished by its capability for simultaneous multi-element analysis with minimal sample preparation, making it particularly valuable for field applications such as mineral exploration and ore processing [10]. The fundamental physics involves using laser energy to ablate a small amount of material (typically nanograms to micrograms) and excite the constituent elements, which then emit characteristic light as they return to ground state [11] [12]. Each element in the periodic table produces unique spectral peaks, serving as elemental "fingerprints" for qualitative identification and quantitative measurement [13] [9].
For mineral prospecting, LIBS offers unique capabilities for detecting lighter elements (including H, Li, Be, B, C, N, O, Na, and Mg) that are difficult to measure with other portable techniques like X-ray fluorescence (XRF) [10]. This advantage is particularly relevant for exploring critical mineral commodities such as lithium, cobalt, nickel, copper, and rare earth elements necessary for green technologies [10]. The recent development of commercial handheld LIBS analyzers has significantly expanded in-situ applications across geosciences, providing real-time analytical capabilities that reduce reliance on lengthy laboratory analysis chains [10].
The Fundamental LIBS Process: Step-by-Step
The LIBS analytical sequence transforms a solid sample into measurable atomic emissions through a series of physical processes. The following workflow details this transformation:
Laser Pulse Generation and Sample Ablation
The LIBS process initiates when a short-pulsed laser (typically a Q-switched Nd:YAG laser operating at 1064 nm or its harmonics) produces a high-focused pulse directed at the sample surface [13] [10] [12]. For effective analysis, the laser irradiance must exceed approximately 1 GW/cm² to surpass the plasma generation threshold of the material [12]. This focused laser energy couples with the sample surface, causing thermal and non-thermal mechanisms to remove a small volume of material in a process known as laser ablation [9]. The ablation process typically creates craters ranging from 30-400 µm in diameter, depending on laser parameters and material properties [11]. In mineralogical applications, this minimal destruction preserves sample integrity for subsequent analyses while providing sufficient material for measurement.
The ablated material interacts with the trailing portion of the laser pulse, forming a high-temperature plasma with temperatures that can exceed 10,000-30,000 K in its early stages [9] [12]. At these extreme temperatures, the ablated material dissociates into constituent atoms that undergo collisional excitation by electrons within the plasma [11]. This process elevates electrons to higher energy orbitals, creating electronically excited atoms and ions [13]. The plasma expands rapidly into the surrounding environment (initially at approximately 10⁶ cm/s in vacuum) and begins cooling immediately after laser pulse termination [12]. The initial high-temperature plasma emits a strong continuum background radiation that typically subsides within the first 200-300 nanoseconds, after which discrete atomic emissions become dominant [9].
Light Emission and Collection
As the plasma cools, excited electrons return to lower energy states, emitting photons at characteristic wavelengths specific to each element [13]. These emission lines form unique "fingerprints" in the electromagnetic spectrum, predominantly in the 200-900 nm range covered by most commercial LIBS instruments [10]. The emitted light is collected through lenses or telescopes positioned near the plasma plume, with fiber optic cables typically transmitting the light to the spectrometer [13] [11]. For stand-off applications, such as the ChemCam instrument on NASA's Mars rovers, telescope systems collect light from samples located several meters from the instrument [10] [11]. Specialized time-gating techniques are employed where collection begins after a short delay (~1 µs) to allow the continuum background to diminish while retaining discrete atomic emissions [9] [14].
Spectral Dispersion and Detection
The collected light enters a spectrometer through an entrance slit and interacts with a diffraction grating that separates it into component wavelengths [13]. Various spectrometer designs are employed, with echelle spectrographs being common for their ability to provide high resolution across broad wavelength ranges [11]. The dispersed light is detected using array detectors such as Charge-Coupled Devices (CCDs) or Intensified CCDs (ICCDs) that convert photon intensities into digital signals [10] [12]. The resulting spectrum displays intensity versus wavelength, with each element producing multiple peaks corresponding to electronic transitions of its atoms and ions [11]. The central processing unit (CPU) then analyzes these spectral data to determine elemental composition based on line identities and intensities [13].
Elemental Quantification Methods
Transforming LIBS spectral data into quantitative elemental concentrations requires careful calibration to account for matrix effects and plasma variability. The quantification workflow progresses from basic to advanced computational approaches:
Univariate Calibration
Univariate analysis represents the fundamental approach to LIBS quantification, relying on single peak integration of a specific emission line for the element of interest [14]. The process involves measuring the integrated peak area (or sometimes peak height) after subtracting the spectral background, which can be defined from nearby interference-free regions or under the peak edges [14]. To compensate for pulse-to-pulse variations in laser energy and plasma conditions, normalization strategies are often employed, including:
- Peak-to-Baseline Ratio: Dividing the peak area by the nearby background continuum [14]
- Internal Standardization: Normalizing against an emission line from a major matrix element (e.g., normalizing Cr against Fe in steel analysis) [14]
- Total Plasma Emission: Dividing by the integrated signal across all wavelengths when the total plasma emission is relatively constant [14]
Emission lines must be carefully selected based on the concentration range being measured. Low excitation energy lines ending at or near the ground state provide high sensitivity for trace elements but suffer from self-absorption at higher concentrations, while harder-to-excite lines not ending on the ground state offer better linearity for major elements [14].
Multivariate Chemometrics
Multivariate methods utilize multiple spectral features (entire spectral regions or selected peaks) to build predictive models through chemometric techniques [14]. These approaches better account for complex matrix effects and spectral interferences common in geological samples [10]. The most common multivariate methods include:
- Partial Least Squares (PLS): Finds latent variables that maximize covariance between spectral features and concentrations [14]
- Principal Component Regression (PCR): Uses principal components of spectral data as predictors [14]
- Support Vector Machines Regression (SVR): Applies kernel functions for nonlinear relationships [14]
Successful implementation requires proper experimental design with calibration standards that closely match the sample matrix, rigorous model validation using independent test sets, and avoidance of overfitting by limiting model complexity relative to the number of standards [14]. For mineralogical applications, studies have demonstrated that combining LIBS with multivariate analysis can achieve 98.4% classification accuracy for minerals when enhanced with machine learning algorithms [15].
Analytical Performance Characteristics
LIBS performance varies significantly across elements and matrices, with typical analytical characteristics for geological applications summarized below:
Table 1: Typical LIBS Analytical Performance for Geological Materials
| Parameter | Typical Range | Factors Influencing Performance |
|---|---|---|
| Detection Limits | ppm to low-% range; specific elements like Li can have very low LODs [10] | Element properties, sample matrix, instrument design, analysis conditions [10] |
| Precision | 5-20% RSD [10]; can reach 2-3% for homogeneous samples [14] | Sample heterogeneity, laser stability, plasma fluctuations [10] |
| Sensitivity to Light Elements | Excellent for Z < 13 [10] | Plasma conditions, ambient atmosphere [10] |
| Shot-to-Shot Variability | Significant due to plasma instabilities [10] | Laser energy stability, matrix effects, sample homogeneity [10] |
| Spatial Resolution | 30-400 µm crater diameter [11] | Laser wavelength, power, material properties [11] |
Table 2: Advantages and Limitations of LIBS for Mineral Exploration
| Advantages | Limitations |
|---|---|
| Minimal sample preparation required [9] [11] | Matrix effects can complicate quantification [10] [12] |
| Rapid analysis (seconds per spot) [9] | Shot-to-shot variability requires multiple spectra [10] [11] |
| Portability for field deployment [10] [11] | Lower precision and accuracy compared to laboratory techniques (e.g., ICP-MS) [10] [11] |
| Light element capability (Li, Be, B, C, etc.) [10] | Limited detection sensitivity for some elements compared to ICP methods [10] [15] |
| Versatile sampling (solids, liquids, gases) [12] | Micro-destructive nature (nanograms to micrograms removed) [10] [12] |
LIBS in Mineral Prospecting and Ore Processing
Mineral Exploration Applications
LIBS technology addresses critical needs across the mineral exploration pipeline, from initial prospecting to resource definition. In target generation, handheld LIBS analyzers enable rapid geochemical surveying of rocks, sediments, and soils directly in the field, providing immediate feedback for follow-up sampling [10]. During prospect evaluation, LIBS systems can be deployed in core sheds for high-throughput analysis of drill cores, generating extensive geochemical datasets for 3D visualization of mineralized zones without the delays and costs associated with external laboratory analysis [10]. For resource definition, LIBS offers unique capabilities for light element detection that is particularly valuable for commodities like lithium-bearing minerals and rare earth elements [10] [15].
The technique's sensitivity to isotopic variations and molecular structure influences further enhances its utility for provenance studies and mineral discrimination [11]. Research has demonstrated successful application of LIBS spectral fingerprinting with multivariate analysis to distinguish garnet varieties and other minerals based on subtle compositional differences, with implications for understanding mineralization processes and vectoring toward economic deposits [11].
Ore Processing and Grade Control
In ore processing operations, LIBS technology enables real-time grade control and process optimization through rapid elemental analysis [10]. Purpose-specific LIBS systems have been developed by the mining industry for online analysis and rapid processing of ore streams, with applications including:
- Belt sorting of mined material based on elemental composition [10]
- Slurry monitoring in processing plants for process control [10]
- Concentrate grade verification before shipping [10]
- Slag analysis for process efficiency evaluation [10]
The capacity for stand-off analysis allows LIBS systems to be deployed in hazardous or difficult-to-access areas within processing plants, while minimal sample preparation requirements enable almost instantaneous feedback for process adjustments [10]. This real-time capability is particularly valuable for flotation plants and leaching operations where rapid chemical characterization can significantly improve recovery efficiency and reduce reagent consumption.
Experimental Protocols for Mineralogical Analysis
Field Analysis of Geological Samples
For field-based mineral prospecting using handheld LIBS analyzers, the following protocol ensures reliable results:
Sample Preparation:
- Expose fresh surfaces by breaking or cleaning to avoid weathering effects
- Remove obvious contaminants or coatings that may interfere with analysis
- For powdered samples, prepare pressed pellets when possible for improved homogeneity
Instrument Preparation:
- Calibrate using manufacturer-provided standards and verify with reference materials
- Ensure fully charged battery for consistent laser energy
- Set appropriate analysis mode based on sample type (e.g., soil, rock, ore)
Data Collection:
- Position analyzer firmly against sample surface to maintain consistent distance
- Acquire multiple spectra (typically 10-30 shots) from different spots to account for heterogeneity
- Include quality control samples (known standards) every 10-20 samples
- Record GPS coordinates and photographic documentation when possible
Data Interpretation:
- Use instrument-specific calibration models optimized for geological matrices
- Apply spectral matching algorithms for mineral identification
- Generate elemental maps for heterogeneous samples when capability exists
Laboratory Quantitative Analysis
For more precise quantitative analysis in laboratory settings using benchtop LIBS systems:
Sample Preparation:
- Pulverize samples to fine powder (<75 µm) in tungsten carbide or agate mills
- Prepare pressed pellets using hydraulic presses with binding agents if necessary
- Include certified reference materials matched to expected sample composition
Instrument Optimization:
- Optimize laser energy (typically 10-100 mJ/pulse) to balance signal intensity and ablation stability
- Adjust delay time (typically 1-5 µs) and gate width (0.5-5 µs) to maximize signal-to-noise ratio
- Use inert gas purging (Ar or He) when analyzing elements with high excitation potentials
- Set appropriate spot size based on mineral grain size and heterogeneity
Calibration:
- Develop matrix-matched calibration curves using well-characterized reference materials
- Apply internal standardization when suitable major elements are present at consistent concentrations
- Validate models with independent check samples not used in calibration
- Implement multivariate calibration (PLS) using entire spectral regions for improved accuracy
Data Quality Assurance:
- Monitor plasma temperature and electron density to verify LTE conditions
- Check for self-absorption effects in major element lines
- Analyze replicate samples to determine method precision
- Compare results with reference methods for validation
The Researcher's Toolkit for LIBS Analysis
Table 3: Essential Research Reagent Solutions for LIBS Analysis
| Item | Function | Application Notes |
|---|---|---|
| Certified Reference Materials | Calibration and validation | Matrix-matched to samples; cover expected concentration ranges [14] |
| Sample Preparation Tools | Homogenization and presentation | Hydraulic presses for pellets; tungsten carbide or agate mills for pulverization |
| Laser Source | Plasma generation | Q-switched Nd:YAG (1064 nm or harmonics); typical pulse widths 6-15 ns [10] [11] |
| Spectrometer System | Spectral dispersion | Echelle spectrographs for broad coverage; CCD/ICCD detectors for sensitivity [10] [12] |
| Inert Gas Supply | Signal enhancement | Argon or helium purging to confine plasma and improve excitation [10] |
| Multivariate Software | Data processing | PLS, PCR algorithms for quantitative analysis; classification tools for discrimination [14] |
Laser-Induced Breakdown Spectroscopy represents a powerful analytical technique that transforms laser energy into quantitative elemental data through a carefully orchestrated sequence of physical processes. From initial laser ablation through plasma formation, atom excitation, and spectral emission, each stage of the LIBS process contributes to its unique capabilities for rapid, in-situ elemental analysis. For mineral prospecting and ore processing applications, LIBS offers particular advantages in detecting critical light elements, providing real-time analytical feedback, and enabling field-based decision making. While challenges remain in quantification accuracy and precision, ongoing advancements in instrumentation, calibration methodologies, and data processing continue to expand LIBS applications across the geosciences. The integration of multivariate chemometrics and machine learning approaches promises to further enhance LIBS capabilities, solidifying its role as an indispensable tool in modern mineral exploration and processing research.
Laser-Induced Breakdown Spectroscopy (LIBS) represents a paradigm shift in geochemical analysis for mineral prospecting and ore processing. This application note details the core technological advantages of portable LIBS systems, with a specific focus on their unparalleled capability for light element detection and requirement for minimal sample preparation. These differentiators are critically evaluated within the context of a broader research thesis on field-deployable analytical techniques, providing researchers and development professionals with structured quantitative data, standardized experimental protocols, and visual workflows to underpin methodological decisions in exploration geology and mineralogical research.
The Technological Advantage of Light Element Detection
The capacity of LIBS to detect light elements—specifically lithium (Li), beryllium (Be), boron (B), and sodium (Na)—constitutes a primary advantage over other field-portable techniques like X-ray Fluorescence (XRF). This capability is driven by the fundamental physics of the technique, which analyzes optical emissions from a laser-induced plasma, and is particularly sensitive to elements with low atomic numbers that are poor X-ray emitters [16].
Quantitative Detection Performance
The following table summarizes typical detection capabilities for key light and critical elements using handheld LIBS systems in geological applications [4] [16].
Table 1: Detection Limits for Critical Elements Using Handheld LIBS
| Element Category | Specific Elements | Characteristic Wavelength | Typical Detection Limit | Primary Mining Application |
|---|---|---|---|---|
| Critical Battery Metals | Lithium (Li) | 670.8 nm | 0.01 - 0.1% [4] | Pegmatite exploration, brine analysis [4] |
| Cobalt (Co) | 345.4 nm | 10 - 100 ppm [4] | Sulfide ore grade assessment [4] | |
| Nickel (Ni) | 352.4 nm | 50 - 200 ppm [4] | Laterite deposits [4] | |
| Light Elements | Beryllium (Be) | Not Specified | 0.01 - 0.5% [4] | Advanced materials, specialty minerals [4] |
| Boron (B) | Not Specified | 0.01 - 0.5% [4] | Tourmaline-bearing systems, skarn deposits | |
| Sodium (Na) | Not Specified | 0.01 - 0.5% [4] | Rock-forming mineral identification | |
| Base Metals | Copper (Cu) | Not Specified | 100 - 500 ppm [4] | Porphyry deposits, sulfide ores [4] |
Experimental Protocol: Light Element Identification and Quantification
Objective: To qualitatively identify and quantitatively measure the concentration of lithium in a granitic rock sample using a handheld LIBS analyzer.
Materials:
- Handheld LIBS analyzer (e.g., SciAps Z-903) with a spectral range of 190–950 nm [17] [16].
- Unprepared, flat-surfaced rock sample or drill core segment [5].
- Certified Reference Materials (CRMs) with known Li concentrations, matrix-matched to granite [5].
- Lint-free cloth for surface cleaning.
Methodology:
- System Calibration: Power on the LIBS analyzer and allow it to warm up. Select or create a calibration model tailored for lithium detection in silicate matrices. This model is often built using a set of CRMs and sophisticated algorithms to account for matrix effects [5] [17].
- Sample Presentation: Wipe the sample surface to remove loose debris. Ensure the sample has a relatively flat area for stable contact with the analyzer's nose cone.
- Data Acquisition: Firmly press the analyzer's nose cone against the sample surface to create a light lock. Initiate analysis. The system will fire a series of high-energy laser pulses (typically a Q-switched Nd:YAG laser) at the sample, ablating a micro-volume of material to create a plasma [18] [4]. The emitted light from the cooling plasma is collected by optics and dispersed by a spectrometer [18].
- Spectral Analysis: The software automatically processes the collected spectrum. For qualitative identification, inspect the spectrum for the characteristic lithium emission line at 670.8 nanometers [4]. The presence of a peak at this wavelength confirms lithium.
- Quantitative Calculation: For quantitative analysis, the software compares the intensity of the Li emission line (and/or other elemental lines) against the pre-calibrated model, providing an estimated concentration in weight percent (wt.%) or parts per million (ppm) on the device display [5].
Data Interpretation: The quantitative result provides an immediate field estimate of Li concentration. Researchers can use this data to make rapid decisions during drilling campaigns, such as continuing, ceasing, or repositioning drill sites to optimize financial and human resources [5].
The Operational Advantage of Minimal Sample Preparation
Traditional laboratory analysis requires extensive sample preparation, including crushing, grinding, and chemical dissolution of solid samples, which can consume 2-4 hours before analysis even begins [4]. LIBS technology eliminates these time-consuming steps entirely, enabling direct analysis of unprepared samples.
Workflow Comparison: Traditional vs. LIBS Analysis
The following diagram illustrates the significant efficiency gains offered by the minimal sample preparation requirements of LIBS technology.
Experimental Protocol: Direct Analysis of Unprepared Drill Core
Objective: To obtain quantitative geochemical data directly from unprepared drill core samples to guide real-time drilling decisions during a mineral exploration campaign.
Materials:
- Handheld LIBS analyzer.
- Drill core segments (e.g., 400 cm segments as used in the Beauvoir granite case study) [5].
- Reference samples sourced from the same deposit for calibration [5].
Methodology:
- Model Development: Prior to field deployment, build a quantitative calibration model using reference samples from the deposit. This model is crucial for mitigating matrix effects and ensuring prediction reliability [5].
- Core Logging: Place the drill core segment on a stable surface. Visually inspect for a representative and relatively flat analysis point.
- In-Situ Measurement: Apply the LIBS analyzer directly to the drill core surface. A single analysis point typically involves multiple laser shots (e.g., 2-4 pulses per zone, multiple zones per grid) to capture a representative signal of the rock volume [5] [17].
- Data Processing: The analyzer's software uses the pre-loaded calibration model to convert the spectral data into quantitative elemental concentrations in near real-time.
Data Interpretation: In the Beauvoir granite case study, this protocol successfully quantified Li and Rb with a mean absolute error (MAE) of 0.043 wt% and 0.068 wt% respectively, compared to laboratory data, confirming the viability of LIBS for reliable quantitative analysis on unprepared materials [5]. This allows operating teams to make strategic decisions about drilling continuity and positioning within hours instead of weeks [5].
The Scientist's Toolkit: Essential Research Reagent Solutions
The effective implementation of LIBS technology in research relies on several key components and consumables.
Table 2: Essential Materials for Field LIBS Research
| Item | Function/Description | Research Application |
|---|---|---|
| Handheld LIBS Analyzer | Integrated device containing laser, spectrometer, optics, and software. Spectral range: 190–950 nm. | Primary tool for in-situ data acquisition. Enables analysis of all elements from hydrogen to uranium [4] [16]. |
| Certified Reference Materials (CRMs) | Samples with known, certified concentrations of elements in a specific matrix (e.g., granite, soil). | Critical for building site-specific calibration models and validating analytical accuracy. Mitigates matrix effects [5] [4]. |
| Reference Mineral Spectra Library | A collection of over 12,000 LIBS spectra from pure mineral samples (silicates, carbonates, sulfides, etc.) [17]. | Serves as a reference for mineral identification, relevant emission line selection, and input for machine learning algorithms [17]. |
| Lens Cleaning Kit | Lint-free wipes and compressed air. | Maintains optical clarity of the protective window, ensuring consistent laser focus and light collection. |
| Rechargeable Batteries | Power source for the handheld analyzer. | Enables 8-12 hours of field operation, essential for remote prospecting and extended drilling campaigns [4]. |
The technological differentiators of light element detection and minimal sample preparation firmly establish portable LIBS as an indispensable tool for modern mineral prospecting and ore processing research. Its ability to deliver rapid, quantitative data for critical elements like lithium directly on drill cores and rock chips transforms exploration workflows, enabling a more dynamic and responsive approach to resource discovery. While challenges such as matrix effects and the need for robust calibration exist, the protocols and data presented herein provide a foundation for researchers to leverage LIBS technology to its full potential, thereby accelerating scientific discovery and enhancing operational efficiency in the field.
The transition of Laser-Induced Breakdown Spectroscopy (LIBS) from a laboratory technique to a rugged field-deployable analyzer represents a paradigm shift in geochemical analysis, particularly for mineral prospecting and ore processing research. This evolution has transformed a once bulky and complex technique requiring controlled environments into a handheld tool that delivers real-time, lab-quality elemental analysis directly at the exploration site [19] [20]. The core of LIBS technology involves using a high-powered pulsed laser to ablate a microscopic amount of material, creating a plasma whose emitted light is spectrally resolved to characterize elemental composition [4]. For researchers, this migration to portability enables immediate, data-driven decisions during field campaigns, drastically reducing the delay between sample collection and analytical results from days or weeks to mere seconds [19] [21].
The Laboratory Foundations of LIBS
LIBS technology originated in laboratory settings, relying on sophisticated, non-portable equipment. Traditional laboratory LIBS systems utilized high-energy laser sources, high-resolution spectrometers, and complex optical arrangements often housed on large optical tables. These systems required precise alignment, stable temperature control, and connection to external computing resources for data processing [19]. Sample analysis was a meticulous process, typically requiring samples to be cut, polished, and sometimes converted into pressed pellets to ensure a uniform and representative surface for laser ablation [19]. This level of preparation made rapid, in-situ analysis impossible.
Early laboratory LIBS demonstrated a key strength: exceptional capability for detecting light elements such as lithium (Li), beryllium (Be), boron (B), and carbon (C), which are notoriously difficult to analyze with other field techniques like portable X-Ray Fluorescence (XRF) due to their poor X-ray fluorescence yields [19] [4]. Furthermore, laboratory systems paved the way for advanced applications like high-speed, high-resolution geochemical imaging, where elemental maps could be generated to reveal mineral zonation, overprinting features, and the composition of fine veins and fractures at a microscale [19] [22]. These foundational capabilities established LIBS as a powerful analytical technique and set the performance benchmark that field-portable systems would need to meet.
Technological Drivers for Miniaturization and Ruggedization
The transformation of LIBS into a field-worthy tool was driven by parallel advancements in several key technologies that addressed the core challenges of size, power consumption, robustness, and analytical performance.
Laser Technology: The development of compact, robust, and efficient pulsed lasers was paramount. Modern handheld LIBS analyzers incorporate lasers, such as Nd:YAG types, that deliver 5-8 millijoules per pulse with nanosecond pulse widths at repetition rates of 50 Hz, all within a small, battery-operable package [19] [20] [23]. This high power density is crucial for creating a robust plasma on various sample surfaces in an air environment.
Spectrometer and Detector Miniaturization: The replacement of bulky laboratory spectrometers with compact, high-resolution units was another critical step. Innovations like patented stack-spectrometer designs allow handheld analyzers to cover a wide spectral range (e.g., 190–950 nm) with the resolution necessary to distinguish closely spaced emission lines from multiple elements [23].
On-Board Computing and Software: The integration of powerful, low-power-consumption mobile processors running operating systems like Android has enabled real-time spectral processing, advanced chemometrics, and intuitive user interfaces directly on the device [23]. This eliminates the need for tethered computers and allows for immediate interpretation of results in the field.
Ruggedized Design and Safety: To withstand harsh field conditions, handheld LIBS units are housed in ruggedized casings. A critical safety innovation is the sample-detection interlock system, which ensures the laser fires only when in direct contact with a sample, allowing the instrument to be operated as a Class 1 laser device and ensuring user safety [23].
The table below summarizes the key technological transitions from laboratory to field-deployable LIBS systems.
Table 1: Evolution of Key LIBS System Components from Laboratory to Field
| Component | Laboratory Instrument | Rugged Field-Deployable Analyzer |
|---|---|---|
| Laser Source | Large, water-cooled, high-energy lasers on optical tables | Compact, air-cooled, ~6-8 mJ/pulse, 50 Hz, battery-powered [20] [23] |
| Spectrometer | Bench-mounted, high-resolution but bulky | Miniaturized stack-spectrometer design; wide range (190-950 nm) [23] |
| Sample Chamber | Large, fixed chamber with argon purge | Integrated, small-volume argon purge cup or air-burn "QuickSort" mode [23] |
| Computer & Software | Tethered external PC with complex software | Integrated Android-based touchscreen with real-time analysis and data sharing [23] |
| Portability & Power | Mains-powered, immobile | Handheld (<~2.9 kg), hot-swappable batteries for 6+ hours of operation [24] [23] |
Capabilities of Modern Handheld LIBS for Mineral Research
Modern handheld LIBS analyzers offer a powerful suite of capabilities that make them indispensable for mineral prospecting and ore processing research.
Elemental Coverage and Detection Limits
Handheld LIBS provides comprehensive elemental coverage, a particular advantage for critical minerals and light elements. Its capability spans from hydrogen to uranium, but it excels where other portable techniques are weak [23] [4]. The technology is uniquely positioned for the "green economy," being the only handheld field technique capable of measuring lithium content in soils, ores, and brines, a critical capability for lithium exploration needed for battery production [20] [4]. Quantitative analysis is achieved through empirical calibration models that can be developed by the user for specific matrices using onboard software [21] [22] [23].
Table 2: Typical Detection Capabilities of Handheld LIBS for Selected Elements in Mining [4]
| Element Category | Specific Elements | Typical Detection Limit | Primary Research Application |
|---|---|---|---|
| Critical Battery Metals | Lithium (Li) | 0.01 - 0.1% | Pegmatite exploration, brine analysis |
| Cobalt (Co), Nickel (Ni) | 10 - 200 ppm | Sulfide ore grade assessment | |
| Light Elements | Carbon (C), Boron (B) | 0.01 - 0.5% | Advanced materials, specialty minerals |
| Fluorine (F) | Quantifiable via CaF bands [22] | Mineral discrimination | |
| Precious Metals | Gold (Au), Silver (Ag) | 50 - 200 ppm | Precious metal mining & processing |
| Base Metals | Copper (Cu), Zinc (Zn) | 100 - 500 ppm | Porphyry deposits, sulfide ores |
Geochemical Imaging and Mapping
A significant research application derived from laboratory practice is geochemical imaging. Handheld LIBS can be used in a rastering mode to perform elemental mapping on rock surfaces or drill cores with sub-millimeter resolution [19]. An open-source workflow has been developed for processing LIBS data and stitching multiple raster grids together, enabling researchers to map centimeter-scale features such as veinlets, alteration zones, and mineral intergrowths directly on saw-cut drill core surfaces without any sample preparation [19]. This allows for the unraveling of complex paragenetic sequences and fluid flow histories in rocks.
Advanced Data Analysis and Chemometrics
The large, multidimensional spectral data generated by LIBS is ideally suited for advanced statistical and pattern recognition techniques. Researchers routinely use chemometrics—such as Partial Least Squares Discriminant Analysis (PLS-DA), k-Nearest Neighbors (k-NN), and Support Vector Machines (SVM)—to extract meaningful information from the spectra [22]. These methods enable applications like the precise discrimination of mineral species [22], determination of gemstone provenance with high accuracy [22], and correlation of elemental data with molecular data from techniques like Raman spectroscopy [22].
Experimental Protocols for Mineral Research
Protocol 1: Handheld LIBS Analysis of Drill Core for Geochemical Imaging
Application Note: This protocol details the methodology for rapid, qualitative geochemical imaging of hydrothermally altered drill core samples to identify mineral zonation and fluid pathways, as adapted from Lawley et al. [19].
Research Reagent Solutions & Essential Materials:
Table 3: Essential Materials for Drill Core Analysis
| Item | Function |
|---|---|
| Handheld LIBS Analyzer (e.g., SciAps Z-903) | Full spectral range (190-950 nm) required for light elements (Li, C, F) and heavy metals [23]. |
| Sample Preparation Tools | Rock saw for creating a fresh, flat surface. Compressed air or brush for removing loose debris. |
| Positioning Stage (Optional) | For precise, repeatable movement of the core for large-area mapping. |
| Reference Materials | Matrix-matched standards (e.g., NIST, CANMET) for qualitative verification and potential quantification. |
| Profile Builder Software | Proprietary software (e.g., SciAps) for building custom calibration models and processing spectral data [21] [23]. |
Methodology:
- Sample Preparation: Cut the drill core to create a fresh, flat surface. No polishing or further preparation is required. Clean the surface with compressed air to remove dust [19].
- Instrument Setup: Select the "Mapping" or "Raster" mode on the handheld LIBS analyzer. Define the analysis area and the grid pattern (e.g., 16 x 16 shots). The analyzer will typically employ beam rastering, automatically moving the laser to multiple positions to average out sample heterogeneity [19] [23].
- Data Acquisition: Hold the analyzer's sampling window firmly against the sample surface. Initiate the automated analysis. The laser (e.g., 1064 nm, 5-7 mJ/pulse) will fire a series of shots at each grid point, collecting spectra from the generated plasma [19].
- Data Processing & Stitching: Use the manufacturer's software or an open-source workflow to process the spectral data from each grid. For areas larger than a single analyzer footprint, stitch multiple adjacent raster grids together to create a cohesive cm-scale elemental map [19].
- Data Interpretation: Use the generated false-color elemental maps to identify mineral associations based on known chemical compositions. Overlay maps of different elements (e.g., Mg vs. Fe) to distinguish between mineral species like olivine and pyroxene.
The following workflow diagram illustrates the core steps of this protocol.
Protocol 2: Quantitative Analysis of Lithium in Pegmatites
Application Note: This protocol describes a method for the quantitative estimation of lithium (Li) content in Li-rich minerals (e.g., spodumene, lepidolite) from pegmatites using a handheld LIBS analyzer, based on the work of Fabre et al. [21].
Research Reagent Solutions & Essential Materials:
Table 4: Essential Materials for Lithium Analysis
| Item | Function |
|---|---|
| Handheld LIBS Analyzer (e.g., SciAps Z-901 Li or Z-903) | Configured for the Li emission range (~670.8 nm) [23]. |
| Certified Reference Materials (CRMs) | Matrix-matched pegmatite/ Li-ore standards with certified Li concentrations. |
| Profile Builder Software | Essential for constructing the empirical calibration model [21] [23]. |
| Sample Preparation Tools | Jaw crusher, mill, and pellet press for producing homogeneous powder pellets (for calibration). |
Methodology:
- Calibration Model Development: Prepare a set of matrix-matched certified reference materials and/or well-characterized in-house standards. If using powders, mill to a consistent fine grain size and press into pellets. Analyze each standard multiple times with the handheld LIBS to collect a robust spectral dataset [21].
- Model Building: Use the Profile Builder software to input the known concentrations of Li and other elements of interest. The software will correlate the spectral intensity (e.g., of the Li 670.8 nm line) or use full-spectrum multivariate analysis to build an empirical calibration model [21] [23].
- Validation: Validate the calibration model by analyzing validation standards not used in the model building. Check for accuracy and precision to ensure the model's predictive capability.
- Sample Analysis: In the field, present a fresh rock surface or a prepared powder pellet of the unknown sample to the analyzer. The instrument will use the pre-loaded calibration to provide a quantitative estimate of Li content in seconds [21].
- Quality Control: Periodically analyze a check standard to monitor and ensure the continued performance of the calibration over time.
The quantitative calibration process is outlined in the diagram below.
The historical evolution of LIBS from a laboratory instrument to a rugged field-deployable analyzer has fundamentally expanded the capabilities of researchers in mineral prospecting and ore processing. This transition, powered by advancements in laser technology, spectrometer miniaturization, and data processing, has democratized access to real-time, high-quality geochemical data. The ability to perform rapid qualitative imaging and quantitative analysis of critical elements like lithium directly on outcrops, drill cores, and soils enables a more dynamic and efficient research workflow. As handheld LIBS technology continues to mature, its integration with advanced data analytics and other sensing modalities promises to further solidify its role as an indispensable tool in the geoscientist's toolkit, driving innovation from early-stage exploration to process optimization.
Market Growth and Adoption Trends in the Global Mining Industry
The global mining industry is undergoing a significant transformation, driven by increasing demand for minerals and technological innovation. Current market analysis indicates the mining market has reached a substantial size of $1,969.24 billion in 2024 and is projected to grow to $2,585.73 billion by 2029, representing a compound annual growth rate (CAGR) of 5.8% [25]. This expansion is primarily fueled by government policies supporting the mining sector and an escalating global demand for minerals and metals essential for construction, electronics, automotive, and renewable energy industries [25].
Concurrent with this market expansion, a technological revolution is underway with the emergence of portable Laser-Induced Breakdown Spectroscopy (LIBS) analyzers as a transformative tool for mineral prospecting and ore processing. The market for portable element analyzers specifically for minerals is poised to reach approximately $1.2 billion in 2025, growing at an anticipated CAGR of 6.5% through 2033 [26]. This growth trajectory underscores the mining industry's accelerating adoption of portable analytical technologies that enable real-time, on-site elemental analysis, fundamentally changing exploration and operational methodologies.
Market Analysis: Quantitative Industry Outlook
The mining industry's growth is characterized by strong regional variations and segment-specific dynamics. The tables below summarize key quantitative data driving this expansion.
Table 1: Global Mining Market Overview and Growth Forecast
| Metric | Value (2024) | Projected Value | Timeframe | CAGR |
|---|---|---|---|---|
| Overall Mining Market Size | $1,969.24 billion [25] | $2,585.73 billion [25] | 2024-2029 | 5.8% [25] |
| Mining Production Volume | - | 15.89 trillion kg [27] | Projected for 2025 | 0.94% (2025-2030) [27] |
| Portable Element Analyzers Market | - | ~$1.2 billion [26] | Projected for 2025 | 6.5% (2025-2033) [26] |
| Handheld LIBS Analyzers Market | - | - | 2025-2032 | 6.7% [28] |
Table 2: Mining Market Segmentation and Regional Dynamics
| Segment | Key Details | Largest Region (2024) | Fastest-Growing Region |
|---|---|---|---|
| Market by Type | Mining Support Activities, General Minerals, Metal Ore, Coal, etc. [25] | Asia-Pacific [25] | North America [25] |
| Market by Process | Underground Mining, Surface Mining [25] | - | - |
| Portable LIBS Demand | - | North America (~30% share) [28] | Asia-Pacific (~20% share, rapid growth) [28] |
| LIBS Market Growth | - | North America (34.7% 2024 revenue) [15] | Asia-Pacific (5.9% CAGR through 2030) [15] |
Key Market Drivers and Trends
Several interconnected factors are propelling the growth and transformation of the mining sector:
- Government Support and Mineral Demand: Governments worldwide are providing subsidies and encouraging foreign direct investments in mining. This support, combined with rising demand for minerals and metals for economic growth and raw materials, is a primary market driver [25].
- Technology Adoption and Strategic Partnerships: The industry is focusing on technological innovations, including the use of LIDAR, drone technology, digital twins, and battery-driven machinery. Major companies are increasingly forming strategic partnerships with equipment manufacturers and technology firms to improve efficiency and sustainability [25].
- Regulatory and Environmental Pressures: Stringent environmental regulations globally, particularly in Europe, necessitate precise elemental analysis for compliance. This drives the adoption of portable analyzers for environmental monitoring and hazardous material detection [26] [29].
The Portable LIBS Revolution: Technology and Adoption
Portable LIBS analyzers represent a paradigm shift in geochemical analysis, moving time-sensitive elemental characterization from distant laboratories directly to the field. This technology provides a critical tool for real-time decision-making in mineral exploration and ore processing.
Laser-Induced Breakdown Spectroscopy (LIBS) operates by focusing a high-energy laser pulse onto a sample surface, ablating a tiny amount of material (nanograms to micrograms) to create a transient plasma with temperatures of 10,000-20,000 K [29]. As this plasma cools, it emits characteristic atomic emission lines collected and analyzed by a spectrometer to determine elemental composition with remarkable precision, typically detecting elements at concentrations from parts per million (ppm) to percentage levels [29].
A key advantage of LIBS is its speed, providing analysis in 1-10 seconds per measurement point, a dramatic improvement over traditional laboratory methods requiring hours or days [29]. Recent advancements have successfully fused LIBS with Raman Spectroscopy (RS), leveraging machine learning to achieve mineral identification accuracy up to 98.4% by combining elemental and molecular structure information [7].
Adoption Trends and Operational Advantages
The adoption of handheld LIBS in mining is accelerated by its demonstrable operational advantages over traditional analysis methods, as shown in the table below.
Table 3: Traditional vs. LIBS-Based Analysis Workflow
| Aspect | Traditional Laboratory Analysis | Portable LIBS Analysis |
|---|---|---|
| Turnaround Time | 1-3 days for ICP-MS [29] | Results in seconds [29] |
| Logistics | Sample transport required [29] | On-site analysis [29] |
| Data Processing | Batch processing [29] | Continuous, real-time analysis [29] |
| Decision-Making | Static mine planning based on outdated data [29] | Dynamic, proactive optimization [29] |
| Light Element Detection | Effective for a wide range | Effective for light elements (e.g., Li, C, Be) crucial for battery minerals [30] [15] |
The core workflow of LIBS technology and its integration into the mining value chain can be visualized as follows, illustrating the process from laser-sample interaction to data-driven decision-making.
Application Notes: Protocols for Portable LIBS in Mining
The implementation of portable LIBS technology spans the entire mining value chain. The following application notes provide detailed methodologies for key use cases.
Application Note AN-001: Real-Time Drill Core Analysis
Objective: To accelerate resource definition by providing immediate geochemical data during drilling campaigns, enabling on-the-fly targeting and reducing reliance on external laboratories [29].
Experimental Protocol:
- Step 1: Sample Preparation. Wipe drill core surface with a clean, dry cloth to remove loose debris. Minimal preparation is required; avoid using water or solvents that may contaminate the analysis spot [30] [21].
- Step 2: Instrument Calibration. Select the appropriate calibration model for the expected geology (e.g., "Lithium in Pegmatites"). Perform a quick validation check using a provided reference standard [30] [21].
- Step 3: Data Acquisition. Firmly press the analyzer's nose cone perpendicular to the clean core surface. Acquire a minimum of three 10-second readings at each logging interval, spacing measurements to account for core heterogeneity [24].
- Step 4: Data Logging and Integration. Use the instrument's built-in software to log GPS coordinates and depth for each measurement. Export data in CSV format for direct import into geological modeling software [29].
Application Note AN-002: LIBS-Enabled Ore Sorting
Objective: To implement real-time grade control by precisely separating valuable ore from waste material at the earliest stage, thereby increasing mill feed grade, reducing processing costs, and minimizing waste volumes [29].
Experimental Protocol:
- Step 1: System Integration. Install a conveyor-mounted LIBS system for continuous analysis. Key components include a pulsed laser source, optical focusing system, spectrometer, and a computer for data acquisition [29].
- Step 2: Calibration for Sorting. Develop a robust calibration model that correlates LIBS signal intensity for the target element(s) (e.g., Cu, Li, Ni) with economic cut-off grades. This may require analyzing hundreds of known samples [29] [15].
- Step 3: Real-Time Analysis and Activation. Analyze rock fragments on the conveyor belt at speeds up to 3 meters/second. The system should be capable of analyzing multiple points on each fragment [29].
- Step 4: Mechanical Sorting. Integrate the LIBS analyzer with a pneumatic or mechanical sorting mechanism. Rocks identified as "waste" based on pre-set elemental thresholds are automatically diverted from the processing stream [29].
The integration of LIBS across the mining lifecycle creates a continuous feedback loop that enhances efficiency and decision-making from discovery to processing.
The Scientist's Toolkit: Essential Research Reagent Solutions
Successful field deployment of portable LIBS requires more than just the analyzer. The following table details essential materials and their functions for researchers conducting field analysis.
Table 4: Essential Research Reagent Solutions for Field LIBS Analysis
| Item | Function | Critical Specifications |
|---|---|---|
| Portable LIBS Analyzer | Primary tool for on-site elemental analysis. | Spectral range (e.g., 190-950 nm), laser energy, detector resolution, weight (<3 kg ideal) [30] [24]. |
| Certified Reference Materials (CRMs) | Calibration validation and quality assurance. | Matrix-matched to target geology (e.g., pegmatite for Li, ultramafic for Ni) [21]. |
| Profile Builder Software | Create custom, matrix-matched calibrations. | User-friendly interface, chemometric capabilities [30] [21]. |
| Ruggedized Field Laptop | Data management, visualization, and backup. | Daylight-readable screen, solid-state drive, long battery life. |
| Portable Power Supply | Extended field operation. | High-capacity, lightweight lithium power pack. |
| Sample Preparation Kit | Minimal surface cleaning for optimal analysis. | Non-metallic brushes, compressed air duster, lint-free cloths [21]. |
Challenges and Future Outlook
Despite its promise, the widespread adoption of portable LIBS faces several challenges. Key restraints include the established dominance of XRF and ICP methods in core laboratories, creating workflow inertia [15]. Furthermore, accuracy variability due to matrix effects and calibration complexity requires robust reference libraries and chemometric expertise, posing a near-term barrier for some operators [26] [15]. The initial capital investment for high-performance units can also be a barrier for smaller enterprises [26].
The future of LIBS in mining is intrinsically linked to technological convergence. The integration of Artificial Intelligence (AI) and Machine Learning (ML) is set to automate sample identification and enhance data analysis, directly addressing calibration complexity challenges [26] [7]. Furthermore, the ongoing miniaturization and cost decline of solid-state lasers and spectrometers will make the technology more accessible and embeddable into larger automated systems [15]. Finally, the fusion of LIBS with complementary techniques like Raman spectroscopy and XRF provides a more comprehensive material characterization, paving the way for next-generation analytical platforms [7] [15].
The global mining industry is on a solid growth trajectory, increasingly driven by technological innovation. Portable LIBS analyzers have emerged as a cornerstone technology, enabling real-time, data-driven decisions that enhance operational efficiency, improve sustainability, and secure the supply of critical minerals. For researchers and scientists, mastering the application notes and protocols associated with this technology is no longer a specialized skill but a fundamental competency for advancing mineral prospecting and ore processing research in the 21st century.
Field Deployment and Workflow Integration: Practical Applications in Mineral Exploration and Processing
Laser-Induced Breakdown Spectroscopy (LIBS) represents a revolutionary analytical approach that fundamentally transforms how mining operations assess elemental composition in real-time [4]. For researchers and scientists in mineral prospecting, portable LIBS instruments provide the critical capability to perform rapid, on-site geochemical analysis of outcrops and rock chips, enabling immediate geological interpretations and target generation during active field seasons [31] [4]. This technology eliminates traditional bottlenecks associated with laboratory analysis, supporting dynamic decision-making in exploration campaigns and ore processing research.
The core advantage lies in LIBS's ability to analyse solid samples without extensive pre-treatment requirements that plague traditional laboratory methods [4]. Where conventional approaches require extensive sample grinding, chemical dissolution, and complex preparation procedures consuming 2-4 hours before analysis begins, LIBS technology delivers instantaneous elemental characterization through focused laser pulses that instantly vaporize microscopic material portions, generating plasma temperatures exceeding 15,000 Kelvin within nanoseconds [4]. This micro-destructive approach preserves sample integrity while delivering comprehensive elemental analysis within 30-60 seconds per measurement point [4].
LIBS Technology Fundamentals and Principles
Core Analytical Mechanism
The LIBS analytical sequence operates through a precisely controlled physical mechanism that occurs within microseconds [4]. When a high-energy laser beam strikes the sample surface, it delivers energy densities ranging from 10⁸ to 10¹¹ watts per square centimetre, creating instantaneous ionisation that transforms material into plasma consisting of free electrons and excited ions [4]. As this plasma expands outward and cools over 1-10 microseconds, excited electrons transition to lower energy states and emit characteristic photons at wavelengths specific to each element present [31].
Advanced optical spectrometers equipped with charge-coupled device (CCD) cameras capture these emission signatures across wavelengths spanning from ultraviolet through near-infrared regions [4]. Sophisticated software algorithms then compare recorded spectral patterns against calibrated reference libraries, enabling simultaneous identification and quantification of multiple elements from hydrogen through uranium on the periodic table [4]. The technology achieves remarkable precision with typical laser-induced craters measuring only 50-500 micrometers in diameter, removing merely 1-10 micrograms of material per pulse [4].
Handheld Instrumentation Specifications
For field applications in outcrop and rock chip analysis, commercial handheld LIBS instruments like the Sci-Aps Z-300 or Thermo Fisher Scientific Niton Apollo provide laboratory-grade analytical capabilities in portable form factors [31] [32]. These systems typically incorporate Nd:YAG lasers operating at their fundamental wavelength of 1064 nm with repetition rates of 10 Hz and laser energies of 5-6 mJ per pulse [31]. Modern handheld units integrate multiple spectrometers covering broad spectral ranges from 190-950 nm to capture emission lines across the elemental spectrum [31].
Standard measurement protocols involve raster patterns with multiple laser pulses per point, where the first few pulses serve as "cleaning shots" to remove surface contamination before analytical measurements are recorded [31]. The plasma emission is typically recorded with a delay of 630 ns after plasma ignition and with an integration time of 1 ms [31]. To enhance emission line intensities, most handheld instruments employ a constant flow of Ar gas that surrounds the plasma formation region [31].
Analytical Capabilities for Geochemical Analysis
Elemental Detection Performance
Modern portable LIBS demonstrates exceptional versatility across the entire periodic table, with particular excellence in detecting light elements that challenge traditional analytical methods [4]. The technology effectively identifies critical elements across multiple categories with detection limits suitable for most exploration and grade control applications.
Table 1: Elemental Detection Capabilities of LIBS for Mining Applications
| Element Category | Specific Elements | Typical Detection Limits | Primary Mining Application |
|---|---|---|---|
| Critical Battery Metals | Lithium, Cobalt, Nickel, Manganese | 0.01-0.1% (Li), 10-200 ppm (Co, Ni) | Battery mineral exploration, recycling |
| Base Metals | Copper, Zinc, Lead, Aluminium | 100-500 ppm | Porphyry deposits, sulfide ores |
| Precious Metals | Gold, Silver, Platinum Group | 50-200 ppm | Precious metal mining, processing |
| Light Elements | Carbon, Boron, Beryllium, Sodium | 0.01-0.5% | Advanced materials, specialty minerals |
| Rock-Forming Elements | Silicon, Magnesium, Calcium, Iron | 0.1-1% | Geological mapping, ore characterisation |
LIBS technology particularly excels with light elements such as lithium, boron, and beryllium that produce strong, easily-detectable emission lines but present significant challenges for X-ray fluorescence methods due to poor X-ray fluorescence sensitivity [4]. This capability provides substantial advantages in critical mineral exploration, especially for lithium exploration innovations essential to energy transition technologies.
Key Performance Metrics for Field Applications
For mining researchers and operations, LIBS technology delivers specific performance benchmarks essential for reliable field analysis [4]:
- Detection Sensitivity: Parts-per-million levels for most elements, sub-ppm for certain critical minerals
- Analysis Speed: Complete elemental profile within 30-60 seconds per measurement point
- Elemental Coverage: Hydrogen (atomic number 1) through uranium (atomic number 92)
- Quantification Range: Linear response from 0.01% to >90% elemental concentration
- Precision: ±2-5% relative standard deviation for major elements, 10-20% for trace elements
The simultaneous multi-element detection capability enables LIBS systems to capture entire elemental spectra during single measurement events, eliminating the sequential scanning required by traditional methods [4]. This approach dramatically accelerates compositional fingerprinting of mineral samples while maintaining analytical accuracy comparable to established laboratory techniques for major element concentrations.
Experimental Protocols for Outcrop and Rock Chip Analysis
Field Measurement Procedure
Standardized protocols ensure consistent analytical results across varied field conditions and sample types:
Site Selection and Preparation: Identify representative outcrop surfaces or rock chips free of thick weathering rinds. Remove obvious vegetation or debris, but minimal preparation is required as LIBS penetrates surface dust.
Instrument Calibration: Perform daily calibration checks using certified reference materials matched to the expected geological matrix. Field calibration standards should include composition ranges relevant to the exploration targets.
Measurement Configuration: Program the handheld LIBS unit with appropriate measurement parameters:
Sample Analysis: Position the instrument measurement window flush against the sample surface. Maintain consistent pressure to ensure proper focus distance. Trigger analysis and hold steady until completion.
Quality Assessment: Review spectral quality indicators in real-time. Repeat measurements with poor signal-to-noise ratios. Document GPS coordinates and geological context for each measurement.
Data Interpretation: Utilize statistical analysis methods including principal component analysis (PCA) and clustering techniques to identify compositional trends and anomalies [31].
Data Analysis and Interpretation Methods
Advanced statistical approaches enable researchers to extract meaningful geological information from complex LIBS spectral datasets:
Principal Component Analysis (PCA): This matrix decomposition technique reduces complexity in high-dimensional LIBS data by identifying axes along which samples have the highest variance [31]. PCA identifies correlations and anti-correlations of spectral features through loadings, while scores reveal similar targets, clusters, and patterns in the dataset [31].
Interesting Features Finder (IFF): This complementary approach based on convex hull principles helps identify spectra containing emission lines of minor and trace elements that often remain undetected with variance-based methods like PCA [31]. IFF is particularly valuable for detecting rare compositions that don't contribute significantly to overall dataset variance.
Cluster Analysis: Techniques like k-means clustering or hierarchical clustering group samples with similar compositional characteristics, supporting mineral classification and trend identification [31]. These methods have proven particularly valuable for interpreting extraterrestrial LIBS data from Mars missions, demonstrating robustness for geological applications [31].
Research Reagent Solutions and Essential Materials
Table 2: Essential Research Materials for Field LIBS Analysis
| Item | Function | Application Notes |
|---|---|---|
| Certified Reference Materials (CRMs) | Calibration verification and quality control | Matrix-matched to geological samples; should cover expected concentration ranges |
| Argon Gas Canisters | Plasma enhancement | High-purity grade (99.995%+) for optimal signal intensity [31] |
| Surface Abrasion Tools | Limited sample preparation | Removal of thick weathering rinds or contamination |
| GPS Mapping Device | Spatial documentation | Integration with geochemical data for spatial analysis |
| Spectral Validation Standards | Instrument performance monitoring | Daily verification of spectral resolution and sensitivity |
| Sample Storage System | Rock chip preservation | Moisture-proof containers with minimal contamination risk |
Workflow Visualization for Outcrop Analysis
The following workflow diagram illustrates the integrated process for rapid on-site grade assessment and target generation using portable LIBS technology:
Applications in Critical Mineral Exploration
LIBS technology provides distinct advantages for battery metal exploration and other critical mineral assessment:
Lithium Exploration Applications:
- Pegmatite mapping through rapid identification of lithium-bearing minerals (spodumene, lepidolite, petalite) using characteristic lithium emission at 670.8 nanometers wavelength [4]
- Brine analysis with direct measurement of dissolved lithium concentrations in evaporation pond operations
- Clay deposit evaluation for quantification of lithium-rich clay minerals in sedimentary deposits
- Battery recycling operations through composition analysis enabling efficient sorting and processing
Advanced Exploration Targeting: The real-time capabilities of portable LIBS enable researchers to immediately correlate geological observations with compositional data during field mapping. This integrated approach significantly enhances the efficiency of identifying mineralized zones, alteration patterns, and geochemical vectors toward ore bodies. The technology's sensitivity to pathfinder elements supports the development of refined exploration models directly in the field.
Table 3: Critical Mineral Detection Performance for Exploration
| Critical Element | Detection Limit | Characteristic Wavelength | Exploration Application |
|---|---|---|---|
| Lithium | 0.01-0.1% | 670.8 nm | Pegmatite exploration, brine analysis |
| Cobalt | 10-100 ppm | 345.4 nm | Sulfide ore grade assessment |
| Nickel | 50-200 ppm | 352.4 nm | Laterite and sulfide deposit evaluation |
Operational Considerations and Limitations
Despite significant advantages for field analysis, researchers must acknowledge and manage specific technical considerations when implementing LIBS:
Matrix Effects and Calibration Requirements: Spectral interference between elements represents a primary analytical challenge, particularly when analysing complex mineral matrices containing multiple elements with overlapping emission wavelengths [4]. Different host rock compositions can significantly affect measurement accuracy for target elements, requiring comprehensive calibration protocols specific to each geological environment.
Environmental Operating Constraints: Field deployment presents challenges including atmospheric particulates and humidity that can interfere with laser beam transmission and affect plasma formation consistency [4]. Sample surface conditions (weathered, rough, or contaminated surfaces) may require minimal preparation to ensure representative analysis of fresh material [31].
Analytical Performance Considerations: LIBS technology performs optimally within specific operational parameters. Sample heterogeneity can significantly affect measurement reproducibility, particularly in coarse-grained materials where individual mineral grains may not be representative of bulk composition [4]. Additionally, very low concentration elements may approach detection limits in certain matrix types, requiring alternative analytical approaches for critical trace element analysis.
Through understanding of these principles, protocols, and capabilities, researchers can effectively implement portable LIBS technology for rapid outcrop and rock chip analysis, enabling real-time grade assessment and more efficient exploration target generation in mineral prospecting and ore processing research.
Laser-Induced Breakdown Spectroscopy (LIBS) is an analytical technique that uses a high-energy laser pulse to perform rapid, elemental analysis of materials without any sample preparation. The technology fundamentally transforms how mining operations assess elemental composition by eliminating traditional time-consuming laboratory processes that require extensive sample grinding, chemical dissolution, and complex preparation procedures [4].
The core principle involves focusing a high-energy laser pulse onto a sample surface, which delivers energy densities ranging from 10⁸ to 10¹¹ watts per square centimetre. This creates instantaneous ionization that transforms material into plasma with temperatures exceeding 15,000 Kelvin within nanoseconds [4]. As this plasma cools over 1-10 microseconds, excited electrons transition to lower energy states and emit characteristic photons at wavelengths specific to each element present [4]. Advanced optical spectrometers equipped with charge-coupled device (CCD) cameras then capture these emission signatures across wavelengths spanning from ultraviolet through near-infrared regions [4].
For drill core profiling, LIBS represents a revolutionary approach by enabling direct analysis of intact core samples, eliminating the need for crushing, grinding, or chemical treatment traditionally required for laboratory analysis [4]. This capability provides unprecedented speed in geochemical characterization while preserving sample integrity for future studies.
LIBS Operational Workflow for Drill Core Analysis
The following diagram illustrates the complete workflow for LIBS-based drill core profiling, from initial setup to final data interpretation:
Experimental Protocols for High-Resolution Drill Core Profiling
Field Deployment and Instrument Setup
Equipment Configuration:
- Utilize portable LIBS systems (typically 10-30 kg) capable of 8-12 hours of battery operation for field deployment [4]
- Employ Nd:YAG laser sources with 1064 nm wavelength, 9 mJ pulse energy, 4 ns pulse width, and 1-3 Hz repetition rate [3]
- Configure spectrometers with three spectral channels covering 240-340 nm, 340-540 nm, and 540-850 nm wavelength ranges [3]
- Ensure system calibration using certified reference materials (GBW series) specific to the geological domain under investigation [3]
Core Handling Protocol:
- Assign unique sample codes to each drill core interval for traceability [33]
- Split core using diamond saw, preserving one half for archival reference [33]
- Clean analysis surfaces using compressed air to remove dust and debris without chemical contamination
- Position core samples on stable mounting platform with consistent laser-to-sample distance (typically 1.6-7 meters) [3]
Data Acquisition Parameters
Laser and Spectrometer Settings:
- Set gate delay to 0 μs and gate width to 1000 μs (1 ms) for optimal signal collection [3]
- Configure laser for 10-60 pulses per analysis point to ensure representative sampling
- Maintain energy density at 10⁸-10¹¹ W/cm² for consistent plasma generation [4]
- Acquire 60 spectra per sample at each distance to ensure statistical significance [3]
Spatial Profiling Protocol:
- Establish measurement intervals along core length based on geological complexity (typically 2-meter intervals, reduced to 10-50 cm in mineralized zones) [33]
- Implement overlapping analysis points (50-500 μm crater diameter) to ensure complete coverage [4]
- Conduct triplicate measurements at each analysis point to assess heterogeneity
Quality Assurance and Quality Control (QA/QC)
Reference Materials and Validation:
- Insert certified reference materials (CRMs) at frequency of 1:20 samples to validate analytical accuracy [33]
- Include blank samples to monitor potential contamination throughout analysis sequence [33]
- Implement duplicate analyses every 10-15 samples to assess measurement precision [33]
- Document all QA/QC results in dedicated tracking system with acceptance criteria
Data Quality Indicators:
- Monitor plasma temperature consistency (should exceed 10,000 K) [29]
- Track signal-to-noise ratios for key elemental lines
- Verify spectral resolution across operational wavelength range
- Document environmental conditions (temperature, humidity) during analysis
Analytical Performance Specifications
Elemental Detection Capabilities and Limits
Table 1: LIBS Elemental Detection Performance for Drill Core Analysis
| Element Category | Specific Elements | Typical Detection Limits | Primary Geological Applications |
|---|---|---|---|
| Critical Battery Metals | Lithium, Cobalt, Nickel, Manganese | 0.01-0.1% (Li), 10-200 ppm (Co, Ni, Mn) [4] | Battery mineral exploration, pegmatite mapping [4] |
| Base Metals | Copper, Zinc, Lead, Aluminium | 100-500 ppm [4] | Porphyry deposits, sulfide ore characterization [4] |
| Precious Metals | Gold, Silver, Platinum Group | 50-200 ppm [4] | Precious metal vein systems, reef deposits [4] |
| Light Elements | Carbon, Boron, Beryllium, Sodium | 0.01-0.5% [4] | Carbonate identification, specialty minerals [4] |
| Rock-Forming Elements | Silicon, Magnesium, Calcium, Iron | 0.1-1% [4] | Lithological discrimination, ore characterization [4] |
Operational Performance Metrics
Table 2: LIBS Operational Parameters for Drill Core Profiling
| Performance Metric | Specification | Comparison to Traditional Methods |
|---|---|---|
| Analysis Speed | 30-60 seconds per measurement point [4] | 100-300x faster than laboratory analysis (2-4 hours preparation + 1-3 days analysis) [4] [29] |
| Elemental Coverage | Hydrogen (Z=1) through Uranium (Z=92) [4] | Superior to XRF for light elements (Li, Be, B, C) [4] |
| Precision | ±2-5% RSD for major elements, 10-20% for trace elements [4] | Comparable to laboratory techniques for major elements [4] |
| Spatial Resolution | 50-500 μm crater diameter [4] | Micro-destructive, preserves sample integrity [4] |
| Sample Throughput | 100-200 samples per day (field deployment) | 5-10x higher than laboratory submission workflows [29] |
Advanced Data Processing Framework
Spectral Data Processing Workflow
The following diagram outlines the advanced computational workflow for processing LIBS spectral data, incorporating machine learning approaches for enhanced classification:
Advanced Computational Methodologies
Deep Learning Integration:
- Implement 1D Convolutional Neural Networks (CNNs) capable of directly processing LIBS multi-distance spectra without distance correction [3]
- Apply Bidirectional Long Short-Term Memory (BiLSTM) networks to capture sequential dependencies in geochemical profiles [34]
- Utilize spectral sample weight optimization strategies that assign tailored weights based on detection distance, improving testing accuracy from 83.61% to 92.06% in validation studies [3]
Spatial Modeling Framework:
- Integrate ordinary kriging (OK) with deep learning models to enhance prediction accuracy in heterogeneous materials [34]
- Employ hybrid geostatistical-deep learning frameworks (GCNN-RNN) that combine spatial covariance structures with pattern recognition capabilities [34]
- Implement cross-validation procedures for variogram parameter selection (nugget, sill, range) to minimize prediction error [34]
The Researcher's Toolkit: Essential LIBS Solutions
Table 3: Essential Research Grade Equipment and Reagents for LIBS Drill Core Analysis
| Item | Specification | Research Function |
|---|---|---|
| Portable LIBS Analyzer | Nd:YAG laser (1064 nm), triple spectrometer (240-850 nm), CCD detector [3] | Field-deployable elemental analysis without sample preparation [4] |
| Certified Reference Materials (CRMs) | GBW series national standards, matrix-matched to geological samples [3] | Quality assurance, analytical validation, and instrument calibration [33] |
| Spectral Calibration Standards | Pure element pellets, certified geological standards | Wavelength calibration and spectral response verification [3] |
| QA/QC Materials | Blank samples, duplicate reference materials [33] | Monitoring contamination and analytical precision [33] |
| Data Processing Software | Advanced chemometrics packages with CNN/BiLSTM capabilities [3] [34] | Spectral processing, machine learning classification, and geostatistical modeling [3] [34] |
Applications in Mineral Prospecting and Ore Processing
Exploration and Resource Definition
LIBS technology enables rapid drill core profiling that significantly accelerates mineral exploration workflows. By providing immediate geochemical data during drilling operations, LIBS facilitates real-time decisions about drill hole direction and depth optimization, potentially improving operational efficiency by 15-25% [4]. The technology demonstrates particular strength in critical mineral exploration, with exceptional sensitivity to lithium (detection limits 0.01-0.1%) and rare earth elements that are challenging for traditional XRF methods [4] [29].
The capacity for high-density spatial profiling (50-500 μm resolution) enables detailed characterization of complex mineralization textures and micro-scale elemental distributions that are often homogenized in traditional bulk analysis [4]. This capability is particularly valuable for identifying narrow high-grade veins and understanding metal zoning patterns in complex ore systems [33].
Operational Ore Sorting and Processing
In active mining operations, LIBS technology enables real-time grade control through continuous elemental monitoring on conveyor systems, with measurement frequencies of 30-120 second intervals [4]. This capability supports automated routing decisions where high-grade ore proceeds to primary milling circuits while lower-grade material routes to reprocessing systems [4].
Modern LIBS-enabled sorting systems can process 100-300 tons per hour, analyzing multiple points on each rock fragment as it passes on conveyor belts at speeds up to 3 meters per second [29]. This application delivers significant operational benefits including higher mill feed grades, reduced processing costs, increased recovery rates, and lower waste volumes [29]. By rejecting waste rock before it enters processing circuits, LIBS technology minimizes tailings generation and addresses one of mining's most significant environmental challenges [29].
Analytical Performance of Portable LIBS
Portable LIBS analyzers meet the demands of field-based mineral exploration by delivering rapid, on-site elemental analysis with minimal sample preparation. Their capability to detect light elements like Lithium (Li) and Beryllium (Be), which are challenging for other field techniques like XRF, is particularly valuable for critical mineral assessment [4] [5].
Table 1: Quantitative Detection Capabilities of Portable LIBS for Critical Minerals
| Element Category | Specific Elements | Typical Detection Limits | Primary Exploration Application |
|---|---|---|---|
| Critical Battery Metals | Lithium (Li), Cobalt (Co), Nickel (Ni), Manganese (Mn) | 0.01-0.1% (Li), 10-200 ppm (Co, Ni, Mn) [4] | Battery mineral exploration, pegmatite mapping, brine analysis, recycling [4] |
| Rare Earth Elements (REEs) | Cerium (Ce) | < 100 ppm [35] | Identification of REE-bearing minerals [35] |
| Light Elements | Beryllium (Be), Boron (B), Sodium (Na) | 10 ppm (Be) [35] | Environmental monitoring, pathfinder elements, specialty minerals [4] [35] |
| Base & Precious Metals | Copper (Cu), Gold (Au), Silver (Ag), Platinum Group (Pt, Pd, Rh) | 50-200 ppm (Au, Ag, PGEs), 100-500 ppm (Cu) [4] | Precious metal mining, porphyry deposits, sulfide ores [4] |
Application Notes & Experimental Protocols
Application Note: Lithium Quantification in Granitic Drill Cores
Objective: To provide a methodology for direct, quantitative analysis of lithium in unprepared drill core samples, enabling rapid decision-making during exploration drilling campaigns [5].
Background: The Beauvoir granite case study demonstrates that reliable quantitative data for Li and Rb can be obtained directly from drill cores with minimal preparation, reducing turnaround time from weeks to minutes [5]. LIBS is uniquely suited for this application due to its sensitivity for lithium [5].
Protocol:
- Sample Selection & Preparation: Select representative drill core segments. Ensure the analysis surface is flat and smooth. No crushing or pulverizing is required [5].
- Instrument Calibration: Develop a quantification model using reference samples sourced from the same geological deposit. This step is critical to account for matrix effects [5].
- Data Acquisition: Use a handheld LIBS analyzer. Acquire spectra from multiple raster spots along the core to account for sample heterogeneity. A typical analysis might involve 20 raster spots [5].
- Spectral Analysis: Identify the lithium emission line at 670.8 nm. Use multivariate calibration models (e.g., PLS-R) to correlate spectral intensity with lithium concentration [5].
- Validation: Validate model performance by comparing LIBS predictions with laboratory results (e.g., ICP-AES). The Beauvoir study achieved a Mean Absolute Error (MAE) of 0.043 wt% for Li [5].
Application Note: Automated Mineral Identification in Complex Li-Bearing Ores
Objective: To employ LIBS imaging combined with machine learning for automated identification and mapping of lithium-bearing minerals in complex geological samples [36].
Background: Accurate mineral classification is essential for efficient Li extraction. This protocol uses LIBS to create elemental maps and an algorithm to classify minerals based on their unique spectral signatures [36].
Protocol:
- Sample Preparation: Prepare a polished rock section or a pressed powder pellet representative of the ore body [36].
- LIBS Imaging: Use a LIBS instrument to perform raster analysis across the sample surface, collecting a full spectrum at each point and creating a hyperspectral data cube [36].
- Spectral Pre-processing: Process the raw spectra through baseline removal, application of a Gaussian filter, and data normalization to enhance signal quality [36].
- Machine Learning Classification: Apply an unsupervised clustering model to group spectra with similar chemical signatures. The algorithm uses predetermined elemental lines for key minerals (e.g., Li I 670.8 nm, Al I 394.4 nm, Si I 288.1 nm) for robust identification [36].
- Result Interpretation: Generate classification maps that visually represent the spatial distribution of different minerals, such as amblygonite and quartz [36].
Application Note: Real-Time Ore Grade Control on a Conveyor Belt
Objective: To implement continuous, real-time monitoring of ore composition on a conveyor belt to enable automated grade-based sorting and process optimization [4].
Background: LIBS sensors installed above conveyor systems provide unprecedented continuous elemental analysis of moving ore streams, allowing for immediate process adjustments [4].
Protocol:
- Sensor Installation: Position the LIBS probe 0.5–2 meters above the conveyor belt. Implement protective measures, such as optical window protection and purge air mechanisms, to ensure reliable operation in dusty environments [4].
- System Integration: Feed the real-time elemental composition data directly into the mill control system [4].
- Automated Monitoring & Decisioning: Configure the system to take measurements at 30-120 second intervals. The control system uses this data to make automated routing decisions, sending high-grade ore to primary milling and lower-grade material to reprocessing circuits [4].
Workflow Visualization
Field to Decision LIBS Workflow
Automated Mineral ID with LIBS & ML
The Scientist's Toolkit: Essential Research Reagents & Materials
Table 2: Key Materials and Reagents for Field and Laboratory LIBS Analysis
| Item Name | Function / Explanation |
|---|---|
| Certified Reference Materials (CRMs) | Site-specific certified reference materials are essential for building accurate, matrix-matched calibration models, which correct for inter-element interference and improve quantitative accuracy [5]. |
| Argon Purge Gas | An on-board argon canister improves Limits of Detection (LOD) by a factor of 5x–20x by creating an inert environment for plasma formation, which enhances signal and reduces background noise [35]. |
| Handheld LIBS Analyzer | A self-contained unit (e.g., SciAps Z-903) with a laser, spectrometer, and onboard computer for field-deployed analysis. Key features include a broad spectral range (190–950 nm) for full elemental coverage, including light elements [16] [4]. |
| Polishing Equipment | Used to create flat, polished sections from rock samples for LIBS imaging and automated mineralogy, ensuring a representative surface for analysis [36]. |
| Multivariate Calibration Models | Algorithms such as Partial Least Squares Regression (PLS-R) are not reagents but are crucial "research tools." They correlate complex LIBS spectral data with known concentrations from CRMs to enable quantitative prediction of elements like Li in unknown samples [5]. |
In the competitive and environmentally conscious landscape of modern mining, the ability to make rapid, data-driven decisions at the mine face is a critical differentiator. Traditional grade control and ore sorting methods often rely on laboratory-based analysis, creating delays of days or even weeks between sample collection and the availability of results [29]. This lag forces mining personnel to make operational decisions—such as defining ore boundaries, optimizing blast patterns, and directing truck routes—based on outdated information, leading to suboptimal recovery, increased energy consumption, and higher volumes of waste sent to the processing plant. Laser-Induced Breakdown Spectroscopy (LIBS) technology is revolutionizing this process by providing real-time elemental analysis directly on-site, enabling a shift from reactive to proactive mine planning [29]. This application note details the protocols and advantages of using portable and integrated LIBS systems for grade control and ore sorting, framing them within the broader research context of portable LIBS for mineral prospecting and ore processing.
LIBS Technology and Operational Advantages
The LIBS Principle for Geological Materials
Laser-Induced Breakdown Spectroscopy (LIBS) is an atomic emission spectroscopy technique that uses a focused, high-energy laser pulse to analyze the elemental composition of a sample [37]. The laser pulse ablates a microscopic amount of material (nanograms to micrograms), creating a transient plasma with temperatures reaching 10,000-20,000 K [29]. As this plasma cools, the excited atoms and ions emit light at characteristic wavelengths. This emitted light is collected and dispersed by a spectrometer, producing a spectrum that serves as a unique elemental fingerprint for the material [37]. The technique is particularly valuable for geochemistry because it can simultaneously detect a wide range of elements, including strategic light elements like lithium, which are difficult to identify with other portable field analyzers [5].
Key Advantages for Mine-Face Operations
The implementation of LIBS for grade control and ore sorting delivers several transformative operational advantages:
- Revolutionized Assay Turnaround: LIBS compresses analytical timeframes from weeks to seconds, providing immediate feedback for decision-making [29].
- Enhanced Grade Control: Real-time data allows for precise delineation of ore boundaries, ensuring optimal feed is sent to the mill and reducing dilution from waste rock [29].
- Efficient Ore Sorting: LIBS-enabled sorters can process 100-300 tons per hour, analyzing rock fragments on a conveyor belt in real-time to separate valuable ore from waste material [29].
- Support for Sustainability Goals: By enabling early waste rejection, LIBS reduces the volume of material processed, leading to lower energy and water consumption, decreased tailings generation, and a smaller overall carbon footprint [29].
Quantitative Performance and Economic Data
The effectiveness of LIBS in quantitative analysis is demonstrated by recent field studies. The following table summarizes key performance metrics for LIBS in mining applications, comparing traditional methods with LIBS-enabled processes and highlighting quantitative results from field tests.
Table 1: Operational and Economic Comparison: Traditional Analysis vs. LIBS-Enabled Processes
| Metric | Traditional Laboratory Analysis | LIBS On-Site Analysis | Data Source / Case Study |
|---|---|---|---|
| Analysis Time | 1-3 days (ICP-MS) | Seconds to minutes | [29] |
| Throughput | Batch processing | Continuous analysis; sorters process 100-300 tons/hour | [29] |
| Detection Limits | Varies by technique | 1-100 ppm for most elements; 1-10 ppm for Li in rocks | [5] [29] |
| Quantitative Accuracy | High (lab standard) | High for prepared models; e.g., Li prediction MAE*: 0.043 wt% | Beauvoir Granite Study [5] |
| Economic Impact | Delayed decision-making leads to cost inefficiencies | Higher metal recovery, reduced processing costs, extended mine life | [29] |
MAE: Mean Absolute Error
Experimental Protocols for Mine-Face Grade Control
Protocol A: Real-Time Drill Core Analysis for Resource Definition
This protocol is designed for the rapid, on-site analysis of drill cores to accelerate resource modeling and ore body characterization without the need for sample preparation [5] [29].
1. Research Reagent Solutions & Essential Materials
Table 2: Essential Materials for Drill Core Analysis
| Item | Function |
|---|---|
| Handheld LIBS Analyzer | A portable unit with full spectral coverage (e.g., 190-950 nm) is ideal for detecting a wide range of elements, including Li. |
| Reference Samples | A set of samples from the deposit with known elemental concentrations (via laboratory analysis) for model calibration. |
| Flat, Stable Surface | A table or rig to securely hold the drill core during analysis. |
| Argon Gas Purging (Optional) | Improves signal sensitivity for certain elements by creating an inert atmosphere around the plasma. |
2. Step-by-Step Workflow:
- Sample Selection & Preparation: Select representative drill core sections. While no chemical preparation or powdering is required, ensure the analysis surface is flat, dry, and free of loose debris to ensure consistent laser coupling [5].
- Instrument Calibration: Load the instrument with a quantitative calibration model developed using the reference samples from the specific deposit. This step is crucial for accurate quantification, as it accounts for matrix effects [5].
- Data Acquisition: Firmly place the LIBS analyzer probe against the prepared surface of the drill core. The analysis is typically non-destructive, with minimal visible marking. Acquire multiple spectra (e.g., 10-50 shots) per measurement point to ensure statistical representation and average out heterogeneity.
- Real-Time Data Processing: The onboard software immediately processes the spectra, applying the calibration model to display elemental concentrations in near real-time.
- Data Integration & Decision Making: The geochemical data is integrated into geological modeling software. This enables immediate decisions regarding drill hole continuation, infill drilling strategies, and refined ore body interpretation.
Protocol B: Sensor-Based Ore Sorting on a Conveyor Belt
This protocol outlines the methodology for integrating LIBS into an industrial ore-sorting system to separate ore from waste in real-time [38] [29].
1. Research Reagent Solutions & Essential Materials
Table 3: Essential Materials for LIBS Ore Sorting
| Item | Function |
|---|---|
| Industrial LIBS Sorter | A system of LIBS sensors mounted around a conveyor belt, designed for high-speed, continuous operation. |
| Crushed Ore Feed | Mine rock crushed to a consistent, appropriate size (e.g., 2-100 mm) for sorting. |
| High-Speed Ejection System | A mechanism (e.g., pneumatic air jets) to physically divert identified waste rocks from the ore stream. |
| Central Control Computer | Runs the sorting algorithm that processes LIBS data and triggers the ejection system. |
2. Step-by-Step Workflow:
- Feed Preparation: Crush run-of-mine material to a specific size range to ensure optimal presentation to the laser and spectrometer.
- System Calibration: Calibrate the LIBS sorter using representative samples of ore and waste rock to define the elemental concentration thresholds for separation.
- High-Speed Analysis: As individual rock fragments pass the sensor station on the conveyor belt, each is analyzed by a rapid LIBS laser pulse.
- Instantaneous Classification: The acquired spectrum is instantly compared against the pre-set grade thresholds. The rock is classified as "ore" or "waste" within milliseconds.
- Physical Separation: Rocks classified as "waste" are targeted by a precision ejection system (e.g., air jets) that knocks them off the conveyor into a separate stream. The valuable ore continues to the processing plant.
The following diagram visualizes the core analytical process that powers both the field and industrial LIBS applications described in these protocols.
The Scientist's Toolkit: Key Analytical Considerations
Successful implementation of LIBS for quantitative grade control requires careful consideration of several analytical factors. Researchers and scientists must address these to ensure data quality and operational reliability.
Table 4: Key Analytical Considerations for Research and Implementation
| Consideration | Challenge | Recommended Solution |
|---|---|---|
| Matrix Effects | The geological matrix (mineral composition, texture) can influence the LIBS signal, affecting accuracy [5]. | Develop site-specific calibration models using reference materials that are chemically and physically representative of the local deposit [5]. |
| Heterogeneity | Unprepared rocks are inherently heterogeneous, leading to varying results from a single laser shot [5]. | Acquire multiple spectra (≥ 30-50 shots) from different points on a sample to obtain a representative average composition [5]. |
| Light Element Detection | Quantification of very light elements (e.g., H, Be, Li) can be challenging. | Use LIBS analyzers with spectral ranges that extend into the deep UV (e.g., below 200 nm) or near-IR for optimal detection of these elements [37]. |
| Data Processing | Translating complex spectral data into accurate concentrations requires sophisticated algorithms. | Employ machine learning techniques (e.g., PCA-SVM) and chemometrics to build robust quantitative models and classify ore types with high accuracy [39]. |
The integration of LIBS technology into grade control and ore sorting represents a paradigm shift towards real-time decision-making at the mine face. By providing immediate, quantitative elemental data, LIBS empowers mining companies to optimize resource extraction, enhance operational efficiency, and meet stringent environmental and economic targets. The protocols outlined herein provide a framework for researchers and operational scientists to deploy this powerful technology, ultimately contributing to a more sustainable and profitable future for the mining industry. As portable LIBS technology and data analytics continue to advance, their role in mineral prospecting and ore processing will only become more central and transformative.
Laser-Induced Breakdown Spectroscopy (LIBS) is an atomic emission spectrometry technique that is revolutionizing real-time elemental analysis in mineral processing plants. Its capacity for rapid, multi-elemental analysis with minimal sample preparation makes it an ideal technology for conveyor belt monitoring and product quality assurance [40]. The integration of LIBS systems directly into processing streams enables unprecedented levels of process control, allowing for immediate adjustments to maximize recovery rates, optimize grade control, and ensure consistent product quality [29].
For researchers and scientists focused on mineral prospecting and ore processing, LIBS technology represents a paradigm shift from delayed laboratory analysis to immediate, data-driven decision-making. Modern LIBS systems configured for conveyor belt monitoring can perform measurements in under one millisecond, enabling up to 1000 readings per second to keep pace with fast-moving process streams [41]. This real-time capability transforms traditional processing workflows from reactive to proactive operations, significantly enhancing both economic returns and resource efficiency.
Fundamental Mechanism
The analytical power of LIBS stems from its fundamental physical principle: the interaction of a high-focused laser pulse with a material surface to produce a plasma whose light emission characteristics are element-specific. The complete process occurs through several well-defined stages [13]:
- Laser Ablation: A high-focused laser pulse is directed onto the sample surface, ablating a nanogram to microgram quantity of material.
- Plasma Formation: The ablated material forms a transient plasma with temperatures reaching 10,000-20,000 K, exciting atoms and ions within the sample [29].
- Light Emission: As excited atoms and ions decay to their ground states, they emit light at characteristic wavelengths unique to each element.
- Spectral Analysis: Emitted light is collected and separated into its component wavelengths by a spectrometer.
- Quantification: A detector measures the intensity of specific wavelengths, allowing for both qualitative identification and quantitative determination of elemental composition [13].
LIBS System Components
A complete LIBS system engineered for industrial processing environments incorporates several robust components [29]:
- Pulsed laser source (typically Nd:YAG lasers at 1064 nm or 532 nm)
- Optical focusing and collection system
- Spectrometer (covering 200-950 nm wavelength range for comprehensive elemental coverage)
- Detector (CCD or ICCD camera)
- Ruggedized enclosure with environmental protection
- Data acquisition and analysis computer with real-processing capabilities
Table 1: Key LIBS Technological Characteristics for Processing Plant Applications
| Characteristic | Performance Specification | Significance for Processing Plants |
|---|---|---|
| Measurement Speed | 1-10 seconds per measurement point; up to 1000 readings/second for conveyor systems [29] [41] | Enables real-time process control and 100% material monitoring |
| Detection Limits | 1-100 ppm for most elements; as low as 0.1% for conveyor systems [40] [41] | Sufficient for tracking valuable elements and contaminants at economically significant levels |
| Elemental Coverage | Capable of measuring all elements in the periodic table [30] [41] | Comprehensive monitoring of valuable metals, gangue minerals, and potential contaminants |
| Spectral Range | 190-950 nm for full elemental coverage [30] | Enables detection of both light (Li, Be, B, C) and heavy elements in a single system |
Conveyor Belt Integration Systems
System Configuration and Design
Dedicated LIBS sensors such as the BeltPulse system are engineered specifically for integration over conveyor belts in processing plants [41]. These industrial-grade systems feature robust designs with adjustable sensor positions to accommodate varying working distances and belt profiles. The system's configuration ensures consistent and reliable measurements regardless of conveyor speed, with specialized optics designed to maintain focus and analytical precision even with material movement and potential vibration [41].
The mechanical integration involves mounting the LIBS sensor at strategic points in the material flow path where analytical data will have the greatest impact on process control decisions. Primary installation locations include:
- Primary crusher output for initial ore characterization
- Pre-concentration circuits for ore/waste separation decisions
- Grade control points before processing plants
- Final product conveyors for quality assurance
Operational Advantages for Mining Operations
The integration of LIBS technology into conveyor systems delivers transformative operational advantages throughout the mining value chain [29]:
Real-Time Grade Control: LIBS-enabled systems provide immediate elemental composition data, allowing operators to make rapid adjustments to downstream processes based on actual ore characteristics rather than delayed laboratory results.
Ore Sorting Optimization: Modern sensor-based ore sorting systems equipped with LIBS can process 100-300 tons per hour, with sensors analyzing multiple points on each rock fragment as it passes on a conveyor belt at speeds up to 3 meters per second [29].
Processing Efficiency: By ensuring only valuable material enters processing circuits, LIBS systems significantly improve the grade of ore delivered to processing plants, reducing energy and reagent consumption per unit of metal produced.
Waste Reduction: The ability to identify and reject waste rock at the earliest possible stage minimizes tailings generation and storage requirements, addressing one of mining's most significant environmental challenges.
Table 2: Economic Impact of LIBS Conveyor Monitoring in Mineral Processing
| Performance Metric | Traditional Processing | LIBS-Optimized Processing | Economic Impact |
|---|---|---|---|
| Assay Turnaround | 1-3 days for laboratory analysis [29] | Real-time (seconds) [29] | Compressed decision cycle from weeks to minutes |
| Mill Feed Grade | Highly variable | Consistent, optimized grade | Higher metal recovery and throughput |
| Ore Sorting Accuracy | Limited by sampling frequency | Continuous monitoring of all material | Reduced dilution and processing costs |
| Resource Utilization | Based on historical data | Dynamic optimization based on real-time data | Extended mine life through better resource use |
Quality Assurance Protocols
Implementation Framework
Implementing LIBS technology for quality assurance in mineral processing requires a structured approach to ensure analytical reliability and process integration:
System Calibration: Develop matrix-matched calibrations for specific ore types and expected elemental ranges using certified reference materials. Advanced systems offer Profile Builder software allowing operators to create and maintain their own calibrations [30].
Validation Procedures: Establish routine validation protocols using quality control samples to monitor analytical performance and detect instrument drift.
Data Integration: Implement robust data management systems that can handle the high-volume data streams from continuous LIBS monitoring and integrate them with process control systems.
Maintenance Schedule: Create preventive maintenance protocols specific to the industrial environment, including optical cleaning, verification checks, and component replacement schedules.
Application-Specific Methodologies
Real-Time Ore Grade Monitoring
Objective: Continuously monitor elemental composition of ore on conveyor belts to maintain optimal feed grade to processing plants.
Protocol:
- Install LIBS sensor at strategic location after primary crushing but before ore sorting or processing circuits.
- Configure measurement frequency to achieve representative sampling of entire material stream (typically multiple measurements per second).
- Set elemental thresholds for valuable elements and deleterious contaminants.
- Integrate LIBS data with automated diversion systems to route material based on composition.
- Implement data trending and alert systems for process deviations.
Quality Metrics: Measurement precision (RSD <5% for major elements), false acceptance/rejection rates, calibration stability.
Final Product Quality Certification
Objective: Verify final product composition meets customer specifications before shipment.
Protocol:
- Position LIBS sensor on final product conveyor loading to storage or transport.
- Program product specification limits into quality control software.
- Implement automated rejection system for non-conforming material.
- Generate certificates of analysis for each shipment based on continuous LIBS data.
- Maintain comprehensive data records for quality traceability.
Quality Metrics: Compliance with specifications, measurement accuracy against reference methods, documentation completeness.
Experimental Workflows and Signaling Pathways
The integration of LIBS analysis into mineral processing workflows creates a continuous feedback loop that optimizes operational efficiency. The following diagram illustrates the complete operational workflow from material extraction to process optimization:
Real-Time Process Optimization Workflow
This integrated workflow demonstrates how LIBS data creates a closed-loop control system that continuously optimizes processing parameters based on actual material composition rather than presumed characteristics.
The Researcher's Toolkit: Essential LIBS Solutions
Table 3: Essential Research and Implementation Tools for LIBS Processing Integration
| Tool/Solution | Function | Research Application |
|---|---|---|
| BeltPulse LIBS Sensor [41] | Conveyor-mounted LIBS analyzer for continuous monitoring | Real-time elemental analysis of bulk material flows for process control |
| NIST LIBS Database [42] | Spectral line reference database with simulation interface | Spectral line identification, method development, and interference correction |
| Profile Builder Software [30] | Custom calibration development tools | Creation of matrix-matched calibrations for specific ore types |
| Portable LIBS Validators (e.g., SciAps Z-903 [30]) | Field-portable analyzers with comprehensive elemental coverage | Method validation, spot checking, and calibration verification |
| External Quality Control Materials | Certified reference materials for validation | Ensuring analytical accuracy and monitoring long-term instrument performance |
| Data Management Systems (e.g., ExTOPE Connect [43]) | Cloud-based data storage and analysis platforms | Secure data handling, trend analysis, and remote monitoring capabilities |
Analytical Performance and Validation
Quantitative Performance Metrics
LIBS systems deployed in processing environments must demonstrate consistent analytical performance under industrial operating conditions. Key performance metrics include:
Precision and Accuracy: For major elements (>0.1%), LIBS typically delivers relative standard deviations of <5% and accuracy comparable to laboratory methods when properly calibrated [29].
Detection Limits: Practical detection limits for conveyor-based systems are approximately 0.1% for most elements, sufficient for grade control and quality assurance applications [41]. Laboratory LIBS systems can achieve 1-100 ppm detection limits for more sensitive applications [40].
Analysis Speed: Industrial LIBS systems perform measurements in under one millisecond, enabling up to 1000 readings per second for comprehensive material characterization on fast-moving conveyor belts [41].
Method Validation Procedures
Rigorous validation ensures LIBS data meets the required standards for process control decisions:
Comparative Analysis: Correlate LIBS results with reference laboratory methods (ICP-OES/ICP-MS) using statistically significant sample sets.
Precision Studies: Perform repeated measurements on homogeneous samples to determine short-term and long-term precision.
Robustness Testing: Evaluate performance under varying environmental conditions (temperature, humidity, vibration) and material characteristics (particle size, moisture content).
Limit of Detection Studies: Establish method detection limits for elements of economic and operational significance.
The integration of LIBS technology into mineral processing plants represents a significant advancement in real-time analytical capability for the mining industry. By providing immediate, multi-elemental composition data directly from conveyor systems, LIBS enables unprecedented levels of process control, quality assurance, and operational efficiency. The technology's speed, versatility, and ability to measure all elements in the periodic table make it particularly valuable for today's complex processing operations where precise grade control and quality consistency are economically critical.
For researchers and scientists working in mineral prospecting and ore processing, LIBS technology offers powerful capabilities for both exploration and process optimization. As LIBS technology continues to evolve with improvements in detection limits, data processing algorithms, and system integration, its role in mineral processing is expected to expand, further enhancing the industry's ability to efficiently and sustainably meet global mineral demand.
Overcoming Technical Challenges: Strategies for Optimizing LIBS Performance and Data Quality
Laser-Induced Breakdown Spectroscopy (LIBS) has emerged as a powerful analytical technique for mineral prospecting and ore processing, enabling rapid, in-situ elemental analysis of geological materials. However, the accuracy of quantitative LIBS analysis is significantly challenged by matrix effects, where the emission signal intensity of a target element is influenced by the physical and chemical properties of the surrounding sample matrix [44]. These effects manifest as variations in laser-sample interaction, plasma formation dynamics, and elemental emission behavior, even when the concentration of the target element remains constant [44] [45].
In geological applications, matrix effects arise from several sources. Physical matrix effects result from variations in sample properties such as thermal conductivity, heat capacity, absorption coefficient, density, and surface roughness [44]. Chemical matrix effects stem from differences in elemental composition that influence plasma characteristics, including plasma temperature and electron density [44]. Additionally, spectral interferences occur when emission lines from matrix elements overlap with those of target analytes, particularly in complex mineral assemblages [4] [44]. The heterogeneous nature of geological samples further compounds these challenges, as different host rock compositions can significantly affect measurement accuracy [4].
Quantitative Assessment of Matrix Effects
Impact on Analytical Performance
Matrix effects introduce significant challenges for quantitative LIBS analysis, particularly for light elements and trace metals critical in mineral exploration. The following table summarizes the performance characteristics of LIBS for selected elements in geological matrices:
Table 1: LIBS Performance Characteristics for Selected Elements in Geological Matrices
| Element | Detection Limit | Characteristic Wavelength | Key Matrix Challenges |
|---|---|---|---|
| Lithium | 0.01-0.1% [4] / 1-10 ppm [29] | 670.8 nm [4] | Spectral interference in complex mineral assemblages |
| Cobalt | 10-100 ppm [4] | 345.4 nm [4] | Physical matrix effects from host rock properties |
| Nickel | 50-200 ppm [4] | 352.4 nm [4] | Variation in plasma temperature affecting excitation |
| Rubidium | MAE*: 0.068 wt% [5] | Multiple lines 780-850 nm [5] | Signal instability in heterogeneous samples |
| Calcium | Varies with calibration approach [45] | Multiple lines 315-650 nm [45] | Mineral form and associated anions affecting emission |
*MAE: Mean Absolute Error
The precision of LIBS measurements typically ranges from ±2-5% relative standard deviation for major elements, decreasing to 10-20% for trace elements, with matrix effects being a primary contributor to this variability [4].
Comparative Performance of Calibration Approaches
Research has systematically evaluated different calibration strategies to mitigate matrix effects. A study on soil nutrients compared three calibration methods, demonstrating significantly different performance outcomes:
Table 2: Comparison of Calibration Approaches for LIBS Analysis of Soil Nutrients
| Calibration Method | Description | Advantages | Limitations | Performance (R²) |
|---|---|---|---|---|
| Standard Addition (Univariate) | Addition of analyte to single reference soil | Simple implementation; minimal standards | Poor transferability between fields | Variable; matrix effects not fully accounted for [45] |
| Multi-Sample (Univariate) | Calibration from multiple reference samples from one field | Better accounting of matrix effects | Requires extensive reference set from each field | Improved calibration and prediction compared to standard addition [45] |
| Multivariate (PLSR) | Partial Least Squares Regression using full spectral data | Utilizes full spectral information; handles complex correlations | Computationally intensive; requires careful model validation | Similar to multi-sample univariate for some elements [45] |
Methodologies for Site-Specific Calibration
Reference Material Selection and Preparation
Developing effective site-specific calibrations begins with appropriate reference material selection. The Beauvoir granite case study demonstrated that using reference samples sourced directly from the deposit of interest is crucial for building accurate quantification models [5]. The protocol involves:
Sample Collection: Obtain representative samples from the geological formation of interest, covering the expected concentration ranges for target elements. For drill core analysis, select samples representing different lithologies and alteration zones [5].
Surface Preparation: Ensure flat and smooth surfaces for analysis. For unprepared drill cores, select naturally flat surfaces or create minimal preparation surfaces to maintain representative matrix conditions [5].
Powder Pellet Preparation (alternative method): For heterogeneous materials, grinding and pelletization improves homogeneity. The protocol includes:
Reference Analysis: Conduct conventional laboratory analysis (e.g., ICP-OES, ICP-MS) to establish ground truth concentrations for calibration development [45] [5].
Spectral Data Acquisition Protocol
Consistent spectral acquisition is critical for developing robust calibrations. The recommended protocol includes:
Instrument Configuration:
Spectral Acquisition:
- Acquire multiple spectra (typically 200 single shots) per sample [45]
- For heterogeneous materials, implement multi-directional spectral acquisition covering different surface orientations [2]
- Rotate and translate samples during measurement to create a spiral-like trace of ablation events, improving representativeness [45]
Quality Control:
- Monitor plasma temperature and stability through reference lines
- Verify laser energy consistency throughout acquisition
- Include quality control standards at regular intervals
Diagram 1: Spectral data acquisition workflow for site-specific calibration.
Advanced Calibration Model Development
Multivariate Calibration with Machine Learning
Advanced calibration approaches leverage machine learning algorithms to model complex matrix effects. Research with portable LIBS devices has demonstrated the effectiveness of various algorithms for geological classification and quantification:
Table 3: Performance Comparison of Machine Learning Algorithms for Rock Classification
| Algorithm | Accuracy | Training Set Performance | Best Suited Applications |
|---|---|---|---|
| XGBoost | 98.57% [2] | 100% accuracy [2] | Complex classification tasks with large datasets |
| LDA | 95.71% [2] | Not specified | Dimensionality-reduced spectral data |
| KNN | 93.57% [2] | Not specified | Similar matrix types with clear clustering |
| SVM | 92.14% [2] | Not specified | High-dimensional spectral data |
The implementation protocol includes:
Spectral Pre-processing:
Feature Selection:
- Identify element-specific emission lines free from spectral interference
- Apply Principal Component Analysis (PCA) for dimensionality reduction [2]
- Select optimal spectral windows for target elements
Model Training:
- Split data into training and validation sets (typically 70-80% for training)
- Apply machine learning algorithms (XGBoost, LDA, KNN, SVM) [2]
- Optimize hyperparameters through cross-validation
- Validate with independent test set from the same geological formation
Ablation Morphology-Based Calibration
Recent research has demonstrated that laser ablation morphology correlates with matrix effects and can be used to improve quantification accuracy. A novel approach involves:
3D Ablation Morphology Reconstruction:
Morphology-Calibration Integration:
- Establish correlation between ablation volume and laser parameters (energy, wavelength, pulse duration) [44]
- Develop multivariate regression models incorporating both spectral intensity and morphological parameters [44]
- Create nonlinear calibration models that compensate for matrix-dependent ablation behavior
This approach has demonstrated significant improvement in quantification accuracy, achieving R² = 0.987 and reducing RMSE to 0.1 for trace element detection in alloy samples [44], showing promise for geological applications.
Field Implementation and Validation
Validation Protocol for Field Applications
Rigorous validation is essential before deploying site-specific calibrations in operational environments. The recommended protocol includes:
Independent Validation Set:
- Reserve 20-30% of reference samples for validation, not used in model development
- Ensure validation samples represent full concentration range and matrix diversity
Performance Metrics:
- Calculate Mean Absolute Error (MAE) - for Beauvoir granite, successful models achieved MAE of 0.043 wt% for Li and 0.068 wt% for Rb [5]
- Determine Root Mean Square Error (RMSE)
- Calculate correlation coefficients (R²) between predicted and reference values
- Assess precision through repeated measurements
Transferability Testing:
- Test calibration performance on samples from different locations within the same geological formation
- Evaluate temporal stability through repeated measurements over time
Diagram 2: Field validation protocol for site-specific calibration models.
The Scientist's Toolkit: Essential Research Reagents and Materials
Table 4: Essential Research Reagents and Materials for Site-Specific LIBS Calibration
| Item | Function | Application Notes |
|---|---|---|
| Certified Reference Materials | Calibration standards with known concentrations | Should match matrix composition of site geology; multiple concentration levels [5] |
| Binding Agents | Powder pellet preparation | Starch (19 wt% typical) [45]; cellulose; ensures pellet integrity |
| Calibration Salts | Standard addition method | High-purity CaCO₃, MgCl₂, FeS for specific element addition [45] |
| Sample Preparation Equipment | Homogeneous sample preparation | Agate ball mill for grinding; hydraulic press (40-110 MPa capacity) [44] |
| Surface Profilometer | Ablation morphology characterization | Quantifies crater dimensions for morphology-based calibration [44] |
| Portable LIBS with CCD | Spectral and morphological data acquisition | Integrated camera for ablation imaging; typical laser: Nd:YAG (1064/532/355 nm) [44] |
Developing site-specific calibrations for complex geologies requires a systematic approach that addresses the fundamental challenges of matrix effects in LIBS analysis. Through appropriate reference material selection, comprehensive spectral data acquisition, and advanced calibration modeling incorporating both spectral and morphological data, researchers can significantly improve the accuracy and reliability of field-portable LIBS for mineral prospecting and ore processing applications. The integration of machine learning algorithms, particularly XGBoost and other multivariate methods, has demonstrated notable success in handling the complex relationships between spectral signals and elemental concentrations in heterogeneous geological materials. As LIBS technology continues to evolve, these site-specific calibration approaches will play an increasingly critical role in enabling real-time, data-driven decision-making throughout the mining value chain.
Laser-Induced Breakdown Spectroscopy (LIBS) has emerged as a transformative analytical technique for mineral prospecting and ore processing research, particularly due to its compatibility with portable and field-deployable systems. The technology operates by focusing a high-powered laser pulse onto a sample surface to create a microplasma, whose characteristic emission spectra are analyzed to determine elemental composition [4]. Despite its advantages of rapid analysis, minimal sample preparation, and multi-element detection capability spanning hydrogen to uranium, LIBS faces significant precision challenges that can limit its quantitative analytical performance [47].
The core precision limitations stem from signal instability influenced by multiple factors including laser parameter fluctuations, matrix effects, and self-absorption phenomena [48]. In the context of mineral exploration, where field-portable LIBS systems are increasingly deployed for real-time ore grade assessment and boundary delineation, these precision challenges become particularly critical. The plasma generated during laser ablation is a dynamic entity subject to short-time spatiotemporal evolution during its expansion process, resulting in signal uncertainty and measurement repeatability issues [47]. Understanding and mitigating these limitations through advanced signal optimization and multi-pulse techniques forms the essential foundation for improving LIBS analytical precision in field applications for mineral prospecting.
Signal Optimization Scenarios and Techniques
Classification of Optimization Approaches
Researchers have systematically developed various experimental methods to address LIBS signal instability, which can be categorized into four primary optimization scenarios based on their operational principles. These scenarios encompass distinct approaches to enhancing plasma characteristics and spectral quality for improved analytical precision in mineralogical applications [47].
Table 1: Classification of LIBS Signal Optimization Scenarios
| Optimization Scenario | Operating Principle | Key Techniques |
|---|---|---|
| Energy Injection | Augmenting plasma energy through external sources | Multi-pulse LIBS, Discharge Assistance, Microwave Assistance, Resonance Excitation |
| Spatial Confinement | Restricting plasma expansion to enhance signal intensity | Cavity Confinement, Pit Restriction Methods |
| Experimental Environment | Modifying ambient conditions to stabilize plasma | Pressure Modification, Ambient Gas Control |
| Technology Fusion | Integrating complementary analytical approaches | Nanoparticle Enhancement, Sample Modification, Ultra-fast Lasers |
Energy Injection Techniques
Energy injection methods represent the most extensively researched category for signal optimization in LIBS systems. The multi-pulse approach, particularly dual-pulse LIBS (DP-LIBS), has demonstrated remarkable efficacy in enhancing signal intensity and stability for mineral analysis. In collinear DP-LIBS configurations, a second laser pulse is directed at the initial plasma plume, effectively re-heating the plasma and significantly extending its lifetime [47]. This secondary energy injection increases plasma temperature and electron density, resulting in up to ten-fold signal enhancement and improved measurement repeatability [48].
Discharge-assisted LIBS constitutes another prominent energy injection technique, where an external electrical discharge is synchronized with the laser pulse to supplement plasma energy. Recent advancements in this approach have demonstrated particularly effective signal stabilization for quantitative analysis of geological samples, with studies reporting substantial improvements in measurement precision for critical elements in mineral prospecting, including lithium, cobalt, and rare earth elements [47]. The discharge assistance method generates a more stable and homogeneous plasma, effectively reducing the relative standard deviation (RSD) of spectral line intensities—a crucial parameter for accurate ore grade determination in field applications.
Spatial Confinement and Environmental Optimization
Spatial confinement techniques leverage physical structures to restrict plasma expansion, thereby increasing plasma density and temperature through shock wave reflections. Conventional cavity confinement methods utilize cylindrical cavities positioned around the ablation spot, with research indicating optimal signal enhancement with aluminum cavities of 4-6mm diameter [48]. A novel adaptation particularly relevant to portable LIBS for mineral analysis involves utilizing ablation pits formed by successive laser pulses as natural confinement structures. This approach eliminates the need for external hardware, making it ideal for field-deployable systems where simplicity and robustness are paramount.
Environmental optimization techniques focus on modifying the ambient conditions surrounding the plasma to enhance signal stability. The composition of the ambient gas significantly influences plasma characteristics, with helium demonstrating particular effectiveness for detecting light elements—including lithium—in geological samples [47] [48]. The specific heat ratio, molar mass, and ionization energy of the ambient gas collectively determine plasma evolution dynamics and energy transfer processes, ultimately affecting both signal intensity and measurement repeatability in field applications.
Experimental Protocols for Signal Enhancement
Ablation Pit Optimization Protocol
The ablation pit confinement method represents a particularly promising approach for field-portable LIBS systems in mineral prospecting, as it requires no additional hardware while significantly improving signal stability. The following detailed protocol outlines the procedure for determining optimal ablation pit parameters:
Sample Preparation: Begin with representative geological samples of appropriate size for analysis (typically >80mm × 15mm × 4mm). Clean the sample surface with compressed air or ethanol to remove debris and ensure consistent laser ablation. For powdered samples, prepare pellets using a hydraulic press with consistent pressure settings [49].
Instrument Setup: Configure a standard LIBS system with a nanosecond Nd:YAG laser (1064nm wavelength), spectrometer with resolution ≤0.1nm, and digital delay generator for precise timing control. Ensure the laser beam is focused to a spot diameter of approximately 50-100μm on the sample surface [48].
Plasma Parameter Calculation: For each series of laser pulses (varying from 1 to N pulses at the same location), calculate plasma temperature using the Boltzmann plot method with multiple elemental spectral lines (e.g., Ti II, K II, Ca I, Fe I). Follow with electron density determination using the Stark broadening method [48].
Ablation Pit Characterization: After plasma analysis, measure the dimensions of resulting ablation pits using laser confocal microscopy. Determine pit area and depth with sub-micrometer precision across multiple ablation sites.
Stability Correlation: Correlate plasma characteristic parameters (temperature and electron density) with ablation pit dimensions and laser pulse counts. Identify the specific pulse count where plasma stability is maximized, typically corresponding to pit areas of 0.400-0.443mm² and depths of 0.357-0.412mm [48].
Validation: Validate the optimized parameters by comparing the relative standard deviation (RSD) of spectral line intensities for key mineralogical elements (e.g., Li, Co, Ni) before and after optimization. Successful implementation typically reduces RSD by 30-60% [48].
Figure 1: Workflow for ablation pit optimization in LIBS analysis
Dual-Pulse LIBS Configuration Protocol
Dual-pulse LIBS configurations offer significant signal enhancement for mineral analysis, particularly for trace element detection in complex geological matrices. The following protocol details the implementation of collinear dual-pulse LIBS:
Laser Configuration: Employ two Nd:YAG lasers capable of independent triggering with nanosecond precision. Configure the first laser (ablation laser) with wavelength of 1064nm and pulse energy of 30-50mJ. Set the second laser (re-heating laser) with wavelength of 532nm and pulse energy of 20-40mJ [47].
Temporal Synchronization: Utilize a digital delay generator to control inter-pulse timing between the ablation and re-heating pulses. Sweep delay times from 0.1μs to 5μs to determine the optimal inter-pulse delay for maximum signal enhancement, typically occurring at 1-2μs for geological samples [47].
Spatial Alignment: In collinear configuration, ensure both laser beams are precisely aligned to focus on the same spot on the sample surface using dichroic mirrors and focusing lenses. Verify alignment accuracy to within 10μm using beam profiling techniques.
Spectral Acquisition Optimization: Set spectrometer gate delay to 0.3-1.0μs after the second laser pulse with gate width of 5-10μs to capture the enhanced emission from the re-heated plasma while minimizing background continuum radiation [49].
Performance Validation: Quantify signal enhancement factors for target elements in certified reference materials. Compare limits of detection and RSD values between single-pulse and dual-pulse configurations, typically demonstrating 5-10× improvement for trace elements in mineral samples [47].
Calibration and Matrix Matching Protocol
Effective calibration strategies are essential for accurate quantitative analysis in mineral prospecting applications, where matrix effects significantly influence LIBS signals:
Reference Material Selection: Acquire certified reference materials (CRMs) with matrix compositions closely matching the unknown samples. For geological applications, select CRMs with similar mineralogical composition and bulk chemistry [49].
Calibration Model Development: Acquire LIBS spectra from multiple spots on each CRM (typically 30-50 spectra per CRM). Pre-process spectra using normalization techniques, such as total light normalization or internal standard normalization with a major matrix element [48].
Multivariate Analysis: Employ partial least squares (PLS) regression or principal component regression (PCR) to develop quantitative calibration models that account for matrix effects and spectral interferences. Validate models using cross-validation techniques to prevent overfitting [49].
Model Updating: Regularly update calibration models using newly acquired samples to account for instrumental drift and varying sample characteristics encountered during field deployment.
Performance Metrics and Analytical Validation
Quantitative Performance Assessment
The efficacy of signal optimization techniques must be rigorously evaluated through standardized performance metrics relevant to mineral prospecting applications. The following table summarizes typical performance improvements achievable through advanced signal optimization techniques:
Table 2: Performance Metrics for LIBS Signal Optimization Techniques in Mineral Analysis
| Optimization Technique | Signal Enhancement Factor | RSD Improvement | Detection Limit Enhancement | Applicable Elements in Mining |
|---|---|---|---|---|
| Dual-Pulse LIBS | 5-10× | 40-60% reduction | 5-8× improvement | Li, Co, Ni, Mn, Cu, Zn |
| Discharge Assistance | 3-8× | 30-50% reduction | 3-5× improvement | Precious metals (Au, Ag), Base metals |
| Spatial Confinement | 2-5× | 20-40% reduction | 2-4× improvement | Light elements (Li, B, Be), Rock-forming elements |
| Ablation Pit Optimization | 1.5-3× | 30-60% reduction | 1.5-2× improvement | Major elements (Si, Mg, Ca, Fe) |
| Ambient Gas Control | 2-4× | 25-45% reduction | 2-3× improvement | Light elements, Battery metals |
Validation of method performance should include assessment of precision (through RSD measurements of repeated analyses), accuracy (via comparison with certified reference values), and limits of detection calculated using the 3σ criterion [48]. For mineral prospecting applications, particular attention should be paid to key commodity elements, with target RSD values of <5% for major elements and <15% for trace elements constituting successful method optimization [4].
Operational Considerations for Field Deployment
When implementing signal optimization techniques in portable LIBS systems for mineral prospecting, several operational factors must be considered:
- Power Requirements: Dual-pulse systems typically require higher power capacity, impacting battery life in field-portable instruments.
- Analysis Speed: Optimization techniques may affect analysis throughput, with dual-pulse configurations potentially reducing acquisition rate but improving single-shot quality.
- Environmental Robustness: Field instruments must maintain alignment and performance under varying temperature, humidity, and vibration conditions encountered in mining environments [4].
- Data Processing: Enhanced signals often require more sophisticated data processing algorithms, necessitating balanced computational resources in portable systems.
The Researcher's Toolkit for LIBS Optimization
Successful implementation of advanced signal optimization techniques requires specific reagents, materials, and instrumentation. The following table details essential components for LIBS research in mineralogical applications:
Table 3: Essential Research Reagents and Materials for LIBS Signal Optimization
| Category | Specific Items | Function/Application | Technical Specifications |
|---|---|---|---|
| Reference Materials | Certified Soil/Geological CRMs | Calibration and validation | Matrix-matched to target samples, multiple concentration levels |
| Ore Research & Exploration Pty Ltd standards | Method development | Wide range of ore types, certified composition [49] | |
| Laser Components | Nd:YAG lasers | Plasma generation | 1064nm/532nm wavelength, 5-10ns pulse width, 10-100Hz [47] |
| Digital delay generators | Pulse synchronization | <25ps jitter, 1ns timing accuracy [48] | |
| Spectral Acquisition | Echelle spectrometers | High-resolution detection | R ≥ 6000, UV-NIR range [49] |
| ICCD/EMCCD cameras | Signal detection | Gate width ≤50ns, delay capability ≥0.3μs [49] | |
| Sample Preparation | Hydraulic presses | Pellet preparation | 10-20 ton capacity for powder compaction |
| Binding agents | Sample stabilization | Gypsum, cellulose, polyvinyl alcohol [49] | |
| Calibration Accessories | Neutral density filters | Laser energy adjustment | OD 0.1-2.0, appropriate wavelength range |
| Wavelength calibration sources | Spectrometer calibration | Hg/Ar lamps, characteristic emission lines |
Figure 2: LIBS signal optimization techniques and typical enhancement factors
The implementation of advanced signal optimization and multi-pulse techniques significantly enhances the analytical precision of LIBS systems for mineral prospecting and ore processing applications. Through methodical application of the protocols outlined in this document, researchers can achieve substantial improvements in signal stability, detection limits, and analytical precision—critical parameters for effective field deployment in mining and exploration.
The ablation pit optimization method presents particular promise for portable LIBS applications, as it provides significant signal stabilization without requiring additional hardware. Meanwhile, dual-pulse techniques offer maximum signal enhancement for trace element analysis where extreme sensitivity is required. Successful implementation of these approaches requires careful attention to experimental parameters, calibration strategies, and validation protocols tailored to specific mineralogical matrices.
As LIBS technology continues to evolve in mineral prospecting applications, further advancements in signal optimization will likely focus on artificial intelligence-driven parameter control, adaptive plasma monitoring, and integrated multi-technique approaches. These developments will further solidify LIBS as a powerful analytical technique for real-time, in-situ geochemical analysis in field settings.
Sample heterogeneity represents a fundamental and persistent obstacle in quantitative and qualitative spectroscopic analysis, particularly in the context of mineral prospecting and ore processing [50]. Chemical heterogeneity refers to the uneven spatial distribution of elemental or molecular species throughout a sample, while physical heterogeneity encompasses variations in particle size, shape, surface roughness, and packing density [50]. These forms of heterogeneity introduce significant spectral variations that can degrade calibration model performance, reducing both prediction accuracy and precision [50]. For researchers utilizing portable Laser-Induced Breakdown Spectroscopy (LIBS) in mineral exploration, this challenge is exacerbated by the naturally heterogeneous nature of geological materials and the constraints of field-based analysis.
The core of the problem lies in the disconnect between the scale of spectroscopic measurements and the spatial complexity of real-world materials [50]. In mineralogical applications, where LIBS has demonstrated growing value for detecting critical light elements like lithium [5], heterogeneity can lead to substantial inaccuracies if not properly managed. This application note outlines systematic strategies to mitigate these effects, enabling more reliable analysis of uneven materials using portable LIBS technology within mineral prospecting and ore processing research.
Theoretical Foundations: Heterogeneity Challenges in LIBS Analysis
Fundamental Principles of LIBS Technology
Laser-Induced Breakdown Spectroscopy (LIBS) operates by focusing a pulsed laser onto a sample surface to create a microplasma [51]. This plasma atomizes and excites the material, and the emitted light is spectrally analyzed to determine elemental composition [52]. The technique offers several advantages for mineral exploration, including minimal sample preparation, capability for in-situ analysis, and sensitivity to light elements that traditional X-ray fluorescence (XRF) cannot detect [51]. However, the transient nature of LIBS plasma and its dependence on sample surface properties make it particularly susceptible to heterogeneity effects.
Portable LIBS systems, such as the Thermo Scientific Niton Apollo, have made field deployment feasible, but their analytical performance depends heavily on proper sampling strategies [52]. The laser interaction volume is typically small (around 50 micrometers), meaning that a single measurement may not represent the overall composition of a heterogeneous sample [5] [50]. This limitation becomes critical during drilling campaigns for ore exploration, where rapid decisions based on unprocessed drill cores are essential for operational efficiency [5].
Manifestations of Heterogeneity in LIBS Signals
In LIBS analysis, heterogeneity manifests through multiple mechanisms that impact signal quality and analytical accuracy:
Chemical heterogeneity creates a composite spectrum resulting from the superposition of individual spectra from different mineral phases [50]. When heterogeneity occurs at scales smaller than the laser spot size, sub-sampling and averaging effects lead to inaccurate concentration estimates [50].
Physical heterogeneity introduces variations in laser-matter interaction due to differences in surface topography, hardness, and thermal properties [53]. Non-flat surfaces affect focusing conditions and plasma characteristics, while varying physical properties cause differential ablation rates and matrix effects [53] [5].
Spatial constraints in handheld LIBS analysis present additional challenges, as the requirement for a flat, smooth surface for optimal analysis often conflicts with the irregular nature of field samples [5]. Studies on heterogeneous materials like soybean grist pellets have demonstrated that the choice of sampling area is crucial for reliable analyte determination, with several hundred sampling spots sometimes required for representative quantification [53].
Table 1: Types of Sample Heterogeneity and Their Impacts on LIBS Analysis
| Heterogeneity Type | Primary Manifestations | Impact on LIBS Signals |
|---|---|---|
| Chemical Heterogeneity | Uneven distribution of elements/minerals; concentration gradients | Spectral line intensity variations; non-linear calibration curves; inaccurate quantification |
| Physical Heterogeneity | Variable surface roughness; differing particle sizes; hardness variations | Fluctuations in plasma temperature and lifetime; changing ablation rates; signal intensity instability |
| Structural Heterogeneity | Mixed mineral phases; layered structures; inclusions | Matrix effects; preferential ablation; spectral interferences |
Strategic Approaches for Managing Heterogeneity
Spatial Mapping and Representative Sampling
For heterogeneous materials, increasing the number of analysis points is essential to capture representative elemental composition. LIBS mapping approaches systematically analyze multiple positions across a sample surface, compensating for local variations through spatial averaging [53]. Research on non-flat heterogeneous samples has demonstrated that analyte line normalization on plasma background emission provides an effective strategy for improving analysis, though it may require hundreds of sampling spots for representative quantification [53].
In the Beauvoir granite case study, researchers addressed heterogeneity by analyzing unprepared drill core segments while ensuring a flat, smooth surface was presented to the handheld LIBS analyzer [5]. This approach balanced the need for representative sampling with practical field constraints. The study successfully quantified lithium and rubidium concentrations despite the inherent heterogeneity of the granite, achieving mean absolute errors of 0.043 wt% and 0.068 wt% respectively compared to laboratory reference methods [5].
Signal Processing and Data Analysis Techniques
Spectral preprocessing methods help mitigate physical heterogeneity effects by reducing unwanted variations due to scattering and surface topography:
- Multiplicative Scatter Correction (MSC) adjusts spectra using linear regression against a reference to remove baseline offsets and multiplicative scatter effects [50].
- Standard Normal Variate (SNV) processing centers and scales individual spectra to minimize multiplicative and additive effects [50].
- Derivative Spectroscopy (e.g., Savitzky-Golay derivatives) reduces broad baseline trends and emphasizes spectral features, though it may amplify high-frequency noise [50].
For quantitative analysis, chemometric modeling approaches such as Partial Least Squares (PLS) regression can accommodate heterogeneity by incorporating spectral variations into the calibration model [5]. In the Beauvoir granite study, the choice between different multivariate models (PLS vs. PCR) depended on the specific element and its distribution characteristics, highlighting the need for element-specific modeling strategies [5].
Sample Presentation and Preparation Protocols
While minimal sample preparation is a key advantage of LIBS, some controlled preparation significantly improves analytical reliability for heterogeneous materials:
- Surface preparation through grinding or polishing creates a uniform analysis surface, improving laser focus consistency and plasma characteristics [5].
- Powder homogenization involves crushing and mixing samples to redistribute heterogeneous components, though this extends acquisition time and may not be practical for all field applications [5].
- For the Niton Apollo handheld LIBS, thorough cleaning to remove "miscellaneous matter, such as plating, lubricants, paint, rust, dust, or fingerprints" is essential for accurate results [52].
Table 2: Comparison of Heterogeneity Management Strategies for Portable LIBS
| Strategy | Technical Approach | Best Suited Applications | Limitations |
|---|---|---|---|
| Spatial Mapping | Multiple analyses across sample surface; signal averaging | Drill core analysis; large heterogeneous specimens | Increased analysis time; complex data processing |
| Powder Homogenization | Crushing and mixing to create uniform powder | Laboratory preparation of field samples; powdered reference materials | Destructive; requires additional equipment and time |
| Surface Polishing | Creating uniform analysis surface | Prepared samples for quantitative analysis; calibration standards | May alter surface composition; not always field-practical |
| Chemometric Modeling | Multivariate calibration accommodating variability | Quantitative analysis of complex minerals; light element detection | Requires extensive calibration set; model transfer challenges |
Experimental Protocols for Heterogeneous Mineral Analysis
Protocol 1: LIBS Mapping of Heterogeneous Drill Cores
Purpose: To obtain representative elemental composition from geologically heterogeneous drill core samples using systematic spatial mapping.
Materials and Equipment:
- Handheld LIBS analyzer (e.g., Niton Apollo)
- Argon purge cartridges
- Flat surface preparation tools (grinder if applicable)
- Reference materials for calibration validation
- Positioning fixture for consistent sample presentation
Procedure:
- Sample Preparation: If possible, create a flat analysis surface on the drill core segment using a rock saw or grinder. Remove surface contaminants and ensure dryness.
- Instrument Setup: Perform daily setup procedures including wave check and sensitivity check using provided standards [52]. Install fresh argon cartridge if needed.
- Grid Definition: Mark or mentally divide the analysis surface into a systematic grid pattern with sufficient points to capture heterogeneity (typically 20-100 points depending on heterogeneity scale).
- Data Acquisition: At each grid point:
- Ensure proper contact between analyzer and sample surface
- Acquire LIBS spectrum using standardized analysis time (typically 10-30 seconds per point)
- Record spatial coordinates for each measurement
- Data Processing:
- Calculate mean and standard deviation for elements of interest
- Identify and investigate statistical outliers
- Generate elemental distribution maps if spatial patterns are of interest
Validation: Compare averaged LIBS results with laboratory analysis of representative subsamples. For the Beauvoir granite, this approach achieved prediction errors of 0.043 wt% for Li and 0.068 wt% for Rb compared to reference methods [5].
Protocol 2: Quantitative Light Element Analysis in Complex Minerals
Purpose: To develop accurate quantification methods for strategically important light elements (e.g., Li) in heterogeneous mineral samples.
Materials and Equipment:
- Handheld LIBS analyzer with broadband spectrometer (190-950 nm)
- Matrix-matched reference materials
- Sample preparation tools for creating uniform surfaces
- Safety equipment including laser safety glasses (OD 5+ @ 1064nm)
Procedure:
- Calibration Set Development:
- Select reference samples covering expected concentration ranges and mineralogical variations
- Ensure references represent the chemical and physical heterogeneity of target samples
- Analyze references using both LIBS and reference laboratory methods
- Spectral Acquisition:
- For each reference and unknown sample, acquire multiple spectra from different surface locations
- Maintain consistent analysis conditions (laser energy, argon flow, detector settings)
- Use averaging of multiple laser pulses (typically 3-10) per analysis point
- Model Development:
- Select analytical lines free from spectral interferences for target elements
- Apply appropriate spectral preprocessing (SNV, derivatives, or MSC)
- Develop multivariate calibration models (PLS or PCR) using reference spectra and known concentrations
- Validation:
- Use independent validation set to assess model performance
- Calculate figures of merit (RMSEP, R², bias)
- Verify model robustness through repeated measurements
Technical Notes: The Beauvoir granite case study demonstrated that different elements may require different modeling approaches; lithium quantification achieved better performance with PLS, while rubidium showed comparable results with both PLS and PCR models [5].
Essential Research Tools and Reagents
Table 3: Essential Research Toolkit for Portable LIBS Analysis of Heterogeneous Materials
| Tool/Reagent Category | Specific Examples | Function in Heterogeneity Management |
|---|---|---|
| Portable LIBS Analyzer | Niton Apollo Handheld LIBS | Field-deployable elemental analysis; detection of light elements (Li, C) not possible with XRF [52] |
| Calibration Standards | Matrix-matched reference materials; certified geological standards | Instrument calibration; quantification model development; accounting for matrix effects [5] |
| Sample Preparation Tools | Portable grinders; surface polishing equipment; cleaning supplies | Creating uniform analysis surfaces; removing contamination that affects LIBS signals [52] |
| Argon Purge System | Disposable argon cartridges | Improving signal-to-noise ratio; enhancing sensitivity for light elements [52] |
| Spatial Mapping Accessories | Sample positioning fixtures; measurement grids | Ensuring systematic coverage of heterogeneous samples; enabling representative sampling [53] |
Implementation Workflow
The following workflow diagram illustrates the comprehensive approach to managing sample heterogeneity in portable LIBS analysis:
Managing sample heterogeneity remains a fundamental challenge in portable LIBS analysis for mineral prospecting, but systematic approaches can yield reliable, representative results. The integration of spatial mapping strategies, appropriate sample presentation, and advanced chemometric modeling enables researchers to overcome the limitations posed by heterogeneous materials. The successful application of these methods in real-world scenarios, such as the Beauvoir granite case study, demonstrates their practical value for rapid, in-situ analysis during exploration campaigns [5].
Future developments in handheld LIBS technology will likely focus on improved spatial resolution, enhanced light element detection, and more sophisticated onboard data processing capabilities. The integration of artificial intelligence and machine learning for real-time spectral interpretation and adaptive sampling represents a promising direction for next-generation systems [26]. As these technological advances mature, portable LIBS will become an increasingly powerful tool for mineral exploration, providing geoscientists with immediate chemical data to guide strategic decision-making in the field while effectively managing the inherent heterogeneity of geological materials.
Laser-Induced Breakdown Spectroscopy (LIBS) has emerged as a powerful analytical technique for elemental analysis in mineral prospecting and ore processing. While the fundamental LIBS technology generates rich spectral data, the critical challenge lies in accurately interpreting this complex information, particularly for portable field applications. The core advancement transforming LIBS from a qualitative tool to a quantitative analytical method lies in sophisticated data processing protocols leveraging machine learning (ML) and chemometrics. These computational approaches systematically address the inherent limitations of LIBS technology, including matrix effects, spectral interference, and signal variability, thereby enabling reliable quantification essential for mineral exploration and ore grade control.
The integration of machine learning has fundamentally reshaped LIBS data analysis by developing models that learn directly from spectral data to establish robust relationships between emission line characteristics and elemental concentrations. Concurrently, chemometric techniques provide the mathematical framework for extracting meaningful information from complex spectral datasets. For researchers and development professionals in mineral sciences, these advancements offer unprecedented capabilities for real-time, on-site decision-making during prospecting campaigns and processing operations, significantly reducing reliance on centralized laboratory analysis.
Machine Learning Frameworks for LIBS Quantification
Dominant Factor-Driven Machine Learning (DF-ML)
A groundbreaking methodological advancement in LIBS quantification is the Dominant Factor-Driven Machine Learning (DF-ML) framework, specifically designed to enhance metrological performance in complex mineral matrices. This approach systematically reduces measurement uncertainty through optimized signal processing and feature selection, addressing the fundamental challenge of signal variability in LIBS analysis [54]. The DF-ML framework integrates physics-based domain knowledge with data-driven algorithms, creating hybrid models that significantly improve accuracy, generalization, and interpretability compared to conventional techniques.
The implementation of DF-ML has demonstrated remarkable performance in iron ore analysis, a complex matrix critical to metallurgical efficiency. In practical validation, this framework achieved exceptional precision for total iron (TFe) content quantification, with a coefficient of determination (R²) reaching 0.9974, coupled with minimal error margins (root mean square error/RMSE of 0.3324%, and mean absolute error/MAE of 0.2523%) [54]. This performance represents a substantial improvement over traditional LIBS quantification methods, establishing a new standard for precision in industrial mineral applications.
Deep Convolutional Neural Networks for Distance-Invariant Analysis
In field applications, variation in detection distance poses a significant challenge for LIBS quantification, as changing distances alter laser spot characteristics, plasma formation dynamics, and spectral collection efficiency. Deep Convolutional Neural Networks (CNN) have been developed to directly process multi-distance LIBS spectra without requiring distance-specific corrections [3]. This approach maintains classification accuracy even when detection distances vary naturally, as occurs in practical field settings.
Recent innovations incorporating spectral sample weight optimization have further enhanced CNN performance for geological sample classification. By assigning tailored weights to training samples based on their corresponding detection distances, this strategy achieves a testing accuracy of 92.06% on eight-distance LIBS datasets—an improvement of 8.45 percentage points over conventional equal-weight training approaches [3]. Supplementary metrics including precision, recall, and F1-score demonstrated increases of 6.4, 7.0, and 8.2 percentage points respectively, confirming the robustness of this approach for field-deployable LIBS systems in mineral prospecting [3].
Table 1: Performance Comparison of Machine Learning Approaches for LIBS Quantification
| Machine Learning Method | Application Context | Key Performance Metrics | Advantages |
|---|---|---|---|
| Dominant Factor-Driven ML (DF-ML) | Quantitative iron content measurement in complex iron mineral matrices | R²: 0.9974, RMSE: 0.3324%, MAE: 0.2523% [54] | Integrates domain knowledge with data-driven algorithms; reduces measurement uncertainty |
| Deep CNN with Weight Optimization | Multi-distance geological sample classification | Testing accuracy: 92.06%; 8.45% improvement over baseline [3] | Distance-invariant analysis; requires no distance correction |
| Partial Least Squares Regression (PLSR) | On-stream mineral identification in tailings slurry | Determination coefficients: 70.0% (quartz) to 82.6% (Fe-oxides) [54] | Handles collinear spectral variables; effective for quantitative analysis |
| Kernel Extreme Learning Machine (KELM) | Hybrid modeling within DF-ML framework | Enhanced accuracy and generalization capability [54] | Fast learning speed; good generalization performance |
Hybrid Modeling Approaches
The integration of multiple machine learning techniques within unified frameworks represents a significant trend in advanced LIBS data processing. Research demonstrates that hybrid models combining Partial Least Squares Regression (PLSR) with Kernel Extreme Learning Machine (KELM) can leverage the strengths of both algorithms [54]. PLSR effectively handles the high dimensionality and collinearity inherent in LIBS spectra, while KELM provides superior nonlinear modeling capabilities and faster learning speeds. This synergistic approach delivers enhanced accuracy and generalization capability, particularly beneficial for the complex, heterogeneous samples encountered in mineral prospecting.
Chemometric Techniques for Spectral Analysis
Spectral Preprocessing Protocols
Effective quantification begins with comprehensive spectral preprocessing to enhance signal quality and reduce noise. Standard protocols must include dark background subtraction, wavelength calibration, ineffective pixel masking, spectrometer channel splicing, and background baseline removal [3]. For quantitative analysis of geological materials, additional preprocessing steps such as baseline correction, noise reduction through spectral averaging, peak identification, sum normalization, and spectral line matching are essential for optimal model performance [54].
Signal stability remains a critical concern in field-deployable LIBS systems. Research demonstrates that averaging 20 individual spectra reduces relative standard deviation (RSD) from approximately 16% to just 2%, significantly improving quantification reliability [55]. This approach is particularly valuable for light element detection (lithium, boron, beryllium) where traditional X-ray fluorescence methods exhibit poor sensitivity [4].
Feature Selection and Optimization
The optimal selection of spectral features constitutes a crucial step in developing robust quantification models. For complex mineral matrices like the Beauvoir granite, identifying spectral intervals devoid of interference from matrix elements is essential [5]. Research indicates that careful selection of characteristic emission lines—such as the Li I line at 670.8 nm and Rb I lines at 780.0 nm and 794.8 nm—followed by integration of peak areas within specific wavelength windows (e.g., 669.80–671.80 nm for Li) significantly enhances quantification accuracy for critical elements [5].
Table 2: Detection Performance for Critical Elements in Mineral Prospecting
| Element | Characteristic Wavelength | Detection Limit | Quantification Performance | Application Context |
|---|---|---|---|---|
| Lithium (Li) | 670.8 nm [4] [5] | 0.01-0.1% [4] | MAE: 0.043 wt% on unprepared drill cores [5] | Pegmatite exploration, brine analysis, battery mineral prospecting |
| Rubidium (Rb) | 780.0 nm, 794.8 nm [5] | Not specified | MAE: 0.068 wt% on unprepared drill cores [5] | Granite deposit characterization |
| Calcium (Ca) | Multiple lines in visible spectrum | 11.58 mg/L (liquid analysis) [55] | Recovery rates: 90.83-101.74% [55] | Water hardness testing, environmental monitoring |
| Magnesium (Mg) | Multiple lines in visible spectrum | 2.57 mg/L (liquid analysis) [55] | Recovery rates: 93.43-108.74% [55] | Water hardness testing, environmental monitoring |
| Iron (Fe) | Multiple lines across spectrum | 100-500 ppm [4] | R²: 0.9974 with DF-ML framework [54] | Iron ore beneficiation and purification processes |
Experimental Protocols for Method Validation
Protocol 1: Quantitative Model Development for Lithium and Rubidium
Application Context: This protocol details the methodology for developing quantitative models for critical elements (Li, Rb) in granite samples using handheld LIBS, specifically validated on the Beauvoir granite case study [5].
Materials and Equipment:
- Handheld LIBS analyzer (covering 190–950 nm spectral range)
- Certified reference materials from the target deposit
- Unprepared drill core samples (typical dimensions: 400×5×3 cm)
- Flat, smooth surface preparation tools
- Computer with multivariate analysis software
Procedure:
- Sample Preparation: Select reference samples representing the chemical variability of the deposit. Ensure surfaces are flat and smooth without extensive preparation.
- Spectral Acquisition: Acquire LIBS spectra from multiple points on each reference sample. Use the following typical parameters:
- 20 spectra per analysis point
- Laser energy: Optimized for specific instrument
- Spectral range: Full spectrum (190–950 nm)
- Spectral Preprocessing:
- Apply dark background subtraction
- Conduct wavelength calibration
- Perform intensity normalization
- Remove background baseline
- Feature Selection:
- Identify characteristic emission lines (Li I at 670.8 nm; Rb I at 780.0/794.8 nm)
- Define integration windows around principal peaks (e.g., 669.80–671.80 nm for Li)
- Verify absence of spectral interferences from matrix elements
- Model Development:
- Compile dataset with reference concentrations and spectral features
- Apply Partial Least Squares Regression (PLSR)
- Implement cross-validation (e.g., leave-one-out or k-fold)
- Validate with independent test set
- Performance Evaluation:
- Calculate Mean Absolute Error (MAE)
- Determine coefficient of determination (R²)
- Assess recovery rates for validation samples
Validation Metrics: Successful implementation yields MAE of 0.043 wt% for Li and 0.068 wt% for Rb on unprepared drill cores, with prediction consistency demonstrated through repeated measurements [5].
Protocol 2: Multi-Distance Classification for Geological Samples
Application Context: This protocol enables accurate classification of geological samples across varying detection distances, essential for field applications where distance control is challenging [3].
Materials and Equipment:
- LIBS instrument with adjustable distance capability
- Certified geological reference materials (GBW series)
- Sample preparation equipment for pellet formation
- Computer with deep learning framework (e.g., TensorFlow, PyTorch)
Procedure:
- Sample Preparation:
- Process powdered reference materials into tablets using standardized compression molding
- Ensure surface homogeneity and consistency
- Multi-Distance Spectral Acquisition:
- Acquire spectra at multiple distances (e.g., 2.0m, 2.3m, 2.5m, 3.0m, 3.5m, 4.0m, 4.5m, 5.0m)
- Collect 60 spectra per sample at each distance
- Maintain consistent laboratory conditions (atmosphere, gate delay, gate width)
- Spectral Preprocessing:
- Apply dark background subtraction
- Conduct wavelength calibration
- Perform ineffective pixel masking
- Execute spectrometer channel splicing
- Remove background baseline
- Dataset Construction:
- Combine spectra from all distances into a unified dataset
- Assign sample weights based on detection distance
- Partition data into training, validation, and test sets
- CNN Model Implementation:
- Design network architecture with convolutional layers
- Implement spectral sample weight optimization strategy
- Train model using weighted samples
- Validate with independent test set across all distances
- Performance Evaluation:
- Calculate overall classification accuracy
- Determine precision, recall, and F1-score for each class
- Compare performance with equal-weight training approach
Validation Metrics: Successful implementation yields maximum testing accuracy of 92.06% on eight-distance LIBS dataset, representing an 8.45 percentage point improvement over conventional approaches [3].
Visualization of Advanced LIBS Data Processing Workflows
Diagram 1: Comprehensive Workflow for LIBS Data Processing and Quantification
The Scientist's Toolkit: Essential Research Reagents and Materials
Table 3: Essential Research Materials for Advanced LIBS Quantification Studies
| Item | Specification/Requirements | Function/Application |
|---|---|---|
| Certified Reference Materials | GBW series (Chinese national standards) or equivalent international standards [3] | Method calibration, model development, and validation; ensures traceability and accuracy |
| Handheld LIBS Analyzer | Spectral range: 190–950 nm; integrated multivariate analysis capabilities [5] | Field-deployment for on-site analysis; enables rapid decision-making during prospecting |
| Laboratory LIBS System | Nd:YAG laser (1064 nm), triple spectrometer (240-340 nm, 340-540 nm, 540-850 nm) [3] | Controlled experiments, method development, and reference analysis |
| Sample Preparation Equipment | Compression molding apparatus for pellet formation [3] | Homogeneous sample presentation; improves analytical precision and reproducibility |
| Multivariate Analysis Software | PLS, PCR, machine learning algorithms implementation capability [54] [5] | Development of quantification models; spectral data processing and interpretation |
| Deep Learning Framework | TensorFlow, PyTorch, or similar with CNN implementation capability [3] | Advanced pattern recognition; distance-invariant classification models |
| Portable Computer | High-processing capability for real-time data analysis [5] | On-site data processing and immediate interpretation during field campaigns |
The integration of advanced machine learning frameworks and chemometric techniques has fundamentally transformed LIBS from a primarily qualitative technique to a robust quantitative analytical method for mineral prospecting and ore processing. The development of specialized approaches such as Dominant Factor-Driven Machine Learning and distance-invariant Deep Convolutional Neural Networks addresses the core challenges of matrix effects and signal variability that have historically limited LIBS quantification accuracy. These data processing advancements, coupled with standardized experimental protocols and comprehensive validation methodologies, enable researchers and development professionals to reliably deploy portable LIBS systems for critical decision-making in field settings. As these computational approaches continue to evolve, they will further enhance the precision, reliability, and application scope of LIBS technology throughout the mineral resource value chain, from initial prospecting through processing optimization and final product verification.
Sample Presentation and Preparation Protocols
The reliability of portable Laser-Induced Breakdown Spectroscopy (LIBS) analysis is highly dependent on sample presentation. Inconsistent preparation introduces significant variability in spectral data due to matrix effects and physical heterogeneity [4] [36].
Solid Rock and Drill Core Samples
Surface Preparation: The primary goal is to create a fresh, flat, and representative surface.
- Field Protocol: For drill core and rock samples, use a diamond-edged rock saw or a coarse abrasive grinding wheel to create a fresh surface, minimizing the influence of weathering rinds [4].
- Laboratory Protocol: For higher precision analysis, follow with sequential polishing using progressively finer abrasives (e.g., 120, 400, and 600 grit) to create a uniform, flat surface, which enhances plasma stability and signal reproducibility [2].
- Cleaning: After preparation, clean the surface with compressed air or an acetone-rinsed cloth to remove residual polishing material and debris [4].
Spatial Averaging: To account for mineralogical heterogeneity at the micro-scale, perform multi-directional or raster-based spectral acquisition.
- Method: Collect a minimum of 10-30 laser pulses from random, non-overlapping spots on the sample surface [4] [2].
- Justification: This approach averages out the inherent variability in coarse-grained materials, providing a spectral signature more representative of the bulk composition [36].
Particulate and Powdered Samples
For soils, crushed ores, and powdered samples, preparation focuses on achieving consistency in particle size and packing density.
- Particle Size Reduction: Crush and pulverize samples to a consistent particle size, ideally below 100 µm, using a jaw crusher and ring mill [4].
- Pelletization: Press approximately 5-10 grams of the homogenized powder into a firm pellet using a hydraulic press at 10-20 tons for 1-2 minutes. This creates a solid, flat surface analogous to a rock sample and improves packing density for more stable plasma formation [36].
Liquid Sample Handling
While less common in mineral prospecting, LIBS can analyze liquid samples like brines.
- Jet Stream Method: A specialized setup introduces the liquid as a stable, free-falling jet stream. Optimized parameters include a jet diameter of 0.64 mm with the laser ablation point positioned 5 mm from the jet outlet for stable signal acquisition [55].
- Signal Stability: To reduce the relative standard deviation (RSD) from ~16% to 2%, average a minimum of 20 individual spectra from the liquid stream [55].
Table 1: Sample Preparation Summary for Different Sample Types
| Sample Type | Primary Preparation Method | Key Parameter | Objective |
|---|---|---|---|
| Rock/Drill Core | Sawing & Polishing | Creation of a fresh, flat surface | Minimize surface topography effects |
| Particulate/Powder | Pressing into Pellets | Consistent particle size & packing density | Ensure homogeneous analysis volume |
| Liquid/Brine | Stable Jet Stream | Controlled diameter (e.g., 0.64 mm) & ablation point | Enable stable plasma in aqueous matrix |
Environmental Control and Field Deployment Considerations
Field deployment of portable LIBS subjects the instrument to conditions that can degrade analytical performance. Proactive environmental control is essential for data quality.
Mitigating Atmospheric and Physical Interference
Ambient Light and Dust:
- Direct Sunlight: Operate the analyzer in shaded areas or use a simple dark shroud to cover the measurement spot. Ambient light can interfere with the detection of the faint plasma emission [4].
- Dust and Moisture: Dust particles in the air can scatter the laser beam and attenuate the emitted light. Instruments with an IP54 rating or higher provide protection against dust and water splashes. For conveyor belt monitoring, systems employ purge air mechanisms to keep optical windows clean [4] [43].
Vibration and Stability:
- Isolation: Ensure the instrument is placed on a stable surface during measurement. While handheld analyzers are built to military standards (MIL-STD-810G) for ruggedness, minimizing movement during the laser pulse improves data quality [4] [43].
- Instrument Design: Downhole LIBS tools are specifically engineered with robust mechanical designs to maintain laser alignment despite drilling vibrations [4].
Instrument Calibration and Matrix Effects
Matrix Effects: The chemical and physical makeup of the sample (the "matrix") significantly influences plasma temperature and emission intensity, which can skew quantitative results. This is a primary challenge for LIBS analysis [4] [15].
Calibration Strategies:
- Site-Specific Calibration: Develop calibrations using Certified Reference Materials (CRMs) that are matrix-matched to the local geology. For example, use CRMs from lithium pegmatites when analyzing spodumene-bearing rocks [4] [36].
- Advanced Data Processing: Employ multivariate calibration and machine learning models that are trained on a wide variety of sample types from the target area. These algorithms can learn to correct for matrix-induced spectral interferences [36] [2].
Diagram: The workflow from sample to result, highlighting critical control points for environmental factors and data processing.
Quality Assurance and Quality Control (QA/QC) Procedures
A rigorous QA/QC protocol is non-negotiable for generating reliable and defensible data in mineral exploration.
Routine Instrument Performance Verification
Daily Checks:
- System Suitability Test: Analyze a known control sample (e.g., a stainless steel or a pure silicon standard) at the start of each session. Record the intensity and signal-to-noise ratio of key elemental lines (e.g., Si I at 288.16 nm) to monitor instrument drift and laser performance [24].
- Pre-burn Cycle: Utilize the instrument's pre-burn function (typically 1-3 laser pulses) on a new analysis spot to remove surface contaminants and weathering layers, ensuring analysis of fresh, representative material [43].
In-Field QA/QC for Analytical Batches
Incorporate quality control samples directly into the analytical sequence during field mapping or drill core logging.
- Frequency: Insert a blank and a certified reference material (CRM) after every 10-20 unknown samples [4].
- Action Limits: Establish acceptable recovery limits for key elements in the CRM (e.g., 90-110%). If results fall outside these limits, investigate potential instrument issues or recalibrate [55].
Table 2: Quality Control Samples and Their Functions
| QC Sample Type | Composition | Frequency | Target & Purpose |
|---|---|---|---|
| Certified Reference Material (CRM) | Matrix-matched to local geology | Every 10-20 samples | Monitor analytical accuracy and long-term precision |
| Blank | Silica sand or pressed powder of known low composition | Every 10-20 samples | Detect contamination or instrument memory (carry-over) |
| Duplicate Sample | Split of a prepared unknown | 5-10% of samples | Quantify sampling and analytical precision (variance) |
Experimental Protocols for Specific Applications
Protocol 1: Automated Mineral Identification via LIBS Imaging
This protocol leverages LIBS mapping and machine learning for accurate mineral identification, particularly for lithium-bearing minerals [36].
Workflow:
- Sample Preparation: Prepare a polished rock section or epoxy-mounted pellet.
- LIBS Mapping: Mount the sample on the LIBS imaging stage. Define a grid over the area of interest. At each grid point, fire a single laser pulse and collect the full spectrum. Typical parameters: laser energy ~50 mJ/pulse, spot size ~50 µm, step size ~50-100 µm [36].
- Spectral Pre-processing:
- Baseline Removal: Subtract the background signal from the spectrum.
- Filtering: Apply a Savitzky-Golay filter to reduce high-frequency noise.
- Normalization: Normalize spectra to a strong, consistent emission line (e.g., Si I at 288.16 nm) to minimize pulse-to-laser energy fluctuation effects [36].
- Machine Learning Classification:
- Feature Reduction: Use Principal Component Analysis (PCA) to reduce the dimensionality of the spectral data.
- Model Training: Train a classification algorithm (e.g., XGBoost, which achieved 98.57% test accuracy [2]) using labeled spectra from known minerals.
- Classification: Apply the trained model to classify every spectrum in the map, generating a false-color mineral map.
Diagram: Workflow for automated mineral identification using LIBS imaging and machine learning.
Protocol 2: Lithium Quantification in Geological Samples
This protocol outlines a methodology for quantifying lithium in rocks and brines, critical for battery mineral exploration.
Workflow:
- Calibration Set Development: Assemble a suite of CRMs and well-characterized samples spanning the expected concentration range of lithium (e.g., from ppm to percent levels) [4] [36].
- LIBS Analysis: Analyze each calibration sample following the sample presentation best practices (e.g., as polished pellets). Acquire multiple spectra (n=30) per sample.
- Model Building:
- Peak Selection: Identify the characteristic lithium emission line at 670.8 nm [4] [36].
- Multivariate Regression: Use a chemometric model (e.g., Partial Least Squares Regression - PLSR) to build a quantitative relationship between the intensity of the Li line (and other relevant spectral features) and the known concentration, accounting for matrix effects.
- Validation: Validate the model using a separate set of validation samples not used in the calibration. Report the Root Mean Square Error of Prediction (RMSEP) and R² values.
- Unknown Analysis: Apply the validated model to predict lithium concentration in unknown samples.
Table 3: Key Parameters for Lithium Detection via Portable LIBS
| Parameter | Specification | Application Note |
|---|---|---|
| Characteristic Wavelength | 670.8 nm | Primary atomic emission line for quantification [4] |
| Typical Detection Limit | 0.01 - 0.1% (100 - 1000 ppm) | Varies based on host matrix and instrument [4] |
| Key Spectral Interferences | Molecular bands (e.g., CN, C₂) | Requires high-resolution spectrometers or chemometric correction |
| Optimal Sample Form | Polished rock section or pressed powder pellet | Minimizes heterogeneity and surface effects |
The Scientist's Toolkit: Essential Research Reagents & Materials
Table 4: Essential Materials and Equipment for Field and Laboratory LIBS Analysis
| Item | Function | Specification/Example |
|---|---|---|
| Certified Reference Materials (CRMs) | Calibration and accuracy verification | Must be matrix-matched to local geology (e.g., OREAS, NIST series) |
| Diamond Saw / Abrasive Grinder | Sample surface preparation | Creates a fresh, flat analysis surface on rock and core samples |
| Hydraulic Pellet Press | Homogeneous sample presentation | Prepures consistent powder pellets for crushed soils and ores |
| Portable LIBS Analyzer | Elemental analysis | Handheld device (e.g., weighing 2.9-6.4 lbs) with IP54 rating for field use [24] [43] |
| Compressed Air Duster | Sample cleaning | Removes debris and dust from the sample surface pre-analysis |
| Machine Learning Software | Data processing & classification | Platforms capable of running PCA, PLSR, and XGBoost algorithms |
Performance Validation and Technology Comparison: LIBS vs. Traditional Analytical Methods
Within the research scope of portable Laser-Induced Breakdown Spectroscopy (LIBS) for mineral prospecting and ore processing, a rigorous assessment of analytical capabilities is fundamental. This document provides a detailed benchmark of the detection limits, precision, and accuracy of modern portable LIBS systems. The quantitative data, experimental protocols, and methodological workflows presented herein are designed to equip researchers and scientists with the necessary information to validate and implement LIBS technology for real-time, in-situ geochemical analysis.
Performance Benchmarking: Quantitative Capabilities of Portable LIBS
The analytical performance of portable LIBS systems is demonstrated through their detection limits for key elements, precision in measurement, and accuracy in classification tasks across various geological applications.
Elemental Detection Limits
Portable LIBS excels at providing rapid, multi-elemental analysis, with particular strength in detecting light elements that are challenging for other field-portable techniques like X-ray fluorescence (XRF). The following table summarizes typical detection limits for geochemically relevant elements [4].
Table 1: Typical Detection Limits for Elements in Geological Samples using Portable LIBS
| Element Category | Specific Elements | Typical Detection Limit | Primary Mining Application |
|---|---|---|---|
| Critical Battery Metals | Lithium (Li) | 0.01 - 0.1% | Battery mineral exploration, recycling |
| Cobalt (Co), Nickel (Ni) | 10 - 200 ppm | Battery mineral exploration, recycling | |
| Base Metals | Copper (Cu), Zinc (Zn), Lead (Pb) | 100 - 500 ppm | Porphyry deposits, sulfide ores |
| Precious Metals | Gold (Au), Silver (Ag), Platinum Group | 50 - 200 ppm | Precious metal mining, processing |
| Light Elements | Boron (B), Beryllium (Be), Sodium (Na) | 0.01 - 0.5% | Advanced materials, specialty minerals |
| Rock-Forming Elements | Silicon (Si), Magnesium (Mg), Calcium (Ca), Iron (Fe) | 0.1 - 1% | Geological mapping, ore characterisation |
Precision and Accuracy in Classification and Quantification
The integration of machine learning (ML) with portable LIBS has significantly enhanced the precision and accuracy of geological sample identification and analysis.
Table 2: Precision and Accuracy Metrics for LIBS in Geological Applications
| Application | Methodology | Reported Performance | Reference |
|---|---|---|---|
| Rock Type Classification | Portable LIBS with XGBoost ML algorithm | 98.57% accuracy for classifying 7 common rock types (e.g., mudstone, basalt, dolomite) | [2] |
| Mineral Identification | Fused LIBS-Raman spectroscopy with ML (K-ELM algorithm) | 98.4% classification accuracy for six mineral types | [7] |
| Signal Stability Enhancement | LIBS with plasma acoustic correction via quartz tuning fork | Improved RSD from ~16% to 2%; R² of 0.997 for Fe calibration model in steel | [56] |
| Mineral Abundance Mapping | LIBS hyperspectral imaging with k-means clustering | Good agreement with TIMA-EDX for volumetric proportion of major minerals | [57] |
| Aqueous Analysis | Portable LIBS with liquid jet for water hardness | Recovery rates: 90.8-101.7% for Ca, 93.4-108.7% for Mg | [55] |
Experimental Protocols for Key Applications
Protocol: Signal Stabilization Using Plasma Acoustic Correction
Objective: To enhance the stability and prediction accuracy of LIBS spectral signals by using a quartz tuning fork for plasma acoustic signal correction [56].
Materials:
- Pulsed Nd:YAG laser (e.g., 1064 nm, 100 mJ max energy)
- Spectrometers with CCD detectors
- Quartz tuning fork (commercially available, 32.768 kHz)
- Data acquisition system (Oscilloscope)
- Standard reference materials (e.g., standard steel samples)
Procedure:
- Setup: Configure a synchronous acquisition system for plasma spectral and acoustic signals. Position the quartz tuning fork approximately 3 cm from the plasma generation point at a 45-degree angle.
- Data Acquisition: For each laser pulse, simultaneously collect the plasma emission spectrum and the acoustic signal from the tuning fork.
- Signal Processing: Extract the peak value of the acquired acoustic signal for each laser pulse.
- Spectral Correction: Normalize the intensity of the spectral line of the target element (e.g., Iron) by dividing it by the corresponding acoustic peak value for each measurement.
- Model Building: Use the corrected spectral data to build a univariate calibration model (e.g., for element concentration) using methods like Partial Least Squares Regression (PLSR).
Protocol: In-Situ Rock Classification with Machine Learning
Objective: To achieve accurate, real-time classification of rock types in field conditions using a portable LIBS device integrated with machine learning [2].
Materials:
- Portable LIBS device (e.g., low-energy laser, limited spectral resolution)
- Rock samples of known types (e.g., mudstone, basalt, dolomite, sandstone, conglomerate, gypsolyte, shale)
- Computing unit with ML software environment (e.g., Python with scikit-learn)
Procedure:
- Spectral Acquisition: Use the portable LIBS device to collect spectra from multiple random points on the surface of each pre-identified rock sample. A minimum of 100 spectra per rock type is recommended.
- Data Pre-processing: Apply standard pre-processing techniques to the raw spectral data:
- Normalization: Normalize spectra to the total intensity or a specific background region to minimize pulse-to-pulse energy fluctuations.
- Filtering: Apply Savitzky-Golay (SG) filtering to smooth the spectra and reduce high-frequency noise.
- Dimensionality Reduction: Perform Principal Component Analysis (PCA) to reduce the number of variables and highlight the most significant spectral features.
- Model Training: Split the pre-processed data into training and testing sets (e.g., 70/30 split). Train multiple ML algorithms (e.g., LDA, KNN, SVM, XGBoost) on the training set to identify the optimal classifier.
- Validation: Validate the performance of the trained model using the independent test set. The XGBoost algorithm has been shown to achieve test set accuracy exceeding 98% for this application [2].
Protocol: Large-Scale Correlative Mineral Imaging (LIBS + SEM-EDX)
Objective: To generate comprehensive elemental and mineralogical maps of large-scale geological samples by correlating LIBS with high-resolution SEM-EDX [57].
Materials:
- Automated LIBS mapping system
- Scanning Electron Microscope (SEM) with Energy-Dispersive X-ray spectroscopy (EDX), ideally a TIMA (Tescan Integrated Mineral Analyzer)
- Large-scale geological sample (up to 8x8 cm)
- Certified reference materials for calibration
Procedure:
- LIBS Hyperspectral Mapping: Perform a grid-based LIBS analysis over the entire surface of the sample. At each point, acquire a full spectrum.
- LIBS Data Processing: Apply k-means clustering to the hyperspectral LIBS data cube to identify and segment different mineral phases based on their elemental signatures.
- SEM-EDX Analysis: Subsequently, analyze the exact same sample area using SEM-EDX to obtain high-resolution phase maps and accurate mineral identification.
- Data Fusion & Correlation: Co-register the LIBS and EDX images. Use the EDX data to validate and refine the mineral classifications from LIBS. Leverage LIBS data to map the distribution of light elements (Li, Be, B) that are difficult to detect with EDX.
- Cross-Validation: Quantify the volumetric abundance of key minerals from both LIBS and EDX maps and compare the results to assess the accuracy of the LIBS-based classification.
Workflow Visualization
LIBS Acoustic Signal Correction
The following diagram illustrates the experimental workflow for improving LIBS stability using plasma acoustic correction with a quartz tuning fork [56].
Integrated LIBS-Raman Mineral Identification
This workflow depicts the process of fusing LIBS and Raman spectroscopy with machine learning for high-accuracy mineral identification [7].
The Scientist's Toolkit: Essential Research Reagents & Materials
Successful implementation of the aforementioned protocols requires specific reagents and materials. The following table lists key solutions and their functions in portable LIBS research for mineral analysis.
Table 3: Essential Research Reagents and Materials for LIBS Experiments
| Item | Function/Application | Specifications & Notes |
|---|---|---|
| Certified Reference Materials (CRMs) | Calibration and validation of LIBS instruments for quantitative analysis. | Site-specific CRMs that match the mineral matrix of the samples being analyzed are critical to mitigate matrix effects [4] [57]. |
| Quartz Tuning Fork | Acquisition of plasma acoustic signals for spectral normalization and stability enhancement. | 32.768 kHz standard frequency; provides high signal-to-noise ratio and anti-interference capability at low cost [56]. |
| Standard Rock & Mineral Samples | Training and testing datasets for machine learning models for rock classification and mineral identification. | Should include all relevant rock types (e.g., mudstone, basalt, dolomite) and minerals of interest for a given project [7] [2]. |
| Liquid Jet Sample Introduction System | Direct analysis of liquid samples (e.g., water, brines) via portable LIBS. | Enables stable analysis of liquids; optimized parameters include a jet stream diameter of 0.64 mm [55]. |
| Multivariate Analysis Software | Processing of hyperspectral LIBS data cubes for elemental mapping and mineral classification. | Used for algorithms such as PCA, k-means clustering, PLSR, and support vector machines (SVM) [57] [2]. |
| Hybrid LIBS-Raman Sensor | Combined elemental and molecular analysis from a single instrument platform. | Enables data fusion for superior mineral identification accuracy, as demonstrated in integrated systems [7]. |
In mineral prospecting and ore processing research, the accurate determination of elemental composition is fundamental. The scientific community increasingly relies on portable analytical techniques that provide real-time, on-site data, enabling rapid decision-making during field campaigns. Among these techniques, Laser-Induced Breakdown Spectroscopy (LIBS) and X-ray Fluorescence (XRF) have emerged as dominant technologies, each with distinct capabilities and limitations [58] [26]. This application note provides a systematic comparison of LIBS and XRF technologies, with particular emphasis on their performance for light element analysis—a critical capability for exploring lithium-rich deposits and other strategic mineral resources essential for the clean energy transition [26] [5].
The growing demand for critical elements such as lithium (Li), beryllium (Be), and boron (B) has highlighted a significant analytical challenge: many traditional field-deployable techniques struggle with reliable light element detection [59]. Within this context, LIBS has demonstrated particular strength for light element quantification directly in the field, potentially revolutionizing exploration workflows for these commodities [5]. Meanwhile, XRF remains a well-established, robust method for analyzing heavier elements across diverse geological materials [58]. This analysis delineates the specific applications where each technique excels and provides detailed experimental protocols for researchers engaged in mineral prospecting and ore processing studies.
Fundamental Technological Principles
Laser-Induced Breakdown Spectroscopy (LIBS) Fundamentals
LIBS operates by focusing a high-powered laser pulse onto a sample surface, generating a microplasma that vaporizes and excites a small quantity of material (typically nanograms to picograms) [58] [60]. As the plasma cools, excited atoms and ions return to their ground states, emitting element-specific wavelengths of light [61]. A spectrometer detects this emitted light, and the resulting spectrum serves as a unique elemental fingerprint for both qualitative identification and quantitative analysis [5]. LIBS is considered minimally destructive due to the microscopic sample quantity removed during analysis [62].
X-Ray Fluorescence (XRF) Fundamentals
XRF technology functions by directing primary X-rays at a sample, which causes the ejection of inner-shell electrons from constituent atoms [58] [60]. As outer-shell electrons fill these vacancies, they emit fluorescent (secondary) X-rays with energies characteristic of each element [61]. A detector measures these energies and their intensities, enabling elemental identification and concentration measurement [58]. Unlike LIBS, XRF is a non-destructive technique that leaves samples completely intact for subsequent analysis [58].
Comparative Performance Analysis
Elemental Coverage and Detection Limits
The principal distinction between LIBS and XRF lies in their respective capabilities for detecting light elements. LIBS can effectively detect elements across the periodic table from lithium (atomic number 3) to uranium (atomic number 92), providing exceptional coverage of light elements critically important for mineral exploration targeting lithium, beryllium, and boron deposits [59] [5]. In contrast, conventional XRF technology typically detects elements from magnesium (atomic number 12) upward, with reduced sensitivity for elements below titanium (atomic number 22) in the periodic table [58] [59].
Table 1: Elemental Coverage and Analytical Performance Comparison
| Parameter | LIBS | XRF |
|---|---|---|
| Elemental Range | Lithium to Uranium [59] | Magnesium to Uranium [58] |
| Light Element Performance | Excellent for Li, Be, B, C, Na, Mg, Al, Si [5] | Poor to non-detect for elements lighter than Mg [58] |
| Heavy Element Performance | Good for most heavy elements [58] | Excellent for heavy elements [58] |
| Detection Limits | Parts-per-million (ppm) for many elements [5] | Parts-per-million (ppm) to percentage levels [58] |
| Carbon Analysis | Possible with specific instruments [60] | Not feasible with portable instruments [58] |
Table 2: Operational Characteristics for Field Deployment
| Characteristic | LIBS | XRF |
|---|---|---|
| Sample Preparation | Minimal for powders; flat surface preferred for solids [5] | Minimal; surface cleaning often sufficient [58] |
| Analysis Speed | 1-3 seconds per measurement point [60] | 5-30 seconds per measurement point [60] |
| Destructiveness | Micro-destructive (nanogram removal) [62] | Non-destructive [58] |
| Safety Requirements | Laser safety glasses [60] | Radiation safety protocols and regulations [60] |
| Portability | Handheld systems available [5] | Handheld systems available [58] |
Quantitative Performance in Geological Applications
Recent research demonstrates LIBS's quantitative capabilities for critical elements in mineral exploration contexts. A comprehensive study on the Beauvoir granite (France) highlighted LIBS's performance for lithium and rubidium quantification, achieving mean absolute errors of 0.043 wt% and 0.068 wt% respectively when analyzing unprepared drill core samples [5]. This precision level enables reliable in-field decision-making during drilling campaigns. XRF typically delivers slightly better precision for heavy elements at trace levels (<0.1%) and is less affected by surface conditions, making it preferable for quantifying elements like tungsten and heavy rare earth elements [58] [60].
Diagram 1: Fundamental principles and elemental coverage of LIBS and XRF technologies
Experimental Protocols for Mineral Prospecting
LIBS Quantitative Analysis Protocol for Lithium in Granitic Rocks
Application Context: This protocol details the methodology for quantifying lithium concentrations in rare-metal granites similar to the Beauvoir granite case study, enabling real-time grade assessment during drilling operations [5].
Materials and Equipment:
- Handheld LIBS analyzer (e.g., SciAps Z-903)
- Reference materials with certified Li concentrations
- Flat, clean rock surfaces (drill cores or outcrops)
- Portable computer with multivariate analysis software
Procedure:
- Sample Selection and Preparation: Select representative rock samples spanning expected concentration ranges. For quantitative analysis, ensure flat, fresh surfaces without visible weathering. Minimal preparation is required beyond surface cleaning.
- Instrument Calibration: Develop a quantification model using reference samples from the deposit. Apply multivariate regression methods (e.g., PLS-R) to correlate LIBS spectral data with laboratory-determined Li concentrations.
- Spectral Acquisition: Position the analyzer probe perpendicular to the sample surface with firm contact. Acquire spectra from multiple locations (minimum 30-50 points) to account for sample heterogeneity. Use the following typical parameters:
- Laser energy: 5-6 mJ
- Spot size: 50 μm
- Number of laser pulses: 10-30 per location
- Wavelength range: 190-950 nm
- Data Processing: Apply the pre-developed calibration model to convert spectral intensities into concentration values. Utilize specialized software for data processing to minimize matrix effects.
- Quality Control: Analyze certified reference materials every 10-15 samples to verify calibration stability. Recalibrate if measured values deviate by >10% from certified values.
Performance Metrics: This protocol has demonstrated a mean absolute error of 0.043 wt% for Li quantification in granitic rocks, with analysis times of approximately 1-2 minutes per sample [5].
XRF Field Analysis Protocol for Base Metal Exploration
Application Context: This protocol outlines standardized procedures for rapid multi-element analysis of soil, rock chip, and drill core samples during base metal exploration campaigns.
Materials and Equipment:
- Handheld XRF analyzer (e.g., Olympus Vanta series)
- Reference materials matched to geological matrix
- Sample preparation tools (grinder, pellet press)
- Radiation safety equipment
Procedure:
- Sample Preparation: For highest accuracy, pulverize samples to <75 μm and prepare pressed pellets using a hydraulic press. For field screening, clean rock surfaces to remove weathering rinds and ensure relatively flat analysis areas.
- Instrument Setup: Select the appropriate analytical mode (typically "Geochemical" or "Mining" mode). Ensure the analyzer is calibrated using manufacturer-supplied standards.
- Analysis Procedure: Position the analyzer window flush against the sample surface. Initiate analysis for 15-30 seconds per beam condition (typically two conditions: main filter and low filter). Maintain consistent measurement geometry throughout analysis.
- Data Interpretation: Review spectra for anomalous peaks of target elements. Compare results against established threshold values for the deposit type. Apply matrix-specific corrections if available.
- Safety Protocol: Never point the analyzer at people. Use instrument stands for fixed-position analysis. Implement radiation monitoring badges for regular users.
Performance Metrics: Modern handheld XRF analyzers typically achieve detection limits of 5-20 ppm for copper, zinc, and lead in concentrated mineralized zones, with precision of 2-5% RSD for major elements [58].
Diagram 2: Comparative analytical workflows for LIBS and XRF in mineral prospecting
Essential Research Reagents and Materials
Table 3: Essential Research Materials for Field Analysis
| Material/Reagent | Function | Application Specifics |
|---|---|---|
| Pressed Pellet Standards | Calibration and quality control [59] | Matrix-matched to geological samples; binder-free construction preferred for light element analysis [59] |
| Certified Reference Materials (CRMs) | Method validation and accuracy verification [63] | Should cover expected concentration ranges of target elements with certified values [63] |
| Portable Sample Preparation Kit | Field-based sample processing [59] | Includes diamond saw, pulverizer, and pellet press for rapid field preparation [59] |
| Matrix-Matched Calibration Sets | Quantitative model development [5] | Composed of well-characterized samples from the specific deposit type under investigation [5] |
Integrated Application Strategy for Mineral Prospecting
For comprehensive mineral exploration programs targeting both light and heavy elements, an integrated approach utilizing both LIBS and XRF technologies provides optimal results. LIBS serves as the primary tool for light element detection (Li, Be, B) and rapid screening, while XRF delivers high-precision data for heavier elements and trace metal analysis [59] [5]. This complementary strategy is particularly valuable in lithium-tin-tantalum (LCT) pegmatite exploration, where light elements (lithium) and heavy elements (tantalum, niobium) both hold economic significance [5].
Research demonstrates that LIBS can transform exploration workflows by providing same-day assay results for pathfinder elements, enabling field teams to make immediate decisions about sampling density and drill targeting rather than waiting 4-8 weeks for laboratory results [59]. This real-time analytical capability significantly reduces exploration costs and accelerates project advancement from reconnaissance to resource definition stages.
LIBS and XRF represent complementary analytical technologies that, when deployed strategically, provide comprehensive elemental characterization capabilities for mineral prospecting and ore processing research. LIBS offers unparalleled capacity for light element detection, particularly lithium, with quantitative precision suitable for field-based decision-making [5]. XRF remains the superior technique for heavy element analysis with exceptional precision and minimal sample preparation [58]. Researchers should select the appropriate technology based on specific elemental targets, required detection limits, and operational constraints, while recognizing that combined implementation often delivers the most complete geochemical understanding for modern mineral exploration challenges.
The integration of portable Laser-Induced Breakdown Spectroscopy (LIBS) into mineral prospecting and ore processing represents a significant advancement in geochemical analysis. The value of field-based LIBS data, however, is fundamentally contingent upon its correlation and harmonization with established laboratory methods, primarily Inductively Coupled Plasma Mass Spectrometry (ICP-MS) and Inductively Coupled Plasma Optical Emission Spectrometry (ICP-OES). This application note details the validation protocols and methodological harmonization necessary to ensure that portable LIBS data meets the rigorous demands of mineral exploration and drug development research, providing a framework for data quality assurance and cross-methodological reliability.
Technical Comparison of Analytical Techniques
The selection of an analytical technique is governed by the specific data quality objectives of the analysis, including required detection limits, sample matrix, and regulatory considerations.
Table 1: Comparison of Atomic Spectroscopy Techniques for Elemental Analysis
| Parameter | ICP-OES | ICP-MS | Portable LIBS |
|---|---|---|---|
| Detection Principle | Measurement of excited atoms/ions at characteristic wavelengths [64] | Measurement of an atom's mass by mass spectrometry [64] | Measurement of atomic emission from laser-induced plasma [13] |
| Typical Detection Limits | Parts per billion (ppb) [64] | Parts per trillion (ppt) [64] | Parts per million (ppm) [65] |
| Dynamic Range | Limited | Wide [64] | Moderate |
| Sample Throughput | High | High | Very High (seconds per analysis) [30] |
| Sample Preparation | Often requires digestion | Often requires digestion; low TDS tolerance (~0.2%) [64] | Minimal to none [65] [30] |
| Suitability for Field Use | No | No | Yes (handheld units available) [32] [30] |
| Isotopic Analysis | No | Yes [64] | Limited |
| Key Applications | High-matrix samples (wastewater, soil); elements with higher regulatory limits [64] | Trace element analysis; low regulatory limits; isotopic studies [64] | Alloy verification, mining exploration, on-site sorting [30] |
Advanced ICP-MS Modalities
Beyond conventional solution-based ICP-MS, advanced modalities offer unique capabilities for specialized applications:
- Single-Particle ICP-MS (SP-ICP-MS): This approach uses short integration times (micro- to milliseconds) to detect transient signals from individual nanoparticles or cells, capturing cellular heterogeneity that is lost in bulk analysis [65]. This is critical for studying the heterogeneity in mineral samples or biological uptake of metal-containing drugs.
- Laser Ablation ICP-MS (LA-ICP-MS): This solid-sampling technique uses a laser to ablate material directly from a solid sample, which is then transported to the ICP-MS for analysis [65] [66]. It provides high sensitivity for spatial mapping and depth profiling with minimal sample preparation, overcoming the limitations of wet chemical digestion [66].
Experimental Protocols for Method Validation
A rigorous method validation is essential to establish the accuracy, precision, and reliability of analytical measurements, particularly when correlating a field technique like LIBS with primary laboratory methods.
Protocol for ICP-MS Method Validation for Biological Matrices
The following protocol, adapted from the validation of an ICP-MS method for quantifying elements in red blood cells, outlines key validation parameters [67].
- 1. Sample Preparation: Packed red blood cells are aliquoted and diluted in an alkaline diluent solution containing internal standards, 0.1% Triton X-100, 0.1% EDTA, and 1% ammonium hydroxide [67].
- 2. Instrumental Analysis: The diluted specimen is analyzed using ICP-MS. The quadrupole mass analyser is typically set to operate in peak-hopping mode for the best detection limits, dwelling at the peak maximum for each target isotope [67] [68].
- 3. Validation Parameters:
- Accuracy and Linearity: Assessed by analysing standards of known concentration. Acceptance criterion is typically within ±15% of the expected value [67].
- Precision: Determined by within-run, between-run, and total imprecision, expressed as coefficient of variation (CV). A CV of ≤15% is generally acceptable [67].
- Method Comparison: Comparison of results with a reference method or standard reference materials.
- Analytical Sensitivity and Carryover: Evaluation of the method's detection limit and investigation of any sample-to-sample contamination.
Protocol for LIBS Analysis and Correlation with ICP-MS
This protocol ensures the quality of field LIBS data and its validity against primary methods.
- 1. Sample Preparation (if any): For solid samples like rocks or alloys, minimal preparation is needed. The surface may be cleaned to remove contaminants. For soils, powders may be pressed into pellets to ensure a uniform surface [30].
- 2. LIBS Instrument Operation:
- A high-focused laser pulse is directed at the sample surface, ablating a micro-scale amount of material and forming a plasma [13].
- The plasma emits element-specific wavelengths of light as it decays [13].
- Emitted light is collected via fiber optics, diffracted by a spectrometer, and detected to produce a spectral fingerprint [13].
- 3. Data Validation and Harmonization:
- Analysis of Certified Reference Materials (CRMs): CRMs with a matrix similar to the unknown samples must be analyzed to calibrate the LIBS instrument and verify accuracy [69]. This step is critical and often overlooked.
- Comparison with ICP-MS/OES: A statistically significant number of samples should be analyzed by both portable LIBS and laboratory ICP-MS/OES. The resulting data is used to create correlation models and correction algorithms, harmonizing the LIBS data with the reference method.
The following workflow diagram illustrates the multi-step process for validating and harmonizing a portable LIBS method against primary laboratory techniques.
Harmonization of LIBS with Laboratory Methods
Method harmonization is the process of aligning data from different analytical techniques to ensure consistency and reliability. For portable LIBS, this is paramount for its acceptance as a quantitative tool.
Data Correlation and Model Development
The cornerstone of harmonization is establishing a robust statistical correlation between the LIBS signal and the reference values obtained from ICP-MS/OES. This involves using a training set of samples analyzed by both techniques to develop a univariate or multivariate calibration model that corrects for matrix effects and spectral interferences in the LIBS data.
Combined Instrumental Approaches
The synergistic combination of techniques can provide comprehensive information. A tandem LA-ICP-MS/LIBS setup, where a single laser ablation system is coupled to both an ICP-MS and a LIBS spectrometer, is a powerful example [66]. This setup simultaneously provides the exceptional sensitivity and trace element quantification of LA-ICP-MS with the molecular and bulk elemental information from LIBS, offering a deep insight into sample heterogeneity and composition from a single ablation event [66].
The following diagram illustrates the logical relationship between field-based and laboratory-based techniques, leading to a harmonized and reliable analytical outcome.
The Scientist's Toolkit: Essential Research Reagents and Materials
The following table details key reagents and materials essential for conducting validated elemental analysis as discussed in this note.
Table 2: Key Research Reagent Solutions for Elemental Analysis
| Item | Function | Application Context |
|---|---|---|
| Certified Reference Materials (CRMs) | Calibration and verification of analytical accuracy for both LIBS and ICP-MS; essential for method validation [69]. | Geochemistry (rock/soil CRMs), Metallurgy (alloy CRMs), Environmental Science. |
| Internal Standards (e.g., Indium-115, Bismuth-209) | Correct for signal drift and matrix effects during ICP-MS analysis [67]. | Quantitative analysis by ICP-MS and LA-ICP-MS. |
| High-Purity Acids & Reagents (e.g., HNO₃, HCl) | Digestion and dissolution of solid samples for liquid analysis by ICP-MS/OES, minimizing contamination [66]. | Sample preparation for environmental, biological, and geological samples. |
| Alkaline Diluent (Triton X-100, EDTA, NH₄OH) | Dilution and stabilization of biological samples (e.g., RBCs) for direct introduction into ICP-MS [67]. | Clinical research, analysis of biological matrices. |
| Matrix-Matched Calibration Standards | Standards prepared in a base material similar to the sample to correct for matrix-specific effects in LIBS [30]. | Quantitative analysis by portable LIBS (e.g., alloy sorting, soil analysis). |
The global transition to sustainable energy has catalyzed a "white gold rush," creating an unprecedented demand for lithium (Li) to support battery production and green technologies [10] [5]. This demand drives the need for rapid, accurate analytical tools for mineral exploration. Laser-Induced Breakdown Spectroscopy (LIBS) has emerged as a powerful technique, distinguished by its capacity for in-situ lithium detection in geological materials, a capability where traditional methods like portable X-ray fluorescence (XRF) are ineffective [10] [70]. This application note details a successful methodology for the quantification of lithium in granite pegmatites using handheld LIBS, framing the protocol within the critical context of mineral prospecting and ore processing research.
Background & Geological Context
The Lithium Prospect: Beauvoir Granite
This case study focuses on the Beauvoir rare-metal granite in France, a site of significant scientific and economic interest due to its lithium potential. The granite is an LCT-type pegmatite (Lithium-Caesium-Tantalum), characterized by its formation from the extreme fractionation of peraluminous S-type granites [5] [70]. The Beauvoir granite's B1 facies is described as an equigranular textured leucogranite, contributing to its remarkable geochemical homogeneity. This isotropic nature is a key factor for analytical success, as it ensures that a localized LIBS analysis is representative of the larger rock volume, even with minimal sample preparation [5].
LIBS Technology in a Nutshell
LIBS is a type of atomic emission spectroscopy that utilizes a pulsed laser to ablate a micro-volume of material, creating a transient plasma. The light emitted as the plasma cools is collected and spectrally resolved, producing a unique "fingerprint" spectrum for the sample's elemental composition [71]. For lithium exploration, its most significant advantage is the exceptional sensitivity for light elements (Z < 13), allowing for the direct detection of Li in minerals, rocks, and soils in the field [10] [70].
Experimental Protocol & Workflow
The following section outlines the standardized protocol developed for reliable lithium quantification in granite samples, from sample preparation to data acquisition.
Materials & Equipment
Table 1: Essential Research Toolkit for Handheld LIBS Analysis of Granite
| Item/Solution | Function/Description |
|---|---|
| Handheld LIBS Analyzer | A unit with a spectral range covering key Li lines (e.g., 190–950 nm for the SciAps Z-903). Must include software for building custom calibration models [30]. |
| Reference Samples | A set of granite samples from the target deposit, chemically characterized by a primary laboratory method (e.g., ICP-OES). These are crucial for building a matrix-matched calibration model [5]. |
| Sample Preparation Tools | A diamond-blade saw to create fresh, flat surfaces on drill core segments or hand samples. A smooth, flat surface is critical for optimal laser focusing and signal stability [5]. |
| Portable Power Supply | A battery pack to ensure continuous operation of the handheld analyzer during extended field campaigns or in remote locations. |
| Internal Standard (Optional) | For advanced users: elements with known, constant concentration in the sample matrix can be used for signal normalization to reduce shot-to-shot variability [72]. |
Methodology
The core methodology involves a structured workflow to ensure data quality and prediction reliability.
Step 1: Sample Collection & Preparation
Eleven hand samples and four drill core segments from the Beauvoir granite were analyzed. A critical step was ensuring a flat and smooth surface was available for analysis. No other prior preparation (e.g., powdering) was conducted, highlighting a key advantage of LIBS for rapid analysis [5].
Step 2: Reference Analysis
A subset of samples was analyzed using Inductively Coupled Plasma–Optical Emission Spectrometry (ICP-OES) following total acid digestion to determine the "ground truth" Li concentration. This data is essential for building and validating the LIBS quantification models [5] [73].
Step 3: Spectral Acquisition
A handheld LIBS analyzer (e.g., SciAps Z-Series) was used to collect spectra directly from the unprepared rock surfaces. The analytical protocol involved:
- Spectral Range: A broad range from 190–950 nm to capture all relevant Li emission lines [30].
- Averaging: Multiple laser shots (e.g., 30-60 spectra per sample) were averaged at several locations to account for micro-scale heterogeneity and improve signal-to-noise ratio [72] [73].
Step 4: Data Processing & Model Building
The acquired spectra were processed to develop quantitative models.
- Pre-processing: Spectra underwent baseline removal using an asymmetric least squares algorithm and normalization by total area to minimize signal fluctuations [72].
- Line Selection: Key lithium emission lines were identified, including the resonant lines at 610.36 nm and 670.78 nm, and non-resonant lines at 812.62 nm and 922.40 nm [73] [70].
- Model Development: Both univariate (based on a single peak) and multivariate models were constructed and compared. Multivariate methods like Partial Least Squares (PLS) Regression are often superior as they utilize information from the entire spectrum, effectively working around matrix effects and signal saturation [72] [5].
Results & Quantitative Data
The performance of the handheld LIBS protocol was rigorously validated against laboratory ICP-OES data.
Table 2: Quantitative Performance of Handheld LIBS for Lithium in Beauvoir Granite
| Metric | Univariate Model | Multivariate (PLS) Model | Notes |
|---|---|---|---|
| Mean Absolute Error (MAE) | Not Reported | Li: 0.043 wt% | MAE values demonstrate high prediction accuracy, with the PLS model performing exceptionally well [5]. |
| Coefficient of Determination (R²) | Lower performance due to self-absorption & matrix effects [73] | High (e.g., >0.95 for well-tuned models) | PLS regression yields a much stronger correlation with reference values by using full spectral information [72] [74]. |
| Key Advantage | Simplicity | Handles matrix effects and non-linearity; provides a single model for wide concentration ranges [72] [73]. | |
| Optimal Li Emission Lines | Resonant lines (610.36 nm, 670.78 nm) for low concentrations [73]. | Utilizes multiple lines and spectral regions, reducing reliance on a single, potentially saturated peak. |
Beyond the Beauvoir granite, the methodology was successfully applied in the Carolina Tin-Spodumene Belt (CTSB), USA. In the CTSB, handheld LIBS was used for real-time Li analysis, micro-chemical mapping, and determining the degree of pegmatite fractionation by measuring K/Rb ratios in muscovite—a powerful vectoring tool in exploration [70].
Discussion
Significance for Mineral Exploration & Ore Processing
The ability to obtain laboratory-quality elemental data in the field with minimal to no sample preparation is transformative for the mining industry. It drastically shortens the decision-making loop, allowing geologists to:
- Guide drilling operations in near real-time, making on-site decisions about whether to continue, cease, or reposition drill sites [5].
- Rapidly map geochemical anomalies and define the extent of mineralization directly at the outcrop or on drill cores [10].
- Perform rapid ore grading during processing, improving efficiency and resource utilization [10].
Overcoming LIBS Challenges
Quantitative LIBS analysis is historically challenged by matrix effects and shot-to-shot signal variability. This protocol successfully mitigates these issues through:
- Matrix-Matched Calibration: Using reference samples from the same geological deposit ensures the calibration model accounts for the specific chemical and physical properties of the granite [5].
- Ensemble Averaging: Averaging multiple spectra per location suppresses random noise and variability [72] [10].
- Advanced Chemometrics: Employing multivariate algorithms like PLS allows the model to recognize and correct for complex, non-linear interactions within the plasma, leading to more robust and accurate predictions than traditional univariate methods [72] [75] [74].
This application note demonstrates that handheld LIBS is no longer a merely qualitative tool but a robust quantitative technology for lithium exploration. The developed protocol—centered on minimal sample preparation, the use of matrix-matched standards, and advanced multivariate data processing—enables the rapid, accurate, and reliable quantification of lithium in granite-pegmatite systems. By providing immediate geochemical data, handheld LIBS empowers researchers and mining professionals to optimize exploration strategies, reduce operational costs, and accelerate the development of critical lithium resources essential for the global energy transition.
Portable Laser-Induced Breakdown Spectroscopy (LIBS) is revolutionizing the elemental analysis of geological materials, offering significant economic and operational advantages for mineral prospecting and ore processing. This application note details how this field-deployable technology accelerates decision-making, reduces operational costs, and enhances efficiency throughout the mining lifecycle, from exploration to grade control. By enabling real-time, on-site geochemical analysis, portable LIBS transforms traditional workflows that traditionally rely on time-consuming and expensive laboratory analyses.
Quantifiable Economic and Operational Advantages
Portable LIBS technology directly addresses key cost and time inefficiencies in mineral exploration and mining operations. The table below summarizes the core advantages supported by quantitative data from field applications.
Table 1: Quantitative Economic and Operational Advantages of Portable LIBS in Mining
| Advantage Category | Traditional Method | Portable LIBS Approach | Improvement Factor | Primary Source / Application |
|---|---|---|---|---|
| Result Turnaround Time | 2-7 days laboratory processing [4] | Immediate real-time data [4] | 100-300x acceleration [4] | Downhole drilling analysis |
| Sample Preparation | 2-4 hours for grinding and dissolution [4] | Zero preparation required [4] [5] | Complete elimination of prep time [4] | Analysis of raw drill cores [5] |
| Cost Per Analysis | $50-200 per sample [4] | Equipment amortization of $5-15 per sample [4] | 3-10x cost reduction [4] | General exploration and grade control |
| Drilling Efficiency | Static drilling plans [4] | Dynamic depth optimization [4] | 15-25% operational improvement [4] | Real-time downhole geochemical profiling |
| Analysis Speed | Hours per sample (SEM-EDS) [76] | Minutes or seconds per sample [4] [76] | Dramatic acceleration (e.g., 30-60 seconds) [4] | Gunshot residue testing (analogous to mineral screening) [76] |
The ability to analyze materials with no sample preparation is a game-changer, particularly for drill core analysis. Handheld LIBS has been successfully used to analyze unprepared drill core segments, providing reliable quantitative data for critical elements like lithium and rubidium, thereby confirming the feasibility of capturing a representative signal from raw rock surfaces [5]. This eliminates the need for costly and time-consuming crushing and powdering, which has been the standard protocol for decades with techniques like laboratory XRF [5].
Detailed Experimental Protocols
The efficacy of portable LIBS is demonstrated through specific, field-tested protocols. The following section outlines two key methodologies: one for the quantitative analysis of critical elements in raw drill cores and another for the rapid classification of rock types using machine learning.
Protocol 1: Quantitative Analysis of Critical Elements in Unprepared Drill Core
Application Objective: To achieve reliable quantification of pathfinder elements (e.g., Li, Rb) directly on unprepared drill core samples during exploration campaigns to enable real-time decision-making [5].
Materials and Reagents:
- Portable LIBS Analyzer: A handheld LIBS unit with a spectral range of 190–950 nm is required for comprehensive element detection [5].
- Reference Samples: A set of certified reference materials (CRMs) or samples from the deposit with known compositions (as determined by laboratory analysis) that match the matrix of the target granite are essential for calibration [5].
- Sample Subset: A smaller subset of reference samples is used for model validation [5].
Methodology:
- Sample Selection & Surface Requirement: Select drill core segments. While no crushing or powdering is needed, a flat and smooth surface is required for optimal laser focus and signal stability [5].
- Spectral Acquisition: Acquire LIBS spectra at multiple points along the drill core to account for sample heterogeneity. The number of laser shots and locations should be sufficient to capture a representative average composition [5].
- Data Pre-processing: Process raw spectral data to remove background noise and correct for baseline drift [5].
- Quantitative Model Development: Employ multivariate regression techniques, such as Partial Least Squares Regression (PLSR), to build a calibration model that correlates the processed LIBS spectral data with the known concentrations of the target elements (e.g., Li, Rb) from the reference samples [5].
- Model Validation: Test the performance of the calibration model using the reserved validation sample set. Calculate figures of merit like Mean Absolute Error (MAE) to ensure accuracy (e.g., MAE of 0.043 wt% for Li) [5].
- Prediction: Apply the validated model to predict the concentration of the target elements in unknown drill core samples in the field.
Logical Workflow: The following diagram illustrates the streamlined workflow from field deployment to data-driven decision-making.
Protocol 2: Rapid In-Situ Rock Classification with Machine Learning
Application Objective: To perform rapid, accurate classification of common rock types in the field for geological mapping and petroleum logging using a portable LIBS device integrated with machine learning [2].
Materials and Reagents:
- Portable Multi-Directional LIBS Device: A portable spectrometer designed for field use, capable of acquiring spectra from rough and irregular rock surfaces [2].
- Rock Samples: A comprehensive set of known rock types (e.g., mudstone, basalt, dolomite, sandstone, conglomerate, gypsolyte, shale) for training the classification model [2].
- Computing Unit: A device running machine learning algorithms for data processing and model training [2].
Methodology:
- Spectral Library Creation: Use the portable LIBS device to collect spectral data from multiple random points on each known rock sample. This multi-directional acquisition mitigates the effects of surface roughness [2].
- Data Pre-processing: Apply pre-processing techniques to the raw spectra, including normalization, Savitzky-Golay (SG) filtering for smoothing, and Principal Component Analysis (PCA) for dimensionality reduction and noise removal [2].
- Machine Learning Model Training: Train multiple classification algorithms (e.g., Linear Discriminant Analysis (LDA), k-Nearest Neighbor (KNN), Support Vector Machine (SVM), and Extreme Gradient Boosting (XGBoost)) using the pre-processed spectral data from the known samples [2].
- Model Validation: Evaluate the performance of each algorithm using a test set of data not seen during training. Research has demonstrated that the XGBoost model can achieve test set accuracy up to 98.57% for classifying seven common rock types [2].
- Field Deployment for Classification: Deploy the best-performing trained model to the field. The portable LIBS system can now classify unknown rock samples in real-time by acquiring a spectrum and running it through the model [2].
The Scientist's Toolkit: Essential Research Reagent Solutions
Successful implementation of portable LIBS in research relies on key components and consumables.
Table 2: Essential Materials for Portable LIBS Research in Mineral Prospecting
| Item | Function | Application Note |
|---|---|---|
| Matrix-Matched Reference Materials | Calibration and validation of quantitative models. | Critical for accuracy; should be geochemically similar to the samples under investigation [5]. |
| Portable LIBS Analyzer with Wide Spectral Range | In-field elemental analysis. | A range of 190-950 nm enables detection of all elements, from light elements (Li, B) to heavy metals [16] [5]. |
| Rechargeable Battery Packs | Powers the analyzer in remote locations. | Enables 8-12 hours of continuous operation, which is essential for field deployment [77] [4]. |
| Surface Preparation Tool (e.g., Rock Saw) | Creates a flat, fresh surface on rock samples. | Mitigates signal instability caused by weathering, roughness, or contamination, improving reproducibility [5]. |
| Purge Gas (e.g., Argon) Attachment | Inert gas flow over the analysis spot. | Can enhance analyte signal intensity by reducing atmospheric interference in the plasma [76]. |
Portable LIBS provides a paradigm shift in geochemical analysis for mineral prospecting and ore processing. The technology delivers undeniable economic benefits through drastic reductions in analysis time and cost per sample, while its operational advantages manifest as accelerated decision velocity and improved resource efficiency. By adopting the detailed protocols for quantitative analysis and rock classification, researchers and mining professionals can leverage this powerful tool to optimize exploration campaigns, enhance grade control, and build more resilient and responsive mining operations.
Conclusion
Portable LIBS represents a paradigm shift in geochemical analysis, offering unprecedented capabilities for real-time, on-site elemental quantification throughout mineral exploration and ore processing workflows. Its unique ability to detect light elements like lithium, combined with minimal sample preparation requirements and rapid analysis times, positions LIBS as an indispensable tool for modern mining operations. While challenges such as matrix effects and quantification accuracy require careful management through proper calibration and advanced data processing, the technology's demonstrated success in field applications confirms its transformative potential. As LIBS technology continues to evolve with improvements in laser sources, detector sensitivity, and integrated artificial intelligence, its role will expand further, enabling more precise resource definition, enhanced operational efficiency, and ultimately contributing to more sustainable and economically viable mineral resource development. The integration of portable LIBS into standard geological practice marks a significant advancement toward fully data-driven exploration and mining operations.
References
- 1. New Study Demonstrates LIBS as a Promising Tool for ... [https://www.spectroscopyonline.com/view/new-study-demonstrates-libs-as-a-promising-tool-for-cement-content-analysis]
- 2. Achieving Accurate Rock Classification Using LIBS [https://www.spectroscopyonline.com/view/achieving-accurate-rock-classification-using-libs]
- 3. A multi-distance laser-induced breakdown spectroscopy ... [https://www.nature.com/articles/s41598-025-24644-x]
- 4. LIBS in Mining: Real-Time Elemental Analysis Solutions [https://discoveryalert.com.au/libs-technology-mining-2025-geochemical-analysis/]
- 5. Handheld LIBS contribution to quantify critical elements ... [https://www.sciencedirect.com/science/article/abs/pii/S0375674225000214]
- 6. Laser Induced Breakdown Spectroscopy compared with ... [https://www.sciencedirect.com/science/article/abs/pii/S0584854716303871]
- 7. Next-Gen Mineral Identification: Fusing LIBS and Raman ... [https://www.spectroscopyonline.com/view/next-gen-mineral-identification-fusing-libs-and-raman-spectroscopy-with-machine-learning]
- 8. The 2025 Emerging Leader in Atomic Spectroscopy Award [https://www.spectroscopyonline.com/view/the-2025-emerging-leader-in-atomic-spectroscopy-award]
- 9. What is LIBS? [https://appliedspectra.com/technology/libs.html]
- 10. Laser-Induced Breakdown Spectroscopy in Mineral ... [https://www.mdpi.com/2075-163X/14/7/731]
- 11. Laser-Induced Breakdown Spectroscopy (LIBS) [https://serc.carleton.edu/msu_nanotech/methods/libs.html]
- 12. Laser Induced Breakdown Spectroscopy for Elemental ... [https://pmc.ncbi.nlm.nih.gov/articles/PMC3231154/]
- 13. LIBS, Laser Induced Breakdown Spectroscopy ... [https://www.thermofisher.com/us/en/home/industrial/spectroscopy-elemental-isotope-analysis/portable-analysis-material-id/industrial-elemental-radiation-solutions/how-does-libs-work.html]
- 14. LIBS Basics, Part III: Deriving the Analytical Answer [https://www.spectroscopyonline.com/view/libs-basics-part-iii-deriving-analytical-answer-calibrated-solutions-libs]
- 15. Laser-induced Breakdown Spectroscopy Market Size & ... [https://www.mordorintelligence.com/industry-reports/laser-induced-breakdown-spectroscopy-market]
- 16. USGS 2025 Critical Minerals List: SciAps PowerHouse X & ... [https://www.sciaps.com/post/analyzing-the-usgs-2025-draft-list-of-critical-minerals-with-sciaps-powerhouse-x-and-z-903]
- 17. Analysis of Minerals Using Handheld Laser-Induced ... [https://www.mdpi.com/2306-5729/10/3/40]
- 18. How LIBS Spectroscopy Systems Works — In One Simple ... [https://www.linkedin.com/pulse/how-libs-spectroscopy-systems-works-one-simple-flow-xoohc]
- 19. Rapid geochemical imaging of rocks and minerals with ... [https://www.sciencedirect.com/science/article/abs/pii/S0375674220306543]
- 20. The latest success story in portable analytical instrumentation [https://www.onestopndt.com/ndt-articles/handheld-libs-the-latest-success-story-in-portable-analytical-instrumentation]
- 21. Making a case for handheld LIBS in mineral exploration [https://www.sciaps.com/post/making-a-case-for-handheld-libs-in-mineral-exploration]
- 22. HH LIBS analyzers for chemistry & sciences [https://www.sciaps.com/post/scix]
- 23. Z-Series LIBS Analyzers [https://www.sciaps.com/products/libs/z-series]
- 24. Laser Induced Breakdown Spectroscopy, LIBS Analyzer [https://www.thermofisher.com/us/en/home/industrial/spectroscopy-elemental-isotope-analysis/portable-analysis-material-id/industrial-elemental-radiation-solutions/niton-apollo-handheld-libs-analyzer.html]
- 25. Mining Market 2025 - Size And Trends to 2034 [https://www.thebusinessresearchcompany.com/report/mining-global-market-report]
- 26. Portable Element Analyzers for Minerals Analysis 2025 ... [https://www.archivemarketresearch.com/reports/portable-element-analyzers-for-minerals-808079]
- 27. Mining - Worldwide | Statista Market Forecast [https://www.statista.com/outlook/io/mining/worldwide?srsltid=AfmBOopvo9ThQ2956Mn0xN6eVBwG03BxYah6kystwpglhR1tXq2t-Ual]
- 28. The Handheld LIBS Analyzers Market's comprehensive ... [https://www.linkedin.com/pulse/handheld-libs-analyzers-markets-comprehensive-1f13e]
- 29. LIBS Revolution Transforms European Mining with Real ... [https://discoveryalert.com.au/libs-revolution-european-mining-2025/]
- 30. Handheld LIBS analyzers [https://www.malvernpanalytical.com/en/products/category/handheld-libs-analyzers]
- 31. Explorative Data Analysis Methods: Application to Laser- ... [https://www.mdpi.com/1424-8220/23/13/6208]
- 32. Handheld LIBS Analysers [https://www.portableas.com/handheld-libs-analysers/]
- 33. Geochemical Sample Preparation: A Focus on Drill Core ... [https://lkiconsulting.com/2025/01/geochemical-sample-preparation-a-focus-on-drill-core-samples/]
- 34. Hybrid geostatistical and deep learning framework for ... [https://www.nature.com/articles/s41598-025-19441-5]
- 35. Initial Quantitative Measurements with Handheld LIBS [https://www.spectroscopyonline.com/view/initial-quantitative-measurements-handheld-libs-2]
- 36. Advancing automated mineral identification through LIBS ... [https://www.sciencedirect.com/science/article/abs/pii/S0584854724002301]
- 37. 激光诱导击穿光谱技术(LIBS) [https://www.malvernpanalytical.com.cn/products/technology/laser-induced-breakdown-spectroscopy]
- 38. CN103816976A - 激光诱导击穿光谱矿石智能分选方法及设备 [https://patents.google.com/patent/CN103816976A/zh]
- 39. 激光诱导击穿光谱技术结合PCA-PSO-SVM对矿石分类识别 [https://www.opticsjournal.net/Articles/OJ7ef9b0dca7bc0d52/FullText]
- 40. Laser Induced Breakdown Spectroscopy (LIBS) [https://phoenix-sci.com/laser-induced-breakdown-spectroscopy-libs/]
- 41. BeltPulse [https://www.spectralindustries.com/products/beltpulse/]
- 42. NIST: Atomic Spectra Database - LIBS Interface Help File [https://physics.nist.gov/PhysRefData/ASD/Html/libshelp.html]
- 43. Handheld LIBS analyzers | Vulcan+ range [https://hha.hitachi-hightech.com/en/product-range/products/handheld-xrf-libs-analyzers/handheld-libs-analyzers]
- 44. A Matrix Effect Calibration Method of Laser-Induced ... [https://www.mdpi.com/2076-3417/15/15/8640]
- 45. Comparison of Calibration Approaches in Laser-Induced ... [https://pmc.ncbi.nlm.nih.gov/articles/PMC6928797/]
- 46. LIBS Technology Transforming Sustainable Mining Practices [https://discoveryalert.com.au/sustainable-mining-libs-technology-2025/]
- 47. Methods for optimization of the original signal in laser ... [https://www.sciencedirect.com/science/article/abs/pii/S0584854724001265]
- 48. Research on Enhancement of LIBS Signal Stability ... [https://www.mdpi.com/2227-9040/13/2/42]
- 49. Benchmark classification dataset for laser-induced ... [https://www.nature.com/articles/s41597-020-0396-8]
- 50. Mastering Spectroscopy of Inhomogeneous Materials [https://www.spectroscopyonline.com/view/mastering-spectroscopy-of-inhomogeneous-materials-advanced-sampling-strategies-to-solve-the-heterogeneity-problem]
- 51. LIBS: Fundamentals, Benefits, and Advice to New Users [https://www.spectroscopyonline.com/view/libs-fundamentals-benefits-and-advice-new-users]
- 52. FAQs - Niton Apollo Handheld LIBS Analyzer [https://www.thermofisher.com/us/en/home/industrial/spectroscopy-elemental-isotope-analysis/portable-analysis-material-id/industrial-elemental-radiation-solutions/niton-apollo-handheld-libs-analyzer-faqs.html]
- 53. Improving LIBS analysis of non-flat heterogeneous ... [https://opg.optica.org/abstract.cfm?uri=ao-62-8-2030]
- 54. Laser-induced breakdown spectroscopy quantitative ... [https://www.sciencedirect.com/science/article/abs/pii/S026322412502473X]
- 55. New Portable LIBS Device for On-Site Water Hardness ... [https://www.spectroscopyonline.com/view/new-portable-libs-device-for-on-site-water-hardness-testing]
- 56. Improvement in detection stability and prediction accuracy ... [https://www.sciencedirect.com/science/article/pii/S0039914025010628?dgcid=rss_sd_all]
- 57. Correlative imaging of large-scale geological samples ... [https://www.sciencedirect.com/science/article/pii/S0584854725002824]
- 58. XRF vs. LIBS vs. OES: Comprehensive Guide to Choosing ... [https://verichek.net/xrf-vs-libs-vs-oes-metal-analysis-guide.html]
- 59. LIBS and XRF home [https://www.libsxrf.com/]
- 60. Handheld LIBS vs. XRF: 7 Main Differences [https://www.sweetfishmedia.com/blog/handheld-libs-vs-xrf]
- 61. How to Choose the Right Elemental Analyzer: XRF vs LIBS [https://www.thermofisher.com/blog/metals/how-to-choose-the-right-elemental-analyzer-xrf-vs-libs/]
- 62. LIBS and XRF: Complementary Analysis Techniques for ... [https://www.spectroscopyonline.com/view/libs-and-xrf-complementary-analysis-techniques-pharmaceutical-development]
- 63. Assessment of performance rates on the elemental ... [https://www.sciencedirect.com/science/article/abs/pii/S2468170924000195]
- 64. Comparison of ICP-OES and ICP-MS for Trace Element ... [https://www.thermofisher.com/us/en/home/industrial/environmental/environmental-learning-center/contaminant-analysis-information/metal-analysis/comparison-icp-oes-icp-ms-trace-element-analysis.html]
- 65. critical review of SP-ICP-MS, LIBS and LA- ... [https://pmc.ncbi.nlm.nih.gov/articles/PMC10632293/]
- 66. Combined LA-ICP-MS/LIBS: powerful analytical tools for ... [https://www.nature.com/articles/s41598-020-69210-9]
- 67. Method validation of an inductively coupled plasma mass ... [https://www.sciencedirect.com/science/article/pii/S2667145X24000336]
- 68. Impact of Measurement Protocol on ICP-MS Data Quality ... [https://www.spectroscopyonline.com/view/impact-of-measurement-protocol-on-icp-ms-data-quality-objectives-part-i]
- 69. Evaluating the Impact of ICP-MS and LIBS on ... [https://www.spectroscopyonline.com/view/evaluating-the-impact-of-icp-ms-and-libs-on-environmental-monitoring]
- 70. Handheld LIBS for Li Exploration: An Example from the ... [https://www.mdpi.com/2075-163X/12/1/77]
- 71. LIBS technology: fast and accurate [https://elemission.ca/libs-technology/]
- 72. Comprehensive comparison of linear and non ... [https://www.sciencedirect.com/science/article/abs/pii/S0584854722001483]
- 73. Fast Quantification of Lithium Concentration in Non- ... [https://www.mdpi.com/2076-3417/15/17/9583]
- 74. Optimization of laser-induced breakdown spectroscopy for ... [https://www.sciencedirect.com/science/article/abs/pii/S0009254110002664]
- 75. Comparison of different calibration techniques of laser ... [https://jeos.springeropen.com/articles/10.1186/s41476-021-00164-9]
- 76. Portable LIBS Paves the Way for More Effective Gunshot ... [https://www.spectroscopyonline.com/view/portable-libs-paves-the-way-for-more-effective-gunshot-residue-testing]
- 77. A review of the development of portable laser induced ... [https://www.sciencedirect.com/science/article/abs/pii/S0584854714002663]