Portable Raman Spectroscopy for Raw Material Identification: A Comprehensive Guide for Pharmaceutical Research and Development
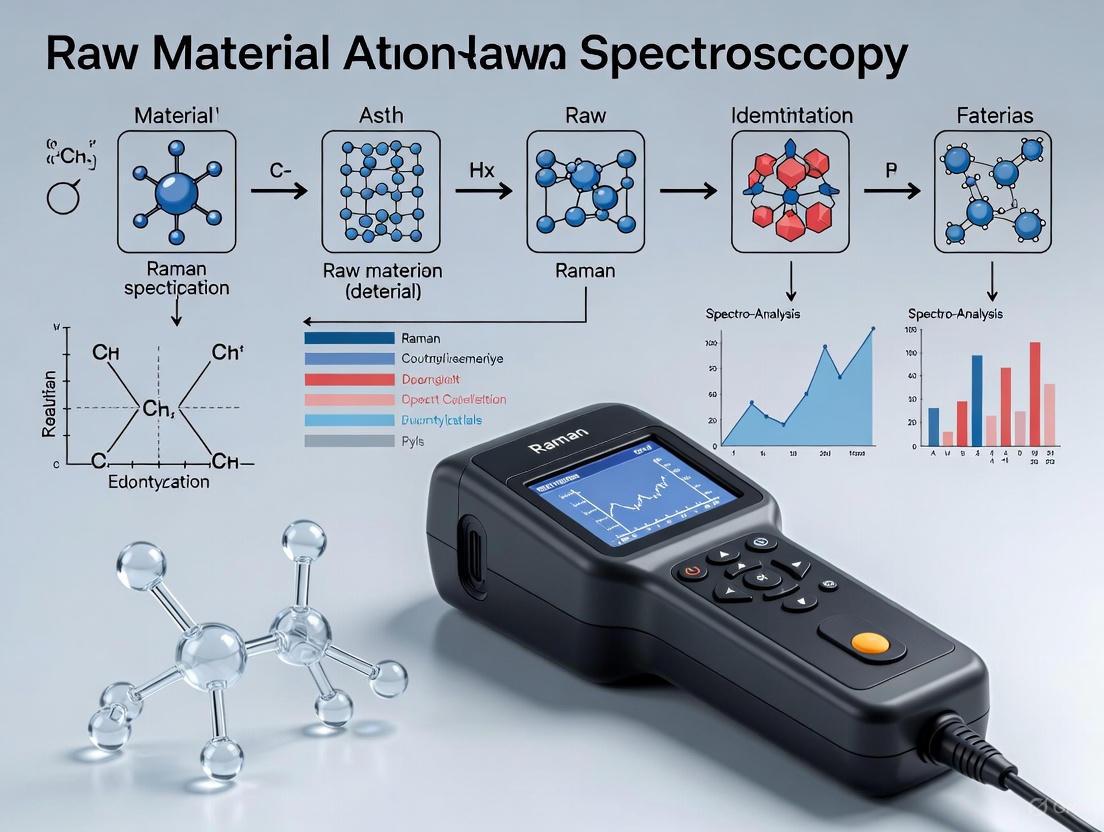
This article provides a comprehensive overview of portable Raman spectroscopy for raw material identification (RMID), tailored for researchers, scientists, and drug development professionals.
Portable Raman Spectroscopy for Raw Material Identification: A Comprehensive Guide for Pharmaceutical Research and Development
Abstract
This article provides a comprehensive overview of portable Raman spectroscopy for raw material identification (RMID), tailored for researchers, scientists, and drug development professionals. It covers the foundational principles of the technology, explores its methodological applications in pharmaceutical manufacturing and quality control, addresses common troubleshooting and optimization challenges, and validates its performance against traditional techniques. The scope includes practical guidance on implementing portable Raman for regulatory-compliant, on-site material verification to enhance efficiency, reduce costs, and ensure supply chain integrity from warehouse to production floor.
The Principles and Rise of Portable Raman in Pharmaceutical QA/QC
Fundamental Principles of Raman Scattering
Raman spectroscopy is a powerful analytical technique based on the Raman effect, a form of inelastic light scattering. When light interacts with a sample, most photons are elastically scattered (Rayleigh scattering) with unchanged energy. However, approximately 1 in 10⁶ photons undergoes Raman scattering, where energy transfer occurs between the photon and the molecule, resulting in a scattered photon with shifted energy [1] [2].
Types of Raman Scattering
The energy exchange process defines two primary types of Raman scattering:
- Stokes Raman Scattering: The most common form, where the incident photon transfers energy to the molecule, resulting in a scattered photon with lower energy and longer wavelength than the incident light. This occurs when the molecule transitions to a higher vibrational energy level [1].
- Anti-Stokes Raman Scattering: Less common, where the molecule transfers energy to the photon, resulting in a scattered photon with higher energy and shorter wavelength. This requires the molecule to initially be in an excited vibrational state [1].
The energy difference between incident and scattered photons corresponds to vibrational energy levels in the molecule, creating a unique "molecular fingerprint" for chemical identification [1] [2].
Diagram 1: Energy level diagram showing Stokes and Anti-Stokes Raman scattering processes.
Application Note: Portable Raman for Raw Material Identification
Portable Raman spectroscopy has emerged as a transformative technology for raw material identification (RMID) in pharmaceutical manufacturing and quality control. Traditional methods require sampling and laboratory analysis, causing delays of several days. Handheld Raman spectrometers enable 100% inspection of incoming raw materials at the receipt point, reducing quality release time from weeks to minutes [3] [4].
Key Advantages for Raw Material Verification
- Non-destructive testing: Materials can be analyzed through transparent packaging such as plastic bags, minimizing contamination risk and handling [3]
- Molecular specificity: Each chemical compound produces characteristic Raman shifts, providing definitive chemical fingerprints for excipients and active ingredients [3]
- Operational efficiency: Significant reduction in time between material receipt and production availability [4]
- Regulatory compliance: Accepted Good Manufacturing Practice (GMP) technique for raw material identification [5]
Technical Specifications for Handheld Raman Systems
Table 1: Typical specifications of handheld Raman spectrometers for raw material identification
| Parameter | Specification | Application Notes |
|---|---|---|
| Laser Wavelength | 785 nm NIR | Optimal balance between fluorescence avoidance and signal strength [3] [5] |
| Laser Power | 300-400 mW maximum output | Sufficient for signal generation without sample damage [3] |
| Detector Type | Cooled CCD | High sensitivity for low-light detection; back-thinned variants ideal [3] [1] |
| Spectral Range | 500-1800 cm⁻¹ (fingerprint) | Covers primary molecular vibration region for most materials [2] |
| Measurement Time | Seconds to minutes (auto-mode) | Instrument optimizes for signal-to-noise ratio automatically [3] |
Experimental Protocols for Raw Material Authentication
Protocol: Method Development for Raw Material Library
Purpose: Create reference spectral methods for common pharmaceutical raw materials [3] [4].
Materials and Equipment:
- Handheld Raman spectrometer (e.g., TruScan, BRAVO)
- Transparent packaging materials (polyethylene bags, glass vials)
- Reference materials (neat chemicals, excipients, active ingredients)
Procedure:
Sample Preparation:
- Place approximately 2g of reference material in 2μm thick polyethylene bags or borosilicate glass vials
- Ensure uniform packing density without air gaps
- Prepare triplicate samples for method robustness
Reference Spectrum Acquisition:
- Select appropriate attachment (nose-cone or vial-holder) for consistent focal distance
- Initiate automatic acquisition mode allowing instrument to optimize exposure time, accumulations, and laser power
- For fluorescent materials (cellulose, dextrin): terminate reference scan before automatic completion or periodically move sample to avoid photobleaching
- Exclude materials with weak Raman signals or excessive fluorescence (colloidal silica, talc) from library
Method Creation:
- Transfer reference spectra to web-based software utility
- Establish pass/fail criteria using probability-based approach (default p-value threshold: 0.05)
- Account for normal spectral variation across multiple suppliers and lots
- Validate method selectivity against similar materials
Method Transfer and Deployment:
- Load reference library files to multiple handheld units
- Verify method performance across different instruments without additional tuning
- Train operators on proper technique for consistent measurements
Protocol: Routine Raw Material Identity Verification
Purpose: Rapid identification of incoming raw materials at receipt point [3] [4].
Procedure:
Material Receipt:
- Maintain containers in receiving area without opening
- Ensure transparent packaging or representative sampling in clear containers
Instrument Preparation:
- Select appropriate method from instrument menu using barcode scanner or manual entry
- Verify instrument calibration status
Measurement:
- Position laser aperture against or near transparent packaging
- Initiate automatic measurement mode
- Maintain position until instrument indicates completion (typically 10-30 seconds)
Result Interpretation:
- Instrument calculates probability (p-value) that measured spectrum matches reference
- p-value ≥ 0.05: Material identity confirmed ("PASS")
- p-value < 0.05: Identity verification fails ("FAIL") - initiate investigation
Documentation:
- Record results with material identification, timestamp, and operator
- Maintain electronic records for data integrity and regulatory compliance
Diagram 2: Raw material identity verification workflow using handheld Raman spectroscopy.
Advanced Raman Techniques and Data Analysis
Enhanced Raman Methodologies
For challenging applications, several enhanced Raman techniques have been developed:
- Surface-Enhanced Raman Spectroscopy (SERS): Uses metallic surfaces to amplify local electric fields, significantly increasing Raman signal intensity [2]
- Tip-Enhanced Raman Spectroscopy (TERS): Combines Raman spectroscopy with atomic force microscopy for nanoscale spatial resolution [2]
- Coherent Anti-Stokes Raman Scattering (CARS): A nonlinear technique providing stronger signals and chemical specificity without fluorescence interference [2]
Data Analysis and Machine Learning Approaches
Modern Raman spectroscopy increasingly incorporates advanced data analysis:
Table 2: Data analysis methods for Raman spectroscopy in material identification
| Method | Application | Advantages | Limitations |
|---|---|---|---|
| Correlation Coefficient | Quick similarity assessment | Simple calculation, intuitive (0-1 scale) | Insensitive to subtle spectral differences; arbitrary threshold selection [3] |
| Probability-Based Approach | Statistical identity testing | Accounts for measurement uncertainty; p-value interpretation | Requires comprehensive reference libraries [3] |
| Deep Learning (CNN) | Spectral classification | Eliminates need for manual preprocessing; handles complex patterns | "Black box" nature; requires extensive training data [6] |
| Principal Component Analysis (PCA) | Dimensionality reduction | Visualizes spectral clustering; reduces data complexity | May obscure important spectral features [7] |
The Scientist's Toolkit: Essential Research Reagents and Materials
Table 3: Key materials and reagents for Raman spectroscopy-based raw material identification
| Item | Function/Application | Technical Notes |
|---|---|---|
| Handheld Raman Spectrometer | Primary analysis instrument | 785 nm laser preferred for fluorescence reduction; integrated barcode scanner for workflow efficiency [3] [5] |
| Polyethylene Bags (2μm thickness) | Sample containment | Enable non-destructive testing through transparent packaging; minimize fluorescence interference [3] |
| Borosilicate Glass Vials | Reference standard containment | Low fluorescence background; suitable for creating reference spectral libraries [3] |
| Reference Materials | Method development and validation | High-purity materials representing typical excipients and active ingredients [4] |
| Spectral Library Software | Method creation and management | Web-based utilities for reference spectrum processing and method transfer between instruments [3] |
Troubleshooting and Method Validation
Common Challenges and Solutions
- Fluorescence Interference: Use 1064 nm excitation wavelength instead of 785 nm to reduce sample-induced fluorescence [5]
- Weak Raman Signals: Consider SERS substrates or resonance Raman techniques for signal enhancement [2]
- Spectral Variation: Incorporate multiple lots and suppliers during method development to account for normal cause variation [4]
- Packaging Effects: Validate measurement through different packaging materials to ensure method robustness [3]
Method Validation Parameters
For regulatory compliance, Raman methods should be validated for:
- Repeatability and Reproducibility: Consistent results across operators, instruments, and time [4]
- Selectivity: Ability to distinguish between similar materials and detect contaminants [3]
- Robustness: Performance under varying environmental conditions (temperature, humidity) and operational factors [4]
- Data Integrity: Secure electronic records with audit trails for regulatory compliance [4]
In the modern pharmaceutical industry, the globalization of supply chains and the push towards 100% material inspection have made rapid and reliable Raw Material Identification (RMID) a critical component of Quality Control (QC) and Good Manufacturing Practices (GMP) [8] [9]. Traditional analytical techniques, while precise, often involve sample preparation, destruction of the sample, and time-consuming delays for laboratory analysis [10]. Portable Raman spectroscopy has emerged as a transformative technology that addresses these challenges directly. This Application Note details how the core advantages of speed, non-destructiveness, and through-container analysis with portable Raman spectrometers streamline pharmaceutical RMID, enhance operational efficiency, and ensure regulatory compliance, thereby forming a cornerstone of lean manufacturing processes [11] [12] [9].
Key Advantages and Supporting Data
The strategic adoption of portable Raman spectroscopy in QC laboratories is driven by quantifiable benefits that outperform traditional methods. The table below summarizes a comparative analysis and key performance metrics.
Table 1: Comparative Analysis: Portable Raman vs. Traditional Techniques for RMID
| Feature | Portable Raman Spectroscopy | Traditional Lab Methods (HPLC, FT-IR) |
|---|---|---|
| Analysis Speed | Seconds (<10 seconds) [12] | Minutes to Hours [9] |
| Sample Preparation | None typically required [12] | Often extensive (e.g., dissolution, filtration) [10] |
| Sample Integrity | Non-destructive [11] [13] | Destructive or consumptive |
| Through-Container Capability | Yes (through glass, plastic packaging) [12] | No |
| Operational Cost | Lower (no consumables, reduced lab fees) [11] | Higher (reagents, lab fees, personnel time) |
| Skill Requirement | Lower (intuitive software, one-click operation) [12] | Higher (requires trained analysts) |
| Data Integrity | 21 CFR Part 11 compliant software available [14] [9] | Varies by system |
Table 2: Quantitative Performance Metrics in Pharmaceutical RMID
| Parameter | Performance Metric | Context & Benefit |
|---|---|---|
| Measurement Time | < 10 seconds [12] | Enables real-time decision-making at goods receipt. |
| Regulatory Compliance | U.S. FDA GMP, 21 CFR Part 11 [9] | Meets stringent pharmaceutical quality standards. |
| Market Growth (CAGR) | ~7.7% (2025-2032) [15] | Indicates strong industry adoption and validation. |
| Method Agreement | No significant difference vs. benchtop [10] | Ensures field data is lab-grade; supports method validation. |
Speed and Operational Efficiency
The primary driver for adopting portable Raman is the dramatic reduction in analysis time. Traditional workflows require collecting samples, sending them to a control laboratory, and waiting for results, a process that can take hours or days and adds significant costs [9]. Portable Raman spectrometers eliminate this bottleneck by providing on-the-spot identification in seconds, directly at the point of need—be it the warehouse receiving bay or the production line [12]. This speed translates directly into reduced downtime, faster release of materials, and leaner manufacturing operations.
Non-Destructiveness and Through-Container Analysis
Portable Raman spectroscopy is a non-destructive technique, meaning the analyzed sample remains intact and available for further testing or release for production [11] [13]. This preserves valuable raw materials and is essential for auditing and forensic applications.
A critical extension of this non-destructiveness is the ability to perform through-container analysis. The Raman signal can penetrate transparent or translucent packaging such as glass vials and plastic bags, allowing for identification without breaking the seal [12]. This capability:
- Prevents Contamination: The integrity of the sterile material is maintained.
- Enhances Safety: Operators are not exposed to potentially hazardous substances.
- Increases Efficiency: Eliminates the time and effort required to open and re-package samples.
Experimental Protocols
This section provides a detailed methodology for implementing portable Raman for RMID, from instrument qualification to specific through-container testing protocols.
Protocol 1: Standard Operating Procedure for Raw Material Verification
Objective: To confidently identify a raw material (e.g., an Active Pharmaceutical Ingredient (API) or excipient) using a portable Raman spectrometer.
Workflow Overview of Raw Material Identification (RMID)
Materials and Equipment:
- Portable Raman Spectrometer (e.g., Rigaku Progeny, Metrohm i-Raman NxG, IndiRAM)
- Certified reference standards of the raw material
- Appropriate containment (e.g., glass vial, sample holder)
- Personal Protective Equipment (PPE)
Procedure:
- Instrument Setup: Power on the portable Raman spectrometer. Allow the laser to warm up as per the manufacturer's instructions. Perform a quick performance validation (e.g., using a built-in standard) to ensure the instrument is functioning correctly.
- Sample Presentation:
- For direct analysis: Place a representative sample of the raw material in a suitable glass vial or on a non-fluorescent surface.
- For through-container analysis: Ensure the sealed container is clean and the laser window is clear.
- Spectral Acquisition: Point the spectrometer's probe at the sample. Ensure a good contact or a consistent stand-off distance. Activate the measurement. A typical acquisition time is 5-10 seconds [12]. The instrument's software will display the collected Raman spectrum in real-time.
- Data Analysis and Library Matching: The instrument's software automatically compares the acquired spectrum against a pre-loaded library of reference spectra. This library should contain spectra of all approved raw materials.
- Result Interpretation: The software provides a match score (e.g., Hit Quality Index - HQI). A result above a pre-defined threshold confirms the identity of the raw material. The result is logged, often with date, time, and user stamps for compliance.
Protocol 2: Through-Container Verification of Solvents
Objective: To identify a chemical solvent (e.g., Ethanol, Methanol, Isopropanol) directly through its sealed glass bottle.
Materials and Equipment:
- Portable Raman Spectrometer
- Sealed glass bottles containing solvents
- Solvent reference spectra library
Procedure:
- Safety Check: Visually inspect the sealed container for any leaks or damage.
- Instrument Alignment: Position the spectrometer probe perpendicular to the surface of the glass bottle to minimize signal reflection and distortion.
- Background Measurement (Optional): Some protocols may recommend taking a background spectrum of an empty area of the container or a similar empty container to account for the packaging signal.
- Spectral Acquisition: Place the probe tip against the glass and acquire the spectrum. The laser will penetrate the glass, interact with the solvent, and the scattered light will be collected back through the container.
- Library Matching and Interpretation: Compare the measured spectrum against the library. A successful match confirms the identity of the solvent without breaking the seal, ensuring operator safety and sample integrity [12].
The Scientist's Toolkit
Table 3: Essential Research Reagent Solutions for Portable Raman RMID
| Item | Function & Importance in RMID |
|---|---|
| Portable Raman Spectrometer | The core instrument. Key specifications include laser wavelength (e.g., 785nm, 1064nm to minimize fluorescence), resolution, and onboard spectral libraries [11] [9]. |
| Certified Reference Materials | High-purity materials used to build and validate instrument libraries. Essential for ensuring the accuracy of identification [10]. |
| Validated Spectral Library | A curated database of reference spectra for all raw materials. The integrity of the library directly determines the reliability of the RMID results. |
| 21 CFR Part 11 Compliant Software | Software that ensures electronic records and signatures are trustworthy, reliable, and equivalent to paper records, a requirement in regulated pharma environments [14] [9]. |
| Standardized Sample Containers | Consistent use of glass vials or specific plastic bags with known Raman signatures minimizes spectral interference during through-container testing [12]. |
Portable Raman spectroscopy represents a paradigm shift in pharmaceutical raw material identification. Its unparalleled speed, non-destructive nature, and unique through-container analysis capability directly address the inefficiencies and risks inherent in traditional analytical workflows. By enabling real-time, on-site verification with lab-grade confidence, this technology significantly reduces operational costs, accelerates manufacturing processes, and enhances overall supply chain security. As the market continues to grow and technologies like AI integration and IoT connectivity evolve, portable Raman spectroscopy is poised to become an even more indispensable tool in the researcher's and quality professional's toolkit, firmly supporting the industry's commitment to quality, safety, and efficiency.
Portable Raman spectroscopy has emerged as a transformative analytical technology for raw material identification in the pharmaceutical industry, driven by converging pressures for regulatory compliance and lean manufacturing efficiency. This technique provides non-destructive, rapid molecular analysis with minimal sample preparation, enabling real-time decision-making directly at the point of use. The global portable Raman spectrometer market, valued at approximately $1.2 billion in 2024, is projected to grow at a compound annual growth rate (CAGR) of 7.3% to 9.3%, reaching $2.3 to $2.5 billion by 2033 [16] [17]. This growth is largely propelled by the pharmaceutical and biotechnology sector, which accounted for the largest application share at 34.34% in 2024 [18]. Within this segment, portable Raman spectroscopy addresses two critical business needs: ensuring regulatory compliance through robust quality control and driving operational excellence through lean manufacturing principles.
Portable Raman Spectroscopy Market Landscape
The expanding adoption of portable Raman spectroscopy reflects its strategic importance across multiple industries. The broader Raman spectroscopy market, including all instrument types, was valued at $1.25 billion in 2024 and is expected to reach $2.16 billion by 2032 [18]. The handheld and portable segment represents a substantial portion of this market, generating $538.3 million in revenue in 2024 [18]. This growth trajectory underscores the technology's increasing centrality to modern quality control and process optimization initiatives.
Table: Portable Raman Spectroscopy Market Growth Projections
| Metric | 2024 Baseline | 2033 Projection | CAGR | Source |
|---|---|---|---|---|
| Portable Raman Spectrometer Market | $1.2 Billion | $2.5 Billion | 9.3% | [16] |
| Portable Raman Spectrometer Market | $1.2 Billion | $2.3 Billion | 7.5% | [17] |
| Overall Raman Spectroscopy Market | $1.25 Billion | $2.16 Billion (2032) | 7.24% | [18] |
| Handheld & Portable Segment Revenue | $538.3 Million | N/A | N/A | [18] |
Regional Adoption Patterns
Regional analysis reveals distinct adoption patterns and growth centers. North America dominated the market in 2024, holding a 36.55% share valued at $455.2 million, driven by its strong pharmaceutical and biotechnology sector and supportive regulatory environment [18]. The Asia-Pacific region is expected to witness the most rapid growth, with a projected CAGR of 8.18% during the forecast period, fueled by expanding research infrastructure, government investments in healthcare, and growing pharmaceutical manufacturing capabilities [18] [19].
Driver 1: Regulatory Compliance
Global Regulatory Frameworks
Regulatory requirements for pharmaceutical quality control represent a primary driver for portable Raman spectroscopy adoption. Major regulatory agencies worldwide have established frameworks that encourage or mandate the use of advanced analytical technologies for material verification and process control:
- United States: The U.S. Food and Drug Administration (FDA) regulates Raman spectroscopy under the Process Analytical Technology (PAT) framework and 21 CFR Part 610.14 for biologics [18]. Raman systems typically require Class II medical device classification and FDA 510(k) clearance when used for quality control [18].
- European Union: The European Pharmacopoeia (Ph. Eur.) General Chapter 2.2.48 outlines specific standards for instrument calibration, spectral resolution, and validation procedures [18]. The European Medicines Agency (EMA) supports its use through PAT guidance aligned with ICH Q8-Q11 guidelines [18].
- Japan: The Japanese Pharmacopoeia (JP) 18th edition includes a comprehensive Raman chapter mandating calibration using reference materials like polystyrene with clear validation protocols [18].
- India: The Central Drugs Standard Control Organization (CDSCO) regulates Raman spectroscopy under Good Manufacturing Practices as outlined in the Drugs and Cosmetics Act, following harmonized ICH Q8-Q11 guidelines [18].
Compliance Application Note: Raw Material Identification
Objective: To implement a compliant raw material identification protocol using portable Raman spectroscopy that meets regulatory requirements for pharmaceutical manufacturing.
Experimental Protocol:
Instrument Qualification:
Method Validation:
- Specificity: Acquire reference spectra for all approved raw materials and common adulterants
- Repeatability: Analyze each material six times to establish spectral reproducibility
- Robustness: Evaluate method performance across different environmental conditions and operators
- Limit of Detection: Establish the minimum detectable level of contamination or adulteration
Library Development:
- Create a validated spectral library for all incoming raw materials
- Include spectra from multiple lots to account for natural variability
- Incorporate common counterfeit substances specific to the supply chain
Testing Protocol:
- Scan incoming materials through transparent packaging when possible to enable non-destructive testing [20]
- For opaque packaging, utilize sample vials with consistent geometry
- Acquire spectra with appropriate integration times for adequate signal-to-noise ratio
- Compare unknown spectra against validated library using correlation algorithms
- Establish and document pass/fail criteria based on spectral match thresholds
Data Integrity:
- Implement electronic records with audit trails compliant with 21 CFR Part 11
- Maintain complete data traceability from raw material receipt through verification
- Secure spectral data with time-stamped backups
Case Example: A recent study demonstrated Raman spectroscopy's effectiveness in combating counterfeit drugs, achieving detection limits as low as 0.02 mg/mL for active pharmaceutical ingredients in oral medication syrups without complex sample preparation [20]. This capability directly supports regulatory compliance by enabling rapid screening of incoming materials for adulteration or counterfeiting.
Driver 2: Lean Manufacturing
Lean Principles and Waste Elimination
Lean manufacturing principles focus on eliminating waste and maximizing value-added activities throughout production processes. Portable Raman spectroscopy directly supports these objectives by addressing multiple forms of manufacturing waste:
- Waiting: Reduces or eliminates laboratory queue times for material identification from days to minutes
- Transportation: Entesting at point-of-use eliminates movement of samples to centralized laboratories
- Overprocessing: Streamlines identification protocols with minimal sample preparation
- Defects: Prevents formulation errors through rapid material verification
- Inventory: Enables just-in-time manufacturing by reducing raw material quarantine periods
The integration of portable Raman spectroscopy exemplifies "Lean 4.0" - the convergence of traditional lean principles with Industry 4.0 technologies to create digital, data-driven improvement cycles [21]. This approach aligns with the core lean principle of "Pull" production, where materials are only processed when needed by downstream processes [22].
Lean Manufacturing Application Note: Just-in-Time Raw Material Release
Objective: To implement a lean raw material management system that reduces inventory waste, minimizes warehouse space requirements, and supports just-in-time manufacturing through rapid material identification.
Experimental Protocol:
Value Stream Mapping:
- Document the current state material identification process, including wait times, processing times, and inventory levels
- Identify bottlenecks and non-value-added steps in the traditional laboratory analysis workflow
- Calculate total lead time from material receipt to production release
Point-of-Use Testing Station Design:
- Establish testing stations at receiving docks or production line feeding areas
- Implement 5S workplace organization for testing supplies and reference materials [22]
- Design standardized work instructions for operators
Rapid Identification Workflow:
- Train material handlers in proper sampling and measurement techniques
- Establish a single-piece flow for material verification
- Implement visual management systems for material status (e.g., color-coded labels)
Pull System Integration:
- Link material testing to production schedule demands
- Establish kanban signals for material replenishment [23]
- Integrate test results with inventory management systems
Performance Metrics:
- Track lead time reduction from material receipt to production release
- Monitor reduction in raw material inventory levels
- Measure space utilization improvements in quarantine areas
- Calculate reduction in working capital tied up in raw material inventory
Performance Outcomes: Companies implementing lean principles through technologies like portable Raman spectroscopy report significant operational improvements, including 70-90% reduction in production lead times, 25-30% lower manufacturing costs, and up to 80% fewer defects [22]. These improvements demonstrate the powerful synergy between analytical technology and lean methodologies.
The Scientist's Toolkit: Essential Research Reagents and Materials
Successful implementation of portable Raman spectroscopy for raw material identification requires specific materials and reagents to ensure accurate and reproducible results.
Table: Essential Research Reagent Solutions for Portable Raman Spectroscopy
| Item | Function | Application Notes |
|---|---|---|
| NIST-Traceable Calibration Standards | Verifies instrument wavelength accuracy and intensity | Polystyrene is most common; required for regulatory compliance [20] [18] |
| Surface-Enhanced Raman Scattering (SERS) Substrates | Enhances signal for low-concentration analytes | Enables detection limits as low as 0.02 mg/mL; essential for trace analysis [20] [18] |
| Standard Reference Materials | Validates method performance for specific applications | Use materials representative of your sample matrix; include positive and negative controls |
| Sample Vials and Containers | Consistent presentation for reproducible measurements | Transparent packaging enables non-destructive testing [20]; standardized geometry improves reproducibility |
| Cleaning Solvents | Prevents cross-contamination between samples | HPLC-grade solvents recommended; compatible with instrument components |
| Spectral Library Software | Enables automated material identification | Must be validated with specific instrument parameters; requires regular updates |
The convergence of regulatory compliance requirements and lean manufacturing principles continues to drive adoption of portable Raman spectroscopy in pharmaceutical raw material identification. The technology's ability to provide rapid, non-destructive analysis directly at the point of use addresses both quality assurance imperatives and operational efficiency goals. As regulatory frameworks increasingly recognize Raman spectroscopy as a validated analytical method, and as lean manufacturing practices demand faster decision cycles, this technology will become increasingly integral to pharmaceutical quality systems. The protocols and applications detailed in this document provide a foundation for researchers and drug development professionals to leverage portable Raman spectroscopy as a strategic tool that simultaneously ensures regulatory compliance and enables lean operational excellence.
Raman spectroscopy has evolved significantly from a specialized laboratory technique to a versatile tool for point-of-use analysis. The choice of instrument form factor—handheld, benchtop, or modular portable—directly impacts the scope, quality, and application of research outcomes. For scientists working on raw material identification (Raw Material ID), this decision is critical for balancing analytical performance with practical requirements. Handheld devices offer unparalleled portability for field use, benchtop systems deliver maximum performance in laboratory settings, and modular portable systems bridge these worlds by offering configurable components in a transportable format [24] [25].
Each form factor serves distinct roles within the research workflow. The core advantage of Raman spectroscopy itself—minimal sample preparation, non-destructive analysis, and capability to test materials through transparent packaging—is maintained across all platforms [26] [27] [28]. However, the implementation of this technology varies dramatically, affecting everything from spectral resolution and excitation wavelength options to software accessibility and regulatory compliance. This application note provides a structured framework for researchers to evaluate these critical parameters against their specific project requirements in pharmaceutical development and raw material verification.
Comparative Analysis of Raman Form Factors
The table below summarizes the key technical and operational characteristics of the three primary Raman spectrometer form factors, providing a quantitative basis for comparison.
Table 1: Technical Comparison of Raman Spectrometer Form Factors
| Parameter | Benchtop | Portable/Modular | Handheld |
|---|---|---|---|
| Primary Use Case | Laboratory-based research & development [24] [29] | Applied research, field measurements, OEM integration [30] [24] | Point-of-use identification by non-experts [24] [31] |
| Typical Size & Portability | Large, heavy, fixed location [29] | Compact, transportable between locations [30] [24] | Lightweight, battery-operated, single-hand use [24] |
| Excitation Wavelength Options | Multiple, high-powered lasers [24] [29] | Configurable (e.g., 248-1064 nm) [24] | Single wavelength (e.g., 785 nm, 1064 nm) [27] [29] |
| Spectral Performance & Sensitivity | High spectral resolution, superior signal-to-noise ratio [29] | High sensitivity, configurable for weak Raman scatterers [30] [24] | Lower-excitation wavelengths, potential for fluorescence [29] |
| Sample Coupling & Flexibility | Variety of sampling accessories [24] [29] | Fiber optic probes, various sample interfaces [24] | Integrated, point-and-shoot operation [24] [31] |
| Software & Data Access | Sophisticated software; may limit raw data access [24] | Software SDKs; often full data transparency [24] | Limited access to raw data; pre-installed libraries [24] |
| Relative Cost | High [24] | Medium [24] | Varies, generally lower cost-in-use [31] |
Application-Focused Selection Protocol
Decision Workflow for Form Factor Selection
The following diagram outlines a systematic decision-making workflow to guide researchers in selecting the optimal Raman spectrometer form factor based on their project's primary requirements.
Experimental Protocols for Raw Material Identification
Protocol 1: Raw Material Verification in a Warehouse Setting Using Handheld Raman
Purpose: To provide a rapid, non-destructive method for verifying the identity of raw materials (APIs, excipients) upon receipt in a warehouse, minimizing handling and accelerating release to manufacturing [32] [31].
Materials:
- Handheld Raman spectrometer (e.g., Agilent Vaya, BWTek NanoRam)
- Required personal protective equipment (PPE)
- Reference spectral library for expected materials
Procedure:
- Instrument Preparation: Power on the handheld instrument and allow it to complete its self-check. Authenticate user if operating in a compliant environment [27].
- Method Selection: Choose the appropriate validated method for the material to be tested from the instrument's library [29].
- Sample Presentation:
- For materials in clear packaging: Place the spectrometer probe in direct contact with the container, ensuring the laser spot will illuminate the material inside [32] [27].
- For materials in opaque packaging: Use a spatially offset Raman technique if supported, or obtain a small sample in a glass vial as per approved sampling procedures [27].
- Data Acquisition: Aim the laser at the sample and initiate measurement. Hold the instrument steady until acquisition is complete (typically 1-10 seconds) [31].
- Result Interpretation: The instrument software automatically compares the acquired spectrum to the reference library and displays a "Pass" (p-value ≥ 0.05) or "Fail" (p-value < 0.05) result [29].
- Action:
- Pass: Record the result and release material for manufacturing.
- Fail: Quarantine the material and initiate an investigation. Confirm results with an orthogonal analytical method (e.g., FTIR) in a controlled laboratory [27].
Protocol 2: High-Confidence Library Development Using Benchtop Raman
Purpose: To create a high-resolution spectral library of raw materials for use with portable and handheld instruments, leveraging the superior signal-to-noise ratio and stability of a benchtop system [27].
Materials:
- Benchtop Raman spectrometer (e.g., FT-Raman system)
- Microscope accessory for solid samples (if applicable)
- Reference standard materials from qualified vendors
Procedure:
- System Calibration: Perform wavelength and intensity calibration of the benchtop instrument using standard reference materials (e.g., silicon, cyclohexane) as specified by the manufacturer [27] [24].
- Sample Preparation:
- Powders: Present in a glass vial or compact gently in a pellet holder to ensure consistent packing density and surface topography.
- Avoid using plastic containers that may contribute interfering Raman signals [28].
- Parameter Optimization:
- Laser Wavelength/Wavenumber: Select 1064 nm to minimize fluorescence or 785 nm for higher signal if fluorescence is not an issue [27] [29].
- Laser Power: Use the minimum power required to achieve a good signal-to-noise ratio to avoid sample degradation.
- Acquisition Time: Adjust to maximize signal without saturating the detector (typically 10-30 seconds, repeated 5-10 times and averaged) [27].
- Spectral Acquisition: Collect spectra from multiple batches and lots of each material to capture natural variability. For each sample, collect spectra from at least three different spots to account for heterogeneity [27].
- Data Processing: Apply consistent preprocessing (e.g., cosmic ray removal, baseline correction, vector normalization) to all spectra before adding them to the master library [24].
- Library Validation: Validate the library by testing against known positive and negative controls to ensure specificity, particularly for chemically similar compounds (e.g., anhydrous vs. hydrate forms) [27].
Protocol 3: In-Process Monitoring Using Modular Fiber-Optic Systems
Purpose: To monitor chemical reactions or mixture homogeneity in real-time using a modular Raman system with a fiber-optic probe immersed directly in the process stream [28].
Materials:
- Modular portable Raman spectrometer with 785 nm excitation
- Immersion-style fiber-optic Raman probe with appropriate window material
- Process reactor or mixing vessel
Procedure:
- Probe Installation: Install the Raman probe into the process vessel through a standard port (e.g., NPT, Ingold fitting), ensuring the probe window is immersed in the reaction mixture and positioned to avoid direct impingement from agitators [28].
- System Configuration: Connect the probe to the modular spectrometer. In the control software, set up a continuous acquisition method with appropriate laser power and acquisition time for the expected concentration of the target analyte.
- Background Collection: Collect a background spectrum with the probe installed but before reaction initiation, to account for signal contributions from the probe window and any solvent present.
- Method Development: Using standard mixtures, develop a calibration model (e.g., using PLS regression) that correlates specific Raman band intensities or spectral changes with analyte concentration or reaction progress [28].
- Real-Time Monitoring: Initiate the process and begin continuous spectral acquisition. The software will apply the calibration model and display the concentration or conversion in real-time.
- Endpoint Determination: Monitor the target analyte concentration until it reaches the predefined endpoint specification, at which point the process can be stopped.
The Scientist's Toolkit: Essential Research Reagents and Materials
Table 2: Key Research Reagents and Materials for Raman Spectroscopy of Raw Materials
| Item | Function/Application | Key Considerations |
|---|---|---|
| Silicon Wafer | Wavenumber calibration standard [24] | The 520.7 cm⁻¹ peak provides a precise reference for instrument calibration. |
| Cyclohexane | Intensity/response calibration standard [24] | Used to correct for system-specific intensity variations across the spectral range. |
| NIST-Traceable Standards | Validation of instrument performance [27] | Required for regulated environments to demonstrate data integrity. |
| Low-Fluorescence Glass Vials | Sample containment for analysis [27] | Minimizes background fluorescence interference during measurement. |
| Raman-Compatible Sampling Accessories | Enhanced signal collection for specific sample types [31] | Includes fixtures for powders, liquids, and solids to ensure reproducible sampling. |
| Reference Standard Materials | Spectral library development [27] | Certified materials from qualified vendors ensure library accuracy and specificity. |
Selecting between handheld, benchtop, and modular Raman systems requires a strategic balance of analytical needs and practical constraints. Benchtop systems remain indispensable for method development and high-resolution analysis in controlled environments. Handheld instruments provide decisive advantages for rapid identification at the point of receipt or use, significantly reducing testing cycle times [32] [31]. Modular portable systems offer a versatile middle ground, enabling field applications and process monitoring with a degree of configurability that approaches benchtop flexibility [30] [24].
For a robust raw material identification program, many organizations find value in maintaining multiple platforms: a benchtop system for creating validated spectral libraries and troubleshooting, and handheld or modular systems for routine testing in warehouses and manufacturing environments. This integrated approach leverages the unique strengths of each form factor to create a comprehensive quality control ecosystem that is both scientifically sound and operationally efficient.
Portable Raman spectroscopy has emerged as a transformative technology for raw material identification in pharmaceutical research and development. Its ability to provide non-destructive, molecular-level verification directly at the point of need—such as incoming quality control checkpoints—significantly enhances operational efficiency while maintaining rigorous compliance with regulatory standards [33] [3]. The performance and applicability of these systems are determined by three core technological components: the spectrometer itself, the excitation laser, and the analytical software. Advances in miniaturization and computational power have enabled modern portable systems to deliver performance once exclusive to laboratory instruments, making them indispensable for today's pharmaceutical scientist [34]. This application note details these core components, provides validated protocols for raw material authentication, and outlines the essential toolkit for implementing portable Raman spectroscopy in drug development workflows.
Core Component Analysis
The effectiveness of a portable Raman system for raw material identification hinges on the synergistic integration of its physical and digital components.
Spectrometer Configurations
Portable Raman spectrometers have undergone significant miniaturization while improving signal-to-noise ratio (S/N). Their designs have evolved from briefcase-sized units to compact, handheld devices, with some modern systems now scarcely larger than a pack of playing cards [34].
Table 1: Evolution of Portable Raman Spectrometer Form Factors
| Generation | Approximate Size/Volume | Key Technological Features | Typical Spectral Resolution | Representative S/N Improvement Over 1st Gen |
|---|---|---|---|---|
| First Generation (c. 2005) | ~3420 cm³ (e.g., 30 x 15 x 7.6 cm) [34] | Reflective Čzerny-Turner design, fiber-coupled components [34] | Not Specified | Baseline |
| Second Generation | Smaller than 1st Gen [34] | Free-space optical coupling, tighter integration [34] | Not Specified | ~5x [34] |
| Current Generation | ~42 cm³ (e.g., 6.3 x 3.9 x 1.7 cm) [34] | Transmission grating designs, smartphone data systems [34] | 16-19 cm⁻¹ (for smallest units) [34] | ~10x [34] |
The primary trade-off for reduced size is often a more limited spectral range and resolution compared to benchtop systems. However, for the specific application of raw material identification, the spectral quality of modern portable instruments is typically more than sufficient for definitive chemical fingerprinting [3].
The choice of laser wavelength is a critical design parameter, as it directly influences the Raman signal intensity and the susceptibility to sample fluorescence—a common interference.
Table 2: Common Laser Wavelengths in Portable Raman Spectroscopy
| Laser Wavelength | Relative Signal Strength | Fluorescence Interference | Primary Applications & Notes | Detector Requirement |
|---|---|---|---|---|
| 785 nm | High | Moderate | Standard for most raw material identification; good balance of signal and fluorescence avoidance [3]. | Silicon-based CCD or CMOS [34] [3] |
| 1064 nm | Lower | Low | Ideal for fluorescent samples; can scan through translucent packaging [33] [35]. | InGaAs Array [34] |
| < 250 nm (Deep UV) | Varies | Low | Useful for resonance Raman studies; mitigates fluorescence but can cause sample degradation [34]. | Specialized UV Detector |
Fluorescence can overwhelm the weaker Raman signal, making identification impossible. The 1064 nm systems are particularly valuable for pharmaceutical raw materials, as they allow for non-invasive verification through translucent packaging like plastic bags lining drums, minimizing contamination risk and handling time [33] [3].
Software and Data Analysis
Modern Raman software transforms raw spectral data into actionable results through three key functions: instrument control, data processing, and chemical identification.
Advanced software packages like WiRE and Raman Data Library provide sophisticated processing algorithms including background fluorescence removal, cosmic ray artifact rejection, and noise reduction [36] [37]. For identity testing, a probability-based statistical approach is often employed. This method evaluates whether an unknown sample's spectrum lies within the multivariate domain defined by the reference spectrum and its measurement uncertainties. A resulting p-value above a set threshold (e.g., 0.05) indicates a "pass," confirming material identity [3]. This method is more robust than simple correlation coefficients, which can be misleading—for instance, glycerin contaminated with 20% diethylene glycol can still yield a high correlation (0.96) but is correctly failed by the probability test [3].
Furthermore, Artificial Intelligence (AI) and machine learning are revolutionizing spectral analysis. Recent studies demonstrate that neural networks can classify Raman spectra with accuracies exceeding 99%, offering a path to fully automated, rapid, and highly reliable identification [38] [39]. These software platforms are also designed to ensure data integrity and compliance with 21 CFR Part 11 through features like electronic signatures, audit trails, and user management [36].
Experimental Protocol: Raw Material Identification for Pharmaceutical QA
This protocol outlines the procedure for verifying the identity of incoming raw materials using a handheld Raman spectrometer, ensuring compliance with cGMP and 21 CFR Part 11.
Principle
Raman spectroscopy provides a unique molecular fingerprint based on inelastic light scattering. The spectrum of an unknown material is compared against a validated reference library. A statistical match confirms the identity of the raw material without the need to breach sealed packaging [3].
Research Reagent Solutions and Materials
Table 3: Essential Materials for Raw Material Identification
| Item | Function/Application |
|---|---|
| Handheld Raman Spectrometer | A portable unit with 785 nm or 1064 nm laser excitation and compliant software [33] [3]. |
| Validated Spectral Library | A collection of reference spectra for all raw materials to be tested, created under controlled conditions. |
| Transparent Packaging | Glass vials or 2-mil thick polyethylene bags for containing samples, allowing non-contact measurement [3]. |
| Validation Cap | Accessory with integrated ASTM-standard polystyrene for routine performance validation of the instrument [40]. |
| Laser Safety Goggles | Personal protective equipment specific to the laser wavelength of the spectrometer [40]. |
Step-by-Step Workflow
Procedure Details
- Method Selection: Using the instrument's software, select the analytical method corresponding to the raw material to be tested. This can be done via an on-screen menu or an integrated barcode scanner reading the container's ID [3].
- Sample Presentation: Position the instrument's laser aperture against the transparent external packaging (e.g., the wall of a glass vial or the polyethylene liner of a drum) containing the sample. Use any provided accessories (e.g., vial holder) to ensure consistent and correct focal distance [3].
- Automated Measurement: Initiate the measurement. The instrument's software should operate in an automatic mode, where it intelligently controls key acquisition parameters—including laser power, integration time, and number of accumulations—to achieve an optimal spectral signal-to-noise ratio in the shortest possible time. This auto-mode compensates for variables like operator positioning and minor sample fluorescence [3].
- Spectral Analysis & Match: The software automatically compares the acquired unknown spectrum against the selected reference method. The comparison uses a probability-based algorithm to calculate a p-value, representing the probability that observed differences are due to random measurement uncertainty alone [3].
- Interpretation of Results:
- Pass: If the p-value is ≥ 0.05 (or a pre-set threshold), the system confirms the material's identity. The raw material can be released for production.
- Fail: If the p-value is < 0.05, the system rejects the identity. The material must be quarantined and investigated using orthogonal analytical techniques (e.g., HPLC, FTIR).
Validation and Compliance
To ensure method robustness, libraries should be built using reference spectra acquired on multiple instruments from different production batches [3]. The system must be validated for the specific materials tested; some, like talc or certain cellulose derivatives, may exhibit weak Raman signals or high fluorescence, making them unsuitable for this technique and requiring alternative identification methods [3]. All electronic records and signatures generated by the process must be managed in a 21 CFR Part 11-compliant software environment [36].
Portable Raman spectroscopy represents a powerful, compliant, and efficient solution for raw material identification in pharmaceutical research and quality control. By understanding the capabilities and trade-offs of the core components—the spectrometer, laser, and software—scientists can effectively deploy this technology to streamline workflows, from incoming inspection to final product authentication. The integration of advanced data analysis, particularly AI-driven classification, promises to further enhance the speed, accuracy, and diagnostic power of portable Raman systems, solidifying their role as a cornerstone of modern pharmaceutical analysis.
Implementing Portable Raman for Raw Material Verification: Protocols and Use Cases
In the pharmaceutical industry, the identification of raw materials (RMID) is a critical quality control step, ensuring the safety and efficacy of final drug products. Portable Raman spectroscopy has emerged as a powerful technique for this purpose, allowing for rapid, through-container verification of materials directly at the receiving dock, thereby significantly reducing the time between receipt and release to manufacturing [27] [3] [41]. The reliability of any Raman-based identification system, however, is fundamentally dependent on the quality and robustness of the spectral library it uses for comparison [27] [42]. This application note details the best practices for developing standard reference scans to build spectral libraries that are accurate, reproducible, and fit-for-purpose in regulated environments.
Core Principles of Library Development
The Role of Specificity and Regulatory Context
For spectral libraries used in raw material identification, specificity is the paramount validation characteristic. It is defined as the ability to unequivocally identify the analyte in the presence of other components, such as impurities or excipients [41]. Raman spectroscopy is highly specific, as each chemical compound with covalent bonds produces a unique spectral fingerprint [3]. According to the United States Pharmacopeia (USP), identification tests are categorized as Category IV methods, for which specificity is the primary required validation characteristic [41]. While Raman serves as an excellent preliminary test, it is often used in conjunction with a second, well-characterized analytical procedure (e.g., HPLC or GC/MS) for complete qualification [41].
The Challenge of Instrument and Sample Variability
A robust spectral library must account for multiple sources of variability to ensure successful method transfer and long-term reliability. Key factors to consider include:
- Instrumental Factors: Laser wavelength (e.g., 785 nm vs. 1064 nm), laser power, and detector sensitivity can vary between models and manufacturers [27] [42]. The 1064 nm lasers are particularly effective at reducing fluorescence interference, a common issue with some organic compounds [27].
- Sample Factors: Physical characteristics such as particle size (e.g., in stearic acid), crystalline form (anhydrate vs. hydrate), and batch-to-batch variability from different vendors can alter spectral features [27] [43].
- Environmental Factors: The type and color of the container used for through-container measurement can affect the spectrum. Raman is generally less affected by container material than NIR spectroscopy, but it still requires validation for the specific packaging used [43] [3].
Table 1: Impact of Common Variability Sources on Raman Spectral Libraries
| Factor | Impact on Spectrum | Mitigation Strategy |
|---|---|---|
| Laser Wavelength | Different excitation can cause fluorescence; spectral features remain consistent but baselines may vary. | Select 785 nm for general use; 1064 nm for fluorescent samples [27]. |
| Particle Size | Affects light scattering; can change relative peak intensities in NIR; less impact on Raman sharp peaks [43]. | Include multiple lots with natural particle size variation in library [27]. |
| Container Material | Can introduce spectral peaks (e.g., polyethylene) or cause fluorescence (e.g., colored glass) [27] [43]. | Build library using the same container type and thickness intended for routine use [43]. |
| Material Fluorescence | Creates a sloping baseline that can obscure weak Raman peaks [27] [43]. | Use 1064 nm laser; employ baseline correction algorithms; manage scan time to avoid photobleaching [27] [3]. |
Experimental Protocol: Building a Robust Library
This protocol provides a step-by-step guide for acquiring standard reference scans for a spectral library, incorporating checks for robustness and reproducibility.
Research Reagent Solutions and Essential Materials
The following materials are critical for developing a high-quality Raman spectral library.
Table 2: Essential Materials for Raman Spectral Library Development
| Material / Reagent | Function in Library Development |
|---|---|
| Reference Standards | High-purity chemicals with a certificate of analysis (COA), traceable to compendial standards (e.g., USP), form the basis of the library [41]. |
| Representative Sample Lots | Multiple lots from different vendors capture natural variability in particle size, morphology, and minor impurities [27] [41]. |
| Standardized Containers | Vials and bags (e.g., clear glass vials, polyethylene bags) that match the packaging used in routine testing ensure spectral consistency [43] [3]. |
| Calibration Standards | Standards for wavelength and intensity verification (e.g., polystyrene) ensure instrumental performance is consistent across sessions and devices [42]. |
| Reflectance Tarps | Used for radiometric calibration in some setups to convert raw data to reflectance, standardizing for lighting conditions [44]. |
Step-by-Step Workflow for Reference Scan Acquisition
The following diagram outlines the critical stages of the spectral library development workflow.
Step 1: Planning and Sample Preparation
- Define Scope: Identify all materials to be included in the library and establish acceptance criteria for spectral quality (e.g., signal-to-noise ratio, resolution) [41].
- Select Samples: Source high-purity reference standards for each material. To ensure the library is robust, include multiple lots and, if applicable, multiple vendors to account for natural variability in parameters like particle size and impurity profiles [27] [41]. For example, different vendors of microcrystalline cellulose (MCC) or sodium carbonate can exhibit significant spectral differences due to fluorescence or background interference [27].
- Prepare Samples: Present samples in the exact same type of container used for routine testing, whether it is a clear glass vial, a polyethylene bag, or another transparent container. This ensures the library spectrum incorporates any minor contributions from the packaging [43] [3].
Step 2: Instrument Calibration and Setup
- Calibrate the Instrument: Perform wavelength and intensity calibration according to the manufacturer's specifications using certified standards before acquiring reference scans [42].
- Standardize Settings: Document and standardize key instrumental parameters including laser wavelength (e.g., 785 nm), laser power, spectral resolution, and the number of accumulations. Using the instrument's "auto-mode," which optimizes acquisition time and laser power to achieve a target signal-to-noise ratio, can be beneficial for consistency [3].
Step 3: Data Acquisition
- Acquire Multiple Scans: For each sample lot, collect a sufficient number of replicate spectra (e.g., n=10 or more) from different spots on the sample to account for heterogeneity and instrumental noise [44].
- Incorporate Robustness: To build a transferable library, acquire reference data on multiple instruments of the same model, and if possible, have different operators perform the measurements. This helps to capture and account for minor inter-instrument and inter-operator variability [3].
Step 4: Data Processing and Validation
- Preprocess Spectra: Apply consistent preprocessing steps to the raw spectral data. This typically includes smoothing to improve the signal-to-noise ratio (SNR) and applying baseline correction to remove fluorescent backgrounds [27] [44].
- Create a Representative Spectrum: For each material and lot, average the replicate scans to create a single, high-quality representative spectrum. Statistically analyze the replicates to identify and exclude any spectral outliers [44].
- Orthogonal Validation: Confirm the identity of the reference material using an orthogonal analytical technique, such as FT-IR or HPLC, to ensure the integrity of the library's foundation [27].
Step 5: Library Assembly and Documentation
- Compile the Library: Assemble the validated, averaged spectra into the library file format required by your Raman instrument's software.
- Annotate with Metadata: This is a critical step for reproducibility and compliance with FAIR (Findable, Accessible, Interoperable, Reusable) principles. Comprehensive metadata should include [42]:
- Sample information (name, source, lot number)
- Instrument parameters (laser wavelength, power, resolution)
- Acquisition settings (exposure time, number of accumulations)
- Data processing steps applied
- Operator name and date of acquisition
Quality Control and Validation
A library is only as good as its performance. Implement the following QC measures:
- Challenge Testing: Test the library against known positive and negative samples, including mixtures and adulterated samples (e.g., glycerin contaminated with diethylene glycol) [3]. A robust library should correctly identify pure materials and reject contaminants with high statistical confidence (e.g., p-value < 0.05 for rejection) [3].
- Performance Monitoring: Continuously monitor the library's performance in routine use. Track any identification failures and investigate their root causes. If a new material lot consistently fails identification despite being authentic, it may be necessary to add its spectrum to the library to capture the new range of spectral variability [27].
- Laser Wavelength: 785 nm is common, but 1064 nm is highly effective at reducing fluorescence for challenging materials like microcrystalline cellulose [27] [41].
- Laser Power: Use the minimum power required to achieve a good SNR to avoid sample degradation [3].
- Integration Time: Balance between achieving a high SNR and practical measurement time; often determined automatically by the instrument in "auto-mode" [3].
- Number of Scans: More accumulations improve SNR but increase acquisition time. A typical range is 5-20 accumulations.
Developing a robust spectral library through meticulous acquisition of standard reference scans is the cornerstone of a reliable portable Raman spectroscopy system for raw material identification. By adhering to the best practices outlined in this document—including comprehensive planning, accounting for material and instrumental variability, rigorous data acquisition, and thorough documentation—researchers and quality control professionals can create libraries that are specific, reproducible, and compliant with regulatory standards. A well-constructed library streamlines the raw material inspection process, enhances supply chain safety, and ultimately helps bring high-quality pharmaceuticals to market faster and with greater confidence.
Portable Raman spectroscopy has revolutionized raw material identification (RMID) in the pharmaceutical industry by enabling rapid, non-destructive analysis directly at the point of need, such as warehouse receiving docks [45] [46]. This shift from laboratory testing to on-site verification drastically reduces analysis time from hours to seconds, streamlines logistics, and enhances supply chain security [27] [46]. These workflows are framed within stringent regulatory requirements, including the Pharmaceutical Inspection Co-operation Scheme (PIC/S) Annex 8, which mandates identity testing on individual incoming containers rather than composited samples [45]. This application note details the comprehensive protocols and experimental methodologies for implementing portable Raman spectroscopy within a research context for pharmaceutical raw material inspection.
The on-site inspection workflow integrates procedural steps with analytical verification to ensure material identity while maintaining data integrity. Figure 1 illustrates the complete process, from container receipt to final release for production.
Figure 1: Workflow for on-site raw material identification (RMID) using portable Raman spectroscopy.
Workflow Key Steps
- Container Receipt and Documentation: The process initiates with a visual inspection of the incoming container's integrity and a review of accompanying documentation and certificates of analysis (CoA) against purchase orders [46].
- System Suitability Testing (SST): Prior to analysis, the portable Raman analyzer must undergo SST to verify instrumental performance, wavelength accuracy, and photometric linearity, ensuring data reliability [46]. Metrohm's MIRA P, for instance, uses a Calibrate/Verify Accessory (CVA) for this purpose [46].
- Non-Destructive Sampling: A significant advantage of Raman technology is its ability to analyze samples through various primary containers, including low-density polyethylene (LDPE) bags and glass containers, minimizing contamination risks and preserving sample integrity [45] [27].
- Automated Spectral Matching: The acquired spectrum from the unknown sample is compared against a validated reference spectral library. The instrument's software calculates a Hit Quality Index (HQI) value, providing a quantitative measure of spectral similarity and yielding a PASS/FAIL result [47].
- Data Integrity and Release: All results, including passed and failed measurements, are automatically recorded in a secure, encrypted audit trail compliant with 21 CFR Part 11, which mandates electronic records and signatures [47] [46]. Upon a PASS result, the material is released to production.
Experimental Protocols
Method Development and Library Building
Robust method development is foundational for reliable on-site RMID. The process, summarized in Table 1, requires careful planning and execution.
Table 1: Key Steps for Raman Spectral Library Development
| Step | Protocol Description | Critical Parameters | Considerations for Robustness |
|---|---|---|---|
| 1. Material Assessment | Evaluate the Raman activity of the target material. | Raman scattering strength, fluorescence potential. | Weak scatterers (e.g., NaCl) or fluorescent compounds may require NIR as an orthogonal technique [47] [27]. |
| 2. Standard Selection | Acquire certified reference standards from qualified vendors. | Vendor qualification, chemical purity, lot-to-lot variability. | Orthogonal techniques (e.g., FT-IR) confirm material identity and purity before inclusion in the library [27]. |
| 3. Spectral Acquisition | Collect multiple spectra from different batches and physical presentations. | Laser wavelength (785 nm, 1064 nm), exposure time, number of accumulations. | Using 1064 nm lasers can reduce fluorescence interference. Include spectra from different container types if analyzing through packaging [27]. |
| 4. Library Validation | Challenge the library with independent test sets and similar compounds. | Specificity, robustness to environmental changes. | Ensure the model can distinguish between hydrates/anhydrates and similar compounds like magnesium, calcium, and zinc stearates [45] [27]. |
| 5. Model Deployment | Transfer the final validated library to the portable analyzer. | On-board chemometrics, result interpretation. | Instruments like the Visum Palm GxP or TruScan RM use embedded algorithms to provide results to non-expert users [45] [47]. |
Specific Experimental Procedures
Protocol for Incoming Container Inspection of Organic Powders
- Objective: To verify the identity of an organic powder (e.g., an API or excipient) through its sealed LDPE bag.
- Materials: Portable Raman spectrometer (e.g., Thermo Scientific TruScan RM, Metrohm MIRA P), validated spectral library for the target material, and the incoming container [45] [46].
- Procedure:
- Perform an SST check on the Raman analyzer using a built-in reference standard [46].
- Place the analyzer's aperture flush against a single layer of the LDPE bag, ensuring no underlying labels or uneven surfaces interfere.
- Aim the laser at the powder within the bag, avoiding the bag seams.
- Initiate the pre-programmed method. A typical acquisition involves a 785 nm laser with a 2-5 second exposure time and 3-5 accumulations.
- The instrument automatically compares the acquired spectrum to the library, calculates an HQI, and returns a PASS/FAIL result.
- The result, spectrum, operator ID, and timestamp are automatically saved to the secure audit trail [47].
Protocol for Counterfeit Drug Detection
- Objective: To identify falsified or substandard pharmaceutical products in the field.
- Rationale: A tablet's Raman spectrum is a fingerprint representing the API, excipients, fillers, and coatings. Any deviation from the authentic formulation's spectrum is detectable [45].
- Procedure:
- Scan the suspect dosage form (tablet, capsule) directly or through its blister pack.
- The analyzer's software compares the spectrum to a reference library of the authentic product.
- A failure indicates a spectral mismatch, potentially revealing incorrect API, wrong dosage, or improper excipients [45].
Data Analysis and Regulatory Compliance
Data Interpretation and Handling Anomalies
Portable Raman analyzers designed for pharmaceutical use incorporate intelligent algorithms that not only perform spectral matching but also evaluate measurement uncertainty in real-time based on sample characteristics and instrument telemetry [45]. For a FAIL result, the instrument typically indicates the most likely correct identity, guiding the next steps [47].
Challenges such as fluorescence or varying signal-to-noise ratios between batches can cause false negatives [27]. Mitigation strategies include:
- Using longer wavelength lasers (e.g., 1064 nm) to minimize fluorescence [27] [6].
- Incorporating advanced deep learning models that can analyze raw spectra, potentially bypassing the need for manual preprocessing and improving robustness to spectral variations [6].
- Regularly updating spectral libraries with new vendor batches to account for acceptable material variability [27].
Regulatory Framework
Successful implementation requires adherence to a robust regulatory and data integrity framework. Table 2 outlines the core compliance components.
Table 2: Essential Regulatory and Data Integrity Requirements
| Requirement | Governing Standard / Guideline | Implementation in Workflow |
|---|---|---|
| Electronic Records & Signatures | 21 CFR Part 11 | Secure, time-stamped audit trail; user access controls with role-based privileges (e.g., Analyst, Supervisor); electronic signatures for result approval [45] [47]. |
| Raman Spectroscopy General Chapter | USP <1120>, Ph. Eur. 2.2.48 | Instrument qualification and method validation following pharmacopeial guidelines [45] [47]. |
| Sampling Requirement | PIC/S Annex 8 | Enables 100% identity testing of individual containers, moving away from composite sampling [45]. |
| Software Validation | GAMP 5 | Use of standalone, pre-validated systems (e.g., Visum Palm GxP) with embedded software to simplify qualification [47]. |
The Scientist's Toolkit
Table 3 provides an overview of essential reagents, materials, and analytical tools central to research and application development in portable Raman spectroscopy for RMID.
Table 3: Research Reagent Solutions and Essential Materials
| Item | Function / Application in Research |
|---|---|
| Polystyrene | A common reference material used for wavelength and intensity calibration of the Raman spectrometer, ensuring measurement accuracy [48]. |
| Magnesium Stearate | A frequently used pharmaceutical lubricant. A model compound for developing methods to distinguish between highly similar stearates (e.g., Ca, Zn stearates) using advanced chemometrics [45]. |
| Opadry Film Coating | Used to develop classification methods for identifying different coating formulations based on subtle spectral differences, crucial for brand protection and counterfeit detection [45]. |
| Calibrate/Verify Accessory (CVA) | A dedicated accessory (e.g., for Metrohm MIRA P) used to perform automated System Suitability Tests (SST), verifying instrument calibration and performance before use [46]. |
| Spectral Library Management Software | PC-based software (e.g., Visum Master GMP) that allows researchers to build, maintain, and validate custom spectral libraries and classification models without deep chemometrics expertise [47]. |
Comparative Analysis of Portable Technologies
While Raman spectroscopy is powerful, no single technology is universal. Table 4 compares Raman and Near-Infrared (NIR) spectroscopy, another common portable technique, to guide technology selection.
Table 4: Raman vs. NIR Spectroscopy for Pharmaceutical RMID
| Parameter | Portable Raman Spectroscopy | Portable NIR Spectroscopy |
|---|---|---|
| Principle | Inelastic light scattering; probes molecular vibrations. | Absorption of light; probes overtone and combination vibrations of C-H, N-H, O-H bonds [47]. |
| Sample Preparation | Minimal; can analyze through glass, plastic packaging. | Often requires direct contact or specific accessories; can analyze through some bags [47]. |
| Sensitivity to Water | Low (weak water signal); suitable for aqueous solutions. | High (strong water absorption); can interfere with analysis [47] [27]. |
| Key Strengths | Excellent for covalent bonds; specific spectral fingerprints; through-container analysis. | Excellent for organic functional groups; fast; high penetration depth for large bags [47]. |
| Key Limitations | Can be hindered by fluorescence; weak signal for some inorganics; requires laser safety precautions. | Less specific for similar compounds; struggles with aqueous samples; requires robust calibration models [47]. |
Portable Raman spectroscopy provides a robust, compliant, and efficient workflow for raw material identification from incoming container inspection to warehouse testing. The successful implementation of these on-site workflows hinges on rigorous method development, comprehensive library validation, and an unwavering commitment to data integrity within the regulatory framework. As technology advances with deeper instrument miniaturization [48] and the integration of artificial intelligence [6], the role of portable Raman in ensuring pharmaceutical quality and safety is poised for further growth, solidifying its value as a critical analytical technique in modern pharmaceutical manufacturing and research.
The accurate identification of raw materials is a critical quality control step in pharmaceutical manufacturing, directly impacting product safety and efficacy. Regulatory standards from the United States Pharmacopeia (USP), the European Pharmacopoeia (Ph. Eur.), and the Pharmaceutical Inspection Co-operation Scheme (PIC/S) provide a comprehensive framework for ensuring material quality and data integrity. Portable Raman spectroscopy has emerged as a powerful analytical technique that aligns with these regulatory requirements, enabling non-destructive, rapid identification of materials through sealed packaging at the point of need. This application note details the experimental protocols and compliance strategies for implementing handheld Raman spectroscopy for raw material verification within the boundaries of current and emerging pharmacopeial standards, including the newly proposed USP general chapter <1120> on ensuring the microbiological quality of articles of botanical origin.
The global regulatory landscape is evolving towards greater integration of Process Analytical Technology (PAT) and real-time monitoring. As evidenced by recent research, Raman spectroscopy is positioned to play a critical role in advancing biopharmaceutical manufacturing by resolving clinical, regulatory, and cost challenges simultaneously [49]. Furthermore, regulatory bodies are modernizing their publication formats to improve accessibility; the Ph. Eur., for instance, is transitioning to an online-only 12th Edition in June 2025, featuring a new publication model with three annual issues and a user-friendly 365-day access license [50] [51]. This shift underscores the importance of leveraging digital tools and advanced analytical technologies like Raman spectroscopy to maintain compliance in a dynamic regulatory environment.
Key Regulatory Standards and Their Applications
United States Pharmacopeia (USP) Standards
USP standards form the backbone of quality control for pharmaceutical products in the United States and many other regions. Several general chapters provide direct and indirect guidance relevant to raw material identification and microbiological quality control.
- USP <1120> Ensuring Microbiological Quality of Articles of Botanical Origin: This newly proposed chapter (previously announced as <1114>) provides information on practices to prevent and methods to treat microbiological contamination in herbal raw materials [52] [53]. It emphasizes that adherence to Good Agricultural and Collection Practices (GACP) and Good Manufacturing Practices (GMP) is the preferred method for minimizing microbial contamination, rather than relying solely on post-harvest decontamination treatments [53]. For raw material identification, this implies a need for techniques that can verify botanical identity without compromising material integrity, a need met by non-destructive Raman analysis.
- General Chapter <1116> Microbiological Control and Monitoring of Aseptic Processing Environments: While focused on the manufacturing environment, the principles of control and monitoring align with the need for robust, reliable identification of disinfectants and cleaning agents used in these areas, which can be facilitated by handheld Raman.
- General Chapter <1111> Microbiological Examination of Nonsterile Products: This chapter outlines acceptance criteria for pharmaceutical preparations, underpinning the necessity of verifying the identity and quality of all incoming raw materials to prevent contamination [52].
The following table summarizes key USP chapters relevant to raw material quality assurance:
Table 1: Key USP General Chapters for Material Quality and Microbiological Control
| Chapter Number | Chapter Title | Key Focus Area | Relevance to Raw Material ID |
|---|---|---|---|
| <1120> | Ensuring Microbiological Quality of Articles of Botanical Origin | Prevention and treatment of microbial contamination in botanicals [53] | Verifies identity of herbal materials to ensure proper handling and decontamination |
| <1111> | Microbiological Examination of Nonsterile Products | Acceptance criteria for nonsterile products [52] | Ensures raw materials meet basic quality standards for subsequent processing |
| <1116> | Microbiological Control & Monitoring of Aseptic Environments | Contamination control in manufacturing [52] | ID of disinfectants and cleaning agents used in controlled environments |
| <1115> | Bioburden Control of Nonsterile Drug Substances and Products | Bioburden control strategies [52] | Confirms identity of materials to prevent introduction of contaminants |
European Pharmacopoeia (Ph. Eur.) and PIC/S Guidelines
The European Pharmacopoeia and PIC/S guidelines provide the legal and technical foundation for quality standards and manufacturing practices in Europe and among its participating authorities worldwide.
- European Pharmacopoeia (Ph. Eur.): The Ph. Eur. is the primary source of official quality standards for medicines and their ingredients in Europe, with legally binding standards [51]. Its monographs and general chapters often include specifications for identity testing. The upcoming 12th Edition (online-only from June 2025) will feature an improved platform with powerful search tools and a "traffic light" system to easily track the status of texts (in force, no longer in force, not yet in force) [51]. This ensures that manufacturers using Raman spectroscopy for identity tests, as per specific monographs, are always using the most current standards.
- PIC/S GMP Guide (PE 009-17): PIC/S harmonizes GMP standards across its 56 participating authorities [54] [55]. The PIC/S GMP Guide, which is practically identical to the EU GMP Guide, provides overarching rules for quality assurance in manufacturing. Annex 8 of the PIC/S/EU GMP guide, which specifically addresses "Sampling of Starting and Packaging Materials," emphasizes the importance of a validated system for the identification of raw materials. It states that "The identity of a complete batch of starting material should be verified," supporting the use of representative sampling with highly specific identity testing methods like Raman spectroscopy. Furthermore, PIC/S is actively developing new annexes, such as a draft Annex 22 on Artificial Intelligence, which could future impact the use of advanced data analysis in Raman-based ID methods [54].
Table 2: European Pharmacopoeia and PIC/S Guidance Overview
| Standard / Guide | Authority | Key Focus | Relevance to Raman Material ID |
|---|---|---|---|
| European Pharmacopoeia (Ph. Eur.) | EDQM | Legally binding quality standards for APIs, excipients, and finished products [51] | Provides specific monographs requiring identity tests; Raman can be suitable for this purpose. |
| PIC/S GMP Guide, Part I | PIC/S | Basic requirements for medicinal products manufacturing [54] | Sets GMP framework requiring correct, identified materials (Chapter 5: Production). |
| PIC/S GMP Guide, Annex 8 | PIC/S | Sampling of Starting & Packaging Materials [54] | Mandates a validated system for material identification, justifying a scientific approach to sampling. |
| PIC/S GMP Guide, Annex 11 | PIC/S | Computerised Systems (under revision) [54] | Guides compliance with data integrity (e.g., ALCOA+), critical for electronic Raman data and methods. |
Portable Raman Spectroscopy: Principles and Regulatory Advantages
Raman spectroscopy is a vibrational spectroscopy technique that characterizes materials based on their unique molecular fingerprint. When a monochromatic laser light interacts with a sample, the scattered photons undergo a shift in energy (wavelength) corresponding to the vibrational modes of the molecules. The resulting Raman spectrum is a plot of the intensity of this scattered light versus the energy shift, providing a highly specific pattern for material identification [56] [57].
Portable Raman analyzers leverage this principle for point-of-need verification. They typically use a 785nm laser wavelength, which offers an optimal balance for measuring most pharmaceutical materials without causing excessive fluorescence while maintaining good spectral resolution [56]. A key advantage for raw material testing in a regulated environment is the ability to perform non-destructive analysis through sealed, transparent, and even colored opaque packaging, minimizing the risk of contamination and exposure, and significantly reducing sampling time [58].
The technique's regulatory advantages are multi-faceted. It supports data integrity and compliance with 21 CFR Part 11 through built-in features like electronic signatures and audit trails. Furthermore, it aligns perfectly with the PAT initiative encouraged by regulatory agencies for real-time quality control. By providing immediate and accurate chemical identification, it enables a robust quality control strategy that helps manufacturers confidently navigate regulatory expectations [52] [57].
Experimental Protocol: Handheld Raman for Raw Material Identity Testing
Research Reagent Solutions and Essential Materials
Table 3: Key Materials and Equipment for Raman-Based Raw Material Identification
| Item | Function/Justification |
|---|---|
| Handheld Raman Spectrometer (e.g., Agilent Vaya, Thermo Scientific TruScan G3) | Core analytical instrument; must be validated and calibrated. Capabilities for reading through colored packaging (e.g., Vaya) are advantageous [58]. |
| Validated Spectral Library | A compendial or user-built library of reference spectra for target materials. This is the benchmark for identity confirmation. |
| Standard Reference Materials | Physico-chemical standards for system suitability testing and library validation. |
| Performance Qualification (PQ) Standards | e.g., Polystyrene or Naphthalene standards, for regular verification of instrument wavelength and intensity accuracy. |
| Sealed Packaging Simulants | Transparent glass vials, plastic bags, and colored/orange sacks to simulate and validate through-container analysis [58]. |
Methodology: Instrument Qualification and Library Validation
Step 1: Instrument Qualification
- Perform Installation Qualification (IQ) and Operational Qualification (OQ) as per the manufacturer's protocols and GMP requirements.
- Before each use or series of analyses, conduct a Performance Qualification (PQ) using a certified standard (e.g., polystyrene) to verify spectral resolution and wavelength accuracy are within specified limits.
Step 2: Spectral Library Development and Validation
- For each raw material in scope, acquire reference spectra from at least three independent lots of the qualified material.
- Collect spectra through the intended packaging (e.g., glass vial, polyethylene bag) to account for any packaging interference in the final method.
- Define the spectral correlation threshold (e.g., using Hit Quality Index - HQI) for a positive identity match. This threshold must be established to discriminate between the target material and potential look-alikes or contaminants.
- The library and correlation thresholds must be validated to demonstrate the method's specificity and robustness. This includes testing against known similar materials and excipients to ensure they are not falsely identified.
Methodology: Sample Analysis Workflow
Step 1: Sample Preparation and Safety
- No sample preparation is required for through-container testing. Visually inspect the container seal for integrity.
- Follow laser safety protocols. Ensure the instrument's laser is only fired against the sample material and not into open air or reflective surfaces.
Step 2: Spectral Acquisition
- Position the handheld spectrometer probe window firmly against the sample container.
- Initiate analysis. The instrument will typically acquire an averaged spectrum from multiple short acquisitions to improve the signal-to-noise ratio. A typical acquisition time is 5-10 seconds.
Step 3: Data Analysis and Result Interpretation
- The instrument's software automatically compares the acquired sample spectrum against the validated spectral library.
- The result is displayed as a Pass/Fail (or Match/No Match) based on the pre-defined spectral correlation threshold.
- Any result failing the identity test must trigger a deviation investigation per site SOPs. The sample should be quarantined and subjected to confirmatory testing using an orthogonal method (e.g., FTIR, NIR).
The following workflow diagram illustrates the logical relationship between regulatory requirements, the experimental process, and the final quality outcome.
Diagram 1: Raman ID Workflow
Data Presentation and Compliance Reporting
The integration of handheld Raman spectroscopy generates critical quantitative data that must be structured for both operational decision-making and regulatory audits. The system's software typically captures all relevant data, but summary reports are essential for batch record review and trend analysis.
Table 4: Example Data Summary for a Raw Material Identification Run
| Material Name & Lot # | Test Date/Time | Operator ID | Spectral Match (HQI) | Pre-defined Threshold | Result | Instrument ID |
|---|---|---|---|---|---|---|
| Microcrystalline Cellulose (Lot ABX-2023) | 2025-11-24 / 08:15 | SR_01 | 0.987 | ≥ 0.950 | PASS | RAMAN-SYS-03 |
| Lactose Monohydrate (Lot CDE-2045) | 2025-11-24 / 08:22 | SR_01 | 0.992 | ≥ 0.950 | PASS | RAMAN-SYS-03 |
| Magnesium Stearate (Lot FGH-2011) | 2025-11-24 / 08:30 | SR_01 | 0.901 | ≥ 0.950 | FAIL | RAMAN-SYS-03 |
To ensure ongoing compliance, a routine monitoring program should be established. This includes periodic checks of the spectral library to ensure its continued suitability and the re-validation of methods when significant changes occur, such as a change in material supplier or packaging. Furthermore, the data integrity principles of ALCOA+ (Attributable, Legible, Contemporaneous, Original, and Accurate) must be maintained throughout the data lifecycle, from acquisition to archival. Adherence to PIC/S GMP Annex 11 on computerised systems is critical for managing electronic data and associated metadata [54].
Portable Raman spectroscopy represents a synergistic convergence of technological innovation and regulatory compliance. By implementing the detailed protocols outlined in this application note, pharmaceutical manufacturers and researchers can effectively leverage this advanced analytical tool to meet the rigorous identification requirements set forth by USP <1120>, the European Pharmacopoeia, and PIC/S GMP Annex 8. The method's speed, accuracy, and non-destructive nature directly support the core regulatory objectives of ensuring product quality and patient safety, while its data integrity features facilitate compliance in an increasingly digital and traceable manufacturing landscape. As the regulatory environment continues to evolve with initiatives like the Ph. Eur.'s digital transformation and new PIC/S annexes, the flexibility and analytical power of Raman spectroscopy will be instrumental in building robust, future-ready quality control systems.
Spatially Offset Raman Spectroscopy (SORS) represents a significant advancement in analytical spectroscopy, enabling non-invasive chemical analysis of materials concealed within opaque packaging. This application note details the principles, methodologies, and practical protocols for implementing SORS technology within a research framework focused on raw material identification. The ability to analyze contents without breaching packaging integrity offers transformative potential for pharmaceutical manufacturing, security screening, and quality control processes, reducing contamination risks and analytical timeframes while improving safety protocols.
Traditional Raman spectroscopy is a powerful analytical technique capable of providing molecular fingerprints of materials. However, its utility is limited to surface analysis or samples within transparent containers, as it cannot penetrate opaque barriers effectively. Spatially Offset Raman Spectroscopy (SORS) overcomes this limitation through a sophisticated photon migration approach that selectively probes subsurface layers [59].
The fundamental innovation of SORS lies in its ability to separate laser illumination and collection points by a spatial offset distance (ΔS). This spatial separation leverages differential photon migration behavior: photons traveling through deeper sample layers undergo greater lateral scattering before re-emerging at the surface compared to photons interacting only with surface layers. Consequently, collecting Raman signals at offset positions from the illumination point enriches the spectral contribution from subsurface materials while suppressing interference from surface layers and packaging materials [59]. This capability is particularly valuable for pharmaceutical applications where raw materials often arrive in multilayer opaque packaging such as paper sacks and colored plastic containers.
Principles and Instrumentation
Theoretical Foundation
SORS operation is governed by photon migration theory within turbid media. When laser light illuminates a sample, photons undergo multiple scattering events. The key principle is that photons penetrating to deeper sample layers experience more scattering events, causing them to emerge at the surface further from the original illumination point. By systematically varying the spatial offset between illumination and collection points, researchers can effectively "tune" the sampling depth and preferentially collect signals from different subsurface layers [59].
The relationship between spatial offset (ΔS) and sampling depth (ΔH) enables depth profiling capabilities. At zero spatial offset (ΔS=0), the collected signal is dominated by surface layers and packaging materials. As ΔS increases, the relative contribution from deeper layers becomes more pronounced because surface signal intensity decays more rapidly with increasing offset than subsurface signals. This differential decay rate enables mathematical reconstruction of pure component spectra from individual layers within a packaged material [59].
Instrumentation Configurations
Several SORS configurations have been developed for different application scenarios:
- Standard SORS: Utilizes a single-point illumination with collection at multiple offset positions or vice versa. This configuration is ideal for non-contact measurements at distances [59].
- Inverse SORS: Employs ring-shaped illumination with central collection, offering enhanced sensitivity and reduced spectral distortion potential. This approach provides better control over effective illumination area and spatial offset, minimizing sample heating [59].
- Tilted SORS: Uses a simplified optical arrangement with high detection sensitivity, offering easier implementation with conventional instrumentation [59].
Commercial implementations such as See-Through Raman Technology (STRaman) are now available on portable and handheld systems with both 785 nm and 1064 nm excitation lasers. These systems feature enlarged sampling areas that decrease power density, preventing sample damage while improving signal from deeper layers [60].
Research Reagent Solutions and Materials
Table 1: Essential Research Materials and Their Functions in SORS Experiments
| Material/Reagent | Function in SORS Research |
|---|---|
| Pharmaceutical Raw Materials (e.g., APIs, Excipients) | Target analytes for identification through packaging; strong Raman scatterers preferred (e.g., amino acids like phenylalanine) [27]. |
| Opaque Packaging Materials | Substrate for method development; includes white PE bottles, multi-layer kraft paper sacks, manila envelopes, and colored plastics [60]. |
| Low-Density Polyethylene (LDPE) Bags | Transparent packaging control; enables method validation against traditional through-packaging Raman [3]. |
| Brown Kraft Paper Sacks | Challenging fluorescent packaging; requires 1064 nm excitation to overcome strong fluorescence background at 785 nm [60]. |
| Raman Standards (e.g., Tartaric Acid) | Method validation controls; materials with known spectral features and variable fluorescence between batches [27]. |
Experimental Protocols and Methodologies
SORS Method Development for Raw Material Identification
Objective: Develop a validated SORS method for identifying pharmaceutical raw materials through opaque packaging.
Materials and Equipment:
- Handheld or portable Raman spectrometer with SORS capability (785 nm or 1064 nm excitation)
- Target raw materials (e.g., active pharmaceutical ingredients, excipients)
- Opaque packaging (multi-layer paper sacks, colored plastic containers)
- Reference standards for library development
- Computer with spectral analysis software
Procedure:
Library Development:
- Collect reference spectra of raw materials using direct measurement in transparent containers (e.g., glass vials) or through thin polyethylene bags [3].
- For each material, acquire multiple spectra from different batches to account for natural variability.
- Evaluate materials for Raman activity and fluorescence background. Strong Raman scatterers with conjugated systems (e.g., phenylalanine) are preferred over weak scatterers (e.g., sodium hydroxide) [27].
- Incorporate spectra from packaging materials alone to enable spectral subtraction algorithms.
SORS Parameter Optimization:
- Determine optimal spatial offset distances (ΔS) for target packaging configurations through systematic testing.
- For standard SORS, test offset distances from 0 mm to 5 mm in increments of 0.5 mm.
- For inverse SORS, vary illumination ring diameter while maintaining central collection.
- Optimize laser power and integration time to maximize signal-to-noise ratio while preventing sample photodamage.
Through-Packaging Measurement:
- Position spectrometer probe perpendicular to packaging surface, maintaining consistent pressure and distance.
- Acquire spectra through intact packaging using predetermined optimal SORS parameters.
- Perform multiple measurements at different positions to account for material heterogeneity.
- For challenging materials exhibiting fluorescence, employ 1064 nm excitation to minimize fluorescent background [60].
Figure 1: SORS Experimental Workflow for Raw Material Identification
Data Analysis and Validation Protocol
Spectral Processing:
- Apply baseline correction to remove fluorescent background contributions.
- For SORS measurements, employ multivariate curve resolution (MCR) or similar algorithms to separate signal contributions from packaging and contained material [59].
- Use scaled subtraction techniques to isolate sample spectrum from packaging interference [60].
Material Identification:
- Compare processed unknown spectra against reference library using correlation algorithms or probability-based matching.
- Implement hit quality index (HQI) thresholding (typically >85) with margin requirements (>2) between first and second hits to ensure reliable identification [60].
- For probability-based systems, use p-value thresholds (typically >0.05) to determine positive identification [3].
Validation:
- Challenge methods with samples from multiple vendors and batches to ensure robustness against material variability.
- Test specificity using chemically similar compounds and mixtures to verify discrimination capability.
- Verify method performance across multiple instruments to demonstrate transferability.
Application Data and Performance Metrics
Table 2: SORS Performance for Raw Material Identification Through Opaque Packaging
| Material | Packaging Type | Excitation Wavelength | Identification Performance | Key Challenges |
|---|---|---|---|---|
| Sodium Benzoate | White PE Bottle | 785 nm | Positive ID with high HQI [60] | Minimal; standard SORS application |
| Trisodium Phosphate | 2-ply Brown/White Kraft Paper | 1064 nm | Positive ID (HQI >85) [60] | Strong fluorescence with 785 nm excitation |
| Calcium Carbonate | Multi-layer Paper Bags | 1064 nm | Positive ID [60] | Strong Raman scatterer; easier detection |
| Microcrystalline Cellulose | Various Opaque Packagings | 785 nm/1064 nm | Variable (vendor-dependent) [27] | Weak Raman scatterer; fluorescence variability |
| Tartaric Acid | Plastic Containers | 785 nm | Variable (batch-dependent) [27] | Fluorescence differences between batches |
Advanced Applications and Future Directions
The applications of SORS extend well beyond pharmaceutical raw material identification. The technology has demonstrated significant utility in security screening for detecting concealed explosives, medical diagnostics for non-invasive bone disease monitoring, artwork authentication, and food safety evaluation [59]. Recent developments also include applications in recycling, where SORS can identify post-consumer plastics through colored packaging for efficient sorting [61].
Future advancements in SORS technology focus on several key areas:
- Enhanced portability and miniaturization for field deployment
- Improved algorithms for real-time spectral separation and analysis
- Integration with complementary techniques such as spatially offset offset Raman spectroscopy for increased sensitivity
- Expansion to new application domains including biomedical diagnostics and forensics
Spatially Offset Raman Spectroscopy represents a paradigm shift in analytical testing methodologies, particularly for pharmaceutical raw material identification. Its ability to non-invasively verify material identity through opaque packaging significantly streamlines supply chain processes, reduces contamination risks, and enhances operational efficiency. The protocols and applications detailed in this document provide researchers with a foundation for implementing SORS technology within their quality control and research frameworks. As instrumentation continues to evolve and applications expand, SORS is poised to become an indispensable tool for analytical scientists across multiple industries.
Application Note: Counterfeit Drug Detection
The global pharmaceutical market faces a significant and growing threat from counterfeit medicines, with the World Health Organization estimating that countries spend over $30 billion annually on substandard and falsified medical products [62]. Counterfeit drugs may contain incorrect ingredients, improper dosages, no active ingredients, or harmful contaminants, posing severe risks to patient safety and public health [62] [29]. Portable Raman spectroscopy has emerged as a powerful analytical technique for rapid, on-site identification of counterfeit pharmaceutical products throughout the supply chain, from manufacturing facilities to border control points [29] [63].
The technique is particularly valuable for identifying counterfeit biologics and high-cost therapeutics, which are increasingly targeted by counterfeiters. Recent cases have involved falsified versions of GLP-1 receptor agonists (e.g., semaglutide), botulinum toxins, monoclonal antibodies (e.g., bevacizumab), and various hormones [62]. Portable Raman instruments enable rapid screening of these products without the need for sample preparation or destruction, making them ideal for field-based authentication [63].
Experimental Protocol for Counterfeit Detection
Materials and Equipment:
- Portable Raman spectrometer (785 nm or 1064 nm excitation)
- Authentic reference standard of the pharmaceutical product
- Spectral library software with search algorithms
- Optional: vial holder for liquid samples, point-and-shoot tip for solid dosage forms
Procedure:
Instrument Calibration: Perform wavelength and intensity calibration according to manufacturer specifications using built-in reference standards [27].
Reference Spectrum Collection:
- Obtain authentic product from verified supply chain
- Scan through original packaging if possible (blister packs, vials) using appropriate instrument settings
- Collect multiple spectra from different lots to account for natural variability
- Store reference spectrum in library database with appropriate metadata [27]
Sample Analysis:
- Position portable Raman spectrometer directly on sample or packaging
- For 785 nm systems: Use ~300 mW laser power with 1-10 second integration time
- For 1064 nm systems: Use ~300 mW laser power with 5-30 second integration time to compensate for reduced scattering efficiency [63]
- Collect 3-5 spectra from different positions on the sample
Spectral Comparison:
- Compare sample spectra to reference library using correlation algorithms or principal component analysis
- Examine specific API peaks for presence/absence and relative intensity
- Check for unexpected excipient peaks or missing formulation components [29]
Interpretation:
- Match scores above 0.95 (p-value > 0.05) typically indicate authentic products
- Match scores below 0.90 (p-value < 0.05) suggest potential counterfeit
- Visually inspect spectra for API peak presence and excipient pattern consistency [29]
Technical Notes:
- 1064 nm excitation significantly reduces fluorescence interference common in pharmaceutical formulations [63]
- Testing through packaging requires background subtraction of packaging material spectrum [63]
- For coated tablets, ensure laser penetration through coating by verifying API peak detection [63]
Data and Results
Table 1. Performance Comparison of Portable Raman Systems for Counterfeit Detection
| Parameter | 785 nm System | 1064 nm System |
|---|---|---|
| Excitation Wavelength | 785 nm | 1064 nm |
| Detector Type | CCD | InGaAs |
| Laser Power | 300 mW | 300 mW |
| Fluorescence Interference | Significant for many samples | Greatly reduced |
| Spectral Quality | Fluorescence may obscure Raman peaks | Enhanced Raman specificity |
| Measurement Through Packaging | Possible with thin containers | Effective through various packaging materials |
| Example: Orlistat Capsules | High fluorescence, poor peak definition | Clear Raman features, minimal fluorescence |
| Example: Amoxicillin in Glass Vial | Strong fluorescence from glass | Clear API spectrum through packaging |
Data compiled from experimental comparisons [63]
Application Note: Excipient Verification of Raw Materials
Pharmaceutical raw material identification is a critical good manufacturing practice (GMP) requirement to ensure product quality and patient safety [5] [27]. Portable Raman spectroscopy provides rapid, non-destructive identification of diversely sourced raw materials directly in warehouse environments, significantly reducing testing cycle times compared to traditional laboratory methods [27]. The technique is particularly valuable for identifying excipients and active pharmaceutical ingredients (APIs) through their molecular fingerprints without sample preparation [5].
Material verification using portable Raman systems has been widely adopted for incoming raw material inspection, quality control during manufacturing, and lean processing initiatives [5]. The method's ability to test materials through transparent packaging further enhances efficiency while minimizing exposure risks and potential contamination [27].
Experimental Protocol for Raw Material Identification
Materials and Equipment:
- Handheld Raman analyzer with 1064 nm excitation recommended
- Barcode scanner for sample tracking
- Customizable reporting software
- Representative samples from qualified vendors
- Appropriate containers (LDPE bags, glass vials)
Procedure:
Method Development:
- Evaluate material Raman activity (strong, medium, or weak scatterer)
- Assess fluorescence background with different excitation wavelengths
- Determine optimal sampling technique (direct contact, through container)
- Establish spectral range and acquisition parameters [27]
Library Development:
- Collect spectra from multiple lots and vendors to capture natural variability
- Include different container types if testing through packaging
- Establish pass/fail thresholds using statistical measures (p-value > 0.05 for pass)
- Validate library specificity against similar materials (e.g., hydrates vs. anhydrates) [27]
Warehouse Testing:
- Login with administrator-controlled credentials
- Scan material barcode for sample tracking
- Position analyzer against sample or container
- Acquire spectrum using predefined method parameters
- Review automatic pass/fail result based on library matching [5]
Result Documentation:
- Save spectrum with metadata (timestamp, operator, sample ID)
- Generate customizable report with match score and graphical data
- Flag borderline results for secondary verification [5]
Technical Notes:
- Strong Raman scatterers: conjugated compounds, aromatic rings (e.g., phenylalanine at ~1000 cm⁻¹)
- Weak Raman scatterers: microcrystalline cellulose, hydroxides (e.g., O-H stretch in NaOH)
- For fluorescent materials, switch to 1064 nm excitation or implement baseline correction algorithms [27]
- When testing through packaging, account for signal contributions from container materials [27]
Data and Results
Table 2. Method Robustness Factors for Raw Material Identification
| Factor | Considerations | Mitigation Strategies |
|---|---|---|
| Material Variability | Different vendors, batch-to-batch variation | Include multiple lots in reference library, establish acceptable variability ranges |
| Fluorescence | Impurities, transition metals | Use 1064 nm excitation, implement baseline correction, source alternative vendors |
| Packaging Interference | Signal contributions from containers | Test through consistent packaging types, use background subtraction |
| Environmental Conditions | Ambient light, temperature fluctuations | Use protective shrouds, establish environmental controls |
| Operator Training | Consistent positioning, pressure application | Standardized training, use of positioning fixtures |
Data compiled from method development studies [27]
Application Note: High-Throughput Screening
High-throughput screening (HTS) is essential in modern drug discovery and development workflows, requiring rapid analytical techniques that can keep pace with automated synthesis and biological testing [64]. Traditional methods such as HPLC and mass spectrometry, while highly specific, are relatively slow and destructive, creating bottlenecks in screening pipelines [64]. Raman spectroscopy has recently emerged as a viable non-destructive alternative for HTS applications, with technological advances enabling complete analysis of 96-well plates in under one minute [64].
The 2025 introduction of dedicated Raman plate readers specifically designed for pharmaceutical applications represents a significant advancement in this field [65] [64]. These systems combine the molecular specificity of Raman spectroscopy with the throughput requirements of modern drug discovery, enabling real-time monitoring of reactions and processes without sample destruction [64].
Experimental Protocol for High-Throughput Screening
Materials and Equipment:
- Raman plate reader (e.g., PoliSpectra RPR system)
- 96-well plates appropriate for Raman analysis
- Automated liquid handling system
- Plate heater for temperature control
- Integration software with OPC-UA or REST API interfaces
Procedure:
System Configuration:
- Integrate Raman plate reader with automated liquid handling or robotic arm microplate loaders
- Establish communication between systems using OPC-UA or REST API protocols
- Configure method parameters for rapid scanning (≤1 minute per 96-well plate) [64]
Method Development:
- Define spectral acquisition parameters (laser power, integration time, spectral range)
- Establish baseline correction and normalization protocols
- Develop multivariate models for specific applications (reaction monitoring, protein stability)
- Validate method specificity and reproducibility [64]
Plate Analysis:
- Load plate using automated system
- Initiate non-destructive Raman analysis through plate reader software
- Monitor reaction progress in real-time with optional plate heater for temperature control
- Transfer data to central repository for processing [64]
Data Processing:
- Apply chemometric models for component identification and quantification
- Generate heat maps for visual representation of plate heterogeneity
- Export results to laboratory information management systems (LIMS)
- Flag outliers for further investigation [64]
Technical Notes:
- Raman HTS provides streamlined alternative to MS, HPLC, and IR processes
- Non-destructive analysis enables additional testing on same samples
- Rapid plate reading and transfer supports live process monitoring
- Significant capital expenditure (CAPEX) savings compared to traditional destructive methods [64]
Data and Results
Table 3. Comparison of Analytical Techniques for High-Throughput Screening
| Technique | Throughput (96-well plate) | Destructive | Quantitative Capability | Molecular Specificity |
|---|---|---|---|---|
| Raman Plate Reader | <1 minute | No | Semi-quantitative | High (molecular fingerprints) |
| HPLC | 30-60 minutes | Yes | Excellent | High |
| Mass Spectrometry | 10-30 minutes | Yes | Excellent | High |
| IR Spectroscopy | 2-5 minutes | No | Semi-quantitative | Moderate |
Data adapted from HORIBA technical specifications and application notes [64]
The Scientist's Toolkit: Essential Research Reagent Solutions
Table 4. Key Research Reagent Solutions for Portable Raman Applications
| Item | Function | Application Notes |
|---|---|---|
| Portable Raman Spectrometer (1064 nm) | Chemical identification with reduced fluorescence | Essential for fluorescent pharmaceuticals; cooled InGaAs detector recommended [63] |
| Portable Raman Spectrometer (785 nm) | General chemical identification | Higher scattering efficiency but prone to fluorescence; CCD detector [29] |
| Spectral Library Software | Reference spectrum matching | Customizable libraries with vendor-specific materials; p-value statistical testing [29] [27] |
| Barcode Scanner Integration | Sample tracking and chain of custody | Critical for GMP compliance and documentation [5] |
| Customizable Reporting Software | Result documentation and regulatory compliance | Generate audit trails for quality systems [5] |
| Vial Holders and Positioning Fixtures | Reproducible sampling geometry | Minimize operator-induced variability [27] |
| Background Subtraction Algorithms | Packaging interference minimization | Essential for testing through blister packs, glass vials [63] |
Workflow Visualization
Counterfeit Drug Detection Workflow
Counterfeit Detection Workflow
Raw Material Identification Workflow
Raw Material Identification Workflow
High-Throughput Screening Workflow
High-Throughput Screening Workflow
Overcoming Practical Challenges: Fluorescence, Sampling, and Data Analysis
Raman spectroscopy is a powerful analytical tool that provides a unique molecular "fingerprint" for the identification and characterization of materials. However, a significant challenge in obtaining high-quality Raman spectra is fluorescence interference, where fluorescence emissions from a sample can raise the spectral baseline and, in severe cases, completely obscure the weaker Raman signals [66]. This interference is particularly problematic for fluorescent samples such as pharmaceuticals, pigmented materials, biological tissues, dyes, and oils [67] [68]. For researchers utilizing portable Raman spectroscopy in raw material identification, fluorescence can severely compromise the reliability of results, leading to false negatives or difficulties in matching spectra against reference libraries [5] [27].
The fundamental difference between Raman scattering and fluorescence lies in their underlying physical processes. Raman scattering is an instantaneous inelastic scattering process involving a virtual energy state, while fluorescence involves the absorption of light and subsequent emission from a real electronic excited state, which typically occurs over a longer timescale [66] [69]. Since fluorescence emission is generally independent of the excitation wavelength (following Kasha's rule), while Raman shifts are proportional to it, one of the most effective strategies to suppress fluorescence is the careful selection of the excitation wavelength [66]. This application note explores the principle of fluorescence avoidance through longer wavelength excitation, with a specific focus on the strategic use of 1064 nm lasers within the context of portable Raman spectroscopy for raw material identification in pharmaceutical development and manufacturing.
Fundamental Theory and Mechanism
The core principle behind using 1064 nm excitation for fluorescence suppression is based on the energy difference between photon-induced electronic transitions (which cause fluorescence) and vibrational transitions (which cause Raman scattering). Fluorescence typically occurs when the energy of the excitation light source induces an electronic transition within the sample [66]. Since 1064 nm laser photons possess lower energy (near-infrared region) compared to visible or UV photons, they are less likely to excite molecules to their fluorescent electronic states [68] [70]. Consequently, for many highly fluorescent materials, moving the excitation wavelength to 1064 nm pushes the excitation energy below the threshold required to populate the first excited electronic state, thereby eliminating or significantly reducing fluorescence interference [67] [68].
A critical trade-off in this approach is the reduction in Raman scattering intensity, which is approximately inversely proportional to the fourth power of the excitation wavelength (λ⁻⁴) [67] [68] [69]. This means that shifting from a 785 nm to a 1064 nm laser results in a significantly weaker Raman signal, all other factors being equal. However, advancements in instrumentation, including the use of high-throughput spectrometers and sensitive InGaAs detectors optimized for the near-infrared region, have mitigated this signal reduction, making dispersive 1064 nm Raman a viable and powerful technique [67] [68] [70].
The effectiveness of 1064 nm excitation is best illustrated through direct comparison with commonly used wavelengths. The table below summarizes the key characteristics of different laser wavelengths used in Raman spectroscopy.
Table 1: Comparison of Common Laser Excitation Wavelengths in Raman Spectroscopy
| Parameter | 532 nm | 785 nm / 830 nm | 1064 nm |
|---|---|---|---|
| Detector Type | Silicon CCD | Silicon CCD | InGaAs |
| Fluorescence Interference | High | Medium | Low |
| Raman Scattering Intensity | High | Medium | Low |
| Laser-induced Sample Damage Risk | Low | Medium | High |
| Typical Mapping Speed | Fast | Normal | Slow |
| Optimum Sample Types | Non-fluorescent organics, inorganics, semiconductors | Most common sample types | Highly fluorescent samples (dyes, pigments, colored plastics, oils, biological tissues) [68] |
Experimental data from various studies confirms this performance hierarchy. For instance, in measurements of polyether ether ketone (PEEK) plastic, Raman peaks were almost undetectable due to strong fluorescence at 532 nm excitation, weakly observable at 785 nm, but clearly resolved with a flat baseline at 1064 nm [67]. Similar results were demonstrated with cassis liqueur, where no clear Raman peaks were obtained at 532 nm or 785 nm, whereas 1064 nm excitation yielded a high-quality spectrum suitable for peak assignment and identification [67]. These findings are particularly relevant for pharmaceutical raw material identification, where excipients, active pharmaceutical ingredients (APIs), or their mixtures can exhibit similar fluorescent behavior.
Experimental Protocols for 1064 nm Raman Spectroscopy
Instrumentation Setup and Configuration
Successful implementation of 1064 nm Raman spectroscopy requires specific hardware configurations to compensate for the inherently weaker Raman signal at this wavelength. The following protocol outlines the key considerations.
Table 2: Key Research Reagent Solutions and Instrumentation for 1064 nm Raman
| Item | Function/Description | Application Note |
|---|---|---|
| 1064 nm Laser | Near-infrared excitation source; suppresses fluorescence by avoiding electronic excitation. | Power levels of 500-800 mW are common. Ensure stable output to prevent spectral artifacts [67] [70]. |
| InGaAs Detector | NIR-sensitive detector array; essential for detecting Stokes-Raman shift from 1064 nm excitation. | Cooled to reduce thermal noise. Quantum efficiency drops beyond ~1650 nm [68]. |
| NIR-Optimized Objective Lens | Microscope objective designed for high transmission in the NIR range. | Essential for Raman microscopes. Use 20x or 100x objectives designed for NIR [67]. |
| Long-Pass Edge Filter | Optical filter that blocks the intense 1064 nm laser line while transmitting the weaker Raman-shifted light. | A 1064 nm long-pass edge filter is critical for clean signal detection [67]. |
| Fenton's Reagent | Chemical pre-treatment solution (Fe²⁺/H₂O₂) to oxidize fluorescent additives in samples like plastics. | Used for sample preparation to degrade fluorescent pigments prior to measurement [71]. |
Procedure:
- Laser Alignment: Align the 1064 nm laser to ensure the beam is focused precisely on the sample. For a microscope system, use a NIR-optimized objective (e.g., 20x or 100x) [67].
- Power Calibration: Calibrate the laser power at the sample plane. Begin with lower power to avoid thermal damage, especially to biological samples or sensitive polymers, then increase as needed for a sufficient signal [70].
- Detector Optimization: Set the acquisition parameters on the InGaAs detector. Due to lower sensitivity, integration times are typically longer (e.g., 10-30 seconds or more) compared to visible Raman systems. Multiple accumulations may be required to improve the signal-to-noise ratio [68] [70].
- Spectral Acquisition: Collect the spectrum, ensuring the Raman shift range of interest falls within the detectable range of the InGaAs detector (typically up to ~3200 cm⁻¹, but verify with instrument specifications).
Sample Preparation and Pre-treatment Methods
For samples with extreme fluorescence, a pre-treatment step may be necessary. Photobleaching (prolonged exposure to laser light) can reduce fluorescence, but it is time-consuming and may alter the sample [66] [70]. As an alternative, chemical bleaching using Fenton's reagent has proven effective for samples like pigmented microplastics, which are analogues to some pharmaceutical raw materials or packaging [71].
Protocol: Chemical Pre-treatment with Fenton's Reagent for Fluorescence Reduction [71]
- Reagent Preparation: Prepare a Fenton's reagent solution. For example, a solution of FeSO₄ with a concentration of 1 × 10⁻⁶ M in an H₂O₂ matrix has been shown to be effective.
- Sample Immersion: Immerse the sample in the Fenton's reagent solution.
- Reaction Incubation: Allow the reaction to proceed under sunlight or UV light. The treatment generates reactive oxygen species (particularly hydroxyl radicals, ·OH) that oxidatively degrade fluorescent additives like pigments.
- Duration: Treatment times can vary. For colored plastic samples, maximum pigment removal rates of over 80% have been achieved within 1.5 to 18 hours, depending on the color and sample type.
- Termination and Rinsing: After treatment, remove the sample from the reagent and rinse thoroughly with ultrapure water to halt the reaction and remove any residual chemicals.
- Drying: Gently dry the sample before Raman analysis.
This pre-treatment can effectively eliminate fluorescence signals derived from additives, thereby revealing clear Raman spectra for material identification [71].
Integrated Strategy and Workflow for Fluorescence Mitigation
Selecting the appropriate fluorescence mitigation strategy requires a systematic approach based on the sample properties and analytical requirements. The following decision workflow helps guide this selection, positioning 1064 nm excitation as a solution for the most challenging samples.
Within the framework of portable Raman spectroscopy for raw material identification, managing fluorescence is critical for operational efficiency and analytical accuracy. While techniques like photobleaching and computational baseline correction are valuable, 1064 nm excitation stands out as a powerful hardware-based solution for analyzing highly fluorescent raw materials that would otherwise be intractable with shorter wavelengths. The strategic integration of 1064 nm Raman systems into the quality control workflow enables pharmaceutical scientists and drug development professionals to reliably identify a broader range of materials on-site, directly in warehouses or manufacturing suites, thus supporting lean manufacturing principles and ensuring product quality. As detector technology continues to advance, making 1064 nm systems more sensitive and cost-effective, their role in the portable analytical toolkit is poised to expand significantly.
The deployment of portable Raman spectroscopy for raw material identification in pharmaceutical development represents a significant advancement in process analytical technology. A principal challenge encountered in field-based measurements is the spectral interference and signal contribution from product containers, which can compromise the accuracy of material authentication. This application note details the sources of packaging variability and provides validated protocols to mitigate these interferences, enabling robust and reliable non-destructive testing through various packaging materials.
Understanding Packaging-Induced Spectral Interference
Packaging materials introduce spectral artifacts through two primary mechanisms: direct Raman scattering from the container material itself, and signal attenuation/fluorescence that obscures the Raman signal of the contents [27] [72]. The magnitude of interference depends on both the packaging composition and the analytical capabilities of the Raman system.
Table 1: Common Packaging Materials and Their Spectral Interference Profiles
| Packaging Material Type | Primary Interference Type | Raman Signal Strength | Fluorescence Risk | Suitable Raman Technologies |
|---|---|---|---|---|
| Clear Glass & Transparent Plastics | Minimal attenuation, distinct peaks | Low to Moderate | Low | Conventional Backscatter Raman [72] |
| Colored/Amber Glass | Beam attenuation, fluorescence | Low | High | SORS, 1064 nm systems [72] |
| White Opaque Plastics (HDPE, LDPE) | Diffuse scattering, fluorescence | Moderate | Moderate | STRaman, 785 nm systems [60] |
| Multi-layer Kraft Paper/Brown Paper Sacks | Strong fluorescence, attenuation | Variable | High | STRaman, 1064 nm systems [60] |
| Multi-layer Flexible Packaging (foils, polymers) | Complex layered interference | Variable | Variable | Depth-profiling Raman [73] |
Advanced Raman technologies have been developed specifically to address these challenges. See-through Raman (STRaman) technology utilizes an increased sampling area and enhanced signal from deeper layers to penetrate opaque packaging such as white polyethylene bottles and multi-layer paper sacks [60]. Spatially Offset Raman Spectroscopy (SORS) employs a novel geometric approach where measurements are taken at different spatial offsets from the laser excitation point, enabling the separation of container and content signals through computational processing [72].
Experimental Protocols for Mitigating Packaging Interference
Protocol 1: Library Development Accounting for Packaging Variability
Purpose: To establish a robust spectral library that accommodates normal packaging variations and prevents false negatives during identity testing.
Materials and Equipment:
- Portable Raman spectrometer (785 nm or 1064 nm excitation recommended)
- Representative raw material samples from multiple lots and suppliers
- All approved packaging types and configurations
- Spectral library management software
Procedure:
- Sample Selection and Preparation: Collect a minimum of 3-5 representative lots for each raw material from all qualified suppliers. Include materials with varying physical characteristics (e.g., particle size, crystalline form) that may affect spectral features [27].
- Reference Spectrum Acquisition:
- For each material lot, acquire reference spectra through all approved packaging configurations.
- Utilize automatic acquisition mode where the instrument optimizes exposure time, accumulations, and laser power to achieve target signal-to-noise ratio [3].
- For fluorescent materials (e.g., microcrystalline cellulose), employ special acquisition techniques such as periodic sample movement or premature termination to avoid photobleaching effects [3].
- Spectral Analysis and Library Building:
- Incorporate multiple reference spectra for each material to account for normal spectral variability.
- Establish appropriate Hit Quality Index (HQI) thresholds and match margins based on statistical analysis of spectral variance. A typical HQI threshold of 85 with a margin of 2 between first and second hits has proven effective [60].
- Validate library robustness by challenging with samples from new lots not included in the original library build.
Troubleshooting: If materials demonstrate significant fluorescence interference at 785 nm, re-acquire spectra using 1064 nm excitation, which typically produces less fluorescence [60] [27].
Protocol 2: Through-Package Measurement Using Advanced Raman Techniques
Purpose: To reliably identify raw materials through opaque and complex packaging without opening containers.
Materials and Equipment:
- Portable Raman spectrometer with STRaman or SORS capability
- Opaque packaging samples (white PE bottles, kraft paper sacks, multi-layer bags)
- Standard reference materials for validation
Procedure for STRaman Technology:
- Instrument Configuration:
- Select appropriate laser wavelength (785 nm for most opaque plastics, 1064 nm for highly fluorescent materials like kraft paper) [60].
- Position the spectrometer probe in direct contact with or immediately adjacent to the packaging surface.
- Spectral Acquisition:
- Acquire spectra using the STRaman configuration, which utilizes a larger sampling area to enhance signal from deeper layers.
- For multi-layer packaging, acquire multiple measurements at different positions to account for potential heterogeneity.
- Signal Processing and Identification:
- The STRaman algorithm automatically separates package signal contribution from the content spectrum.
- Compare processed spectrum against the established library using predefined HQI thresholds.
- Document any spectral pre-processing steps applied (e.g., baseline correction, fluorescence subtraction).
Procedure for SORS Technology:
- Measurement Geometry:
- Position the spectrometer nose cone directly opposite the material of interest, ensuring distance does not exceed ~5mm [72].
- For true SORS systems, acquire both "zero offset" and "spatially offset" measurements.
- Spectral Processing:
- The SORS algorithm automatically processes the multiple measurements to separate container and content signals.
- The resulting pure component spectrum is compared against reference libraries for identification.
Validation: Confirm method effectiveness by testing with known standards through various packaging thicknesses and compositions. Trisodium phosphate, a weak Raman scatterer, has been successfully identified through two-ply brown and white kraft paper bags using STRaman-1064 technology [60].
Table 2: Performance of Advanced Raman Technologies Through Opaque Barriers
| Technology | Excitation Wavelength | Packaging Challenge | Identification Performance | Key Applications |
|---|---|---|---|---|
| STRaman | 785 nm | White PE bottles, colored plastic, thick glass | Positive ID of sodium benzoate through white PE bottle [60] | Pharmaceutical raw materials, chemicals |
| STRaman | 1064 nm | Multi-layer brown/white kraft paper sacks | Positive ID of weak scatterers (trisodium phosphate) through 2-ply bags [60] | Warehouse incoming inspection |
| SORS | 830 nm | Yellow HDPE containers (palm oil containers) | ID of ammonium nitrate/sugar mixtures through colored HDPE [72] | Security, hazardous materials |
| SORS | 830 nm | Narcotics in post packs, brown paper, plastic wrapping | Detection of hazardous narcotics (e.g., fentanyl) through multiple barriers [72] | Law enforcement, customs |
The Scientist's Toolkit: Essential Research Reagent Solutions
Table 3: Key Research Materials and Their Functions in Method Development
| Material/Solution | Function in Experimental Protocol | Application Notes |
|---|---|---|
| Reference Standards (USP, EP) | Method qualification and validation | Use certified reference materials for library development [4] |
| Multi-lot Raw Materials | Assess material variability and library robustness | Include 3-5 lots from multiple suppliers [27] |
| Packaging Mock-ups | Simulate real-world measurement conditions | Include all approved packaging types and configurations [60] |
| Fluorescence Standards | Evaluate and optimize fluorescence mitigation | Tartaric acid, microcrystalline cellulose [27] |
| Statistical Software | Data analysis and HQI threshold determination | Implement probability-based algorithms [3] |
Material and packaging variability presents significant challenges for portable Raman spectroscopy in pharmaceutical raw material identification. Through the implementation of robust library development practices and the application of advanced spectroscopic techniques such as STRaman and SORS, researchers can effectively mitigate container interference and signal contribution issues. The protocols detailed in this application note provide a framework for reliable through-package material identification, enabling rapid raw material release in warehouse environments while maintaining data integrity and analytical confidence.
For researchers and scientists implementing portable Raman spectroscopy for raw material identification, two persistent obstacles can compromise data integrity: fluorescence interference and sample degradation. Fluorescence, a phenomenon where samples emit light upon excitation, often manifests as a broad, sloping background that can obscure the weaker, sharp Raman peaks essential for material identification [66]. Concurrently, sample degradation, particularly when analyzing sensitive biological or chemical raw materials, can result from excessive laser power, altering the sample's molecular structure and producing inaccurate spectra [74]. Within the pharmaceutical industry, where regulatory compliance demands 100% raw material inspection, overcoming these challenges is not merely advantageous but essential for ensuring product safety and efficacy [33] [75]. This Application Note delineates strategic considerations for laser wavelength and power optimization to mitigate these issues, providing detailed protocols to enhance the reliability of your Raman analyses in drug development workflows.
Theoretical Background: Fluorescence and Sample Degradation
The Origin of Fluorescence Interference
Raman scattering and fluorescence are distinct physical processes. Raman scattering involves the inelastic scattering of photons, promoting molecules to a short-lived virtual state, with the resulting energy shift providing a vibrational fingerprint of the molecule. Fluorescence, a significantly more intense process, involves the absorption of light and subsequent excitation of a molecule to a higher electronic state, from which it relaxes back to the ground state via a radiative transition that emits light [66]. A critical distinction is that the wavelength of Raman scattering is directly determined by the excitation laser wavelength, whereas fluorescence emission is generally independent of it, governed by Kasha's Rule [66] [76]. When these fluorescence emissions overlap with the Raman spectrum, they can swamp the weaker Raman signal, rendering identification impossible.
Mechanisms of Laser-Induced Sample Damage
Laser-induced sample degradation in Raman spectroscopy primarily occurs through two mechanisms:
- Photothermal Damage: Plasmonic nanoparticles or absorbing samples can efficiently convert laser energy into heat. In Surface-Enhanced Raman Spectroscopy (SERS), aggregated nanoparticles in air can easily exceed temperatures of 250°C, sufficient to melt nanorods into nanospheres within an hour, drastically diminishing the SERS signal [74].
- Photochemical Damage: The same plasmonic enhancements used for signal amplification can accelerate chemical reactions at the nanoparticle surface. Molecules capturing energetic "hot" electrons can experience bond breaking or altered vibrations, which modifies or destroys the SERS signal [74]. This is particularly critical for raw material verification of pharmaceuticals, where molecular integrity is paramount.
Optimizing Laser Wavelength to Combat Fluorescence
Wavelength Selection Strategy
The choice of laser excitation wavelength is the most effective tool for minimizing fluorescence. Because Raman shifts are constant in wavenumbers (cm⁻¹), changing the laser wavelength moves the Raman spectrum to a different absolute wavelength (nm) position, potentially away from the fluorescence emission band [66] [76].
Table 1: Laser Wavelength Performance for Fluorescence Suppression
| Laser Wavelength | Relative Raman Signal Intensity | Fluorescence Risk | Typical Applications | Considerations |
|---|---|---|---|---|
| UV (e.g., 244 nm, 325 nm) | Very High | Low (for resonant conditions) | Specific resonance Raman studies | Can cause photodegradation; requires specialized optics and detectors. |
| 457 nm | High | Variable | Strongly fluorescent samples (e.g., dyes, polymers) | Can avoid fluorescence for some samples; shorter wavelength increases scattering efficiency [76]. |
| 532 nm | High | High | General purpose for non-fluorescent samples | Common and cost-effective; often induces fluorescence in biological/organic samples [77]. |
| 633 nm | Medium | Medium | Lower fluorescence alternative to 532nm | --- |
| 785 nm | Medium | Low | General purpose for fluorescent samples; raw material ID | Excellent balance between signal and fluorescence suppression; widely used [66] [77]. |
| 830 nm | Low | Very Low | Highly fluorescent samples | --- |
| 1064 nm | Low | Very Low | Raw material ID through packaging; highly fluorescent samples | Virtually eliminates fluorescence; often used in handheld FT-Raman systems [33]. |
A study on synovial fluid analysis for gout diagnosis demonstrated the practical impact of wavelength choice. While 532 nm excitation provided greater inherent Raman signal, the significant fluorescence from the organic components either hindered signal collection or necessitated prolonged photobleaching. In contrast, the 785 nm excitation enabled feasible Raman diagnostics without extensive photobleaching, despite the reduced signal due to the 1/λ⁴ dependence of Raman scattering intensity [77]. Similarly, a 457 nm laser successfully minimized fluorescence in a nylon fiber sample where 532 nm and 785 nm lasers failed, allowing for correct database identification [76].
Experimental Protocol: Systematic Wavelength Screening
Objective: To identify the optimal laser wavelength for obtaining a Raman spectrum with minimal fluorescence from an unknown raw material sample.
Materials:
- Raman spectrometer equipped with multiple laser wavelengths (e.g., 785 nm, 1064 nm, and ideally 457 nm or 532 nm).
- The unknown raw material sample.
- A non-fluorescent standard (e.g., silicon wafer) for intensity calibration.
Procedure:
- Sample Mounting: Place the raw material sample on the microscope stage or in the sample holder. Ensure a clean, flat surface for analysis where possible.
- Initial Parameter Setting: Begin with the longest available wavelength (e.g., 1064 nm). Set the laser power to a low level (e.g., 10-25% of maximum) to prevent potential damage during initial testing.
- Spectral Acquisition:
- Focus the laser on the sample surface.
- Acquire a spectrum with a short exposure time (e.g., 1-5 seconds) and a single accumulation.
- Spectral Evaluation: Examine the acquired spectrum.
- Low Fluorescence: If the baseline is relatively flat and Raman peaks are visible above the noise, proceed to optimize power and acquisition time at this wavelength.
- High Fluorescence: If a broad, sloping fluorescence background obscures the Raman signal, proceed to the next shorter wavelength.
- Iterative Testing: Repeat steps 2-4, moving to progressively shorter wavelengths (e.g., 785 nm, 632 nm, 532 nm, 457 nm).
- Optimal Wavelength Selection: The optimal wavelength is the shortest wavelength that produces an acceptable, low-fluorescence baseline while maintaining sample integrity. This maximizes the Raman scattering intensity.
Optimizing Laser Power to Prevent Sample Degradation
Power Density Considerations
Laser power must be balanced to provide a detectable Raman signal while avoiding irreversible sample damage. The critical parameter is often power density (W/cm²) at the sample, not merely the total laser power (mW).
Table 2: Laser Power Recommendations for Different Sample Types
| Sample Type | Recommended Laser Power (Typical) | Power Density (Approx.) | Rationale & Citations |
|---|---|---|---|
| SERS Substrates (e.g., Au nanoparticles) | < 1 mW (at sample) | ~100,000 W/cm² (1 mW/μm² spot) | Prevents thermal melting of nanostructures and damage to analyte molecules [74]. |
| SERS Substrates (Commercial, e.g., Silmeco) | < 0.1 μW (at sample) | < 10 W/cm² | Manufacturer specification to avoid damage to the sensitive substrate coating [74]. |
| Dark/Colored or Absorbing Materials | Start at < 0.1 mW; increase cautiously | As low as possible | High absorption leads to rapid local heating and burning. |
| Biological Samples (e.g., Proteins, Tissues) | 1 - 10 mW (for 785 nm) | Varies with spot size | Low power preserves conformational integrity; e.g., protein spectra lose fine detail at high power [74] [78]. |
| Pharmaceutical Raw Materials (Bulk Powder) | 10 - 100 mW (for 1064 nm handheld) | Varies with instrumentation | Higher power can be tolerated by bulk samples; used for through-container verification [33] [75]. |
| In-Vivo Measurements (Skin) | Must comply with MPE limits (e.g., 3 mW/mm²) [78] | < 300 W/cm² | Regulatory safety requirement to prevent tissue damage. |
A study on protein dried on a SERS substrate showed that while increased laser power (from 2.0×10⁴ to 1.6×10⁵ W/cm²) yielded higher signal intensity, it led to the loss of distinct vibrational bands near 900 and 1500 cm⁻¹. This loss of chemical information, potentially due to conformational changes, thermal damage, or chemical reactions, is detrimental for identification and subsequent chemometric analysis [74].
Experimental Protocol: Laser Power Ramp for Sensitive Samples
Objective: To determine the maximum laser power that can be applied to a sensitive sample (e.g., a SERS substrate or dark powder) without causing degradation.
Materials:
- Raman spectrometer with calibrated and finely adjustable laser power control.
- The sensitive sample.
- A microscope camera for visual monitoring (if available).
Procedure:
- Initial Setup: Focus the laser on the desired analysis spot. Set the laser to the lowest available power setting.
- Baseline Acquisition: Acquire a spectrum with a short exposure time (e.g., 1-5 seconds). Save this spectrum.
- Visual Inspection: Use the microscope camera to closely inspect the sample spot for any visual changes (e.g., burning, discoloration, bubbling).
- Power Ramp and Acquisition: Systematically increase the laser power in small increments (e.g., 0.1 mW steps for powers under 1 mW, or 5-10% steps for higher powers). At each new power level, acquire a new spectrum and visually inspect the sample.
- Degradation Detection:
- Spectral Indicators: A sudden change in spectral features, such as the appearance of broad bands (often from carbonization), the loss of sharp Raman peaks, or a significant change in the baseline, indicates the onset of damage.
- Visual Indicators: Any visible darkening, bubbling, or physical alteration of the sample is a clear sign of degradation.
- Determine Safe Power: The safe operating power is the level immediately below the point where either spectral or visual degradation is first observed.
Additional Techniques for Fluorescence Reduction
Beyond the primary levers of wavelength and power, several other techniques can help mitigate fluorescence.
- Confocal Pinhole Optimization: In a confocal Raman microscope, closing the confocal pinhole diameter reduces the collection volume, spatially filtering out fluorescence originating from the sample volume above and below the focal plane. One study on a pharmaceutical tablet showed that decreasing the pinhole diameter from 2 mm to 50 μm exponentially increased the sensitivity (contrast) of the Raman band against the fluorescent background [66].
- Diffraction Grating Selection: Using a diffraction grating with a higher groove density spreads the polychromatic light over a larger area on the detector. This increases spectral resolution and can be used to physically exclude a fluorescence band that lies outside the spectral region of interest from being detected altogether, preventing detector saturation and improving the signal-to-noise ratio for the Raman peaks [66].
- Photobleaching: This involves pre-exposing the sample to the laser for an extended period before collecting the analytical spectrum. The prolonged exposure can permanently reduce the concentration of fluorophores in the excitation volume, thereby diminishing the fluorescence background. The downside is the extra time required and the potential risk of sample damage during the bleaching step [66] [77].
- Background Subtraction Algorithms: Software algorithms (e.g., Savitsky-Golay filters, modified polynomial fitting) can model and subtract the broad fluorescence baseline from the raw spectrum post-acquisition. This is a last resort, as it does not prevent the fluorescence from being collected and can sometimes inadvertently subtract or distort real Raman features if applied incorrectly [66] [76].
The Scientist's Toolkit: Research Reagent Solutions
Table 3: Essential Materials for Raman Spectroscopy of Raw Materials
| Item | Function/Application | Example Use-Case |
|---|---|---|
| Portable Handheld Raman Spectrometer (1064 nm) | Through-container verification of raw materials; minimizes fluorescence. | Identifying pharmaceutical raw materials through sealed plastic bags or glass vials without breaking the seal [33] [75]. |
| Commercial SERS Substrates (e.g., Gold films) | Provides massive signal enhancement for trace analysis. | Detecting low concentrations of contaminant or active ingredient in a raw material sample. |
| Multiple Laser Wavelength Module (e.g., 457, 532, 785 nm) | Enables empirical screening for the optimal excitation wavelength. | Research and method development for new, unknown raw materials that exhibit fluorescence. |
| Micro-Pipettes & Vials | Precise sample preparation and handling. | Creating standardized solutions or suspensions of raw materials for analysis. |
| Non-Fluorescent Microscope Slides | Provides a low-background substrate for sample presentation. | Mounting small quantities of powder or liquid for analysis under a Raman microscope. |
| Silicon Wafer | Provides a sharp, known Raman peak at 520.7 cm⁻¹. | Daily calibration of the Raman spectrometer's wavelength axis. |
| Neutral Density Filters | Precisely attenuates laser power without changing beam properties. | Systematically performing a "laser power ramp" test on sensitive samples. |
Successful implementation of portable Raman spectroscopy for raw material identification hinges on a strategic and empirical approach to laser wavelength and power selection. The core recommendation is to first select the longest wavelength that provides an adequate signal-to-noise ratio to circumvent fluorescence, then systemically determine the highest laser power that does not induce sample degradation. This structured methodology, leveraging the protocols and data tables provided herein, will empower researchers and drug development professionals to generate high-fidelity, reproducible Raman spectra, thereby ensuring the integrity and safety of the pharmaceutical supply chain.
Portable Raman spectroscopy has revolutionized raw material identification (RMID) in pharmaceutical development by enabling rapid, non-destructive verification directly at the loading dock or warehouse. This shift from laboratory testing to field-based analysis creates critical requirements for robust data processing solutions that can compensate for environmental variables and instrument limitations encountered outside controlled settings. Unlike traditional laboratory instruments, portable Raman systems face challenges including varying ambient light conditions, sample fluorescence, packaging interference, and the need for operation by non-specialist personnel [27] [46]. Consequently, sophisticated data processing pipelines comprising baseline correction, denoising algorithms, and chemometric models have become indispensable for transforming raw spectral data into reliable, actionable results for pharmaceutical raw material verification.
The fundamental challenge in portable Raman spectroscopy stems from the inherently weak Raman effect, where typically only 1 in 10⁶ to 10⁸ scattered photons undergo Raman scattering, creating an intrinsically low signal-to-noise ratio (SNR) [79]. This problem is further compounded by fluorescence background, cosmic ray spikes, and detector noise that can obscure the characteristic Raman fingerprint patterns crucial for material identification [27] [80]. For pharmaceutical researchers and scientists, these data processing solutions are not merely academic exercises but essential components that enable accurate verification of excipients and active pharmaceutical ingredients (APIs), detection of contaminants like diethylene glycol in glycerin, and prevention of material misidentification that could compromise drug safety and efficacy [27] [3].
Core Data Processing Algorithms and Methods
Denoising Algorithms
Denoising algorithms are essential for enhancing the signal-to-noise ratio in Raman spectra, particularly when dealing with weak scatterers or low concentrations of analytes. Traditional methods have now been supplemented by advanced deep learning approaches that offer superior performance with less parameter dependency.
Table 1: Comparison of Raman Spectral Denoising Algorithms
| Algorithm Category | Specific Methods | Key Advantages | Performance Characteristics | Limitations |
|---|---|---|---|---|
| Moving Window Smoothing | Savitzky-Golay (SG) filtering, Local Weighted Regression | Computational efficiency, simplicity | Effective for moderate noise levels; SNR improvements of 10-20 dB | Can distort sharp peaks; parameter selection critical [79] |
| Power Spectrum Estimation | Nonparametric and parametric methods | Effective for periodic noise patterns | Identifies spectrum peaks submerged in noise | Limited effectiveness for complex noise patterns [79] |
| Deep Learning-Based | Convolutional Denoising Autoencoder (CDAE), Deep Residual CNN | Automated feature learning, preserves peak integrity | SNR improvements up to 33 dB; maintains peak shapes and intensities [81] [80] | Requires substantial training data; computational intensity |
Recent advances in deep learning have demonstrated remarkable capabilities in Raman denoising. The Convolutional Denoising Autoencoder (CDAE) model incorporates additional convolutional layers in its bottleneck layer to enhance noise reduction while preserving critical spectral features [80]. This architecture uses an encoder-decoder structure where the encoder progressively reduces dimensionality through convolutional and pooling layers to extract essential features, while the decoder reconstructs the denoised spectrum through upsampling and convolutional operations. The model employs mean square error (MSE) as the loss function to minimize differences between the output and clean reference spectra [80]. For pharmaceutical applications, this approach has proven particularly valuable for preserving the intensity of characteristic Raman peaks that serve as identification markers for raw materials.
Baseline Correction Methods
Baseline correction addresses the persistent challenge of fluorescence background that often obscures the Raman signal, especially in biological samples or complex mixtures. The evolution of these methods has progressed from mathematical fitting approaches to sophisticated neural network architectures.
Table 2: Baseline Correction Methods for Raman Spectroscopy
| Method Type | Examples | Working Principle | Effectiveness | Pharmaceutical Application Suitability |
|---|---|---|---|---|
| Traditional Algorithms | Piecewise Linear Fitting, Adaptive Iteratively Reweighted Penalized Least Squares (airPLS), Iterative Polynomial Fitting | Mathematical fitting to estimate and subtract baseline | Variable; depends on baseline complexity and parameter tuning | Moderate; requires expert parameter optimization [80] |
| Convolutional Autoencoder (CAE+) | CAE+ with comparison function | Neural network learns to separate baseline from Raman signal | High; effectively handles complex baselines while preserving peak intensities [80] | High; automated operation suitable for non-specialists |
| Adversarial Networks | Baseline Recognition Networks (BRN) | Adversarial training for precise baseline estimation | High; eliminates need for manual parameter adjustment [80] | High; robust across diverse sample types |
The CAE+ model for baseline correction represents a significant advancement through its incorporation of a comparison function after the decoder, specifically designed for effective baseline correction without distorting peak intensities [80]. This is particularly crucial for pharmaceutical raw material identification, where maintaining relative peak intensities is essential for both qualitative identification and semi-quantitative analysis of mixtures or impurities. The model is trained on both simulated and experimental spectra with varying baseline profiles, learning to distinguish the Raman signal from the fluorescence background without requiring manual parameter optimization that traditionally demands specialist expertise [80].
Chemometric Models for Spectral Analysis
Chemometric models transform preprocessed spectra into reliable material identification and quantification results. These methods range from classical multivariate statistics to cutting-edge explainable artificial intelligence (XAI) approaches.
Table 3: Chemometric Models for Raman Spectral Analysis in Pharmaceutical Applications
| Model Category | Specific Algorithms | Primary Applications | Key Advantages | Interpretability |
|---|---|---|---|---|
| Classical Multivariate | Principal Component Analysis (PCA), Linear Discriminant Analysis (LDA), Partial Least Squares (PLS) | Dimensionality reduction, classification, quantification | Well-established, computationally efficient | Moderate; loadings provide some chemical insight [82] |
| Traditional Machine Learning | Support Vector Machine (SVM), Random Forest (RF) | Classification, regression | Handles non-linear relationships, robust to noise | Variable; requires additional explainability techniques [82] [83] |
| Deep Learning | Convolutional Neural Networks (CNN), Transformers, Artificial Neural Networks (ANN) | Complex pattern recognition, feature extraction | Automates feature discovery, high accuracy | Low; inherently black-box without XAI [82] [83] |
| Explainable AI (XAI) | SHAP (SHapley Additive exPlanations), LIME (Local Interpretable Model-agnostic Explanations), GradCAM | Feature importance identification, model decision explanation | Bridges AI predictions with chemical reasoning | High; identifies biologically relevant spectral features [84] [83] |
The emergence of explainable AI (XAI) has addressed a critical limitation of complex machine learning models by making their decision processes transparent and interpretable. For CNN models, GradCAM generates visual explanations by using the gradients of target concepts flowing into the final convolutional layer to produce a localization map highlighting important regions in the spectrum [83]. Similarly, for Transformer models, attention scores from the self-attention mechanisms can be leveraged to identify which spectral regions contribute most to the classification decision [83]. These XAI approaches are particularly valuable in pharmaceutical applications where regulatory compliance requires understanding the basis for material acceptance or rejection decisions [84] [83].
Experimental Protocols
Comprehensive Denoising and Baseline Correction Protocol
This protocol describes a complete workflow for preprocessing Raman spectra using deep learning approaches, suitable for pharmaceutical raw materials with varying fluorescence and noise characteristics.
Materials and Equipment:
- Raman spectrometer (portable or benchtop)
- Computer with GPU capability for model training
- Python with TensorFlow/PyTorch libraries
- Reference standards for validation (e.g., polystyrene)
- Sample materials and appropriate containers
Procedure:
Data Collection and Preparation:
- Collect multiple spectra (minimum 50-100) from each reference material to build a training dataset. Include variations in measurement conditions (different operators, environmental conditions) to enhance model robustness [46].
- For supervised learning approaches, create paired datasets of noisy and clean spectra. Clean spectra can be obtained through long acquisition times or from standard reference materials [80].
- Augment the dataset through synthetic noise addition, including Gaussian noise, spike noise (cosmic rays), and varying fluorescence backgrounds to improve model generalization [84].
CDAE Model Training for Denoising:
- Configure the CDAE architecture with an encoder comprising two convolutional layers with ReLU activation followed by 1D max-pooling layers [80].
- Implement the bottleneck with two additional convolutional layers to enhance feature learning without excessive compression [80].
- Design the decoder with upsampling layers and convolutional layers to reconstruct the denoised output at original resolution.
- Train the model using Mean Square Error (MSE) loss function with Adam optimizer, validating performance on a separate test set not used during training.
- Evaluate model performance using quantitative metrics including Signal-to-Noise Ratio (SNR) improvement, Mean Square Error (MSE), and visual inspection of peak preservation.
CAE+ Model Training for Baseline Correction:
- Implement the CAE+ architecture similar to CDAE but incorporate a comparison function after the decoder specifically designed for baseline estimation and removal [80].
- Train the model using simulated baselines combined with clean Raman spectra to create training pairs, ensuring the model learns to separate the Raman signal from various baseline types.
- Incorporate a loss function that penalizes distortion of peak intensities to maintain quantitative reliability.
- Validate the model on experimental spectra with known baseline characteristics, comparing performance to traditional methods like airPLS and polynomial fitting.
Model Integration and Validation:
- Integrate the trained CDAE and CAE+ models into a sequential preprocessing pipeline.
- Validate the complete pipeline on independent test samples including excipients, APIs, and known mixtures.
- Verify that the processed spectra maintain identification capabilities when used with existing spectral libraries and chemometric models.
Chemometric Model Development Protocol for Raw Material Identification
This protocol outlines the development of chemometric models for raw material identification, incorporating explainable AI techniques to ensure regulatory compliance and scientific understanding.
Materials and Equipment:
- Preprocessed Raman spectra dataset
- Computer with appropriate computational resources
- Python/R with scikit-learn, TensorFlow/PyTorch, and SHAP/LIME libraries
- Reference standards for validation
Procedure:
Feature Selection using Explainable AI:
- Train a Convolutional Neural Network (CNN) on the full spectral dataset for initial classification [83].
- Apply GradCAM to the trained CNN model to generate heatmaps indicating spectral regions with high relevance for classification decisions [83].
- Extract feature importance scores and select the top 10-20% of wavenumbers based on these scores for the reduced feature set.
- Alternatively, for Transformer models, utilize attention scores from self-attention layers to identify important spectral regions [83].
- Compare the performance of XAI-based feature selection against traditional methods like Principal Component Analysis (PCA) or Fisher criterion.
Classifier Development and Training:
- Divide the dataset into training (70%), validation (15%), and test (15%) sets, ensuring representative distribution of all material classes in each split.
- Train multiple classifier types on both the full spectrum and reduced feature sets, including Support Vector Machine (SVM), Random Forest (RF), and Artificial Neural Networks (ANN) [82] [83].
- Optimize hyperparameters for each model using grid search or Bayesian optimization with cross-validation.
- For deep learning models, implement appropriate regularization techniques (dropout, batch normalization) to prevent overfitting, particularly important with limited training data.
Model Interpretation and Validation:
- Apply SHAP (SHapley Additive exPlanations) or LIME (Local Interpretable Model-agnostic Explanations) to the trained models to generate human-understandable explanations for classification decisions [84] [83].
- Validate model performance using confusion matrices, classification accuracy, precision, and recall metrics.
- Establish model robustness through cross-validation and testing on independently collected datasets.
- Correlate important features identified by XAI techniques with known chemical assignments to verify biochemical plausibility.
Visualization of Workflows
Raman Data Processing and Analysis Workflow
Deep Learning Architecture for Denoising and Baseline Correction
The Scientist's Toolkit: Essential Research Reagents and Materials
Table 4: Essential Research Materials for Raman Spectroscopy Method Development
| Item/Category | Specification/Examples | Primary Function | Application Notes |
|---|---|---|---|
| Reference Standards | Polystyrene, acetonitrile, naphthalene | Instrument calibration, method validation | Essential for verifying spectral accuracy and reproducibility [82] |
| Pharmaceutical Materials | Excipients (lactose, microcrystalline cellulose), APIs | Method development, library building | Include materials from multiple vendors to capture variability [27] |
| Sample Containers | Glass vials, polyethylene bags, amber glass | Sample presentation | Enable through-container measurements; assess container interference [27] [3] |
| Data Processing Tools | Python/R with specialized libraries (scikit-learn, TensorFlow) | Algorithm implementation | Open-source platforms facilitate reproducible research [84] |
| Portable Raman Instruments | Handheld systems with 785nm or 1064nm lasers | Spectral acquisition | 1064nm systems reduce fluorescence; verify calibration regularly [27] [46] |
The integration of advanced data processing solutions has transformed portable Raman spectroscopy from a qualitative screening tool into a robust analytical technique suitable for regulated pharmaceutical raw material identification. Deep learning-based denoising and baseline correction algorithms address the fundamental challenges of spectral quality while preserving critical peak information necessary for accurate material verification. When combined with explainable AI approaches for feature selection and model interpretation, these methods create a comprehensive framework that balances predictive accuracy with scientific understanding—a crucial consideration for drug development professionals operating in regulated environments.
Future directions in Raman data processing will likely emphasize greater automation through unified platforms like SpectrumLab and SpectraML, increased integration of physical constraints through physics-informed neural networks, and enhanced multimodal data fusion capabilities [84]. For researchers and scientists implementing these solutions, the focus should remain on establishing rigorous validation protocols, maintaining data integrity throughout the processing pipeline, and ensuring that algorithmic decisions remain interpretable and traceable. As these computational methods continue to evolve, they will further solidify the role of portable Raman spectroscopy as an indispensable tool for pharmaceutical raw material identification, combining the convenience of field-based analysis with the reliability of laboratory-grade results.
In the pharmaceutical industry, the precise identification of raw materials is a critical pillar of Quality by Design (QbD) principles and robust drug product manufacturing. Variability in excipient properties, particularly for complex materials like stearates, represents a significant source of risk, potentially leading to manufacturing problems, lot rejections, and product recalls [85]. Among these, magnesium stearate (MgSt) is one of the most widely used lubricants in solid dosage forms, yet it exhibits considerable lot-to-lot and supplier-to-supplier variability [85]. This variability stems from differences in physical properties such as particle size and specific surface area, chemical properties like fatty acid composition, and the existence of multiple pseudopolymorphic hydrate forms (e.g., anhydrate (AH), monohydrate (MH), and dihydrate (DH)) [86] [85]. The hydration state of an excipient is not a mere academic distinction; it directly influences critical performance characteristics. A recent 2025 study demonstrated that the monohydrate form of magnesium stearate (MgSt-MH) showed the highest crystallinity and most stable moisture sorption profile, which correlated with significantly enhanced aerodynamic performance in dry powder inhaler formulations compared to the anhydrate and dihydrate forms [86] [87].
Portable Raman spectroscopy has emerged as a powerful tool for addressing these challenges. It allows for rapid, non-destructive, and through-container verification of raw material identity directly in the warehouse, facilitating 100% inspection and compliance with stringent regulatory guidelines like PIC/S Annex 8 [88] [5]. This application note, framed within broader research on portable Raman spectroscopy, details standardized protocols for distinguishing between similar stearates and their hydrate forms, underpinning the vital role of this technology in modern pharmaceutical quality control.
Experimental Protocols
Instrumentation and Material Preparation
Research Reagent Solutions and Essential Materials
The following table lists key materials and instruments essential for experiments aimed at differentiating stearates and their hydrates.
Table 1: Key Research Reagents and Materials
| Item Name | Function/Description | Critical Specifications/Notes |
|---|---|---|
| TruScan Handheld Raman Analyzer (or equivalent) | Primary instrument for non-destructive, through-container raw material identity verification. | 785 nm laser wavelength; Class 3B laser; Spectral range: 250-2875 cm⁻¹; IP65 rated; MIL-SPEC 810G ruggedness [88]. |
| Magnesium Stearate Hydrates | Model compounds for studying pseudopolymorph differentiation. | Supplied as anhydrate (AH), monohydrate (MH), and dihydrate (DH) from various vendors [86]. |
| Calcium Stearate | A similar stearate compound used for discrimination studies. | Used to demonstrate specificity in method development [88]. |
| Zinc Stearate | A similar stearate compound used for discrimination studies. | Used to demonstrate specificity in method development [88]. |
| TruTools Software (Optional) | Embedded chemometrics software for building custom qualitative/quantitative methods. | Enables development of advanced models for complex analysis, such as differentiating similar stearates [88]. |
| Vial Holder / Tablet Holder | Standard sampling accessories for the analyzer. | Ensures consistent positioning and measurement geometry for solid samples [88]. |
Method Development and Validation Protocol
Step 1: Spectral Library Development Collect a minimum of 20-30 spectra for each material of interest (e.g., MgSt-AH, MgSt-MH, MgSt-DH, calcium stearate, zinc stearate) using the handheld Raman analyzer. Ensure samples are from authenticated and well-characterized batches. For hydrate characterization, reference techniques like Powder X-Ray Diffraction (PXRD) and Thermogravimetric Analysis (TGA) are recommended for definitive form identification [86] [89]. Acquire spectra through common primary packaging materials (e.g., plastic bags) if this represents the intended use case. Process and average the spectra to create a reference library.
Step 2: Chemometric Model Building (For Complex Discrimination) For challenges requiring discrimination between materials with minimal spectral differences (e.g., different stearates or hydrate forms), use advanced software tools like TruTools. Develop a Principal Component Analysis (PCA) model based on the spectral library. This model will map the unique "fingerprint" of each material, allowing the analyzer to detect subtle deviations [88].
Step 3: Method Validation Validate the developed method or library by testing against a blinded set of samples. Key performance metrics to establish include:
- Specificity: The method should correctly identify all target stearates and reject incorrect materials. It should be able to distinguish, for instance, magnesium stearate from calcium and zinc stearate [88].
- Robustness: Test the method under varied but realistic conditions, such as slightly different focus distances or through packaging of varying thickness and color.
- Precision: Demonstrate that repeated analysis of the same sample yields consistent results.
Routine Operation for Raw Material Identity Verification
Step 1: Instrument Preparation Power on the handheld Raman analyzer and log in using credentialed or biometric access. Perform a system performance verification (self-test) using the provided polystyrene check sample to ensure the instrument is within calibration specifications [88].
Step 2: Sample Analysis Select the appropriate method (e.g., "Stearates Identity Test") from the instrument's menu. Position the instrument's nose cone firmly against the container (e.g., plastic bag, glass bottle) containing the raw material to be tested. If using a vial holder, ensure the sample is consistently positioned. Trigger the measurement. Analysis time is typically on the order of seconds.
Step 3: Result Interpretation and Action The analyzer will display a result, typically "PASS" or "FAIL," based on the spectral match to the reference library or chemometric model. A "PASS" confirms material identity, allowing the container to be released for production. A "FAIL" indicates a mismatch, requiring the material to be quarantined for further laboratory investigation [88]. The result, along with a full audit trail, is automatically recorded in the device.
Diagram 1: Raman-based raw material identity verification workflow. The process is non-destructive and allows for immediate release or quarantine.
Results and Data Analysis
Performance of Magnesium Stearate Hydrates
The impact of the hydrate form on pharmaceutical performance was quantitatively demonstrated in a 2025 study on dry powder inhaler (DPI) formulations. The following table summarizes the key aerodynamic performance data for two model drugs, arformoterol and budesonide, when formulated with different MgSt hydrates.
Table 2: Aerodynamic Performance of DPI Formulations with Different MgSt Hydrates [86]
| Formulation Component | Model Drug | Fine Particle Fraction (FPF) ± SD | Key Physicochemical Property of MgSt Form |
|---|---|---|---|
| MgSt Anhydrate (AH) | Arformoterol | Data not explicitly listed in result summary | Lower crystallinity, less stable moisture profile [86] |
| MgSt Monohydrate (MH) | Arformoterol | 51.02 ± 5.16% | Highest crystallinity, most stable moisture sorption, smallest particle size in formulation [86] |
| MgSt Dihydrate (DH) | Arformoterol | Data not explicitly listed in result summary | - |
| MgSt Anhydrate (AH) | Budesonide | Data not explicitly listed in result summary | Lower crystallinity, less stable moisture profile [86] |
| MgSt Monohydrate (MH) | Budesonide | 61.98 ± 4.09% | Highest crystallinity, most stable moisture sorption, smallest particle size in formulation [86] |
| MgSt Dihydrate (DH) | Budesonide | Data not explicitly listed in result summary | - |
The data clearly shows that the monohydrate (MH) form of magnesium stearate yielded the highest Fine Particle Fraction (FPF) for both drugs, a critical metric for lung deposition efficiency. This superior performance is attributed to its more stable physicochemical properties, including higher crystallinity and a more favorable moisture sorption profile, which make it a more effective force control agent [86] [87].
Discrimination of Similar Stearate Compounds
Handheld Raman spectroscopy, especially when equipped with advanced chemometric software, has proven highly effective in distinguishing between chemically similar compounds. A technical note cited for the TruScan RM analyzer specifically highlights its capability to verify and discriminate between magnesium stearate, calcium stearate, and zinc stearate [88]. This discrimination is crucial for preventing sourcing errors that could severely impact formulation performance. The underlying principle is that Raman spectroscopy examines the vibrational fingerprints of all components in a sample. Even slight deviations in composition or crystal structure, such as those caused by different metal ions or hydration states, lead to a detectable change in the resulting spectrum [88].
Discussion
The ability to accurately distinguish between different stearates and their hydrate forms is more than a quality check; it is a fundamental requirement for ensuring consistent drug product performance. The variability in MgSt, influenced by factors such as the fatty acid composition, specific surface area, and crystalline hydrate form, can directly affect critical process parameters like lubricity and, consequently, the dissolution rate and bioavailability of the final product [85]. The findings from the DPI study [86] underscore that simply conforming to a monograph for "magnesium stearate" is insufficient. The specific hydrate form, a property not typically specified in compendial standards, can be a critical performance-determining attribute.
Portable Raman spectroscopy addresses this gap by providing a "fingerprint" identity verification that is sensitive to both chemical and physical differences. Its non-destructive nature and capability for through-barrier testing transform the quality control workflow. It eliminates the risks associated with traditional sampling, such as contamination and human error, while dramatically reducing the time and cost associated with moving materials and laboratory testing [88]. By implementing the protocols outlined herein, pharmaceutical manufacturers can build a more resilient supply chain, mitigate the risks of excipient variability, and ensure that every batch of raw material aligns with the stringent specifications required for robust and effective drug products.
Assessing Performance: Validation, Comparative Studies, and Future Trends
Within pharmaceutical development, the identity of raw materials constitutes a critical quality attribute. Portable Raman spectroscopy has emerged as a powerful technique for the non-destructive, rapid identification of raw materials directly at the point of receipt, such as warehouse loading docks [27] [3]. This application note, framed within a broader thesis on portable Raman spectroscopy for raw material identification, provides detailed protocols for the essential performance validation of these methods. The focus is on establishing three fundamental figures of merit: Limits of Detection (LOD), Specificity, and Precision.
The migration of testing from the laboratory to the field necessitates robust validation protocols to ensure data integrity and method reliability in less-controlled environments [27]. This document outlines standardized experimental procedures and data analysis workflows to quantitatively demonstrate that a portable Raman method is fit for its intended purpose, providing a framework for researchers and scientists in drug development.
The Scientist's Toolkit: Essential Research Reagent Solutions
Successful development and validation of a portable Raman method require careful consideration of several key components. The table below details the essential materials and their functions in the context of this research.
| Component | Function & Rationale |
|---|---|
| Portable/Handheld Raman Spectrometer | The core analytical device. Key specifications include laser wavelength (e.g., 785 nm, 830 nm to minimize fluorescence), detector sensitivity, and spectral resolution [27] [3]. |
| Certified Reference Materials (CRMs) | High-purity materials with a verified identity, serving as the ground truth for building spectral libraries and assessing method specificity [27]. |
| Representative Test Samples | Authentic raw material batches from multiple vendors to evaluate material variability and its impact on precision and specificity [27]. |
| Challenging/Contaminated Samples | Blends of authentic materials with known contaminants (e.g., glycerin with diethylene glycol) or samples from vendors with historically variable quality to rigorously test method specificity and LOD [3]. |
| Standardized Packaging | Consistent, thin-walled containers like low-density polyethylene (LDPE) bags or glass vials. Packaging must be evaluated for its potential spectral interference [27] [3]. |
| Spectral Library Software | Software for storing reference spectra and performing chemometric analyses (e.g., correlation, probability-based matching, or multivariate algorithms) for identity confirmation [3]. |
Establishing Limits of Detection (LOD)
The LOD is the lowest level at which an analyte can be reliably detected. For identity testing, this translates to the minimum concentration of an active ingredient that can be distinguished from a placebo or the minimum signal required to detect a specific contaminant.
Experimental Protocol for LOD Determination
1. Sample Preparation:
- Prepare a series of binary mixtures of the target analyte (e.g., an API) in a common pharmaceutical excipient (e.g., microcrystalline cellulose) or prepare contaminant mixtures (e.g., diethylene glycol in glycerin) [3].
- Concentration levels should span from well above the expected LOD to below it (e.g., 1%, 0.5%, 0.1%, 0.05% w/w).
- Homogenize all mixtures thoroughly using standard powder blending techniques to ensure uniformity.
2. Data Acquisition:
- Use a portable Raman spectrometer with a stabilized laser source (e.g., 785 nm) [3].
- For each concentration level, acquire a minimum of n=10 spectra from different spots on the sample.
- Acquire spectra from the pure diluent and pure analyte for reference.
- Maintain consistent instrument settings (laser power, integration time) and sampling geometry (e.g., using a vial holder) across all measurements [27].
3. Data Analysis:
- Pre-process all spectra (e.g., baseline correction, normalization).
- For each spectrum of the diluted series, calculate a match score (e.g., correlation coefficient, or a probability-based p-value) against the reference spectrum of the pure analyte [3].
- Plot the average match score for each concentration level against the concentration.
- The LOD is defined as the concentration where the match score becomes statistically indistinguishable from the match score of the diluent. This can be determined as the concentration where the signal-to-noise ratio (SNR) of a key analyte peak drops below a threshold (e.g., 3:1).
Data Presentation: LOD for Contaminant Detection
The following table summarizes hypothetical data from an LOD study for diethylene glycol (DEG) contamination in glycerin, demonstrating how method sensitivity can be quantified.
Table 2: Representative Data for LOD Determination of Diethylene Glycol (DEG) in Glycerin
| Concentration of DEG (% v/v) | Mean Correlation Coefficient (r) vs. Pure Glycerin | Standard Deviation | Probability-Based p-value | Visual Spectral Differences |
|---|---|---|---|---|
| 0.0 (Pure Glycerin) | 1.000 | 0.000 | 0.99 | N/A |
| 0.5 | 0.995 | 0.003 | 0.15 | Not discernible |
| 1.0 | 0.985 | 0.005 | 0.04 | Barely discernible |
| 5.0 | 0.950 | 0.008 | 3.2 x 10⁻³ | Clearly discernible |
| 20.0 | 0.850 | 0.010 | <1.0 x 10⁻⁵ | Highly pronounced |
This data shows that while a correlation coefficient might still be relatively high (e.g., r=0.985 at 1% DEG), a probability-based test is more sensitive, with a p-value (<0.05) indicating a significant spectral discrepancy and thus successful detection [3].
Demonstrating Specificity
Specificity is the ability of a method to distinguish the target analyte from other closely related compounds, excipients, or potential contaminants.
Experimental Protocol for Specificity Assessment
1. Library Construction:
- Acquire Certified Reference Materials (CRMs) for all target raw materials and for common compounds that must be distinguished (e.g., different hydrates, salts, or isomorphs) [27].
- Build a comprehensive spectral library by collecting multiple spectra from each CRM. Ensure the library includes materials from different vendors to account for natural variability [27].
2. Challenge Testing:
- Test the method against a validation set comprising:
- True Positives: Authentic samples of the target material.
- True Negatives: Materials that are different but potentially similar (e.g., lactose monohydrate vs. anhydrous lactose).
- Challenging Mixtures: Blends of the target material with known contaminants or with similar-looking but incorrect materials [3].
3. Data Analysis & Acceptance Criteria:
- For each test sample, the method should result in a "PASS" for true positives and a "FAIL" for true negatives.
- The selectivity can be quantified using a confusion matrix and calculating metrics such as Accuracy, Specificity, and Selectivity. A well-validated method should achieve at least 95% accuracy on the challenge set [90].
Data Presentation: Specificity Challenge Results
The following table illustrates the outcome of a specificity challenge for a method designed to identify Tartaric Acid.
Table 3: Specificity Challenge for a Tartaric Acid Identification Method
| Sample Type | Sample Identity | Expected Result | Method Result (PASS/FAIL) | p-value | Comments |
|---|---|---|---|---|---|
| True Positive | Tartaric Acid (Vendor A) | PASS | PASS | 0.85 | Correctly identified |
| True Positive | Tartaric Acid (Vendor B) | PASS | PASS | 0.78 | Correctly identified, minor spectral variance |
| True Negative | Malic Acid | FAIL | FAIL | 4.1 x 10⁻⁴ | Correctly rejected |
| True Negative | Citric Acid | FAIL | FAIL | 2.0 x 10⁻⁵ | Correctly rejected |
| Challenging Mixture | Tartaric Acid with 5% Malic Acid | FAIL | FAIL | 0.01 | Correctly rejected, contaminant detected |
Evaluating Precision
Precision, the degree of agreement among a series of measurements under prescribed conditions, is typically assessed as Repeatability (same operator, same instrument, short interval) and Intermediate Precision (different operators, different days, different instruments).
Experimental Protocol for Precision Measurement
1. Study Design:
- Select a minimum of 3-5 different lots of the target raw material.
- For Repeatability: A single operator acquires n=10 measurements of a single lot in one session, repacking the sample between measurements if possible.
- For Intermediate Precision: A second operator repeats the study on a different day, ideally using a different, but equivalent, portable Raman instrument.
2. Data Acquisition:
- Use the instrument's "auto" mode if available, which automatically optimizes acquisition time and laser power to achieve a target signal-to-noise ratio, as this reflects real-world usage [3].
- Ensure measurements are taken through the intended packaging (e.g., LDPE bag).
3. Data Analysis:
- For each spectrum, the key output is the match score (correlation or p-value) against the library reference.
- Calculate the mean, standard deviation (SD), and relative standard deviation (RSD%) of the match scores for each operator and each lot.
- Acceptance Criterion: The method is considered precise if the RSD% of the match scores is less than 5% for all operators and instruments across all tested lots.
Data Presentation: Precision Study Results
The following table provides a template for reporting the results of a precision study.
Table 4: Repeatability and Intermediate Precision Data for Lactose Monohydrate Identification
| Operator | Instrument | Lot/Batch | Mean p-value | Standard Deviation | RSD% |
|---|---|---|---|---|---|
| Op 1 | Unit A | Lot 1 | 0.92 | 0.02 | 2.2% |
| Op 1 | Unit A | Lot 2 | 0.89 | 0.03 | 3.4% |
| Op 2 | Unit A | Lot 1 | 0.90 | 0.03 | 3.3% |
| Op 2 | Unit B | Lot 1 | 0.88 | 0.04 | 4.5% |
| Op 2 | Unit B | Lot 3 | 0.91 | 0.02 | 2.2% |
The low RSD% values across operators, instruments, and lots indicate that the method delivers highly reproducible results, meeting the acceptance criterion for precision.
Raman spectroscopy has become an indispensable analytical technique in pharmaceutical research and development, particularly for raw material identification (RMID). The emergence of portable handheld spectrometers has introduced a new paradigm, offering the potential for rapid, on-the-spot analysis outside the traditional laboratory [91] [5]. This application note provides a systematic comparison between portable and laboratory Raman instruments, focusing on their spectral quality, operational capabilities, and practical implementation for raw material verification within pharmaceutical research settings. The transition from laboratory-based to field-deployed analysis presents researchers with significant advantages in speed and flexibility, but also requires careful consideration of technical compromises related to spectral resolution and sensitivity [92] [93]. This document synthesizes experimental data and validation protocols to guide scientists in selecting and implementing the appropriate Raman technology for their specific research requirements in drug development.
Technical Comparison: Key Performance Parameters
The choice between portable and laboratory Raman instruments involves balancing multiple performance characteristics against operational requirements. The following comparison details the critical parameters that differentiate these systems.
Table 1: Key Performance Characteristics of Laboratory vs. Portable Raman Instruments
| Performance Characteristic | Laboratory Instruments | Portable Handheld Instruments |
|---|---|---|
| Spectral Resolution | 0.3–4.4 cm⁻¹ [92] | 7–16 cm⁻¹ [92] [93] |
| Typical Laser Wavelength | Multiple wavelengths (532, 785, 830, 1064 nm) [93] | Typically single wavelength (785 nm or 1064 nm) [93] |
| Laser Power on Sample | ~90 mW [92] | ~75-90 mW [92] |
| Spectral Range | 100–3409 cm⁻¹ [92] | 200–3200 cm⁻¹ [93] |
| Signal-to-Noise Ratio | Higher [91] | Lower [91] |
| Measurement Modes | Reflection and transmission modes [91] | Reflection mode only [91] |
| Fluorescence Mitigation | Multiple laser wavelengths, transmission mode [91] | 1064 nm laser option for fluorescent samples [5] [93] |
| Relative Cost | High (€50,000+) [38] | Lower (€1,700-€5,000) [38] |
Analysis of Spectral Quality Differences
Laboratory Raman systems demonstrate superior spectral fidelity, characterized by higher resolution and better signal-to-noise ratios [91] [92]. This enhanced performance enables more confident identification of complex mixtures and detection of minor components. However, studies have demonstrated that despite their lower resolution, portable instruments remain highly effective for screening applications and identification of pure materials [92]. For pharmaceutical raw material identification, where the analysis typically involves verification against known reference spectra, portable instruments often provide sufficient spectral quality while offering significant operational advantages [5] [93].
Fluorescence Interference Challenges
Fluorescence interference represents a significant challenge in Raman spectroscopy, potentially masking the weaker Raman signals. Laboratory instruments address this through multiple excitation wavelengths and transmission measurement modes [91]. Portable instruments predominantly utilize 785 nm lasers, though 1064 nm excitation is available in specialized handheld devices and proves particularly effective for analyzing colored or fluorescent pharmaceutical samples and enabling reliable through-container analysis [5] [93].
Experimental Comparison: Methodology and Protocols
To objectively evaluate the capabilities of both instrument types for pharmaceutical raw material identification, a structured experimental approach is essential. The following protocols outline standardized methodologies for comparative analysis.
Protocol 1: Raw Material Verification Using Handheld Raman
Purpose: To rapidly verify the identity of incoming raw materials at the point of receipt using handheld Raman spectroscopy [5] [93].
Materials:
- Handheld Raman spectrometer with 785 nm or 1064 nm laser
- Reference spectral library of approved raw materials
- Samples in original packaging
- Barcode scanner for sample tracking
Procedure:
- Instrument Preparation: Power on the handheld spectrometer and allow for a 5-minute initialization and self-check. Verify successful calibration using internal standards [93].
- Sample Presentation: Position the instrument's optical window firmly against the sample container. For transparent packaging, ensure proper contact; for opaque containers, use a 1064 nm instrument for through-container analysis [93].
- Spectral Acquisition: Activate the laser and acquire spectra for 10-30 seconds. Employ Orbital Raster Scanning if available to improve signal quality and reduce localized heating [93].
- Spectral Matching: The integrated software automatically compares acquired spectra against the reference library, calculating correlation coefficients or spectral match scores [91].
- Result Interpretation: A match score exceeding the predefined threshold (typically r > 0.95) confirms material identity. Results below threshold trigger rejection and laboratory analysis [91].
- Documentation: Save results with timestamps, operator details, and GPS location if required. Export data for quality records [93].
Quality Controls:
- Perform daily validation using known standards
- Maintain audit trails for regulatory compliance
- Regularly update spectral libraries
Protocol 2: Comprehensive Analysis Using Laboratory Raman
Purpose: To conduct detailed material characterization, detect subtle spectral variations, and resolve discrepancies found during handheld screening [91] [92].
Materials:
- Laboratory Raman spectrometer
- Microscope slides or sampling accessories
- Reference standards
- Computer with spectral analysis software
Procedure:
- Sample Preparation: For potent compounds or heterogeneous mixtures, gently crush a small portion to reduce particle size effects. Place sample on microscope slide or in vial [91] [92].
- Instrument Configuration: Select appropriate laser wavelength (785 nm standard). Set resolution to maximum (typically 2-4 cm⁻¹). Configure measurement parameters: 10-30 accumulations, 1-5 second exposure times [92].
- Spectral Acquisition: Position sample and focus laser. Acquire spectra across multiple sample regions to assess homogeneity. For transmission mode analysis, prepare thin sample sections [91].
- Data Processing: Apply baseline correction, vector normalization, and smoothing algorithms. For mixture analysis, employ multivariate methods [91] [92].
- Advanced Analysis: Utilize PCA, HCA, or SIMCA models to classify samples and identify subtle spectral differences not detectable with handheld instruments [92].
- Validation: Compare against certified reference materials. Document all parameters for method validation.
The experimental workflow for this comparative analysis is systematically outlined below:
Case Studies and Experimental Data
Pharmaceutical Tablet Analysis
A direct comparison of handheld and laboratory Raman instruments for pharmaceutical analysis revealed significant practical implications [91]. When analyzing Zyrtec tablets containing cetirizine hydrochloride, the handheld instrument detected primarily titanium dioxide from the coating, while the laboratory instrument successfully identified the active pharmaceutical ingredient beneath the coating [91]. This demonstrates the superior penetration and spectral quality of laboratory systems for layered samples.
In contrast, for Ciproxin tablets containing a high concentration (66%) of ciprofloxacin hydrochloride, both instruments successfully identified the API despite the titanium dioxide coating [91]. This highlights that for materials with strong Raman activity or high concentration, portable instruments can deliver satisfactory results.
Table 2: Quantitative Performance Comparison in Pharmaceutical Analysis
| Analysis Scenario | Handheld Raman Performance | Laboratory Raman Performance | Research Implications |
|---|---|---|---|
| Low API Concentration (<10%) | Limited detection capability [91] | Reliable API identification [91] | Laboratory preferred for low-dose formulations |
| High API Concentration (>50%) | Effective identification [91] | Excellent identification with detail [91] | Handheld sufficient for verification |
| Coated Tablets | Surface-weighted spectra [91] | Bulk material penetration [91] | Laboratory preferred for coated forms |
| Powdered Samples | Limited improvement [91] | Significant signal enhancement [91] | Sample preparation benefits laboratory systems |
| Colored/Fluorescent Samples | Challenging with 785 nm, improved with 1064 nm [5] [93] | Multiple wavelength options [91] | 1064 nm handheld or laboratory preferred |
Biological Tissue Analysis
A 2024 comparative study evaluated handheld, modular, and laboratory Raman instruments for analyzing colon tissues and colorectal polyps [92]. The laboratory instrument demonstrated superior spectral features, but all three devices successfully discriminated between normal colon tissue, adenomatous polyp, and adenocarcinoma using principal component analysis and hierarchical cluster analysis [92]. This confirms that despite resolution limitations, portable instruments provide sufficient spectral quality for effective classification in research applications.
The Scientist's Toolkit: Essential Research Reagent Solutions
Implementing robust Raman spectroscopy protocols requires specific materials and computational tools. The following table details essential components for pharmaceutical raw material identification research.
Table 3: Essential Research Materials and Computational Tools for Raman Spectroscopy
| Tool/Reagent | Specification | Research Function | Application Notes |
|---|---|---|---|
| Reference Standards | USP/EP certified chemical standards | Spectral library development and validation | Critical for method development and transfer |
| Spectral Libraries | 20,000+ compound databases | Reference for material identification | Industry-specific libraries enhance accuracy |
| CMOS Sensors | High quantum efficiency, low noise | Enhanced detection in portable systems | Emerging technology improving portable performance [94] |
| Chemometric Software | PCA, HCA, SIMCA algorithms | Multivariate spectral analysis | Essential for complex mixture analysis [92] |
| Validation Kits | Certified reference materials | Method validation and instrument qualification | Required for regulated environments |
| AI-Enhanced Algorithms | Machine learning libraries (PyTorch, Keras) | Advanced spectral classification | Improves handling of complex datasets [38] [94] |
Implementation Framework and Decision Guidance
Selecting between portable and laboratory Raman technologies requires careful consideration of research objectives, sample characteristics, and operational constraints. The following decision pathway provides a systematic approach to instrument selection:
Strategic Integration in Pharmaceutical Research
For comprehensive raw material identification programs, a hybrid approach leveraging both technologies provides optimal efficiency and scientific rigor [91] [5] [93]. Portable instruments serve as first-line screening tools at receiving docks and in warehouse environments, providing immediate material verification without opening containers [5]. Suspicious samples, complex mixtures, and materials failing initial screening are referred to laboratory instruments for confirmatory analysis with higher resolution and advanced chemometric processing [91] [92].
This integrated workflow maximizes operational efficiency while maintaining scientific rigor, with portable systems reducing laboratory workload by handling routine verifications of high-quality materials [93]. The implementation of handheld Raman for raw material identification has demonstrated significant reductions in analytical turnaround time and associated costs, while maintaining reliability in material verification [5].
Portable and laboratory Raman instruments offer complementary capabilities for pharmaceutical raw material identification research. Handheld systems provide unprecedented operational advantages through rapid, on-site analysis with minimal sample preparation, while laboratory instruments deliver superior spectral quality and advanced analytical capabilities for complex research challenges [91] [92] [93]. The integration of artificial intelligence and advancements in CMOS-based detection are rapidly enhancing both platforms, with portable systems increasingly approaching the performance characteristics once exclusive to laboratory instruments [38] [94]. For research organizations, a strategic combination of both technologies, implemented through the structured protocols and decision frameworks presented in this application note, provides an optimal pathway for leveraging the unique advantages of each platform in pharmaceutical development workflows.
Within pharmaceutical development and forensic science, the demand for rapid, reliable, and field-deployable analytical techniques for raw material identification is paramount. Portable Raman spectroscopy has emerged as a powerful tool that meets this need, offering non-destructive, on-site analysis with minimal sample preparation [27] [46]. This case study presents a retrospective analysis comparing the performance of portable Raman spectroscopy against the laboratory gold standard, Gas Chromatography-Mass Spectrometry (GC-MS), for the identification of seized drugs [95]. The study rigorously evaluates the practical applicability of Raman technology in real-world scenarios, focusing on critical parameters such as detection rate, fluorescence suppression, and matching accuracy to establish its reliability for field deployment by researchers and law enforcement personnel.
Experimental Design and Methodology
Sample Collection and Preparation
A total of 43 random seized drug samples were obtained from the Jiangsu Provincial Public Security Department in China [95]. These samples, which included forms such as colorful tablets and candies with fluorescently-colored additives, were stored in polyethylene evidence bags post-seizure to preserve integrity [95]. For Raman analysis, samples were analyzed without any pretreatment, enabling assessment of the technique's performance for direct, on-site identification [95].
For the confirmatory GC-MS analysis, a sample preparation protocol was rigorously followed:
- Each sample (approximately 10 mg) was dissolved in 1.0 mL of HPLC-grade methanol [95]
- The mixture was vortexed and subjected to ultrasonication at room temperature to ensure complete dissolution [95]
- The solution was centrifuged at 18,000 rpm for 5 minutes to obtain a clear supernatant for injection [95]
Instrumentation and Analysis Protocols
Portable Raman Spectroscopy Analysis
Two Raman technologies were employed for parallel analysis:
- Ordinary Portable Raman Spectroscopy: Utilizing a Thermo Fisher First Defender RMX spectrometer with a 785 nm excitation source and laser power set to 5 mW [95]
- Shifted-Excitation Raman Difference Spectroscopy (SERDS): Employing a SERDS Portable-BASE instrument with dual laser excitation at 784-785 ± 0.3 nm [95]
Both instruments collected spectra that were automatically matched against their respective integrated databases to provide rapid component identification [95]. The SERDS technology specifically leveraged the principle that while fluorescence remains constant with slight wavelength changes, Raman peaks shift position, allowing for effective fluorescence removal through differential signal processing [95].
GC-MS Reference Analysis
The GC-MS analysis was performed using an Agilent 7890B gas chromatograph system coupled with a 5977A mass selective detector to provide definitive compound identification [95]. The detailed parameters were:
- Column: DB-5MS elastic silica capillary (30 m × 0.25 mm × 0.25 µm) [95]
- Carrier Gas: Helium at a constant flow rate of 1.0 mL/min [95]
- Injection: 1 µL in split mode (20:1 ratio) at 280 °C [95]
- Oven Program: Initial temperature 100 °C (hold 1 min), ramp to 290 °C at 8 °C/min, final hold at 290 °C for 10 min [95]
- Mass Detection: Full scan mode (40-500 m/z) with ion source and quadrupole temperatures of 230 °C and 150 °C, respectively [95]
Data Analysis and Validation
The detected results from both Raman technologies were confirmed against GC-MS findings, which served as the reference method [95]. Performance was compared based on:
- Detection Rate: Percentage of samples correctly identified against GC-MS [95]
- Matching Accuracy: Spectral correlation and database matching fidelity [95]
Results and Discussion
Performance Comparison of Raman Techniques
Table 1: Comparative Performance of Raman Technologies Against GC-MS
| Analytical Technique | Detection Rate | Key Advantages | Limitations |
|---|---|---|---|
| SERDS Raman | 93.0% | Superior fluorescence suppression; minimal sample preparation; non-destructive | Slightly lower accuracy for multi-component mixtures |
| Ordinary Portable Raman | 53.3% | Higher accuracy for multi-component mixed samples | Severely limited by fluorescence interference |
| GC-MS (Reference) | 100% | Definitive identification; high sensitivity and specificity | Destructive; extensive sample preparation; laboratory-bound |
The dramatic difference in detection rates between SERDS (93.0%) and ordinary portable Raman (53.3%) underscores the critical challenge of fluorescence interference in seized drug samples, which often contain fluorescent additives [95]. The SERDS technology effectively addresses this limitation through its differential measurement approach, making it particularly valuable for real-world samples where fluorescent compounds are present [95].
Technical Comparative Analysis
Table 2: Technical Specifications of Portable Analytical Techniques
| Technique | Sample Handling | Acquisition Time | Destructive? | Target Applications |
|---|---|---|---|---|
| Raman Spectroscopy | Through transparent packaging | Few seconds to 1 minute | No | Single-component samples, high-concentration mixtures [96] |
| NIR Spectroscopy | Through glass/plastic containers | ~5 seconds | No | Single-component samples, white powders [43] |
| IR Spectroscopy | Direct contact required | <1 minute | No | Single-component samples, liquids, tablets [96] |
| GC-MS | Solvent extraction required | 4-15 minutes | Yes | Trace amounts, mixture separation [95] [96] |
The non-destructive nature of Raman spectroscopy, combined with its ability to analyze samples through transparent packaging, provides significant advantages for evidentiary preservation and rapid screening applications [96] [93]. This is particularly valuable in forensic contexts where maintaining evidence integrity is crucial for subsequent legal proceedings.
Methodological Considerations for Raman Spectroscopy
Successful implementation of portable Raman spectroscopy for raw material identification requires careful attention to several critical factors:
- Material Raman Activity: Molecules with numerous covalent bonds and conjugation typically yield strong Raman signals, while simple ionic compounds like sodium hydroxide are poor candidates [27]
- Fluorescence Interference: Samples with fluorescent impurities can overwhelm the weaker Raman signal, necessitating technologies like SERDS or 1064 nm excitation to minimize this effect [95] [27]
- Container Compatibility: Raman spectroscopy can typically analyze samples through transparent packaging such as glass and plastic containers, though colored or opaque materials may interfere with measurement [43]
The Scientist's Toolkit: Essential Research Reagents and Materials
Table 3: Essential Materials and Reagents for Raman-Based Drug Identification
| Item | Function | Application Notes |
|---|---|---|
| HPLC-grade Methanol | Sample extraction for GC-MS confirmation | Provides clean baseline for chromatographic analysis [95] |
| Polyethylene Evidence Bags | Sample storage and transport | Maintains sample integrity without interfering with Raman analysis [95] [43] |
| SERDS Portable Raman Spectrometer | Fluorescence-suppressed spectral acquisition | Dual-laser system for differential measurement [95] |
| DB-5MS GC Column | Chromatographic separation of drug components | 30 m × 0.25 mm × 0.25 µm dimensions for optimal resolution [95] |
| Reference Spectral Libraries | Compound identification and verification | Customizable databases with 20,000+ spectra for accurate matching [93] |
Experimental Workflow and Signaling Pathways
The following diagram illustrates the integrated experimental workflow for the comparative analysis of seized drugs using both field-deployable and laboratory techniques:
Experimental Workflow for Drug Identification Analysis
This retrospective analysis demonstrates that portable Raman spectroscopy, particularly SERDS technology, provides a highly effective solution for rapid identification of seized drugs in field settings. The 93.0% detection rate achieved by SERDS highlights its superior capability to overcome the persistent challenge of fluorescence interference that plagues conventional Raman systems. While GC-MS remains the definitive laboratory standard for forensic confirmation, the implementation of portable Raman technologies significantly enhances operational efficiency by enabling reliable on-site screening. This approach facilitates faster decision-making at crime scenes, reduces laboratory backlogs, and ensures the integrity of evidence through non-destructive analysis. For researchers and drug development professionals, these findings validate portable Raman spectroscopy as a robust tool for raw material identification within pharmaceutical quality control and forensic investigation frameworks.
In pharmaceutical development, the accurate identification of raw materials is a critical first step to ensure final product quality, safety, and efficacy. Portable Raman spectroscopy has emerged as a powerful technique for rapid, non-destructive raw material identification (RMID) at the point of need, such as warehouses and receiving docks [5] [27]. This technique provides a viable solution for tighter quality control and helps manufacturers boost lean manufacturing processes that reduce costs and improve productivity [5].
However, no single analytical technique is infallible. A comprehensive quality control strategy must acknowledge the limitations of individual methods and integrate complementary—orthogonal—techniques to create a robust system with greater discriminative power and reliability [27] [3]. This Application Note details protocols for combining portable Raman spectroscopy with other analytical methods to build a defensible, comprehensive quality control framework for raw material authentication, designed for researchers, scientists, and drug development professionals.
Key Methodological Considerations for Portable Raman Spectroscopy
Successful implementation of a portable Raman spectroscopy method requires careful consideration of several critical factors during the method development and validation stages. The table below summarizes these key parameters and their implications for method robustness.
Table 1: Critical Factors in Raman Method Development for Raw Material Identification
| Factor | Consideration | Impact on Method |
|---|---|---|
| Material Raman Activity [27] | Does the material have covalent bonds that are Raman active? (e.g., Sodium hydroxide is poor, while phenylalanine is excellent) | Determines suitability of Raman for identification; weak scatterers may require alternative techniques. |
| Fluorescence Interference [5] [27] | Can the analyte or low-level impurities cause fluorescence that masks the Raman signal? | Can prevent positive identification; may require 785 nm, 830 nm, or 1064 nm excitation lasers to mitigate. |
| Sample Presentation [27] | Is the sample a powder, liquid, suspension, or solution? | Influences sampling technique and potential need for accessories. |
| Container Interference [27] [3] | Can the material be tested through its container (e.g., LDPE bag, glass vial)? | Enables non-destructive, in-situ testing without risk of contamination; requires assessment of container signal contribution. |
| Material Variability [27] | Are the Raman signals reproducible between different batches and vendors? | Affects library robustness; may require adding multiple representative spectra to avoid false negatives. |
| Specificity [27] | Can the method distinguish between similar materials (e.g., anhydrates vs. hydrates)? | Crucial for correct identification; must be validated during method development. |
Experimental Protocols for Material Identification
Protocol 1: Development and Validation of a Portable Raman Method
This protocol provides a step-by-step methodology for creating a validated library entry for a raw material using a portable Raman spectrometer.
Research Reagent Solutions & Essential Materials
Table 2: Essential Materials for Raman-Based Raw Material Identification
| Item | Function/Application |
|---|---|
| Portable/Handheld Raman Spectrometer (e.g., with 785 nm, 830 nm, or 1064 nm laser) [27] | Core instrument for spectral acquisition. Laser choice is critical to minimize fluorescence. |
| Borosilicate Glass Vials or Polyethylene Bags [3] | Standardized containers for measuring materials through packaging. |
| High-Purity Reference Standards (from qualified vendors) [27] [3] | Essential for building accurate and representative spectral libraries. |
| Spectral Library/Method Building Software (e.g., SpecSuite, BWSP) [14] [97] | Software for compiling reference spectra, building identification methods, and controlling instruments. |
| Barcode Scanner (often integrated) [5] | For linking sample identity to spectral data and ensuring traceability. |
Procedure:
- Sample Preparation: Obtain a representative sample of the raw material from a qualified vendor. For solids, ensure a consistent particle size if possible. For direct measurement through packaging, place approximately 2 grams of material into a 2-mil thick polyethylene bag or a clear glass vial [3].
- Instrument Preparation: Initialize the portable Raman spectrometer according to the manufacturer's instructions. Allow the instrument to warm up and stabilize if required. Select the appropriate laser wavelength (e.g., 1064 nm is beneficial for fluorescent materials) [5] [27].
- Spectral Acquisition: Position the instrument's laser aperture at the specified distance from the sample using the provided attachment (e.g., vial holder or nose-cone). Initiate data collection. It is recommended to use the automatic mode, which optimizes integration time and laser power to achieve a target signal-to-noise ratio (SNR) [3]. For fluorescent materials, terminate the scan early or move the sample periodically to avoid photobleaching effects [3].
- Library Building: Acquire spectra from multiple lots and, if applicable, multiple vendors to capture natural variability. Use the instrument's software to create a reference method from the collected spectra. The software typically uses a probability-based approach, defining a multivariate domain for the reference spectrum that accounts for measurement uncertainty [3].
- Method Validation: Challenge the method with independent samples of the target material and closely related or structurally similar compounds (e.g., different polymorphs, hydrates) to confirm specificity. A sample is positively identified if the calculated p-value is above the threshold (commonly 0.05), indicating that any spectral differences are not significant relative to the measurement uncertainty [3].
Protocol 2: Orthogonal Confirmation Using Fourier Transform-Infrared (FT-IR) Spectroscopy
For materials that are poorly suited to Raman or to resolve ambiguous results, FT-IR serves as an excellent orthogonal technique.
Procedure:
- Sample Preparation: Prepare the sample for FT-IR analysis. For solids, this may involve creating a potassium bromide (KBr) pellet or using an attenuated total reflectance (ATR) crystal. ATR is often preferred for its simplicity and minimal preparation.
- Background Scan: Collect a background spectrum with the empty ATR crystal or a pure KBr pellet.
- Sample Scan: Place the sample on the ATR crystal or in the KBr pellet and collect the infrared spectrum over the standard range (e.g., 4000-400 cm⁻¹).
- Data Analysis: Compare the sample's FT-IR spectrum to a reference spectrum of the authentic material. The fundamental difference in selection rules (Raman relies on a change in polarizability, while IR relies on a change in dipole moment) means the two techniques provide complementary vibrational information. A conclusive match in both techniques provides a high degree of confidence in the material's identity [27] [3].
Integrated Quality Control Workflow
The following workflow diagram illustrates how portable Raman spectroscopy and orthogonal techniques are integrated into a seamless quality control process for incoming raw materials.
Data Analysis and Interpretation
Spectral Comparison and Statistical Analysis
Portable Raman systems move beyond simple correlation coefficients for spectral matching. Advanced systems use a probability-based approach that evaluates whether an unknown sample's spectrum lies within the multivariate domain defined by the reference spectrum and its associated measurement uncertainties [3]. A p-value is calculated, and if it falls below a threshold (e.g., 0.05), the sample fails identification. This method is more sensitive to spectral discrepancies than correlation, as demonstrated in a study where glycerin contaminated with 20% diethylene glycol had a high correlation (0.96) but a definitively failing p-value of 3.2 × 10⁻³ [3].
Integration with Multivariate Analysis
For complex mixtures or quantitative analysis, portable Raman can be coupled with multivariate methods. A reaction can be monitored by trending the rise and fall of specific reactant and product peaks (univariate analysis) [97]. Furthermore, Principal Component Analysis (PCA) combined with Support Vector Machine (SVM) modeling can be used to effectively classify and differentiate materials based on their Raman spectra, as successfully demonstrated for different starch types [98].
Comparative Analysis of Techniques
A comprehensive quality control strategy leverages the strengths of multiple analytical techniques. The table below compares Raman spectroscopy with other common methods.
Table 3: Comparison of Techniques for Raw Material Identification
| Technique | Key Strengths | Key Limitations | Orthogonal Role to Raman |
|---|---|---|---|
| Portable Raman Spectroscopy [5] [27] [3] | - Non-destructive, through-package testing- High spectral specificity (fingerprint)- Minimal water interference- Rapid analysis in field | - Weak signal for some materials- Susceptible to fluorescence interference- Can be ineffective for weak Raman scatterers (e.g., MCC) | Primary technique for fast, in-situ screening. |
| FT-IR Spectroscopy [27] [3] | - High specificity- Universally applicable to organic materials- Strong signal for functional groups | - Strong water absorption- Requires direct contact (ATR) or sample preparation (KBr)- Cannot typically measure through packaging | Confirmation for materials with weak Raman signals; provides complementary vibrational data. |
| Near-Infrared (NIR) [3] | - Fast and non-destructive- Deep penetration- Suitable for through-package analysis | - Broad, overlapping spectral bands- Requires complex chemometrics for analysis- Less specific than Raman or FT-IR | Alternative for through-package testing where Raman fails; good for physical properties. |
| HPLC [3] | - High sensitivity and specificity- Provides quantitative purity data | - Destructive- Requires sample preparation and solvents- Time-consuming; requires lab setting | Definitive quantification and purity assessment when contamination is suspected. |
The integration of artificial intelligence (AI), machine learning (ML), and cloud analytics with portable Raman spectroscopy is revolutionizing the field of automated raw material identification. This powerful synergy directly addresses longstanding challenges in spectral analysis, such as fluorescence interference and complex data interpretation, while enhancing the capabilities of handheld devices for rapid, on-site analysis [99] [5]. These technological advancements are transforming portable Raman spectrometers from simple data collection tools into intelligent, connected systems capable of real-time decision-making.
The global market data reflects this rapid evolution. The handheld Raman spectroscopy market is projected to grow from $1.34 billion in 2025 to $2.13 billion by 2029, at a compound annual growth rate (CAGR) of 12.1% [25]. Similarly, the broader Raman analyzers market is expected to expand from $573.0 million in 2025 to $1,319.0 million by 2032, with a CAGR of 7.4%, driven significantly by the adoption of AI and portable systems [100] [101]. This growth is largely fueled by the pharmaceutical and biotechnology sectors, where these technologies are critical for applications ranging from raw material verification to counterfeit drug detection [25] [100].
Table 1: Global Market Projections for Raman Spectroscopy (2025-2032)
| Market Segment | 2025 Market Size | 2032/2029 Market Size | CAGR | Primary Growth Driver |
|---|---|---|---|---|
| Handheld Raman Spectroscopy [25] | $1.34 billion | $2.13 billion (2029) | 12.1% | On-site material identification needs |
| Raman Analyzers (Overall) [100] [101] | $573.0 million | $1,319.0 million (2032) | 7.4% | Demand for non-destructive analytical techniques |
Key Technological Trends and Data Integration Frameworks
AI and Machine Learning for Spectral Analysis
AI and ML algorithms are at the forefront of enhancing Raman spectroscopy's analytical power. Deep learning models, including Convolutional Neural Networks (CNNs), Multilayer Perceptrons (MLPs), and Gated Recurrent Units (GRUs), automatically extract meaningful features from complex, high-dimensional spectral data, minimizing the need for manual preprocessing and expert intervention [102] [99] [103]. This capability is crucial for identifying subtle spectral patterns indicative of material composition or pathological states that are often imperceptible to the human eye [104]. For instance, in cancer diagnostics using liquid biopsies, a model combining Principal Component Analysis (PCA) for feature extraction with Linear Discriminant Analysis (LDA) for classification achieved an impressive 93.3% overall accuracy in classifying exosomes from different cancer cell lines [104].
A significant trend is the move towards interpretable AI. Researchers are increasingly employing attention mechanisms and ensemble learning techniques to open the "black box" of deep learning, providing transparency into the model's decision-making process, which is vital for regulatory approval and clinical adoption [99].
Cloud Analytics and System Connectivity
The emergence of cloud-connected Raman systems marks a pivotal shift in data management and analysis. Cloud platforms enable the aggregation of vast spectral libraries, facilitate remote data access and collaboration, and allow for the deployment of sophisticated, computationally intensive AI models that may be too large to run on a handheld device itself [25] [105]. This architecture supports continuous model refinement, where algorithms improve as they process more data from multiple instruments deployed across different locations [100]. Furthermore, cloud integration is a key component of the Industry 4.0 framework, enabling real-time process analytics (PAT) and seamless data integration with manufacturing execution systems (MES) and electronic lab notebooks (ELN) [100] [101].
Application Notes & Experimental Protocols
Protocol 1: Raw Material Identification (RMID) in Pharmaceutical Manufacturing
Objective: To establish a standardized procedure for the rapid, non-destructive identification of raw materials at the point of receipt or within the warehouse using an AI-powered handheld Raman spectrometer [5].
Materials:
- Handheld Raman spectrometer with cloud connectivity (e.g., equipped with a 1064 nm laser to minimize fluorescence interference) [5].
- Device with barcode scanner and customizable reporting software.
- Sample presentation accessories (e.g., vials for liquids, solid sample holders).
Procedure:
- System Calibration: Perform instrument calibration according to the manufacturer's specifications using built-in standards.
- Sample Presentation: Present the raw material in its original container (if optically transparent) or in a suitable sample vial. Use the integrated barcode scanner to log the sample ID.
- Spectral Acquisition: Aim the spectrometer's probe at the sample and acquire the Raman spectrum. Typical acquisition parameters include 3-5 second integration time and 1-3 accumulations to improve the signal-to-noise ratio.
- Cloud-Based AI Analysis: The acquired spectrum is automatically preprocessed and securely transmitted to a cloud-based analytics platform.
- Real-Time Identification: The cloud-based AI model compares the unknown spectrum against a validated spectral library. The model provides a definitive identification (Pass/Fail) and a confidence score, typically in under 30 seconds.
- Data Documentation: The result, along with the sample ID, operator, timestamp, and full spectrum, is automatically saved to a compliant database (supporting FDA 21 CFR Part 11)
Supporting Data: This application addresses a critical need in a dominant market segment. The pharmaceutical and biotechnology industry is the leading end-user of Raman analyzers, driven by stringent quality control and the need to combat counterfeit drugs [100] [101].
Protocol 2: Early Disease Detection via Gastric Juice Analysis
Objective: To detect precancerous gastric lesions and Helicobacter pylori (HP) infection using Raman spectroscopy and machine learning analysis of gastric juice samples, demonstrating a minimally invasive diagnostic application [102].
Materials:
- Confocal Raman microspectrometer (e.g., WITec alpha300R).
- Low-background calcium fluoride (CaF₂) Raman substrates.
- Centrifuge and sterile sample containers.
- Software for spectral processing and machine learning (e.g., Python with Scikit-learn, TensorFlow).
Procedure:
- Sample Collection & Preparation: Collect gastric juice during endoscopy. Clarify the sample via a two-step centrifugation process: first at 1,800 rpm for 10 minutes, then at 15,000 ×g for 30 minutes to obtain a clear supernatant [102].
- Sample Deposition: Deposit a 10 µL aliquot of the supernatant onto a CaF₂ substrate and allow it to air-dry.
- Spectral Acquisition: Acquire Raman spectra using a 532 nm laser, 100x objective, and 3-5 second accumulation time. Collect more than 25 spectra per sample from random locations to ensure statistical robustness.
- Data Preprocessing: Preprocess the raw spectra by removing cosmic rays, performing baseline correction, and applying vector normalization.
- Machine Learning Model Training:
- Data Splitting: Split the dataset (131 patients in the cited study) at the sample level, with 80% for training and 20% for testing, using stratified sampling to maintain class distribution (e.g., CSG, IM, DYS, EGC, HP+/-) [102].
- Model Training & Validation: Train a stacked ensemble model or a Multilayer Perceptron (MLP) on the training set using fivefold cross-validation. Optimize hyperparameters via GridSearch.
- Model Evaluation: Evaluate the final model on the held-out test set.
Results & Performance: The cited study achieved a 90% accuracy, 90% sensitivity, and 97% specificity in distinguishing pathological stages, and a 96% accuracy, 96% sensitivity, and 96% specificity in detecting HP infection. The MLP model excelled at differentiating controls from patients with dysplasia or early gastric cancer, with an AUC of 0.98 [102].
Table 2: Performance Metrics of AI-Raman Models in Biomedical Diagnostics
| Application / Study | AI/ML Model Used | Key Performance Metrics | Significance |
|---|---|---|---|
| Gastric Lesion Staging [102] | Stacked Ensemble Model | 90% Accuracy, 90% Sensitivity, 97% Specificity | Enables minimally invasive, rapid stratification of cancer risk. |
| H. pylori Detection [102] | Stacked Ensemble Model | 96% Accuracy, 96% Sensitivity, 96% Specificity | Provides a highly accurate and convenient alternative to traditional tests. |
| Liquid Biopsy (Cancer Exosomes) [104] | PCA + Linear Discriminant Analysis | 93.3% Overall Accuracy, F1 scores up to 98.2% | Demonstrates potential for non-invasive cancer classification and monitoring. |
Workflow Visualization: AI-Powered Raman Analysis
The following diagram illustrates the integrated workflow for automated identification, from sample collection to result reporting, as described in the protocols.
The Scientist's Toolkit: Essential Research Reagents & Materials
The following table details key reagents, software, and hardware essential for conducting research in AI-enhanced portable Raman spectroscopy.
Table 3: Essential Research Toolkit for AI-Enhanced Raman Spectroscopy
| Item | Function/Application | Examples / Specifications |
|---|---|---|
| Portable Raman Spectrometer | Core instrument for on-site spectral acquisition. | Devices with 1064 nm lasers to minimize fluorescence; integrated barcode scanner and camera for documentation [5] [14]. |
| Cloud Analytics Platform | Hosts AI/ML models, stores large spectral libraries, enables remote collaboration. | Platforms supporting 21 CFR Part 11 compliance; capable of running CNN, MLP, and other deep learning models [25] [105]. |
| Low-Fluorescence Substrates | Provides a low-background surface for analyzing liquid samples (e.g., biofluids). | Calcium Fluoride (CaF₂) slides [102]. |
| AI/ML Software Libraries | Provides tools for building, training, and validating custom machine learning models. | Python libraries (Scikit-learn, TensorFlow, PyTorch); used for algorithms like PCA, LDA, SVM, and neural networks [102] [103]. |
| Process Analytical Technology (PAT) Software | Enables real-time monitoring and control of manufacturing processes (e.g., in pharmaceuticals). | Software like SpecSuite that supports method development and compliance with regulatory guidelines [14]. |
The confluence of portable Raman spectroscopy, artificial intelligence, and cloud analytics has created a paradigm shift in automated identification. This powerful combination delivers a robust framework for applications ranging from pharmaceutical raw material verification to groundbreaking clinical diagnostics. The experimental protocols and data presented herein provide a clear roadmap for researchers and drug development professionals to implement and advance these technologies. As AI models become more interpretable and cloud ecosystems more integrated, the role of these intelligent, connected systems in ensuring product quality, advancing personalized medicine, and accelerating scientific discovery will only continue to grow.
Conclusion
Portable Raman spectroscopy has firmly established itself as a powerful, regulatory-accepted tool for rapid and reliable raw material identification, directly addressing the needs of modern pharmaceutical manufacturing for efficiency and quality assurance. Its ability to provide immediate, non-destructive verification through packaging transforms quality control workflows, enabling 100% container inspection and significantly reducing the risk of adulteration. While challenges like fluorescence and material variability require careful methodological planning, solutions such as longer-wavelength lasers and advanced chemometrics are readily available. The integration of artificial intelligence and machine learning promises to further automate and enhance the accuracy of spectral analysis. As the technology continues to evolve, its application is set to expand beyond traditional QA/QC, playing an increasingly vital role in personalized medicine, point-of-care diagnostics, and ensuring the integrity of complex global supply chains, ultimately contributing to safer and more effective therapeutics.
References
- 1. Basic Principles of Raman Scattering and Spectroscopy [https://www.edmundoptics.com/knowledge-center/application-notes/lasers/basic-principles-of-raman-scattering-and-spectroscopy/?srsltid=AfmBOoo7IeNRIAfrFGhVzX4HwDFz_5sYFtrBVvHJ1LRXzVbsFEPj3IxU]
- 2. Raman Techniques: Fundamentals and Frontiers - PMC [https://pmc.ncbi.nlm.nih.gov/articles/PMC6626094/]
- 3. Raw-Material Authentication Using a Handheld Raman ... [https://www.pharmtech.com/view/raw-material-authentication-using-handheld-raman-spectrometer]
- 4. Enabling Robust and Rapid Raw Material Identification and ... [https://journal.pda.org/content/73/4/356]
- 5. Raman Spectroscopy: Immediate Raw Material Identification [https://www.supplysidesj.com/manufacturing/raman-spectroscopy-immediate-raw-material-identification]
- 6. Advances in deep learning-based applications for Raman ... [https://www.sciencedirect.com/science/article/abs/pii/S0026265X25000463]
- 7. Raman Spectroscopy and Machine Learning Show ... [https://www.spectroscopyonline.com/view/raman-spectroscopy-and-machine-learning-show-promise-for-pfas-detection]
- 8. Strategic Trends in Portable Raman Spectroscopy ... [https://www.datainsightsmarket.com/reports/portable-raman-spectroscopy-1646584]
- 9. Pharmaceutical Manufacturing Uses Raman [https://rigaku.com/products/handheld-raman/industries/pharmaceutical-manufacturing-using-raman]
- 10. A Comparative Study of Benchtop and Portable NIR ... [https://pmc.ncbi.nlm.nih.gov/articles/PMC9331271/]
- 11. Portable Raman Spectrometers for Material ID | Guide 2025 [https://www.apexinstrument.me/exploring-the-role-of-portable-raman-spectrometers-in-advanced-material-identification/]
- 12. Field Testing Simplified: Benefits of Portable Raman ... [https://www.technosphotonics.com/blog/field-testing-simplified-benefits-of-portable-raman-spectrometers]
- 13. Top 7 Applications of IndiRAM Portable Raman in Industry ... [https://www.linkedin.com/pulse/top-7-applications-indiram-portable-raman-industry-do5bc]
- 14. Introducing the Metrohm i-Raman NxG [https://www.metrohm.com/en/discover/news/2025/introducing-the-metrohm-i-raman-nxg.html]
- 15. Global Raman Spectroscopy Market Size & Forecast, 2025 ... [https://www.coherentmarketinsights.com/industry-reports/global-raman-spectroscopy-market]
- 16. Portable Raman Spectrometer Market Deep Dive 2025 [https://www.linkedin.com/pulse/portable-raman-spectrometer-market-deep-dive-2025-tg6df/]
- 17. Global Raman Spectroscopy Equipment Market By Type, ... [https://www.marketsizeandtrends.com/report/raman-spectroscopy-equipment-market/]
- 18. Raman Spectroscopy Market Size, Share & Growth, 2032 [https://www.kingsresearch.com/raman-spectroscopy-market-2572]
- 19. Raman Spectroscopy Market: Global Industry Overview ... [https://www.stellarmr.com/report/Raman-Spectroscopy-Market/433]
- 20. Best of the Week: New Raman Spectrometer Product Line ... [https://www.spectroscopyonline.com/view/best-of-the-week-new-raman-spectrometer-product-line-best-of-spectroscopy-interviews-from-june-2025]
- 21. Lean Manufacturing 2025: Digital Trends & Tech Guide [https://airacad.com/lean-manufacturing-in-2025-trends-tech-and-whats-next/]
- 22. Lean Manufacturing: Principles, Tools, Case Studies (2025 ... [https://www.learnleansigma.com/continuous-improvement/lean-manufacturing/]
- 23. How to Use Lean Thinking to Eliminate Waste in 2025 [https://www.systemsandteams.com/how-to-use-lean-thinking-to-eliminate-waste-in-2025]
- 24. What Factors Should be Considered When Choosing a ... [https://www.azom.com/article.aspx?ArticleID=23134]
- 25. Handheld Raman Spectroscopy Global Market Report 2025 [https://www.thebusinessresearchcompany.com/report/handheld-raman-spectroscopy-global-market-report]
- 26. Why we use Raman spectroscopy [https://www.renishaw.com/en/why-we-use-raman-spectroscopy--25803?srsltid=AfmBOoqFP-iPo5--mHdJQFpSBtkFtMiIKuvzehgphROySOMbxoUNhJH_]
- 27. Developing Portable Raman Spectroscopy Methods for ... [https://www.spectroscopyonline.com/view/developing-portable-raman-spectroscopy-methods-identification-raw-materials-used-pharmaceutical-deve]
- 28. Advantages and Limitations of Modular Fiber Optics ... [https://www.spectroscopyonline.com/view/advantages-and-limitations-modular-fiber-optics-based-low-resolution-raman-spectroscopy-systems]
- 29. Benchtop and Portable Raman Spectrometers to Screen ... [https://www.americanpharmaceuticalreview.com/Featured-Articles/563975-Benchtop-and-Portable-Raman-Spectrometers-to-Screen-Counterfeit-Drugs/]
- 30. Choosing a Portable Raman Spectrometer [https://wasatchphotonics.com/technologies/portable-raman-spectrometer/]
- 31. RMID - Raw Material Identification [https://bwtek.com/applications/raw-material-id/]
- 32. Vaya Handheld Raman Spectrometer for Raw Material ... [https://www.agilent.com/en/product/molecular-spectroscopy/raman-spectroscopy/raman-pharmaceutical-analysis-systems/vaya-handheld-raman-spectrometer-for-raw-material-identification?srsltid=AfmBOop5gI4DzVejsnuCaw1pO3sE7wpJYBRLXQyirU19ddL_lO39WLCO]
- 33. Raw material identification [https://rigaku.com/resources/techniques/raw-material-identification]
- 34. Portable Raman Spectrometers: How Small Can They Get? [https://www.spectroscopyonline.com/view/portable-raman-spectrometers-how-small-can-they-get-]
- 35. Rigaku Launches Fourth Generation Handheld 1064 nm ... [https://rigaku.com/about/news-and-press-releases/rigaku-fourth-generation-raman]
- 36. Raman data library software [https://www.us.endress.com/en/field-instruments-overview/optical-analysis-product-overview/raman-data-library?srsltid=AfmBOoqTW-uy0CVyjlGXrF2I0AhZmKxoHG4zICHrTu5ggV44A0Buoah1]
- 37. Raman software: analysis [https://www.renishaw.com/en/raman-software-analysis--25909?srsltid=AfmBOoq9zQnmTlmdLeECX88QJRpaYlZvOJfwJMRNg4eDhRczPv_1U8LB]
- 38. How Portable Raman Spectroscopy Systems Can Lead to ... [https://www.spectroscopyonline.com/view/how-portable-raman-spectroscopy-systems-can-lead-to-affordable-kidney-disease-diagnostics]
- 39. Low-Cost Raman Spectroscopy Setup Combined with a ... [https://www.mdpi.com/1424-8220/25/3/659]
- 40. i-Raman Plus 785S Portable Raman Spectrometer [https://www.metrohm.com/en/products/b/wt-8/bwt-840000340.html]
- 41. Streamline material inspection in regulated industries with ... [https://www.metrohm.com/en/discover/blog/2023/new-raman-usp-library.html]
- 42. The Quest for Universal Spectral Libraries: Standards ... [https://www.spectroscopyonline.com/view/the-quest-for-universal-spectral-libraries-standards-metadata-and-machine-readability]
- 43. Raw Materials Identification Testing by NIR Spectroscopy ... [https://www.shimadzu.com/an/service-support/technical-support/ftir/tips_and_tricks/raman.html]
- 44. A Standardized Procedure to Build a Spectral Library for ... [https://www.mdpi.com/2072-4292/15/2/477]
- 45. Raman Spectroscopy Analysis in Pharmaceutical ... [https://www.thermofisher.com/us/en/home/industrial/spectroscopy-elemental-isotope-analysis/portable-analysis-material-id/portable-pharmaceutical-qa-qc-manufacturing-solutions/raman-spectroscopy-analysis-pharmaceutical-drug-manufacturing-faqs.html]
- 46. Real World Raman: Simplifying Incoming Raw Material ... [https://www.metrohm.com/en/discover/blog/20-21/real-world-raman--simplifying-incoming-raw-material-inspection.html]
- 47. Raw Material Identification with Visum Palm GxP™ [https://www.iris-eng.com/raw-material-identification/]
- 48. Optics miniaturization strategy for demanding Raman ... [https://www.nature.com/articles/s41467-024-47044-7]
- 49. In-line product quality monitoring during biopharmaceutical ... [https://pmc.ncbi.nlm.nih.gov/articles/PMC10251777/]
- 50. A new era for the European Pharmacopoeia – Online-only ... [https://www.edqm.eu/en/-/a-new-era-for-the-european-pharmacopoeia-online-only-format-from-june-2025]
- 51. European Pharmacopoeia – New online-only 12th Edition [https://www.edqm.eu/en/european-pharmacopoeia-new-online-only-12th-edition]
- 52. Microbiological quality control testing [https://www.usp.org/microbiology]
- 53. Ensuring Microbiological Quality of Herbal Products [https://www.gmp-compliance.org/gmp-news/ensuring-microbiological-quality-of-herbal-products]
- 54. Publications [https://picscheme.org/en/publications]
- 55. PIC/S [https://picscheme.org/en/picscheme]
- 56. TruScan Handheld Raman Analyzer for Material Testing [https://www.thermofisher.com/fr/en/home/industrial/spectroscopy-elemental-isotope-analysis/portable-analysis-material-id/portable-pharmaceutical-qa-qc-manufacturing-solutions/truscan-rm-handheld-raman-analyzer-material-verification.html]
- 57. Raman Spectroscopy for Pharmaceutical [https://www.horiba.com/usa/scientific/products/raman-imaging-and-spectrometers/raman-application-corner/raman-spectroscopy-for-pharmaceutical/]
- 58. Vaya Handheld Raman Spectrometer for Raw Material ... [https://www.agilent.com/en/product/molecular-spectroscopy/raman-spectroscopy/raman-pharmaceutical-analysis-systems/vaya-handheld-raman-spectrometer-for-raw-material-identification?srsltid=AfmBOoprgCXC3y3fj5xrmhlsMWCcfOtSUriS8gyGjmqgzGzi3lCKWPzY]
- 59. 空间偏移拉曼光谱技术的发展及应用 ... [http://sciencechina.cn/scichina2/detail_s.jsp;jsessionid=6E0AD6CAB0B997D1D55EF6A0B86F3E3D?detailType=1&internal_id=6479233&CID=]
- 60. Seeing Through Opaque Packaging with Raman Technology [https://www.azom.com/article.aspx?ArticleID=23085]
- 61. Raman spectroscopy for identifying postconsumer ... [https://pubmed.ncbi.nlm.nih.gov/40459434/]
- 62. Vibrational Spectroscopy in Forensic Science: A New ... [https://www.sciepublish.com/article/pii/765]
- 63. Advantages of 1064-nm Portable Raman for Counterfeit ... [https://www.spectroscopyonline.com/view/advantages-1064-nm-portable-raman-counterfeit-pharmaceuticals-authentication]
- 64. HORIBA Announces New Rapid Raman Plate Reader for ... [https://www.horiba.com/int/company/news/detail/news/3/2025/horiba-announces-new-rapid-raman-plate-reader-for-high-throughput-screening/]
- 65. 2025 Review of Spectroscopic Instrumentation [https://www.spectroscopyonline.com/view/2025-review-of-spectroscopic-instrumentation]
- 66. How to Reduce Fluorescence in Raman Spectroscopy [https://www.edinst.com/resource/technical-note-how-to-reduce-fluorescence-in-raman-spectroscopy/]
- 67. Avoiding Interference from Fluorescence Signal by Performing ... [https://jascoinc.com/applications/avoiding-interference-from-fluorescence-signal-by-performing-raman-spectroscopy-measurements-at-excitation-wavelength-of-1064-nm/]
- 68. Extreme Fluorescence Interference in Raman Microscopy [https://www.edinst.com/resource/extreme-fluorescence-interference-raman-microscopy/]
- 69. Time-gating and Other Fluorescence Suppression ... [https://www.timegate.com/resources/blog/time-gating-and-other-fluorescence-suppression-techniques]
- 70. 1064-nm Raman: The Right Choice for Biological Samples? [https://www.spectroscopyonline.com/view/1064-nm-raman-right-choice-biological-samples]
- 71. Overcoming the fluorescent interference during Raman ... [https://www.sciencedirect.com/science/article/abs/pii/S0048969723039566]
- 72. Portable Spatially Offset Raman Spectroscopy for Rapid ... [https://www.spectroscopyonline.com/view/portable-spatially-offset-raman-spectroscopy-rapid-hazardous-materials-detection-within-sealed-conta]
- 73. Seeing Through Layers: Analyzing Multi-Layer Packaging with Raman ... [https://www.horiba.com/deu/company/news/detail/news/4/2025/seeing-through-layers-analyzing-multi-layer-packaging-with-raman-spectroscopy/]
- 74. Not Too Hot: The Importance of Optimizing Laser Power ... [https://www.spectroscopyonline.com/view/not-too-hot-the-importance-of-optimizing-laser-power-for-surface-enhanced-raman-spectroscopy-sers-measurements]
- 75. Streamline your raw materials identification process using ... [https://www.spectroscopyonline.com/view/streamline-your-raw-materials-identification-process-using-handheld-solution-for-through]
- 76. Tips of Raman measurement (minimizing fluorescence ... [https://www.jasco-global.com/solutions/tips-of-raman-measurement-minimizing-fluorescence-using-a-457nm-laser-excitation-wavelength/]
- 77. Laser Wavelength Dependence of Background ... [https://pmc.ncbi.nlm.nih.gov/articles/PMC3775384/]
- 78. Optimization of diffuse Raman spectroscopy for in-vivo ... [https://pmc.ncbi.nlm.nih.gov/articles/PMC10898571/]
- 79. Recent progress and applications of Raman spectrum ... [https://www.sciencedirect.com/science/article/abs/pii/S0165993624000608]
- 80. Denoising and Baseline Correction Methods for Raman ... [https://www.mdpi.com/1424-8220/24/10/3161]
- 81. Raman Spectrum Denoising Using Deep Learning [https://opg.optica.org/abstract.cfm?uri=Translational-2025-TM1F.3]
- 82. Application of Raman Spectroscopy Coupled With ... [https://pmc.ncbi.nlm.nih.gov/articles/PMC12433757/]
- 83. Explainable AI-Based Feature Selection Approaches for ... [https://pmc.ncbi.nlm.nih.gov/articles/PMC12385318/]
- 84. Emerging Applications, Explainable AI, and Future Trends [https://www.spectroscopyonline.com/view/recent-research-in-chemometrics-and-ai-for-spectroscopy-part-ii-emerging-applications-explainable-ai-and-future-trends]
- 85. Elucidating the Variability of Magnesium Stearate and ... [https://www.sciencedirect.com/science/article/abs/pii/S0022354918307895]
- 86. Impact of Different Hydrate Forms of Magnesium Stearate ... [https://pmc.ncbi.nlm.nih.gov/articles/PMC12195998/]
- 87. Impact of Different Hydrate Forms of Magnesium Stearate ... [https://pubmed.ncbi.nlm.nih.gov/40574026/]
- 88. TruScan Handheld Raman Analyzer for Pharmaceutical ... [https://www.thermofisher.com/us/en/home/industrial/spectroscopy-elemental-isotope-analysis/portable-analysis-material-id/portable-pharmaceutical-qa-qc-manufacturing-solutions/truscan-rm-handheld-raman-analyzer-pharmaceutical-material-Identification-faqs.html]
- 89. Pharmaceutical Hydrates Analysis—Overview of Methods ... [https://pmc.ncbi.nlm.nih.gov/articles/PMC7601571/]
- 90. Specificity and Selectivity of Raman Spectroscopy for the ... [https://pmc.ncbi.nlm.nih.gov/articles/PMC12185781/]
- 91. Comparison of Laboratory and Handheld Raman ... [https://www.spectroscopyonline.com/view/comparison-laboratory-and-handheld-raman-instruments-identification-counterfeit-medicines]
- 92. Comparative Study on Handheld, Modular, and Laboratory ... [https://www.mdpi.com/2076-3417/14/2/791]
- 93. Handheld Raman spectrometer [https://www.sciencegears.com.au/handheld-raman-spectrometers]
- 94. Raman Spectroscopy Market Size 2025 to 2034 [https://www.precedenceresearch.com/raman-spectroscopy-market]
- 95. Evaluation of Shifted-Excitation Raman ... | Spectroscopy Online [https://www.spectroscopyonline.com/view/evaluation-of-shifted-excitation-raman-difference-spectroscopy-and-comparison-to-ordinary-portable-raman-spectroscopy-in-identification-of-seized-drugs]
- 96. chemical analysis for drug investigations promises more... Portable [https://cen.acs.org/analytical-chemistry/forensic-science/Drug-tests-portable-analytical-instruments/101/i13]
- 97. The Versatility of Portable Raman in Process Development [https://www.spectroscopyonline.com/view/versatility-portable-raman-process-development]
- 98. Utilization of a portable Raman spectrometer combined ... [https://www.sciencedirect.com/science/article/abs/pii/S2212429223011161]
- 99. AI-Powered Raman Spectroscopy Signals New Era for ... [https://www.spectroscopyonline.com/view/ai-powered-raman-spectroscopy-signals-new-era-for-drug-development-and-disease-diagnosis]
- 100. Raman Analyzers Market Insights into Portable Spectroscopy ... [https://roboticsnautomation.wordpress.com/2025/11/03/raman-analyzers-market-insights-into-portable-spectroscopy-solutions/]
- 101. Raman Analyzers Market Set to Shine with Expanding ... [https://www.openpr.com/news/4246159/raman-analyzers-market-set-to-shine-with-expanding-applications]
- 102. Raman spectroscopy and machine learning for early ... [https://www.nature.com/articles/s41598-025-20270-9]
- 103. Integrating spectroscopy with machine learning and deep ... [https://www.sciencedirect.com/science/article/abs/pii/S1386142525012703]
- 104. An Interview with 2025 Emerging Leader in Molecular ... [https://www.spectroscopyonline.com/view/harnessing-raman-spectroscopy-and-machine-learning-for-liquid-biopsy-classification-an-interview-with-2025-emerging-leader-in-molecular-spectroscopy-award-winner-lingyan-shi]
- 105. A smart handheld Raman spectrometer with cloud and AI ... [https://www.spiedigitallibrary.org/conference-proceedings-of-spie/10983/1098308/A-smart-handheld-Raman-spectrometer-with-cloud-and-AI-deep/10.1117/12.2519139.short]