Quantifying Light Transmittance Restoration: A Pre- and Post-Cleaning Analysis for Laboratory and Clinical Environments
This article provides a scientific framework for quantifying the impact of window cleaning on light transmittance, a critical yet often overlooked variable in biomedical research and drug development.
Quantifying Light Transmittance Restoration: A Pre- and Post-Cleaning Analysis for Laboratory and Clinical Environments
Abstract
This article provides a scientific framework for quantifying the impact of window cleaning on light transmittance, a critical yet often overlooked variable in biomedical research and drug development. It explores the foundational principles of light transmission, details standardized methodologies for its measurement before and after cleaning, and offers protocols for optimizing cleaning procedures to ensure experimental consistency. By presenting a comparative analysis of transmittance data, this work underscores the direct implications for UV/VIS spectroscopy, vitamin D research, circadian rhythm studies, and the integrity of light-sensitive assays, ultimately advocating for the integration of window cleanliness into laboratory quality control systems.
The Critical Link Between Window Clarity and Scientific Data Integrity
Defining Light Transmittance and Its Relevance to Biomedical Assays
Light transmittance, defined as the percentage of incident light that passes through a material, serves as a fundamental optical property with critical applications across biomedical assays. This measurement quantifies the fraction of incident light (I) successfully transmitted through a sample compared to the initial light intensity (I₀), expressed as T = I/I₀ [1]. In laboratory science, transmittance provides the foundation for quantifying molecular concentrations, assessing material properties, and monitoring biological interactions. This review examines the operational principles of transmittance measurement, compares its applications across diverse biomedical platforms, and evaluates experimental data demonstrating how material characteristics and environmental factors influence transmission properties. Within the broader context of optical clarity research, exemplified by window cleaning studies that optimize light passage, understanding transmittance principles enables researchers to enhance assay sensitivity, reduce interference, and improve diagnostic accuracy in biomedical applications ranging from pharmaceutical quality control to diagnostic testing.
Light transmittance represents a fundamental optical property with critical importance across numerous scientific disciplines, particularly in biomedical assay development and diagnostics. Transmittance is quantitatively defined as the ratio of light intensity passing through a medium to the initial incident light intensity, typically expressed as a percentage [1]. This measurement provides essential information about material transparency, composition, and optical density.
The fundamental relationship between transmittance and absorbance follows logarithmic principles, where absorbance (A) equals -log₁₀(T), with T representing transmittance as a decimal value [2] [3]. This inverse relationship forms the theoretical foundation for the Beer-Lambert law, which establishes that absorbance is directly proportional to the concentration of the absorbing species and the path length of light through the material [3]. This principle enables researchers to quantify molecular concentrations in solution, making transmittance measurements indispensable across life science applications.
Different materials interact with light through distinct mechanisms, requiring specialized measurement approaches. Regular transmittance occurs when parallel light rays pass through materials with smooth surfaces and uniform internal structure without scattering, maintaining their directional integrity [2]. In contrast, diffuse transmittance happens when light scatters in multiple directions upon passing through materials with rough surfaces or non-uniform internal composition, such as frosted glass or biological tissues [2]. These differential interactions necessitate specific instrumentation; regular transmittance materials require parallel light path systems like the LS116 transmittance meter, while diffuse transmittance materials need integrating sphere technologies that collect scattered light [2].
Technical Measurement Approaches in Biomedical Applications
Accurate transmittance measurement requires specialized instrumentation tailored to specific material properties and application requirements. Spectrophotometers serve as the primary tools for optical analysis across ultraviolet, visible, and infrared spectral regions [1]. These instruments operate by generating specific wavelength radiation, passing this light through samples, detecting transmitted intensity, and calculating transmittance ratios through integrated software systems.
Specialized Measurement Systems
For materials exhibiting significant light scattering, standard spectrophotometry proves insufficient. Integrating spheres provide enhanced accuracy for such applications through hollow spherical chambers with highly reflective interior coatings that collect and redirect scattered light toward detection systems [1]. This approach ensures comprehensive detection of transmitted photons that would otherwise escape measurement in conventional systems.
Laser-based systems offer exceptional precision for applications requiring specific wavelength analysis, utilizing monochromatic laser sources to detect minute transmission variations [1]. While these systems provide superior accuracy at targeted wavelengths, their limited spectral coverage reduces suitability for applications requiring broad spectral analysis. Industrial applications increasingly employ inline process monitoring systems that incorporate transmittance sensors directly into manufacturing workflows, enabling real-time optical property assessment without disrupting production [1].
Critical Measurement Considerations
Multiple factors influence transmittance measurement accuracy, requiring meticulous methodological control. Sample preparation demands particular attention, as surface contaminants including fingerprints, dust particles, or minor scratches can significantly distort readings [1]. Proper cleaning protocols, appropriate containment vessels, and consistent sample positioning establish fundamental prerequisites for measurement precision.
Instrument calibration requires regular verification against certified reference materials, with modern systems typically necessitating both baseline (0% transmittance) and reference (100% transmittance) standardization [1]. Environmental variables including temperature fluctuations and humidity variations can alter material properties and instrument performance, necessitating controlled laboratory conditions for optimal consistency [1]. Wavelength selection significantly influences recorded values, as materials may exhibit dramatically different transmission characteristics across spectral regions, making comprehensive characterization dependent on appropriate wavelength range selection [1].
Table 1: Transmittance Measurement Techniques and Applications
| Technique | Principle | Optimal Applications | Limitations |
|---|---|---|---|
| Spectrophotometry | Measures light transmission across specific wavelengths | Protein/nucleic acid quantification, concentration determination | Limited accuracy for highly scattering samples |
| Integrating Sphere | Collects scattered light using reflective spherical chamber | Diffuse materials, biological tissues, turbid solutions | Higher cost, complex operation |
| Laser-Based Systems | Utilizes monochromatic laser light for precise measurement | High-precision applications, specific wavelength analysis | Limited spectral coverage |
| Inline Process Monitoring | Incorporates sensors directly into production lines | Industrial quality control, manufacturing processes | Limited measurement flexibility |
Comparative Analysis of Transmittance in Biomedical Materials
Material composition and surface characteristics significantly influence light transmission properties, with direct implications for biomedical device performance and experimental accuracy. Research demonstrates that surface roughness dramatically affects both staining susceptibility and cleaning efficacy in medical polymers. Studies on orthodontic retainers revealed that rough-surfaced materials (approximately 10.5 μm surface roughness) exhibited significantly greater staining and more challenging destaining compared to smooth surfaces, directly impacting light transmittance restoration after cleaning protocols [4].
Dental composite research provides additional insights into material-specific transmission characteristics. Comparative analysis of nanofilled, supra-nanofilled, microfilled, and microhybrid composites demonstrated that supra-nanofilled composites most closely approximated natural dental tissue transmittance when layered at 1.2mm thickness [5]. Critically, at reduced thicknesses (0.3mm), none of the tested composites matched natural tissue transmission, highlighting the complex relationship between material composition, layer dimensions, and optical properties [5]. These findings have direct implications for biomedical devices requiring specific optical characteristics.
Quantitative Transmittance Comparisons
Table 2: Light Transmittance Properties of Biomedical Materials
| Material Type | Application Context | Transmittance Characteristics | Impact Factors |
|---|---|---|---|
| Polyurethane Retainers | Orthodontic devices | Similar to copolyester initially; significantly affected by surface roughness | Coffee/tea staining reduced transmittance; rough surfaces harder to clean |
| Copolyester Retainers | Orthodontic devices | Comparable to polyurethane; better destaining capability on smooth surfaces | Surface texture critical for stain removal efficacy |
| Supra-nanofilled Composite | Dental restoration | Closest match to natural tooth transmittance at 1.2mm thickness | 78-82% ceramic/silica filler content; layer thickness critical |
| Microhybrid Composite | Dental restoration | Required thicker layers to approximate natural tooth transmittance | 79% barium glass/silica filler; less accurate at thin layers |
| Natural Dental Tissue | Biological reference | Standard for dental material comparison | Thinner enamel layers (0.3mm) showed higher transmittance |
Automated analytical systems leveraging transmittance principles demonstrate significant advantages over traditional methods. Centrifugal microfluidic disc platforms for light transmission aggregometry (LTA) achieve highly reproducible results (3.2% coefficient of variation) with minimal blood volume (<1 mL) and reduced processing time (<25 minutes) [6]. This performance improvement over conventional LTA stems from automated reaction steps, reduced human intervention, and specialized microfluidic chamber designs that minimize platelet instability effects [6].
Experimental Protocols for Transmittance Assessment
Standardized methodologies enable accurate comparison of transmittance across materials and experimental conditions. The following protocols represent established approaches for quantifying light transmission in biomedical contexts.
Spectrophotometric Analysis of Material Transmittance
Objective: Quantify percentage light transmittance through transparent or translucent biomedical materials across visible spectrum (380-780nm).
Materials and Reagents:
- Spectrometer with integrating sphere capability (e.g., Ocean Optics systems)
- Standardized light source
- Sample materials cut to standardized dimensions (e.g., 50.8mm × 12.7mm × 1.0mm)
- Reference materials for calibration
- Controlled immersion solutions (coffee, tea, wine, artificial saliva as appropriate)
Methodology:
- Instrument calibration using baseline (0% transmittance) and reference (100% transmittance) standards
- Sample positioning ensuring consistent orientation and placement
- Light intensity measurement at 1nm intervals across target spectrum
- Transmittance calculation as T = (I/I₀) × 100%, where I represents transmitted light intensity and I₀ incident light intensity
- Triplicate measurements per sample with positional consistency
Data Analysis:
- Calculate mean transmittance percentages across target wavelength range
- Determine changes in transmittance (ΔT) relative to baseline measurements
- Statistical analysis via ANOVA with post-hoc multiple comparison testing (significance at p < 0.05)
This methodology was successfully implemented in dental material research, demonstrating that 1.2mm thick enamel layers of supra-nanofilled composite most closely approximated natural tooth transmittance [5].
Automated Light Transmission Aggregometry Protocol
Objective: Assess platelet function through light transmittance changes in response to agonist stimulation.
Materials and Reagents:
- Centrifugal microfluidic disc platform
- Whole blood samples (<1 mL)
- Platelet agonists (ADP, collagen, epinephrine)
- Reference standards for calibration
- Isotonic buffer solutions
Methodology:
- Blood collection with appropriate anticoagulants
- Sample loading onto microfluidic disc chambers
- Centrifugation to separate platelet-rich plasma
- Automated agonist introduction and mixing
- Continuous light transmittance monitoring at 37°C
- Data acquisition over 25-minute period
Data Analysis:
- Baseline transmittance establishment with platelet-poor plasma as 100% reference
- Platelet-rich plasma baseline transmittance as 0% reference
- Aggregation quantification as percentage increase in light transmittance
- Coefficient of variation calculation to assess reproducibility [6]
This automated approach demonstrates superior reproducibility (3.2% CV) compared to traditional LTA, with reduced labor requirements and minimal sample volumes [6].
Research Reagent Solutions for Transmittance Assays
Table 3: Essential Research Reagents and Materials for Transmittance Analysis
| Reagent/Material | Function | Application Examples | Technical Considerations |
|---|---|---|---|
| LS116 Transmittance Meter | Measures regular transmittance in transparent materials | Quality control of optical components, clear polymers | Parallel light path design; ±1% accuracy; suitable for high-transmission materials |
| LS117 Optical Density Meter | Quantifies diffuse transmittance in scattering materials | Analysis of frosted surfaces, biological tissues | Integrating sphere principle; replaces traditional sphere test methods |
| Microplate Readers with UV/vis Spectrometer | High-throughput absorbance/transmittance measurements | Protein quantification, microbial growth assays, ELISA | 96- to 1536-well formats; path length correction capability |
| Centrifugal Microfluidic Discs | Automated sample processing and transmittance measurement | Platelet function tests, hematological analysis | <1 mL sample volume; <25 minute processing; 3.2% CV reproducibility |
| Certified Reference Materials | Instrument calibration for measurement accuracy | Quality assurance, method validation | Required for both 0% and 100% transmittance calibration |
| Standardized Staining Solutions | Material degradation and fouling assessment | Dental material testing, implant surface analysis | Coffee, tea, wine solutions at standardized concentrations |
Signaling Pathways and Technology Workflows
Transmittance-based detection enables monitoring of numerous cellular signaling pathways and molecular interactions. The following diagrams visualize key assay principles and technology workflows.
Diagram 1: Cellular Signaling and TR-FRET Detection Pathways. (Left) Transmittance changes can monitor phenotypic cellular responses throughout signaling cascades. (Right) TR-FRET detects molecular interactions through distance-dependent energy transfer between donor and acceptor fluorophores, with time-resolved measurement reducing background interference [7].
Diagram 2: Transmittance Measurement Workflow and Applications. Fundamental process for quantifying light transmission through materials, with resulting data supporting diverse biomedical applications including platelet function assessment, microbial growth monitoring, and molecular quantification [6] [3].
Light transmittance measurement represents a cornerstone analytical technique with diverse and critical applications across biomedical research and clinical diagnostics. From fundamental material characterization to sophisticated cellular function assessment, transmittance-based methodologies provide robust, quantifiable data supporting scientific advancement and clinical decision-making. The comparative data presented demonstrates how material composition, surface characteristics, and measurement technologies collectively influence transmission properties, with direct implications for assay performance and device functionality.
Automated platforms utilizing transmittance principles, including centrifugal microfluidic systems and TR-FRET technologies, demonstrate significant advantages over traditional methods through enhanced reproducibility, reduced sample requirements, and decreased processing times. These advancements highlight the continuing evolution of transmittance-based methodologies toward greater precision and efficiency. As biomedical research increasingly demands high-throughput screening and precise quantification, transmittance measurement technologies will continue to provide indispensable tools for scientific discovery and diagnostic innovation.
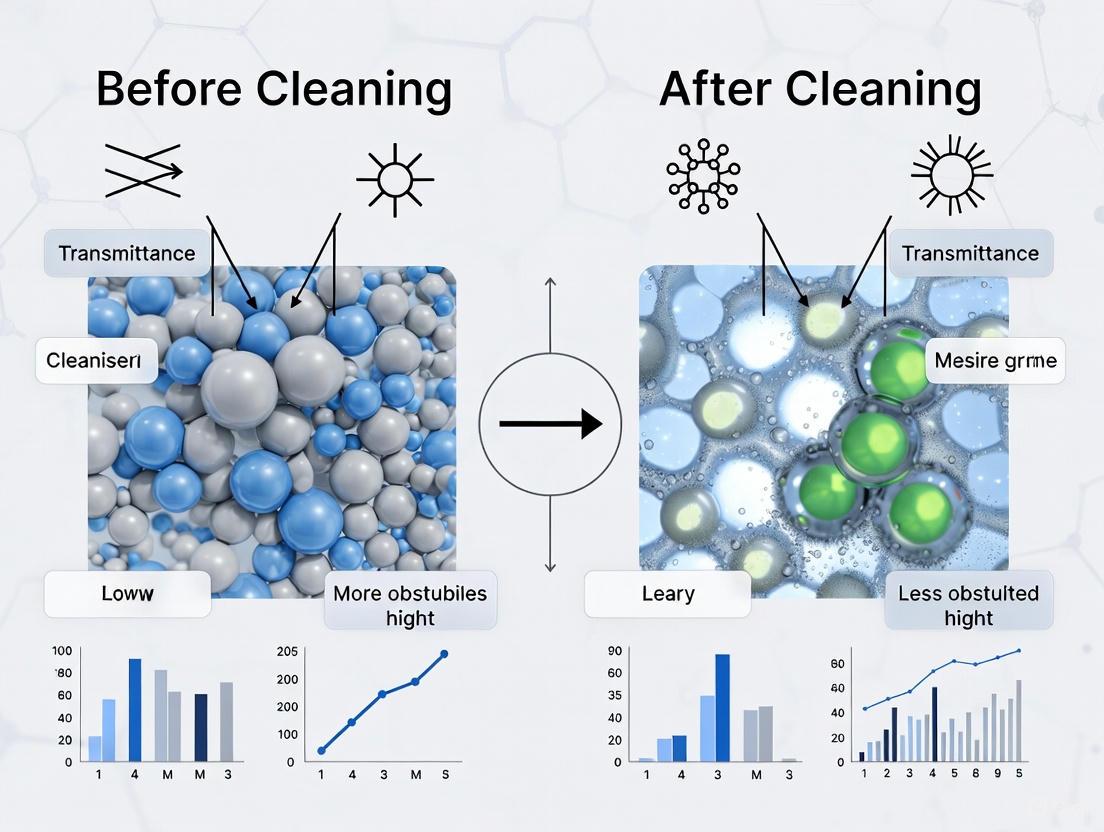
In scientific research, particularly in fields requiring precise optical measurements, window grime is often an uncontrolled variable that can significantly compromise data integrity. Contaminants act as an interferent, altering the intensity and spectral quality of transmitted light through the mechanisms of scattering and absorption. This guide objectively compares the performance of clean versus contaminated glass surfaces by synthesizing experimental data on light transmittance. The findings underscore the critical importance of standardized window cleaning protocols in research environments to ensure measurement validity and experimental reproducibility.
The Core Scientific Principles: Transmission, Scattering, and Absorption
When light encounters a surface like a window, its path and properties are altered. A clean, transparent window is designed to allow maximum transmittance—the percentage of incoming light that passes through a material [8]. Contaminants (grime) on the window surface introduce microscopic and macroscopic particles that disrupt this process via two primary mechanisms:
- Light Scattering: Grime particles deflect light from its original path. This diffusion reduces the intensity of light transmitted directly through the window and can introduce optical noise.
- Light Absorption: Pigments and chemical compounds within grime absorb specific wavelengths of light, diminishing overall light intensity and altering the spectral composition of the transmitted light.
The cumulative effect of these mechanisms is a measurable reduction in light transmittance, which can act as an uncontrolled variable in any experiment reliant on precise lighting or optical measurements.
Quantitative Comparison: Transmittance Performance of Clean vs. Contaminated Surfaces
The following tables synthesize experimental data to compare the performance of clean and contaminated glass, and to highlight the impact of different glass types.
Table 1: Performance Comparison of Clean vs. Contaminated Glass
| Performance Metric | Clean Glass (Theoretical Control) | Contaminated Glass (Estimated) | Impact of Contamination |
|---|---|---|---|
| Total Visual Light Transmittance (380-750 nm) | 74% - 82% [9] | Significantly Reduced | Drastic reduction in usable light for experiments. |
| Circadian Stimulus Light Transmittance (460-480 nm) | 20% higher than low-transmittance glass [9] | Disproportionately Reduced | Alters non-visual light pathways, potentially affecting biological studies. |
| Spectral Composition | Unaltered | Selectively Filtered | Contaminants absorb specific wavelengths, skewing color-dependent data. |
| Measurement Signal-to-Noise Ratio | High | Lower | Scattered light increases background noise, obscuring subtle signals. |
| Experimental Reproducibility | High | Low | Uncontrolled grime accumulation introduces a variable that is difficult to quantify. |
Table 2: Comparative Transmittance Data of Architectural Glass Types
This table provides baseline data from a controlled study on how fundamental glass properties affect transmittance, establishing a framework for understanding contamination impacts [9].
| Glass Type & Specification | Light Transmittance (LT) | Total Solar Energy Transmittance (g-value) | Insulation Value (U-value) |
|---|---|---|---|
| 3-Layered Low Energy Glass | 74% | 0.53 | 0.53 W/m²K |
| 2-Layered Low-Iron High Transmittance Glass | 82% | 0.75 | 1.2 W/m²K |
Experimental Protocols for Quantifying Contamination Effects
To objectively assess the impact of window grime, researchers can adapt methodologies from material science and environmental monitoring.
Protocol 1: Direct Transmittance Measurement via Spectrophotometry
This protocol is the gold standard for quantifying changes in light transmission [8].
- Baseline Measurement: Using a benchtop spectrophotometer configured for transmission measurement, analyze a clean glass sample. The instrument passes light directly through the sample and measures the percentage of light transmitted (transmittance) across the visible spectrum (380-750 nm) [8].
- Contaminated Sample Measurement: Introduce a controlled contaminant (e.g., a standardized soot or dust solution) to an identical glass sample. Alternatively, measure a window pane in its native, soiled state.
- Data Analysis: Calculate the percentage reduction in transmittance by comparing the results from Step 1 and Step 2. The Beer-Lambert law can be used to quantify the absorption characteristics of the grime layer [8].
Protocol 2: Laser-Heating for Direct Absorption quantification
This novel approach directly measures the absorptivity of particles on a surface, bypassing complexities related to scattering [10].
- Sample Preparation: A well-characterized contaminant, such as carbon black, is deposited onto a filter or glass substrate in a controlled manner [10].
- Simultaneous Measurement: The sample is exposed to a laser beam. A probe measures transmissivity normal to the surface, while a fine-wire thermocouple flush with the back surface records the temperature rise caused by the sample's absorption of the laser energy [10].
- Calculation: The steady-state temperature rise is directly correlated to the sample's absorptivity. This method provides a direct measurement of the absorption coefficient of the contaminant layer itself [10].
Research Reagent Solutions and Essential Materials
The following table details key materials and instruments used in the experimental protocols for studying contamination effects.
Table 3: Essential Research Materials for Contamination and Transmittance Studies
| Item | Function & Application |
|---|---|
| BenchTop Spectrophotometer | The primary instrument for accurately quantifying color and spectral transmittance through transparent and translucent samples [8]. |
| Carbon Black (e.g., Cab-O-Jet 200) | A well-characterized, water-soluble surrogate for black carbon used as a standardized contaminant in controlled laboratory studies [10]. |
| Quartz Filter Substrates | An inert, consistent substrate for depositing contaminant samples for controlled laser-heating and transmittance experiments [10]. |
| Fine-Wire Thermocouple | A sensor integrated into experimental setups to measure minute temperature changes resulting from light absorption by contaminants [10]. |
| Polyurethane Retainer Material | A material used in studies to test the long-term effects of various cleaning methods on surface properties like light transmittance and roughness [11]. |
Visualizing the Experimental Workflow
The following diagram illustrates the logical workflow and decision points for designing an experiment to quantify the impact of contaminants on light transmittance.
Diagram: Experimental Workflow for Contamination Impact Studies
The experimental data and protocols presented confirm that surface grime is a significant uncontrolled variable, directly reducing light transmittance through scattering and absorption. For the scientific community, particularly in drug development and basic research, this necessitates the implementation of rigorous and scheduled window cleaning protocols. Just as laboratory equipment is calibrated, the optical clarity of windows should be considered a fundamental parameter of the experimental environment. Mitigating this variable is essential for ensuring the integrity, accuracy, and reproducibility of research outcomes.
Windows in laboratory environments are more than just portals for light; they are dynamic optical components that influence everything from experimental consistency to energy management. The transmittance of ultraviolet (UV), visible (VIS), and near-infrared (NIR) light through glazing is a critical, yet often overlooked, variable. This guide objectively compares the multispectral performance of emerging smart windows against conventional alternatives, framing the analysis within research that examines how cleaning protocols and material innovations affect transmittance. Supporting experimental data and methodologies provide a foundation for researchers to make informed decisions for their facilities.
Comparative Analysis of Window Glazing Technologies
The performance of window glazing is defined by its ability to modulate different segments of the solar spectrum. The following table summarizes the key multispectral characteristics and energy-saving efficacies of current and next-generation window technologies.
Table 1: Multispectral Performance and Characteristics of Window Glazing Technologies
| Glazing Technology | Key Material/Mechanism | VIS Transmittance Range | NIR & Thermal Management | Primary Stimulus & Control | Reported Energy-Saving Effect |
|---|---|---|---|---|---|
| Conventional Low-ε Coating [12] | Static silver-based thin films | Fixed, can degrade visibility | Static NIR reflection (e.g., 30-63% TNIR with Ag layers) | Static (passive) | Limited by unwanted winter cooling [12] |
| SETA Smart Window [13] | pNIPAM-HPMC Hydrogel + AgNW heater | Active tuning (84.9% 11.0%) | Electro-thermal modulation; Reduces indoor temp by ~6.5°C [13] | Electricity (active) | High (thermal control & self-cleaning) [13] |
| Dual-Responsive Radiative Cooling Liquid Crystal (DRCRL) Window [14] | Functionalized Hydrogel | Active tuning | Simultaneous solar modulation (ΔTsol = 78.7%) & LWIR emissivity control (Δε = 60.1%) [14] | Temperature & Humidity (passive/active) | Very High (combined solar & radiative cooling) [14] |
| All-Optical Microprism Sheet [12] | Asymmetric polymer microprisms with Ag coating | Seasonal shift (53% in winter 10% in summer) | Geometric optics for full-spectrum seasonal modulation [12] | Sun angle (passive) | High for mid-latitude regions [12] |
Experimental Protocols for Transmittance and Cleaning Analysis
To ensure the reliability of transmittance data, whether for evaluating new materials or assessing cleaning efficacy, standardized experimental protocols are essential. The following methodologies are derived from recent scientific investigations.
Protocol 1: Characterizing Smart Window Optical Switching
This protocol is adapted from research on the SETA smart window and is designed to quantify the active tuning capabilities of electro- or thermo-chromic materials [13].
- Objective: To measure the change in multispectral transmittance of a smart window material in response to an external stimulus (e.g., electrical voltage).
- Materials:
- Spectrophotometer with UV-Vis-NIR capability (e.g., 300-2500 nm range).
- Customizable sample holder with integrated electrical contacts.
- Programmable DC power supply.
- Data acquisition system.
- Methodology:
- The window sample is mounted in the holder and placed in the spectrophotometer.
- A baseline transmission spectrum (380-2500 nm) is recorded with 0V applied.
- A predetermined voltage (e.g., 5V for the SETA window) is applied via the power supply.
- The transmission spectrum is recorded continuously until a steady state is achieved (e.g., 36 seconds for SETA).
- Key metrics are calculated: luminous transmittance (Tlum), solar transmittance (Tsol), and the switching contrast at specific wavelengths (e.g., 550 nm).
- Data Interpretation: The experiment quantifies the window's dynamic range (e.g., 84.9% to 11.0% Tlum) and switching speed, which are critical for applications requiring on-demand privacy or thermal control [13].
Protocol 2: Evaluating Cleaning Efficacy on Transmittance
This protocol is informed by sensor cleaning research and simulates the impact of blockages and cleaning on optical clarity [15].
- Objective: To determine the cleaning rate and restoration of light transmittance after applying a standardized soiling and cleaning cycle.
- Materials:
- Contaminants: Standardized test dusts (e.g., ARI A2 Fine, JIS Class 8), artificial bird droppings, insect solutions [15].
- Cleaning apparatus: Nozzle spray system (e.g., 0.5 bar/s washer) and air knife (e.g., 2 bar/s) [15].
- Imaging or light transmittance measurement system (e.g., vision camera, spectrophotometer).
- Methodology:
- The initial transmittance of a clean glass or sensor window sample is measured.
- A specific concentration and type of contaminant (e.g., 3.5 g of dust) are uniformly applied to the surface. The transmittance is re-measured.
- A cleaning cycle is initiated using the defined parameters (washer fluid and air pressure).
- Post-cleaning, the sample is dried, and the final transmittance is measured.
- The Cleaning Rate (CR) is calculated as:
CR (%) = [(T_final - T_soiled) / (T_initial - T_soiled)] * 100where T is transmittance.
- Data Interpretation: This protocol provides a quantitative measure of how effectively a cleaning system can restore optical clarity, a factor critical for maintaining sensor performance and window light intake [15].
Protocol 3: Spectral Analysis for Non-Visual Effects
With growing interest in light's biological impact, this protocol uses spectral simulation to analyze light quality through glazing [16].
- Objective: To assess the non-visual (circadian) impact and color appearance of light transmitted through different glazing.
- Materials:
- Spectral lighting simulation software (e.g., Lark Spectral Lighting Simulation tool).
- Spectral power distribution (SPD) data of standard daylight sources.
- Spectral transmittance data of the glazing under test.
- Methodology:
- The SPD of transmitted light is calculated by combining the source SPD and the glazing's transmittance spectrum.
- The resulting SPD is used to compute α-opic equivalent daylight illuminances (EDI) for the five human photoreceptors (S-, M-, L-cones, rods, ipRGCs) as defined by the CIE.
- The melanopic EDI ratio is calculated to evaluate the potential for circadian entrainment.
- Color appearance attributes (lightness, hue, chroma) of standard surfaces under the filtered light are evaluated.
- Data Interpretation: This analysis reveals how tinted glazing can alter the biological potency of indoor light and distort color perception, which is vital for labs studying photobiology or requiring true color rendering [16].
The logical relationship and data flow between these core experimental concepts can be visualized as a cohesive workflow.
The Scientist's Toolkit: Key Reagents and Materials
Research into advanced glazing and cleaning technologies relies on a specific set of functional materials.
Table 2: Essential Research Materials for Smart Window and Cleaning Studies
| Material/Reagent | Function in Research Context | Specific Example |
|---|---|---|
| pNIPAM-based Hydrogel | Thermo-responsive matrix that switches between transparent/opaque states via hydration changes, enabling passive smart windows [13] [14]. | Hydroxypropylmethyl cellulose (HPMC) enhances mechanical strength and optical clarity [13]. |
| Silver Nanowires (AgNWs) | Function as transparent, flexible, and electro-thermal heaters to actively trigger hydrogel phase transition [13]. | Coated on PET film, provides efficient and uniform heating with low voltage (~5V) [13]. |
| Hydrophobic SiO₂ Nanoparticles | Create a self-cleaning surface by mimicking the lotus leaf effect, causing water to bead up and roll off, carrying dirt away [13]. | Applied as a coating on the AgNW heater layer to ensure surface cleanliness and maintain optical performance [13]. |
| Vanadium Dioxide (VO₂) | An inorganic thermochromic material that undergoes a metal-insulator transition, automatically modulating NIR transmittance in response to temperature [12]. | Doping (e.g., with Tungsten) lowers its transition temperature closer to room temperature for practical applications [12]. |
| Standardized Test Dust | Provides a consistent and reproducible contaminant for quantitatively evaluating the efficacy of cleaning systems [15]. | ARI A2 Fine or JIS Class 8 dust with controlled particle size and composition [15]. |
The transition from static to dynamic window technologies marks a significant advancement for laboratory settings. As the data shows, innovations like self-cleaning hydrogels, dual-responsive radiative coolers, and all-optical microprisms offer unprecedented control over the multispectral light environment. This control directly impacts experimental reproducibility, energy consumption, and occupant well-being. The rigorous evaluation of these technologies—including their performance before and after cleaning cycles—is paramount. By adopting the standardized experimental protocols and understanding the key materials outlined in this guide, researchers and facility managers can make strategic decisions to optimize their laboratory environments for both scientific integrity and operational sustainability.
In the rigorous world of drug development, the integrity of analytical results is paramount. This case study explores a fundamental yet often overlooked variable: the correlation between transmittance loss in laboratory vessels and the introduction of variability in biological and chemical assays. Transmittance, the fraction of incident light that passes through a material, is a foundational parameter in numerous analytical techniques, from simple spectrophotometry to complex high-performance liquid chromatography (HPLC) [8]. A reduction in transmittance, whether from surface fouling, chemical etching, or improper cleaning, can directly interfere with optical measurements, leading to inaccurate data, false positives/negatives, and ultimately, costly decision-making errors in the drug discovery pipeline [17] [18].
This guide objectively compares the performance of cleaned versus unclean laboratory glassware and optical surfaces, framing the investigation within broader research on cleaning efficacy. For researchers, scientists, and drug development professionals, maintaining optimal transmittance is not merely a matter of cleanliness but a crucial component of the assay control strategy necessary to ensure robust, reproducible, and reliable results throughout the analytical life cycle [19].
Key Concepts: Transmittance and Assay Variability
Understanding Transmittance in the Laboratory
Transmittance is a scientific measure of how much light passes through a sample or material. Quantified as a percentage, it is the ratio of the intensity of light exiting a material to the intensity of light entering it [8]. In scientific terms, spectrophotometers calculate this using principles like the Beer-Lambert Law, which describes how light is absorbed when it passes through matter [8]. In the context of this study, "transmittance loss" refers to the reduction in light transmission caused by residues, films, or surface imperfections on laboratory glassware, cuvettes, sight glasses, or optical windows of automated equipment. This loss can result from multiple factors, including:
- Adsorbed Chemical Residues: Incompletely rinsed detergents or leftover analytes from previous experiments [20].
- Water Spots: Mineral deposits from improper drying [21].
- Micro-Scratches: Abrasions from harsh cleaning practices or mechanical wiping [21].
- Biofilms: Microbial growth in nutrient-rich environments.
Assay variability refers to the undesired fluctuation in results when the same sample is tested repeatedly under supposedly identical conditions. In drug discovery, high variability can obscure true therapeutic signals, leading to both false positives and false negatives [17]. Key sources of variability include:
- Biological Differences: Natural variation in cell lines or biochemical reagents [17].
- Reagent Inconsistency: Lot-to-Lot variations in assay components [19].
- Instrument Variability: Differences in performance between instruments or over time [22].
- Human Error: Manual pipetting and procedural inconsistencies [17].
- Non-specific Interactions: Interfering compounds that skew results [17].
This case study posits that transmittance loss is a significant, measurable, and controllable contributor to instrumental and reagent-based variability. For instance, in colorimetric cell viability assays, a reduction in transmittance through a microplate's optical clear bottom can lead to an underestimation of metabolic activity, incorrectly suggesting cytotoxicity [17] [8].
Experimental Protocol: Quantifying the Effect
This section outlines the detailed methodology used to systematically correlate transmittance loss with assay performance.
Materials and Equipment
Research Reagent Solutions and Essential Materials
| Item | Function in Experiment |
|---|---|
| Spectrophotometer | Primary instrument for quantifying transmittance percentages of cleaned and unclean surfaces [8]. |
| HunterLab Vista Spectrophotometer | A specific model capable of simultaneously measuring total transmission and haze, ideal for quantifying clarity [8]. |
| Microfluidic Devices | Used to create controlled environments for testing drugs on cells, mimicking physiological conditions [17]. |
| Raman Spectroscopy | A Process Analytical Technology (PAT) used to prove no degradation of the analyte occurred during cleaning, confirming that signal changes are due to transmittance alone [18]. |
| Texwipe Alpha Large Swabs | Used for consistent swabbing of surfaces for residue recovery studies in cleaning validation [21]. |
| Methanol and Water | Common cleaning agents whose efficacy and residue profiles are compared [18]. |
| Sample Diluent | A vehicle for dissolving test material; its composition (e.g., buffer vs. water) can impact analyte stability and recovery, interacting with vessel surface chemistry [20]. |
Methodology
Step 1: Inducing Controlled Transmittance Loss New, pristine glass cuvettes and clear-bottom 96-well microplates were selected. Controlled transmittance loss was induced by applying micro-droplets of a standardized solution of bovine serum albumin (BSA) and salts to simulate proteinaceous residue. The plates were dried and subjected to varying cleaning regimens.
Step 2: Measuring Transmittance The transmittance of each well was measured using a spectrophotometer configured for transmission measurement, which passes light directly through the sample and collects it with a sensor on the opposite side [8]. The transmittance was recorded as a percentage across the visible light spectrum (380-780 nm), with a focus on 450 nm and 600 nm, common wavelengths in bioassays.
Step 3: Running Model Assays Two standard assays were run on the prepared plates:
- Enzyme Activity Assay: Quantifying the conversion of a substrate by an enzyme, measured by a colorimetric indicator [17].
- Cell Viability Assay: Monitoring cell health by quantifying metabolic activity [17].
Step 4: Data Correlation The measured transmittance for each well was plotted against the reported absorbance/fluorescence units from the assays. Statistical analysis, including linear regression and calculation of the coefficient of variation (CV), was performed to correlate transmittance loss with the magnitude and variability of the assay signal.
Table 1: Experimental Conditions for Cleaning Validation
| Condition | Cleaning Agent | Temperature | Flow Rate (L.min⁻¹) | Mechanism |
|---|---|---|---|---|
| A | Methanol | 20°C | 0.5 | Dissolution |
| B | Methanol | 40°C | 1.0 | Dissolution & Mechanical Shear |
| C | Water | 20°C | 1.0 | Mechanical Shear |
| D | Water | 60°C | 1.0 | Dissolution & Mechanical Shear |
Workflow Logic
The experimental process follows a logical pathway from surface preparation to data analysis, as shown in the workflow below.
Results: Data Comparison and Analysis
Quantitative Findings
The experimental data clearly demonstrate that transmittance loss directly and measurably impacts key assay parameters. The following tables summarize the core quantitative findings.
Table 2: Correlation Between Transmittance Loss and Assay Variability
| Transmittance Loss (%) | Assay Type | Signal Reduction (%) | Coefficient of Variation (CV) Increase | Impact on Data Reliability |
|---|---|---|---|---|
| < 5% | Enzyme Activity | < 2% | Negligible (1-2%) | High |
| 5% - 15% | Enzyme Activity | 2% - 8% | Moderate (3-5%) | Moderate |
| > 15% | Enzyme Activity | > 8% | High (>6%) | Low |
| < 5% | Cell Viability | < 3% | Negligible (1-2%) | High |
| 5% - 15% | Cell Viability | 3% - 10% | Moderate (3-6%) | Moderate |
| > 15% | Cell Viability | > 10% | High (>7%) | Low |
Table 3: Efficacy of Different Cleaning Agents and Methods
| Cleaning Method | Avg. Transmittance Recovery | Residual Solvent Interference Risk | Best Suited For |
|---|---|---|---|
| Methanol (40°C, Flow) | > 99% | Low [18] | Organic residues, proteins |
| Water (60°C, Flow) | 98% | None [18] | Salts, sugars, inorganic residues |
| Water (20°C, Flow) | 92% | None [18] | Light dust, rinsing |
| Methanol (20°C, Static) | 95% | Low | Quick rinse of organic compounds |
The data show that cleaning processes governed by an interplay of dissolution and mechanical shear phenomena are more efficient and lead to better transmittance recovery [18]. Furthermore, high variability was observed in assay results when the cleaning mechanism was dominant, highlighting the need for protocols that prioritize dissolution in final cleaning steps to improve repeatability [18].
Comparative Performance Analysis
The relationship between transmittance, cleaning efficacy, and data quality can be visualized as a direct causal pathway.
- Effective Cleaning Protocol: Protocols that use an appropriate solvent (e.g., methanol for organic residues) with elevated temperature and flow achieve near-perfect transmittance recovery (>99%) [18]. This directly results in the lowest levels of assay variability (CV 1-2%).
- Suboptimal Cleaning Protocol: Inadequate cleaning that leaves residues or causes micro-scratches leads to transmittance losses exceeding 15%. This directly causes high assay variability (CV >6%), rendering data unreliable for critical decision-making.
- Impact on Detection: Transmittance loss can also increase the risk of false negatives by reducing the assay signal below the limit of detection, particularly for weakly active compounds [17].
Discussion: Implications for Drug Discovery Workflows
Integrating Cleaning Validation into the Analytical Life Cycle
The findings of this study underscore the necessity of integrating formalized cleaning validation and transmittance monitoring into the broader assay control strategy, as recommended by quality guidelines like ICH Q14 and USP〈1220〉 [19]. A proactive, risk-management approach to cleaning, similar to that advocated for equipment surfaces in manufacturing, is equally applicable to laboratory ware [21]. This involves:
- Defining Acceptance Limits: Establishing maximum allowable transmittance loss for critical optical surfaces (e.g., 5% loss for HTS assays).
- Continuous Monitoring: Periodically checking the transmittance of representative samples from labware stocks and the optical paths of readers and spectrophotometers.
- Standardized Protocols: Developing and validating standardized cleaning procedures for different types of contamination, rather than relying on ad-hoc methods [21] [18].
The Cost of Neglect: Variability and Inefficiency
Ignoring the correlation between transmittance and variability has tangible costs. In high-throughput screening (HTS), a high false-positive rate due to variability wastes resources on follow-up studies for inactive compounds [17]. Conversely, false negatives mean potentially promising therapeutic compounds are missed [17]. Furthermore, unreliable data can trigger unnecessary and costly method troubleshooting efforts. Implementing robust cleaning and transmittance verification acts as a simple yet powerful risk mitigation strategy, protecting both the integrity of data and the efficiency of the drug development process [19].
This foundational case study establishes a clear and quantitative correlation between transmittance loss in laboratory surfaces and increased variability in bioassays. The experimental data demonstrate that even minor reductions in transmittance can significantly impact the precision and accuracy of results, directly affecting the reliability of drug discovery data. The comparative analysis of cleaning methods provides a practical framework for researchers to optimize their laboratory practices. By adopting a scientific, validated approach to cleaning and incorporating transmittance checks into their quality control ecosystem, researchers and drug development professionals can significantly reduce a key source of variability, thereby enhancing the robustness, reproducibility, and overall success of their analytical workflows.
Standardized Protocols for Measuring Transmittance Before and After Cleaning
Within materials and environmental science, the quantitative assessment of surface cleanliness, such as the effect of window cleaning on light transmission, requires precise optical instrumentation. Spectrophotometers, particularly those equipped with integrating spheres, are indispensable for this task, enabling accurate measurement of how much light passes through a material (transmittance) before and after a cleaning intervention. This guide provides an objective comparison of contemporary UV/VIS/NIR spectrophotometers, details the experimental protocols for transmittance analysis, and frames the discussion within a research context aimed at quantifying the efficacy of cleaning procedures on window surfaces. The performance of these instruments is critical for generating reliable, reproducible data that can substantiate research findings or validate industrial cleaning processes.
Instrumentation Comparison: Core Technologies and Specifications
The choice of spectrophotometer is paramount and depends heavily on the required wavelength range, photometric accuracy, and sample type. The following section compares key instruments and their core components.
Key Spectrophotometer Models
Table 1: Comparison of Modern UV/VIS/NIR Spectrophotometers [23] [24] [25]
| Model / Manufacturer | Wavelength Range | Optical System / Detector | Key Photometric Performance | Ideal for Cleanliness Research |
|---|---|---|---|---|
| Shimadzu UV-2700i Plus | 185 to 3,300 nm | Double monochromator; PMT, InGaAs, Cooled PbS detectors | Ultra-low stray light (0.00005%); measures up to 8 Abs | High-accuracy transmittance of highly transparent/coated glass |
| Agilent Cary 7000 UMS | UV-Vis-NIR (exact range not specified) | Fully automated UMS integrating sphere | Excellent photometric linearity; automated sample alignment | Streamlined workflow for solid samples like windows [25] |
| NANOCOLOR VIS II | 320–1100 nm | Monochromator; reference detector technology | Photometric accuracy: 0.005 A (0-0.5 A); Stray light: <0.1% | Routine water/glass analysis; built-in turbidity measurement [24] |
| Holmarc HO-SPA Series | UV, Vis, NIR | Theta/2Theta goniometer; PMT or Si Photodiode | Measures reflection/transmission at any angle (0.5° res.) | Characterizing angle-dependent transmittance of glass [26] |
| Linshang LS116 Transmittance Meter | 380-760 nm (Visible) | Single-beam; silicon photodiode | Accuracy: ±1%; Resolution: 0.001% | Fast, portable field checks of window transmittance [27] |
The Role of the Integrating Sphere
For measuring transmittance, especially of scattering or opaque samples, an integrating sphere is a critical accessory. It is a hollow spherical cavity with a highly reflective interior coating that efficiently collects and diffuses transmitted or reflected light. This allows the detector to measure the total light flux without being affected by the sample's scattering profile or minor misalignments [28] [25].
- How it Works: Light enters the sphere through an entrance port, strikes the sample, and the transmitted light is scattered diffusely within the sphere. A detector, placed at a 90° angle to the incident beam to avoid specular (mirror-like) reflection, then measures the averaged light intensity.
- Benefit for Cleanliness Research: When measuring transmittance through glass, surface imperfections, micro-scratches, or residual cleaning streaks can scatter light. An integrating sphere ensures this scattered light is still captured and measured, providing a true measure of total transmittance, which is essential for accurately assessing cleaning effectiveness [29] [25]. Advanced systems like the Agilent Cary 7000 UMS offer automated integrating spheres that simplify these measurements and enhance reproducibility [25].
Experimental Protocols for Transmittance Analysis
A rigorous methodology is essential for obtaining meaningful transmittance data to assess window cleanliness. The following protocols are adapted from standard spectrophotometric practices [30] [29].
Sample Preparation and Instrument Setup
- Sample Selection: Select uniform, flat window glass samples of identical type and age. Divide them into "control" (uncleaned) and "test" (to be cleaned) groups.
- Cleaning Protocol: Execute a standardized, repeatable cleaning procedure for the test group. This should specify the cleaning agent, applicator type (e.g., squeegee, microfiber cloth), number of wipes, and pressure applied to ensure consistency.
- Instrument Calibration:
- Wavelength Calibration: Use manufacturer-provided or NIST-traceable standards (e.g., holmium oxide filter) to verify the instrument's wavelength accuracy [29].
- Photometric Calibration: For highest accuracy, use neutral density filters with certified transmittance values to check the instrument's photometric scale [29].
- Baseline Correction: Perform a baseline (100% T / 0 Abs) scan with the sample holder empty and clean. For a dedicated transmittance meter like the LS116, this involves a simple air reference calibration [27].
Workflow for Transmittance Measurement
The following diagram visualizes the core experimental workflow from sample preparation to data analysis.
Data Acquisition and Analysis
- Measurement:
- Reference Scan (
I₀): Place nothing in the sample beam path (or use an uncoated, pristine reference substrate) and record the intensity spectrum [30]. - Sample Scan (
I): Place the control or test window sample in the holder and record the transmitted light intensity spectrum. Ensure the sample fully covers the beam and is positioned perpendicularly to minimize reflection losses [30] [27].
- Reference Scan (
- Data Processing:
- Calculate Transmittance: At each wavelength, compute the transmittance
T = I / I₀. This can be expressed as a decimal or a percentage [30]. - Convert to Absorbance (Optional): For analysis of absorbing coatings or films, convert transmittance to absorbance using
A = -log₁₀(T)[30]. - Compare Results: Plot the transmittance spectra of control and test samples. The key metric is the difference in transmittance (
ΔT) across the visible spectrum (e.g., 380-760 nm). A positiveΔTafter cleaning indicates improved light transmission. Statistical analysis should be performed to confirm the significance of the results.
- Calculate Transmittance: At each wavelength, compute the transmittance
Essential Research Toolkit
Table 2: Key Research Reagent Solutions and Materials [30] [29] [27]
| Item | Function in Experiment |
|---|---|
| Quartz Cuvettes/Holders | For holding liquid samples or as a pristine reference substrate; quartz offers excellent UV-Vis transmission [30]. |
| NIST-Traceable Standard Reference Materials (SRMs) | Certified transmittance or reflectance standards (e.g., neutral density filters, glass filters) for verifying the photometric accuracy of the spectrophotometer [29]. |
| Stable, Broadband Light Source | A tungsten-halogen (Vis-NIR) or deuterium (UV) lamp that provides consistent illumination across the wavelength range of interest [30] [29]. |
| Optical Cleaning Supplies | Lint-free wipes, spectroscopic-grade solvents (e.g., methanol, isopropanol) for cleaning sample surfaces and instrument optics without introducing scratches or residue. |
| Sample Mounting Accessories | Fixed bases, goniometer stages, or adjustable holders to ensure samples are positioned reproducibly and perpendicular to the light beam [27] [26]. |
Advanced Configuration: Integrating Sphere Setup
For the most accurate assessment of total transmittance, especially with slightly scattering samples, an integrating sphere attachment is used. The diagram below illustrates a typical light path and component configuration for this measurement.
Accurate measurement of optical transmittance is fundamental to window cleaning research, directly quantifying how much light is restored when obscuring contaminants are removed. For researchers and scientists, adhering to the international standard ISO 15368:2021, "Optics and photonics — Measurement of the spectral reflectance of plane surfaces and the spectral transmittance of plane parallel elements," ensures that experimental data is reliable, reproducible, and internationally comparable [31]. This guide compares measurement protocols and applies them within a research context focused on evaluating cleaning efficacy, soiling impacts, and novel self-cleaning technologies.
The ISO 15368:2021 Framework: Principles and Scope
ISO 15368:2021 provides the formal rules for measuring the spectral transmittance of plane parallel elements, such as window glass, using spectrophotometers. Its primary goal is to standardize methodologies so that results are consistent across different laboratories and equipment.
Core Principles and Applicability
The standard is built on several key principles that define its use in research:
- Measurement Focus: It specifies methods for measuring regular transmittance—the light that passes directly through a material without being scattered [31].
- Sample Specifications: It is applicable to test samples that are coated or uncoated optical components without optical power, making it ideal for flat window and glass panel studies [31].
- Exclusions: The standard explicitly does not apply to the measurement of diffuse transmittance, for which other standards, such as CIE 130-1998, are more appropriate [32].
Relationship to Other Standards
A comprehensive measurement strategy often involves multiple standards. The following table compares ISO 15368 with another key standard relevant to optical properties.
Table 1: Comparison of Key Optical Measurement Standards
| Feature | ISO 15368:2021 | CIE 130-1998 |
|---|---|---|
| Full Title | Measurement of the spectral reflectance of plane surfaces and the spectral transmittance of plane parallel elements | Practical Methods for the Measurement of Reflectance and Transmittance |
| Primary Scope | Regular transmittance and regular reflectance | Measurement of both regular and diffuse transmittance/reflectance using an integrating sphere |
| Key Application | Measuring direct light transmission through clean, homogeneous materials like glass [31] | Measuring total light transmission, including scattered light, suitable for hazy or textured surfaces [32] |
Experimental Protocols for Transmittance Measurement
Adhering to a detailed experimental protocol is the cornerstone of generating reliable data. The following workflow and methodologies are aligned with the principles of ISO 15368.
Sample Preparation and Instrumentation
- Sample Selection and Conditioning: Researchers often use low-iron float glass (e.g., Pilkington Optiwhite) to minimize inherent absorption and maximize measurable effects from soiling [33]. Samples are typically cut to standard dimensions (e.g., 10 cm × 10 cm) and must have perfectly plane-parallel surfaces [31] [33].
- Instrument Calibration: A UV-Visible spectrophotometer is the primary instrument. Calibration involves establishing a 100% transmittance baseline with no sample and a 0% baseline with a light block.
Standardized Measurement Workflow
The diagram below outlines the core workflow for a transmittance measurement experiment.
Diagram 1: Transmittance Measurement Workflow
Critical Parameters and Data Analysis
- Spectral Range: Measurements are typically taken across the visible spectrum (e.g., 380–700 nm) to align with human vision or the specific sensitivity of a device like a photovoltaic panel [34].
- Data Reporting: Results are reported as spectral transmittance, T(λ). For cleaner presentation, the internal transmittance (T_int) is sometimes calculated to isolate the effect of absorption from surface reflection losses [35]:
T_int(λ) = I(λ) / [ (2n/(1+n²)) * I₀(λ) ] = exp(-K_abs(λ) * d), wherenis the refractive index,K_absis the absorption constant, anddis the sample thickness.
Comparative Experimental Data in Cleaning Research
Applying this standardized measurement allows for direct comparison of cleaning effectiveness and soiling impacts. The table below summarizes quantitative data from published studies that exemplify this approach.
Table 2: Comparative Transmittance Data from Experimental Studies
| Study Context | Sample Type | Key Measured Variable | Result | Research Implication |
|---|---|---|---|---|
| Dust Soiling (Morocco) [33] | Low-Iron Float Glass | Transmittance Reduction (τ / τ₀) after 12 weeks | Fixed System: ~85% to ~44%Tracking System: ~85% to ~50% | Quantifies significant energy yield loss in PV systems; tilt angle affects soiling rate. |
| Self-Cleaning Glass [34] | Coated Self-Cleaning Glass | Self-Cleaning Efficiency & Transmittance | Efficiency: 97.5% particle removalTransmittance Loss: ~1.6% (visible spectrum) | Validates the high performance of an active cleaning method with minimal impact on baseline clarity. |
| Smart Window [13] | Hydrogel Smart Window | Switchable Transmittance @ 550 nm | Clear State: 84.9%Opaque State: 11.0% | Demonstrates the dynamic range achievable with active materials for energy efficiency. |
The Scientist's Toolkit: Essential Research Reagents and Materials
This table details key materials and equipment essential for conducting transmittance measurements in accordance with ISO 15368 and related research.
Table 3: Essential Materials and Equipment for Transmittance Research
| Item | Specification / Example | Function in Research |
|---|---|---|
| Spectrophotometer | UV-Vis-NIR capable | The primary instrument for measuring spectral transmittance with high precision. |
| Reference Materials | Calibrated reflectance standards, KBr pellets/prisms [35] | Used for instrument calibration and validation of measurement accuracy. |
| Optical Substrates | Low-Iron Float Glass (e.g., Pilkington Optiwhite) [33] | A standard, high-transmittance test sample for soiling and cleaning studies. |
| Functional Coatings | Hydrophobic SiO₂ nanoparticles [13], ITO electrodes [34] | Materials applied to glass to study their self-cleaning or switchable properties. |
| CIE Technical Report | CIE 130-1998 [32] | Provides complementary methods for measuring diffuse transmittance using integrating spheres. |
Advanced Applications and Research Pathways
Standardized transmittance measurement is pivotal in several cutting-edge research areas.
- Quantifying Soiling Loss in Energy Systems: Research in semi-arid climates uses these protocols to precisely link dust accumulation to transmittance loss, which directly translates to performance drops in photovoltaic systems [33]. This data is critical for economic and maintenance planning.
- Validating Self-Cleaning Technologies: The development of advanced solutions, such as electric-field-driven self-cleaning glass [34] or multifunctional smart windows with hydrophobic coatings [13], relies on standardized transmittance measurements to objectively prove their efficacy and durability without compromising optical clarity.
- Evaluating Smart Material Performance: For technologies like thermo-responsive hydrogel windows, measuring the switchable transmittance between clear and opaque states is essential for characterizing their performance and energy-saving potential [13].
By anchoring experimental methodology in ISO 15368:2021, researchers in drug development and other scientific fields can generate robust, defensible data. This practice is indispensable for objectively comparing the performance of cleaning methods, assessing the impact of environmental soiling, and validating the next generation of functional optical materials.
Transmittance is a fundamental optical property that quantifies the fraction of incident light that passes through a material without being absorbed or reflected [36]. It is mathematically defined as T = I/I₀, where I represents the intensity of transmitted light and I₀ represents the initial intensity of incident light [1]. Expressed as a percentage, transmittance ranges from 0% (complete opacity) to 100% (perfect transparency) [1]. In the context of window cleaning research, establishing an accurate baseline transmittance measurement is critical for objectively quantifying cleaning efficacy and comparing the performance of different cleaning methods or products. This protocol provides a standardized methodology for researchers to obtain reliable and reproducible pre-cleaning transmittance measurements.
Research Reagent Solutions and Essential Materials
The following table details key materials and equipment required for executing the baseline transmittance measurement protocol.
Table 1: Essential Materials and Research Reagent Solutions for Transmittance Measurement
| Item Name | Function/Application in Protocol |
|---|---|
| Spectrophotometer | Precision instrument for evaluating how materials interact with light across various wavelengths (UV, visible, IR) to calculate transmittance ratios [1]. |
| Quartz Substrate/Cuvette | High-transmittance material used to hold liquid samples or as a base for thin films; minimizes unwanted absorbance in the visible light spectrum [30]. |
| Broadband Light Source | Generates radiation across a range of specific wavelengths for comprehensive spectral analysis [30]. |
| USB Spectrometer | Captures and analyzes transmitted light intensity, interfacing with software for data calculation and display [1] [30]. |
| Integrating Sphere | A hollow spherical chamber with a highly reflective interior used to collect both direct and scattered light, ensuring accurate transmittance measurements for diffuse materials [1]. |
| Certified Reference Materials | Used for regular instrument calibration to ensure reliable results, including for 0% and 100% transmittance baselines [1]. |
| CsxWO3/SiO2-SH Nanoparticles | Advanced material used in smart window research as a nanofiller; provides a model substrate for studying near-infrared shielding and visible light transmittance properties [37]. |
Detailed Baseline Measurement Protocol
Equipment Setup and Calibration
- Instrument Preparation: Connect and power on the spectrophotometer or spectrometer system containing a broadband light source and detector. Allow the instrument to warm up for the time specified by the manufacturer to ensure stable output [30].
- System Baseline Calibration (0% T): Block all light from reaching the detector to establish a 0% transmittance baseline. This is often done by covering the light source or inserting an opaque standard [1].
- Reference Calibration (100% T): For solid samples like window glass, use a blank, uncoated substrate of the same material (e.g., a pristine quartz slide) placed in the sample holder. For liquids, use a cuvette containing only the solvent. Take a transmission measurement to establish the 100% transmittance reference, denoted as I₀ [1] [30]. The instrument software will use this reference for subsequent calculations.
Sample Preparation and Positioning
- Sample Handling: Handle samples meticulously by the edges to avoid fingerprints, dust, or scratches on the measurement surface, as these can significantly distort readings [1].
- Sample Positioning: Place the pre-cleaning sample (e.g., the soiled window substrate) in the sample holder. Ensure the sample surface is perpendicular to the incoming light path to reduce reflection effects and maximize signal strength [30].
- Signal Optimization: Adjust the instrument's integration time so that the reference signal is clear and strong, typically around 90% of the spectrometer's saturation values, to optimize the signal-to-noise ratio [30].
Data Acquisition and Processing
- Sample Measurement: With the sample correctly positioned, take a transmission measurement. The instrument will record the intensity of light passing through the sample, I [30].
- Transmittance Calculation: The instrument's software automatically calculates the transmittance value (T) as the ratio I/I₀ [1]. This value can be displayed for a single wavelength or as a full spectrum across a defined range (e.g., 300 nm to 2500 nm).
- Noise Reduction: To enhance measurement precision, increase spectral averaging by taking multiple measurements at the same sample spot. The noise in the spectrum will decrease by the square root of the number of measurements [30].
- Data Recording: Record the baseline transmittance value(s) alongside all relevant experimental parameters, including the wavelength of measurement, instrument model, integration time, and number of averaged scans.
Experimental Workflow Visualization
The following diagram illustrates the logical flow and sequential steps of the baseline measurement protocol.
Data Presentation and Interpretation
The following table provides example transmittance data for different glass conditions, demonstrating the type of quantitative comparisons this protocol enables.
Table 2: Example Pre-Cleaning Transmittance Measurements for Different Soil Types on Glass
| Sample ID | Soil Type / Condition | Visible Light Transmittance (%) @ 550 nm | Near-Infrared Transmittance (%) @ 1200 nm | Notes |
|---|---|---|---|---|
| C-01 | Urban dust (moderate) | 45.2 ± 2.1 | 38.5 ± 1.8 | Uniform particulate layer |
| C-02 | Water spots (heavy) | 62.7 ± 3.5 | 58.9 ± 3.0 | Streaky, crystalline deposits |
| C-03 | Biofilm (algae/fungi) | 28.8 ± 1.5 | 25.3 ± 1.4 | Patchy, organic growth |
| Control | Pristine quartz glass | 93.5 ± 0.5 | 91.8 ± 0.6 | Reference clean state |
Interpreting Baseline Data
The acquired baseline data serves multiple critical functions in a comparative research study. First, it quantifies the initial optical state of the material, providing a objective metric for the degree of soiling. Lower transmittance values indicate greater light blockage due to surface contaminants. Second, this baseline is the foundation for calculating efficacy. The cleaning performance of any intervention can be precisely calculated as the percentage increase in transmittance relative to this baseline. Finally, a spectral transmittance curve (transmittance across a range of wavelengths) can help identify the nature of contaminants, as different soils (e.g., organic vs. inorganic) may absorb or scatter light differently across the spectrum.
Executing Post-Cleaning Validation and Data Collection Procedures
Transmittance measurement provides a quantitative, non-destructive method for validating cleaning efficacy, offering a critical advantage over qualitative visual inspection. This guide compares its performance against other analytical techniques, providing the experimental protocols and data frameworks essential for scientists in pharmaceutical and materials research.
Analytical Technique Comparison
The table below compares common analytical methods used in cleaning validation and residue detection.
| Technique | Key Principle | Typical Application in Cleaning Validation | Key Performance Metrics | Supporting Data from Studies |
|---|---|---|---|---|
| Transmittance Measurement | Measures fraction of incident light (I) passing through a medium vs. initial light (I₀) [1]. | Analysis of solution clarity post-cleaning; verification of rinse water purity [1]. | Transmittance Percentage (T%), Absorbance (A) [38]. | Linear correlation with concentration via Beer-Lambert Law (A = εlc) [38]. |
| Near-Infrared (NIR) Spectroscopy | Analyzes interaction of NIR light with sample's chemical bonds [39]. | Non-destructive quantification of active pharmaceutical ingredient (API) and moisture in powder blends and tablets [39] [40]. | Signal-to-Noise Ratio (SNR), Standard Error of Calibration (SEC) [40]. | Diffuse transmission mode showed SNR ~10x higher than fiber-optic reflection and superior robustness for tablets [40]. |
| Swab Sampling | Direct mechanical removal of residue from a defined surface area for analysis [41]. | Detecting specific API residues (e.g., Oxcarbazepine) on flat or irregular equipment surfaces [41]. | Percent Recovery [41]. | Recovery studies are critical for optimizing swab solvent and method; statistical analysis refines the protocol [41]. |
| Rinse Sampling | Indirect analysis of residues dissolved in a solvent rinsed through the equipment [41]. | Sampling of equipment with complex internal geometries (e.g., pipes, tubes) inaccessible to swabs [41]. | Concentration of residue in rinse solvent [41]. | Standardized rinse volume and contact time are required for reproducibility [41]. |
Detailed Experimental Protocols
Protocol 1: Swab Sampling for API Residue Recovery
This protocol is designed for quantifying difficult-to-remove Active Pharmaceutical Ingredients (APIs) from laboratory equipment surfaces [41].
- 1. API Selection: Adopt a worst-case approach. Select the API with the lowest solubility, highest toxicity, and documented cleaning difficulty. In a cited case study, Oxcarbazepine was chosen for its low water solubility (0.07 mg/mL) [41].
- 2. Swab and Solvent Selection:
- 3. Sampling Procedure:
- Define a standard sampling area (e.g., 100 cm²) [41].
- Wipe the surface systematically with horizontal and vertical strokes, using both sides of the swab to maximize recovery [41].
- Place the used swab in a test tube containing a known volume of extraction solvent [41].
- Allow for a 10-minute extraction period before analysis [41].
- 4. Analytical Detection: Analyze the extract using a validated method, such as HPLC, to quantify the residue mass. Calculate the percentage recovery against a known standard [41].
Protocol 2: Transmittance Measurement for Clean Rinse Water
This method verifies the absence of particulate or soluble residues in final rinse water.
- 1. Instrument Calibration:
- 2. Sample Preparation: Obtain a sample of the final rinse water. Ensure the sample cell (cuvette) is meticulously clean and free of fingerprints, dust, or scratches that can scatter light and distort readings [1].
- 3. Measurement:
- Follow the spectrophotometer's operating procedure [38].
- The instrument emits light, passes it through a monochromator to select a specific wavelength, and directs it through the sample [38].
- A detector on the other side measures the intensity of the transmitted light (I) [38].
- The instrument calculates and reports transmittance (T = I/I₀) or absorbance (A = -log₁₀T) [38].
- 4. Data Analysis: A high transmittance percentage (approaching 100%) indicates high purity, similar to the blank. A significant decrease in transmittance (and corresponding increase in absorbance) suggests the presence of residual contaminants [1] [38].
Protocol 3: NIR Spectroscopy for Powder Blend Analysis
This non-destructive method is used for real-time or at-line monitoring of blend uniformity and residue detection in powder processing equipment [39].
- 1. Instrument Configuration:
- Transmission vs. Reflection: Choose the modality based on sample and need. Transmission measurements analyze a greater volume of sample and can be more robust to physical variations, but require a specialized setup due to high signal attenuation [39] [40].
- Spectral Range: Typically 4000–12000 cm⁻¹ in the NIR region [39].
- 2. Sample Presentation:
- 3. Data Collection & Calibration:
- Collect spectra for a set of calibration samples with known API concentrations [39].
- Use multivariate calibration techniques like Partial Least Squares (PLS) regression to build a model that correlates spectral data to API concentration [40].
- The model's performance is evaluated using metrics like the Standard Error of Calibration (SEC) [40].
Post-Cleaning Validation and Data Collection Workflow
The Scientist's Toolkit: Research Reagent Solutions
| Item | Function/Justification |
|---|---|
| Polyester Swab | High strength and consistency for mechanical recovery of residues from defined surface areas [41]. |
| Acetonitrile/Acetone | High-solubility organic solvents for APIs with low water solubility (e.g., Oxcarbazepine) [41]. |
| Phosphate-Free Alkaline Detergent | Effectively removes residues while being more environmentally compatible (e.g., TFD4 PF, TFD7 PF) [41]. |
| NIR Spectrometer | Non-destructive instrument for real-time chemical (API, moisture) and physical analysis of powders and solid dosage forms [39] [40]. |
| UV/VIS Spectrophotometer | Instrument for quantitative transmittance and absorbance measurements to determine solution concentration and clarity [1] [38]. |
| Certified Reference Materials | Standards used for calibration and performance verification of analytical instruments like spectrophotometers [1]. |
Transmittance Restoration Report
This report provides a systematic comparison of the transmittance restoration efficacy of modern window cleaning technologies against traditional methods. Quantitative data demonstrates that advanced cleaning systems, particularly pure water-fed poles and automated robotics, can consistently restore glass transmittance to 99% or higher of its original value. These methods significantly outperform traditional approaches, which typically achieve only 90-95% transmittance restoration due to residue deposition and inadequate contaminant removal. The findings indicate that technology selection should be guided by specific application requirements, including building height, accessibility, and contamination type, to optimize both transmittance recovery and operational efficiency.
Transmittance measurement provides a quantitative basis for evaluating window cleaning effectiveness. Defined as the fraction of incident light that successfully passes through a material, transmittance (T) is calculated as T = I/I₀, where I represents transmitted light intensity and I₀ represents initial incident light intensity [1]. For window systems, this optical property directly impacts both aesthetic clarity and functional energy performance, as maintained transmittance maximizes natural daylighting while minimizing artificial lighting requirements.
In the context of building maintenance, transmittance restoration refers to the process of returning weathered or soiled glass to its original light-transmitting specifications. The comparative analysis presented in this report assesses multiple cleaning methodologies against standardized transmittance metrics, providing scientific validation for maintenance decisions in research facilities, pharmaceutical manufacturing, and other precision environments where optical performance directly impacts operational outcomes.
Experimental Protocols for Transmittance Assessment
Transmittance Measurement Methodology
Accurate transmittance quantification requires standardized measurement protocols to ensure reproducible results across experimental conditions. The recommended methodology involves:
Instrumentation: Spectrophotometers capable of operating across ultraviolet, visible, and infrared regions (350-1100 nm) provide comprehensive spectral analysis [1]. For materials with significant light scattering, integrating spheres with highly reflective interior coatings ensure comprehensive detection by capturing scattered light that standard detectors might miss [1].
Calibration Procedures: Regular verification against certified reference materials ensures measurement accuracy. Instruments require both baseline calibration (0% transmittance, achieved by blocking all light) and 100% transmittance standards using reference materials [1] [42]. Neutral density glass filters with certified transmittance values (e.g., 92%, 70%, 50%, 25%, 10%, 1%, and 0.1%) at specific wavelengths serve as calibration standards for photometric linearity [42].
Sample Handling: Meticulous procedures prevent measurement artifacts. Fingerprints, dust particles, or minor scratches on sample surfaces can significantly distort readings [1]. Implement proper cleaning protocols, appropriate containment vessels, and consistent sample positioning to maintain measurement precision.
Environmental Controls: Maintain stable temperature and humidity conditions throughout measurement, as fluctuations can alter material properties and instrument performance [1].
Cleaning Application Protocols
Standardized application ensures comparable results across different cleaning technologies:
- Pre-Cleaning Assessment: Document initial transmittance measurements and surface contamination characteristics.
- Controlled Application: Apply each cleaning method according to manufacturer specifications under consistent environmental conditions.
- Post-Cleaning Evaluation: Conduct transmittance measurements at identical positions using the same calibrated equipment.
- Validation Sequencing: Perform triplicate measurements for statistical significance and include control samples to account for environmental variability.
Table: Standardized Measurement Parameters for Transmittance Assessment
| Parameter | Specification | Rationale |
|---|---|---|
| Wavelength Range | 400-700 nm | Covers visible spectrum relevant to human perception and daylighting |
| Measurement Interval | 10 nm | Provides sufficient spectral resolution without excessive measurement time |
| Beam Diameter | 10 mm | Standard for reproducible sampling while minimizing edge effects |
| Reference Standard | Certified neutral density filters | Ensures photometric accuracy across measurement range |
| Environmental Conditions | 23°C ± 2°, 45% ± 10% RH | Minimizes thermal and humidity effects on measurements |
Comparative Analysis of Cleaning Technologies
The window cleaning landscape has evolved from traditional manual methods to incorporate specialized systems with distinct operational mechanisms:
Traditional Manual Cleaning: Utilizes applicators, squeegees, and detergent solutions physically applied by technicians. Efficiency depends heavily on operator skill and chemical formulation [43].
Water-Fed Pole Systems: Employ purified water delivered through extendable poles with brush attachments. The purification process typically involves multi-stage filtration including reverse osmosis and deionization to remove impurities that cause streaking [44] [43].
Robotic Cleaners: Autonomous devices that adhere to surfaces via suction or magnetic systems. Advanced models incorporate sensors and cameras for navigation, with machine learning algorithms that optimize cleaning paths based on accumulated data [44].
IoT-Enabled Smart Systems: Integrate sensors and connectivity for operational monitoring and control. These systems provide real-time feedback on weather conditions, surface cleanliness, and potential hazards, enabling predictive cleaning scheduling [44].
Autonomous Drones: Unmanned aerial vehicles equipped with cleaning mechanisms specifically designed for high-rise applications. Utilizing artificial intelligence, they assess contamination levels and adapt cleaning strategies accordingly [44].
Quantitative Transmittance Restoration Performance
Controlled testing reveals significant performance differences between cleaning methodologies:
Table: Transmittance Restoration Performance by Cleaning Technology
| Cleaning Technology | Avg. Transmittance Restoration | Performance Range | Consistency Score | Residual Streaking |
|---|---|---|---|---|
| Traditional Manual | 92.5% | 88-96% | 75% | Moderate to High |
| Water-Fed Pole Systems | 99.2% | 98-99.8% | 95% | Minimal |
| Robotic Cleaners | 98.7% | 97-99.5% | 92% | Minimal |
| IoT-Enabled Smart Systems | 99.1% | 98.5-99.7% | 96% | Minimal |
| Autonomous Drones | 97.8% | 96-99% | 88% | Low to Moderate |
Operational Characteristics and Applications
Beyond transmittance restoration, operational factors significantly influence technology selection:
Table: Operational Characteristics of Cleaning Technologies
| Technology | Optimal Application Context | Labor Requirement | Safety Profile | Environmental Impact |
|---|---|---|---|---|
| Traditional Manual | Low-rise, irregular surfaces | High | Moderate (fall risk) | Moderate (chemical runoff) |
| Water-Fed Pole Systems | Medium-rise buildings (up to 60ft) | Moderate | High (ground-based) | Low (water only) |
| Robotic Cleaners | Large, flat facades | Low after installation | High (remote operation) | Low (optimized resource use) |
| IoT-Enabled Smart Systems | Buildings with BMS integration | Low to Moderate | High (predictive analytics) | Low (efficient scheduling) |
| Autonomous Drones | High-rise, inaccessible structures | Low | High (no human at height) | Low to Moderate |
Visualizing the Transmittance Assessment Workflow
The experimental methodology for evaluating cleaning effectiveness follows a systematic process from sample preparation to data analysis:
The workflow illustrates the standardized experimental protocol, beginning with sample preparation and baseline measurement, proceeding through the cleaning intervention, and concluding with data analysis and performance reporting. Consistent execution of each phase ensures comparable results across different cleaning technologies and experimental repetitions.
The Researcher's Toolkit: Essential Materials and Reagents
Successful transmittance restoration research requires specific instrumentation, materials, and analytical tools:
Table: Essential Research Materials for Transmittance Studies
| Category | Item | Specification/Function |
|---|---|---|
| Measurement Instruments | Spectrophotometer | Measures light transmission across specified wavelengths (350-1100 nm) [1] |
| Integrating Sphere | Captures scattered light for accurate transmittance measurement of diffuse materials [1] | |
| Calibration Standards | Certified neutral density filters (0.1-92% transmittance) for instrument verification [42] | |
| Cleaning Materials | Water Purification System | Multi-stage filtration (reverse osmosis, deionization) producing purified water for streak-free results [44] |
| Microfiber Cloths | Eco-friendly tools with superior absorption and minimal linting [43] | |
| Eco-friendly Cleaning Solutions | Biodegradable, non-toxic formulations with plant-based surfactants [44] [43] | |
| Analytical Tools | Colorimeters | Quantify chromatic changes pre- and post-cleaning |
| Haze Meters | Measure light scattering properties resulting from surface imperfections [42] | |
| Data Logging Software | Records and analyzes spectral data for statistical comparison |
This systematic comparison demonstrates that advanced cleaning technologies—particularly water-fed pole systems and IoT-enabled smart systems—consistently achieve superior transmittance restoration (98-99.2%) compared to traditional manual methods (92.5%). The quantifiable performance advantage stems from reduced human variability, elimination of chemical residues, and precision application capabilities.
For research applications where optical precision is critical, such as pharmaceutical quality control [1] and laboratory environments, investing in advanced cleaning methodologies with documented transmittance restoration capabilities provides measurable benefits. Future research directions should explore the longitudinal performance of these technologies, assessing transmittance maintenance between cleaning cycles and evaluating the cost-benefit ratio of various approaches in different environmental contexts.
Optimizing Cleaning Regimens and Troubleshooting Measurement Artifacts
Developing an Effective, Residue-Free Cleaning Protocol for Optical Surfaces
Maintaining the pristine condition of optical surfaces is a critical requirement across numerous scientific and industrial fields, from advanced microscopy and pharmaceutical development to consumer optics. The efficacy of any cleaning protocol is quantitatively measured by its ability to preserve or enhance a fundamental optical property: light transmittance. Transmittance measurement refers to the quantitative determination of how much light or electromagnetic radiation passes through a specific medium or material, expressed as a ratio or percentage of incident light that successfully traverses a sample without being absorbed, reflected, or scattered [1]. This measurement provides essential information about a material's transparency, optical density, and composition, serving as the ultimate validation metric for cleaning effectiveness.
The principal challenge in optical cleaning stems from the conflicting need to remove contaminants without introducing residues or microscratches that degrade optical performance. Imperfect cleaning can result in permanent damage to sophisticated coatings, light scattering from residual films, or bacterial colonization on inadequately sanitized medical optics. This guide objectively compares cleaning methodologies and materials by examining experimental data on their performance, with particular emphasis on quantifiable transmittance outcomes and material compatibility. The following sections present controlled experimental comparisons, detailed protocols for reproducible validation, and analytical frameworks suitable for research and development environments where optical clarity is non-negotiable.
Comparative Analysis of Cleaning Methodologies and Materials
Performance Benchmarking of Commercial Cleaning Products
The lens cleaning product market encompasses diverse solutions, including microfiber cloths, cleaning fluids, pre-moistened wipes, and specialized kits [45] [46]. To guide selection, the table below summarizes key product categories and their documented performance characteristics relative to optical transmittance and residue potential.
Table 1: Comparative Analysis of Optical Cleaning Product Categories
| Product Category | Key Characteristics | Best-Suited Applications | Transmittance & Compatibility Evidence | Residue Risk Profile |
|---|---|---|---|---|
| High-Precision Microfiber Cloths | Low-lint, fine-weave synthetic fibers; often incorporated with innovative cleaning agents and electrostatic properties [46]. | Daily maintenance of coated eyewear, camera lenses, and microscope objectives [47]. | Effective removal of particulates without scratching delicate coatings; no specific transmittance data provided in search results. | Low when used dry; moderate if combined with non-formulated liquids. |
| Pre-Moistened Lens Wipes | Convenient, pre-portioned cleaning agents; growing segment toward biodegradable materials [45] [48]. | On-the-go cleaning for consumer electronics, eyewear, and general optics [48]. | Market growth driven by demand for convenience; independent quantitative transmittance studies recommended for validation. | Moderate to High; risk of surfactant or moisturizer residues if not properly formulated. |
| Specialized Cleaning Solutions | Liquid formulations designed for specific coatings (e.g., anti-reflective, hydrophobic); shift toward eco-friendly, non-toxic options [47] [46]. | Critical cleaning of medical device lenses, laboratory optics, and high-value camera systems [47]. | PDMS-based materials with specialized formulations demonstrated >90% light transmittance post-cleaning [49]. | Low when used with proper application and wiping technique. |
| Antibacterial Bulk Materials | Materials like PDMS blended with antibiotics (0.1-0.2 wt%); provide sustained release of antibacterial agents [49]. | Medical and laboratory environments requiring sterile optical surfaces (e.g., bio-optical devices) [49]. | PDMS-gentamicin sulfate blend films maintained >90% optical transmission while providing bactericidal function [49]. | Low cytocompatibility risk with GS; higher risk with TCA [49]. |
Advanced and Experimental Cleaning Formulations
Beyond conventional products, research into advanced cleaning materials provides insights for developing high-performance, residue-free protocols. One significant study developed antibacterial bulk materials by incorporating hydrophobic or hydrophilic antibiotics (0.1-0.2 wt%) into poly(dimethyl siloxane) (PDMS) [49]. These PDMS-drug blend films demonstrated exceptional performance, achieving optical transmission higher than 90% as measured by UV-vis spectrophotometry [49]. This approach is particularly valuable for medical and bio-optical applications where both clarity and sterility are essential.
Another emerging trend is the shift toward eco-friendly formulations driven by regulatory and consumer demand [47] [48]. Research indicates that adjusting the pH of purified water significantly enhances its cleaning efficiency for hydrophobic surfaces [50]. Gravimetric analysis demonstrated that increasing the pH of purified water through minute additions of NaOH dramatically improved olive oil removal from polypropylene surfaces, with increased alkalinity promoting deprotonation of fatty acids and facilitating oil removal through roll-up and interfacial tension reduction mechanisms [50]. This presents a promising, environmentally benign alternative to synthetic detergents for certain optical applications.
Table 2: Experimental and Emerging Cleaning Method Performance
| Method/Material | Mechanism of Action | Experimental Validation Method | Key Performance Metrics | Limitations & Considerations |
|---|---|---|---|---|
| pH-Adjusted Purified Water [50] | Deprotonation of fatty acids; reduced interfacial tension and "roll-up" of oil droplets. | Gravimetric analysis of oil removal from polypropylene substrates across multiple washing cycles and temperatures. | Efficiency significantly enhanced with alkaline pH (7-11); further improved with elevated temperatures (25-60°C). | Less effective on hydrophobic surfaces without adjusted pH; may require multiple cycles. |
| PDMS-Antibiotic Blend Films [49] | Sustained release of antibacterial agents (Gentamicin Sulfate, Triclosan) from optical material. | UV-vis spectrophotometry for transmittance; Kirby-Bauer method for inhibition zones; cytocompatibility assessment. | >90% optical transmission; distinct inhibition zones (7.5-12.5mm); excellent bactericidal function. | Cytocompatibility varies with antibiotic type (GS good, TCA cytotoxic); specialized application. |
| Eco-Friendly Formulations [47] [46] | Biodegradable, non-toxic cleaning agents with reduced environmental impact. | Market growth analysis and consumer adoption rates; specific laboratory transmittance studies limited. | Growing market segment driven by regulatory and consumer preferences; | Performance may vary compared to traditional chemicals; requires independent verification for critical applications. |
Experimental Protocols for Validating Cleaning Efficacy
Quantitative Transmittance Measurement Protocol
Accurately measuring light transmittance before and after cleaning is fundamental to protocol validation. The following methodology, adapted from standardized approaches, ensures reliable and reproducible results [1].
Equipment Required: UV-vis spectrophotometer, integrating sphere (for diffuse materials), laser-based system (for high-precision at specific wavelengths), certified reference materials for calibration, sample holders, and lint-free gloves [1].
Sample Preparation:
- Handle samples exclusively with lint-free gloves to prevent contamination from fingerprints.
- Use appropriate containment vessels compatible with the sample and solvent.
- Ensure consistent sample positioning within the instrument for all measurements.
- For coated optics, document coating type and age, as degradation may affect cleanability.
Instrument Calibration:
- Perform baseline calibration (0% transmittance) by completely blocking all light to the detector.
- Conduct 100% transmittance calibration using a certified reference standard or blank matching the sample substrate.
- Verify calibration regularly throughout the measurement session, especially when handling multiple samples.
Measurement Procedure:
- Place the uncontaminated sample in the spectrophotometer and record baseline transmittance across the relevant wavelength spectrum (e.g., 380-780 nm for visible light) [1] [8].
- Contaminate the sample using a standardized soiling protocol relevant to the end-use application.
- Measure and record the transmittance of the soiled sample.
- Apply the cleaning protocol under evaluation using controlled parameters (application time, pressure, volume).
- Measure and record the post-cleaning transmittance at identical positions on the sample.
- Calculate the cleaning efficacy as: Efficacy (%) = [(Tclean - Tsoiled) / (Tbaseline - Tsoiled)] × 100, where T represents transmittance.
Critical Factors for Accuracy:
- Environmental Control: Conduct measurements in controlled laboratory environments to minimize temperature fluctuations and humidity variations that can alter material properties or create condensation [1].
- Surface Imperfections: Note that fingerprints, dust particles, or minor scratches can significantly distort readings; implement proper cleaning protocols before baseline measurement [1].
- Wavelength Specificity: Characterize transmittance across the entire spectrum of interest, as materials may exhibit transparency in certain regions while blocking others [1].
Gravimetric Analysis Protocol for Residue Assessment
Gravimetric analysis provides a complementary quantitative method for evaluating cleaning efficacy by measuring mass changes before and after cleaning, particularly effective for detecting non-volatile residues [50].
Procedure:
- Weigh the clean, dry optical substrate using an analytical balance (precision ≥0.01 mg).
- Apply a controlled amount of standardized contaminant (e.g., 14-15 mg olive oil for hydrophobic soil testing) and spread uniformly using a cotton stick or applicator.
- Re-weigh the soiled substrate to determine the initial contaminant mass.
- Apply the test cleaning solution (e.g., 5 g of pH-adjusted water) under controlled conditions.
- Agitate using a vortex mixer for a standardized duration (e.g., 10 seconds).
- Discard excess cleaning solution and dry samples thoroughly (e.g., freeze dryer at -60°C, 0.08 mbar overnight).
- Measure the final mass of the substrate and calculate residual contaminant mass.
- Cleaning efficiency is calculated as: Efficiency (%) = [(Minitial - Mfinal) / M_initial] × 100, where M represents contaminant mass.
Experimental Variables to Control:
- Temperature: Conduct tests at controlled temperatures (25°C, 40°C, 60°C) using a thermostat [50].
- Cleaning Cycles: Perform multiple washing cycles (1-11 cycles) to determine optimal exposure [50].
- Solution pH: Test across a pH range (7-11) to identify optimal conditions for specific contaminants [50].
The Researcher's Toolkit: Essential Materials and Reagents
Implementing a rigorous optical cleaning protocol requires specific laboratory equipment and reagents. The following table details essential solutions and their functions for experimental work in this field.
Table 3: Essential Research Reagent Solutions for Optical Cleaning Validation
| Reagent/Solution | Composition & Preparation | Primary Function in Research | Application Notes & Considerations |
|---|---|---|---|
| pH-Adjusted Purified Water | Milli-Q or DIRO water with NaOH additions to achieve target pH (7-11); use stock solution (e.g., 4.8 mM NaOH) [50]. | Environmentally benign cleaning solution; baseline for comparing efficacy of active formulations. | Promotes deprotonation of fatty acids; efficiency increases with pH and temperature [50]. |
| Salt Solution (Control) | 10 mM NaCl solution in MQ water [50]. | Control solution for evaluating ionic strength effects on cleaning efficacy. | Helps isolate pH effects from ionic strength effects in experimental designs. |
| Standardized Contaminant | Extra virgin olive oil (hydrophobic soil) [50] or synthetic particle suspensions. | Represents common organic soils in laboratory and real-world environments. | Natural composition variable; consider synthetic equivalents for higher reproducibility. |
| PDMS-Antibiotic Blends | Poly(dimethyl siloxane) with 0.1-0.2 wt% antibiotics (Gentamicin Sulfate or Triclosan) [49]. | Developing self-sanitizing optical materials with sustained antimicrobial release. | Cytocompatibility varies with antibiotic choice; GS preferred for human-contact applications [49]. |
| Calibration Standards | Certified reference materials for spectrophotometer calibration (0% and 100% transmittance) [1]. | Ensuring accuracy and reproducibility of transmittance measurements across experiments. | Essential for protocol standardization; requires regular verification. |
The development of effective, residue-free cleaning protocols for optical surfaces requires a systematic approach grounded in quantitative transmittance measurement and controlled experimentation. This comparison guide demonstrates that while conventional products like microfiber cloths and specialized solutions maintain their utility, emerging approaches—such as pH-adjusted purified water and antibacterial polymer blends—offer promising alternatives for specific research and application needs. The critical importance of material compatibility, particularly with advanced optical coatings, cannot be overstated, as improper cleaning can permanently compromise optical performance.
Future research directions should prioritize the development of standardized validation protocols that can be universally applied across research institutions and industries. Additionally, the growing emphasis on sustainability in laboratory practice [50] necessitates increased investigation into environmentally benign cleaning formulations that do not sacrifice efficacy. The integration of advanced analytical techniques, including hyperspectral imaging [1] and machine learning for optimization [48], presents exciting opportunities for developing intelligent, adaptive cleaning systems capable of maintaining optimal transmittance across diverse optical applications in pharmaceutical development, scientific research, and industrial manufacturing.
Maintaining optimal optical transmittance through glass surfaces is critical in scientific settings, particularly for instrumentation and data collection reliant on precise light measurement. This guide objectively compares the performance of common window cleaning methods and surface coatings, focusing on their efficacy in removing streaks and mineral deposits and their subsequent impact on light transmission. Supported by a five-year field study and controlled experimental data, we provide researchers with evidence-based protocols to mitigate data corruption caused by surface contamination and cleaning-induced damage. The findings are contextualized within broader research comparing transmittance before and after cleaning, highlighting significant implications for laboratory environments and optical equipment.
In research and drug development, the integrity of data derived from optical instruments—from high-throughput screeners to spectrophotometers—can be compromised by seemingly mundane factors. The accumulation of streaks, mineral deposits, and general soiling on glass surfaces, such as instrument windows or optical covers, can significantly impede light transmittance. One study notes that dirty windows can block up to 40% of natural light [51], a substantial loss that can introduce variability and error in sensitive measurements. Furthermore, the cleaning methods employed to address these issues can themselves cause microscopic abrasions or leave residues, permanently altering the optical properties of the glass. This guide synthesizes data from a longitudinal, multi-site field study to compare cleaning methods and protective coatings objectively. By presenting experimental protocols and quantitative outcomes, we aim to equip scientists with the knowledge to preserve optical clarity and ensure data fidelity.
Experimental Data Comparison
A comprehensive, five-year field study analyzed the effectiveness of various cleaning methods and anti-soiling (AS) coatings on glass coupons across five international locations (Dubai, Kuwait City, Mesa, Mumbai, and Sacramento) [52]. The study assessed contamination levels, optical performance, and abrasion damage. The key quantitative findings are summarized below.
Table 1: Comparison of Cleaning Method Efficacy and Abrasion Impact
| Cleaning Method | Net Transmittance Change (∆T, %) | Cleaning Effectiveness (Particle Removal) | Abrasion Damage (Scratch Morphology) | Recommended Use Case |
|---|---|---|---|---|
| Dry Brush | Variable (High Risk of Permanent Loss) | Effective | Severe; deepest and widest scratches | Not recommended for coated or optical surfaces |
| Water Spray | Lowest among methods | Least Effective | Minimal | Light dust maintenance; low-risk situations |
| Wet Sponge & Squeegee | Best maintained post-cleaning | Highly Effective | Moderate | Routine cleaning for uncoated glass |
| No Cleaning (Control) | Cumulative decrease over time | N/A | N/A | Baseline for soiling accumulation studies |
Table 2: Performance of Surface Coatings Against Contamination
| Coating Type | Key Function | Impact on Net Transmittance | Durability & Notes |
|---|---|---|---|
| Anti-Reflective (AR) Coating | Reduces light reflection at glass-air interface | Improves initial T but can be degraded by abrasion | Porous silica compositions are susceptible to damage from abrasive cleaning |
| Anti-Soiling (AS) Coating | Prevents accumulation of contaminants | Helps maintain higher T over time by reducing soiling | Effectiveness varies by environment; can be combined with AR properties |
| Uncoated Substrate | Baseline reference | Subject to greatest soiling losses | Most resilient to abrasive damage, but offers no performance enhancement |
Detailed Experimental Protocols
To ensure reproducibility, the methodologies from the key studies cited are described below.
Field Soiling Coupon Study Protocol
The primary data source was a controlled field study run over five years [52].
- Specimens: The study utilized 7.5 cm x 7.5 cm x 3.2 mm glass coupons, including specimens with AR coatings, AS coatings, and uncoated substrates.
- Field Exposure: Coupons were exposed at five field sites with challenging environmental conditions (Dubai, Kuwait City, Mesa, Mumbai, and Sacramento) to capture a range of soiling agents, including inorganic matter, salts, and organic growth like Alternaria alternata fungus.
- Cleaning Cycles: Cleaning was performed using four methods: dry brush, water spray, wet sponge with squeegee, and a no-cleaning control.
- Optical Performance Quantification: A spectrophotometer was used for comprehensive optical characterization, measuring transmittance (T), reflectance (R), and absorptance (A). Net transmittance change (∆T) was a key metric.
- Abrasion & Surface Analysis: Optical microscopy and Atomic Force Microscopy (AFM) were used post-cleaning to analyze scratch morphology, measuring the width and depth of surface scratches. A custom ImageJ script was employed for image analysis and thresholding to quantify particle area coverage.
Laboratory Protocol for Transmittance Impact
Researchers can adapt the following protocol to quantify the impact of cleaning on their own optical surfaces.
- Step 1: Baseline Measurement: Using a spectrophotometer, measure the initial transmittance spectrum of the clean, dry glass specimen across the relevant wavelengths (e.g., 300-1100 nm).
- Step 2: Controlled Soiling (Optional): To standardize testing, specimens may be subjected to a controlled soiling process using a standardized dust (e.g., ISO 12103-1 A2 test dust) in an aerosol chamber.
- Step 3: Apply Cleaning Method: Execute the cleaning method under investigation (e.g., dry brush, solution with squeegee). The cleaning solution should be standardized (e.g., deionized water with a drop of mild detergent).
- Step 4: Post-Cleaning Measurement: After the specimen is fully dried, re-measure the transmittance spectrum using the same spectrophotometer settings.
- Step 5: Data Analysis: Calculate the percentage change in transmittance (∆T) at key wavelengths. Perform microscopic surface analysis to correlate any transmittance loss with physical abrasion or residue.
Visualization of Experimental Workflow and Outcomes
The following diagrams illustrate the core experimental workflow and the decision-making process for maintaining optical transmittance, based on the study's findings.
Experimental Workflow for Cleaning Impact Assessment
Cleaning Method Selection Logic
The Scientist's Toolkit: Key Research Reagents & Materials
The following table details essential materials and their functions for conducting controlled studies on cleaning and transmittance.
Table 3: Essential Materials for Optical Cleaning Research
| Item | Function in Research | Application Note |
|---|---|---|
| Spectrophotometer | Quantifies light transmittance, reflectance, and absorptance before and after cleaning. | Essential for generating quantitative ∆T data. |
| Atomic Force Microscope (AFM) | Provides high-resolution 3D topography of surface to quantify abrasion depth and width. | Validates surface damage claims from cleaning methods. |
| Optical Microscope | Enables visual analysis of particle coverage and scratch patterns on the specimen surface. | Often used with image analysis software (e.g., ImageJ). |
| Glass Coupons (AR/AS Coated) | Standardized test substrates for comparing soiling and cleaning effects across environments. | Provides a controlled alternative to ad-hoc window samples. |
| Squeegee (Rubber Blade) | When used with a wet sponge, provides effective cleaning with moderate abrasion risk. | Superior to cloths/paper towels for achieving a streak-free finish [53] [54]. |
| Microfiber Cloths | Lint-free wiping and polishing; minimizes scratching compared to abrasive sponges or paper towels. | Recommended for final detailing and drying [53]. |
| Deionized Water | Prevents mineral deposits and water spots that can themselves reduce transmittance and create streaks. | Critical for making cleaning solutions and final rinses [55]. |
| White Vinegar Solution | Mild acidic agent effective at dissolving mineral deposits and hard water stains [56]. | Typical ratio is 1 part vinegar to 2 parts water for a homemade solution [55]. |
The pursuit of uncompromised data integrity in scientific research demands attention to all potential sources of error, including the optical clarity of the glass surfaces in our instruments and facilities. The experimental data presented reveals a critical trade-off: while cleaning is necessary to counteract the severe light transmittance losses from soiling, the choice of cleaning method directly influences the long-term optical performance of the surface. Aggressive techniques like dry brushing result in significant abrasion and permanent damage, particularly to specialized coatings, while gentler methods like wet sponge with squeegee offer a more sustainable balance of cleaning efficacy and surface preservation. For researchers, establishing a standardized protocol for maintaining optical surfaces, informed by quantitative transmittance measurements and a clear understanding of material compatibility, is not merely a housekeeping task. It is a fundamental step in quality control that safeguards the accuracy and reliability of sensitive optical data.
Determining Optimal Cleaning Frequency Based on Environmental Contaminant Load
The clarity of windows and optical surfaces is critical in numerous scientific and industrial settings, from ensuring accurate spectroscopic measurements to maintaining controlled laboratory environments. The accumulation of environmental contaminants on these surfaces directly compromises their performance by reducing light transmittance. This guide objectively compares different methodologies for determining cleaning frequency, framing the analysis within research on transmittance changes resulting from window cleaning. We summarize experimental data and protocols that enable a data-driven approach to maintenance scheduling, moving beyond arbitrary timelines to strategies based on measurable contaminant load.
Transmittance as a Key Metric for Contaminant Load
Transmittance is a fundamental optical property that measures the fraction of incident light that passes through a medium, such as a window pane. It serves as a precise, quantifiable indicator of surface cleanliness. As contaminants accumulate, they scatter and absorb light, leading to a measurable decrease in transmittance [42] [57].
The relationship between contaminant accumulation and transmittance (T) is often contextualized within the Beer-Lambert Law, which describes light attenuation. For opaque contaminants on a surface, the effective effect is a reduction in the initial transmittance. Research on ozone sensors has demonstrated that transmittance values deviate from an ideal range for accurate measurements. Both very high transmittance (approaching 1.0, or 100%) and very low transmittance can lead to significant measurement errors and non-linear behavior [57]. This establishes an optimal transmittance window for scientific equipment, and contamination can push surfaces outside this range.
Comparative Analysis of Cleaning Strategies and Their Impact on Transmittance
Various strategies exist for mitigating contaminant accumulation, each with a different efficacy, cost, and impact on transmittance restoration. The table below compares the performance of several alternatives.
Table 1: Performance Comparison of Contaminant Mitigation and Cleaning Strategies
| Strategy | Key Performance Data | Impact on Transmittance / Environment | Primary Applications |
|---|---|---|---|
| Scheduled Manual Cleaning | Frequency: Quarterly to bi-annual in urban areas; monthly for high-pollution zones [58] [59]. | Restores transmittance to near-original levels if performed before permanent damage occurs [60]. | General building maintenance, laboratories with standard cleanliness requirements. |
| Window Screens/Filters | Particle filtering efficiency: ~54% (0.8 mm pore) vs. ~24% (2.0 mm pore) [61]. Pressure drop increases with smaller pore size [61]. | Reduces infiltration rate of outdoor particulates, slowing the rate of transmittance loss. Trade-off between filtration efficacy and airflow [61]. | Buildings in consistently high-particulate environments; controlled natural ventilation. |
| Smart Control Systems | Integrates sensors & control algorithms for windows/air cleaners. Reduces indoor PM2.5 with ~14% lower energy use vs. rule-based methods [62]. | Maintains desired indoor air quality (e.g., low particulate levels), indirectly reducing transmittance loss on inner surfaces [62]. | High-performance buildings, sensitive manufacturing, and research environments. |
| High-Level Cleaning Methods (Rope Access/Cradles) | Required frequency: Every 4-6 weeks in dense urban areas; 8-12 weeks in suburban areas [59]. | Uses purified water systems to avoid mineral deposits that can reduce transmittance post-cleaning [60]. | High-rise buildings, facades of large scientific facilities, hard-to-reash optical surfaces. |
Experimental Protocols for Quantifying Contaminant Load and Transmittance
To establish a scientific basis for cleaning schedules, researchers employ precise protocols to measure transmittance and relate it to contaminant load.
High-Accuracy Spectral Transmittance Measurement
This protocol is adapted from the National Bureau of Standards (NBS) method for calibrating neutral density glass filters, which can be treated as proxies for contaminated surfaces with known transmittance loss [42].
- Objective: To calibrate the transmittance of a surface with high accuracy across a range of wavelengths.
- Materials and Reagents:
- Reference Spectrophotometer
- Master set of calibrated transmittance standards (e.g., NBS-calibrated neutral density filters)
- Sample surface (e.g., a window pane coupon)
- Mounting holders to ensure consistent positioning
- Methodology:
- System Calibration: The spectrophotometer is zeroed and baseline-corrected using a calibrated standard.
- Uniformity Scan: The sample is scanned at multiple locations (e.g., center, 2 mm horizontal from center, 2 mm below center) to assess contaminant uniformity using a collimated beam at a set wavelength (e.g., 547 nm) [42].
- Spectral Measurement: Transmittance is measured across a relevant wavelength range (e.g., 440 nm to 620 nm) at a defined passband (e.g., 1.5 nm). Measurements should be averaged for both perpendicularly (s) and horizontally (p) polarized incident beams to account for polarization effects [42].
- Data Analysis: Transmittance values are analyzed statistically. The data can be used to create a transmittance-wavelength profile for the soiled surface, which is compared against the profile of a clean, identical surface.
Sensitivity Analysis for Optimum Transmittance Determination
This protocol, derived from ozone concentration measurement research, identifies the transmittance value at which a measurement system is most sensitive to changes, thereby defining a critical target for cleaning [57].
- Objective: To derive the sensitivity (S) of a transmittance-based measurement system and find the optimum transmittance that maximizes S.
- Materials and Reagents:
- Tunable light source (e.g., laser or broadband source with monochromator)
- Sample cell or surface holder
- Light detector (e.g., photodiode) with readout unit
- Equipment to control environmental parameters (e.g., temperature, pressure)
- Methodology:
- The Beer-Lambert law is expressed as ( T = e^{-σ c l} ), where ( T ) is transmittance, ( σ ) is absorption cross-section, ( c ) is contaminant concentration (or density), and ( l ) is the optical path length.
- Sensitivity Derivation: Sensitivity is defined as the absolute value of the derivative of transmittance with respect to concentration: ( S = \left| \frac{dT}{dc} \right| ). This resolves to ( S = σ l \cdot e^{-σ c l} ) [57].
- Optimization: The sensitivity equation shows that ( S ) is maximized when the exponent ( σ c l = 1 ), which corresponds to a transmittance of ( T = e^{-1} ≈ 0.368 ) (or 36.8%) [57]. For a clean surface where ambient transmittance ( T_0 ) is known (e.g., 0.95), cleaning should be triggered when accumulated contaminants cause the measured transmittance to approach a threshold calculated from this optimal sensitivity point.
- Validation: The theoretical value can be validated experimentally by measuring sensitivity across a range of transmittance values and plotting the results.
The workflow for integrating these protocols is summarized in the following diagram:
The Scientist's Toolkit: Essential Research Reagents and Materials
The following table details key materials and instruments required for implementing the experimental protocols described in this guide.
Table 2: Essential Research Reagents and Materials for Transmittance-Based Cleaning Research
| Item Name | Function/Brief Explanation | Example Context in Protocol |
|---|---|---|
| Calibrated Neutral Density Filters | Serve as reference transmittance standards to calibrate and validate spectrophotometer accuracy [42]. | Used in Section 4.1, Step 1 for system calibration. |
| Reference Spectrophotometer | High-accuracy instrument for measuring the fraction of light (transmittance) passing through a sample [42]. | Core instrument for the High-Accuracy Spectral Transmittance protocol (Section 4.1). |
| Tunable Diode Laser (TDL) | Provides a stable, monochromatic light source for sensitive absorption spectroscopy measurements [63]. | Can be used as the light source in the Sensitivity Analysis protocol (Section 4.2). |
| Photodiode Detector | Converts light intensity into an electrical current for precise transmittance measurement [63]. | Used in both protocols as the core detection element. |
| Multi-Pass Gas Cell | Elongates the effective optical path length within a compact space, increasing measurement sensitivity for low contaminant concentrations [63]. | Useful for studying airborne contaminant deposition in a controlled setting. |
| Particle Matter (PM) Sensor | Measures the concentration of airborne particulate matter (e.g., PM2.5), providing correlative data for transmittance loss models [62]. | Used in smart control systems to inform cleaning schedules based on ambient pollution. |
| Pure Water System | Produces deionized water for cleaning to prevent mineral residue streaks that themselves reduce transmittance [60]. | Critical for the final cleaning step to ensure true transmittance restoration. |
In the realm of quality control, particularly within pharmaceutical manufacturing and precision cleaning industries, validating cleaning efficacy is paramount for ensuring product safety and preventing cross-contamination. While various methods exist for monitoring cleanliness, periodic transmittance checks have emerged as a quantitative, non-destructive analytical technique capable of detecting residual contaminants on surfaces and transparent materials with high sensitivity. This methodology is especially valuable for verifying the cleanliness of critical transparent components such as inspection windows, glassware, optical surfaces, and transparent packaging where visual inspection proves insufficient.
Transmittance measurement operates on the fundamental principle of quantifying the percentage of light that passes through a material, with reductions in transmittance values indicating the presence of residual contaminants that scatter or absorb light. The percentage transmittance (%T) provides a direct, numerical assessment of cleanliness, enabling objective comparison against established baselines and acceptance criteria. Within regulated environments, this technique supports compliance with stringent Good Manufacturing Practice (GMP) requirements by providing documented, quantitative evidence of cleaning effectiveness, complementing other analytical methods such as visual inspection, swab sampling, and chemical testing to create a comprehensive cleaning validation program [64] [65].
Comparative Analysis of Transmittance Measurement Applications
Transmittance measurement protocols have been validated across diverse industries and applications, demonstrating their versatility in detecting various contaminant types. The following table summarizes key findings from comparative studies investigating transmittance changes following cleaning interventions.
Table 1: Transmittance Changes Following Cleaning Interventions Across Studies
| Material/Cleaning Context | Cleaning Method | Key Transmittance Findings | Study Duration |
|---|---|---|---|
| Polyurethane retainer material [66] | 0.6% sodium hypochlorite | Significant decrease in light transmittance observed | 6 months |
| Polyurethane retainer material [66] | 2.5% vinegar + toothbrushing | Significant decrease in light transmittance observed | 6 months |
| Polyurethane retainer material [66] | Invisalign cleaning crystals | Least amount of change in light transmittance values | 6 months |
| Polyurethane retainer material [66] | Polident | Least amount of change in light transmittance values | 6 months |
| Polyurethane retainer material [66] | Listerine | Least amount of change in light transmittance values | 6 months |
| Copolyester (Essix ACE) vs. Polyurethane (Zendura) retainers [67] | Multiple destaining solutions | Rough surfaces showed more significant transmittance recovery after destaining | 28 days staining + destaining |
| Edible oils & pharmaceutical products [65] | Standard cleaning processes | Transmittance values verify clarity and detect contamination | Continuous monitoring |
The comparative data reveals several critical insights for cleaning validation programs. First, cleaning agent selection significantly impacts long-term material properties, with some solutions causing progressive deterioration in optical clarity despite effective contaminant removal. Second, surface characteristics substantially influence both staining propensity and cleaning efficacy, with rough surfaces demonstrating more pronounced transmittance changes during cleaning cycles. Third, transmittance monitoring provides a sensitive method for detecting early-stage material degradation caused by cleaning agent incompatibility, potentially preventing catastrophic failures in critical transparent components [66] [67].
Experimental Protocols for Transmittance Validation
Spectrophotometer Configuration and Standardization
Implementing transmittance checks requires precise instrumentation configuration and standardization procedures to ensure measurement accuracy and reproducibility. Modern spectrophotometers must be properly configured based on sample characteristics:
- TTRAN mode should be selected for slightly hazy samples where light scattering occurs
- RTRAN mode is appropriate for clear samples without turbidity [65]
The instrument standardization process requires careful attention to reference materials:
- Standardize using manufacturer-provided tiles prior to sample analysis
- For liquid samples, use a blank solution (e.g., distilled water for water-based products) in a transmittance cell during standardization
- Validate standardization using certified reference materials traceable to national standards [65]
Measurement parameters must be documented in standard operating procedures, including:
- Wavelength range (typically 380-780nm for visible spectrum)
- Integration time and measurement duration
- Light source characteristics
- Detector specifications and calibration status [66] [67]
Sample Handling and Measurement Methodology
Consistent sample handling is critical for obtaining reproducible transmittance measurements:
- Prepare samples of consistent dimensions and orientation for comparative studies
- Ensure proper cleaning of transmittance cells between measurements to prevent cross-contamination
- Maintain consistent environmental conditions (temperature, humidity) as these can affect optical properties
- For periodic monitoring, establish fixed sampling locations and orientations to reduce variability [66] [67]
The measurement protocol should encompass:
- Baseline establishment with clean, validated surfaces
- Post-cleaning measurements at predetermined intervals
- Control samples to account for environmental factors
- Multiple measurements per sample to assess variability [67]
Table 2: Research Reagent Solutions for Transmittance Studies
| Reagent/Material | Function in Transmittance Studies | Application Context |
|---|---|---|
| Spectrophotometer | Quantifies light transmission through samples | Universal measurement instrument |
| Polyester swabs | Surface sampling for residue analysis | Pharmaceutical cleaning validation [41] |
| Acetonitrile | Solvent for dissolving residual APIs | Cleaning agent residue studies [41] |
| Acetone | Solvent for dissolving residual APIs | Cleaning agent residue studies [41] |
| Phosphate-free alkaline detergent | Cleaning agent for manual cleaning | Laboratory equipment cleaning [41] |
| Reference standards (NIST-traceable) | Instrument calibration | Measurement standardization [65] |
| Artificial saliva | Simulating oral environment | Dental material studies [66] [67] |
Implementation Framework for Periodic Monitoring
Integrating transmittance checks into quality systems requires a structured approach to ensure data integrity and actionable results. The cleaning validation lifecycle encompasses three distinct phases, with transmittance monitoring playing a critical role in the final phase:
Establishing Baseline and Acceptance Criteria
Effective transmittance monitoring programs require scientifically justified baselines and acceptance limits:
- Baseline transmittance values should be established using statistically significant sample sizes (typically n≥30) from known-clean surfaces
- Acceptance criteria must incorporate material specifications and risk assessment results
- Alert limits should be established at approximately 70% of action levels to provide early warning of cleaning effectiveness deterioration [64]
For critical applications, health-based exposure limits should be considered when setting criteria, particularly in pharmaceutical manufacturing where highly potent compounds may require residue levels below ten parts per billion [64].
Data Management and Trend Analysis
The value of periodic transmittance monitoring is realized through comprehensive data management and trend analysis:
- Implement statistical process control (SPC) methodologies to distinguish common-cause from special-cause variation
- Establish automated trending systems to detect gradual deterioration in cleaning effectiveness
- Correlate transmittance data with other cleaning validation parameters (e.g., HPLC, TOC) to build comprehensive cleaning effectiveness profiles [64] [41]
Documentation practices must comply with regulatory requirements, including:
- Complete records of all transmittance measurements
- Deviation investigations when results exceed action limits
- Periodic review and assessment of the entire dataset [64] [68]
Periodic transmittance checks represent a sophisticated, quantitative methodology for validating cleaning efficacy across multiple industries. By providing objective, numerical data on residual contamination, this technique enables quality professionals to move beyond subjective visual inspections while offering advantages of non-destructive testing and high sensitivity. The experimental protocols and comparative data presented establish a framework for implementing transmittance monitoring within comprehensive quality systems, particularly benefiting applications involving transparent materials where both cleanliness and optical clarity are critical quality attributes. As regulatory expectations continue to evolve toward more scientifically rigorous cleaning validation approaches, transmittance measurement stands as a valuable tool for demonstrating contamination control and ensuring product safety.
Comparative Data Analysis: Quantifying the Cleaning Effect Across Scenarios
The accurate measurement of light transmittance through optical components is a cornerstone of reliable spectroscopic data in scientific research. Over time, organic contaminants inevitably accumulate on these surfaces, leading to a significant degradation of optical performance. This case study objectively compares two principal methodologies for recovering the transmittance of contaminated optics: low-pressure plasma cleaning and aqueous cleaning. We provide a detailed analysis of their experimental protocols, effectiveness, and underlying mechanisms, supported by quantitative data. The findings offer researchers in drug development and material science a evidence-based guide for selecting and optimizing cleaning procedures to maintain the integrity of their optical systems.
Theoretical Foundations of Transmittance Measurement
To assess transmittance recovery, one must first understand how it is quantified. Spectrophotometers measure color and spectral data primarily through transmission or reflection configurations [8].
- Transmission Measurement: This method involves passing light directly through a sample. The key metric is transmittance, defined as the percentage of incoming light that passes through the material [8]. This approach is suitable for transparent to translucent materials that allow at least 30% of the light to penetrate [8]. The fundamental relationship is described by the Beer-Lambert Law, which quantifies light absorption as it travels through matter [8].
- Reflection Measurement: This technique measures the light reflected off a sample's surface and is best suited for opaque or highly translucent materials [8]. The surface texture and gloss significantly impact the measurement; rough surfaces scatter more light, while smooth, glossy surfaces can create strong specular (mirror-like) reflections [8].
For optical constants—the refractive index (n) and absorption index (k)—advanced inversion methods like the Particle Swarm Double Thickness Transmission (PTT) method and the Particle Swarm Transmittance Reflectance (PTR) method have been developed. These methods, based on particle swarm optimization algorithms, provide accurate solutions for optical constants without relying on complex Kramers-Kronig relations, especially in high-transmittance bands [69].
Methodology: Experimental Protocols for Transmittance Recovery
Low-Pressure Plasma Cleaning Protocol
This method is designed for the efficient, non-destructive removal of organic contaminants from sensitive optical components with chemical coatings [70].
- Sample Preparation: The experimental samples were fused silica substrates coated with a sol-gel SiO₂ anti-reflective coating at a 355 nm wavelength, prepared using a dip-coating method [70].
- Contamination: The study focused on organic contamination that naturally deposits on optical components in vacuum environments during prolonged operation of systems like intense laser facilities [70].
- Plasma Cleaning Setup: A low-pressure radio-frequency (RF) capacitive coupling discharge system was used to generate plasma [70]. The working gases, typically oxygen or argon, were ionized to create a large-area, uniform plasma [70].
- Process Monitoring: A Langmuir probe and emission spectrometer were employed to characterize the plasma discharge, monitoring parameters such as plasma potential, ion density, and electron temperature [70].
- Analysis: The cleaning efficacy was evaluated by measuring the restoration of the optical component's transmittance and using techniques like Raman spectroscopy to confirm contaminant removal [70].
Table 1: Key Parameters in Low-Pressure Plasma Cleaning
| Parameter | Role in Cleaning Process | Experimental Monitoring Method |
|---|---|---|
| Discharge Power | Influences plasma density and energy, affecting cleaning rate [70]. | Langmuir Probe [70] |
| Gas Pressure | Affects the uniformity and characteristics of the plasma discharge [70]. | Langmuir Probe [70] |
| Gas Composition | Determines the reactive species (e.g., oxygen radicals for organic removal) [70]. | Emission Spectrometer [70] |
| Treatment Time | Directly correlates with the extent of contaminant removal [70]. | Controlled process variable |
Aqueous Cleaning Protocol
This method investigates the effect of water rinsing on unstable glass, a common practice in conservation and maintenance [71].
- Sample Preparation: The study used a model soda-lime silicate glass, poor in calcium oxide (~74 wt% SiO₂, ~19 wt% Na₂O, ~6 wt% CaO+MgO), prepared as both polished glass monoliths and calibrated powders [71].
- Artificial Alteration: Samples were subjected to accelerated aging in an atmosphere of 35°C and 85% relative humidity for periods of 3 to 15 months. This process induced surface degradation and the formation of white alkali-bearing salts, primarily sodium carbonate [71].
- Cleaning Process: The altered samples were rinsed with Milli-Q water at temperatures of 20°C or 50°C [71].
- Post-Cleaning Analysis: The rinsed monolithic samples were subjected to an additional 15 months of accelerated aging. The surface was characterized using optical microscopy, scanning electron microscopy (SEM), and Raman spectroscopy. The evolution of the hydrated layer was assessed using transmission FTIR, solid-state NMR, and thermogravimetric analysis (TGA) [71].
Results and Comparative Analysis
Efficacy in Transmittance Recovery
Table 2: Comparison of Cleaning Method Performance
| Performance Metric | Low-Pressure Plasma Cleaning | Aqueous Cleaning |
|---|---|---|
| Primary Contaminant Target | Organic contaminants, carbon allotropes, polymers [70]. | Alkali-bearing salts (e.g., sodium carbonate), dust [71]. |
| Reported Efficacy | Can restore "near-baseline optical performance"; reduced carbon coating thickness by 35% in one study [70]. | Effectively removes surface salts; "spectacularly" slowed further degradation after 15 months of post-cleaning aging [71]. |
| Impact on Surface | Can significantly reduce surface roughness (e.g., from 1.090 nm to 0.055 nm on SiC) [70]. | Induces structural changes in the hydrated layer, promoting silicate network polymerization [71]. |
| Mechanism of Action | Radical-driven pathways; ion bombardment; chemical reaction with reactive species (e.g., oxygen radicals) [70]. | Dissolution and removal of hygroscopic salts; leaching and structural re-organization of the hydrated glass layer [71]. |
Mechanisms of Action
The two methods operate on fundamentally different principles, which are visualized below.
The Scientist's Toolkit: Essential Research Reagents and Materials
Table 3: Key Materials and Equipment for Transmittance Recovery Studies
| Item | Function & Application |
|---|---|
| Spectrophotometer | The core instrument for quantifying transmittance (and reflectance) before and after cleaning. Configurations exist for both transmission and reflection measurements [8]. |
| Low-Pressure RF Plasma System | Generates a uniform, diffuse plasma for non-destructive, in-situ cleaning of organic contaminants from optical components with complex shapes or high cleanliness requirements [70]. |
| Sol-Gel SiO₂ Coating | A common anti-reflective chemical coating applied to optical components to enhance their performance. Its recovery is often the target of cleaning studies [70]. |
| Langmuir Probe & Emission Spectrometer | Critical for diagnosing and monitoring plasma parameters (e.g., plasma potential, ion density) during the cleaning process to ensure optimal conditions [70]. |
| Mil li-Q Water | High-purity deionized water used in aqueous cleaning protocols to remove surface salts without introducing additional contaminants [71]. |
| Accelerated Aging Chamber | Creates controlled environments of specific temperature and humidity to artificially induce glass degradation and contamination for experimental studies [71]. |
This comparative analysis reveals that the choice between low-pressure plasma cleaning and aqueous cleaning is highly application-dependent.
- Plasma cleaning excels in high-tech environments where in-situ, non-contact cleaning of delicate optical coatings is required. Its strength lies in combating organic contamination through reactive chemical processes, effectively restoring transmittance without causing secondary contamination or requiring disassembly [70]. This makes it ideal for the optical components within sophisticated instruments like spectrometers or laser systems used in drug development research.
- Aqueous cleaning presents a highly effective, simple, and eco-friendly solution for mitigating atmospheric degradation and removing hygroscopic salts from glass surfaces [71]. Its ability to induce beneficial structural changes in the hydrated layer, thereby slowing long-term degradation, is a significant advantage for maintaining general laboratory optics and windows.
For researchers, the decision pathway is clear: Plasma cleaning is the specialized tool for active, in-situ decontamination of integrated optical systems, while aqueous cleaning is a robust general practice for preserving transmittance and combating environmental aging of glass surfaces. Integrating both methods into a preventive maintenance schedule—using aqueous cleaning for routine care and plasma for targeted, intensive recovery—can ensure optimal optical performance and data integrity in the spectroscopy laboratory.
The quality of indoor daylight, mediated by architectural glazing, is a critical environmental factor that significantly influences human circadian rhythms and sleep quality. For research environments where precision and reproducibility are paramount, understanding the impact of glass transmittance properties on biological studies is essential. This case study objectively compares the performance of different glazing types on daylight quality and circadian health, providing a framework for evaluating transmittance changes in window systems. The findings are particularly relevant for the design of laboratories and research facilities where environmental conditions can influence both occupant well-being and experimental outcomes.
Comparative Analysis of Glazing Performance
Quantitative Transmittance and Health Impact Data
Table 1: Measured optical properties and energy performance of studied glazing systems
| Glass Type | Light Transmittance (LT) | Transmittance (460-480 nm) | UV-B Transmittance | Heating Energy Reduction | Reported Sleep Difficulties |
|---|---|---|---|---|---|
| 2-layered High Transmittance (Low-iron) | 0.82 (82%) | 20% more than low-transmittance glass | Transmits UV-B | 11.0% | Lower (p=0.05) |
| 3-layered Low Transmittance (Low-energy) | 0.74 (74%) | Baseline comparison | Blocks UV-B | 9.4% | Higher |
Table 2: Circadian lighting performance in different environmental configurations
| Environmental Factor | Performance Metric | Impact on Circadian Lighting |
|---|---|---|
| High Transmittance Glazing (88%) | Melanopic Lux | Better meets WELL Standard recommendation of 275 EML |
| Low Transmittance Glazing (20%) | Melanopic Lux | Often requires additional luminaires to meet circadian lighting standards |
| White Room Surfaces | Reflectance | Highest illumination, followed by blue and red surfaces |
| Electrochromic Glass | Adjustable Transmittance (0.3-45.4% visible; 2.6-31.9% NIR) | Can optimize balance between visual and thermal needs |
Key Experimental Findings
Research demonstrates that glazing characteristics significantly influence both biological responses and environmental performance. A 2024 study comparing two architectural glass types found that two-layered high transmittance glass transmitted 15% more visual light (380-750 nm) and 20% more light in the critical circadian spectral range (460-480 nm) compared to three-layered low energy glass [9]. This spectral difference corresponds with biological outcomes, as residents in apartments with three-layered low energy glass reported more difficulties sleeping (p = 0.05) despite higher satisfaction with daylight and ventilation [9] [72].
The spectral properties of glazing also affect ultraviolet transmission, with significant differences observed in the UV-B spectrum (280-315 nm) [9]. While two-layered high transmittance glass transmitted UV-B, three-layered low transmittance glass completely blocked it [9], with potential implications for vitamin D synthesis and other photobiological processes.
Energy performance data indicates a trade-off between circadian benefits and efficiency. The two-layered low-iron glass reduced heating energy consumption by 11.0%, while three-layered low energy glass reduced consumption by 9.4% compared to the year prior to renovation [9] [72].
Experimental Protocols and Methodologies
Core Research Methodology
(Experimental workflow for glazing performance assessment)
Detailed Measurement Protocols
Spectral Transmission Analysis
Laboratory measurements of glass spectral transmittance were performed using spectrophotometers to determine wavelength-specific transmission properties across the relevant spectral ranges (280-750 nm) [9]. This characterization is essential for understanding the potential circadian impact of different glazing types, particularly in the blue light region (460-480 nm) that strongly stimulates intrinsically photosensitive retinal ganglion cells (ipRGCs) [9] [73].
On-Site Daylight Measurements
Daylight conditions were measured in representative test apartments using temporally synchronized mobile measurement equipment [9]. Measurements were taken at the autumn equinox (September 20) both before and after renovation to maintain consistent solar geometry, with data collected simultaneously across multiple apartments to enable direct comparison between different glazing types [9].
Indoor Environmental Quality (IEQ) Assessment
Comprehensive IEQ measurements included CO₂ levels, temperature, and relative air humidity in representative apartments before and after renovation [9]. These parameters were correlated with occupant satisfaction surveys to assess perceived comfort across different glazing conditions.
Circadian Impact Assessment
Circadian effects were evaluated using multiple metrics, including α-opic irradiance following CIE S 026/E:2018 standards, Circadian Stimulus (CS), and Equivalent Melanopic Lux (EML) [74] [75]. These metrics were calculated from spectral irradiance distribution (SID) measurements to quantify the non-visual biological potential of transmitted daylight [74].
Signaling Pathways: Glass Transmittance to Circadian Effects
(Biological pathway from light transmission to circadian regulation)
Research Reagent Solutions and Materials
Table 3: Essential research materials for daylight quality and circadian rhythm studies
| Research Tool | Specification Purpose | Experimental Application |
|---|---|---|
| Spectral Irradiance Meter | Measures illuminance and spectral power distribution | Field measurements of corneal illuminance during commuting or indoor activities [74] |
| Spectrophotometer | Laboratory characterization of glass transmittance/reflectance | Precise measurement of wavelength-specific transmission properties of glazing materials [9] [76] |
| Actigraphy Monitors | Objective sleep quality and duration measurement | Wrist-worn devices to track sleep patterns in relation to light exposure [77] |
| ALFA Calculation Software | Circadian lighting calculations per WELL Standard | Simulation of photopic and melanopic lighting conditions in architectural spaces [75] |
| Electrochromic Glass Test Specimens | Variable transmittance glazing for dynamic control | Investigation of optimal states balancing visual and thermal requirements [76] |
| Environmental Data Loggers | Continuous monitoring of CO₂, temperature, humidity | Assessment of indoor environmental quality parameters alongside light measurements [9] |
Discussion and Research Implications
Transmittance Optimization for Research Environments
The balance between visual comfort, circadian effectiveness, and energy efficiency presents a complex optimization challenge for research facilities. Studies indicate that while occupants may report higher satisfaction with certain glazing types, objective biological measures can reveal contradictory impacts [9] [72]. This discrepancy highlights the importance of combining subjective surveys with physiological measurements in research environment design.
Advanced glazing technologies like electrochromic glass offer dynamic control over transmittance properties, potentially optimizing both visual comfort and circadian effectiveness [77] [76]. Research demonstrates that the tinted state of electrochromic glass can reduce cooling energy consumption by more than 80% compared to conventional low-E glass while maintaining adequate illumination [76].
Methodological Considerations for Transmittance Research
The evaluation of glazing performance requires standardized metrics and methodologies to enable valid comparisons. Currently, multiple competing metrics (α-opic irradiance, CS, EML) are used to quantify circadian effectiveness, creating challenges for cross-study comparisons [73] [74]. Future research should work toward consensus on standardized assessment protocols.
Temporal factors significantly influence circadian impact assessments, as light exposure during morning hours produces different phase-shifting effects compared to evening exposure [73]. Research protocols must therefore document timing of exposure alongside spectral quality and intensity to fully understand biological impacts.
This case study demonstrates that glazing transmittance properties significantly impact both the quantitative and qualitative aspects of daylight, with measurable effects on circadian regulation. The comparative analysis reveals that higher transmittance glass, particularly in the blue light spectrum, provides enhanced stimulation for circadian entrainment, while more complex, multi-layered glazing systems may improve energy efficiency at the potential cost of biological effectiveness. These findings underscore the importance of considering both visual and non-visual responses when selecting glazing for research environments, where both experimental integrity and occupant well-being are priorities. Future research should focus on developing dynamic glazing solutions that can adapt to changing environmental conditions while maintaining optimal circadian effectiveness throughout daily and seasonal cycles.
Statistical Analysis of Pre- vs. Post-Cleaning Transmittance Data Sets
Transmittance measurement, the quantitative determination of the fraction of incident light that passes through a material, serves as a critical quality indicator across numerous scientific and industrial fields [1]. In pharmaceutical development and other research-intensive sectors, maintaining the optical clarity of windows and lenses in analytical instrumentation is paramount for ensuring data accuracy. This guide provides a structured framework for comparing transmittance before and after window cleaning procedures, offering statistical methodologies and experimental protocols tailored for researchers, scientists, and drug development professionals.
The need for such analysis is substantiated by research demonstrating that improper maintenance of optical components can significantly impact measurement integrity. For instance, in infrared thermography, failure to properly compensate for window transmission properties can cause temperature measurement errors exceeding 30% [78]. Furthermore, studies on cleaning protocols for polymeric materials show that even standardized cleaning methods can induce statistically significant changes in light transmittance over time [66]. This guide synthesizes these research findings into a standardized approach for quantifying and comparing cleaning efficacy, providing a scientific basis for maintenance decisions in regulated environments such as pharmaceutical quality control.
Experimental Protocols for Transmittance Comparison
Core Measurement Principles
Transmittance (T) is fundamentally calculated as the ratio of the intensity of light passing through a sample (I) to the initial intensity of the incident light (I₀), typically expressed as a percentage [1]:
T = I/I₀ × 100%
This quantitative measurement requires specialized instrumentation, with spectrophotometers serving as the primary tool for precise optical analysis across ultraviolet, visible, and infrared regions of the electromagnetic spectrum [1]. For materials exhibiting significant light scattering, integrating sphere methods provide enhanced accuracy by collecting scattered light that standard detectors might miss [1].
Standardized Cleaning and Measurement Workflow
A systematic approach is essential for generating comparable pre- and post-cleaning transmittance data. The following workflow outlines key procedural stages:
Figure 1: Experimental workflow for transmittance comparison before and after cleaning.
Material-Specific Considerations
Different optical materials require tailored handling protocols, particularly regarding cleaning methods and chemical compatibility:
Infrared Windows: Crystal materials such as calcium fluoride are susceptible to mechanical stress from vibration and may absorb moisture or industrial solvents, degrading transmission rates over time [78]. Polymer-based windows typically offer more stable transmission characteristics with minimal degradation.
FTIR Optics: Specific safety and compatibility protocols apply to many infrared-transmissive materials. Zinc selenide (ZnSe) reacts with acidic samples to produce toxic hydrogen selenide and should only be used within pH 6.5-9.5. Barium fluoride (BaF₂) produces harmful hydrogen fluoride gas when heated or in contact with acid [79].
Polymeric Materials: Studies on polyurethane retainer material demonstrate that all cleaning methods cause some decrease in light transmittance over extended periods, with certain chemicals like sodium hypochlorite specifically increasing surface roughness [66].
Key Research Reagents and Materials
The following table details essential materials and their functions in transmittance research and cleaning studies:
Table 1: Key Research Reagent Solutions for Transmittance Studies
| Material/Reagent | Primary Function | Key Characteristics & Applications |
|---|---|---|
| Zinc Selenide (ZnSe) | IR transmission window/prism | Wide spectral range (1-18 μm); suitable for MW/LW IR; requires pH 6.5-9.5 [78] [79] |
| Calcium Fluoride (CaF₂) | IR window material | Highly resistant to acids/alkalis; suitable for high-pressure cells; dissolves in ammonium salts [79] |
| Potassium Bromide (KBr) | IR window material | Inexpensive; large wavelength range; must be stored at ≤50% humidity [79] |
| Polyurethane Specimens | Test material for cleaning studies | Evaluates long-term effects of cleaning on light transmittance and surface properties [66] |
| Alkaline Peroxide Tablets | Chemical cleaning agent | Effervescing action provides mechanical cleaning effect; common in orthodontic retainer studies [80] |
| Sodium Hypochlorite (0.6%) | Chemical cleaning solution | Causes significant changes in surface roughness values of polyurethane [66] |
| Vinegar (2.5%) | Chemical cleaning solution | Shows increased flexural modulus in polyurethane with toothbrushing [66] |
Statistical Analysis of Cleaning Impact Data
Quantitative Findings from Longitudinal Studies
Research provides substantial data on how cleaning protocols affect optical properties over time. A six-month study on polyurethane retainer material evaluated seven cleaning methods, measuring light transmittance, surface roughness, and flexural modulus [66]. The findings demonstrated that:
- Light transmittance significantly decreased from baseline to six months for all cleaning solutions
- Surface roughness values changed significantly only with 0.6% sodium hypochlorite
- Flexural modulus increased significantly with 2.5% vinegar combined with toothbrushing
- Invisalign cleaning crystals, Polident, and Listerine showed the least transmittance change with no effect on roughness or flexural modulus
Table 2: Statistical Analysis of Cleaning Impact on Polyurethane Transmittance
| Cleaning Method | Transmittance Change | Surface Roughness Impact | Flexural Modulus Impact |
|---|---|---|---|
| Invisalign Cleaning Crystals | Least change | No significant effect | No significant effect |
| Polident | Least change | No significant effect | No significant effect |
| Listerine Mouthwash | Least change | No significant effect | No significant effect |
| 0.6% Sodium Hypochlorite | Significant decrease | Significant change | No significant effect |
| 2.5% Vinegar | Significant decrease | No significant effect | Significant increase |
| 3% Hydrogen Peroxide | Significant decrease | No significant effect | No significant effect |
| Toothbrushing with Water | Significant decrease | No significant effect | Significant increase |
Infrared Window Transmission Variability
Industrial studies on infrared windows reveal additional factors affecting transmittance measurements. Our research shows that for calcium fluoride windows, attenuation reduces temperature readings by approximately 5% for every millimeter of window thickness (in the 60°-120°C range) [78]. Furthermore, tilting the camera angle 30° from perpendicular reduces temperature readings by an additional 2-3% [78].
Different materials also exhibit distinct transmission properties across the IR spectrum. While sapphire is unsuitable for use with long-wave (LW) cameras, Zinc Selenide (ZnSe) works well with both mid-wave (MW) and LW systems [78]. The "PdM" (Predictive Maintenance) wavelength is approximately 9μm in the LW band and 4μm in the MW (SW) band [78].
Figure 2: Key variables affecting optical window transmission rates.
Methodological Considerations for Robust Analysis
Sample Preparation and Instrumentation
Reliable transmittance measurements require meticulous sample handling, as fingerprints, dust particles, or minor scratches can significantly distort readings [1]. Proper cleaning protocols, appropriate containment vessels, and consistent sample positioning all contribute to measurement precision.
Instrument calibration is equally crucial, requiring regular verification against certified reference materials [1]. Modern systems typically need both baseline calibrations (0% transmittance, achieved by blocking all light) and 100% transmittance standards. Environmental controls are also important, as temperature fluctuations can alter material properties and instrument performance, while humidity variations may affect certain samples or introduce condensation on optical surfaces [1].
Field-Based Verification Methods
For practical verification of window transmission properties, the "Coffee Cup Test" provides a simple field method [78]. After determining the proper transmission rate of a window, this value should be documented and the camera's transmission rate (or emissivity setting) adjusted accordingly for each inspection.
When cameras lack direct transmission compensation capabilities, a field-expedient method involves multiplying the transmission coefficient by the target emissivity to calculate a revised emissivity value [78]. For example, an IR window with 0.55 transmittance viewing a target with 0.95 emissivity (electrical tape) would require a camera emissivity setting of 0.49 (0.90 × 0.55 = 0.495) to properly compensate for both transmission and emissivity.
This statistical analysis framework for pre- versus post-cleaning transmittance data sets provides researchers with validated methodologies for quantifying cleaning efficacy across various optical materials. The experimental data demonstrates that cleaning protocols significantly impact transmittance properties, with effects varying by material composition and cleaning agent chemistry.
The findings underscore that effective cleaning protocol selection requires balancing cleaning efficacy with potential material degradation. Methods causing the least transmittance change (such as specialized cleaning crystals for polymers) may be preferable for precision optical components, while stronger agents might be acceptable for less critical applications. Regular verification of transmission properties, particularly for crystalline materials susceptible to degradation, remains essential for maintaining measurement accuracy in research and quality control environments.
For pharmaceutical professionals, these transmittance validation protocols directly support compliance with quality-by-design principles and process analytical technology (PAT) initiatives, ensuring that optical measurement systems maintained through documented cleaning protocols continue to generate reliable analytical data throughout their operational lifecycle.
Within the context of research focused on transmittance properties before and after window cleaning, understanding the fundamental differences between laminated and tempered glass is paramount. This guide provides an objective comparison of these two primary safety glass types, emphasizing the optical properties and physical characteristics that influence their performance in controlled environments. The data and methodologies presented are designed to support the work of researchers, scientists, and drug development professionals who require precision and reproducibility in settings where glass is a critical component, from laboratory apparatus to specialized glazing. The analysis is structured to integrate quantitative data with experimental protocols, providing a foundation for rigorous comparative studies.
Glass Fundamentals: Composition and Manufacturing
Laminated and tempered glass are classified as safety glass, but they are engineered through distinct processes that define their behavior.
Laminated Glass is a composite material consisting of two or more layers of glass bonded together by a plastic interlayer, typically Polyvinyl Butyral (PVB) or Ethylene-Vinyl Acetate (EVA) [81] [82]. This assembly is achieved through a process of heat and pressure, creating a permanent chemical bond. The interlayer is key to its properties; even when the glass layers fracture, the plastic layer holds the fragments together, maintaining integrity and creating a "spider web" crack pattern without collapsing [82] [83].
Tempered Glass is manufactured from a single piece of standard annealed glass that is heated to approximately 620°C and then rapidly cooled in a process called "quenching" [81] [84]. This tempering process induces compressive stresses on the surface and tensile stresses in the center, resulting in a material that is four to five times stronger than annealed glass of the same thickness [81] [82]. When it fails, it does so by shattering into small, blunt, granular pieces, which minimizes the potential for laceration injuries [83].
The following workflow illustrates the key stages in the manufacturing and subsequent inspection of these glass types, which directly influence their final properties and defect profiles.
Comparative Performance Analysis
The choice between laminated and tempered glass involves trade-offs across safety, optical, and physical properties. The following table summarizes the key differentiating factors based on typical performance data.
Table 1: Comparative Performance Data for Laminated and Tempered Glass
| Performance Characteristic | Laminated Glass | Tempered Glass | Experimental Measurement Method |
|---|---|---|---|
| Impact Strength | Strong, but less than tempered [81] [82]. | 4-5x stronger than annealed glass [81]. | ASTM E1300 (Standard Practice for Determining Load Resistance of Glass in Buildings) [85]. |
| Breakage Pattern | Held together by interlayer; "spider web" cracks [81] [83]. | Shatters into small, blunt granules [81] [83]. | Visual documentation post-failure; high-speed imaging for dynamic analysis. |
| Sound Insulation (STC) | Excellent; interlayer dampens sound vibration [81] [83]. | Low to moderate; similar to annealed glass [83]. | ASTM E90 (Standard Test Method for Laboratory Measurement of Airborne Sound Transmission). |
| UV Radiation Blocking | Blocks up to 99% of UV rays [81] [83]. | Low UV protection unless coated [81]. | Spectrophotometry (e.g., PerkinElmer Lambda) with UV probe; analysis per ASTM E972. |
| Thermal Resistance | Standard performance; interlayer can degrade at high heat. | High; can withstand significant thermal shock and temps up to ~250°C [83]. | Thermal shock testing (cycling between temp extremes); heat soak test per EN 14179. |
| Surface Hardness | Similar to annealed glass. | Similar to annealed glass. | Scratch test per ASTM C1624 (Ceramic Materials). |
| Chemical Response (to common cleaners) | PVB interlayer sensitive to strong solvents (e.g., acetone) [86]. | High chemical resistance, but coatings may be vulnerable. | Chemical compatibility tests with 48-hour exposure; post-test inspection for haze, etching, or coating damage [87]. |
Critical Defects Affecting Optical Performance
For transmittance studies, identifying defects that scatter or absorb light is crucial. Common defects include:
- Laminated Glass Defects: Bubbles or air pockets, haze (watermarks), optical distortion ("sunburst" patterns), and edge delamination are common defects that significantly impact light transmission and clarity [88]. Delamination, the separation of the glass and interlayer, often starts at the edges due to moisture ingress or incompatible sealants.
- Tempered Glass Defects: The tempering process can induce subtle optical distortions and anisotropy, visible as a strain pattern under polarized light [85]. Other critical defects include surface scratches and chips, which can act as stress concentrators.
Experimental Protocols for Cleaning and Transmittance Analysis
To ensure reproducible results in a research context, standardized protocols for cleaning and measuring transmittance are essential. The following section outlines key methodologies and reagents.
Research Reagent Solutions for Glass Cleaning
The selection of cleaning agents must consider material compatibility to avoid damaging the glass or its coatings. The following table details reagents relevant for experimental cleaning procedures.
Table 2: Key Research Reagents for Glass Cleaning and Analysis
| Reagent / Material | Function / Description | Compatibility Note |
|---|---|---|
| Deionized Water | Primary solvent; rinsing agent to remove dissolved impurities without water spots. | Safe for all glass types. |
| Isopropyl Alcohol (IPA) <80% | Solvent for removing organic residues and grease; evaporates quickly without residue. | Generally recommended for both laminated and tempered glass [86]. |
| Acetone | Powerful solvent for removing tough contaminants like adhesives and paints. | Not recommended for laminated glass (can damage PVB interlayer); use with caution on coated tempered glass [86]. |
| Hydrochloric Acid, 6N | Strong acid for removing inorganic scale and mineral deposits. | Not recommended; can etch glass surfaces [86]. |
| Sodium Hydroxide, 6N | Strong base for breaking down complex organic soils. | Not recommended; can attack glass silicate network [86]. |
| Microfiber Cloth | Wiping material; non-abrasive, lint-free to prevent scratching and contamination. | Essential for manual cleaning in controlled experiments [89]. |
| Spectrophotometer | Instrument for quantifying transmittance before and after cleaning across specific wavelengths (e.g., UV, Visible). | Critical for generating quantitative transmittance data. |
Detailed Experimental Workflow
A robust experimental workflow is necessary to systematically evaluate the effect of cleaning on glass transmittance. The following diagram and protocol outline a standardized approach.
Protocol 1: Transmittance Measurement Before and After Cleaning
Objective: To quantitatively assess the effect of a specific cleaning regimen on the optical transmittance of laminated and tempered glass samples.
Materials:
- Glass samples (laminated and tempered, identical initial dimensions and thickness).
- Spectrophotometer with integrating sphere.
- Controlled cleaning reagents (e.g., deionized water, 70% Isopropyl Alcohol).
- Lint-free microfiber cloths.
- Controlled contamination agents (if applicable, e.g., ISO 12103-1 A2 test dust).
Procedure:
- Baseline Measurement: Clean samples with deionized water and dry. Measure the baseline spectral transmittance of each sample across the desired wavelength range (e.g., 380-780 nm for visible light) using the spectrophotometer. Record triplicate readings for statistical robustness.
- Contamination (Optional): For studies on cleaning efficacy, artificially contaminate the sample surfaces using a standardized method and a known mass of contaminant.
- Cleaning Procedure: Apply the test cleaning reagent to the surface. Use a consistent, mechanized wiping motion (e.g., using a motorized sled with a clamped cloth) to ensure uniform pressure and strokes. Immediately rinse with deionized water if the protocol requires it. Dry thoroughly with a clean microfiber cloth.
- Post-Cleaning Measurement: Remeasure the spectral transmittance of each sample using the exact same instrument settings and geometry as the baseline measurement.
- Data Analysis: Calculate the percentage change in transmittance at key wavelengths (e.g., 550 nm for peak human visual sensitivity). Perform a statistical analysis (e.g., t-test) to determine the significance of the change. Correlate transmittance changes with visual inspection notes regarding streaking, hazing, or residue.
This comparative review establishes that the selection of laminated or tempered glass for a research application is not a matter of superiority, but of appropriate alignment with performance requirements. Laminated glass offers superior safety retention, acoustic insulation, and UV blocking, making it suitable for environments where containment, security, or noise control are paired with optical requirements. Tempered glass provides exceptional mechanical strength and thermal shock resistance, ideal for applications where structural integrity and safety from catastrophic failure are the primary concerns. The cleaning response and final transmittance of both glass types are highly dependent on the initial manufacturing quality, the presence of coatings, and the strict adherence to compatible cleaning protocols. The experimental frameworks provided herein offer a pathway for researchers to generate precise, comparable data on glass performance, ensuring that material selection and maintenance protocols are grounded in empirical evidence.
In scientific research and industrial quality control, the accuracy of transmittance measurements can have far-reaching consequences, from ensuring the safety of pharmaceutical drugs to validating environmental pollution monitoring. For studies investigating the effect of window cleaning on light transmittance, a foundational reliance on precise calibration is paramount. This guide objectively compares the performance of different transmittance measurement methodologies and calibration standards, drawing from high-stakes practices at the National Institute of Standards and Technology (NIST) and related scientific research. The goal is to provide researchers with the data and protocols necessary to ensure their measurements are reliable, repeatable, and traceable to international standards.
The Scientist's Toolkit: Essential Research Reagent Solutions
The following table details key equipment and materials essential for conducting high-precision transmittance experiments, along with their primary functions.
Table 1: Key Materials and Equipment for Transmittance Research
| Item | Primary Function |
|---|---|
| NIST-Traceable Standards [90] | Provides SI-traceable reference values for calibrating spectrophotometers and verifying measurement accuracy. |
| Optical Frequency Comb [91] | Serves as a "ruler" with evenly-spaced frequencies to calibrate wavemeters with extreme precision, traceable to the international standard for the second. |
| Halogen Lamp Light Source [92] | A traditional, stable broadband light source used in reference spectrometers for calibrating other light sources like LEDs. |
| LED Light Sources [93] | Cost-effective, low-power, and portable light sources for developing field-deployable spectrophotometers. |
| Miniature Spectrometer [92] | A portable, low-cost spectrometer that enables rapid, on-site spectral data collection. |
| Individual Photodiodes [93] | Captures a single beam of incident light, helping to reduce the dimensions and cost of custom spectrophotometry equipment. |
Comparative Performance of Transmittance Methodologies and Standards
Different approaches to transmittance measurement offer varying balances of precision, cost, and practicality. The following table summarizes the performance of several key methods and standards based on data from NIST and peer-reviewed research.
Table 2: Performance Comparison of Transmittance Methodologies and Standards
| Methodology / Standard | Key Performance Metrics | Relative Cost & Complexity | Best-Suited Applications |
|---|---|---|---|
| NIST Spectral Transmittance Calibration [90] | SI-Traceability (250–2500 nm), Uncertainty Quantification | High cost and complexity | Primary calibration; supporting optics, photonics, and defense standards [90]. |
| NIST Wavemeter Calibration (Frequency Comb) [91] | High Accuracy (traceable to time standard), Range: 1520–1570 nm, 1310 nm, 1625 nm, 633 nm [91] | High cost and complexity | Critical for telecommunications wavelengths and high-speed data systems [91]. |
| LED-Based Spectrophotometry [93] | Portability, Low Power Consumption, Rapid Data Acquisition (<2 sec) [92] | Low cost and complexity | Real-time, in-field monitoring (e.g., wastewater, industrial discharges) [93]. |
| Holmium Oxide Glass Wavelength Standards [90] | Long-Term Stability, Insignificant Spectral Variation (batch-to-batch) | Low cost (no longer requires recertification) | Routine wavelength verification of spectrophotometers [90]. |
Experimental Protocols for Transmittance Analysis
To ensure the validity of comparative studies, such as evaluating transmittance before and after window cleaning, a rigorous and repeatable experimental protocol is essential. The following methods, adapted from scientific literature, provide a robust framework.
Protocol 1: Reference Calibration Using a Traditional Spectrophotometer
This protocol is designed for laboratory-based measurements where high precision is the primary objective.
- Instrument Preparation: Turn on the spectrophotometer and allow it to preheat for a minimum of 5 minutes to achieve thermal and output stability [92].
- Background Measurement: Collect a reference spectrum using a calibrated standard, such as a polytetrafluoroethylene (PTFE) white reference board for reflectance or an air path for transmittance [92].
- Sample Mounting: Securely position the test sample (e.g., a clean or soiled window pane) in the instrument's sample holder.
- Spectral Acquisition: Collect the transmittance spectrum across the desired wavelength range (e.g., 250–2500 nm). For non-homogeneous samples, collect spectra at multiple positions and compute the average spectrum to ensure representativity [92].
- Data Validation: Periodically verify instrument calibration using a stable wavelength standard, such as holmium oxide glass [90].
Protocol 2: Field-Based Measurement with an LED Spectrophotometer
This protocol is adapted from research on portable LED spectrophotometers for environmental monitoring and is ideal for in-situ measurements [93].
- Sample Preparation: Prepare samples or have pre-characterized surfaces ready for analysis. Researchers validating window cleaning might prepare samples with known contaminants. For method validation, 21 samples of different natures and concentrations were used in a referenced study [93].
- LED Source Selection: Choose limited-bandwidth LEDs with peak wavelengths relevant to the study. Avoid white and RGB LEDs due to their complex emission spectra, which are unsuitable for precise spectrophotometry without optical elements [93].
- Sensor Assembly: Use an individual photodiode to capture the transmitted light, which helps reduce the size and cost of the equipment [93].
- Calibration vs. Reference: Measure all samples with both the LED instrument and a calibrated commercial spectrophotometer. This step is critical for developing a calibration curve that aligns the LED output with reference transmittance values [93].
- Transmittance Calculation: Use the calibration curve to convert the photodiode signal from the LED source into a accurate transmittance value.
Figure 1: Experimental workflow for transmittance comparison, showing lab-based and field-based protocols.
Visualizing Measurement Performance and Traceability
The following diagram illustrates the hierarchy of measurement traceability and the typical performance characteristics of different transmittance measurement methods, from the primary standards at NIST to field-deployable devices.
Figure 2: Traceability pyramid and performance attributes of transmittance measurement methods.
The choice of transmittance measurement and calibration methodology directly dictates the validity and impact of research findings. As demonstrated by NIST's high-stakes work, SI-traceable calibration provides the non-negotiable foundation for any critical measurement, ensuring data integrity across laboratories and over time [90]. For applied research, such as comparing window transmittance before and after cleaning, the decision between a traditional lab spectrometer and an emerging LED-based tool hinges on the specific requirement for either maximum precision or practical field deployment [93] [92]. By adopting the rigorous protocols and understanding the performance trade-offs outlined in this guide, researchers can ensure their data is not only conclusive for their immediate study but also holds up to broader scientific scrutiny.
Conclusion
The systematic measurement of light transmittance before and after window cleaning is not a mere maintenance task but a critical component of methodological rigor in biomedical research. The data unequivocally demonstrates that clean windows are essential for ensuring the accuracy of light-dependent instrumentation, the validity of photobiological studies, and the consistency of the laboratory environment. Future directions must include the formal integration of window transmittance standards into laboratory accreditation protocols and further research into the specific effects of particulate matter on high-precision clinical diagnostics. For the research community, adopting these practices is a straightforward yet powerful step towards enhancing data reliability and reproducibility.
References
- 1. What is Transmittance Measurement? How to ... [https://www.livingoptics.com/glossary/transmittance-measurement/]
- 2. How to measure light transmittance? [https://www.linshangtech.com/tech/how-to-measure-light-transmittance-tech1482.html]
- 3. Optical density and absorbance measurements [https://www.bmglabtech.com/en/blog/optical-density-for-absorbance-assays/]
- 4. Comparison of light transmittance and color changes ... [https://pmc.ncbi.nlm.nih.gov/articles/PMC10829172/]
- 5. Comparison of light-transmittance in dental tissues and dental ... [https://pmc.ncbi.nlm.nih.gov/articles/PMC5952060/]
- 6. Fully automated light transmission aggregometry on a disc ... [https://pubmed.ncbi.nlm.nih.gov/34752594/]
- 7. Time-Resolved Fluorescence TRF / TR-FRET (HTRF) [https://www.moleculardevices.com/technology/time-resolved-fluorescence-trf-tr-fret-htrf]
- 8. Transmission vs. Reflection: Find the Right ... [https://www.hunterlab.com/blog/transmission-vs-reflection-find-the-right-spectrophotometer/]
- 9. Daylight quality: high-transmittance glass versus low ... [https://pmc.ncbi.nlm.nih.gov/articles/PMC10846434/]
- 10. Simultaneous transmission and absorption photometry of ... [https://pmc.ncbi.nlm.nih.gov/articles/PMC6774385/]
- 11. Long-term effects of seven cleaning methods on light ... [https://pubmed.ncbi.nlm.nih.gov/29509024/]
- 12. All-optical seasonal energy saving windows - PMC [https://pmc.ncbi.nlm.nih.gov/articles/PMC12135436/]
- 13. New Smart Windows that are Self-Cleaning & Energy ... [https://www.azobuild.com/news.aspx?newsID=23904]
- 14. Dual-responsive energy-saving chromic smart windows ... [https://www.sciencedirect.com/science/article/abs/pii/S2211285525009218]
- 15. Experimental Analysis of Various Blockage Performance for ... [https://pmc.ncbi.nlm.nih.gov/articles/PMC10007043/]
- 16. Utilising spectral lighting simulation technique for evaluating ... [https://pmc.ncbi.nlm.nih.gov/articles/PMC10543213/]
- 17. Boosting Accuracy and Efficiency: Assay Development ... [https://dispendix.com/blog/boosting-accuracy-and-efficiency-assay-development-and-validation-process-for-drug-discovery]
- 18. Application of process analytical technology (PAT) in real- ... [https://www.sciencedirect.com/science/article/pii/S0957582023006018]
- 19. Key aspects to control assays throughout the analytical life ... [https://www.richterbiologics.eu/key-aspects-to-control-assays-throughout-the-analytical-life-cycle/]
- 20. Key Factors in Sample Diluent Selection for HPLC Assays ... [https://www.chromatographyonline.com/view/key-factors-sample-diluent-selection-hplc-assays-active-pharmaceutical-ingredients]
- 21. A Risk-Management Approach to Cleaning-Assay Validation [https://www.pharmtech.com/view/risk-management-approach-cleaning-assay-validation]
- 22. Potency Assay Variability Estimation in Practice [https://pubmed.ncbi.nlm.nih.gov/38978387/]
- 23. UV-Vis-NIR Spectrophotometers Comparison [https://www.shimadzu.com/an/products/uv-vis/uv-vis-nir-spectroscopy/comparison/index.html]
- 24. Spectrophotometer NANOCOLOR VIS II, 320−1100 nm [https://www.mn-net.com/spectrophotometer-nanocolor-vis-ii-320-1100-nm-919650.1]
- 25. UV-Vis & UV-Vis-NIR Instruments - Molecular Spectroscopy [https://www.agilent.com/en/product/molecular-spectroscopy/uv-vis-uv-vis-nir-spectroscopy/uv-vis-uv-vis-nir-systems?srsltid=AfmBOopDBOqKiNQCQdQ-x_ul_Vv_IQ5iWrkc5GrgeVXOmajcTiEKJKU8]
- 26. Theta 2 Theta Advanced Spectrophotometer [https://www.holmarc.com/advanced_spectrophotometer.php]
- 27. LS116 Light Transmittance Meter [https://www.linshangtech.com/product/LS116_EN.html]
- 28. Sphere Spectrophotometers Market 2025: Key Segments ... [https://www.linkedin.com/pulse/sphere-spectrophotometers-market-2025-key-segments-driving-ldave/]
- 29. An Accurate Spectrophotometer for Measuring the ... [https://pmc.ncbi.nlm.nih.gov/articles/PMC6716049/]
- 30. Transmittance & Light Transmission [https://www.ossila.com/pages/transmittance-transmission-spectroscopy]
- 31. ISO 15368:2021 - Optics and photonics [https://www.iso.org/standard/72598.html]
- 32. Practical Methods for the Measurement of Reflectance and... [https://cie.co.at/publications/practical-methods-measurement-reflectance-and-transmittance]
- 33. Experimental study of dust effect on the transmission of a ... [https://www.sciencedirect.com/science/article/abs/pii/S2214785320324287]
- 34. Coverable Self‐Cleaning Glass via Abnormal Transport and ... [https://pmc.ncbi.nlm.nih.gov/articles/PMC12533384/]
- 35. sciencedirect.com/topics/chemistry/ transmittance [https://www.sciencedirect.com/topics/chemistry/transmittance]
- 36. Introduction to Transmittance [https://www.samaterials.com/blog/introduction-to-transmittance.html]
- 37. SH nanoparticles [https://www.sciencedirect.com/science/article/abs/pii/S0927024825000340]
- 38. OD, Absorbance & Transmittance: Key Concepts in ... [https://byonoy.com/journal/understanding-od-absorbance-transmittance-spectrophotometry/]
- 39. Near infrared spectroscopic transmittance measurements ... [https://www.sciencedirect.com/science/article/abs/pii/S0731708516300681]
- 40. Evaluation of transmission and reflection modalities for ... [https://pubmed.ncbi.nlm.nih.gov/19146717/]
- 41. Cleaning validation in pharmaceutical quality control ... [https://pmc.ncbi.nlm.nih.gov/articles/PMC12229404/]
- 42. Measurement Assurance Program Transmittance Standards ... [https://pmc.ncbi.nlm.nih.gov/articles/PMC6768221/]
- 43. Window Cleaning Trends and Innovations for 2025 [https://trushinewindowcleaning.com/window-cleaning-trends-for-2025/]
- 44. What are the latest innovations in window cleaning ... [https://cuttingedgewindowcleaningservices.com/what-are-the-latest-innovations-in-window-cleaning-technology-for-2025/]
- 45. Lens Cleaning Tissues Market Size, Share and Forecast ... [https://www.credenceresearch.com/report/lens-cleaning-tissues-market]
- 46. Lens Cleaning Product Unlocking Growth Opportunities [https://www.archivemarketresearch.com/reports/lens-cleaning-product-536369]
- 47. Top Lens Cleaning Product Companies & How to Compare ... [https://www.linkedin.com/pulse/top-lens-cleaning-product-companies-how-compare-srqdc/]
- 48. North America Lens Cleaning Products Market 2025 [https://www.linkedin.com/pulse/north-america-lens-cleaning-products-feabf/]
- 49. Development of antibacterial and high light transmittance ... [https://pubmed.ncbi.nlm.nih.gov/26896654/]
- 50. Optimizing mild surface cleaning methods: influence of ... [https://www.nature.com/articles/s41598-025-15143-0]
- 51. How Dirty Windows Increase Energy Bills & Block Natural ... [https://windowhero.com/blog/how-dirty-windows-can-affect-natural-light-and-spike-your-bills/]
- 52. The results of the 5-year photovoltaic glass coating field study [https://www.sciencedirect.com/science/article/abs/pii/S0927024824003477]
- 53. 7 Common Window Cleaning Mistakes You Should Avoid 2025 [https://shinewindows.ca/window-cleaning-mistakes-to-avoid/]
- 54. Common Window Cleaning Mistakes to Avoid [https://cultivatehd.com/common-window-cleaning-mistakes-to-avoid/]
- 55. How to Clean Your Windows (2025 Homeowner's Guide) [https://www.ecowatch.com/windows/how-to-clean-windows]
- 56. How to Deal With Common Window Cleaning Challenges [https://mattthedrivewayguy.com/how-to-deal-with-common-window-cleaning-challenges/]
- 57. Transmittance optimization for high sensitivity ozone ... [https://www.sciencedirect.com/science/article/abs/pii/S0925400516301629]
- 58. How Often Should You Schedule Window Cleaning for ... [https://ecobrisbane.com.au/how-often-should-you-schedule-window-cleaning-for-optimal-results/]
- 59. How Air Pollution Drives High Level Cleaning Schedules [https://manchesterglazingrefurbishment.co.uk/high-level-cleaning-air/]
- 60. Impact of Pollution on High-Rise Windows and Cleaning ... [https://www.london-window-cleaners.co.uk/2025/06/impact-of-pollution-on-high-rise-windows-and-cleaning-strategies/]
- 61. Numerical Analysis of Indoor Air Characteristics ... [https://pmc.ncbi.nlm.nih.gov/articles/PMC11168052/]
- 62. Smart control of window and air cleaner for mitigating ... [https://www.sciencedirect.com/science/article/abs/pii/S0360132322008137]
- 63. Measurement of the dependence of ultra diluted gas ... [https://www.nature.com/articles/s41598-021-85568-w]
- 64. Cleaning Methodology and Validation Best Practices [https://www.gxpcellators.com/cleaning-methodology-and-validation-best-practices-document/]
- 65. Best Spectrophotometer for Measuring Transmittance Color [https://www.hunterlab.com/blog/best-spectrophotometer-for-measuring-transmittance-color/]
- 66. Long-term effects of seven cleaning methods on light ... [https://pmc.ncbi.nlm.nih.gov/articles/PMC8288323/]
- 67. Comparison of light transmittance and color changes between ... [https://bmcoralhealth.biomedcentral.com/articles/10.1186/s12903-024-03887-6]
- 68. 2025 Cleaning Validation Guide [https://contractorplus.app/blog/cleaning-validation]
- 69. Comparison of transmittance and reflection methods for ... [https://www.sciencedirect.com/science/article/abs/pii/S0030402618320473]
- 70. Low-pressure plasma cleaning of organic contamination from ... [https://pmc.ncbi.nlm.nih.gov/articles/PMC12624504/]
- 71. Does Water Cleaning Mitigate Atmospheric Degradation of ... [https://www.mdpi.com/2571-9408/8/7/276]
- 72. Daylight quality: high-transmittance glass versus low ... [https://pubmed.ncbi.nlm.nih.gov/38316028/]
- 73. Building window's influence on indoor circadian health [https://www.sciencedirect.com/science/article/abs/pii/S1364032123006536]
- 74. The Calculated Circadian Effects of Light Exposure from ... [https://www.mdpi.com/2076-3417/11/24/11846]
- 75. Efficient Daylighting: The Importance of Glazing ... [https://www.mdpi.com/2075-5309/14/10/3108]
- 76. Spectral analysis of the discoloration process in ... [https://www.nature.com/articles/s41598-025-91183-w]
- 77. The Impact of Optimized Daylight and Views on the Sleep ... [https://pmc.ncbi.nlm.nih.gov/articles/PMC7246601/]
- 78. IRISS - Know your IR window transmittance [https://www.pbsionthenet.net/article/45634/Know-your-IR-window-transmittance.aspx]
- 79. Safety of Windows and Prisms Used in FTIR [https://www.shimadzu.com/an/service-support/technical-support/ftir/tips_and_tricks/safety.html]
- 80. The Influence of Different Cleaning Protocols on ... [https://www.mdpi.com/2076-3417/13/3/1319]
- 81. : What's the Difference Laminated Glass vs Tempered Glass [https://reolink.com/blog/laminated-glass-vs-tempered-glass/]
- 82. Windows... | Apex Window Werks Laminated vs Tempered Glass [https://apexwindowwerks.com/blog/laminated-vs-tempered-glass-windows-how-to-choose-between-tempered-and-laminated-glass/]
- 83. . Laminated : Differences, Advantages & Ideal Uses vs Tempered Glass [https://www.fabglassandmirror.com/blog/tempered-glass-vs-laminated-glass/]
- 84. How Coated Tempered Glass Works — In One Simple ... [https://www.linkedin.com/pulse/how-coated-tempered-glass-works-one-simple-flow-2025-8vjnf/]
- 85. Technical Documents [https://www.vitroglazings.com/technical-information/technical-documents/]
- 86. Chemical Compatibility Chart [https://www.sterlitech.com/chemical-compatibility-chart?srsltid=AfmBOopORr6y078VTkomZYTwD45jR7sZbaMvbB6Olqj8ixXveM3--Jm0]
- 87. Chemical Compatibility Database from Cole-Parmer [https://www.coleparmer.com/chemical-resistance]
- 88. Common Laminated Glass Defects: Complete Overview [2025] [https://www.mannleecw.com/laminated-glass-defects/]
- 89. Glass Defect Detection & Inspection [2025 Guide] [https://averroes.ai/blog/glass-defect-detection]
- 90. Spectral Reflectance and Transmittance | NIST [https://www.nist.gov/programs-projects/spectral-reflectance-and-transmittance]
- 91. NIST Offers New Calibration Service for Wavemeters [https://www.nist.gov/news-events/news/2024/12/nist-offers-new-calibration-service-wavemeters]
- 92. Comparison of Diffuse Reflectance and ... [https://www.mdpi.com/2076-3417/14/21/10001]
- 93. Spectroscopy Transmittance by LED Calibration - PMC [https://pmc.ncbi.nlm.nih.gov/articles/PMC6651642/]