Raman Spectroscopy in Cultural Heritage: A Non-Destructive Guide for Material Analysis and Authentication
This article provides a comprehensive overview of the application of Raman spectroscopy in cultural heritage analysis.
Raman Spectroscopy in Cultural Heritage: A Non-Destructive Guide for Material Analysis and Authentication
Abstract
This article provides a comprehensive overview of the application of Raman spectroscopy in cultural heritage analysis. It explores the foundational principles of this non-destructive technique and its evolution into an indispensable tool for researchers and scientists. The content details methodological approaches for analyzing diverse materials—from pigments and ceramics to metals and organic remains—highlighting both standard and advanced techniques like SERS and portable systems. It also addresses common analytical challenges, such as fluorescence interference, and offers optimization strategies. Finally, the article examines how Raman spectroscopy complements other analytical techniques and discusses future directions, including the role of machine learning in enhancing diagnostic capabilities for artifact preservation and authentication.
The Fundamentals of Raman Spectroscopy: Principles and Evolution in Heritage Science
Raman spectroscopy is a powerful analytical technique that provides a structural fingerprint by which molecules can be identified, based on the inelastic scattering of light [1]. This phenomenon, known as Raman scattering, occurs when light interacts with molecular vibrations, phonons, or other excitations in a system, resulting in a shift in the energy of the laser photons [1]. The technique is particularly valuable because it directly probes vibration and rotational-vibration states in molecules and materials, allowing for non-destructive and label-free chemical analysis [2]. The core principle revolves around the interaction between incident light and the electron cloud of a molecule, which creates an induced dipole moment based on the molecule's polarizability [1]. For a molecule to exhibit a Raman effect, there must be a change in its electric dipole-electric dipole polarizability with respect to the vibrational coordinate corresponding to the rovibronic state [1]. The resulting spectral fingerprints, typically covering the 500 cm⁻¹ to 1800 cm⁻¹ range for biological samples, contain detailed information about molecular composition and structure [2].
Fundamental Physics of Light-Matter Interaction
The Raman Scattering Phenomenon
The Raman effect originates from the inelastic scattering of monochromatic light, usually from a laser in the visible, near infrared, or near ultraviolet range [1]. When a photon interacts with a molecule, most photons are elastically scattered (Rayleigh scattering) with no change in energy. However, a small fraction (approximately 1 in 10 million) undergoes inelastic scattering, resulting in energy shifts that provide information about molecular vibrational modes [3]. This energy shift, known as the Raman shift, is measured in wavenumbers (cm⁻¹) and calculated using the formula:
[ \Delta \tilde{\nu} = \left( \frac{1}{\lambda0} - \frac{1}{\lambda1} \right) ]
where (\Delta \tilde{\nu}) is the Raman shift expressed in wavenumber, (\lambda0) is the excitation wavelength, and (\lambda1) is the Raman spectrum wavelength [1].
Quantum Mechanical Description
From a quantum mechanical perspective, Raman scattering involves transitions between vibrational energy states described by:
[ E_v = h \nu \left( n + \frac{1}{2} \right) ]
where (\nu) is the vibrational frequency, (h) is Planck's constant, and (n) is the vibrational quantum number with integer values [3]. When the final vibrational state is higher in energy than the initial state, the scattered photon is shifted to a lower frequency (Stokes Raman scattering). Conversely, when the final state is lower in energy, the scattered photon is shifted to a higher frequency (anti-Stokes Raman scattering) [3] [1].
Comparison with Infrared Spectroscopy
Raman spectroscopy provides complementary information to infrared (IR) absorption spectroscopy, as they depend on different molecular properties. While IR spectroscopy depends on the electric dipole moment derivative (atomic polar tensor), Raman spectroscopy depends on the electric dipole-electric dipole polarizability derivative [1]. This contrasting feature means vibrational transitions that are weak or inactive in IR may be strong in Raman spectroscopy and vice versa, following the rule of mutual exclusion in centrosymmetric molecules [1].
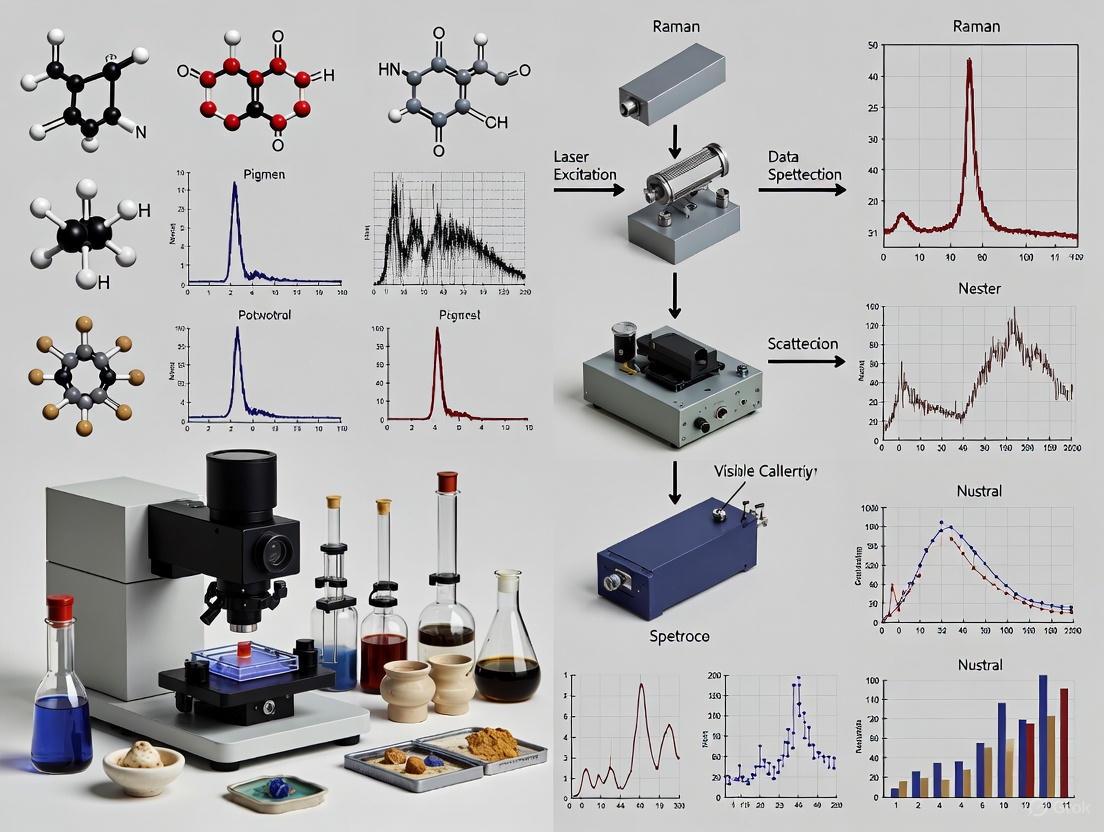
Figure 1: Raman Spectroscopy Workflow. This diagram illustrates the fundamental process from laser excitation to spectrum generation, highlighting the different scattering phenomena.
Molecular Fingerprinting Principle
The "molecular fingerprint" region in Raman spectroscopy refers to the unique pattern of peaks corresponding to specific molecular vibrations that are characteristic of a material's chemical composition [3]. These molecular vibrations are crucial processes in physical chemistry and biochemistry, and studying these fingerprints provides valuable insights into molecular structure and interactions [3]. In biological samples, approximately 90% of Raman peaks are found in the fingerprint spectral region (500 cm⁻¹ to 1800 cm⁻¹), with the remaining found in the higher energy CH/OH stretching vibrational modes (2700 cm⁻¹ to 3300 cm⁻¹) [2]. The specificity of these fingerprints allows researchers to identify chemical bonds, functional groups, and molecular structures, making Raman spectroscopy invaluable for characterizing complex materials without the need for labels or dyes [3] [2].
Quantitative Spectral Interpretation
The intensity of Raman scattering is proportional to the change in polarizability during vibration [1]. Different chemical bonds produce characteristic shifts:
Table 1: Characteristic Raman Shifts for Common Molecular Vibrations
| Molecular Bond/Vibration | Raman Shift Range (cm⁻¹) | Relative Intensity | Chemical Information |
|---|---|---|---|
| C-C stretching | 800-1200 | Strong | Carbon backbone structure |
| C=C stretching | 1500-1680 | Strong | Unsaturation presence |
| C-H stretching | 2850-3000 | Moderate | Aliphatic chains |
| O-H stretching | 3200-3600 | Weak | Hydroxyl groups, water |
| Amide I | 1640-1680 | Moderate | Protein secondary structure |
| S-S stretching | 500-550 | Strong | Disulfide bridges in proteins |
Advanced Raman Techniques
Enhanced Raman Methodologies
Several enhanced Raman techniques have been developed to overcome the inherent weakness of spontaneous Raman scattering:
Surface-Enhanced Raman Spectroscopy (SERS) concentrates electromagnetic energy using metallic nanostructures with surface plasmon optical modes, enhancing Raman scattering intensity by 10⁸ to 10¹¹ magnitudes [3] [2]. This extreme sensitivity enables detection of single molecules and is particularly valuable for identifying low-abundance biomarkers in complex biological samples [3].
Tip-Enhanced Raman Spectroscopy (TERS) provides spectral information with nanoscale spatial resolution by combining Raman spectroscopy with scanning probe microscopy, allowing characterization at the single-molecule level [2].
Spatially Offset Raman Spectroscopy (SORS) probes deeper into samples than conventional Raman spectroscopy by spatially offsetting the laser excitation and scattering collection regions, enabling non-invasive diagnosis of subsurface features up to 2 mm deep in diffusely scattering samples [3].
Stimulated Raman Scattering (SRS) and Coherent Anti-Stokes Raman Scattering (CARS) are coherent Raman techniques that provide much stronger signals relative to spontaneous Raman spectroscopy, enabling real-time imaging of biological processes and materials [2].
Technical Comparison of Raman Modalities
Table 2: Comparison of Advanced Raman Spectroscopy Techniques
| Technique | Enhancement Mechanism | Spatial Resolution | Key Applications | Limitations |
|---|---|---|---|---|
| Conventional Raman | Spontaneous scattering | Diffraction-limited (~0.5 µm) | General material characterization | Weak signal, fluorescence interference |
| SERS | Plasmonic enhancement on metallic nanostructures | Diffraction-limited to nanoscale | Trace detection, single-molecule analysis | Substrate dependency, reproducibility challenges |
| TERS | Plasmonic enhancement at scanning probe tip | Nanoscale (<10 nm) | Nanomaterial characterization, single-molecule studies | Complex instrumentation, slow acquisition |
| SORS | Spatial offset for subsurface probing | Depth-dependent (up to 2 mm) | Non-invasive deep tissue imaging, layered materials | Reduced signal intensity with depth |
| CARS | Coherent nonlinear process | Diffraction-limited | High-speed chemical imaging, biological tissues | Non-resonant background, complex interpretation |
Experimental Protocols for Cultural Heritage Analysis
Standardized Analytical Workflow for Pigment Identification
Objective: To identify and characterize historical pigments in cultural heritage artifacts using non-destructive Raman spectroscopy.
Materials and Equipment:
- Portable Raman spectrometer (532 nm or 785 nm laser excitation)
- Microscopic attachment for small features
- Spectral calibration standards (e.g., silicon wafer at 520.7 cm⁻¹)
- Non-reflective sampling stage
- Computer with spectral processing software (e.g., RamanSPy [4])
Procedure:
Instrument Calibration:
- Perform daily wavelength calibration using a silicon standard
- Verify laser power output with a power meter
- Optimize spectrometer alignment using a reference sample
Sample Preparation:
- Stabilize artifact on non-reflective surface to minimize background
- For portable analysis, ensure proper distance and angle between probe and sample surface
- Document sampling location with microscopic imaging
Spectral Acquisition Parameters:
- Laser power: 1-10 mW (minimize potential damage to sensitive materials)
- Integration time: 1-10 seconds (adjust based on signal intensity)
- Accumulations: 3-10 scans (improve signal-to-noise ratio)
- Spectral range: 200-2000 cm⁻¹ (cover fingerprint region)
Data Quality Assessment:
- Verify signal-to-noise ratio > 10:1 for characteristic peaks
- Check for fluorescence background interference
- Ensure cosmic ray artifacts are removed from spectra
Spectral Interpretation:
- Compare acquired spectra with reference spectral libraries
- Identify key biomarker peaks for specific pigments
- Document peak positions, relative intensities, and bandwidths
Figure 2: Cultural Heritage Analysis Workflow. Standardized protocol for analyzing historical artifacts using Raman spectroscopy, ensuring reproducible results.
Multi-Technique Integration Protocol
Objective: To comprehensively characterize complex cultural heritage materials by integrating Raman spectroscopy with complementary analytical techniques.
Rationale: The combination of multiple spectroscopic approaches provides complementary information for complete characterization of molecular fingerprints in heterogeneous heritage materials [5] [6].
Integrated Workflow:
Initial Non-Invasive Screening:
- Perform macroscopic Raman mapping to identify regions of interest
- Use portable X-ray fluorescence (pXRF) for elemental composition
- Document with high-resolution photography
Targeted Molecular Analysis:
- Conduct micro-Raman spectroscopy on specific regions identified during screening
- Employ SERS for enhanced detection of organic colorants
- Utilize FT-IR spectroscopy for complementary vibrational information
Data Correlation and Interpretation:
- Correlate elemental (pXRF) and molecular (Raman/FT-IR) data
- Identify material degradation products and original components
- Compare with historical recipes and reference databases
The Scientist's Toolkit: Essential Research Reagents and Materials
Table 3: Essential Research Reagents and Materials for Raman Spectroscopy in Cultural Heritage
| Category | Specific Items | Function/Application | Technical Considerations |
|---|---|---|---|
| Calibration Standards | Silicon wafer (520.7 cm⁻¹), Acetaminophen, NIST SRM 2241 | Wavelength calibration, instrument performance verification | Use daily for portable instruments; weekly for benchtop systems |
| Reference Materials | RRUFF mineral database [4], Historical pigment sets, Bacterial isolates for contamination ID [4] | Spectral matching and material identification | Maintain institution-specific database of common local materials |
| Sample Preparation | Non-reflective substrates, Conductive adhesive tapes, Micro-sampling tools | Minimize background interference, enable micro-analysis | Test substrate Raman activity before sample mounting |
| Enhancement Substrates | SERS-active nanoparticles (Au/Ag), TERS probes, Plasmonic nanostructures | Signal enhancement for trace analysis | Match plasmon resonance to laser wavelength for optimal enhancement |
| Data Processing Tools | RamanSPy [4], ORPL package [7], BubbleFill algorithm | Baseline correction, cosmic ray removal, spectral analysis | Implement standardized processing pipelines for reproducibility |
Applications in Cultural Heritage Research
Raman spectroscopy has emerged as a reliable analytical tool for understanding cultural heritage, with applications evolving from initial phase to advanced stage characterized by integrated application of multi-spectral and multi-assistive techniques [5]. This shift reflects a profound change from analyzing chemical and physical systems to molecular material characterization, now encompassing diverse heritage forms including artifacts, murals, paintings, bronzes, stones, and crystals [5].
The synergistic combination of Raman, Laser-Induced Breakdown Spectroscopy (LIBS) and Infrared Spectroscopies has proven particularly valuable for addressing the varied material properties encountered in heritage science [5]. Recent advancements include mobile instrumentation for in-situ analysis, application of multivariate statistical analysis to Raman spectra, and coupling mobile instrumentation with complementary analytical techniques [6]. These developments are crucial for analyzing valuable objects on-site, driven by regulatory constraints and ethical considerations of preserving cultural heritage [6].
Current research focuses on overcoming challenges related to data availability, complexity, and uncertainty through machine learning system development, enhancing Raman spectroscopy detection, and reducing operational costs [5]. These advancements ensure that Raman spectroscopy continues to empower cultural heritage preservation, conservation, and understanding, ultimately enriching our cultural legacy.
Raman spectroscopy has undergone a profound transformation in the field of cultural heritage science, evolving from a specialized laboratory technique to a fundamental, established tool for art conservation and archaeological analysis. This evolution is characterized by critical advancements in instrumentation, data processing, and application methodologies that have collectively addressed the unique challenges presented by priceless and irreplaceable cultural objects [5] [6]. The technique's capacity for non-destructive, non-invasive, and in-situ analysis has positioned it as an indispensable ally for conservators, art historians, and scientists, enabling the detailed molecular characterization of artifacts without the need for sampling [8] [9].
The journey of Raman spectroscopy within cultural heritage is one of adaptation and innovation. Initially constrained by challenges such as fluorescence interference and the bulkiness of equipment, the field has matured through technological breakthroughs. These include the development of portable and handheld instruments, the strategic use of multiple laser wavelengths to minimize fluorescence, and the application of advanced data processing algorithms [6] [10]. This article traces this historical progression, provides detailed experimental protocols for contemporary analysis, and visualizes the workflows that now define this vital scientific discipline.
The Evolutionary Journey: Four Phases of Development
Bibliometric analysis of literature from 1992 to 2024 reveals that the application of spectroscopy in cultural heritage has followed a distinct four-phase evolutionary path [5]. This journey reflects a broader shift from basic chemical analysis to sophisticated molecular-level characterization.
Table 1: Historical Phases of Spectroscopy in Cultural Heritage
| Phase | Time Period | Key Characteristics | Major Advancements |
|---|---|---|---|
| Phase I: Initial Emergence | 1992-2002 | Erratic growth; initial exploration of spectroscopic methods for cultural heritage objects [5]. | Foundation laid by conferences and early research; Laser spectroscopy and Raman spectroscopy identified as promising tools [5]. |
| Phase II: Growth & Application | 2002-2008 | Steady growth trend; focus on safety, scientific assessment, and data collection [5]. | Creation of shared heritage material databases; recognition of spectroscopy's utility for conservation management [5]. |
| Phase III: Consolidation | 2008-2015 | Constant use of spectroscopy in conservation science, art technology, and archaeology [5]. | Proliferation of multispectral combining methods; increased analysis of trace samples [5]. |
| Phase IV: Advanced Innovation | 2015-Present | Rapid, steady growth in publications; integration of multi-spectral and multi-assistive techniques [5]. | Synergistic combination of techniques (e.g., Raman-LIBS-IR); rise of machine learning and AI for data interpretation; development of advanced portable instrumentation [5] [9]. |
The field's maturation is further evidenced by the expansion of research themes. From only 24 themes in the initial phase (1992-2002), the field grew to encompass 445 distinct research themes in the current advanced phase (2016-2024), indicating immense diversification and specialization [5]. A pivotal driver of this evolution has been the shift from analyzing isolated chemical systems to the comprehensive molecular characterization of a diverse range of heritage materials, including artifacts, murals, paintings, bronzes, and crystals [5].
Fundamentals of Raman Spectroscopy
Core Principles
Raman spectroscopy is based on the inelastic scattering of photons by matter, known as the Raman effect [11]. When light interacts with a molecule, most photons are elastically scattered (Rayleigh scattering). However, a tiny fraction (approximately 1 in a million) undergoes inelastic scattering, resulting in a shift in energy that corresponds to the vibrational frequencies of the molecular bonds in the sample [11]. This shift provides a unique molecular "fingerprint" that allows for the identification of specific materials [2].
Key Technical Considerations for Heritage Science
- Resonance Raman Effect: When the laser excitation wavelength matches an electronic transition of the analyte, the scattering intensity of associated vibrational modes can be enhanced by up to 10⁶ times compared to normal Raman scattering [12]. This is particularly useful for analyzing certain pigments.
- Stress and Strain Analysis: The application of stress to a material produces strain, which manifests in Raman spectra through changes in peak position and bandwidth. Compressive stress shifts peaks to higher frequencies, while tensile stress shifts them to lower frequencies [13]. This is crucial for assessing the structural state of materials.
- Laser Wavelength Selection: The choice of laser wavelength is critical. Near-infrared (NIR) lasers (e.g., 785 nm and 852 nm) are widely used in heritage science to minimize fluorescence interference from organic binders and varnishes, which can overwhelm the weaker Raman signal [10].
Detailed Application Notes and Protocols
Protocol 1: Pigment Identification on Manuscripts
Objective: To non-invasively identify the pigments used on illuminated manuscripts, such as 16th–17th century Persian manuscripts, to inform conservation, authentication, and art-historical studies [14].
Materials and Reagents: Table 2: Research Reagent Solutions for Manuscript Analysis
| Item | Function/Description | Example Pigments Identified |
|---|---|---|
| Raman Spectrometer | A Renishaw 1000 Ramascope or similar system with a HeNe laser (632.8 nm) for excitation [14]. | - |
| Microscope Objectives | 10x for locating areas of interest; 50x for focusing the laser beam to a small spot size (~1 μm) [14]. | - |
| Reference Databases | Spectral databases (e.g., IRUG, CHSOS, RRUFF) for pigment identification [10] [14]. | Lazurite, Vermilion, Orpiment |
Methodology:
- Manuscript Stabilization: Secure the manuscript on a stable platform to prevent movement during analysis. Do not apply any chemical or mechanical pretreatment.
- Instrument Calibration: Calibrate the spectrometer to better than 1 cm⁻¹ using a neon lamp or other standard before measurement [14].
- Spectral Acquisition:
- Use the optical microscope (10x objective) to locate the area of interest on the manuscript.
- Focus the laser beam onto the sample surface using a 50x objective lens.
- Use low laser power (e.g., <1 mW at the sample) to avoid potential damage to the artifact [14].
- Accumulate spectra with an integration time sufficient to achieve a good signal-to-noise ratio.
- Data Interpretation: Compare the acquired spectra to reference databases and published spectra of known pigments to make identifications [14].
Expected Outcomes: Analysis of Persian manuscripts typically reveals a palette including lazurite, red lead, vermilion, orpiment, carbon-based black, lead white, and malachite [14]. A key finding is the use of pigment mixtures rather than a wide range of distinct pigments to achieve different hues. For example, mixtures involving realgar and pararealgar were used to create various orange shades [14].
Protocol 2: In-Situ Analysis of Panel Paintings using a Handheld Spectrometer
Objective: To perform in-situ, non-invasive characterization of pigments and fillers in a complex paint layer, such as a mock-up panel painting prepared with egg-tempera, using a handheld Bravo spectrometer [10].
Materials and Reagents: Table 3: Research Reagent Solutions for Handheld Analysis
| Item | Function/Description | Example Pigments Identified |
|---|---|---|
| Bravo Handheld Spectrometer | Portable Raman spectrophotometer employing Sequentially Shifted Excitation (SSE) technology with 785 nm and 852 nm lasers to mitigate fluorescence [10]. | Azurite, Lapis lazuli, Indigo |
| Aluminum Foil/Support | To provide a clean, non-interfering background for analyzing pure pigment powders for reference [10]. | - |
| Mock-Up Panel Painting | Artwork with a known composition, featuring a wooden support, ground layer of rabbit glue and gypsum, and an egg-tempera paint layer [10]. | Smalt, Cobalt blue, Prussian blue |
Methodology:
- Sample Preparation: For reference powders, place the pigment on a sheet of aluminum foil. Position the Bravo instrument vertically over the powder using supports to avoid interference [10].
- Instrument Settings: The Bravo spectrometer uses two temperature-shifted diode lasers (785 nm and 852 nm). This protocol utilizes the 852 nm laser, covering a spectral range of 170–2200 cm⁻¹ [10].
- Spectral Acquisition:
- Begin with instrument-automated parameters for integration time and accumulations.
- To improve spectrum quality, manually increase the number of scans and integration time as needed (e.g., 0.5–50 s detector integration time with 5–30 accumulations) [10].
- For the panel painting, place the spectrometer head directly onto the painted surface.
- Data Processing: The instrument's internal algorithm (PCA-based) processes the raw data to provide background-free and smoothed spectra, which is particularly helpful for overcoming luminescence from organic materials [10].
Expected Outcomes: This protocol allows for the successful identification of pigments within a complex matrix. It is important to note that some materials may exhibit slightly different spectra, particularly in the relative intensity of Raman lines, when using the 852 nm laser excitation compared to the more standard 785 nm [10]. Building a specific spectral library for the excitation wavelength used is therefore crucial for accurate identification.
In-Situ Raman Analysis Workflow for Cultural Heritage Objects
The Modern Scientist's Toolkit
The contemporary application of Raman spectroscopy in cultural heritage relies on a suite of advanced techniques and tools that extend beyond the basic spectrometer.
Advanced Raman Techniques
- Portable and Mobile Instrumentation: The development of compact, handheld, and mobile Raman spectrometers has been a game-changer, allowing for in-situ analysis directly in museums, at archaeological sites, and in heritage buildings [8] [6]. This eliminates the need to transport often fragile and invaluable objects.
- Sequentially Shifted Excitation (SSE): This patented technology, used in instruments like the Bravo spectrometer, involves rapidly shifting the laser excitation wavelength over a small range. An internal algorithm then processes this data to effectively mitigate and subtract fluorescent background, yielding a clean Raman spectrum [10].
- Coupling with Complementary Techniques: The combination of Raman spectroscopy with other portable techniques, such as portable X-ray Fluorescence (pXRF), is increasingly common. This hybrid approach provides both molecular information (from Raman) and elemental data (from pXRF), offering a more comprehensive understanding of the material composition of an artifact [6].
- Multivariate Statistical Analysis: As compact devices sometimes yield lower-quality spectra, advanced data processing techniques are essential. The application of multivariate analysis to Raman spectra helps extract meaningful chemical information from complex and noisy data sets [6].
Current Challenges and Future Directions
Despite significant progress, the field continues to face challenges that guide its future trajectory [5] [9]:
- Data Complexity and Standardization: The heterogeneity of heritage materials and the complexity of spectral data hinder standardization.
- Operational Costs: The high cost of advanced instrumentation can limit access for smaller institutions.
- Raman Detection Sensitivity: Challenges remain in identifying spectra from degraded, contaminated, or low-signal samples.
Future progress is anticipated in three key areas:
- Accelerating Machine Learning: ML and AI will be crucial for automating complex data interpretation, pattern recognition, and predicting degradation pathways [5] [9].
- Improving Raman Detection: Enhancements in detector sensitivity and laser technology will enable more accurate analysis of delicate samples [5].
- Reducing Operational Costs: The development of more accessible and scalable instrumentation will democratize access to these powerful analytical tools [5] [9].
The journey of Raman spectroscopy in cultural heritage, from a niche laboratory technique to an established, indispensable tool, is a testament to three decades of interdisciplinary innovation. This evolution, marked by the development of portable instrumentation, advanced fluorescence-mitigation strategies, and sophisticated data processing, has fundamentally transformed our ability to interrogate and preserve humanity's material past. The technique's non-destructive nature provides an ethical foundation for scientific inquiry into priceless artworks and artifacts. As the field moves forward, the integration of machine learning and artificial intelligence promises to further revolutionize data interpretation, while ongoing instrumental refinements will enhance sensitivity and accessibility. Raman spectroscopy has firmly established itself as a bridge between science and the humanities, ensuring that the tangible evidence of human creativity is understood, preserved, and transmitted to future generations.
Raman spectroscopy has emerged as a cornerstone analytical technique in cultural heritage science, offering unparalleled capabilities for non-destructive material analysis. This vibrational spectroscopy technique probes molecular rotational and vibrational states, generating unique spectral fingerprints that enable precise identification and characterization of a wide range of materials found in cultural heritage objects [15]. The technique's fundamental principles, based on the inelastic scattering of light discovered by C.V. Raman and K.S. Krishnan in 1928, provide the foundation for its three key advantages in heritage analysis: non-destructiveness, molecular specificity, and high spatial resolution [16] [17]. These characteristics make it particularly valuable for investigating irreplaceable artifacts where minimal intervention is paramount.
The application of Raman spectroscopy in cultural heritage has evolved through distinct phases, from initial exploratory studies to the current advanced stage characterized by integrated multi-spectral techniques and machine learning integration [5]. This evolution reflects a profound shift from analyzing simple chemical and physical systems to comprehensive molecular material characterization, now encompassing diverse heritage forms including artifacts, murals, paintings, bronzes, stones, and crystals [5]. The technique's ability to operate with minimal or no sample preparation, combined with the availability of portable systems for in-situ analysis, has established Raman spectroscopy as an indispensable tool for conservation scientists, archaeologists, and art historians alike [16].
Fundamental Advantages and Their Technical Basis
Non-Destructiveness and Non-Invasiveness
The non-destructive nature of Raman spectroscopy represents its most significant advantage for cultural heritage analysis. This characteristic allows for repeated analysis of the same sample over time without causing damage or alteration to the investigated materials [16]. The technique is strictly noninvasive, enabling the determination of both organic and inorganic components without any chemical or mechanical pretreatment—an essential requirement for rare and valuable samples [8]. This capability is particularly crucial for long-term conservation strategies and monitoring programs where the integrity of artifacts must be preserved for future generations.
The non-destructiveness stems from the fundamental physical process involved: Raman spectroscopy relies on the inelastic scattering of monochromatic light, typically from a laser source in the visible or near-infrared range [16]. Unlike techniques requiring sample removal or preparation, Raman analysis can be performed directly on artifact surfaces without compromising their structural integrity or aesthetic value. This allows conservators to obtain essential chemical information without the ethical concerns associated with destructive sampling, making it possible to analyze even the most fragile and valuable objects in museum collections and at archaeological sites.
Molecular Specificity and Fingerprinting Capabilities
Raman spectroscopy provides exceptional molecular specificity through its ability to generate unique spectral fingerprints for different chemical compounds [16]. The observed Raman peaks are associated with the chemical structure of molecules and present specific characteristic patterns that enable precise material identification [17]. This molecular-level information allows heritage scientists to distinguish between different pigments, binders, degradation products, and original materials with high confidence, even when dealing with complex mixtures or similar-appearing compounds.
The technique's specificity extends to both organic and inorganic materials commonly encountered in cultural heritage contexts. Raman spectroscopy can identify various cultural heritage materials such as paints, fibers, dyes, woods, stones, inks, and textiles based on their distinct molecular vibrations [16]. This capability has proven invaluable for authenticating artifacts, identifying historical manufacturing technologies, and detecting previous restoration interventions. Furthermore, the technique's ability to analyze samples in aqueous environments without significant interference from water molecules enhances its applicability to a wide range of heritage materials, unlike infrared spectroscopy which experiences strong water absorption [16] [17].
High Spatial Resolution and Imaging Capabilities
Raman spectroscopy offers high spatial resolution, enabling the analysis of micrometer-sized areas on cultural heritage materials [16]. This capability is particularly valuable for investigating heterogeneous samples, stratified layers in painted surfaces, or small details in manuscripts and decorative arts. Modern Raman systems can achieve spatial resolution down to approximately 1 μm with confocal microscopy configurations, allowing for detailed examination of individual pigment grains, corrosion products, or material interfaces [18].
The integration of Raman spectroscopy with digital imaging technology has further enhanced its analytical power through Raman chemical imaging [17]. This hybrid approach provides spatially resolved chemical information, generating detailed images that visualize the distribution of chemical components across a sample surface [17]. For cultural heritage applications, this means conservators can map the distribution of specific pigments across a painting, identify degradation compounds forming at specific locations, or visualize subsurface layers in stratified artifacts, providing crucial information for understanding artistic techniques and deterioration mechanisms.
Table 1: Quantitative Capabilities of Raman Spectroscopy in Cultural Heritage Analysis
| Analytical Parameter | Capability/Range | Significance in Cultural Heritage |
|---|---|---|
| Spatial Resolution | ~1 μm with confocal microscopy [18] | Analysis of individual pigment grains, fine details, heterogeneous materials |
| Spectral Range | Typically 150-1510 cm⁻¹ [19] | Covers molecular vibrations for most heritage materials |
| Sampling Depth | Variable with technique; subsurface analysis with SORS | Stratified layer analysis, subsurface deterioration |
| Portability | Full portable systems available [16] | In-situ analysis at museums, archaeological sites, historical buildings |
| Water Interference | Minimal compared to IR spectroscopy [16] [17] | Analysis in humid environments, water-containing materials |
Experimental Protocols and Methodologies
Standard Analysis Protocol for Pigments and Paints
Objective: To identify pigment composition and distribution in painted surfaces, manuscripts, or polychrome sculptures using non-destructive Raman analysis.
Materials and Equipment:
- Raman spectrometer (portable or benchtop system with microscope)
- Laser sources (typically 532 nm, 785 nm, or 1064 nm wavelengths)
- Calibration standards (silicon wafer for frequency calibration)
- Positioning stage for precise sample manipulation
- Computer with spectral database and analysis software
Procedure:
- Instrument Calibration: Perform daily wavelength calibration using a silicon standard (peak at 520.7 cm⁻¹) to ensure spectral accuracy [16].
- Visual Examination: Conduct preliminary visual inspection of the artifact under magnification to identify analysis areas.
- Laser Wavelength Selection: Choose appropriate laser wavelength based on expected material properties:
- 785 nm for general pigment analysis with reduced fluorescence
- 1064 nm (FT-Raman) for highly fluorescent materials [16]
- 532 nm for enhanced signal strength with non-fluorescent materials
- Parameter Optimization: Adjust laser power (typically 0.1-10 mW at sample), acquisition time (1-30 seconds), and number of accumulations to optimize signal-to-noise ratio while preventing sample damage.
- Spectral Acquisition: Collect spectra from multiple points within the area of interest to account for material heterogeneity.
- Database Comparison: Compare acquired spectra with reference spectral libraries of historical pigments and materials.
- Chemometric Analysis: Apply multivariate statistical methods (PCA, LDA, HCA) for complex mixture analysis and pattern recognition [16] [17].
Quality Control: Include reference materials when possible, document all instrument parameters, and replicate measurements to ensure reproducibility.
Ceramic and Glaze Analysis Protocol
Objective: To determine mineralogical composition and firing technology of ancient ceramics and glazes.
Materials and Equipment:
- μ-Raman spectrometer with confocal capability
- Polarized light microscope for sample observation
- Cross-section preparation materials (if micro-sampling is permissible)
- Reference collections of mineral phases and ceramic technologies
Procedure:
- Sample Selection: Identify representative areas for analysis including ceramic body, slip, glaze, and colored decorations.
- Non-Destructive Surface Analysis: Perform Raman mapping on intact ceramic surfaces to identify mineral phases and their distribution [20].
- Cross-Section Analysis (if micro-samples are available):
- Prepare polished cross-sections to examine stratigraphic layers
- Perform point analysis across different layers to characterize technological features
- Map elemental and mineralogical distribution within the ceramic fabric
- Mineral Identification: Focus on key indicator minerals:
- Quartz (465 cm⁻¹), rutile (612 cm⁻¹), hematite (610 cm⁻¹)
- Silicate phases to estimate firing temperature ranges
- Amorphous phases to identify original firing conditions
- Data Interpretation: Correlate mineral assemblages with potential firing temperatures and atmospheric conditions [20].
Technical Considerations: Use longer wavelength lasers (785 nm or 1064 nm) to reduce fluorescence from amorphous phases in ceramic bodies. Implement extended acquisition times for weak scatterers.
Advanced Technical Approaches
Integration with Chemometric Analysis
The combination of Raman spectroscopy with chemometrics represents a powerful advancement in cultural heritage analysis. Chemometric methods are particularly valuable for analyzing complex mixtures or when spectral bands overlap, significantly simplifying data interpretation [16]. Key chemometric techniques include principal component analysis (PCA), partial least squares regression (PLS), linear discriminant analysis (LDA), and hierarchical cluster analysis (HCA) [16] [17]. These methods reduce the dimensionality of large datasets, allowing researchers to identify key differences and correlations between samples that might not be apparent through visual inspection of raw spectra alone.
Advanced chemometric methods such as multivariate curve resolution (MCR) enable the deconvolution of complex spectra, facilitating the separation of different components in mixtures [16]. This capability is particularly valuable for analyzing heritage materials where natural aging, previous restoration attempts, and complex manufacturing techniques create challenging analytical scenarios. The integration of chemometrics with Raman spectroscopy has proven especially beneficial for classifying artifacts based on their material composition, identifying geographical origins, detecting forgeries, and understanding degradation patterns in complex multi-component systems.
Portable and In-Situ Analysis Methodologies
The development of portable Raman systems has revolutionized cultural heritage analysis by enabling in-situ investigations at museums, archaeological sites, and historical buildings without the need for sample transport [16]. This protocol outlines the methodology for successful field analysis of cultural heritage materials.
Equipment Setup:
- Portable Raman spectrometer with built-in power supply
- Fiber optic probe for access to constrained areas
- Positioning arm or tripod for stability during measurement
- Integrated video microscope for precise area selection
- Environmental protection equipment for outdoor operations
Field Procedure:
- Site Assessment: Evaluate environmental conditions including lighting, temperature, and humidity that might affect measurements.
- Instrument Stabilization: Position and secure the spectrometer to prevent movement during measurements.
- Sample Access: Carefully position the probe head perpendicular to the analysis area, maintaining consistent working distance.
- Preliminary Testing: Perform quick scans to optimize parameters for specific materials and conditions.
- Systematic Documentation: Record measurement locations photographically and schematically for future reference.
- On-Site Validation: Compare initial results with expected material composition to validate data quality before leaving the site.
Challenges and Solutions:
- Ambient Light Interference: Use protective shrouding or conduct analysis during evening/nighttime hours
- Vibration: Implement short acquisition times with multiple accumulations
- Temperature Fluctuations: Allow instrument acclimatization and frequent recalibration
Table 2: Research Reagent Solutions and Essential Materials for Raman Analysis of Cultural Heritage
| Material/Reagent | Function/Purpose | Application Context |
|---|---|---|
| Silicon Wafer Standard | Frequency calibration (520.7 cm⁻¹ peak) | Daily instrument calibration [16] |
| Polystyrene Reference | Intensity and resolution verification | Quality control and instrument performance validation |
| Nd:YAG Laser (1064 nm) | Excitation source for FT-Raman | Fluorescence reduction for organic materials [16] |
| RRUFF Database | Reference spectral library | Mineral and pigment identification [19] |
| Micro-fiber Cloths | Surface cleaning before analysis | Removal of loose debris without affecting original materials |
| Positioning Stages | Precise sample manipulation | Mapping and heterogeneous area analysis |
Emerging Frontiers and Future Directions
Artificial Intelligence and Machine Learning Integration
The integration of artificial intelligence (AI) and machine learning (ML) with Raman spectroscopy represents a transformative development in cultural heritage analysis. AI algorithms can improve, automate, and accelerate data acquisition as well as processing and quality control tasks [15]. These approaches are particularly valuable for handling the complex, multi-component spectra often encountered in heritage materials, where traditional analysis can be time-consuming and require extensive expert knowledge.
Machine learning methods including convolutional neural networks (CNN), support vector machines (SVM), and probabilistic neural networks (PNN) have demonstrated remarkable success in classifying Raman spectral data [19]. For instance, the fire module convolutional neural network (FMCNN) has achieved classification accuracy of 0.988 for mineral identification based on Raman spectra [19]. These approaches reduce reliance on human participation in routine identifications while maintaining high accuracy, allowing heritage scientists to focus on more complex interpretive challenges. Furthermore, visualization techniques for deep learning models help make the results more interpretable and transparent, addressing the "black box" concern often associated with AI approaches [19].
Multi-Technique Hybridization and Data Fusion
The combination of Raman spectroscopy with other analytical techniques through hybrid approaches provides a more comprehensive understanding of cultural heritage materials. The synergistic combination of Raman, Laser-Induced Breakdown Spectroscopy (LIBS), and Infrared Spectroscopies has proven particularly powerful for addressing complex analytical challenges [5]. These multi-technique approaches leverage the complementary strengths of different methods, such as Raman's molecular specificity with LIBS' elemental sensitivity, to create more complete material characterizations.
Future developments are focusing on the digitalization of Raman spectroscopy through the incorporation of Open Science and FAIR data principles (Findable, Accessible, Interoperable, and Reusable) [15]. This approach facilitates collaborative research through standardized data formats, metadata schemas, and domain-specific ontologies to ensure machine-actionability and interoperability [15]. The creation of federated databases and open resources in Raman spectroscopy will accelerate methodological developments and improve the reproducibility of analyses across different laboratories and research teams, ultimately strengthening the scientific basis for cultural heritage conservation decisions.
The application of Raman spectroscopy in cultural heritage science has undergone a profound transformation. Initially employed as a specialized tool for the molecular identification of pigments, its role has expanded to encompass the comprehensive characterization of complex artifact materials, degradation mechanisms, and even mechanical properties. This evolution from a targeted analytical technique to a holistic diagnostic tool is revolutionizing preservation strategies and deepening our understanding of humanity's material past. The non-destructive, non-invasive nature of Raman spectroscopy, which allows for the analysis of unique and irreplaceable artifacts without sampling, remains the cornerstone of its utility in this field [21]. Furthermore, the ability to perform analyses in situ with portable instruments brings the laboratory to the artifact, whether it is in a museum, at an archaeological site, or part of an immovable monument [8] [22]. This application note details the advanced protocols and integrated methodologies that enable this expanded analytical scope, providing a framework for researchers to implement these approaches in their work.
The Evolving Landscape of Raman Spectroscopy in Heritage Science
Bibliometric analysis of the field from 1992 to 2024 reveals a clear trajectory of growth and diversification. Research has evolved from an initial phase of basic chemical analysis to a mature, advanced stage characterized by the integrated application of multi-spectral and multi-assistive techniques [5]. This shift reflects a deeper change in analytical philosophy: from analyzing simple chemical and physical systems to the sophisticated molecular characterization of diverse heritage materials, including artifacts, murals, paintings, bronzes, stones, and crystals [5].
The table below summarizes the key phases in this evolution, highlighting the expanding scope of research themes and analytical approaches.
Table 1: Evolution of Raman Spectroscopy in Cultural Heritage Research (1992-2024)
| Time Period | Phase Designation | Number of Research Themes | Key Developments and Characteristics |
|---|---|---|---|
| 1992-2002 | Initial Phase | 24 | Erratic growth; foundational techniques established; focus on basic material identification [5]. |
| 2003-2008 | Growth & Application | 123 | Steady growth; creation of shared spectral databases; expansion into safety and condition assessment [5]. |
| 2009-2015 | Multispectral Integration | 307 | Proliferation of research themes; common use in conservation science and archaeology; rise of combined/hybrid techniques [5]. |
| 2016-2024 | Advanced Holistic Stage | 445 | Rapid publication growth; integration of machine learning; sophisticated multi-technique synergies (e.g., Raman-LIBS) for holistic artifact profiling [5]. |
A pivotal finding from recent studies is the critical importance of multi-wavelength analysis. Research has demonstrated that some historical pigments exhibit slight but diagnostically crucial variations in their spectral lines when excited with different laser wavelengths, such as 852 nm compared to the more common 785 nm [23]. These differences in relative peak intensity provide enhanced insights into pigment composition, underscoring the need for flexible instrumentation and comprehensive, wavelength-specific spectral libraries to improve the reliability of pigment identification [23].
Advanced Experimental Protocols
Protocol for Holistic Pigment and Binder Characterization on a Painted Artifact
This protocol is designed for the in-situ analysis of a painted surface, such as a canvas painting or a mural, to identify both inorganic and organic components while minimizing interference from fluorescence.
Table 2: Key Research Reagent Solutions and Equipment
| Item Name | Function/Brief Explanation |
|---|---|
| Handheld Raman Spectrometer | Enables non-destructive, in-situ analysis on the artifact without the need for sampling. Ideal for large or immobile objects [24] [22]. |
| Dual-Wavelength Laser Source (e.g., 785 nm & 852 nm) | Using multiple excitation wavelengths helps overcome fluorescence interference and improves pigment differentiation by revealing wavelength-dependent spectral responses [23]. |
| Anisotropic Metal Nanoparticles (e.g., Ag Nanostars) | Used as substrates for Surface-Enhanced Raman Spectroscopy (SERS). Their high degree of anisotropy generates intense "hot spots" that dramatically enhance the signal of weak scatterers like organic dyes and binders [21]. |
| Spectral Library/Database | A comprehensive, curated database of reference spectra is essential for accurate material identification. Libraries specific to cultural heritage materials and, ideally, to the laser wavelength used, are critical [23] [22]. |
| Fiber-Optic Probe (for SERS) | Allows for the safe and controlled application of SERS substrates (nanoparticle colloids) to a micro-area of the artifact for analysis of organic compounds [21]. |
Workflow Steps:
- Project Description & Preliminary Examination: Clearly define the research objectives (e.g., identification of original vs. restoration materials, understanding degradation). Describe the artwork and perform a thorough visual inspection under normal and raking light.
- Selection of Measurement Sites: Using high-resolution reference images, annotate and select specific sites for analysis. Prioritize areas with different colors, visible degradation, or suspected restoration.
- Instrument Setup and Calibration:
- Employ a handheld Raman spectrometer equipped with dual-wavelength lasers (e.g., 785 nm and 852 nm).
- Calibrate the instrument for both wavelength and intensity using a standard reference material (e.g., silicon wafer).
- Define operational parameters: laser power must be set to a safe level to prevent photodegradation (typically <1 mW/µm² at the sample for sensitive materials); spectral range and resolution must be configured.
- Primary Analysis with 785 nm Laser: Conduct initial Raman measurements on the selected sites. The 785 nm laser is effective for many inorganic pigments and less prone to fluorescence than shorter wavelengths.
- Fluorescence Mitigation with 852 nm Laser: If the 785 nm spectrum is overwhelmed by fluorescence, switch to the 852 nm laser. The longer wavelength can often suppress fluorescence and may reveal subtle spectral features not visible at 785 nm [23].
- SERS Analysis for Organic Components: For areas suspected to contain organic dyes (e.g., red lakes, blues) or binders that yield no Raman signal with conventional Raman:
- Apply a small droplet of an anisotropic metal nanoparticle colloid (e.g., silver nanostars) using a micro-pipette under a microscope.
- Allow the droplet to dry, concentrating nanoparticles on the surface.
- Perform Raman analysis directly on the treated area. The plasmonic enhancement provided by the nanoparticles can yield a strong SERS signal, enabling the identification of organic components at trace concentrations [21].
- Data Pre-processing: For all acquired spectra, perform baseline correction to subtract fluorescence background and normalize spectra for comparative analysis.
- Spectral Interpretation and Material Identification: Compare the processed spectra against wavelength-specific reference spectral libraries. Use chemometric tools like Principal Component Analysis (PCA) to handle complex spectral datasets and classify materials [16].
- Data Storage and Reporting: Archive all raw and processed spectra with associated metadata (laser wavelength, power, integration time, location on artifact). Prepare a comprehensive report linking material identification to the artifact's condition and history.
Diagram 1: Holistic pigment and binder analysis workflow.
Protocol for Integrated Chemical and Mechanical Analysis via BRaMS
Brillouin and Raman Micro-Spectroscopy (BRaMS) is a novel, label-free technique that simultaneously assesses chemical composition and viscoelastic mechanical properties, which are critical for understanding structural integrity and deterioration phenomena like cracking and embrittlement [25].
Workflow Steps:
- Sample Selection: This protocol is suitable for homogeneous materials or small, representative samples where micro-destructive sampling is permissible. It is ideal for studying varnishes, binders like linseed oil, or modern polymeric materials in heritage collections.
- BRaMS Instrument Configuration: Integrate a Brillouin scattering spectrometer with a confocal Raman microscope into a single experimental setup. This allows for co-localized measurements from the same microscopic spot.
- Co-localized Mapping: Position the sample and define a grid or line scan for mapping.
- The Raman laser (e.g., 785 nm) excites the sample to collect a vibrational spectrum, identifying molecular components.
- The Brillouin probe (often a single-frequency laser like 532 nm) simultaneously measures the inelastic scattering from thermally excited acoustic phonons (sound waves), which provides information on the viscoelastic moduli (e.g., longitudinal modulus) of the material.
- Data Correlation: Process the data to generate correlated maps: one map showing the chemical distribution based on Raman band intensities, and a second map showing the spatial variation of mechanical properties based on Brillouin frequency shifts.
- Interpretation: Correlate areas of chemical alteration (e.g., oxidation identified by Raman) with changes in mechanical properties (e.g., embrittlement indicated by Brillouin). This provides a direct link between molecular change and macroscopic degradation.
Diagram 2: Integrated chemical and mechanical analysis workflow.
The future of Raman spectroscopy in cultural heritage is inextricably linked to computational science and interdisciplinary collaboration. Machine learning (ML) and artificial intelligence (AI) are poised to revolutionize data processing by enhancing pattern recognition, automating the interpretation of complex spectra from mixtures, and predicting degradation pathways [5] [9]. This will be crucial for managing the growing volume of data from hyperspectral and multi-technique analyses. Furthermore, the development of more sensitive, cost-effective, and portable instrumentation will democratize access to these advanced analytical capabilities, allowing smaller museums and local conservation teams to benefit from cutting-edge technology [5] [9].
In conclusion, Raman spectroscopy has successfully expanded its scope from a tool for simple pigment identification to a core platform for the holistic characterization of cultural heritage artifacts. By integrating advanced techniques like multi-wavelength analysis, SERS with anisotropic nanoparticles, and coupled methods like BRaMS, researchers can now construct a multidimensional profile of an object—revealing not only "what it is" but also "what has happened to it" and "what its future might be." This comprehensive understanding is fundamental to developing effective, long-term, and sustainable preservation strategies for our shared cultural legacy.
Methodologies and Practical Applications: From the Lab to the Field
The analysis of paints and pigments forms a cornerstone of cultural heritage science, enabling the identification of artistic materials, confirmation of provenance, and detection of anachronisms that may indicate forgery. Raman spectroscopy has emerged as a preeminent technique in this field due to its molecular specificity, minimal sample requirements, and adaptability to non-destructive in-situ analysis [6]. This application note details the protocols and methodologies for using Raman spectroscopy, often in combination with complementary techniques, to definitively identify pigment composition and trace the origin of cultural heritage artifacts, directly supporting advanced research within the framework of cultural heritage analysis.
The fundamental principle exploited is the Raman effect, an inelastic scattering process where photons interact with molecular vibrations, producing energy shifts that serve as a unique molecular fingerprint [26]. This allows for the direct identification of pigments based on their chemical structure and crystalline form, even differentiating between pigments with similar elemental compositions [27].
Essential Techniques and Instrumentation
Core Analytical Techniques
A multi-technique approach is often necessary for comprehensive analysis. The table below summarizes the key techniques used in conjunction with Raman spectroscopy for pigment analysis.
Table 1: Core Analytical Techniques for Pigment Analysis
| Technique | Acronym | Primary Information | Key Advantages | Key Limitations |
|---|---|---|---|---|
| Raman Spectroscopy [6] [26] | RS | Molecular fingerprint; chemical structure | Identifies specific molecular phases and crystal structures; minimal sample prep. | Fluorescence interference can mask signals. |
| X-Ray Fluorescence [28] [27] | XRF / HHXRF | Elemental composition | Rapid, non-destructive elemental analysis. | Cannot distinguish different chemical compounds of the same elements. |
| Fourier Transform Infrared Spectroscopy [28] [29] | FT-IR | Molecular functional groups | Excellent for identifying organic binders and some degradation products. | Can be affected by water and carbon dioxide. |
| Visible Reflectance Spectroscopy [29] | VRS | Colorimetric properties | Provides quantitative data on color changes and degradation. | Primarily provides surface information. |
Advanced Raman Modalities
To overcome limitations like fluorescence and weak signal intensity, several advanced Raman modalities are employed:
- Surface-Enhanced Raman Spectroscopy (SERS): Utilizes nanostructured metal substrates to dramatically enhance the Raman signal, enabling the detection of trace amounts of materials, such as organic dyes, which are challenging for conventional Raman spectroscopy [26] [30].
- Spatially Offset Raman Spectroscopy (SORS): Allows for the collection of spectra from subsurface layers, making it possible to analyze pigments beneath varnishes or overpaints without physical sampling [26].
- Micro-Raman Spectroscopy: Couples a Raman spectrometer to a microscope, enabling the analysis of individual pigment grains or specific microscopic features within a heterogeneous sample [30].
Experimental Protocols
In-Situ Pigment Analysis Using Portable Instrumentation
This protocol is designed for the non-destructive analysis of paintings or other cultural heritage objects in situ, such as in a museum setting.
Table 2: Key Research Reagent Solutions and Materials
| Item Name | Function/Application | Critical Notes |
|---|---|---|
| Portable Raman Spectrometer (785 nm laser) | In-situ molecular identification of pigments. | A 785 nm laser minimizes fluorescence from organic binders [31]. |
| Portable XRF (pXRF) Analyzer | Complementary elemental analysis of inorganic pigments. | Used to identify key elements, guiding subsequent Raman analysis [27]. |
| Calibration Standards | Verification of instrument wavenumber accuracy. | Typically a silicon wafer or a standard with known peaks like polystyrene. |
| ColorChecker Chart | Standardization of visible light imaging and color reference. | Used during photographic documentation [27]. |
| Stable Tripod and Positioning Stage | Ensures consistent and safe positioning of the instrument probe. | Prevents accidental contact with the artifact surface. |
Workflow Overview:
Step-by-Step Procedure:
Preliminary Documentation and Visual Examination
- Perform high-resolution visible light photography of the entire object and specific areas of interest. Include a ColorChecker chart for accurate color calibration [27].
- Conduct multispectral imaging:
- Ultraviolet-induced visible fluorescence (UV): To observe modern restorations (which often appear darker) and the distribution of organic materials like binders or varnishes [27].
- Infrared reflectography (IRR): To potentially reveal underlying sketches (sinopie) or compositional changes (pentimenti) [27].
Elemental Screening with pXRF
- Select multiple measurement points representing different color regions.
- Position the pXRF probe securely and perpendicular to the surface. A typical measurement takes 10-30 seconds per point [27].
- Collect spectra and identify key elements present (e.g., Hg in vermilion/cinnabar, Pb in lead-based pigments like red lead or white lead, Cu in azurite or malachite) [28] [27].
Molecular Identification with Portable Raman Spectroscopy
- Based on XRF results, select points for Raman analysis. The elemental data helps narrow down potential pigments.
- Instrument Settings: Use a 785 nm laser to minimize fluorescence. Power should be optimized to the lowest possible level that still produces a quality signal to avoid any risk of photodamage; start below 20 mW [31]. Acquisition times typically range from 1 to 30 seconds, with 10-20 accumulations to improve the signal-to-noise ratio.
- Collect Raman spectra. The output will be a plot of Raman shift (cm⁻¹) versus intensity.
- Compare the obtained spectra against reference spectral libraries (e.g., the RRUFF database for minerals) for definitive pigment identification [31].
Data Integration and Interpretation
- Correlate data from all techniques. For example, the detection of the element Hg with XRF and a strong Raman peak at 252 cm⁻¹ confirms the presence of vermilion (HgS) [31].
- The combination of techniques helps identify mixtures and layered structures.
Laboratory-Based Analysis for Degradation Studies
This protocol is for a more detailed investigation, which may involve micro-sampling to study pigment-binder interactions and degradation mechanisms.
Workflow Overview:
Step-by-Step Procedure:
Sample Preparation and Artificial Aging
- Create mock-up samples using historical pigments mixed with appropriate binders (e.g., linseed oil, egg tempera).
- Subject these samples to controlled light aging using a solar simulator or other calibrated light sources to simulate long-term degradation [29].
Colorimetric Analysis
- Use Visible Reflectance Spectroscopy to quantitatively measure color changes (∆E) over the aging period. This provides a measurable criterion for degradation [29].
Molecular Analysis of Degradation Products
- Use FT-IR Spectroscopy to monitor the oxidative degradation of the organic binder, observing changes in carbonyl (C=O) and other functional groups [29].
- Use Micro-Raman Spectroscopy to analyze specific pigment particles and look for spectral shifts or the appearance of new peaks that indicate chemical alteration of the pigment itself.
Data Modeling
- Process the spectral data (both Reflectance and FT-IR) using Principal Component Analysis (PCA) to identify the most significant spectral changes correlated with degradation [29].
- Develop spectral response models to forecast pigment behavior under different environmental conditions, informing preventive conservation strategies [29].
Data Interpretation and Critical Analysis
Reference Spectral Data
Successful pigment identification relies on comparison with reliable reference data. The table below lists characteristic Raman shifts for common historical pigments.
Table 3: Characteristic Raman Shifts of Common Historical Pigments
| Pigment Name | Chemical Composition | Characteristic Raman Shifts (cm⁻¹) | Notes |
|---|---|---|---|
| Vermilion | HgS | 252, 282, 343 [31] | |
| Cinnabar | HgS | 252, 282, 343 [31] | Natural mineral form of Vermilion. |
| Azurite | 2CuCO₃·Cu(OH)₂ | 400, 432, 540, 770, 1090, 1430 [29] | A blue copper carbonate. |
| Lapis Lazuli (Ultramarine) | Na₈–₁₀Al₆Si₆O₂₄S₂–₄ | 548, 580, 802, 1096, ~1640 [28] | The ~1640 cm⁻¹ band is particularly diagnostic [6]. |
| Red Lead (Minium) | Pb₃O₄ | 122, 152, 223, 312, 390, 548 [28] | |
| Carbon Black | C | ~1320 (D band), ~1580 (G band) [28] | Broad bands characteristic of amorphous carbon. |
Integrating Data for Provenance and Authentication
The combination of elemental and molecular information is powerful for tracing provenance. For instance, the identification of Egyptian blue (a synthetic pigment with a specific Raman signature and a composition of CaCuSi₄O₁₀) on an object supposedly from a region where this pigment was not used would raise questions about its provenance [28] [6]. Furthermore, the detection of modern pigments like cadmium red (e.g., CdS) on a painting purportedly from the 17th century is a clear indicator of forgery, as cadmium pigments were not available until the 19th century [31].
Case Study: Gainsborough Paintings
A study on three paintings by Thomas Gainsborough exemplifies this integrated approach [27].
- HHXRF Analysis: Identified the presence of elements such as Pb (lead), Hg (mercury), and Cu (copper) across the paintings, indicating the use of lead-white, vermilion, and copper-based green or blue pigments.
- Raman Spectroscopy: Provided molecular confirmation, specifically identifying vermilion (HgS) by its characteristic Raman fingerprint. This combination allowed researchers to characterize the palette and identify potential later restorations.
- Imaging Techniques: X-ray radiography revealed the artist's compositional changes and the canvas structure, while raking light photography showed the surface topography and brushwork.
The protocols outlined herein demonstrate that Raman spectroscopy, particularly when integrated with complementary techniques like XRF and FT-IR, provides an unparalleled toolkit for the definitive analysis of paints and pigments. The ability to perform non-destructive, in-situ molecular identification makes it indispensable for authenticating artifacts, tracing their provenance, and understanding their material history. Furthermore, the application of advanced data analysis techniques, including machine learning, is poised to further enhance the sensitivity and predictive power of spectroscopic analysis in cultural heritage science [5] [32]. This rigorous analytical approach ensures the preservation of our cultural legacy by providing a scientific basis for conservation, documentation, and art historical research.
Within cultural heritage science, Raman spectroscopy has carved out a critical niche as a non-destructive and highly sensitive analytical technique for diagnosing and conserving invaluable artifacts [33]. Its exceptional ability to elucidate the structural properties of materials is further enhanced when coupled with mathematical and statistical models, enabling researchers to trace the technological and degradation histories of ancient objects [33]. This application note details protocols and illustrative case studies for the examination of ceramics, glass, and stone, framing them within the broader context of a thesis on the application of Raman spectroscopy in cultural heritage research. The focus is on providing researchers and scientists with structured methodologies to extract quantitative data on material composition, manufacturing technology, and assessment of degradation.
Experimental Protocols
Core Raman Spectroscopy Workflow
A standardized workflow is essential for generating reliable, reproducible data, particularly when analyses are performed by different research groups or with different instrumentation [7]. The following protocol, summarized in Figure 1, outlines the key steps from experimental design to data interpretation.
Figure 1. Raman Spectral Analysis Workflow. This diagram outlines the logical sequence for analyzing Raman spectral data, from experimental design to final interpretation [34].
Protocol 1: Standardized Raman Spectral Acquisition and Processing
1.1 Experimental Design & Sample Size Planning
- Objective: Estimate the minimal number of samples required to reach a statistically meaningful conclusion or build a model with acceptable performance.
- Procedure: Base the sample size on a learning curve that characterizes a predefined metric (e.g., model accuracy) over an increasing sample size. The minimal sample size is identified where the metric no longer improves significantly [34].
1.2 Spectral Preprocessing
- Objective: Remove corrupting effects originating from the instrument, environment, and sample to isolate the Raman signal.
- Cosmic Spike Removal: Detect sharp, intense spikes by comparing successive spectra. Replace affected data points via interpolation or with intensities from adjacent scans [34] [7].
- Baseline Correction: Remove the broad fluorescence background using mathematical approaches such as asymmetric least squares smoothing, polynomial fitting, or the novel BubbleFill algorithm [34] [7].
- Smoothing: Apply a moving-window low-pass filter (e.g., Gaussian) only to highly noisy data, as it can degrade spectral resolution [34].
- Normalization: Suppress fluctuations in excitation intensity or focusing by dividing spectral intensities by the area, maximum, or l2 norm of a selected spectral region [34].
1.3 Data Modeling & Interpretation
- Dimension Reduction: Use unsupervised (e.g., Principal Component Analysis - PCA) or supervised (e.g., Partial Least Squares - PLS) methods to extract useful features and reduce redundant information [33] [34].
- Model Construction & Evaluation: Construct classification or regression models using a training dataset. Evaluate performance with an independent testing dataset using metrics like root-mean-squared error (RMSE) or accuracy in a cross-validation framework [34].
- Model Interpretation: Identify spectroscopic variables that are important to the model and link them to chemical or biological explanations [34].
Specific Protocol for Analyzing Ancient Ceramics
This protocol leverages Raman spectroscopy to determine the firing conditions and composition of ancient pottery.
Protocol 2: Determination of Firing Temperature and Technology in Ancient Potteries
2.1 Sample Preparation
- Objective: Obtain a representative and clean surface for analysis.
- Procedure: If possible, analyze a fresh fracture surface to avoid contamination from burial deposits or previous handling. Gently clean the surface with compressed air or a soft brush. For non-portable samples, use a portable Raman instrument for in-situ analysis [33].
2.2 Spectral Acquisition
- Instrumentation: Use a portable or micro-Raman spectrometer with a Near-IR (NIR) excitation laser (e.g., 1064 nm) to minimize fluorescence from organic residues or the clay body itself [33].
- Parameters: Acquire spectra from multiple points on the sample to account for heterogeneity. Typical acquisition settings might include a 4-8 cm⁻¹ spectral resolution and multiple accumulations to improve the signal-to-noise ratio [33].
2.3 Data Analysis for Firing Temperature Estimation
- Objective: Estimate the maximum firing temperature and furnace permanence time.
- Procedure:
- Identify the spectrum of amorphous carbon (a common temper in clay) and focus on its characteristic D (Disordered) and G (Graphitic) bands.
- Perform a spectral deconvolution of the carbon band region using Lorentzian or Gaussian band shapes.
- Calculate the ratio between the areas of the D and G bands (AD/AG).
- Apply the model established by Ferrari et al. Using the AD/AG ratio and the band positions, estimate the firing temperature. Furthermore, by tracking the transition of carbon from sp³ to sp² hybridization, the permanence time in the oven can be calculated based on the percentage of transformed atoms and an assumed transition time [33].
Data Presentation and Analysis
Key Spectral Signatures and Their Interpretation
Table 1: Key Raman Spectral Bands for Cultural Heritage Materials.
| Material Class | Raman Shift (cm⁻¹) | Vibrational Mode Assignment | Interpretation in Cultural Heritage |
|---|---|---|---|
| Ceramics / Carbon | ~1350 (D band) | A₁ᵍ mode of disordered graphite | Presence of amorphous carbon; used for firing temperature estimation [33] |
| ~1580 (G band) | E₂ᵍ mode of ordered graphite | Indicates graphitic ordering; AD/AG ratio correlates with thermal history [33] | |
| Pigments / Inorganics | ~2240 | C≡N stretch | Presence of nitrile groups [35] |
| 1700-1730 | C=O stretch | Presence of carbonyl groups, e.g., in binders [35] | |
| General Organic | 2800-3100 | C-H stretching | Detects organic materials; position and shape inform on bonding [35] |
| 3200-3600 | O-H stretching | Indicates hydration or presence of hydroxides; broad band suggests hydrogen bonding [33] [35] |
Case Study: Quantitative Analysis of Early Bronze Age Pottery
Table 2: Quantitative Data Derived from Raman Analysis of Early Bronze IV Pottery from Khirbat Iskandar [33].
| Analyzed Parameter | Observed Spectral Feature | Mathematical Model Applied | Inferred Technological/Degradation Insight |
|---|---|---|---|
| Firing Temperature | D and G bands of amorphous carbon | Ferrari model for AD/AG ratio and band position | Firing temperature estimated at ~700 °C |
| Furnace Permanence Time | sp²/sp³ carbon hybridization ratio | Kinetic model of atomic transition | Permanence time of ~8 hours per mm³ of amorphous carbon |
| Material Provenance | Presence of Olivine and Anatase | Multivariate analysis (PCA) for mineralogical fingerprint | Geographical tracing of raw materials |
The Scientist's Toolkit
Table 3: Essential Research Reagent Solutions and Materials for Heritage Raman Analysis.
| Item | Function / Application | Brief Explanation |
|---|---|---|
| Portable Raman Spectrometer (1064 nm) | In-situ analysis of precious, non-movable artifacts. | Near-IR laser minimizes fluorescence from aged organic compounds, a common issue in heritage samples [33]. |
| Standard Reference Materials (e.g., NIST SRM 2241) | Wavenumber and intensity calibration of the spectrometer. | Ensures spectral data are comparable across different instruments and measurement sessions [34] [7]. |
| Computational Chemistry Software (e.g., GAUSSIAN) | Density Functional Theory (DFT) simulations. | Models molecular structures and reactions to help identify unknown compounds or degradation pathways from spectral data [33]. |
| Open-Source Data Processing Package (e.g., ORPL) | Standardized preprocessing of raw spectral data. | Provides modular, open-sourced algorithms (e.g., BubbleFill for baseline removal) to ensure reproducibility and data compatibility between labs [7]. |
Advanced Data Modeling and Visualization
The integration of Raman spectroscopy with advanced data modeling is a cornerstone of modern heritage science. For instance, the combination of Raman observables with kinetic or Arrhenius models allows researchers to simulate and understand aging processes and firing technologies [33]. The relationship between key spectroscopic observables and the analytical models they inform is illustrated in Figure 2.
Figure 2. From Spectral Data to Heritage Insight. This diagram illustrates the logical relationship between measured spectroscopic observables, the analytical models they feed into, and the resulting insights into artifact technology and degradation [33] [34].
This application note demonstrates that Raman spectroscopy, particularly when paired with robust experimental protocols and mathematical modeling, is a powerful tool for unraveling the history embedded in cultural heritage materials. The detailed workflows for data processing and the specific protocol for ceramic analysis provide a framework for generating quantitative, reproducible data on the technology and degradation of ceramics, glass, and stone. As the field evolves, the integration of open-source data processing and machine learning promises to further enhance the sensitivity, reliability, and accessibility of Raman spectroscopy, solidifying its role as an indispensable technique in cultural heritage science [33] [5] [7].
Within the field of cultural heritage science, the authentication and preservation of metal artifacts necessitate a profound understanding of their surface chemistry, particularly the nature of corrosion products and patinas. Raman spectroscopy has emerged as a preeminent analytical technique for this purpose, enabling the non-destructive, in-situ molecular identification of corrosion phases on artworks and archaeological objects [8]. This application note details standardized protocols for utilizing Raman spectroscopy, including portable instruments, to characterize patinas on copper-alloy artifacts, providing a scientific basis for authentication and conservation assessments. The methodologies outlined are framed within a broader research context on the application of Raman spectroscopy in cultural heritage analysis.
Theoretical Background: Raman Spectroscopy of Corrosion Products
Raman spectroscopy operates on the principle of inelastic light scattering, where monochromatic laser light interacts with molecular vibrations in a sample, resulting in a shift in the energy of the scattered photons [1]. This shift, known as the Raman shift, provides a unique fingerprint of the molecular species present [1]. The technique is exceptionally well-suited for analyzing cultural heritage materials because it is typically non-destructive and can be performed in situ with portable equipment, eliminating the need for sampling [8] [36].
The identification of specific corrosion products on metals, particularly copper and its alloys (e.g., bronze and brass), is critical for diagnosing an object's conservation state. Table 1 summarizes the most common copper-based corrosion products, their chemical compositions, and their significance, which can be identified by their characteristic Raman bands [37] [36].
Table 1: Common Copper Corrosion Products and Their Raman Spectral Characteristics
| Mineral Name | Chemical Composition | Crystal System | Primary Raman Bands (cm⁻¹) | Significance in Cultural Heritage |
|---|---|---|---|---|
| Cuprite | Cu₂O | Cubic | 218, 410, 525, 635 [36] | Primary oxide layer; often part of a "noble patina" [37]. |
| Tenorite | CuO | Monoclinic | 283, 329, 615 [36] | |
| Malachite | Cu₂(CO₃)(OH)₂ | Monoclinic | 268, 355, 435, 540, 605, 750, 1088 [36] | Common basic copper carbonate; forms green patinas in burial environments [37]. |
| Azurite | Cu₃(CO₃)₂(OH)₂ | Monoclinic | 400, 545, 765, 838, 1098, 1430 [36] | |
| Atacamite | Cu₂Cl(OH)₃ | Orthorhombic | 511, 540, 570, 815, 890, 973 [36] | Copper hydroxychloride; indicator of "bronze disease," a destructive corrosion process [37] [36]. |
| Clinoatacamite | Cu₂Cl(OH)₃ | Monoclinic | 480, 510, 550, 570, 815, 890, 973 [36] | Polymorph of atacamite; also associated with bronze disease [36]. |
| Brochantite | Cu₄(SO₄)(OH)₆ | Monoclinic | 476, 510, 545, 600, 610, 975, 1105 [36] | Copper hydroxysulfate; common in atmospheric corrosion [36]. |
Distinguishing between natural patinas formed over centuries and artificially produced patinas is a cornerstone of authentication. Natural archaeological patinas are typically complex, multi-layered structures that can include soil encrustations and often show evidence of specific deterioration processes like bronze disease (evidenced by atacamite/clinoatacamite) [37]. In contrast, artificially created patinas, used to simulate age on forgeries, are often chemically simpler, may contain phases unlikely to form in natural long-term corrosion, and lack the stratigraphic complexity of authentic patinas [37].
Experimental Protocols
On-Site Analysis Using a Portable Raman Spectrometer
This protocol is designed for the in-situ assessment of copper-alloy artworks, enabling the identification of corrosion products and evaluation of their conservation state without moving the object to a laboratory [36].
Workflow Overview:
Materials and Equipment:
- Portable Raman spectrometer (e.g., I-Raman Pro, B&W Tek) equipped with a 532 nm diode laser [36].
- Standard reference spectra for common corrosion products (e.g., from the RRUFF database or in-house measured standards) [36].
- Portable colorimeter (optional, for documenting surface color) [36].
Step-by-Step Procedure:
- Instrument Calibration: Calibrate the portable Raman spectrometer according to the manufacturer's instructions using a silicon wafer or other standard reference material.
- Visual Examination: Conduct a thorough visual inspection of the artifact under consistent lighting. Document the color, texture, and distribution of different patina areas. A colorimeter can be used for objective color measurement [36].
- Spectrum Acquisition:
- Position the spectrometer's probe head securely against the measurement point on the artifact's surface.
- Set the laser power to 35 mW (or a level verified to be safe for the material) and the acquisition time to 10 seconds per scan [36].
- Accumulate and average 3 to 5 scans to improve the signal-to-noise ratio [36].
- To ensure reproducibility, collect spectra from 2-3 different spots within the same corrosion feature [36].
- Data Processing: Perform basic spectral processing (e.g., cosmic ray removal, baseline correction) using the instrument's software.
- Spectral Identification: Compare the acquired spectra against the standard reference spectra. Key corrosion products to identify include:
- Stable/Protective Patinas: Cuprite, malachite, brochantite.
- Indicators of Active Degradation (Bronze Disease): Atacamite, clinoatacamite [36].
- Conservation Assessment: Correlate the identified corrosion products with the visual inspection to diagnose the artifact's conservation status and recommend any necessary treatments.
Laboratory-Based Authentication Study
This protocol employs benchtop micro-Raman spectroscopy for a more detailed analysis, often used for authentication purposes where high resolution and sensitivity are required [37].
Workflow Overview:
Materials and Equipment:
- Benchtop micro-Raman spectrometer (e.g., Horiba LabRam HR Evolution) with a 532 nm laser [36].
- Optical microscope with digital camera.
- Scanning Electron Microscope with Energy-Dispersive X-ray Spectroscopy (SEM-EDS) for complementary elemental analysis [37].
Step-by-Step Procedure:
- Macro and Micro Documentation: Examine the artifact under an optical microscope to document the patina's morphology, heterogeneity, and stratigraphy at different magnifications (e.g., from 50x to 500x) [37].
- High-Resolution Raman Analysis:
- Use a benchtop micro-Raman system with a 100x objective to focus on specific micro-features.
- Set the laser power to a low level (e.g., 14 mW) and use neutral density filters to prevent potential damage to the original material [36].
- Acquire spectra with high spectral resolution (e.g., ~2 cm⁻¹) across a range of 100–2000 cm⁻¹ [36].
- Correlative Analysis: Perform SEM-EDS analysis on the same or representative areas to obtain elemental composition data, which complements the molecular information from Raman spectroscopy [37].
- Data Interpretation for Authentication:
- Evaluate the assemblage of identified minerals. A complex mixture of cuprite, malachite/azurite, and possibly copper chlorides (like atacamite) with soil encrustations suggests a natural archaeological patina [37].
- Be alert for the presence of corrosion products that are unlikely to form through long-term natural processes or that are indicative of modern chemical recipes for artificial patination [37].
- Inconsistencies between the object's purported age and the patina's composition are key indicators of forgery [37].
Data Presentation and Analysis
The following tables consolidate quantitative data and essential research reagents for the characterization of copper alloy patinas.
Table 2: Portable vs. Benchtop Raman Spectrometer Operational Parameters for Corrosion Analysis [36]
| Parameter | Portable Raman Spectrometer | Benchtop Micro-Raman Spectrometer |
|---|---|---|
| Example Instrument | I-Raman Pro (B&W Tek) | LabRam HR Evolution (Horiba) |
| Laser Wavelength | 532 nm | 532 nm |
| Laser Power at Sample | 35 mW | 14 mW (with filters) |
| Spectral Range | 100 – 3457 cm⁻¹ | 100 – 4000 cm⁻¹ |
| Spectral Resolution | 8 cm⁻¹ | ~2 cm⁻¹ |
| Typical Acquisition | 10 s, 3-5 accumulations | Variable, single or few scans |
| Primary Application | Field-based, on-site screening and conservation diagnosis | Laboratory-based, high-resolution analysis for authentication |
Table 3: Research Reagent Solutions for Patina Analysis
| Item / Reagent | Function / Significance | Example Application / Note |
|---|---|---|
| Standard Mineral Powders (Cuprite, Malachite, Atacamite, etc.) | Provide reference Raman spectra for definitive identification of unknown corrosion products on artifacts [36]. | Commercially available from suppliers like Sigma-Aldrich and Kremer Pigment Inc. [36]. |
| Portable Raman Spectrometer | Enables non-destructive, in-situ molecular analysis of artworks that cannot be moved to a lab [36]. | Effective for identifying most common corrosion products, though may have lower SNR than benchtop systems [36]. |
| Benchtop Micro-Raman Spectrometer | Provides high-resolution, high-sensitivity analysis for detailed authentication studies and complex patina characterization [37]. | Can be coupled with optical microscopy for targeting specific micro-features [37]. |
| RRUFF Database | A publicly available database of reference Raman spectra for minerals, essential for corrosion product identification [36]. | Serves as a key spectral library for comparison against acquired data from artifacts [36]. |
The protocols detailed herein provide a robust framework for applying Raman spectroscopy to the critical tasks of characterizing corrosion products and authenticating metal artifacts in cultural heritage. The integration of portable systems for on-site conservation diagnostics with high-resolution laboratory analysis for in-depth study represents the current state of the art. As the field evolves, the combination of multi-spectroscopic data with advanced data processing techniques like machine learning will further enhance the power of Raman spectroscopy to unlock the material secrets of our shared cultural patrimony [5] [9].
Within cultural heritage science, Raman spectroscopy has emerged as a pivotal non-destructive analytical technique for characterizing organic materials found in historical objects. Its application provides critical insights into the material composition, degradation processes, and provenance of artifacts, thereby informing appropriate conservation strategies [38] [39] [9]. This document outlines standardized application notes and experimental protocols for the analysis of key organic material classes—inks, dyes, binding media, and human remains—framed within a broader research thesis on the application of Raman spectroscopy in cultural heritage analysis. The non-destructive nature of Raman spectroscopy is particularly valuable for analyzing fragile and irreplaceable cultural artifacts, allowing for in-situ examination with portable instruments in museums or at archaeological sites [9].
Analysis of Historical Inks and Dyes
Application Notes
The analysis of colorants is a primary application of Raman spectroscopy in heritage science, driving significant technological innovation in the field [9]. Its capability to identify molecular vibrations specific to different dyes and pigments allows for precise material identification, which is essential for authentication, understanding historical manufacturing techniques, and tracing the geographical origins of materials [40] [9]. A major challenge in this analysis is the inherent fluorescence from aged substrates or binding media, which can swamp the Raman signal. This can be mitigated through the use of longer wavelength lasers (e.g., 785 nm) and advanced data processing techniques [41] [39].
The detectability of dyes on textiles is influenced by multiple factors, as demonstrated by forensic studies which have direct relevance to the analysis of historical textiles. Key findings include:
- Raman spectroscopy can detect certain dyes at very low concentrations (e.g., 0.5% and 0.05% weight/weight) even when mounted under a coverslip with mounting media [41].
- The ability to detect a given dye is influenced by the excitation source, dye category, dye concentration, fiber type, and mounting method [41].
- Library searching programs can aid identification, but the quality of the result depends on whether spectra of the target compounds are in the database and the quality of the reference spectra. Analyst judgment remains crucial, especially when Hit Quality Index (HQI) values are not definitive [40].
Experimental Protocol: Dye Identification on Textile Fibers
Objective: To identify unknown dyes on historical textile fibers using Raman microscopy. Sample Preparation: If sampling is permissible, a single fiber (approximately 2-5 mm in length) should be placed on a microscope slide. For analysis, it may be left unmounted or secured with a non-fluorescent mounting medium (e.g., Permount or Entellan new) and a coverslip [41].
Instrumental Parameters:
- Instrument: Raman Microscope
- Excitation Wavelengths: Test both 532 nm and 780 nm lasers to minimize fluorescence [41].
- Laser Power: Keep low (e.g., <1 mW at sample) to avoid photodegradation.
- Spectral Range: 200 - 2000 cm⁻¹
- Acquisition Time: 10-30 seconds, with 3-10 accumulations.
Procedure:
- Calibrate the spectrometer using a silicon wafer (peak at 520.7 cm⁻¹).
- Locate the fiber under low magnification (e.g., 10x objective).
- Focus the laser on the fiber and acquire spectra.
- Perform a background scan on a clean area of the slide adjacent to the sample.
- Collect spectra from multiple points along the fiber to assess homogeneity.
Data Analysis:
- Pre-process spectra: subtract background, correct baseline.
- Compare processed spectrum against spectral libraries of historical dyes/pigments.
- Cross-reference major peak positions with literature data for known historical dyes. For example, the presence of an aromatic C=C stretch near 1600 cm⁻¹ and aromatic C-H stretches near 3060 cm⁻¹ can indicate an aromatic dye compound [40].
- Correlate identification with historical knowledge of dye use.
Research Reagent Solutions
Table 1: Essential Reagents and Materials for Dye and Ink Analysis
| Item | Function/Application |
|---|---|
| Non-fluorescent Microscope Slides | Substrate for sample placement during analysis to minimize background interference. |
| Coverslips | To secure samples, particularly when using mounting media. |
| Permount or Entellan new | Non-fluorescent, stable synthetic mounting media for securing fragile fibers under coverslips [41]. |
| Silicon Wafer | For daily wavelength calibration of the Raman spectrometer (peak at 520.7 cm⁻¹). |
| Reference Dye Library | A curated database of Raman spectra from known historical dyes and pigments for comparison and identification [40]. |
Table 2: Factors Affecting Raman Detectability of Dyes on Textiles (Based on [41])
| Factor | Impact on Detection | Experimental Notes |
|---|---|---|
| Dye Concentration | Detectability decreases with concentration. Some dyes detectable at 0.05% (w/w). | Black dyes may require higher concentrations (tested at 4%) for detection. |
| Excitation Source | Critical for fluorescence avoidance. 780 nm often superior to 532 nm for fluorescent samples. | Always test multiple wavelengths if instrument allows. |
| Fiber Type | Influences background signal and dye uptake. Tested on cotton, polyester, nylon, wool, rayon. | The chemical affinity between dye and fiber affects signal strength. |
| Mounting Media | May slightly affect signal but does not prevent detection. | Mounting can protect fragile samples and allow for secure positioning. |
Characterization of Binding Media
Application Notes
Raman spectroscopy can differentiate between common historical binding media such as proteins (egg, casein), oils (linseed, walnut), and polysaccharides (gum arabic, starch) by identifying characteristic spectral features in the C-H stretching region and fingerprint region [40]. The C-H stretching region (2800-3100 cm⁻¹) is particularly informative for classification [40]:
- Oils (Triglycerides): Show a C-H band at ~3008 cm⁻¹ (indicative of olefinic =C-H) and a carbonyl (C=O) band at ~1747 cm⁻¹ [40].
- Proteins: Exhibit a broad amide I band in the 1600-1700 cm⁻¹ region and a characteristic C-H envelope peaked at ~2930 cm⁻¹ [40].
- Polysaccharides (e.g., Cellulose): Display a distinct spectral pattern in the C-H region, sometimes with a clear splitting between ~2900 and 2960 cm⁻¹ and a significant O-H band [40].
Experimental Protocol: Differentiating Binding Media
Objective: To non-invasively characterize the binding medium in a painted surface or manuscript. Sample Preparation: For in-situ analysis of an artifact, no sample preparation is required. Use a portable Raman spectrometer or microscope with a long working-distance objective.
Instrumental Parameters:
- Instrument: Portable Raman system or microscope with XYZ stage.
- Excitation Wavelength: 785 nm is recommended to reduce fluorescence from aged organic media.
- Laser Power: <10 mW at sample surface.
- Spectral Range: 200 - 3500 cm⁻¹ (to capture both fingerprint and C-H regions).
- Acquisition Time: 20-60 seconds, with 5-10 accumulations.
Procedure:
- Visually inspect the artifact and select areas for analysis (e.g., different paint colors).
- Position the probe or focus the objective on the area of interest.
- Acquire spectra from multiple spots to account for heterogeneity.
- Always acquire a spectrum from an adjacent area presumed to be unpigmented or a substrate for background subtraction.
Data Analysis:
- Process all spectra: cosmic ray removal, background subtraction, and vector normalization.
- Classify the medium by examining key spectral regions:
- Check for carbonyl band ~1747 cm⁻¹ (suggests oil or resin).
- Examine the amide I band ~1650 cm⁻¹ (suggests protein).
- Analyze the C-H stretching region (2800-3100 cm⁻¹) for band shapes characteristic of oils, proteins, or gums [40].
- Use principal component analysis (PCA) for complex spectral comparisons.
Analysis of Human Remains for Dating and Provenance
Application Notes
Raman spectroscopy is a valuable tool for estimating the post-mortem interval (PMI) of skeletal remains, a critical task in forensic and archaeological contexts that helps determine whether remains are of forensic relevance or historical interest [42] [43]. The technique probes the chemical and structural changes in bone that occur during diagenesis—the post-depositional alteration of biological material. Key Raman parameters used for PMI estimation include crystallinity (reflecting crystal size and perfection in bone mineral), carbonate-to-phosphate ratio, and the mineral-to-matrix ratio [42] [44] [43]. These parameters are correlated with burial time because the organic component of bone (e.g., collagen) declines, and the inorganic hydroxyapatite mineral undergoes recrystallization and changes in composition over time [42] [43]. Recent studies have successfully employed both handheld Raman spectrometers and laboratory-grade Raman microscopes for this application, with principal component analysis (PCA) effectively distinguishing between different PMI classes [43]. A significant challenge in analyzing archaeological bone is background fluorescence, which can complicate spectral interpretation [44].
Experimental Protocol: PMI Estimation of Human Skeletal Remains
Objective: To estimate the post-mortem interval of a human bone sample based on its Raman spectral characteristics. Sample Preparation: A ~7 mm thick transverse section is cut from the diaphysis of a long bone (e.g., femur) using a hand saw. The periosteum and bone marrow should be removed. The sample is air-dried at ambient temperature for several days prior to analysis [43].
Instrumental Parameters (Two Configurations):
- Handheld Device (e.g., Mira Raman system): 785 nm laser, spectral range 400-2300 cm⁻¹, spectral resolution ~6 cm⁻¹. Use orbital raster scanning over a 0.332 mm² area. Collect 5 spectra from distinct locations [43].
- Raman Microscope: 785 nm (or 532 nm) laser, 50x objective, spectral range 400-1800 cm⁻¹, resolution ~4 cm⁻¹. Collect 3-5 spectra from the cortical bone area.
Procedure:
- Clean the bone surface gently with a soft brush to remove loose particulate matter.
- Position the sample securely. For handheld devices, ensure consistent contact pressure. For microscopes, focus on the cortical bone surface.
- Acquire the specified number of spectra from different spots to account for sample heterogeneity.
- Record all instrumental parameters and laser power at the sample.
Data Analysis:
- Pre-process all spectra: smooth, subtract background, and normalize to the intense ν₁PO₄³⁻ band at ~960 cm⁻¹.
- Calculate key Raman parameters:
- Crystallinity: Often calculated as the inverse of the full width at half maximum (FWHM) of the ~960 cm⁻¹ phosphate band.
- Mineral-to-Matrix Ratio (MMR): Ratio of the integrated area of the ~960 cm⁻¹ phosphate band to the area of the ~1665 cm⁻¹ amide I band (or the CH/Proline band ~1450 cm⁻¹) [43].
- Carbonate-to-Phosphate Ratio: Ratio of the integrated area of the carbonate band ~1070 cm⁻¹ to the phosphate band ~960 cm⁻¹.
- For low-maturity organic matter, an alternative is the DA1/GA ratio (area ratio of 1100–1400 cm⁻¹ to 1550–1650 cm⁻¹) and Scaled Spectrum Area (SSA) from un-deconvolved spectra [45].
- Input the calculated parameters into a PCA model or a pre-calibrated classification algorithm to assign a PMI class [43].
Research Reagent Solutions
Table 3: Essential Materials for Bone Diagenesis Studies
| Item | Function/Application |
|---|---|
| Diamond Saw or Hand Saw | For cutting transverse sections from long bones (e.g., femur diaphysis). |
| Non-fluorescent Mounting Media (Optional) | For securing small bone fragments for microscopic analysis, though often analyzed unmounted. |
| Silicon Wafer | For instrument calibration. |
| Reference Bone Samples | Bones with known PMI or from controlled taphonomic studies for model calibration and validation. |
Experimental Workflow for Cultural Heritage Analysis
The following diagram illustrates the generalized decision-making workflow for analyzing organic materials in cultural heritage contexts using Raman spectroscopy.
The protocols outlined herein provide a standardized framework for applying Raman spectroscopy to the analysis of organic materials in cultural heritage contexts. The ability to non-destructively identify dyes, characterize binding media, and estimate the post-mortem interval of human remains significantly enhances our understanding of historical artifacts and biological remains. Future developments in Raman spectroscopy for cultural heritage will likely focus on integrating artificial intelligence for improved pattern recognition and data interpretation, enhancing detection sensitivity for low-signal samples, and reducing operational costs to make these techniques more accessible [9]. The interdisciplinary combination of spectroscopy, chemistry, archaeology, art history, and materials science continues to push the frontiers of cultural heritage science, ensuring that our shared material legacy is preserved and understood for future generations.
Raman spectroscopy has established itself as a cornerstone analytical technique in cultural heritage science, providing invaluable molecular-level information about the materials constituting historical and archaeological objects [46]. The advent of portable and remote systems has fundamentally transformed its application, enabling direct, in-situ analysis at museums, archaeological sites, and within historical buildings [46] [47]. This non-destructive approach is particularly crucial for the study of cultural artifacts, which are often too valuable, fragile, or immobile to be transported to a laboratory [48]. The core strength of these portable systems lies in their ability to provide rapid, on-site identification of pigments, dyes, minerals, and binding media, thereby offering immediate insights into the provenance, manufacturing techniques, and authenticity of cultural objects while also informing their conservation and restoration [47].
Instrumentation and Key Technical Specifications
The transition from bulky laboratory instruments to field-deployable systems has been driven by advancements in laser technology, miniaturized optics, and sensitive detectors [46]. Modern portable Raman spectrometers are characterized by their ruggedness, ease of use, and flexibility. A key feature of many contemporary systems is the integration of a fiber optic probe, which facilitates the analysis of samples with different shapes and sizes, even in hard-to-reach areas, without any sample preparation [47]. Furthermore, precise laser power control is essential for analyzing sensitive materials, such as dark pigments, which can be altered or damaged by excessive laser intensity [47].
Some specialized systems incorporate advanced features to overcome common analytical challenges. For instance, the Bruker Bravo handheld spectrometer employs a Sequentially Shifted Excitation (SSE) technique using two laser diodes (785 nm and 852 nm). This method minimizes the interfering effects of sample fluorescence—a common issue when analyzing organic materials and certain minerals—by collecting multiple interferograms that allow the software to identify and subtract fluorescence bands, resulting in a cleaner Raman spectrum [49].
The table below summarizes the specifications of typical portable Raman instruments used in cultural heritage research.
Table 1: Technical Specifications of Representative Portable Raman Spectrometers
| Feature | B&W Tek i-Raman Series [47] | Bruker Bravo [49] |
|---|---|---|
| Excitation Wavelength(s) | Not specified | 785 nm and 852 nm |
| Laser Power Control | Adjustable in 1% increments, down to 3 mW | Maximum combined output of 100 mW |
| Spectral Range | Not specified | 300 - 3200 cm⁻¹ |
| Resolution | Not specified | 10-12 cm⁻¹ |
| Special Features | Fiber optic probe; Tripod-mountable video microscope | Sequentially Shifted Excitation (SSE) for fluorescence suppression |
| Spot Size | Not specified | ~1 mm |
The Scientist's Toolkit: Essential Research Reagent Solutions
While portable Raman spectroscopy is predominantly non-invasive, the interpretation of spectral data and the understanding of material composition often rely on reference databases and supporting analytical techniques. The following table outlines key resources and tools that form an essential part of the researcher's toolkit.
Table 2: Key Research Tools and Resources for In-Situ Raman Analysis
| Tool / Resource | Function & Explanation |
|---|---|
| Spectral Databases (e.g., KnowItAll, Bio-Rad) [50] | Software and reference spectral libraries used for rapid identification of unknown materials by comparing their Raman fingerprint against a database of known compounds. |
| Portable X-ray Fluorescence (pXRF) [48] [9] | A complementary analytical technique that provides elemental composition data, which, when combined with molecular information from Raman, offers a more comprehensive material characterization. |
| Multivariate Statistical Analysis [48] [51] | A subset of chemometrics used to extract meaningful information from complex spectral datasets, often compensating for the lower spectral quality of some portable instruments. |
| Flexible Sampling Accessories (e.g., Càrol’s cap) [47] | Physical tools, such as a flexible foam rubber cap, designed to minimize environmental interference from sunlight, wind, and dust during outdoor measurements. |
Detailed Experimental Protocols for In-Situ Analysis
Protocol A: Analysis of Rock Art Pigments in Open-Air Shelters
This protocol is adapted from studies conducted on prehistoric paintings in open-air rock shelters, such as those on the Iberian Peninsula [47].
Objective: To identify the mineralogical composition of pigments and any associated degradation crusts without sampling.
Materials and Equipment:
- Portable Raman spectrometer (e.g., i-Raman series) with a fiber optic probe.
- Tripod for instrument stabilization.
- "Càrol’s cap" or similar shielding device to block ambient light and wind.
- Laptop for data collection and real-time visualization.
- Low-power laser option (≤3 mW) to avoid photodegradation of ancient pigments.
Procedure:
- Site Preparation: Erect the tripod on a stable surface near the analysis point. Secure the portable Raman instrument and attach the fiber optic probe.
- Environmental Shielding: Place the shielding device (e.g., Càrol’s cap) directly over the area of interest on the rock surface to create a micro-environment protected from sunlight and air currents.
- Probe Positioning: Carefully position the tip of the fiber optic probe against the rock surface through the shield. Ensure gentle but firm contact to minimize signal loss.
- Acquisition Parameters:
- Set the laser excitation wavelength (typically 785 nm for reducing fluorescence).
- Adjust the laser power to a low level (e.g., 3 mW) to prevent any potential damage to the original pigments.
- Set the integration time and number of accumulations to achieve an adequate signal-to-noise ratio (e.g., 10-30 seconds per accumulation, 3-5 accumulations).
- Spectral Collection: Acquire spectra from multiple points within the same pigment area to account for heterogeneity and degradation.
- Data Processing: Perform baseline correction and cosmic ray removal on the collected spectra using the instrument's software.
- Identification: Compare the processed spectra with reference spectral libraries of minerals and pigments (e.g., haematite, whewellite, gypsum) for identification.
Protocol B: In-Situ Investigation of Architectural Plasterworks
This protocol is based on the long-term study of the plasterwork in the vaults of the Alhambra's Hall of Kings [47].
Objective: To characterize pigments, substrates, and decay products on elevated architectural features without physical sampling.
Materials and Equipment:
- Portable Raman spectrometer coupled to a microscope head.
- Motorized stage on a tripod mounting for precise positioning.
- Video microscope for visual inspection and area selection.
- Scaffolding or lifting platform for accessing high vaults.
Procedure:
- Access and Setup: Position the scaffolding to safely access the analysis area. Mount the Raman instrument with the microscope head on the scaffolding platform.
- Visual Inspection: Use the video microscope to visually identify and document the regions of interest, including areas of different colors and visible decay.
- Targeted Analysis:
- For Pigments (e.g., Lapis Lazuli, Cinnabar): Focus the laser on the colored area. A characteristic peak for lazurite (the main component of lapis lazuli) is at 548 cm⁻¹, while cinnabar shows a strong peak at 252 cm⁻¹.
- For Substrates and Degradation: Acquire spectra from adjacent areas or areas with discoloration to identify the substrate (e.g., gypsum, peak at 1009 cm⁻¹) and potential degradation products (e.g., calomel from cinnabar decay).
- Spectral Acquisition: For each point, collect spectra with appropriate laser power and integration time. The use of a motorized stage allows for mapping larger areas to understand pigment distribution and degradation patterns.
- Data Integration: Correlate the Raman findings with visual documentation to build a comprehensive map of the materials and their condition across the architectural surface.
The workflow for a typical in-situ analysis campaign, from planning to data interpretation, is summarized in the diagram below.
Case Studies & Data Analysis
Case Study 1: The Alhambra Hall of Kings Plasterwork
A multi-year investigation of the polychrome plasterworks in the vaults of the Alhambra demonstrates the power of in-situ Raman analysis [47]. Researchers used a tripod-mounted portable Raman system to analyze decorations 12 meters above ground level.
Key Findings:
- Pigment Identification: The study identified lapis lazuli (characteristic peak at 548 cm⁻¹) for blue areas, and a mixture of cinnabar (HgS) and minium (Pb₃O₄) for red colors.
- Degradation Analysis: Spectra from areas with cinnabar showed the presence of calomel (Hg₂Cl₂), a white degradation product, indicating ongoing chemical decay processes.
- Historical Insights: Analysis of gilded areas revealed the presence of tin oxides, suggesting the use of tin foil instead of gold in later restoration efforts, a fact not previously documented.
This non-invasive approach allowed for the study of a vast area without compromising the integrity of this UNESCO World Heritage site.
Case Study 2: Medieval Soapstone Artifacts and Hellenistic Glyptics
Recent studies underscore the efficacy of mobile instrumentation for rapid on-site identification.
- Medieval Soapstone: Fornasini et al. successfully used mobile Raman setups to provide quick and accurate preliminary identifications of Medieval soapstone artifacts directly at the archaeological site, with results validated by laboratory instruments [48].
- Hellenistic-Roman Glyptics: Caggiani et al. employed mobile Raman spectroscopy for the non-invasive analysis of semi-precious stones in Hellenistic-Roman glyptics, enabling on-site examination with minimal interference to the valuable objects [48].
The quantitative data from various case studies is consolidated in the table below.
Table 3: Summary of Analytical Findings from Cultural Heritage Case Studies
| Analyzed Object / Site | Materials Identified | Characteristic Raman Peaks (cm⁻¹) | Degradation Products Identified |
|---|---|---|---|
| Alhambra Plasterwork(Hall of Kings) [47] | Lapis Lazuli (Lazurite), Cinnabar (HgS), Minium (Pb₃O₄), Gypsum substrate | 548 (Lazurite), 252 (Cinnabar), 1009 (Gypsum) | Calomel (Hg₂Cl₂) |
| Prehistoric Rock Art(Iberian Peninsula) [47] | Haematite (Fe₂O₃) | 225, 293, 412, 500, 610 (Haematite) | Whewellite (CaC₂O₄·H₂O), Gypsum (CaSO₄·2H₂O) |
| 18th Century Enameled Objects [48] | Lead-tin yellows, Naples yellow | ~135, ~335 (Lead-tin yellow) | Not Specified |
Advanced Data Processing and Future Outlook
A significant challenge with portable Raman devices can be the lower spectral quality compared to benchtop systems. To address this, the field is increasingly adopting advanced data processing techniques [48]. Multivariate statistical analysis (a type of chemometrics) is proving highly effective in extracting meaningful information from complex or noisy spectral data collected in the field [48] [51]. Furthermore, software capabilities such as automated baseline correction and algorithms that can compensate for minor wavenumber miscalibrations are crucial for reliable database searching and identification [50].
The future of portable Raman spectroscopy in cultural heritage is pointed towards greater interdisciplinary integration. Key trends include:
- Multi-Technique Integration: The combination of portable Raman with other techniques like pXRF is becoming standard practice, providing complementary molecular and elemental data for a more complete analytical picture [48] [9].
- Artificial Intelligence (AI) and Machine Learning (ML): These technologies are poised to revolutionize data interpretation by enhancing pattern recognition, automating the identification of complex mixtures, and managing large spectral datasets [9] [52].
- Instrument and Database Development: Ongoing efforts focus on improving the sensitivity of portable detectors and expanding open-access spectral databases, which will be vital for accurately analyzing delicate or poorly characterized historical materials [9].
Overcoming Analytical Challenges: Fluorescence, Sensitivity, and Data Interpretation
Fluorescence interference is a pervasive challenge in Raman spectroscopy, particularly in the analysis of cultural heritage materials. When samples contain fluorescent compounds—such as certain pigments, binders, or aging products—the resulting fluorescence emission can overwhelm the inherently weak Raman signal, leading to obscured spectral features and poor signal-to-noise ratios [53] [54]. This issue is frequently encountered in the analysis of historical artworks, archaeological objects, and forensic trace evidence,
where the complex chemical composition of samples often includes natural and synthetic materials prone to fluorescence [26] [55]. Overcoming this interference is crucial for obtaining reliable vibrational fingerprints that enable accurate identification of pigments, binding media, and degradation products in cultural heritage research.
This application note provides a comprehensive overview of both established and emerging techniques for fluorescence suppression in Raman spectroscopy. It details instrumental configurations, data processing protocols, and specialized methodologies tailored to the unique requirements of cultural heritage analysis, with an emphasis on non-destructive, in-situ approaches essential for studying invaluable and often irreplaceable artifacts [56].
Fluorescence Suppression Techniques: Mechanisms and Applications
Fluorescence suppression strategies can be broadly categorized into instrumental approaches, which involve specialized hardware or experimental setups, and computational methods, which process acquired spectra to remove fluorescent backgrounds. The optimal choice depends on factors such as sample properties, available equipment, and analysis requirements [57].
Table 1: Overview of Fluorescence Suppression Techniques in Raman Spectroscopy
| Technique | Underlying Principle | Best Suited For | Key Limitations |
|---|---|---|---|
| NIR Excitation [54] | Uses longer wavelength lasers (e.g., 785 nm) less likely to excite electronic transitions. | General-purpose analysis of fluorescent samples. | Raman signal intensity decreases with longer wavelengths. |
| Time-Gated (TRRS) [58] [57] | Explores the instantaneous nature of Raman scattering vs. slower fluorescence decay. | Samples with moderate to long fluorescence lifetimes (ns-µs). | Requires pulsed lasers & fast detectors; complex setup. |
| SERDS [56] [57] | Utilizes two slightly shifted laser wavelengths; fluorescence remains constant while Raman shifts. | Highly fluorescent and heterogeneous samples. | Requires tunable laser source; reconstruction algorithm needed. |
| Photobleaching [53] [54] | Pre-irradiation with laser light to degrade fluorophores. | Samples resistant to laser-induced damage. | Risk of sample alteration; not always reproducible. |
| Chemical Suppression (Fenton's Reagent) [53] | Uses reactive oxygen species to oxidatively degrade fluorescent additives (e.g., pigments). | Synthetic materials like microplastics and modern pigments. | Not suitable for delicate organic or historical materials. |
| Computational Background Subtraction [54] [57] | Mathematical algorithms (e.g., polynomial fitting) to model and subtract fluorescence baseline. | As a post-processing step for all spectra with elevated baselines. | Can produce artifacts; limited ability to improve SNR. |
| Spatially Offset Raman Spectroscopy (SORS) [56] | Collects signal from a spatially offset point to probe subsurface layers and reduce surface fluorescence. | Turbid, layered, or encapsulated samples (e.g., layered paints). | Signal intensity decreases with larger spatial offsets. |
Advanced and Hybrid Techniques
For particularly challenging samples, advanced or hybrid techniques that combine multiple principles offer superior performance. Shifted-Excitation Raman Difference Spectroscopy (SERDS) is highly effective for removing both sample fluorescence and ambient light interference. It acquires two spectra using laser wavelengths with a narrow difference (on the scale of Raman band widths). The fluorescence background remains constant, while Raman peaks shift; subtracting the two spectra yields a difference spectrum with the fluorescence removed [56]. A reconstruction algorithm is then used to retrieve the conventional Raman spectrum [56].
When combined with Charge-Shifting (CS) detection, SERDS can also mitigate dynamically changing backgrounds, such as fluctuating ambient light during in-situ measurements. The CS technique uses a specially masked CCD and rapid charge shifting to subtract ambient light interference in real-time [56]. The synergy of SERDS-CS is powerful for in-situ heritage science where both static (sample fluorescence) and dynamic (room light) interferences are present [56].
Another powerful hybrid approach is Time-Gated Raman using SPAD detectors. This method leverages the temporal difference between the instantaneous Raman scattering and the nanosecond-scale fluorescence emission. A pulsed laser and a Single-Photon Avalanche Diode (SPAD) line sensor capable of time-correlated single-photon counting (TCSPC) are used. By applying a precise time gate that collects light only during the laser pulse (when the Raman signal is present), the subsequently emitted fluorescence is effectively excluded [58] [57]. This technique also excels at removing the Raman signal generated within the optical fibres of probes, a common background source in portable systems [58].
Experimental Protocols
Protocol: Fluorescence Suppression via Fenton's Reagent for Synthetic Pigments
This protocol is adapted from methods developed for degrading fluorescent pigments in microplastics and is applicable to the analysis of modern synthetic artistic materials [53].
- Objective: To chemically degrade fluorescent pigments or additives in a sample, thereby reducing fluorescence interference prior to Raman analysis.
- Materials:
- Fenton's reagent catalysts: e.g., FeSO₄·7H₂O (Ferrous sulfate heptahydrate)
- Hydrogen peroxide (H₂O₂, 30% wt/wt)
- Ultrapure water
- Light source (sunlight or UV lamp)
- Plastic samples or synthetic pigments on a substrate
- Procedure:
- Preparation of Fenton's Reagent: Dissolve FeSO₄·7H₂O in ultrapure water to prepare a catalyst solution with a concentration of 1 × 10⁻⁶ M [53].
- Sample Treatment: Immerse the sample in the Fenton's reagent catalyst solution. Add H₂O₂ to a final concentration of 0.05 M [53].
- Light Exposure: Place the reaction vessel under a light source (sunlight or UV lamp). The reaction time will vary with pigment type and light intensity. Monitor for visual fading of the pigment.
- Termination and Washing: After the desired bleaching is achieved (e.g., 74-86% pigment removal as reported), remove the sample from the solution and rinse thoroughly with ultrapure water [53].
- Drying and Analysis: Allow the sample to air-dry completely in a clean environment before proceeding with Raman spectroscopic measurement.
- Notes: This method is highly effective for robust, synthetic materials but is not recommended for delicate historical samples due to potential oxidative damage [53].
This protocol describes the acquisition of Raman spectra using a SERDS-capable instrument for effective fluorescence removal [56].
- Objective: To acquire Raman spectra of a fluorescent sample using two slightly different excitation wavelengths and process the data to yield a fluorescence-free spectrum.
- Materials:
- Raman spectrometer equipped with a dual-wavelength SERDS laser module (e.g., emitting at 829.40 nm and 828.85 nm) [56].
- Sample of interest.
- Procedure:
- Instrument Setup: Configure the spectrometer with the SERDS laser module. Ensure the laser power and acquisition settings are identical for both wavelengths.
- Spectral Acquisition:
- Acquire the first spectrum using laser wavelength λ₁.
- Immediately acquire the second spectrum from the same spot using laser wavelength λ₂. The acquisition time for each spectrum should be set so the total energy delivered to the sample matches a conventional measurement (e.g., halve the time for each of the two spectra) [56].
- Data Processing:
- Difference Spectrum: Subtract the spectrum obtained with λ₂ from the spectrum obtained with λ₁. The resulting difference spectrum will contain positive and negative derivatives of the Raman peaks, while the fluorescent background is cancelled out [56].
- Spectrum Reconstruction: Process the difference spectrum using a reconstruction algorithm to generate a standard Raman spectrum. This can be achieved with a custom routine in software like Python, often based on scaling and integrating the derivative-like features in the difference spectrum [56].
The following workflow illustrates the SERDS data acquisition and processing steps:
The Scientist's Toolkit: Key Reagent and Material Solutions
Table 2: Essential Research Reagents and Materials for Fluorescence Suppression
| Item | Function/Application | Specific Example / Note |
|---|---|---|
| Fenton's Reagent Catalysts [53] | Chemical oxidation of fluorescent pigments and additives in synthetic materials. | Fe²⁺ (FeSO₄), Fe³⁺, Fe₃O₄, K₂Fe₄O₇. Use with H₂O₂ under light. |
| Nile Red Stain [59] | Fluorescent dye used for staining and categorizing microplastics; requires optimization to avoid interference. | Optimize solvent, staining time, and dye concentration for the sample. |
| Standard Reference Materials (SRMs) [60] | Calibrate and validate the spectral response and intensity of Raman spectrometers. | NIST SRM 2241-2243 (Raman) and SRM 2940-2943 (Fluorescence). |
| SERDS Laser Module [56] | Provides two tightly spaced excitation wavelengths for the SERDS technique. | e.g., integrated module emitting at 829.40 nm and 828.85 nm. |
| Charge-Shifting CCD [56] | Specialized detector for mitigating dynamic ambient light interference during Raman acquisition. | Used in conjunction with SERDS for in-situ measurements. |
| Time-Gated SPAD Line Sensor [58] | Detector for Time-Resolved Raman Spectroscopy; enables rejection of fluorescence and fibre background. | 512-pixel CMOS SPAD array with time-correlated single-photon counting (TCSPC). |
| Density Separation Media [59] | Isolate particles of interest (e.g., microplastics) from complex matrices before analysis. | Zinc chloride (ZnCl₂) solution at 1.4 g/cm³ for high recovery rates. |
Fluorescence interference, while a significant obstacle in Raman spectroscopy, can be effectively mitigated through a suite of sophisticated techniques. For cultural heritage scientists, the choice of method must balance analytical efficacy with the imperative of non-invasiveness. Instrumental approaches like SERDS and Time-Gated Raman offer powerful, non-contact solutions for a wide range of materials, from pigments on canvases to residues in archaeological ceramics.
Emerging trends point towards the integration of multiple techniques, such as SERDS with charge-shifting detection, to tackle complex real-world scenarios involving both static and dynamic interferences [56]. Furthermore, the miniaturization of advanced technologies like SPAD-based time-gating paves the way for more compact and versatile probes, enhancing the potential for in-situ analysis of large or immovable heritage objects [58]. By carefully selecting and applying the protocols and tools outlined in this document, researchers can unlock the full potential of Raman spectroscopy, revealing intricate chemical details of our cultural past that were previously obscured by fluorescence.
Surface-enhanced Raman spectroscopy (SERS) has emerged as a pivotal analytical technique in cultural heritage science, addressing critical limitations of conventional Raman microscopy. The core principle of SERS relies on the giant increase in Raman scattering intensity—by factors of up to 10^10 to 10^12—experienced by organic molecules adsorbed on atomically rough metallic surfaces [61] [62]. This extraordinary signal amplification enables the identification of organic colorants that were previously inaccessible to standard Raman analysis due to their strong luminescence under laser excitation [61].
In the context of cultural heritage diagnostics, SERS provides a vital solution for analyzing works of art such as prints, drawings, paintings, and polychrome sculpture [61]. Unlike the benchmark technique of high-performance liquid chromatography (HPLC), SERS requires considerably smaller sample sizes, typically ranging from 20 to 100 micrometers, thereby minimizing the impact on precious artifacts [61]. The technique's molecular specificity, coupled with its enhanced sensitivity, allows conservators and scientists to identify trace levels of historical pigments and dyes that carry significant art historical and technological information about the originating civilization [63].
Fundamental Principles of SERS Enhancement
Enhancement Mechanisms
The remarkable sensitivity of SERS stems from the synergistic combination of two primary enhancement mechanisms: the electromagnetic enhancement mechanism and the chemical enhancement mechanism [62].
The electromagnetic enhancement mechanism (EM) dominates the SERS effect, contributing enhancement factors of 10^4 to 10^8 [62]. This mechanism primarily arises from the localized surface plasmon resonance (LSPR) effect, where incident light triggers collective oscillations of conduction electrons in noble metal nanostructures [62]. When the incident light frequency matches the intrinsic oscillation frequency of these free electrons, the resulting resonance generates enormously amplified electromagnetic fields at specific locations known as "hot spots" [62]. Additional contributions to EM include the lightning rod effect, where charge accumulation at sharp geometric features further enhances local electromagnetic fields [62].
The chemical enhancement mechanism (CM) provides more modest signal improvements, typically in the range of 10 to 1000 times [62]. This mechanism involves charge transfer between the metal substrate and analyte molecules, which alters the molecular polarizability and increases Raman scattering cross-sections [62].
The Advantage of Anisotropic Nanostructures
Recent advances have demonstrated that anisotropic nanostructures—asymmetric nanoparticles with shapes such as nanocubes, nanotriangles, and nanorods—significantly outperform their spherical counterparts in SERS applications [63]. These geometrically complex structures naturally generate a broader distribution of electromagnetic hot spots, concentrating the electromagnetic field at particle tips or edges [63]. This intrinsic property enables the trace analysis of dyes and pigments with substantial signal enhancements, often detecting compounds that would otherwise remain undetectable [63].
Table 1: Comparison of SERS Enhancement Mechanisms
| Mechanism | Primary Physical Origin | Enhancement Factor | Key Characteristics |
|---|---|---|---|
| Electromagnetic Enhancement | Localized Surface Plasmon Resonance | 10^4 – 10^8 | Distance-dependent, dominates overall enhancement, creates "hot spots" |
| Chemical Enhancement | Charge transfer between metal and analyte | 10 – 10^3 | Short-range, requires molecular adsorption, affects Raman cross-section |
| Anisotropic Nanostructure Contribution | Geometric field concentration at tips/edges | Additional 10-1000x beyond spherical particles | Broadened hot spot distribution, concentration-independent enhancement |
Anisotropic Nanostructures: Synthesis and Properties
Types of Anisotropic Nanostructures
The development of anisotropic nanostructures has opened new frontiers in SERS sensitivity. These include several distinct geometric configurations:
- Nanorods: Elongated structures with high aspect ratios that support longitudinal and transverse plasmon modes [63]
- Nanotriangles: Planar structures with enhanced field concentration at vertices [63]
- Nanocubes: Structures with field enhancement at corners and edges [63]
- Nanosupernovas: A recently developed highly anisotropic structure containing gold/silver nanostars at their core with a final silver coating, demonstrating exceptional SERS activity [64]
- Gold Nanoraspberries: Silica-encapsulated anisotropic structures used in advanced SERS applications [65]
Synthesis Considerations
Producing anisotropic nanomaterials with high yields and stability remains challenging because synthesis protocols are often intricate and require precise control over reaction conditions [63]. The formation of these structures typically involves carefully controlled reduction processes where parameters such as temperature, pH, reducing agent concentration, and stabilizing agents dictate the final morphology [64]. For instance, the formation of nanosupernova structures depends critically on incubation time and the specific Raman reporter molecule used, with DTNB (5,5′-dithiobis-(2-nitrobenzoic acid)) playing a crucial role in controlling morphology [64].
Experimental Protocols for SERS in Cultural Heritage Analysis
SERS Analysis of Organic Colorants in Artworks
Objective: To identify organic colorants in cultural heritage objects using anisotropic nanostructure-based SERS substrates.
Materials and Reagents:
- Anisotropic gold or silver nanoparticles (nanostars, nanorods, or nanocubes)
- Appropriate Raman reporter molecules (e.g., DTNB, BPE)
- Hydroxylamine hydrochloride or citrate reduction agents for nanoparticle synthesis
- Silver nitrate or chloroauric acid as metal precursors
- Ethanol or acetone for cleaning
- Deionized water
- Micro-sampling tools (scalpel, tungsten needle)
Instrumentation:
- Raman spectrometer with laser excitation (532-785 nm)
- Portable Raman system for in situ analysis (where applicable)
- Optical microscope for sample localization
- Ultrasonic bath for nanoparticle synthesis
Procedure:
Substrate Preparation: a. Synthesize anisotropic nanoparticles using seed-mediated growth method [64] b. Functionalize nanoparticles with Raman reporter molecules (e.g., incubate with 1 mM BPE solution for 30 minutes) [65] c. Apply silica coating for stability if required (for gold nanoraspberries) [65]
Sample Collection: a. For micro-sampling, carefully remove a microscopic fragment (20-100 μm) using a scalpel under magnification [61] b. Alternatively, apply nanoparticle colloid directly to the artifact's surface for non-invasive analysis where permissible [63]
Sample Preparation: a. Transfer sample to microscope slide b. Apply functionalized anisotropic nanoparticle solution to the sample c. Allow adsorption for 10-15 minutes d. Remove excess solution by gentle washing if necessary
SERS Measurement: a. Focus laser beam on sample-nanoparticle interface b. Use low laser power (0.1-1 mW) to prevent photodegradation c. Acquire spectra with integration times of 1-10 seconds d. Collect multiple spectra from different sample positions
Data Analysis: a. Compare obtained spectra with reference database of historical pigments b. Identify characteristic vibrational bands for colorant identification
Advanced Protocol: Active SERS with Ultrasound Perturbation
Objective: To enhance SERS signal detection from complex matrices using external perturbation.
Materials and Reagents:
- Silica-encapsulated BPE-labelled gold nanoraspberries [65]
- Ultrasound coupling gel
- Tissue phantom or similar complex matrix
- Phosphate buffered saline (PBS)
Instrumentation:
- Custom Raman system with transmission capability
- Ultrasound source (20 kHz frequency, capable of 10W power) [65]
- Dielectric mirrors and prism for beam delivery
- Calcium fluoride window for collection
Procedure:
Nanoparticle Preparation: a. Prepare silica-encapsulated BPE-labelled gold nanoraspberries as described in supplemental literature [65] b. Characterize nanoparticles in solution before and after SERS measurements
Sample Assembly: a. Arrange heterogeneous tissue phantom to mimic cultural heritage matrix b. Insert nanoparticle cluster deep within matrix to simulate target analyte
Active SERS Measurement: a. Couple ultrasound tip to sample surface at 90° angle to Raman axis using coupling gel [65] b. Set ultrasound to 20% maximum output (10W) c. Acquire Raman spectra with ultrasound ON and OFF states d. Use synchronization to separate spectra based on perturbation state
Data Processing: a. Sum spectra separately for ON and OFF states b. Subtract ON and OFF spectra with appropriate scaling factor c. Analyze differential spectrum to eliminate matrix background signals
SERS Experimental Workflow for Cultural Heritage Analysis
Research Reagent Solutions for SERS Applications
Table 2: Essential Research Reagents for SERS with Anisotropic Nanostructures
| Reagent/Material | Function | Application Notes |
|---|---|---|
| Gold chloride (HAuCl₄) | Metal precursor for nanoparticle synthesis | Forms basis for most anisotropic gold nanostructures; concentration controls nucleation |
| Silver nitrate (AgNO₃) | Silver source for nanoparticles and coatings | Essential for creating nanosupernovas; enhances SERS activity of gold cores |
| DTNB (5,5′-dithiobis-(2-nitrobenzoic acid)) | Raman reporter molecule | Controls morphology in nanosupernova formation; provides strong SERS signal [64] |
| BPE (1,2-bis(4-pyridyl)ethylene) | Raman reporter label | Used in gold nanoraspberries for stable, enhanced signals; chemisorption onto metal surface [65] |
| Hydroxylamine hydrochloride | Reducing agent for nanoparticle synthesis | Facilitates formation of anisotropic structures; concentration affects morphology |
| Sodium citrate | Stabilizing and reducing agent | Controls growth rate in seed-mediated synthesis; prevents aggregation |
| Silica precursors (TEOS) | Encapsulation agent | Provides chemical and mechanical stability to SERS nanotags; protects metal core [65] |
| CTAB (cetyltrimethylammonium bromide) | Surfactant and shape-directing agent | Critical for anisotropic growth; concentration influences aspect ratio |
Applications in Cultural Heritage Diagnostics
Organic Colorant Identification
SERS with anisotropic nanostructures has revolutionized the analysis of organic colorants in cultural heritage. The extreme sensitivity allows conservators to identify natural dyes such as cochineal, indigo, and madder at trace levels that were previously undetectable [21]. The molecular specificity provided by SERS spectra enables precise differentiation between chemically similar colorants, providing art historians with crucial information about historical painting techniques, trade routes, and artistic practices [61].
Micro-Invasive Analysis
The small sample requirements of SERS (as little as 20 micrometers) make it particularly valuable for analyzing priceless artworks where minimal intervention is paramount [61]. Recent advances in micro-invasive sampling methods allow conservators to obtain diagnostic information from virtually invisible samples, balancing analytical needs with conservation ethics [63]. When combined with portable Raman systems, anisotropic nanoparticle-based SERS enables in situ analysis of artifacts too fragile or large to transport to laboratory settings [21].
Complex Multi-Layer Analysis
The enhanced sensitivity of anisotropic nanostructures facilitates the analysis of complex multi-layer structures in paintings and polychrome sculptures. Through careful micro-sampling at cross-section interfaces, SERS can identify individual layer compositions, revealing artistic techniques, previous restorations, and degradation products [21]. This information is invaluable for developing appropriate conservation strategies and understanding the material history of artifacts.
SERS Enhancement Mechanism with Anisotropic Nanoparticles
Data Presentation and Quantitative Comparisons
Performance Metrics of Anisotropic Nanostructures
Table 3: Quantitative Performance of Anisotropic Nanostructures in SERS
| Nanostructure Type | Enhancement Factor | Optimal Excitation Wavelength | Key Advantages | Reported Applications in CH |
|---|---|---|---|---|
| Gold Nanostars | 10^7 – 10^9 | 650-785 nm | High tip-enhanced fields, tunable plasmonics | Organic dye identification in manuscripts |
| Silver Nanocubes | 10^6 – 10^8 | 450-550 nm | Strong edge enhancement, sharp vertices | Trace pigment analysis in paintings |
| Gold Nanorods | 10^5 – 10^7 | 600-800 nm | Tunable aspect ratio, longitudinal plasmons | Colorant identification in textiles |
| Nanosupernovas | 10^8 – 10^10 | 532-785 nm | Extreme anisotropy, silver coating enhancement | High-sensitivity detection of faded colorants |
| Gold Nanoraspberries | 10^6 – 10^8 | 630-830 nm | Silica encapsulation, stability in complex matrices | Active SERS applications with ultrasound |
The integration of anisotropic nanostructures in SERS represents a transformative advancement for cultural heritage science. These materials provide unprecedented sensitivity for analyzing trace organic colorants, enabling new insights into historical artifacts that were previously beyond analytical detection limits [63]. Future research directions will likely focus on improving the synthesis reproducibility of anisotropic nanoparticles, developing specialized substrates for specific cultural heritage applications, and integrating SERS with complementary techniques such as optical microscopy and fiber optics [63] [21].
The emerging concept of "active SERS," which uses external perturbations like ultrasound to enhance signal contrast, shows particular promise for analyzing heterogeneous cultural heritage matrices where traditional SERS faces challenges from background interference [65]. Additionally, ongoing research into complex anisotropic structures like nanosupernovas points toward even greater sensitivity enhancements in the future [64].
As these technologies mature, SERS with anisotropic nanostructures will increasingly become an indispensable tool in the cultural heritage diagnostician's toolkit, providing molecular-level insights into our shared cultural past while respecting the irreplaceable nature of the artifacts being studied. By enabling more sensitive, minimally invasive analysis, these advanced SERS methodologies support the core ethical principles of cultural heritage conservation while expanding the frontiers of our analytical capabilities.
The analysis of cultural heritage artifacts presents unique challenges for Raman spectroscopy, primarily due to the inherent chemical heterogeneity of historical materials and their advanced degradation over time. These artifacts are typically complex mixtures of original components, alteration products, and modern conservation materials, all of which complicate spectral interpretation [5]. Despite these challenges, Raman spectroscopy has emerged as a powerful, non-destructive analytical tool in heritage science, capable of providing detailed molecular information without compromising artifact integrity [9] [66]. The technique's ability to identify pigments, binding media, and degradation products through their unique vibrational fingerprints makes it indispensable for authentication, conservation planning, and understanding historical manufacturing techniques [66].
This application note outlines standardized protocols to address the specific challenges of analyzing heterogeneous and degraded heritage materials. By implementing these strategies, researchers can improve the reliability of material identification, enhance the accuracy of degradation assessment, and develop more effective conservation methodologies.
Experimental Considerations for Heritage Materials
Instrumentation and Measurement Parameters
The analysis of cultural heritage objects requires careful instrument selection and configuration to address fluorescence interference and weak Raman signals while preserving delicate artifacts.
Table 1: Instrumentation Considerations for Heritage Analysis
| Component | Recommendation | Rationale for Heritage Analysis |
|---|---|---|
| Laser Wavelength | 785 nm NIR excitation | Reduces fluorescence from organic binders and aged varnishes; minimizes potential photodegradation [67] |
| Spatial Resolution | Confocal microscope with <2 μm lateral resolution | Enables analysis of individual pigment grains and heterogeneous material phases [68] |
| Detection System | CCD with >90% quantum efficiency | Enhances sensitivity for weak signals from degraded or low-concentration components [69] [68] |
| Portability | Handheld or portable systems with fiber optic probes | Enables in-situ analysis of immovable artifacts in museums or archaeological sites [66] |
Laser power must be carefully optimized to balance signal-to-noise ratio with artifact preservation. For highly light-sensitive materials (such as organic pigments or faded dyes), start with power below 1 mW at the sample and gradually increase only as needed [66]. Integration times should be determined experimentally, typically ranging from 0.5-5 seconds for in situ measurements, with multiple accumulations to improve signal quality [67].
Research Reagent Solutions and Essential Materials
Table 2: Essential Materials for Raman Analysis of Cultural Heritage
| Material/Reagent | Function | Application Examples |
|---|---|---|
| Reference Spectral Databases | Comparison with historical materials | Identification of ancient pigments and their degradation products [66] |
| Surface-Enhanced Raman (SERS) Substrates | Signal amplification for trace analysis | Detection of faded organic dyes and binding media [66] |
| Index-Matching Materials | Refractive index homogenization | Analysis of rough surfaces on painted artworks and archaeological ceramics [70] |
| Calibration Standards | Instrument performance verification | Acetaminophen tablet for wavenumber; NIST SRM 2241 for intensity [7] |
Protocol 1: Mapping Heterogeneous Materials
Workflow for Spatial Heterogeneity Analysis
The following workflow provides a systematic approach for analyzing chemically heterogeneous heritage objects such as painted surfaces, composite artifacts, and stratified archaeological materials.
Detailed Experimental Methodology
Step 1: Sample Selection and Preparation
- For non-movable artifacts, use portable Raman systems with fiber optic probes for in-situ analysis [66].
- When micro-sampling is permitted, secure minute samples (<1 mm) on glass slides using minimal adhesive. Cross-sections may be embedded in resin for stratified material analysis.
- Ensure the analysis area is stable and vibration-isolated during measurement to maintain spatial registration.
Step 2: Define Mapping Region
- Perform initial low-magnification visual inspection to identify regions of interest based on color variation, texture, or visible degradation.
- Select mapping areas that represent the material diversity of the artifact, typically 100×100 μm to 1×1 mm regions depending on heterogeneity scale.
- For layered structures, employ confocal capabilities to limit depth resolution to 1-2 μm, enabling virtual sectioning [68].
Step 3: Configure Raman Imaging Parameters
- Set spatial resolution based on feature size: 1 μm step size for fine details, 5-10 μm for broader distribution mapping.
- Select excitation wavelength: 785 nm is generally preferred for reduced fluorescence, though 532 nm may provide better signal for certain inorganic pigments [67].
- Adjust laser power and integration time to optimize signal while preventing damage: typically 1-10 mW with 0.1-1 second integration per spectrum [68].
Step 4: Data Acquisition and Processing
- Acquire spectral hypercube containing thousands of individual spectra across the mapped area [71].
- Apply cosmic ray removal algorithm to eliminate spike artifacts from high-energy particles [7].
- Implement BubbleFill baseline correction or similar morphological techniques to remove fluorescence background without distorting Raman bands [7].
- Use vector normalization to correct for intensity variations due to surface topography or focus changes.
Step 5: Multivariate Analysis and Interpretation
- Apply principal component analysis (PCA) to identify major spectral variations across the mapped region [71].
- Use cluster analysis to group spectra with similar chemical composition, automatically identifying material phases.
- Generate false-color chemical images showing distribution of specific components based on reference spectra or characteristic bands [71].
- Compare results with reference databases of historical materials, noting that modern analogs may differ from historical compositions [66].
Protocol 2: Assessing Material Degradation
Workflow for Degradation Product Analysis
This protocol addresses the identification of degradation products and alteration phases that form in cultural heritage materials over time.
Detailed Experimental Methodology
Step 1: Degradation Pattern Recognition
- Document visible signs of alteration including discoloration, cracking, powdering, or efflorescence.
- Consult reference literature on common degradation pathways for specific materials (e.g., conversion of white lead to lead carbonate, vermilion darkening to metacinnabar) [5].
- Identify diagnostic Raman bands for both original and altered materials, noting that degradation products often exhibit broader, less-defined bands due to structural disorder.
Step 2: Spectral Acquisition Strategy
- Collect spectra from multiple points across degradation gradients to capture various alteration stages.
- For surface alterations, employ depth profiling with confocal capability to characterize stratification of degradation products.
- Use consistent measurement parameters across all analysis points to enable quantitative comparison of band intensities and positions.
Step 3: Monitoring Diagnostic Spectral Features
- Track band shifts indicating structural changes: for example, shifts in the v1 (A1g) symmetric stretch of cinnabar (253 cm⁻¹) to 343 cm⁻¹ upon conversion to metacinnabar [5].
- Monitor band broadening which may indicate decreased crystallinity or amorphous phase formation.
- Identify new Raman bands corresponding to specific alteration products, such as calcium sulfate bands in weathered marble or calcium oxalate formations on limestone.
Step 4: Quantitative Assessment
- Calculate band intensity ratios between degradation products and original materials to quantify extent of alteration.
- Employ curve fitting to deconvolve overlapping bands from mixed phases, constraining parameters based on reference spectra [71].
- For complex mixtures, use multivariate curve resolution-alternating least squares (MCR-ALS) to extract pure component spectra and their relative abundances [71].
Step 5: Interpretation and Conservation Planning
- Correlate degradation products with environmental exposure history (humidity, pollutants, light exposure) to identify causative factors.
- Use distribution maps of alteration phases to predict future degradation patterns and prioritize conservation interventions.
- Establish baseline condition documentation for monitoring long-term stability post-treatment.
Data Processing and Analysis Framework
Standardized Pre-processing Workflow
Consistent data processing is essential for reliable comparison of results across different heritage artifacts and research institutions.
Table 3: Essential Data Processing Steps for Heritage Materials
| Processing Step | Method | Heritage-Specific Considerations |
|---|---|---|
| Cosmic Ray Removal | Signal comparison between accumulations | Critical for long acquisitions needed for weak signals from degraded materials [7] |
| Background Subtraction | BubbleFill morphological algorithm | Effectively handles complex fluorescence from aged organic components [7] |
| Spectral Calibration | Acetaminophen and NIST SRM 2241 standards | Ensures comparability of data collected across different instruments and research groups [7] |
| Multivariate Analysis | PCA, cluster analysis, MCR-ALS | Essential for resolving complex mixtures without pure reference spectra [71] |
Implementing the Open Raman Processing Library (ORPL) provides a standardized approach to spectral processing, facilitating data sharing and comparison across the heritage science community [7]. The modular design allows researchers to apply consistent processing workflows regardless of the specific instrument used for data acquisition.
Raman spectroscopy provides heritage scientists with powerful capabilities for addressing the complex challenges of material heterogeneity and degradation in cultural artifacts. The protocols outlined in this application note establish standardized methodologies for spatial mapping of complex mixtures and systematic assessment of degradation pathways. By implementing these strategies—including appropriate instrumentation selection, careful experimental design, multivariate data analysis, and standardized processing workflows—researchers can extract more reliable and comprehensive information from precious cultural heritage materials. These approaches facilitate not only improved understanding of historical manufacturing techniques and material behaviors but also more effective conservation strategies for preserving our shared cultural legacy.
The application of Raman spectroscopy in cultural heritage science has transformed from basic chemical analysis to sophisticated molecular-level characterization, creating unprecedented volumes of spectral data [5]. This data deluge presents a critical analytical bottleneck: while Raman spectroscopy provides rich molecular fingerprint information essential for identifying pigments, binders, and degradation products in artworks and artifacts, the complexity of interpreting these spectra often hinders rapid and accurate decision-making in conservation science [6] [16]. The integration of Machine Learning (ML) and Artificial Intelligence (AI) is now revolutionizing this field by providing powerful computational tools to navigate this complexity, enabling automated pattern recognition, enhancing detection sensitivity, and revealing subtle spectral features invisible to conventional analysis [5] [9]. This paradigm shift is not merely incremental but represents a fundamental transformation in how scientists extract meaningful information from cultural heritage materials, moving from subjective interpretation to data-driven discovery with significant implications for authentication, conservation, and art historical research.
The Data Complexity Challenge in Cultural Heritage Spectroscopy
Cultural heritage materials present unique analytical challenges that generate exceptionally complex data. Raman spectra from artworks and artifacts often contain signals from multiple component mixtures, fluorescent backgrounds, degradation products, and restoration materials, creating interpretation hurdles that traditional analytical methods struggle to overcome [6] [16]. The non-destructive nature of Raman spectroscopy—one of its primary advantages for analyzing priceless cultural objects—also imposes limitations, as samples cannot be purified or simplified prior to analysis [72]. This inherent complexity is compounded by several factors:
- Spectral Overlap: Historical pigments and binding media often produce overlapping Raman bands, complicating definitive identification [16].
- Fluorescence Interference: Aging materials and varnishes generate strong fluorescent backgrounds that can obscure the weaker Raman signals [6].
- Sample Heterogeneity: Cultural heritage materials are typically heterogeneous at microscopic scales, requiring numerous measurements for representative analysis [5].
- Degradation Complexity: Chemical changes over time create complex spectral signatures that differ from reference materials of pristine compounds [9].
The traditional approach of manual spectral matching against reference libraries becomes increasingly inadequate as data volume and complexity grow, creating an urgent need for intelligent computational solutions that can learn from complex patterns and make reliable predictions from multidimensional spectral data [5] [9].
Machine Learning Approaches for Spectral Data Analysis
Dimensionality Reduction and Feature Extraction
Before applying classification algorithms, raw spectral data must be transformed to reduce dimensionality while preserving critical chemical information. Principal Component Analysis (PCA) is widely employed to identify the most significant sources of variance in spectral datasets, effectively compressing hundreds of spectral dimensions into a few principal components that capture the essential molecular information [16]. Linear Discriminant Analysis (LDA) further enhances class separation by projecting data onto axes that maximize between-class variance while minimizing within-class variance [73]. T-distributed Stochastic Neighbor Embedding (t-SNE) provides nonlinear dimensionality reduction that preserves local data structures, often revealing subtle cluster relationships invisible to linear methods [73]. Orthogonal Partial Least Squares Discriminary Analysis (OPLS-DA) is particularly valuable for correlating spectral variations with specific sample properties, making it ideal for discriminating between different historical periods or artistic techniques [73].
Classification Algorithms and Model Selection
Once feature extraction is complete, multiple classification algorithms can be deployed to identify materials based on their Raman signatures. Research indicates that ensemble methods like Random Forest (RF) and Gradient Boosting (GB) often achieve superior performance for cultural heritage applications due to their ability to handle high-dimensional data with complex nonlinear relationships [73]. Support Vector Machines (SVM), particularly with radial basis function (RBF) kernels, effectively separate classes in transformed feature spaces, while k-Nearest Neighbors (KNN) provides a simple yet powerful approach for well-clustered spectral data [73]. For the most challenging pattern recognition tasks, deep learning architectures including Multilayer Perceptrons (MLP), Convolutional Neural Networks (CNN), and Gated Recurrent Units (GRU) can learn hierarchical feature representations directly from raw or minimally preprocessed spectra, eliminating the need for manual feature engineering [73] [74].
Table 1: Machine Learning Algorithms for Raman Spectral Analysis
| Algorithm Category | Specific Models | Key Advantages | Typical Applications in Cultural Heritage |
|---|---|---|---|
| Traditional Classifiers | LDA, QDA, Naive Bayes | Computational efficiency, interpretability | Preliminary screening, pigment identification |
| Ensemble Methods | Random Forest, Gradient Boosting | Handles nonlinear relationships, robust to outliers | Complex mixture analysis, degradation assessment |
| Support Vector Machines | Linear SVM, RBF SVM | Effective in high-dimensional spaces | Authentication studies, forgery detection |
| Neural Networks | MLP, CNN, GRU | Automatic feature extraction, high accuracy | Large-scale spectral mapping, multivariate analysis |
Advanced Deep Learning Architectures
Convolutional Neural Networks (CNN) represent a particularly promising approach for Raman spectral analysis due to their ability to automatically learn spatial hierarchies of features from spectral data [74]. Recent research demonstrates that optimized CNN architectures incorporating batch normalization, max-pooling layers, and carefully tuned convolutional parameters can achieve near-perfect identification accuracy—up to 100% in controlled studies—significantly outperforming traditional machine learning approaches [74]. These architectures treat spectra as one-dimensional images, with convolutional layers detecting increasingly abstract patterns from raw spectral inputs. Recurrent neural networks like Gated Recurrent Units (GRU) offer complementary advantages for modeling sequential dependencies in spectral data, capturing context relationships across wavenumber ranges that reflect molecular structure correlations [73].
Experimental Protocols
Protocol 1: Pigment Identification Using Raman Spectroscopy with Machine Learning
Objective: To identify historical pigments in cultural heritage objects using Raman spectroscopy combined with machine learning classification.
Materials and Equipment:
- Portable or laboratory Raman spectrometer (532 nm or 785 nm laser recommended)
- Microscopic attachment for spatial resolution
- Spectral database of reference pigments
- Computer with Python/R and machine learning libraries (scikit-learn, TensorFlow/PyTorch)
Procedure:
- Sample Preparation:
- Position artifact securely to prevent movement during analysis.
- For portable instruments, ensure proper contact or stand-off distance as required.
- Select multiple analysis points to account for heterogeneity.
Spectral Acquisition:
- Use 532 nm laser for most pigments; 785 nm for fluorescent samples.
- Set laser power to 1-10 mW to prevent damage to sensitive materials.
- Acquisition parameters: 3-5 second accumulation time, 5-10 accumulations.
- Wavenumber range: 400-3200 cm⁻¹ to capture fingerprint and CH regions.
- Collect multiple spectra from each sample (≥25 spectra recommended).
Data Preprocessing:
- Remove cosmic rays using algorithms in instrument software.
- Apply Savitzky-Golay smoothing (window size 5, polynomial order 2).
- Perform baseline correction using asymmetric least squares or polynomial fitting.
- Vector-normalize spectra to account for intensity variations.
- Optionally employ Standard Normal Variate (SNV) scaling.
Machine Learning Workflow:
- Split data into training (80%) and test (20%) sets using sample-level stratification.
- Apply PCA to reduce dimensionality (retain 95% of variance).
- Train multiple classifiers (RF, SVM, LDA) using 5-fold cross-validation.
- Optimize hyperparameters via grid search with cross-validation.
- Evaluate model performance on held-out test set.
Validation:
- Compare ML identifications with known reference spectra.
- Confirm results with complementary techniques (e.g., XRF) when possible.
- Assess confidence scores from classifier probability estimates.
Table 2: Research Reagent Solutions for Cultural Heritage Analysis
| Material/Category | Specific Examples | Function in Analysis |
|---|---|---|
| Reference Pigments | Vermilion, Azurite, Malachite, Lead-white | Create spectral libraries for training machine learning models |
| Binding Media | Linseed oil, Egg tempera, Gum arabic | Understand composite spectral signatures in complex artworks |
| Substrates | Calcium fluoride (CaF₂) slides, Aluminum foil | Provide low-background surfaces for micro-sampling when allowed |
| Cleaning Agents | Deionized water, Ethanol, Surfactant solutions | Prepare reference materials (not used directly on artifacts) |
| Consolidants | Acrylic polymers, Cellulose ethers | Reference spectra for distinguishing restoration materials |
Protocol 2: Multi-Analytical Fusion with Raman and XRF Spectroscopy
Objective: To enhance material characterization by combining Raman spectroscopy with portable X-ray Fluorescence (pXRF) using data fusion and machine learning approaches.
Rationale: The combination of molecular information (Raman) with elemental composition (pXRF) provides complementary data that significantly improves identification accuracy and enables analysis of complex mixtures that challenge single-technique approaches [6].
Procedure:
- Data Collection:
- Acquire paired Raman and pXRF spectra from identical locations on samples.
- Maintain consistent spatial registration between analytical techniques.
- Document measurement locations with microscopy or photography.
Data Preprocessing:
- Preprocess each data type according to technique-specific requirements.
- Normalize both datasets to comparable intensity scales.
- Align data matrices to ensure matched samples/positions.
Data Fusion Strategies:
- Low-Level Fusion: Concatenate raw preprocessed spectra from both techniques.
- Mid-Level Fusion: Extract features separately then combine feature vectors.
- Decision-Level Fusion: Apply separate classifiers then combine predictions.
Model Development:
- Implement ensemble classifiers capable of handling heterogeneous data.
- Use multi-input neural networks with separate branches for each data type.
- Apply feature selection to identify most discriminative Raman and XRF features.
Validation:
- Use cross-validation with grouped samples to avoid data leakage.
- Compare performance against single-technique models.
- Assess real-world performance on authentic cultural heritage objects.
Diagram 1: Machine Learning Workflow for Raman Spectral Analysis. This diagram illustrates the comprehensive pipeline from spectral acquisition to cultural heritage application, highlighting key processing steps and algorithm choices.
Performance Metrics and Validation
Rigorous validation is essential when applying machine learning to cultural heritage analysis, where decisions may impact conservation strategies and historical interpretations. The performance of ML models for Raman spectral classification should be evaluated using multiple metrics to provide a comprehensive assessment of model capability [73].
Table 3: Performance Metrics for ML Models in Raman Spectroscopy
| Metric | Formula | Interpretation in Cultural Heritage Context |
|---|---|---|
| Accuracy | (TP+TN)/(TP+TN+FP+FN) | Overall correctness in material identification |
| Precision | TP/(TP+FP) | Reliability when model identifies a specific pigment |
| Recall (Sensitivity) | TP/(TP+FN) | Ability to detect target materials when present |
| F1-Score | 2×(Precision×Recall)/(Precision+Recall) | Balanced measure for class-imbalanced datasets |
| AUC-ROC | Area under ROC curve | Discrimination ability across classification thresholds |
Cross-validation strategies must account for the hierarchical structure of spectral data, where multiple spectra originate from the same physical sample. Recommended practice employs sample-level splitting, where all spectra from a single sample are assigned entirely to either training or test sets to prevent overoptimistic performance estimates [73]. For cultural heritage applications, where sample sizes are often limited due to the rarity of materials, nested cross-validation provides robust performance estimation while optimizing hyperparameters [73].
External validation using completely independent datasets remains the gold standard for assessing model generalizability. This is particularly important for cultural heritage applications, where materials may have undergone unique degradation pathways or exist in environmental contexts not represented in training data [5].
Future Perspectives and Challenges
Despite significant advances, the integration of machine learning with Raman spectroscopy in cultural heritage science faces several important challenges that represent opportunities for future research. Data scarcity for rare materials remains a fundamental constraint, necessitating research into few-shot learning approaches that can identify materials from limited examples [5] [9]. Transfer learning, where models pre-trained on larger scientific datasets are fine-tuned for specific cultural heritage applications, shows particular promise for addressing this limitation [74].
Model interpretability represents another critical challenge, as the "black box" nature of complex neural networks can hinder adoption by cultural heritage conservators and art historians who require understandable reasoning for analytical results. Research into explainable AI (XAI) techniques for spectral interpretation will be essential for building trust in ML-powered analyses [9]. Future developments should focus on visualizing which spectral regions contribute most to classification decisions, providing intuitive connections between ML outputs and chemical knowledge.
Operational costs and accessibility present practical barriers to widespread adoption, particularly for smaller museums and cultural institutions [5] [9]. The ongoing development of more affordable portable instrumentation, coupled with cloud-based analysis platforms that centralize computational resources, could democratize access to these advanced analytical capabilities.
The most promising future direction involves the creation of comprehensive, standardized spectral libraries with curated metadata that can support the data-hungry nature of deep learning approaches [5]. Community-wide efforts to share spectral data across institutions, coupled with federated learning approaches that preserve data privacy while enabling collective model improvement, could accelerate progress across the field.
Diagram 2: Multi-Modal Data Fusion for Heritage Science. This diagram visualizes the integration of complementary analytical techniques through data fusion and machine learning to extract comprehensive information from cultural heritage objects.
The integration of machine learning and artificial intelligence with Raman spectroscopy represents a paradigm shift in cultural heritage science, transforming how researchers extract meaningful information from complex spectral data. What began as a technique for basic molecular identification has evolved into a sophisticated analytical ecosystem capable of unraveling the most challenging problems in heritage conservation, authentication, and art historical research. The protocols and methodologies outlined in this application note provide a framework for leveraging these advanced analytical capabilities, while the performance metrics offer standardized approaches for validation and comparison. As the field continues to evolve, the convergence of improved instrumentation, enhanced computational power, and more sophisticated algorithms promises to further democratize these capabilities, making powerful analytical tools accessible to broader cultural heritage communities. The future of Raman spectroscopy in cultural heritage lies not merely in more advanced instrumentation, but in smarter interpretation of the rich spectral data it provides—a challenge that machine learning is uniquely positioned to address.
Instrument Selection and Operational Cost-Reduction Strategies
Within the broader context of applying Raman spectroscopy in cultural heritage analysis, the selection of appropriate instrumentation and the implementation of cost-reduction strategies are critical for expanding research accessibility and sustainability. The non-destructive, molecular-specific fingerprinting capabilities of Raman spectroscopy make it indispensable for analyzing priceless artifacts, from pigments and binders to ceramics and metals [17] [66]. However, widespread adoption is often hindered by challenges such as high equipment costs, operational complexity, and the need for specialized expertise [5] [9]. This document outlines structured guidelines for instrument selection, details actionable strategies for minimizing operational expenditures, and provides standardized protocols to enhance the efficiency and reach of spectroscopic analysis in cultural heritage science.
Instrument Selection Criteria
Selecting the correct Raman spectrometer is a balance between analytical performance, practicality for heritage objects, and budget. The following table summarizes the key spectrometer classes and their suitability for cultural heritage applications.
Table 1: Raman Spectrometer Classes for Cultural Heritage Analysis
| Spectrometer Class | Key Features & Techniques | Best-Suited Heritage Applications | Relative Cost & Operational Considerations |
|---|---|---|---|
| Benchtop Systems | High spectral resolution, superior sensitivity, confocal microscopy, multiple laser wavelengths [17]. | Detailed laboratory analysis of micro-samples (e.g., pigment cross-sections, fiber identification), fundamental research [17]. | High initial investment; requires dedicated space and stable environment; requires sample transport [66]. |
| Portable/Handheld Systems | Miniaturized design, battery operation, fiber optic probes, built-in databases [6] [66]. | In-situ analysis of large, immovable objects: murals, architectural elements, archaeological site findings [6]. | Lower upfront cost than benchtop; enables on-the-spot decision-making; spectra may be lower quality [6]. |
| Hybrid/Multi-Technique Systems | Integrates Raman with LIBS, LIF, XRF, or reflectance spectroscopy in a single unit [75]. | Comprehensive analysis providing simultaneous elemental (LIBS/XRF) and molecular (Raman) data from the same spot [75]. | High development cost; operational complexity is offset by rich, complementary data from a single measurement campaign. |
Selection Guidance
The choice of instrument should be driven by the specific research question. For unambiguous material identification in a controlled lab setting, a high-resolution benchtop system is optimal. When the object cannot be moved or a rapid survey is needed, portable systems are indispensable, despite potential compromises in spectral quality. The emerging class of multi-spectroscopic systems, like the SYSPECTRAL platform, represents a powerful albeit more complex solution for gaining the most comprehensive material characterization in a single measurement session [75].
Operational Cost-Reduction Strategies
Managing the total cost of ownership for spectroscopic capabilities is essential for their sustainable application, particularly in smaller institutions.
Table 2: Strategies for Reducing Operational Costs in Heritage Spectroscopy
| Strategy Category | Specific Actions | Expected Outcome & Impact |
|---|---|---|
| Technical & Procedural | Adopt Time-Resolved Raman to suppress fluorescence interference without costly sample preparation [75]. | Reduces analysis time and improves success rate with challenging materials. |
| Employ portable systems for in-situ analysis to eliminate risks and costs of artifact transport [75] [66]. | Lowers insurance, logistics, and handling costs; enables more frequent analysis. | |
| Data Management & Collaboration | Implement chemometrics (PCA, PLS, LDA) to extract more information from lower-quality spectra from portable devices [17] [6]. | Maximizes value from affordable instrumentation; automates interpretation. |
| Accelerate Machine Learning (ML) development for automated pattern recognition and data interpretation [5] [9]. | Reduces expert analysis time and accelerates high-throughput studies. | |
| Utilize public computational databases (e.g., Materials Project) for Raman spectra comparison [76]. | Provides a free, expansive reference library, reducing reliance on commercial databases. | |
| Financial & Institutional | Pursue collaborative funding and resource-sharing models between institutions [66]. | Distributes capital and operational costs across multiple entities. |
| Explore subscription-based access to analytical services instead of outright equipment purchases [66]. | Converts high capital expenditure into manageable operational costs for smaller institutions. |
Experimental Protocols
Protocol: In-Situ Multi-Analytical Investigation of a Painted Artifact
This protocol leverages a portable, multi-technique approach to maximize data yield while preserving artifact integrity and managing operational costs.
1. Aim: To non-invasively identify the pigment and binding media composition of a painted surface on an immovable heritage object.
2. Materials and Reagents: Table 3: Research Reagent Solutions and Essential Materials
| Item | Function in Protocol |
|---|---|
| Portable Raman Spectrometer | Provides molecular identification of pigments and some binders via inelastic light scattering [75]. |
| Portable XRF (pXRF) Spectrometer | Delivers complementary elemental composition data, aiding in pigment identification (e.g., heavy metal pigments) [6]. |
| Portable Reflectance Spectrometer | Provides colorimetric data and aids in identifying pigments with characteristic reflectance profiles [75]. |
| Calibration Standards (e.g., Si, Teflon) | Ensures spectral accuracy (Raman shift) and instrument performance before on-site analysis. |
| Stabilized Laser Power Supply & Battery | Ensures consistent instrument operation and enables use in remote archaeological sites [75]. |
3. Procedure:
- Site Preparation: Secure the analysis area. Ensure stable environmental conditions (low vibration, controlled lighting) if possible.
- Instrument Calibration: Perform wavelength and intensity calibration on all devices using certified standards.
- Macro-Examination: Conduct a broad visual and photographic survey to select representative analysis points.
- Co-Located Analysis:
- Reflectance Spectroscopy: First, perform a non-contact measurement to record the surface color.
- XRF Analysis: Position the pXRF probe at the selected point. Acquire a spectrum for elemental analysis.
- Raman Analysis: Precisely position the Raman probe on the same point. Use a low laser power initially to avoid photodegradation. Acquire the Raman spectrum.
- Data Cross-Referencing: Compare the collected Raman spectrum, elemental profile from XRF, and reflectance data against established heritage material databases.
- Validation: If results are ambiguous, consider using time-resolved Raman or slightly adjusting laser power to mitigate fluorescence, repeating step 4.
The workflow for this integrated analysis is summarized in the following diagram:
Protocol: Enhancing Data Analysis from Portable Systems using Chemometrics
This protocol uses statistical methods to overcome the limitations of portable instruments, representing a cost-effective strategy to enhance data utility.
1. Aim: To apply chemometric techniques for the classification and identification of heritage materials using spectra from a portable Raman system.
2. Materials:
- Raman spectra dataset (from portable instrument).
- Computer with chemometrics software (e.g., Python with Scikit-learn, R, or commercial packages).
- Reference spectral database.
3. Procedure:
- Spectral Pre-processing: Load all spectra. Apply preprocessing steps including:
- Cosmic ray removal.
- Background subtraction to correct for fluorescence baseline.
- Vector Normalization to account for intensity variations.
- Data Reduction: Perform Principal Component Analysis (PCA) on the pre-processed spectra. This step reduces the dimensionality of the data and helps visualize clustering patterns between different sample groups.
- Model Building: Using the principal components as input, build a Linear Discriminant Analysis (LDA) or Partial Least Squares - Discriminant Analysis (PLS-DA) model. This model is trained to classify spectra based on known material identities (the training set).
- Validation: Validate the model's predictive accuracy using a separate set of spectra not included in the training step (validation set).
- Identification: Apply the validated model to identify unknown spectra collected from the artifact.
The logical flow of the chemometric analysis is outlined below:
Validation, Integration, and Comparative Analysis with Complementary Techniques
Building Robust Reference Databases for Cultural Heritage Materials
Within the broader thesis on the application of Raman spectroscopy in cultural heritage analysis, the construction of robust reference databases is not merely a preliminary step but a foundational pillar for the entire research edifice. Raman spectroscopy has emerged as a powerful, non-destructive analytical tool for identifying materials in cultural heritage objects, from ancient Egyptian papyri to modern acrylic paintings [17] [77] [78]. Its effectiveness, however, is critically dependent on the availability and quality of reference spectral libraries that enable accurate material identification [77]. The initial applications of Raman spectroscopy in cultural heritage conservation in the late 1990s were hampered by the lack of such reference databases, a challenge that was only partially alleviated with the first online Raman databases in the early 2000s [77]. This application note details the protocols and considerations for building comprehensive, reliable, and accessible spectral databases that can support the rigorous demands of cultural heritage research, including the identification of pigments, binders, and degradation products, as well as novel applications like the dating of archaeological materials [78].
The Critical Role of Reference Databases in Heritage Science
Reference databases serve as the authoritative corpus against which unknown spectra from artifacts are compared. The identification process typically involves treating spectra as vectors and calculating a dot product (correlation algorithm) between the unknown spectrum and every entry in the database, with the results ranked by a score or hit quality index [50]. The accuracy of this process is paramount and can be compromised by several factors:
- Spectral Quality: The presence of significant background fluorescence or poor signal-to-noise ratios in reference spectra can severely degrade search results [50].
- Instrument Calibration: Variations in instrumental calibration, such as shifts in the Raman wavenumber axis, can lead to missed identifications if the database and query spectra are not properly aligned [50].
- Material Diversity: The vast diversity of pigments, especially synthetic organic pigments introduced after 1900, makes comprehensive database coverage a significant challenge [77]. Without a relevant reference spectrum, even the highest quality unknown spectrum cannot be identified.
The integration of chemometrics—the use of mathematical and statistical methods to analyze chemical data—has further elevated the importance of high-quality databases. Techniques like Principal Component Analysis (PCA) and multivariate curve resolution (MCR) rely on databases to deconvolute complex spectra from mixture samples, enabling the mapping of different chemical components within a heterogeneous heritage object [17] [79].
Protocols for Database Development
Sample Preparation and Selection
A robust database must encompass the materials relevant to the cultural heritage context, including historical and modern pigments, binding media, and substrates.
- Material Sourcing: Acquire reference materials from reputable suppliers. For modern materials, use commercially available artists' products, such as the Maimeri Brera Acrylics Extrafine line used in one study [77].
- Substrate Preparation: To simulate real artifacts and account for potential substrate-induced spectral effects, deposit reference materials on substrates commonly encountered in heritage objects. Protocols should specify the application of pigments onto historically relevant supports, such as wood panels pre-coated with an acrylic plaster preparatory base or glass slides [77]. Standardize the application method and layer thickness to ensure reproducibility.
- Comprehensive Coverage: Actively include both pure inorganic and organic pigments, as well as complex mixtures that reflect actual artists' practice. The database should also account for different forms of the same material (e.g., various grades of carbon black) [77] [78].
Spectral Acquisition Parameters
Consistent and well-documented spectral acquisition is crucial for creating comparable and reliable data.
Table 1: Key Spectral Acquisition Parameters for Database Building
| Parameter | Considerations | Example from Literature |
|---|---|---|
| Laser Wavelength | Test multiple wavelengths (e.g., 532 nm, 633 nm) to manage fluorescence and resonance effects. | 532 nm (Nd:YAG) and 633 nm (He-Ne) were used to characterize modern acrylic paints [77]. |
| Laser Power | Use low power to avoid damaging samples; attenuate with neutral density filters if necessary. | Power kept below 0.5 mW on ancient papyri; filters used to attenuate power on modern paints [77] [78]. |
| Microscope Objective | Select appropriate magnification and numerical aperture for spatial resolution and light collection. | A 50x objective with NA=0.75 was used for manuscript analysis [78]. |
| Acquisition Time & Scans | Optimize for signal-to-noise ratio without causing damage. Vary per sample. | Exposure times of 75 seconds for ancient inks; number of scans varied for modern paints [77] [78]. |
| Spectral Range & Resolution | Ensure the range covers the fingerprint region (e.g., 200-2000 cm⁻¹) with sufficient resolution. | An 1800 lines/mm grating provided high resolution for papyrus analysis [78]. |
Data Processing and Validation
Raw spectral data must be processed to ensure quality and interoperability.
- Pre-processing: Apply consistent baseline correction to remove fluorescence background and instrument artifacts. Software tools like KnowItAll can automate this, but settings must be documented [50].
- Quality Control: Visually inspect all spectra for artifacts and validate the identification of key Raman bands against published literature.
- Metadata Annotation: Each spectrum must be accompanied by comprehensive metadata, including all acquisition parameters from Table 1, sample provenance, chemical name, and date of analysis. This context is vital for future users.
Essential Research Reagent Solutions
Building and utilizing a spectral database requires a suite of analytical tools and reagents.
Table 2: Key Research Reagents and Tools for Spectral Database Work
| Item | Function / Description | Role in Database Development |
|---|---|---|
| Reference Pigments | High-purity, well-characterized historical and modern pigments. | The core reference materials for generating the foundational spectral data [77]. |
| Micro-Raman Spectrometer | Instrument with confocal microscope, multiple laser wavelengths, and motorized stage. | The primary tool for acquiring high-quality, spatially resolved spectra from reference samples and artifacts [77] [79]. |
| KnowItAll / Spectral Software | Commercial software with spectral database and search algorithms. | Used for spectral searching, mixture analysis, and chemometric processing of data [50]. |
| Chemometric Tools (PCA, MCR) | Mathematical algorithms for multivariate analysis. | Essential for analyzing complex spectral images and deconvoluting mixtures within the database or from unknown samples [17] [79]. |
Database Applications and Workflows
Workflow for Pigment Identification
The primary application of a reference database is the identification of unknown materials. The following workflow visualizes this process from measurement to final report.
Advanced Application: Dating of Carbon-Based Inks
A remarkable advanced application of a carefully curated database is the dating of ancient Egyptian carbon-based inks. Research has shown that the Raman spectra of these inks exhibit systematic changes over time, characterized by parameters like the D-band to G-band intensity ratio (I~D~/I~G~) and band widths [78]. A robust database of spectra from dated manuscripts enables the creation of a predictive model.
The process involves building a database of spectra from manuscripts with well-established dates (e.g., 400 BCE to 1000 CE) and performing a statistical analysis, such as Gaussian Mixture Modelling (GMM), to classify the inks and verify their suitability for dating [78]. The spectral parameters are then correlated with the known dates to create a calibration curve. For an unknown manuscript, the Raman spectrum is acquired, its similarity to the database is checked via GMM, and its date is predicted using the established correlation [78]. This workflow demonstrates how a specialized database can unlock novel research avenues beyond simple identification.
The construction of robust reference databases is a critical endeavor that directly underpins the accuracy, reliability, and expanding scope of Raman spectroscopy in cultural heritage science. By adhering to rigorous protocols for sample preparation, spectral acquisition, and data management—and by leveraging these databases with advanced chemometric techniques—researchers can transform spectral data into profound insights about the composition, history, and preservation needs of our shared cultural legacy. As the field progresses, the continued expansion and refinement of these databases, potentially incorporating machine learning for data analysis, will be essential for addressing the complex challenges posed by the diverse and often delicate materials of cultural heritage objects [5].
Vibrational spectroscopy stands as a cornerstone of modern analytical techniques for cultural heritage research, with Raman spectroscopy and Fourier-Transform Infrared (FTIR) spectroscopy serving as two principal workhorses in the field [80]. These techniques provide molecular-level fingerprints of materials, enabling researchers, scientists, and conservators to identify pigments, binders, degradation products, and original constituents in artworks and archaeological artifacts without extensive sampling [9]. The fundamental distinction between these techniques lies in their physical principles: Raman spectroscopy measures inelastic light scattering, while FTIR spectroscopy detects infrared light absorption [81]. For cultural heritage applications, where non-destructiveness is often paramount, understanding the complementary strengths and limitations of each technique is essential for designing appropriate analytical protocols [8] [82]. This application note provides a structured comparison of Raman and FTIR spectroscopy, with specific methodologies and examples drawn from cultural heritage analysis.
Fundamental Principles and Comparative Advantages
Physical Mechanisms and Selection Rules
The core difference between these techniques stems from their underlying physical mechanisms. Raman spectroscopy relies on an inelastic scattering process. When monochromatic laser light interacts with a molecule, a tiny fraction of photons (~1 in 10⁶) exchange energy with molecular vibrations, resulting in shifted frequencies known as Raman shifts [80] [83]. The resulting spectrum provides information about vibrations that cause a change in molecular polarizability.
In contrast, FTIR spectroscopy is an absorption technique. A broadband infrared source passes through or onto a sample, and molecular bonds absorb specific infrared frequencies that match their vibrational energies [81]. The resulting spectrum reveals vibrations associated with a change in dipole moment [80].
Table 1: Fundamental Differences Between Raman and FTIR Spectroscopy
| Aspect | Raman Spectroscopy | FTIR Spectroscopy |
|---|---|---|
| Primary Principle | Inelastic scattering of laser light [81] | Absorption of infrared light [81] |
| Selection Rule | Change in molecular polarizability [80] | Change in dipole moment [80] |
| Typical Excitation | NIR or visible laser [80] | Mid-IR broadband source [80] |
| Water Compatibility | Excellent (weak Raman scatterer) [81] | Limited (strong IR absorber) [80] |
| Sample Containment | Can analyze through glass/plastic containers [81] | Typically requires direct access (except reflectance modes) [82] |
Complementary Strengths for Cultural Heritage
The selection rules make these techniques highly complementary. Raman is exceptionally strong for detecting non-polar functional groups and symmetric vibrations (e.g., C–C, S–S, S–H bonds), while FTIR excels at identifying polar bonds (e.g., C=O, O–H, N–H) [81]. This complementarity is crucial in cultural heritage contexts, where complex mixtures of organic and inorganic materials are common.
A significant advantage of Raman spectroscopy for in-situ analysis is its minimal interference from water and ability to probe samples through transparent containers like glass museum cases, making it ideal for examining sensitive or immobilized objects [80] [81]. However, Raman faces a major challenge from fluorescence, which can swamp the weaker Raman signal. This is particularly problematic for cultural heritage materials containing organic dyes, binders, or varnishes [83]. FTIR spectroscopy is not susceptible to fluorescence but is severely limited by water absorption, making the analysis of aqueous samples or hydrated materials challenging [80].
Application in Cultural Heritage Research
Cultural Heritage-Specific Considerations
In cultural heritage science, the imperative for non-destructive analysis is a primary driver in technique selection [82] [9]. Recent advances in portable instrumentation have significantly expanded in-situ applications for both techniques [8].
For Raman spectroscopy, the development of Surface-Enhanced Raman Spectroscopy (SERS) has been transformative, particularly for analyzing organic dyes [83]. SERS uses metallic nanostructures (typically gold or silver) to dramatically enhance the Raman signal, overcoming intrinsic fluorescence and sensitivity limitations. Recent research explores highly anisotropic metal nanostructures (e.g., nanostars, nanorods), which provide intense electromagnetic "hot spots" for detecting trace amounts of cultural heritage materials [83].
For FTIR spectroscopy, Attenuated Total Reflectance (ATR) and External Reflectance (ER) configurations are most relevant. ATR-FTIR requires contact with the sample, which may leave marks on softer materials and is thus sometimes considered micro-destructive [82]. ER-FTIR offers a completely non-contact approach but produces complex spectra with distorted bands that require mathematical transformation (Kramers-Krönig) for interpretation [82].
Table 2: Applications of Raman and FTIR Spectroscopy in Cultural Heritage Analysis
| Cultural Heritage Material | Raman Spectroscopy Applications | FTIR Spectroscopy Applications |
|---|---|---|
| Pigments & Inorganics | Excellent for inorganic minerals and pigments; can identify crystal structure [8] [83] | Identifies associated anions, carbonates, sulfates; less specific for cations [84] |
| Organic Dyes & Binders | Effective with SERS; analyzes carmine, cochineal, indigo, etc. [83] | Identifies natural gums, proteins, drying oils, waxes [84] |
| Polymers & Modern Materials | Identifies synthetic plastics in 20th-century art; assesses degradation [82] | Primary tool for polymer identification (e.g., PE, PP, PVC, PMMA) [82] |
| Corrosion & Degradation | Characterizes corrosion products on metals; mineral phases on stone [8] | Identifies oxidation products, organic acids, and environmental residues [84] |
| Textiles & Fibers | Analyzes dyes via SERS; characterizes fiber structure and degradation [8] | Identifies fiber type (natural/synthetic); detects finishing treatments [84] |
Decision Workflow for Technique Selection
The following diagram outlines a systematic approach for selecting the appropriate spectroscopic technique in cultural heritage research, based on sample properties and analytical requirements:
Experimental Protocols for Cultural Heritage Analysis
Non-Invasive Pigment Analysis Using Portable Raman Spectroscopy
Principle: This protocol utilizes the ability of Raman spectroscopy to provide specific molecular fingerprints of inorganic pigments through transparent glass or directly on artifact surfaces without contact [8] [81].
Materials and Reagents:
- Portable Raman spectrometer with 785 nm laser excitation to minimize fluorescence [83]
- Fiber optic probe for accessing constrained areas in museum settings [8]
- Calibration standard (e.g., silicon wafer with peak at 520.7 cm⁻¹) for daily wavelength verification [13]
- Micropositioning stage for stable analysis of small areas
- SERS substrates (e.g., gold nanostars or aggregated colloids) for organic pigment analysis if needed [83]
Procedure:
- Instrument Preparation: Power on the portable Raman spectrometer and allow the laser to stabilize for 15 minutes. Perform wavelength calibration using the silicon standard, ensuring the peak center is within ±1 cm⁻¹ of the expected position.
- Sample Examination: Visually inspect the artifact under magnification to identify analysis locations. Avoid areas with obvious modern restoration materials or severe degradation.
- Spectral Acquisition: Position the probe perpendicular to the sample surface at the recommended working distance. For painted surfaces, employ a low laser power (typically <1 mW at sample) to prevent photodegradation. Acquire spectra with 10-30 second integration time and 3-10 accumulations.
- Quality Assessment: Verify spectrum quality by checking signal-to-noise ratio and ensuring fluorescence doesn't overwhelm Raman bands. If fluorescence is excessive, switch to NIR excitation (1064 nm) if available.
- Data Interpretation: Compare acquired spectra to reference spectral libraries of historical pigments, focusing on key biomarker bands (e.g., vermilion at 252, 282 cm⁻¹; lapis lazuli at 548 cm⁻¹; lead white at 1050 cm⁻¹).
Polymer Identification in Modern Artworks Using FTIR Spectroscopy
Principle: This protocol employs FTIR spectroscopy to identify synthetic polymers in 20th-century artworks, utilizing both ATR and external reflectance modes depending on object fragility and accessibility [82].
Materials and Reagents:
- FTIR spectrometer with interchangeable ATR and external reflectance accessories
- ATR crystal (diamond or ZnSe) for direct contact measurements on robust areas [82]
- Gold-coated reference mirror for background spectra in reflectance mode
- Soft, solvent-free cleaning materials (e.g., microfiber cloth) for sample contact areas
- Reference spectral databases of synthetic polymers common in art (e.g., PE, PP, PS, PMMA, PVC, PET) [82]
Procedure:
- Technique Selection: Assess artwork fragility. Use ATR-FTIR for stable, accessible areas on non-delicate surfaces. For fragile, valuable, or large-scale objects, employ external reflectance FTIR.
- ATR-FTIR Analysis:
- Clean the ATR crystal according to manufacturer instructions.
- Apply minimal pressure to bring the sample into contact with the crystal.
- Acquire spectrum with 4 cm⁻¹ resolution and 32-64 scans.
- Clean the crystal again after analysis to prevent cross-contamination.
- External Reflectance FTIR Analysis:
- Position the artwork to ensure a flat analysis area normal to the beam.
- Collect background spectrum using the gold-coated mirror.
- Acquire sample spectrum with 4-8 cm⁻¹ resolution and 64-128 scans to improve signal-to-noise.
- Spectral Processing: For ER-FTIR spectra, apply Kramers-Krönig transformation to correct for distorted band shapes and convert to absorption-like format for library comparison.
- Material Identification: Compare processed spectra to polymer reference libraries, focusing on key absorption bands (e.g., C=O stretch at ~1730 cm⁻¹ for acrylics; ester linkages at 1240, 1725 cm⁻¹ for PET; C-Cl stretch at ~600-800 cm⁻¹ for PVC).
Essential Research Reagent Solutions
Table 3: Essential Materials and Reagents for Cultural Heritage Spectroscopy
| Item | Function/Application | Technical Considerations |
|---|---|---|
| Portable Raman Spectrometer (785 nm/1064 nm) | In-situ analysis of pigments, minerals, corrosion products in museums/archaeological sites | 785 nm laser balances fluorescence reduction with detector sensitivity; 1064 nm further reduces fluorescence [83] |
| SERS Substrates (Anisotropic metal nanostructures) | Signal enhancement for trace analysis of organic dyes and pigments | Gold nanostars/nanorods provide intense electromagnetic "hot spots" for superior enhancement over spherical nanoparticles [83] |
| ATR-FTIR Accessory (Diamond crystal) | Direct analysis of polymers, binders, varnishes with minimal sample preparation | Diamond provides durability and chemical resistance; penetration depth ~2-3 µm; requires good crystal contact [82] |
| External Reflectance FTIR Accessory | Completely non-contact analysis of sensitive, fragile, or large-scale objects | Eliminates physical contact; spectra require Kramers-Krönig transformation for interpretation [82] |
| Reference Spectral Databases | Identification of unknown materials by spectral matching | Culture-specific databases essential (historical pigments, ancient binding media, early synthetic polymers) [82] |
Future Perspectives in Cultural Heritage Science
The field of cultural heritage spectroscopy is evolving toward multi-technique approaches that combine the complementary strengths of Raman and FTIR spectroscopy with other analytical methods [5] [9]. Research indicates a growing trend toward integrating multiple spectroscopic techniques, with combinations of Raman, LIBS, and infrared spectroscopies becoming increasingly common for comprehensive material characterization [5].
Emerging directions include the application of machine learning and AI for automated pattern recognition and data interpretation, which is particularly valuable for complex heterogeneous samples commonly encountered in cultural heritage [5] [9]. The development of enhanced Raman techniques such as spatially offset Raman spectroscopy (SORS) for subsurface analysis and tip-enhanced Raman spectroscopy (TERS) for nanoscale characterization promises to expand non-invasive analytical capabilities [83].
Future advancements will likely focus on improving detection sensitivity while further reducing operational costs, making these sophisticated analytical tools more accessible to smaller museums and cultural institutions [5] [9]. This technological democratization, coupled with continued method refinement, will ensure that vibrational spectroscopy remains indispensable for preserving and understanding our shared cultural legacy.
The analysis of cultural heritage (CH) materials presents a unique set of challenges that often preclude the use of a single analytical technique. These challenges arise from the complex, heterogeneous, and often degraded nature of historical materials, which can include layered paints, corroded metals, and composite artifacts. The imperative for non-destructive (ND) or minimally invasive analysis is paramount when investigating irreplaceable objects [85] [86]. Consequently, the integration of complementary spectroscopic and microscopic techniques has become a cornerstone of modern heritage science. This approach leverages the distinct advantages of each method to build a comprehensive understanding of an artifact's composition, structure, and history [5] [87].
Raman spectroscopy has secured a central role in this multi-technique framework due to its exceptional ability to provide molecular-level information and structural properties of materials, both organic and inorganic, often without any sample preparation [33] [17]. Its capabilities are significantly enhanced when combined with techniques that provide elemental composition and high-resolution morphological data. The synergy between Raman and techniques like Laser-Induced Breakdown Spectroscopy (LIBS), X-ray Fluorescence (XRF), and Scanning Electron Microscopy (SEM) allows researchers to overcome the limitations inherent in each standalone method. This integrated strategy facilitates a more robust identification of materials, clarifies degradation pathways, and reveals insights into historical manufacturing technologies [5] [87] [9]. The following sections detail the specific synergies, applications, and experimental protocols for these powerful analytical partnerships.
The selection of technique combinations is guided by the specific analytical questions posed by the cultural heritage artifact. Each partnership brings a different set of strengths to address particular challenges, from surface mapping to stratigraphic analysis.
Raman Spectroscopy and LIBS
The combination of Raman and LIBS represents a powerful partnership for the sequential molecular and elemental analysis of the same micro-spot. Raman spectroscopy identifies molecular phases and crystalline structures, while LIBS provides the elemental fingerprint, including light elements that are difficult to detect with other methods [5]. This is particularly valuable for identifying pigments where different chemical compounds can share common elements.
A key advantage of this pairing is their complementary spatial resolution and micro-destructive nature. While Raman is considered non-destructive, LIBS performs minimally invasive ablation of a micro-volume of material, allowing for depth profiling through layered structures. This makes the combination ideal for investigating the stratigraphy of paintings or complex corrosion layers on metals [5].
Raman Spectroscopy and XRF
Perhaps the most widespread partnership in heritage science is that of Raman and XRF spectroscopy. Both are non-destructive and highly suited to in-situ analysis using portable instruments [85] [86]. XRF excels at providing bulk elemental composition, rapidly identifying key elements present in pigments, metals, or glass. This elemental data can then guide and refine the interpretation of Raman spectra, which delivers specific molecular and compound identification [87].
For example, XRF might detect the presence of lead and iron in a paint sample. Raman spectroscopy can then determine whether these elements are present as red lead (Pb₃O₄), white lead (2PbCO₃·Pb(OH)₂), or an iron oxide like hematite (Fe₂O₃). This synergy is indispensable for the accurate identification of historical pigments and their degradation products [87].
Raman Spectroscopy and SEM-EDS
When more detailed morphological and chemical information is required, Raman spectroscopy is coupled with Scanning Electron Microscopy with Energy-Dispersive X-ray Spectroscopy (SEM-EDS). This pairing bridges the gap between molecular identification and micro-scale structural imaging. SEM provides high-resolution topographical and compositional images, while EDS offers elemental mapping of the same micro-region [87].
The protocol typically involves analyzing a micro-sample. Raman spectroscopy first identifies the different molecular species present on the sample surface. Subsequently, SEM-EDS is used to visualize the microstructure and correlate the spatial distribution of elements with the molecular phases identified by Raman. This is particularly powerful for studying complex degradation products on glass, corrosion layers on metals, or the heterogeneous composition of ceramic glazes [87].
Table 1: Comparative Overview of Raman and its Complementary Techniques
| Technique | Primary Information | Spatial Resolution | Analytical Depth | Key Synergy with Raman |
|---|---|---|---|---|
| Raman Spectroscopy | Molecular structure, crystalline phases, functional groups [33] [17] | ~1 μm [17] | Surface (μm scale) | Provides molecular context for elemental data. |
| LIBS | Elemental composition (including light elements) [5] | 10-100 μm [5] | Surface to subsurface (via ablation) | Provides elemental profile; enables depth profiling for stratigraphy. |
| XRF | Elemental composition (Z > 11) [85] [33] | 10 μm - several mm [85] | Surface to bulk (μm-mm) | Rapid, non-destructive elemental screening to guide Raman analysis. |
| SEM-EDS | High-resolution morphology & elemental mapping [87] | 1 nm - 1 μm (SEM), 1-3 μm (EDS) [87] | Surface | Correlates molecular identity with microstructure and elemental distribution. |
Experimental Protocols for Integrated Analysis
The following protocols provide detailed methodologies for the synergistic application of Raman spectroscopy with LIBS, XRF, and SEM-EDS on cultural heritage materials.
Protocol: Integrated Raman-LIBS for Pigment Stratigraphy
Application Note: Uncovering the layer structure and composition of historical paintings to understand artistic technique and restoration history.
Materials & Equipment:
- Portable or benchtop Raman spectrometer (e.g., 785 nm laser to minimize fluorescence) [17]
- Micro-LIBS system with pulsed Nd:YAG laser (e.g., 1064 nm)
- Motorized XYZ stage for precise sample positioning
- Optical microscope for site selection
- White light interferometer (optional, for crater depth measurement)
Procedure:
- Sample Stabilization: Secure the artifact or sample to prevent movement during analysis.
- Site Selection & Initial Raman: Using the optical microscope, select an analysis area. Perform a Raman measurement to identify the molecular composition of the surface layer [17].
- Co-located LIBS Analysis: Without moving the sample, perform a single LIBS shot on the exact same spot. The laser pulse ablates a micro-volume of material, creating a small crater.
- Sub-surface Raman: Perform a second Raman measurement inside the newly created LIBS crater. This spectrum provides molecular information from the sub-surface layer now exposed.
- Iterative Depth Profiling: Repeat steps 3 and 4 in a sequential manner. Each LIBS shot removes a thin layer, and the subsequent Raman analysis identifies the composition at that new depth.
- Data Correlation: Compile the sequential Raman spectra into a depth profile, correlating molecular phase changes with depth. The LIBS elemental data acquired at each shot can be used to complement the molecular identification.
Protocol: Combined Raman-XRF for In-situ Pigment Identification
Application Note: Non-invasive, in-situ identification of pigments on a mural or painting.
Materials & Equipment:
- Portable Raman spectrometer
- Portable XRF spectrometer
- Sample positioning rig (tripod, holder)
- Spectral database for pigments and minerals
Procedure:
- Macroscopic Examination: Visually inspect the artifact under visible and UV light to identify areas of interest with different colors or apparent degradation.
- XRF Survey: Perform a broad-area XRF scan on each region of interest. This provides a list of major and minor elements present (e.g., Pb, Hg, Fe, Cu, As) [85] [87].
- Targeted Raman Analysis: Based on the XRF results, perform targeted Raman measurements.
- If XRF shows Hg: Raman can distinguish between cinnabar (HgS) and vermilion.
- If XRF shows Pb and Fe: Raman can differentiate between white lead, red lead, and iron oxides like hematite or goethite [87].
- Data Integration: Create a table cross-referencing the elemental data (XRF) with the molecular identification (Raman) for each pigment area analyzed. This combined data set provides unambiguous pigment identification.
Protocol: Correlative Raman-SEM-EDS for Corrosion Products
Application Note: Detailed investigation of corrosion mechanisms on ancient metal objects.
Materials & Equipment:
- Raman microscope with multiple laser wavelengths
- Scanning Electron Microscope with EDS detector
- Cross-section sample (embedded and polished)
- Sputter coater (for non-conductive samples)
Procedure:
- Sample Preparation: Take a micro-sample from the corroded area, embed it in resin, and polish the cross-section to reveal the stratigraphy.
- Initial Raman Mapping: Analyze the cross-section using Raman mapping to identify the spatial distribution of different corrosion products (e.g., cuprite, malachite, brochantite on copper alloys) [87].
- SEM-EDS Analysis: Transfer the same sample to the SEM. Acquire backscattered electron (BSE) images to visualize phase contrast and morphology of the corrosion layers.
- Elemental Mapping: Perform EDS area mapping and point analysis on the regions previously identified by Raman.
- Data Overlay: Correlate the Raman molecular map with the SEM-BSE image and EDS elemental maps. This confirms, for instance, that a specific copper carbonate hydroxide mineral (malachite, identified by Raman) is co-located with a copper-rich area (confirmed by EDS).
Diagram 1: Integrated analysis workflow for cultural heritage materials, showing non-invasive and micro-invasive paths.
The Scientist's Toolkit: Key Reagents and Materials
Table 2: Essential Research Reagents and Materials for Heritage Science Analysis
| Item | Function/Application | Key Considerations |
|---|---|---|
| Polyester/Epoxy Resin | For embedding micro-samples to create stable cross-sections. | Low exotherm and viscosity resins are preferred to avoid damaging sensitive materials. |
| Silicon Carbide/Alumina Sandpaper | For polishing cross-sections to a smooth finish for SEM and Raman. | Use a graded series (e.g., P600 to P4000) and avoid contamination between samples. |
| Conductive Carbon Tape | Mounting non-conductive samples for SEM analysis to prevent charging. | High-purity tape ensures minimal interference with EDS analysis. |
| Reference Pigment & Mineral Standards | For calibrating instruments and building spectral libraries. | Certified standards with known provenance are essential for accurate identification [87]. |
| Optical Adhesives (e.g., Paraloid B72) | Temporary stabilization of fragile areas during micro-sampling. | Must be reversible and compatible with conservation ethics [86]. |
The complex and irreplaceable nature of cultural heritage materials demands analytical strategies that are as nuanced as the objects themselves. The synergistic integration of Raman spectroscopy with LIBS, XRF, and SEM-EDS has proven to be a transformative approach, moving beyond the limitations of single-technique analysis. By concurrently leveraging molecular specificity, elemental composition, and high-resolution morphology, these partnerships empower researchers to construct comprehensive narratives about an artifact's creation, history, and decay. As the field evolves, the continued refinement of these protocols, coupled with emerging technologies like machine learning for data fusion, promises to further unlock the secrets held within our shared cultural patrimony [5] [86] [9].
Standardization and Protocol Development for Reproducible Results
The application of Raman spectroscopy in cultural heritage research has transformed from a specialized technique to a fundamental analytical tool, enabling non-destructive, in-situ analysis of priceless artifacts including paintings, archaeological objects, and historical documents [5] [9]. This evolution, characterized by increased instrumental sensitivity and the development of portable systems, has highlighted a critical challenge: the lack of standardized methodologies can lead to significant variations in data interpretation between institutions, potentially compromising the reproducibility and reliability of scientific conclusions in conservation science [66]. The inherent complexity of heritage materials—often consisting of heterogeneous mixtures altered by aging processes—demands rigorous protocols to ensure that analytical results accurately reflect the artifact's composition and condition rather than instrumental artifacts or operator-dependent variables [21] [66].
The fundamental objective of standardization in this field is to provide a framework that yields consistent, comparable, and reproducible data across different instruments, laboratories, and timeframes. This is particularly crucial for the creation of comprehensive spectral databases, which require standardized measurement conditions to be universally applicable [66]. Furthermore, the increasing integration of multivariate data analysis and machine learning algorithms for material identification and degradation assessment necessitates high-quality, standardized input data to build robust predictive models [5] [88]. This protocol document outlines a standardized workflow, from experimental design to data reporting, specifically tailored for Raman spectroscopy in cultural heritage analysis, providing researchers with a validated framework to enhance the quality and impact of their scientific investigations.
Core Analytical Workflow: From Experimental Design to Data Modeling
A standardized Raman analysis protocol encompasses three consecutive phases: Experimental Design, Spectral Preprocessing, and Data Modeling. Adherence to this structured workflow is essential for minimizing variability and ensuring that results are scientifically defensible.
Phase 1: Experimental Design and Sample Preparation
Sample Size Planning (SSP): Prior to analysis, researchers must determine the minimal number of spectral acquisitions required to achieve statistically meaningful conclusions. Sample size planning should be based on learning curves that characterize a predefined performance metric (e.g., signal-to-noise ratio, classification accuracy) against increasing sample size. The minimal sample size is identified as the point where the metric no longer improves with additional measurements [34]. For heterogeneous cultural heritage materials, this often requires multiple acquisitions from different regions of the artifact to account for natural variability.
Instrument Calibration: Regular calibration of the Raman spectrometer is non-negotiable for reproducible results. This process involves both wavenumber and intensity calibration using standard reference materials [34].
- Wavenumber Calibration: A calibration function is estimated by aligning the measured band positions of a wavenumber standard (e.g., polystyrene, silicon) to their well-established theoretical values, typically through polynomial fitting.
- Intensity Calibration: The intensity response function is calculated as the ratio between the measured and the theoretical emission spectrum of an intensity standard. This function is subsequently used to correct the intensities of measured Raman spectra from artifacts, allowing for valid quantitative comparisons [34].
Laser Power Optimization: The laser power must be optimized to balance signal acquisition against the risk of photo-damage to sensitive heritage materials. A common strategy is to commence analysis at low laser power (e.g., <0.1 mW for highly sensitive organic dyes) and gradually increase power only if necessary, while continuously monitoring the sample for any visual or spectral signs of degradation [89] [21].
Phase 2: Spectral Preprocessing Workflow
Raw Raman spectra are invariably corrupted by instrumental and environmental effects that must be removed through a systematic preprocessing sequence. The following steps should be applied in order, with the understanding that adjustments to one step may require re-optimization of subsequent steps [34].
Table 1: Essential Spectral Preprocessing Steps
| Step | Primary Function | Recommended Methods | Key Considerations |
|---|---|---|---|
| Spikes Removal | Remove narrow, intense bands caused by cosmic rays striking the detector. | Interpolation from neighboring points; replacement with intensities from successive measurements. | Detection relies on identifying abnormal intensity changes between successive spectra or along the wavenumber axis [34]. |
| Baseline Correction | Remove broad, fluorescent background that obscures Raman signals. | Asymmetric Least Squares (ALS); polynomial fitting; SNIP clipping. | Fluorescence manifests as a slowly changing baseline. The chosen method must model this background without distorting the underlying Raman bands [34] [88]. |
| Smoothing | Improve Signal-to-Noise Ratio (SNR). | Moving-window low-pass filtering (e.g., Savitzky-Golay). | Use sparingly and only on highly noisy data, as it can degrade spectral resolution and obscure subtle peaks [34]. |
| Normalization | Suppress intensity fluctuations from variable excitation or focusing. | Division by area, maximum, or vector norm (e.g., Standard Normal Variate - SNV). | The choice of spectral region (entire spectrum or a specific band) is application-dependent [34]. |
The logical sequence and dependencies of this core preprocessing workflow are illustrated below.
Phase 3: Data Modeling and Chemometric Analysis
For complex heritage materials, advanced data modeling is often required to extract meaningful chemical information. The selection of the model must align with the research question, whether it is classification (e.g., authentic vs. forgery), regression (e.g., quantifying pigment concentration), or unmixing (e.g., mapping material distribution) [34] [88].
Dimension Reduction: This step is critical for handling the high dimensionality of spectral data. Principal Component Analysis (PCA) is a widely used unsupervised technique that transforms the original variables into a new set of uncorrelated variables (principal components), which capture the greatest variance in the data. This allows for the visualization of data clustering and the identification of outliers [88].
Model Construction, Evaluation, and Transfer: A statistical or machine learning model is constructed using a training dataset and its performance is rigorously evaluated with an independent testing dataset.
- Construction & Evaluation: Performance is characterized using metrics like root-mean-squared error (RMSE) for regression and accuracy/sensitivity for classification. Cross-validation frameworks are essential to avoid model overestimation [34].
- Model Transfer: A model trained on one instrument often performs poorly on data from another due to spectral shifts. Model transfer techniques correct for these variations, ensuring the model's broad applicability and longevity [34].
Instrumentation and Reagent Standards
Research Reagent Solutions
The following table details essential materials and reagents required for standardized Raman analysis in a cultural heritage context.
Table 2: Key Research Reagents and Materials
| Item | Function/Application | Standardization Role |
|---|---|---|
| Wavenumber Standards (e.g., Polystyrene, Silicon) | Calibrating the spectral x-axis (wavenumber/Raman shift). | Ensures spectral peaks are reported at consistent, accurate positions, enabling reliable database matching [34]. |
| Intensity Standards (e.g., NIST-traceable white light source) | Calibrating the spectral y-axis (intensity). | Allows for valid quantitative or semi-quantitative comparison of band intensities between different instruments and sessions [34]. |
| Anisotropic Metal Nanoparticles (e.g., Ag Nanostars, Au Nanorods) | Substrates for Surface-Enhanced Raman Spectroscopy (SERS). | Provides orders-of-magnitude signal enhancement for detecting trace materials (e.g., organic dyes); anisotropy creates intrinsic "hot spots" [21]. |
| Reference Pigment & Material Sets | Creating institution-specific spectral libraries. | Serves as a ground-truth reference for identifying unknown materials found on artifacts, compensating for gaps in commercial databases [66]. |
Advanced and Specialized Techniques
For specific analytical challenges, standard Raman spectroscopy may be supplemented with advanced modalities. Surface-Enhanced Raman Spectroscopy (SERS) is indispensable for analyzing organic colorants and other trace materials that yield weak or fluorescent-prone conventional Raman spectra. The protocol for SERS involves the careful application of a colloidal metal suspension (often Ag or Au) onto a micro-sample or the artifact's surface, which dramatically amplifies the Raman signal via plasmonic effects [21]. Spatially Offset Raman Spectroscopy (SORS) is another advanced technique that enables the non-invasive subsurface analysis of layered structures, such as the stratigraphy of paintings or the composition of subsurface corrosion layers [21].
The decision-making process for selecting the appropriate Raman technique is summarized in the following workflow.
Data Reporting and Documentation Standards
To ensure complete reproducibility and facilitate data sharing, the following parameters must be documented alongside all published or archived Raman spectra:
- Instrument Specifications: Manufacturer, model, laser wavelength and power at sample, spectrometer type (dispersive/FT), grating, and detector type (CCD, InGaAs) [89] [1].
- Acquisition Parameters: Spectral range, resolution, number of accumulations, integration time, and microscope objective magnification.
- Sample Description: Detailed description of the analyzed artifact and the exact location of analysis.
- Processing History: A complete record of all preprocessing steps applied, including software used and specific algorithm parameters (e.g., polynomial degree for baseline correction, filter window for smoothing) [34] [88].
Adherence to these standardized protocols will significantly enhance the reliability, comparability, and scientific value of Raman spectroscopy in the preservation and understanding of our shared cultural heritage.
The analysis of cultural heritage (CH) materials presents a unique set of challenges for researchers and conservation scientists. These irreplaceable artifacts, which convey historical, artistic, scientific, and societal values, are often fragile, heterogeneous, and chemically complex [5]. The fundamental challenge lies in extracting comprehensive molecular and structural information without compromising the integrity of these precious objects. This necessitates analytical approaches that are not only sensitive and specific but also predominantly non-invasive or micro-destructive [5] [16].
Raman spectroscopy has emerged as a cornerstone technique in the heritage scientist's toolkit, owing to its molecular specificity, minimal sample requirements, and ability to perform in-situ analysis [16] [6]. However, the complexity of cultural heritage materials—often consisting of mixtures of pigments, binders, degradation products, and substrates—means that relying on a single analytical technique can yield incomplete or even misleading conclusions. The limitations of any one method can be mitigated through a multi-analytical framework, which integrates complementary techniques to provide a validated and more holistic understanding of an artifact's composition, history, and state of preservation [5].
This application note outlines structured, multi-analytical protocols that leverage the strengths of Raman spectroscopy in concert with other analytical methods. By presenting detailed case studies and experimental workflows, we provide a validated framework for researchers in cultural heritage science to design robust studies that yield reliable, defensible findings for conservation, authentication, and art-historical research.
The Multi-Analytical Principle: Complementary Techniques
A strategic multi-analytical approach combines techniques that provide complementary information, such as molecular structure, elemental composition, and spatial distribution. This synergy creates a validation loop where findings from one technique can corroborate or refine interpretations from another.
Table 1: Core Analytical Techniques for Cultural Heritage Analysis
| Technique | Primary Information | Key Strengths | Common Synergy with Raman |
|---|---|---|---|
| Raman Spectroscopy | Molecular vibrations; specific molecular fingerprints and crystal structure [16]. | Identifies organic and inorganic pigments, degradation products, and binding media with high specificity [16]. | Correlates molecular identity with elemental data. |
| Laser-Induced Breakdown Spectroscopy (LIBS) | Elemental composition (atomic emission lines) [5]. | Rapid, micro-destructive, provides elemental depth profiles. | Validates presence of elements associated with Raman-identified compounds (e.g., Pb in lead pigments). |
| Fourier-Transform Infrared (FTIR) Spectroscopy | Molecular functional groups; especially sensitive to organic materials [5] [16]. | Excellent for identifying binders, varnishes, and some degradation products where Raman signals may be weak. | Provides a more complete picture of both inorganic and organic components in a sample. |
| X-ray Fluorescence (XRF) | Elemental composition (especially heavier elements) [6]. | Fully non-invasive, portable, and widely used for in-situ analysis of artifacts. | Complements Raman by confirming elemental makeup, helping to discriminate between pigments with similar colors but different elements. |
| Optical Microscopy | Morphology, layer structure, and micro-scale physical features. | Provides context for spectral data; used to identify sampling locations and examine cross-sections. | Guides analysis and helps interpret heterogeneous or complex Raman spectral maps. |
The integration of these techniques is particularly powerful. For instance, while Raman spectroscopy can definitively identify the specific chemical compound vermilion (HgS) by its molecular vibration bands, portable X-ray Fluorescence (pXRF) can quickly confirm the presence of mercury, providing immediate elemental corroboration in the field [6]. Similarly, the combination of Raman spectroscopy and Laser-Induced Breakdown Spectroscopy (LIBS) is highly effective, as they can often be performed using the same or similarly configured instrumentation, allowing for sequential analysis on the exact same micro-spot [5].
Experimental Protocols
Protocol 1: In-Situ Pigment Analysis on a Painted Artifact
This protocol is designed for the non-invasive analysis of pigments on paintings, manuscripts, or polychrome sculptures directly in a museum or gallery setting.
1. Research Questions & Goals: Identify the palette of original and restoration pigments. Understand the artist's technique and inform conservation treatment.
2. Materials & Equipment
- Portable Raman spectrometer (e.g., with 785 nm laser to minimize fluorescence) [6].
- Portable X-Ray Fluorescence (pXRF) spectrometer.
- Handheld digital microscope.
- Calibration standards for both Raman and XRF (e.g., sulfur for Raman, pure metal standards for XRF).
- Stable, vibration-dampening platform for instrument support.
3. Step-by-Step Procedure 1. Documentation: Photograph the artifact under normal and raking light. Document all areas to be analyzed. 2. Macro-examination: Use the handheld microscope to examine surface morphology, brushstrokes, and potential areas of degradation or overpainting. 3. pXRF Analysis: - Place the instrument's nose cone gently and securely on the area of interest. - Acquire spectra for a minimum of 30-60 seconds per spot. - Record the key elements detected (e.g., Pb, Hg, Cu, Fe, As). 4. Raman Analysis: - Calibrate the Raman spectrometer using a silicon or sulfur standard. - Position the spectrometer probe on the same spot or an adjacent area analyzed by pXRF. - Optimize acquisition parameters (laser power, integration time, number of accumulations) to obtain a high signal-to-noise spectrum while avoiding damage. Start with low laser power (e.g., <5 mW on the sample) and gradually increase if necessary [16]. - Acquire multiple spectra from each pigment area to ensure representativeness. 5. Data Correlation: - Create a table for each analyzed point, listing the elements detected by pXRF and the molecular compounds identified by Raman. - Cross-reference the identified compounds with historical pigment databases.
4. Data Interpretation & Validation The elemental data from pXRF provides a list of candidate pigments, which is then confirmed or refined by the molecular specificity of Raman. For example, the detection of lead (by pXRF) and minium, Pb₃O₄ (by Raman), provides a validated identification of the pigment. Discrepancies, such as the detection of titanium (Ti) by pXRF without a corresponding Raman identification of titanium white (TiO₂), may indicate the presence of a modern restoration pigment that is amorphous or highly fluorescent, requiring further investigation.
Protocol 2: Laboratory-based Depth Profiling of Complex Stratigraphies
This protocol is for the micro-destructive analysis of cross-sections to reveal the layer-by-layer composition of a sample, which is crucial for studying painting techniques and the sequence of restoration campaigns.
1. Research Questions & Goals: Determine the sequence and composition of paint layers, ground, and varnish. Identify degradation products at layer interfaces.
2. Materials & Equipment
- Raman microscope with high numerical aperture objectives (e.g., 50x, 100x).
- LIBS system, ideally coupled to the same microscope platform [5].
- Scanning Electron Microscope with Energy Dispersive X-ray spectroscopy (SEM-EDS).
- Embedded and polished cross-section sample from the artifact.
- Reference samples of common pigments and binding media.
3. Step-by-Step Procedure 1. Sample Preparation: A micro-sample is embedded in a resin block and polished to reveal a clean cross-sectional surface. 2. Optical Microscopy: Examine the cross-section under visible and UV light to identify distinct layers and areas of interest. 3. SEM-EDS Analysis: - Coat the cross-section with a thin carbon layer. - Acquire backscattered electron images to show atomic number contrast. - Perform EDS point analysis and elemental mapping on key layers. 4. Raman-LIBS Sequential Analysis: - Place the cross-section under the Raman/LIBS microscope. - Select points for analysis across the stratigraphy. - For each point: - First, acquire a Raman spectrum to identify molecular species. - Then, fire a single, low-energy LIBS laser pulse at the same precise location. The LIBS pulse ablates a minute amount of material, creating a micro-crater. - Acquire the LIBS emission spectrum from the generated plasma. - Move to the next layer or a subsequent point within the same micro-crater for sub-surface depth profiling.
4. Data Interpretation & Validation The combination is powerful for identifying both the molecular and elemental character of each layer. Raman identifies compounds like lead white (2PbCO₃·Pb(OH)₂) in a ground layer, while LIBS confirms the presence of lead and can detect trace elements that Raman cannot. Analyzing the crater floor with Raman after a LIBS pulse can then reveal the composition of the underlying layer, providing a powerful tool for micro-destructive depth profiling [5].
Case Study: Analysis of a Renaissance-Era Panel Painting
A hypothetical case study of a 16th-century Italian panel painting, "Madonna and Child," demonstrates the practical application of these protocols.
1. Challenge: The blue robe of the Virgin Mary appeared visually heterogeneous, with areas of granular discoloration, raising concerns about the pigment's identity and stability.
2. Multi-Analytical Approach: Protocol 1 (In-Situ Analysis) was applied.
Table 2: Results from the Analysis of the Virgin's Blue Robe
| Analysis Area | pXRF Elemental Data | Raman Spectral Peaks (cm⁻¹) | Compound Identified | Interpretation |
|---|---|---|---|---|
| Area 1: Intense Blue | Strong Cu, Ca | 259, 282, 376, 1092 | Azurite (2CuCO₃·Cu(OH)₂) | Original, well-preserved azurite pigment. |
| Area 2: Pale Blue | Strong Cu, Ca; Trace S | 265, 285, 395, 470, 1094 | Azurite & Gypsum (CaSO₄·2H₂O) | Azurite mixed with or overlaid by gypsum (a common alteration product or filler). |
| Area 3: Greenish Crust | Strong Cu, S | 265, 285, 395, 470, 605, 975, 1145 | Azurite & Brochantite (Cu₄SO₄(OH)₆) | Azurite partially altered to brochantite, a green copper sulfate, explaining the discoloration. |
3. Validated Findings & Conclusion: The pXRF data consistently showed copper, confirming a copper-based blue pigment. Raman spectroscopy was crucial for specific identification: it differentiated the original azurite from the alteration product brochantite and the filler/alteration product gypsum, which have overlapping elemental signatures in pXRF. The study conclusively identified the pigment as azurite and diagnosed its degradation into brochantite as the cause of the disfiguring green crust. This validated finding directly informed the conservator's decision to stabilize the micro-climate around the painting to prevent further sulfation.
The Scientist's Toolkit: Essential Research Reagents & Materials
Table 3: Key Reagents and Materials for Multi-Analytical Cultural Heritage Research
| Item | Function/Application |
|---|---|
| Silicon Wafer / Sulfur Pellet | Essential standards for wavelength calibration of Raman spectrometers before and during analysis [90]. |
| Certified XRF Calibration Pellets | Used to calibrate pXRF for quantitative and semi-quantitative elemental analysis. |
| Micro-Embedding Resin (e.g., polyester, epoxy) | For preparing polished cross-sections of micro-samples for stratigraphic analysis. |
| Reference Pigment & Binder Libraries | Collections of known, historically accurate materials for acquiring reference Raman and FTIR spectra. |
| Bioorthogonal MARS Dyes | Specialized Raman tags with unique signatures in the cell-silent region; useful for highly multiplexed imaging in complex systems, though more common in biological applications [70]. |
| Index Matching Refractive Liquids | Used in conjunction with microscopy to reduce light scattering and improve visualization of sample details. |
Workflow and Data Processing Diagrams
Multi-Analytical Validation Workflow
The following diagram illustrates the logical flow of a multi-analytical campaign, from initial non-invasive steps to more detailed micro-destructive analysis, showing how techniques interact to validate findings.
Multi-Analytical Validation Workflow: This chart outlines the decision-making process in a multi-analytical campaign, showing how different techniques are sequenced to validate findings.
Raman Data Processing Pipeline
The following diagram details the standard workflow for processing raw Raman spectral data into a form suitable for interpretation, analysis, and reporting, highlighting steps where chemometric techniques are applied.
Raman Data Processing Pipeline: This flowchart details the sequential steps for transforming raw Raman spectral data into actionable results, including key pre-processing and analysis stages.
The integration of Raman spectroscopy into a multi-analytical framework is not merely a best practice but a necessity for generating validated, scientifically defensible results in cultural heritage research. The protocols and case studies presented here demonstrate that the synergistic use of complementary techniques—such as pXRF, LIBS, and SEM-EDS—overcomes the inherent limitations of any single method. This approach provides a robust foundation for answering complex questions about the composition, authenticity, and degradation of cultural artifacts. As the field moves forward, the ongoing development of portable instrumentation, advanced data processing algorithms like the BubbleFill baseline removal technique [7], and sophisticated chemometric analyses [16] [91] will further enhance the power and reliability of these multi-analytical strategies, ensuring that our shared cultural legacy is understood and preserved for future generations.
Conclusion
Raman spectroscopy has profoundly transformed cultural heritage analysis, establishing itself as a cornerstone non-destructive technique for material identification and authentication. Its journey from a laboratory method to an adaptable field tool, especially with portable systems and advanced methods like SERS, underscores its critical role. Future progress hinges on overcoming persistent challenges like fluorescence and data complexity, largely through the accelerated development of machine learning systems and AI-powered data processing. The ongoing trend of integrating Raman with complementary techniques and building comprehensive spectral databases promises a more holistic and accessible future for heritage science. These advancements in interdisciplinary methodology and data analysis, pioneered in cultural heritage, offer valuable frameworks and insights that can inspire innovation and cross-pollination in biomedical and clinical research, particularly in the non-invasive analysis of complex biological samples.
References
- 1. Raman spectroscopy [https://en.wikipedia.org/wiki/Raman_spectroscopy]
- 2. Raman Techniques: Fundamentals and Frontiers - PMC [https://pmc.ncbi.nlm.nih.gov/articles/PMC6626094/]
- 3. Molecular Fingerprint Detection Using Raman and Infrared ... [https://pmc.ncbi.nlm.nih.gov/articles/PMC10216688/]
- 4. Datasets - RamanSPy [https://ramanspy.readthedocs.io/en/latest/datasets.html]
- 5. Application of spectroscopy technique in cultural heritage [https://www.nature.com/articles/s40494-025-01622-0]
- 6. Raman Spectroscopy Transforms Cultural Heritage and ... [https://www.spectroscopyonline.com/view/raman-spectroscopy-transforms-cultural-heritage-and-forensic-analysis]
- 7. Open-sourced Raman spectroscopy data processing ... [https://pmc.ncbi.nlm.nih.gov/articles/PMC9941747/]
- 8. Raman Spectroscopy in Cultural Heritage Preservation [https://link.springer.com/book/10.1007/978-3-031-14379-3]
- 9. How Spectroscopy Has Shaped Cultural Heritage ... [https://www.spectroscopyonline.com/view/how-spectroscopy-has-shaped-cultural-heritage-preservation-insights-from-30-years-of-research]
- 10. Historical Pigments and Paint Layers: Raman Spectral ... [https://www.mdpi.com/2075-163X/14/6/557]
- 11. Raman scattering [https://en.wikipedia.org/wiki/Raman_scattering]
- 12. Exploring Resonance Raman Spectroscopy [https://www.spectroscopyonline.com/view/exploring-resonance-raman-spectroscopy]
- 13. Stress, Strain, and Raman Spectroscopy [https://www.spectroscopyonline.com/view/stress-strain-and-raman-spectroscopy]
- 14. Raman spectroscopy analysis of pigments on 16–17th c. ... [https://www.sciencedirect.com/science/article/abs/pii/S1386142512001242]
- 15. Artificial Intelligence-Powered Raman Spectroscopy through ... [https://pmc.ncbi.nlm.nih.gov/articles/PMC12613844/]
- 16. A Review of Non-Destructive Raman Spectroscopy and ... [https://www.mdpi.com/1420-3049/29/22/5324]
- 17. A Review of Non-Destructive Raman Spectroscopy and ... [https://pmc.ncbi.nlm.nih.gov/articles/PMC11596853/]
- 18. Raman Spectrum - an overview [https://www.sciencedirect.com/topics/computer-science/raman-spectrum]
- 19. Raman Spectroscopy Analysis of Minerals Based on ... [https://www.spectroscopyonline.com/view/raman-spectroscopy-analysis-of-minerals-based-on-feature-visualization]
- 20. μ-Raman spectroscopy as a useful tool for improving ... [https://www.sciencedirect.com/science/article/pii/S0169131724000954]
- 21. Raman spectroscopy and SERS: Recent advances in ... [https://www.sciencedirect.com/science/article/abs/pii/S1296207424002620]
- 22. Raman spectroscopy for art and cultural heritage [https://www.renishaw.com/en/raman-spectroscopy-for-art-and-cultural-heritage--7982?srsltid=AfmBOooWpfTtidFeWqOQeu7jWZpwKA9N7VQtVtnZ7wO1f0PPVxbcX2oy]
- 23. Unlocking the Secrets of Historical Pigments with Raman ... [https://hsg.ino.cnr.it/unlocking-the-secrets-of-historical-pigments-with-raman-spectroscopy/]
- 24. Raman spectrometry for the analysis and identification of ... [https://marketplace.sshopencloud.eu/workflow/Jj3UU9]
- 25. Brillouin and Raman micro-spectroscopy for cultural heritage [https://www.spiedigitallibrary.org/conference-proceedings-of-spie/13569/1356912/Brillouin-and-Raman-micro-spectroscopy-for-cultural-heritage--an/10.1117/12.3066590.short]
- 26. A systematic review on the analysis of trace materials via ... [https://www.sciencedirect.com/science/article/abs/pii/S0379073825002476]
- 27. HHXRF, Raman and imaging techniques applied to the ... [https://www.sciencedirect.com/science/article/abs/pii/S0969806X25008369]
- 28. Review of in-situ non- and micro-destructive techniques for ... [https://www.nature.com/articles/s40494-025-01675-1]
- 29. Analyzing Pigment Degradation in Cultural Heritage Artworks [https://www.spectroscopyonline.com/view/analyzing-pigment-degradation-in-cultural-heritage-artworks]
- 30. A systematic review on the analysis of trace materials via ... [https://pubmed.ncbi.nlm.nih.gov/40848479/]
- 31. Raman Spectroscopy for Pigment Identification [https://www.spectroscopyonline.com/view/raman-spectroscopy-pigment-identification]
- 32. Advances in deep learning-based applications for Raman ... [https://www.sciencedirect.com/science/article/abs/pii/S0026265X25000463]
- 33. Application of Raman Spectroscopy to Ancient Materials [https://pmc.ncbi.nlm.nih.gov/articles/PMC7321063/]
- 34. Key Steps in the Workflow to Analyze Raman Spectra [https://www.spectroscopyonline.com/view/key-steps-in-the-workflow-to-analyze-raman-spectra]
- 35. How to Read Raman Spectroscopy Results: A Beginner's ... [https://www.azooptics.com/Article.aspx?ArticleID=2803]
- 36. On-Site Identification of Corrosion Products and Evaluation ... [https://www.mdpi.com/1996-1944/18/5/924]
- 37. Raman approach to the forensic study of bronze patinas [https://www.sciencedirect.com/science/article/abs/pii/S2352409X21003278]
- 38. Optics & Photonics News - Spectroscopy for Cultural Science Heritage [https://www.optica-opn.org/home/articles/volume_36/july_august_2025/features/spectroscopy_for_cultural_heritage_science/?_gl=1*e6c6e0*_up*MQ,linkedin,twitter]
- 39. of Raman Materials: Overview of... Spectroscopy cultural heritage [https://link.springer.com/article/10.1007/s41061-016-0061-z]
- 40. A Simple Introduction to Raman Spectral Identification of ... [https://www.spectroscopyonline.com/view/a-simple-introduction-to-raman-spectral-identification-of-organic-materials]
- 41. Assessment of detection limits for dyed and mounted textile ... [https://pubmed.ncbi.nlm.nih.gov/36076332/]
- 42. Raman spectroscopy for postmortem interval estimation of ... [https://pubmed.ncbi.nlm.nih.gov/37494000/]
- 43. Raman Handheld Versus Microscopic Spectroscopy for ... [https://www.mdpi.com/2306-5354/11/11/1151]
- 44. Assessing the usefulness of Raman spectroscopy and lipid ... [https://www.sciencedirect.com/science/article/pii/S0379073823003316]
- 45. Assessing low-maturity organic matter in shales using ... [https://www.sciencedirect.com/science/article/pii/S0166516218301034]
- 46. Critical evaluation of portable Raman spectrometers: From ... [https://www.sciencedirect.com/science/article/abs/pii/S0003267021008539]
- 47. Raman Spectroscopy in Archaeological Studies [https://www.metrohm.com/en/applications/bw-tek-applikationen/410000004-a.html]
- 48. Cutting-Edge Raman Spectroscopy Applied for Forensic ... [https://www.spectroscopyonline.com/view/cutting-edge-raman-spectroscopy-applied-for-forensic-and-heritage-studies]
- 49. Raman Spectroscopy [https://archaeometry.missouri.edu/raman.html]
- 50. Introduction to Interpretation of Raman Spectra Using ... [https://www.spectroscopyonline.com/view/introduction-interpretation-raman-spectra-using-data-base-searching-and-functional-group-detection-a]
- 51. School of Infrared and Raman for Spectroscopy in... applications [https://www.centrorestaurovenaria.it/eng/scuola-di-spettroscopia-infrarossa-e-raman-per-applicazioni-nei-beni-culturali-2/]
- 52. Artificial intelligence guided Raman spectroscopy in ... [https://www.sciencedirect.com/science/article/pii/S2095177925000887]
- 53. Overcoming the fluorescent interference during Raman ... [https://www.sciencedirect.com/science/article/abs/pii/S0048969723039566]
- 54. How to Reduce Fluorescence in Raman Spectroscopy [https://www.edinst.com/resource/technical-note-how-to-reduce-fluorescence-in-raman-spectroscopy/]
- 55. Raman Spectroscopy for Artwork and Archaeology [https://www.edinst.com/resource/application-note-raman-spectroscopy-for-artwork-and-archaeology/]
- 56. Shifted-excitation Raman difference spectroscopy and charge ... [https://pubs.rsc.org/en/content/articlehtml/2025/an/d4an01280a]
- 57. Time-gating and Other Fluorescence Suppression ... [https://www.timegate.com/resources/blog/time-gating-and-other-fluorescence-suppression-techniques]
- 58. Time-resolved Raman spectroscopy using a CMOS SPAD ... [https://pmc.ncbi.nlm.nih.gov/articles/PMC12265467/]
- 59. Improving Fluorescence and Raman Techniques for ... [https://www.spectroscopyonline.com/view/improving-fluorescence-and-raman-techniques-for-environmental-microplastic-analysis]
- 60. Relative Intensity Correction Standards for Fluorescence ... [https://www.nist.gov/programs-projects/relative-intensity-correction-standards-fluorescence-and-raman-spectroscopy]
- 61. Surface-enhanced Raman spectroscopy (SERS) in cultural ... [https://pubs.rsc.org/en/content/articlelanding/2017/ay/c7ay90097j]
- 62. Research Progress of Surface-Enhanced Raman ... [https://www.mdpi.com/2304-6732/12/8/809]
- 63. Advancing Cultural Heritage Analysis: How Anisotropic ... [https://www.spectroscopyonline.com/view/advancing-cultural-heritage-analysis-how-anisotropic-nanostructures-are-revolutionizing-raman-and-sers-spectroscopy]
- 64. Nanosupernova: a new anisotropic nanostructure for SERS [https://pubs.rsc.org/en/content/articlelanding/2023/nr/d2nr05287c]
- 65. Active Surface-Enhanced Raman Spectroscopy (SERS) [https://pmc.ncbi.nlm.nih.gov/articles/PMC11823272/]
- 66. How to Employ Raman Spectroscopy for Cultural Heritage ... [https://eureka.patsnap.com/report-how-to-employ-raman-spectroscopy-for-cultural-heritage-preservation]
- 67. Clinical instrumentation and applications of Raman ... [https://pmc.ncbi.nlm.nih.gov/articles/PMC4854574/]
- 68. Criteria for High-Quality Raman Microscopy [https://www.spectroscopyonline.com/view/criteria-high-quality-raman-microscopy]
- 69. Raman Spectroscopy as a Quantitative Tool for Industry [https://www.spectroscopyonline.com/view/raman-spectroscopy-quantitative-tool-industry]
- 70. Highly-multiplexed volumetric mapping with Raman dye ... [https://pmc.ncbi.nlm.nih.gov/articles/PMC8930416/]
- 71. What Raman images can reveal [https://www.renishaw.com/en/what-raman-images-can-reveal--25802?srsltid=AfmBOoq8LweGmT0DBK2nwJ_Uzl4cF6eWQQ_-HnkyqFE2DzB3dsFUvE5R]
- 72. Raman spectroscopy for art and cultural heritage [https://www.renishaw.com/en/raman-spectroscopy-for-art-and-cultural-heritage--7982?srsltid=AfmBOoqjn6PHnZYx721HfZ23P6Bq4muWO97xIrkZ1-V8j7QL2BBNmskp]
- 73. Raman spectroscopy and machine learning for early ... [https://www.nature.com/articles/s41598-025-20270-9]
- 74. New AI-Powered Raman Spectroscopy Method ... [https://www.spectroscopyonline.com/view/new-ai-powered-raman-spectroscopy-method-revolutionizes-culture-media-identification]
- 75. New Multi-Spectroscopic System Enhances Cultural ... [https://www.spectroscopyonline.com/view/new-multi-spectroscopic-system-enhances-cultural-heritage-analysis]
- 76. High-throughput computation and evaluation of raman ... [https://www.nature.com/articles/s41597-019-0138-y]
- 77. Spectral Raman Database of Modern Acrylic Paints at 532 ... [https://www.mdpi.com/2076-3417/15/11/5908]
- 78. Using Raman spectroscopy to estimate the dates of carbon ... [https://www.sciencedirect.com/science/article/abs/pii/S1296207418307404]
- 79. What Raman images can reveal [https://www.renishaw.com/en/what-raman-images-can-reveal--25802?srsltid=AfmBOoqjjM2jTWUOePyJA1PQ_UJl9RRUZ8MZUWsMc_OU6h8O_FxnsW_x]
- 80. Raman vs. FTIR: Selecting the Best Tool [https://whitebearphotonics.com/blogs/measurement-techniques/raman-vs-ftir?srsltid=AfmBOoqpcSOK9m0ztVUPBxCmChu8VFYOmZ2L4MnCwVzSRzUEzdkMrIGJ]
- 81. FTIR vs Raman Spectroscopy: Which Technique Suits Your ... [https://www.labmanager.com/ftir-vs-raman-spectroscopy-which-technique-suits-your-analysis-33682]
- 82. Material survey in the modern and contemporary ... [https://www.sciencedirect.com/science/article/abs/pii/S1386142525009588]
- 83. Raman spectroscopy and SERS: Recent advances in ... [https://www.sciencedirect.com/science/article/pii/S1296207424002620]
- 84. Recent advances and applications to cultural heritage ... [https://pubs.rsc.org/en/content/articlelanding/2022/an/d2an00005a]
- 85. Electromagnetic Techniques Applied to Cultural Heritage ... [https://www.mdpi.com/2076-3417/15/12/6402]
- 86. Development Trend in Non-Destructive Techniques for ... [https://www.mdpi.com/2571-9408/8/9/381]
- 87. Advances in Analytical Strategies to Study Cultural ... [https://pmc.ncbi.nlm.nih.gov/articles/PMC10489939/]
- 88. Review of multidimensional data processing approaches for ... [https://epjtechniquesandinstrumentation.springeropen.com/articles/10.1140/epjti/s40485-015-0018-6]
- 89. Basic Principles of Raman Scattering and Spectroscopy [https://www.edmundoptics.com/knowledge-center/application-notes/lasers/basic-principles-of-raman-scattering-and-spectroscopy/?srsltid=AfmBOoppYQY4IvEzAP8AkNsZSQGeNktetBFhh7Kt1jLdzkVzXPce6Hci]
- 90. Applications of Raman Spectroscopy in Solvent Distillation ... [https://www.spectroscopyonline.com/view/applications-of-raman-spectroscopy-in-solvent-distillation-and-exchange-during-early-phase-chemical-synthesis]
- 91. Qualitative and Quantitative Analysis of Azithromycin as ... [https://pmc.ncbi.nlm.nih.gov/articles/PMC10552109/]