Real-Time Reaction Monitoring: A Guide to Spectroscopic Techniques for Pharmaceutical Development
This article provides a comprehensive guide for researchers and drug development professionals on utilizing spectroscopic techniques for monitoring chemical reactions.
Real-Time Reaction Monitoring: A Guide to Spectroscopic Techniques for Pharmaceutical Development
Abstract
This article provides a comprehensive guide for researchers and drug development professionals on utilizing spectroscopic techniques for monitoring chemical reactions. It covers foundational principles of key methods like Raman, FT-IR, NMR, and UV-Vis, explores their specific applications in bioprocessing and stability testing, and offers best practices for troubleshooting and data optimization. By comparing technique capabilities and highlighting the role of chemometrics, this resource supports the implementation of robust, real-time Process Analytical Technology (PAT) strategies to enhance process understanding and ensure final product quality.
Core Spectroscopic Principles: From Light-Matter Interaction to Reaction Fingerprints
In the fields of chemical synthesis and drug development, the ability to monitor reactions in real-time provides a significant advantage for process optimization, understanding reaction mechanisms, and ensuring product quality. Spectroscopic techniques have emerged as powerful tools for real-time analysis due to their non-destructive nature, rapid data acquisition, and molecular specificity. Unlike traditional analytical methods that require manual sampling and offline analysis, spectroscopic methods enable researchers to observe chemical transformations as they occur, providing immediate feedback on reaction progress, intermediate formation, and endpoint determination.
The fundamental principle underlying spectroscopic monitoring involves the interaction of electromagnetic radiation with matter to generate signals specific to molecular composition and structure. Different spectroscopic techniques probe various molecular properties, making them suitable for diverse applications across organic synthesis, catalysis, and biopharmaceutical manufacturing. The integration of these techniques with flow chemistry systems, automated reactors, and machine learning algorithms has further enhanced their capability for real-time process control and optimization, establishing spectroscopy as an indispensable tool for modern chemical research and development.
Fundamental Advantages of Spectroscopy for Real-Time Analysis
Key Characteristics Enabling Real-Time Monitoring
Spectroscopic techniques possess several inherent properties that make them particularly suitable for real-time reaction monitoring:
- Non-destructive analysis: Samples remain unchanged after measurement, allowing continuous monitoring of the same reaction mixture [1] [2].
- Rapid data acquisition: Modern spectrometers can collect multiple spectra per second, enabling near-instantaneous feedback on reaction progress [3].
- Molecular specificity: Different techniques provide unique insights into specific molecular features, including functional groups, bond vibrations, and electronic transitions [4] [2].
- Minimal sample preparation: Most spectroscopic analyses require little to no sample manipulation, reducing analysis time and potential error sources [1].
Comparative Advantages Over Traditional Methods
When compared to traditional chromatographic methods, spectroscopic techniques offer distinct benefits for real-time monitoring:
Table: Comparison of Reaction Monitoring Techniques
| Analytical Method | Time Resolution | Sample Preparation | Molecular Information | Automation Potential |
|---|---|---|---|---|
| FTIR Spectroscopy | Seconds to milliseconds | Minimal | Functional groups, intermediates | High |
| Raman Spectroscopy | Seconds | Minimal | Molecular fingerprints, crystallinity | High |
| UV-Vis Spectroscopy | Milliseconds | Minimal | Chromophores, concentration | High |
| NMR Spectroscopy | Minutes to seconds | None to minimal | Molecular structure, kinetics | Moderate |
| HPLC | Minutes to hours | Extensive | Separation, purity | Low to moderate |
The tabular data illustrates how spectroscopic methods generally provide faster time resolution with minimal sample preparation compared to chromatographic techniques like HPLC, making them better suited for real-time monitoring applications [1] [3] [2].
Essential Spectroscopic Techniques and Their Applications
Fourier-Transform Infrared (FTIR) Spectroscopy
FTIR spectroscopy monitors changes in functional groups by measuring infrared absorption corresponding to molecular vibrations, making it particularly valuable for tracking reaction progress through the appearance or disappearance of specific functional groups [3] [2]. Recent advances have demonstrated its application in automated reaction optimization systems, where it provides real-time feedback for controlling reaction parameters.
Experimental Protocol: Real-Time FTIR Monitoring of Suzuki-Miyaura Cross-Coupling
- Equipment Setup: Reactor system equipped with attenuated total reflection (ATR) probe, FTIR spectrometer, flow chemistry setup with programmable logic controller [3].
- Spectral Acquisition Parameters: 4 cm⁻¹ resolution, 16 scans per spectrum, frequency range of 699–1692 cm⁻¹ (fingerprint region) [3].
- Data Processing: Apply first-derivative transformation to enhance spectral features; use linear combination of reference spectra for quantitative analysis [3].
- Integration with Automation: Connect FTIR output to control system for real-time adjustment of flow rates and temperature based on spectral data [3].
- Validation: Compare predicted yields from FTIR data with offline HPLC analysis to verify accuracy [3].
Raman Spectroscopy
Raman spectroscopy provides molecular fingerprint information through inelastic scattering of light, enabling non-invasive monitoring of chemical reactions. Its compatibility with aqueous systems and ability to measure through glass make it particularly useful for biopharmaceutical applications [1] [2].
Experimental Protocol: Inline Raman Monitoring of Cell Culture Processes
- Equipment Setup: Raman spectrometer with fiber-optic probe immersed directly in bioreactor, 785 nm laser source to minimize fluorescence [2].
- Spectral Acquisition: 400-1800 cm⁻¹ spectral range, 30-second integration time, continuous monitoring throughout culture process [2].
- Chemometric Modeling: Collect reference spectra for 27 critical culture components; develop partial least squares (PLS) models for concentration prediction [2].
- Anomaly Detection: Implement control charts to identify spectral anomalies indicating contamination or process deviations [2].
- Real-Time Control: Integrate with bioreactor control system to adjust nutrient feed rates based on metabolite concentrations [2].
Ultraviolet-Visible (UV-Vis) Spectroscopy
UV-Vis spectroscopy monitors electronic transitions in molecules with chromophores, providing quantitative concentration data for reaction species. Its rapid acquisition speed makes it ideal for tracking fast reaction kinetics [1] [2].
Experimental Protocol: UV-Vis Monitoring of Protein Chromatography
- Equipment Setup: Flow cell with 1 mm pathlength integrated into chromatography system, diode-array detector [2].
- Wavelength Selection: Monitor at 280 nm for protein detection (aromatic amino acids) and 410 nm for host cell protein impurities [2].
- Calibration: Develop calibration curves for monoclonal antibodies and host cell proteins in relevant buffer systems [2].
- Process Control: Optimize collection parameters based on real-time absorbance data; start fraction collection at 0.5 column volumes during elution phase [2].
- Validation: Compare with offline analytics to confirm separation efficiency and impurity removal [2].
Nuclear Magnetic Resonance (NMR) Spectroscopy
NMR provides detailed structural information through detection of nuclear spin transitions in magnetic fields, enabling researchers to monitor structural changes and molecular interactions directly [1] [2].
Experimental Protocol: Inline NMR for Reaction Mechanistic Studies
- Equipment Setup: Flow NMR probe integrated with reaction system, permanent magnet or superconducting magnet system [1].
- Spectral Acquisition: ¹H NMR with water suppression for aqueous systems, acquisition time of 1-5 minutes per spectrum depending on concentration [1].
- Data Processing: Apply Fourier transformation and phase correction; integrate characteristic peaks for quantitative analysis [1].
- Kinetic Analysis: Monitor time-dependent changes in peak intensities to derive reaction rates and identify transient intermediates [1].
Experimental Design and Workflow Integration
Reaction Monitoring Workflow
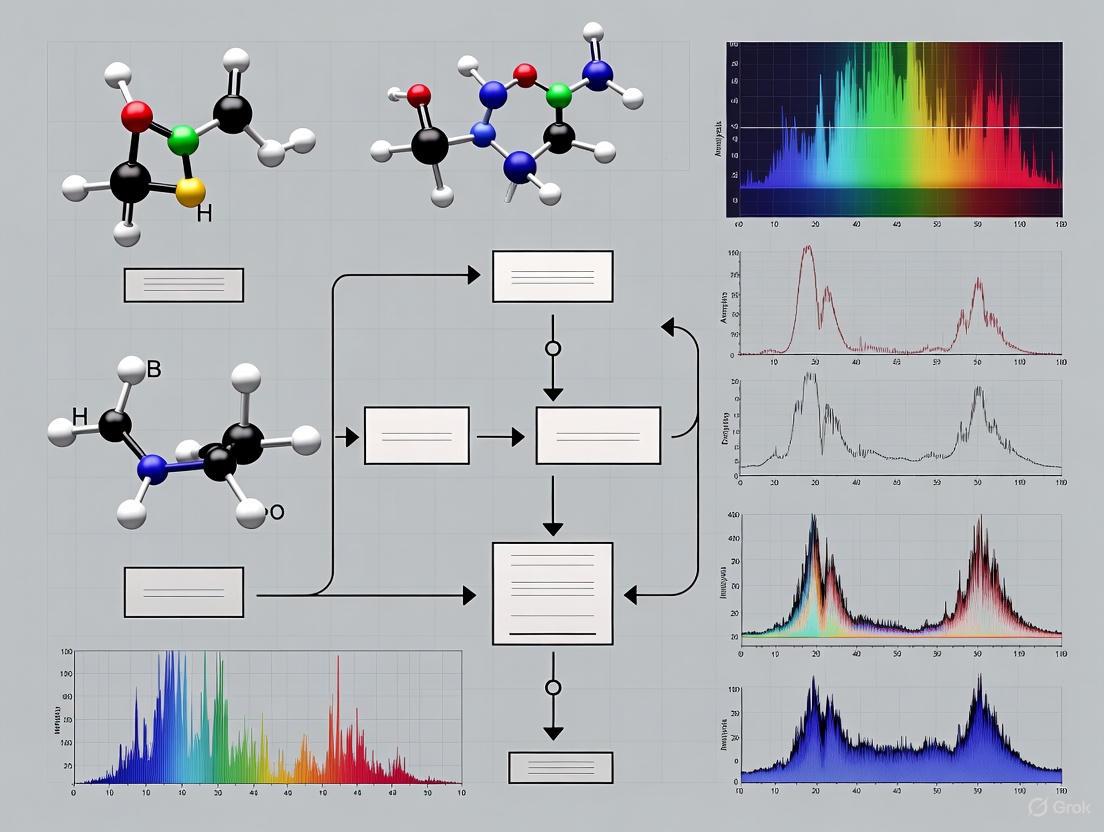
The diagram below illustrates a generalized workflow for integrating spectroscopic monitoring into reaction optimization systems:
Research Reagent Solutions for Spectroscopic Monitoring
Table: Essential Materials for Spectroscopic Reaction Monitoring
| Reagent/Material | Function in Experimental Setup | Application Examples |
|---|---|---|
| ATR Crystal Probes | Enables direct measurement in reaction media without sampling | FTIR monitoring of organic synthesis reactions [3] |
| Flow Cells with Optical Windows | Provides controlled pathlength for transmission measurements | UV-Vis monitoring of protein chromatography [2] |
| Raman-Compatible Fiber Optic Probes | Allows non-contact measurements through glass reactor walls | Bioprocess monitoring in bioreactors [2] |
| Deuterated Solvents | Provides NMR lock signal and minimizes interference | Reaction monitoring by flow NMR spectroscopy [1] |
| Chemometric Software | Processes spectral data and builds predictive models | Multivariate analysis of reaction components [3] [2] |
| Internal Standards | Provides reference signal for quantitative analysis | Concentration determination in complex mixtures [3] |
Advanced Applications and Integration with Automation
Integration with Flow Chemistry Systems
The combination of spectroscopy with flow chemistry represents a powerful approach for reaction optimization and automated synthesis. Flow systems provide enhanced heat and mass transfer, precise residence time control, and improved safety profiles compared to batch reactors [1] [3]. When integrated with spectroscopic monitoring, these systems enable rapid screening of reaction conditions and real-time optimization of process parameters.
Experimental Protocol: Automated Reaction Optimization with Real-Time FTIR
- System Configuration: Peristaltic or syringe pumps for reagent delivery, microreactor or packed-bed reactor, ATR-FTIR flow cell, automated collection system [3].
- Spectral Training Set Generation: Create simulated spectra through linear combination of reactant and product spectra to build machine learning training set [3].
- Neural Network Implementation: Train model to predict reaction yield from spectral features, using fingerprint region (699-1692 cm⁻¹) with first-derivative processing [3].
- Closed-Loop Optimization: Implement Bayesian optimization algorithm to adjust flow rates and temperature based on predicted yield, maximizing reaction performance [3].
- Validation and Scale-Up: Verify optimized conditions with offline analysis, then translate to production scale through numbering-up of reactor units [3].
Machine Learning-Enhanced Spectral Analysis
Machine learning algorithms have revolutionized the interpretation of complex spectral data, enabling accurate predictions even when distinct spectral features are absent. These approaches are particularly valuable for reactions where traditional peak-based analysis fails due to overlapping signals or subtle spectral changes [5] [3].
Experimental Protocol: Machine Learning-Assisted Spectral Analysis
- Data Collection: Acquire reference spectra for pure components (reactants, products, potential intermediates) under reaction conditions [3].
- Training Dataset Generation: Create virtual spectra through linear combination of reference spectra representing different reaction compositions [3].
- Model Selection and Training: Implement neural network or partial least squares regression model, using spectral differentiation to enhance predictive accuracy [3].
- Model Validation: Test prediction accuracy with prepared standard mixtures of known composition, comparing predicted versus actual values [3].
- Real-Time Implementation: Integrate trained model with spectroscopic system for continuous composition prediction during reaction monitoring [3].
Spectroscopic techniques provide an unparalleled platform for real-time reaction monitoring, offering the speed, specificity, and non-destructive analysis required for modern chemical research and pharmaceutical development. The fundamental advantages of these methods—including rapid data acquisition, minimal sample preparation, and molecular specificity—make them ideal for understanding reaction mechanisms, optimizing process conditions, and ensuring product quality.
The integration of spectroscopy with flow chemistry systems, automated reactors, and machine learning algorithms represents the cutting edge of reaction monitoring technology. As these advanced applications continue to evolve, spectroscopic monitoring will play an increasingly central role in accelerating research and development cycles across chemical and pharmaceutical industries. By implementing the protocols and methodologies outlined in this application note, researchers can leverage the full potential of spectroscopic monitoring to enhance their reaction optimization workflows and drive innovation in synthetic chemistry and drug development.
Within the framework of spectroscopic techniques for monitoring chemical reactions, UV-Visible (UV-Vis) absorption spectroscopy stands as a cornerstone analytical method for researchers and drug development professionals. Its principle is foundational: the measured absorbance of light in the ultraviolet or visible range by a sample is directly proportional to the concentration of a given reactant, product, or intermediate species [6]. This relationship, governed by the Beer-Lambert law, makes UV-Vis spectroscopy a highly efficient and effective technique for quantitatively tracking the progression of chemical reactions in real time, thereby providing critical insights into reaction kinetics and mechanistic pathways [6].
The value of this technique spans from fundamental research to industrial manufacturing, where maintaining optimal reaction conditions is critical for quality control and assurance [6]. This Application Note details the protocols and quantitative data analysis necessary to leverage UV-Vis spectroscopy for monitoring concentration changes and elucidating kinetic parameters, with a particular emphasis on applications relevant to the pharmaceutical industry.
Principles and Applications in Reaction Monitoring
The primary application of UV-Vis in reaction monitoring is to observe the formation or loss of components as a chemical reaction progresses [6]. By measuring the absorbance at a specific wavelength over time, a researcher can generate a dataset that reflects concentration changes. Subsequent analysis of this temporal data allows for the identification of the reaction order and the calculation of the appropriate rate constant [6].
A key advantage of UV-Vis spectroscopy is its adaptability to various experimental setups. It can be employed for off-line analysis, where samples are periodically taken from a reaction vessel, or as an in-line Process Analytical Technology (PAT) tool for continuous manufacturing processes. A notable study validated the use of in-line UV-Vis spectroscopy for monitoring the active pharmaceutical ingredient (API) content uniformity in tablets during a continuous manufacturing process, a critical quality attribute [7]. The research demonstrated that UV-Vis, with its straightforward univariate data analysis, could be a promising alternative to more complex techniques like NIR and Raman spectroscopy for this application [7].
Table 1: Key Kinetic Parameters Accessible via UV-Vis Spectroscopy
| Parameter | Description | Typical UV-Vis Output |
|---|---|---|
| Reaction Order | The dependence of the reaction rate on the concentration of reactants. | Determined by fitting concentration-time data to integrated rate laws. |
| Rate Constant (k) | The proportionality constant in the rate law, specific to a temperature. | Calculated from the slope of the linear fit from the appropriate rate plot. |
| Half-life (t₁/₂) | The time required for the concentration of a reactant to decrease to half of its initial value. | Calculated from the rate constant (e.g., t₁/₂ = ln(2)/k for a first-order reaction). |
| Activation Energy (Eₐ) | The minimum energy required for a reaction to occur. | Determined from the Arrhenius equation using k values at different temperatures. |
Furthermore, the technique's utility extends to specialized fields like (photo)electrocatalysis, where operando UV-Vis spectroelectrochemistry is used to probe catalytic mechanisms and quantify the accumulation of reactive intermediates at the catalyst-electrolyte interface under working conditions [8].
Experimental Protocols
Protocol 1: General Method for Monitoring Reaction Kinetics
This protocol outlines the general steps for using a benchtop UV-Vis spectrophotometer to monitor the kinetics of a homogeneous solution-phase reaction.
1. Pre-Experimental Setup:
- Wavelength Selection: Prior to the reaction, obtain UV-Vis spectra of the individual reactants and the expected product(s) in the reaction solvent. Identify a wavelength where the reactant or product of interest shows significant absorbance change with minimal interference from other species [7].
- Calibration Curve: Prepare a series of standard solutions with known concentrations of the analyte. Measure the absorbance of each standard at the selected wavelength and construct a calibration curve of absorbance versus concentration to establish the relationship for quantitative analysis.
2. Instrument and Software Configuration:
- Instrument: Use a cuvette-based UV-Vis spectrophotometer (e.g., Thermo Fisher Scientific, Shimadzu) [6] [9].
- Software: Initialize the instrument's kinetics software package.
- Parameters Setup:
- Set the monitoring wavelength (e.g., 270 nm for theophylline [7]).
- Set the total measurement time to match the expected reaction duration.
- Set the time interval between consecutive scans to capture the reaction profile adequately (e.g., one scan per second or per minute).
3. Reaction Initiation and Data Acquisition:
- Place a cuvette containing the solvent and any non-reactive components into the spectrophotometer to establish a baseline.
- Remove the cuvette and quickly add a small, known volume of the reaction initiator (e.g., one reactant, a catalyst, or a trigger). Mix rapidly and thoroughly.
- Immediately return the cuvette to the spectrophotometer and start the kinetic measurement.
- The software will automatically collect absorbance data at the set wavelength and time intervals until the measurement is complete.
4. Data Analysis:
- Export the time (t) and absorbance (A(t)) data.
- Convert absorbance to concentration ([C]) using the pre-determined calibration curve.
- Plot concentration versus time. Fit the data to different reaction order models (e.g., plot ln[C] vs. t for a first-order reaction, or 1/[C] vs. t for a second-order reaction).
- The plot that yields the best linear fit indicates the reaction order. The rate constant (k) is obtained from the slope of this linear fit.
Protocol 2: In-Line Monitoring for Pharmaceutical Content Uniformity
This protocol is adapted from a validated study using UV-Vis spectroscopy as a PAT tool for monitoring API content in tablets during continuous manufacturing [7].
1. Materials and Formulation:
- API: Theophylline monohydrate (7–13 wt%) [7].
- Excipients: Lactose monohydrate (filler/binder), Magnesium stearate (lubricant) [7].
- Equipment: Rotary tablet press, in-line UV-Vis reflectance probe with a fiber-optic connection [7].
2. Probe Integration and Measurement:
- Mount the UV-Vis probe at the tablet press ejection position, aligned to measure the sidewall of the tablets as they are ejected [7].
- Configure the system to measure in reflectance mode (R), where R = I / I₀, with I being the intensity of reflected light and I₀ the intensity of emitted light [7].
- Synchronize the spectrum acquisition with the tablet production rate (e.g., 7200 or 20,000 tablets per hour) [7].
3. Data Pre-treatment and Validation:
- Apply a data filter to exclude spectra not measured on the tablet sidewall (e.g., leading edge or back end) [7].
- To correct for baseline shifts, calculate the second derivative of the absorbance spectrum [7].
- Correlate the processed spectral data (e.g., the second derivative value at a specific wavelength) with the API concentration using a calibration model.
- Validate the method according to ICH Q2 guidelines, assessing specificity, linearity, precision (repeatability and intermediate precision), accuracy, and range [7].
The following workflow diagram illustrates the logical sequence of a general UV-Vis kinetics experiment, from setup to data analysis:
Data Presentation and Analysis
The following table summarizes quantitative data from a study that validated UV-Vis for in-line content uniformity monitoring, demonstrating its performance against regulatory standards [7].
Table 2: Validation Results for In-Line UV-Vis Monitoring of Theophylline Tablets (according to ICH Q2) [7]
| Validation Parameter | Result (Throughput: 7200 tablets/h) | Result (Throughput: 20,000 tablets/h) |
|---|---|---|
| Specificity | Proven for the model formulation | Proven for the model formulation |
| Linearity (Coefficient of Determination, R²) | 0.9891 | 0.9936 |
| Repeatability (Coefficient of Variation, CV) | Maximum of 6.46% | Similar or better accuracy |
| Intermediate Precision (CV) | Maximum of 6.34% | - |
| Accuracy (Mean Percent Recovery) | Sufficient | Higher accuracy than lower throughput |
For researchers quantifying specific biomolecules like hemoglobin (Hb) in complex formulations such as hemoglobin-based oxygen carriers (HBOCs), the choice of UV-Vis method is critical. A 2024 comparative study identified the most reliable methods, as summarized below [10].
Table 3: Comparison of UV-Vis Methods for Hemoglobin Quantification [10]
| Quantification Method | Basis of Method | Key Finding / Recommendation |
|---|---|---|
| Sodium Lauryl Sulfate (SLS)–Hb | Hb-specific | Preferred method due to specificity, ease of use, cost-effectiveness, and safety. |
| Cyanmethemoglobin (CN-Hb) | Hb-specific | Involves the use of toxic potassium cyanide, posing a safety risk. |
| Bicinchoninic Acid (BCA) Assay | Non-specific (general protein) | Accuracy can be compromised if other proteins are present in the sample. |
| Coomassie Blue (Bradford) Assay | Non-specific (general protein) | Accuracy can be compromised if other proteins are present in the sample. |
| Absorbance at 280 nm (Abs280) | Non-specific (general protein) | Accuracy can be compromised if other proteins are present in the sample. |
The Scientist's Toolkit: Essential Research Reagents and Materials
The following table lists key reagents, materials, and instruments essential for experiments involving UV-Vis spectroscopy for reaction monitoring.
Table 4: Essential Research Reagents and Solutions
| Item | Function / Application |
|---|---|
| Cuvette-based UV-Vis Spectrophotometer | The core instrument for measuring light absorption by samples in solution [6]. |
| Quartz Cuvettes | Sample holders for UV-Vis measurements; transparent to ultraviolet and visible light. |
| In-line Reflectance Probe | For non-invasive, in-line measurements in PAT applications, such as on a tablet press [7]. |
| Theophylline Monohydrate | A model API used in validation studies for pharmaceutical content uniformity [7]. |
| Sodium Lauryl Sulfate (SLS) | A reagent used in the specific, safe, and recommended SLS-Hb method for hemoglobin quantification [10]. |
| Potassium Cyanide (KCN) | A toxic reagent used in the traditional cyanmethemoglobin (CN-Hb) method for Hb quantification [10]. |
| High-Performance Computing (HPC) Resources | Used for large-scale data processing, such as that from text-mined spectral databases or high-throughput computational screening [11]. |
Advanced Topics and Future Outlook
The field of UV-Vis spectroscopy is being advanced by integration with text-mining and computational techniques. For instance, automated tools like ChemDataExtractor can mine vast scientific literature to create large-scale databases of experimental UV/vis absorption maxima (λmax) and extinction coefficients (ϵ) [11]. These experimental datasets can be paired with high-throughput quantum-chemical calculations (e.g., using density functional theory) to predict optical properties and validate computational methods, paving the way for data-driven materials discovery [11].
Furthermore, the latest instrumentation developments focus on both laboratory and field applications. Recent product introductions include robust handheld and portable UV-vis-NIR instruments with features like real-time video and GPS for field documentation, as well as sophisticated laboratory systems with enhanced software to assure properly collected data [9]. The ongoing innovation in hardware, coupled with the growing power of data science, ensures that UV-Vis spectroscopy will remain an indispensable tool in the kinetic analysis and reaction monitoring toolkit for the foreseeable future.
Fourier Transform-Infrared (FT-IR) and Raman spectroscopy are two cornerstone techniques in the vibrational spectroscopist's toolkit, providing a powerful, complementary approach for probing molecular bonds and functional group transformations. Their combined application delivers a more complete vibrational characterization of solid and liquid materials without destruction or modification, making them indispensable for monitoring chemical reactions in fields ranging from drug development to materials science [12]. The fundamental difference between the techniques lies in their underlying mechanisms: FT-IR spectroscopy measures the absorption of infrared light by molecular bonds that undergo a change in dipole moment, while Raman spectroscopy relies on the inelastic scattering of light from molecules that experience a change in polarizability [13]. This difference in selection rules means that bands strong in one measurement tend to be weak in the other, making the techniques highly synergistic [12].
This article provides detailed application notes and protocols for researchers leveraging these techniques to monitor chemical reactions, with a specific focus on practical implementation, data interpretation, and integration into research workflows.
Fundamental Principles and Complementary Nature
The complementary relationship between FT-IR and Raman spectroscopy arises from their distinct physical bases for detecting molecular vibrations. FT-IR spectroscopy is highly sensitive to heteronuclear functional group vibrations and polar bonds, making it particularly effective for detecting groups like C=O, O-H, and N-H. In contrast, Raman spectroscopy excels at detecting vibrations of homonuclear molecular bonds, such as C-C, C=C, and C≡C in carbon allotropes, as well as symmetric ring breathing modes [14] [13]. This complementarity is vividly illustrated in the analysis of polymers like silicone (polydimethylsiloxane), where certain vibrational modes appear strongly in the Raman spectrum but are weak or absent in the FT-IR spectrum, and vice versa [12].
Another practical distinction is their different spectral ranges. While FT-IR spectra typically start at 400-650 cm⁻¹, Raman spectroscopy can access the important low-frequency region down to 50-150 cm⁻¹, where metal oxides and other inorganic materials exhibit characteristic bands [12]. Furthermore, the techniques differ in their sample handling requirements and potential interferences. Raman spectroscopy generally requires little to no sample preparation but can suffer from fluorescence interference. FT-IR, while less prone to fluorescence, has constraints on sample thickness, uniformity, and dilution to avoid signal saturation [13].
Table 1: Fundamental Comparison of FT-IR and Raman Spectroscopy
| Parameter | FT-IR Spectroscopy | Raman Spectroscopy |
|---|---|---|
| Physical Principle | Absorption of IR light | Inelastic scattering of light |
| Selection Rule | Change in dipole moment | Change in polarizability |
| Key Strengths | Sensitive to polar functional groups (OH, C=O, NH) | Excellent for non-polar bonds (C-C, C=C, S-S) |
| Spectral Range | Typically 4000 - 400 cm⁻¹ | Typically 4000 - 50 cm⁻¹ |
| Water Compatibility | Strong absorber, problematic for aqueous samples | Weak scatterer, suitable for aqueous samples |
| Primary Interference | Signal saturation from strong absorbers | Fluorescence from impurities or sample itself |
| Typical Sample Preparation | Constraints on thickness/dilution; ATR common | Minimal to none required |
Applications in Monitoring Chemical Reactions and Transformations
The FT-IR/Raman combination provides powerful insights into chemical reactions across diverse fields. The following sections detail specific applications with experimental data.
Battery Research and Development
In lithium-ion battery research, these techniques are invaluable for characterizing components and understanding degradation mechanisms. FT-IR spectroscopy is widely used to characterize reactive materials like lithium salts, monitor their degradation over time, and study reaction rates in different environments. For instance, a time-series FT-IR study of lithium hexafluorophosphate (LiPF₆) clearly showed the decrease of a characteristic shoulder near 820 cm⁻¹, indicating the compound's decomposition [14]. Raman spectroscopy, meanwhile, is particularly adept at analyzing carbon allotropes used in anodes, distinguishing between graphite and carbon black, and mapping their spatial distribution. Ex situ Raman analysis of anode cross-sections has revealed dramatic differences in coating composition on opposite sides of a copper current collector, with one side dominated by carbon black and the other by the active graphite phase—a heterogeneity that could be missed by single-point measurements [14].
Table 2: Selected Use Cases in Battery Technology
| Research Challenge | Preferred Technique | Application and Solution |
|---|---|---|
| Profile battery components ex situ | Raman | Raman imaging consolidates measurements across an area or cross-section, capturing spatial variability [14]. |
| Trace anode composition across cycles | Raman | In situ monitoring of changes on electrode surfaces during charge/discharge cycles [14]. |
| Characterize lithium & reactive salts | FT-IR | Compact FT-IR instruments can be placed inside argon-purged glove boxes for analysis [14]. |
| Map degradation of SEI layer | Raman | Visualizing changes to electrode materials and component distributions after cell use [14]. |
| Monitor battery off-gassing | FT-IR | Gas-phase FT-IR can quantify release of HF and other gases under hazardous conditions [14]. |
Polymerization Reaction Monitoring
Photopolymerization reactions, crucial in industries from 3D printing to adhesives, require fast, reliable monitoring techniques. FT-IR spectroscopy has emerged as a key method for real-time tracking of these rapid processes, providing both qualitative and quantitative information on reaction progress and kinetics [15]. The ability to monitor the disappearance of monomer functional groups and the appearance of polymer signals allows researchers to determine conversion rates and optimize reaction conditions. Time-resolved FT-IR can achieve remarkable temporal resolution, collecting complete spectra within 10 milliseconds in rapid-scan mode, and even reaching nanosecond resolution for repetitive reactions using step-scan mode [16]. This capability is essential for controlling ultrafast photopolymerization processes where conversion from liquid monomer to cross-linked polymer occurs in seconds.
Catalysis Studies
In catalysis research, the FT-IR/Raman combination provides comprehensive information under "Operando" conditions (where catalysis controls reactions). FT-IR spectroscopy is particularly sensitive to organic reactants and products, while Raman spectroscopy is most informative about the state of the catalytic surface itself [12]. For example, researchers have used FT-IR to monitor the conversion of methanol on a Mo/Al₂O₃ catalyst, tracking the evolution of species like dimethyl ether, dimethoxymethane, formaldehyde, formic acid, and water by following characteristic CH stretching bands [12]. By correlating this spectroscopic data with temperature, pressure, and mass spectrometry data, scientists can develop a complete understanding of catalytic processes.
Nanomaterial Characterization
FT-IR spectroscopy plays a critical role in characterizing green-synthesized nanoparticles, where it helps identify functional groups responsible for the reduction, capping, and stabilization of metal and metal oxide nanoparticles [17]. The technique can detect characteristic absorption peaks from biomolecules (from plant or microbial extracts) that facilitate nanoparticle formation and stabilization. While pure metals themselves don't produce significant FT-IR spectra due to their metallic bonds, the technique is excellent for characterizing molecular adsorbates on metal particles and the capping agents that stabilize them [17].
Experimental Protocols
Protocol: Combined FT-IR/Raman Analysis of Polymer Composites
Objective: To completely characterize the molecular composition and structure of a polymer composite material, including filler identification.
Materials & Equipment:
- FT-IR spectrometer with microscope (ATR objective recommended)
- Raman spectrometer with microscope (standard refractive optics)
- Polymer composite sample
Procedure:
- Sample Preparation: Present a flat, clean surface of the polymer composite. For FT-IR, ensure good contact with the ATR crystal. For Raman, minimal preparation is needed.
- FT-IR Analysis:
- Raman Analysis:
- Focus on the same sample region analyzed by FT-IR.
- Set spectral range to 4000-100 cm⁻¹.
- Use appropriate laser wavelength to minimize fluorescence.
- Acquire spectrum, noting the low-frequency region (350-700 cm⁻¹) for filler identification [12].
- Data Interpretation:
- Correlate strong IR bands (Amide II at ~1550 cm⁻¹) with strong Raman bands (CH stretches).
- Identify fillers (e.g., TiO₂ anatase by bands at 350-700 cm⁻¹) in the Raman spectrum that are invisible to FT-IR [12].
- Map component distribution using hyperspectral Raman imaging if heterogeneity is suspected.
Protocol: In Situ Monitoring of Photopolymerization by FT-IR
Objective: To monitor the real-time progress of a photopolymerization reaction by tracking the disappearance of monomer functional groups.
Materials & Equipment:
- FT-IR spectrometer with rapid-scan capability
- Reaction cell with IR-transparent windows or ATR crystal
- UV/visible light source for initiation
- Monomer/photoinitiator mixture
Procedure:
- Experimental Setup:
- Place reaction mixture in contact with the ATR crystal or between IR-transparent windows.
- Position the light source to uniformly illuminate the sample while collecting IR spectra.
- Data Collection:
- Establish a time-resolved method with a spectral acquisition time of 10 ms or less if possible [16].
- Begin collecting background spectra.
- Initiate polymerization by turning on the light source while continuously collecting spectra.
- Monitor specific vibrational bands associated with the reactive functional group (e.g., C=C stretch at ~1640 cm⁻¹ for acrylates).
- Data Analysis:
- Plot the intensity or area of the monitored band as a function of time.
- Calculate conversion using the formula: Conversion (%) = [1 - (Aₜ/A₀)] × 100, where A₀ is the initial band area and Aₜ is the area at time t.
- Generate kinetic profiles to determine induction time, polymerization rate, and final conversion [15].
The Scientist's Toolkit: Essential Research Reagents and Materials
Table 3: Key Reagents and Materials for FT-IR/Raman Experiments
| Item | Function/Application |
|---|---|
| ATR Crystals (Diamond, ZnSe) | Enables minimal sample preparation for FT-IR; diamond is durable for solids, ZnSe provides good spectral range [12] [18]. |
| Lithium Salts (LiPF₆) | Reactive battery electrolyte components; require characterization in inert atmosphere [14]. |
| Deuterated Triglycine Sulfate (DTGS) Detector | Standard room-temperature detector for FT-IR; robust for routine analysis. |
| Mercury-Cadmium-Telluride (MCT) Detector | Cooled detector for FT-IR; offers higher sensitivity and faster response than DTGS. |
| Charge-Coupled Device (CCD) Detector | Standard detector for modern Raman spectroscopy; offers high sensitivity and low noise [12]. |
| Holographic Notch Filter | Critical optical component in Raman spectrometers; efficiently blocks elastically scattered laser light [12]. |
| Argon-Filled Glove Box | Essential for preparing and analyzing air-sensitive samples (e.g., battery components) [14]. |
| Sealed Transfer Cells | Allows safe transport of air-sensitive samples from glove box to spectrometer [14]. |
| Silver Halide Optical Fibers | Enables remote monitoring by connecting FT-IR spectrometer to fiber-optic ATR probes [18]. |
Workflow and Data Analysis Visualization
Nuclear Magnetic Resonance (NMR) spectroscopy stands as a powerful, non-destructive analytical technique that provides unparalleled insight into molecular structure, dynamics, and interactions in solution. Its unique capability to deliver atomic-resolution information in real-time makes it exceptionally valuable for monitoring chemical reactions and elucidating conformational changes as they occur [19] [20]. For researchers and drug development professionals, understanding reaction pathways and intermediate states is crucial for optimizing synthetic routes, designing catalysts, and developing new pharmaceutical compounds. Unlike many analytical methods, NMR spectroscopy is inherently quantitative and non-biased, with signal strength directly proportional to the concentration of the species, allowing for precise kinetic studies without requiring chromatographic separation [21].
This application note details the principles and protocols for employing NMR spectroscopy in reaction monitoring, focusing on its ability to unravel molecular structures and conformational changes mid-reaction. We provide structured methodologies, case studies, and technical specifications to enable researchers to implement these techniques effectively in their investigative workflows.
Theoretical Background
Fundamental Principles of NMR
NMR spectroscopy exploits the magnetic properties of certain atomic nuclei. When placed in a strong external magnetic field, nuclei with a non-zero spin quantum number (I ≠ 0), such as ( ^1H ), ( ^13C ), ( ^19F ), and ( ^31P ), can adopt discrete energy states [19] [20]. The fundamental equation governing the energy difference (ΔE) between these states is:
[ \Delta E = \frac{\mu B0}{I} = \gamma B0 \hbar ]
where ( \mu ) is the magnetic moment of the nucleus, ( B_0 ) is the external magnetic field strength, ( I ) is the spin quantum number, ( \gamma ) is the magnetogyric ratio (a nucleus-specific constant), and ( \hbar ) is the reduced Planck's constant [19]. This energy difference corresponds to the radiofrequency range, and the exact resonance frequency provides detailed information about the chemical environment of the nucleus.
Parameters for Structural Elucidation
The key parameters extracted from NMR spectra that are essential for structural determination and reaction monitoring include:
- Chemical Shift (δ): Expressed in parts per million (ppm), the chemical shift reflects the electronic environment of a nucleus, influenced by electron density and nearby functional groups. It is calculated relative to a standard compound (e.g., Tetramethylsilane, TMS) using the equation [19] [20]: [ \delta = \frac{ H{ref} - H{sub} }{ H_{machine} } \times 10^6 ]
- Scalar Coupling (J): This through-bond interaction between nearby nuclei splits NMR signals into multiplets (e.g., doublets, triplets). The multiplicity follows the n+1 rule, where n is the number of equivalent coupled protons, and the coupling constant J (in Hz) provides information on dihedral angles and connectivity [22] [20].
- Integration: The area under an NMR signal is directly proportional to the number of nuclei giving rise to that signal, enabling quantitative concentration measurements during reaction monitoring [22].
- Nuclear Overhauser Effect (NOE): Through-space interactions observed via NOE provide critical information for determining three-dimensional molecular structures and conformational changes [20].
Application Notes: NMR for Reaction Monitoring
In Situ Reaction Monitoring
The non-invasive nature of NMR allows for direct, in situ monitoring of chemical reactions, providing real-time data on reaction kinetics, mechanisms, and the presence of intermediates [23] [24]. Benchtop NMR systems, such as the Magritek Spinsolve, can be installed directly in fume hoods and integrated with flow reactors for online analysis [23]. This setup enables continuous pumping of the reaction mixture from the reactor to the magnet and back, allowing for autonomous, real-time optimization of reaction parameters [23].
A key application is monitoring the formation of unstable intermediates. For instance, the identification of myrmicarin alkaloids from unfractionated ant secretion was only possible through in situ 2D NMR, as these compounds decompose upon chromatographic isolation [21]. Similarly, the discovery of sulfated nucleosides in spider venom highlighted NMR's ability to detect labile components missed by other analytical techniques [21].
Protocol for Real-Time NMR Reaction Monitoring
Objective: To monitor the progress of a homogeneous organic reaction in real-time, quantifying the consumption of starting materials and the formation of products and/or intermediates.
Materials and Equipment:
- NMR spectrometer (high-field or benchtop)
- Standard NMR tube or flow cell setup
- Deuterated solvent for field-frequency lock
- Reaction components (substrates, catalysts, etc.)
Procedure:
- Sample Preparation: Dissolve the reaction substrates in a deuterated solvent directly in the NMR tube. Initiate the reaction by adding the catalyst or a second reactant directly within the tube.
- Instrument Setup: Insert the NMR tube into the spectrometer. Set the temperature using the variable temperature unit to the desired reaction temperature.
- Data Acquisition: Acquire a series of ( ^1H ) NMR spectra over time. A typical setup might use:
- A 1D ( ^1H ) pulse sequence with water suppression if necessary.
- 2-16 scans per spectrum to balance signal-to-noise with temporal resolution.
- A relaxation delay (D1) of 1-5 seconds.
- Automated, sequential acquisition over hours or days, with the time interval between spectra determined by the reaction rate.
- Data Processing and Analysis:
- Process all spectra in the series with identical parameters (e.g., Fourier transformation, phase correction, baseline correction).
- Identify signals unique to the starting material, product, and any intermediates based on their chemical shifts.
- Integrate these characteristic signals in each spectrum of the time series.
- Plot the normalized integral values against time to generate kinetic profiles for each species.
Troubleshooting:
- Broad Peaks: Can result from exchangeable protons (e.g., -OH, -NH(2)). Adding a drop of D(2)O can exchange these protons and remove their signals [22].
- Spectral Distortions: In fast reactions or with non-deuterated solvents, magnetic field homogeneity may be lost. Novel processing methods based on metrics like the Wasserstein distance can enable quantitative analysis without peak-picking [25].
- Overlapping Signals: Employ 2D NMR experiments (e.g., COSY, TOCSY) on samples taken at specific time points to resolve ambiguities in signal assignment [24] [21].
Case Study: Monitoring an Imine Formation (Schiff Base Reaction)
Imine formation is a key reaction in synthetic chemistry and biochemistry. The reaction between phenylenediamine and isobutyraldehyde in acetonitrile can be effectively monitored by ( ^1H ) NMR [23].
Experimental Workflow:
- The reaction mixture was monitored using a benchtop NMR spectrometer equipped with a flow cell.
- Sequential ( ^1H ) NMR spectra were acquired, focusing on the aromatic region.
- The decrease in the aromatic proton signals of the phenylenediamine starting material (red) and the growth of new aromatic signals corresponding to the monoimine (green) and diimine (yellow) products were tracked [23].
Findings:
- Quantitative analysis of the signal integrals over time provided concentration profiles for all three species.
- The data allowed for the determination of the reaction kinetics for both the first and second condensation steps.
- This confirmed the sequential mechanism and the stability of the monoimine intermediate under the reaction conditions [23].
The workflow for this analysis is summarized in the following diagram:
Advanced Techniques: Zero-Field NMR for Heterogeneous Reactions
A significant limitation of conventional high-field NMR is its susceptibility to signal broadening in heterogeneous mixtures, a challenge addressed by Zero- to Ultralow-Field (ZULF) NMR [26]. This technique operates in a regime where J-couplings dominate, eliminating magnetic susceptibility broadening. This allows for high-resolution spectra even in biphasic systems or when using conductive metal reactors, which are opaque to high-frequency radio waves [26].
Application Example: The two-step hydrogenation of dimethyl acetylenedicarboxylate (DMAD) with parahydrogen gas was monitored inside a titanium tube. ZULF NMR, enhanced by parahydrogen-induced polarization (PHIP), provided clear spectra of the intermediates and products (dimethyl maleate and dimethyl succinate) via their J-coupling networks, enabling reaction monitoring in a previously inaccessible setup [26].
Essential Research Reagent Solutions
Successful NMR-based reaction monitoring requires specific reagents and materials to ensure data quality and experimental consistency. The following table details key components and their functions.
Table 1: Key Research Reagents and Materials for NMR Reaction Monitoring
| Item | Function/Application | Example/Note |
|---|---|---|
| Deuterated Solvents | Provides a field-frequency lock signal; minimizes intense solvent proton signals that would otherwise obscure analyte signals. | Deuterium Oxide (D₂O) is used to suppress broad signals from exchangeable protons like -OH and -NH [22]. |
| Chemical Shift Standards | Calibrates the chemical shift scale to ensure consistency and comparability across instruments and experiments. | Tetramethylsilane (TMS) or sodium trimethylsilylpropanesulfonate (DSS) are common internal standards for ( ^1H ) NMR [19] [20]. |
| Parahydrogen (p-H₂) | Serves as a source of hyperpolarization to dramatically enhance NMR signals, enabling the detection of low-concentration intermediates or faster kinetics. | Used in techniques like Parahydrogen-Induced Polarization (PHIP), particularly in ZULF NMR for monitoring hydrogenation reactions [26]. |
| Flow Cells & Tubing | Enables online monitoring of reactions occurring in external reactors by continuously circulating the reaction mixture through the NMR spectrometer. | PTFE tubing or glass flow cells are used with benchtop NMR systems for integration with flow chemistry setups [23]. |
| Cryogenic Probes | Significantly increases spectrometer sensitivity, reducing required measurement time or sample concentration, crucial for detecting transient species. | HTS cryogenic probes have been used for "single insect NMR," analyzing nanoliter-volume natural product samples [21]. |
Quantitative Data and Spectral Interpretation
Characteristic NMR Parameters for Reaction Monitoring
Quantitative analysis of NMR spectra provides the data necessary for kinetic modeling and mechanistic studies. The table below summarizes key NMR parameters and their utility in monitoring reactions.
Table 2: Quantitative NMR Parameters for Reaction Analysis
| Parameter | Typical Values / Units | Utility in Reaction Monitoring |
|---|---|---|
| Chemical Shift (δ) | 0 - 15 ppm (for ( ^1H )) | Identifies functional groups and monitors changes in the electronic environment (e.g., due to protonation, deprotonation, or bond formation) [22] [20]. |
| Integration / Signal Area | Arbitrary units (proportional to concentration) | Provides direct quantification of species concentration over time; used to build kinetic profiles [22]. |
| Scalar Coupling Constant (J) | Hertz (Hz) | Confirms molecular connectivity and stereochemistry; can be used to distinguish between isomers formed during a reaction [22] [26]. |
| Relaxation Times (T₁, T₂) | Seconds | Informs on molecular dynamics and aggregation state; can change as reaction progresses, especially in polymerizations or with viscosity changes. |
Data Acquisition and Analysis Workflow
The process from experimental setup to kinetic analysis involves several critical steps to ensure data reliability, as shown in the following workflow:
NMR spectroscopy provides a versatile and powerful platform for monitoring chemical reactions and elucidating conformational changes in real-time. Its quantitative nature, combined with the rich structural information it provides, makes it an indispensable tool for researchers aiming to understand reaction mechanisms and kinetics. From routine in situ monitoring in standard NMR tubes to advanced applications using benchtop spectrometers with flow chemistry or ZULF NMR for heterogeneous systems, the techniques outlined in this note offer a pathway to deeper mechanistic insight. By adopting the protocols and methodologies described, scientists in drug development and chemical research can accelerate reaction optimization, identify key intermediates, and advance the understanding of complex molecular processes.
Within the broader context of spectroscopic techniques for monitoring chemical reactions, fluorescence and microwave rotational spectroscopy represent two powerful, yet fundamentally different, approaches for investigating molecular processes. Microwave rotational spectroscopy probes the pure rotational transitions of gas-phase molecules, providing unparalleled precision for determining molecular structure and identity [27] [28]. In contrast, fluorescence spectroscopy leverages the emission properties of molecules following light absorption, offering extreme sensitivity for tracking dynamics, interactions, and concentrations in diverse environments, including living cells [29] [30]. This application note details the theoretical foundations, experimental protocols, and key applications of these techniques, providing researchers and drug development professionals with practical methodologies for their implementation in reaction monitoring.
Microwave Rotational Spectroscopy
Principles and Theory
Microwave rotational spectroscopy measures the energies associated with transitions between quantized rotational energy levels of molecules in the gas phase [28]. The fundamental requirement for observing a pure rotational spectrum using microwave radiation is the presence of a permanent electric dipole moment that can interact with the electromagnetic field of the microwave photon [27] [28].
For a molecule to be rotationally active, it must have a charge separation that changes upon rotation, providing a "handle" for the microwave radiation to exert torque. Consequently, non-polar molecules such as N₂ or CH₄ (methane) do not exhibit pure rotational microwave spectra, though weak spectra for the latter can be observed due to centrifugal distortion effects [28].
The quantum mechanical treatment of a rigid rotor leads to the expression for the rotational energy levels: [E_J = J(J+1) \frac{h^2}{8\pi^2 I} = J(J+1)Bh] where J is the rotational quantum number, I is the moment of inertia, and B is the rotational constant, defined as (B = \frac{h}{8\pi^2 I}) [27]. The energy difference between adjacent rotational levels (ΔJ = +1) falls typically in the microwave region of the electromagnetic spectrum. For a rigid rotor, the transition energies increase linearly with J.
Classification of Molecular Rotors
Molecules are classified into four categories based on their moments of inertia about three principal axes, which dictates their rotational energy level structure [28]:
Table: Classification of Molecular Rotors for Rotational Spectroscopy
| Molecule Type | Moment of Inertia Relation | Examples |
|---|---|---|
| Spherical Tops | IA = IB = IC | SF6, CH4, CCl4 |
| Linear Molecules | IA << IB = IC | CO, HCN, OCS, HC≡CH |
| Symmetric Tops | IA = IB < IC or IA < IB = IC | NH3, CH3Cl |
| Asymmetric Tops | IA ≠ IB ≠ IC | H2O, NO2 |
Experimental Protocol: Chirped-Pulse Fourier Transform Microwave (CP-FTMW) Spectroscopy
Objective: To measure the broadband rotational spectrum of a gas-phase reaction mixture for component identification and quantitative analysis.
Materials and Equipment:
- CP-FTMW spectrometer
- Pulsed nozzle supersonic expansion source
- Arbitrary Waveform Generator (AWG) [31]
- High-performance real-time oscilloscope (e.g., bandwidth ≥ 8 GHz) [31]
- Vacuum chamber with pumping system
- Gas handling system for sample introduction
Procedure:
- Sample Preparation: Introduce the volatile gas-phase reaction mixture into the reservoir of the pulsed nozzle. For non-volatile species, use laser ablation or heating. Maintain a constant stagnation pressure (typically 1-10 bar) [32].
- Supersonic Expansion: Pulse the gas mixture through a small orifice into the vacuum chamber. The expansion cools the internal molecular degrees of freedom, simplifying the rotational spectrum by populating only the lowest rotational and vibrational states.
- Chirped-Pulse Excitation: Generate a microwave frequency "chirp" (a rapid, linear scan across a broad bandwidth, e.g., 2-8 GHz) using the AWG. This polarized chirp is amplified and broadcast into the vacuum chamber, exciting the rotational transitions of all molecules within the interaction region [32].
- Signal Acquisition: Following the excitation pulse, the coherently radiating molecular free induction decay (FID) is detected with a microwave antenna. The signal is amplified and digitized directly using a high-speed oscilloscope [31] [32].
- Averaging and Data Processing: Acquire a large number of FID transients (often 10⁵ to 10⁶) to improve the signal-to-noise ratio through averaging. Proprietary hardware averaging technology can significantly reduce acquisition time [31].
- Fourier Transformation: Convert the averaged time-domain FID signal into a frequency-domain power spectrum using a Fast Fourier Transform (FFT) algorithm.
- Spectral Analysis and Assignment: Fit the observed transition frequencies to a rigid rotor model to determine rotational constants (A, B, C). These constants are directly related to the molecular moments of inertia, allowing for the determination of precise molecular structures (bond lengths and angles) [28] [32].
Figure 1: Workflow for Chirped-Pulse Fourier Transform Microwave Spectroscopy.
Fluorescence Spectroscopy
Principles and Theory
Fluorescence is a specific type of photoluminescence that occurs in three distinct stages [29] [33]:
- Excitation: A photon of energy
hν_EXis absorbed by a fluorophore, promoting it to an higher electronic excited singlet state (S₁' or S₂). This process occurs in femtoseconds (10⁻¹⁵ s). - Excited-State Lifetime: The excited fluorophore undergoes rapid vibrational relaxation (picoseconds, 10⁻¹² s) to the lowest vibrational level of S₁. This state exists for a finite time, typically 1-10 nanoseconds.
- Emission: A photon of energy
hν_EMis emitted as the fluorophore returns to the ground state (S₀). Due to energy dissipation during the excited-state lifetime, the emitted photon has lower energy (longer wavelength) than the absorbed photon. This difference is known as the Stokes shift, which is fundamental for sensitivity as it allows emission to be detected against a low background, isolated from excitation light [29].
The entire process can be visualized in a Jablonski diagram, which charts the energy states and transitions of the fluorophore [29] [33].
Experimental Protocol: Fluorescence Correlation Spectroscopy (FCS) for Monitoring Binding Kinetics
Objective: To determine the diffusion coefficient and binding kinetics of a fluorescently labeled ligand (e.g., a drug candidate) to its macromolecular target (e.g., a protein receptor).
Materials and Equipment:
- Confocal fluorescence microscope or dedicated FCS instrument
- High-numerical aperture (NA) objective lens
- Pulsed or continuous-wave laser source tuned to fluorophore excitation
- High-sensitivity single-photon counting detectors (e.g., Avalanche Photodiodes)
- Data acquisition hardware and correlation software
- Coverslip-bottom dishes or chambers for sample containment
- Purified target protein and fluorescently labeled ligand
Procedure:
- Sample Preparation: Prepare a dilute solution (typically 1-100 nM) of the fluorescent ligand in an appropriate assay buffer. The high dilution is necessary to achieve a low number of molecules (typically 0.1-100) in the femtoliter observation volume [30].
- Instrument Calibration: Place a reference dye solution with a known diffusion coefficient (e.g., Rhodamine 6G) on the microscope. Focus the laser to create a diffraction-limited confocal volume. Optimize alignment and set detector parameters to minimize background.
- Data Acquisition for Ligand Alone:
- Pipette the ligand solution onto the microscope.
- Record the fluctuating fluorescence intensity
F(t)over a period of 30-60 seconds. The fluctuations arise from molecules diffusing into and out of the confocal volume, as well as from any chemical reactions that alter fluorescence [30].
- Data Acquisition for Ligand-Target Mixture: Incubate the ligand with the target protein at the desired concentration and temperature. Record the fluorescence intensity fluctuation trace
F(t)for the mixture. - Data Analysis via Autocorrelation:
- Calculate the normalized autocorrelation function
G(τ)for each intensity trace: [ G(\tau) = \frac{\langle \delta F(t) \delta F(t+\tau) \rangle}{\langle F(t) \rangle^2} ] whereδF(t) = F(t) - ⟨F(t)⟩is the fluctuation from the mean intensity, andτis the correlation time delay [30]. - Fit the autocorrelation curve to an appropriate physical model. For a single diffusing species undergoing binding:
[ G(\tau) = \frac{1}{N} (1 - Y + Y e^{- \tau / \tau{rxn}} ) \left( 1 + \frac{\tau}{\tauD} \right)^{-1} \left( 1 + \frac{\tau}{\omega^2 \tau_D} \right)^{-1/2} ]
where
Nis the average number of molecules in the volume,τ_Dis the diffusion time,ωis the structure factor (ratio of axial to radial dimensions of the volume),Yis the fraction of molecules undergoing reaction, andτ_rxnis the reaction time [30].
- Calculate the normalized autocorrelation function
- Interpretation: The measured increase in diffusion time (
τ_D) for the mixture compared to the ligand alone indicates binding to the larger, slower-diffusing target protein. The kinetic parameters (τ_rxn,Y) provide information on binding constants and populations.
Figure 2: Fluorescence Correlation Spectroscopy (FCS) Experimental Workflow.
The Scientist's Toolkit: Essential Research Reagents and Materials
Table: Key Reagent Solutions for Spectroscopic Techniques
| Item | Function / Application | Example Use-Case |
|---|---|---|
| Permanent Dipole-Containing Molecules | Essential for microwave rotational activity; enables spectral detection. | Probing reaction mechanisms of polar intermediates in gas-phase synthesis [27] [28]. |
| Stable Isotope-Labeled Precursors (e.g., ¹³C, ¹⁵N, ²H) | Allows determination of precise atomic positions in molecular structures via isotopic shifts in rotational constants. | Elucidating the binding geometry of a catalyst-substrate complex [28] [32]. |
| Supersonic Expansion Nozzle | Cools molecules to few Kelvin, simplifying spectra by collapsing populations into lowest rotational states. | Analysis of complex mixtures or weakly-bound molecular clusters [32]. |
| Fluorescent Probes / Dyes | Target-specific labels that provide a detectable fluorescence signal. | Labeling antibodies (immunofluorescence) or specific proteins in live cells [29] [33]. |
| High-Purity Buffer Solutions | Maintain biomolecular stability and function; minimize background fluorescence (scatter, impurities). | FCS measurements of protein-ligand interactions in physiological conditions [30]. |
| Fluorescent Reference Standards | Calibrate instrument response, correct for day-to-day and instrument-to-instrument variation. | Quantifying fluorescence brightness (extinction coefficient × quantum yield) in spectrofluorometry [29]. |
| Oxygen-Scavenging Systems | Reduce photobleaching and generation of reactive oxygen species that destroy fluorophores. | Prolonged time-lapse imaging or single-molecule tracking experiments [29]. |
Comparative Data and Application Scopes
Key Parameters and Figures of Merit
Table: Comparative Analysis of Spectroscopic Techniques
| Parameter | Microwave Rotational Spectroscopy | Fluorescence Spectroscopy (FCS Example) |
|---|---|---|
| Primary Information | Precise molecular structure (bond lengths/angles), dipole moment, molecular identity. | Diffusion coefficients, concentrations, kinetic rates, molecular interactions. |
| Sample Phase | Gas phase (required) [27] [28]. | Solution, solid, surface, living cells [29] [30]. |
| Sample Consumption | Minimal (pulsed gas expansion). | Minimal (µL volumes, nanomolar concentrations) [30]. |
| Sensitivity | High (can detect trace gases). | Extremely High (single-molecule detection possible) [30]. |
| Structural Specificity | Uniquely high (structures to < 0.001 Å resolution) [32]. | Low (reports on changes in size/environment, not atomic structure). |
| Temporal Resolution | Microseconds to milliseconds (CP-FTMW). | Microseconds to nanoseconds (FCS correlation times). |
| Key Limitation | Requires permanent dipole moment and volatility. | Requires a fluorescent label, potential for photobleaching [29]. |
| Primary Application in Reaction Monitoring | Identifying and characterizing transient reaction intermediates and products in the gas phase [32]. | Quantifying binding constants, aggregation, and diffusion dynamics in solution [30]. |
Microwave rotational and fluorescence spectroscopy offer complementary capabilities for monitoring chemical reactions across diverse phases and complexity scales. Microwave rotational spectroscopy stands out for its unparalleled structural specificity in identifying gas-phase molecules and intermediates, making it indispensable for fundamental reaction dynamics and astrochemistry [28] [32]. Fluorescence spectroscopy, particularly advanced forms like FCS, provides exquisite sensitivity for studying molecular dynamics and interactions in solution and biologically relevant contexts, which is crucial for drug development [29] [30]. The choice of technique is therefore dictated by the specific research question, whether it demands atomic-level structural precision or high-sensitivity probing of molecular behavior in complex environments. Used in concert, these powerful methods provide a comprehensive toolkit for elucidating reaction mechanisms from the simplest gas-phase systems to the most complex biological milieus.
From Lab to Production: Applied Spectroscopic Methods in Pharmaceutical Reactions
Inline Raman for Real-Time Monitoring of Product Aggregation and Fragmentation in Bioreactors
Within the framework of spectroscopic techniques for monitoring chemical reactions, inline Raman spectroscopy has emerged as a powerful Process Analytical Technology (PAT) for biopharmaceutical manufacturing. This application note details its specific use for the real-time monitoring of critical product quality attributes (PQAs)—namely, protein aggregation and fragmentation—during bioreactor operations. The implementation of PAT is positioned to resolve clinical, regulatory, and cost challenges simultaneously in the biopharmaceutical industry [34]. Driven by regulatory encouragements like ICH Q13 for continuous manufacturing and the principles of Quality by Design (QbD), there is a pressing need for advanced monitoring strategies that move beyond traditional offline testing, which is slow, prone to contamination, and fails to provide the dynamic data essential for proactive process control [35] [36]. Raman spectroscopy is particularly suited for this task due to its molecular specificity, minimal interference from water, and ability to non-invasively provide a molecular "fingerprint" of the complex bioreactor environment [34] [35]. This document provides a detailed protocol for implementing inline Raman to monitor product aggregation and fragmentation, complete with experimental data and validated methodologies.
Key Principles and Technological Advantages
Raman spectroscopy is a laser-based vibrational spectroscopic technique that measures inelastically scattered light to provide specific information about the molecular bonds and symmetry of molecules in a sample. For monitoring biologics, this translates to several key advantages:
- Molecular Specificity: It can distinguish between monomeric, aggregated, and fragmented protein species based on their unique spectral signatures [34] [37].
- Minimal Water Interference: Unlike infrared spectroscopy, Raman spectroscopy is not hampered by the strong absorption of water, making it ideal for aqueous bioprocess streams [34] [38].
- Non-Invasive and Real-Time Analysis: A fiber-optic probe can be inserted directly into the bioreactor or flow stream, enabling continuous, real-time monitoring without the need for manual sampling, thus reducing contamination risk and providing immediate feedback [35] [36].
- Multi-Attribute Monitoring: A single Raman probe can be calibrated to monitor multiple critical process parameters (CPPs) and PQAs concurrently, including glucose, lactate, cell density, titer, aggregation, and glycosylation [35] [37].
The term "inline" denotes that the analyzer is integrated directly into the process stream, allowing for real-time monitoring and control [39]. This is distinguished from online (analysis in an adjacent area), atline (manual sampling to a nearby instrument), and offline (analysis in a separate lab) methods [39].
Experimental Performance and Quantitative Data
Recent studies have robustly demonstrated the application of inline Raman spectroscopy for monitoring product quality attributes in various cell culture systems. The following tables summarize key quantitative findings from these investigations.
Table 1: Performance of Raman Models in Predicting Product Quality Attributes in an Intensified Perfusion Cell Culture [37]
| Product Quality Attribute | Analytical Method | Optimized Model Performance (RMSECV) | Prediction Performance in a New Bioreactor (RMSEP) |
|---|---|---|---|
| SEC Monomer | Size-Exclusion Chromatography | 0.44 % | 1.74 % |
| HMW Species (Aggregates) | Size-Exclusion Chromatography | 0.24 % | 0.90 % |
| SDS_Caliper-NR Main Peak (Fragments) | Non-reduced Microchip CE-SDS | 0.37 % | 1.88 % |
| Mannose 5 (Glycosylation) | N-glycan LC | 0.51 % | 2.79 % |
Table 2: Comparison of Regression Models for Predicting Aggregates in an Affinity Chromatography Process [34]
| Regression Model | R² (Aggregates) | MSE (Aggregates) | Key Findings |
|---|---|---|---|
| CNN (Convolutional Neural Network) | 0.91 | 0.19 | Demonstrated accurate predictions every 38 seconds; qualitatively best able to predict off-line analytical results. |
| SVR (Support Vector Regressor) | 0.22 | - | Performance was significantly lower compared to CNN. |
| k-Nearest Neighbor (KNN) | - | - | Qualitatively best able to predict product quality attributes comparable to off-line analytical results. |
The data in Table 1 confirms that Raman models, once trained, can maintain a high degree of predictability (robustness) even when applied to a new bioreactor run with modified process parameters. Table 2 highlights that advanced machine learning models like Convolutional Neural Networks (CNN) can achieve superior accuracy in predicting complex attributes like aggregation.
Detailed Experimental Protocol
This section provides a step-by-step protocol for establishing an inline Raman monitoring system for product aggregation and fragmentation in a bioreactor.
Materials and Equipment
Table 3: The Scientist's Toolkit: Essential Research Reagent Solutions and Materials
| Item | Function/Description | Example/Specification |
|---|---|---|
| Raman Spectrometer System | The core analytical instrument for excitation and detection. | System with a 785 nm laser [35] [37]; ProCellics Raman Analyzer is an example of a commercially available bioprocess-suited system [35]. |
| Fiber-Optic Raman Probe | Transmits laser light to the sample and collects scattered light. Must be sterilizable. | Immersion probe rated for in-situ use; sapphire ball lens probes are suitable for optically dense media [40]. |
| Bioreactor System | The environment for the cell culture process. | Stirred-tank bioreactor (single-use or stainless steel) with appropriate ports for probe insertion [36]. |
| Calibration Samples | Samples with known analyte concentrations for model development. | Cell culture fluid fractions with characterized aggregation/fragmentation levels via reference methods [34]. |
| Automated Sampling System (Optional) | For automated sample collection to pair with off-line analytics. | Liquid handling robotics (e.g., Tecan system) to increase calibration data throughput [34]. |
| Data Analysis Software | For spectral preprocessing, chemometric model building, and prediction. | Software with PLS, CNN, or other regression algorithms; examples include Bio4C PAT Raman Software, RamanMetrix, or custom code in MATLAB/Python [34] [35] [40]. |
Step-by-Step Workflow
Step 1: System Setup and Integration Integrate the sterilized Raman probe directly into the bioreactor, ensuring it is immersed in the culture broth. For downstream unit operations like affinity chromatography, the probe can be installed in the flow path using appropriate fittings or a clip-on adapter for tubes [34] [38]. Connect the probe to the spectrometer and ensure all control and data acquisition software is operational.
Step 2: Calibration Sample Generation Execute a representative bioreactor run (e.g., perfusion or fed-batch). Collect multiple samples over the course of the run to capture process variability. To maximize the diversity and number of calibration points without exponentially increasing offline analytical load, employ a robotic mixing strategy. For example, mix adjacent elution fractions from a chromatography step in different proportions to generate a large set of calibration samples with varying levels of aggregates and fragments [34]. One study generated 169 calibration points from 25 original fractions using this method [34].
Step 3: Reference Analysis Analyze all collected calibration samples using the reference analytical methods for the target PQAs. For aggregation, use Size-Exclusion Chromatography (SEC). For fragmentation, use non-reduced Capillary Electrophoresis (CE-SDS or SDS_Caliper-NR) [37]. This provides the "ground truth" data that the Raman spectra will be correlated against.
Step 4: Spectral Preprocessing Collect Raman spectra for all calibration samples. Implement a preprocessing pipeline to remove noise and irrelevant signal variations. A typical pipeline may include:
- High-pass filtering (e.g., a digital Butterworth filter) to remove low-frequency background fluorescence [34].
- Baseline correction (e.g., using asymmetrically reweighted Penalized Least Squares algorithm) to subtract fluorescent offsets [38].
- Standard Normal Variate (SNV) transformation or derivative filters (Savitzky-Golay) to minimize baseline effects and enhance spectral features [37] [41].
- Normalization (e.g., to an internal sapphire peak at 418 cm⁻¹ or the total spectrum) to account for instrumental variations [34].
Step 5: Chemometric Model Training Correlate the preprocessed Raman spectra with the reference analytical data using multivariate regression techniques. The most common method is Partial Least Squares (PLS) regression [37]. For improved accuracy, explore advanced machine learning models like Convolutional Neural Networks (CNN) or Support Vector Machines (SVM) [34] [40]. The dataset should be split into training and testing sets to validate model performance and avoid overfitting. The model is optimized by selecting specific Raman shift ranges (e.g., 800-1800 cm⁻¹) and preprocessing parameters [37].
Step 6: Real-Time Prediction and Monitoring Once the model is validated, deploy it for real-time monitoring of new bioreactor runs. The software continuously acquires Raman spectra, applies the same preprocessing steps, and uses the calibrated model to predict and report the concentrations of aggregates and fragments in near real-time (e.g., every 38 seconds) [34]. This data can be used for advanced process understanding and control.
Data Processing and Modeling Pathway
The transformation of raw spectral data into actionable information involves a critical, multi-step computational pathway, as illustrated below.
The integration of inline Raman spectroscopy represents a significant advancement in the spectroscopic monitoring of bioprocesses. It shifts the paradigm from reactive, offline quality testing to proactive, real-time quality assurance. The ability to monitor critical quality attributes like aggregation and fragmentation every 38 seconds provides an unprecedented window into the bioreactor, enabling scientists to better understand process dynamics and intervene promptly if parameters drift from their desired ranges [34].
Successful implementation requires careful attention to calibration design. The use of automated systems to generate large, diverse calibration datasets is highly recommended to build robust models [34]. Furthermore, the choice of data preprocessing and regression algorithms is critical; while PLS remains a workhorse, machine learning approaches like CNNs are demonstrating superior predictive accuracy for complex attributes [34].
In conclusion, inline Raman spectroscopy is a versatile and powerful PAT tool that aligns perfectly with the QbD and continuous manufacturing initiatives in the modern biopharmaceutical industry. The detailed protocols and data presented in this application note provide a roadmap for researchers and drug development professionals to implement this technology, thereby enhancing process control, ensuring consistent product quality, and accelerating development timelines.
FT-IR with Hierarchical Cluster Analysis for Drug Stability Studies and Solid-State Characterization
Fourier Transform Infrared (FT-IR) spectroscopy, when coupled with Hierarchical Cluster Analysis (HCA), provides a powerful, non-destructive analytical framework for assessing drug stability and solid-state characteristics. This application note details protocols for using this combined approach to detect drug-excipient interactions and monitor solid-state transformations under stressed conditions. Within the broader context of spectroscopic techniques for monitoring chemical reactions, this methodology offers researchers a rapid, cost-effective tool for formulation development and stability testing, supported by robust chemometric validation.
In pharmaceutical development, ensuring the stability of an Active Pharmaceutical Ingredient (API) in its final formulation is paramount. Pharmaceutical excipients, though theoretically inert, can interact with APIs, affecting the drug's efficacy, chemical stability, and safety profile [42]. Such interactions are often accelerated by environmental stressors like temperature and humidity.
FT-IR spectroscopy probes molecular vibrations, providing a unique "chemical fingerprint" for compounds [43] [44]. Modern FT-IR instruments, particularly those using Attenuated Total Reflectance (ATR) accessories, enable rapid analysis of solids and liquids with minimal sample preparation [44]. However, interpreting subtle spectral changes in complex mixtures is challenging. This is where Hierarchical Cluster Analysis (HCA), an unsupervised chemometric technique, adds immense value by objectively classifying samples based on their spectral similarity, thus identifying potential incompatibilities that may not be visible to the naked eye [42] [45]. This document outlines standardized protocols for applying FT-IR with HCA to drug stability and characterization studies.
Key Applications and Case Studies
The FT-IR/HCA combination has been successfully applied across various pharmaceutical research scenarios, demonstrating its versatility and robustness.
Drug-Excipient Compatibility Screening
A primary application is screening for API-excipient interactions during pre-formulation.
- Linagliptin Compatibility: A 2022 study investigated the antidiabetic drug linagliptin (LINA) mixed with four excipients: lactose (LAC), mannitol (MAN), magnesium stearate (MGS), and polyvinylpyrrolidone (PVP). Binary mixtures were stored under stressed conditions (60°C, 70% relative humidity) and analyzed using DSC, FT-IR, and NIR spectroscopy. Chemometric analysis via PCA and HCA revealed that all tested excipients showed some degree of interaction with LINA. Some interactions were evident even without stressing, while others manifested only under high-temperature/high-humidity conditions. HCA successfully grouped samples based on their stability profiles, underscoring the importance of excipient selection for LINA formulation stability [42] [46].
- Timolol, Naphazoline, and Diflunisal Stability: A 2025 study extended this approach to three other APIs—timolol (TIM), naphazoline (NAPH), and diflunisal (DIF)—in mixtures with five excipients, including MAN and PVP. The samples were subjected to forced degradation (70°C/80% RH). A hybrid approach, combining visual assessment of FT-IR/ATR and NIR spectra with PCA and HCA evaluation, enabled the detection of changes that were not clearly observable using a single method. The study clearly identified interactions of TIM, NAPH, and DIF with MAN and TRIS (Tris HCl) [47].
Detection of Adulterants and Illicit Substances
The methodology is also critical for forensic and quality control applications.
- Ecstasy Profiling: ATR-FTIR spectroscopy with HCA was used to profile ecstasy tablets and their adulterants. HCA of the spectral data resulted in the formation of two primary clusters: one predominantly containing MDA and MDMA samples, and a second cluster containing cocaine, methamphetamine, and caffeine. This demonstrated the technique's power in the precise classification of illicit substances and their common cutting agents [45].
- Herbal Product Adulteration: FT-IR-ATR with PCA and HCA was developed as a screening method to detect synthetic drugs (metamizole, diclofenac sodium, and prednisone) adulterating herbal products (Jamu). The PCA results showed clear differentiation between unadulterated herbal products and those mixed with synthetic drugs, providing a fast and efficient quality control check [48].
Experimental Protocols
Protocol 1: Drug-Excipient Compatibility Study
This protocol is adapted from published studies on linagliptin and timolol [42] [47].
1. Sample Preparation:
- Prepare binary mixtures of the API with each excipient under investigation in a 1:1 ratio (w/w).
- Include control samples of pure API and pure excipients.
- Subject the mixtures and controls to stressed conditions (e.g., 60-70°C, 70-80% Relative Humidity) for a predetermined period (e.g., 1-4 weeks). Store reference samples under ambient conditions.
2. FT-IR Data Acquisition:
- Instrument: FT-IR spectrometer with an ATR accessory (diamond crystal is recommended for its robustness).
- Settings: Resolution: 4 cm⁻¹; Number of scans: 32; Spectral range: 4000–650 cm⁻¹ [48] [47].
- Procedure: Place a small amount of each sample on the ATR crystal and ensure good contact. Acquire spectra in absorbance mode. Clean the crystal thoroughly with a suitable solvent (e.g., acetone) between samples. Record a background spectrum before each sample measurement or whenever the environment changes [43] [44].
3. Data Pre-processing and HCA:
- Pre-processing: Export the spectral data. Perform pre-processing steps such as Standard Normal Variate (SNV), multiplicative scatter correction (MSC), or derivatives (e.g., Savitzky–Golay first derivative) to minimize the effects of light scattering and baseline drift.
- Analysis: Input the pre-processed spectral data (or a selected, informative spectral range) into a chemometric software package. Perform HCA using a suitable distance metric (e.g., Euclidean distance) and linkage method (e.g., Ward's linkage). The output is a dendrogram that visually represents the clustering of samples based on spectral similarity.
Protocol 2: Real-Time Reaction Monitoring
This protocol utilizes specialized equipment for monitoring reactions in situ [49].
1. Setup:
- Instrument: Configure an FT-IR spectrometer (e.g., JASCO VIR-200) equipped with a fiber optic interface and an immersion ATR probe (e.g., with a ZnSe prism).
- Calibration: Insert the probe into the reaction vessel and ensure it is immersed in the reaction mixture. Collect a background spectrum under initial reaction conditions.
2. Data Acquisition:
- Settings: Use rapid-scan mode to collect spectra at short intervals (e.g., every 80 ms to several seconds) over the course of the reaction.
- Monitoring: The software will collect time-resolved spectra, showing intensity changes at specific wavenumbers corresponding to the disappearance of reactants and appearance of products.
3. Data Analysis:
- Trend Analysis: Plot the intensity of characteristic absorption bands (e.g., C=O stretch, O-H stretch) against time to visualize reaction kinetics.
- Multivariate Analysis: Subject the collected spectral data set to HCA to identify distinct phases of the reaction or to cluster different reaction batches based on their spectral progression.
The Scientist's Toolkit
Table 1: Essential Research Reagent Solutions and Materials
| Item | Function & Application Notes |
|---|---|
| FT-IR Spectrometer with ATR | The core instrument. ATR accessories require minimal sample prep and are ideal for solids and liquids. Diamond ATR crystals are durable and chemically resistant [44]. |
| Chemometric Software | Software capable of performing HCA and PCA (e.g., R, Python with scikit-learn, or commercial packages) is essential for objective, multivariate data analysis [42]. |
| Forced Degradation Chamber | An environmental chamber to apply stressors like controlled temperature and humidity, accelerating potential drug-excipient interactions [42] [47]. |
| Fiber Optic ATR Probe | For real-time, in-situ monitoring of reactions. Allows the probe to be immersed directly into a reaction vessel [49]. |
| Potassium Bromide (KBr) | For traditional transmission FT-IR, where solid samples are ground and pressed into pellets with KBr. Less common with the prevalence of ATR [44]. |
Workflow and Data Analysis Visualization
The following diagram illustrates the logical workflow for a typical FT-IR/HCA drug stability study, from sample preparation to data interpretation.
Figure 1: Experimental and Data Analysis Workflow for FT-IR/HCA Stability Studies.
Data Presentation and Interpretation
The following table summarizes quantitative data from a representative drug-excipient compatibility study, illustrating the type of results generated by this methodology.
Table 2: Exemplary Data from a Drug-Excipient Compatibility Study [42] [47]
| API | Excipient | Stress Condition | Key Spectral Changes (FT-IR) | HCA Cluster Result | Conclusion |
|---|---|---|---|---|---|
| Linagliptin (LINA) | Lactose (LAC) | 60°C / 70% RH | Changes in C=O and O-H stretching regions | Stressed mixture clustered separately from non-stressed | Interaction confirmed |
| Linagliptin (LINA) | Polyvinylpyrrolidone (PVP) | 60°C / 70% RH | Shift in amine N-H stretch | Stressed mixture clustered separately from non-stressed | Interaction confirmed |
| Timolol (TIM) | Mannitol (MAN) | 70°C / 80% RH | n/a | Stressed mixture clustered separately from controls | Interaction confirmed |
| Naphazoline (NAPH) | Tris HCl (TRIS) | 70°C / 80% RH | n/a | Stressed mixture clustered separately from controls | Interaction confirmed |
Interpreting the HCA Dendrogram: The primary output of HCA is a dendrogram. Samples that are spectrally similar cluster together at the tips of the tree. A large distance between clusters (a long branch point) indicates significant spectral differences and, therefore, a high likelihood of a chemical interaction or instability. A successful, stable formulation will typically see the stressed binary mixture cluster closely with the non-stressed pure API and excipient controls. In contrast, an incompatible mixture will form a distinct, separate cluster.
UV-Vis as a Process Analytical Technology for Optimizing Chromatography in mAb Purification
Within the framework of a broader thesis on spectroscopic techniques for monitoring chemical reactions, this document details the application of Ultraviolet-Visible (UV-Vis) spectroscopy as a Process Analytical Technology (PAT) for optimizing chromatography in monoclonal antibody (mAb) purification. The biopharmaceutical industry is increasingly adopting PAT and Quality by Design (QbD) principles to enhance process understanding, control, and real-time quality assurance [50] [51]. PAT enables the design, analysis, and control of manufacturing through timely measurements of critical quality attributes and process parameters [50].
UV-Vis spectroscopy is a powerful analytical technique that measures the absorption of discrete wavelengths of UV or visible light by a sample. The measured absorbance is directly proportional to the concentration of absorbing species in the sample, as described by the Beer-Lambert law [52]. This property, combined with its non-destructive nature, rapid data acquisition, and cost-effectiveness, makes it an ideal tool for real-time monitoring of chromatographic processes [51]. This application note provides detailed protocols and data for implementing UV-Vis-based PAT to optimize the critical Protein A affinity chromatography step in mAb purification, with a specific focus on enhancing separation from host cell proteins (HCPs) and controlling the load phase.
Theoretical Background and Principles
UV-Vis Spectroscopy Fundamentals
UV-Vis spectroscopy functions on the principle that molecules absorb light in the ultraviolet (typically 200-400 nm) and visible (400-780 nm) regions of the electromagnetic spectrum. This absorption promotes electrons from their ground state to a higher energy, excited state [52] [53]. The wavelength at which absorption occurs and the intensity of that absorption are characteristic of the specific molecular structure and its concentration, respectively.
The primary relationship governing quantitation in UV-Vis spectroscopy is the Beer-Lambert Law: A = ε * c * l Where:
- A is the measured Absorbance (no units)
- ε is the molar absorptivity (L·mol⁻¹·cm⁻¹)
- c is the concentration of the analyte (mol·L⁻¹)
- l is the path length of the light through the sample (cm) [52]
Proteins, including mAbs, absorb UV light primarily due to their aromatic amino acids (tryptophan, tyrosine, and phenylalanine), with a characteristic absorption maximum at 280 nm. This property is leveraged for the quantification of mAbs in solution [52] [51].
PAT in mAb Purification
In chromatographic mAb purification, PAT serves to move quality control from offline, batch-end testing to inline, real-time monitoring. This paradigm shift allows for dynamic process control, such as terminating a column load based on product breakthrough or making real-time pooling decisions during elution to maximize yield and purity [50] [54]. The workflow for implementing a PAT control strategy is logically sequenced as follows:
Application Note: UV-Vis for Monitoring and Optimizing Protein A Chromatography
Real-time Monitoring of mAb and Host Cell Proteins (HCPs)
Objective: To utilize in-line UV-Vis monitoring at 280 nm and 410 nm to optimize the elution phase of Protein A affinity chromatography for maximizing mAb recovery while minimizing HCP content [51].
Background: HCPs are critical impurities that can co-elute with mAbs during Protein A chromatography. A previous study established that the absorbance peak area at 410 nm is directly proportional to HCP concentration, as measured by ELISA [51]. This correlation allows for real-time, non-destructive estimation of HCP levels.
Key Quantitative Findings: The correlation between UV-Vis signal and analyte concentration was robust. The table below summarizes the key performance data from the application of this PAT tool [51].
Table 1: Performance Data for UV-Vis-based Monitoring of mAb and HCPs
| Parameter | mAb (A₂₈₀) | HCP (A₄₁₀) |
|---|---|---|
| Correlation with Reference Method | Direct quantitation via Beer-Lambert Law | Direct proportionality to ELISA (R² = 0.9505) |
| Optimal Load Volume | 12 Column Volumes (CV) | - |
| Optimal Elution pH | pH 3.5 | - |
| Optimal Collection Start Point | 0.5 CV into elution peak | - |
| Resulting mAb Recovery | 95.92% | - |
| Additional HCP Removal | - | 49.98% compared to whole elution pool |
Protocol: Optimization of mAb Elution from Protein A Chromatography
The Scientist's Toolkit: Essential Materials and Reagents
| Item | Function / Specification | Justification |
|---|---|---|
| Chromatography System | ÄKTA explorer or equivalent, with built-in or external DAD | System capable of precise buffer delivery and in-line UV monitoring [51]. |
| Protein A Column | Prepacked column (e.g., Praesto Jetted A50) | High-affinity capture step for mAbs [55] [51]. |
| Clarified Cell Culture Fluid | Contains mAb (~0.5 mg/mL) and HCPs | The process feedstock for the capture step [51]. |
| Equilibration Buffer | 25 mM Tris, 0.1 M NaCl, pH 7.4 | Prepares the column for sample loading [54]. |
| Elution Buffer | 20 mM Citric Acid, pH 3.5 | Disrupts Protein A-mAb binding; low pH is critical for elution [54] [51]. |
| In-line Diode Array Detector (DAD) | UV-Vis flow cell (e.g., 0.4 mm pathlength) | Enables real-time acquisition of full spectra during the process [54]. |
Experimental Workflow:
Step-by-Step Procedure:
- System Setup: Connect the in-line DAD downstream of the chromatography column outlet. Configure the software to monitor and record absorbance at 280 nm and 410 nm simultaneously throughout the run.
- Equilibration: Equilibrate the Protein A column with at least 5 CV of Equilibration Buffer until a stable UV baseline is achieved.
- Loading: Load 12 CV of clarified cell culture fluid onto the column at a specified flow rate. Unbound proteins and impurities are washed to waste.
- Elution and Monitoring: Initiate elution with Elution Buffer (pH 3.5). The DAD acquires real-time absorbance data as the mAb and residual HCPs are eluted from the column.
- Fraction Collection: Begin collecting 0.1 CV fractions once the UV signal at 280 nm starts to increase (typically at 0.5 CV into the elution peak).
- Data Analysis and Optimization: Calculate the peak area at 280 nm (mAb) and 410 nm (HCP) for each fraction. Compare these values to identify the elution window that provides the optimal balance of high mAb recovery and low HCP content. The optimal conditions were found to be a 12 CV load, elution at pH 3.5, and starting the collection at 0.5 CV into the peak [51].
Real-time Control of the Load Phase Using Multivariate Analysis
Objective: To apply Partial Least Squares (PLS) regression modeling to UV/Vis spectra for real-time quantification of mAb breakthrough during the load phase of Protein A capture, enabling automatic termination of loading at a predefined breakthrough level [54].
Background: During column loading, the product (mAb) will eventually "break through" the column when binding capacity is exceeded. Monitoring this breakthrough is crucial for maximizing resin utilization without product loss. Simple single-wavelength absorbance (A₂₈₀) is non-selective, as both mAb and impurities contribute to the signal [54]. PLS modeling correlates the entire spectral signature with reference data (e.g., from analytical Protein A chromatography) to provide selective mAb quantification even in the presence of a complex, variable impurity background [54].
Key Quantitative Findings: The PLS modeling approach demonstrated high accuracy and sensitivity in predicting mAb concentration in the column effluent, enabling precise load control.
Table 2: Performance Data for PLS-based Monitoring of mAb Breakthrough
| Parameter | Model 1 (General) | Model 2 (High-Sensitivity) |
|---|---|---|
| Root Mean Square Error of Prediction (RMSEP) | 0.06 mg/mL | 0.01 mg/mL |
| Target Breakthrough for Load Termination | 1.5 mg/mL (≈50% breakthrough) | 0.15 mg/mL (≈5% breakthrough) |
| Key Model Adjustment | - | Background subtraction of impurity signal |
| Application Outcome | Successful automatic termination | Successful automatic termination |
Protocol: PLS-based Control of the Load Phase
The Scientist's Toolkit: Essential Materials and Reagents
| Item | Function / Specification | Justification |
|---|---|---|
| Chromatography System with DAD | System capable of automated valve control and spectral acquisition. | Allows for real-time data acquisition and automated process control based on model predictions [54]. |
| Harvested Cell Culture Fluid (HCCF) | Contains mAb at variable titers and impurities. | The feed material for the capture step. Variability in titer is used for model training [54]. |
| Mock Feed | HCCF without the mAb. | Used for diluting HCCF and for background signal studies [54]. |
| Software for Multivariate Analysis | e.g., SIMCA, MATLAB, or equivalent. | Required for developing and validating the PLS calibration model. |
| Reference Method | Analytical Protein A HPLC. | Provides the precise mAb concentration data for correlating with UV spectra during model calibration [54]. |
Experimental Workflow:
Step-by-Step Procedure:
Calibration Data Generation:
- Perform several column loading experiments with HCCF diluted to different mAb titers using mock feed.
- During each run, collect the column effluent in fractions and simultaneously acquire a UV-Vis spectrum for each fraction using the in-line DAD.
- Analyze each fraction using a reference analytical method (e.g., analytical Protein A HPLC) to determine the true mAb concentration [54].
PLS Model Development:
- Input the collected UV-Vis spectra (X-matrix) and the corresponding reference mAb concentrations (Y-matrix) into multivariate analysis software.
- Develop a PLS regression model to correlate the spectral features with the mAb concentration. For higher sensitivity at low breakthrough levels, refine the model by focusing on low concentration data and subtracting the impurity background signal from the mock feed [54].
Model Validation:
- Validate the model by performing a new, independent loading experiment not used in the calibration set.
- Compare the mAb concentrations predicted by the PLS model in real-time with the offline analysis of collected fractions. Calculate the Root Mean Square Error of Prediction (RMSEP) to quantify accuracy [54].
Real-time Process Control:
- Integrate the validated PLS model into the chromatography control system.
- For a production run, load the HCCF onto the column while the DAD continuously acquires spectra of the effluent.
- In real-time, the software uses the PLS model to predict the mAb concentration from each new spectrum.
- When the predicted concentration reaches a predefined setpoint (e.g., 0.15 mg/mL for 5% breakthrough), the system automatically triggers a valve to stop the load and proceed to the wash step [54].
The integration of UV-Vis spectroscopy as a PAT tool in mAb purification chromatography provides a powerful means to enhance process understanding and control. The presented protocols demonstrate two key applications: optimizing the elution phase for superior impurity clearance and enabling real-time, automated control of the load phase. By transitioning from offline testing to real-time spectroscopic monitoring, manufacturers can achieve more consistent product quality, intensify processes, improve resin utilization, and ultimately facilitate the implementation of continuous biomanufacturing [50] [54] [51].
NMR for Characterizing Protein-Protein and Protein-Excipient Interactions in Formulations
Nuclear Magnetic Resonance (NMR) spectroscopy has emerged as a powerful analytical technique for characterizing biomolecular interactions directly in formulated solutions, providing atomic-level insights critical for biologics development [56]. Unlike many other biophysical methods, NMR can simultaneously probe both protein-protein and protein-excipient interactions under physiologically relevant conditions without requiring isotopic labeling in many cases [57] [56]. This capability is particularly valuable for pharmaceutical scientists developing stable protein formulations, where subtle molecular interactions can significantly impact stability, efficacy, and shelf-life.
The unique strength of NMR lies in its ability to detect weak, transient interactions and conformational changes that often precede protein aggregation or degradation [56]. Through various one-dimensional and two-dimensional experiments, researchers can identify binding interfaces, quantify interaction strengths, monitor structural dynamics, and detect excipient interactions that either stabilize or destabilize protein therapeutics [57] [58] [59]. This application note details practical NMR methodologies for characterizing these critical interactions within the context of biologics formulation development.
Application Notes
Protein-Protein Interactions
NMR spectroscopy provides multiple approaches for studying protein-protein interactions, with Chemical Shift Perturbation (CSP) and solvent Paramagnetic Relaxation Enhancement (solvent-PRE) being among the most widely used techniques [58]. CSP experiments capitalize on the extreme sensitivity of NMR chemical shifts to the local electronic environment, which is perturbed when binding events occur [58]. In practice, researchers track changes in chemical shifts by acquiring a series of 2D-heteronuclear single quantum coherence (HSQC) spectra of a 15N- or 13C-labeled protein while titrating in increasing concentrations of its unlabeled binding partner [58]. This methodology is ideally suited for weak binding interactions (affinity in the μM-mM range) that exchange rapidly on the NMR timescale [58].
Table 1: Key NMR Techniques for Protein-Protein Interaction Analysis
| Technique | Information Obtained | Applicable KD Range | Key Observables |
|---|---|---|---|
| Chemical Shift Perturbation (CSP) | Binding interface, affinity, allosteric effects | μM-mM (fast exchange) | Chemical shift changes, peak intensity |
| Solvent Paramagnetic Relaxation Enhancement (PRE) | Binding interface, surface accessibility | Not affinity-dependent | Transverse relaxation rate (R2) enhancement |
| Diffusion Ordered Spectroscopy (DOSY) | Hydrodynamic radius, oligomerization | Not affinity-dependent | Translational diffusion coefficient |
| Intermolecular NOE | Structural constraints for complex | Tight binding (slow exchange) | Through-space nuclear Overhauser effect |
Solvent-PRE experiments provide complementary information by measuring the magnetic dipolar coupling between protein nuclei and unpaired electrons from a paramagnetic probe in solution [58]. The resulting enhancement of nuclear spin relaxation rates is proportional to the local concentration of the paramagnetic molecule, thereby mapping surface accessibility [58]. When comparing solvent-PREs between free and complexed protein, residues at the binding interface show reduced paramagnetic effects due to obstruction by the binding partner [58]. This technique is particularly valuable for distinguishing direct binding interfaces from allosteric conformational changes that may also cause chemical shift perturbations [58].
Protein-Excipient Interactions
Protein-excipient interactions play a crucial role in formulation stability, and NMR has proven invaluable for characterizing these often weak and transient interactions directly in therapeutic formulations [57] [59]. Recent advancements in NMR methodologies now enable researchers to study proteins at natural abundance in actual drug product formulations, despite the challenges posed by low protein concentrations and overwhelming excipient signals [56].
Table 2: NMR Studies of Protein-Excipient Interactions
| Excipient Category | Example | Interaction Mechanism | Stabilization Impact | NMR Detection Method |
|---|---|---|---|---|
| Sugars | Sucrose | Preferential exclusion, possible specific binding | Dramatic thermal stabilization [57] | 1D/2D fingerprinting, diffusion profiling |
| Surfactants | Polysorbate 20 | Binding to protein surface | Alters physical stability [59] | DOSY, chemical shift analysis |
| Preservatives | Phenol | Specific binding to API | Reduced antimicrobial efficacy [59] | Diffusion coefficients, binding quantification |
| Amino Acids | Arginine | Binding to unfolded protein/charged patches | Suppresses aggregation [57] | Chemical shift perturbations |
In one notable study, NMR was used to investigate the stabilization of a multivalent VHH molecule (42 kDa) composed of three flexibly linked heavy-chain-only domains [57]. The research demonstrated dramatic thermal stabilization in the presence of sucrose, with a concentration-dependent decrease in high molecular weight (HMW) species formation from 18% ∆HMW without sucrose to 3.8% ∆HMW at 20% sucrose concentration [57]. Through a combination of NMR fingerprinting and profiling methods, the study showed that sucrose provided stabilization without detectable structural changes or specific binding to the protein, supporting the preferential exclusion mechanism [57].
Another critical application involves quantifying preservative binding in multidose formulations. Research has shown that phenol strongly interacts with a model fusion protein, with the bound fraction successfully quantified using Diffusion Ordered NMR Spectroscopy (DOSY) [59]. This interaction proved pharmaceutically relevant as it reduced antimicrobial efficacy, highlighting the importance of such characterization during formulation development [59].
Experimental Protocols
Protein-Protein Interaction Mapping via CSP
Sample Preparation:
- Prepare a 0.1-0.5 mM sample of 15N-labeled protein in appropriate formulation buffer (e.g., 20 mM phosphate buffer, pH 6.5, 50 mM NaCl)
- Match buffer conditions between protein samples using dialysis or buffer exchange
- Add 5-10% D2O for field-frequency lock
- Consider adding 0.02% sodium azide for bacterial prevention if necessary
Data Acquisition:
- Acquire a reference 2D 1H-15N HSQC spectrum of the free 15N-labeled protein
- Titrate in unlabeled binding partner at increasing concentrations (typical molar ratios: 0.5:1, 1:1, 2:1, 4:1 ligand:protein)
- For each titration point, collect 2D 1H-15N HSQC spectra using identical acquisition parameters
- Set acquisition temperature based on protein stability (typically 25-37°C)
- For a 0.2 mM protein sample, use 128-256 scans per t1 increment with total experiment time of 30-60 minutes per spectrum
Data Analysis:
- Process all spectra with identical parameters (apodization, zero-filling, etc.)
- Assign chemical shift changes for backbone amide peaks
- Calculate combined chemical shift perturbations using the formula: Δδ = √((ΔδHN)2 + (αΔδN)2) where α is a scaling factor (typically 0.1-0.2)
- Plot Δδ versus residue number to identify binding interface
- For KD determination, plot Δδ as a function of ligand concentration and fit to appropriate binding model
Protein-Excipient Interaction Analysis via DOSY
Sample Preparation:
- Prepare protein formulation at target concentration (typically 1-10 mg/mL)
- Include excipient of interest at pharmaceutically relevant concentrations
- Use deuterated buffer (e.g., D2O) for field-frequency lock while maintaining other buffer components
- For preservative binding studies, typical phenol concentrations range from 2-3 mg/mL [59]
Data Acquisition:
- Use a stimulated echo pulse sequence with bipolar gradient pulses for diffusion measurement
- Set diffusion delay (Δ) based on expected molecular size (typically 50-200 ms for proteins)
- Linearly vary gradient strength in 16-32 steps from 2% to 95% of maximum gradient strength
- Set gradient pulse duration (δ) based on molecular weight (typically 1-4 ms)
- Include appropriate water suppression if necessary (e.g., excitation sculpting)
- Use sufficient relaxation delay between scans (typically 1-5 seconds)
Data Analysis:
- Process spectra with identical phasing and baseline correction
- Measure peak intensities as a function of gradient strength
- Fit decay to the Stejskal-Tanner equation: I = I0exp(-D(γgδ)2(Δ-δ/3)) where D is diffusion coefficient, γ is gyromagnetic ratio, g is gradient strength
- Calculate hydrodynamic radius using Stokes-Einstein equation: rh = kT/(6πηD) where η is solvent viscosity
- Compare diffusion coefficients of free excipient versus protein-bound excipient to determine bound fraction
HOS Assessment of Formulated Proteins via 2D 1H-13C HMQC
Sample Preparation:
- Use protein therapeutic at formulation concentration (natural abundance)
- Maintain original formulation buffer and excipients
- Add 5-10% D2O for field-frequency lock
- For high-concentration excipients, consider using signal suppression techniques
Data Acquisition:
- Implement XL-ALSOFAST-[1H-13C]-HMQC experiment for enhanced sensitivity [56]
- Set acquisition temperature to recommended storage condition (typically 5-25°C)
- Use optimized recycling delay (d1) of 1-2 seconds
- Set 1H spectral width to 15-20 ppm centered on water resonance
- Set 13C spectral width to 30-40 ppm centered in aliphatic region
- Acquire 128-256 t1 increments with 32-64 scans per increment
- Total experiment time: 2-8 hours depending on protein concentration
Data Analysis:
- Process with Gaussian apodization in both dimensions
- Use polynomial baseline correction if necessary
- Compare chemical shifts across different formulations or stress conditions
- Monitor peak intensity changes indicative of structural perturbations
- Identify specific excipient interactions through chemical shift mapping
The Scientist's Toolkit
Table 3: Essential Research Reagent Solutions for NMR Studies of Protein Interactions
| Reagent/Category | Specific Examples | Function in NMR Experiments |
|---|---|---|
| Isotopically Labeled Proteins | 15N-labeled, 13C-labeled proteins | Enables detection in 2D HSQC/HMQC experiments; essential for CSP studies [58] |
| Formulation Buffers | Phosphate, histidine, citrate buffers | Maintain physiological pH; deuterated versions provide field-frequency lock [59] |
| Stabilizing Excipients | Sucrose, trehalose, arginine | Provide thermal and conformational stability; studied for preferential exclusion [57] |
| Surfactants | Polysorbate 20, Polysorbate 80 | Prevent surface-induced aggregation; potential binding partner for NMR study [59] |
| Preservatives | Phenol, m-cresol | Antimicrobial activity in multidose formulations; protein binding quantified by DOSY [59] |
| Paramagnetic Probes | Gd(DTPA-BMA), chelated Mn2+ | Solvent-PRE agents for mapping surface accessibility and binding interfaces [58] |
| Chemical Reference Compounds | DSS, TSP, sodium azide | Chemical shift referencing; prevention of microbial growth in NMR samples |
Workflow Visualizations
Protein-Protein Interaction Analysis
Protein-Excipient Interaction Workflow
NMR spectroscopy provides formulation scientists with powerful tools for characterizing protein-protein and protein-excipient interactions at atomic resolution directly in therapeutic formulations. The protocols outlined herein enable comprehensive assessment of critical quality attributes during biologics development, facilitating the design of stable, efficacious protein therapeutics.
ICP-MS and SEC-ICP-MS for Tracking Ultra-Trace Metal Interactions in Therapeutic Proteins
The presence of transition metals in therapeutic protein drugs constitutes a critical quality concern in biopharmaceutical development. Metals such as cobalt, chromium, copper, iron, and nickel can be introduced at various manufacturing stages—through raw materials, stainless-steel equipment, or formulation components—and can catalyze modifications that impact drug efficacy, safety, and stability [60]. These metal-protein interactions can promote oxidative damage through Fenton reactions, leading to fragmentation, aggregation, and alterations to critical quality attributes (CQAs) [60].
While conventional inductively coupled plasma mass spectrometry (ICP-MS) provides sensitive measurement of total metal content, it cannot differentiate between protein-bound metals and free ions in solution [60]. This limitation has driven the adoption of hyphenated techniques, particularly size exclusion chromatography coupled to ICP-MS (SEC-ICP-MS), which enables speciation analysis by separating metal-containing species while providing ultra-trace detection capabilities [60] [61]. This application note details standardized protocols for implementing these techniques to monitor metal-protein interactions during biotherapeutic development.
Technical Principles and Instrumentation
Fundamental Concepts
ICP-MS operates by introducing a nebulized sample into high-temperature argon plasma (~8000 K), which atomizes and ionizes constituent elements. These ions are then separated by mass-to-charge ratio in the mass spectrometer, enabling simultaneous multi-element detection with exceptional sensitivity (sub-parts-per-billion detection limits) and a wide dynamic range [62] [63].
SEC-ICP-MS integrates size-based chromatographic separation with elemental detection. The SEC column separates analytes by hydrodynamic volume, preserving metal-protein interactions in their native state. As eluents exit the chromatography system, they are directly introduced into the ICP-MS via an interface that typically incorporates flow-splitting to match volumetric requirements [61].
Key Instrumentation Components
Table 1: Essential Instrumentation Components for SEC-ICP-MS Analysis
| Component | Specifications | Function |
|---|---|---|
| ICP-MS | Quadrupole mass analyzer (e.g., NexIon 350); Cyclonic spray chamber with concentric nebulizer | Element-specific detection and quantification with ultra-trace sensitivity [63] [61] |
| SEC Column | Compatible with aqueous mobile phases; Molecular weight range: 1-1000 kDa | Gentle separation of protein-bound metals from free metal species while maintaining native interactions [60] |
| HPLC System | Binary or quaternary pump; Diode array detector (DAD); Autosampler | Precise mobile phase delivery and initial protein detection [61] |
| Interface | PEEK capillary tubing (e.g., 120 mm); Low-dead-volume tee connector | Matches LC flow rate to ICP-MS requirements via controlled flow splitting [61] |
| Mobile Phase | Volatile buffers (e.g., ammonium acetate, ammonium bicarbonate); Physiological pH and ionic strength | Maintains protein integrity and metal-binding interactions during separation [60] [64] |
Experimental Protocols
SEC-ICP-MS Method for Metal-Protein Interaction Analysis
This protocol enables the differentiation and quantification of protein-associated versus free metals in therapeutic formulations [60] [61].
Sample Preparation
- Therapeutic protein samples: Prepare drug substance or product at concentrations typically ranging from 1-10 mg/mL in formulation buffer [60].
- Metalloprotein standards: Utilize ferritin (for iron) and Cu,Zn-superoxide dismutase (for copper and zinc) for system suitability testing and calibration [60].
- Metal spike solutions: Prepare single-element or multi-element standards in dilute nitric acid or matching formulation buffer to evaluate metal-binding capacity.
- Sample preservation: Maintain samples at appropriate pH and ionic strength to prevent disruption of metal-protein interactions. Avoid chelating agents in buffers [61].
Chromatographic Conditions
- Column: Size exclusion column suitable for native protein separation (e.g., 300 mm length, 10 μm particle size)
- Mobile phase: 150 mM ammonium acetate, pH 7.4 or similar physiological buffer [60]
- Flow rate: 0.7-1.0 mL/min with post-column split to ~0.4 mL/min for ICP-MS introduction [61]
- Injection volume: 5-100 μL depending on protein concentration and sensitivity requirements [61]
- Column temperature: Ambient or controlled (e.g., 20-25°C)
- Run time: 10-15 minutes to separate protein peaks from free metal species
ICP-MS Parameters
- RF power: 1500 W
- Nebulizer gas flow: 0.95-1.05 L/min
- Auxiliary gas flow: 1.2 L/min
- Plasma gas flow: 15 L/min
- Monitored isotopes: ⁵²Cr, ⁵⁵Mn, ⁵⁶Fe, ⁵⁹Co, ⁶⁰Ni, ⁶³Cu, ⁶⁶Zn
- Dwell time: 100-500 ms per isotope
- Data acquisition mode: Time-resolved analysis for chromatographic data collection
Data Analysis and Quantitation
The following workflow illustrates the complete SEC-ICP-MS analysis process from sample preparation to data interpretation:
Peak Integration and Calculation
- Chromatographic peak identification: Identify protein-associated metal peaks (early eluting, ~3-5 minutes) and free metal peaks (late eluting, ~7-10 minutes) based on retention time [60].
- Peak area integration: Integrate areas for both protein-associated and free metal peaks using ICP-MS chromatographic data.
Relative quantitation: Calculate the percentage of protein-associated metal using the formula [60]:
% Protein-associated metal = (Aprotein / (Aprotein + A_free)) × 100
Where Aprotein is the integrated peak area for protein-associated metal and Afree is the integrated peak area for free metal.
Absolute quantitation: Combine SEC-ICP-MS data with bulk metal analysis by ICP-MS to determine absolute concentrations of protein-bound metals [60].
Applications and Case Studies
Metal-Protein Interaction Assessment in Co-formulated mAbs
A recent study applied SEC-ICP-MS to investigate metal interactions in co-formulated monoclonal antibodies (mAbs) stressed with stainless steel coupons to simulate manufacturing conditions [60]. After 9 days of storage, samples were analyzed for total metal content by ICP-MS followed by SEC-ICP-MS to determine metal distribution.
Table 2: Metal Distribution in Co-formulated mAbs After Stainless Steel Exposure
| Metal | Total Concentration (μg/L) | Protein-Associated (%) | Free in Solution (%) |
|---|---|---|---|
| Iron (Fe) | 45.2 ± 3.1 | 68.5 ± 2.4 | 31.5 ± 2.4 |
| Chromium (Cr) | 12.8 ± 1.2 | 42.3 ± 3.1 | 57.7 ± 3.1 |
| Nickel (Ni) | 9.5 ± 0.8 | 35.8 ± 2.7 | 64.2 ± 2.7 |
| Copper (Cu) | 6.3 ± 0.5 | 71.2 ± 3.5 | 28.8 ± 3.5 |
| Cobalt (Co) | 2.1 ± 0.3 | 28.9 ± 2.1 | 71.1 ± 2.1 |
The data revealed significant differences in metal-binding behavior, with copper and iron showing the highest association with mAbs (>68%), while cobalt predominantly remained free in solution [60]. This information is critical for understanding potential degradation pathways and designing appropriate control strategies.
Advanced Integration with High-Resolution Mass Spectrometry
Recent methodological advances combine SEC-ICP-MS with high-resolution mass spectrometry (HRMS) in a comprehensive LC-UV-ICPMS-HRMS platform [64]. This configuration enables simultaneous detection of metals and identification of metal-binding molecules, including biotherapeutics and small molecules like histidine, citrate, or sucrose in drug substances.
In one application, this platform identified that iron binds predominantly to the Fab domain of an IgG1 mAb through integrated enzyme-assisted subunit analysis [64]. This precise localization of metal binding sites provides invaluable insights for protein engineering and formulation development.
Research Reagent Solutions
Table 3: Essential Research Reagents for Metal-Protein Interaction Studies
| Reagent | Specifications | Application |
|---|---|---|
| Monoclonal Antibodies | IgG1, IgG2; 1-10 mg/mL in formulation buffer | Primary analytes for metal interaction studies [60] [61] |
| Metalloprotein Standards | Ferritin (iron), Cu,Zn-SOD (copper,zinc); High purity | System suitability testing and calibration [60] |
| Mobile Phase Buffers | Ammonium acetate, ammonium bicarbonate; HPLC grade, metal-free | SEC separation under native conditions [60] [61] |
| Multi-element Calibration Standards | Cr, Mn, Fe, Co, Ni, Cu, Zn; 1000 ppm stock solutions | ICP-MS calibration and quantitation [63] |
| Stainless Steel Coupons | 316 L grade (Cr, Fe, Ni, Cu alloy) | Controlled metal exposure studies [60] |
SEC-ICP-MS has established itself as an indispensable analytical platform for characterizing metal-protein interactions in therapeutic biologics. The method provides unparalleled sensitivity for speciated metal analysis at ultra-trace levels, enabling researchers to differentiate protein-bound metals from free ions in solution. The experimental protocols detailed in this application note offer robust methodologies for implementing this technique in biopharmaceutical development.
As therapeutic modalities continue to evolve, the integration of SEC-ICP-MS with complementary techniques like HRMS and the development of increasingly sensitive and high-throughput approaches will further enhance our understanding of metal-mediated degradation pathways. These advancements will ultimately contribute to the development of safer, more stable, and more efficacious biologic therapies.
Optimizing Data Quality: From Sample Prep to Advanced Chemometrics
In the context of spectroscopic techniques for monitoring chemical reactions, the path to robust and interpretable data begins long before the spectrometer is initialized. Sample preparation is the critical, often underestimated, foundation that dictates the success or failure of analytical outcomes. Inadequate sample preparation is not a minor oversight but a primary source of error, responsible for as much as 60% of all spectroscopic analytical errors [65]. For researchers and drug development professionals, this translates to a substantial risk of collecting misleading data that can compromise research validity, derail quality control processes, and lead to incorrect analytical conclusions.
The physical and chemical characteristics of a sample directly govern how it interacts with electromagnetic radiation. Surface topography, particle size distribution, homogeneity, and the sample matrix all profoundly influence spectral quality by affecting phenomena like light scattering and signal absorption [65]. Without proper preparation, even the most advanced instrumentation cannot compensate for these fundamental flaws. This article provides a detailed examination of sample preparation protocols designed to safeguard the integrity of your spectroscopic data, ensuring that the critical parameters you monitor in chemical reactions—be they reaction progression, intermediate formation, or final product quality—are accurately reflected in your spectral results.
Core Sample Preparation Techniques for Different Sample Types
Solid Sample Preparation
The preparation of solid samples requires meticulous technique to achieve the homogeneity, particle size, and surface quality necessary for valid analysis. The chosen method must be tailored to both the material properties and the specific spectroscopic technique employed.
Grinding and Milling: These processes are used to reduce particle size and create homogeneous samples. The selection of equipment is crucial; harder materials require more powerful grinders with specialized surfaces. The target particle size varies by technique but is typically <75 μm for XRF analysis. Swing grinding machines are ideal for tough samples like ceramics, as their oscillating motion minimizes heat generation that could alter sample chemistry. Milling, offering greater control, produces flat, uniform surfaces that enhance spectral quality by minimizing light scattering and ensuring consistent density [65].
Pelletizing for XRF: This technique transforms powdered samples into solid disks of uniform density and surface properties, which is essential for quantitative XRF analysis. The process involves blending the ground sample with a binder (e.g., wax or cellulose) and pressing it under high pressure (10-30 tons) using a hydraulic or pneumatic press. Proper pellet preparation directly improves analytical accuracy by enhancing sample stability and reducing matrix effects [65].
Fusion Techniques: Fusion is the most rigorous preparation method for refractory materials, resulting in complete dissolution into homogeneous glass disks. It involves mixing the ground sample with a flux (e.g., lithium tetraborate), melting it at 950-1200°C in platinum crucibles, and casting it into a disk. This method is superior for silicates, minerals, and ceramics as it彻底 (completely) breaks down crystal structures and standardizes the sample matrix, thereby eliminating mineralogical and particle size effects that hinder quantitative analysis [65].
Table 1: Solid Sample Preparation Techniques for Spectroscopy
| Technique | Primary Applications | Key Parameters | Influence on Spectral Accuracy |
|---|---|---|---|
| Grinding | Tough samples (ceramics, ferrous metals) | Particle size (<75 μm for XRF), avoidance of contamination | Creates homogeneity; reduces sampling error and light scattering |
| Milling | Non-ferrous metals (alloys of Al, Cu) | Surface flatness, rotational speed, feed rate | Minimizes light scattering; provides consistent density for quantification |
| Pelletizing | Powdered samples for XRF | Binder type, press pressure (10-30 tons) | Creates uniform surface and density; reduces matrix effects in XRF |
| Fusion | Refractory materials (cement, slag, oxides) | Flux type, temperature (950-1200°C), crucible material | Eliminates particle size and mineralogical effects; standardizes matrix |
Liquid and Gas Sample Preparation
Liquid and gaseous samples present a distinct set of challenges, requiring specialized handling to prevent introduction of error during preparation.
Dilution and Filtration for ICP-MS: The extreme sensitivity of ICP-MS demands stringent liquid preparation. Dilution must bring analyte concentrations into the instrument's optimal detection range while also reducing matrix effects that can disrupt ionization. Samples with high dissolved solid content may require dilution factors as high as 1:1000. Following dilution, filtration through 0.45 μm or 0.2 μm membrane filters (e.g., PTFE) is essential to remove suspended particles that could clog nebulizers or contaminate the system. High-purity acidification with nitric acid (typically to 2% v/v) helps keep metal ions in solution and prevents their adsorption onto container walls [65] [66].
Solvent Selection for Molecular Spectroscopy: For techniques like UV-Vis and FT-IR, the solvent must fully dissolve the sample without itself being spectroscopically active in the region of interest. For UV-Vis, solvents with high transparency are chosen based on their cutoff wavelength (e.g., water at ~190 nm, acetonitrile at ~190 nm). For FT-IR, the solvent's absorption bands must not overlap with key analyte features. Deuterated solvents like CDCl₃ are often preferred for their transparency across much of the mid-IR spectrum. Sample concentration must be optimized to yield absorbance values that are within the linear range of the detector [65].
The Scientist's Toolkit: Essential Reagents and Materials
The reliability of spectroscopic analysis is contingent upon the quality and appropriateness of the materials used during sample preparation.
Table 2: Key Research Reagent Solutions for Spectroscopic Sample Preparation
| Item | Function | Key Considerations |
|---|---|---|
| High-Purity Water (ASTM Type I) | Diluent, rinsing agent | Low total organic carbon and bacterial count; essential for trace metal analysis (ICP-MS) [66]. |
| ICP-MS Grade Acids | Sample digestion, preservation, acidification | Certificate of analysis confirming low elemental background; e.g., nitric acid for metal stabilization [66]. |
| Lithium Tetraborate Flux | Fusion preparation for XRF | Enables formation of homogeneous glass disks from refractory materials at high temperatures [65]. |
| FEP or Quartz Labware | Sample storage and preparation | Inert; minimizes contamination from Boron, Silicon, or Sodium that leaches from borosilicate glass [66]. |
| Protease/Phosphatase Inhibitors | Added to lysis buffers during protein extraction | Protects protein samples from degradation or artifactual modification by endogenous enzymes during extraction [67]. |
| Silica Beads (0.5mm diameter) | Mechanical cell disruption for MALDI-TOF MS | Ensures efficient breakdown of tough cell walls (e.g., mycobacteria) for effective protein extraction [68]. |
| Cold Acidic Acetonitrile:Methanol:Water | Quenching solvent for metabolomics | Rapidly halts enzymatic activity in cells; acid prevents metabolite interconversion during quenching [69]. |
Contamination: The Silent Adversary
At the parts-per-billion (ppb) or parts-per-trillion (ppt) levels detectable by modern instrumentation, contamination from seemingly innocuous sources can severely skew results. A systematic approach is required to identify and control these sources [66].
- Labware and Containers: Glassware is a known source of boron, silicon, and sodium. Using fluorinated ethylene propylene (FEP) or quartz containers minimizes this risk. Furthermore, labware should be segregated for high-concentration (>1 ppm) and low-concentration use. Certain metals, like lead and chromium, are prone to absorption onto glass and can create a "memory effect," necessitating dedicated containers or the use of plastics [66].
- Water and Reagents: The quality of water and acids is paramount. An aliquot of 5 mL of acid containing 100 ppb of a nickel contaminant, when used to dilute a sample to 100 mL, introduces 5 ppb of nickel. Always use the highest purity reagents available and consult certificates of analysis to understand elemental backgrounds. Blank subtraction is not a reliable fix if it pushes the result near the instrument's detection limit [66].
- Laboratory Environment and Personnel: Background contamination from laboratory air, dust, and personnel is a significant concern. Distilling nitric acid in a HEPA-filtered clean room results in dramatically lower levels of aluminum, calcium, and iron contamination compared to distillation in an ordinary lab. Personnel can introduce contaminants via powdered gloves (zinc), cosmetics (aluminum), lotions, and hair [66]. Establishing a clean workspace and enforcing a strict personal hygiene protocol (e.g., no jewelry, use of powder-free gloves) is essential for ultra-trace analysis.
Incomplete Quenching and Metabolite Interconversion
In reaction monitoring and metabolomics, the instantaneous "snapshot" of a system is only valid if metabolic activity or the chemical reaction is stopped instantly upon sampling. Incomplete or slow quenching leads to metabolite interconversion, distorting the true profile.
Studies show that using cold organic solvent alone may not fully denature enzymes quickly enough. This can be tracked by spiking isotope-labeled standards into the quenching solvent. For example, residual enzymatic activity can convert 3-phosphoglycerate into phosphoenolpyruvate or cause ATP to degrade to ADP. The addition of 0.1 M formic acid to the organic quenching solvent has been shown to prevent this interconversion effectively. After quenching, the extract should be neutralized to avoid acid-catalyzed degradation of labile metabolites [69].
Method Selection and Comparative Workflows
Comparative Analysis of Preparation Techniques
The optimal sample preparation method is not universal; it must be selected based on the analytical goal, sample type, and technique. A comparative study on FT-NIR screening of almonds for geographical origin determination provides a powerful illustration of this principle.
The study systematically compared four preparation techniques: whole nuts, bisected nuts, ground nuts, and freeze-dried (after grinding) nuts. Using support vector machine (SVM) classification, the freeze-dried preparation achieved a classification accuracy of 80.2% (±1.9%) for determining origin. The other three preparations resulted in at least 8.3 percentage points lower accuracy. This confirms that the most rigorous preparation (freeze-drying) yields the most reliable data. However, the study also pragmatically noted that for an initial rapid screening, the analysis of whole or bisected almonds was more suitable due to a significantly lower overall work effort [70].
Platform-Specific Preparation Protocols
The following workflows detail specific, validated protocols for different analytical goals.
Protocol 1: Mycobacterial Protein Extraction for MALDI-TOF MS Identification
MALDI-TOF MS has revolutionized microbial identification, but tough-walled organisms like mycobacteria require extensive preparation for valid results.
Diagram 1: Mycobacterial protein extraction for MALDI-TOF MS.
- Step 1: Inactivation. Suspend mycobacterial isolates in 300 μl of water and heat inactivate at 95°C for 30 minutes [68].
- Step 2: Washing. Centrifuge the sample, resuspend the pellet in 70% ethanol, and then wash again with water [68].
- Step 3: Further Inactivation and Disruption. Resuspend in 50 μl of water and incubate at 95°C for 10 minutes. Wash with 100% ethanol and dry. Add 0.5-mm diameter glass beads and 20 μl acetonitrile, then vortex for 1 minute using a horizontal vortex adaptor [68].
- Step 4: Protein Extraction. Add 20 μl of 70% formic acid to the tube. Centrifuge the sample, and spot 1 μl of the resulting supernatant onto the MALDI target plate. Overlay with 1 μl of HCCA matrix solution and analyze within 3 hours [68].
Protocol 2: Preparation of a Fused Bead for XRF Analysis
Fused bead preparation is critical for achieving high accuracy in the quantitative elemental analysis of difficult materials.
Diagram 2: Fused bead preparation workflow for XRF.
- Step 1: Grinding. Ensure the sample is finely ground to a consistent particle size.
- Step 2: Mixing. Accurately weigh the ground sample and mix it with an appropriate flux, typically lithium tetraborate, in a specific ratio (e.g., 1:10 sample-to-flux) [65].
- Step 3: Fusion. Transfer the mixture to a platinum crucible and place it in a high-temperature furnace. Fuse the material at a temperature between 950°C and 1200°C until a homogeneous melt is achieved [65].
- Step 4: Casting. Pour the molten mixture into a pre-heated platinum mold to create a disk of uniform thickness.
- Step 5: Cooling. Allow the disk to cool slowly, forming a homogeneous, stable glass bead ready for XRF analysis [65].
In spectroscopic monitoring of chemical reactions, the fidelity of the final data is irrevocably tied to the initial steps of sample preparation. As demonstrated, errors introduced at this stage are not merely additive but can be multiplicative, leading to fundamentally incorrect interpretations. The pursuit of spectral accuracy demands a disciplined, methodology-aware approach that treats sample preparation not as a mundane prerequisite, but as an integral part of the analytical science itself. By adopting the rigorous protocols and contamination control practices outlined herein—from selecting the appropriate grinding technique for solid samples to implementing flawless quenching for metabolic snapshots—researchers and drug developers can significantly reduce the ~60% of errors originating from this phase. This diligence ensures that the sophisticated data generated by modern spectrometers truly reflects the chemical system under study, thereby delivering reliable, actionable insights for research and development.
In spectroscopic research for monitoring chemical reactions, the reliability of analytical data is fundamentally dependent on sample preparation. Proper techniques ensure that the sample presented to the spectrometer is representative, homogeneous, and in a form compatible with the instrument's requirements, thereby yielding data that accurately reflects the chemical process under investigation [71]. Inauthentic preparation can lead to misinterpretation of spectroscopic data, undermining the goal of understanding chemical phenomena [72]. This guide details established protocols for preparing solid and liquid samples, with a specific focus on applications in kinetic studies and reaction profiling.
Foundational Principles and Data Presentation
Core Principles of Effective Sample Preparation
- Representativity: The prepared sample must accurately reflect the bulk composition of the reaction mixture at the time of sampling.
- Homogeneity: Ensuring a uniform sample is critical for obtaining reproducible and reliable spectroscopic readings, particularly in solids.
- Compatibility: The sample form must be suitable for the specific spectroscopic technique (e.g., transparency for transmission IR, low fluorescence for Raman).
- Minimal Interference: Preparation should avoid introducing contaminants or artifacts that could be misinterpreted in the spectra.
Quantitative Comparison of Sample Preparation Techniques
The following table summarizes key quantitative parameters for common sample preparation methods used in spectroscopic analysis.
Table 1: Comparison of Common Sample Preparation Techniques for Spectroscopy
| Preparation Technique | Typical Sample Mass (mg) | Common Dilution Factors | Particle Size Target (µm) | Key Applications in Reaction Monitoring |
|---|---|---|---|---|
| Grinding & Pelletizing (KBr) | 1 - 3 | N/A | < 5 | FT-IR analysis of solid reaction products or catalysts [71] |
| Liquid Dilution (Transmission) | Variable | 10x - 1000x | N/A | UV-Vis and IR spectroscopy of liquid reaction aliquots to maintain linearity |
| Filtration (Syringe Filter) | > 1 mL volume | N/A | 0.2 - 0.45 µm pore size | Removing particulates from liquid aliquots for HPLC-UV or Raman analysis [71] |
| Powder Grinding (Milling) | 10 - 1000 | N/A | < 20 | Homogenizing solid precipitates for representative Raman sampling [71] |
Experimental Protocols for Sample Preparation
Protocol 1: Grinding and KBr Pelletizing for FT-IR Analysis
This protocol is essential for preparing solid samples for Fourier-Transform Infrared (FT-IR) spectroscopy, a common technique for verifying functional group transformations in reaction products [72].
Objective: To create a transparent pellet for transmission FT-IR analysis from a solid sample.
Materials:
- High-purity, FT-IR grade potassium bromide (KBr)
- Solid sample (e.g., a purified product or a freeze-dried reaction aliquot)
- Agate mortar and pestle
- Hydraulic pellet press (capable of ~8-10 tons)
- Evacuable pellet die
- Laboratory spatula and powder funnel
Method:
- Dry Components: Gently dry approximately 200 mg of KBr and 1-2 mg of the sample in a desiccator or oven to remove absorbed water.
- Preliminary Grinding: Place the KBr into the agate mortar and grind it vigorously for 30-60 seconds to create a fine, uniform base powder.
- Sample Incorporation: Add the 1-2 mg of sample to the mortar. This represents a sample concentration of approximately 0.5-1.0% by weight.
- Combined Grinding: Mix and grind the combined powders for 2-3 minutes. Use a "smearing" motion with the pestle to ensure complete homogenization and minimal particle size.
- Pellet Die Loading: Transfer the mixed powder into a clean pellet die. Tap the die gently to settle the powder evenly.
- Pressing: Place the die under the hydraulic press. Apply a pressure of 8-10 tons (or as recommended by the die manufacturer) and hold for 1-2 minutes. For optimal transparency, the press chamber may be evacuated during this step to remove air.
- Pellet Recovery: Carefully release the pressure and remove the formed transparent pellet from the die.
Troubleshooting:
- Hazy Pellet: Indicates insufficient grinding or moisture contamination. Re-grind the mixture with drier components.
- Pellet Too Opaque: The sample concentration may be too high. Repeat the process with a lower sample-to-KBr ratio.
- Pellet Cracks: This can be caused by releasing the pressure too quickly.
Protocol 2: Dilution and Filtration of Liquid Aliquots for UV-Vis and Raman Spectroscopy
This protocol is used for preparing liquid samples taken directly from a reaction vessel to monitor concentration changes over time [71].
Objective: To obtain a clear, particle-free liquid sample at an appropriate concentration for quantitative spectroscopic analysis.
Materials:
- Liquid sample aliquot from the reaction mixture
- Appropriate spectroscopic-grade solvent (e.g., HPLC-grade water, acetonitrile)
- Volumetric flasks or pipettes for accurate dilution
- Syringe (1-5 mL)
- Syringe filter (0.2 µm or 0.45 µm pore size, compatible with the solvent)
- Sample vial for analysis
Method:
- Initial Dilution: If necessary, perform an initial dilution of the reaction aliquot into a volumetric flask to bring the analyte concentration within the linear range of the spectrometer.
- Syringe Preparation: Draw the diluted (or neat) sample into a clean syringe.
- Filtration: Attach the syringe filter to the syringe. Gently expel the solution through the filter into a clean sample vial. Discard the first few drops if a low-binding filter is not used.
- Analysis: Cap the vial and proceed with spectroscopic analysis promptly.
Troubleshooting:
- Filter Clogging: Pre-dilute the sample further or use a filter with a larger pore size (e.g., 0.45 µm before 0.2 µm).
- Analyte Adsorption: For sensitive analytes, use low-protein-binding filters (e.g., PTFE) and confirm recovery with a standard.
Workflow Visualization for Sample Preparation
The following diagram illustrates the logical decision-making pathway for selecting the appropriate sample preparation method based on the physical state of the sample and the analytical technique.
Decision Workflow for Sample Preparation
The Scientist's Toolkit: Key Research Reagent Solutions
Table 2: Essential Materials for Spectroscopic Sample Preparation
| Item | Function & Rationale |
|---|---|
| Agate Mortar & Pestle | Provides a hard, inert surface for grinding solid samples to a fine, homogeneous powder without contaminating the sample. |
| Hydraulic Pellet Press | Applies the high, uniform pressure required to form transparent KBr pellets for transmission FT-IR measurements. |
| FT-IR Grade KBr | Used as a transparent matrix medium for preparing solid samples. Its purity ensures no interfering IR absorption bands. |
| Syringe Filters (0.2 µm) | Removes suspended particulates from liquid samples to prevent light scattering in UV-Vis and clogging in flow cells, and to ensure a clear path for Raman laser excitation [71]. |
| Spectroscopic-Grade Solvents | Solvents with low UV cutoffs and minimal spectral impurities are essential for preparing dilutions that do not introduce interfering analytical signals. |
| Raman Probe | A remote probe enables direct, real-time measurement of reactions, often with minimal sample preparation, by focusing the laser directly on the sample [71]. |
| Classical Least Squares (CLS) Software | A computational tool used to analyze spectral data sets, such as those acquired during reaction monitoring, to quantify components and track chemical changes like epoxy ring opening [71]. |
In the spectroscopic monitoring of chemical reactions, the choice of solvent and the management of matrix effects are not merely procedural steps but are fundamental to obtaining accurate, reproducible, and meaningful data. Matrix effects refer to the influence of sample components other than the analyte on its measurement, potentially leading to signal suppression or enhancement [73] [74]. In UV-Vis and FT-IR spectroscopy, these effects, along with the solvent's intrinsic properties, can significantly alter spectral baselines, band shapes, and intensities [75]. For researchers in drug development, where reactions are often tracked in complex solvent systems, a systematic approach to managing these interferences is crucial for correct interpretation of reaction kinetics, intermediate identification, and final product quantification. This note provides detailed protocols and application data to empower scientists to minimize these interferences effectively.
Theoretical Background: Solvent-Solute Interactions
The physicochemical properties of a solvent directly influence the energy levels and vibrational states of dissolved molecules, thereby affecting their spectroscopic signatures.
- UV-Vis Spectroscopy: Solvent effects primarily involve shifts in the position and intensity of absorption bands. Polar solvents can stabilize the excited state of a polar molecule more than its ground state, leading to a red-shift (bathochromic effect) in the absorption maximum (λmax). The extent of this shift can be quantitatively correlated with solvent polarity parameters using multi-component linear regression analyses, such as the Kamlet-Taft parameters [75].
- FT-IR Spectroscopy: Solvents can cause shifts in vibrational frequencies, particularly for stretching vibrations of groups like O-H, N-H, and C=O, which are sensitive to hydrogen bonding. A protic solvent can broaden and shift the O-H stretching band to lower wavenumbers due to hydrogen bond formation [75]. Furthermore, solvents must be selected for their own "window of transparency" to avoid obscuring critical analyte absorption regions.
Emerging computational models are shifting the paradigm from viewing solvents as a static continuum to treating them as Dynamic Solvation Fields—fluctuating environments that actively participate in the chemical process [76]. Machine learning potentials (MLPs) now enable efficient modeling of these explicit solvent effects without the prohibitive computational cost of traditional ab initio methods, providing deeper insights into how local solvent structure influences reactivity and spectroscopy [77].
Experimental Protocols
Protocol 1: Assessment of Matrix Effects via Post-Extraction Spiking
This quantitative method evaluates the extent of ion suppression or enhancement caused by the sample matrix [73] [74].
Materials:
- Analytical standard of the target analyte.
- Blank matrix: The sample matrix free of the analyte (e.g., a reaction mixture without the reactant).
- Appropriate solvent for preparing standard solutions.
- UV-Vis spectrophotometer or FT-IR spectrometer.
Procedure:
- Prepare a standard solution of the analyte in a neat solvent at a known concentration within the analytical range.
- Prepare a post-extraction spiked sample by adding the same amount of the analytical standard to the blank matrix.
- Record the spectra of both solutions using identical instrumental parameters.
- Calculate the Matrix Effect (ME) using the following formula:
ME (%) = [(Response of spiked sample - Response of blank) / Response of standard solution] × 100% - Interpretation: An ME of 100% indicates no matrix effect. Values >100% signify signal enhancement, while values <100% indicate signal suppression [73].
Protocol 2: Qualitative Assessment of Matrix Effects via Post-Column Infusion (LC-UV Adaption)
While originally developed for LC-MS, this method can be adapted for LC-UV systems to identify regions of spectroscopic interference throughout a chromatographic run [73] [74].
Materials:
- HPLC system with UV-Vis detector.
- Solution of the analyte for continuous infusion.
- Blank matrix extract.
Procedure:
- Infuse the analyte solution post-column at a constant rate while running the mobile phase gradient.
- Inject the blank matrix extract. As the blank components elute from the column, they mix with the infused analyte.
- Monitor the detector signal. A stable signal indicates no interference. A depression or elevation of the signal indicates the retention time windows where matrix components are causing suppression or enhancement, respectively [73].
- Use this information to adjust the chromatographic method, ensuring the analyte of interest elutes in a "clean" region, or to optimize sample clean-up procedures.
Data Presentation and Analysis
Solvent-Induced Spectral Shifts of Indapamide
The following table summarizes the experimental data from a study on the antihypertensive drug indapamide, demonstrating how different solvents affect its UV-Vis absorption characteristics. Such data is critical for selecting an appropriate solvent when monitoring this drug's synthesis or dissolution [75].
Table 1: Solvent Effects on the UV-Vis Absorption Spectra of Indapamide [75]
| Solvent | Polarity | λmax (nm) | Absorbance | Observed Spectral Shift |
|---|---|---|---|---|
| DMSO | High | 242.0 | 1.85 | Strong Red-Shift |
| Methanol | High | 240.5 | 1.80 | Red-Shift |
| Ethanol | High | 240.0 | 1.78 | Red-Shift |
| THF | Medium | 237.5 | 1.75 | Slight Red-Shift |
Performance Comparison of UV-Vis and FT-IR for Complex Matrices
A study comparing UV-Vis and FT-IR for quantifying polyphenols in red wine provides a excellent model for assessing technique robustness in a complex matrix. The results below can guide the choice of spectroscopic technique for monitoring reactions in similar complex media [78].
Table 2: Comparison of PLS Model Performance for Polyphenol Quantification in Red Wine [78]
| Analytical Parameter | Spectroscopic Technique | Coefficient of Determination (R²) | Model Robustness |
|---|---|---|---|
| Tannin Concentration | FT-IR | > 0.7 | Higher |
| Tannin Concentration | UV-Vis | > 0.7 | Moderate |
| Anthocyanin Concentration | UV-Vis | > 0.7 | Higher |
| Anthocyanin Concentration | FT-IR | > 0.7 | Moderate |
| Combined FT-IR & UV-Vis | Both | > 0.7 (Improved) | Highest |
The Scientist's Toolkit: Essential Research Reagents and Materials
Table 3: Key Reagents and Materials for Solvent and Matrix Effect Studies
| Item Name | Function/Application | Key Considerations |
|---|---|---|
| Kamlet-Taft Solvent Parameters | Quantitative descriptors of solvent polarity, hydrogen-bond donation, and acceptance used to correlate and predict solvent effects [75]. | Provides a multi-parameter approach beyond a single polarity index for more accurate modeling. |
| Deuterated Solvents (e.g., D₂O, CDCl₃) | Used as NMR-inert solvents in spectroscopy; also serve as high-purity options for FT-IR to minimize interference from water peaks. | Essential for preparing samples for FT-IR where O-H stretching from water can obscure the analyte signal. |
| Analyte Protectants (e.g., Gulonolactone, Sorbitol) | Compounds added to samples to interact with active sites in analytical systems, reducing analyte adsorption and degradation, thereby minimizing matrix effects [79]. | Particularly useful in complex matrices like herbal extracts; a cheap and effective alternative to expensive labeled standards. |
| Primary-Secondary Amine (PSA) | A clean-up sorbent used in QuEChERS extraction to remove fatty acids and other polar interferences from complex matrices prior to analysis [79]. | Improves assay accuracy and reduces matrix-induced signal variations in subsequent spectroscopic analysis. |
| Stable Isotope-Labeled Internal Standards | Internal standards with identical chemical properties but different mass, used to compensate for matrix effects by normalizing the analyte response [73] [74]. | Considered the "gold standard" for compensation but can be expensive and are not always commercially available. |
Workflow for Managing Solvent and Matrix Interferences
The following diagram illustrates a logical, step-by-step workflow for diagnosing and addressing interferences in spectroscopic analysis.
Diagram 1: A logical workflow for diagnosing and addressing spectroscopic interferences.
In the field of spectroscopic reaction monitoring, modern analytical platforms generate massive amounts of complex, high-dimensional data [80]. Chemometrics provides the mathematical and statistical framework to extract meaningful chemical information from this data, transforming raw spectral measurements into actionable insights about reaction progress, quality, and composition [81]. Within this framework, Principal Component Analysis (PCA) and Partial Least Squares (PLS) regression have emerged as two foundational techniques that respectively address the complementary challenges of exploratory data analysis and predictive modeling [82] [83].
This article provides detailed application notes and protocols for implementing PCA and PLS within the context of spectroscopic monitoring of chemical reactions, with particular emphasis on pharmaceutical development and research. The guidance is structured to enable researchers and scientists to deploy these methods effectively in their analytical workflows.
Theoretical Foundations
Principal Component Analysis (PCA)
PCA is a mathematical method for reorganizing information in a dataset, particularly valuable when dealing with large numbers of correlated variables such as spectroscopic measurements [84]. The core objective of PCA is dimensionality reduction – describing the majority of information content in original data with considerably fewer variables [84].
The algorithm operates by identifying new, uncorrelated variables called Principal Components (PCs) that capture maximum variance in the data according to specific rules:
- The first PC defines the direction through the data that explains the most variability
- The second PC must be orthogonal (at right angles) to the first PC while describing the maximum amount of remaining variability
- Each subsequent PC follows the same orthogonality and maximum remaining variance principles [84]
The resulting scores represent the values of individual samples expressed in terms of the PCs, while weights (or loadings) are the coefficients describing how each original variable contributes to the PCs [84].
Partial Least Squares (PLS) Analysis
PLS analysis represents the most favored tool in chemometrics for developing calibration models that relate predictor variables (e.g., spectra) to predicted variables (e.g., concentration) [85]. Unlike PCA, which operates solely on the predictor space, PLS specifically maximizes covariance between predictor blocks (X) and response blocks (Y) [85].
The PLS algorithm not only captures maximum variation associated with both predictor and predicted variables but also explicitly maximizes the correlation between them [85]. This dual focus makes PLS particularly powerful for building predictive models from spectral data where the relationship between measurements and chemical properties of interest must be quantified.
Experimental Protocols
Sample Preparation and Data Collection
Table 1: Key Research Reagent Solutions for Chemometric Analysis
| Reagent/Material | Function in Chemometric Analysis |
|---|---|
| Pharmaceutical Tablets | Representative solid dosage forms for NIR spectroscopic analysis and model development [84] |
| Freeze-dried Formulations | Model system containing varying excipient levels (e.g., sucrose, arginine) for methodological validation [82] |
| Extra-virgin Olive Oil | Complex natural product for authentication studies using ICP-MS and chemometrics [80] |
| Synthetic Mixture Spectra | Controlled reference standards with known composition for calibration and validation [86] |
Protocol 1: Sample Preparation for Pharmaceutical Reaction Monitoring
- Prepare formulations with systematically varied component levels (e.g., increasing sucrose and/or arginine concentrations) to capture expected compositional variation [82]
- Ensure representative sampling across the entire reaction process or product range to build robust models
- Document all known sources of variation including operator, instrument, and environmental factors that may influence spectral measurements [82]
- Include quality control samples at regular intervals to monitor analytical performance over time
Protocol 2: Spectral Data Collection
- Select appropriate spectroscopic technique based on analytical requirements (NIR for rapid, non-destructive analysis; Raman for in-packaged testing; ICP-MS for elemental composition) [80] [87]
- Standardize measurement conditions including spectral range, resolution, and number of scans to ensure data consistency
- Collect spectra from sufficient samples to adequately represent population variability (typically >30 samples for initial models)
- Incorporate replication to assess measurement reproducibility and uncertainty
Data Preprocessing Workflow
Protocol 3: Essential Preprocessing Steps
- Apply Standard Normal Variate (SNV) or multiplicative scatter correction to address light scattering effects and path length variations [82]
- Implement detrending to remove baseline offsets and linear trends that may obscure chemical information
- Calculate derivatives (first or second) to enhance resolution of overlapping spectral features and eliminate baseline effects
- Perform mean centering by subtracting the average spectrum to focus PCA on covariance rather than absolute values [84]
- Validate preprocessing effectiveness through visual inspection of treated spectra and preliminary PCA
PCA for Exploratory Analysis
Protocol 4: Implementing Principal Component Analysis
- Structure data matrix with samples as rows and spectral variables (wavelengths) as columns
- Apply selected preprocessing methods from Protocol 3 to the data matrix
- Perform PCA computation using established algorithms (NIPALS, SVD) available in most chemometric software packages
- Determine optimal number of components through cross-validation, scree plots, or cumulative variance explained [84]
- Interpret results through:
- Scores plots to identify sample clusters, outliers, and patterns
- Loadings plots to understand which spectral variables contribute to each PC
- Variance explained to assess information capture per component
Table 2: Interpreting PCA Results in Spectroscopic Reaction Monitoring
| PCA Output | Interpretation | Common Observations in Reaction Monitoring |
|---|---|---|
| PC1 Scores | Major direction of variance in dataset | Often correlates with pathlength/particle size effects in NIR data [84] |
| PC2/PC3 Scores | Secondary variance directions after PC1 | Frequently reveals chemical composition differences or reaction progression [84] |
| Outliers in Scores Plot | Atypical samples deviating from main distribution | May indicate failed reactions, contaminants, or analytical errors |
| PC Loadings | Spectral features contributing to each PC | Identifies wavelengths associated with chemical changes during reactions |
| Variance Explained | Proportion of total information captured by each PC | Typically >99.9% with <20 PCs for spectroscopic data [84] |
PLS for Predictive Modeling
Protocol 5: Developing PLS Calibration Models
- Define calibration set representing the expected variability in future samples, ensuring adequate representation of all factors influencing spectra
- Reference method analysis using primary analytical techniques to obtain accurate reference values (Y-block) for calibration samples
- Perform PLS regression to establish relationship between spectral data (X-block) and reference values (Y-block)
- Optimize model complexity by determining the optimal number of latent variables through cross-validation to avoid overfitting [85]
- Validate model performance using independent test sets not included in calibration, reporting key figures of merit:
Table 3: Key Figures of Merit for PLS Model Validation
| Parameter | Calculation | Acceptance Criteria |
|---|---|---|
| Root Mean Square Error of Calibration (RMSEC) | $\sqrt{\frac{\sum{i=1}^{n{cal}}(\hat{y}i-yi)^2}{n_{cal}}}$ | Assess model fit to calibration data |
| Root Mean Square Error of Prediction (RMSEP) | $\sqrt{\frac{\sum{i=1}^{n{test}}(\hat{y}i-yi)^2}{n_{test}}}$ | Primary indicator of predictive ability |
| Coefficient of Determination (R²) | $1-\frac{\sum{i=1}^{n}(yi-\hat{y}i)^2}{\sum{i=1}^{n}(y_i-\bar{y})^2}$ | >0.90 for quality control applications |
| Ratio of Performance to Deviation (RPD) | $\frac{SD}{RMSEP}$ | >3.0 for screening; >5.0 for quality control |
Advanced Applications in Spectroscopic Reaction Monitoring
Multivariate Statistical Process Control (MSPC)
Protocol 6: Implementing MSPC for Reaction Monitoring
- Collect historical process data from normal operation to establish baseline model [88]
- Develop PCA model on reference data representing normal operating conditions
- Establish control limits for multivariate control charts (Hotelling's T², Q-residuals) based on the reference distribution
- Monitor new process samples by projecting them into the established PCA model and calculating their statistical metrics
- Implement fault detection by identifying when process measurements exceed control limits, triggering investigation [80]
Classification with PLS-DA
Protocol 7: Developing PLS-DA Classification Models
- Define discrete classes representing different reaction outcomes, product grades, or quality attributes
- Assign class membership to calibration samples based on reference methods or known outcomes
- Develop PLS-DA model using class membership as the Y-variable instead of continuous properties [82]
- Establish classification thresholds based on predicted class probabilities or discriminant scores
- Validate classification accuracy using confusion matrices and cross-validation to ensure robust performance
Integration with Artificial Intelligence
Modern chemometric workflows increasingly integrate Artificial Intelligence (AI) and Machine Learning (ML) to enhance traditional PCA and PLS approaches [81]. Key integration points include:
- Deep Learning for automated feature extraction from raw or minimally preprocessed spectral data using architectures like Convolutional Neural Networks (CNNs) [81]
- Explainable AI (XAI) techniques to interpret complex models and identify informative wavelength regions, preserving chemical interpretability [81]
- Generative AI for creating synthetic spectral data to balance datasets, enhance calibration robustness, or simulate missing spectra [81]
- Ensemble Methods like Random Forest and XGBoost that can complement PLS for handling nonlinear relationships in complex reaction systems [81]
PCA and PLS represent powerful chemometric tools that transform complex spectroscopic data into actionable information for reaction monitoring. The protocols presented provide a structured framework for implementing these techniques in pharmaceutical development and research settings. By following standardized approaches to data preprocessing, model development, and validation, researchers can reliably extract meaningful chemical information, build robust predictive models, and implement effective process monitoring strategies. The ongoing integration of AI with classical chemometric methods promises even greater capabilities for understanding and controlling chemical reactions through spectroscopic monitoring.
This application note provides detailed protocols for troubleshooting common issues in spectroscopic instruments, specifically within the context of research focused on monitoring chemical reactions. For researchers and drug development professionals, maintaining the integrity of spectroscopic data is paramount. Signal noise, component contamination, and optical misalignment can significantly compromise data quality, leading to inaccurate reaction monitoring and erroneous conclusions. This document outlines practical, actionable strategies to identify, diagnose, and resolve these challenges, leveraging the latest advancements in spectroscopic techniques.
Signal Noise: Identification and Mitigation
Excessive signal noise obscures spectral features and reduces the reliability of quantitative data, which is particularly critical when tracking reaction intermediates or kinetics.
Advanced Noise Reduction via Compressed Sensing
Traditional sampling at the Nyquist rate can be a significant source of noise. Compressed Sensing (CS) is an advanced under-sampling technique that leverages signal sparsity to reduce both measurement noise and intrinsic noise [89].
- Principle: CS allows for accurate signal reconstruction from fewer measurements than required by the Nyquist-Shannon theorem by assuming the signal is sparse in some domain [89].
- Experimental Protocol for CS Implementation:
- Setup: Employ a digital mirror device (DMD) to create structured illumination patterns for random temporal sampling of the spectroscopic signal [89].
- Data Acquisition: Collect a series of single-shot measurements (e.g., for pump-probe spectroscopy) using varying, random sampling patterns instead of uniform delay spacing.
- Signal Reconstruction: Use sparsity-promoting optimization algorithms (e.g., L1-norm minimization) to reconstruct the final, high-fidelity spectrum from the under-sampled data [89].
- Expected Outcome: Application of CS to single-shot pump-probe data has demonstrated effectiveness in mitigating signal noise, leading to clearer spectral data without the need for extensive signal averaging [89].
Calibration and Error Assessment
Accurate calibration is fundamental for minimizing perceived noise and understanding the true error of an analysis.
- Best Practice: Assess the precision of laboratory reference values used for calibration by running multiple replicates of a sample to determine the standard deviation. The true error of the spectral analysis is typically between 50% and 75% of the error reported during the initial calibration step [90].
- Key Insight: A well-calibrated spectrometer, due to the high precision of optical spectroscopy, will often outperform the laboratory reference methods used to calibrate it [90].
Table 1: Summary of Signal Noise Sources and Solutions
| Noise Source | Impact on Data | Recommended Mitigation Protocol |
|---|---|---|
| Sub-Nyquist Sampling | Increased noise, obscured features | Implement Compressed Sensing with a DMD for random temporal sampling [89]. |
| Poor Calibration | Inaccurate quantification, high apparent error | Characterize reference method precision; true error is often 50-75% of apparent calibration error [90]. |
| Detector Variability | Additive or multiplicative noise, signal drift | Standardize instruments using Direct Standardization (DS) or Piecewise Direct Standardization (PDS) [91]. |
Contamination: Source Analysis and Prevention
Contamination can introduce spurious signals, mask analyte peaks, and foul instrument components, leading to signal drift and permanent damage.
Chemical Fingerprinting for Source Identification
Non-targeted screening combined with high-resolution mass spectrometry (HRMS) provides a powerful strategy for identifying contamination sources by interpreting complex chemical fingerprints [92].
- Experimental Protocol for GC-HRMS Contamination Analysis:
- Sample Collection: Collect solid or liquid samples from potential contamination sources.
- Non-Targeted Screening: Analyze samples using Gas Chromatography-High Resolution Mass Spectrometry (GC-HRMS) to characterize thousands of organic compounds without prior targeting [92].
- Data Analysis Workflow:
- Similarity Analysis: Use principal component analysis (PCA) or hierarchical cluster analysis (HCA) to find common characteristics among contaminants from the same source [92].
- Difference Analysis: Identify characteristic marker contaminants that differentiate sample subcategories (e.g., in a case study, 169 such markers were identified in landfill leachate) [92].
- Hazard Screening: Screen the identified compounds against hazardous chemical (HC) databases to assess ecological risk [92].
Real-Time Monitoring with Miniature Mass Spectrometry
For monitoring ongoing reactions, compact analytical techniques can reduce the risk of contamination from extensive sample handling.
- Technology: Thermal Desorption Electrospray Ionization Mass Spectrometry (TD-ESI/MS) is a miniature ambient ionization technique ideal for on-site and decentralized applications [93].
- Protocol for Reaction Monitoring:
- Sample Introduction: Apply 2 µL of sample solution directly from the reaction vessel onto a metal probe [93].
- Thermal Desorption: Pass a direct current through the wire to rapidly heat and desorb the analyte, generating droplets and gaseous molecules [93].
- Ionization and Detection: The desorbed analytes are delivered into an ESI plume for soft ionization and detected by a miniature ion trap mass analyzer. The entire process takes less than 15 seconds per analysis, allowing for rapid profiling of reactants, intermediates, and products with minimal solvent waste [93].
Optical Alignment and Calibration Transfer
Spectral inconsistencies due to misalignment or differences between instruments are a major obstacle to reproducible research.
Universal Calibration Techniques
Inter-instrument variability, caused by factors like wavelength shift, resolution differences, and detector noise, can render a model developed on one spectrometer (the "master") ineffective on another (the "slave") [91].
- Standardization Techniques:
- Direct Standardization (DS): Applies a global linear transformation to map slave spectra to the master's domain. It requires a set of identical samples to be run on both instruments [91].
- Piecewise Direct Standardization (PDS): A more robust method that applies localized linear transformations across different spectral segments, better handling local nonlinearities [91].
- External Parameter Orthogonalization (EPO): A pre-processing method that projects spectra onto a subspace orthogonal to the known sources of variability (e.g., instrument effects), which can be used even without full sample sets [91].
Novel Fiber-Based Calibration
Conventional calibration using aerosolized particles is challenging for larger particles due to losses. A static fiber-based method offers a robust alternative.
- Protocol for Fiber-Based OPS Calibration:
- Setup: Mount a static, finite-length fiber within the sample area of an Optical Particle Spectrometer (OPS) to traverse the laser beam [94].
- Measurement: Measure the scattering cross section (SCS) generated by the fiber.
- Theoretical Calculation: Calculate the expected SCS using Generalised Lorenz-Mie Theory (GLMT), which accounts for deviations in beam intensity profile [94].
- Calibration: Compare the measured and theoretical SCS values to derive the instrument's calibration function. This technique is instrument-independent and suitable for field calibration [94].
Table 2: Common Inter-Instrument Variability Factors and Calibration Solutions
| Variability Factor | Impact on Model Transfer | Standardization Solution |
|---|---|---|
| Wavelength Shift | Misalignment of absorbance features, reduced prediction accuracy | Piecewise Direct Standardization (PDS) [91]. |
| Spectral Resolution | Altered peak shapes, distorting multivariate models | Direct Standardization (DS) or instrument harmonization [91]. |
| Detector Noise | Altered signal-to-noise ratio, erroneous latent variables | External Parameter Orthogonalization (EPO) to remove non-chemical variance [91]. |
The Scientist's Toolkit: Essential Research Reagents & Materials
Table 3: Key Reagents and Materials for Spectroscopic Reaction Monitoring
| Item | Function/Benefit | Example Application |
|---|---|---|
| Static Calibration Fibers | Provides a stable, calculable scattering target for instrument calibration, independent of aerosol generation [94]. | Calibrating Optical Particle Spectrometers (OPS) for large particle sizes [94]. |
| TD-ESI Metal Probe | Enables rapid thermal desorption and ionization of liquid samples for direct mass spectrometric analysis with minimal sample volume [93]. | Monitoring kinetics of condensation or Tröger's base formation reactions in real-time [93]. |
| Metamaterial Substrates | Artificial subwavelength structures that confine light and generate intense electromagnetic fields, enhancing spectroscopic signals [95]. | Surface-Enhanced Raman Scattering (SERS) or Infrared Absorption (SEIRA) for detecting trace reactants or products [95]. |
| Standard Reference Materials | Well-characterized materials used to establish and verify the accuracy of spectroscopic calibrations across instruments [91]. | Implementing Direct Standardization (DS) or Piecewise Direct Standardization (PDS) for model transfer [91]. |
Integrated Experimental Workflow
The following diagram illustrates a logical workflow for diagnosing and troubleshooting the common instrument issues discussed in this note.
Choosing the Right Tool: A Comparative Analysis of Spectroscopic Techniques
Within chemical reaction research, selecting the appropriate analytical technique is paramount to obtaining meaningful data. Spectroscopic methods, which study the interaction between light and matter, provide a powerful toolkit for monitoring reactions, identifying intermediates, and quantifying products [96]. The fundamental goal is to match the specific analytical question—whether about molecular structure, composition, or kinetics—to the inherent strengths of each spectroscopic method. This guide provides a structured overview of major spectroscopic techniques, detailing their applications, and includes standardized protocols for their application in reaction monitoring.
Spectroscopic techniques probe different molecular and atomic properties by utilizing various regions of the electromagnetic spectrum. The following table summarizes the key characteristics, primary applications, and performance metrics of the most common spectroscopic methods used in chemical reaction monitoring.
Table 1: Comparison of Spectroscopic Techniques for Reaction Monitoring
| Technique | Spectral Region (Wavelength / Wavenumber) | Type of Information | Typical Detection Limit | Dynamic Range | Key Applications in Reaction Monitoring |
|---|---|---|---|---|---|
| Ultraviolet-Visible (UV-Vis) | 190–780 nm [97] | Electronic transitions | Parts per billion (ppb) level [96] | Wide [98] | Reaction kinetics, concentration quantification, color development [96] |
| Infrared (IR/FTIR) | 4000–400 cm⁻¹ [99] | Fundamental molecular vibrations | Percentage to ppm level [96] | Moderate | Functional group identification, reactant consumption, intermediate detection [97] [99] |
| Near-Infrared (NIR) | 2270–1440 nm (example bands) [97] | Overtone/combination vibrations | Percentage level (e.g., sucrose) [100] | Wide | Quantitative analysis of complex mixtures (e.g., polymers, moisture) [97] [100] |
| Raman | 1680–1630 cm⁻¹ (e.g., C=C stretch) [97] | Molecular vibrations (complementary to IR) | Varies | Moderate | Aqueous solutions, glass reactors, symmetric bonds, functional groups (e.g., C≡C, S-S) [97] |
| Atomic Emission | Varies by element | Elemental composition | Varies | Wide | Multielemental analysis, trace metal catalyst tracking [101] |
| Fluorescence | Varies with analyte | Emission from excited states | Very low (ppb) [96] | Wide | Tracking specific fluorophores, high-sensitivity quantification [96] |
Experimental Protocols for Key Techniques
Protocol for Monitoring Reaction Kinetics via UV-Vis Spectroscopy
This protocol details the use of UV-Vis spectroscopy to track the progress of a chemical reaction in solution by monitoring the appearance or disappearance of a chromophore.
1. Research Reagent Solutions & Essential Materials
Table 2: Key Materials for UV-Vis Reaction Monitoring
| Item | Function/Explanation |
|---|---|
| Double-beam UV-Vis Spectrophotometer | Measures the absorption of light by the sample relative to a reference blank, compensating for source fluctuations [101]. |
| Quartz Cuvettes (e.g., 1 cm pathlength) | Hold liquid samples; quartz is transparent across the UV and visible wavelength ranges. |
| Reaction Solvent (High Purity) | Serves as the matrix for the reaction and is used to prepare the reference blank. |
| Stock Solutions of Reactants | Prepared in the reaction solvent at precise, known concentrations. |
| Temperature-Controlled Cuvette Holder | Maintains a constant temperature to ensure reproducible kinetic data. |
2. Methodology
- Instrument Preparation: Turn on the UV-Vis spectrophotometer and allow the lamp to warm up for the time specified by the manufacturer (typically 15-30 minutes). Initialize the associated software for kinetics data acquisition.
- Wavelength Selection: Based on prior knowledge or a preliminary scan of one of the reactants or products, select a wavelength where the species of interest (e.g., the product) absorbs significantly, and where the change in absorbance over time is expected to be large.
- Baseline Correction: Fill a cuvette with the pure reaction solvent, place it in the reference compartment, and run a baseline correction to account for any solvent absorption.
- Reaction Initiation:
- Pipette a known volume of the primary reactant stock solution into a cuvette.
- Rapidly add a known volume of the second reactant stock solution, cap the cuvette, and mix thoroughly by inverting several times or using a small stir bar.
- Immediately place the cuvette in the sample compartment of the spectrophotometer.
- Data Acquisition: Start the kinetics measurement. The instrument will automatically record the absorbance at the pre-set wavelength at regular time intervals (e.g., every second) for the duration of the reaction.
- Data Analysis: Export the data (Time vs. Absorbance). Convert absorbance to concentration using the Beer-Lambert law (A = ε * b * C) if the molar absorptivity (ε) of the absorbing species is known. Plot concentration versus time to determine the reaction rate and kinetic parameters.
Protocol for Functional Group Analysis via FTIR Spectroscopy
This protocol describes the use of FTIR spectroscopy to identify functional groups present in a reaction product or to monitor their appearance/disappearance during a reaction.
1. Research Reagent Solutions & Essential Materials
Table 3: Key Materials for FTIR Analysis
| Item | Function/Explanation |
|---|---|
| FTIR Spectrometer | Utilizes an interferometer and Fourier transform for rapid, sensitive collection of infrared spectra [99]. |
| ATR (Attenuated Total Reflectance) Accessory | Allows for direct analysis of solid and liquid samples without preparation by measuring the interaction of IR light with the sample surface. |
| Potassium Bromide (KBr) | For creating pressed pellets of solid samples, as KBr is transparent in the IR region. |
| Hydraulic Press | Used to create transparent KBr pellets under high pressure. |
| Solvents (e.g., CHCl₃, ACN) | Anhydrous, IR-grade solvents for preparing liquid film samples. |
2. Methodology
- Background Scan: With no sample present in the beam path (or a clean ATR crystal), collect a background interferogram and convert it to a spectrum. This will be subtracted from the sample spectrum.
- Sample Preparation (Choose appropriate method):
- ATR Method: Place a few milligrams of a solid sample or a drop of liquid directly onto the ATR crystal. Ensure good contact by tightening the pressure clamp.
- KBr Pellet Method: Grind 1-2 mg of the solid sample with approximately 200 mg of dry KBr. Transfer the mixture to a die and press under vacuum at 5-10 tons of pressure for 1-2 minutes to form a transparent pellet.
- Sample Scanning: Place the prepared sample in the spectrometer and collect the interferogram. The instrument's software will apply the Fourier transform to generate the infrared absorption spectrum.
- Data Analysis: Examine the resulting spectrum for characteristic absorption bands (e.g., C=O stretch ~1700 cm⁻¹, O-H stretch ~3300 cm⁻¹) [97] [99]. Compare the spectrum to reference libraries for compound identification. For reaction monitoring, track the intensity of key peaks associated with reactant or product functional groups over time.
Workflow Visualization
The following diagram illustrates the logical decision process for selecting the most appropriate spectroscopic technique based on the primary analytical question.
Vibrational spectroscopy and nuclear magnetic resonance (NMR) spectroscopy serve as foundational tools for monitoring chemical reactions in research and development. Understanding the comparative strengths of Fourier-Transform Infrared (FT-IR), Raman, and NMR spectroscopy is crucial for selecting the optimal analytical technique for specific applications, particularly in pharmaceutical and chemical manufacturing. This analysis provides a detailed comparison of these techniques based on information depth, sensitivity, and speed, with specific application notes and experimental protocols for monitoring chemical conversions. Each technique offers unique capabilities: FT-IR excels at detecting polar functional groups, Raman spectroscopy is ideal for non-polar molecular backbones and aqueous samples, and NMR provides unparalleled structural elucidation despite traditionally longer acquisition times. Recent advancements, including the integration of artificial intelligence (AI) and novel detection methods, are significantly accelerating the capabilities of these spectroscopic techniques, opening new possibilities for real-time reaction monitoring and high-throughput analysis [102] [103].
Technical Comparison of Spectroscopic Techniques
Fundamental Principles and Comparative Strengths
The selection between FT-IR, Raman, and NMR spectroscopy hinges on their fundamental physical principles, which dictate their sensitivity to different molecular features and their suitability for various sample types.
FT-IR Spectroscopy measures the absorption of infrared light by molecular bonds, causing characteristic vibrations. It is highly sensitive to polar functional groups (e.g., O-H, C=O, N-H) and is excellent for identifying organic compounds, polymers, and pharmaceuticals. However, water strongly absorbs IR light, making FT-IR less ideal for aqueous solutions without specialized accessories [104].
Raman Spectroscopy operates on the principle of inelastic scattering of monochromatic laser light. It measures the energy shift (Raman shift) as photons interact with molecular vibrations. Raman is particularly effective for analyzing non-polar bonds (e.g., C-C, C=C, S-S) and symmetric molecular vibrations. A key advantage is its compatibility with aqueous samples, as water produces a very weak Raman signal, making it indispensable for biological and aqueous reaction monitoring [104].
NMR Spectroscopy exploits the magnetic properties of certain atomic nuclei (e.g., ^1H, ^13C). When placed in a strong magnetic field, these nuclei absorb and re-emit electromagnetic radiation at frequencies characteristic of their chemical environment. NMR provides exhaustive information on molecular structure, dynamics, and interactions but traditionally requires longer acquisition times, especially for multidimensional experiments [103].
Table 1: Core Principles and Sensitivity Profiles
| Technique | Fundamental Principle | Best For | Key Sensitivity |
|---|---|---|---|
| FT-IR | Absorption of infrared light | Organic & polar molecules | Polar bonds (O-H, C=O, N-H) |
| Raman | Inelastic scattering of laser light | Non-polar molecules & aqueous samples | Non-polar bonds (C=C, S-S) |
| NMR | Absorption of radio waves by nuclei in a magnetic field | Molecular structure & dynamics | Chemical environment of nuclei (e.g., ^1H, ^13C) |
Quantitative Comparison: Information Depth, Sensitivity, and Speed
A direct comparison of the performance metrics for FT-IR, Raman, and NMR spectroscopy reveals their distinct operational profiles. The following table synthesizes key quantitative and qualitative data to guide technique selection.
Table 2: Performance Comparison for Reaction Monitoring
| Parameter | FT-IR | Raman | NMR |
|---|---|---|---|
| Information Depth | Surface to bulk (µm range); depends on setup [105] | Surface to bulk; can probe depths up to several mm with diffuse techniques like SORS/TD-DIRS [105] | Bulk technique; probes entire sample volume |
| Sensitivity (Quantitative) | Excellent for polar species; RMSEP can reach ~0.54 for specific analytes like PAO conversion [106] | Good for non-polar species; can suffer from fluorescence interference; RMSEP ~0.62 (with MSC) for PAO, but repeatability issues noted [106] | High sensitivity to molecular structure; can detect subtle changes in chemical environment |
| Speed / Acquisition Time | Very fast (seconds to minutes) | Fast; new methods like PT-SRS offer 10,000x speedup over confocal Raman [107] | Traditionally slow (minutes to hours); AI acceleration can reduce 4D data acquisition from months to hours [103] |
| Spectral Accuracy | High wavenumber precision; peak position known within 1.1 cm⁻¹ at 4 cm⁻¹ resolution [108] | Subject to instrumental calibration; potential laser-induced sample damage | Excellent frequency precision; enables ultra-high-resolution spectroscopy |
| Key Advantage | Excellent for polar functional groups, high repeatability | Excellent for aqueous samples, minimal sample prep, can analyze through containers | Unmatched structural elucidation, non-destructive, quantitative |
| Key Limitation | Strong water absorption, weak for non-polar bonds | Fluorescence interference, potentially lower sensitivity for some samples | Long acquisition times, high instrument cost, requires expert operation |
Application Notes & Experimental Protocols
Protocol 1: Monitoring Poly Alpha Olefin (PAO) Conversion
Objective: To determine the most suitable spectroscopic technique for the rapid, quantitative analysis of the conversion rate of monomer α-olefin in PAO base oil production [106].
Background: The conversion rate is a critical quality parameter for PAO base oil. Traditional methods like titration are tedious, while spectroscopic techniques offer a fast and non-destructive alternative.
Materials & Reagents:
- PAO Base Oil Samples: 125 samples with conversion rates pre-determined by gas chromatography (GC) [106].
- Spectrometers: NIR, FT-IR, and Raman spectrometers.
- Software: Chemometric software capable of Partial Least Squares (PLS) regression and spectral preprocessing.
Procedure:
- Sample Preparation: Present samples without any chemical pretreatment to all three spectrometers to maintain the non-destructive nature of the analysis.
- Spectral Acquisition:
- NIR: Collect spectra in the near-infrared range.
- FT-IR: Collect spectra using an FT-IR spectrometer, preferably with an ATR accessory to simplify sample handling.
- Raman: Collect spectra using a Raman spectrometer with an appropriate laser wavelength to minimize fluorescence.
- Spectral Preprocessing: Apply various preprocessing algorithms to the raw spectral data to reduce noise and enhance relevant features. Test methods include:
- Multiplicative Scatter Correction (MSC)
- Standard Normal Variate (SNV)
- First and Second Derivatives (e.g., using Savitzky-Golay filters)
- Adaptive iteratively reweighted penalized least squares (airPLS)
- Calibration Model Development:
- Use the GC-determined conversion rates as the reference data.
- For each spectroscopic technique, establish a separate calibration model using PLS regression on the preprocessed spectra.
- Model Validation: Evaluate the performance of each model using cross-validation. Key indicators include the Root Mean Square Error of Prediction (RMSEP) and an assessment of test repeatability.
Results & Interpretation:
- In a comparative study, FT-IR spectra pretreated with the second derivative yielded the best prediction accuracy (RMSEP = 0.54) and excellent repeatability, establishing it as the most suitable technique for this specific application [106].
- Raman spectroscopy pretreated with MSC also showed good prediction accuracy (RMSEP = 0.62), but its test repeatability was found to be unacceptable for reliable quality control.
- NIR provided better repeatability than Raman but lower prediction accuracy (RMSEP = 1.02) than FT-IR.
Protocol 2: AI-Accelerated Ultrahigh-Resolution NMR
Objective: To achieve fast acquisition of ultrahigh-resolution 2D NMR spectra for in-situ monitoring of dynamic processes like electrocatalytic reactions [103].
Background: Conventional high-dimensional NMR requires prohibitively long acquisition times. This protocol uses a deep learning approach, Rank-One Approximation Decomposition (ROAD), to reconstruct spectra from highly undersampled data.
Materials & Reagents:
- NMR Spectrometer: Capable of non-uniform sampling (NUS).
- ROAD Software: Deep learning network for NMR reconstruction.
- Protein or Reaction Sample: For example, a protein for structure determination or a reaction mixture for in-situ monitoring.
Procedure:
- Data Acquisition: Acquire the multidimensional NMR signal (e.g., 3D or 4D) using a highly accelerated NUS schedule (e.g., as low as 3-5% of traditional sampling).
- DL Reconstruction: Process the undersampled Free Induction Decay (FID) data using the pre-trained ROAD network. The method works by:
- Modeling the time-domain signal as the outer product of 1D exponentials.
- Approximating each 1D exponential with a rank-one Hankel matrix.
- Correcting the reconstruction error with a neural network.
- Spectral Analysis: Use the reconstructed ultrahigh-resolution spectrum for applications such as protein structure determination, peak assignment, or monitoring reaction kinetics.
Results & Interpretation:
- The ROAD method enables the reconstruction of 3D and 4D NMR spectra with high fidelity from data acquired in a fraction of the time.
- It demonstrates robustness across a wide range of acceleration factors (2 to 33) using a single trained network, overcoming a major limitation of earlier deep learning methods [103].
- This protocol allows for the in-situ observation of processes like electrocatalytic reactions of 1-butanol, which was previously impractical due to time constraints.
Essential Research Reagent Solutions
Table 3: Key Materials and Their Functions
| Item | Function / Application |
|---|---|
| ATR-FT-IR Accessory | Enables simple analysis of solids and liquids with minimal sample preparation [109] [104]. |
| Portable Raman Spectrometer | Allows for in-situ and on-site analysis, including through transparent containers [104]. |
| Chemometric Software (PLS, PCA) | Essential for extracting quantitative and qualitative information from complex spectral data [106] [109]. |
| NUS (Non-Uniform Sampling) Schedule | Dramatically reduces NMR acquisition time by sampling only a fraction of the traditional data points [103]. |
| Deep Learning Models (e.g., 1D-CNN, ROAD) | Accelerate spectral acquisition, reconstruction, and classification in Raman and NMR spectroscopy [110] [103]. |
Workflow and Technique Selection Diagram
The following diagram illustrates the decision-making workflow for selecting the most appropriate spectroscopic technique based on sample properties and analytical goals.
The comparative analysis of FT-IR, Raman, and NMR spectroscopy reveals a landscape of complementary techniques. FT-IR stands out for its high accuracy and repeatability in quantifying polar functional groups. Raman spectroscopy offers superior performance for aqueous systems and non-polar molecular backbones, with emerging technologies like photothermal SRS providing dramatic improvements in speed and spatial resolution. NMR remains the gold standard for detailed structural elucidation, with AI-driven methods like ROAD overcoming its traditional speed limitations. The integration of artificial intelligence and deep learning across all these spectroscopic disciplines is a transformative trend, enabling faster data acquisition, robust reconstruction, and automated analysis. For researchers monitoring chemical reactions, the optimal strategy often involves a synergistic combination of these techniques, leveraging their individual strengths to obtain a comprehensive understanding of the reaction kinetics, mechanisms, and products.
Validating Spectroscopic Methods with Orthogonal Techniques like SEC and CD
Within research focused on spectroscopic techniques for monitoring chemical reactions, the reliability of individual analytical methods is paramount. This is especially critical in the development of therapeutic antibodies, where the stability and integrity of protein structure directly influence efficacy and safety. Relying on a single spectroscopic technique can be insufficient for comprehensive analysis. This document details application notes and protocols for validating key spectroscopic methods using orthogonal techniques, specifically Size Exclusion Chromatography (SEC) and Circular Dichroism (CD). The integration of these complementary approaches provides a robust framework for the biophysical characterization of protein-based therapeutics, enabling a more confident assessment of properties like higher order structure, conformational stability, and aggregation propensity [111].
Application Notes
The Critical Need for Orthogonal Validation
Therapeutic proteins, particularly engineered antibodies, are susceptible to alterations in their higher order structure (HOS) that can compromise function and trigger immunogenic responses. While spectroscopic techniques like CD are excellent for monitoring secondary structural changes, they provide limited information on sample homogeneity or oligomeric state. Conversely, SEC can identify aggregates but may not detect subtle conformational changes that precede aggregation. Combining these methods offers a more holistic view. For instance, a CD spectrum might indicate a partial unfolding event, while a simultaneous shift in the SEC chromatogram would confirm the formation of higher molecular weight species, validating the structural observation [111] [112]. This orthogonal strategy is essential for mitigating risk in early-stage research and therapeutic design [111].
Key Quality Attributes and Corresponding Analytical Techniques
The following table summarizes the critical quality attributes of biotherapeutics and the orthogonal techniques best suited for their assessment.
Table 1: Key Quality Attributes and Orthogonal Analytical Methods
| Quality Attribute | Primary Spectroscopic Method | Complementary Orthogonal Technique | Information Gained |
|---|---|---|---|
| Secondary Structure | Circular Dichroism (CD) [112] | FTIR Spectroscopy [112] | Confirms estimates of α-helix and β-sheet content; allows measurement of high-concentration formulations. |
| Conformational/Thermal Stability | nanoDSF [111] | CD Spectroscopy [111] | Correlates thermal unfolding transitions with loss of secondary structural elements. |
| Aggregation Propensity & Sample Homogeneity | Dynamic Light Scattering (DLS) [111] | Size Exclusion Chromatography (SEC) [111] | Confirms size distribution and quantifies monomeric vs. aggregated species. |
| Size & Oligomeric State | Mass Photometry [111] | SEC or DLS [111] | Provides orthogonal determination of molecular mass and oligomeric distribution in solution. |
| Higher Order Structure & Flexibility | Small-Angle X-Ray Scattering (SAXS) [111] | Electron Microscopy (EM) [111] | Visualizes overall shape, flexibility, and global structure. |
Interpreting Orthogonal Data: A Case Study on Engineered Antibodies
A systematic study characterizing various antibody constructs—including full-length IgG (Ab1) and single-chain variable fragments (scFvs)—demonstrates the power of orthogonal validation. The data revealed that full-length antibodies exhibited high thermal and structural stability, remaining predominantly monomeric across all tested conditions. In contrast, engineered fragments like scFvs and bispecific tandem scFvs displayed reduced conformational stability and increased aggregation propensity [111].
This was evidenced by several orthogonal measurements:
- nanoDSF and CD: showed altered thermal folding profiles for scFvs, indicating reduced stability [111].
- DLS: revealed higher polydispersity indexes for the same fragments, signaling a less homogeneous solution and the presence of aggregates [111].
- SEC: chromatograms displayed early elution peaks for unstable constructs, directly confirming the presence of soluble aggregates [111].
This multi-faceted data set underscores that engineered fragments are more prone to degradation and highlights the necessity of orthogonal methods for a robust evaluation.
Experimental Protocols
Workflow for Orthogonal Biophysical Characterization
The following diagram illustrates the integrated workflow for the orthogonal characterization of a therapeutic antibody candidate, from purification to data integration.
Protocol 1: Secondary Structure Analysis via CD and FTIR
Objective: To determine the secondary structure of a monoclonal antibody in its formulated state and validate the estimate using orthogonal FTIR spectroscopy.
Materials and Reagents
- Protein Sample: Monoclonal antibody (e.g., 10-20 mg/mL in formulation buffer) [112].
- CD Spectrometer: JASCO J-1500 CD Spectrometer or equivalent [112].
- FTIR Spectrometer: JASCO FT/IR-4X Spectrometer with ATR PRO 4X accessory or equivalent [112].
- Cuvette: Demountable short pathlength cuvette (10 µm) [112].
- Software: Spectra Manager 2.5 with BeStSel CFR add-in for secondary structure estimation [112].
CD Spectroscopy Method
Instrument Setup: Configure the CD spectrometer according to manufacturer's instructions. Purge the instrument with nitrogen gas throughout the measurement. Set parameters as follows [112]:
- Bandwidth: 1.0 nm
- Scan Speed: 50 nm/min
- Data Integration Time (D.I.T.): 4 seconds
- Accumulations: 4
- Wavelength Range: 260-200 nm
Sample Loading: Using a precision pipette, apply 6 µL of the undiluted antibody formulation directly onto the quartz window of the demountable cuvette. Assemble the cuvette according to the manufacturer's instructions to ensure no air bubbles are trapped and a consistent 10 µm pathlength is achieved.
Data Acquisition: Place the cuvette in the spectrometer and initiate data collection. The instrument will simultaneously acquire both the CD spectrum and the absorbance spectrum.
Data Processing:
- In the Spectra Manager software, input the amino acid sequence of the antibody.
- The software will automatically calculate the protein concentration from the absorbance at 280 nm and convert the raw CD signal (ellipticity in mdeg) to Mean Residue Ellipticity (MRE).
- Use the BeStSel algorithm within the software to analyze the processed CD spectrum and generate a report of the secondary structure fractions (e.g., α-helix, parallel/anti-parallel β-sheet, turns, unordered) [112].
FTIR Spectroscopy Method (Orthogonal Validation)
Instrument Setup: Configure the FTIR spectrometer with the following parameters [112]:
- Resolution: 4 cm⁻¹
- Accumulations: 128
- Detector: TGS (Triglycine Sulfate)
- N₂ Purge: On
Data Acquisition:
- Place a drop (~20 µL) of the undiluted antibody sample directly onto the crystal of the ATR accessory.
- Collect the infrared spectrum over a range of 4000-400 cm⁻¹, with a focus on the amide I region (1700-1600 cm⁻¹).
Data Processing:
- Process the spectrum by subtracting the background spectrum of the buffer and performing a straight-line baseline correction across the amide I region.
- Use the IR SSE-4X Secondary Structure Estimation Program or a similar reference-based algorithm to deconvolute the amide I peak and estimate the secondary structure fractions [112].
Data Interpretation and Validation
- Compare the secondary structure fractions obtained from CD and FTIR.
- The results from the two techniques should show excellent agreement, validating the accuracy of the structural assessment [112].
- A high-quality CD measurement will have a small normalized root-mean-square deviation (NRMSD) between the experimental and the back-calculated spectrum from the BeStSel fit [112].
Protocol 2: Assessing Conformational Stability and Aggregation
Objective: To evaluate the thermal stability of an antibody construct and correlate unfolding transitions with the formation of soluble aggregates.
Materials and Reagents
- Protein Sample: Purified antibody construct (e.g., 0.5-1.0 mg/mL in PBS or a suitable buffer).
- nanoDSF Instrument: Prometheus Panta NT48 (NanoTemper) or equivalent [111].
- SEC Instrument: ÄKTA Start system with Superdex Increase 10/300 column (Cytiva) or equivalent HPLC/UPLC system [111].
- Buffer: PBS or the protein's formulation buffer.
nanoDSF Method
- Sample Preparation: Dialyze or dilute the protein into the desired buffer. Clarify the sample by centrifugation at 10,000-15,000 × g for 10 minutes.
- Instrument Setup: Load the sample into a nanoDSF-grade glass capillary.
- Data Acquisition:
- Set a thermal ramping protocol from 20°C to 95°C with a controlled ramp rate (e.g., 1°C/min).
- The instrument will monitor the intrinsic protein fluorescence (350 nm and 330 nm) as a function of temperature.
- The software will automatically calculate the first derivative of the 350/330 nm ratio, identifying the inflection points which correspond to the protein's melting temperatures (Tm) [111].
- Data Analysis: Record the Tm values for all observed unfolding transitions. A decrease in Tm for an engineered construct compared to the full-length IgG indicates reduced conformational stability [111].
Size Exclusion Chromatography Method (Orthogonal Validation)
Chromatography Conditions:
- Column: Superdex Increase 200 5/150 GL or similar.
- Mobile Phase: PBS, pH 7.4, filtered and degassed.
- Flow Rate: 0.5 mL/min
- Detection: UV absorbance at 280 nm.
- Injection Volume: 5-10 µL of protein sample (1-2 mg/mL).
Data Acquisition:
- Equilibrate the column with at least 1.5 column volumes of mobile phase.
- Inject the sample and run the isocratic method for approximately 15 minutes or until the sample has fully eluted.
Data Analysis:
- Integrate the chromatogram to quantify the area of the monomer peak and any high molecular weight (HMW) or low molecular weight (LMW) species.
- Calculate the percentage of monomer and aggregates.
- For stressed samples (e.g., after thermal denaturation in nanoDSF), inject the sample and look for an increase in the HMW aggregate peak or a decrease in the monomer peak, providing direct, orthogonal evidence of the instability observed in the nanoDSF experiment [111].
The Scientist's Toolkit: Research Reagent Solutions
Table 2: Essential Materials and Equipment for Orthogonal Characterization
| Item | Function / Application | Example Product / Specification |
|---|---|---|
| CD Spectrometer | Analysis of protein secondary structure and folding properties. | JASCO J-1500 CD Spectrometer [112] |
| FTIR Spectrometer with ATR | Orthogonal secondary structure analysis, ideal for high-concentration formulations. | JASCO FT/IR-4X with ATR PRO 4X [112] |
| nanoDSF Instrument | Label-free analysis of thermal unfolding and conformational stability. | Prometheus Panta NT48 [111] |
| Size Exclusion Chromatography System | Separation and quantification of monomeric and aggregated protein species. | ÄKTA Start system with Superdex Increase column [111] |
| Dynamic Light Scattering (DLS) Instrument | Determination of hydrodynamic size distribution and particle polydispersity. | Anton Paar Litesizer 100 [111] |
| Short Pathlength Cuvette | Enables CD measurement of highly concentrated protein samples without dilution. | 10 µm pathlength demountable cuvette [112] |
| BeStSel Algorithm | Advanced software for accurate secondary structure estimation from CD data, including β-rich proteins. | Spectra Manager 2.5 BeStSel CFR [112] |
| Expi293F Cells | Mammalian host system for transient expression of recombinant antibodies and fragments. | Thermo Fisher Scientific [111] |
In the field of chemical reaction and process monitoring, the demand for rapid, non-destructive, and accurate analytical techniques is paramount. Spectroscopic methods, particularly Near-Infrared (NIR), Mid-Infrared (MIR), and handheld NIR spectroscopy, have emerged as powerful tools for real-time material authentication. These techniques are integral to Process Analytical Technology (PAT), enabling researchers and pharmaceutical professionals to monitor critical quality attributes during manufacturing processes [113] [114]. This case study provides a comparative performance analysis of these spectroscopic methods, underpinned by experimental data from recent research, to guide their application in chemical reaction monitoring and material authentication.
Theoretical Background and Relevance to Reaction Monitoring
Vibrational spectroscopy, encompassing both NIR and MIR regions, probes molecular vibrations to provide a characteristic fingerprint of a material's chemical composition. The MIR region (approximately 4000-400 cm⁻¹) captures fundamental molecular vibrations, offering high specificity for functional group identification [115]. In contrast, the NIR region (approximately 12,500-4000 cm⁻¹) corresponds to overtones and combinations of these fundamental vibrations, allowing for deeper penetration into samples and facilitating non-destructive analysis [116] [117].
The integration of these techniques with chemometrics—the application of mathematical and statistical methods to chemical data—is what unlocks their potential for quantitative analysis and classification. For monitoring chemical reactions, this combination allows researchers to track reaction progress, identify intermediates, and verify endpoints in real-time without disrupting the process, aligning with the Quality by Design (QbD) framework advocated by modern regulatory standards [113] [114].
Comparative Performance Data
The following table summarizes key performance metrics for NIR, MIR, and handheld NIR technologies as reported in recent authentication studies.
Table 1: Performance Comparison of Spectroscopic Techniques in Material Authentication
| Application | Technique | Accuracy | Key Chemometric Model(s) | Sample Form | Reference |
|---|---|---|---|---|---|
| Hazelnut Authentication | Benchtop NIR | >93% | PLS-DA | Whole & Ground Kernels | [118] |
| Handheld NIR | Effective for cultivar, lower for origin | PLS-DA | Whole & Ground Kernels | [118] | |
| MIR | >93% | PLS-DA | Whole & Ground Kernels | [118] | |
| A2 Milk Authentication | MIR | 88% (Test Set) | PLS-DA | Liquid Milk | [119] |
| Cashmere/Wool Discrimination | Handheld NIR | 100% | PLS-DA, 1D-CNN | Fibers | [120] |
| Saffron Authentication | Solvent-based MIR | 95.5% | RSDE, DD-SIMCA | Liquid Extract | [121] |
Detailed Experimental Protocols
Protocol 1: Authentication of Food Products using Benchtop and Handheld NIR
This protocol is adapted from a comparative study on hazelnut authentication [118].
- Objective: To distinguish hazelnut cultivars and geographic origin using NIR spectroscopy.
- Materials:
- Over 300 hazelnut samples of known cultivar and origin.
- Benchtop NIR spectrometer.
- Handheld NIR (hNIR) device.
- Grinder for sample homogenization.
- Procedure:
- Sample Preparation: Analyze a subset of samples as whole kernels. For another subset, grind kernels to a homogeneous powder to enhance spectral quality and reduce scatter.
- Spectral Acquisition:
- Benchtop NIR: Acquire spectra from each sample according to instrument specifications.
- Handheld NIR: Use the portable device to collect spectra directly from whole and ground samples in a simulated on-site setting.
- Data Analysis:
- Use Principal Component Analysis (PCA) for exploratory analysis to identify natural clustering.
- Develop Partial Least Squares-Discriminant Analysis (PLS-DA) models for classification.
- Split the dataset into calibration (training) and validation (test) sets.
- Validate model performance using external sample sets not included in model building.
- Key Findings: Benchtop NIR showed superior performance for geographic origin discrimination. Grinding samples improved results for all devices by increasing homogeneity. Handheld NIR was effective for cultivar distinction but struggled with finer geographic discrimination due to its lower sensitivity compared to benchtop systems [118].
Protocol 2: Protein Secondary Structure Analysis in Wheat using MIR
This protocol is based on a study analyzing the wheat proteome [115].
- Objective: To qualitatively and quantitatively analyze protein secondary structures in wheat fractions using Attenuated Total Reflection (ATR)-MIR.
- Materials:
- 60 Austrian wheat samples.
- ATR-MIR spectrometer.
- Chemical reagents for sequential Osborne fractionation (albumins, globulins, gliadins, glutenins).
- Procedure:
- Sample Fractionation: Perform sequential extraction to isolate albumin, globulin, gliadin, and glutenin protein fractions from the wheat samples.
- Spectral Acquisition: Place each fraction on the ATR crystal and collect MIR spectra. The ATR accessory ensures reproducible contact with minimal sample preparation.
- Data Processing and Analysis:
- Analyze the amide I and II regions of the spectra.
- Apply Analysis of Variance (ANOVA) Simultaneous Component Analysis (ASCA) to determine the statistical significance of factors like variety and sampling site.
- Use secondary derivative analysis and curve-fitting to quantify the proportions of different secondary structures (α-helix, β-turn).
- Key Findings: Distinct secondary structure profiles were identified for each protein fraction. For instance, albumins were primarily α-helical (57.8%), while glutenins were predominantly β-turn (44.8%). The study confirmed that MIR spectra were significantly affected by wheat variety and sampling site [115].
Protocol 3: Real-Time Monitoring of Powder Blends using NIR in a Feed Frame
This protocol is derived from a pharmaceutical manufacturing study [114].
- Objective: To monitor low-concentration (1% w/w) Active Pharmaceutical Ingredient (API) in a powder blend and ejected tablets in real-time using NIR Spatially Resolved Spectroscopy (SRS).
- Materials:
- Powder blend with API (Acetaminophen, APAP) and excipients.
- Tablet press equipped with an NIR SRS probe at the feed frame and outlet port.
- Procedure:
- System Setup: Install the NIR SRS probe in the feed frame of the tablet press and at the outlet port to analyze ejected tablets.
- Calibration: Develop a calibration model correlating NIR spectral data to known API concentrations.
- Real-Time Monitoring: Initiate the tableting process. The NIR probe continuously collects spectra from the flowing powder blend and the ejected tablets.
- Data Analysis:
- Monitor the API concentration in real-time to detect deviations from the target (1% w/w).
- Perform Residence Time Distribution (RTD) analysis to understand powder flow dynamics and mixing homogeneity within the feed frame.
- Key Findings: NIR SRS was able to detect small API concentration changes as low as 0.50% w/w, providing a non-destructive method for ensuring blend uniformity in low-dose formulations directly within the manufacturing process [114].
Workflow Diagram for Technique Selection
The following diagram illustrates the decision-making workflow for selecting an appropriate spectroscopic technique based on research goals and sample properties.
The Scientist's Toolkit: Essential Research Reagents and Materials
Table 2: Key Materials and Reagents for Spectroscopic Analysis
| Item | Function/Application | Example from Research |
|---|---|---|
| ATR Crystal | Enables simple, reproducible MIR sampling of liquids, pastes, and solids with minimal preparation. | Used for analyzing wheat protein fractions [115]. |
| Solvent Extraction Kits | For metabolite extraction in solvent-based MIR analysis, optimizing signal for specific analytes. | Modified ISO 3632 protocol used for saffron metabolite extraction [121]. |
| Chemometric Software | For data preprocessing, multivariate model development (PCA, PLS-DA, etc.), and classification. | Essential for all cited studies to transform spectral data into actionable results [119] [120] [121]. |
| Portable/Handheld NIR Device | For non-destructive, on-site analysis in the field or at-line in a production facility. | Used for cashmere authentication and milk origin tracing [120] [116]. |
| Reference Standards | Authentic, well-characterized materials required for building and validating calibration models. | Authentic drug samples for NIR library; genuine saffron for adulteration models [121] [122]. |
| Benchtop NIR & MIR Spectrometers | High-sensitivity instruments for detailed laboratory analysis and method development. | Used for foundational studies on hazelnuts, wheat, and low-dose pharmaceutical blends [115] [118] [114]. |
The presented data and protocols demonstrate that the choice between NIR, MIR, and handheld NIR is highly application-dependent. MIR spectroscopy excels in scenarios requiring detailed molecular-level information, such as identifying protein secondary structures or specific functional groups, due to its high specificity [119] [115]. Benchtop NIR offers a robust solution for high-throughput laboratory analysis, often achieving superior accuracy for complex authentication tasks like geographic origin discrimination [118]. The emergence of handheld NIR technology is a game-changer for real-time, on-site decision-making, enabling rapid screening for material authenticity directly in the field or on the production line, though it may trade off some sensitivity and specificity compared to benchtop counterparts [120] [118].
For researchers monitoring chemical reactions, this translates to:
- Using MIR for deep mechanistic studies probing specific bond formation/cleavage.
- Implementing Benchtop NIR as a PAT tool for rigorous quality control in a lab-scale or pilot-plant environment.
- Deploying Handheld NIR for at-line or in-line checks in a continuous manufacturing setup or for raw material identity verification.
In conclusion, NIR, MIR, and handheld NIR are complementary techniques within the spectroscopic toolkit. The integration of advanced chemometric models is the linchpin for their success, transforming spectral data into predictive, actionable insights. The ongoing trends of miniaturization, the integration of AI, and the development of more robust calibration models promise to further solidify the role of these techniques in advancing research and ensuring quality in drug development and beyond [113] [117].
The Role of Spectroscopic Data in Quality-by-Design and Regulatory Submissions
Quality by Design (QbD) represents a fundamental shift in pharmaceutical development, moving from reactive quality testing to a systematic, science-based approach that builds quality into products and processes from the outset. The International Council for Harmonisation (ICH) Q8 guideline defines QbD as "a systematic approach to development that begins with predefined objectives and emphasizes product and process understanding and process control, based on sound science and quality risk management" [123]. This approach enables manufacturers to understand how formulation components and process parameters affect final product quality, creating a robust foundation for consistent drug manufacturing [124].
Spectroscopic techniques have emerged as critical enablers of QbD implementation, providing the real-time, quantitative data necessary for defining Critical Quality Attributes (CQAs), establishing design spaces, and developing control strategies. The integration of spectroscopic data throughout the product lifecycle—from initial development through commercial manufacturing—provides a scientific foundation for regulatory submissions, demonstrating enhanced product and process understanding to global health authorities [123] [124]. This application note details the practical integration of spectroscopic data within QbD frameworks and provides standardized protocols for generating regulatory-ready data.
Spectroscopic Techniques in QbD: A Comparative Analysis
Technique Selection Guide
The selection of appropriate spectroscopic techniques is guided by the specific analytical requirements, sample properties, and process constraints. Table 1 summarizes the principal spectroscopic techniques employed in QbD-driven pharmaceutical development.
Table 1: Comparative Analysis of Spectroscopic Techniques in QbD Applications
| Technique | Key Strengths in QbD | Common QbD Applications | Regulatory Considerations |
|---|---|---|---|
| Mid-Infrared (MIR) Dispersion Spectroscopy | High sensitivity (detects phase shifts down to 6.1 × 10⁻⁷ RIU); enhanced robustness for liquid analysis; decoupled from source intensity noise [125]. | Monitoring catalytic enzyme activity (e.g., invertase); reaction kinetics studies; investigation of complex, time-dependent chemical reactions [125]. | Newer methodology requires thorough validation; demonstrate superiority over FT-IR for specific applications [125]. |
| UV-Visible Spectroscopy | Direct proportionality between absorbance and concentration; well-established for reaction kinetics [6]. | Monitoring reaction progression; quantifying reactant loss/product formation; determining reaction order and rate constants [6]. | Well-established in pharmacopeias; method validation straightforward. |
| NMR Spectroscopy | Inherently quantitative; non-destructive; provides structural information; insensitive to sample matrix [23]. | Online reaction monitoring in flow reactors; determining reaction endpoints and kinetics; identifying intermediates [23] [1]. | Requires robust calibration for quantitative online use; ensure compatibility with PAT framework [23]. |
| Raman Spectroscopy | Minimal sample preparation; suitable for aqueous solutions; provides molecular specificity [1]. | Identifying polymorphic forms; monitoring blend uniformity; reaction monitoring in microreactors [1] [124]. | Laser-induced degradation risks; may require calibration models for quantitative analysis. |
| NIR Spectroscopy | Deep penetration depth; suitable for intact sample analysis; fiber-optic probes enable remote sensing [124]. | Moisture content analysis in granulations; blend uniformity monitoring; real-time release testing [124]. | Requires multivariate calibration (chemometrics); model maintenance is critical for ongoing accuracy. |
The Scientist's Toolkit: Essential Research Reagent Solutions
Table 2: Key Reagents and Materials for Spectroscopic Reaction Monitoring
| Item | Function/Description | Application Example |
|---|---|---|
| Quantum Cascade Laser (QCL) | High-power, tunable coherent IR source enabling MIR dispersion spectroscopy with broad spectral coverage (>200 cm⁻¹) [125]. | MIR dispersion spectroscopy for monitoring enzyme kinetics (e.g., invertase activity) [125]. |
| Microreactor Systems | Provides excellent heat/mass transfer for process intensification; enables precise residence time control by adjusting flow rates [1]. | Continuous-flow synthesis with integrated spectroscopic analytics for rapid reaction optimization [23] [1]. |
| Process Analytical Technology (PAT) | A system for designing, analyzing, and controlling manufacturing through timely measurement of CQAs [126] [124]. | Real-time release testing; in-line monitoring of CQAs to ensure consistent product quality [123] [124]. |
| Chemometric Software | Utilizes multivariate analysis (e.g., PCA, PLS) to extract physical/chemical information from complex spectral data [1]. | Developing quantitative calibration models for NIR spectroscopy; analyzing dynamic dispersion spectra [125] [1]. |
| Flow Cell Systems | Enables continuous sampling from reactors to spectroscopic instruments for real-time, non-invasive monitoring [23]. | Online NMR reaction monitoring using PTFE tubing or glass flow cells to transfer reaction mixture [23]. |
QbD Workflow: Integrating Spectroscopic Data
The following workflow diagram illustrates how spectroscopic data is systematically integrated into each stage of the QbD pharmaceutical development process.
QbD Workflow with Spectroscopic Integration
This workflow demonstrates the cyclical, knowledge-building approach of QbD, where spectroscopic data provides the scientific evidence linking material attributes and process parameters to product quality outcomes [123] [124].
Application Notes & Experimental Protocols
Protocol 1: Monitoring Enzyme Kinetics Using MIR Dispersion Spectroscopy
This protocol details the application of MIR dispersion spectroscopy for monitoring the hydrolysis of sucrose by invertase, a key reaction in carbohydrate metabolism and industrial sugar processing [125].
Experimental Workflow
The following diagram outlines the key stages of the experimental process for monitoring enzyme kinetics using MIR dispersion spectroscopy.
Enzyme Kinetics Monitoring Workflow
Materials and Equipment
- MIR Dispersion Spectrometer: Custom system with tunable External Cavity Quantum Cascade Laser (EC-QCL) (935–1175 cm⁻¹), Mach-Zehnder Interferometer (MZI), and mercury cadmium telluride (MCT) detectors [125].
- Temperature-Controlled Flow Cell: Calcium fluoride (CaF₂) windows with PTFE spacer, optimized pathlength of 170 μm for aqueous samples [125].
- Reagents: Invertase (β-fructofuranosidase), sucrose substrate (2.5–25 g/L concentration range), and appropriate buffer solutions [125].
- Software: Python API for data acquisition and specialized tools for two-dimensional correlation spectroscopy (2D-COS) analysis [125].
Step-by-Step Procedure
- System Configuration: Configure the EC-QCL in pulsed mode (1.5 MHz repetition rate, 30% duty cycle) to maximize output power (~110 mW). Set laser sweep rate to 80 cm⁻¹ s⁻¹ and ensure dry air purging (5 L/min) to eliminate atmospheric humidity effects [125].
- Quadrature Locking: Implement active quadrature point locking using a proportional–integral–derivative (PID) servo closed loop to control the piezo-actuator movement, which counterbalances phase shifts between reference and sample arms during spectral scanning [125].
- Sample Loading: Simultaneously fill the transmission cell with reference (solvent/buffer) and sample (reaction mixture) streams. Maintain temperature control (±0.1°C) throughout the experiment as enzyme activity is temperature-dependent [125].
- Reaction Initiation & Monitoring: Initiate the enzymatic reaction by introducing invertase to the sucrose solution. Continuously record piezo-displacement signals (proportional to refractive index changes) as the laser scans the spectral range. Monitor until reaction completion, evidenced by signal stabilization [125].
- Data Processing: Convert recorded piezo-displacement to refractive index spectra using the relationship Δn(ṽ) = δ/(2d), where δ is displacement and d is pathlength. Analyze the anomalous dispersion spectra at characteristic carbohydrate absorption bands (e.g., 990–1180 cm⁻¹) [125].
- Kinetic Analysis: Apply Michaelis-Menten kinetic modeling to the concentration-time data derived from phase shift measurements. Calculate kinetic parameters (Vmax, KM) and compare with literature values for validation [125].
- 2D-COS Analysis: Perform two-dimensional correlation spectroscopy on dynamic dispersion spectra to identify sequential order of molecular events (e.g., mutarotation of glucose and fructose products) [125].
Data Interpretation and QbD Integration
The phase shift data provides direct quantification of reactant consumption and product formation. For QbD implementation, this methodology defines the design space for enzymatic processes by establishing proven acceptable ranges for critical process parameters (CPPs) such as temperature, enzyme concentration, and substrate concentration. The identification of mutarotation via 2D-COS demonstrates the capability to detect and characterize complex reaction pathways that may impact final product quality [125].
Protocol 2: Real-Time Reaction Monitoring in Flow Reactors Using Benchtop NMR
This protocol describes the integration of benchtop NMR spectroscopy with continuous flow reactors for real-time monitoring and optimization of chemical reactions, a key application in Process Analytical Technology (PAT) [23] [1].
Experimental Setup
- NMR System: Spinsolve benchtop NMR spectrometer (60 or 80 MHz) installed in fume hood or adjacent to reactor [23].
- Flow Reactor System: Continuous flow microreactor (e.g., Ehrfeld Micro Reaction System) with precision pumping systems [23].
- Flow NMR Kit: Includes PTFE tubing or glass flow cell (4 mm ID) with appropriate fittings, and peristaltic pump for continuous circulation [23].
- Automation Interface: LabManager and LabVision automation tools for feedback control and real-time optimization [23].
Step-by-Step Procedure
- System Configuration: Connect the flow reactor outlet to the NMR flow cell using PTFE tubing, ensuring minimal dead volume. Implement closed-loop sample transfer for homogeneous liquid mixtures [23].
- NMR Method Development: Establish quantitative ¹H NMR parameters (pulse angle, relaxation delay, number of scans) optimized for flow conditions. Typical acquisition time: 10-30 seconds per spectrum [23].
- Reaction Calibration: Develop calibration curves correlating NMR signal integrals with concentration for key reactants, products, and intermediates [23].
- Continuous Monitoring: Initiate flow reaction and begin real-time NMR data acquisition. Monitor specific chemical shifts characteristic of reactant disappearance and product formation [23].
- Feedback Optimization: Implement self-optimizing algorithms (e.g., for Knoevenagel condensation) that use real-time NMR concentration data to adjust reaction parameters (temperature, residence time, stoichiometry) to maximize yield or selectivity [23].
- Endpoint Determination: Continue monitoring until reaction completion is confirmed by stable product concentration and minimal reactant residues [23].
QbD and Regulatory Considerations
This PAT approach provides definitive evidence of reaction understanding in regulatory submissions. The real-time data demonstrates control over CPPs and establishes a design space for continuous manufacturing processes. For heterogeneous reactions, implement specialized protocols to address line broadening and potential clogging issues [23].
Regulatory Submission Framework
Incorporating Spectroscopic Data in Regulatory Dossiers
When submitting spectroscopic data as part of a QbD-based regulatory filing, several key elements must be addressed to ensure regulatory acceptance:
- Method Validation: Comprehensive validation of spectroscopic methods according to ICH guidelines, including specificity, accuracy, precision, and robustness data [127].
- Linkage to CQAs: Clear demonstration of how spectroscopic measurements correlate with and ensure control of identified CQAs [123] [124].
- Design Space Justification: Spectroscopic data used to define and validate the design space must show multivariate understanding of parameter interactions [123].
- Control Strategy Documentation: Detailed description of how spectroscopic PAT methods are implemented in the control strategy, including real-time release testing protocols where applicable [124].
Regulatory agencies recognize that under QbD, "the regulatory burden is less because there are wider ranges and limits based on product and process understanding. Changes within these ranges and limits do not require prior approval" [126]. This regulatory flexibility provides significant business advantages while maintaining quality standards.
Success Metrics and Implementation Benefits
Successful implementation of spectroscopic methods in QbD frameworks delivers substantial benefits:
- Reduced Batch Failures: QbD implementation can reduce batch failures by approximately 40% through enhanced process understanding and control [123].
- Regulatory Flexibility: Operating within an approved design space enables process improvements without regulatory resubmission [126] [124].
- Accelerated Development: Real-time spectroscopic monitoring dramatically reduces reaction optimization time, with flow chemistry potentially reducing development time by up to 90% [1].
- Enhanced Product Quality: Consistent quality through reduced batch-to-batch variability, particularly crucial for generic products demonstrating therapeutic equivalence [124].
Spectroscopic data provides the scientific foundation for successful QbD implementation and regulatory submissions across the pharmaceutical lifecycle. By enabling real-time monitoring of CQAs, facilitating design space establishment, and supporting robust control strategies, spectroscopic techniques transform quality from a retrospective testing function to a proactive, built-in product characteristic. The protocols outlined in this application note provide standardized methodologies for generating high-quality, regulatory-ready spectroscopic data that demonstrates enhanced product and process understanding to global health authorities. As regulatory expectations continue evolving toward science-based manufacturing approaches, the integration of spectroscopic data within QbD frameworks will remain essential for maintaining competitive advantage while ensuring patient safety and product efficacy.
Conclusion
Spectroscopic techniques have evolved into indispensable tools for real-time, non-invasive monitoring of chemical reactions throughout the pharmaceutical development pipeline. By integrating foundational knowledge with robust methodological applications, effective troubleshooting, and strategic comparative analysis, scientists can fully leverage techniques like Raman, FT-IR, and NMR to build quality into processes from the start. The future points toward greater automation, the integration of machine learning with chemometric models, and the expanded use of handheld devices for decentralized testing. These advancements will further solidify spectroscopy's role in accelerating drug development, enhancing bioprocess control, and delivering safer, more effective medicines to patients.
References
- 1. Application of Spectroscopy Techniques for Monitoring (Bio ... [https://www.mdpi.com/2073-4344/13/4/690]
- 2. A Review of the Latest Spectroscopic Research in ... [https://www.spectroscopyonline.com/view/review-latest-spectroscopic-research-pharmaceutical-and-biopharmaceutical-applications]
- 3. Real-time inline-IR-analysis via linear-combination strategy ... [https://www.nature.com/articles/s42004-025-01676-y]
- 4. A comprehensive review-current development in ... [https://www.sciencedirect.com/science/article/pii/S2211715625003248]
- 5. Machine learning spectroscopy to advance computation ... [https://pmc.ncbi.nlm.nih.gov/articles/PMC12590498/]
- 6. Monitoring Reactions Through UV-Visible Spectroscopy [https://www.spectroscopyonline.com/view/monitoring-reactions-through-uv-visible-spectroscopy]
- 7. UV/Vis spectroscopy as an in-line monitoring tool for tablet ... [https://www.sciencedirect.com/science/article/abs/pii/S0731708523004909]
- 8. UV–Vis operando spectroelectrochemistry for (photo) ... [https://www.sciencedirect.com/science/article/pii/S2451910322001636]
- 9. 2025 Review of Spectroscopic Instrumentation [https://www.spectroscopyonline.com/view/2025-review-of-spectroscopic-instrumentation]
- 10. Comparative Evaluation of UV-Vis Spectroscopy-Based ... [https://pmc.ncbi.nlm.nih.gov/articles/PMC11430504/]
- 11. Comparative dataset of experimental and computational ... [https://www.nature.com/articles/s41597-019-0306-0]
- 12. FT-IR–Raman Combination: The Perfect Analytical ... [https://www.spectroscopyonline.com/view/ft-ir-raman-combination-perfect-analytical-solution-vibrational-spectroscopists]
- 13. Comparison Of Raman And FTIR Spectroscopy [https://gatewayanalytical.com/comparison-of-raman-and-ftir-spectroscopy-advantages-and-limitations/]
- 14. Raman and FTIR spectroscopy for battery components [https://www.thermofisher.com/us/en/home/materials-science/battery-research/technologies/raman-ftir.html]
- 15. Review of quantitative and qualitative methods for monitoring ... [https://pubs.rsc.org/en/content/articlehtml/2023/py/d2py01538b]
- 16. Time-resolved Infrared Spectroscopy for Monitoring Fast ... [https://www.spectroscopyonline.com/view/time-resolved-infrared-spectroscopy-for-monitoring-fast-chemical-changes]
- 17. Application of Fourier Transform Infrared (FTIR ... [https://www.mdpi.com/1420-3049/30/3/684]
- 18. MATRIX-MF II FT-IR Reaction Monitoring [https://www.bruker.com/en/products-and-solutions/infrared-and-raman/ft-ir-nir-for-process-control/matrix-mf-ft-ir-reaction-monitoring.html]
- 19. 4.7: NMR Spectroscopy [https://chem.libretexts.org/Bookshelves/Analytical_Chemistry/Physical_Methods_in_Chemistry_and_Nano_Science_(Barron)/04%3A_Chemical_Speciation/4.07%3A_NMR_Spectroscopy]
- 20. NMR Spectroscopy Principles, Interpreting an ... [https://www.technologynetworks.com/analysis/articles/nmr-spectroscopy-principles-interpreting-an-nmr-spectrum-and-common-problems-355891]
- 21. NMR-spectroscopic analysis of mixtures: from structure to ... [https://pmc.ncbi.nlm.nih.gov/articles/PMC3053045/]
- 22. The Basics of Interpreting a Proton ( 1 H) NMR Spectrum [https://www.acdlabs.com/blog/the-basics-of-interpreting-a-proton-nmr-spectrum/]
- 23. Reaction Monitoring [https://magritek.com/applications/reaction-monitoring/]
- 24. Mechanistic analysis by NMR spectroscopy: A users guide [https://www.sciencedirect.com/science/article/pii/S0079656522000073]
- 25. NMR reaction monitoring robust to spectral distortions [https://chemrxiv.org/engage/chemrxiv/article-details/67a4937d81d2151a025ceef7]
- 26. Chemical Reaction Monitoring using Zero‐Field Nuclear ... [https://pmc.ncbi.nlm.nih.gov/articles/PMC7540358/]
- 27. Microwave Rotational Spectroscopy [https://chem.libretexts.org/Bookshelves/Physical_and_Theoretical_Chemistry_Textbook_Maps/Supplemental_Modules_(Physical_and_Theoretical_Chemistry)/Spectroscopy/Rotational_Spectroscopy/Microwave_Rotational_Spectroscopy]
- 28. Rotational spectroscopy [https://en.wikipedia.org/wiki/Rotational_spectroscopy]
- 29. Fluorescence Fundamentals | Thermo Fisher Scientific - US [https://www.thermofisher.com/us/en/home/references/molecular-probes-the-handbook/introduction-to-fluorescence-techniques.html]
- 30. Fluorescence Correlation Spectroscopy: Past, Present, Future [https://pmc.ncbi.nlm.nih.gov/articles/PMC3244056/]
- 31. Rotational Spectroscopy [https://www.tek.com/en/solutions/application/research/rotational-spectroscopy]
- 32. Microwave Spectroscopy [https://mcguirelab.mit.edu/chemistry.html]
- 33. Basic Concepts in Fluorescence [https://evidentscientific.com/en/microscope-resource/knowledge-hub/techniques/fluorescence/fluorescenceintro]
- 34. In-line product quality monitoring during biopharmaceutical ... [https://pmc.ncbi.nlm.nih.gov/articles/PMC10251777/]
- 35. In-Line & Real-Time Raman Monitoring [https://www.sigmaaldrich.com/US/en/integrated-offerings/biopharma-4-0/process-analytical-technology/raman-monitoring?srsltid=AfmBOorrOaX8jXQoDBjc1o1qPMyJKaJjEc-vBRfT7VrDlyp5_ynjycaU]
- 36. Advances in Inline Monitoring for Improved Bioreactor ... [https://www.biopharminternational.com/view/advances-in-inline-monitoring-for-improved-bioreactor-performance]
- 37. The application of Raman spectroscopy for monitoring ... [https://www.sciencedirect.com/science/article/abs/pii/S1369703X21001406]
- 38. Clip-on adapter for simultaneous inline Raman and ... [https://link.springer.com/article/10.1007/s00216-025-06213-3]
- 39. Exploring the Versatility of Raman Spectroscopy in Material ... [https://www.thermofisher.com/blog/materials/exploring-the-versatility-of-raman-spectroscopy-in-material-characterization/]
- 40. Real-Time Chemometric Analysis of Multicomponent ... [https://www.spectroscopyonline.com/view/real-time-chemometric-analysis-of-multicomponent-bioprocesses-using-raman-spectroscopy]
- 41. The Versatility of Portable Raman in Process Development [https://www.spectroscopyonline.com/view/versatility-portable-raman-process-development]
- 42. DSC, FT-IR and NIR with Chemometric Assessment Using ... [https://pubmed.ncbi.nlm.nih.gov/35807528/]
- 43. FT-IR Spectroscopy Mini-Tutorial: Principles, Practice, and ... [https://www.spectroscopyonline.com/view/ft-ir-spectroscopy-mini-tutorial-principles-practice-and-applications-across-disciplines]
- 44. Guide to FT-IR Spectroscopy [https://www.bruker.com/en/products-and-solutions/infrared-and-raman/ft-ir-routine-spectrometer/what-is-ft-ir-spectroscopy.html]
- 45. Using ATR-FTIR spectroscopy and DD-SIMCA for ecstasy ... [https://www.sciencedirect.com/science/article/abs/pii/S2468170923000565]
- 46. DSC, FT-IR and NIR with Chemometric Assessment Using ... [https://www.mdpi.com/1420-3049/27/13/4283]
- 47. Spectroscopic and Chemometric Evaluation of the Stability ... [https://pmc.ncbi.nlm.nih.gov/articles/PMC12473119/]
- 48. A development method of FTIR spectroscopy coupled with ... [https://japsonline.com/abstract.php?article_id=3574&sts=2]
- 49. Monitoring of Reaction using IR Spectroscopy with Fiber Probe [https://jascoinc.com/applications/monitoring-of-reaction-process-using-a-fiber-probe/]
- 50. Process Analytical Technology Tools for Monitoring ... [https://pmc.ncbi.nlm.nih.gov/articles/PMC8234957/]
- 51. UV/Vis-based process analytical technology to improve ... [https://www.sciencedirect.com/science/article/abs/pii/S1004954122002324]
- 52. UV-Vis Spectroscopy: Principle, Strengths and Limitations ... [https://www.technologynetworks.com/analysis/articles/uv-vis-spectroscopy-principle-strengths-and-limitations-and-applications-349865]
- 53. UV-Visible Spectroscopy [https://www2.chemistry.msu.edu/faculty/reusch/virttxtjml/spectrpy/uv-vis/spectrum.htm]
- 54. Real‐time monitoring and control of the load phase of a ... [https://pmc.ncbi.nlm.nih.gov/articles/PMC5215519/]
- 55. Purification of Monoclonal Antibodies Using ... [https://pmc.ncbi.nlm.nih.gov/articles/PMC12235372/]
- 56. NMR spectroscopy as a characterization tool enabling ... [https://www.sciencedirect.com/science/article/abs/pii/S0731708522005313]
- 57. Investigating protein–excipient interactions of a multivalent ... [https://pmc.ncbi.nlm.nih.gov/articles/PMC9519013/]
- 58. NMR Methods for Structural Characterization of Protein- ... [https://www.frontiersin.org/journals/molecular-biosciences/articles/10.3389/fmolb.2020.00009/full]
- 59. Protein-Excipient Interactions Evaluated via Nuclear ... [https://www.sciencedirect.com/science/article/pii/S0022354918303265]
- 60. Determination of ultra-trace metal-protein interactions in co ... [https://pmc.ncbi.nlm.nih.gov/articles/PMC10085571/]
- 61. Determination of interactions between antibody ... [https://www.sciencedirect.com/science/article/abs/pii/S0003267019307731]
- 62. ICP-MS: Biomedical Advances and Experimental ... [https://momentum.bio/content/icp-ms-biomedical-advances-and-experimental-applications/]
- 63. An ICP-MS platform for metal content assessment of cell ... [https://www.sciencedirect.com/science/article/abs/pii/S0731708518306988]
- 64. Investigating residual trace metals in recombinant ... [https://www.sciencedirect.com/science/article/pii/S0003267024013965]
- 65. Spectroscopic Sample Preparation: Techniques for ... [https://www.metkon.com/spectroscopic-sample-preparation/]
- 66. A Common Sense Laboratory Guide to Reducing Errors ... [https://www.spectroscopyonline.com/view/common-sense-laboratory-guide-reducing-errors-and-contamination-icp-and-icp-ms-analysis]
- 67. Protein Sample Preparation for Mass Spectrometry [https://www.thermofisher.com/us/en/home/life-science/protein-biology/protein-biology-learning-center/protein-biology-resource-library/pierce-protein-methods/sample-preparation-mass-spectrometry.html]
- 68. Comparison of Sample Preparation Methods, ... [https://pmc.ncbi.nlm.nih.gov/articles/PMC4473241/]
- 69. Metabolite Measurement: Pitfalls to Avoid and Practices to ... [https://pmc.ncbi.nlm.nih.gov/articles/PMC5734093/]
- 70. Comparison of different sample preparation techniques for ... [https://www.sciencedirect.com/science/article/abs/pii/S0956713520302188]
- 71. Monitoring Chemical Changes by Raman Spectroscopy [https://www.spectroscopyonline.com/view/monitoring-chemical-changes-by-raman-spectroscopy]
- 72. Spectroscopic Unknown Puzzles from Real DataA More ... [https://pmc.ncbi.nlm.nih.gov/articles/PMC12506630/]
- 73. Compensate for or Minimize Matrix Effects? Strategies ... [https://pmc.ncbi.nlm.nih.gov/articles/PMC7412464/]
- 74. Strategies for the Detection and Elimination of Matrix ... [https://www.chromatographyonline.com/view/strategies-detection-and-elimination-matrix-effects-quantitative-lc-ms-analysis]
- 75. Solvent effects on UV–Vis and FT-IR spectra of indapamide ... [https://link.springer.com/article/10.1007/s11696-019-00945-0]
- 76. Dynamic solvation fields: a paradigm shift in solvent effects on ... [https://pubs.rsc.org/en/content/articlehtml/2025/cp/d5cp02863a]
- 77. Modeling solvent effects in chemical reactions [https://communities.springernature.com/posts/modeling-solvent-effects-in-chemcial-reactions]
- 78. Development of UV-vis and FTIR Partial Least Squares ... [https://oeno-one.eu/article/view/3731]
- 79. Three approaches to minimize matrix effects in residue ... [https://www.sciencedirect.com/science/article/abs/pii/S0308814618320776]
- 80. Editorial: Novel Applications of Chemometrics in Analytical ... [https://pmc.ncbi.nlm.nih.gov/articles/PMC9152351/]
- 81. Recent Research in Chemometrics and AI for ... [https://www.spectroscopyonline.com/view/recent-research-in-chemometrics-and-ai-for-spectroscopy-part-i-foundations-definitions-and-the-integration-of-artificial-intelligence-in-chemometric-analysis]
- 82. Exploring NIR spectroscopy data: A practical chemometric ... [https://www.sciencedirect.com/science/article/pii/S0169743924002314]
- 83. A guide to good practice in chemometric methods for ... [https://www.sciencedirect.com/science/article/pii/S0165993620303861]
- 84. Back to basics: the principles of principal component analysis [https://www.spectroscopyeurope.com/td-column/back-basics-principles-principal-component-analysis]
- 85. Partial Least Square (PLS) Analysis | Resonance [https://link.springer.com/article/10.1007/s12045-021-1140-1]
- 86. Chemical information obtained from multicomponent ... [https://www.sciencedirect.com/science/article/pii/S0169743921002069]
- 87. New Tutorial Highlights Power of Chemometrics in Data ... [https://www.spectroscopyonline.com/view/new-tutorial-highlights-power-of-chemometrics-in-data-analysis]
- 88. The Process Chemometrics Approach to ... [https://www.sciencedirect.com/science/article/pii/S1474667017453985]
- 89. [2503.00321] Note on the noise reduction in spectroscopic ... [https://arxiv.org/abs/2503.00321]
- 90. MINIMIZING ERROR IN CALIBRATING ... [https://infometrix.com/2025/09/05/minimizing-error-in-calibrating-spectrometers-4-part-series-part-4-conclusion-and-understanding-true-calibration-error/]
- 91. Universal Calibration: Can Models Travel Successfully ... [https://www.spectroscopyonline.com/view/universal-calibration-can-models-travel-successfully-across-instruments-]
- 92. Analysis strategy of contamination source using chemical ... [https://www.sciencedirect.com/science/article/abs/pii/S0043135424019675]
- 93. Monitoring ongoing chemical reactions using eco-friendly ... [https://www.sciencedirect.com/science/article/pii/S2772577425000655]
- 94. Calibration of optical particle spectrometers using mounted ... [https://amt.copernicus.org/articles/18/305/2025/]
- 95. Surface-enhanced spectroscopy technology based on ... [https://www.nature.com/articles/s41378-025-00905-7]
- 96. Spectroscopic Analysis | Research Starters [https://www.ebsco.com/research-starters/chemistry/spectroscopic-analysis]
- 97. The Essentials of Analytical Spectroscopy: Theory and ... [https://www.spectroscopyonline.com/view/the-essentials-of-analytical-spectroscopy-theory-and-applications]
- 98. 1.4: Selecting an Analytical Method [https://chem.libretexts.org/Bookshelves/Analytical_Chemistry/Instrumental_Analysis_(LibreTexts)/01%3A_Introduction/1.04%3A_Selecting_an_Analytical_Method]
- 99. Spectroscopy Technique - an overview [https://www.sciencedirect.com/topics/materials-science/spectroscopy-technique]
- 100. Statistical tests for comparison of quantitative and ... [https://www.sciencedirect.com/science/article/abs/pii/S0022286003002485]
- 101. 10: Spectroscopic Methods [https://chem.libretexts.org/Bookshelves/Analytical_Chemistry/Analytical_Chemistry_2.1_(Harvey)/10%3A_Spectroscopic_Methods]
- 102. AI-Powered Raman Spectroscopy Signals New Era for ... [https://www.spectroscopyonline.com/view/ai-powered-raman-spectroscopy-signals-new-era-for-drug-development-and-disease-diagnosis]
- 103. Scalable deep learning reconstruction for accelerated ... [https://pmc.ncbi.nlm.nih.gov/articles/PMC12466916/]
- 104. FTIR vs Raman Spectroscopy: Which Technique Suits Your ... [https://www.labmanager.com/ftir-vs-raman-spectroscopy-which-technique-suits-your-analysis-33682]
- 105. Generation depth modeling in time domain diffuse Raman ... [https://opg.optica.org/oe/abstract.cfm?uri=oe-33-20-41473]
- 106. Comparison between NIR, FT-IR and Raman for ... [https://www.sciencedirect.com/science/article/abs/pii/S0924203122001199]
- 107. A Breakthrough SRS, Stimulated Raman microscope ... [https://www.photothermal.com/photothermal-spectroscopy-corp-launches-stramos-a-breakthrough-srs-stimulated-raman-microscope-based-on-photothermal-detection/]
- 108. An evaluation of resolution, accuracy, and precision in FT- ... [https://www.sciencedirect.com/science/article/abs/pii/S138614252400711X]
- 109. A Review of the Latest Research Applications Using FT-IR ... [https://www.spectroscopyonline.com/view/a-review-of-the-latest-research-applications-using-ft-ir-spectroscopy]
- 110. RamanCMP: A Raman spectral classification acceleration ... [https://www.sciencedirect.com/science/article/abs/pii/S0003267023009790]
- 111. Enhancing therapeutic antibody profiling: orthogonal ... [https://pmc.ncbi.nlm.nih.gov/articles/PMC12510943/]
- 112. Secondary Structure Estimation for Formulated Monoclonal ... [https://jascoinc.com/applications/secondary-structure-estimation-for-formulated-monoclonal-antibodies-using-jasco-spectra-manager-2-5-bestsel-cfr/]
- 113. Near-infrared Spectroscopy Market Size & Share Analysis [https://www.mordorintelligence.com/industry-reports/near-infrared-spectroscopy-market]
- 114. Real-time monitoring of small changes in powder blends ... [https://pubmed.ncbi.nlm.nih.gov/39755344/]
- 115. Mid-Infrared Spectroscopy for the Qualitative and ... [https://chemrxiv.org/engage/chemrxiv/article-details/689a00be728bf9025e047fdb]
- 116. Research progress on the application of near-infrared ... [https://bjbas.springeropen.com/articles/10.1186/s43088-025-00660-8]
- 117. The potential of near infrared (NIR) spectroscopy coupled ... [https://www.nature.com/articles/s41598-025-17598-7]
- 118. Comparative analysis of spectroscopic methods for rapid ... [https://www.sciencedirect.com/science/article/pii/S1386142524015336]
- 119. Mid-infrared spectroscopy can be applied to authenticate ... [https://www.sciencedirect.com/science/article/pii/S0022030225004540]
- 120. Handheld NIR Technology Proves a Game-Changer in ... [https://www.spectroscopyonline.com/view/handheld-nir-technology-proves-a-game-changer-in-combatting-counterfeit-cashmere]
- 121. Solvent-based mid-infrared spectroscopy paired with ... [https://www.sciencedirect.com/science/article/abs/pii/S0963996925019301]
- 122. A comparative study between Near-Infrared (NIR ... [https://journals.plos.org/plosone/article?id=10.1371/journal.pone.0319523]
- 123. Aspects and Implementation of Pharmaceutical Quality by ... [https://pmc.ncbi.nlm.nih.gov/articles/PMC12114689/]
- 124. Quality by Design in Pharmaceutical Manufacturing [https://pharmasource.global/content/guides/category-guide/quality-by-design-in-pharmaceutical-manufacturing-a-complete-guide-for-modern-drug-development/]
- 125. Mid-Infrared Dispersion Spectroscopy as a Tool for ... [https://pmc.ncbi.nlm.nih.gov/articles/PMC11462787/]
- 126. Quality by design approach: Regulatory need [https://arabjchem.org/quality-by-design-approach-regulatory-need/]
- 127. Compliance and regulatory considerations for the ... [https://www.sciencedirect.com/science/article/pii/S0939641123002114]