Speckle Pattern Reconstruction: Enabling Next-Generation Compact Spectrometers for Biomedical Research
This article explores the transformative role of speckle pattern reconstruction in developing ultra-compact, high-performance spectrometers.
Speckle Pattern Reconstruction: Enabling Next-Generation Compact Spectrometers for Biomedical Research
Abstract
This article explores the transformative role of speckle pattern reconstruction in developing ultra-compact, high-performance spectrometers. We examine the fundamental principles of how disordered media and metasurfaces encode spectral information into unique speckle patterns. The discussion covers advanced reconstruction methodologies, including deep learning models like ResNet-50 and U-Net variants, and their applications in biomedical sensing, drug development, and clinical diagnostics. Critical challenges such as system calibration, environmental stability, and optimization strategies are addressed, alongside rigorous validation using metrics including PSNR and SSIM. This synthesis provides researchers and drug development professionals with a comprehensive framework for leveraging speckle-based spectrometers in laboratory and point-of-care settings.
The Principles of Speckle-Based Spectral Encoding and Hardware Foundations
Principle of Operation
Speckle pattern-based spectrometry represents a paradigm shift from conventional spectroscopic methods. Unlike traditional spectrometers that rely on bulky dispersive elements like prisms and gratings to separate light spatially, speckle-based devices utilize the phenomenon of light interference in disordered media [1] [2].
When coherent light passes through a scattering medium, it generates a random, granular interference pattern known as a speckle pattern. Crucially, each specific wavelength of light produces a distinct and highly reproducible speckle fingerprint [1]. This occurs because the exact path each light wave takes through the disordered nanostructures is wavelength-dependent, creating unique interference profiles at the detector. The relationship between incident light and the resulting pattern can be expressed as:
I = Φ · S
where S represents the original spectral signal, Φ represents the measurement matrix transformation performed by the scattering medium, and I represents the observed light intensity (speckle pattern) [3].
Advanced computational algorithms, including deep learning models like Convolutional Long Short-Term Memory (CNN-LSTM) networks, then solve the inverse problem to reconstruct the original spectrum from the captured speckle image with high precision [4].
Performance Specifications and Comparative Analysis
The following table summarizes key performance metrics achieved by recent advanced speckle spectrometer implementations:
Table 1: Performance comparison of speckle-based spectrometer technologies
| Technology / Platform | Spectral Range | Spectral Resolution | Form Factor | Key Innovation |
|---|---|---|---|---|
| Double-Layer Disordered Metasurface [1] [2] | 440–1300 nm (Visible to IR) | ~1 nm | < 1 cm (fingernail-sized) | Direct integration with commercial image sensors |
| CNN-LSTM Denoising on Sapphire [4] | Not Specified | 0.5 nm | Compact and Stable | Advanced denoising algorithm reducing environmental noise |
| Localized Speckle Pattern (Integrating Sphere) [3] | 1520–1567 nm (IR) | 2 pm (0.002 nm) | Not Specified | Uses localized speckles for 35x faster measurement |
Experimental Protocol: Metasurface Integration
This protocol details the methodology for constructing a compact spectrometer using a double-layer disordered metasurface, based on the approach pioneered by KAIST [1] [2].
Materials and Equipment
Table 2: Essential research reagents and materials
| Item | Function / Description |
|---|---|
| Double-Layer Disordered Metasurface | Engineered optical component with nanostructures that scatter light to create wavelength-specific speckles. [1] [2] |
| Image Sensor | Standard CMOS or CCD sensor (e.g., from a smartphone camera) to capture speckle patterns. [1] |
| Tunable Laser Source | For system calibration, providing known wavelengths to establish the reference speckle library. [3] |
| Polarization-Maintaining Fiber (PMF) | Delivers light to the scattering medium while preserving polarization state for consistent speckle generation. [3] |
| Computational Framework | Software with reconstruction algorithms (e.g., CNN-LSTM) to convert speckle patterns into spectra. [4] |
Step-by-Step Procedure
- System Assembly: Mount the double-layer disordered metasurface directly onto the active area of the image sensor. The two metasurface layers should be separated by a precisely controlled propagation space to allow for complex light scattering [2].
- Calibration and Library Generation: Illuminate the metasurface-sensor system with light from a tunable laser source across the entire target wavelength range (e.g., 440-1300 nm) in small, discrete steps (e.g., 0.5-1 nm).
- Sample Measurement: Direct the light from the unknown sample onto the metasurface. Capture a single image of the resulting speckle pattern (I).
- Spectral Reconstruction: Input the captured speckle pattern into the reconstruction software. The algorithm (e.g.,
reconstruct_spectrum(I, Φ)) compares the sample pattern against the reference library to compute the most probable original spectrum (S). - Validation: Validate the system's accuracy using standard samples with known spectral features.
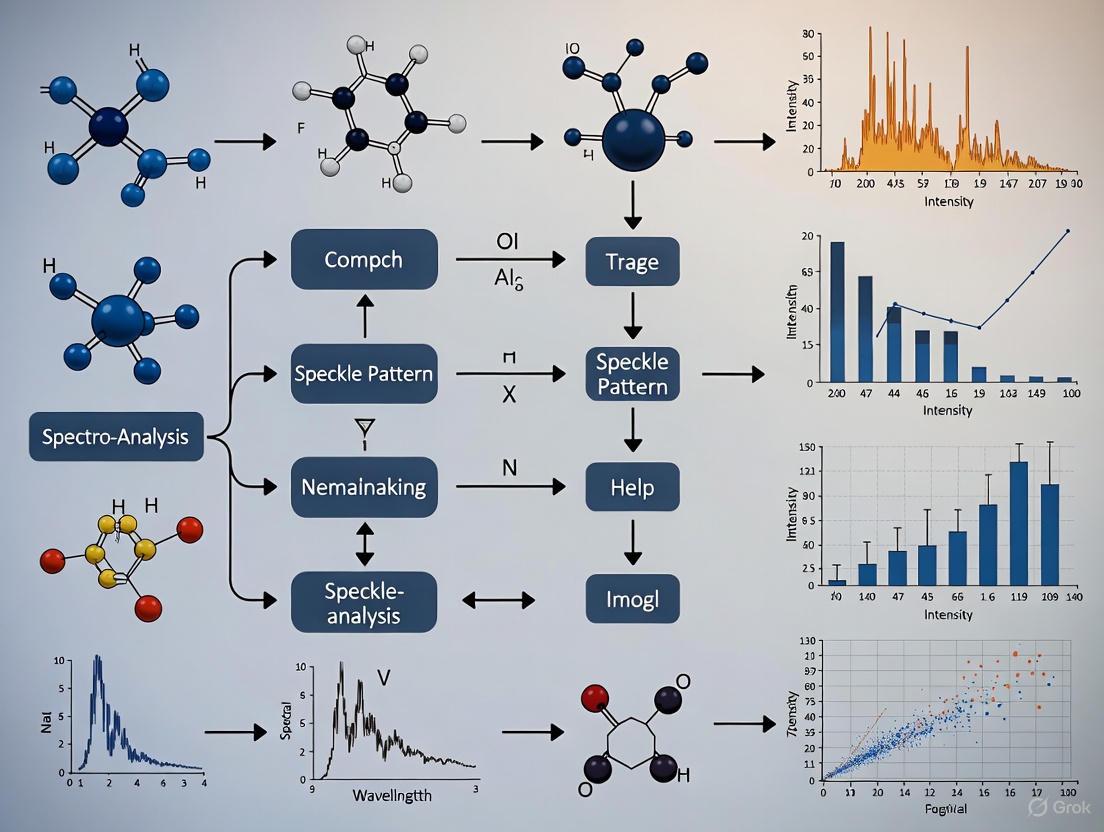
Figure 1: Speckle Spectrometer Workflow
System Architecture and Information Flow
The core of the technology lies in the metasurface, which replaces all bulk optics. The diagram below illustrates the system's architecture and the transformation of light into data.
Figure 2: System Architecture Diagram
Critical Technical Considerations
Scattering Media Selection
The choice of scattering medium directly impacts performance. Research compares multimode optical fibers (MMF) and integrating spheres, showing that localized speckles from an integrating sphere can increase the spectral measurement rate by 35 times compared to full-pixel speckles from an MMF, without sacrificing reconstruction accuracy [3].
Enhancing Signal-to-Noise Ratio
Environmental noise can reduce speckle autocorrelation, leading to reconstruction errors. Implementing a CNN-LSTM denoising algorithm effectively suppresses this noise, ensuring higher reconstruction accuracy and prolonging system stability [4]. This is critical for applications in dynamic environments.
Scattering media, which randomize the propagation of light, have transitioned from being a fundamental challenge in optics to a valuable resource for modern spectroscopic and imaging applications. The core principle underpinning this technology is that a disordered medium can encode the spectral information of incident light into a unique, high-dimensional spatial speckle pattern. This phenomenon enables the development of highly compact and computationally powerful spectrometers and sensors by replacing traditional bulk optical components like diffraction gratings with miniaturized scattering elements. These systems find particular relevance in applications demanding portability and robustness, such as point-of-care medical diagnostics, environmental monitoring, and industrial process control. This document provides detailed application notes and experimental protocols for implementing spectral encoding systems, with a specific focus on their role in compact spectrometer design within a broader research context of speckle pattern reconstruction.
Theoretical Foundations of Scattering-Based Spectral Encoding
The operation of spectrometers based on scattering media relies on a well-understood physical principle: when monochromatic light is transmitted through or reflected from a disordered medium, it produces a random interference pattern known as a speckle pattern. Crucially, the pattern is highly sensitive to the wavelength of the incident light. A slight change in wavelength results in a completely different, yet deterministic, speckle output.
The relationship between the input field and the output speckle pattern for a fixed scattering medium can be described by a transmission matrix, T. For a vectorial (polarized) optical field, this relationship is expressed as:
$$ \begin{pmatrix} E{out, x}(u,v) \ E{out, y}(u,v)
\end{pmatrix}
\sum{m,n,u,v} \begin{pmatrix} T{11}(m,n,u,v) & T{12}(m,n,u,v) \ T{21}(m,n,u,v) & T{22}(m,n,u,v) \end{pmatrix} \begin{pmatrix} E{in, x}(m,n) \ E_{in, y}(m,n) \end{pmatrix} $$
where ((m,n)) and ((u,v)) are the spatial coordinates of the input and output light fields, respectively, and (E{in,x}, E{in,y}) and (E{out,x}, E{out,y}) represent the complex amplitudes of the two orthogonal polarization components of the incident and outgoing vectors [5]. The transmission matrix T thus provides a complete linear description of the medium's scattering properties. In a spectral encoding device, the scattering medium acts as a mixer, mapping the input spectrum to a spatial intensity distribution ((I(x,y) = |E_{out}(x,y)|^2)) that is recorded by a standard image sensor. The reconstruction of the original spectrum is then achieved by employing a pre-calibrated reconstruction algorithm that maps the recorded speckle pattern to a known wavelength or a full spectral profile.
Key Scattering Platforms and Experimental Protocols
Multimode and Few-Mode Optical Fibers
Multimode fibers (MMFs) are a widely used platform for spectral encoding due to their flexibility, low cost, and strong mode-mixing characteristics. MMFs support numerous transverse guided modes (often hundreds or more), which interfere to form a speckle pattern at the output [6]. The large number of modes provides a high-dimensional encoding space, enabling precise spectral discrimination.
Table 1: Research Reagent Solutions for Multimode Fiber Systems
| Component | Specifications / Example Types | Function in Experimental Setup |
|---|---|---|
| Multimode Fiber (MMF) | Core/Cladding: 50/125 µm or 62.5/125 µm; Numerical Aperture (NA): 0.2-0.3 [6] | Acts as the primary dispersive and mode-mixing element for spectral encoding. |
| Few-Mode Fiber (FMF) | SMF28-J9 (2nd-mode cutoff 1260 nm), 1550-BHP (2nd-mode cutoff 1400 nm) [7] | Provides a balance between number of modes and manageable complexity; reduces speckle contrast. |
| Broadband Light Source | Superluminescent Diode (SLD), e.g., 840 nm center wavelength, 50 nm bandwidth [7] | Provides the incoherent or partially coherent illumination whose spectrum is to be characterized. |
| Polarization Controller | Inline fiber polarization controller with three adjustable rings [7] | Mitigates polarization-dependent spectral modulation artifacts caused by differential mode delay. |
| Imaging Spectrometer | Custom-built spectrometer with high-speed line camera (e.g., 80 kHz) [7] | Captures the spectrally encoded line for analysis in flow cytometry or imaging applications. |
Experimental Protocol 3.1: Spectrally Encoded Flow Cytometry (SEFC) with Few-Mode Fiber Collection
This protocol details the setup for a fiber-based SEFC system, which demonstrates the practical application of spectral encoding for high-speed cell analysis [7].
Optical Setup Assembly:
- Begin with a polarized broadband light source (e.g., an 840 nm SLD). Collimate the beam and expand it to a 2.5 mm diameter.
- Pass the expanded beam through a transmission diffraction grating (e.g., 600 l/mm) to disperse the spectrum.
- Use a unit-magnification telescope and a high-NA objective lens (e.g., 60×, 1.2 NA) to focus the spectrally encoded line onto the sample plane.
- For signal collection, employ a separate few-mode fiber (e.g., 1550-BHP). Couple the back-scattered light into this fiber using an appropriate collimating lens. A polarizing beam splitter and a quarter-wave plate in the illumination path are used to improve signal efficiency.
- Direct the collected signal to a custom spectrometer equipped with a high-speed line camera.
Calibration and Artifact Mitigation:
- Image a reflective resolution target to establish a baseline.
- If severe vertical fringe patterns appear in the image (an artifact of differential mode delay in the FMF), carefully adjust an inline polarization controller wrapped with the FMF. Manually tune the rings' tilt angles to minimize the fringe contrast.
System Characterization:
- Lateral Resolution Measurement: Image a USAF 1951 resolution target. Calculate the edge response to determine the spatial resolution along the spectrally encoded axis. Expect a slight reduction in resolution (e.g., 0.71 µm for a 1550-BHP fiber vs. 0.54 µm for a single-mode fiber) [7].
- Signal Acquisition: For flow cytometry, acquire images of flowing cells without scanning, at a high line rate (e.g., 20 kHz). The spectral encoding allows for the translation of spatial information into temporal data.
The following workflow diagram illustrates the key steps in this SEFC protocol:
Laser Projection Speckle for 3D Morphology
While not a spectrometer, this application powerfully demonstrates the use of engineered speckle for high-precision measurement, showcasing another critical facet of speckle pattern reconstruction. It involves projecting a laser speckle pattern onto a target object and using stereoscopic imaging to reconstruct its 3D form.
Experimental Protocol 3.2: High-Temperature 3D Morphology Reconstruction via Laser Speckle Projection
This protocol is designed for challenging environments, such as measuring thermal components at temperatures up to 1000°C, where traditional contact methods or surface-applied speckles fail [8].
Laser Speckle Projector Assembly:
- Construct a laser projection system using a 400 mW laser and a frosted glass diffuser mounted on a micro-displacement platform. The diffuser generates a high-contrast, non-invasive speckle pattern that is projected onto the target specimen.
- Incorporate an optical filtering system (e.g., short-wavelength active light source with a matched narrowband filter) to suppress intense blackbody thermal radiation from the hot sample.
Image Acquisition and 3D-DIC Processing:
- Use a stable, calibrated dual-camera system to synchronously capture images of the laser-speckled specimen from different angles.
- Perform stereo matching and temporal matching of the speckle images using digital image correlation (DIC) algorithms. This process establishes correspondence between points in the left and right images to compute 3D coordinates [8].
Point Cloud Post-Processing:
- The initial 3D point cloud will contain noise and holes due to thermal airflow disturbances.
- Apply a wavelet-based smoothing algorithm to the point cloud data. This step is crucial for reducing high-frequency noise while preserving the underlying sharp features of the object's morphology, thereby significantly improving reconstruction accuracy [8].
Table 2: Performance Comparison of Speckle-Based 3D Reconstruction Methods
| Method | Key Innovation | Test Environment | Reported Performance / Accuracy |
|---|---|---|---|
| Laser Speckle & Wavelet Smoothing [8] | Laser projection speckle avoids high-temperature speckle degradation. Wavelet smoothing of point clouds. | 1000°C furnace | High-precision reconstruction; validated against commercial CMM. |
| Bi-Directional Speckle Projection [9] | Two laser projectors overcome occlusion and limited coverage on curved surfaces. | Room temperature | Relative reconstruction error of 0.1% on a semicylindrical surface. |
Advanced Reconstruction Techniques and Data Processing
Deep Learning for Speckle Restoration
Traditional linear reconstruction methods can be limited by noise and the complexity of the scattering process. Deep learning offers a powerful nonlinear alternative for reconstructing information from speckle patterns.
Experimental Protocol 4.1: Adaptive Vectorial Restoration using Trans-CNN Network
This protocol is designed for reconstructing images from dynamic speckle patterns after passing through anisotropic biological scattering media (e.g., chicken breast tissue) [5].
Dataset Generation:
- Generate Vector Optical Fields: Use a spatial light modulator (SLM) in a 4f optical setup to generate input images (e.g., processed MNIST handwritten digits) encoded on vector optical fields.
- Record Speckle Patterns: Transmit these fields through dynamic biological tissue samples of varying thickness (0.5 mm to 2.0 mm). Use a camera to record the resulting output speckle patterns for both orthogonal polarization components. This creates a paired dataset of input images and output speckles.
Model Training:
- Network Architecture: Employ the Trans-CNN network, a hybrid model combining a U-Net (for capturing local features) and a Transformer encoder (for modeling long-range, global dependencies) [5].
- Input and Output: The input to the network is the speckle image. The network is trained to output the reconstructed original image. For vector fields, the final decoding layer splits features into two channels to reconstruct the phase information for each orthogonal polarization component.
Validation and Testing:
- Evaluate the model on a test set of unseen speckle patterns generated by the biological tissue.
- Assess reconstruction quality using metrics like Structural Similarity Index (SSIM) and Peak Signal-to-Noise Ratio (PSNR), demonstrating robustness against the dynamic and anisotropic nature of the scattering medium.
The architecture of the deep learning model used in this protocol is detailed below:
Scattering media, ranging from multimode fibers to engineered disordered surfaces, provide a versatile and powerful foundation for developing next-generation compact spectroscopic and imaging systems. The experimental protocols outlined here—from SEFC with few-mode fibers and high-temperature 3D reconstruction to deep-learning-assisted speckle restoration—provide a concrete roadmap for researchers to implement these technologies. The critical considerations of platform selection, calibration, speckle contrast management, and advanced computational reconstruction must be carefully addressed to harness the full potential of spectral encoding. As research progresses, the integration of novel disordered metasurfaces and more sophisticated AI-driven analysis promises to further miniaturize these devices and expand their applications into areas such as wearable sensors, real-time biomedical diagnostics, and harsh-environment monitoring.
In the field of compact spectrometer applications, the reconstruction of speckle patterns represents a transformative approach to spectral analysis. This methodology replaces the bulky dispersive optics of conventional spectrometers with a miniaturized encoding element and a computational reconstruction algorithm [10]. The core of this approach lies in a mathematical framework where spectral information is encoded into a spatial intensity distribution (a speckle pattern) via a transmission matrix, and subsequently decoded to recover the original input spectrum [11] [12]. This document details the foundational mathematical models, quantitative performance metrics, and standardized experimental protocols that underpin this technology, providing a resource for researchers and scientists engaged in its development and application.
Core Mathematical Model
The operation of a speckle-based reconstructive spectrometer can be formulated as a linear encoding process. An unknown input spectrum, represented by the vector S with dimensions ( N \times 1 ) (where ( N ) is the number of spectral channels), is encoded by a transmission matrix T [11] [12] [10]. The result of this encoding is a measured output signal, typically a speckle pattern, represented by the vector I with dimensions ( M \times 1 ) (where ( M ) is the number of detection channels or pixels imaging the speckle) [11] [10]. This relationship is captured by the linear equation:
[ \mathbf{I}{M \times 1} = \mathbf{T}{M \times N} \cdot \mathbf{S}_{N \times 1} ]
In the context of speckle spectrometers, the transmission matrix T is not a designed or simple matrix but is rather a complex and random mapping that is highly dependent on the physical properties of the scattering medium, be it a multimode optical fiber [12], a disordered photonic crystal [12], or a cascaded diffractive metasurface [11]. Each element ( T_{ij} ) of this matrix defines the coupling strength between the ( j )-th spectral component and the ( i )-th detection channel [10]. The process of spectral recovery involves inverting this equation to solve for the unknown spectrum S given the calibrated matrix T and the measured speckle pattern I [10].
Table 1: Key Variables in the Linear Encoding Model for Speckle Spectrometers.
| Variable | Description | Role in Spectral Reconstruction |
|---|---|---|
| S | Input spectrum vector (( N \times 1 )) | The unknown signal to be recovered; represents light intensity at N discrete wavelengths [10]. |
| I | Measured speckle pattern vector (( M \times 1 )) | The encoded signal; a spatial intensity distribution captured by a camera [11] [10]. |
| T | Transmission Matrix (( M \times N )) | The linear model of the encoding hardware; maps spectral channels to spatial channels [11] [10]. |
| ( N ) | Number of spectral channels | Defines the potential spectral resolution and bandwidth of the reconstructed spectrum [11]. |
| ( M ) | Number of detection channels | The number of pixels used to sample the speckle pattern; often ( M < N ) for compressed sensing [10]. |
Quantitative Performance Metrics
The performance of a speckle-based spectrometer is quantified by several key metrics that are directly influenced by the properties of the transmission matrix and the physical encoding hardware.
The spectral correlation width is a critical parameter that indicates the minimum wavelength shift required to produce a statistically independent speckle pattern, thereby defining the fundamental resolution limit of the system [11] [12]. It is calculated from the correlation function of the speckle intensity [11] [12]: [ C(\Delta \lambda) = \left\langle \frac{ \langle I(\lambda, x) I(\lambda + \Delta \lambda, x) \rangle\lambda }{ \langle I(\lambda, x) \rangle\lambda \langle I(\lambda + \Delta \lambda, x) \rangle\lambda } - 1 \right\ranglex ] where ( I(\lambda, x) ) is the recorded intensity at position ( x ) for wavelength ( \lambda ), and ( \langle \cdots \rangle ) denotes averaging over wavelengths or spatial channels [11]. The Half-Width at Half-Maximum (HWHM) of ( C(\Delta \lambda) ) is often reported as the spectral correlation width [11].
Furthermore, the overall capability of a spectrometer is captured by the number of spectral channels, which is the ratio of its operational bandwidth to its resolution [11]. When this is considered relative to the chip area, it gives the channel density, a key metric for assessing the miniaturization and efficiency of on-chip devices [11].
Table 2: Reported Performance of Select Speckle Spectrometer Implementations.
| Implementation | Footprint | Bandwidth | Resolution | Spectral Channels | Channel Density | Citation |
|---|---|---|---|---|---|---|
| On-chip Diffractive Metasurface | 150 μm × 950 μm | 100 nm | 70 pm | 1400 | ~10,021 ch/mm² | [11] |
| Multimode Optical Fiber (20 m) | N/A (Fiber) | N/A | 8 pm | N/A | N/A | [12] |
| 2D Photonic Microring Lattice | 1 mm × 1 mm | 40 nm | 15 pm | 2666 | ~2,666 ch/mm² | [11] |
Experimental Protocols
Protocol 1: System Calibration and Transmission Matrix Measurement
This protocol outlines the procedure for calibrating a speckle-based spectrometer by empirically determining its transmission matrix, T.
Research Reagent Solutions:
- Tunable Laser Source: Provides a spectrally pure and wavelength-known input for calibration [12].
- Single-Mode Input Waveguide/Fiber: Ensates a consistent spatial and polarization input profile for reproducible mode excitation in the scattering medium [12].
- Multimode Scattering Element: The core encoding element (e.g., multimode fiber [12], cascaded metasurfaces [11]) that generates the wavelength-dependent speckle pattern.
- High-Resolution Camera (CCD/CMOS): Images and records the output speckle patterns for each calibration wavelength [11] [12].
Methodology:
- Setup: Couple the output of the tunable laser source into the scattering element using the single-mode input waveguide. Image the output facet of the scattering element onto the camera [12].
- Data Acquisition: For each wavelength ( \lambdaj ) across the desired operational bandwidth (e.g., in steps matching the target resolution), record the corresponding speckle pattern ( \mathbf{I}(\lambdaj) ) [12].
- Matrix Construction: The measured speckle pattern for each wavelength ( \lambdaj ) forms the ( j )-th column of the transmission matrix T. For a monochromatic input at ( \lambdaj ), the spectrum S is a delta function, and thus ( \mathbf{I}(\lambdaj) = \mathbf{T}{\cdot, j} ), where ( \mathbf{T}_{\cdot, j} ) is the ( j )-th column of T [10].
- Storage: The fully populated ( M \times N ) matrix T is stored for use in the subsequent reconstruction of unknown spectra.
Protocol 2: Spectral Reconstruction of an Unknown Source
This protocol describes the process for reconstructing the spectrum of an unknown light source after the system has been calibrated.
Methodology:
- Measurement: Replace the tunable laser with the unknown light source, ensuring the input coupling conditions remain identical to those during calibration. Capture a single image of the resulting speckle pattern, which constitutes the measurement vector ( \mathbf{I}_{meas} ) [10].
- Inversion: Recover the unknown spectrum ( \mathbf{S}{rec} ) by solving the linear system ( \mathbf{I}{meas} = \mathbf{T} \cdot \mathbf{S}_{rec} ). Since this is often an ill-posed inverse problem (especially when ( M < N )), computational techniques are required [10].
- Computational Techniques:
- Compressive Sensing (CS): Used if the spectrum is sparse in some domain (e.g., has a few sharp peaks). CS algorithms find the solution that best fits the measurement while enforcing sparsity [10].
- Least Squares Minimization: A robust algorithm can combine a truncated inversion technique with least squares minimization to achieve accurate reconstruction in the presence of experimental noise [12].
- Deep Learning: Neural networks, such as U-Net architectures, can be trained to learn the inverse mapping from speckle patterns I directly to spectra S, often showing superior robustness to noise and perturbations [13] [10] [14].
The following workflow diagram illustrates the complete process from system calibration to spectral reconstruction.
The Scientist's Toolkit
Table 3: Essential Research Reagent Solutions for Speckle Spectrometer Development.
| Item | Function / Role | Example Specification / Note |
|---|---|---|
| Tunable Laser Source | Provides precise wavelength control for system calibration. | Key for building the transmission matrix; requires high wavelength accuracy and purity [12]. |
| Multimode Fiber / On-Chip Scatterer | Serves as the compact, dispersive element that encodes spectrum into speckle. | Examples: 20m multimode fiber for high resolution [12]; cascaded metasurfaces for on-chip integration [11]. |
| High-Sensitivity Camera | Records the spatial intensity distribution of the speckle pattern. | A monochrome CCD or CMOS camera is typically used; number of pixels defines detection channels (M) [12]. |
| Silicon Photonics Platform | Foundational substrate for fabricating on-chip spectrometers. | Enables integration of input waveguides, metalenses, and metasurfaces using standard processes [11]. |
| Computational Reconstruction Algorithm | Decodes the speckle pattern to recover the original spectrum. | Includes compressive sensing, least squares minimization, or deep learning models [12] [10]. |
The pursuit of miniaturized, high-performance spectrometers has catalyzed the development of advanced encoding hardware that transforms spectral information into measurable spatial patterns. Within the context of compact spectrometer applications, speckle pattern reconstruction has emerged as a powerful paradigm, leveraging complex optical scattering to encode wavelengths into unique intensity distributions. Two particularly promising technologies for generating these encoding patterns are double-layer disordered metasurfaces and femtosecond laser-induced nanostructures. These approaches enable the creation of wavelength-specific speckle fingerprints within extremely compact form factors, bypassing the traditional trade-offs between spectral resolution, operational bandwidth, and device size that have long constrained conventional spectrometer design. By functioning as specialized spectral-to-spatial encoders, these advanced hardware platforms transform integrated image sensors into powerful analytical instruments, bringing laboratory-grade spectroscopic capability to portable formats suitable for field deployment and point-of-care diagnostics.
Double-Layer Disordered Metasurfaces
Double-layer disordered metasurfaces represent a precisely engineered approach to spectral encoding through controlled multiple scattering. These devices comprise two separate layers of nanostructured metasurfaces separated by a precisely defined propagation distance [15] [16]. Each metasurface layer consists of nanoscale scatterers with randomized geometries and positions, typically fabricated from high-index dielectric materials like silicon nitride (SiNx). When incident light passes through this double-layer system, it undergoes wavelength-dependent complex modulation through the combined effects of scattering from both layers and free-space propagation between them.
The operational principle hinges on creating predictable yet highly complex speckle patterns that serve as unique fingerprints for each wavelength [15]. Unlike random scattering media, these disordered metasurfaces are computationally designed, enabling a priori determination of their spectral response without exhaustive empirical characterization. The double-layer configuration provides critical advantages over single-layer implementations by introducing additional degrees of freedom in the optical path, effectively decoupling the requirements for high spectral resolution and adequate sampling of the resulting speckle patterns [15]. This architecture enables spectral resolutions of approximately 1 nm across the visible spectrum (440-660 nm) within a total form factor of less than 1 centimeter [15] [16].
Femtosecond Laser-Induced Nanostructures
Femtosecond laser-induced nanostructures leverage a fundamentally different approach based on controlled surface modification of transparent materials. When femtosecond laser pulses (typically with durations of 10^-15 seconds) are focused onto or within transparent substrates, they induce nonlinear absorption processes that create permanent nanograting structures with feature sizes significantly smaller than the optical wavelength [17] [18]. These self-organized nanostructures exhibit periodic refractive index variations with periods ranging from 60-300 nm, functioning as form-birefringent elements that impart wavelength-dependent polarization and phase modifications to transmitted light [17].
The formation mechanism involves a complex interplay between the incident laser pulse and the electron plasma it creates, leading to nanoscale material redistribution through processes like Coulomb explosion and hydrodynamic ablation [18]. By controlling laser parameters such as pulse energy, duration, repetition rate, and polarization, along with scanning trajectory and speed, researchers can precisely tune the structural characteristics of the resulting nanogratings, including their period, orientation, and birefringence strength [17] [19]. When integrated into spectroscopic systems, these nanostructures serve as compact, robust scattering elements that generate wavelength-dependent speckle patterns, achieving remarkable spectral resolutions as fine as 0.1 nm in demonstrated implementations [20].
Table 1: Performance Comparison of Advanced Encoding Platforms for Compact Spectrometers
| Parameter | Double-Layer Disordered Metasurfaces | Femtosecond Laser-Induced Nanostructures |
|---|---|---|
| Spectral Resolution | ~1 nm [15] [16] | 0.1 nm (visible) to 10 pm (NIR) [20] [21] |
| Operational Bandwidth | 440-660 nm (visible) [15] | Up to 200 nm in NIR [21] |
| Form Factor | <1 cm [15] [16] | Chip-scale (mm) [20] [11] |
| Key Advantage | Predictable speckle patterns [15] | Ultra-high resolution [20] |
| Fabrication Method | Nanolithography (e.g., E-beam) [15] | Direct laser writing [17] [18] |
| Integration Compatibility | Direct mounting on image sensors [15] | Surface or bulk modification of various substrates [17] |
Quantitative Performance Specifications
Table 2: Detailed Technical Specifications of Encoding Hardware Platforms
| Performance Metric | Double-Layer Disordered Metasurfaces | Femtosecond Laser Nanostructures on Quartz | On-Chip Diffractive Metasurfaces |
|---|---|---|---|
| Spectral Channels | 221 channels [15] | Not specified | 1400 channels [11] |
| Bandwidth-Resolution Ratio | ~200 | >1000 (for 0.1 nm resolution/100 nm BW) [20] | ~1428 [11] |
| Footprint Area | ~1 cm² [15] | Chip-scale [20] | 0.1425 mm² (150 × 950 μm) [11] |
| Channel Density | Not specified | Not specified | 10,021 ch/mm² [11] |
| Operating Wavelength | Visible (440-660 nm) [15] | Visible to NIR (1500-1600 nm demonstrated) [20] | Telecom (1500-1600 nm) [11] |
| Calibration Requirement | Minimal (predictable design) [15] | Transmission matrix measurement [20] | System-specific calibration [11] |
Experimental Protocols
Fabrication Protocol for Double-Layer Disordered Metasurfaces
The fabrication of double-layer disordered metasurfaces requires precise nanofabrication techniques to create the designed random scattering structures:
Metasurface Design:
- Define disordered patterns of silicon nitride (SiNx) nanoposts with randomized widths using computational design tools.
- Set phase delay values for nanoposts to range from 0 to 2π at the design wavelength (e.g., 532 nm).
- Determine system parameters including inter-layer separation (T ≈ 1.34 mm) and metasurface-to-sensor distance (L ≈ 8 mm) based on desired spectral resolution and form factor constraints [15].
Nanofabrication Process:
- Deposit SiNx thin film on transparent substrate via plasma-enhanced chemical vapor deposition (PECVD).
- Apply electron-beam lithography to pattern disordered nanopost arrays with feature sizes ranging from 60-300 nm.
- Use reactive ion etching (RIE) to transfer patterns into the SiNx layer with vertical sidewalls and minimal roughness.
- Repeat the process for the second metasurface layer on a separate substrate, maintaining design consistency [15].
Alignment and Integration:
- Precisely align the two metasurface layers using optical alignment fixtures with sub-micrometer accuracy.
- Fix the inter-layer separation using precision spacers (T = 1.34 mm).
- Directly mount the stacked metasurface assembly onto a commercial image sensor (pixel size = 2.4 μm) using index-matching optical adhesive [15].
- Verify alignment and wavefront distortion using interferometric characterization.
Validation and Testing:
- Illuminate the system with monochromatic light from a tunable laser source across the operational bandwidth.
- Capture speckle patterns at 1 nm wavelength intervals.
- Calculate spectral correlation function to verify resolution using the formula: δλ ≈ λ² / [2(T(1-cosθₘₘ) + L(1-cosθₘₛ))], where θ represents acceptance angles [15].
- Confirm spectral resolution of ~1 nm through correlation analysis of adjacent wavelength speckle patterns.
Fabrication Protocol for Femtosecond Laser-Induced Nanostructures
The formation of nanogratings inside transparent materials using femtosecond laser irradiation follows a precise protocol:
Substrate Preparation:
- Select appropriate transparent substrate (fused silica, borosilicate glass, or sapphire).
- Clean substrates using standard RCA cleaning procedure to remove organic and ionic contaminants.
- Mount substrate on high-precision 3-axis translation stage with rotational capability for polarization control [17] [18].
Laser System Configuration:
- Utilize femtosecond laser system (e.g., Ti:Sapphire, 800 nm, 100 fs, 1 kHz repetition rate).
- Adjust pulse energy using a half-wave plate and polarizer combination (typical range: 0.1-1 μJ depending on material).
- Control beam polarization state using quarter-wave or half-wave plates for circular or linear polarization.
- Focus laser beam inside transparent material using high-NA objective (NA > 0.5) [17] [18].
Nanograting Formation:
- Translate substrate relative to laser focus at constant velocity (1-100 μm/s) while maintaining pulse energy stability.
- Monitor formation quality in real-time using simultaneous reflectance and transmittance measurements.
- Implement active feedback control using proportional-integral-derivative (PID) algorithm to adjust laser power based on transmittance signals for uniform nanostructures [18].
- For surface nanostructures, employ double-sided processing by flipping the substrate and repeating the procedure on the reverse side [20].
Post-Processing and Characterization:
- Anneal samples at elevated temperatures (300-500°C) to enhance stability and remove residual stress (optional).
- Characterize nanograting morphology using scanning electron microscopy (SEM) and atomic force microscopy (AFM).
- Quantify birefringence properties using polarization microscopy and spectroscopic ellipsometry.
- Measure phase shift and retardance to confirm desired optical performance [17] [19].
System Integration and Calibration Protocol
Regardless of the encoding platform, proper integration and calibration are essential for optimal spectrometer performance:
Optical Integration:
- Couple light from input source (fiber, free-space) to the encoding element using appropriate optics.
- For on-chip implementations, use adiabatic tapers to match mode field diameters between components.
- Mount encoding hardware at correct distance from image sensor (L = 8 mm for double-layer metasurfaces) [15].
- Implement stray light suppression using baffles and antireflection coatings.
Calibration Procedure:
- Illuminate system with monochromatic light from tunable laser source across full operational bandwidth.
- For double-layer disordered metasurfaces: Capture speckle patterns at 1 nm intervals, verify predictability of patterns [15].
- For femtosecond laser-induced nanostructures: Measure comprehensive transmission matrix by recording speckle patterns at wavelength intervals matching desired resolution (e.g., 0.1 nm) [20].
- Store calibrated transmission matrix T(λ) for subsequent reconstruction algorithms.
Reconstruction Algorithm Implementation:
- For unknown spectrum measurement, capture single speckle pattern I(x,y).
- Solve linear inverse problem I = T×S using regularization techniques (Tikhonov regularization, compressive sensing).
- Implement neural network approaches (ResNet-50, GRU) for enhanced reconstruction accuracy [20].
- Validate reconstruction accuracy using standard reference sources.
The Scientist's Toolkit: Research Reagent Solutions
Table 3: Essential Materials and Equipment for Encoding Hardware Fabrication
| Category | Specific Items | Function/Purpose | Technical Specifications |
|---|---|---|---|
| Metasurface Fabrication | Silicon Nitride (SiNx) thin films | Primary dielectric material for metasurfaces | High refractive index (~2.0), low absorption in visible range [15] |
| Electron-beam lithography system | Patterning of nanoscale metasurface elements | Sub-10 nm resolution capability [15] | |
| Reactive ion etching (RIE) system | Transfer of patterns into dielectric materials | High aspect ratio, anisotropic etching [15] | |
| Femtosecond Laser Processing | Ti:Sapphire femtosecond laser system | Inducing nanograting formation in transparent materials | 100-300 fs pulse width, 1-1000 kHz repetition rate [17] [18] |
| High-NA objective lenses | Focusing laser pulses inside transparent materials | NA > 0.5, working distance suitable for processing [17] | |
| Precision 3D translation stages | Controlling sample position during laser writing | Sub-micrometer accuracy, 100+ mm travel range [18] | |
| Characterization Equipment | Spectroscopic ellipsometer | Measuring birefringence of nanogratings | Spectral range covering operational wavelengths [17] |
| Scanning electron microscope (SEM) | Imaging nanostructure morphology | Resolution < 5 nm, compatible with insulating materials [18] | |
| Off-axis holographic microscope | Measuring phase delay of metasurface elements | Quantitative phase imaging capability [15] | |
| Integration Components | Scientific CMOS/CCD image sensors | Capturing speckle patterns for reconstruction | High pixel count (>1 MP), small pixel size (<5 μm) [15] [20] |
| Precision mechanical mounts | Aligning optical components | 5-axis adjustment, sub-micrometer resolution [15] | |
| Tunable laser sources | System calibration | Narrow linewidth (<0.01 nm), broad tuning range [20] |
Applications in Drug Development and Biomedical Research
The integration of advanced encoding hardware into compact spectrometers opens numerous applications in pharmaceutical and biomedical fields:
Point-of-Care Diagnostic Platforms: Miniature spectrometers enable portable chemical analysis systems for therapeutic drug monitoring, allowing healthcare providers to measure drug concentrations in patient blood or urine samples rapidly at the bedside. The 1 nm resolution capability of double-layer disordered metasurfaces permits discrimination of closely related molecular species, while the compact form factor enables integration into handheld diagnostic devices [15] [16].
High-Throughput Pharmaceutical Screening: Speckle-based spectrometers incorporated into microplate readers facilitate rapid characterization of compound libraries during drug discovery. The single-shot measurement capability of these systems significantly accelerates spectral acquisition compared to traditional scanning spectrometers, enabling real-time monitoring of chemical reactions and binding events in high-throughput screening environments [20].
Biomolecular Interaction Analysis: The ultra-high resolution (up to 10 pm) achievable with femtosecond laser-induced nanostructures enables detailed study of molecular interactions through subtle spectral shifts in absorption or fluorescence signatures. This precision allows researchers to monitor conformational changes in proteins, nucleic acid hybridization, and receptor-ligand binding kinetics without labeling [20] [21].
Quality Control in Pharmaceutical Manufacturing: Compact spectrometers integrated into manufacturing systems enable real-time monitoring of drug synthesis and formulation processes. The robustness and minimal calibration requirements of disordered metasurface-based systems make them suitable for industrial environments, providing continuous verification of chemical composition and detection of contaminants during production [15] [16].
These applications demonstrate how advanced encoding hardware transforms spectroscopic capability from a benchtop technique confined to specialized laboratories to a versatile tool deployable throughout the drug development pipeline, from discovery research to manufacturing and clinical monitoring.
Future Perspectives and Development Challenges
The continued advancement of speckle-based spectrometer technologies faces several interdisciplinary challenges requiring collaboration between materials science, photonics, and computational fields:
Fabrication Scalability: Current nanofabrication methods for disordered metasurfaces, particularly electron-beam lithography, face limitations in throughput and cost for mass production. Future development of nanoimprint lithography approaches could enable high-volume manufacturing while maintaining the precise feature control required for predictable speckle generation [15].
Spectral Range Expansion: Most current implementations focus on visible or near-infrared regions. Extending operation to ultraviolet and mid-infrared ranges would significantly broaden application potential in pharmaceutical analysis, but requires development of novel material systems with suitable dispersion properties and transparency in these regions [17] [11].
Computational Efficiency: As spectral resolution and channel counts increase, the computational burden of reconstruction algorithms grows substantially. Development of dedicated hardware accelerators and optimized reconstruction algorithms will be essential for real-time operation in resource-constrained portable devices [20] [21].
Environmental Stability: Maintaining calibration under varying temperature and mechanical conditions remains challenging for field-deployable systems. Research into temperature-compensated designs and active recalibration methods using reference light sources will enhance operational robustness in real-world environments [18].
Multimodal Sensing: Future systems may integrate spectroscopic sensing with other measurement modalities such as polarization analysis or spatial imaging within common hardware platforms. Such hyperspectral imaging capabilities would provide comprehensive material characterization for complex pharmaceutical formulations and biological samples [16] [11].
Addressing these challenges will further establish speckle-based spectrometers as powerful analytical tools that combine the performance of laboratory instruments with the portability and accessibility required for widespread deployment in pharmaceutical research, clinical diagnostics, and therapeutic monitoring applications.
The advancement of compact spectrometers is intrinsically linked to the strategic engineering of three core performance metrics: spectral resolution, operational bandwidth, and device form factor. These parameters often exist in a trade-off relationship, where improving one can compromise another. For researchers and drug development professionals, navigating this balance is crucial for selecting or developing the appropriate spectroscopic tool for applications ranging from real-time reaction monitoring to portable diagnostic sensing.
This application note delineates these key metrics, provides a quantitative comparison of state-of-the-art technologies, and details experimental protocols for implementing speckle-based spectroscopic systems, which have emerged as a leading approach for achieving high performance in a miniaturized footprint.
Performance Metrics of Miniaturized Spectrometers
The table below summarizes the performance of various miniaturized spectrometer technologies, highlighting the advancements in speckle-based and other computational approaches.
Table 1: Performance Comparison of Miniaturized Spectrometer Technologies
| Technology / Architecture | Spectral Resolution | Bandwidth | Bandwidth-Resolution Ratio | Footprint | Form Factor |
|---|---|---|---|---|---|
| On-Chip Diffractive Speckle Spectrometer [11] | 70 pm | 100 nm | ~1,430 | 150 µm × 950 µm | Layered metasurfaces on SOI chip |
| Disordered Photonic Molecule Spectrometer [22] | 8 pm | >100 nm | >12,500 | 70 µm × 50 µm | CMOS-compatible photonic molecule chip |
| Single-Shot Integrated Speckle Spectrometer [21] | 10 pm | 200 nm | 20,000 | ~2 mm² | Passive silicon photonic network on SOI |
| Compact Speckle Spectrometer (Femtosecond Laser) [20] | 0.1 nm (100 pm) | 100 nm | 1,000 | Not Specified | Double-sided nanostructures on quartz glass |
| Double-Spiral Waveguide Spectrometer [23] | 0.08 nm (80 pm) | 150 nm | 1,875 | Not Specified | Silicon nitride double-spiral waveguide |
| Nonlinear Memristive Spectrometer [24] | 2 nm | 10 nm (630–640 nm) | 5 | Ultra-compact | 2D material (WSe₂) homojunction memristor |
Analysis of Performance Trade-offs
The data reveals distinct strategies for balancing performance metrics. Speckle-based spectrometers consistently achieve high bandwidth-resolution ratios by leveraging complex light-matter interactions to encode extensive spectral information into a spatially-dense speckle pattern [11] [21]. For instance, the single-shot spectrometer uses a cascaded network of unbalanced Mach-Zehnder interferometers and an antenna array to generate a pattern with thousands of independent sampling channels from a compact chip [21].
The disordered photonic molecule spectrometer demonstrates an extreme miniaturization, achieving a resolution of 8 pm in a footprint of just 3500 µm². This is accomplished by using an N-body-like system of coupled microdisks to generate a quasi-chaotic, high-Q transmission spectrum that effectively eliminates the periodicity found in simpler resonator systems [22].
Experimental Protocols for Speckle Spectrometry
Protocol: Transmission Matrix Calibration for a Speckle Spectrometer
This protocol is fundamental to the operation of any reconstructive speckle spectrometer [20] [11].
1. Principle: The system is treated as a linear operator, T, such that I = T ⋅ S, where S is the input spectrum and I is the output speckle intensity pattern. Calibration involves empirically determining the matrix T.
2. Materials:
- Tunable laser source with a wavelength range covering the spectrometer's operational bandwidth.
- Speckle spectrometer chip (e.g., with scattering metasurfaces [11] or a disordered photonic molecule [22]).
- High-resolution imaging system (e.g., an infrared camera with appropriate objectives).
3. Procedure:
- Step 1: Couple light from the tunable laser into the spectrometer's input waveguide.
- Step 2: Set the laser to a specific wavelength, λ₁.
- Step 3: Capture the resulting speckle pattern I(λ₁) using the imaging system. Flatten the 2D image into a 1D column vector.
- Step 4: Repeat Steps 2-3 for a dense set of wavelengths (λ₁, λ₂, ..., λ_N) across the entire bandwidth. The wavelength step should be smaller than the target resolution.
- Step 5: Construct the transmission matrix T by assembling the column vectors I(λ₁) ... I(λ_N). Each column of T represents the speckle "fingerprint" for its corresponding wavelength.
4. Data Analysis: The calibrated matrix T is stored and used for subsequent spectral reconstruction of unknown inputs via algorithms like non-negative least squares or trained neural networks.
Protocol: Single-Shot Spectral Reconstruction Using a Passive Photonic Chip
This protocol describes the operational use of a spectrometer like the one detailed in [21].
1. Materials:
- Passive silicon photonic chip with an integrated unbalanced MZI network and antenna array.
- Broadband light source (e.g., supercontinuum laser) or light from the sample under test.
- Imaging system (microscope objective, lens, IR camera).
2. Procedure:
- Step 1: Couple the unknown light into the chip's input grating.
- Step 2: Allow the light to propagate through the cascaded MZI network, acquiring wavelength-dependent phase shifts, and diffract into free space via the antenna array.
- Step 3: Capture a single image of the resulting far-field speckle pattern.
- Step 4: Extract the intensity values from the image pixels to form the measurement vector I_meas.
3. Spectral Reconstruction:
- The unknown spectrum Sunknown is reconstructed by solving the equation Imeas = T ⋅ S_unknown, where T is the pre-calibrated transmission matrix.
- Due to noise and an often underdetermined system, solving this typically involves optimization techniques with regularization, such as Tikhonov regularization [25]:
ŝ = argmin ‖T ⋅ s - I_meas‖₂² + α‖s‖₂² where α is a regularization parameter that prevents overfitting to noise.
- Alternatively, deep learning models (e.g., ResNet-50 combined with GRU) can be trained on known speckle-spectrum pairs to directly map Imeas to Sunknown, which can achieve superior resolution beyond the classical Rayleigh limit [20].
Visualization of the Speckle Spectrometry Workflow
The following diagram illustrates the core workflow and logical relationships in a speckle-based spectral reconstruction system.
Diagram 1: Speckle spectrometry workflow for spectral reconstruction.
The Scientist's Toolkit: Essential Research Reagents & Materials
Table 2: Key Research Reagent Solutions for Speckle Spectrometer Development
| Item / Solution | Function / Application | Key Characteristics |
|---|---|---|
| Silicon-on-Insulator (SOI) Wafer | Standard substrate for fabricating CMOS-compatible photonic integrated circuits [11] [21]. | 220 nm top silicon layer on 2 µm buried oxide is a common platform. |
| Femtosecond Laser Writer | Fabricating double-sided surface nanostructures as scattering media on quartz glass [20]. | Enables direct-write, maskless fabrication of complex scattering structures. |
| Si₃N₄ Photonic Platform | Fabrication of ultra-low-loss waveguides for long optical paths in compact spirals or microresonators [23] [26]. | Low material absorption and scattering losses in the near-infrared. |
| Tunable Laser Source | Calibration of the spectrometer's transmission matrix [20] [3]. | Narrow linewidth, precise wavelength control over the full operational bandwidth. |
| High-Resolution SWIR Camera | Capturing speckle patterns in the telecommunications wavelength band (e.g., 1500-1600 nm) [21]. | High pixel count (e.g., InGaAs sensor) to maximize independent sampling channels. |
| Neural Network Software Stack | High-accuracy spectral reconstruction from speckle patterns, potentially surpassing classical resolution limits [20] [24]. | Frameworks like TensorFlow/PyTorch; architectures like ResNet-50 and GRU are applicable. |
The relentless drive for miniaturization in spectroscopy is being successfully addressed by innovations in speckle pattern reconstruction and other computational methods. As demonstrated, the strategic design of scattering media—from disordered metasurfaces and photonic molecules to cascaded interferometer networks—allows developers to deftly navigate the fundamental trade-offs between resolution, bandwidth, and footprint. The experimental protocols and toolkit outlined herein provide a foundation for researchers in academia and industry to implement, validate, and further advance these compact spectroscopic systems for demanding applications in drug development and beyond.
Reconstruction Algorithms and Biomedical Applications
Speckle patterns, the granular interference structures generated when coherent light scatters through a disordered medium, encode valuable information about the incident light. In compact spectrometer applications, these patterns serve as a unique fingerprint for the spectrum of the light they originate from. The core principle of speckle-based reconstructive spectrometers (RSs) involves capturing the speckle pattern generated by the light to be measured after it passes through a scattering medium, then computationally recovering the incident spectra using specialized reconstruction algorithms [3]. This single-shot working mechanism significantly increases the potential spectral measurement rate compared to traditional scanning spectrometers. The measurement rate of these systems can theoretically reach the kHz scale, primarily limited by the speed of detection and modulation devices [3].
The fundamental mathematical framework governing this process can be expressed as I = Φ · S, where S represents the original spectral signal, Φ denotes the measurement matrix characterizing the scattering medium, and I represents the observed light intensity captured by the detector [3]. The central computational challenge involves inverting this relationship to recover the unknown spectrum S from the measured speckle intensity I, often without direct knowledge of the transmission matrix Φ. This reconstruction process forms the core of modern computational methodologies ranging from traditional transmission matrix inversion to advanced compressive sensing and deep learning techniques.
Computational Reconstruction Methodologies
Transmission Matrix Formalism and Inversion
The transmission matrix (TM) approach provides a comprehensive mathematical framework for describing how optical fields transform when passing through scattering media. For vector optical fields, which convey multidimensional information including intensity, phase, and polarization states, the vector transmission matrix (VTM) formalism becomes essential. The relationship between input and output optical fields is expressed as:
Where Ein and Eout represent the complex amplitudes of the two orthogonal polarization components of the incident and outgoing vector fields, respectively, and T is the VTM capturing the medium's transmission characteristics [5]. In anisotropic biological tissues, the off-diagonal components of the VTM (T₁₂, T₂₁) become non-zero, indicating reciprocal conversion between orthogonal polarization components during propagation [5].
Traditional TM inversion requires precise characterization of the scattering medium through calibration, where the TM is first measured using known input fields and corresponding output speckles. Once characterized, image reconstruction involves numerically inverting the TM to recover the input from measured output speckles. However, this approach faces challenges in dynamic biological media where the TM fluctuates over time due to tissue movement or dehydration.
Explicit Speckle Tracking Algorithms
Explicit speckle tracking methods represent another class of computational approaches, particularly valuable in X-ray phase contrast imaging. These methods track local transverse displacements of speckle patterns in the detection plane after sample insertion.
X-ray Speckle Tracking (XST): This algorithm calculates the 2D cross-correlation between small windows in sample and reference images to determine lateral shifts of speckle modulations [27]. The transverse displacement D⊥(xi, yj) is found by maximizing the zero-normalized cross-correlation between image subsets. The phase image ϕ(x, y) is subsequently obtained through numerical integration of gradients derived from these displacements [27].
X-ray Speckle Vector Tracking (XSVT): This scanning technique enhances lateral resolution to a single pixel and improves angular resolution by acquiring multiple image pairs at different transverse positions of the speckle generator [27]. By organizing collected images into 3D stacks, XSVT achieves superior displacement mapping compared to basic XST.
Compressive Sensing and Ghost Imaging
Compressive sensing (CS) leverages signal sparsity to reconstruct images from significantly fewer measurements than required by the Nyquist-Shannon criterion. In speckle-based spectrometry, CS enables accurate spectral reconstruction from limited speckle data.
Computational Ghost Imaging (CGI) utilizes this principle by correlating random speckle patterns with bucket detector signals to reconstruct images. The object image G(x, y) is reconstructed through the second-order correlation function:
Where In(x,y) represents the intensity distribution of the nth speckle pattern, Sn is the corresponding bucket detector signal, and N is the total number of patterns [28]. Advanced implementations can resolve fine details as small as 2.2 μm using optimized speckle patterns and deep learning enhancement [28].
Deep Learning-Based Reconstruction
Deep learning approaches have revolutionized speckle reconstruction by learning complex mappings between speckle patterns and their corresponding sources without explicit physical models.
Trans-CNN Network: This hybrid architecture combines U-Net convolutional layers for local feature extraction with Transformer self-attention mechanisms for global dependencies [5]. The model processes input speckle images through parallel encoding paths that capture both detailed textural information and long-range pixel relationships, effectively reconstructing high-dimensional characteristics of vector optical fields.
Speckle2Self: A novel self-supervised algorithm for speckle reduction using only single noisy observations [29]. By applying multi-scale perturbation operations that introduce tissue-dependent variations while preserving anatomical structure, the method isolates clean images without requiring paired training data.
U-Tunnel-Net: A U-Net variant specifically designed for speckle noise reduction, featuring strategic pooling operation placement between convolution blocks and novel Tunnel Blocks incorporating the xUnit activation function [30]. This architecture preserves significant features after pooling operations before transfer through skip connections, enhancing denoising performance for ultrasound imaging.
Table 1: Comparison of Computational Reconstruction Methodologies
| Methodology | Key Principles | Advantages | Limitations |
|---|---|---|---|
| Transmission Matrix Inversion | Direct inversion of measured transmission matrix | Physically interpretable; High accuracy with known TM | Requires precise calibration; Sensitive to medium changes |
| Explicit Speckle Tracking (XST/XSVT) | Cross-correlation of local speckle displacements | Simple implementation; Quantitative phase retrieval | Limited spatial resolution; Computationally intensive |
| Compressive Sensing & Ghost Imaging | Sparse signal recovery from undersampled measurements | Reduced measurements required; Lensless imaging possible | Reconstruction artifacts possible; Dependent on sparsity |
| Deep Learning (Trans-CNN, U-Tunnel-Net) | Learned mappings from speckle to source | Handles complex noise; Robust to variations | Large training data needed; Black-box nature |
Experimental Protocols
Protocol: Transmission Matrix Calibration for Spectral Reconstruction
Purpose: To characterize the transmission matrix of a scattering medium for compact spectrometer applications.
Materials:
- Tunable laser source (1520-1567 nm range)
- Polarization-maintaining fiber
- Scattering medium (integrating sphere or multimode fiber)
- InGaAs camera or CMOS detector
- Computational processing unit
Procedure:
- Setup Configuration: Connect the tunable laser to the polarization-maintaining fiber, which is fused with the selected scattering medium (integrating sphere recommended for higher measurement rates) [3].
- Wavelength Sampling: Step through the wavelength range of interest (e.g., 1520-1567 nm) at discrete intervals, ensuring sufficient sampling for target spectral resolution.
- Speckle Acquisition: At each wavelength, capture the corresponding speckle pattern using the camera. For local speckle analysis, crop regions of interest to 1/50 of full-pixel speckles to increase measurement speed by 35× without significant accuracy loss [3].
- Matrix Construction: Organize speckle patterns into column vectors to construct the measurement matrix Φ, where each column corresponds to a specific wavelength.
- Validation: Verify matrix accuracy by reconstructing known test spectra and calculating mean squared error (target: ~10⁻³ order) [3].
Computational Analysis:
- For spectral reconstruction, solve the linear system I = Φ · S using regularization techniques (Tikhonov regularization recommended for ill-conditioned systems).
- Implement singular value decomposition (SVD) for matrix inversion with truncation to eliminate noise-sensitive components.
Protocol: Deep Learning-Based Speckle Reconstruction
Purpose: To implement a Trans-CNN network for vector field reconstruction from dynamic speckle patterns through biological scattering media.
Materials:
- Vector optical field generation system (4f configuration)
- Biological scattering samples (chicken breast tissue slices, 0.5-2.0 mm thickness)
- Polarization-resolved detection system
- GPU-accelerated computational platform
Procedure:
- Data Acquisition:
- Generate vector optical fields using coherent superposition of orthogonal polarization basis vectors [5].
- Pass generated fields through biological samples of varying thickness.
- Capture output speckle patterns using polarization-resolved detection.
- Acquire approximately 10,000 speckle-image pairs for training [5].
Network Implementation:
- Configure Trans-CNN architecture with parallel U-Net and Transformer paths.
- Set input speckle image size to 256×256 pixels.
- For Transformer path, divide input image into 16×16 patches with projection to 768-dimensional embedding space [5].
- Implement skip connections with multiplicative feature combination.
Training Protocol:
- Initialize with He normal weight initialization.
- Use Adam optimizer with learning rate 1×10⁻⁴.
- Train for 1000 epochs with batch size 16.
- Employ early stopping with patience of 50 epochs.
Validation:
- Evaluate on test set with structural similarity index (SSIM) and peak signal-to-noise ratio (PSNR).
- Assess generalization on unseen tissue samples and thicknesses.
Research Reagent Solutions
Table 2: Essential Materials for Speckle-Based Spectrometry Research
| Category | Specific Items | Function & Application Notes |
|---|---|---|
| Scattering Media | Integrating spheres, Multimode fibers, Ground glass diffusers | Generate speckle patterns; Integrating spheres provide 35× faster measurement than MMFs [3] |
| Optical Components | Polarization-maintaining fibers, DMDs (Digital Micromirror Devices), Waveplates | Control polarization state; Generate structured illumination; DMDs enable programmable speckle patterns [28] |
| Detection Systems | InGaAs cameras, CMOS detectors, Single-pixel bucket detectors | Capture speckle patterns; Balance frame rate and resolution; Silicon cameras achieve ~200 kHz for visible light [3] |
| Computational Tools | NIRFASTer, NeuroDOT, Custom deep learning frameworks | Forward modeling and image reconstruction; Specialized packages for diffuse optical tomography [31] |
| Sample Preparation | Polystyrene microspheres, Chicken breast tissue slices, USAF resolution targets | Phantom validation; Biological tissue analogs; Resolution testing [32] [5] |
Workflow Visualization
Diagram 1: Speckle Pattern Reconstruction Workflow. This diagram illustrates the complete pipeline from laser illumination through scattering media to computational reconstruction using various methodologies.
Diagram 2: Trans-CNN Network Architecture. This hybrid deep learning model combines U-Net convolutional layers for local feature extraction with Transformer self-attention mechanisms for capturing global dependencies in speckle patterns.
The application of deep learning architectures for pattern recognition represents a cornerstone of modern computational analysis, enabling breakthroughs across multiple scientific disciplines. In the specific context of speckle pattern reconstruction for compact spectrometer applications, the challenges of noise resilience, feature extraction, and sequence modeling require specialized architectural solutions. ResNet-50, Gated Recurrent Units (GRUs), and U-Net variants have emerged as particularly powerful tools for addressing these challenges, each contributing unique capabilities to the pattern recognition pipeline. ResNet-50 provides the deep feature extraction necessary for discerning subtle patterns in spectral data; GRU networks model temporal and sequential dependencies in wavelength-dependent phenomena; while advanced U-Net variants enable precise reconstruction of speckle patterns with pixel-level accuracy.
The integration of these architectures creates a powerful framework for spectrometer miniaturization, where traditional optical components are replaced or augmented by computational methods. Speckle patterns, which arise from the interference of scattered light, contain rich information about the incident light's properties but require sophisticated analysis to decode. The architectures discussed herein provide the mathematical foundation for transforming these complex interference patterns into actionable spectral data, enabling the development of compact, cost-effective spectroscopic tools with applications spanning pharmaceutical development, chemical analysis, and biomedical diagnostics.
Architectural Foundations
ResNet-50: Deep Feature Extraction
ResNet-50 belongs to the family of residual networks that addressed the vanishing gradient problem in deep networks through skip connections, enabling the training of substantially deeper architectures. The ResNet-50 architecture consists of 50 layers, organized into four sequential stages with increasing filter counts (64, 128, 256, 512). The fundamental innovation is the residual block, which implements the mapping: H(x) = F(x) + x, where x is the input to the block, F(x) represents the learned transformations, and H(x) is the final output. This formulation allows gradients to flow directly backward through the identity connections, mitigating gradient degradation in deep networks [33].
For speckle pattern analysis, ResNet-50 serves as a powerful feature extractor that can identify hierarchical patterns in complex interference structures. The initial layers capture basic edges and textures, while deeper layers assemble these primitives into increasingly abstract representations relevant to spectral decomposition. The architecture's depth and complexity enable it to discern subtle variations in speckle patterns that correspond to minute differences in incident light properties, making it particularly valuable for high-resolution spectroscopic applications [34].
Gated Recurrent Unit (GRU): Sequential Modeling
Gated Recurrent Units represent a sophisticated evolution in recurrent neural network architecture, designed to capture temporal dependencies in sequential data while addressing the vanishing gradient problem through gating mechanisms. The GRU simplifies the Long Short-Term Memory (LSTM) unit by combining the input and forget gates into a single update gate, resulting in fewer parameters while maintaining comparable performance on many sequence modeling tasks [35].
The mathematical formulation of a GRU cell includes two primary gates:
- Update gate (z_t): Controls the balance between previous hidden state information and new candidate activation
- Reset gate (r_t): Determines how much of the previous hidden state contributes to the candidate activation
These gates enable the GRU to selectively retain important historical information while discarding irrelevant content, making it particularly effective for modeling wavelength-dependent sequential patterns in spectroscopic data. In compact spectrometer applications, GRU networks can model the temporal evolution of speckle patterns as they respond to changing light properties, capturing complex dependencies that would be challenging for traditional feedforward networks [35].
U-Net Variants: Precision Reconstruction
The U-Net architecture, originally developed for biomedical image segmentation, has become a cornerstone for precise pixel-level reconstruction tasks across multiple domains. The base architecture features a symmetric encoder-decoder structure with skip connections that preserve spatial information across layers. The encoder progressively reduces spatial resolution while increasing feature depth, capturing contextual information efficiently. The decoder then reconstructs spatial resolution while leveraging skip connections to recover fine-grained details lost during downsampling [36] [37].
Recent variants have significantly enhanced the original architecture:
- U-Net++: Incorporates nested skip pathways that reduce the semantic gap between encoder and decoder features
- U-Net 3+: Employs full-scale skip connections and deep supervision to improve feature fusion
- Attention U-Net: Integrates attention gates that selectively emphasize relevant spatial features
- Transformer-U-Net: Replaces convolutional blocks with transformer modules for improved long-range dependency modeling [38] [37]
For speckle pattern reconstruction, these U-Net variants enable precise mapping from raw interference patterns to reconstructed spectra, with particular strength in preserving high-frequency components and managing the complex, non-linear relationships inherent in the phenomenon.
Quantitative Performance Comparison
Table 1: Comparative Performance of Deep Learning Architectures on Pattern Recognition Tasks
| Architecture | Top-1 Error (%) | Parameters (Millions) | Inference Speed (ms) | Key Strengths | Speckle Pattern Applications |
|---|---|---|---|---|---|
| ResNet-50 | 7.3 | 25.6 | 89 | Hierarchical feature extraction, stable training | Feature extraction from complex speckle textures |
| GRU | N/A | 3.2 | 45 | Temporal modeling, parameter efficiency | Sequential spectral data reconstruction |
| U-Net (Base) | N/A | 31.2 | 76 | Pixel-level precision, skip connections | Speckle-to-spectrum translation |
| U-Net++ | N/A | 36.4 | 92 | Reduced semantic gap, improved fusion | Detailed speckle pattern reconstruction |
| Attention U-Net | N/A | 34.1 | 84 | Spatial feature selection | Noise-resilient speckle analysis |
| Transformer-U-Net | N/A | 48.7 | 121 | Long-range dependency modeling | Global speckle pattern correlations |
Table 2: U-Net Variant Performance on Medical Imaging Tasks (Relevant to Speckle Pattern Analysis)
| Architecture | Dice Coefficient | mIoU | Parameter Efficiency | Inference Speed | Relevance to Speckle Analysis |
|---|---|---|---|---|---|
| Traditional U-Net | 0.823 | 74.9% | Medium | 89 ms | Baseline for speckle reconstruction |
| Weak-Mamba-UNet | 0.887 | 87.21% | High | 62 ms | Long-range speckle correlations |
| MWG-UNet++ | 0.8965 | 85.4% | Medium | 76 ms | Multi-scale speckle feature fusion |
| AFTer-UNet | 0.879 | 83.6% | Medium | 68 ms | Computational efficiency for embedded spectrometers |
Experimental Protocols
Protocol 1: ResNet-50 for Speckle Pattern Feature Extraction
Purpose: To extract discriminative features from raw speckle patterns for preliminary spectral classification.
Materials:
- Speckle pattern dataset (minimum 10,000 samples)
- NVIDIA V100 or equivalent GPU
- PyTorch or TensorFlow deep learning framework
- Data augmentation pipeline
Procedure:
- Data Preparation: Resize all speckle patterns to 224×224 pixels to match ResNet-50 input requirements. Apply data augmentation including rotation (±15°), random cropping (85-100% of original area), and brightness variation (±20%).
- Model Configuration: Initialize ResNet-50 with pre-trained ImageNet weights. Replace the final fully connected layer with a custom classifier head matching the number of spectral classes in your dataset.
- Training Configuration: Set batch size to 32, initial learning rate to 0.001 with cosine decay, and cross-entropy loss. Use the Adam optimizer with default parameters.
- Fine-tuning: Train the network for 100 epochs, monitoring validation accuracy. Apply early stopping if validation performance plateaus for 10 consecutive epochs.
- Feature Extraction: Remove the classification head and use the output of the final convolutional layer (before global average pooling) as a 2048-dimensional feature vector for each speckle pattern.
Validation Metrics: Track top-1 classification accuracy, feature discriminability (using t-SNE visualization), and reconstruction error from downstream processing.
Protocol 2: GRU for Sequential Spectral Reconstruction
Purpose: To model the temporal dependencies in wavelength-swept speckle patterns for accurate spectral reconstruction.
Materials:
- Time-series speckle data (wavelength-dependent sequences)
- High-memory computational resources for sequence processing
- Python with Keras/TensorFlow implementation
Procedure:
- Sequence Preparation: Organize speckle patterns as sequences ordered by wavelength. Standardize each frame to zero mean and unit variance. Sequence length should be optimized for specific spectrometer characteristics (typically 50-200 frames).
- Architecture Configuration: Implement a 3-layer GRU network with 256 units per layer. Include layer normalization between GRU layers and 20% dropout for regularization.
- Teacher Forcing: During training, use teacher forcing with probability 0.5 to improve convergence. Use scheduled sampling to transition to model outputs during later training stages.
- Training Protocol: Train using mean squared error loss with the Adam optimizer (learning rate = 0.0005, β₁ = 0.9, β₂ = 0.999). Use gradient clipping at norm 5.0 to prevent explosion.
- Inference: For spectral reconstruction, process complete sequences using autoregressive generation or single forward pass depending on application requirements.
Validation Metrics: Sequence prediction accuracy, mean squared reconstruction error, and inference latency.
Protocol 3: U-Net for Speckle-to-Spectrum Translation
Purpose: To implement pixel-level reconstruction of spectral data from individual speckle patterns.
Materials:
- Paired speckle patterns and corresponding ground-truth spectra
- GPU with minimum 8GB VRAM
- U-Net implementation (PyTorch or TensorFlow)
Procedure:
- Data Preparation: Prepare paired dataset of speckle patterns and corresponding spectra. Resize inputs to optimal dimensions for selected U-Net variant (typically 256×256 or 512×512).
- Model Selection: Choose appropriate U-Net variant based on computational constraints and accuracy requirements. For initial experiments, standard U-Net provides a strong baseline.
- Loss Function: Implement a combined loss function: 60% Dice loss + 40% MSE to balance structural preservation and spectral accuracy.
- Training Configuration: Train with batch size 16 (adjust based on memory constraints), initial learning rate 0.0001 with reduce-on-plateau scheduling (factor=0.5, patience=5 epochs).
- Inference Optimization: Implement test-time augmentation (TTA) with 4 rotations (0°, 90°, 180°, 270°) and average predictions to boost performance.
Validation Metrics: Dice coefficient, mean Intersection over Union (mIoU), structural similarity index (SSIM), and spectral reconstruction accuracy.
Workflow Visualization
Diagram 1: Integrated Speckle Pattern Reconstruction Workflow
Diagram 2: Architecture Capabilities and Applications
Research Reagent Solutions
Table 3: Essential Research Materials for Speckle Pattern Analysis
| Reagent/Material | Specifications | Function | Application Notes |
|---|---|---|---|
| Multimode Fiber | 50µm core, 0.22 NA | Speckle pattern generation | Optimal for visible spectrum; ensures consistent speckle formation |
| CMOS Sensor | 5MP resolution, global shutter | Speckle pattern acquisition | High resolution captures fine speckle details; global shutter reduces motion artifacts |
| Tunable Laser Source | 400-700nm range, 1nm resolution | Wavelength-controlled illumination | Enables sequential speckle pattern acquisition across spectrum |
| Computational Resources | NVIDIA V100 GPU, 32GB VRAM | Model training and inference | Essential for processing large speckle pattern datasets |
| Data Augmentation Pipeline | Rotation, scaling, brightness adjustment | Dataset expansion | Improves model generalization; critical with limited experimental data |
| Calibration Standards | NIST-traceable wavelength standards | System validation | Ensures reconstruction accuracy across operational range |
Implementation Considerations
Computational Efficiency
For compact spectrometer applications, computational efficiency is paramount. Model selection should balance accuracy with inference speed, particularly for portable or real-time applications. Recent U-Net variants demonstrate significant efficiency improvements; for example, the Weak-Mamba-UNet architecture achieves 87.21% mIoU with only 24.7M parameters and 62ms inference time, representing an optimal balance for embedded deployment [38]. The comprehensive U-Bench evaluation platform has further revealed that traditional CNN architectures often provide superior computational efficiency compared to more recent transformer-based approaches when evaluated using holistic metrics like U-Score, which considers accuracy, parameter count, computational cost, and inference speed simultaneously [36].
Integration Strategies
Successful integration of ResNet-50, GRU, and U-Net architectures requires thoughtful design of information flow between components. The recommended approach employs ResNet-50 for initial feature extraction, GRU networks for modeling wavelength-dependent sequential relationships, and U-Net variants for final reconstruction. Skip connections should be implemented between ResNet-50 feature maps and corresponding U-Net decoder layers to preserve spatial information [37]. This integrated approach leverages the strengths of each architecture while mitigating their individual limitations.
Domain Adaptation
Spectrometer applications vary widely in their operational requirements, including spectral range, resolution, and signal-to-noise ratio. Effective domain adaptation strategies include:
- Transfer learning from natural image datasets (ImageNet) to initialize feature extractors
- Progressive fine-tuning on increasingly target-specific data
- Domain randomization during training to improve robustness
- Adversarial training to minimize domain shift between simulation and real-world deployment
Recent advances in few-shot learning and self-supervised pre-training offer promising pathways for reducing data requirements in specialized spectroscopic applications [38] [37].
The synergistic application of ResNet-50, GRU networks, and U-Net variants provides a powerful framework for speckle pattern reconstruction in compact spectrometer applications. ResNet-50 delivers robust feature extraction from complex interference patterns, GRU networks effectively model sequential wavelength dependencies, and advanced U-Net variants enable precise pixel-level reconstruction of spectral data. The integration of these architectures, guided by the protocols and implementations detailed herein, enables the development of sophisticated computational spectrometers that leverage speckle pattern analysis for miniaturized chemical sensing, pharmaceutical development, and biomedical diagnostics. As these architectures continue to evolve—particularly through hybrid design approaches that combine the strengths of multiple paradigms—they will unlock new capabilities in portable spectroscopic instrumentation with broad applications across scientific research and industrial practice.
Single-Shot Spectral Acquisition and High-Speed Measurement Techniques
Single-shot spectral acquisition represents a paradigm shift in optical measurement technology, enabling the complete characterization of light pulses or spectral distributions in a single measurement event. Unlike conventional techniques that require hundreds or thousands of laser shots to assemble a complete picture, single-shot methods capture the full temporal and spectral structure of ultrafast phenomena in real-time [39]. This capability is particularly crucial for studying irreversible processes, highly dynamic systems, and experiments where shot-to-shot reproducibility cannot be assumed. The rapid evolution of these technologies has been driven by advances in computational spectroscopy, nanophotonics, and innovative optical encoding strategies.
The fundamental challenge in single-shot measurements lies in capturing ultra-rapid fluctuations and complex electromagnetic field structures that occur on timescales too brief for sequential scanning techniques. Traditional spectrometers rely on dispersive elements that require significant physical distance to spread light into constituent wavelengths, inherently limiting their speed and miniaturization potential [1]. Single-shot techniques overcome these limitations through spatial encoding of spectral information, temporal stretching of ultrafast signals, or mapping spectral components to unique spatial patterns that can be captured simultaneously with array detectors.
Within the context of speckle pattern reconstruction for compact spectrometer applications, single-shot acquisition enables new paradigms for instrument design. By employing disordered media or engineered metasurfaces that generate wavelength-dependent speckle patterns, researchers can create spectrometers that simultaneously capture broad bandwidths with high resolution in a compact form factor [1] [11] [21]. These innovations are pushing the boundaries of what's possible in portable spectroscopy, enabling laboratory-grade performance in devices small enough for integration into smartphones and wearable technology.
Key Single-Shot Acquisition Techniques
Speckle-Based Reconstruction Methods
Speckle-based spectroscopic techniques leverage the fundamental principle that light propagating through disordered media generates unique interference patterns that serve as fingerprints for different wavelengths. Unlike conventional spectrometers that establish one-to-one correspondence between spectral components and spatial positions, speckle-based methods employ a computational reconstruction approach where the entire pattern encodes the spectral information [1].
Double-Layer Disordered Metasurfaces: KAIST researchers have pioneered a reconstructive spectrometer technology using double-layer disordered metasurfaces that complexly scatter light through two layers of disordered nanostructures [1] [2]. This architecture creates unique and predictable speckle patterns for each wavelength across a broad spectral range (440-1,300 nm). The metasurface, featuring structures tens to hundreds of nanometers in size, is mounted directly onto a standard image sensor, creating a complete spectrometer system smaller than 1 centimeter that achieves 1 nm resolution from a single image capture [1]. The key innovation lies in the precise engineering of the random structures to generate optimally diverse speckle patterns that enable accurate spectral reconstruction through computational inversion.
Multi-Layer Diffractive Metasurfaces: Building on single-layer designs, researchers have developed cascaded metasurface architectures that significantly enhance spectral channel density [11]. This approach employs three layers of diffractive metasurfaces on a silicon photonic chip, greatly increasing the effective interference path lengths and creating speckle patterns with more finely detailed spectral features. The system achieves a remarkable spectral resolution of 70 pm over a 100 nm bandwidth, providing up to 1,400 spectral channels within an ultra-compact chip area of only 150 μm × 950 μm [11]. This corresponds to an exceptional channel density of 10,021 ch/mm², representing a significant advancement in the miniaturization of high-performance spectrometers.
Integrated Speckle Spectrometer with Mach-Zehnder Networks: Another innovative approach combines cascaded unbalanced Mach-Zehnder interferometers (MZIs) with random antenna arrays on a silicon photonic chip [21]. The MZI network introduces strong wavelength-dependent phase variations, while the antenna array diffracts the encoded optical signals into free space at wavelength-dependent angles. This combination produces highly complex speckle patterns that shift dynamically with wavelength changes. The system achieves an impressive spectral resolution of 10 pm across a 200 nm bandwidth, with approximately 2,730 statistically independent sampling channels captured in a single shot [21]. The purely passive nature of this photonic network eliminates the need for power-consuming tunable elements while maintaining exceptional performance.
Temporal and Spatial Encoding Techniques
RAVEN (Real-time Acquisition of Vectorial Electromagnetic Near-fields): Developed collaboratively by the University of Oxford and Ludwig-Maximilian University of Munich, RAVEN represents a breakthrough in complete laser pulse characterization [39]. This technique splits the laser beam into two components: one measures wavelength changes over time, while the other passes through a birefringent material that separates light with different polarization states. A microlens array then records the wavefront structure, with all information captured in a single image from which a computer program reconstructs the full electromagnetic structure of the laser pulse. The system has been successfully demonstrated on petawatt-class lasers, revealing previously unmeasurable distortions and wave shifts in real-time [39].
Fiber-Based Temporal Stretching: This approach circumvents the limitations of two-dimensional detectors by using dispersive optical fibers to slow down ultrafast signals to measurable timescales [40]. The method employs a linearly chirped probe pulse where the optical frequency varies linearly across the pulse in time, encoding temporal profile information in the probe spectrum. The pulse is then further chirped using group velocity dispersion in an optical fiber, stretching the ultrafast signal to nanosecond timescales that can be recorded with conventional photodiodes and electronics. This enables single-shot measurements at repetition rates up to 100 kHz, limited only by the acquisition speed of the oscilloscope [40].
SAPPHIRE (Single-shot Advanced Plasma Probe HolographIc REconstruction): Designed for plasma diagnostics, SAPPHIRE utilizes a chirped probe pulse, a diffractive optical element, and a self-referenced interferometer to achieve high-fidelity electron density measurements in a single shot [41]. The technique captures both spatial and temporal evolution of plasma density by exploiting the wavelength-time correspondence in chirped pulses. Different wavelength components interact with the plasma at different times, enabling reconstruction of full 3D electron density profiles nₑ(r,z,t) from a single exposure, revealing shot-to-shot variations that would be averaged out in multi-shot techniques [41].
Table 1: Performance Comparison of Single-Shot Spectral Acquisition Techniques
| Technique | Spectral Resolution | Bandwidth | Measurement Speed | Key Applications |
|---|---|---|---|---|
| Double-Layer Disordered Metasurfaces [1] | 1 nm | 440-1300 nm | Single image capture | Mobile spectroscopy, material analysis |
| Multi-Layer Diffractive Metasurfaces [11] | 70 pm | 100 nm | Single shot | High-resolution spectral analysis |
| Integrated Speckle Spectrometer [21] | 10 pm | 200 nm | Single image capture | Ultra-high resolution spectroscopy |
| RAVEN [39] | Full field characterization | Laser spectrum | Single laser shot | Ultra-intense laser pulse characterization |
| Fiber Temporal Stretching [40] | Sub-ps temporal | THz spectrum | 100 kHz rate | Irreversible phenomena, plasma dynamics |
Experimental Protocols
Protocol: Metasurface-Based Speckle Spectrometer
Principle: This protocol details the implementation of a single-shot spectrometer using double-layer disordered metasurfaces that convert spectral information into unique spatial speckle patterns [1] [2].
Materials and Equipment:
- Double-layer disordered metasurface chip
- Broadband light source (e.g., supercontinuum laser)
- Sample holder or interaction region
- High-resolution image sensor (CMOS or CCD)
- Computational reconstruction software
- Calibration source with known spectral lines
Procedure:
- System Calibration:
- Illuminate the metasurface with monochromatic light across the operational bandwidth
- Record the speckle pattern for each wavelength using the image sensor
- Construct a transmission matrix T(λ) linking each wavelength to its unique speckle fingerprint
- Validate calibration accuracy using sources with known spectral features
Sample Measurement:
- Direct light from the source through or reflected from the sample onto the metasurface
- Capture the resulting speckle pattern in a single exposure using the image sensor
- Extract the intensity distribution across the speckle pattern pixels
Spectral Reconstruction:
- Apply reconstruction algorithms to solve the inverse problem: I = T × S
- Utilize compressive sensing or machine learning approaches to recover the unknown spectrum S(λ)
- Quantify reconstruction accuracy using calibrated reference samples
Validation:
- Compare results with conventional spectrometer measurements
- Assess resolution using narrowband sources with known linewidths
- Evaluate dynamic range using attenuated broadband sources
Technical Notes: The metasurface must be precisely fabricated with controlled disorder to ensure optimal speckle diversity. The image sensor should have sufficient pixel count to capture detailed speckle patterns, typically exceeding 1 megapixel. Computational efficiency can be improved using pre-computed reconstruction matrices.
Protocol: Single-Shot Ultrafast Laser Characterization (RAVEN)
Principle: This protocol describes the complete characterization of ultra-intense laser pulses using the RAVEN technique, which captures the full spatiotemporal and polarization properties in a single shot [39].
Materials and Equipment:
- Ultra-intense laser system (e.g., petawatt-class laser)
- Beam splitting optics
- Birefringent crystal
- Microlens array
- Polarization components
- High-dynamic-range camera
- Reconstruction software
Procedure:
- Beam Preparation:
- Split the incoming laser beam into two paths using a partial reflector
- In one path, direct the beam through a spectrometer to measure wavelength changes over time
- In the second path, pass the beam through a birefringent material to separate different polarization states
Wavefront Sensing:
- Direct the polarization-separated beam through a microlens array
- Record the focal spot patterns from each microlens using a high-resolution camera
- Extract wavefront phase and amplitude information from the spot displacements
Data Acquisition:
- Simultaneously capture the spectral, polarization, and wavefront data in a single laser shot
- Ensure proper synchronization between all detection channels
- Record reference measurements without the laser pulse for background subtraction
Reconstruction:
- Combine the spectral, polarization, and wavefront data using specialized algorithms
- Reconstruct the complete electric field E(x,y,t) of the laser pulse
- Quantify spatiotemporal couplings and polarization imperfections
Validation:
- Compare with multi-shot characterization techniques where possible
- Verify reproducibility through repeated measurements
- Assess sensitivity by introducing known wavefront distortions
Technical Notes: The RAVEN technique is particularly valuable for lasers that fire only occasionally, as it provides complete characterization from single shots. The method has demonstrated success on the ATLAS-3000 petawatt-class laser, revealing small distortions and wave shifts previously impossible to measure in real-time [39].
Table 2: Research Reagent Solutions for Single-Shot Spectroscopy
| Material/Component | Function | Specifications | Application Examples |
|---|---|---|---|
| Disordered Metasurface | Spectral encoder | Double-layer nanostructures, <1 cm² area | Speckle pattern generation [1] |
| Microlens Array | Wavefront sensor | 100s of micro-lenses, precise pitch | Laser pulse characterization [39] |
| Chirped Fiber | Temporal stretcher | High dispersion, single-mode | Ultrafast signal slowing [40] |
| Unbalanced MZI Network | Phase diversity generator | Randomized path differences | Speckle complexity enhancement [21] |
| Diffractive Optical Element | Spatial encoder | Precise grating period, rotation capability | Wavelength-to-space mapping [41] |
Visualization of Techniques
Speckle Spectrometer Working Principle
Single-Shot Laser Characterization (RAVEN)
Applications and Future Directions
Single-shot spectral acquisition techniques have enabled transformative applications across numerous scientific and industrial domains. In laser physics and extreme optics, the RAVEN method provides unprecedented insights into ultra-intense laser-matter interactions, enabling real-time optimization of laser systems that was previously impossible [39]. This capability is particularly valuable for fusion energy research, where precise control of laser parameters is essential for achieving the extreme intensities required for inertial confinement fusion.
In material science and chemistry, single-shot spectroscopy enables the study of irreversible phenomena such as laser-induced phase transitions in materials like Ge₂Sb₂Te₅ (GST) [40]. The ability to capture complete transient dynamics in single exposures reveals accumulative effects and relaxation pathways that would be inaccessible through traditional multi-shot techniques. This provides crucial insights into fundamental material processes under extreme conditions.
The miniaturization of speckle-based spectrometers has opened new possibilities for portable and consumer applications. Metasurface-based spectrometers smaller than a fingernail can now perform laboratory-grade spectral analysis in smartphones and wearable devices [1] [2]. This enables applications ranging from food component analysis and crop health diagnosis to skin health measurement and environmental pollution detection, bringing advanced spectroscopic capabilities beyond traditional laboratory settings.
In plasma physics and accelerator technology, single-shot diagnostics like SAPPHIRE have revolutionized our ability to characterize rapidly evolving plasma systems without relying on shot-to-shot reproducibility [41]. The technique has revealed significant fluctuations between nominally identical laser shots, highlighting the importance of single-shot measurements for understanding the true variability of plasma dynamics. Similarly, single-shot terahertz spectroscopy techniques are enabling quantitative measurements in dynamic, reactive media with unprecedented speed and accuracy [42].
Future developments in single-shot spectral acquisition will likely focus on increasing computational efficiency, enhancing reconstruction algorithms through machine learning, and further miniaturization of optical components. The integration of these techniques with emerging photonic platforms and the development of hybrid approaches that combine multiple encoding strategies will continue to push the boundaries of speed, resolution, and compactness in spectroscopic instrumentation.
Biomedical sensing relies on advanced analytical techniques to characterize materials and elucidate chemical structures, which are critical for drug development, diagnostic procedures, and understanding biological systems. This field leverages a diverse array of technologies, from optical methods like speckle pattern analysis to spectroscopic techniques such as Near-Infrared (NIR) and Infrared Ion Spectroscopy (IRIS). These tools provide researchers with non-destructive, rapid, and highly sensitive means to probe the physical, chemical, and structural properties of materials—from pharmaceutical tablets to biological tissues [43] [44] [45].
The integration of these techniques is particularly powerful. For instance, laser speckle analysis can report on scattering properties of tissues, potentially differentiating between healthy and pathological states like melanoma [45]. Simultaneously, NIR spectroscopy and chemical imaging facilitate non-destructive analysis of solid dosage forms, enabling real-time monitoring of critical quality attributes such as content uniformity and blend homogeneity in pharmaceutical manufacturing [43]. Furthermore, emerging technologies like IRIS combine the sensitivity of mass spectrometry with the structural elucidation power of infrared spectroscopy, overcoming significant limitations in metabolite identification during drug development [46]. This application note details the protocols and methodologies underpinning these key techniques, providing a framework for their application in advanced biomedical research.
Speckle Pattern Analysis for Tissue Characterization
Theoretical Background and Application Principles
Laser speckle patterns are random interference patterns generated when coherent light scatters from a rough surface or through a complex medium. The statistical properties of these patterns, such as speckle size and contrast, are highly sensitive to the structural properties of the scattering material. This sensitivity enables the use of speckle analysis for characterizing biological tissues and turbid materials [45]. In biomedical contexts, this technique can interrogate subsurface scattering properties to distinguish between different tissue states. The simple and inexpensive experimental setup typically involves a laser (e.g., a HeNe laser) illuminating samples in a backscattering geometry, with a camera capturing the resultant speckle patterns for analysis [45].
Key Quantitative Parameters in Speckle Analysis
| Parameter | Symbol | Formula/Description | Biomedical Significance |
|---|---|---|---|
| Speckle Size | δx | δx = λZ1 / (D M) [47] | Determines spatial resolution of measurements; smaller speckles can resolve finer structural details. |
| Speckle Contrast | C | C = σs / , where σs is standard deviation and is mean intensity [45] | Related to scatterer concentration and mobility; can indicate tissue pathology (e.g., melanoma). |
| Lateral Shift | d | d = α Z1 M [47] | Used in vibration sensing to track surface motion (e.g., vocal fold vibrations). |
The combined measurement of speckle size and contrast can help separate the effects of scatterer size from scatterer concentration within a sample. This is crucial for biomedical applications, as it allows researchers to link specific stochastic speckle metrics to underlying tissue properties, such as changes in cellular and subcellular structures that may indicate disease [45]. Monte Carlo simulations of subsurface light fluence patterns are often employed to interpret experimental findings and expand speckle theory from surface-only to volumetric scattering processes [45].
Experimental Protocol: Volumetric Tissue Phantom Analysis
Objective: To characterize the scattering properties of turbid, tissue-like phantoms using spatial laser speckle analysis, with the goal of distinguishing samples based on scatterer size and concentration.
Materials and Reagents:
- Laser Source: HeNe laser (632.8 nm wavelength).
- Detection: CCD or CMOS camera (2D sensor for full pattern analysis; 1D sensor with diffractive optical element (DOE) for high-speed acquisition) [47] [45].
- Samples: Volumetric optical phantoms with calibrated scattering coefficients (µs) and known scatterer sizes (e.g., polystyrene microspheres in a suspending matrix).
- Optical Components: Lenses, neutral density filters, and a DOE (e.g., a linear multiplexer generating five replicas) if using a 1D sensor [47].
Procedure:
- Setup Configuration: Arrange the laser, sample, and camera in a backscattering geometry. The laser beam is expanded to illuminate the sample surface uniformly.
- Sensor Selection and Calibration:
- For Standard 2D Analysis: Use a 2D area scan camera. Adjust the lens to slightly defocus the imaging system to work in the far-field regime [47].
- For High-Speed 1D Analysis: Place a DOE directly in front of a high-speed 1D sensor. The DOE creates multiple spatially multiplexed replicas of the speckle pattern along the sensor, enabling synthetic 2D reconstruction and overcoming directional sensitivity limitations [47].
- Data Acquisition: For each phantom sample, acquire a sequence of speckle patterns. Ensure acquisition parameters (exposure time, laser power) are consistent across samples to allow for comparative analysis.
- Image Processing: For each captured frame, calculate the spatial speckle contrast and the average speckle size.
- Speckle Contrast: Compute a contrast image by sliding a small window (e.g., 7x7 pixels) across the raw speckle image, calculating the local standard deviation divided by the mean intensity [45].
- Speckle Size: Perform an autocorrelation analysis on the speckle image. The average speckle size is typically estimated as the full width at half maximum (FWHM) of the autocorrelation function [47].
- Data Analysis: Plot the measured speckle contrast against the speckle size for all phantom samples. Use this combined metric to differentiate phantoms based on their known scatterer size and concentration.
Workflow Visualization
NIR Spectroscopy for Pharmaceutical Material Characterization
Core Principles and Data Analysis
Near-Infrared (NIR) spectroscopy is a non-destructive analytical technique that measures the interaction of matter with light in the NIR region (780-2500 nm). It is widely used in the pharmaceutical industry for its rapid analysis capabilities and suitability as a Process Analytical Technology (PAT) tool. NIR spectroscopy probes overtone and combination bands of fundamental molecular vibrations (e.g., C-H, O-H, N-H), providing chemical and physical information about samples [43]. When combined with chemical imaging, it generates a hypercube—a three-dimensional data set containing a full spectrum for every pixel in a spatial image, enabling the visualization of component distribution in heterogeneous samples like tablets [43].
Chemometric techniques are essential for extracting meaningful information from NIR data:
- Partial Least Squares (PLS): A regression method used to develop quantitative models predicting material attributes (e.g., drug content, crushing force) from spectral data. Robust PLS models can achieve high coefficients of determination (R² > 0.98) [43].
- Principal Component Analysis (PCA): An unsupervised technique for classifying samples and identifying spectral patterns. PCA can detect blend segregation during tableting by highlighting outliers or trends in the scores plot, requiring only spectral data without prior wet chemical analysis [43].
Key Quantitative Findings from NIR Analysis of Multiparticulate Tablets
| Tableted System | Analyte | Analytical Technique | Key Result (SEP, SEC) | Application Note |
|---|---|---|---|---|
| Uncoated Theophylline Beads | Theophylline | PLS (Content Uniformity) | SEC: 0.31 mg, SEP: 0.37 mg [43] | Robust model for content uniformity of low-dose drugs. |
| Uncoated Cimetidine Beads | Cimetidine | PLS (Content Uniformity) | SEC: 0.47 mg, SEP: 0.49 mg [43] | Model suitable for tracking content uniformity. |
| Cimetidine/Placebo Bead Blends | Blend Homogeneity | PCA & NIR Chemical Imaging | Detected segregation in 80:20 ratio blends [43] | PCA can pinpoint onset of segregation during tableting. |
Experimental Protocol: Content Uniformity and Blend Segregation
Objective: To use NIR spectroscopy and chemical imaging to determine the content uniformity of multiparticulate tablets and assess the segregation tendency of bead blends during the tableting process.
Materials and Reagents:
- Spectrometer: NIR spectrometer with a fiber optic probe or a NIR chemical imaging system.
- Samples: Tablets prepared from extrusion-spheronized drug beads (e.g., Theophylline, Cimetidine) and lipid-based placebo beads, compressed at varying forces. Blends with different drug-to-placebo bead ratios (e.g., 20:80, 50:50, 80:20) [43].
- Software: Chemometric software package for PLS and PCA.
Procedure:
- Calibration Set Development: Prepare a calibration set of tablets with known drug content, spanning the expected range (e.g., 10.5–19.5 mg). Use reference methods (e.g., HPLC) to determine the actual drug content for these tablets.
- Spectral Acquisition: Collect NIR spectra from all tablets in the calibration set and from unknown test tablets. Ensure consistent positioning and environmental conditions.
- Chemometric Model Development:
- For Content Uniformity (PLS): Develop a PLS model by correlating the spectral data of the calibration set with the reference drug content values. Use cross-validation to optimize the model and avoid overfitting.
- For Blend Segregation (PCA): Acquire NIR spectra at regular intervals during the tableting run of a blended formulation. Perform PCA on the entire spectral dataset. Monitor the scores plot (e.g., PC1 vs. PC2) for any systematic drift or clustering, which indicates the onset of segregation.
- NIR Chemical Imaging: For selected tablets, use a NIR chemical imaging system to collect a hypercube. Generate chemical images based on the predicted content from the PLS model or from specific spectral bands characteristic of the drug. Visually assess the distribution of the drug beads within the tablet.
- Validation: Predict the drug content of the test tablets using the established PLS model and compare the results with reference methods to validate the model's accuracy.
Workflow Visualization
Infrared Ion Spectroscopy (IRIS) for Metabolite Identification
Infrared Ion Spectroscopy (IRIS) is a powerful tandem mass spectrometry (MS/MS) technique that combines the high sensitivity and separation capabilities of mass spectrometry with the detailed molecular structure information from infrared spectroscopy. It is particularly valuable in pharmaceutical research for identifying unknown drug metabolites, where traditional MS/MS data may be insufficient for definitive structural elucidation [46].
The principle of IRIS involves trapping and mass-isolating ions of interest within a mass spectrometer. These ions are then irradiated with a tunable infrared laser. When the laser frequency matches a vibrational transition of the ion, photons are absorbed, leading to characteristic fragmentation. An infrared spectrum is generated by plotting the fragmentation yield as a function of the laser wavelength, providing a unique "IR fingerprint" of the ion [46]. This technique is highly sensitive, requiring only the amount of material needed for a standard MS/MS experiment.
Key Advantages of IRIS in Metabolite Identification
| Feature | Advantage | Impact in Drug Development |
|---|---|---|
| Gas-Phase IR Spectra | Spectra can be reliably calculated using Density Functional Theory (DFT). | Enables identification of metabolites without synthetic reference standards. |
| Orthogonal Data | Provides IR structural fingerprints beyond MS/MS fragmentation patterns. | Distinguishes between positional isomers, which can have different biological activities. |
| High Sensitivity | Sensitivity is equivalent to standard MS/MS. | Suitable for analyzing metabolites found in complex biological matrices at low concentrations. |
| Specific Spectral Ranges | The 2800–3800 cm⁻¹ range (O-H, N-H, C-H stretches) is highly informative [46]. | Provides diagnostic information on functional groups like free OH groups (~3600 cm⁻¹). |
Experimental Protocol: Structural Elucidation of Metabolites
Objective: To use IRIS for the identification of an unknown drug metabolite, specifically to determine the site of glucuronidation or phase I oxidation.
Materials and Reagents:
- Platform: Mass spectrometer with optical access to the ion trap, coupled to an LC system and integrated with a high-power, high-repetition-rate infrared laser [46].
- Sample: Metabolite mixture from in vitro or in vivo studies, extracted and dissolved in appropriate solvent for LC-MS analysis.
- Software: Instrument control software and quantum-chemical calculation software (e.g., for DFT).
Procedure:
- LC-MS/MS Analysis: First, perform a standard LC-MS/MS analysis of the metabolite mixture to identify ions of interest (potential metabolites) based on their m/z values and fragmentation patterns.
- Ion Selection and Trapping: For a target m/z value, isolate the corresponding ions in the mass spectrometer's trap.
- IRIS Spectral Acquisition: Irradiate the trapped ions with the IR laser, scanning across a relevant wavelength range (e.g., 2800–3800 cm⁻¹). Monitor the yield of a specific fragment ion as a function of the laser wavelength to generate the IR spectrum.
- Theoretical Calculation: While the IRIS experiment is running, use DFT to calculate the expected IR spectra for a set of candidate isomeric structures for the metabolite.
- Spectral Matching and Identification: Compare the experimentally acquired IRIS spectrum with the library of DFT-calculated spectra. A match between the experimental and theoretical spectra allows for definitive identification of the metabolite's structure, including the specific site of modification.
The Scientist's Toolkit: Essential Research Reagents and Materials
Key Research Reagent Solutions
| Item | Function/Application | Example Context |
|---|---|---|
| Diffractive Optical Element (DOE) | Creates multiple spatial replicas of a speckle pattern on a 1D sensor. | Enables high-speed, direction-independent speckle sensing for vibration monitoring [47]. |
| Turbid Tissue Phantoms | Calibrated samples with known scattering properties. | Serve as controlled models for validating speckle-based tissue characterization methods [45]. |
| Extrusion-Spheronized Beads | Multiparticulate drug delivery systems. | Used as a complex model system for developing NIR methods for content uniformity and segregation studies [43]. |
| High-Power IR Laser | Provides photons for efficient ion fragmentation in IRIS. | Critical for obtaining high-quality, reproducible IR spectra of metabolites in an industrial IRIS platform [46]. |
| Chemometric Software | Applies multivariate algorithms (PLS, PCA) to spectral data. | Extracts quantitative and qualitative information from NIR spectra for pharmaceutical analysis [43]. |
Application Notes: Portable Spectrometers in Skin Health Diagnostics
The integration of compact spectrometer technology into dermatology represents a paradigm shift towards non-invasive, precise, and accessible diagnostic tools. These devices, particularly those leveraging speckle pattern reconstruction, enable detailed analysis of skin properties by probing its molecular composition without biopsies. The following applications are at the forefront of this transformation.
Non-Invasive Skin Cancer Detection
Portable spectrometers are revolutionizing the early detection of skin cancers, including melanoma, basal cell carcinoma, and squamous cell carcinoma.
- Elastic Scattering Spectroscopy (ESS): Devices like the DermaSensor utilize ESS to analyze light scattering from skin structures, providing real-time, non-invasive assessments of suspicious lesions [48]. Clinical trials have demonstrated its utility as a effective triage tool.
- Raman Spectroscopy: This technique detects the unique molecular "fingerprint" of skin tissue by analyzing inelastically scattered light. A multi-site FDA clinical study commenced in January 2025 is evaluating the AURA device from Vita Imaging Inc. for its effectiveness in detecting melanoma and other skin cancers [49]. Its non-invasive nature promises to reduce unnecessary biopsies and enable precise surgical interventions.
- AI-Enhanced Handheld Devices: Combined with artificial intelligence, these portable spectrometers can achieve diagnostic accuracy comparable to experienced dermatologists, facilitating rapid assessment even in regions with limited specialist access [50].
Objective Assessment of Inflammatory Skin Diseases
For chronic conditions like Atopic Dermatitis (AD), compact spectrometers and related digital tools provide quantitative, objective data that transcends traditional subjective scoring.
- Hyperspectral Imaging: This technology captures detailed spatial and spectral data across the visible light spectrum (400-720 nm). It quantifies subtle variations in skin color and inflammation (erythema) that are critical for monitoring disease severity and treatment response [51] [52]. Recent databases now include diverse skin tones, enhancing diagnostic accuracy across populations [51].
- Skin Ultrasound: High-resolution skin ultrasound, a related imaging modality, can quantitatively measure epidermal thickness—a biomarker positively correlated with inflammatory cell infiltration in AD. A reduction in epidermal thickness after treatment can objectively demonstrate therapeutic efficacy [52].
Personalized Treatment and Skin Health Monitoring
The miniaturization of spectroscopic technology enables its integration into consumer devices for daily skin health management.
- Smartphone Integration: Ultra-compact, high-resolution spectrometers, such as the fingernail-sized device developed by KAIST researchers, can be built into smartphones or wearable devices [1] [2]. This allows consumers to monitor skin hydration, UV exposure, and the effectiveness of skincare products by analyzing light reflected from the skin.
- Nanoparticle Delivery Monitoring: As nanotechnology advances in skincare, spectrometers could potentially track the penetration and distribution of nanoparticles delivering active ingredients like vitamins and retinoids, ensuring optimal delivery and efficacy [50].
Table 1: Performance Metrics of Emerging Spectroscopic Diagnostic Devices
| Device / Technology | Primary Application | Key Metric | Performance/Value |
|---|---|---|---|
| Speckle Spectrometer [20] | General Spectral Analysis | Spectral Resolution | 0.1 nm (up to 5 pm with neural network) |
| Bandwidth | 100 nm | ||
| KAIST Metasurface Spectrometer [1] [2] | Mobile Skin Health Analysis | Spectral Resolution | ~1 nm |
| Size | < 1 cm (fingernail-sized) | ||
| Raman Spectroscopy (AURA) [49] | Skin Cancer Detection | Diagnostic Feature | Molecular "fingerprint" for tissue identification |
| Hyperspectral Imaging [51] | Inflammatory Skin Assessment | Spectral Range | 400 - 720 nm |
| Data Resolution | 10-nanometer steps |
Experimental Protocols
The following protocols detail the methodologies for employing speckle-based spectrometers in skin diagnostics, from fundamental device operation to specific clinical validation.
Protocol 1: Fundamental Operation of a Speckle Spectrometer for Skin Measurement
This protocol outlines the basic procedure for acquiring spectral data from a skin sample using a compact speckle spectrometer.
2.1.1 Research Reagent Solutions & Essential Materials
Table 2: Essential Materials for Speckle-Based Skin Measurement
| Item | Function/Description |
|---|---|
| Compact Speckle Spectrometer | A device using a scattering medium (e.g., laser-induced nanostructures [20] or disordered metasurfaces [2]) to generate wavelength-dependent speckle patterns. |
| Calibrated Light Source | A broadband or tunable light source for illuminating the skin sample and calibrating the transmission matrix. |
| Image Sensor (CMOS/CCD) | Captures the high-resolution speckle patterns generated when light interacts with the scattering medium. |
| Skin Phantom or In Vivo Sample | A calibrated skin model or consenting human subject for measurement. |
| Computing Unit with Reconstruction Software | Hardware and algorithms (e.g., neural networks like ResNet-50/GRU [20]) to process the speckle pattern and reconstruct the spectrum. |
2.1.2 Step-by-Step Procedure
Device Calibration (Transmission Matrix Acquisition):
- Illuminate the speckle spectrometer with a tunable laser source across the target wavelength range (e.g., 440-1300 nm [2]) in discrete, known steps.
- For each wavelength step, use the image sensor to capture the corresponding unique speckle pattern.
- Compile the relationship between each input wavelength and its output speckle pattern into a "Transmission Matrix" (TM). This TM serves as a calibration map for the device [20].
Sample Measurement:
- Direct the calibrated light source onto the area of interest on the skin sample.
- Collect the light reflected from or transmitted through the skin and couple it into the speckle spectrometer.
- Capture the resulting speckle pattern on the image sensor with a single exposure [2].
Speckle Pattern Reconstruction:
- Input the captured speckle pattern into the reconstruction software.
- The software, often powered by a pre-trained deep learning model (e.g., a combination of ResNet-50 and Gated Recurrent Unit (GRU) [20]), compares the sample's speckle pattern against the calibrated TM.
- The algorithm solves the inverse problem to reconstruct the original spectrum of the light that interacted with the skin.
Data Interpretation:
- Analyze the reconstructed spectrum for specific spectral signatures (e.g., absorbance peaks, reflectance slopes) that correlate with skin properties such as melanin concentration, hemoglobin oxygen saturation, water content, or the presence of abnormal structures.
Protocol 2: Clinical Validation of a Spectroscopy Device for Skin Cancer Triage
This protocol describes a framework for validating the diagnostic accuracy of a portable spectrometer in a clinical setting, as exemplified by ongoing trials [49] [53].
2.2.1 Research Reagent Solutions & Essential Materials
Table 3: Essential Materials for Clinical Validation of a Skin Cancer Device
| Item | Function/Description |
|---|---|
| Investigational Spectrometer | The portable spectroscopic device (e.g., Raman, ESS) undergoing validation, pending regulatory approval [49]. |
| Reference Standard | The gold-standard diagnostic method, typically a histopathological analysis of a biopsy sample. |
| Dermatologist Panel | A group of board-certified dermatologists to provide clinical assessments for comparison. |
| Patient Cohort | A diverse population of consenting patients with suspicious skin lesions, recruited per the study protocol. |
| Data Management System | A secure, HIPAA-compliant system for storing clinical data, images, and spectroscopic readings. |
2.2.2 Step-by-Step Procedure
Study Design and IRB Approval:
- Design a blinded, prospective, multi-center clinical trial.
- Obtain approval from an Institutional Review Board (IRB) to ensure ethical compliance.
- Pre-define the primary endpoints (e.g., sensitivity, specificity) and the target performance metrics [49].
Patient Recruitment and Data Acquisition:
- Recruit a diverse patient cohort that represents a range of skin types (e.g., Fitzpatrick I-VI) to mitigate algorithmic bias [51] [53].
- For each consenting patient with a suspicious lesion, perform two parallel assessments:
- Test Method: Use the investigational spectrometer to acquire spectral data from the lesion.
- Reference Method: The lesion is clinically assessed by a dermatologist and subsequently biopsied for histopathological diagnosis.
Blinded Analysis:
- The spectroscopic data analysis should be performed blindly, without knowledge of the histopathology results.
- The device's algorithm classifies the lesion as "suspicious" or "benign."
Data Analysis and Validation:
- Compare the spectrometer's classifications against the gold-standard histopathology results.
- Calculate key performance metrics: Sensitivity (ability to correctly identify cancer), Specificity (ability to correctly identify benign lesions), and overall accuracy.
- Assess the device's potential impact on clinical workflow, including its ability to reduce unnecessary biopsies and streamline patient triage [53].
Overcoming Practical Challenges in Speckle Spectrometer Implementation
Addressing Calibration Ambiguity and System Drift
Calibration ambiguity and system drift present significant challenges in high-precision optical systems, particularly in the emerging field of speckle pattern reconstruction for compact spectrometers. These instruments, which are becoming increasingly vital for on-site chemical analysis and portable diagnostic tools, rely on stable calibration to deliver reliable results [54] [55]. As the market for portable spectrometers grows—projected to reach $4.065 billion by 2030—addressing these metrological challenges becomes increasingly critical for researchers, scientists, and drug development professionals who depend on accurate measurements [55].
System drift introduces measurement errors through gradual changes in system components due to temperature fluctuations, mechanical instability, or environmental factors [56]. Calibration ambiguity arises when the relationship between measured signals and underlying physical quantities lacks a unique, deterministic solution, particularly problematic in speckle-based systems where pattern interpretation is complex. This application note details protocols to identify, quantify, and correct these issues using speckle-based methodologies, enabling more robust and reliable compact spectrometer systems.
Theoretical Framework
Speckle Pattern Fundamentals for Compact Spectrometers
Speckle patterns form when coherent light scattered from a rough surface creates random interference, producing a granular intensity distribution that serves as a unique spatial fingerprint [57]. In compact spectrometers, these patterns enable precise calibration and drift monitoring by providing high-contrast features that can be tracked with nanometer-scale precision [56]. The stochastic nature of speckle patterns makes them ideal for addressing calibration ambiguity because each pattern is unique to the specific optical configuration and spectrometer state.
The memory effect in speckle patterns—where small changes in illumination angle or wavelength produce predictable pattern shifts—provides the theoretical foundation for drift compensation [57]. This property allows researchers to establish deterministic relationships between system parameters and observed speckle formations, reducing ambiguity in spectrometer calibration.
Table 1: Primary Sources of Calibration Ambiguity and System Drift
| Source Category | Specific Manifestations | Impact on Measurement |
|---|---|---|
| Thermal Effects | Component expansion/contraction, Refractive index changes | Pattern shift, Scale distortion |
| Mechanical Instability | Vibration, Relaxation, Mounting stress | Positional drift, Focus changes |
| Optical Changes | Laser wavelength drift, Lens degradation | Intensity variation, Correlation loss |
| Algorithm Limitations | Feature matching errors, Optimization convergence | Measurement ambiguity, Reduced reproducibility |
Experimental Protocols
Speckle Pattern Generation and Capture
Objective: Establish a stable, reproducible speckle reference for system calibration.
- Equipment Requirements: Coherent light source (laser diode, 520-850 nm), precision ground glass diffuser or reflective surface, CMOS/CCD sensor, kinematic mount system, vibration isolation table, temperature monitoring system.
- Speckle Pattern Generation:
- Illuminate the diffuser surface with expanded collimated laser beam at normal incidence
- Ensure full beam coverage over the diffusing area with intensity uniformity >95%
- Maintain consistent surface roughness (Ra 1-10 μm) for optimal speckle contrast
- Reference Pattern Acquisition:
- Capture reference z-stack at 0.5-1 μm intervals through focus range (≥20 μm total)
- Maintain constant illumination intensity (±1%) and temperature (±0.5°C)
- Acquire 10-20 frames per position for averaging to reduce noise
- Store reference patterns with timestamp and environmental data
Quality Control Metrics: Speckle contrast ratio >0.5, signal-to-noise ratio >30 dB, pattern uniformity >90% across field of view.
System Drift Monitoring Protocol
Objective: Quantify and compensate for temporal drift in spectrometer systems.
- Equipment Setup: Compact spectrometer development platform, reference speckle generator, temperature-stabilized enclosure, high-stability mounting.
- Continuous Monitoring Procedure:
- Acquire speckle images at regular intervals (1-60 minutes based on stability requirements)
- Maintain constant illumination and exposure settings throughout monitoring period
- Record environmental parameters (temperature, humidity, pressure) synchronously with image capture
- Drift Estimation Method:
- Apply normalized cross-correlation between current speckle patterns and reference z-stack
- Implement peak-finding algorithm with parabolic interpolation for sub-pixel precision
- Calculate x, y, z displacement vectors through correlation maximization
- Apply temperature-compensated drift model for real-time correction
Validation: Compare against fiducial marker method achieving <10 nm agreement [56].
Calibration Ambiguity Resolution Protocol
Objective: Resolve calibration ambiguities in speckle-based spectrometer systems.
- Equipment: Multi-axis positioning stages, reference materials, speckle projection system.
- Geometric Calibration Procedure [57]:
- Display synthetic speckle pattern on calibrated screen or project onto reference surface
- Capture patterns from multiple orientations (≥3 positions)
- Apply KAZE feature detection algorithm for robust feature extraction in defocused conditions
- Implement coarse-to-precise matching algorithm with improved similarity evaluation function
- Parameter Optimization:
- Apply Improved Gray Wolf Optimizer (IGWO) algorithm for camera parameter estimation [58]
- Utilize Levenberg-Marquardt algorithm for iterative parameter refinement
- Establish uncertainty bounds through Monte Carlo simulation
- Validate with known calibration standards
Performance Metrics: Feature matching accuracy >99%, reprojection error <0.1 pixels, parameter estimation consistency >95%.
Data Analysis and Interpretation
Drift Quantification and Correction
Table 2: Drift Correction Performance Comparison
| Method | Spatial Precision | Temporal Resolution | Implementation Complexity | Suitable Applications |
|---|---|---|---|---|
| Speckle Correlation [56] | 1-10 nm | 1-10 seconds | Medium | Fixed systems, High-precision measurements |
| Fiducial Markers | 5-20 nm | 1-5 seconds | High (sample preparation) | Biological imaging, Material science |
| Laser Interferometry | 0.1-1 nm | 0.1-1 seconds | High | Metrology systems, Stage control |
| Feature-based Image Registration | 50-200 nm | 5-30 seconds | Low | General microscopy, Macroscopic imaging |
Calibration Stability Assessment
Long-term calibration stability is quantified through Allan deviation analysis of speckle position data. Calculate stability metrics over increasing time windows to identify optimal recalibration intervals. For compact spectrometers used in field applications, implement automated stability monitoring with threshold-based recalibration triggers.
Analyze calibration residual distributions to identify systematic versus random components of calibration ambiguity. Implement Kalman filtering approaches to separate true drift from measurement noise, improving correction accuracy, particularly in portable spectrometer applications where environmental control is limited.
The Scientist's Toolkit
Table 3: Essential Research Reagent Solutions for Speckle-Based Calibration
| Item | Specifications | Function | Example Applications |
|---|---|---|---|
| Standard Reference Diffuser | Ground glass, Ra 1.5±0.2 μm, 25 mm diameter | Creates reproducible speckle patterns | System calibration, Point spread function characterization |
| Synthetic Speckle Pattern Target | Chrome on glass, 0.1-0.5 μm feature size, UV-NIR reflective | Provides stable calibration reference | Geometric calibration, System alignment [57] |
| Wavelength-Calibrated Laser Source | 520-850 nm, Δλ/λ < 0.1%, power stability >99% | Coherent illumination for speckle generation | System characterization, Drift monitoring [56] |
| Stabilized Mounting System | Kinematic mount, thermal expansion coefficient <1 ppm/°C | Minimizes mechanical drift | Long-term experiments, High-precision measurements |
| Temperature Monitoring System | ±0.1°C accuracy, multi-channel logging | Correlates thermal changes with drift | Environmental compensation, Error budgeting |
| Feature Detection & Analysis Software | KAZE algorithm, sub-pixel registration capability | Extracts and matches speckle features | Calibration, Drift estimation [57] |
Workflow Visualization
Speckle Calibration and Drift Correction Workflow
The protocols detailed in this application note provide comprehensive solutions for addressing calibration ambiguity and system drift in compact spectrometer systems using speckle pattern methodologies. Implementation of these methods enables researchers to achieve and maintain nanometer-scale measurement precision essential for advanced spectroscopic applications [56]. The integration of speckle-based monitoring with advanced optimization algorithms creates a robust framework for compensating temporal drift and resolving calibration ambiguities, significantly enhancing measurement reliability [57] [58].
For researchers developing compact spectrometers, these approaches offer practical solutions to critical metrological challenges, supporting the advancement of portable spectroscopic technologies across pharmaceutical development, analytical testing, and field research applications. The continued refinement of these protocols will further enable the deployment of high-precision spectroscopic systems outside traditional laboratory environments, expanding their utility in point-of-care diagnostics and on-site chemical analysis.
Speckle-based reconstructive spectrometers (RSs) determine an incident spectrum by analyzing the speckle pattern generated after light passes through a scattering medium, enabling high-speed, compact spectral analysis [4] [3]. A significant challenge for their deployment in real-world applications, from field-based environmental monitoring to industrial laser characterization, is maintaining calibration and accuracy under varying thermal and mechanical conditions [59]. These environmental perturbations can alter the properties of the scattering medium and the surrounding optical path, inducing changes in the speckle pattern that are indistinguishable from those caused by a shift in the input wavelength. This application note details protocols for characterizing and mitigating these destabilizing effects, ensuring reliable spectrometer operation in complex environments. The stability framework established herein is a critical prerequisite for the high-time-resolution (theoretically exceeding 10 kHz) spectral measurements that speckle-based systems promise [3].
Quantitative Stability Parameters & Characterization
The stability of a speckle spectrometer is quantitatively assessed against specific thermal and mechanical parameters. The following tables summarize the key metrics for characterization and the corresponding performance targets for a stable system.
Table 1: Key Quantitative Parameters for Stability Characterization
| Parameter | Symbol | Unit | Description | Relevance to Speckle Spectrometer |
|---|---|---|---|---|
| Spectral Resolution | Δλ | nm, pm | Minimum distinguishable wavelength difference [4] [3]. | Primary performance metric; degradation indicates system instability. |
| Mean Reconstruction Error | - | - | Average error between reconstructed and reference spectrum (e.g., on the order of 10⁻³) [3]. | Direct measure of calibration fidelity under perturbation. |
| Operating Temperature Range | ( T_{op} ) | °C | Range of ambient temperature over which specs are met [59]. | Defines functional limits for thermal stability. |
| Thermal Hysteresis | ( H_{T} ) | nm/°C | Wavelength shift per degree temperature change, on heating vs. cooling cycles. | Indicates non-reversible thermal effects in materials. |
| Bending Radius | ( R_{b} ) | mm | Minimum radius a flexible circuit can bend without performance loss [59]. | Critical for mechanical stability in flexible/fiber-based systems. |
| Vibration Tolerance | - | g | Maximum vibrational acceleration (in g-forces) before failure. | Ensures reliability in mobile or industrial settings. |
Table 2: Target Stability Performance Benchmarks
| Parameter | Condition | Target Value | Test Standard / Reference |
|---|---|---|---|
| Spectral Resolution | Lab Benchtop (20°C) | 0.5 nm [4] | Optics Letters, 2024 |
| Spectral Resolution | High-Resolution Mode | 2 pm (0.002 nm) [3] | Optics Communications, 2025 |
| Mean Reconstruction Error | After thermal cycling | Maintained on order of 10⁻³ [3] | Optics Communications, 2025 |
| Operating Temperature | Standard Polymer Substrate | -55 to 150 °C [59] | JEDEC standards |
| Bending Resistance | Flexible Circuitry | >10,000 cycles [59] | TC183SC4 standard |
Experimental Protocols
Protocol: Thermal Stability Characterization of a Speckle Spectrometer
Objective: To quantify the wavelength drift and resolution degradation of a speckle spectrometer across a defined operating temperature range.
Materials:
- Device Under Test (DUT): Assembled speckle spectrometer.
- Thermal Chamber (capable of precise ramp and soak profiles).
- Tunable Laser Source (e.g., 1520–1567 nm range, 5 MHz linewidth) [3].
- Temperature Data Logger.
- Vibration-isolated optical table.
Methodology:
- Initial Calibration: At a stable reference temperature (e.g., 20°C), generate the system's transmission matrix by recording speckle patterns, ( I(\vec{r}) ), across the laser's tuning range at 0.1 nm intervals.
- Thermal Cycling: Subject the DUT to a thermal profile within the chamber. A sample profile: 20°C → 40°C → 0°C → 20°C, with a ramp rate of 1°C/min and a 60-minute soak at each plateau.
- Data Acquisition: At each temperature plateau, inject a laser signal at three known, stable wavelengths (e.g., 1530 nm, 1550 nm, 1560 nm). For each, capture the corresponding speckle pattern.
- Reconstruction & Analysis: Use the initial transmission matrix (from Step 1) to reconstruct the wavelength of the data captured in Step 3. Calculate:
- Wavelength Drift: ( \Delta \lambda{drift} = \lambda{reconstructed} - \lambda_{known} ).
- Reconstruction Error: Compare the reconstructed spectrum to the known single-peak spectrum.
Deliverables: A plot of Wavelength Drift (pm) vs. Temperature (°C) and a table of Mean Reconstruction Error at each soak temperature.
Protocol: Mechanical Vibration Tolerance Testing
Objective: To determine the maximum level of mechanical vibration the spectrometer can withstand without permanent calibration shift.
Materials:
- DUT: Calibrated speckle spectrometer.
- Electrodynamic Shaker with controller.
- Vibration Controller Software.
- Accelerometer.
Methodology:
- Baseline Measurement: With the DUT mounted on the shaker but in a static condition, perform a wavelength measurement as in Protocol 3.1, Step 3, to establish a baseline.
- Vibration Profile: Define a swept-sine vibration profile (e.g., 10-500 Hz, 0.5 g RMS).
- In-situ Testing: While subjecting the DUT to the vibration profile, continuously or intermittently capture speckle patterns from the stable laser source and perform real-time reconstruction.
- Post-Vibration Calibration Check: After the vibration test, repeat the baseline measurement with the system static.
Deliverables: A report detailing any deviation in reconstructed wavelength during and after vibration compared to the static baseline.
Stability Framework and Mitigation Workflow
The following diagram illustrates the logical relationship between environmental perturbations, their physical effects on the spectrometer system, and the corresponding mitigation strategies required to ensure thermal and mechanical stability.
Stability Mitigation Workflow
The Scientist's Toolkit: Research Reagent Solutions
Table 3: Essential Materials for Robust Speckle Spectrometer Fabrication
| Item | Function / Rationale | Specification / Example |
|---|---|---|
| Sapphire Substrate | Scattering medium base; offers high thermal stability and hardness. | Femtosecond laser-processed micro-nanostructures on surface [4]. |
| Polyimide (PI) Base Film | Flexible circuit substrate; excellent thermal resistance and mechanical strength. | Kapton-like films; stable >400°C, εr ~4.0 @ 1kHz [59]. |
| Integrating Sphere | Acts as a scattering medium; provides highly randomized speckle patterns. | Preferred over MMF for localized speckle use, increases measurement rate 35x [3]. |
| Polarization-Maintaining Fiber (PMF) | Delivers light to scattering medium; preserves polarization state for consistent speckles [3]. | Critical for ensuring input condition stability. |
| Nanostructured Silver Inks | Conductive traces for flexible electronics; enables 3D printed electrodes. | Used in electric-field-driven 3D printing for flexible electrode arrays [59]. |
| CNN-LSTM Denoising Algorithm | Computational method to reduce noise-induced reconstruction error. | Mitigates error from reduced speckle autocorrelation, prolongs stability [4]. |
Optimizing Illumination Uniformity for Enhanced Reconstruction Fidelity
In compact spectrometer applications, the fidelity of speckle pattern reconstruction is fundamentally limited by the quality and uniformity of the illumination system. Achieving high-fidelity reconstruction requires precise control over illumination parameters to generate consistent, information-rich speckle patterns that serve as accurate spectral fingerprints. This protocol details optimized methodologies for enhancing illumination uniformity across various spectrometer architectures, enabling researchers to achieve superior spectral reconstruction performance in miniaturized systems.
The critical relationship between illumination quality and reconstruction accuracy stems from the underlying principle of reconstructive spectrometers: unique spectral information is encoded into spatial speckle patterns through complex light-matter interactions. Non-uniform illumination introduces artifacts and reduces the signal-to-noise ratio in these patterns, directly compromising the accuracy of subsequent computational reconstruction. The techniques outlined herein address these challenges through engineered optical systems and computational corrections.
Experimental Protocols for Illumination Optimization
Protocol 1: On-Chip Homogenized Illumination for Metasurface Spectrometers
This protocol establishes a method for achieving speckle-free, uniform illumination well-matched to digital micromirror devices (DMDs) in metasurface-based spectrometers, which is critical for maintaining reconstruction fidelity as penetration depth increases [60].
Materials Required:
- High-power multi-mode laser source
- Square homogenizing fiber
- Digital micromirror device (DMD)
- Disordered metasurfaces (fabricated via electron-beam lithography)
- sCMOS camera
- Standard silicon photonics fabrication facilities
Step-by-Step Procedure:
- Source Preparation: Couple the high-power multi-mode laser into the square homogenizing fiber to achieve speckle-free output with uniform intensity profile.
- DMD Configuration: Set the incidence angle to the DMD to 26.3° to achieve over 95% diffraction efficiency for multi-color imaging (405 nm, 488 nm, 561 nm), minimizing field-of-view sacrifice [60].
- Beam Delivery: Project the homogenized beam onto the DMD plane, ensuring complete and even coverage of the active area.
- Structured Illumination: Program the DMD to generate multifocal illumination patterns using periodic lattice designs, with each element consisting of a square aperture formed by 4×4 "ON" state DMD pixels.
- Pattern Translation: Shift the multifocal pattern by two DMD pixels at a time, corresponding to a 108 nm step size on the sample plane, achieving a sampling rate twice the diffraction-limited frequency.
- Validation: Capture the output speckle patterns using the sCMOS camera and verify uniformity by analyzing intensity distribution histograms across multiple regions of interest.
Troubleshooting Tips:
- Non-uniform illumination: Verify fiber coupling efficiency and check for imperfections in the homogenizing fiber end-faces.
- Low diffraction efficiency: Precisely recalibrate DMD incidence angle using goniometric measurements.
- Pattern artifacts: Ensure DMD pixel grouping matches the designed aperture configuration (4×4 "ON" states).
Protocol 2: Cascaded Interferometric Illumination for Single-Shot Speckle Spectrometry
This protocol describes the implementation of a cascaded unbalanced Mach-Zehnder interferometer (MZI) network to generate wavelength-dependent phase variations, creating highly decorrelated speckle patterns with minimal spatial redundancy for ultra-high resolution reconstruction [21].
Materials Required:
- Silicon-on-insulator (SOI) wafer with 220 nm top silicon and 2 μm buried oxide
- Unbalanced Mach-Zehnder interferometer components
- Compact antenna array
- Input broadband grating coupler
- Infrared camera (e.g., ARTCAM-991SWIR)
- Objective lens (e.g., MY10X-823) and imaging lens (e.g., MVL12X3Z)
Step-by-Step Procedure:
- Chip Fabrication: Fabricate the passive photonic network on SOI platform, incorporating cascaded unbalanced MZIs with randomly tuned arm lengths to ensure decorrelated transmission spectra.
- Input Coupling: Couple broadband light into the system through the input broadband grating, ensuring efficient operation across 1400-1600 nm range [21].
- Interferometric Encoding: Pass light through the cascaded MZI network where each interferometer introduces wavelength-dependent phase delays, creating rapid pseudo-random fluctuations in the transmission spectrum.
- Free-Space Diffusion: Route the encoded light to a compact antenna array that diffracts optical signals out of the chip plane at wavelength-dependent angles.
- Speckle Capture: Image the resulting speckle patterns using the objective lens, imaging lens, and infrared camera system.
- Spatial Decorrelation Analysis: Calculate spatial correlation coefficients between adjacent pixels to verify sufficient decorrelation (target correlation coefficient ρₜₕᵣ < 0.5).
Troubleshooting Tips:
- Low decorrelation: Verify random variation in MZI arm lengths and optimize antenna array design for enhanced angular dispersion.
- Weak signal intensity: Check grating coupler efficiency and waveguide transmission losses.
- Spatial correlation: Adjust imaging magnification to ensure optimal sampling of speckle features.
Protocol 3: Localized Speckle Analysis for High-Speed Spectral Reconstruction
This protocol optimizes measurement speed without significant accuracy sacrifice by using localized speckle patterns from integrating spheres, enabling high-temporal-resolution spectral measurements [3].
Materials Required:
- Integrating sphere scattering medium
- Polarization-maintaining fiber
- Tunable laser (1520-1567 nm range)
- InGaAs camera
- Region of interest (ROI) selection software
Step-by-Step Procedure:
- System Configuration: Connect the tunable laser to a polarization-maintaining fiber to maintain consistent polarization states, then couple output to the integrating sphere.
- Full Speckle Capture: Initially capture full-frame speckle patterns for reference across the operational wavelength range.
- ROI Identification: Analyze spatial correlation patterns to identify regions with high spectral information density.
- Localized Acquisition: Configure camera settings to capture only the selected ROI (approximately 1/50 of full pixel area) to increase frame rate.
- Transmission Matrix Calibration: Build the measurement matrix using localized speckle patterns from monochromatic sources across the spectral range.
- Reconstruction Validation: Compare reconstruction accuracy between localized and full-frame speckle patterns for known spectra.
Troubleshooting Tips:
- Reconstruction accuracy loss: Increase localized speckle area incrementally until acceptable performance is achieved.
- Polarization sensitivity: Ensure proper splicing between polarization-maintaining fiber and integrating sphere input.
- Low signal in ROI: Reposition ROI to regions with higher average intensity while maintaining decorrelation.
Performance Comparison of Speckle Spectrometer Architectures
The table below summarizes key performance metrics for different speckle spectrometer architectures, highlighting the impact of illumination strategies on reconstruction fidelity.
Table 1: Performance Comparison of Advanced Speckle Spectrometer Architectures
| Architecture | Spectral Resolution | Bandwidth | Bandwidth--Resolution Ratio | Footprint | Key Illumination Feature |
|---|---|---|---|---|---|
| On-chip diffractive metasurfaces [11] | 70 pm | 100 nm | ~1,429 | 150 μm × 950 μm | Multi-layer metasurface encoding |
| Single-shot speckle spectrometer [21] | 10 pm | 200 nm | 20,000 | 2 mm² | Cascaded MZI network |
| Double-layer disordered metasurfaces [15] | 1 nm | 220 nm (440-660 nm) | 220 | <1 cm | Predictable spatio-spectral mapping |
| Compact speckle spectrometer [20] | 0.1 nm (100 pm with NN) | 100 nm | 1,000 | Compact glass substrate | Femtosecond laser-induced nanostructures |
| Localized speckle analysis [3] | 2 pm | 47 nm (1520-1567 nm) | 23,500 | N/A | Integrating sphere with ROI optimization |
The Scientist's Toolkit: Essential Research Reagents and Materials
Table 2: Key Research Reagents and Materials for Speckle Spectrometer Implementation
| Item | Function | Example Specifications |
|---|---|---|
| Digital Micromirror Device (DMD) | Generates programmable multifocal illumination patterns | 4×4 pixel grouping for 216 nm spot size; 108 nm step size [60] |
| Square Homogenizing Fiber | Creates speckle-free, uniform illumination from multi-mode lasers | Matched to DMD active area dimensions [60] |
| Disordered Metasurfaces | Acts as scattering medium for spectral-to-spatial encoding | SiNₓ nanoposts with randomized widths (0-2π phase delay) [15] |
| Cascaded MZI Network | Introduces wavelength-dependent phase variations | Multiple unbalanced interferometers with random arm lengths [21] |
| Integrating Sphere | Provides homogeneous scattering for localized speckle analysis | High-reflectivity interior coating for efficient scattering [3] |
| Silicon-on-Insulator Wafers | Platform for integrated speckle spectrometer fabrication | 220 nm top silicon, 2 μm buried oxide [11] [21] |
Workflow Visualization
The following diagram illustrates the complete workflow for optimizing illumination uniformity and achieving enhanced reconstruction fidelity in speckle-based spectrometers, integrating both physical and computational components:
Optimizing illumination uniformity represents a critical pathway toward enhanced reconstruction fidelity in compact speckle spectrometers. The protocols presented herein—spanning homogenized on-chip illumination, cascaded interferometric systems, and localized speckle analysis—provide researchers with comprehensive methodologies to address the fundamental challenges in this domain. The integration of advanced optical engineering with computational reconstruction algorithms enables unprecedented performance in miniaturized spectroscopic systems, as evidenced by the achieving of bandwidth-to-resolution ratios exceeding 20,000 in recent implementations [21].
Future developments will likely focus on further integration of these illumination techniques with machine learning approaches for enhanced reconstruction accuracy and robustness. Additionally, the application of these principles to emerging materials and metamaterial systems promises to unlock new capabilities in ultra-compact spectroscopic sensing for biomedical, environmental, and industrial applications.
Spatial Decorrelation Strategies and Independent Sampling Channel Maximization
In the field of compact spectrometer applications, the quest for high spectral resolution and broad operational bandwidth is often constrained by the physical limitations of chip-scale devices. A pivotal challenge lies in maximizing the amount of unique information that can be extracted from a single measurement. Spatial decorrelation addresses this by transforming the incoming light into a complex, wavelength-dependent speckle pattern, where the degree of independence between sampling channels directly determines the spectrometer's information capacity [21] [11]. This document details the application of spatial decorrelation strategies to maximize independent sampling channels, a cornerstone for advancing reconstructive speckle spectrometers.
The core principle is that a passive optical network can encode spectral information into a spatial speckle pattern. Each independent pixel in the captured image can act as a separate sampling channel. However, the effective number of these channels is not solely determined by the pixel count of the camera, but by the degree of spatial decorrelation achieved by the optical encoder. Highly correlated neighboring pixels provide redundant information, whereas spatially decorrelated speckles maximize the unique spectral data acquired in a single shot, enabling higher resolution and more accurate reconstruction [21].
Theoretical Foundation
The Role of Decorrelation in Efficient Encoding
The concept of decorrelation as a mechanism for efficient information encoding finds strong parallels in biological systems. Research on retinal ganglion cells (RGCs) has demonstrated that neural processing removes spatial and temporal correlations present in natural visual scenes to efficiently transmit information through a limited-capacity channel like the optic nerve [61]. While classical theory attributed this to linear center-surround receptive fields, experimental evidence shows that nonlinear processing is the dominant factor, responsible for a majority of the observed decorrelation and leading to sparse, efficient spike trains [61]. In engineered systems, this translates to designing optical networks that perform a similar function: transforming a correlated input signal (spectrum) into a decorrelated output (spatial speckle pattern) to maximize the information throughput of a limited number of physical detection channels.
In the context of multichannel data analysis, Joint Decorrelation (JD) is a formalized signal processing technique that linearly combines sensor signals to maximize the signal-to-noise ratio (SNR) of a component of interest. JD simultaneously diagonalizes the covariance matrices of the "signal" and "noise," effectively finding a set of weights that suppress prominent noise sources while preserving the activity of interest [62]. This general approach underpins many blind source separation algorithms and highlights the universal value of decorrelation for enhancing information quality in complex datasets.
Quantifying Decorrelation and Channel Independence
The performance of a speckle spectrometer is quantitatively gauged by its spectral correlation function. This metric measures the similarity between the speckle patterns generated by two closely spaced wavelengths. A narrow correlation width indicates that the speckle pattern changes rapidly with wavelength, which is a prerequisite for high spectral resolution [11]. The correlation function ( C(\Delta \lambda) ) is calculated as:
$$C\left(\Delta \lambda \right)={\left\langle \frac{{\left\langle I\left(\lambda ,x\right)I\left(\lambda +\Delta \lambda ,x\right)\right\rangle }{\lambda }}{{\left\langle I\left(\lambda ,x\right)\right\rangle }{\lambda }{\left\langle I\left(\lambda +\Delta \lambda ,x\right)\right\rangle }{\lambda }}-1\right\rangle }{x}$$
where (I\left(\lambda ,x\right)) is the recorded intensity at position (x) for wavelength (\lambda). The half-width at half-maximum (HWHM) of this function's central peak is often used as an experimental measure of the achievable spectral resolution [11]. The number of statistically independent sampling channels is then estimated by analyzing the spatial cross-correlation between pixels across the entire operational bandwidth, typically using a threshold (e.g., (ρ_{thr} = 0.5)) to define channel independence [21].
Implementations in Spectrometer Design
Recent advances have produced several sophisticated on-chip architectures that implement spatial decorrelation through engineered disorder. The table below summarizes the key performance metrics of these state-of-the-art devices.
Table 1: Performance Comparison of Advanced Speckle Spectrometers
| Implementation | Core Decorrelation Strategy | Bandwidth | Resolution | Independent Channels / Channel Density | Footprint |
|---|---|---|---|---|---|
| On-Chip Diffractive Speckle Spectrometer [11] | Multi-layered disordered metasurfaces | 100 nm | 70 pm | ~1400 channels / 10,021 ch/mm² | 150 μm × 950 μm |
| Single-Shot Integrated Speckle Spectrometer [21] | Cascaded unbalanced MZIs + antenna array | 200 nm | 10 pm | ~2730 channels (estimated) | ~2 mm² |
| Double-Layer Disordered Metasurfaces [15] | Two disordered metasurface layers | 220 nm (440-660 nm) | ~1.7 nm | 221 spectral channels | < 1 cm (system size) |
These implementations share a common goal of maximizing the number of independent sampling channels within a minimal footprint. The ultra-high channel density of 10,021 ch/mm² achieved by the multi-layered metasurface spectrometer [11] represents a benchmark in the field, demonstrating the powerful synergy between scalable optical design and the principles of spatial decorrelation.
Protocol: Characterizing a Speckle Spectrometer's Spatial Decorrelation
This protocol outlines the steps to calibrate a speckle spectrometer and quantify its spatial decorrelation and effective number of independent channels.
Research Reagent Solutions & Essential Materials Table 2: Key Materials for Speckle Spectrometer Characterization
| Item | Function / Specification |
|---|---|
| Tunable Laser Source | Provides narrow-linewidth, wavelength-specific light for calibration. Range must cover the spectrometer's operational bandwidth. |
| Polarization-Maintaining Fiber (PMF) | Ensures a consistent polarization state for each wavelength, guaranteeing reproducible speckle patterns [3]. |
| Scattering Medium / Photonic Chip | The core encoder (e.g., disordered metasurface [11], MZI network [21], or multimode fiber [3]). |
| Imaging System & Camera | High-pixel-count camera (e.g., infrared SWIR camera [21]) to capture speckle patterns. |
| Data Processing Unit | Computer with software for matrix inversion and spectral reconstruction algorithms. |
Experimental Workflow:
- System Setup: Couple the output of the tunable laser into the PMF, which is fused or aligned with the input of the scattering medium/photonic chip. Ensure the speckle output is properly imaged onto the camera sensor.
- Transmission Matrix Calibration:
- Sweep the tunable laser across the entire operational bandwidth (e.g., from ( \lambda{min} ) to ( \lambda{max} )) in small, discrete steps (( \delta \lambda )). The step size should be smaller than the target resolution.
- At each wavelength ( \lambdai ), capture the corresponding speckle pattern ( I(\lambdai) ). This pattern is a vector of pixel intensities.
- Assemble all the column vectors ( I(\lambdai) ) into a transmission matrix ( T ), where ( T{ij} ) is the intensity at the ( j )-th pixel for the ( i )-th wavelength.
- Spatial Correlation Analysis:
- To find the effective number of independent channels, analyze the spatial cross-correlation between different pixels in the speckle image across all calibrated wavelengths.
- Calculate the correlation coefficient for every pair of pixels. Pairs with a correlation coefficient below a set threshold (e.g., (ρ_{thr} = 0.5)) are considered statistically independent [21].
- The number of independent channels is the number of pixels that are not highly correlated with any other pixel in the selected set.
- Spectral Resolution Assessment:
- Plot the spectral correlation function ( C(\Delta \lambda) ) using the formula in Section 2.2.
- Measure the HWHM of the central peak of ( C(\Delta \lambda) ). This value is a direct indicator of the system's spectral resolution [11].
The following workflow diagram illustrates the core process of spectral reconstruction using a spatially decorrelated speckle pattern.
Advanced Strategies and Optimization
Architectural Scaling for Enhanced Decorrelation
A powerful method to boost channel count without increasing footprint is to scale the optical architecture vertically. Research has shown that moving from a single-layer to a multi-layer metasurface structure introduces more complex wave propagation and interference, significantly enhancing spectral sensitivity [11]. Simulations confirm that a three-layer metasurface produces a much narrower spectral correlation width than single or dual-layer structures, directly translating to higher resolution and more spectral channels [11]. Similarly, using a double-layer disordered metasurface increases the λ-derivative of the relative optical phase delay, improving spectral resolution beyond the limits of a single-layer system and helping to decouple resolution from the system's form factor [15].
Leveraging Localized Speckle Patterns
For applications requiring high measurement speeds, using localized (cropped) speckle patterns instead of the full field offers a viable trade-off. Studies indicate that local speckles from an integrating sphere can increase the spectral measurement rate by 35 times compared to using full-pixel speckles from a multimode fiber, while maintaining a low reconstruction error [3]. It was found that a cropped area as small as 1/50 of the full speckle pattern could be sufficient for effective multi-wavelength reconstruction, enabling higher frame rates by reducing the amount of data processed per measurement [3].
The Scientist's Toolkit
Table 3: Essential Research Reagent Solutions for Speckle Spectrometer Development
| Category / Item | Critical Function |
|---|---|
| Optical Encoders | |
| Disordered Metasurfaces | Engineered surface with subwavelength scatterers to create complex, wavelength-dependent phase modulations [11] [15]. |
| Cascaded Unbalanced MZIs | A network of interferometers with random path differences to generate pseudo-random spectral responses [21]. |
| Multimode Fibers (MMF) / Integrating Spheres | Traditional scattering media that mix optical paths to produce speckle patterns [3]. |
| Computational Tools | |
| Transmission Matrix Calibration | The foundational linear model (I = T × S) that maps the spectrum (S) to the speckle intensity (I) [3] [11]. |
| Neural Network Reconstruction | Deep learning models (e.g., ResNet-50, GRU) used to recognize speckle patterns and enhance resolution [20]. |
| Joint Decorrelation (JD) Algorithms | Signal processing techniques to linearly combine sensor data and maximize SNR by suppressing noise correlations [62]. |
In the development of compact spectrometers, speckle pattern reconstruction has emerged as a powerful computational imaging technique. These devices, which are now small enough to be integrated into smartphones or wearable technology, rely on computational methods to translate random speckle patterns into meaningful spectral data [63] [54]. The central challenge in this domain lies in optimizing the trade-off between reconstruction accuracy and processing speed to enable practical, real-world applications in fields ranging from pharmaceutical development to point-of-care diagnostics [64]. This document outlines standardized protocols and application notes for researchers working to enhance computational efficiency in speckle-based spectral analysis.
Quantitative Performance Comparison of Speckle Processing Algorithms
The selection of an appropriate processing algorithm is fundamental to balancing accuracy and speed. The following table summarizes the performance characteristics of key methods identified in recent literature.
Table 1: Performance Comparison of Speckle Processing Algorithms
| Algorithm Name | Computational Complexity | Reconstruction Accuracy (PSNR/SSIM) | Optimal Application Context | Key Limitations |
|---|---|---|---|---|
| Zero-Mean Normalized Cross-Correlation (ZNCC) with Limited Shifts [65] | Low (due to reduced shift calculations) | High (subpixel precision) | Microbial activity tracking, early growth phase detection | Accuracy decreases with increased speckle size |
| Frequency-Domain Correlation of Normalized Images [65] | Medium | High | General displacement estimation in speckle patterns | Peak width introduces errors in displacement estimation |
| U-Tunnel-Net (U-Net Variant) [30] | High (training), Medium (inference) | Superior (PSNR: 30.21-39.52, SSIM: 91.78%+ on UNS dataset) | Ultrasound image despeckling, medical image restoration | Requires training data; computationally intensive training phase |
| Pixel-Removing DIC (PR-DIC) [66] | Adaptive (reduces with pixel pruning) | Robust in degradation/discontinuity | High-temperature testing, crack propagation analysis | Requires tuning of pruning ratio parameter |
| Noise2Void Ghost Imaging (N2VGI) [28] | Low (single-image training) | High (SSIM improvement >324%, resolution +33%) | Microscopic ghost imaging, low-light conditions | Requires a U-Net backbone for denoising |
Detailed Experimental Protocols
Protocol A: Correlation-Based Analysis for Microbial Growth Monitoring
This protocol is adapted from methods used to assess microbial growth with laser speckle imaging, which shares computational principles with dynamic speckle analysis in spectrometers [65].
1. Equipment and Reagents:
- Imaging System: CMOS camera (e.g., 10 Mpix "uEye UI-1492LE-C").
- Light Source: Expanded laser beam (e.g., 658 nm laser diode "LP660-SF60").
- Sample Preparation: Microbial cultures (e.g., Candida albicans, Escherichia coli) prepared according to standards like EUCAST on agar plates [65].
2. Procedure:
1. Setup: Illuminate the sample Petri dish uniformly with the expanded laser beam. Ensure the camera is fixed on a stable platform to minimize external vibrations.
2. Image Acquisition: Capture speckle images at predetermined intervals (e.g., 20 s for bacteria, 1 s for fungi). The exposure time of the camera should be set to a fixed value (e.g., 1 second) [65].
3. Speckle Sequence Pre-processing: Convert the acquired image sequence into a three-dimensional signal array for time-frequency analysis [65].
4. Displacement Calculation:
* Divide the reference and deformed speckle images into small, overlapping sub-regions (grids).
* For each grid, compute the cross-correlation using the ZNCC algorithm.
* To enhance speed, limit the spatial shifts (u, v in Equation 1) calculated to a narrow window around the expected peak rather than the entire image [65].
* Estimate the displacement vector for each grid by locating the correlation peak with subpixel precision using Gaussian interpolation.
5. Signal Reconstruction: Transform the 2D displacement fields over time into a 1D signal representing microbial activity.
3. Computational Notes:
- The key to efficiency is the reduction of shift calculations in the ZNCC algorithm. This trade-off slightly reduces the search area but significantly accelerates processing with minimal impact on accuracy for predictable displacements [65].
- The sub-image (grid) size is critical: larger sizes improve correlation accuracy but reduce spatial resolution.
Protocol B: Deep Learning-Enhanced Ghost Imaging
This protocol leverages a self-supervised deep learning model to efficiently reconstruct high-resolution images from a minimal set of speckle patterns, a technique directly applicable to reconstructing spectral data from speckle images in spectrometers [28].
1. Equipment and Reagents:
- Pattern Projection: Digital Micromirror Device (DMD, e.g., VialuxTM V4100) for generating sequenced random speckle patterns.
- Detection: A single-pixel bucket detector (e.g., Thorlabs PDA36A-EC) to record total transmitted intensity.
- Sample: A resolution target (e.g., USAF 1951) for validation [28].
2. Procedure:
1. Setup: Align the DMD, sample plane, and bucket detector as illustrated in Figure 2.
2. Data Acquisition:
* Project a sequence of N random speckle patterns, I_n(x, y), onto the sample.
* For each pattern, record the corresponding total intensity S_n from the bucket detector.
3. Initial Reconstruction: Reconstruct a low-quality ghost image G(x, y) using the second-order correlation function (Eq. 1): G(x, y) = (1/N) * Σ [ (I_n(x, y) - ⟨I⟩) * S_n ] [28].
4. Deep Learning Denoising:
* Model: Implement a U-Net architecture with an encoder-decoder structure and skip connections.
* Training: Train the network using the Noise2Void (N2V) self-supervised paradigm. The model learns to denoise the initial reconstruction G(x, y) using only that single noisy image, without needing a clean reference [28].
* Inference: Feed the initial reconstruction G(x, y) through the trained N2V model to output the final, high-quality image.
3. Computational Notes:
- This method's efficiency comes from decoupling the reconstruction from the denoising. High resolution can be achieved with a smaller number of patterns (N), as the deep learning model effectively infers the missing information, drastically reducing acquisition and computational time [28].
- The speckle pattern size should be optimized; smaller speckles generally enable higher resolution reconstruction.
Workflow Visualization
The following diagram illustrates the logical workflow of the deep learning-enhanced ghost imaging protocol (Protocol B), highlighting the pathway to computational efficiency.
Diagram 1: Workflow for efficient deep learning-enhanced speckle imaging.
The Scientist's Toolkit: Essential Research Reagents & Materials
Table 2: Key Materials and Computational Tools for Speckle Pattern Research
| Item Name | Function / Application | Specific Example / Note |
|---|---|---|
| Miniaturized Spectrometer Sensor [63] [64] | The core component of the compact device; detects speckle patterns for spectral analysis. | Organic photodetectors (OPDs) sensitive from UV to NIR (400-1000 nm), operating at <1V [63]. |
| Digital Micromirror Device (DMD) [28] | Programmatically generates and projects sequenced random speckle patterns for computational imaging. | Vialux DLP V-Module V4100 (1024x768 micromirrors) [28]. |
| CMOS Camera [65] | High-resolution capture of dynamic speckle patterns for correlation-based analysis. | 10 Mpix "uEye UI-1492LE-C" camera; used with fixed exposure times [65]. |
| Laser Diode [65] | Coherent light source for generating speckle patterns via interference. | 658 nm "LP660-SF60" laser diode, expanded for uniform illumination [65]. |
| U-Net Architecture [30] [28] | Deep learning backbone for image restoration, denoising, and reconstruction tasks. | Basis for U-Tunnel-Net [30] and Noise2Void Ghost Imaging [28]. |
| ZNCC Algorithm [65] [66] | Core mathematical operation for quantifying displacement and correlation between speckle images. | Can be optimized with limited shifts for speed [65] or pixel-pruning for robustness [66]. |
Performance Validation and Comparative Analysis of Speckle Spectrometers
The development of compact spectrometers, particularly those utilizing speckle pattern reconstruction, represents a significant advancement in portable optical sensing technology [11] [1] [21]. These devices encode spectral information into spatial intensity variations (speckles), requiring sophisticated computational methods to reconstruct the original input spectrum [67] [21]. The performance of these reconstruction algorithms directly impacts the accuracy and reliability of the retrieved spectral data, making rigorous quantitative assessment essential for research and development.
This document establishes standardized application notes and experimental protocols for three fundamental quantitative metrics—Peak Signal-to-Noise Ratio (PSNR), Structural Similarity Index (SSIM), and Spectral Reconstruction Error—within the context of compact speckle spectrometer research. These metrics provide complementary insights into reconstruction quality, enabling researchers to objectively compare algorithms, optimize system parameters, and validate performance against application-specific requirements.
Metric Definitions and Significance
The following metrics offer a multi-faceted view of reconstruction performance, each targeting different aspects of quality and fidelity.
Peak Signal-to-Noise Ratio (PSNR)
PSNR is a classical metric that quantifies the ratio between the maximum possible power of a signal and the power of corrupting noise. In the context of hyperspectral or spectral image reconstruction, it measures the fidelity of the reconstructed data compared to a ground truth reference [68]. It is most commonly expressed in decibels (dB). A higher PSNR value generally indicates a lower reconstruction error. For instance, in hyperspectral image (HSI) reconstruction, state-of-the-art models like the Flow-Matching-guided Unfolding network (FMU) have been reported to achieve PSNR values of up to 42.13 dB on simulation datasets, signifying high reconstruction accuracy [68].
Structural Similarity Index (SSIM)
SSIM assesses the perceptual quality of an image by measuring the degradation of structural information [68]. Unlike PSNR, which is sensitive to absolute errors, SSIM considers image luminance, contrast, and structure, providing a better approximation of human visual perception. It is particularly valuable for evaluating the quality of reconstructed spatial information in speckle patterns or the resultant hyperspectral cubes, ensuring that fine textures and structural details are preserved.
Spectral Reconstruction Error
Spectral Reconstruction Error (also referred to as spectral angle or RMS error) directly evaluates the accuracy of the recovered spectrum itself. It is crucial for spectrometer applications where the precise shape and intensity of the spectral signature are paramount. This metric can be defined as the root-mean-square error between the reconstructed spectrum and the ground truth spectrum across all wavelengths or as a spectral angle mapper that measures the angular similarity between the two spectral vectors. It is a direct indicator of the spectrometer's ability to correctly identify and quantify chemical compounds or material properties.
The Researcher's Toolkit: Essential Materials and Reagents
The table below outlines key components and their functions in a typical speckle spectrometer setup for quantitative evaluation.
Table 1: Key Research Reagent Solutions for Speckle Spectrometer Experiments
| Item | Function/Description | Application in Evaluation |
|---|---|---|
| On-Chip Spectral Encoder | A passive photonic structure (e.g., disordered metasurface [11] [1], cascaded MZIs [21]) that maps input light to a unique speckle pattern. | Serves as the core component under test; its design dictates the system's encoding efficiency and reconstruction potential. |
| Image Sensor (Camera) | Captures the speckle pattern generated by the encoder (e.g., an infrared camera for near-IR applications [21]). | Provides the raw 2D measurement data (IM×1) for the reconstruction algorithm. |
| Tunable Laser or Broadband Source | Provides a known, controlled input signal for system calibration and testing. | Used to establish the system's transmission matrix (TM×N) and to generate ground truth data. |
| Reconstruction Algorithm | Computational method (e.g., based on compressive sensing [21] or deep learning [68] [4]) that solves the inverse problem. | The primary object of evaluation; its output is assessed using PSNR, SSIM, and Spectral Error. |
| Calibrated Reference Spectrometer | A high-accuracy, benchtop spectrometer. | Provides the ground truth spectral data (SN×1) against which the reconstructed spectrum is compared. |
Experimental Protocols for Metric Evaluation
This section provides a detailed methodology for conducting a performance evaluation of a speckle spectrometer system.
The following diagram illustrates the end-to-end experimental workflow for calibrating a speckle spectrometer and evaluating its reconstruction performance.
Protocol 1: System Calibration and Ground Truth Establishment
Objective: To characterize the speckle spectrometer's response and build a transmission matrix that maps spectral inputs to speckle patterns.
Apparatus Setup:
- Connect a tunable laser source to the input of the speckle spectrometer chip via a single-mode optical fiber.
- Ensure the spectrometer's output plane is properly imaged onto a high-dynamic-range camera sensor [21].
- Connect the output of the tunable laser via a beam splitter to a calibrated reference spectrometer to independently verify the input wavelength and power.
Data Collection:
- Set the tunable laser to a starting wavelength (λ₁) within the operational bandwidth (e.g., 1500 nm).
- Capture the resulting speckle pattern on the camera. Ensure the exposure time is set to avoid saturation.
- Record the speckle image and the corresponding wavelength verified by the reference spectrometer.
- Increment the laser wavelength by a step size smaller than the target resolution (e.g., 10 pm [21] or 70 pm [11]) and repeat the capture.
- Continue this process across the entire operational bandwidth (e.g., 100 nm [11] or 200 nm [21]) to collect a comprehensive set of wavelength-speckle pairs.
Transmission Matrix Construction:
- Let N be the number of spectral channels (wavelengths) sampled during calibration.
- Let M be the number of spatial detection channels (e.g., the number of statistically independent pixels in the speckle image [21]).
- Construct the transmission matrix T of size M × N, where each column T(λi) is the flattened, normalized speckle pattern corresponding to wavelength λi.
Protocol 2: Reconstruction and Quantitative Assessment
Objective: To evaluate the performance of the reconstruction algorithm on unknown spectra using PSNR, SSIM, and Spectral Reconstruction Error.
Test Data Acquisition:
- Illuminate the speckle spectrometer with a test light source (e.g., a laser line, a broadband source with filters, or a complex multi-line spectrum).
- Simultaneously capture the output speckle pattern IM×1 and measure the true spectrum Strue of the source using the calibrated reference spectrometer. This provides the ground truth for subsequent comparison.
Spectrum Reconstruction:
- Input the captured speckle pattern I into the reconstruction algorithm.
- The algorithm solves the inverse problem I = T × Srecon for the unknown spectrum Srecon [11] [21]. This may involve ordinary least squares, compressed sensing algorithms, or a pre-trained deep neural network [68] [4].
- The output is the reconstructed spectrum Srecon(λ).
Quantitative Evaluation:
- Calculate the three core metrics by comparing Srecon to Strue.
- Spectral Reconstruction Error: Compute the Root-Mean-Square Error (RMSE).
- RMSE = √[ Σ( Strue(λi) - Srecon(λi) )² / N ]
- PSNR: Calculate for the reconstructed spectral curve, treating it as a 1D signal.
- PSNR = 20 · log₁₀( MAX / RMSE )
- Where MAX is the maximum possible value of the signal (e.g., the maximum intensity of the ground truth spectrum).
- SSIM: If the system reconstructs a spatial-spectral data cube (e.g., in hyperspectral imaging [68]), compute the SSIM index between the reconstructed cube and the ground truth cube. For a simple 1D spectrum, this metric may not be applicable.
Data Presentation and Analysis
The following tables provide a structured format for reporting and comparing quantitative results from spectrometer evaluations.
Table 2: Example Quantitative Metrics Report for a Single Reconstruction
| Metric | Value | Interpretation |
|---|---|---|
| Spectral RMSE | 0.015 (a.u.) | Lower is better. Absolute measure of intensity error across the spectrum. |
| PSNR | 38.2 dB | Higher is better. Indicates a strong signal relative to reconstruction noise. |
| SSIM (Spatial Map) | 0.98 | Closer to 1 is better. Applicable for HSI cubes, indicates excellent structural preservation. |
Table 3: Comparative Algorithm Performance on Benchmark Dataset
| Reconstruction Algorithm | Average PSNR (dB) | Average SSIM | Average Spectral RMSE |
|---|---|---|---|
| Traditional Least Squares | 32.5 | 0.91 | 0.042 |
| Deep Unfolding Network (DUN) | 40.1 | 0.97 | 0.018 |
| Flow-Matching Unfolding (FMU) [68] | 42.1 | 0.99 | 0.012 |
| CNN-LSTM Denoising [4] | 39.5 | 0.98 | 0.015 |
Metric Interrelationships and Strategic Application
Understanding the relationships between different metrics is crucial for a balanced assessment of spectrometer performance. The following diagram illustrates how these metrics interact and guide research conclusions.
These metrics should be applied strategically:
- Algorithm Development: Use PSNR and Spectral RMSE as primary loss functions or validation metrics during algorithm training to drive improvements in signal fidelity and spectral accuracy [68].
- System Comparison: When benchmarking against state-of-the-art systems, report all three metrics to provide a comprehensive view of performance, as seen in Table 3.
- Application-Specific Validation: For applications where material identification is key, prioritize minimizing the Spectral Reconstruction Error. For imaging applications where spatial quality matters, SSIM becomes critically important [68] [67].
{#context} This application note provides a comparative analysis of three primary scattering media—Multimode Fibers (MMF), Integrating Spheres, and Metasurfaces—within the context of speckle pattern reconstruction for compact computational spectrometers. The content is structured to guide researchers and scientists in selecting and implementing the appropriate scattering medium for specific application needs in sensing and drug development. {/context}
The advent of computational spectrometers has revolutionized optical sensing by leveraging scattering media to generate wavelength-dependent speckle patterns. These patterns serve as unique fingerprints, enabling spectral reconstruction without the need for traditional bulky dispersive elements. This paradigm shift is critical for developing compact, cost-effective diagnostic and analytical tools. Among the various platforms, Multimode Fibers (MMF), Integrating Spheres, and Metasurfaces have emerged as prominent candidates, each with distinct physical operating principles and performance characteristics. This document provides a detailed comparison of these three media, focusing on their application in speckle-based spectral reconstruction, complete with experimental protocols and performance data to facilitate informed research and development.
Comparative Analysis of Scattering Media
The following table summarizes the key attributes of the three scattering media, providing a basis for selection.
| Feature | Multimode Fibers (MMF) | Integrating Spheres | Metasurfaces |
|---|---|---|---|
| Working Principle | Multimode interference (MMI) within a guided waveguide structure [69] [3] | Multiple diffuse reflections of light on a highly reflective, spherical interior [70] | Wavefront shaping via subwavelength, phase-shifting nanostructures [71] [72] [1] |
| Typical Footprint | Spiral waveguides with ~250 µm radius [69]; 4 cm length [73] | Varies; typically several centimeters in diameter [70] | Ultra-compact; fingernail-sized or smaller (<1 cm²) [1] |
| Spectral Bandwidth | Broad (e.g., 545–725 nm visible [69]; 1520–1567 nm infrared [3]) | Wide (e.g., 350–2400 nm for BaSO₄ coating [70]) | Can be designed for specific bands (e.g., visible [1]) |
| Spectral Resolution | High (e.g., 20 pm [69]; 2 pm [3]) | Information limited | High (e.g., ~1 nm [1]) |
| Key Advantage(s) | High resolution, guided light, fiber compatibility | Light collection efficiency, output uniformity, mature technology | Smallest footprint, direct integration with detectors, design flexibility |
| Key Challenge(s) | Sensitivity to mechanical perturbations, input condition | Lower resolution, larger physical size, port fraction management [70] | Complex nanofabrication, specialized design required for broad bandwidth |
The logical relationship and primary selection criteria for these three scattering media are summarized in the workflow below.
{#fig1} Scattering Media Selection Workflow {/fig1}
The Scientist's Toolkit: Essential Research Reagents & Materials
Successful experimentation in speckle-based spectroscopy requires specific materials and components. The following table lists key items and their functions.
| Item | Function / Explanation |
|---|---|
| Polarization-Maintaining Fiber (PMF) | Preserves the polarization state of input light, ensuring consistent and repeatable speckle pattern generation during calibration and measurement [3]. |
| Index-Matching Fluid (e.g., Glycerine) | Facilitates optical coupling between a fiber and another component (e.g., a silica sphere) by reducing Fresnel reflections at the interface [74]. |
| High-Reflectivity Sphere Coating (e.g., Barium Sulfate, PTFE) | Forms the diffuse, highly reflective inner surface of an integrating sphere, enabling multiple reflections and spatial integration of light [70]. |
| Silicon-on-Insulator (SOI) Wafer | Standard substrate for fabricating silicon photonic devices, including multimode spiral waveguides and micro-ring resonators, providing optical confinement [73] [75]. |
| Tunable Laser Source | A critical calibration tool; its narrow linewidth and precise wavelength control allow for the systematic mapping of wavelength to speckle pattern [3] [73]. |
| CCD/CMOS Camera | The primary sensor for capturing high-resolution spatial speckle patterns generated by MMFs, integrating spheres, or metasurfaces [69] [3]. |
Experimental Protocols
Protocol for Multimode Fiber Spectrometer
This protocol outlines the procedure for characterizing and calibrating a multimode fiber-based computational spectrometer, achieving high spectral resolution [69] [3].
Key Materials:
- Tunable laser source (e.g., 1520–1567 nm range) [3]
- Polarization-maintaining fiber (PMF) [3]
- Multimode fiber (MMF)
- CCD camera (e.g., InGaAs for IR) [3]
- Polarization controller [69]
Procedure:
- Source Setup: Connect the tunable laser source to the system via a PMF to ensure a stable polarization state.
- Coupling: Fuse the PMF to the MMF, which acts as the scattering medium. Use a polarization controller before the MMF to fine-tune the input launch condition [69].
- Pattern Imaging: Align the CCD camera to capture the speckle pattern at the output facet of the MMF.
- System Calibration: a. Set the tunable laser to a specific wavelength, λ₁. b. Capture the corresponding speckle pattern image, I(λ₁). c. Repeat steps a-b over the entire spectral range of interest with a step size smaller than the desired resolution (e.g., 2 pm steps) [3]. d. Compile all images to construct the calibration matrix, T, where each column represents the speckle pattern for a given wavelength.
- Spectral Reconstruction: a. For an unknown light source, capture its speckle pattern, Iunknown. b. Reconstruct the input spectrum, S, by solving the linear equation Iunknown = T • S using computational algorithms (e.g., Tikhonov regularization or machine learning techniques) [73].
The experimental setup and information flow for this protocol are visualized below.
{#fig2} MMF Spectrometer Setup {/fig2}
Protocol for Integrating Sphere-based Spectral Measurement
This protocol describes using an integrating sphere for uniform light collection and its configuration for speckle-based spectral analysis, emphasizing throughput and uniformity [70] [3].
Key Materials:
- General Purpose Integrating Sphere (e.g., with Barium Sulfate coating) [70]
- Calibrated photodetector
- Input light source (collimated or from an optical fiber)
- Baffle (typically included inside the sphere)
Procedure:
- Sphere Configuration: Select an integrating sphere with a port fraction low enough to ensure high measurement accuracy [70].
- Port Assignment: a. For a collimated input beam (e.g., a laser), admit the light through the 180° port. The "hot spot" will form on the sphere wall at the 0° port. b. Mount the calibrated detector at the 90° port. The internal baffle must be positioned between the 0° and 90° ports to prevent the detector from viewing the direct illumination spot [70]. c. The north pole port can be used as a pick-off port for simultaneous wavelength analysis with another instrument.
- Calibration & Measurement: a. The spatially integrated radiation is measured by the baffled detector. b. The signal is proportional to the total initial radiation power. For speckle-based reconstruction, the spatial distribution of the sphere's output can be imaged and calibrated similarly to the MMF protocol [3].
Implementation Notes for Metasurface Spectrometers
Metasurface-based spectrometers represent a cutting-edge approach where the scattering medium is a planar, nanostructured surface [71] [1]. While detailed fabrication is highly specialized, the implementation workflow is as follows.
{#fig3} Metasurface Spectrometer Implementation {/fig3}
Key Materials:
- Double-layer disordered metasurface [1]
- Silicon image sensor
- Fabrication equipment (e.g., for electron-beam lithography, FIB) [71]
Procedure:
- Design & Fabrication: Design a metasurface composed of subwavelength nanostructures (e.g., GaN nanofins on an Al₂O₃ substrate) to function as a random scrambler [72] [1]. The geometry is optimized to create a complex, wavelength-dependent speckle pattern.
- Integration: The metasurface is directly mounted onto a standard CMOS image sensor to create a monolithic, ultra-compact device [1].
- Calibration & Operation: The system is calibrated using a tunable laser. For an unknown input, the captured single speckle pattern is analyzed by reconstruction algorithms to deduce the spectrum [1].
The choice between Multimode Fibers, Integrating Spheres, and Metasurfaces involves a direct trade-off between resolution, footprint, and light handling capability. MMFs are superior for achieving the highest spectral resolution in a guided-wave format, making them ideal for fiber-integrated sensor systems. Integrating spheres excel in applications demanding high collection efficiency and uniform light distribution, such as bulk property measurement. Metasurfaces offer a revolutionary path toward mass-producible, chip-integrated spectrometers for portable and consumer-level applications where miniaturization is paramount. The ongoing refinement of fabrication techniques and reconstruction algorithms will further enhance the performance and accessibility of these powerful spectroscopic tools.
Computational spectrometers that utilize speckle patterns are a transformative technology in miniaturized optical analysis. Their operation relies on a fundamental principle: mapping the spectral information of incoming light to a unique spatial intensity pattern, or "speckle," which is then decoded computationally. The accuracy of this spectral reconstruction is heavily dependent on the underlying physical model that describes the interaction between light and the scattering structure. For quasi-homogeneous random scattering media whose fluctuations follow Gaussian statistics, the first Born and first Rytov approximations are two foundational models used to predict scattered light intensity [76].
A critical comparison reveals that for most scattering directions, excluding those in or very near the forward direction, the predictions of the Born and Rytov approximations are essentially identical, provided the integrated strength of the dielectric fluctuations is sufficiently small. Under these conditions of weak scattering, the first Born approximation is considered reasonably accurate [76]. This establishes the domain of validity for linearized models and is the cornerstone for developing robust reconstruction algorithms in compact speckle spectrometers. Framing the system within this linear regime justifies the use of linear matrix operations for spectrum reconstruction, expressed as ( \text{I}{\text{M} \times 1} = \text{T}{\text{M} \times \text{N}} \times \text{S}_{\text{N} \times 1} ), where I is the measured speckle pattern, T is the transmission matrix of the spectrometer, and S is the unknown input spectrum [11].
Theoretical Foundation: Born and Rytov Approximations
The Born and Rytov approximations are both perturbative methods for solving wave scattering problems, but they approach the problem from different angles. Understanding their mathematical relationship is key to validating their linear application.
- The Born Approximation: This is an additive method. It models the total field as the sum of the incident field and the scattered field. The solution is derived by assuming the field inside the scatterer can be approximated by the incident field. Its validity is traditionally associated with weak scattering and scatterers that are small or have a low refractive index contrast relative to the surrounding medium.
- The Rytov Approximation: This is a multiplicative method. It expresses the total field as the incident field multiplied by a complex-valued phase term. The solution is found by assuming the spatial variation of this phase term is slow. The Rytov approximation is often considered valid over a longer propagation path and can sometimes handle stronger scattering than the Born approximation for certain geometries, as it better accounts for phase accumulation.
The pivotal finding from comparative studies is that for a class of quasi-homogeneous random media, the predicted distribution of scattered light intensity in the far zone is nearly identical for both approximations, provided the scattering is not in the forward direction and the dielectric fluctuations are weak [76]. This convergence justifies the use of a linear framework for speckle-based reconstruction in a wide array of experimental conditions. When these conditions are met, the computationally accessible Born approximation can be employed with confidence.
Table 1: Core Characteristics of Born and Rytov Approximations
| Feature | Born Approximation | Rytov Approximation |
|---|---|---|
| Mathematical Form | Additive: ( \psi{total} = \psi{incident} + \psi_{scattered} ) | Multiplicative: ( \psi{total} = \psi{incident} e^{\phi} ) |
| Primary Assumption | The field inside the scatterer is the incident field. | The spatial variation of the phase term ( \phi ) is slow. |
| Domain of Validity | Weak scattering, small scatterers, low contrast. | Potentially longer propagation paths; can be more accurate for certain forward-scattering problems. |
| Key Commonality | For non-forward directions and weak fluctuations, their intensity predictions are essentially identical [76]. |
Experimental Protocol for Model Validation
Validating the linearity and interchangeability of the Born and Rytov models requires a structured experimental approach. The following protocol outlines the key steps for a benchtop experiment using a custom-designed speckle spectrometer.
Apparatus and Material Setup
The core of the experimental setup is a disordered scattering element integrated into a photonic chip. Recent advancements have employed various structures:
- On-Chip Diffractive Metasurfaces: Cascaded layers of metasurfaces with randomly distributed meta-atoms (e.g., etched waveguide slots) create highly complex, wavelength-dependent speckle patterns. Using three such layers has been shown to significantly enhance spectral richness and resolution [11].
- Femtosecond Laser-Induced Nanostructures: Scattering media fabricated on substrates like sapphire using femtosecond lasers offer a compact and stable platform for speckle generation [4].
- Passive Silicon Photonic Networks: A network of cascaded unbalanced Mach-Zehnder Interferometers (MZIs) and a random antenna array can be designed to produce spatially decorrelated speckle patterns with a high number of independent sampling channels [21].
The supporting apparatus includes a tunable laser source (covering, for instance, the C-band from 1500 nm to 1600 nm), a single-mode input waveguide, and an infrared camera (e.g., an InGaAs camera) for capturing the output speckle patterns with high pixel count.
Data Acquisition and Calibration
- System Calibration: The transmission matrix T of the spectrometer must be characterized. This is done by inputting a series of known, narrow-linewidth wavelengths ( \lambda1, \lambda2, ..., \lambda_N ) from the tunable laser and recording the corresponding speckle pattern for each. Each pattern is flattened into a column vector, forming the calibrated matrix T [11] [21].
- Test Data Collection: For validation, a set of known test spectra (both single wavelengths and combinations) are input into the system. Their corresponding speckle patterns ( I_{measured} ) are captured. This dataset will be used to benchmark the reconstruction accuracy of the model based on the Born approximation.
Validation Procedure
The validation procedure is a quantitative comparison between the known input spectra and the spectra reconstructed using the Born-approximation-based linear model.
- Spectrum Reconstruction: For each test speckle pattern ( I{measured} ), the input spectrum ( S{reconstructed} ) is calculated by solving the linear equation ( I_{measured} = T \cdot S ). This is typically an inverse problem that can be addressed with algorithms like Tikhonov regularization or compressed sensing.
- Quantitative Accuracy Assessment: The reconstructed spectra are compared to the ground-truth input spectra using the following metrics:
- Spectral Resolution: Determined by measuring the minimum wavelength shift required to produce a statistically distinct speckle pattern. This is quantified by the half-width-at-half-maximum (HWHM) of the speckle correlation function ( C(\Delta \lambda) ) [11].
- Reconstruction Fidelity: Calculated using the Normalized Mean Square Error (NMSE) between the reconstructed spectrum ( S{recon} ) and the true spectrum ( S{true} ).
- Linearity Confirmation: The core of the Born/Rytov validation. The linearity of the system is tested by inputting combined spectra (e.g., ( SA + SB )) and verifying that the reconstructed spectrum is the linear sum of the individual reconstructions of ( SA ) and ( SB ). The high accuracy of reconstruction under these weak scattering conditions, as confirmed by the theoretical equivalence of Born and Rytov, validates the use of the linear Born model [76].
The following workflow diagram illustrates the complete experimental protocol from setup to validation.
The Scientist's Toolkit: Research Reagent Solutions
The development and validation of linear reconstruction models for speckle spectrometers rely on a suite of specialized "research reagents"—both physical components and computational tools.
Table 2: Essential Research Reagents for Speckle Spectrometer Validation
| Category | Item | Function & Specification |
|---|---|---|
| Hardware | Silicon Photonic Chip with Disordered Metasurface | Core scattering element; generates wavelength-dependent speckle patterns. Specifications include layer count (e.g., 3 layers) and meta-atom design [11]. |
| Tunable Laser Source | Provides precise, narrow-linewidth light for system calibration and testing. Requires coverage of the operational bandwidth (e.g., 1500-1600 nm). | |
| High-Resolution Infrared Camera | Captures speckle patterns. Key parameters: high pixel count (e.g., >1MP) and sensitivity in the operational wavelength range [21]. | |
| Software & Algorithms | Linear Algebra Solver (e.g., with Tikhonov Regularization) | Computational core for solving the inverse problem I = T × S to reconstruct the unknown spectrum S [11]. |
| Speckle Correlation Analysis Code | Quantifies spectral resolution by calculating the correlation function C(Δλ) from speckle patterns [11]. | |
| Machine Learning Denoising Models (e.g., CNN-LSTM) | Optional: Improves reconstruction accuracy and system stability by reducing noise in the speckle patterns [4]. | |
| Theoretical Models | First Born Approximation | The linear scattering model being validated; provides the theoretical foundation for the reconstruction matrix T. |
| First Rytov Approximation | Used as a theoretical benchmark to confirm the validity domain of the linear Born model under weak scattering conditions [76]. |
Data Presentation and Analysis
Rigorous data analysis is critical for demonstrating the validity of the linear model. The following tables summarize key quantitative metrics from state-of-the-art research, providing a benchmark for expected performance.
Table 3: Performance Metrics of Advanced Speckle Spectrometers
| Spectrometer Architecture | Bandwidth (nm) | Resolution | Footprint (mm²) | Spectral Channels | Channel Density (ch/mm²) |
|---|---|---|---|---|---|
| On-Chip Diffractive Metasurfaces [11] | 100 | 70 pm | 0.1425 | 1400 | ~10,021 |
| Single-Shot Integrated Speckle Spectrometer [21] | 200 | 10 pm | 2 | 2730 | ~1,365 |
| Compact Speckle Spectrometer with CNN-LSTM [4] | N/A | 0.5 nm | Compact | N/A | N/A |
The data in Table 3 shows the impressive performance achievable with modern speckle spectrometers. The high spectral channel density, in particular, underscores the efficiency of the information encoding in speckle patterns. The relationship between the number of independent speckle patterns (or spectral channels) and the physical hardware is a key validation point for the linear model.
Furthermore, the correlation function ( C(\Delta \lambda) ) is a direct measure of the spectral resolution and a validation tool for model linearity. A narrow correlation width indicates that a small change in wavelength produces a significantly different speckle pattern, enabling high resolution. Experimental results from cascaded metasurface spectrometers show that more complex scattering structures (e.g., three layers) produce a narrower correlation width, directly linking the physical design to the performance predicted by the linear model [11].
The validation of linearity between the Rytov and Born approximations under weak scattering conditions provides a solid theoretical foundation for the use of linear reconstruction models in computational speckle spectrometers. The experimental protocol and data analysis frameworks outlined here offer a pathway for researchers to benchmark their own systems. The convergence of advanced photonic chip design, high-resolution imaging, and robust linear algebra algorithms is pushing the boundaries of miniaturized spectroscopy. Future work will likely focus on further increasing channel density and bandwidth, enhancing robustness to noise with advanced machine learning, and expanding these validated linear models into new application domains such as portable medical diagnostics, environmental monitoring, and real-time industrial process control [11] [1] [21].
The miniaturization of spectroscopic instruments represents a paradigm shift in analytical science, enabling the transition of high-precision chemical analysis from laboratory environments to portable, field-deployable devices. Speckle pattern reconstruction has emerged as a foundational principle driving this revolution, allowing for the replacement of traditional, bulky dispersive optical elements with compact scattering media and computational algorithms. This approach facilitates the creation of spectrometers with form factors smaller than a fingernail while achieving remarkable spectral resolution.
This application note provides a systematic resolution benchmark for miniaturized spectroscopic systems, detailing performance from the picometer scale to the nanometer regime. We present quantitative comparisons of current technologies, detailed experimental methodologies for achieving high-resolution measurements, and essential protocols for researchers developing applications in pharmaceutical analysis, biomedical diagnostics, and environmental monitoring.
Fundamental Principles of Speckle-Based Spectrometry
Speckle-based spectrometers operate on a fundamentally different principle than traditional dispersive instruments. When coherent or partially coherent light interacts with a disordered medium, such as a scattering surface or a multimode fiber, it generates a random interference pattern known as a speckle pattern. The specific spatial configuration of this pattern is highly sensitive to the wavelength of the incident light. Each wavelength produces a unique, reproducible "fingerprint" speckle pattern [1] [2].
The core mathematical framework treats this relationship as a linear operation, expressed as:
I = Φ · S
Where:
- S represents the original spectral signal to be measured
- Φ is the system's measurement matrix, which encodes the wavelength-to-speckle relationship
- I is the observed speckle intensity pattern captured by an image sensor [3]
The spectrum is reconstructed by solving the inverse problem: using computational algorithms to deduce the input spectrum S from the captured speckle pattern I and the pre-calibrated measurement matrix Φ. The spectral resolution achievable depends on the sensitivity of the speckle pattern to minute wavelength changes and the precision of the reconstruction algorithm.
Resolution Benchmarking of Miniaturized Systems
The following table benchmarks the current state-of-the-art in miniaturized spectrometer resolution, highlighting the technologies that enable measurements across an impressive five-order-of-magnitude range.
Table 1: Resolution Benchmarking of Miniaturized Spectrometer Technologies
| Technology Platform | Best Reported Resolution | Operating Wavelength Range | Key Technology Enabler | Form Factor |
|---|---|---|---|---|
| Fiber/Scattering Media with Neural Network | 5 pm (0.005 nm)(at 1500-1600 nm) | 100 nm bandwidth | ResNet-50 & GRU Neural Network | Compact |
| Localized Speckle Pattern (Integrating Sphere) | 2 pm (0.002 nm)(Theoretical) | 1520-1567 nm | Localized speckle analysis; 35x faster measurement rate | Compact |
| Double-Sided Nanostructures | 0.1 nm | 100 nm bandwidth | Femtosecond laser-induced nanostructures; Transmission Matrix | Compact |
| Double-Layer Disordered Metasurface | 1 nm | 440-1300 nm | Engineered metasurface on image sensor | < 1 cm (fingernail-sized) |
Analysis of Benchmarking Data
The data reveals a clear trade-space between resolution, bandwidth, and form factor. The highest resolutions—at the picometer level—are achieved in specialized, compact systems using computational enhancements like neural networks or localized speckle analysis within specific infrared bands [20] [3]. These are ideal for applications requiring extreme precision in a confined spectral region.
In contrast, technologies like the double-layer disordered metasurface offer a compelling balance, providing nanometer-level resolution across a vastly wider operational range from visible to infrared, all in an ultra-compact, robust package suitable for integration into mobile devices [1] [2]. This makes them highly applicable for broad-spectrum daily-life analyses, including food component analysis, skin health measurement, and environmental pollution detection [2].
Detailed Experimental Protocols
This section provides actionable methodologies for implementing high-resolution, speckle-based spectroscopic systems.
Protocol: Fabrication of a Femtosecond Laser-Induced Scattering Medium
This protocol details the creation of a high-performance scattering element capable of 0.1 nm resolution [20].
Primary Research Reagent Solutions:
- Substrate: Quartz glass slide
- Laser System: Femtosecond pulsed laser system
- Positioning System: High-precision 3-axis translation stage
Step-by-Step Procedure:
- Substrate Cleaning: Clean the quartz glass substrate in an ultrasonic bath with sequential rinses of acetone, isopropanol, and deionized water. Dry with a nitrogen gun.
- Laser Parameter Calibration: Set the femtosecond laser to the desired pulse energy and repetition rate. The optimal parameters must be determined empirically for the specific laser and substrate combination.
- Direct Laser Writing: Mount the substrate on the translation stage. Program the stage to move the substrate under the fixed laser beam in a raster-scan pattern, ensuring a significant overlap (e.g., >50%) between adjacent laser spots.
- Double-Sided Processing: Flip the substrate and repeat Step 3 to create nanostructures on the opposite side. This double-sided configuration enhances light-scattering complexity, which is crucial for high resolution.
- Characterization: Inspect the fabricated nanostructures using scanning electron microscopy (SEM) or atomic force microscopy (AFM) to verify surface morphology.
Protocol: System Calibration and Spectral Reconstruction
This protocol covers the calibration and operation of a speckle-based spectrometer after the scattering medium is prepared.
Primary Research Reagent Solutions:
- Tunable Reference Laser: A laser with a known, narrow linewidth and precise tunability (e.g., 5 MHz linewidth).
- Image Sensor: CMOS or CCD camera, selected for the target wavelength range.
- Computational Framework: Software environment (e.g., Python with PyTorch/TensorFlow) for implementing reconstruction algorithms.
Step-by-Step Procedure:
- Experimental Setup: Align the system so that light from the tunable laser is collimated and normally incident on the scattering medium. The transmitted or reflected speckle pattern should be fully projected onto the image sensor.
- Transmission Matrix Calibration:
- Set the reference laser to a starting wavelength within the operating range.
- Capture the resulting speckle pattern, I(λ₁).
- Increment the laser wavelength by a small step (e.g., ≤ target resolution) and capture the next speckle pattern, I(λ₂).
- Repeat this process over the entire desired bandwidth. The collection of all I(λ) forms the system's measurement matrix, Φ.
- Spectral Reconstruction:
- For an unknown light source, capture its single-shot speckle pattern, Iunknown.
- Use a reconstruction algorithm to solve Iunknown = Φ · S for the spectrum S.
- For the highest resolution (5 pm), employ a pre-trained neural network model (e.g., ResNet-50 combined with a Gated Recurrent Unit (GRU)) to process the speckle pattern and output the reconstructed spectrum [20].
Protocol: Enhancing Measurement Rate with Localized Speckle
For applications requiring high temporal resolution, this protocol outlines the use of localized speckle patterns [3].
- Procedure:
- Capture a full-field speckle pattern from your scattering medium (e.g., an integrating sphere or multimode fiber) for a known wavelength.
- Rather than using the entire speckle image, define a small Region of Interest (ROI)—as small as 1/50th of the full pixel count.
- Re-calibrate the measurement matrix Φ using only the pixel intensities from this ROI.
- Perform spectral reconstruction using the localized data. This method can increase the measurement rate by over 35 times with minimal impact on reconstruction error for multi-wavelength measurements.
The Researcher's Toolkit: Essential Materials & Reagents
Table 2: Key Research Reagent Solutions for Speckle Spectrometer Development
| Item Name | Function/Description | Application Context |
|---|---|---|
| Double-Layer Disordered Metasurface | Engineered surface with nano-scale structures that creates wavelength-dependent speckle patterns; the core scattering element. | Ultra-compact, smartphone-integratable spectrometers [1] [2]. |
| Quartz Glass with Laser-Induced Nanostructures | A scattering medium fabricated via femtosecond laser ablation to create a complex, disordered surface for light scrambling. | High-resolution (0.1 nm) compact spectrometers [20]. |
| Multimode Optical Fiber (MMF) | Acts as a ready-made, flexible scattering medium where light undergoes multiple modes of propagation, generating speckle. | Prototyping and all-fiber speckle spectrometers [3]. |
| Integrating Sphere | A hollow spherical structure with a highly reflective interior, used to generate uniform and well-mixed speckle patterns. | High-speed spectral measurements using localized speckles [3]. |
| ResNet-50 & GRU Neural Network Model | A deep learning architecture for processing spatial speckle patterns (ResNet-50) and sequential spectral data (GRU) for reconstruction. | Achieving the highest spectral resolution (5 pm) from speckle data [20]. |
Workflow and System Diagrams
The following diagrams illustrate the core logical relationships and experimental workflows in speckle-based spectrometry.
Diagram 1: Core workflow of a speckle-based spectrometer, showing the one-time calibration phase and the operational measurement phase.
Diagram 2: The technology continuum, illustrating the fundamental trade-off between spectral resolution, operational bandwidth, and device size.
Robustness Testing Under Real-World Operating Conditions
Robustness testing is defined as the deliberate, systematic examination of an analytical method's capacity to remain unaffected by small, deliberate variations in method parameters, providing an indication of its reliability during normal use [77] [78]. For researchers developing speckle pattern reconstruction methods for compact spectrometers, establishing method robustness is not merely an optional validation step but a fundamental requirement for ensuring data integrity and scientific reproducibility. A method that performs perfectly under ideal, tightly controlled laboratory conditions may fail when subjected to the minor, unavoidable variations encountered in real-world operating environments [77].
In the context of compact spectrometer applications, where precise optical measurements are critical, robustness testing serves as an essential safeguard. It ensures that your experimental results represent a reliable, reproducible truth rather than a snapshot of a single moment in time under perfect conditions. The reliability of a single data point in speckle pattern analysis can have significant consequences for the interpretation of spectral data, influencing subsequent scientific conclusions and technological applications [77]. By systematically investigating how sensitive your method is to variations in operational parameters, you can identify critical control points and establish a range within which the method remains reliable, thereby building a foundation of data integrity that stands up to the test of time and the unpredictable nature of real-world experimental conditions [77] [79].
Key Parameters for Robustness Assessment in Speckle Pattern Analysis
Critical Method Parameters
For speckle pattern reconstruction in compact spectrometer applications, specific methodological parameters must be controlled and systematically varied during robustness testing. The table below outlines these essential parameters, their typical variations, and their potential impact on measurement outcomes.
Table 1: Key Parameters for Robustness Testing in Speckle Pattern Analysis
| Parameter Category | Specific Parameters | Typical Variation Ranges | Potential Impact on Measurements |
|---|---|---|---|
| Optical Configuration | Light source intensity | ±5% of nominal value | Affects signal-to-noise ratio and pattern visibility |
| Wavelength stability | ±0.5 nm | Impacts reconstruction accuracy and spectral resolution | |
| Polarization state | Minor alterations in polarization | Influences speckle contrast and pattern formation | |
| Environmental Conditions | Temperature | ±2°C from controlled setpoint | Affects optical components and detector performance |
| Mechanical vibration | Ambient laboratory levels | Introduces pattern instability and measurement noise | |
| Ambient light leakage | Low-level controlled exposure | Contributes to background noise in detection | |
| Sample Presentation | Positioning reproducibility | ±10 μm in x,y,z axes | Alters speckle pattern geometry and consistency |
| Surface characteristics | Controlled variations in roughness | Affects speckle generation and pattern quality | |
| Instrumental Factors | Detector gain | ±5% adjustment | Influences signal amplitude and dynamic range |
| Exposure time | ±10% of optimized setting | Impacts pattern brightness and saturation levels | |
| Calibration stability | Multiple calibrations over time | Affects long-term measurement reproducibility |
Research Reagent Solutions and Essential Materials
The experimental workflow for speckle pattern robustness testing requires specific materials and instrumentation to ensure reliable results. The following table details these essential components and their functions within the experimental context.
Table 2: Essential Research Materials for Speckle Pattern Robustness Testing
| Category | Item | Specification/Standard | Function in Experiment |
|---|---|---|---|
| Optical Components | Stable light source | Tunable laser or broadband source with spectral filtering | Provides controlled illumination for speckle generation |
| Precision pinholes | 10-50 μm diameter, precise geometry | Creates defined scattering conditions for speckle formation | |
| Reference samples | Certified spectral standards or calibrated diffusers | Enables method verification and performance benchmarking | |
| Detection System | Compact spectrometer module | Defined spectral range and resolution | Captures speckle patterns for reconstruction analysis |
| CCD/CMOS detector | Specified quantum efficiency and noise characteristics | Converts optical patterns to digital signals for processing | |
| Calibration Tools | Wavelength standards | Certified emission lines (e.g., neon-argon lamp) | Validates spectral accuracy and calibration stability |
| Neutral density filters | Certified optical density values | Tests dynamic range and linearity response | |
| Temperature controller | ±0.1°C stability | Maintains consistent thermal environment for components | |
| Computational Resources | Reconstruction algorithms | Custom or established mathematical approaches | Processes raw speckle patterns into spectral information |
| Data analysis software | MATLAB, Python, or specialized analytical platforms | Performs statistical analysis and robustness quantification |
Experimental Design and Protocol
Systematic Approach to Robustness Testing
A structured experimental design is paramount for meaningful robustness assessment. For speckle pattern analysis, we recommend a screening design approach that efficiently identifies critical factors affecting method performance. The Plackett-Burman design is particularly suitable for initial robustness studies as it allows for the investigation of multiple factors (7-11 parameters) with a minimal number of experimental runs while maintaining statistical significance [78]. This efficient design enables researchers to screen a broad range of potential variability sources before conducting more focused studies on the identified critical parameters.
The experimental protocol should follow a structured workflow:
- Parameter Selection: Identify all potential sources of variation in your speckle pattern analysis system based on the parameters outlined in Table 1.
- Range Definition: Establish scientifically justified variation ranges for each parameter that represent realistic operational deviations.
- Experimental Matrix: Implement a Plackett-Burman design that systematically varies parameters according to a predefined matrix.
- Data Collection: Execute all experimental runs in randomized order to minimize confounding effects of external factors.
- Response Measurement: Quantify method performance using predefined metrics specific to speckle pattern reconstruction.
Robustness Testing Workflow
The following diagram illustrates the systematic workflow for conducting robustness testing in speckle pattern analysis:
Systematic Robustness Testing Workflow
Detailed Experimental Protocol
Preparation Phase
- Instrument Calibration: Verify spectrometer calibration using certified wavelength standards before commencing robustness testing. Document all calibration parameters and results.
- Environmental Stabilization: Allow the optical system to stabilize under controlled temperature conditions for a minimum of 60 minutes prior to initial measurements.
- Reference Measurement: Collect speckle patterns from certified reference samples to establish baseline performance metrics for comparison throughout the robustness study.
Experimental Execution
- Parameter Variation Sequence: Following the experimental design matrix, systematically adjust each parameter within its predefined range while maintaining other factors at nominal values.
- Replication Strategy: Perform triplicate measurements at each parameter setting to account for random variability and enable precision estimation.
- Control Measurements: Intersperse control measurements at nominal conditions throughout the experimental sequence to monitor system stability over time.
- Data Recording: Document all raw speckle patterns alongside metadata detailing specific parameter settings, environmental conditions, and timestamps for each measurement.
Performance Metrics for Speckle Pattern Reconstruction
The effectiveness of speckle pattern reconstruction under varied conditions should be evaluated against multiple quantitative metrics:
Table 3: Performance Metrics for Robustness Assessment
| Performance Metric | Calculation Method | Acceptance Criterion |
|---|---|---|
| Reconstruction Accuracy | RMS error between reconstructed and reference spectra | ≤2% deviation from reference |
| Spectral Resolution | FWHM of measured emission lines | ≤1.5x theoretical resolution limit |
| Signal-to-Noise Ratio | Mean signal divided by standard deviation in flat spectral regions | ≥100:1 for nominal conditions |
| Pattern Reproducibility | Cross-correlation coefficient between replicate patterns | ≥0.95 under nominal conditions |
| Processing Time | Time required for complete reconstruction | Application-dependent threshold |
Data Analysis and Interpretation
Statistical Treatment of Robustness Data
Robustness testing generates multidimensional datasets that require appropriate statistical analysis to identify significant effects. Analysis of Variance (ANOVA) serves as the primary statistical tool for determining which parameter variations significantly impact method performance metrics [79]. For each performance metric listed in Table 3, calculate the statistical significance (p-value) of each parameter's effect, with p < 0.05 typically indicating a statistically significant influence on method performance.
Beyond significance testing, calculate the quantitative impact of each parameter variation:
- Effect Size: Determine the magnitude of change in each performance metric relative to the variation in each parameter.
- Confidence Intervals: Establish 95% confidence intervals for performance metrics under varied conditions to quantify uncertainty.
- Tolerance Intervals: Calculate intervals within which a specified proportion (e.g., 95%) of future measurements are expected to fall, given the anticipated parameter variations in routine operation.
Parameter Significance and Control Strategy
The following diagram illustrates the decision-making process for establishing control strategies based on robustness testing results:
Parameter Control Strategy Decision Tree
Presentation of Robustness Data
Effective presentation of robustness testing data enables clear communication of method limitations and operating boundaries. The table below provides a template for summarizing robustness testing outcomes, facilitating comparison across multiple parameters and performance metrics.
Table 4: Robustness Testing Results Summary
| Parameter | Variation Range | Reconstruction Accuracy | Spectral Resolution | Signal-to-Noise Ratio | Pattern Reproducibility | Overall Impact |
|---|---|---|---|---|---|---|
| Light Source Intensity | ±5% | 1.2% deviation | No significant change | 15% reduction at -5% | Correlation ≥0.98 | Low |
| Wavelength Stability | ±0.5 nm | 3.5% deviation | 25% degradation at ±0.5 nm | 8% reduction | Correlation = 0.91 | High |
| Temperature | ±2°C | 2.1% deviation | 12% degradation at +2°C | 5% reduction | Correlation ≥0.95 | Medium |
| Detector Gain | ±5% | 1.8% deviation | No significant change | 22% improvement at +5% | Correlation ≥0.97 | Low |
| Sample Positioning | ±10 μm | 4.2% deviation | 8% degradation at ±10 μm | 10% reduction | Correlation = 0.89 | High |
Implementation Protocol for Routine Operation
System Suitability Testing
Based on robustness testing results, implement regular system suitability tests to verify method performance before critical measurements. The system suitability protocol should include:
- Control Sample Measurement: Analyze a certified reference material that produces a characteristic speckle pattern.
- Performance Verification: Confirm that key metrics (e.g., reconstruction accuracy, pattern reproducibility) fall within established control limits derived from robustness testing.
- Documentation and Acceptance Criteria: Record all system suitability results and define explicit acceptance criteria that must be met before proceeding with experimental measurements.
Control Strategies for Critical Parameters
For parameters identified as having high impact on method performance (as determined through the analysis summarized in Table 4), implement enhanced control strategies:
- Environmental Controls: Stabilize temperature and humidity for parameters sensitive to environmental fluctuations.
- Instrumental Monitoring: Implement real-time monitoring and logging of critical instrument parameters (e.g., source intensity, detector temperature).
- Calibration Frequency: Increase calibration frequency for components associated with high-impact parameters.
- Procedural Controls: Implement strict standardized protocols for operator-dependent steps, particularly those involving sample positioning and handling.
Continuous Robustness Monitoring
Robustness assessment should not conclude with initial method validation but should continue throughout the method's lifecycle:
- Trend Analysis: Regularly review system suitability test results to identify performance trends that may indicate emerging robustness issues.
- Control Charts: Implement statistical process control charts for key performance metrics to visually monitor method stability over time.
- Periodic Re-assessment: Re-evaluate method robustness when significant changes occur, such as instrument replacement, software updates, or application to new sample types.
By implementing this comprehensive approach to robustness testing and control, researchers can ensure the reliability of speckle pattern reconstruction methods for compact spectrometer applications, thereby generating trustworthy data that supports valid scientific conclusions and technological advancements.
Conclusion
Speckle pattern reconstruction has fundamentally transformed spectrometer miniaturization, enabling lab-grade performance in devices smaller than a fingernail. The synergy of advanced scattering media like disordered metasurfaces with sophisticated deep learning algorithms has achieved remarkable spectral resolution down to 10 pm, making these systems viable for demanding biomedical applications. Future directions include developing calibration-free systems through predictive hardware design, enhancing robustness against environmental perturbations, and creating multi-functional devices capable of hyperspectral and ultrafast imaging. For biomedical researchers and drug development professionals, these advancements promise unprecedented capabilities in portable chemical analysis, real-time tissue diagnostics, and point-of-care therapeutic monitoring, potentially democratizing advanced spectroscopic analysis beyond traditional laboratory settings.
References
- 1. Fingernail-sized spectrometer could bring lab-grade ... [https://modernsciences.org/miniature-spectrometer-metasurface-smartphones-june-2025/]
- 2. research [https://news.kaist.ac.kr/newsen/html/news/?mode=V&mng_no=47730]
- 3. Multi-wavelength spectral reconstruction with localized ... [https://www.sciencedirect.com/science/article/abs/pii/S0030401824010034]
- 4. Compact speckle spectrometer based on CNN-LSTM ... [https://opg.optica.org/ol/abstract.cfm?uri=ol-49-22-6521]
- 5. Adaptive Vectorial Restoration from Dynamic Speckle ... [https://www.mdpi.com/1424-8220/25/6/1803]
- 6. Multimode Fibers [https://www.rp-photonics.com/multimode_fibers.html]
- 7. Spectrally encoded flow cytometry using few-mode fiber ... [https://pmc.ncbi.nlm.nih.gov/articles/PMC11729279/]
- 8. High-precision 3D morphology reconstruction method in ... [https://www.sciencedirect.com/science/article/abs/pii/S0143816625004191]
- 9. Reconstruction method for highly curved surfaces using bi ... [https://opg.optica.org/abstract.cfm?uri=ao-64-8-1831]
- 10. Reconstructive spectrometers: hardware miniaturization and ... [https://elight.springeropen.com/articles/10.1186/s43593-025-00101-0]
- 11. Scalable on-chip diffractive speckle spectrometer with high ... [https://www.nature.com/articles/s41377-025-01797-y]
- 12. All-fiber spectrometer based on speckle pattern ... [https://opg.optica.org/oe/abstract.cfm?uri=oe-21-5-6584]
- 13. Speckle-based image reconstruction via uniform ... [https://www.sciencedirect.com/science/article/abs/pii/S0030399225012241]
- 14. Adaptive Vectorial Restoration from Dynamic Speckle ... [https://pubmed.ncbi.nlm.nih.gov/40292951/]
- 15. Reconstructive spectrometer using double - layer ... disordered [https://pmc.ncbi.nlm.nih.gov/articles/PMC12118547/]
- 16. KAIST NEWS CENTER [https://www.kaist.ac.kr/newsen/html/news/?mode=V&mng_no=47730]
- 17. Research advances of femtosecond laser-induced ... [https://www.frontiersin.org/journals/chemistry/articles/10.3389/fchem.2022.1082651/full]
- 18. Stable fabrication of femtosecond-laser-induced periodic ... [https://www.light-am.com/article/doi/10.37188/lam.2025.003]
- 19. Recent Developments of Femtosecond Laser Direct Writing ... [https://www.mdpi.com/2079-4991/13/10/1623]
- 20. Compact speckle spectrometer using femtosecond laser ... [https://opg.optica.org/ol/abstract.cfm?uri=ol-49-21-6281]
- 21. Single-Shot Integrated Speckle Spectrometer with ... [https://arxiv.org/html/2505.15166v1]
- 22. Miniaturized disordered photonic molecule spectrometer [https://pmc.ncbi.nlm.nih.gov/articles/PMC11958646/]
- 23. Ultra-broadband on-chip reconstructive spectrometer via ... [https://opg.optica.org/ol/abstract.cfm?uri=ol-50-21-6802]
- 24. Nonlinear memristive computational spectrometer | Light [https://www.nature.com/articles/s41377-024-01703-y]
- 25. Integrated photonic spectrometers: a critical review [https://www.spiedigitallibrary.org/journals/photonics-insights/volume-4/issue-4/R10/Integrated-photonic-spectrometers-a-critical-review/10.3788/PI.2025.R10.full]
- 26. 5.2-THz-bandwidth miniaturized spectrometer using a GHz ... [https://photonix.springeropen.com/articles/10.1186/s43074-025-00193-4]
- 27. Review and experimental comparison of speckle-tracking ... [https://journals.iucr.org/s/issues/2025/01/00/tv5066/]
- 28. Efficient high-resolution microscopic ghost imaging via ... [https://www.frontiersin.org/journals/advanced-optical-technologies/articles/10.3389/aot.2025.1583836/full]
- 29. Self-supervised ultrasound speckle reduction without clean ... [https://www.sciencedirect.com/science/article/pii/S1361841525003020]
- 30. An effective image despeckling and reconstruction ... [https://www.nature.com/articles/s41598-025-10220-w]
- 31. Anatomical Modeling and Optimization of Speckle Contrast ... [https://pmc.ncbi.nlm.nih.gov/articles/PMC10508753/]
- 32. Laser speckle size and contrast investigation of volumetric ... [https://pmc.ncbi.nlm.nih.gov/articles/PMC12063137/]
- 33. 深度学习在目标视觉检测中的应用进展与展望 [https://www.aas.net.cn/article/id/19104]
- 34. 融合FPN的Faster R-CNN复杂背景下棉田杂草高效识别方法 [http://www.tcsae.org/cn/article/id/20192025]
- 35. 基于LSTM循环神经网络的故障时间序列预测 [https://bhxb.buaa.edu.cn/bhzk/cn/article/doi/10.13700/j.bh.1001-5965.2017.0285]
- 36. 中科大团队发布:百种U-Net变体医学图像分割评测 [https://finance.sina.com.cn/stock/t/2025-11-08/doc-infwteus4757031.shtml]
- 37. 综述:基于分析驱动的U-Net在医学图像分割中的综述 [https://www.ebiotrade.com/newsf/2025-9/20250921083048533.htm]
- 38. 2025 U-Net混合进化:医学影像分割精度与效率双重突破原创 [https://blog.csdn.net/gitblog_00760/article/details/153450643]
- 39. New technique for capturing ultra-intense laser pulses in a ... [https://www.physics.ox.ac.uk/news/new-technique-capturing-ultra-intense-laser-pulses-single-shot]
- 40. High-Acquisition-Rate Single-Shot Pump-Probe ... [https://www.nature.com/articles/srep37614]
- 41. Single-shot spatiotemporal plasma density measurements ... [https://opg.optica.org/optica/abstract.cfm?uri=optica-12-9-1522]
- 42. Real-time Measurements, Rogue Phenomena, and Single- ... [https://spie.org/pwl/conferencedetails/real-time-measurements-rogue-phenomena]
- 43. NIR Spectroscopy Applications in the Development of a ... [https://pmc.ncbi.nlm.nih.gov/articles/PMC3066347/]
- 44. What Is Materials Characterization? [https://www.ansys.com/simulation-topics/what-is-materials-characterization]
- 45. Laser speckle size and contrast investigation of volumetric ... [https://www.sciencedirect.com/science/article/pii/S2589004225006947]
- 46. Advancing Metabolite Identification with a Compact ... [https://www.spectroscopyonline.com/view/advancing-metabolite-identification-with-a-compact-infrared-ion-spectroscopy-platform]
- 47. Spatially Multiplexed Speckle on 1D Sensors for High- ... [https://pmc.ncbi.nlm.nih.gov/articles/PMC11174428/]
- 48. Publications 2025 [https://www.dermasensor.com/resource/clinical-utility-of-an-ai-powered-handheld-elastic-scattering-spectroscopy-device/]
- 49. Clinical Study On Use Of Raman Spectroscopy Device To ... [https://www.va.gov/boston-health-care/news-releases/clinical-study-on-use-of-raman-spectroscopy-device-to-detect-skin-cancer]
- 50. Top Dermatology Technology Trends for 2025 [https://www.medsender.com/blog/top-dermatology-technology-trends-for-2025]
- 51. New Hyperspectral Imaging Database Enhances Human ... [https://www.spectroscopyonline.com/view/new-hyperspectral-imaging-database-enhances-human-skin-research]
- 52. Advances in the study and application of digital technology ... [https://pmc.ncbi.nlm.nih.gov/articles/PMC12423535/]
- 53. Mobile health apps for skin cancer triage in the general ... [https://bmccancer.biomedcentral.com/articles/10.1186/s12885-025-14244-3]
- 54. Portable and Wearable Spectrometers in Our Future [https://www.spectroscopyonline.com/view/portable-and-wearable-spectrometers-in-our-future]
- 55. Portable Spectrometer Market: Trends, Growth, and Future ... [https://lumica.ir/blogs/181/Portable-Spectrometer-Market-Trends-Growth-and-Future-Prospects?lang=en_us]
- 56. Sample Drift Estimation Method Based on Speckle Patterns ... [https://pubmed.ncbi.nlm.nih.gov/31853411/]
- 57. An improved geometrical calibration method for stereo ... [https://www.sciencedirect.com/science/article/abs/pii/S0030401821007562]
- 58. Camera calibration method using synthetic speckle pattern ... [https://opg.optica.org/ao/upcoming_pdf.cfm?id=444593]
- 59. Flexible circuits engineered for complex and extreme ... [https://www.oaepublish.com/articles/ss.2025.69]
- 60. High-fidelity tissue super-resolution imaging achieved with ... [https://pmc.ncbi.nlm.nih.gov/articles/PMC12319088/]
- 61. Decorrelation and efficient coding by retinal ganglion cells [https://pmc.ncbi.nlm.nih.gov/articles/PMC3725273/]
- 62. Joint decorrelation, a versatile tool for multichannel data ... [https://www.sciencedirect.com/science/article/abs/pii/S1053811914004534]
- 63. New Spectrometer Is Small Enough to Fit on Your Phone [https://research.ncsu.edu/new-spectrometer-is-small-enough-to-fit-on-your-phone/]
- 64. Miniaturized Spectrometer Market Trends 2025-2029 [https://natlawreview.com/press-releases/miniaturized-spectrometer-market-trends-2025-2029-regional-outlook-and]
- 65. Adapted Correlation Methods for Laser Speckle Imaging of ... [https://pmc.ncbi.nlm.nih.gov/articles/PMC12473826/]
- 66. A universal method for speckle pattern image degradation ... [https://www.sciencedirect.com/science/article/abs/pii/S0013794425007702]
- 67. Recent Advancements in Hyperspectral Image ... [https://www.mdpi.com/1424-8220/25/11/3286]
- 68. Flow-Matching Guided Deep Unfolding for Hyperspectral ... [https://arxiv.org/html/2510.01912v1]
- 69. High-performance compact spectrometer based on ... [https://opg.optica.org/oe/abstract.cfm?uri=oe-27-26-38349]
- 70. Integrating Sphere Fundamentals and Applications [https://www.newport.com/t/integrating-sphere-fundamentals-and-applications]
- 71. Optical Fiber-Integrated Metasurfaces: An Emerging ... [https://pmc.ncbi.nlm.nih.gov/articles/PMC8912696/]
- 72. Scattering Analysis and Efficiency Optimization of Dielectric ... [https://pmc.ncbi.nlm.nih.gov/articles/PMC7996895/]
- 73. Compact silicon multimode waveguide spectrometer with ... [https://www.nature.com/articles/srep43454]
- 74. Integrating Sphere for Measuring Scattering Loss in Optical ... [https://opg.optica.org/abstract.cfm?uri=ao-13-8-1900]
- 75. A compact on-chip computational spectrometer using ... [https://www.sciencedirect.com/science/article/abs/pii/S0030401825007552]
- 76. Comparison of the Born and the Rytov approximations for ... [https://www.sciencedirect.com/science/article/pii/0030401890903846]
- 77. Robustness and Ruggedness Testing in Analytical Chemistry [https://www.labmanager.com/robustness-and-ruggedness-testing-in-analytical-chemistry-34247]
- 78. Method Validation and Robustness [https://www.chromatographyonline.com/view/method-validation-and-robustness]
- 79. Analytical Method Robustness → Term [https://fashion.sustainability-directory.com/term/analytical-method-robustness/]