Strategic HPLC Column Selection for Pharmaceutical Compounds: A 2025 Guide to Method Development, Optimization, and Troubleshooting
This article provides a comprehensive guide for researchers, scientists, and drug development professionals on selecting and optimizing HPLC columns for pharmaceutical analysis.
Strategic HPLC Column Selection for Pharmaceutical Compounds: A 2025 Guide to Method Development, Optimization, and Troubleshooting
Abstract
This article provides a comprehensive guide for researchers, scientists, and drug development professionals on selecting and optimizing HPLC columns for pharmaceutical analysis. Covering foundational principles to advanced applications, it details the latest innovations in column technology, including inert hardware and novel stationary phases for complex samples like oligonucleotides and biologics. The content offers actionable methodologies for method development, practical troubleshooting strategies for common performance issues, and frameworks for method validation and comparative analysis to ensure regulatory compliance and robust quality control.
Understanding HPLC Column Fundamentals: Stationary Phases, Particle Technology, and Modern Innovations
In the field of pharmaceutical analysis, the selection of an appropriate High-Performance Liquid Chromatography (HPLC) column is a critical determinant of research success. Effective separation of drug compounds, their metabolites, and potential impurities directly impacts the accuracy and reliability of analytical results. This application note details the three fundamental principles governing HPLC separation—retention, selectivity, and efficiency—within the specific context of pharmaceutical compound separation research. Designed for researchers, scientists, and drug development professionals, this document provides both theoretical frameworks and practical experimental protocols to guide robust HPLC method development and column selection.
The core separation power of HPLC is mathematically described by the master resolution equation [1]: Rs = (1/4) * (α - 1) * √N * (k₂/(1 + k₂)) Where:
- Rs = Resolution
- α (Alpha) = Selectivity
- N = Efficiency (Theoretical Plates)
- k = Retention Factor
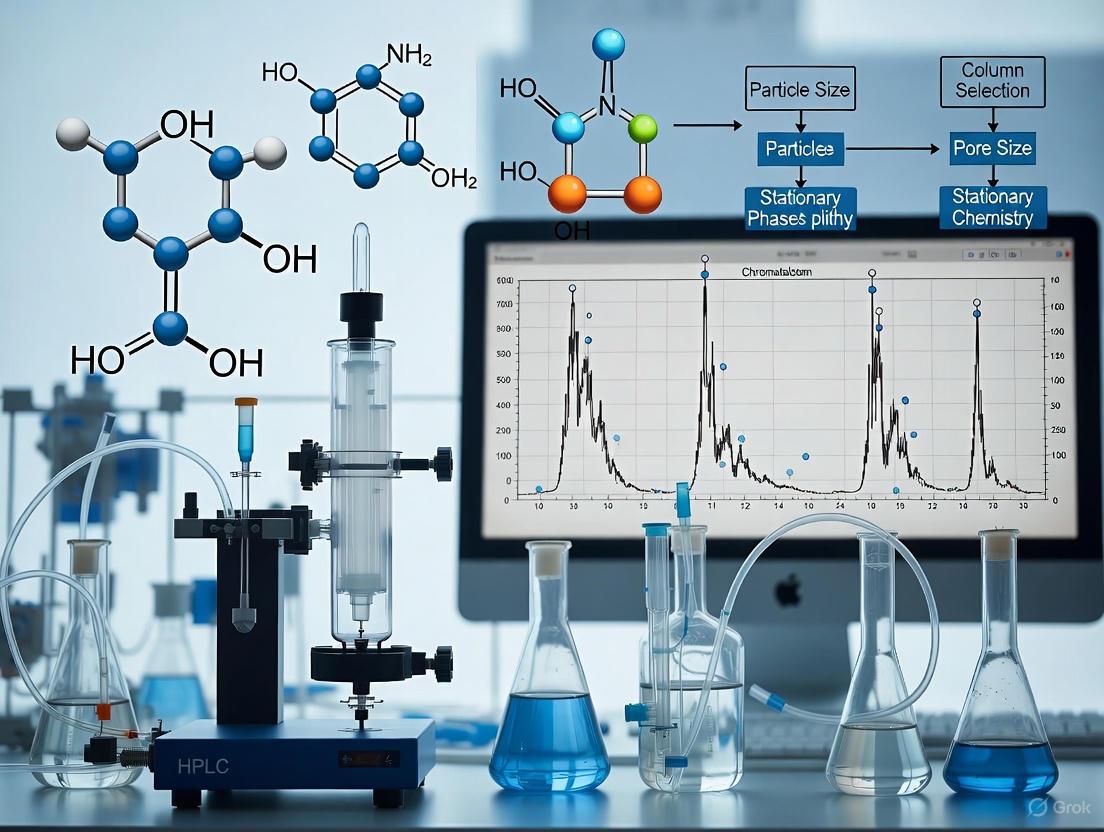
The following diagram illustrates the logical relationships between the fundamental parameters, the factors that influence them, and the ultimate goal of chromatographic resolution.
Core Principles and Quantitative Relationships
Retention (k)
Retention, quantified by the retention factor (k), describes the relative speed at which an analyte moves through the chromatographic system. It is calculated as k = (tᵣ - t₀)/t₀, where tᵣ is the analyte retention time and t₀ is the column dead time [2]. Adequate retention is essential to separate analytes from the solvent front and ensure accurate integration. For pharmaceutical applications, a retention factor between 2 and 10 is generally considered optimal [3]. It is crucial to note that while the retention factor is nominally independent of variables like flow rate and column length, significant operating pressure can influence the retention of certain analytes, particularly larger molecules or ionizable compounds [4].
Selectivity (α)
Selectivity (α) is the capability of the chromatographic system to separate two analytes based on their differing chemical interactions with the stationary and mobile phases. It is defined as α = k₂/k₁, where k₂ and k₁ are the retention factors of the two later- and earlier-eluting analytes, respectively [2]. A selectivity value of 1 indicates co-elution. Altering selectivity is the most powerful approach to improving resolution [1] [5]. For structural isomers or compounds with identical mass, achieving chromatographic selectivity is often the only reliable way to differentiate them, even when using mass spectrometric detection [1] [2].
Efficiency (N)
Column efficiency, expressed as the number of theoretical plates (N), is a measure of peak broadening. A higher number of theoretical plates yields sharper, narrower peaks, which enhances resolution and detection sensitivity [6]. Efficiency is calculated from retention time and peak width, with several accepted calculation methods [7]:
- United States Pharmacopeia (USP) / Tangent Method: N = 16 (tᵣ / Wb)²
- Half-Peak Height Method (used by EP, BP, DAB): N = 5.54 (tᵣ / W₀.₅)²
- Area Height Method: N = 2π (tᵣ H / A)² where Wb is the peak width at baseline, W₀.₅ is the width at half height, H is the peak height, and A is the peak area [7]. It is critical to maintain consistent calculation methods when comparing columns, as the values can differ significantly for tailing peaks [7].
Table 1: Quantitative Impact of k, α, and N on Resolution
| Parameter | Definition | Mathematical Impact on Resolution (Rs) | Optimal Range for Pharmaceuticals |
|---|---|---|---|
| Retention Factor (k) | Measures relative analyte speed; k = (tᵣ - t₀)/t₀ [2] | Affects term k/(1+k); diminishing returns beyond k > 10 [1] | 2 - 10 [3] |
| Selectivity (α) | Ratio of retention factors for two analytes; α = k₂/k₁ [2] | Linear effect via (α - 1); most powerful factor for improving Rs [5] | >1.05 (Values further from 1.0 indicate better separation) |
| Efficiency (N) | Number of theoretical plates; measure of peak sharpness [6] | Square root effect (√N); doubling N only increases Rs by ~1.4x [5] | Maximize via small particles, optimized flow, and column packing |
Table 2: Comparison of Theoretical Plate (N) Calculation Methods [7]
| Calculation Method | Governing Pharmacopeia | Formula | Advantages | Limitations |
|---|---|---|---|---|
| Tangent Line Method | USP | N = 16 (tᵣ / Wb)² | Official USP method. | Problematic with distorted peaks that have multiple inflection points. |
| Half Peak Height Method | EP, BP, DAB | N = 5.54 (tᵣ / W₀.₅)² | Simple; most widely used; can be done easily by hand. | For broader peaks, results in larger N values than other methods. |
| Area Height Method | - | N = 2π (tᵣ H / A)² | Accurate and reproducible even for distorted peaks. | Can yield larger N values when peak overlap is significant. |
| EMG Method | - | N = See reference [7] | Accommodates peak asymmetry. | Cannot calculate unless the peak is completely separated. |
Experimental Protocols for HPLC Method Development
This section provides a detailed workflow and specific procedures for developing and optimizing an HPLC method for pharmaceutical compounds.
Systematic Method Development Workflow
The following workflow outlines a structured approach to HPLC method development, from defining objectives to final validation.
Protocol 1: Optimization of Retention and Selectivity via Mobile Phase and Stationary Phase
Objective: To achieve baseline resolution (Rs ≥ 1.5) for a mixture of active pharmaceutical ingredients (APIs) and related compounds by systematically optimizing mobile phase composition and stationary phase chemistry [3] [8].
Materials:
- HPLC system with UV or PDA detector
- Columns: A standard C18 column (e.g., 150 mm x 4.6 mm, 5 µm), a phenyl-hexyl column, and a cyano (CN) column [1] [9].
- Mobile Phase A: Water or aqueous buffer (e.g., 10-20 mM phosphate or formate)
- Mobile Phase B: Organic modifiers (Acetonitrile, Methanol, Tetrahydrofuran)
- Standard solution containing target analytes
Procedure:
- Initial Scouting: Inject the standard solution using the C18 column and a linear gradient from 5% to 95% B over 20-30 minutes. Observe the retention and separation of all components.
- Optimize Retention (k): Switch to an isocratic method. Adjust the %B based on the scouting run to bring the retention factors of all critical peaks into the optimal range of 2-10. If the last peak elutes with k > 10, increase %B; if the first peak elutes with k < 2, decrease %B.
- Optimize Selectivity (α) via Mobile Phase:
- Change Organic Modifier: If critical peak pairs are still co-eluting, switch the organic modifier. Use Figure 4 (solvent strength relationships) from the search results to estimate the required concentration for equivalent retention [3]. For example, if 50% Acetonitrile was used, try ~57% Methanol or ~35% Tetrahydrofuran.
- Adjust pH (for ionizable compounds): For acidic compounds, use a buffer at a pH ~2 units below the pKa. For basic compounds, use a buffer at a pH ~2 units above the pKa. This suppresses ionization and increases retention. Adjusting pH can dramatically alter selectivity [3].
- Optimize Selectivity (α) via Stationary Phase: If mobile phase adjustments are insufficient, change the column chemistry [1] [2].
- For aromatic compounds, try a biphenyl phase to exploit π-π interactions [1] [9].
- For polar compounds or those requiring different selectivity, try a cyano (CN) or a polar-embedded phase [1].
- For basic compounds that show tailing on silica-based columns, consider a charged surface hybrid (CSH) or polymer-based column to minimize silanol interactions [10] [2].
- Final Method Refinement: Fine-tune the gradient profile or isocratic composition based on the selected column and organic modifier to achieve the final separation.
Protocol 2: Evaluation of Column Efficiency and System Suitability
Objective: To determine the efficiency (theoretical plate count, N) of an HPLC column and assess system suitability for a specific analytical method as per pharmaceutical guidelines [7] [6].
Materials:
- Validated HPLC method (isocratic conditions preferred)
- Column under test
- Standard analyte with k > 5 (e.g., toluene or naphthalene for reversed-phase) [6]
Procedure:
- System Equilibration: Equilibrate the column with the mobile phase until a stable baseline is achieved. Ensure the system is leak-free and the column thermostat is set to the specified temperature.
- Injection and Data Acquisition: Inject the standard solution and record the chromatogram. Ensure the peak of interest is well-defined and symmetrical.
- Data Analysis: Calculate the column efficiency (N) using one of the following methods, ensuring consistency with prior tests [7].
- USP (Tangent) Method: From the chromatogram, measure the retention time (tᵣ) and the peak width at baseline (Wb) determined by drawing tangents to the inflection points of the peak. Calculate N = 16 (tᵣ / Wb)².
- Half-Peak Height Method: Measure the retention time (tᵣ) and the peak width at half its maximum height (W₀.₅). Calculate N = 5.54 (tᵣ / W₀.₅)².
- System Suitability Assessment: Compare the calculated plate count against the method's predefined acceptance criteria. A well-packed analytical column (150 mm) should typically deliver tens of thousands of plates per meter [6]. Also, check for peak asymmetry (tailing factor).
The Scientist's Toolkit: Research Reagent Solutions
Selecting the correct materials is paramount for successful HPLC analysis in pharmaceutical research. The following table details key solutions for method development.
Table 3: Essential Research Reagent Solutions for HPLC Method Development
| Category & Item | Function / Rationale for Use | Application Notes |
|---|---|---|
| Stationary Phases | ||
| C18 (Octadecylsilyl) | The workhorse for reversed-phase; provides hydrophobic retention for a wide range of analytes. | Good starting point for most methods. All C18 phases are not created equal; selectivity varies by manufacturer [1]. |
| Biphenyl | Provides π-π interactions in addition to hydrophobicity, offering enhanced selectivity for aromatic analytes [1] [9]. | Ideal for separating structural isomers of aromatic pharmaceuticals. |
| Phenyl-Hexyl | Offers a combination of hydrophobic and π-π interactions, providing alternative selectivity to C18 [9]. | Useful for challenging separations where C18 fails. |
| Cyano (CN) | A versatile, polar functional group that can be used in both reversed-phase and normal-phase modes, offering vastly different selectivity [1]. | Useful for more polar analytes in reversed-phase mode. |
| Organic Modifiers | ||
| Acetonitrile | Aprotic solvent; strong elution strength in reversed-phase; often produces sharp peaks and high efficiency [2]. | First-choice modifier for methods coupled with MS due to low viscosity and high volatility. |
| Methanol | Protic solvent; weaker elution strength than acetonitrile; can provide different selectivity, especially for hydrogen-bonding compounds [3] [2]. | Useful for separating compounds that co-elute with acetonitrile. Can generate higher backpressure. |
| Aqueous Buffers & Additives | ||
| Ammonium Formate/Acetate (10-20 mM) | Volatile buffers for mass spectrometry compatibility; controls pH for ionizable compounds. | Standard for LC-MS methods. |
| Phosphate Buffers (10-50 mM) | Non-volatile buffers for UV detection; excellent pH control in the 2-8 range. | Not suitable for LC-MS. Provides robust control of retention and selectivity for ionizable analytes [3]. |
| Trifluoroacetic Acid (TFA) (0.05-0.1%) | Ion-pairing agent and pH modifier; improves peak shape for peptides and basic compounds [3]. | Can cause signal suppression in MS. |
| Specialist Columns | ||
| Solid-Core / Fused-Core | Particles with a solid core and porous shell; provide high efficiency with lower backpressure than fully porous particles of the same size [3] [9]. | Enables fast, high-resolution separations. |
| Bio-inert / Inert Hardware | Columns with passivated (e.g., PEEK-lined) hardware to minimize interaction with metal-sensitive analytes [9]. | Essential for analyzing chelating compounds, phosphorylated drugs, or certain antibiotics to prevent adsorption and peak tailing. |
Advanced Considerations and Recent Innovations
The field of HPLC column technology continues to evolve. Recent innovations focus on providing novel selectivity, enhanced inertness, and broader operating ranges [9].
- Novel Stationary Phases: New phases like the Halo 90 Å PCS Phenyl-Hexyl (Advanced Materials Technology) are designed to offer enhanced peak shape for basic compounds and alternative selectivity. Phases such as the Aurashell Biphenyl (Horizon Chromatography) are engineered for improved retention of hydrophilic aromatics and isomer separations [9].
- Enhanced Inertness: The trend towards using inert or bio-inert hardware is strong. Columns like the Halo Inert (Advanced Materials Technology) and Restek Inert HPLC Columns feature passivated fluid paths that minimize analyte adsorption, crucially improving recovery and peak shape for metal-sensitive compounds like those found in many pharmaceutical formulations [9].
- Broad pH Stability: Columns based on hybrid silica (e.g., Halo 120 Å Elevate C18) offer exceptional stability across a wide pH range (e.g., pH 2-12), granting chromatographers a powerful tool for manipulating selectivity via pH without damaging the column [9].
The strategic selection and optimization of an HPLC column are foundational to successful pharmaceutical analysis. A deep understanding of the interdependent roles of retention, selectivity, and efficiency allows researchers to develop robust, reliable methods efficiently. As demonstrated, while all three parameters in the resolution equation are important, manipulating selectivity through changes in the stationary phase chemistry and mobile phase composition provides the most significant leverage for overcoming challenging separations, such as those involving isomeric impurities. By applying the systematic protocols and utilizing the toolkit outlined in this application note, scientists can make informed decisions in HPLC column selection and method development, ultimately accelerating drug research and ensuring data quality.
The selection of an appropriate stationary phase is a critical first step in developing robust, selective, and efficient high-performance liquid chromatography (HPLC) methods for pharmaceutical analysis. The chemical nature of the stationary phase directly governs the retention mechanism and selectivity for target analytes, influencing method resolution, sensitivity, and analysis time. Within drug development, applications range from the separation of small molecule APIs and excipients to the characterization of large biomolecules like oligonucleotides and proteins. This application note provides a detailed, contemporary guide for researchers and scientists selecting among five principal stationary phase chemistries—C18, C8, Phenyl, HILIC, and Ion Exchange. It synthesizes the latest 2025 innovations in column technology with practical experimental protocols to guide method development for specific pharmaceutical compound classes, ensuring optimal outcomes in research and quality control.
The evolving pharmaceutical landscape, particularly the rapid expansion of complex modalities like oligonucleotide therapeutics, continuously pushes the boundaries of chromatographic science. Recent innovations focus on enhancing column inertness to improve the recovery of metal-sensitive compounds, developing stationary phases with alternative selectivity to replace ion-pairing reagents and creating materials capable of withstanding extreme pH conditions for method flexibility. This document frames the selection of stationary phase chemistry within the broader thesis that a fundamental understanding of retention mechanisms, coupled with strategic experimental screening, is paramount for successful HPLC method development in modern drug research and development.
Stationary Phase Chemistry and Characteristics
Core Principles and Retention Mechanisms
The interaction between an analyte and the stationary phase is the foundation of chromatographic separation. In reversed-phase chromatography (RPC), which includes C18, C8, and Phenyl phases, the primary mechanism is hydrophobic interaction, where non-polar regions of the analyte associate with the hydrophobic ligands of the stationary phase. The strength of this interaction increases with the surface area and the carbon load of the phase. In contrast, Hydrophilic Interaction Liquid Chromatography (HILIC) operates with a polar stationary phase and a hydrophobic mobile phase (typically acetonitrile-rich), retaining polar compounds via hydrogen bonding, dipole-dipole interactions, and occasionally electrostatic forces. Ion Exchange Chromatography (IEX) separates ionic or ionizable compounds based on electrostatic attraction between the analyte and charged functional groups on the stationary phase; cationic analytes bind to negatively charged sulfonic acid groups (strong cation exchange, SCX), while anionic analytes bind to positively charged ammonium groups (strong anion exchange, SAX).
Comparative Analysis of Stationary Phases
The following table provides a structured, quantitative comparison of the key physical and chemical characteristics of the five stationary phases, serving as a quick-reference guide for initial selection.
Table 1: Quantitative Comparison of HPLC Stationary Phases for Pharmaceutical Analysis
| Stationary Phase | Retention Mechanism | Typical Pore Size (Å) | Typical Particle Sizes (µm) | pH Range | Primary Pharmaceutical Applications |
|---|---|---|---|---|---|
| C18 | Hydrophobic/dispersive | 90 - 140 [11] | 1.7, 1.8, 2.7, 3, 5 [11] | 1.0 - 12.0 (varies by brand) [9] [11] | General small molecules, potency assays, stability-indicating methods, lipids |
| C8 | Hydrophobic/dispersive (less than C18) | 90 - 100 [11] | 3, 5, 10 [12] [13] | 2.0 - 8.0 [11] | Moderately polar small molecules, peptides, natural products |
| Phenyl | Hydrophobic + π-π stacking, dipole-dipole | 90 - 150 [9] [11] | 1.8, 2.7, 3, 5 [9] | 2.0 - 8.0 [11] | Aromatics, isomers, oligonucleotides (ion-pair free) [14], compounds with conjugated systems |
| HILIC | Hydrogen bonding, dipole-dipole, electrostatic | 100 - 140 [11] | 1.7, 3, 5 [15] | 2.5 - 8.0 (silica-based) [11] | Polar small molecules (sugars, organic acids), nucleotides, water-soluble vitamins, metabolites |
| Ion Exchange | Electrostatic attraction | N/A | 1.9, 3, 5 [9] | Varies (polymer-based can be 1-14) [16] | Biologics (proteins, mAbs, oligonucleotides), charged APIs, impurity profiling |
The Scientist's Toolkit: Essential Research Reagent Solutions
Table 2: Key Research Reagents and Materials for HPLC Method Development
| Item | Function/Description | Key Considerations |
|---|---|---|
| Ammonium Acetate (Volatile Buffer) | Provides pH control and ionic strength in MS-compatible methods. | Ideal for oligonucleotide analysis with phenyl columns and HILIC methods [14]. |
| Trifluoroacetic Acid (TFA) | Ion-pairing reagent and mobile phase modifier for peptides and proteins. | Can suppress ionization in MS; use at low concentrations (0.05-0.1%). |
| Triethylamine (TEA) | Ion-pairing reagent for oligonucleotides in IP-RPLC. | Non-volatile; not MS-compatible. Phenyl phases offer an MS-compatible alternative [14] [17]. |
| Formic Acid (Volatile Acid) | Common mobile phase additive for low-pH RPLC-MS methods. | Promotes protonation of analytes; enhances ionization in positive ESI-MS. |
| Inert/Passivated Hardware Columns | Columns with metal-free flow paths or passivated surfaces. | Crucial for analyzing metal-sensitive compounds like phosphorylated species, chelating PFAS, and pesticides [9]. |
| Methanol & Acetonitrile (HPLC Grade) | Primary organic modifiers for reversed-phase and HILIC chromatography. | Methanol can enhance π-π interactions on phenyl phases [14]. Acetonitrile is preferred for HILIC and low-UV detection. |
Detailed Stationary Phase Profiles and Applications
C18 (Octadecylsilane)
C18 columns are the most widely used stationary phases in RPC due to their strong hydrophobic retention, making them the default choice for a vast range of non-polar to moderately polar small molecules. The long alkyl chain (18 carbons) provides significant hydrophobic surface area for interaction. Newer C18 phases are engineered for high pH stability (pH 2-12), allowing method development at alkaline pH to suppress the ionization of basic compounds, improving peak shape and retention [9]. While often considered a general-purpose phase, its selectivity can be fine-tuned through variations in bonding density, end-capping procedures, and base silica purity. A notable innovation is the introduction of superficially porous particle (SPP) C18 columns, which offer high efficiency and lower backpressure compared to fully porous particles, making them ideal for high-throughput UHPLC-MS/MS applications in bioanalytical testing and therapeutic drug monitoring [9] [11].
C8 (Octylsilane)
C8 columns, with a shorter carbon chain, provide less hydrophobic retention compared to C18. This often results in shorter analysis times and can be advantageous for separating moderately hydrophobic compounds that are overly retained on a C18 phase. The distinction is not merely about retention time; factors such as bonding chemistry and packing quality can have a greater effect on selectivity and efficiency than the chain length itself [18]. In practice, a high-load C8 phase can sometimes generate more retention than a low-load C18 phase. C8 columns are particularly well-suited for the separation of peptides and moderately polar pharmaceutical compounds, and they can exhibit improved peak shapes for basic analytes due to reduced secondary interactions with residual silanols, although this is highly dependent on the base silica and end-capping used [18]. The market for C8 columns is growing steadily, valued at $299 million in 2025, driven by their versatility in pharmaceutical, biotechnology, and food safety applications [12] [13].
Phenyl (and Fluorinated Phenyl)
Phenyl stationary phases, including phenyl-hexyl, biphenyl, and pentafluorophenyl (PFP), offer a unique retention mechanism that combines standard hydrophobic interactions with π-π interactions. This makes them exceptionally selective for analytes containing aromatic rings or conjugated systems, allowing for the separation of structural isomers that are challenging to resolve with alkyl phases. A significant recent application is in the ion-pairing-free analysis of oligonucleotides. A 2025 study systematically evaluated phenyl phases and found that biphenyl and PFP columns provided superior performance, with retention governed primarily by π-π stacking when using methanolic mobile phases [14] [17]. This provides a robust, mass spectrometry-compatible alternative to traditional ion-pair reversed-phase chromatography (IP-RPLC). Fluorinated phases like PFP also exhibit dipole-dipole interactions and enhanced retention for charged bases, offering complementary selectivity to standard phenyl phases [11].
HILIC (Hydrophilic Interaction Liquid Chromatography)
HILIC is the technique of choice for retaining and separating highly polar and hydrophilic compounds that elute near or with the void volume in reversed-phase chromatography. The mechanism involves partitioning analytes between an organic-rich mobile phase (e.g., 70-95% acetonitrile) and a water layer immobilized on the surface of a polar stationary phase. Common stationary phases include bare silica, amino, cyano, and zwitterionic materials. The global HILIC columns market, valued at $193 million in 2025, is growing due to increased adoption in pharmaceutical analysis, biomarker discovery, and metabolomics [15]. HILIC is invaluable for analyzing polar drugs, metabolites, and nucleotides. Method development requires careful optimization of buffer concentration and pH, as electrostatic interactions can play a significant role alongside partitioning. A key advantage is its compatibility with MS detection, as the high organic content promotes desolvation and ionization efficiency [15].
Ion Exchange (IEX)
Ion Exchange Chromatography separates molecules based on their net surface charge. It is predominantly used in the analysis of large biomolecules such as proteins, monoclonal antibodies (mAbs), peptides, and oligonucleotides. Separations are typically performed with a salt gradient (e.g., NaCl) in an aqueous buffer, where increasing ionic strength competes with the analyte for binding to the charged stationary phase. IEX is critical for assessing charge heterogeneity of biopharmaceuticals, which is a critical quality attribute. Modern IEX columns often feature bioinert or polymer-based hardware to prevent protein adsorption and degradation, ensuring high recovery and reproducibility [9] [16]. For example, polymer-based columns like the PRP-C18 (despite its name, often used for ion-exchange) are stable across a wide pH range (1-14), enabling separations under aggressive conditions that would destroy silica-based columns [16]. Guard cartridges with bioinert properties are also available to protect analytical columns and extend their lifetime in these demanding applications [9].
Experimental Protocols
Protocol 1: Oligonucleotide Analysis Using Ion-Pair Free RPLC on a Biphenyl Column
Application Note: This protocol describes a method for analyzing antisense oligonucleotides (ASOs) without the use of ion-pairing reagents, making it highly compatible with mass spectrometry detection. It is based on a 2025 systematic evaluation of phenyl stationary phases [14] [17].
Materials and Reagents:
- Column: Biphenyl or Pentafluorophenyl (PFP) column (e.g., 150 x 2.1 mm, 2.7 µm) [14]
- Mobile Phase A: 50 mM Ammonium Acetate in water, pH 8.0
- Mobile Phase B: Methanol (HPLC grade)
- Reference Standards: Target oligonucleotide and related impurities/shortmers
Instrumentation:
- UHPLC system capable of handling pressures up to 1000 bar
- Column oven
- Mass Spectrometer (e.g., Q-TOF or Triple Quadrupole) or UV detector
Method Parameters:
- Column Temperature: 50 °C
- Flow Rate: 0.3 mL/min
- Injection Volume: 1-5 µL
- Detection: UV at 260 nm and/or MS in negative ionization mode
- Gradient Program:
- Time = 0 min: 5% B
- Time = 20 min: 35% B
- Time = 20.1 min: 95% B (hold for 3 min)
- Time = 23.1 min: 5% B (hold for 5 min for re-equilibration)
Procedure:
- Prepare mobile phases fresh and degas thoroughly.
- Equilibrate the column under initial gradient conditions (5% B) for at least 10 column volumes or until a stable baseline is achieved.
- Inject the oligonucleotide standard and execute the gradient method.
- The retention order is typically: IP-RPLC (TEAA) < biphenyl-RPLC < PFP-RPLC [17].
- For a chemically modified ASO, the biphenyl and PFP phases will show complementarity in selectivity, potentially resolving different impurities.
Protocol 2: Separation of Basic Drugs Using a Polymer-Based C18 Column at High pH
Application Note: This protocol leverages a stable polymer-based C18 column and a high-pH mobile phase to separate basic pharmaceutical compounds in their neutral forms, improving peak shape and broadening the elution window [16].
Materials and Reagents:
- Column: Polymer-based C18 column (e.g., 50 mm length, sub-3µm particles for fast analysis) [16]
- Mobile Phase A: 10 mM Ammonium Bicarbonate in water, pH ~10 (or other compatible alkaline buffer)
- Mobile Phase B: Acetonitrile (HPLC grade)
Instrumentation:
- UHPLC or HPLC system
- Column oven (set to 40 °C)
Method Parameters:
- Column Temperature: 40 °C
- Flow Rate: Adjusted to achieve desired backpressure and separation time (e.g., 0.8 - 1.2 mL/min for a 50 mm column)
- Injection Volume: 1-10 µL
- Detection: UV at 220 nm or 254 nm
- Gradient Program (Generic 5-min example):
- Time = 0 min: 10% B
- Time = 5 min: 90% B
- Time = 5.1 min: 10% B (hold for 2 min for re-equilibration)
Procedure:
- Prepare the alkaline mobile phase A accurately and ensure it is within the pH stability range of the column.
- Condition the polymer column with the starting mobile phase. Note that this column type is stable and does not require the same conditioning precautions as silica-based phases at high pH.
- Inject a mixture of basic drug compounds.
- The method should resolve the compounds with symmetrical peaks and minimal tailing, as the polymer phase is devoid of free silanols and the high pH suppresses analyte ionization.
Decision Framework and Strategic Selection
The following workflow diagram outlines a systematic strategy for selecting the optimal stationary phase based on the physicochemical properties of the analyte and the goals of the analysis.
The strategic selection of stationary phase chemistry is a cornerstone of successful HPLC method development in pharmaceutical research. A one-size-fits-all approach does not exist; rather, the choice must be informed by the chemical structure of the analyte, the desired separation mechanism, and the analytical goals. The contemporary trends in column technology—including the rise of inert hardware to mitigate analyte-surface interactions, the development of novel phenyl phases for challenging separations like ion-pair-free oligonucleotide analysis, and the refinement of robust stationary phases for extended pH and temperature stability—provide scientists with an powerful and expanding toolkit. By applying the principles and protocols outlined in this application note, researchers and drug development professionals can make informed, rational decisions that enhance chromatographic performance, accelerate method development, and ultimately support the delivery of safe and effective pharmaceuticals.
The selection of an appropriate column is a pivotal decision in high-performance liquid chromatography (HPLC) method development, directly influencing the resolution, efficiency, and speed of separations, particularly in pharmaceutical research where analyzing active compounds and their impurities is critical. The performance of an HPLC column is predominantly governed by the morphology and characteristics of the packing particles. Within this context, three classes of particles have proven highly significant: fully porous particles (FPPs), superficially porous particles (SPPs), and monodisperse particles.
FPPs have been the traditional mainstay of HPLC, valued for their high surface area and loading capacity [19]. SPPs, also known as core-shell particles, feature a solid, non-porous core surrounded by a thin, porous outer shell, which provides enhanced kinetic performance [20] [21]. Finally, monodisperse particles, characterized by their highly uniform size and shape, are emerging as a key technology for producing highly efficient and reproducible columns, not only in chromatography but also in areas like drug delivery [22] [23] [24]. This application note details the properties, performance, and optimal applications of these particle types to guide scientists in selecting the ideal phase for their pharmaceutical separation challenges.
Particle Architectures and Fundamental Properties
The structural differences between particle types define their chromatographic behavior.
Fully Porous Particles (FPPs)
FPPs are traditional spherical silica (or other material) particles that are porous throughout their entire volume [19]. This extensive porous network provides a high surface area-to-volume ratio, which is responsible for their high analyte retention capacity and sample loading capability. They are available in a wide range of particle sizes, pore sizes, and surface modifications, making them versatile for various applications from analytical to preparative scale separations [19].
Superficially Porous Particles (SPPs)
SPPs consist of a solid, impermeable core (typically silica) surrounded by a thin, porous outer shell of a consistent thickness [20] [25]. This architecture shortens the diffusion path length for analytes, significantly reducing the resistance to mass transfer (the C-term in the van Deemter equation). Furthermore, SPPs are typically more uniform in size than traditional FPPs, leading to more homogeneous packed beds and reduced eddy dispersion (the A-term) [25]. While their total surface area is lower than an FPP of the same diameter, modern SPPs retain 50-75% of the surface area, which is often sufficient for analytical retention while conferring major efficiency gains [25].
Monodisperse Particles
Monodisperse particles are defined by their extremely narrow size distribution, often with a relative standard deviation of less than 5% [23]. This uniformity can be applied to both fully porous and superficially porous morphologies. The primary advantage of monodispersity is the ability to form exceptionally uniform and well-ordered packed beds within HPLC columns. This minimizes flow path variations, thereby reducing band broadening and enhancing column efficiency [22]. Such particles are also critical in non-chromatographic applications, such as drug delivery, where size uniformity ensures consistent behavior and performance [23] [24].
Table 1: Comparative Characteristics of HPLC Particle Types
| Property | Fully Porous Particles (FPPs) | Superficially Porous Particles (SPPs) | Monodisperse Particles |
|---|---|---|---|
| Core Structure | Porous throughout | Solid, impermeable core | Can be either porous or solid core |
| Typical Size Range | 1.7 µm to 5 µm and larger | 1.7 µm to 5 µm | Varies (sub-micron to microns) |
| Primary Advantage | High surface area & loadability | High efficiency & fast separations | Highly uniform packing & efficiency |
| Key Limitation | Slower mass transfer for large molecules | Lower surface area & loadability | Complex and costly synthesis |
| Ideal Application | Preparative-scale, impurity profiling | High-speed & high-resolution analysis | High-performance columns, drug delivery |
Comparative Kinetic Performance
The performance of HPLC columns is quantitatively evaluated using kinetic plots, which compare efficiency (plate height, H) versus mobile phase linear velocity (u). The van Deemter equation (H = A + B/u + C·u) describes this relationship, where the A-term represents eddy dispersion, the B-term represents longitudinal diffusion, and the C-term represents resistance to mass transfer [25].
Performance Advantages of SPPs
Columns packed with SPPs demonstrate a superior kinetic performance compared to those packed with similarly sized FPPs. This is due to improvements in all three terms of the van Deemter equation [21] [25]:
- Reduced A-term: The high monodispersity of SPPs and their ability to form more homogeneous beds lead to narrower flow path distributions, reducing eddy dispersion [25].
- Reduced B-term: The solid core limits the volume of stagnant mobile phase within the particle, thereby reducing the contribution of longitudinal diffusion to band broadening [25].
- Reduced C-term: The thin porous shell drastically shortens the distance analytes must diffuse into and out of the particle, significantly lowering the resistance to mass transfer. This is particularly beneficial for separating large biomolecules like proteins, which have slow diffusion rates [20].
The following diagram illustrates the relationship between particle structure and the resulting band broadening contributions that define their kinetic performance.
Diagram 1: Performance pathways of different particle technologies, showing how structure influences band-broadening terms and applications.
Quantitative Performance Comparison
The performance benefit of SPPs is such that 2.7 μm SPPs can provide efficiencies comparable to sub-2 μm FPPs but at roughly half the operating pressure [25]. This allows for UHPLC-level performance on conventional HPLC systems rated for 400 bar. A study comparing 5 μm SPPs to 3.5 and 5 μm FPPs found the SPPs provided superior kinetic performance across the entire relevant range of separation conditions [21].
Table 2: Experimental Kinetic Performance Data
| Particle Type | Particle Size (µm) | Minimum Reduced Plate Height (hₘᵢₙ) | Relative Pressure | Recommended Application |
|---|---|---|---|---|
| Fully Porous | 5.0 | ~2.0 [21] | Low | Standard analytical separations |
| Fully Porous | 3.5 | ~2.0 [21] | Medium | High-resolution analysis |
| Fully Porous | 1.8 - 2.0 | ~2.0 | Very High | UHPLC, fast separations |
| Superficially Porous | 5.0 | < 2.0 [21] | Low | Fast separations on HPLC systems |
| Superficially Porous | 2.7 | 1.5 - 1.8 [21] | Medium | High-speed & high-efficiency analysis |
| Superficially Porous | 1.7 | ~1.5 [21] | High | UHPLC applications |
Application Notes for Pharmaceutical Separations
Impurity Profiling and Assay
The separation of active pharmaceutical ingredients (APIs) from closely related impurities and degradants demands high chromatographic efficiency. SPP-based columns are exceptionally well-suited for this task. For instance, a study demonstrating the separation of an amoxicillin impurity showed that 5 μm SPPs provided superior kinetic performance compared to both 3.5 and 5 μm fully porous particles [21]. The ability to resolve critical pairs with high efficiency makes SPPs a powerful tool for method development in quality control labs.
Biomolecule Separations
The fast mass transfer properties of SPPs are particularly advantageous for separating large biomolecules like proteins and monoclonal antibodies. These molecules have low diffusion coefficients, and the short diffusion path length in the porous shell of SPPs minimizes the time they spend in the stagnant mobile phase, leading to sharper peaks and higher resolution even at elevated flow rates [20]. This enables rapid gradient separations, as demonstrated by the separation of eight proteins in just over 0.75 minutes [20].
High-Throughput Analysis
The combination of high efficiency and low backpressure makes SPP-based columns ideal for high-throughput environments, such as during drug discovery. Methods can be accelerated by using higher flow rates without a severe penalty in efficiency or exceeding instrument pressure limits, thereby increasing laboratory productivity.
Experimental Protocols
Protocol: Evaluating Kinetic Performance of HPLC Columns
Purpose: To measure the kinetic performance of an HPLC column by constructing a van Deemter curve and calculating the minimum plate height (Hₘᵢₙ) and optimal linear velocity (uₒₚₜ).
Materials:
- HPLC system with variable wavelength UV-Vis detector or DAD
- Test columns (e.g., packed with FPPs and SPPs of various sizes)
- Mobile phase: Acetonitrile and water (e.g., 50:50 v/v)
- Test analytes: Alkylphenones (e.g., acetophenone, propiophenone, butyrophenone) or other neutral, stable compounds [21]
- Data acquisition and processing software
Procedure:
- System Preparation: Equilibrate the column with the mobile phase at a low flow rate (e.g., 0.2 mL/min) until a stable baseline is achieved.
- Dead Time Determination: Inject a non-retained compound (e.g., uracil or sodium nitrate) to determine the column's void time (t₀).
- Flow Rate Study: Inject a small volume (e.g., 1 µL) of the test analyte solution at a series of increasing flow rates (e.g., 0.2, 0.5, 0.8, 1.0, 1.2, 1.5 mL/min). Ensure the system backpressure remains within the limits for the column and instrument.
- Data Collection: For each flow rate, record the retention time (tᵣ) and the peak width at half height (w₀.₅) or the baseline peak width (w).
- Data Analysis:
- Calculate the linear velocity (u) for each flow rate: u = Column Length (L) / t₀
- Calculate the plate number (N) for each peak: N = 5.54 (tᵣ / w₀.₅)²
- Calculate the plate height (H) for each flow rate: H = L / N
- Plotting: Construct the van Deemter curve by plotting plate height (H) versus linear velocity (u).
Interpretation: The curve will show a minimum plate height (Hₘᵢₙ) at the optimal linear velocity (uₒₚₜ). Compare Hₘᵢₙ and the flatness of the C-term region for different columns. Columns with lower Hₘᵢₙ and flatter C-terms generally provide higher efficiency, especially at faster flow rates.
Protocol: Synthesis of Monodisperse Polymeric Particles for Biosystem Immobilization
Purpose: To synthesize monodisperse polymeric particles for use as matrices for immobilizing enzymes, proteins, or cells [24].
Materials:
- Monomers (e.g., styrene, divinylbenzene for synthetic polymers; or chitosan, alginate for natural polymers)
- Initiator (e.g., potassium persulfate, AIBN)
- Surfactant/Stabilizer (e.g., sodium dodecyl sulfate, polyvinyl alcohol)
- Deionized water and organic solvents as needed
- Nitrogen gas source
- Reaction flask with condenser, stirrer, and heating mantle
Procedure:
- Aqueous Phase Preparation: Charge the reaction flask with deionized water and surfactant. Purge the solution with nitrogen to remove oxygen.
- Monomer Mixture: Combine the primary monomer and cross-linker in a separate vial. Add a hydrophobic initiator if required.
- Emulsion/ Dispersion Polymerization: Slowly add the monomer mixture to the aqueous phase with vigorous stirring to form a stable emulsion or dispersion.
- Polymerization: Heat the reaction mixture to the initiation temperature (e.g., 70°C) with continuous stirring under a nitrogen atmosphere. Maintain the temperature for several hours to complete the reaction.
- Purification: After cooling, filter or centrifuge the resulting particle suspension. Wash the particles repeatedly with water and/or solvent to remove unreacted monomers and surfactant.
- Characterization: Determine particle size and monodispersity using dynamic light scattering (DLS) or electron microscopy. Confirm the presence of functional groups for immobilization via FT-IR.
Notes: The specific ratios of monomer, cross-linker, initiator, and surfactant, as well as stirring speed and temperature, are critical for achieving monodispersity and must be optimized. Natural polymers like chitosan or alginate can be formed into monodisperse particles using emulsification-gelation techniques [24].
The Scientist's Toolkit: Essential Research Reagents and Materials
Table 3: Key Research Reagent Solutions for Particle Technology and Applications
| Item | Function / Description | Example Use-Case |
|---|---|---|
| Alkylphenone Homologous Series | Neutral test compounds for evaluating column efficiency and hydrophobic selectivity [21]. | Constructing van Deemter plots for kinetic performance comparison. |
| Ammonium Acetate Buffer | A volatile buffer for LC-MS/MS compatibility; effective buffering range pH 3.5-5.5 [26]. | Mobile phase modifier for analyzing ionizable pharmaceutical compounds. |
| Base-Resistant C18 Column | A column with a stationary phase stable at high pH (e.g., >9) [26]. | Analyzing basic compounds in their non-ionized form for improved peak shape. |
| Chitosan | A natural, biocompatible polymer with functional groups for chemical modification [24]. | Synthesis of monodisperse particles for enzyme immobilization or drug delivery. |
| Porous Silica Microspheres | The foundational support material for most HPLC stationary phases [19]. | Manufacturing of fully porous and superficially porous HPLC packing materials. |
| Corona Discharge Ion Source | A source of unipolar ions for charge reduction [22]. | Producing monodisperse particles via electrospray by preventing Coulomb explosions. |
The advancement of particle technology has provided chromatographers with powerful tools to address complex separation challenges in pharmaceutical research. Fully porous particles remain the workhorse for methods requiring high loadability, such as preparative-scale purification. Superficially porous particles offer a compelling balance of high efficiency, speed, and moderate operating pressure, making them an excellent first choice for high-resolution analytical methods, including impurity profiling and biomolecule separation. The emerging emphasis on monodisperse particles, both as HPLC packings and for biotechnology applications, underscores the critical importance of particle uniformity for achieving superior and reproducible performance. By understanding the properties and advantages of each particle type, scientists can make an informed, application-driven selection to optimize their chromatographic methods.
The Rise of Bioinert and Metal-Free Hardware for Metal-Sensitive Compounds
For researchers in pharmaceutical development, the analysis of metal-sensitive compounds presents a persistent analytical challenge. Conventional stainless steel high-performance liquid chromatography (HPLC) hardware can cause unwanted interactions with electron-rich analytes, leading to compromised data quality and unreliable results [27]. These interactions are particularly problematic for critical pharmaceutical compounds including oligonucleotides, phosphorylated lipids, phosphopeptides, and metal-coordinating small molecules [27] [28] [29].
Bioinert and metal-free HPLC hardware technologies have emerged as essential solutions, specifically engineered to prevent analyte loss, maintain peak integrity, and ensure the reproducibility required in pharmaceutical research and quality control [27] [30]. This application note details the implementation of these technologies, providing validated protocols and performance data to guide column selection for the analysis of metal-sensitive pharmaceutical compounds.
Bioinert and metal-free HPLC columns address the limitations of traditional stainless steel hardware through several advanced engineering approaches.
Bioinert Coated Stainless Steel: These columns feature an advanced surface coating applied to the stainless steel column body and frits. This coating creates a metal-free barrier for analytes while maintaining the mechanical resilience and high-pressure stability of traditional stainless steel hardware [27] [28]. They are compatible with a wide range of solvents and do not require special connectors [27].
PEEK-Lined Stainless Steel: This design utilizes stainless steel for external pressure resistance while lining the entire internal flow path with inert PEEK (polyetheretherketone) polymer, including PEEK frits [30] [31]. This creates a fully metal-free environment for samples, preventing interactions while maintaining pressure capabilities [30].
Titanium Hardware: While known for biocompatibility, titanium is not truly bioinert as metal erosion can still occur, potentially leading to contamination of the silica bed and interactions with silanol groups [27].
The primary advantage of bioinert coated over PEEK-lined hardware is reduced hydrophobicity, minimizing hydrophobic interactions with polar analytes [30]. For most pharmaceutical applications involving metal-sensitive compounds, both technologies demonstrate superior performance compared to passivation techniques or mobile phase additives, which offer only temporary solutions and can interfere with mass spectrometry detection [27] [28].
Application Performance Data
Quantitative Performance Comparison
Extensive testing across multiple compound classes demonstrates the significant performance advantages of bioinert hardware for metal-sensitive analytes.
Table 1: Performance Comparison of Stainless Steel vs. Bioinert Hardware
| Analyte Class | Specific Analytes | Performance Metric | Stainless Steel Hardware | Bioinert Hardware | Improvement | Reference |
|---|---|---|---|---|---|---|
| Phosphorylated Nucleotides | AMP, ADP, ATP | Peak Tailing Factor | 2.6 - 4.8 | 1.3 - 1.7 | 50-65% reduction | [28] |
| Phosphopeptides | Peptide "c" (pY) | Relative Signal Height | 50% | 100% | 2x increase | [28] |
| Phosphopeptides | Peptide "b", "d" (pS, pY) | Detectability | Not detectable | Clear detection | Complete recovery | [28] |
| Acidic Metabolites | Glutamine, Glutamate, Malate | Peak Shape | Significant tailing | Sharp peaks | Improved resolution | [28] |
| Oligonucleotides | Phosphorothioated RNA | Peak Area/Height | Baseline | Up to 2x higher | 100% increase | [27] |
| Triphosphates | Nucleotide triphosphates | Peak Shape & Recovery | Poor shape, low recovery | Excellent shape, high recovery | Marked improvement | [31] |
Application-Specific Performance
Oligonucleotide Analysis: For phosphorothioated RNA analysis using ion-pair reversed-phase liquid chromatography (IP-RPLC), bioinert columns demonstrated up to twice the peak area and height compared to regular stainless steel columns [27]. In HILIC mode, bioinert coated columns required only 8 injections for conditioning compared to 20 for stainless steel and 14 for PEEK-lined columns, with minimal differences (<10%) between initial and final peak areas [27].
Lipidomic Applications: For the analysis of signaling lipids containing phosphate groups, bioinert coated columns enabled long-term reproducible results across different matrices, with one method identifying approximately 700 distinct molecules in under 10 minutes [27].
Pharmaceutical Small Molecules: Bioinert hardware provides critical advantages for compounds with coordinating functional groups, including mycotoxins (fumonisins), chelating compounds (hinokitiol), and metabolites in tryptophan metabolism [27].
Experimental Protocols
Protocol 1: Analysis of Phosphorylated Nucleotides (AMP, ADP, ATP)
This method is optimized for the separation and quantification of phosphorylated nucleotides using HILIC chromatography with bioinert hardware.
Table 2: Research Reagent Solutions for Nucleotide Analysis
| Reagent/Material | Specifications | Function | Supplier Example |
|---|---|---|---|
| Bioinert HILIC Column | 2.1 × 150 mm, 2.7 μm | Separation of polar phosphorylated compounds | Agilent Altura HILIC-Z [28] |
| Acetonitrile (LC-MS Grade) | ≥99.9% | Organic mobile phase component | Various |
| Ammonium Acetate | ≥99.0% | Volatile buffer salt | Various |
| Formic Acid | LC-MS Grade | Mobile phase additive for ionization | Various |
| Phosphorylated Nucleotides | AMP, ADP, ATP standards | Analytical standards for calibration | Sigma-Aldrich [28] |
Method Parameters:
- Column: Bioinert HILIC column (e.g., Agilent Altura HILIC-Z, 2.1 × 150 mm, 2.7 μm) [28]
- Mobile Phase A: Water with 0.1% formic acid
- Mobile Phase B: Acetonitrile with 0.1% formic acid
- Gradient Program:
- 0 min: 2% B
- 1.5 min: 2% B
- 11.5 min: 32% B
- 12 min: 2% B
- 18 min: 2% B
- Flow Rate: 0.4 mL/min
- Column Temperature: 40°C
- Injection Volume: 1-5 μL
- Detection: MS with ESI+ ionization
Critical Notes: This method utilizes low concentrations of formic acid (0.1%) to maintain compatibility with mass spectrometry while providing efficient ionization. The bioinert hardware is essential to prevent adsorption of phosphate groups to metal surfaces, which would cause poor peak shapes and reduced sensitivity [28].
Protocol 2: Analysis of Therapeutic Oligonucleotides Using IP-RP
This protocol describes the analysis of phosphorothioated oligonucleotides using ion-pair reversed-phase chromatography with bioinert hardware.
Table 3: Research Reagent Solutions for Oligonucleotide Analysis
| Reagent/Material | Specifications | Function | Supplier Example |
|---|---|---|---|
| Bioinert C18 Column | 2.1 mm ID, 1.9-2.7 μm | Separation of oligonucleotides | YMC Accura Triart Bio C18 [30] |
| Hexafluoroisopropanol (HFIP) | ≥99.5% | Ion-pairing agent component | Various |
| N,N-Diisopropylethylamine (DIPEA) | ≥99.5% | Ion-pairing agent component | Various |
| Methanol (LC-MS Grade) | ≥99.9% | Organic modifier | Various |
| Therapeutic Oligonucleotide | Phosphorothioated RNA | Analytic of interest | Prepared in-house |
Method Parameters:
- Column: Bioinert C18 column (e.g., YMC Accura Triart Bio C18, 2.1 × 150 mm, 1.9 μm) [30]
- Mobile Phase A: 100 mM HFIP, 5 mM DIPEA in water
- Mobile Phase B: 100 mM HFIP, 5 mM DIPEA in methanol
- Gradient Program:
- 0 min: 10% B
- 15 min: 40% B
- 15.1 min: 95% B
- 18 min: 95% B
- 18.1 min: 10% B
- 22 min: 10% B
- Flow Rate: 0.3 mL/min
- Column Temperature: 60°C
- Detection: UV at 260 nm or MS detection
Critical Notes: The use of bioinert hardware is particularly crucial for longer oligonucleotides, which show stronger interaction with metal surfaces [27]. For MS-compatible methods without ion-pairing agents, alternative approaches using ammonium bicarbonate as a volatile additive with bioinert C18 columns have been successfully demonstrated [27].
Protocol 3: Native IEX-MS Analysis of Intact Antibodies
This method enables the analysis of intact antibodies under native conditions using bioinert ion-exchange columns coupled to mass spectrometry.
Method Parameters:
- Column: Bioinert coated cation exchange column (e.g., YMC Accura BioPro IEX, 2.1 mm ID) [27] [30]
- Mobile Phase A: 20 mM ammonium acetate, pH 5.6, containing 2% acetonitrile
- Mobile Phase B: 20 mM ammonium acetate, 1 M sodium chloride, pH 5.6, containing 2% acetonitrile
- Gradient Program:
- Varied by specific mAb (e.g., 47-58% B over 55 min for trastuzumab)
- Flow Rate: 0.2-0.3 mL/min
- Column Temperature: 25°C
- Detection: MS with nano-electrospray ionization
Critical Notes: The smaller internal diameter (2.1 mm) available with bioinert columns helps reduce flow rates required for nano-electrospray ionization MS detection [27]. The bioinert hardware prevents metal-induced oxidation and interactions that could compromise the analysis of large biomolecules under native conditions.
Practical Implementation Guide
Column Selection Criteria
When selecting bioinert or metal-free columns for pharmaceutical applications, consider these key parameters:
- Analyte Properties: Electron-rich compounds ( oligonucleotides, phosphorylated species, acidic metabolites) with coordinating moieties strongly benefit from bioinert hardware [27] [28].
- Detection Method: For LC-MS applications, bioinert columns prevent signal suppression and enable the use of minimal MS-compatible additives without compromising recovery [27] [28].
- Pressure Requirements: Bioinert coated stainless steel columns maintain the high-pressure capabilities of traditional hardware (up to 1000 bar for UHPLC), while PEEK-lined columns have moderate pressure limits [30].
- Solvent Compatibility: Bioinert coated columns offer broader solvent compatibility compared to PEEK-lined columns, which may have limitations with certain organic solvents [27].
Method Transfer Considerations
When transferring methods from conventional to bioinert columns:
- Expect Improved Performance: Significantly higher recovery and better peak shapes are typically observed, which may require adjustment of acceptance criteria [27] [28] [31].
- Verify Selectivity: While the stationary phase may be identical, the absence of metal interactions may subtly affect selectivity for metal-coordinating compounds [32].
- Eliminate Passivation Steps: Remove column passivation procedures (e.g., EDTA or phosphoric acid flushes) from methods as they are unnecessary with bioinert hardware [27].
The adoption of bioinert and metal-free HPLC hardware represents a significant advancement in the analysis of metal-sensitive pharmaceutical compounds. These technologies effectively address the fundamental limitation of conventional stainless steel hardware – unwanted metal-analyte interactions – enabling reliable, high-resolution results with precision and reproducibility essential for drug development [27].
The experimental protocols and performance data presented demonstrate that bioinert hardware provides quantifiable improvements in analyte recovery, peak shape, and sensitivity for critical compound classes including oligonucleotides, phosphorylated compounds, and therapeutic antibodies. Implementation of these technologies throughout the pharmaceutical development workflow ensures data integrity while reducing analytical challenges associated with metal-sensitive compounds.
The selection of an appropriate High-Performance Liquid Chromatography (HPLC) column is a critical determinant of success in pharmaceutical research and development. The year 2025 has witnessed significant advancements in column technology, particularly for small-molecule reversed-phase liquid chromatography (RPLC), driven by the need for improved separation efficiency, alternative selectivity, and enhanced analysis of challenging compounds [9]. This application note provides a detailed overview of the latest trends and commercially available columns, equipping scientists with the knowledge and protocols needed to leverage these innovations for superior chromatographic method development.
The global HPLC columns market, valued at USD 4.98 billion in 2025, underscores the importance of this technology, with the pharmaceutical segment accounting for a dominant 29.8% share [33]. A key trend is the move towards more specialized and customized columns for niche applications, including biopharmaceutical analysis and metabolomics [33]. This document synthesizes the most recent product information and technical data to serve as a practical guide for researchers aiming to enhance their analytical workflows.
Key Trends and Column Innovations in 2025
The landscape of small-molecule RPLC columns in 2025 is characterized by three dominant trends: the refinement of particle and hardware technology, the growing adoption of inert columns, and the expansion of chemistries offering orthogonal selectivity. These developments collectively enhance peak shapes, improve analyte recovery for metal-sensitive compounds, and provide scientists with a broader toolkit for method development [9].
Advances in Particle Technology
Manufacturers continue to innovate in particle design to boost column efficiency and peak capacity. Superficially porous particles (SPP), also known as fused-core or solid-core particles, remain at the forefront due to their ability to provide high efficiency with lower backpressure compared to fully porous particles. Simultaneously, monodisperse fully porous particles (MFPP) are being engineered for higher efficiency and improved performance in specific applications, such as oligonucleotide separation without ion-pairing reagents [9].
Table 1: New Small-Molecule RPLC Columns for Alternative Selectivity (2025)
| Product Name | Manufacturer | Stationary Phase | Particle Technology | Key Features and Applications |
|---|---|---|---|---|
| Halo 90 Å PCS Phenyl-Hexyl [9] | Advanced Materials Technology | Phenyl-Hexyl | Superficially Porous | Enhanced peak shape for basic compounds; alternative selectivity to C18 via π-π interactions; optimized for MS. |
| Aurashell Biphenyl [9] | Horizon Chromatography | Biphenyl | Superficially Porous | Utilizes hydrophobic, π-π, and dipole interactions; suited for metabolomics and isomer separations; 100% aqueous compatible. |
| Evosphere C18/AR [9] | Fortis Technologies Ltd. | C18 and Aromatic ligands | Monodisperse Fully Porous | Designed for oligonucleotide separation without ion-pairing reagents; available in various particle sizes. |
| SunBridge C18 [9] | ChromaNik Technologies Inc. | C18 | Fully Porous (5 µm) | High pH stability (pH 1-12); designed for general-purpose use with a broad application range. |
| Raptor C8 LC Columns [9] | Restek Corporation | C8 (Octylsilane) | Superficially Porous (2.7 µm) | Faster analysis times with selectivity similar to C18; suitable for a wide range of acidic to slightly basic compounds. |
The Rise of Bio-inert and Inert Columns
A persistent trend is the increasing availability of columns with inert hardware, designed to minimize surface interactions with analytes that are sensitive to metal surfaces, such as phosphorylated compounds, chelating molecules, and certain pharmaceuticals [9]. This is achieved through various column hardware passivation techniques or the use of polyether ether ketone (PEEK) liners. The primary benefit is enhanced peak shape and improved analyte recovery, which is crucial for accurate quantification in bioanalytical and pharmaceutical workflows [9]. This trend aligns with the broader industry focus on "biocompatible" systems for analyzing biomolecules.
Table 2: New Inert RPLC Columns and Guards (2025)
| Product Name | Manufacturer | Stationary Phase | Key Feature | Target Application |
|---|---|---|---|---|
| Halo Inert [9] | Advanced Materials Technology | Not Specified (RPLC) | Passivated hardware creating a metal-free barrier | Phosphorylated compounds and metal-sensitive analytes. |
| Evosphere Max [9] | Fortis Technologies Ltd. | Not Specified | Inert hardware with monodisperse porous silica | Enhanced peptide recovery and sensitivity. |
| Restek Inert HPLC Columns [9] | Restek Corporation | Polar-embedded alkyl (L68) and C18 (L1) | Inert hardware | Chelating PFAS and pesticide compounds. |
| Raptor Inert HPLC Columns [9] | Restek Corporation | HILIC-Si, FluoroPhenyl, Polar X | Superficially porous particles with inert hardware | Metal-sensitive polar compounds. |
| Force/Raptor Inert Guard Cartridges [9] | Restek Corporation | Biphenyl, C18, and others | Inert hardware in guard format | Protecting inert analytical columns; improving response for metal-sensitive compounds. |
Expansion of Commercially Available Capillary-Scale Columns
The adoption of capillary-scale LC (columns with inner diameters of 0.075–0.50 mm) is accelerating, particularly in 'omics' fields and other applications with limited sample availability [34]. Recent advancements have expanded the commercial availability of these systems and their corresponding columns. The benefits are substantial: increased electrospray ionization mass spectrometry (ESI-MS) sensitivity, dramatic reductions in solvent consumption, and the ability to utilize non-traditional column formats like pillar arrays [34]. Vendors are now offering a wider range of capillary columns in various lengths, inner diameters, and chemistries, making method translation from analytical-scale more accessible.
The Scientist's Toolkit: Essential Research Reagent Solutions
Successful method development and implementation rely on a suite of essential materials. The following table details key solutions for working with the latest RPLC columns.
Table 3: Essential Research Reagent Solutions for Modern RPLC
| Item | Function/Description | Application Note |
|---|---|---|
| Advanced Inert Guard Columns [9] | Protect expensive analytical columns from particulates and irreversibly adsorbed compounds; specifically designed with inert hardware to match the performance of new analytical columns. | Essential for extending column lifetime, especially when analyzing complex biological or environmental matrices. |
| Mass Spectrometry-Compatible Mobile Phase Additives [9] | Low ionic strength volatile acids (e.g., formic acid) and buffers (e.g., ammonium formate) that do not suppress ionization or cause source fouling in MS detection. | Critical for achieving high sensitivity in LC-MS workflows. Many 2025 columns are optimized for these conditions. |
| Wide pH Range Buffers [9] | Mobile phase buffers that allow operation across a wide pH range (e.g., pH 2-12) to leverage the stability of modern hybrid and advanced silica particles. | Enables fine-tuning of selectivity for ionizable compounds, a key strategy in method development. |
| Specialized Solvents for HILIC | High-purity acetonitrile, water, and volatile salts for hydrophilic interaction liquid chromatography, a complementary technique to RPLC for polar analytes. | Used with HILIC phases (available in many 2025 product lines) to retain and separate highly polar compounds not retained in RPLC [35]. |
| Column Performance Test Mixtures | Standardized mixtures of compounds with known properties (e.g., acids, bases, neutrals) for evaluating column efficiency, peak asymmetry, and retention. | Used for initial column qualification and for periodic monitoring of column performance over its lifetime. |
Experimental Protocol: A Systematic Approach to Column Screening and Selectivity Evaluation
This protocol provides a detailed methodology for evaluating the performance of new 2025 RPLC columns for separating a mixture of small-molecule pharmaceutical compounds, including acidic, basic, and neutral analytes.
Materials and Equipment
- HPLC/UHPLC System: Capable of handling pressures up to 1000 bar and generating gradient mobile phases. Should include a diode-array detector (DAD) or similar.
- Columns to be Evaluated: A selection of at least 3-4 columns from Table 1 (e.g., Halo Phenyl-Hexyl, Aurashell Biphenyl, a C18 phase for reference, and an inert column if analyzing metal-sensitive compounds).
- Guard Columns: Corresponding inert guard cartridges matching the analytical columns used [9].
- Mobile Phase Components: LC-MS grade water, acetonitrile, and methanol. Ammonium formate or ammonium acetate, formic acid, and phosphoric acid for buffer preparation.
- Analyte Standards: A mixture of proprietary pharmaceutical compounds or a standardized test mixture containing protonatable bases (e.g., amitriptyline), ionizable acids (e.g., naproxen), and neutral compounds (e.g., acetophenone).
Procedure
Step 1: Mobile Phase Preparation
- Prepare Mobile Phase A: 10 mM Ammonium Formate in water, pH adjusted to 3.0 with formic acid.
- Prepare Mobile Phase B: Acetonitrile.
- Filter all mobile phases through a 0.22 µm nylon or PVDF membrane and degas by sonication under vacuum or with continuous helium sparging.
Step 2: Instrument and Column Conditioning
- Install the first column and its corresponding guard cartridge according to manufacturer instructions.
- Set the column temperature to 30°C and the detection wavelength as appropriate for your analytes (e.g., 254 nm).
- Condition the column by pumping a sequence of solvents at a slow flow rate (e.g., 0.2 mL/min) as follows:
- 5 column volumes (CV) of 50:50 Acetonitrile/Water (no buffer)
- 10 CV of the initial gradient starting condition (e.g., 5% B in A)
- Hold at initial conditions until a stable baseline is achieved.
Step 3: Initial Gradient Scouting Run
- Perform an initial fast gradient to profile the column's performance.
- Gradient Program: 5% B to 95% B over 10 minutes.
- Hold: 95% B for 2 minutes.
- Equilibration: 5% B for 3 minutes.
- Flow Rate: As recommended for the column dimension (e.g., ~0.5 mL/min for a 4.6 mm i.d. column).
- Injection Volume: 1-5 µL of the standard mixture.
Step 4: Data Collection and Analysis
- For each column, record the chromatogram and calculate the following parameters for each peak in the standard mixture:
- Retention Factor (k)
- Peak Asymmetry (As)
- Theoretical Plates per Meter (N/m)
- Resolution (Rs) between the most critical pair of analytes.
Step 5: Selectivity Optimization
- Based on the initial results, select the two most promising columns showing different selectivity.
- For these columns, systematically optimize the gradient time (e.g., 5 to 20 minutes) and temperature (e.g., 30°C to 50°C) to improve resolution and/or reduce run time.
- If analytes are ionizable, consider adjusting the pH of Mobile Phase A within the column's specified operating range (e.g., pH 2.5 and 4.5) to fine-tune selectivity.
Step 6: Final Method Validation
- On the selected optimal column, perform a basic validation by injecting the standard mixture in triplicate to assess the method's precision (%RSD of retention time and peak area).
The logical workflow for this protocol, from preparation to data analysis, is outlined in the following diagram:
Data Analysis and Interpretation
The data collected from the experimental protocol should be systematically compared to guide column selection.
Table 4: Data Analysis Table for Column Performance Comparison
| Analyte / Parameter | Column A (e.g., C18) | Column B (e.g., Biphenyl) | Column C (e.g., Phenyl-Hexyl) | Acceptance Criteria |
|---|---|---|---|---|
| Theoretical Plates (N/m) | > 50,000 (for 5µm particles) | |||
| Peak Asymmetry (As) | 0.8 - 1.5 | |||
| Retention Factor (k) - Analyte 1 | 2 - 10 | |||
| k - Analyte 2 | 2 - 10 | |||
| Resolution (Rs) - Critical Pair | > 1.5 | |||
| %RSD Retention Time (n=3) | < 1.0% |
Interpretation Guide:
- Efficiency and Peak Shape: Columns with higher theoretical plates and peak asymmetry closer to 1.0 are generally preferred, indicating superior kinetic performance [9].
- Retention and Selectivity: Significant differences in retention factor (k) for specific analytes between a C18 column and an alternative phase (e.g., biphenyl) indicate different selectivity. This is often due to additional interactions like π-π bonding or dipole-dipole interactions [9]. A column that provides baseline resolution (Rs > 1.5) for the most challenging pair of analytes is a strong candidate.
- Precision: Low %RSD values indicate a robust method on the given column.
The 2025 market for small-molecule RPLC columns offers pharmaceutical scientists a powerful and expanding array of tools to solve challenging separation problems. The key trends—advanced particle technology, widespread availability of inert hardware, and diverse chemistries for alternative selectivity—provide unprecedented opportunities for method optimization. By adopting a systematic screening protocol as outlined in this application note, researchers can efficiently navigate these new options to develop robust, sensitive, and efficient LC methods that accelerate drug development and ensure product quality.
Developing Robust HPLC Methods: From Column Matching to Complex Separation Strategies
A Systematic Approach to Matching Column Chemistry with Analyte Properties
Within pharmaceutical research and development, High-Performance Liquid Chromatography (HPLC) serves as a cornerstone analytical technique for the separation, identification, and quantification of drug-related compounds. The heart of any HPLC system is the column, and its selection—specifically, the chemistry of the stationary phase—directly dictates the success of the separation [36]. A systematic approach to matching this column chemistry with the properties of the analyte is not merely a matter of convenience; it is fundamental to achieving the resolution, efficiency, and reproducibility required in pharmaceutical analysis, from quality control of active pharmaceutical ingredients (APIs) to impurity profiling and stability studies [37].
The modern chromatographer is faced with a "bewildering array of stationary-phase choices" [38]. This application note provides a structured framework to navigate this complexity, enabling scientists to make informed, rational decisions in HPLC column selection for pharmaceutical compounds.
Fundamental Principles of Analyte-Stationary Phase Interactions
Retention and separation in reversed-phase HPLC, the most common mode for pharmaceutical analysis, are governed by the equilibrium of the analyte between the mobile phase and the bonded stationary phase [38]. The primary molecular interactions influencing this equilibrium include:
- Dispersive (Hydrophobic) Interactions: These are the dominant retention mechanisms in reversed-phase separations, especially with alkyl ligands like C18 and C8. Retention increases with the hydrophobicity of the analyte [38].
- Charge Transfer (π–π) Interactions: These occur when the stationary phase or analyte contains aromatic rings. Phases like biphenyl or phenylhexyl can provide enhanced selectivity for planar compounds or those with unsaturated bonds through π–π interactions [9] [38].
- Dipole–Dipole and Hydrogen Bonding Interactions: These are critical for retaining polar compounds. Stationary phases with polar embedded groups or cyano ligands enhance this type of interaction, offering alternative selectivity for hydrophilic molecules [39] [38].
- Electrostatic Interactions: These occur between ionized sites on the analyte and charged sites on the stationary phase surface, such as residual silanol groups on silica-based particles. While often a source of peak tailing for basic compounds, this mechanism can be managed with inert or specially endcapped columns [9] [38].
A Systematic Framework for Column Selection
Navigating column selection systematically requires a sequence of logical decisions, from defining the analytical goal to fine-tuning the final method. The workflow below outlines this step-by-step process, which is detailed in the subsequent sections.
Step 1: Characterize Analyte Properties
The first step is a thorough analysis of the physicochemical properties of the target pharmaceutical compound(s).
- Polarity/Hydrophobicity: Determine the log P value or assess the functional groups. Polar compounds (e.g., metabolites, sugars) are poorly retained on standard C18 phases and may require polar-embedded, HILIC, or normal-phase methods [39] [40].
- Ionic Character (pKa): The acid-base character of the analyte dictates its state at a given mobile phase pH. Ionizable compounds require careful control of pH and may benefit from columns designed to mitigate undesirable interactions with residual silanols [39] [37].
- Molecular Size and Structure: The molecular weight guides the choice of pore size. For instance, a pore size of 120 Å is suitable for most small-molecule drugs (<2000 Da), while larger pores (e.g., 300 Å) are necessary for biomolecules like proteins and peptides [36] [41]. The presence of aromatic rings or chiral centers also influences phase selection.
Step 2: Select the Appropriate Chromatographic Mode
Based on the analyte properties, the most suitable chromatographic mode can be selected. Table 1 summarizes the primary modes and their typical pharmaceutical applications.
Table 1: Selection of HPLC Mode Based on Analyte Properties
| Mode | Stationary Phase Polarity | Mobile Phase Polarity | Elution Order | Ideal for Analyte Properties | Common Pharmaceutical Applications |
|---|---|---|---|---|---|
| Reversed-Phase (RPLC) [37] [40] | Non-polar (e.g., C18, C8) | Polar (Water/MeCN/MeOH) | More polar first, less polar last | Non-polar to moderately polar; hydrocarbon-soluble | API potency, impurity profiling, dissolution testing [37] |
| Normal-Phase (NPLC) [37] [40] | Polar (e.g., Silica, Diol, Amino) | Non-polar (Organic solvents) | Less polar first, more polar last | Polar; soluble in organic solvents | Separation of isomers, phospholipids |
| Hydrophilic Interaction (HILIC) [40] | Polar (e.g., Amide, Diol) | High Organic (>70% ACN) | More polar last, less polar first | Highly polar, hydrophilic | Polar metabolites, carbohydrates, aminoglycosides [40] |
| Ion-Exchange (IEX) [37] [40] | Charged (Cationic or Anionic) | Aqueous buffer (increasing ionic strength) | Based on charge strength | Charged molecules (proteins, nucleotides) | Purification of biopharmaceuticals (mAbs, oligonucleotides) [9] [40] |
| Size-Exclusion (SEC) [37] [40] | Inert porous matrix | Aqueous buffer | Larger first, smaller last | Biomolecules, polymers | Aggregate analysis of proteins, monoclonal antibodies [37] |
Step 3: Choose Stationary Phase Chemistry and Selectivity
Within the reversed-phase mode—the most prevalent in pharma—selecting the right ligand is crucial for achieving the required selectivity. Table 2 provides a guide to common reversed-phase stationary phases.
Table 2: Guide to Reversed-Phase Stationary Phases for Pharmaceutical Compounds
| Stationary Phase | Primary Interactions | Selectivity For | Typical Pharmaceutical Applications |
|---|---|---|---|
| C18 (Octadecyl) [39] [40] | Hydrophobic | Hydrophobic molecules; general-purpose workhorse | Potency assays, method development starting point [39] |
| C8 (Octyl) [9] [40] | Hydrophobic (less than C18) | Similar to C18 but with weaker retention; good for slightly polar molecules | Faster analysis than C18; slightly polar APIs [9] |
| Phenyl / Biphenyl [9] [40] | Hydrophobic, π-π | Compounds with aromatic rings; planar molecules | Separation of structural isomers; metabolomics [9] |
| Polar-Embedded (e.g., amide) [39] [40] | Hydrophobic, H-bonding | Polar and basic compounds; enhanced aqueous compatibility | Drug metabolites, polar active ingredients [39] |
| FluoroPhenyl [9] | Dipole-dipole, π-π | Unique selectivity for complex mixtures; polar compounds | Isomer separation; metal-sensitive analytes [9] |
| Cyano (CN) [40] [41] | Hydrophobic, dipole-dipole | Dual-use (reversed-phase and normal-phase); polar compounds | Scouting method development; moderate polarity analytes |
Special Consideration: Inert Columns for Metal-Sensitive Analytes Many pharmaceutical compounds, such as those containing phosphates, catechols, or hydroxamates, can chelate metal ions leached from standard stainless steel column hardware. This leads to peak tailing and poor recovery [9]. For such metal-sensitive analytes, columns with inert hardware are strongly recommended. These columns feature a metal-free flow path or passivated surfaces that prevent adsorption, thereby enhancing peak shape and analyte recovery [9].
Step 4: Define Column Dimensions and Physical Specifications
Once the chemistry is chosen, the physical parameters of the column must be selected to optimize efficiency, speed, and pressure.
- Particle Size: Smaller particles (e.g., 1.7–1.9 µm for UHPLC, 2.7–3.5 µm for HPLC) provide higher efficiency and resolution but generate higher backpressure. Larger particles (5 µm) operate at lower pressures and are more robust for contaminated samples [36] [41].
- Pore Size: As a rule, a pore size of 120 Å is ideal for small molecule pharmaceuticals (<2000 Da). For larger biomolecules, peptides, and oligonucleotides, a pore size of 200–300 Å or larger is necessary to allow full analyte access to the pore surface [36] [41].
- Column Dimensions: Shorter columns (e.g., 50–100 mm) packed with small particles enable fast, high-throughput analysis. Longer columns (150–250 mm) provide more theoretical plates for resolving complex mixtures [36] [41]. Narrower diameters (e.g., 2.1 mm) enhance mass sensitivity and reduce solvent consumption, while 4.6 mm remains a standard for robust methods.
Experimental Protocol: A Column Screening Strategy for Method Development
This protocol outlines a systematic screening approach to identify the optimal column and initial conditions for a new small-molecule pharmaceutical compound.
Research Reagent Solutions
Table 3: Essential Materials for Column Screening
| Reagent / Material | Function / Specification | Notes |
|---|---|---|
| HPLC/UHPLC System | Instrument capable of handling pressures up to 1000 bar (for UHPLC) and with a well-defined low dwell volume. | [39] |
| Column Oven | For maintaining stable temperature (e.g., 30–40°C). | |
| Modular Column Screening Kit | A set of 3-5 columns (e.g., 50 mm or 100 mm length) with orthogonal chemistries. | Recommended set: C18, Polar-embedded C18, Biphenyl, HILIC, Cyano [39]. |
| Guard Columns | Small cartridges matching the chemistry of each analytical column. | Protects expensive analytical columns from particulates and irreversibly absorbing matrix components [9] [39]. |
| HPLC-Grade Water | Polar solvent for mobile phase. | Use high-purity water from a reliable supplier. |
| HPLC-Grade Acetonitrile & Methanol | Organic modifiers for mobile phase. | |
| Ammonium Formate / Acetate | Volatile buffers for mass spectrometry compatibility. | Prepare 10–20 mM concentration, pH adjusted with formic/acetic acid. |
| Ammonium Bicarbonate | Volatile buffer for neutral to basic pH range. | |
| Trifluoroacetic Acid (TFA) | Ion-pairing agent and pH modifier for UV detection. | Can suppress MS signal. |
| Standard/Reference Solution | A solution containing the target analyte and known impurities/degradants. | Used to evaluate column performance. |
Detailed Procedure
Sample and Mobile Phase Preparation:
- Prepare a stock solution of the analyte in a suitable solvent (often the starting mobile phase).
- Prepare mobile phase A (aqueous buffer) and B (organic modifier, typically acetonitrile). Filter all mobile phases through a 0.22 µm or 0.45 µm membrane and degas.
Initial Scouting Run:
- Install the first column (e.g., a traditional C18) and its corresponding guard cartridge.
- Set the column temperature to a constant value (e.g., 35°C).
- Use a generic gradient, for example: 5–95% B over 10–15 minutes, with a flow rate appropriate for the column dimension.
- Inject the standard solution and record the chromatogram.
Evaluation of Initial Run:
- Assess the chromatogram for key parameters:
- Retention: Is the analyte retained (retention factor, k > 2)?
- Peak Shape: Is the peak symmetrical (asymmetry factor close to 1.0), or is there tailing?
- Resolution: Are all critical peak pairs (e.g., analyte and impurity) baseline resolved (resolution, Rs > 2.0)?
- Assess the chromatogram for key parameters:
Systematic Screening:
- Repeat steps 2 and 3 for each column in the screening kit using the same initial gradient conditions. This allows for a direct comparison of selectivity and retention provided by the different stationary phases.
Data Analysis and Selection:
- Compare the chromatograms from all columns. The goal is to identify the column that provides the best resolution of critical pairs and the most symmetrical peaks in the shortest runtime.
- If no single column provides adequate resolution, consider the peak patterns. A significant shift in elution order between two columns (e.g., C18 vs. Biphenyl) indicates orthogonality and suggests that a combination of these chemistries might be powerful for the final method or for further impurity identification.
Mobile Phase Optimization:
- Once a lead column is identified, fine-tune the separation by optimizing the gradient profile (slope, initial and final %B), temperature, and pH of the mobile phase. A pH study (e.g., pH 3, 5, and 7) can be highly effective for ionizable compounds.
Column Maintenance and Longevity
Proper column care is essential for reproducible results and cost-effectiveness.
- Always use a guard column to protect the analytical column from sample matrix components [39].
- Filter samples before injection to remove particulates that can clog the column frit [39].
- Adhere to the manufacturer's recommended pH and temperature limits to prevent stationary phase degradation [36].
- Flush the column regularly according to the manufacturer's instructions and store it in an appropriate solvent (e.g., high organic content for reversed-phase columns, without buffers) [36].
Selecting the optimal HPLC column is a scientific exercise that moves beyond trial and error. By systematically characterizing the analyte and understanding the fundamental interactions offered by different stationary phases, pharmaceutical scientists can make rational, informed choices. This structured approach, beginning with a defined analytical goal and progressing through a screening and optimization protocol, streamlines method development, enhances chromatographic performance, and ultimately delivers reliable, reproducible data that accelerates drug development and ensures product quality.
Within the context of high-performance liquid chromatography (HPLC) column selection for pharmaceutical compound separation, method optimization is a critical step for achieving robust, reproducible, and high-resolution results. The heart of a liquid chromatograph is the column, but the separation process is governed by the intricate interplay between the stationary phase and the mobile phase [42]. This application note provides detailed protocols for optimizing key methodological parameters—mobile phase composition, pH, temperature, and gradient programming—to support researchers and drug development professionals in accelerating method development and ensuring regulatory compliance.
Core Optimization Parameters
Mobile Phase Composition and pH
The mobile phase is the liquid solvent or mixture that carries the sample through the chromatographic column. Its composition and pH are primary levers for controlling retention, selectivity, and peak shape [43]. In reversed-phase chromatography, which dominates pharmaceutical analysis, the key considerations are the organic solvent choice, the aqueous phase modifiers, and the pH which controls the ionization state of analytes [42].
Table 1: Common Mobile Phase Organic Solvents in Reversed-Phase HPLC
| Solvent | Eluotropic Strength | Viscosity (cP) | UV Cutoff (approx.) | Key Characteristics |
|---|---|---|---|---|
| Acetonitrile | Medium | 0.37 | 190 nm | Low viscosity, high efficiency, aprotic (proton acceptor) [42] |
| Methanol | Weaker | 0.55 | 210 nm | Protic (proton donor/acceptor), higher viscosity in water mixtures [42] |
| Tetrahydrofuran | Stronger | - | - | Strong eluotropic and solubilizing power; peroxide formation risks [42] |
Table 2: Common Aqueous Phase Additives and Buffers
| Additive/Buffer | pKa | Useful pH Range | UV Transparency | MS Compatibility | Typical Use Cases |
|---|---|---|---|---|---|
| Trifluoroacetic Acid (TFA) | ~2.1 (0.1%) | 1.5 - 2.5 | Good at low wavelength | Moderate (can cause ion suppression) | Peptides, proteins; excellent peak shape for basics [42] |
| Formic Acid | 3.75 | 2.8 - 4.0 | Good down to ~215 nm | Excellent | Standard for LC-MS applications [42] |
| Acetic Acid | 4.76 | 3.8 - 5.2 | Good down to ~210 nm | Excellent | LC-MS applications requiring higher pH [42] |
| Ammonium Acetate | 4.76 / 9.25 | 3.8 - 5.2 / 8.3 - 9.3 | Good | Excellent | Versatile volatile buffer for LC-MS [42] |
| Ammonium Formate | 3.74 | 2.8 - 3.8 | Good | Excellent | Volatile buffer for low pH LC-MS [42] |
| Phosphate Buffer | 2.1, 7.2, 12.3 | ~2, ~7, ~12 | Transparent to ~200 nm | Not compatible | High-precision QC methods with UV detection [42] |
Temperature and Gradient Programming
Column temperature and gradient profile are powerful tools for optimizing resolution and analysis time. Temperature affects retention, efficiency, and selectivity by altering the kinetics and thermodynamics of analyte interactions with the stationary phase [8]. Gradient elution, where the mobile phase composition is varied over time, is essential for separating complex mixtures with a wide range of analyte polarities [43].
Table 3: Optimization Parameters and Their Effects
| Parameter | Primary Effect | Typical Optimization Range | Considerations |
|---|---|---|---|
| Temperature | Retention, efficiency, selectivity | 30°C - 60°C | Higher temperatures reduce backpressure and viscosity; can degrade thermally labile analytes [8]. |
| Initial %B | Retention of early eluters | 5% - 20% | Set to weakly retain the most polar analyte [8]. |
| Gradient Time (tG) | Overall resolution and speed | 10 - 60 minutes | Longer gradients improve resolution but increase analysis time [8]. |
| Gradient Slope | Resolution per unit time | Varies with tG and Δ%B | Steeper slopes speed up analysis but may compromise resolution [8]. |
| Flow Rate | Analysis time, backpressure, efficiency | 0.5 - 2.0 mL/min (for 4.6 mm ID) | Optimize with column hardware and particle size [43]. |
Experimental Protocols
Systematic Method Scouting and Optimization Workflow
A structured approach to method development significantly reduces the time from initial scouting to a validated method.
Protocol 1: Initial Method Scouting with Column and pH Screening
Objective: To identify a promising starting point for separation by evaluating different column chemistries and mobile phase pH conditions [44].
Materials:
- HPLC/UHPLC system with autosampler, column oven, and DAD or MS detector
- Automated column switching module (e.g., Viper Method Scouting Kit) or manual column fittings
- Columns: Select 3-4 columns with diverse selectivity (e.g., C18, phenyl-hexyl, polar-embedded) [9] [45]
- Mobile Phase A (aqueous): Prepare 0.1% v/v formic acid in water (pH ~2.8) and 10 mM ammonium acetate in water (pH ~5.0)
- Mobile Phase B (organic): Acetonitrile and Methanol
- Standard and sample solutions
Procedure:
- System Setup: Install the column switching module or manually mount the first column. Equilibrate the system with 95% Mobile Phase A and 5% Mobile Phase B (acetonitrile) at a flow rate of 1.0 mL/min (or appropriate for column dimension).
- Scouting Gradient: Program a linear gradient from 5% B to 95% B over 20 minutes. Hold at 95% B for 3 minutes, then re-equilibrate at 5% B for 5 minutes.
- Automated Sequence: Using automated solvent and column switching, run the standard mixture on each column with both pH conditions. If automated systems are unavailable, perform these steps manually [44].
- Data Analysis: Evaluate chromatograms based on peak capacity, resolution of critical pairs, and peak symmetry. Select the column and pH condition that provides the best overall separation for further optimization.
Protocol 2: Fine-Tuning Gradient Profile and Temperature
Objective: To optimize the gradient slope and temperature to achieve baseline resolution with a minimal analysis time.
Materials:
- HPLC system
- Selected column and mobile phase from Protocol 1
Procedure:
- Gradient Steepness Optimization:
- Based on the initial scouting run, note the approximate %B at which the first peak elutes (%B
start) and the last peak elutes (%Bend). - Set the initial %B to %B
start- 5%. - Program a gradient to %B
end+ 10% over 10, 20, and 40 minutes. - Inject the sample for each gradient time and evaluate the resolution of the critical pair. Select the shortest gradient time that still provides acceptable resolution (R
s> 1.5) [8].
- Based on the initial scouting run, note the approximate %B at which the first peak elutes (%B
- Temperature Optimization:
- Using the optimized gradient, perform a sequence of injections at 30°C, 40°C, 50°C, and 60°C.
- Record the retention times and resolution of the critical pair(s).
- Plot resolution vs. temperature. Select the temperature that provides maximum resolution or a robust compromise between resolution and analysis speed.
The Scientist's Toolkit: Essential Research Reagents and Materials
Table 4: Key Reagents and Materials for HPLC Method Optimization
| Item | Function/Application | Examples & Notes |
|---|---|---|
| HPLC Columns (Diverse Chemistries) | Provides the stationary phase for separation; different chemistries offer unique selectivity. | C18: Industry standard [46]. Phenyl-Hexyl: For π-π interactions with aromatics [9]. HILIC: For highly polar compounds [45]. Inert Hardware: For metal-sensitive analytes [9]. |
| HPLC-Grade Water | The weak solvent in reversed-phase mobile phases; dissolves polar compounds. | Must be ultra-pure (18.2 MΩ·cm) and free of organics and particles. |
| HPLC-Grade Organic Solvents | The strong solvent(s) in reversed-phase mobile phases. | Acetonitrile, Methanol. Low UV absorbance and high purity are critical. |
| Mobile Phase Additives | Control pH and ionic strength to manipulate retention and peak shape of ionizable analytes. | Volatile Acids/Bases: Formic acid, acetic acid, ammonium hydroxide (for LC-MS) [42]. Buffers: Phosphate, ammonium formate/acetate. Ion-Pairing Reagents: e.g., TFA, heptafluorobutyric acid [43]. |
| Column Guard Cartridge | Protects the analytical column from particulates and contaminants, extending its lifetime. | Should contain the same packing material as the analytical column [9]. |
| Standard Mixture (Analyte-Specific) | Used for system suitability testing and to monitor method performance during optimization. | Should include the API and known impurities/degradants if possible. |
| pH Meter | Accurately measures the pH of aqueous mobile phase components. | Critical: pH must be measured before adding the organic solvent [43]. |
| Syringe Filters | Removes particulates from sample solutions to prevent column clogging. | 0.45 µm or 0.22 µm, compatible with the sample solvent. |
Optimizing the mobile phase composition, pH, temperature, and gradient program is a multivariate process that is essential for developing a robust and reliable HPLC method for pharmaceutical analysis. By following a systematic, QbD-based workflow—beginning with broad scouting of columns and pH, followed by precise fine-tuning of gradient and temperature parameters—researchers can efficiently navigate the complex interplay of these variables. The protocols and data presented herein provide a clear roadmap for achieving optimal separations, which is fundamental to the success of drug development, quality control, and regulatory submission.
The separation of complex biomolecules—namely oligonucleotides, peptides, and proteins—represents a critical challenge in pharmaceutical research and development. High-Performance Liquid Chromatography (HPLC) has emerged as the cornerstone technique for these separations, offering the robustness, resolution, and reproducibility required for analytical and preparative applications. HPLC's superiority in pharmaceutical analysis stems from its versatility in mobile and stationary phase selection, enabling researchers to fine-tune separations based on the unique physicochemical properties of each biomolecule class [47]. The technique has nearly completely replaced alternative chromatographic methods in many pharmaceutical laboratories, becoming indispensable for tasks ranging from quality control and purity assessment to therapeutic drug monitoring [47] [48].
The fundamental principle underlying HPLC separation involves the differential partitioning of analytes between a stationary phase (column packing material) and a mobile phase (liquid solvent system). As each component in the sample interacts differently with the adsorbent material, they migrate through the column at different velocities, ultimately eluting at characteristic retention times [49]. This process enables the resolution of complex biomolecular mixtures with high precision and accuracy. For pharmaceutical scientists, the strategic selection of appropriate HPLC columns and methods is paramount to obtaining reliable data that informs drug development decisions and ensures product quality [50].
This application note provides a comprehensive framework for HPLC column selection and method development specifically tailored to the separation of oligonucleotides, peptides, and proteins. By synthesizing current column technologies, established protocols, and practical considerations, we aim to equip researchers with the knowledge needed to optimize their biomolecular separations within the context of pharmaceutical compound research.
Column Selection Guide
The selection of an appropriate HPLC column is the most critical factor in achieving successful separation of biomolecules. Different classes of biomolecules require distinct column chemistries and characteristics based on their size, charge, hydrophobicity, and structural complexity. The following section provides detailed guidance on column selection for oligonucleotides, peptides, and proteins, with summarized recommendations presented in Table 1.
Table 1: HPLC Column Recommendations for Biomolecule Separation
| Biomolecule Class | Recommended Column Type | Key Characteristics | Separation Mechanism | Common Applications |
|---|---|---|---|---|
| Oligonucleotides | Anion-Exchange (DNAPac) | Polymer-based, pH-stable | Separation by charge/size | n, n-1, n+1 impurity analysis |
| Ion-Pair Reversed Phase (DNAPac RP) | Compatible with LC-MS/MS | Hydrophobicity & ion pairing | Purity analysis, LC-MS methods | |
| Monolithic Anion-Exchange (DNASwift) | High loadability | Size and charge | Preparative purification | |
| Peptides | Reversed Phase (C18) | Small pore size (≤300Å) | Hydrophobicity | Peptide mapping, purity |
| Reversed Phase (C4/C8) | Wide-pore (300Å) | Hydrophobicity | Synthetic peptide analysis | |
| Proteins | Size Exclusion (SEC) | Porous polymer or silica | Molecular size | Aggregate quantification |
| Reversed Phase (C4/C8) | Wide-pore (300Å) | Hydrophobicity | Intact protein analysis | |
| Ion Exchange | Polymer or silica-based | Surface charge | Charge variant analysis | |
| Hydrophobic Interaction | Mild elution conditions | Surface hydrophobicity | Native protein separation |
Oligonucleotide Columns
Oligonucleotide separation presents unique challenges due to the similarity of closely-related impurities (such as n-1 and n+1 species) and the polyanionic nature of these molecules. Anion-exchange chromatography is particularly powerful for oligonucleotide analysis, with columns like the Thermo Scientific DNAPac PA200 series providing outstanding separations based on differences in charge and size [51]. These columns excel at resolving failure sequences from the full-length product, a critical quality attribute for therapeutic oligonucleotides. For applications requiring mass spectrometry compatibility, ion-pair reversed-phase columns such as the DNAPac RP series offer an orthogonal separation mechanism based on hydrophobicity [51]. The DNAPac RP columns utilize polymer chemistry compatible with LC-MS/MS systems, enabling both purity assessment and structural confirmation. For preparative applications, monolithic columns like the DNASwift series provide high loadability with slightly compromised resolution but significantly faster flow rates [51].
Peptide Columns
Peptide separations predominantly employ reversed-phase chromatography on C18-bonded silica columns. The selection of appropriate pore size is crucial—standard peptides typically require 100-130Å pores, while larger peptides may need 300Å pores for optimal access and resolution [52]. The separation mechanism relies on the interaction between hydrophobic amino acid residues and the non-polar stationary phase, with elution typically achieved using acetonitrile or methanol gradients in aqueous mobile phases often modified with ion-pairing agents such as trifluoroacetic acid (TFA). For more hydrophobic peptides or those containing aromatic residues, C8 or C4 columns may provide better recovery and peak shape. The high efficiency of modern peptide columns (with 1.5-5μm particles) enables resolution of complex peptide mixtures, such as those generated by enzymatic digestion of therapeutic proteins [52].
Protein Columns
Protein separation requires consideration of both structural integrity and analytical goal. Size exclusion chromatography (SEC) columns are the gold standard for monitoring protein aggregates and fragments, operating on the steric-exclusion principle where larger species elute faster than smaller ones [53]. SEC is particularly valuable for quantifying aggregates of monoclonal antibodies (mAbs) and adeno-associated viruses (AAVs), critical quality attributes for these biologics [53]. For intact protein analysis, wide-pore reversed-phase columns (C4 or C8 with 300Å pores) accommodate the large hydrodynamic radius of proteins while providing separation based on surface hydrophobicity [50]. When maintaining native structure is essential, hydrophobic interaction chromatography (HIC) or ion-exchange chromatography offer milder conditions that preserve protein function [50]. The selection between these modalities depends on whether the goal is purity assessment (reversed-phase), aggregate quantification (SEC), charge variant analysis (ion-exchange), or native protein purification (HIC).
Experimental Protocols
Oligonucleotide Analysis by Anion-Exchange Chromatography
Principle: This method separates oligonucleotides based on differences in charge and size using a strong anion-exchange mechanism. It is particularly effective for resolving failure sequences (n-1, n+1) from the full-length product [51].
Table 2: HPLC Conditions for Oligonucleotide Analysis
| Parameter | Specification |
|---|---|
| Column | DNAPac PA200 or PA200RS (4 × 250 mm) |
| Mobile Phase A | 25 mM Tris-HCl, pH 8.0 |
| Mobile Phase B | 25 mM Tris-HCl, pH 8.0 + 1.0 M NaCl |
| Gradient | 20-60% B over 25 min |
| Flow Rate | 1.0 mL/min |
| Temperature | 50°C |
| Detection | UV at 260 nm |
| Injection Volume | 10 μL |
Sample Preparation: Dissolve oligonucleotide samples in nuclease-free water or elution buffer to a concentration of 0.5-1.0 mg/mL. Filter through a 0.22 μm membrane before injection.
Procedure:
- Equilibrate the column with 20% Mobile Phase B for at least 10 column volumes.
- Perform blank injection to confirm system cleanliness.
- Inject oligonucleotide standard to verify system performance.
- Inject samples and monitor elution at 260 nm.
- Regenerate column with 100% Mobile Phase B for 5 minutes.
- Re-equilibrate with 20% Mobile Phase B for 10 minutes before next injection.
Critical Notes: Maintain pH consistency between mobile phase A and B. Column temperature control at 50°C enhances resolution and reproducibility. For long-term storage, purge with 20% ethanol.
Peptide Separation by Reversed-Phase Chromatography
Principle: Peptides are separated based on hydrophobicity differences using a water-acetonitrile gradient with ion-pairing modifiers. This method is widely applied in peptide mapping and purity analysis [52].
Table 3: HPLC Conditions for Peptide Analysis
| Parameter | Specification |
|---|---|
| Column | C18 (150 × 4.6 mm, 3.5 μm, 300Å) |
| Mobile Phase A | 0.1% Trifluoroacetic acid in water |
| Mobile Phase B | 0.1% Trifluoroacetic acid in acetonitrile |
| Gradient | 5-60% B over 45 min |
| Flow Rate | 1.0 mL/min |
| Temperature | 35°C |
| Detection | UV at 214 nm |
| Injection Volume | 20 μL |
Sample Preparation: Dissolve peptide samples in 0.1% TFA/water at 0.1-1.0 mg/mL. Centrifuge at 13,000 rpm for 10 minutes to remove particulate matter.
Procedure:
- Equilibrate column with 5% Mobile Phase B for 5 column volumes.
- Establish stable baseline before first injection.
- Inject peptide standard mixture to confirm retention time reproducibility.
- Inject samples and monitor at 214 nm for peptide bond detection.
- After run, wash column with 95% Mobile Phase B for 10 minutes.
- Re-equilibrate with 5% Mobile Phase B for 15 minutes.
Critical Notes: TFA concentration significantly affects peak shape—maintain consistent preparation. For MS compatibility, formic acid (0.1%) can substitute TFA with potential resolution compromise. Column temperature control minimizes retention time drift.
Protein Analysis by Size Exclusion Chromatography
Principle: SEC separates proteins based on hydrodynamic volume, with larger molecules eluting before smaller ones. This non-denaturing method is ideal for aggregate and fragment analysis [53].
Table 4: HPLC Conditions for Protein SEC Analysis
| Parameter | Specification |
|---|---|
| Column | SEC column (e.g., Thermo Scientific SEC-3, 300 × 7.8 mm) |
| Mobile Phase | 100 mM Sodium phosphate, 150 mM NaCl, pH 7.0 |
| Gradient | Isocratic |
| Flow Rate | 1.0 mL/min |
| Temperature | 25°C |
| Detection | UV at 280 nm |
| Injection Volume | 50 μL |
Sample Preparation: Dialyze or dilute protein samples into mobile phase to match buffer composition. Centrifuge at 14,000 × g for 10 minutes to remove aggregates. Final concentration should be 0.5-2.0 mg/mL.
Procedure:
- Equilibrate system with mobile phase until stable baseline achieved (≥5 column volumes).
- Inject protein standard mixture to confirm separation range and resolution.
- Inject blank to exclude system peaks.
- Inject samples and monitor elution at 280 nm.
- Maintain isocratic conditions throughout analysis.
Critical Notes: Mobile phase composition significantly impacts separation—maintain precise pH and ionic strength. Avoid overloading to prevent non-size exclusion effects. For monoclonal antibodies, calibrate with intact mAb (monomer), dimer, and higher aggregates if available.
Method Development Workflow
Systematic method development is essential for optimizing HPLC separations of biomolecules. The following workflow provides a structured approach to method development, from initial selection to final validation, specifically tailored for pharmaceutical applications.
Diagram 1: HPLC Method Development Workflow. This systematic approach ensures robust method development for biomolecule separation, proceeding through literature review, condition establishment, selectivity optimization, system refinement, and final validation.
Step-by-Step Development Strategy
Literature Review and Method Selection: Begin by consulting available literature for similar separations to establish starting points [52]. For oligonucleotides, prioritize anion-exchange or ion-pair reversed-phase methods [51]. For peptides and proteins, consider reversed-phase, SEC, or IEX based on analytical goals [50] [53]. Select detection method based on analyte properties—UV for most applications, with fluorescence or MS for enhanced sensitivity or specificity [47].
Selection of Initial Conditions: Choose column dimensions (typically 10-15 cm for initial scouting) and mobile phase composition. For reversed-phase separations, begin with binary gradients (e.g., water-acetonitrile with 0.1% TFA). Adjust solvent strength to achieve capacity factors (k') between 0.5-15 for all analytes [52]. For complex samples with wide retention ranges, implement gradient elution from the outset.
Selectivity Optimization: Fine-tune peak spacing by modifying parameters with the greatest impact on separation [52]. For reversed-phase, vary organic modifier type (acetonitrile vs. methanol), pH (2.0-8.0), buffer concentration, or ion-pair reagent concentration. For ion-exchange, optimize salt gradient slope and pH. Categorize analytes by type (acidic, basic, neutral) to guide parameter selection [52].
System Parameter Optimization: After achieving adequate selectivity, optimize practical parameters including column dimensions, particle size (1.5-5μm), flow rate (0.5-2.0 mL/min), and temperature (25-60°C) to balance resolution and analysis time [52]. Smaller particles and longer columns enhance resolution but increase backpressure.
Method Validation: For pharmaceutical applications, rigorously validate methods according to ICH guidelines [52]. Assess accuracy, precision (repeatability and intermediate precision), specificity, detection limit, quantitation limit, linearity, range, and robustness. Document all validation parameters in a formal protocol before implementation in quality control environments [52].
The Scientist's Toolkit: Essential Research Reagents and Materials
Successful HPLC analysis of biomolecules requires not only appropriate instrumentation but also carefully selected reagents and materials. The following table details essential components for pharmaceutical HPLC applications.
Table 5: Essential Research Reagents and Materials for Biomolecule HPLC
| Category | Item | Specification | Function/Application |
|---|---|---|---|
| Mobile Phase Additives | Trifluoroacetic acid (TFA) | HPLC grade, ≥99.5% | Ion-pairing agent for peptide/protein RP-HPLC |
| Formic acid | LC-MS grade, ≥99.0% | Mobile phase modifier for MS-compatible methods | |
| Ammonium acetate | HPLC grade, ≥99.0% | Volatile buffer for LC-MS applications | |
| Tris(hydroxymethyl)aminomethane | Molecular biology grade | Buffer component for anion-exchange chromatography | |
| Organic Solvents | Acetonitrile | HPLC gradient grade, ≥99.9% | Primary organic modifier for reversed-phase HPLC |
| Methanol | HPLC grade, ≥99.9% | Alternative organic modifier | |
| Aqueous Solvents | Water | LC-MS grade, 18.2 MΩ·cm | Mobile phase component, sample preparation |
| Column Care | Sodium hydroxide | HPLC grade, 0.1-1.0 M solutions | Column cleaning and regeneration |
| Ethanol | HPLC grade, 20% solution | Column storage medium | |
| Sample Preparation | Solid-phase extraction columns | C18, polymer-based, or mixed-mode | Sample clean-up and concentration |
| Syringe filters | 0.22 μm, PVDF or nylon | Sample filtration prior to injection | |
| Reference Standards | Pharmacopoeial standards | USP, EP, or JP compliant | System suitability testing, quantification |
Advanced Applications in Pharmaceutical Research
Therapeutic Drug Monitoring
HPLC plays an increasingly vital role in therapeutic drug monitoring (TDM), where precise quantification of drug concentrations in biological matrices guides dosing regimens for medications with narrow therapeutic windows. Recent advancements include the development of relative molar sensitivity (RMS) techniques that enable accurate drug quantification without identical reference standards for each analyte [54]. This innovative approach calculates response ratios between analytes and non-analyte reference materials, facilitating the simultaneous measurement of multiple drugs such as anticonvulsants (carbamazepine, phenytoin, lamotrigine), antibiotics (meropenem, linezolid, vancomycin), and immunosuppressants (mycophenolic acid) in patient serum samples [54]. This methodology addresses the challenge of obtaining certified reference materials for all analytes while maintaining traceability to international standards.
Impurity and Aggregate Profiling
For biopharmaceuticals, comprehensive characterization of impurities and aggregates is mandatory for regulatory approval. Size exclusion chromatography remains the gold standard for quantifying protein aggregates, with modern SEC columns providing the resolution needed to distinguish monomers, dimers, and higher-order aggregates [53]. For oligonucleotide therapeutics, anion-exchange chromatography excels at resolving phosphorothioate diastereomers and failure sequences that impact drug efficacy and safety [51]. The pharmaceutical industry increasingly employs orthogonal separation methods—combining, for example, anion-exchange and ion-pair reversed-phase chromatography—to obtain comprehensive impurity profiles that single-method approaches might miss.
Method Validation in Regulated Environments
HPLC methods used in pharmaceutical development must undergo rigorous validation to meet regulatory requirements. The International Conference on Harmonisation (ICH) guidelines define key validation parameters including accuracy, precision, specificity, detection limit, quantitation limit, linearity, and range [52]. For stability-indicating methods, forced degradation studies demonstrate the method's ability to resolve active pharmaceutical ingredients from degradation products. Robustness testing evaluates method resilience to deliberate variations in operational parameters, establishing system suitability criteria for ongoing quality control [52]. Proper documentation throughout method development and validation is essential for regulatory submissions to agencies like the FDA and EMA.
Leveraging Multi-Dimensional LC (LC×LC) for Ultra-Complex Samples
Multi-dimensional liquid chromatography (LC×LC) represents a transformative advancement for separating ultra-complex samples that defy resolution by conventional one-dimensional LC. The fundamental power of LC×LC stems from its ability to combine two independent separation mechanisms, dramatically increasing peak capacity and resolving power. According to the fundamental law of dimensionality, the separation performance of a chromatographic system increases approximately with n^i, where n is the number of resolvable peaks and i represents the dimensionality [55]. This mathematical relationship explains why moving from 1D-LC to 2D-LC creates a multiplicative rather than additive increase in peak capacity, making it uniquely suited for challenging pharmaceutical applications such as impurity profiling, natural products analysis, biopharmaceutical characterization, and metabolomic studies.
The operational principle of LC×LC involves coupling two distinct separation columns through a specialized interface called a modulator. As fractions from the first dimension ([1]D) separation are sequentially transferred to the second dimension ([2]D) for further separation, the comprehensive two-dimensional data generated provides unprecedented resolution of complex mixtures. Modern implementations increasingly leverage ultra-high-pressure liquid chromatography (UHPLC) technology in both dimensions to enhance speed, efficiency, and sensitivity while maintaining full compatibility with mass spectrometric detection [55]. For pharmaceutical researchers, this technological synergy enables the detection and identification of low-abundance impurities, degradation products, and metabolites that would otherwise remain obscured in one-dimensional separations.
Recent Technological Advances in LC×LC
UHPLC Column Technology
The evolution of UHPLC column technology has been instrumental in advancing LC×LC capabilities. State-of-the-art UHPLC columns now predominantly feature 2.1 mm internal diameters packed with sub-2-μm particles, which have largely replaced the traditional 4.6 mm i.d. column format due to superior thermal management and efficiency characteristics [55]. The reduction in column diameter is particularly critical for UHPLC applications because it significantly mitigates the detrimental effects of viscous heating that occur at ultra-high pressure conditions. When operating at pressures up to 1500 bar, the narrower column format facilitates better heat dissipation through the column wall, minimizing radial temperature gradients that would otherwise cause parabolic flow profiles and compromise chromatographic efficiency [55].
Significant advances have also occurred in particle technology, with core-shell particles emerging as particularly attractive for UHPLC applications in LC×LC systems [55]. These particles feature a solid, impervious core surrounded by a thin porous shell, typically comprising about 70% of the total particle volume. This architecture provides several kinetic advantages: reduced eddy-dispersion (A-term) by up to 40%, lower resistance to mass transfer (C-term) by approximately 50%, and diminished longitudinal diffusion (B-term) contributions by up to 40% compared to fully porous particles [55]. While core-shell particles exhibit somewhat lower mass loadability and retention capacity than their fully porous counterparts, this limitation is relatively minor given their substantial efficiency benefits. Recent innovations have even introduced particles with graphite cores surrounded by diamond shells to further improve thermal stability under UHPLC conditions [55].
Table 1: Advanced UHPLC Column Technologies for LC×LC Applications
| Column Technology | Particle Characteristics | Key Advantages | Ideal LC×LC Application |
|---|---|---|---|
| Sub-2-μm Fully Porous | 1.5-1.9 μm fully porous silica | High surface area, excellent retention capacity | [2]D separations requiring maximum peak capacity |
| Core-Shell Particles | 1.3-2.7 μm with solid core | Superior efficiency, reduced band broadening | High-speed [2]D separations |
| Hybrid Technology | 1.7-1.8 μm bridged ethylene hybrid | Extended pH stability (pH 1-12), robust at high pressure | [1]D separations requiring ruggedness |
| Bioinert Materials | Polymer-based or metal-free hardware | Improved recovery for metal-sensitive analytes | Biomolecule separations (peptides, proteins) |
| HILIC Phases | Sub-2-μm or core-shell with polar groups | Orthogonal retention mechanism to RPLC | [1]D or [2]D for polar compounds |
Multi-Dimensional Instrumentation and Modulation
Contemporary LC×LC instrumentation has evolved significantly to address the technical challenges of coupling two separation dimensions while maintaining performance. Modern commercial systems feature refined interfaces for efficient fraction transfer between dimensions, with key advancements in injection technology, low-dispersion switching valves, and compatible flow path geometries [55]. These developments have lowered the barrier to implementation, making comprehensive 2D-LC more accessible to pharmaceutical laboratories.
A critical advance in MDLC technology involves sophisticated modulation approaches that control how effluent from the first dimension is transferred to the second. Current systems employ dual-loop interfaces that enable continuous operation by alternating between collection and injection cycles, with modern configurations minimizing band broadening and maintaining the separation fidelity achieved in the first dimension [55]. For optimal performance with UHPLC in the second dimension, modulation periods typically range from 15-60 seconds, requiring extremely fast secondary separations that leverage the full capabilities of sub-2-μm particle columns operated at their optimum flow rates [55].
Instrument diagnostics and smart system feedback represent another area of advancement, with modern platforms providing real-time monitoring of mobile phase usage, pressure spikes, and column performance [55]. These features are particularly valuable in LC×LC method development and transfer, where system robustness is paramount for reliable operation during extended analytical runs characteristic of comprehensive 2D-LC analyses.
Table 2: Commercial LC×LC Instrumentation Platforms and Key Features
| Instrument Platform | Pressure Limit | Key Features for LC×LC | Specialized Configurations |
|---|---|---|---|
| ACQUITY UPLC M-Class with 2D Technology | 1500 bar | Low-dispersion flow paths, active solvent pre-heater | HDX technology for protein conformation |
| 1290 Infinity II 2D-LC System | 1300 bar | Flexible 2D-LC configurations, high-speed samplers | Bio-inert flow path for biomolecules |
| Vanquish Online 2D-LC Systems | 1500 bar | Dual-gradient capabilities, active flow management | Integrated biocompatible systems |
| Nexera-e | 1300 bar | Multi-dimensional software, method transfer tools | Post-column analysis systems |
| ACQUITY Arc Multi-Dimensional LC | 900 bar | Bridges HPLC and UHPLC methods | APC for polymer characterization |
Method Development and Optimization Strategies
Multidimensional Modeling for Separation Challenges
Multidimensional modeling approaches have emerged as powerful tools for addressing the complex challenges inherent in LC×LC method development. These computational strategies help researchers navigate the expanded parameter space of two-dimensional separations while reducing laboratory experimentation time. One particularly effective approach implements first-principles modeling that correlates experimental parameters with separation responses, requiring only a limited number of initial experiments (typically two or three per factor) to calibrate a highly descriptive and predictive model [56]. Once calibrated, these models can accurately depict complete separation patterns across the entire operational design space, providing invaluable guidance for method optimization.
The most effective multidimensional models incorporate gradient time (tG) and temperature (T) as primary parameters, with three-dimensional extensions that include ternary organic composition (tC), pH, or additive concentration (aC) [56]. For a comprehensive tG-T-pH model, the experimental design expands to 2 × 2 × 3 = 12 input runs, which efficiently maps the separation landscape while maintaining practical laboratory workload [56]. These modeling approaches are particularly valuable for identifying Method Operable Design Regions (MODRs) where baseline separation (Rs,crit. ≥ 1.5) is consistently achieved, even when factors experience minor fluctuations during routine operation. This statistical approach to method development enhances robustness while ensuring critical peak pairs maintain resolution throughout the method lifecycle.
Column Selection and Orthogonality Assessment
Column selection represents one of the most critical decisions in LC×LC method development, as the effectiveness of the separation depends fundamentally on the orthogonality between the two separation mechanisms. In this context, orthogonality refers to the degree to which the separation mechanisms in each dimension are statistically independent, maximizing the utilization of the two-dimensional separation space. Recent research has introduced new metrics specifically designed for preliminary column selection in comprehensive 2D-LC, enabling more systematic approaches to achieving orthogonality [57].
The practical implementation of column selection strategies must balance the theoretical ideal of maximum orthogonality with practical considerations such as mobile phase compatibility and detection requirements. For pharmaceutical applications targeting small molecules, the most common and effective approach combines reversed-phase liquid chromatography (RPLC) in both dimensions using different selectivity stationary phases, often with different pH conditions [56]. This approach, termed selective comprehensive LC×LC (sLC×LC), provides sufficient orthogonality for many pharmaceutical compounds while maintaining full compatibility with mass spectrometric detection. Alternative approaches may combine HILIC (hydrophilic interaction liquid chromatography) with RPLC, or ion-exchange chromatography with RPLC, particularly for biological molecules such as peptides and proteins [56] [45].
Experimental Protocol: Comprehensive LC×LC Method Development
This protocol provides a systematic approach for developing a comprehensive LC×LC method for the analysis of complex pharmaceutical samples, such as impurity profiling or natural product extracts.
Initial Scouting and Column Screening
Sample Preparation: Prepare a representative sample solution containing target analytes and expected impurities in a solvent compatible with both dimensions (typically 10-50% weaker than the starting mobile phase of the first dimension). For small molecules, concentrations of 0.1-1.0 mg/mL are appropriate.
First Dimension Column Selection: Begin method development with a high-efficiency column in the first dimension. Recommended starting conditions:
- Column: 150-250 mm × 2.1-3.0 mm i.d. packed with 1.7-1.9 μm C18 or phenyl-hexyl stationary phase
- Temperature: 35-45°C
- Flow Rate: 0.1-0.3 mL/min (optimize for optimal linear velocity)
- Gradient: 5-95% organic modifier (acetonitrile or methanol) over 45-90 minutes with 5-10 mM ammonium formate or acetate buffer
- Injection Volume: 1-5 μL
Second Dimension Column Screening: Evaluate 3-4 different stationary phases for the second dimension that provide orthogonal selectivity to the first dimension:
- C18 with different bonding density or endcapping
- Phenyl-hexyl or biphenyl phase for π-π interactions
- F5 or pentafluorophenyl phase for mixed-mode interactions
- HILIC phase for highly polar compounds
Orthogonality Assessment: Perform first-dimension separation with full loop fraction collection every 30-60 seconds. Analyze each fraction on candidate second-dimension columns using a very fast gradient (0.5-2 minutes). Calculate practical orthogonality using the new metric described in [57].
Method Optimization Using Multidimensional Modeling
Experimental Design for Modeling: For the selected column combination, perform a limited calibration set based on a 2 × 2 × 3 design (12 experiments total) varying:
- Gradient time (tG): two levels (e.g., 30 and 60 minutes for [1]D; 1 and 2 minutes for [2]D)
- Temperature (T): two levels (e.g., 30 and 50°C)
- pH or organic modifier: three levels (e.g., pH 3, 5, 7 or 10/30/50% acetonitrile in modifier study)
Data Analysis and Modeling: Input retention data for critical peak pairs into modeling software to construct multidimensional resolution maps. Identify the Method Operable Design Region (MODR) where baseline resolution (Rs ≥ 1.5) is achieved for all critical pairs [56].
System Compatibility Optimization: Adjust modulation parameters including:
- Modulation time: 15-60 seconds (typically 3-4 modulations per [1]D peak)
- Loop volume: 10-100 μL (optimize to minimize dilution and maintain detection sensitivity)
- Flush volume: 100-150% of loop volume to ensure complete transfer
Method Validation and Robustness Testing
System Suitability: Establish system suitability criteria based on retention time stability (<2% RSD), peak area precision (<5% RSD), and resolution of critical pairs (Rs ≥ 1.5).
Robustness Testing: Deliberately vary method parameters within expected operational ranges (flow rate ±10%, temperature ±5°C, gradient time ±5%) to verify method robustness within the MODR.
Column Batch-to-Batch Reproducibility: Test identical columns from at least three different manufacturing batches using the established method conditions to ensure consistent performance across column lots [56].
Essential Research Reagent Solutions
Table 3: Essential Research Reagents and Materials for LC×LC Applications
| Category | Specific Products/Technologies | Key Characteristics | Application Note |
|---|---|---|---|
| Stationary Phases | Halo C18, 90 Å PCS Phenyl-Hexyl [9] | Superficially porous particles (2.7 μm), phenyl-hexyl functionality | Provides alternative selectivity to C18, enhanced peak shape for basic compounds |
| Bioinert Columns | Halo Inert [9], Evosphere Max [9] | Metal-free hardware, passivated surfaces | Prevents adsorption of metal-sensitive analytes, improves recovery for phosphorylated compounds |
| MS-Compatible Buffers | Ammonium formate, ammonium acetate (5-20 mM) | Volatile salts, MS-compatible | Optimal for LC×LC-MS applications, minimizes ion suppression |
| High-Purity Solvents | LC-MS grade water, acetonitrile, methanol | Low UV cutoff, minimal background ions | Reduces chemical noise, improves detection sensitivity |
| Specialty Phases | SunBridge C18 [9], Aurashell Biphenyl [9] | High pH stability (pH 1-12), biphenyl for π-π interactions | Extends method development space, particularly for basic compounds |
| Guard Columns | Raptor Inert HPLC Guard Cartridges [9] | Superficially porous particles (2.7 μm), inert hardware | Protects analytical columns, maintains performance with complex samples |
Application Examples in Pharmaceutical Analysis
Impurity Profiling of Active Pharmaceutical Ingredients
LC×LC has demonstrated exceptional capability in the impurity profiling of complex active pharmaceutical ingredients (APIs), where comprehensive separation of structurally similar impurities and degradation products is essential for regulatory compliance and quality control. In one documented application, a combination of a C18 column in the first dimension with a phenyl-hexyl column in the second dimension enabled resolution of over 150 potential impurities in a single analysis, far exceeding the peak capacity of conventional 1D-LC [9]. The phenyl-hexyl stationary phase provided complementary selectivity through π-π interactions with aromatic compounds, while the C18 dimension separated based primarily on hydrophobicity. This orthogonal separation mechanism ensured that co-eluting compounds in the first dimension were effectively resolved in the second dimension, providing a comprehensive impurity profile that met regulatory requirements for pharmaceutical development.
Characterization of Monoclonal Antibodies and Biotherapeutics
The analysis of complex biopharmaceuticals represents another area where LC×LC provides transformative capabilities. In a recent study cited in the literature, two COVID-19-relevant IgG-type monoclonal antibodies (casirivimab and imdevimab) were comprehensively analyzed using prototype ultra-short column formats (1-2 cm in length) across multiple chromatographic modes, including reversed-phase and cation-exchange chromatography (CEX) [56]. The research systematically compared pH gradient elution against traditional sodium chloride elution ("salt gradient") techniques for CEX separation of charge variants. The pH gradient approach demonstrated superior separation and selectivity for various charge variants of the antigen-binding fragment F(ab')2, while the separation of charge variants for the single-stranded crystallizable region (sFc) showed slightly better results with salt-gradient elution [56]. This application highlights how LC×LC enables comprehensive characterization of critical quality attributes for complex biotherapeutics that would require multiple orthogonal methods in a 1D-LC workflow.
Metabolomic and Proteomic Applications
While this application note focuses primarily on small molecule pharmaceutical applications, LC×LC has also demonstrated significant utility in metabolomic and proteomic studies where sample complexity often exceeds the separation power of 1D-LC. The combination of HILIC or ion-exchange chromatography in the first dimension with RPLC in the second dimension has proven particularly effective for these applications, providing orthogonality based on compound polarity or charge in the first dimension followed by hydrophobicity in the second dimension [45]. The implementation of active solvent modulation techniques has further enhanced these applications by improving compatibility between the two separation dimensions, particularly when employing MS detection.
Multi-dimensional liquid chromatography represents a paradigm shift in separation science that effectively addresses the analytical challenges posed by ultra-complex pharmaceutical samples. By combining orthogonal separation mechanisms in a comprehensive two-dimensional workflow, LC×LC delivers unprecedented peak capacity and resolving power that enables researchers to characterize samples with complexity that was previously intractable. The ongoing advancements in column technology, particularly the development of specialized stationary phases and inert hardware, coupled with sophisticated modeling approaches for method development, have transformed LC×LC from a specialized research technique to a robust analytical solution ready for implementation in pharmaceutical laboratories. As this technology continues to evolve, particularly with the emergence of higher pressure instrumentation and more refined modulation strategies, its impact on drug development and quality control will undoubtedly expand, providing researchers with evermore powerful tools to ensure the safety, efficacy, and quality of pharmaceutical products.
The development of robust, efficient high-performance liquid chromatography (HPLC) methods is a critical activity in pharmaceutical analysis, directly impacting the quality control and assurance of drug products. This application note details a case study on optimizing an HPLC method for the simultaneous analysis of a multi-component cold medicine powder containing paracetamol, phenylephrine hydrochloride, and pheniramine maleate. The separation of these compounds—an acidic drug, a basic drug, and a neutral impurity—presents a complex chromatographic challenge requiring careful column and condition selection [58]. The work is situated within broader thesis research on HPLC column selection, demonstrating how modern column technologies and systematic method development can resolve difficult pharmaceutical separations. The optimized method successfully balances analysis time, resolution, and sensitivity, offering a practical solution for routine quality control while adhering to International Conference on Harmonization (ICH) validation guidelines [58] [52].
Background and Analytical Challenge
Drug Components and Properties
The cold powder formulation consists of three active pharmaceutical ingredients (APIs) with diverse chemical properties, plus a critical impurity requiring monitoring:
- Paracetamol (Acetaminophen): An analgesic and antipyretic with a pKa of 9.38 and Log P of 0.46, indicating hydrophilic character [58].
- Phenylephrine Hydrochloride: A sympathomimetic decongestant, freely soluble in water [58].
- Pheniramine Maleate: An antihistamine, very soluble in water and organic solvents [58].
- 4-Aminophenol: A specified impurity of paracetamol that must be controlled in pharmaceutical products [58].
Existing pharmacopeial methods for these compounds suffered from significant limitations, including extended runtimes up to 70 minutes, high mobile phase consumption, and inefficiency for combination products [58]. The initial literature method required 22 minutes for quantitative determination—too lengthy for efficient in-process control in industrial manufacturing [58].
Column Technology Context
This case study was conducted alongside research into modern HPLC column trends. Recent innovations particularly relevant to this separation include:
- Inert Hardware Columns: Designed to prevent adsorption of analytes to metal surfaces, improving peak shape and recovery for metal-sensitive compounds [9]. This is especially beneficial for phosphorylated compounds and certain pharmaceutical molecules [9].
- Superficially Porous Particles (SPPs): Offer lower backpressure, enhanced efficiency, and equal loadability compared to fully porous particles [59]. These columns have become favored in pharmaceutical laboratories for their performance characteristics.
- Specialty Phases: New stationary phases like phenyl-hexyl and biphenyl columns provide alternative selectivity through combinations of hydrophobic, π–π, and dipole interactions [9].
Table 1: Key Properties of Analytes in Cold Powder Formulation
| Analyte | Therapeutic Category | pKa | Log P | Solubility |
|---|---|---|---|---|
| Paracetamol | Analgesic/Antipyretic | 9.38 | 0.46 | Low water solubility |
| Phenylephrine HCl | Decongestant | - | - | Freely soluble in water |
| Pheniramine Maleate | Antihistamine | - | - | Very soluble in water |
| 4-Aminophenol | Paracetamol Impurity | - | - | - |
Experimental Design
Method Development Strategy
The method optimization followed a systematic approach aligned with established HPLC method development principles [52] [60] [61]:
- Method Scouting: Initial screening of column and mobile phase conditions to identify promising starting points.
- Selectivity Optimization: Fine-tuning of separation parameters to achieve adequate resolution between all components.
- System Optimization: Adjustment of operational parameters to balance analysis time and resolution.
- Robustness Testing: Evaluation of method resilience to deliberate variations in method parameters.
- Method Validation: Comprehensive validation according to ICH guidelines to ensure fitness for purpose [52].
Materials and Equipment
Table 2: Research Reagent Solutions and Essential Materials
| Item | Specification | Function/Application |
|---|---|---|
| HPLC System | Agilent 1200 Infinity with DAD | Chromatographic separation and detection |
| Analytical Balance | Mettler Toledo XPE-205 | Precise weighing of standards and samples |
| pH Meter | Mettler Toledo Seven Easy | Mobile phase pH adjustment |
| HPLC Column | Zorbax SB-Aq (50 mm × 4.6 mm, 5 µm) | Stationary phase for separation |
| Paracetamol Standard | Purity ≤ 99% (HPLC) | Quantitative reference standard |
| Phenylephrine HCl Standard | Purity ≤ 99% (HPLC) | Quantitative reference standard |
| Pheniramine Maleate Standard | Purity ≤ 99% (HPLC) | Quantitative reference standard |
| 4-Aminophenol Standard | Purity ≤ 99% (HPLC) | Impurity identification and quantification |
| Sodium Octanesulfonate | Gradient Grade | Ion-pair reagent in mobile phase |
| Methanol | HPLC Grade | Mobile phase component |
| Phosphoric Acid | Gradient Grade | Mobile phase pH adjustment |
Chromatographic Conditions
The final optimized method employed the following conditions:
- Column: Zorbax SB-Aq (50 mm × 4.6 mm, 5 µm) – an octadecylsilyl (C18) column designed for aqueous mobile phases and polar compound retention [58].
- Mobile Phase: Gradient system with:
- Mobile Phase A: 1.1 g/L sodium octanesulfonate solution (pH 3.2)
- Mobile Phase B: Methanol
- Detection: Diode array detector at 273 nm for APIs and 225 nm for 4-aminophenol impurity [58].
- Flow Rate: 1.0 mL/min
- Column Temperature: 40 ± 1°C
- Injection Volume: 10 µL
Table 3: Gradient Elution Program for Separation
| Time (min) | Mobile Phase A (%) | Mobile Phase B (%) |
|---|---|---|
| 0 | 90 | 10 |
| 5 | 90 | 10 |
| 8 | 50 | 50 |
| 10 | 50 | 50 |
| 12 | 90 | 10 |
| 15 | 90 | 10 |
Results and Discussion
Method Optimization and Performance
The systematic development approach yielded significant improvements over existing methods:
- Analysis Time Reduction: The runtime was reduced to 10 minutes for active ingredients and 20 minutes for impurity analysis, twice as fast as the official pharmacopeial method [58].
- Enhanced Selectivity: The Zorbax SB-Aq column provided excellent retention and resolution for all components, including the polar 4-aminophenol impurity.
- Validation Results: The method demonstrated excellent linearity, precision, and accuracy meeting ICH requirements [58].
Table 4: Method Validation Parameters and Results
| Parameter | Paracetamol | Phenylephrine HCl | Pheniramine Maleate | 4-Aminophenol |
|---|---|---|---|---|
| Linearity Range (µg/mL) | 160-360 | 5-11 | 10-22 | - |
| Retention Time (min) | - | - | - | - |
| Precision (% RSD) | - | - | 3.48 | - |
| LOD (µg/mL) | - | - | - | - |
| LOQ (µg/mL) | - | - | - | - |
Column Selection Rationale
The selection of the Zorbax SB-Aq column was pivotal to method success. This stationary phase is specifically designed for high aqueous mobile phase compatibility, making it ideal for retaining polar compounds like phenylephrine and 4-aminophenol [58]. The 50 mm column length provided sufficient theoretical plates for adequate resolution while maintaining short analysis times—a key consideration for quality control laboratories with high sample throughput requirements.
The use of a C18 column with aqueous-enhanced polarity characteristics aligns with broader trends in pharmaceutical HPLC, where columns are increasingly tailored for specific application challenges [9] [59]. While more specialized phases like biphenyl columns (offering π–π interactions) or inert hardware columns (reducing metal adsorption) were considered, the standard C18 phase with appropriate mobile phase modification proved sufficient for this separation [9].
Mobile Phase Optimization
The mobile phase development balanced several competing requirements:
- Ion-Pair Reagent: Sodium octanesulfonate was incorporated to improve retention of the ionizable compounds through ion-pair mechanisms [58].
- pH Selection: The acidic pH (3.2) ensured paracetamol remained predominantly in its non-ionized form for adequate retention while protonating basic compounds to control their interaction with residual silanols.
- Gradient Optimization: The shallow gradient profile provided optimal resolution between early-eluting polar compounds and later-eluting less polar compounds.
Application Protocol
Sample Preparation Procedure
- Test Solution for APIs: Prepare a solution containing 800 µg/mL of paracetamol in a solvent mixture of methanol and water (1:1, v/v), with pH adjusted to 3.5 using phosphoric acid [58].
- Reference Solution for Impurity: Transfer 16.0 mg each of paracetamol and 4-aminophenol reference standards to a 50 mL volumetric flask. Add 10.0 mL of methanol and dilute to volume with methanol. Transfer 1.0 mL of this solution to a 50 mL volumetric flask and dilute to volume with methanol. Transfer 2.5 mL of the resulting solution to a 20 mL volumetric flask and dilute to volume with water (pH adjusted to 3.5 with phosphoric acid) to obtain a solution containing 0.8 µg/mL each of paracetamol and 4-aminophenol [58].
- Filtration: Filter all solutions through 0.2 µm regenerated nylon syringe filters before injection [58].
System Setup and Operation
- Mobile Phase Preparation: Prepare Mobile Phase A by dissolving 1.1 g of sodium octanesulfonate in 900 mL of chromatography water. Adjust to pH 3.2 with phosphoric acid and dilute to 1000 mL with water. Filter and degass. Prepare Mobile Phase B as HPLC-grade methanol [58].
- System Equilibration: Prime the system with the mobile phase and equilibrate the column for at least 35 minutes or until a stable baseline is achieved [62].
- Sequence Execution: Program the autosampler to inject 10 µL of each sample and standard. Set the diode array detector to acquire data at 273 nm for APIs and 225 nm for 4-aminophenol [58].
- System Suitability: Prior to sample analysis, verify system suitability by injecting the reference solution. The relative standard deviation (RSD) of peak areas for five replicate injections should not exceed 2.0%, and the resolution between critical peak pairs should be not less than 1.5 [58] [52].
This case study demonstrates a systematic approach to HPLC method development for a complex multi-component pharmaceutical formulation. Through strategic column selection and careful optimization of chromatographic conditions, the method achieved significant improvements in analysis time, sensitivity, and efficiency compared to existing pharmacopeial methods. The successful application of this optimized method highlights the importance of column technology and method development strategy in modern pharmaceutical analysis. The approach presented serves as a valuable template for similar method development challenges involving multiple analytes with diverse chemical properties, contributing to the broader understanding of HPLC column selection principles in pharmaceutical research. The final validated method provides a reliable, reproducible, and efficient solution for quality control of combined cold powder formulations in both research and industrial settings.
Solving Real-World Problems: HPLC Column Troubleshooting and Performance Restoration
Within pharmaceutical research and drug development, High-Performance Liquid Chromatography (HPLC) is a cornerstone analytical technique for separating and quantifying complex mixtures. The reliability of these analyses directly impacts critical decisions, from lead compound identification to quality control of final drug products. However, analysts frequently encounter three pervasive challenges that compromise data integrity: peak tailing, retention time shifts, and high backpressure. Effectively diagnosing and resolving these issues is fundamental to robust method development and ensuring regulatory compliance. This application note, framed within a broader thesis on HPLC column selection for pharmaceutical separations, provides detailed protocols and structured data to empower researchers in maintaining optimal chromatographic performance.
Peak Tailing
Peak tailing occurs when the trailing edge of a chromatographic peak is elongated, resulting in an asymmetrical shape. This deviation from the ideal Gaussian peak can severely compromise quantification accuracy, lower detection sensitivity, and obscure minor impurities [63] [64].
Root Causes and Diagnostic Approach
The primary cause of peak tailing is the occurrence of multiple retention mechanisms, most commonly secondary interactions between analytes and active sites on the stationary phase [63]. For basic pharmaceutical compounds possessing amine functional groups, these interactions often involve ionized residual silanol groups (Si–OH) on the silica support [63] [64]. Other contributing factors include column mass overload and, less frequently, column bed deformation such as the development of a void or a partially blocked inlet frit [63].
Diagnosing the cause begins with calculating the Peak Asymmetry Factor (As). This is determined using the equation As = B / A, where B is the peak width after the peak centre at 10% peak height, and A is the peak width before the peak centre at the same height. An As value greater than 1.2 is typically considered indicative of tailing, though values up to 1.5 may be acceptable for some assays [63].
Experimental Protocol for Mitigating Peak Tailing
The following workflow provides a systematic approach for diagnosing and resolving peak tailing.
Protocol Steps:
- Initial Diagnosis: Calculate the Asymmetry Factor (As) for the tailing peak. Confirm that tailing is not affecting all peaks equally, which would suggest a systemic issue like mass overload [63].
- Test for Mass Overload: Dilute the sample 10-fold and re-inject. If peak shape improves significantly, the original method was mass-overloaded. Mitigation strategies include using a higher capacity stationary phase, a column with a larger diameter, or injecting a lower absolute amount [63].
- Suppress Silanol Interactions with Low pH: If tailing persists, modify the mobile phase to operate at a lower pH (e.g., pH ≤ 3.0). This suppresses the ionization of residual silanol groups, minimizing their interaction with basic analytes. Note: Standard silica columns should not be used below pH 3 due to risk of dissolution; use columns specifically designed for low-pH stability (e.g., Agilent ZORBAX Stable Bond) [63].
- Evaluate Alternative Stationary Phases: If low pH is ineffective or incompatible with the analysis, switch to a highly deactivated column. Modern Type B silica columns with high-endcapping and low metal content significantly minimize these secondary interactions [64]. For challenging separations, consider alternative phases such as:
Research Reagent Solutions for Peak Tailing
Table 1: Key reagents and columns for resolving peak tailing.
| Reagent/Product | Function/Application | Key Specification |
|---|---|---|
| Type B Silica Columns | Base-deactivated silica with low metal ion content for sharper peaks with basic compounds. | Low metal content, high endcapping [64]. |
| Stable Bond/Low-pH Columns | Stationary phase for separations at pH < 3 to suppress silanol ionization. | e.g., Agilent ZORBAX SB [63]. |
| Trimethylchlorosilane (TMCS) | Reagent used in end-capping process to convert silanols to less polar groups. | Common end-capping reagent [63]. |
| Hexamethyldisilazane (HMDS) | Reagent used in end-capping process to convert silanols to less polar groups. | Common end-capping reagent [63]. |
| Trifluoroacetic Acid (TFA) | Ion-pairing agent and mobile phase pH modifier for peptide and basic compound separations. | HPLC-grade, volatile [65]. |
Retention Time Shifts
Retention time (tR) shifts undermine method reproducibility and can lead to misidentification of compounds. These shifts can be categorized as either a gradual drift over multiple injections or a sudden jump between runs [66].
Root Causes and Diagnostic Approach
A critical first step is to determine whether the issue is mechanical/flow-related or chemical in nature. This is done by observing the retention time of an unretained marker (t0).
- If t0 and tR shift equally, the problem is likely a change in flow rate (e.g., from a pump leak, faulty seal, or bubble) [65] [66].
- If tR changes relative to t0, the problem is chemical, involving changes in the mobile phase or stationary phase [65] [66].
Common causes of chemical changes include mobile phase composition inconsistencies (evaporation of volatile organics or pH modifiers), inadequate column temperature control, and changes to the stationary phase itself due to contamination or degradation [65] [67] [66].
Experimental Protocol for Diagnosing Retention Time Instability
The following protocol provides a logical path to identify the source of retention time shifts.
Protocol Steps:
- Determine Flow Consistency: Using a calibrated flow meter or a 10 mL volumetric flask, time the delivery of mobile phase at 1 mL/min for 10 minutes. A discrepancy indicates a pump issue (e.g., bad seal, check valve failure, or bubble) [65] [66].
- Check for System Leaks: With the system running, methodically check all unions, connections, and the pump head with a folded piece of laboratory "blue roll" paper. A dark blue spot will appear where even a tiny, non-dripping leak is drawing mobile phase [65] [66].
- Eliminate Mobile Phase Variability:
- Prepare a fresh batch of mobile phase, ensuring buffers are made accurately and pH is adjusted before adding the organic modifier.
- Ensure solvent reservoirs are loosely capped to minimize evaporation into the headspace, but not sealed with foil or lab film, which can pressure-lock the bottles [65] [66].
- Verify Column Temperature: A 1°C change in temperature can alter retention by approximately 2% in reversed-phase separations. Always use a column oven for stable temperature control [67].
- Substitute the Column: Replace the analytical column with a new one or a known-good test column. A change in performance confirms the original column was degraded, contaminated, or had a void [67].
Quantitative Impact of Common Variables
Table 2: Factors influencing retention time stability and their typical impact.
| Factor | Impact on Retention Time | Diagnostic Evidence |
|---|---|---|
| Column Temperature (Δ1°C) | ~2% change in tR | Gradual drift with lab ambient temperature [67]. |
| Mobile Phase Evaporation | Increased tR in reversed-phase (less organic) | Drift accelerates as bottle headspace increases [65]. |
| Pump Seal Wear / Leak | Decreased flow rate, increased tR | Shift in t0 marker; visible wetness on blue roll test [65]. |
| Buffer Precipitation | Variable and often increased tR | High pressure, especially at high organic content [68]. |
| Stationary Phase Loss | Gradual decrease in tR | Loss of efficiency (peak broadening) over time [66]. |
High Backpressure
Abnormally high system pressure is a common mechanical failure point in HPLC and UHPLC systems, potentially halting analyses and damaging components.
Root Causes and Diagnostic Approach
High backpressure is almost always caused by a blockage somewhere in the flow path. The main sources of particulates that cause clogs are: the sample itself, mobile phase impurities or precipitation, and instrument wear and tear (e.g., from deteriorating pump seals or injector rotors) [68].
Experimental Protocol for Isolating a Pressure Blockage
A systematic approach to isolate the location of the blockage is the most efficient troubleshooting method. Start at the detector and work backward.
Protocol Steps:
- Establish a Baseline Pressure: With a new column installed, record the system pressure for your method. For more comprehensive troubleshooting, also establish the system-only pressure by replacing the column with a zero-dead-volume union [68].
- Systematic Isolation:
- Disconnect the detector outlet tubing. If pressure remains high, the blockage is in the detector flow cell (less common).
- If pressure drops, reconnect the detector and remove the analytical column, replacing it with a union. If the pressure is now normal, the blockage is in the column or its frits. If pressure remains high, the blockage is upstream of the column (in the system) [68] [69].
- Addressing a Clogged Column:
- Preventative Measures:
- Sample Preparation: Filter all samples using a 0.45 µm or 0.2 µm syringe filter or use filter vials prior to injection [68] [70].
- Use Guard Columns: A guard column packed with the same stationary phase as the analytical column will trap particulates and can be replaced frequently, protecting the more expensive analytical column [63] [68].
- Mobile Phase Handling: Use HPLC-grade solvents, filter mobile phases through a 0.45 µm filter, and avoid storing buffered mobile phases for extended periods to prevent bacterial growth [68].
- Routine Maintenance: Follow a preventative maintenance schedule for high-wear parts like pump seals, injection valve rotors, and needle seats [68].
Research Reagent Solutions for Pressure Management
Table 3: Essential tools and reagents for preventing and troubleshooting high backpressure.
| Reagent/Product | Function/Application | Key Specification |
|---|---|---|
| In-line Filter (0.5 µm) | Placed between injector and column to trap particulates from sample and system. | Stainless steel body, replaceable frit [70]. |
| Guard Column System | Protects analytical column from particulates and irreversibly absorbing sample components. | Must be matched to analytical column chemistry [68]. |
| Syringe Filters (0.2 µm) | For pre-injection filtration of samples to remove particulate matter. | Nylon, PVDF, or PTFE membrane compatible with sample solvent [68]. |
| Mobile Phase Filters (0.45 µm) | For filtering solvents and aqueous buffers during mobile phase preparation. | Glass or stainless steel assembly [68]. |
| Seal Wash Kit / Solvents | Flushes and lubricates pump seals to prevent wear and extend life, especially with buffers. | Compatible with mobile phase and seal material [68]. |
Peak tailing, retention time shifts, and high backpressure are not isolated problems but are often symptoms of interrelated issues with the chromatographic system. A structured, logical approach to diagnosis is far more effective than random troubleshooting. For the pharmaceutical scientist, understanding these common failures is integral to the broader goal of robust HPLC method development and column selection. Selecting the appropriate column chemistry (e.g., modern Type B, low-metal silica for basic compounds) and hardware (e.g., inert for metal-sensitive analytes), combined with meticulous attention to mobile phase preparation and a disciplined maintenance regimen, forms the foundation of reliable, reproducible chromatography essential for drug development.
Within pharmaceutical research, the integrity of High-Performance Liquid Chromatography (HPLC) data is paramount. Central to generating reliable and reproducible results is the analytical column, a core component where the actual separation of compounds occurs. Proper maintenance—encompassing systematic washing, correct equilibration, and appropriate storage—is not merely a procedural formality but a critical practice that directly impacts column lifetime, analytical performance, and the cost-effectiveness of drug development workflows [71]. Neglect can lead to high backpressure, poor resolution, irreproducible retention times, and ultimately, costly operational downtime [71]. This application note provides detailed protocols to safeguard this vital investment, ensuring consistent performance throughout the column's lifecycle.
Essential Pre-Maintenance Practices
Before executing washing or storage protocols, several foundational practices must be observed to prevent column damage.
- Filtration and Inline Protection: Always use filtered, high-purity solvents and mobile phases to minimize particulate introduction [71] [72]. Employ guard columns and inline filters as primary protective barriers; they capture particulates and strongly retained sample impurities, thereby extending the analytical column's life and postponing costly replacements [71] [73].
- Avoiding Physical Stress: Operate the column within its specified pressure, temperature, and pH limits [71]. Avoid sudden changes in flow rate or solvent composition, as these can disturb the packed bed and create voids or channels, leading to peak broadening and loss of resolution [71]. When switching solvents, ensure they are miscible to prevent precipitation within the column [72].
Column Washing and Regeneration Protocols
Routine cleaning removes accumulated contaminants that degrade performance. The optimal protocol depends on the column chemistry and the nature of the contamination.
Reversed-Phase Column Washing
Reversed-phase columns (e.g., C18, C8) are prevalent in pharmaceutical analysis for separating small molecules and peptides.
Indications for Cleaning: A sustained increase in backpressure (e.g., 5% above baseline), deterioration of peak shape (tailing or fronting), changes in selectivity, or a loss of column efficiency signal the need for cleaning [74].
Solvent Selection and Strength: Solvents should be chosen and used in order of increasing elution strength to effectively displace contaminants without causing additional issues [74].
Table 1: Solvent Elution Strength for Reversed-Phase Washing
| Solvent | Elution Strength | Notes and Precautions |
|---|---|---|
| Water | Weakest | Used for initial salt removal; can cause "dewetting" in some columns if used alone [73]. |
| Methanol / Acetonitrile | Medium | Common first-choice solvents; miscible with water and buffer [74]. |
| Tetrahydrofuran (THF) | Strong | Effective for stubborn contaminants; requires compatibility check [74]. |
| Ethanol / Isopropanol | Strong | Isopropanol is viscous, which may cause high backpressure; reduce flow rate accordingly [74]. |
| Hexane | Strongest | Not miscible with water; requires intermediate solvent (e.g., isopropanol) [74]. |
Standard Washing Procedure: This workflow outlines the decision-making process and steps for cleaning a reversed-phase column, starting with the least aggressive approach.
Advanced Stubborn Contaminant Procedure: For severe contamination, a more aggressive protocol using hexane may be necessary [74].
- Follow steps 1-2 from the standard procedure.
- Flush with 10 CV of a strong, water-miscible organic solvent (e.g., Isopropanol).
- Flush with 10 CV of 100% hexane.
- Flush again with 10 CV of the strong organic solvent (e.g., Isopropanol) to remove hexane.
- Flush with 5 CV of 100% weak organic solvent (Methanol/Acetonitrile).
- Flush with 5 CV of 5-20% organic solvent in water.
- Equilibrate with the analytical mobile phase.
Note: A flow rate of 1.0 mL/min is generally advised, but this should be reduced if backpressure becomes excessive, particularly when using viscous solvents like isopropanol [74]. Column volume (CV) can be calculated using the formula for a cylinder (πr²h) or referenced from tables provided by manufacturers [74].
Cleaning Protocols for Other Common Phases
Table 2: Washing Guidelines for Normal Phase and HILIC Columns
| Column Type | Common Solvents | Washing Procedure Overview |
|---|---|---|
| Normal Phase | Hexane (Weak) → Isopropanol/Ethanol (Strong) → Water/Methanol (Strongest) [74] | 1. Flush with 5 CV of 100% Isopropanol/Ethanol.2. Flush with 5 CV of 100% Hexane.3. Re-equilibrate. Note: Water/Methanol can permanently alter retention and should be used with caution. [74] |
| HILIC | Acetonitrile (Weak) → Water (Strong) [71] [75] | 1. Flush with a high-organic solvent (e.g., 80-90% acetonitrile).2. Transition to an aqueous phase to remove polar contaminants [71]. |
| Ion Exchange | Low-salt buffers → High-salt buffers [71] | Begin with low-salt buffer washes, then gradually introduce stronger buffers or adjust pH as per manufacturer's guidance to regenerate active sites [71]. |
Performance Restoration via Backflushing
If high backpressure persists and suggests a clogged inlet frit, backflushing the column can be an effective restoration technique.
- Procedure: Disconnect the column and reconnect it to the pump in reverse flow direction. Do not connect the outlet to the detector. Flush with 5-10 column volumes of a suitable solvent (e.g., the current mobile phase or a restoration solvent like a 40:40:20 mixture of ACN:IPA:Water for reversed-phase columns) [72]. After flushing, reconnect the column in the normal direction and equilibrate thoroughly.
Column Equilibration
After washing, storage, or any mobile phase change, the column must be equilibrated to a stable state to ensure reproducible retention times. Equilibration involves pumping the initial analytical mobile phase through the column until a stable baseline and consistent retention times are achieved. This process can require 150 column volumes or more [72]. Monitor the system pressure and baseline absorbance to confirm that equilibrium has been reached before commencing analytical runs.
Column Storage Protocols
Proper storage is crucial for preserving column integrity during periods of non-use. The following workflow outlines the key steps for preparing a column for short-term or long-term storage.
Key Storage Considerations:
- Remove Buffers and Salts: Always flush the column thoroughly (e.g., with 10-15 CV of 10% organic solvent in water) to remove all buffers and salts before introducing the storage solvent. Residual salts can crystallize and clog the column, causing irreversible damage [71] [73] [75].
- Prevent Microbial Growth: For storage solvents containing water, adding a bactericide (e.g., 0.05% sodium azide) or using a high organic content (>50%) can inhibit microbial growth [72] [75].
- Never Let the Column Dry Out: Allowing a column to dry can irreversibly damage the stationary phase. Ensure end plugs are tightly sealed to prevent solvent evaporation [71] [75].
Table 3: Recommended Storage Solvents by Column Type
| Column Type | Short-Term (< 2 weeks) | Long-Term (> 2 weeks) | Critical Precautions |
|---|---|---|---|
| Reversed-Phase | Working mobile phase [72]. | Methanol, Acetonitrile, or mixtures with water (e.g., 80/20 Isopropanol/Water) [71] [75]. | Flush all salts before storage. Avoid 100% water [71] [72]. |
| Normal Phase | Last mobile phase used [75]. | Heptane or Isopropanol [75]. | Ensure solvent compatibility with the stationary phase. |
| HILIC | N/A | 80-90% Acetonitrile with 5-10 mM Ammonium Acetate/Formate [71] [75]. | Follow manufacturer's guidelines closely. |
| Ion Exchange | N/A | Manufacturer-recommended buffers. | Flush out high-salt mobile phases. Some phases cannot be stored in alcohols [75]. |
The Scientist's Toolkit: Essential Research Reagents and Materials
Table 4: Key Materials for HPLC Column Maintenance
| Item | Function / Purpose |
|---|---|
| High-Purity Solvents (HPLC Grade) | Prevents introduction of particulates and impurities that can contaminate the column and baseline noise [71]. |
| Guard Columns & Inline Filters | Protects the expensive analytical column from particulates and strongly absorbing contaminants, significantly extending its life [71] [73]. |
| Methanol & Acetonitrile | Primary weak organic solvents for washing and storing reversed-phase columns [71] [74]. |
| Isopropanol | A stronger eluting solvent for removing stubborn contaminants; also a preferred storage solvent for some due to its low volatility [75] [74]. |
| Tetrahydrofuran (THF) | A very strong solvent for cleaning severely contaminated reversed-phase columns [74]. |
| Ammonium Acetate/Formate | Volatile buffers for LC-MS methods and for storage of HILIC columns [71] [75]. |
| Needle-Nose Pliers | For safely removing stuck metal fittings from column inlets without damaging the column [76]. |
Troubleshooting and Column Lifetime
Despite best efforts, performance issues may arise.
- When to Replace a Column: A column typically needs replacement when cleaning and restoration procedures fail to resolve issues such as persistent high backpressure, severely split or tailing peaks, loss of resolution between critical pairs, or irreproducible retention times [71].
- Common Mistakes to Avoid:
Rigorous adherence to standardized maintenance protocols for washing, equilibration, and storage is a fundamental aspect of successful HPLC operations in pharmaceutical research. These practices ensure the generation of high-quality, reproducible data, extend the service life of valuable columns, minimize unplanned downtime, and reduce long-term operational costs. By integrating these detailed protocols into routine laboratory workflows, scientists can safeguard the performance and reliability of their chromatographic systems from the method development stage through to quality control.
Preventing and Reversing Hydrophobic Collapse in Reversed-Phase Columns
In the pharmaceutical industry, the reversed-phase high performance liquid chromatography (RP-HPLC) serves as a cornerstone technique for the separation and analysis of drug compounds, their impurities, and metabolites [77]. A significant challenge arises during the analysis of highly polar pharmaceutical compounds, such as organic acids, peptides, nucleosides, and water-soluble vitamins, which require mobile phases with high aqueous content (often exceeding 90% water or even 100% aqueous) to achieve sufficient retention [77] [78]. Under these conditions, traditional C18 columns are susceptible to a performance-degrading phenomenon historically referred to as hydrophobic collapse [79] [78].
Modern studies have clarified that the underlying mechanism is not a permanent collapse of the C18 chains but rather a process of pore dewetting [79]. In this process, the hydrophobic internal surface of the stationary phase pores repels the aqueous mobile phase. When the system flow is stopped, the driving pressure that kept the water within the pores is lost, and water is expelled due to thermodynamic instability [79]. This dewetting results in a dramatic loss of retention time and chromatographic performance because the analytes can no longer access the vast internal surface area of the stationary phase [77] [79]. This application note details the mechanisms of pore dewetting and provides validated protocols for its prevention and reversal, ensuring reliable method performance in pharmaceutical research.
Mechanism and Theoretical Background
The Pore Dewetting Phenomenon
The widely accepted explanation for retention loss under highly aqueous conditions is stationary phase dewetting [77] [79]. The silica particles in HPLC columns are porous, and the C18 alkyl chains are bonded throughout this extensive internal surface area. Under standard RP-HPLC conditions with organic solvent-containing mobile phases, these pores remain filled with liquid.
However, with 100% aqueous mobile phases, a critical problem emerges. The hydrophobic C18-lined pores repel the polar water molecules [77]. During normal flow, the system pressure forces the aqueous mobile phase into the pores. When the flow is stopped, this pressure is lost, and the thermodynamic driving force, specifically the Laplace pressure, spontaneously expels water from the pores [79]. Once the water is expelled, its high surface tension prevents easy re-entry, leaving the pores "dried" and inaccessible to analytes, thereby causing a severe drop in retention [77] [79].
The following diagram illustrates the process of pore dewetting and the strategy for recovery using an organic solvent.
Factors Influencing Dewetting
Several factors control the susceptibility of a column to dewetting [79]:
- Pore Size: Columns with smaller pore sizes (e.g., < 160 Å) are more prone to dewetting because the narrower channels increase the Laplace pressure, forcing water out more easily. Columns with larger pore sizes (≥ 160 Å) are more tolerant [77] [79].
- Surface Chemistry: The hydrophobicity of the bonded phase is a key factor. Standard C18 phases with high surface coverage are most susceptible [79].
- Operating Pressure: Maintaining a system pressure above the extrusion pressure (often >50 bar) can prevent dewetting by keeping water in the pores [79].
- Dissolved Gases: The presence of dissolved gases in the mobile phase can accelerate the dewetting process [79].
Practical Strategies for Prevention and Recovery
Preventing Hydrophobic Collapse (Pore Dewetting)
Prevention is the most effective strategy for managing hydrophobic collapse. The following table summarizes key approaches.
Table 1: Strategies for Preventing Hydrophobic Collapse (Pore Dewetting)
| Strategy | Description | Practical Implementation in Pharmaceutical Analysis |
|---|---|---|
| Use AQ-Specific Columns | Employ columns designed for high aqueous content, featuring polar-embedded groups or polar end-capping. | Use C18AQ columns for methods analyzing polar pharmaceuticals like peptides, nucleosides, or organic acids [77] [78]. |
| Select Larger Pore Sizes | Choose columns with larger average pore diameters. | For analyzing large biomolecules or when using 100% aqueous mobile phases, select columns with pore sizes ≥160 Å [77] [79]. |
| Maintain Minimum Organic Content | Avoid using 100% aqueous mobile phases for extended periods. | Always maintain at least 5-10% organic solvent in the mobile phase or storage solution [80]. |
| Avoid Flow Stoppage | Do not stop the flow when using highly aqueous mobile phases. | If the system must be stopped, keep the outlet blocked to maintain pressure within the column [79]. |
| Use Degassed Mobile Phases | Degassing reduces the potential for bubble formation that can initiate dewetting. | Always use degassed solvents when preparing high-aqueous-content mobile phases [79]. |
Recovering a Dewetted Column
If a conventional C18 column experiences dewetting, its performance can often be recovered with a simple reconditioning procedure [77] [80].
Table 2: Protocol for Reversing Hydrophobic Collapse
| Step | Action | Rationale & Tips |
|---|---|---|
| 1. Flush with Strong Organic Solvent | Flush the column with 20-30 column volumes of a strong organic solvent (e.g., 100% acetonitrile or 100% methanol). | This reduces the surface tension of the liquid, allowing it to re-enter and "rewet" the hydrophobic pores. Isopropanol can be used for very stubborn cases [80]. |
| 2. Gradual Re-equilibration | Gradually transition back to the desired analytical mobile phase composition. | After the initial flush, step or gradient down to the starting mobile phase condition over 10-20 column volumes to prevent shock to the system and ensure full equilibration. |
| 3. Performance Verification | Inject a standard mixture to verify that retention times and peak shapes have been restored. | Compare the chromatogram to one obtained before the collapse occurred. Consistent retention times and symmetric peaks indicate successful recovery [80]. |
The workflow below outlines the decision process for addressing suspected hydrophobic collapse, from diagnosis to resolution.
Experimental Protocols
Protocol 1: Comparative Evaluation of Column Performance
This protocol is designed to demonstrate the superior performance of AQ-columns under 100% aqueous conditions compared to regular C18 columns, using a polar analyte.
- Objective: To compare the retention behavior of a polar pharmaceutical compound (e.g., an organic acid or a peptide) on a regular C18 column versus a C18AQ column under 100% aqueous conditions.
- Materials:
- Columns: One conventional C18 column and one C18AQ column of identical dimensions (e.g., 4.6 x 150 mm, 5 µm).
- Mobile Phase: 100% water (HPLC grade, degassed). For the regular C18 column, a mobile phase with 10% organic solvent can be used as a control.
- Analyte: A solution of a polar standard (e.g., 0.1 mg/mL Brilliant Blue FCF or a relevant pharmaceutical compound) [78].
- Instrumentation: Standard HPLC system with UV-Vis detector.
- Method:
- Equilibrate the C18AQ column with 100% aqueous mobile phase at 1.0 mL/min for 10-15 minutes.
- Inject the standard solution and record the chromatogram.
- Note the retention time and peak shape.
- Switch to the regular C18 column. Condition with a mobile phase containing 10% methanol, then transition to 100% aqueous mobile phase.
- Inject the same standard solution and record the chromatogram.
- Compare the retention and peak shape between the two columns.
- Expected Outcome: The C18AQ column will show strong, stable retention of the polar analyte, while the regular C18 column will exhibit little to no retention, with the analyte eluting near the void volume due to pore dewetting [78].
Protocol 2: Column Recovery from Hydrophobic Collapse
This protocol provides a step-by-step guide to restore a dewetted conventional C18 column.
- Objective: To recover the chromatographic performance of a conventional C18 column that has undergone hydrophobic collapse.
- Materials:
- Compromised C18 column.
- HPLC-grade organic solvents: acetonitrile, methanol, and/or isopropanol.
- Standard mixture for performance verification.
- Method:
- Remove the column from the HPLC system and connect it to a pump (or use an HPLC pump).
- Flush the column with a minimum of 20 column volumes of 100% acetonitrile or methanol at a slow flow rate (e.g., 0.2-0.5 mL/min for a 4.6 mm ID column). For severe cases, flushing overnight with 100% isopropanol at 0.1 mL/min may be necessary [77].
- After the flush, gradually re-equilibrate the column to your desired storage condition (e.g., 80% methanol/20% water) or analytical mobile phase by using a stepped gradient (e.g., 100% organic -> 70% organic -> 50% organic -> storage/analytical condition), using 10 column volumes per step.
- Once equilibrated, inject a standard mixture and compare the retention times and peak shapes to a reference chromatogram from before the collapse.
- Success Criteria: The column is considered recovered when the retention times of the standards are stable and within an acceptable range of their original values, and peak shapes are symmetric.
The Scientist's Toolkit
Table 3: Essential Research Reagent Solutions for Managing Hydrophobic Collapse
| Item | Function & Rationale |
|---|---|
| C18AQ Column | A reversed-phase column with polar modifications (e.g., embedded groups, polar end-capping) that enhance wettability, allowing it to tolerate 100% aqueous mobile phases without dewetting [77] [78]. |
| HPLC-Grade Water | High-purity water for mobile phase preparation; degassing is critical to minimize bubble formation that can trigger or exacerbate dewetting [79]. |
| HPLC-Grade Acetonitrile/Methanol | Strong organic solvents used for flushing and re-wetting dewetted columns, as their low surface tension allows them to easily penetrate hydrophobic pores [77] [80]. |
| HPLC-Grade Isopropanol | A very strong, viscous solvent used as a last resort for recovering severely dewetted columns, as it effectively re-wets the stationary phase but requires lower flow rates due to high viscosity [80]. |
| 0.2 µm Syringe Filter | For filtering sample solutions to prevent particulate matter from clogging the column frit, which can compound performance issues [80]. |
| Guard Column | A small cartridge placed before the analytical column to trap contaminants and particles, protecting the more expensive analytical column and extending its lifespan [46]. |
Hydrophobic collapse, more accurately described as pore dewetting, is a preventable and often reversible phenomenon. For pharmaceutical researchers developing methods for polar compounds, understanding this mechanism is critical for robust method development. The most straightforward preventive strategy is the selection of a purpose-built AQ-column, which is engineered to maintain performance under 100% aqueous conditions. For existing methods that utilize conventional C18 columns, adherence to operational guidelines—such as maintaining a minimum organic modifier content and avoiding flow stoppage—is essential. Should dewetting occur, a systematic flushing protocol with a high-strength organic solvent can typically restore column performance, saving time and resources while ensuring the reliability of analytical data in drug development.
Within the context of pharmaceutical compound separation research, effective management of High-Performance Liquid Chromatography (HPLC) system pressure is a critical determinant of analytical success. Uncontrolled system pressure leads to unreliable retention times, poor peak shape, compromised resolution, and ultimately, costly instrument downtime and column failure [81] [80]. For researchers and drug development professionals, a thorough understanding of pressure dynamics—from initial solvent selection to the definitive identification of a clog—is fundamental to developing robust, reproducible, and efficient analytical methods. This application note provides a detailed framework for diagnosing the root causes of pressure anomalies and implementing validated protocols for resolution and prevention, thereby ensuring the integrity of pharmaceutical research data.
Fundamentals of System Pressure in HPLC
System pressure in HPLC is generated by the resistance encountered by the mobile phase as it is pumped through the chromatographic flow path. While some backpressure is normal and indicative of a functioning system, significant deviations from baseline pressure signal underlying issues. The primary symptoms of pressure-related problems can be categorized as follows:
- Increased Backpressure: A sudden or gradual rise in pressure beyond established normal operating limits is the most common indicator of an obstruction [81] [80].
- Irregular or Distorted Peaks: Blockages can cause peak tailing, splitting, or broadening, which directly impacts separation efficiency and quantitative accuracy [82] [80].
- Reduced or Inconsistent Flow Rates: A partial clog can restrict flow, leading to erratic retention times and unreliable data [81].
- Pump Struggling or Abnormal Noises: The pump may produce noise or show pressure fluctuations as it works against a flow restriction [81].
The common locations where blockages occur within an HPLC system are illustrated in the following troubleshooting workflow. A systematic approach to identifying the clog location is the most efficient path to resolution.
Figure 1: Systematic troubleshooting workflow for identifying HPLC clog locations.
Quantitative Data and Tolerances
Understanding the acceptable operational parameters is crucial for distinguishing between normal system operation and a developing problem. The following tables summarize key quantitative data related to pressure management.
Table 1: Pressure-related symptoms and their common causes.
| Symptom | Common Causes | Preventive Measures |
|---|---|---|
| Sudden pressure increase [82] | Particulate clog at inlet frit; buffer precipitation [83] [81] | Filter samples and mobile phases; use lower buffer concentrations [83] [84] |
| Gradual pressure increase over multiple runs [82] | Contaminant accumulation on frit/stationary phase; system wear debris [81] [84] | Use guard columns; implement regular system flushing; perform preventative maintenance [81] [84] |
| Erratic pressure fluctuations | Inadequate mobile phase degassing; pump seal failure [81] | Degas mobile phases; replace worn pump seals as part of maintenance [81] |
Table 2: Mobile phase composition guidelines to prevent precipitation.
| Component | Risk Factor | Recommended Practice | Reference |
|---|---|---|---|
| Phosphate Buffer | Precipitation with organic solvent | Use concentrations ≤ 25 mM; avoid high-organic mixing | [83] |
| Triethylamine (TEA) | Often unnecessary with modern columns | Add only if severe tailing is observed and cannot be resolved by pH adjustment | [83] |
| EDTA | Indicates method "genetic drift" | Omit unless proven essential for analysis | [83] |
| General Rule | Precipitation upon solvent strength change | Ensure sample solubility in the starting mobile phase | [82] [84] |
Experimental Protocols for Clog Identification and Resolution
Protocol: Systematic Diagnosis of High Pressure
Objective: To methodically isolate and identify the component responsible for elevated system pressure.
Materials:
- Appropriate wrenches for disconnecting fittings
- Seal and rotor seal inspection kit
- HPLC-grade water and solvent (e.g., acetonitrile)
Method:
- Initial System Check: Connect the system without the column and purge the pump with the intended mobile phase. Note the pressure. A consistently high pressure indicates a blockage in the system components before the column (e.g., pump, injector, or tubing) [81].
- Isolate the Injector: Disconnect the tubing downstream of the injector. If the pressure remains high with flow, the issue is likely in the injector or preceding components. Inspect the injector valve and rotor seal for wear and debris [84].
- Reconnect the Column: If the pressure is normal without the column, reconnect it. A subsequent pressure spike confirms the column, its frits, or the guard column as the source of the clog [82].
- Inspect the Guard Column: Replace the guard cartridge. If pressure normalizes, the guard column was successfully protecting the analytical column [81] [84].
Protocol: Cleaning a Clogged HPLC Column
Objective: To restore flow and performance to a partially clogged analytical column.
Materials:
- HPLC system
- Strong, compatible solvents (e.g., 100% acetonitrile, 100% isopropanol, or for proteins, a denaturing agent like urea*)
- A dedicated cleaning protocol for the specific contaminant
Method:
- Identify the Contaminant: Review recent samples and methods. Biological samples may contain precipitated proteins, while other matrices may contain lipids or insoluble salts [82].
- Flush with Strong Solvent: Remove the column from the detector and place the outlet into a waste container. Flush the column with 20-30 column volumes of a strong solvent (e.g., 100% acetonitrile) at a slow flow rate [80].
- Use Specific Cleaning Agents:
- For proteins and lipids, a step-gradient flush with 100% acetonitrile, followed by 100% isopropanol, can be effective. Note: Urea can be used to denature proteins but must be used with extreme caution due to its high viscosity and tendency to crystallize, which can damage the HPLC system. Always verify column compatibility with extreme pH ranges before use [82].
- For buffer salts, flush thoroughly with 20-30 column volumes of HPLC-grade water to dissolve crystals, followed by a gradual transition back to the storage solvent [81].
- Last Resort - Flow Reversal: If flushing fails and the column is otherwise considered lost, carefully reverse the column's flow direction for 10-15 column volumes to dislodge particulates from the inlet frit. Warning: This can disrupt the packed bed and cause irreversible damage to column performance [80].
- Re-equilibrate: After cleaning, gradually re-equilibrate the column with the starting mobile phase. Monitor pressure and baseline stability. A stable, lower pressure indicates successful cleaning [80].
The Scientist's Toolkit: Essential Research Reagents and Materials
The following reagents and tools are essential for effective pressure management and column maintenance in a pharmaceutical research setting.
Table 3: Essential research reagent solutions for HPLC pressure management.
| Item | Function & Rationale |
|---|---|
| HPLC-Grade Solvents | High-purity solvents (ACN, MeOH, Water) minimize particulate and UV-absorbing contaminants that cause baseline noise and blockages [85] [81]. |
| 0.2 µm Syringe Filters & Filter Vials | Critical for removing particulate matter from samples prior to injection, protecting the column inlet frit from clogging [84]. |
| Guard Column & Cartridges | A sacrificial guard column with a matching stationary phase traps contaminants and particulates, preserving the more expensive analytical column [81] [84]. |
| Inert HPLC Columns | Columns with passivated (bioinert) hardware minimize analyte adsorption and peak tailing for metal-sensitive compounds like phosphorylated drugs, improving recovery and data accuracy [9]. |
| Seal and Rotor Seal Kits | Regular replacement of worn seals as part of preventative maintenance prevents micro-particulates from wearing parts from entering and clogging the column [84]. |
Preventive Strategies: Solvent Selection and System Maintenance
Preventing pressure problems is vastly more efficient than resolving them. A proactive strategy centered on solvent management and systematic maintenance is key.
Strategic Solvent Selection
The choice of solvent directly impacts system pressure and stability.
- Purity and Viscosity: Always use HPLC-grade solvents to minimize contaminants. Consider viscosity; methanol-water mixtures generate higher backpressure than acetonitrile-water mixtures, which must be accounted for in method development [85].
- Buffer Management: Prepare buffers with high-purity water and salts. Filter all mobile phases through a 0.2 µm or 0.45 µm filter. Use the lowest effective buffer concentration (e.g., 15-25 mM instead of 0.1 M) to drastically reduce the risk of precipitation when mixed with organic solvent [83] [81].
- Aqueous Mobile Phase Care: To prevent bacterial growth in aqueous mobile phases, prepare fresh solutions frequently and keep bottles capped [84].
Comprehensive Maintenance and Storage Protocols
- Post-Run Flushing: After using buffers, always flush the entire system (pump, injector, and column) with at least 20 column volumes of HPLC-grade water to remove salts, followed by 20 column volumes of organic storage solvent (e.g., 70% methanol or acetonitrile in water) [80].
- Column Storage: Never store a reversed-phase column in pure water or buffer. Always store in a recommended organic-rich solvent (e.g., ≥ 70% methanol or acetonitrile) to prevent microbial growth and "hydrophobic collapse" (de-wetting), which renders the stationary phase inaccessible [80].
- Preventative Maintenance Schedule: Adhere to a strict schedule for replacing wear parts like pump seals and injection valve rotor seals to prevent them from becoming a source of clog-causing particulates [84].
Innovations in Column Technology for Enhanced Pressure Management
Recent advancements in HPLC column technology directly address challenges related to system pressure and robustness, which is particularly relevant for method development in pharmaceutical research.
- Inert Hardware: A significant trend is the proliferation of columns with fully inert, metal-free fluidic paths. These columns prevent the adsorption and degradation of metal-sensitive analytes, such as phosphorylated compounds and certain pharmaceuticals, thereby improving peak shape and analyte recovery without contributing to pressure issues via metal-based interactions [9].
- Advanced Particle Designs: The development of superficially porous particles (also known as fused-core) and monodisperse fully porous particles continues to advance. These particles provide high efficiency and lower backpressure compared to traditional porous particles, enabling faster separations and extending column lifetime under high-pressure conditions [9].
- Automated Method Development: Innovations in automated, high-throughput workflow screening, as highlighted at HPLC 2025, enable rapid exploration of complex variable spaces. This includes testing multiple columns (e.g., 12 different UHPLC-compatible columns) across various pH and solvent conditions to quickly identify the most robust and pressure-stable method, improving efficiency and reproducibility [86].
Within pharmaceutical research and development, High-Performance Liquid Chromatography (HPLC) is a cornerstone technique, vital for tasks ranging from drug development and formulation to quality control, stability testing, and impurity profiling [48]. The HPLC column is the heart of this analytical system, and its performance is critical for generating reliable, reproducible data that supports regulatory compliance. A common challenge faced by scientists is the inevitable deterioration of column performance over time. Making an informed, timely decision on whether to recondition a faltering column or to replace it is essential for maintaining laboratory efficiency, managing costs, and ensuring data integrity. This application note provides a structured decision framework and detailed protocols to guide pharmaceutical analysts in this critical determination.
Performance Symptoms and Diagnostic Checklist
Recognizing the signs of a declining column is the first step in the decision-making process. The following table summarizes common symptoms, their potential causes, and initial diagnostic actions. System suitability tests, which verify the resolution and reproducibility of the chromatographic system, are a fundamental diagnostic tool and should be the primary criterion for assessing whether a method continues to produce acceptable results [87].
Table 1: HPLC Column Performance Issue Diagnostic Checklist
| Symptom | Potential Causes | Quick Diagnostic Actions |
|---|---|---|
| Increased Backpressure [80] [88] [89] | Particulate clogging at inlet frit [80] [89]; Contamination from sample or mobile phase [88] | Check system pressure without column; Filter mobile phase and sample [88] |
| Peak Tailing or Fronting [80] [88] | Column voiding [89]; Strongly retained compounds; Chemical contamination [80] | Inject a standard to see if tailing affects all peaks (indicates physical issue) or specific ones (indicates chemical issue) [89] |
| Loss of Resolution [80] [88] | Loss of stationary phase; Active sites on packing; Contamination [80] | Run a standard test mix and compare resolution, peak shape, and plate number to historical data [88] |
| Shifting Retention Times [80] | Mobile phase decomposition; Temperature fluctuations; Stationary phase degradation [80] | Confirm mobile phase composition and column temperature; Ensure adequate equilibration [80] |
| Ghost Peaks [88] | Elution of previously retained contaminants from the column [88] | Run a blank injection; Perform a strong solvent flush of the column [80] [88] |
The following workflow provides a logical pathway for diagnosing issues and deciding on a course of action, from initial symptom observation to the final recondition/replace decision.
The Decision Framework: Recondition vs. Replace
After diagnosing the issue, the choice between reconditioning and replacing the column depends on the nature of the problem, the potential for recovery, and the cost-benefit analysis of the restoration effort.
When to Recondition a Column
Reconditioning is a viable and cost-effective strategy when the column's issues are caused by reversible conditions. These typically involve contamination or minor physical blockages that have not permanently damaged the stationary phase [80].
- Minor Contamination: The accumulation of strongly retained sample components or matrix materials that can be dissolved and flushed out with strong solvents [80].
- Hydrophobic Collapse ("De-wetting"): This occurs in reversed-phase columns (especially C18) when they are exposed to 100% aqueous mobile phases for extended periods, causing the hydrophobic stationary phase to collapse within the pores. This is often recoverable by flushing with a high concentration (e.g., 95-100%) of a strong organic solvent like acetonitrile or isopropanol [80].
- Particulate Clogging: Blockage of the inlet frit by insoluble particles from the sample or system, which can sometimes be cleared by reverse-flushing the column [89]. This should be attempted with caution and only if the manufacturer allows it.
- Insufficient Equilibration: Performance issues arising from the column not being fully conditioned with the mobile phase before analysis, correctable with proper flushing protocols [80].
When to Replace a Column
Replacement becomes the necessary course of action when a column has suffered irreversible damage or has simply reached the end of its usable life despite restoration attempts [80] [88].
- Persistent Performance Issues: If thorough troubleshooting and reconditioning attempts fail to restore acceptable performance (e.g., peak shape, resolution, backpressure), the column is likely exhausted [80].
- Irreversible Chemical Damage: Exposure to mobile phases outside the recommended pH range can hydrolyze and dissolve the silica base, permanently degrading the stationary phase.
- Irreversible Physical Damage: Significant bed voiding caused by the collapse of the packed bed, often indicated by severe peak splitting or fronting that cannot be remedied [89].
- Exceeded Typical Lifespan: All columns have a finite lifespan. For reversed-phase columns analyzing pharmaceutical compounds, a typical lifetime is between 500–2,000 injections, depending heavily on sample cleanliness and operating conditions [88].
Cost-Benefit Analysis Table
The following table outlines key criteria to weigh when deciding between reconditioning and replacement.
Table 2: Reconditioning vs. Replacement Decision Matrix
| Decision Factor | Favoring RECONDITIONING | Favoring REPLACEMENT |
|---|---|---|
| Column History | Column is relatively new (< 500 injections) [88] | Column has a high injection count, nearing its expected lifespan [88] |
| Nature of Problem | Symptoms point to reversible contamination or de-wetting [80] [90] | Evidence of irreversible damage (e.g., bed voiding, chemical degradation) [80] |
| Time & Resource Cost | Simple flushing protocol required; Downtime is acceptable | Complex, multi-step restoration needed; Project timeline is critical |
| Success Probability | High likelihood of full recovery based on symptom diagnosis | Low likelihood of recovery; previous reconditioning attempts failed [80] |
| Regulatory Impact | Performance can be fully restored to pass system suitability [87] | Method adjustment outside original validation boundaries may be required [87] |
Detailed Experimental Protocols for Column Reconditioning
The following protocols provide step-by-step methodologies for restoring column performance. Always refer to the column manufacturer's instructions, as they take precedence over these general guidelines.
Protocol 1: Standard Reversed-Phase Column Washing
This protocol is designed to remove a wide range of organic and hydrophobic contaminants from standard reversed-phase columns (e.g., C18, C8, Phenyl) [80] [90].
- Flush with 20-30 column volumes of water to remove buffers and salts.
- Flush with 20-30 column volumes of acetonitrile or methanol.
- Flush with 20-30 column volumes of a stronger, less polar solvent like isopropanol to dissolve highly hydrophobic contaminants.
- Flush with 20-30 column volumes of a non-polar solvent like heptane or hexane to remove non-polar impurities (e.g., lipids).
- Repeat the sequence in reverse: Flush with isopropanol, then acetonitrile/methanol, and finally, water.
- Re-equilibrate the column with at least 10-20 volumes of the starting mobile phase before use [80].
Protocol 2: Restoration of Reversed-Phase Columns for Protein/Peptide Analysis
Columns used for biomolecule analysis require specific cleaning to remove proteinaceous residues.
- Flush with 20 column volumes of mobile phase without buffer salts.
- Flush with 20 column volumes of 0.1% Trifluoroacetic acid (TFA) in water.
- Flush with 20 column volumes of 0.1% TFA in a 1:2 mixture of acetonitrile and isopropanol.
- Re-equilibrate with the starting mobile phase [90].
Protocol 3: Clearing a Clogged Inlet Frit (Reverse Flushing)
This is a last-resort procedure for physically dislodging particles from the column inlet.
- Confirm with the manufacturer that the column can tolerate reverse flow.
- Remove the in-line filter or guard column if present.
- Reverse the column direction in the HPLC system, so flow goes from the outlet to the inlet, plumbed directly to waste.
- Flush with 10-20 column volumes of a strong solvent (e.g., acetonitrile or isopropanol).
- Return the column to its normal orientation and re-equilibrate. Monitor pressure and performance closely. Adding an in-line filter after this procedure is highly recommended to prevent recurrence [89].
The Scientist's Toolkit: Essential Reagents and Materials
Table 3: Key Reagent Solutions for HPLC Column Maintenance and Troubleshooting
| Item | Function / Purpose |
|---|---|
| HPLC-Grade Water | Flushing out buffers and salts during cleaning and storage [90] |
| HPLC-Grade Acetonitrile & Methanol | Primary solvents for dissolving and eluting a wide range of organic contaminants [80] [90] |
| HPLC-Grade Isopropanol | Stronger, more viscous solvent for removing highly hydrophobic compounds and for use in de-wetting recovery [80] [90] |
| Heptane or Hexane | Non-polar solvent for flushing out non-polar contaminants like lipids and oils [90] |
| Trifluoroacetic Acid (TFA) | Ion-pairing agent used in cleaning protocols for columns used in protein/peptide separations [90] |
| 0.2 µm or 0.45 µm Syringe Filters | Essential for filtering all samples and mobile phases to prevent particulate clogging [88] |
| In-line Filter (0.5 µm or 0.2 µm) | Placed before the column to trap particulates from the system and samples, protecting the column inlet frit [89] |
| Guard Column | A smaller, disposable column with the same packing as the analytical column. It sacrificially traps contaminants and particulates, significantly extending the life of the more expensive analytical column [88] |
A strategic approach to HPLC column management is fundamental for the efficiency and reliability of pharmaceutical analysis. By systematically diagnosing performance symptoms and applying the clear decision framework outlined in this document, scientists can confidently choose between reconditioning and replacement. Adopting the detailed restoration protocols and utilizing the essential tools in the Scientist's Toolkit will maximize column lifespan, ensure the integrity of analytical data, and optimize laboratory operational costs.
Ensuring Method Reliability: Validation, Comparative Analysis, and Regulatory Alignment
Within pharmaceutical analysis, the reliability of High-Performance Liquid Chromatography (HPLC) data is paramount for ensuring drug quality, safety, and efficacy. This reliability is formally established through analytical method validation, a process mandated by global regulatory bodies like the International Council for Harmonisation (ICH) and the U.S. Food and Drug Administration (FDA) [91]. The core of this process involves demonstrating that an analytical method is fit for its intended purpose through a set of key performance parameters. This application note, framed within a broader thesis on HPLC column selection, details the experimental protocols and acceptance criteria for five key validation parameters: Specificity, Linearity, Accuracy, Precision, and Robustness, in accordance with the modernized ICH Q2(R2) guideline [91] [92]. A thorough understanding of these parameters is essential for researchers and drug development professionals to develop robust, compliant, and defensible analytical methods.
Core Principles and Regulatory Framework
The recent adoption of ICH Q2(R2) and ICH Q14 guidelines marks a significant shift from a prescriptive, "check-the-box" validation approach to a more scientific, lifecycle-based model [91] [92]. This modern framework integrates method development with validation, emphasizing a proactive, risk-based strategy. Central to this is the Analytical Target Profile (ATP), a prospective summary of the method's intended purpose and desired performance criteria, which should be defined before development begins [91]. This ensures the validation study is designed to confirm the method meets all predefined requirements for its specific application, such as the separation of a particular pharmaceutical compound.
Detailed Parameters and Experimental Protocols
The following sections provide a detailed breakdown of the five key validation parameters, including their definitions, experimental methodologies, and data interpretation guidelines. The protocols are designed to be practical for scientists validating HPLC methods for pharmaceutical analysis.
Specificity
Definition: Specificity is the ability of the method to assess the analyte unequivocally in the presence of other components that may be expected to be present, such as impurities, degradants, or matrix components [93] [94]. A specific method yields results for the target analyte that are free from interference.
Experimental Protocol: The primary protocol for demonstrating specificity is through forced degradation studies (stress testing) [94]. The analyte is stressed under various conditions to intentionally generate degradation products.
- Procedure:
- Acidic/Basic Hydrolysis: Treat the analyte solution with 0.1 N HCl or 0.1 N NaOH at room temperature for a defined period (e.g., 2 hours). Neutralize before analysis [94].
- Oxidative Degradation: Expose the analyte solution to 3% hydrogen peroxide for a defined period at room temperature [94].
- Thermal Degradation: Subject the solid drug substance to elevated temperature (e.g., 80°C) for 24 hours [94].
- Photolytic Degradation: Expose the solid drug to UV light (e.g., at 254 nm) for 24 hours in accordance with ICH Q1B guidelines [94].
- Data Interpretation: The method is considered specific if the analyte peak is well-resolved from all degradation product peaks (with a resolution typically >1.5) and the peak purity of the analyte is confirmed using a diode array detector [94].
Linearity and Range
Definition: Linearity is the ability of the method to obtain test results that are directly proportional to the concentration of the analyte in a given range. The range is the interval between the upper and lower concentration levels for which linearity, accuracy, and precision have been demonstrated [93] [94].
Experimental Protocol:
- Procedure: Prepare a minimum of five standard solutions of the analyte at different concentrations across the specified range (e.g., 80%, 90%, 100%, 110%, 120% of the target concentration, or a range like 10–50 µg/mL) [94]. Inject each solution in triplicate.
- Data Analysis: Plot the mean peak area (or height) against the corresponding concentration. Perform linear regression analysis using the least squares method to determine the slope, y-intercept, and coefficient of determination (R²) [94].
- Acceptance Criteria: A correlation coefficient (R) of ≥ 0.999 is typically expected for HPLC assays [94]. The y-intercept should not be significantly different from zero.
Table 1: Example Linearity Data for Mesalamine Assay
| Concentration (µg/mL) | Peak Area (Mean ± SD, n=3) | % RSD |
|---|---|---|
| 20 | 1020 ± 10.2 | 1.0 |
| 25 | 1885 ± 15.1 | 0.8 |
| 30 | 2760 ± 16.6 | 0.6 |
| 35 | 3640 ± 21.8 | 0.6 |
| 50 | 6220 ± 31.1 | 0.5 |
| Regression Line | y = 173.53x – 2435.64 | |
| R² | 0.9992 |
Accuracy
Definition: Accuracy expresses the closeness of agreement between the measured value and a value accepted as a true or reference value [93]. It is often reported as percent recovery.
Experimental Protocol: The accuracy is typically determined using a standard addition (spiking) procedure [94].
- Procedure:
- Take a known amount of the sample matrix (e.g., placebo or pre-analyzed API).
- Spike it with known quantities of the analyte reference standard at three levels (e.g., 80%, 100%, and 120% of the target concentration).
- Analyze these spiked samples using the validated method.
- Calculate the recovery for each level using the formula:
% Recovery = (Measured Concentration / Theoretical Concentration) × 100.
- Acceptance Criteria: The mean recovery should be within 98–102% for the assay of an API, with a low relative standard deviation (%RSD) at each level [94].
Table 2: Example Accuracy (Recovery) Data
| Spike Level (%) | Theoretical Concentration (µg/mL) | Measured Concentration (Mean ± SD, n=3) | % Recovery (Mean) | % RSD |
|---|---|---|---|---|
| 80 | 40 | 39.62 ± 0.24 | 99.05 | 0.61 |
| 100 | 50 | 49.63 ± 0.16 | 99.25 | 0.32 |
| 120 | 60 | 59.48 ± 0.25 | 99.13 | 0.42 |
Precision
Definition: Precision expresses the closeness of agreement between a series of measurements obtained from multiple sampling of the same homogeneous sample under prescribed conditions. It is usually investigated at three levels: repeatability, intermediate precision, and reproducibility [93] [94].
Experimental Protocol:
- Repeatability (Intra-assay Precision):
- Procedure: Analyze six independent preparations of a homogeneous sample at 100% of the test concentration. The %RSD of the measured concentrations is calculated.
- Acceptance Criteria: The %RSD should typically be less than 1.0% for a drug assay [94].
- Intermediate Precision:
- Procedure: Demonstrate the method's reliability within the same laboratory under variations such as different analysts, different instruments, or different days. The results from both sets of experiments are combined, and the overall %RSD is calculated.
- Acceptance Criteria: The %RSD for intermediate precision is also expected to be below 1-2% [94].
Table 3: Example Precision Data
| Precision Type | Experimental Condition | Measured Concentration (Mean ± SD, n=6) | % RSD |
|---|---|---|---|
| Repeatability | Analyst A, Day 1, System 1 | 50.2 ± 0.3 | 0.60 |
| Intermediate Precision | Analyst B, Day 2, System 2 | 49.8 ± 0.4 | 0.80 |
| Combined Data | - | 50.0 ± 0.37 | 0.74 |
Robustness
Definition: Robustness is a measure of the method's capacity to remain unaffected by small, deliberate variations in method parameters (e.g., pH, mobile phase composition, flow rate, column temperature) and provides an indication of its reliability during normal usage [93] [52].
Experimental Protocol: A robustness study is systematically planned using a Design of Experiments (DoE) approach, such as a Plackett-Burman or Box-Behnken design, to efficiently evaluate multiple factors simultaneously [95].
- Procedure:
- Identify critical method parameters (e.g., mobile phase ratio ± 2%, flow rate ± 0.1 mL/min, pH ± 0.1 units, column temperature ± 2°C).
- Prepare a standard solution and a sample solution.
- Run the analysis under the varied conditions as per the experimental design.
- Monitor critical quality attributes like retention time, tailing factor, and resolution.
- Data Interpretation: The method is considered robust if the monitored responses show minimal variation and remain within predefined acceptance criteria (e.g., %RSD for assay results < 2%) across all deliberate changes [94].
The Scientist's Toolkit: Essential Research Reagents and Materials
The following table lists key materials and reagents required for the development and validation of an HPLC method for pharmaceutical analysis.
Table 4: Essential Research Reagent Solutions and Materials
| Item | Function & Importance |
|---|---|
| HPLC Column (C18) | The stationary phase for separation. Inert hardware is recommended for metal-sensitive compounds [9]. |
| Analytical Reference Standard | Provides the "true value" for method calibration and for determining accuracy and specificity [94]. |
| HPLC-Grade Solvents | High-purity methanol, acetonitrile, and water are used to prepare the mobile phase to ensure low UV background and reproducibility [94]. |
| Buffer Salts | Used to control the pH of the mobile phase, which is critical for the retention and peak shape of ionizable analytes [52]. |
| Forced Degradation Reagents | Acids (e.g., HCl), bases (e.g., NaOH), and oxidizers (e.g., H₂O₂) are used in stress studies to demonstrate specificity [94]. |
Method Validation Workflow
The following workflow diagrams the lifecycle of an analytical procedure, from development through validation, highlighting the role of the five key parameters.
Forced Degradation Study Workflow
The following diagram illustrates the logical flow of experiments conducted to establish method specificity through forced degradation.
The rigorous validation of HPLC methods is a non-negotiable requirement in pharmaceutical development. By systematically assessing specificity, linearity, accuracy, precision, and robustness, scientists provide the objective evidence required to ensure that their analytical methods consistently produce reliable, meaningful data. Adherence to the principles outlined in ICH Q2(R2) and the application of structured protocols, including DoE for robustness, not only ensures regulatory compliance but also builds a foundation of quality and confidence in the results that underpin drug development and patient safety.
Within pharmaceutical research, the selection of a high-performance liquid chromatography (HPLC) column is a critical determinant of the success and robustness of an analytical method. For scientists engaged in drug development, the core challenge extends beyond initial separation capabilities to encompass long-term reliability and consistent performance across different column batches. This application note provides a structured, data-driven framework for the comparative evaluation of HPLC columns, focusing on the three pivotal parameters of efficiency, lifetime, and lot-to-lot reproducibility. The protocols and data presented herein are designed to guide the selection of columns for the separation of pharmaceutical compounds, ensuring method robustness from discovery to quality control.
Column Performance Metrics and Experimental Design
Defining Key Performance Indicators (KPIs)
The evaluation of HPLC columns is based on quantifiable metrics that directly impact analytical method quality and cost-effectiveness.
- Efficiency: Often expressed as the number of theoretical plates per meter (N/m), this metric measures a column's ability to produce sharp, well-resolved peaks. Higher efficiency translates to better resolution of complex mixtures, which is crucial for analyzing pharmaceutical compounds and their potential impurities [9].
- Lifetime: A column's operational lifespan is measured by the number of injections it can withstand while maintaining its key performance characteristics, such as efficiency, peak shape, and backpressure. A longer column lifetime reduces analytical costs and downtime [96].
- Lot-to-Lot Reproducibility: This is the consistency of column performance (e.g., retention time, selectivity, efficiency) across different manufacturing lots. High reproducibility is essential for ensuring that validated methods perform identically when a column is replaced, a critical requirement in regulated pharmaceutical quality control environments [96].
Experimental Workflow for Column Evaluation
The following workflow provides a logical sequence for a comprehensive column evaluation study. This process ensures that data collected for efficiency, lifetime, and reproducibility is comparable and statistically sound.
Protocols for Performance Evaluation
Protocol 1: Assessing Column Efficiency
This protocol measures the intrinsic separating power of a column under ideal conditions.
- Objective: To determine the plate number (N) and peak symmetry (As) for a new column.
- Materials:
- Test columns (e.g., C18, superficially porous C18, phenyl-hexyl) [9].
- UHPLC or HPLC system capable of precise low-dispersion flow.
- Standard test mix: Typically includes uracil (or thiourea) for void time (t₀), and a few small, stable analytes like alkylparabens or pharmaceuticals relevant to your project.
- Mobile phase: Acetonitrile/water or methanol/water mixtures, often with a modifier like 0.1% formic acid.
- Procedure:
- Condition the column with the mobile phase for at least 30 minutes at the intended flow rate.
- Prepare a standard solution of the test mix at a suitable concentration.
- Inject the standard and run an isocratic or shallow gradient method.
- Record the chromatogram and measure the retention time (tᵣ), peak width at half height (w₀.₅), and peak asymmetry (As) at 10% of peak height for a well-retained peak.
- Calculate the plate number using the formula: N = 5.54 (tᵣ / w₀.₅)².
Protocol 2: Determining Column Lifetime
This accelerated protocol assesses a column's robustness under stressed conditions.
- Objective: To evaluate the number of injections a column can withstand before key performance parameters degrade beyond acceptable limits.
- Materials:
- Column to be evaluated.
- Standard test mix (as in Protocol 1).
- "Stressed" sample: A sample dissolved in a complex matrix (e.g., extracted plasma, dissolution media, crude reaction mixture) to simulate real-world analysis [96].
- Procedure:
- Perform initial efficiency and backpressure measurements using the standard test mix (Protocol 1).
- Create a sequence that alternates injections of the "stressed" sample with the standard test mix.
- After every 50-100 injections of the stressed sample, run the standard test mix.
- Monitor and record the backpressure, plate count (N), and peak asymmetry (As) from the standard test injections.
- The column lifetime endpoint is defined as the point at which a key parameter fails (e.g., >50% loss in efficiency, >80% increase in backpressure, or peak asymmetry outside 0.8-1.8).
Protocol 3: Evaluating Lot-to-Lot Reproducibility
This protocol assesses the consistency of a column manufacturer's production process.
- Objective: To quantify the variability in retention time, efficiency, and selectivity across three to five different manufacturing lots of the same column brand and phase.
- Materials:
- 3-5 different lot numbers of the same column model.
- Standard test mix containing 5-6 compounds representing a range of hydrophobicities and functional groups.
- Procedure:
- Install the first column and condition it.
- Run a standardized gradient method (e.g., 5-95% organic over 20 minutes).
- Record the retention time (tᵣ), peak area, and efficiency (N) for each analyte in the test mix.
- Repeat steps 1-3 for each column lot.
- Calculate the relative standard deviation (RSD%) for the retention time of each analyte across the different lots. An RSD of <1% for tᵣ is typically considered excellent for reversed-phase columns.
Data Presentation and Analysis
Quantitative Comparison of Column Performance
The following tables summarize hypothetical data generated from the protocols above, providing a template for comparing different column technologies.
Table 1: Initial Efficiency and Characteristics of Evaluated Columns
| Column Brand/Phase | Particle Technology | Particle Size (µm) | Theoretical Plates (N/m) | Peak Asymmetry (As) | Backpressure (bar) |
|---|---|---|---|---|---|
| Column A (C18) | Fully Porous | 1.7 | 285,000 | 1.05 | 870 |
| Column B (C18) | Superficially Porous [9] | 2.7 | 265,000 | 1.02 | 550 |
| Column C (Phenyl-Hexyl) [9] | Superficially Porous | 2.7 | 250,000 | 1.10 | 560 |
Table 2: Lifetime Study Results (Performance after 3000 Stressed Injections)
| Column Brand/Phase | % Efficiency Retained | % Backpressure Increase | Peak Asymmetry (As) Final | Estimated Lifetime (Injections) |
|---|---|---|---|---|
| Column A (C18) | 65% | 120% | 1.65 | ~3,200 |
| Column B (C18) | 88% | 45% | 1.15 | >5,000 |
| Column C (Phenyl-Hexyl) | 82% | 60% | 1.25 | >4,500 |
Table 3: Lot-to-Lot Reproducibility (RSD% of Retention Time, n=5 Lots)
| Analyte | Column A (C18) RSD% | Column B (C18) RSD% | Column C (Phenyl-Hexyl) RSD% |
|---|---|---|---|
| Analyte 1 | 0.8% | 0.3% | 0.4% |
| Analyte 2 | 1.5% | 0.5% | 0.6% |
| Analyte 3 | 1.2% | 0.4% | 0.7% |
| Average RSD% | 1.17% | 0.40% | 0.57% |
The Scientist's Toolkit: Essential Research Reagents and Materials
Table 4: Key Materials for HPLC Column Evaluation
| Item | Function/Description | Application Note |
|---|---|---|
| UHPLC/HPLC System | High-pressure capable system for precise mobile phase delivery, injection, and detection. | Necessary for exploiting modern high-efficiency columns, especially those with sub-2µm particles [9]. |
| Standard Test Mix | A solution of well-characterized compounds for measuring efficiency, peak shape, and retention. | Allows for standardized, objective comparison between different columns and lots. |
| "Stressed" Sample | A sample containing the analyte of interest in a complex, "dirty" biological or process matrix. | Simulates real-world analysis to aggressively test column lifetime and ruggedness [86]. |
| Inert/PFC-Free LC System | System with bioinert flow paths (e.g., PEEK, titanium) to minimize metal-sensitive analyte adsorption. | Critical for recovering metal-sensitive compounds like phosphorylated molecules [9]. |
| Charged Aerosol Detector (CAD) | A universal detector mentioned in advanced screening workflows [86]. | Useful for detecting analytes without a strong chromophore when developing methods for new chemical entities. |
A systematic approach to column evaluation is indispensable for developing robust and transferable HPLC methods in pharmaceutical research. As demonstrated, a column's value is a function of its initial efficiency, its operational lifetime, and the reproducibility of its performance across multiple production lots. While superficially porous particles often provide an excellent balance of high efficiency and low backpressure [9], and inert hardware is crucial for sensitive analytes [9], the final selection must be driven by data generated from a structured testing protocol. By adopting the comparative framework outlined in this application note, scientists and drug development professionals can make informed, defensible decisions in HPLC column selection, thereby de-risking the analytical workflow and ensuring consistent, high-quality results throughout the drug development lifecycle.
Strategies for Scaling from Analytical to Semi-Preparative Purification
Scaling liquid chromatography methods from analytical to semi-preparative scale is a critical process in pharmaceutical development, enabling researchers to obtain sufficient quantities of high-purity compounds for downstream testing and characterization. This transition requires careful consideration of column selection, instrument configuration, and method parameters to maintain separation efficiency while increasing throughput. The process is particularly crucial for challenging pharmaceutical compounds such as oligonucleotides, where isolating the full-length product from closely related impurities demands high-resolution separations even at larger scales [97]. This application note provides detailed strategies and protocols for successfully scaling purification methods, with specific emphasis on maintaining the kinetic and dynamic equivalence between analytical and semi-preparative formats to ensure consistent performance and high recovery of target compounds.
Theoretical Foundations of Scale-Up
The fundamental principle underlying scale-up in chromatography is maintaining consistency in the separation mechanics between analytical and semi-preparative systems. This involves preserving critical parameters that directly impact separation efficiency, including linear velocity, column geometry proportionality, and gradient profiles. When these factors are properly controlled, the separation achieved on an analytical system can be faithfully reproduced at semi-preparative scale, enabling predictable and reliable purification [97] [98].
The scale-up process requires careful calculation to maintain the same linear flow velocity between different column diameters. This is achieved by adjusting the volumetric flow rate proportionally to the cross-sectional area of the column. Similarly, injection volumes must be scaled according to the column volume ratio to maintain equivalent loading conditions. Gradient volumes and times should also be adjusted to preserve the number of column volumes used during the separation, ensuring consistent elution conditions [99] [97].
Experimental Protocols
Method Translation and Parameter Calculation
This protocol outlines a systematic approach for translating analytical methods to semi-preparative scale while maintaining separation fidelity.
Materials and Equipment:
- HPLC system capable of semi-preparative flow rates and equipped with fraction collection capability
- Analytical column (e.g., 4.6 mm ID) with established separation method
- Semi-preparative column with identical stationary phase chemistry
- Mobile phase components identical to analytical method
- Sample for purification
Procedure:
- Column Selection: Select a semi-preparative column with the same stationary phase chemistry and particle size as the analytical column. Ensure the column hardware is compatible with the intended application, particularly for metal-sensitive compounds like oligonucleotides or phosphorylated molecules where inert systems are preferred [9].
Flow Rate Calculation: Calculate the appropriate semi-preparative flow rate using the following equation: Flow Ratesemi-prep = Flow Rateanalytical × (IDsemi-prep² / IDanalytical²) Where ID represents the inner diameter of the respective columns [97].
Injection Volume Scaling: Determine the semi-preparative injection volume based on the ratio of column volumes: Injection Volumesemi-prep = Injection Volumeanalytical × (Volumesemi-prep / Volumeanalytical)
Gradient Adjustment: Adjust gradient times to maintain the same number of column volumes. The gradient time should be scaled using the same factor as the injection volume [97].
System Equilibration: Ensure the system is properly equilibrated with starting mobile phase conditions, monitoring pressure and baseline stability before sample injection.
Method Validation: Inject a test sample and compare the resulting chromatogram with the analytical reference to verify retention time consistency and resolution maintenance.
Troubleshooting Tips:
- If resolution decreases significantly, check linear velocity equivalence and consider slightly reducing sample loading.
- If peak shape deteriorates, verify column chemistry compatibility and assess potential hardware interactions, especially for metal-sensitive compounds [9].
- If retention times shift inconsistently, confirm gradient delay volume has been properly accounted for in method translation.
Oligonucleotide Purification Using IP-RP-HPLC
This specific protocol details the semi-preparative purification of oligonucleotides using ion-pair reversed-phase chromatography, based on research demonstrating high-purity purification with recoveries ranging from 94.1% to 99.3% [97] [98].
Materials and Equipment:
- DNAPac RP analytical and semi-preparative columns or equivalent
- Mobile phase A: 100 mM triethylamine acetate (TEAA) in water, pH 7.0
- Mobile phase B: 100 mM TEAA in water:acetonitrile (10:90, v/v)
- HPLC system with two pump configurations for both analytical and semi-preparative scales
- Fraction collector
Procedure:
- Analytical Method Development: Optimize separation on analytical column (e.g., 4.6 × 50 mm) using gradient elution with mobile phases A and B. Typical flow rate: 1.0 mL/min [97].
Sample Preparation: Dissolve crude oligonucleotide in appropriate solvent, typically water or mild buffer, with concentration optimized for loading capacity without overloading.
Scale-Up Calculation: Scale method parameters to semi-preparative column (e.g., 9.4 × 250 mm) maintaining linear velocity, load, and gradient profiles [97].
Purification Run:
- Equilibrate column with initial mobile phase conditions (e.g., 15% B)
- Inject sample using calculated volume
- Run optimized gradient at calculated flow rate (e.g., 4.0 mL/min for 9.4 mm ID column)
- Monitor elution at 260 nm
- Collect target peak fractions based on UV trigger or timed collection
Fraction Analysis: Analyze collected fractions using analytical IP-RP-HPLC to verify purity (typically >92.9% as demonstrated in research) [97].
Product Recovery: Pool high-purity fractions and desalt using appropriate method (e.g., dialysis, precipitation, or desalting columns).
Critical Considerations:
- Maintain consistent ion-pairing reagent concentration across scales
- Monitor column temperature as it significantly impacts oligonucleotide separation
- Use inert system components to minimize nonspecific adsorption [97]
Equipment and Column Selection
Successful scale-up requires appropriate selection of columns and instrumentation. The following tables summarize key parameters for different purification scales and column technologies suitable for pharmaceutical compound purification.
Table 1: Scale Comparison for HPLC Purification
| Parameter | Analytical HPLC | Semi-Preparative HPLC | Preparative HPLC |
|---|---|---|---|
| Column Inner Diameter (mm) | 2.1–4.6 [100] | 10–25 [100] | 30–100 [100] |
| Flow Rate (mL/min) | 0.2–2 [100] | 5–50 [100] | 50–1000+ [100] |
| Sample Load | µg range [100] | mg–g range [100] | g–kg range [100] |
| Primary Goal | Resolution >99% [100] | Purity >95% + Yield optimization [100] | Maximized throughput [100] |
| Particle Size | 3–5 µm [100] | 5–10 µm | 10–20 µm |
Table 2: Modern HPLC Column Technologies for Pharmaceutical Applications
| Column Type | Key Features | Applications | Vendor Examples |
|---|---|---|---|
| Superficially Porous Particles | Enhanced efficiency, lower backpressure | Small molecules, peptides, basic compounds | Halo (Advanced Materials Technology) [9] |
| Inert Hardware Columns | Reduced metal interactions, improved recovery | Metal-sensitive compounds, phosphorylated analytes, oligonucleotides | Halo Inert (Advanced Materials Technology), Restek Inert [9] |
| Wide-Pore SEC | Improved biomolecule separation | mRNA, AAVs, lipid nanoparticles | Various [101] |
| Monodisperse Porous Particles | High efficiency | Oligonucleotides without ion-pairing reagents | Evosphere (Fortis Technologies) [9] |
Scale-Up Workflow Visualization
The following diagram illustrates the systematic workflow for scaling from analytical to semi-preparative purification:
Research Reagent Solutions
Table 3: Essential Materials for Semi-Preparative Purification
| Item | Function | Application Notes |
|---|---|---|
| DNAPac RP Columns | Oligonucleotide separation using IP-RP-HPLC | Consistent resin across analytical and semi-preparative formats enables seamless scale-up [97] |
| Triethylamine Acetate (TEAA) | Ion-pairing reagent for oligonucleotide retention | Facilitates formation of neutral complexes with negatively charged ONs [97] |
| Inert HPLC Hardware | Minimizes metal-surface interactions | Critical for metal-sensitive compounds; improves peak shape and recovery [9] |
| Superficially Porous Particle Columns | Enhanced efficiency with lower backpressure | Suitable for both small molecules and biomolecules; Halo, Ascentis Express [9] |
| Bioinert Guard Cartridges | Protects analytical column extends lifetime | Particularly valuable for complex biological samples; YMC Accura BioPro [9] |
Successful scaling from analytical to semi-preparative purification requires methodical approach that maintains separation kinetics and dynamics across different scales. By carefully calculating scale-up parameters, selecting appropriate column technologies, and implementing robust protocols, researchers can reliably obtain high-purity compounds in the milligram to gram range needed for pharmaceutical development. The strategies outlined in this application note provide a framework for efficient method translation, with particular utility for challenging separations such as oligonucleotides where maintaining resolution is critical for isolating target compounds from closely related impurities. As demonstrated in recent research, this approach enables purities exceeding 92.9% with excellent recovery rates, supporting the continued development of complex pharmaceutical compounds [97] [98].
Adhering to ICH Guidelines for Pharmaceutical Quality Control Methods
The selection of a High-Performance Liquid Chromatography (HPLC) column is a foundational step in developing robust, reproducible, and regulatory-compliant quality control methods for pharmaceuticals. The International Council for Harmonisation (ICH) guidelines provide a critical framework for analytical method development and validation, emphasizing reliability and consistency across different laboratories and instruments [32]. The heart of any chromatographic separation, the HPLC column directly influences key method parameters such as selectivity, efficiency, and sensitivity. As the pharmaceutical industry expands to include complex modalities like biologics, oligonucleotides, and advanced therapy medicinal products (ATMPs), the strategic selection of HPLC columns aligned with ICH guidelines becomes even more crucial for ensuring product safety, efficacy, and quality [101] [102]. This document provides detailed application notes and protocols for HPLC column selection within the context of ICH Q2(R2) for method validation and the broader stability testing framework, offering practical guidance for researchers and drug development professionals.
Research Reagent Solutions: HPLC Column Components
The following table details essential HPLC column components and their functions, which are critical for method development and ensuring regulatory compliance.
Table 1: Key Research Reagent Solutions for HPLC Method Development
| Component | Function & Importance in Pharmaceutical Analysis |
|---|---|
| C18 (Octadecyl Silane) [103] | The most common reversed-phase ligand; provides strong hydrophobic retention and is versatile for a wide range of small molecules. USP classification L1. |
| C8 (Octyl Silane) [9] [103] | Provides weaker hydrophobic retention than C18, often leading to faster analysis times; useful for more hydrophobic molecules. USP classification L7. |
| Phenyl/Hexyl-Phenyl [9] [103] | Offers hydrophobic retention combined with π-π interactions for separating aromatic compounds or isomers, providing alternative selectivity. USP classification L11. |
| Polar-Embedded Phases [104] [103] | Alkyl chains (e.g., C18, C8) with embedded polar groups (e.g., amide); enhance retention of polar compounds and improve compatibility with 100% aqueous mobile phases. |
| Cyano (CN) [103] [105] | A versatile, weakly hydrophobic phase with dipole interactions; can be used in both reversed-phase and normal-phase modes. USP classification L10. |
| HILIC Phases (e.g., Amide, Diol) [103] | Hydrophilic stationary phases for separating polar to highly polar compounds that are poorly retained in reversed-phase HPLC. |
| Bioinert/Inert Hardware [9] | HPLC hardware with passivated surfaces (e.g., metal-free fluid paths) to minimize adsorption and improve recovery of metal-sensitive analytes like phosphorylated compounds, proteins, and peptides. |
HPLC Column Selection Criteria in Pharmaceutical Analysis
Strategic column selection is guided by the physicochemical properties of the analyte and the requirements of the analytical method. The following criteria are essential for developing methods that are robust, sensitive, and aligned with ICH Q2(R2) principles.
Stationary Phase Chemistry and Selectivity
The choice of stationary phase chemistry is the primary determinant of chromatographic selectivity and retention.
- Reversed-Phase for Small Molecules: For most small-molecule drug substances, reversed-phase chromatography (RPLC) on a C18 column is the default starting point [103]. Its popularity stems from predictable retention based on analyte hydrophobicity and consistent performance [103].
- Alternative Selectivity: When a C18 phase does not provide sufficient resolution, alternative phases should be explored. Phenyl phases interact strongly with analytes containing π-electron systems (e.g., aromatics), offering different selectivity [104]. FluoroPhenyl phases provide unique selectivity for compounds with halogen atoms or complex isomeric mixtures [9]. Polar-embedded phases are excellent for retaining very polar molecules and are more stable in highly aqueous mobile phases [104].
- Specialty Phases for Biomolecules: The analysis of large biomolecules (e.g., proteins, antibodies, AAVs) requires wide-pore materials (e.g., 300 Å) to allow full access to the pore structure for optimal separation [105] [101]. Ion-exchange (IEX) and size-exclusion chromatography (SEC) columns are also critical for characterizing charge variants and aggregates in biologics [103].
- Inert Hardware for Metal-Sensitive Analytes: To prevent analyte adsorption and poor recovery, columns with bioinert or inert hardware are recommended for analyzing metal-sensitive compounds such as phosphorylated drugs, oligonucleotides, and peptides [9]. This is critical for achieving the accuracy and precision required by ICH guidelines.
Physical Column Parameters
The physical dimensions and characteristics of the column directly impact method efficiency, speed, and sensitivity.
- Particle Size: This is a key determinant of column efficiency and backpressure.
- 5 µm: Provides good efficiency and is widely used for standard HPLC systems with pressure limits below 400 bar [104] [106].
- 3–3.5 µm: Offers higher efficiency and faster analyses than 5 µm particles, suitable for rapid separations on conventional or slightly upgraded HPLC systems [104] [105].
- Sub-2 µm Particles: Used with UHPLC systems capable of pressures up to 1000 bar or higher, enabling very fast, high-resolution separations [104].
- Superficially Porous Particles (SPP or Fused-Core): These particles, typically 2.7-2.6 µm, offer efficiencies approaching sub-2-µm fully porous particles but with lower backpressure, making them suitable for both HPLC and UHPLC systems [9] [104].
- Pore Size: The appropriate pore size is selected based on the molecular weight of the analyte to ensure access to the internal surface area.
- Column Dimensions: Length and internal diameter affect resolution, analysis time, and sensitivity.
- Length: Shorter columns (10-50 mm) are used for fast analysis, standard columns (100-150 mm) for routine separation, and longer columns (≥250 mm) for high-resolution needs [105].
- Internal Diameter:
The following workflow provides a logical, step-by-step guide for the column selection process.
Experimental Protocols
Protocol: Column Screening and Selectivity Assessment
This protocol is designed for the initial stages of method development to identify the most promising stationary phase for a given separation.
1. Objective: To systematically evaluate different HPLC stationary phases to identify the chemistry that provides the best resolution and selectivity for the target analytes.
2. Materials and Equipment:
- HPLC or UHPLC system with a binary or quaternary pump, autosampler, and diode array detector (DAD).
- Set of screening columns (e.g., C18, C8, Phenyl-Hexyl, Polar-embedded, HILIC) with identical dimensions (e.g., 50 mm x 4.6 mm, 2.7 µm) [9] [103].
- Mobile phase A: High-purity water with 0.1% formic acid or phosphoric acid.
- Mobile phase B: Acetonitrile or methanol with 0.1% formic acid or phosphoric acid.
- Reference standards of the target analytes and potential impurities.
- Appropriate solvents for sample preparation.
3. Procedure: 1. Mobile Phase Preparation: Prepare at least 1 liter of each mobile phase. Filter through a 0.22 µm or 0.45 µm membrane filter and degas. 2. Sample Preparation: Prepare a stock solution of the analyte and its known impurities. Dilute to a working concentration that provides a good detector response. The sample solvent should be compatible with the initial mobile phase composition. 3. Instrument Parameters: - Detection: DAD, scanning from 200 nm to 400 nm or at specific analyte λmax. - Column Temperature: 30 °C or 40 °C. - Injection Volume: 1-10 µL, depending on column dimensions and concentration. - Flow Rate: 1.0 mL/min for 4.6 mm i.d. columns. 4. Gradient Program: - Initial: 5% B - Ramp to 95% B over 10-15 minutes - Hold at 95% B for 2 minutes - Re-equilibrate at 5% B for 3-5 minutes. 5. Screening Execution: Install the first column and allow for temperature equilibration. Perform 2-3 blank injections to condition the column. Inject the sample mixture and record the chromatogram. Repeat this process for each column in the screening set. 6. Data Analysis: Compare chromatograms for critical peak pairs, overall resolution, peak shape (asymmetry factor), and analysis time. The column that provides baseline resolution for all critical pairs and symmetrical peaks should be selected for further method optimization.
Protocol: Method Validation as per ICH Q2(R2)
Once a column is selected and method conditions are optimized, the following protocol outlines the key validation experiments.
1. Objective: To establish, through laboratory studies, that the analytical method's performance characteristics are suitable for its intended application, ensuring reliability, accuracy, and consistency.
2. Materials and Equipment:
- Qualified HPLC system.
- Qualified column (the selected column from Protocol 4.1).
- Certified reference standards of the drug substance and its impurities.
- Weighed amounts of placebo (excipients).
3. Procedure and Acceptance Criteria: - Specificity/Selectivity: - Procedure: Inject blank (mobile phase), placebo, standard (analyte), and samples spiked with impurities/degradants (from forced degradation studies). - Acceptance Criteria: The analyte peak should be pure and free from interference from the blank, placebo, and any degradation products. This demonstrates the stability-indicating nature of the method [102]. - Linearity and Range: - Procedure: Prepare and inject a minimum of 5 concentrations of the analyte, typically from 50% to 150% of the target concentration. - Acceptance Criteria: The correlation coefficient (r) should be >0.999. The y-intercept should not be significantly different from zero. - Accuracy: - Procedure: Spike the placebo with the analyte at three concentration levels (e.g., 50%, 100%, 150%) in triplicate. Compare the measured amount to the known, added amount. - Acceptance Criteria: Recovery should be within 98.0–102.0% for the drug substance. - Precision: - System Precision: Inject six replicates of the standard solution. - Acceptance Criteria: %RSD of peak area should be ≤1.0%. - Method Precision (Repeatability): Prepare and analyze six independent sample preparations as per the method. - Acceptance Criteria: %RSD of the assay result should be ≤2.0%. - Robustness: - Procedure: Deliberately vary method parameters (e.g., flow rate ±0.1 mL/min, column temperature ±2°C, mobile phase pH ±0.1 units) and evaluate the impact on system suitability criteria. - Acceptance Criteria: The method should meet all system suitability requirements under all varied conditions.
Protocol: Method Transfer with Column Equivalency and Dwell Volume Assessment
This protocol ensures a robust transfer of an HPLC method between laboratories or instruments, a critical step for regulatory compliance [32].
1. Objective: To successfully transfer a validated HPLC method from a sending unit to a receiving unit, accounting for potential differences in column selectivity and instrument dwell volume.
2. Materials and Equipment:
- Identical analytical methods and columns at both sending and receiving units.
- A second "equivalent" column from a different manufacturer or lot, selected using a column comparison tool like the Hydrophobic Subtraction Model (HSM) [32].
- Standard and sample solutions from the same batch.
3. Procedure: 1. Column Equivalency Assessment: - Perform the method on the original column and the proposed "equivalent" column in the sending laboratory using the same instrument and samples. - Compare critical parameters: retention time of the active, relative retention times of impurities, resolution between critical pairs, tailing factor, and plate count. - If the "equivalent" column meets system suitability criteria, it can be qualified for use [32]. 2. Dwell Volume Determination and Adjustment: - Determine Dwell Volume: The receiving unit should measure the dwell volume of their instrument using a known method (e.g., a step gradient with a UV-active tracer) [32]. - Compare to Sending Unit: Compare the dwell volume of the receiving instrument to that of the sending instrument. - Adjust Gradient Program: If a significant difference exists (>10% of the total gradient time), adjust the initial isocratic hold in the receiving unit's method to compensate. For example, if the receiving instrument has a larger dwell volume, add an equivalent isocratic hold at the initial gradient conditions to the method to ensure the sample experiences the same solvent profile [32]. 3. Method Transfer Execution: - The receiving unit performs the method (with dwell volume adjustments if needed) on their system using the qualified column. - Pre-defined system suitability tests and comparative analysis of samples are used as success criteria.
The relationship between instrument dwell volume and gradient elution is critical for reproducible method transfer.
Adherence to ICH guidelines is non-negotiable for developing pharmaceutical quality control methods that are scientifically sound and globally acceptable. A strategic, knowledge-based approach to HPLC column selection is a cornerstone of this process. By systematically evaluating stationary phase chemistry, optimizing physical column parameters, and rigorously validating method performance, scientists can ensure data integrity and product quality. Furthermore, proactively addressing challenges such as column equivalency and instrument dwell volume during method transfer is essential for maintaining robustness and reproducibility across different laboratories [32]. As the industry continues to evolve with new therapeutic modalities, the principles outlined in these application notes and protocols will remain vital for navigating the complexities of analytical development and upholding the highest standards of pharmaceutical quality control.
Application Note: Economic and Technical Considerations for HPLC Column Selection in Pharmaceutical Analysis
In pharmaceutical research and development, High-Performance Liquid Chromatography (HPLC) is indispensable for drug analysis, quality control, and regulatory compliance. The selection of HPLC columns presents a critical cost-benefit decision, where the initial purchase price must be balanced against performance characteristics, lifetime, and total cost of ownership. This application note provides a structured framework for selecting HPLC columns that optimize this balance, ensuring analytical reliability while managing operational expenditures in drug development workflows.
Market Context and Column Economics
The global HPLC columns market, valued at $2.9 billion in 2025, is projected to grow at a Compound Annual Growth Rate (CAGR) of 6.0% through 2033 [107]. This growth is fueled by the expanding pharmaceutical and biotechnology sectors, which constitute approximately 60% of the total market volume for HPLC columns [107]. Another analysis projects the market to reach $7.64 billion by 2032, reflecting a similar growth trajectory [33]. Understanding this market landscape helps contextualize procurement decisions and supplier selection strategies.
Table: Global HPLC Columns Market Overview
| Metric | Value (2025) | Projected Value | CAGR | Dominant Segment |
|---|---|---|---|---|
| Market Size [107] | $2.906 Billion | - | 6.0% (2025-2033) | - |
| Market Size [33] | $4.98 Billion | $7.64 Billion (2032) | 6.3% (2025-2032) | - |
| Pharmaceutical Sector Share [107] | ~60% | - | - | Reversed-Phase (31.6%) |
Core Selection Framework: Balancing Cost and Performance
The following table summarizes the key parameters for HPLC column selection, linking physical characteristics to their impact on both performance and cost.
Table: HPLC Column Selection Parameters and Cost-Benefit Considerations
| Parameter | Performance & Application Impact | Cost & Longevity Implications |
|---|---|---|
| Particle Size [108] [104] | Sub-2 µm: Highest efficiency, fastest analysis. 3-5 µm: Standard efficiency, versatile. >5 µm: Lower efficiency, longer analysis times. | Sub-2 µm requires UHPLC instrumentation (high capital cost), potentially higher backpressure. Standard particles are more affordable to operate. |
| Column Dimensions [104] | Narrow-bore (e.g., 2.1 mm): Increased sensitivity, solvent savings. Standard (4.6 mm): Compatible with traditional HPLC. | Narrow-bore reduces solvent consumption (lower operating cost). Standard dimensions offer broad compatibility. |
| Stationary Phase [107] [104] | C18: Versatile, robust for most small molecules. Specialized (e.g., Chiral, HILIC): For specific separations (e.g., enantiomers). | C18 is cost-effective for general use. Specialized phases command premium prices but are essential for specific APIs. |
| Base Material [10] [109] | Silica-based: High efficiency, but limited pH range (2-8). Polymer-based: Excellent pH stability (1-13), chemically inert. | Polymer columns often have a higher initial cost but can offer longer lifetime with aggressive mobile phases, improving cost-of-ownership. |
Experimental Protocols
Protocol 1: Systematic Column Evaluation for Method Development
This protocol provides a standardized procedure for evaluating and comparing different HPLC columns for a specific pharmaceutical application.
2.1.1 Research Reagent Solutions Table: Essential Materials for Column Evaluation
| Item | Function/Description |
|---|---|
| Analytical Standards | High-purity target analyte and known impurities. |
| Mobile Phase Solvents | HPLC-grade water, acetonitrile, methanol, and buffer salts. |
| Candidate HPLC Columns | Columns of varying chemistry (e.g., C18, C8, phenyl), particle size, and manufacturer. |
| Guard Columns | Matched to each analytical column to protect it and extend its life [110]. |
2.1.2 Procedure
- System Preparation: Equilibrate the HPLC system with initial mobile phase conditions (e.g., 50:50 aqueous buffer:organic solvent). Ensure the system is free of contaminants and previous mobile phases [110].
- Column Conditioning: Flush the new column with 10-15 column volumes of the starting mobile phase to ensure stability and reproducible performance.
- System Suitability Test: Inject the standard mixture and compare the results (efficiency, asymmetry, resolution) against the manufacturer's quality control test sheet provided with the column [110].
- Performance Benchmarking: Inject the sample mixture and record chromatographic data for all candidate columns under identical method conditions.
- Data Analysis: Quantitatively analyze key parameters for each column: plate count (N), peak asymmetry factor (As), resolution (Rs) between critical pairs, and operating backpressure.
The logical workflow for this evaluation is outlined below.
Protocol 2: Column Lifetime and Performance Monitoring
This protocol establishes a routine for monitoring column health to maximize longevity and ensure data integrity, thereby optimizing the column's cost-of-ownership.
2.2.1 Procedure
- Establish a Baseline: Upon receiving a new column, run a standardized test mixture and retain the chromatogram as a reference for future comparisons [110].
- Routine Monitoring: Periodically (e.g., every 100-200 injections or weekly), run the same test mixture under identical conditions.
- Performance Tracking: Quantitatively compare the current chromatogram with the baseline. Key indicators of column degradation include:
- A ≥ 10% increase in plate height (or decrease in plate count).
- A significant change in peak asymmetry (tailing or fronting).
- A consistent rise in operating backpressure.
- A loss of resolution between critical peak pairs.
- Preventive Maintenance: Use guard columns to protect the analytical column from damaging sample matrices, potentially extending its life to 200-500 injections or more [110].
- Proper Storage: For long-term storage (>1 day), flush the column thoroughly to remove buffers and acids, and store in a pure aprotic organic solvent like acetonitrile [110].
The relationship between monitored parameters and their implications is conceptualized below.
A strategic approach to HPLC column selection and management in pharmaceutical research requires looking beyond the initial price tag. The optimal choice is driven by the specific analytical application and a thorough understanding of the total cost of ownership, which encompasses column lifetime, solvent consumption, and required instrumentation. By implementing the structured evaluation and monitoring protocols outlined in this document, researchers can make informed, cost-effective decisions that ensure analytical data quality and support efficient drug development.
Conclusion
Strategic HPLC column selection is a cornerstone of efficient and reliable pharmaceutical analysis, directly impacting drug development timelines and quality control. By integrating foundational knowledge of modern column technologies with robust methodological development and proactive troubleshooting, scientists can achieve superior separations even for the most challenging compounds. Future directions will be shaped by the increasing analysis of complex biologics, the integration of AI for automated method optimization, and a growing emphasis on sustainable practices through green chromatography. Embracing these advancements will ensure that HPLC remains an indispensable tool for delivering safe and effective medicines.
References
- 1. The Role of Selectivity in Liquid Chromatography Method ... [https://www.restek.com/articles/the-role-of-selectivity-in-liquid-chromatography-method-development?srsltid=AfmBOop9zQbmICvvnoUTWsbx21t8du5m9z4OkTBK6DXggs99mUnKJJrY]
- 2. Choosing the Correct Column for Chromatographic ... [https://www.waters.com/blog/choosing-the-correct-column-for-chromatographic-selectivity/?srsltid=AfmBOorr5X-70Fqv_kFhbN17XM2iIWLsR17aM7t0e8gKHe2ZH9mQngop]
- 3. Methods for Changing Peak Resolution in HPLC [https://www.chromatographyonline.com/view/methods-changing-peak-resolution-hplc-advantages-and-limitations]
- 4. Retention Factor is Independent of Pressure in Liquid ... [https://www.chromatographyonline.com/view/retention-factor-is-independent-of-pressure-in-liquid-chromatography-right-]
- 5. Resolution, Selectivity & Efficiency In Liquid ... [https://www.millennialscientific.com/post/resolution-selectivity-efficiency-in-liquid-chromatography-part-1-primer?srsltid=AfmBOorqvW6IlB5moQy-PL5SSnUZBkGku8V0j5kInKhm6lKT-C9rnd-q]
- 6. Theoretical Plates 'N' and their Determination in HPLC ... [https://www.pharmaguideline.com/2013/12/theoretical-plates-and-their-determination-in-hplc.html]
- 7. Formula for Calculating the Number of Theoretical Plates [https://www.shimadzu.com/an/service-support/technical-support/analysis-basics/basic/34/34tec.html]
- 8. Strategies for Method Development and Optimization in ... [https://www.drawellanalytical.com/strategies-for-method-development-and-optimization-in-hplc/]
- 9. Innovations in Liquid Chromatography: 2025 HPLC ... [https://www.chromatographyonline.com/view/innovations-in-liquid-chromatography-2025-hplc-column-and-accessories-review]
- 10. HPLC Column Selection Guide to Help You Achieve ... [https://www.sepscience.com/hplc-column-selection-guide-to-help-you-achieve-the-best-separation-7517]
- 11. LC Column Comparison [https://www.restek.com/pages/lc-columns-physical-characteristics?srsltid=AfmBOorSHE3fKrjx-_FPUOGhOTvnxwiI2lhOPCWJCL_uxVtRyOjGrAzh]
- 12. C8 HPLC Column 2025-2033 Market Analysis [https://www.datainsightsmarket.com/reports/c8-hplc-column-39985]
- 13. C8 HPLC Column 6.1 CAGR Growth Outlook 2025-2033 [https://www.archivemarketresearch.com/reports/c8-hplc-column-796256]
- 14. Systematic evaluation of phenyl stationary phases for ... [https://www.sciencedirect.com/science/article/pii/S0021967325007393]
- 15. HILIC Columns 4.0 CAGR Growth Outlook 2025-2033 [https://www.archivemarketresearch.com/reports/hilic-columns-192954]
- 16. Separation of Basic Drug Compounds (PRP-C18) [https://www.hamiltoncompany.com/knowledge-base/application-note/basic-drug-compounds-prp-c18?srsltid=AfmBOop67QDjz85A1o4HH5R2PNpL66NqycHyoG3Tk34N1xHQ0qeSxp-x]
- 17. Systematic evaluation of phenyl stationary phases for ... [https://pubmed.ncbi.nlm.nih.gov/41038078/]
- 18. C8 vs C18 Column: Which Should You Choose? [https://www.sepscience.com/c8-vs-c18-columns-which-should-you-choose-11217]
- 19. Fully Porous Particles in U/HPLC [https://www.phenomenex.com/liquid-chromatography/particle-type/fully-porous?srsltid=AfmBOorM5dr0ysqDrglViyGMEtAcWnG8DoA6rbHrg3RqBwnTWAC__zyz]
- 20. The Increasing Role of Superficially Porous Particles in ... [https://www.chromatographyonline.com/view/increasing-role-superficially-porous-particles-hplc-0]
- 21. Kinetic performance comparison of fully and superficially ... [https://pmc.ncbi.nlm.nih.gov/articles/PMC5760962/]
- 22. Monodisperse droplets and particles by efficient ... [https://www.sciencedirect.com/science/article/pii/S0021850221006352]
- 23. Monodisperse Gold Nanoparticles: A Review on Synthesis ... [https://pmc.ncbi.nlm.nih.gov/articles/PMC9266776/]
- 24. An Approach to Monodisperse Polymeric Particles as ... [https://www.mdpi.com/2673-7167/5/1/2]
- 25. Fast and High Efficiency HPLC Separations Using ... [https://www.registech.com/blog/fast-and-high-efficiency-hplc-separations-using-superficially-porous-particles/]
- 26. HPLC Column Technical Guide - GL Sciences [https://www.glsciencesinc.com/blog/hplc-column-technical-guide?srsltid=AfmBOoqpURqTAAiFdenzb6UuXtMfQdKiB3WrmsxqpDijoH8T9_luA1gq]
- 27. Solving Key Challenges in (Bio)pharmaceutical Analyses [https://www.chromatographyonline.com/view/solving-key-challenges-in-bio-pharmaceutical-analyses]
- 28. Overcoming Metal Interference in HPLC [https://www.technologynetworks.com/analysis/white-papers/overcoming-metal-interference-in-hplc-405478]
- 29. Comparison of a chromatographic performance for bioinert ... [https://www.selectscience.net/resource/comparison-of-a-chromatographic-performance-for-bioinert-hplc-column-hardware-to-standard-hplc-hardware]
- 30. Bioinert HPLC & UHPLC Columns [https://ymc.eu/bioinert-hplc-uhplc-columns.html]
- 31. Metal-Free Columns Significantly Improve Peak Shape, ... [https://www.chromatographyonline.com/view/metal-free-columns-significantly-improve-peak-shape-recovery-and-sensitivity-phosphorylated-compound]
- 32. RDPA 2025: Strategies for Robust HPLC Method Transfer [https://www.cps.it/rdpa-2025/]
- 33. HPLC Columns Market Size, Trends & YoY Growth Rate, ... [https://www.coherentmarketinsights.com/industry-reports/hplc-columns-market]
- 34. Modern Capillary Scale Liquid Chromatography Columns [https://www.chromatographyonline.com/view/modern-capillary-scale-liquid-chromatography-columns-an-update]
- 35. Popular Small Molecule HPLC UHPLC Column Brands [https://www.thermofisher.com/us/en/home/industrial/chromatography/liquid-chromatography-lc/hplc-uhplc-columns/popular-small-molecule-hplc-uhplc-column-brands.html]
- 36. Choosing the Right HPLC Column: A Complete Guide [https://www.phenomenex.com/knowledge-center/hplc-knowledge-center/choosing-the-right-hplc-column?srsltid=AfmBOopu8V3APMRIREBQoPRpIVttmymSupS-ii33jsxsKJlGCCjTyQ5j]
- 37. HPLC in Pharmaceutical Applications [https://www.labmanager.com/hplc-in-pharmaceutical-applications-25323]
- 38. Choosing the Right HPLC Stationary Phase [https://www.chromatographyonline.com/view/choosing-right-hplc-stationary-phase]
- 39. Considerations for Selecting and Maintaining Column ... [https://www.sepscience.com/considerations-for-selecting-and-maintaining-column-phases-for-optimizing-liquid-chromatography-8836]
- 40. HPLC Columns & LC Columns | Types, How to ... - GL Sciences [https://www.glsciencesinc.com/hplc-columns?srsltid=AfmBOoqW0BJJ_mLHdCNj5z0G-NbXY1OmkwJcCDNCmnV38U88In3PEhNT]
- 41. HPLC Column Selection Guide [https://www.auroraprosci.com/HPLC-column-selection-guide?srsltid=AfmBOoo8jx3e0cJhWYyxstqsMQERUK56TomdG5fF8mAwS0HlO16sUOCh]
- 42. Modern Trends and Best Practices in Mobile-Phase ... [https://www.chromatographyonline.com/view/modern-trends-and-best-practices-mobile-phase-selection-reversed-phase-chromatography-0]
- 43. Mobile Phase Optimization: A Critical Factor in HPLC [https://www.phenomenex.com/knowledge-center/hplc-knowledge-center/mobile-phase-in-chromatography?srsltid=AfmBOopVU6rHApuG0hMVT_0gKYpJ2_Ur6rJ1TwOHF-9ZeKRyHkpzcvYu]
- 44. HPLC Method Development Steps [https://www.thermofisher.com/us/en/home/industrial/chromatography/chromatography-learning-center/liquid-chromatography-information/hplc-method-development-steps.html]
- 45. HPLC Column Selection Guide [https://scioninstruments.com/us/blog/hplc-column-selection-guide/]
- 46. HPLC Columns Explained: Types, Uses & Selection Tips [https://zodiaclifesciences.com/hplc-columns-explained/]
- 47. High perfomance liquid chromatography in pharmaceutical ... [https://pubmed.ncbi.nlm.nih.gov/15629016/]
- 48. Essential Applications of HPLC in the Pharmaceutical ... [https://njlabs.com/essential-applications-of-hplc-in-the-pharmaceutical-industry/]
- 49. High-performance liquid chromatography [https://en.wikipedia.org/wiki/High-performance_liquid_chromatography]
- 50. A Guide to (U)HPLC Column Selection for Protein Analysis [https://www.chromatographyonline.com/view/a-guide-to-u-hplc-column-selection-for-protein-analysis]
- 51. Oligonucleotide HPLC and UHPLC Columns [https://www.thermofisher.com/us/en/home/industrial/chromatography/liquid-chromatography-lc/hplc-uhplc-columns/biomolecule-hplc-uhplc-columns/oligonucleotide-hplc-uhplc-columns.html]
- 52. HPLC Method Development and Validation for ... [https://www.pharmtech.com/view/hplc-method-development-and-validation-pharmaceutical-analysis]
- 53. Size Exclusion (SEC) HPLC Columns for Aggregate Analysis [https://www.thermofisher.com/us/en/home/industrial/chromatography/liquid-chromatography-lc/hplc-uhplc-columns/biomolecule-hplc-uhplc-columns/size-exclusion-sec-hplc-columns-aggregate-analysis.html]
- 54. Development of an HPLC method using relative molar ... [https://pmc.ncbi.nlm.nih.gov/articles/PMC11227149/]
- 55. Advances in ultra‐high‐pressure and multi‐dimensional liquid ... [https://pmc.ncbi.nlm.nih.gov/articles/PMC10989561/]
- 56. Leveraging Multidimensional Modeling to Resolve ... [https://www.chromatographyonline.com/view/leveraging-multidimensional-modeling-to-resolve-frequent-separation-challenges-in-hplc]
- 57. A new metric for preliminary column selection [https://www.sciencedirect.com/science/article/pii/S0021967324009658]
- 58. Optimization of HPLC methods for the development ... [https://pmc.ncbi.nlm.nih.gov/articles/PMC12105191/]
- 59. Innovations and Future Trends in HPLC Column Technology [https://www.pharmtech.com/view/innovations-and-future-trends-hplc-column-technology]
- 60. Steps for HPLC Method Development [https://www.pharmaguideline.com/2015/10/procedure-to-develop-hplc-method.html]
- 61. Don't Get Lost in Your HPLC Method Development [https://www.thermofisher.com/blog/analyteguru/don-t-get-lost-in-your-hplc-method-development/]
- 62. Two sustainable chromatographic approaches for ... [https://www.nature.com/articles/s41598-025-22295-6]
- 63. Peak Tailing in HPLC [https://www.elementlabsolutions.com/uk/chromatography-blog/post/peak-tailing-in-hplc]
- 64. How to Reduce Peak Tailing in HPLC? [https://www.phenomenex.com/knowledge-center/hplc-knowledge-center/how-to-reduce-peak-tailing-in-hplc?srsltid=AfmBOopoWTENem6w28JZdFFmXpG70fwbVUEr53eWMDkML09_52tV4BTP]
- 65. Causes of Retention Time Drift in HPLC [https://www.elementlabsolutions.com/uk/chromatography-blog/post/causes-of-retention-time-drift-in-hplc]
- 66. The LCGC Blog: Retention Shifts in HPLC [https://www.chromatographyonline.com/view/lcgc-blog-retention-shifts-hplc]
- 67. Retention Shifts [https://www.sepscience.com/retention-shifts-7166]
- 68. Diagnosing and Preventing High Back Pressure in LC ... [https://www.restek.com/articles/diagnosing-and-preventing-high-back-pressure-in-lc-systems?srsltid=AfmBOoq3t-rGpvQjQUidPTtRcnX3bZPGIWuA-EVISYJQJHTputWiQ2kS]
- 69. Troubleshooting High Backpressure in HPLC System [http://www.chromforum.org/viewtopic.php?t=122135]
- 70. HPLC Back Pressure Problem [https://www.chromatographyonline.com/view/hplc-back-pressure-problem]
- 71. Maintenance and Care of HPLC Columns ... [https://www.phenomenex.com/knowledge-center/hplc-knowledge-center/maintenance-and-care-hplc-columns?srsltid=AfmBOorQ0bVVlIoijgPtTWu3IdFxCAwk-Pjiy1A__c2YpZsN0_kQi49O]
- 72. HPLC Column Care, Troubleshooting, Restoration, and ... [https://www.hamiltoncompany.com/knowledge-base/article/hplc-column-care-troubleshooting-restoration-and-storage?srsltid=AfmBOop-fJHwSrkM0rRcpTW6GHO0yBgn8Y1lZFFP_tBGRSZ-gKOFT-JD]
- 73. Column Care for the Long Haul—Considerations ... [https://www.chromatographyonline.com/view/column-care-long-haul-considerations-column-storage]
- 74. HPLC Column Cleaning & Washing Procedure - GL Sciences [https://www.glsciencesinc.com/blog/hplc-column-washing-procedure?srsltid=AfmBOooB0pvaLUdl5qCVxPtqq2W_U9JMIC7_f6jWwr-FUzhxATBbILY1]
- 75. HPLC Tips & Tricks: Proper Storage of HPLC/UHPLC ... [https://www.sigmaaldrich.com/US/en/technical-documents/technical-article/analytical-chemistry/small-molecule-hplc/proper-storage-of-hplc-uhplc-columns?srsltid=AfmBOoqM0ABbe-U6KuZq1gLaVDYxcyZCScajy11d0uOtKxIAQOcXparW]
- 76. [Readers Insight] HPLC Column Selection: Core to Method ... [https://www.welch-us.com/blogs/knowleage-base/hplc-column-selection-core-to-method-development-part-ii]
- 77. Preventing Hydrophobic Collapse: Demystifying AQ Columns [https://www.welch-us.com/blogs/knowleage-base/preventing-hydrophobic-collapse-demystifying-aq-columns]
- 78. News - Hydrophobic Phase Collapse, AQ Reversed ... [https://www.santaisci.com/news/hydrophobic-phase-collapse-aq-reversed-phase-chromatography-columns-and-their-applications/]
- 79. Retention Loss of Reversed-Phase Columns Using Highly ... [https://www.chromatographyonline.com/view/retention-loss-of-reversed-phase-columns-using-highly-aqueous-mobile-phases-fundamentals-mechanism-and-practical-solutions]
- 80. HPLC Column Troubleshooting: Restore Performance & ... [https://www.labx.com/resources/hplc-column-troubleshooting-restore-performance-optimize-your-chromatography/26]
- 81. Clogged Systems in HPLC: Causes, Troubleshooting, and ... [https://uhplcs.com/clogged-systems-in-hplc-causes-troubleshooting-and-prevention/]
- 82. How to Clean and Unclog Your HPLC Column [https://bitesizebio.com/29777/how-to-clean-hplc-column/]
- 83. Preventing and Fixing a Clogged HPLC Column: Key Insights [https://www.sepscience.com/hplc-solutions-82-column-blockage-6915]
- 84. Preventing LC Column Clogs [https://www.restek.com/videos/preventing-lc-column-clogs?srsltid=AfmBOoquGqYrecG00VgJ3ftjWWnia4YpmapjvunOcdGj1vWgLcGWc0iN]
- 85. Guide to Choosing the Correct HPLC Solvent [https://www.phenomenex.com/knowledge-center/hplc-knowledge-center/hplc-solvent-selection-guide?srsltid=AfmBOorpHSPDO-3D4AZwLj1T0cDmtnpm_ccZVvdwWJWYasFRhL8Ogn2_]
- 86. HPLC 2025 Update Day 2: Pharmaceutical Separations ... [https://www.chromatographyonline.com/view/hplc-2025-update-day-2-pharmaceutical-separations-session]
- 87. Adjusting Conditions for a Routine Reversed-Phase HPLC ... [https://www.chromatographyonline.com/view/adjusting-conditions-routine-reversed-phase-hplc-assay-part-ii-changing-separation-conditions]
- 88. How Long Does an HPLC Column Last? [https://uhplcs.com/how-long-does-an-hplc-column-last/]
- 89. Detective Work, Part II: Physical Problems with the Column [https://www.chromatographyonline.com/view/detective-work-part-ii-physical-problems-column]
- 90. Restoration of HPLC Column Performance [https://lab-training.com/restoration-hplc-column-performance/]
- 91. ICH and FDA Guidelines for Analytical Method Validation [https://www.labmanager.com/ich-and-fda-guidelines-for-analytical-method-validation-34252]
- 92. 2025 Trends In Pharmaceutical Analytical Methods ... [https://agnopharma.com/blog/trends-in-pharmaceutical-analytical-methods-development-validation/]
- 93. The 6 Key Aspects of Analytical Method Validation [https://www.elementlabsolutions.com/uk/chromatography-blog/post/6-key-aspects-of-analytical-method-validation]
- 94. Design and validation of a robust stability-indicating reversed ... [https://pmc.ncbi.nlm.nih.gov/articles/PMC12619242/]
- 95. A DoE-guided development and validation of a novel ... [https://pubs.rsc.org/en/content/articlelanding/2025/ay/d5ay00310e]
- 96. HPLC Columns [https://www.labmanager.com/hplc-columns-1-16564]
- 97. Scale-up of analytical IP-RP-HPLC methods for high-purity ... [https://www.sciencedirect.com/science/article/pii/S1570023225002247]
- 98. Scale-up of analytical IP-RP-HPLC methods for high-purity ... [https://pubmed.ncbi.nlm.nih.gov/40424946/]
- 99. HPLC Purification: When to Use Analytical, Semi- ... [https://www.thermofisher.com/blog/analyteguru/hplc-purification-when-to-use-the-3-types-of-preparatory-methods/]
- 100. Analytical vs. Semi-Preparative vs. Preparative HPLC [https://www.metwarebio.com/hplc-types-guide-analytical-vs-preparative/]
- 101. Selected new approaches and future perspectives in liquid ... [https://www.sciencedirect.com/science/article/pii/S0928098725001009]
- 102. You Need to Know About the 2025 ICH Q1 (Draft) Guideline [https://www.linkedin.com/pulse/all-you-need-know-2025-ich-q1-draft-guideline-chandramouli-r-fmd1c]
- 103. HPLC Columns & LC Columns | Types, How to ... - GL Sciences [https://www.glsciencesinc.com/hplc-columns?srsltid=AfmBOoolWFX151jtqolsUrm0ysx53XCWHaAgfRRKYkpxNCp9gdRlBRs7]
- 104. HPLC Column Selection [https://www.chromatographyonline.com/view/hplc-column-selection-0]
- 105. HPLC Column Selection Guide [https://www.auroraprosci.com/HPLC-column-selection-guide?srsltid=AfmBOoq7xvWGrbBFiaHnS0rEQpAE4ZGm8-EEP7gex39CC35md7VH_ETY]
- 106. TECH TIP: HPLC Column Selection [https://gentechscientific.com/hplc-column-selection/]
- 107. HPLC Columns Strategic Insights: Analysis 2025 and ... [https://www.archivemarketresearch.com/reports/hplc-columns-213249]
- 108. Current Trends in HPLC Column Usage [https://www.chromatographyonline.com/view/current-trends-hplc-column-usage]
- 109. HPLC Column Market - Growth and Forecast to 2035 [https://www.transparencymarketresearch.com/hplc-column-market.html]
- 110. Everything you ever wanted to know about HPLC columns [https://www.selectscience.net/article/everything-you-ever-wanted-to-know-about-hplc-columns]