Strategies for Reducing Impurity Interference in UV-Vis Spectroscopy for Robust Drug Analysis
This article provides a comprehensive guide for researchers and drug development professionals on overcoming the critical challenge of spectral interference from impurities in UV-Vis spectroscopic analysis.
Strategies for Reducing Impurity Interference in UV-Vis Spectroscopy for Robust Drug Analysis
Abstract
This article provides a comprehensive guide for researchers and drug development professionals on overcoming the critical challenge of spectral interference from impurities in UV-Vis spectroscopic analysis. Covering foundational principles to advanced applications, it explores the origins of physical and chemical interferences, details practical methodological corrections like derivative spectroscopy and isoabsorbance measurements, and presents troubleshooting protocols for complex drug matrices. Furthermore, it examines innovative validation strategies, including the emerging technique of refractive-index-assisted UV/Vis spectrophotometry and the role of orthogonal methods like NMR and HPLC for impurity profiling, offering a complete framework for ensuring data accuracy and regulatory compliance in pharmaceutical development.
Understanding Spectral Interference: The Hidden Challenge in Drug Purity Analysis
Defining Physical vs. Chemical Interferences in Pharmaceutical Samples
This guide helps researchers identify and overcome physical and chemical interference in UV-Vis spectroscopy for accurate pharmaceutical analysis.
Core Concepts: Physical vs. Chemical Interference
Interference in UV-Vis spectroscopy occurs when substances other than your target analyte affect its absorbance measurement. Correctly identifying the interference type is the first step in resolving it.
The table below summarizes their fundamental differences.
| Feature | Physical Interference | Chemical Interference |
|---|---|---|
| Fundamental Nature | Affects light transmission through physical interaction [1] [2] | Arises from absorption of light by other chemical species [1] [2] |
| Primary Cause | Suspended solid impurities or turbidity in the sample [1] [2] | Presence of other UV-absorbing compounds (impurities, excipients, or other APIs) [1] [2] |
| Observed Effect | Scattering of light, leading to background absorbance and reduced analyte signal [1] | Spectral overlap, where interferent absorbance bands overlap with the analyte band [1] [3] |
| Impact on Spectrum | Broad, non-specific increase in baseline absorbance [1] | Introduction of unexpected peaks or distortion of the analyte's characteristic peak [1] |
Troubleshooting Guide: FAQs on Interference
How do I identify if my sample has physical interference?
You can identify physical interference by observing a sloping or elevated baseline, particularly on the lower wavelength side of your spectrum, and hazy or turbid sample appearance [1].
Protocol for Identification:
- Visually Inspect: Hold the sample cuvette up to the light. A cloudy or hazy appearance indicates suspended particles.
- Scan the Spectrum: Run a full wavelength scan of your sample against a pure solvent blank. Observe the region of the spectrum where your analyte does not absorb.
- Check the Baseline: A consistently high or sloped baseline in this non-absorbing region is a strong indicator of scattering from physical interference [1].
My sample is clear, but the absorbance is wrong. Is this a chemical interference?
A clear sample with inaccurate absorbance, especially showing unexpected peaks or a distorted analyte peak shape, strongly suggests chemical interference from a dissolved, UV-absorbing species [1] [3].
Protocol for Identification:
- Compare with Standard: Overlay the UV spectrum of your sample with a standard solution of your pure analyte.
- Look for Anomalies: Check for additional peaks, shoulders on the main peak, or a change in the
λ_max[1]. Significant spectral overlap between components, as seen in drug mixtures like ketorolac and olopatadine, is a classic sign [3].
What are the standard methods to overcome physical interference?
The primary method is to remove the suspended particles causing the scattering.
- Filtration or Centrifugation: Passing the sample through a sub-micron filter or using centrifugation to pellet suspended solids is the most direct approach [1].
- Technical Adjustment: If sample volume is too small for filtration (e.g., microliter sizes), reducing the gap between the sample cuvette and the detector can help minimize signal loss [1].
My sample has multiple absorbing chemicals. How can I analyze my target analyte?
When dealing with chemical interference from multiple components, you can employ several mathematical and technical techniques.
- Derivative Spectroscopy: This is a powerful technique that helps resolve overlapping peaks. By converting the normal (zero-order) spectrum into its first or second derivative, the sharp peaks of the analyte can be differentiated from the broader interferent peaks, and baseline shifts are eliminated [1] [2].
- Multi-Wavelength Methods (Isoabsorbance & Dual Wavelength): These methods rely on measuring absorbance at multiple points.
- Chemometric Modeling: For highly complex mixtures, advanced mathematical models like Partial Least Squares (PLS) regression can be used. These models are trained with standard mixtures and can deconvolute the combined spectral signal to quantify individual components, even with significant overlap [4].
- Refractive Index Assistance: A novel approach involves using refractometry alongside UV-Vis. A large disagreement in concentration results from the two techniques signals spectral interference. By carefully selecting a solvent whose refractive index differs significantly from the analyte, the error from unknown impurities in the refractometry result can be minimized, providing a more accurate concentration check [5].
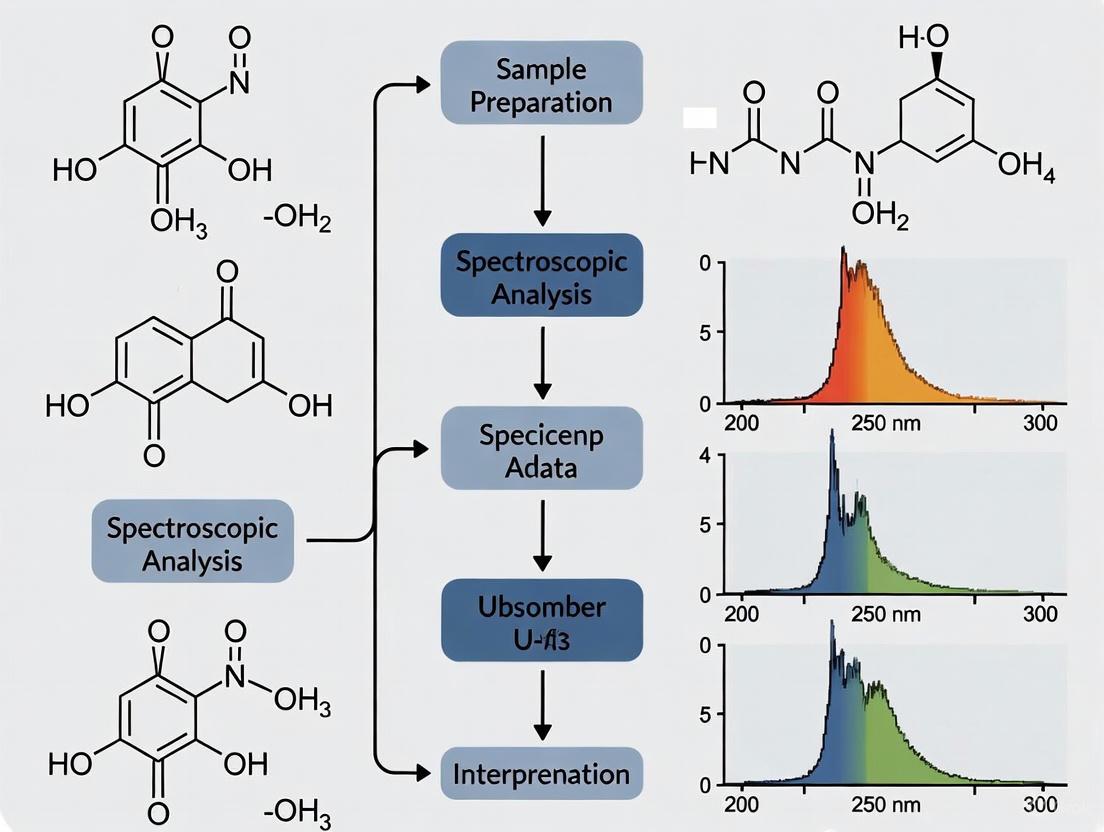
The following workflow diagram can help guide your decision-making process when facing interference.
The Scientist's Toolkit: Essential Research Reagent Solutions
The table below lists key reagents and materials mentioned in this guide, along with their critical function in mitigating interference.
| Reagent / Material | Critical Function in Mitigating Interference |
|---|---|
| Quartz Cuvettes | Essential for UV-range analysis, as they are transparent to UV light unlike plastic or glass, which can act as a filter and cause interference [6] [7]. |
| Compatible Solvents | Using a solvent that does not dissolve plastic cuvettes or absorb significantly in the analytical wavelength region is crucial to avoid physical damage and chemical background interference [6]. |
| Appropriate Filters (0.22/0.45 µm) | Used to remove suspended particles causing physical interference (light scattering) prior to analysis [1]. |
| Pure Analyte Standard | A necessity for identifying chemical interference via spectral comparison and for constructing calibration curves for methods like Derivative Spectroscopy and PLS modeling [4] [3]. |
| Chemometric Software | Software capable of running algorithms like Partial Least Squares (PLS) is required for deconvoluting spectra of complex mixtures with severe chemical interference [4]. |
| Refractometer | Used in the refractive-index assisted technique to provide an orthogonal concentration measurement that is less susceptible to spectral interference from unknown impurities [5]. |
The Critical Impact of Impurities on Absorption Accuracy and Drug Quantification
Impurities in pharmaceutical products are unavoidable byproducts of synthesis and degradation that can significantly compromise the accuracy of UV-Vis spectroscopy measurements. Even at trace levels, these unwanted substances interfere with light absorption properties, leading to inaccurate drug quantification and potentially serious consequences for drug safety and efficacy. This technical support center provides targeted troubleshooting guides and FAQs to help researchers identify, mitigate, and correct for impurity interference in their spectroscopic analyses, ensuring reliable quantification in drug research and development.
Troubleshooting Guides
Guide 1: Addressing Inaccurate Absorbance Measurements
Problem: Absorbance readings are consistently higher or lower than expected, or show poor reproducibility.
| Symptoms | Potential Causes | Corrective Actions |
|---|---|---|
| High baseline absorbance or noisy signal [8] | Sample turbidity or particulate matter | Centrifuge or filter sample using a 0.45 µm membrane filter [8]. |
| Non-linear Beer-Lambert law response [8] [6] | Sample concentration is too high | Dilute sample to achieve an absorbance within the ideal 0.2-1.0 AU range [8] [9]. |
| Unstable or drifting baseline [8] | Instrument instability or temperature fluctuations | Allow lamp to warm up for 20+ minutes; use double-beam instrument for compensation [8] [6]. |
| Presence of unexpected peaks [6] | Sample or cuvette contamination | Thoroughly clean quartz cuettes; handle only with gloved hands [6]. |
Guide 2: Identifying and Mitigating Impurity Interference
Problem: Suspected impurity is causing spectral interference with the active pharmaceutical ingredient (API).
| Symptoms | Type of Impurity | Mitigation Strategies |
|---|---|---|
| Overlapping absorption peaks [8] | Organic impurities (degradation products, synthesis by-products) [10] | Employ HPLC-UV for separation prior to spectroscopy analysis [11] [8]. |
| Altered absorbance at API's λ-max [12] | Impurities with chromophores similar to the API [12] | Use advanced software for derivative spectroscopy or multivariate calibration [8]. |
| Inaccurate quantification of trace impurities [12] | Genotoxic impurities or others at low concentrations [11] | Switch to a more sensitive technique like LC-MS/MS for accurate quantification [11] [12]. |
| Significant baseline scattering [8] | Inorganic impurities or particulate matter [10] | Implement rigorous sample preparation, including digestion or extraction [13]. |
Frequently Asked Questions (FAQs)
Q1: What are the most common types of impurities that can interfere with UV-Vis drug analysis?
Impurities are classified into three main categories. Organic Impurities, the most common interferents in UV-Vis, include starting materials, synthesis by-products, and degradation products. These often contain chromophores that absorb in the UV-Vis range [10]. Inorganic Impurities include catalysts, ligands, and residual metals, which can cause light scattering or catalyze degradation [10] [13]. Residual Solvents are typically volatile and less likely to interfere directly, but can indicate other process-related issues [10].
Q2: My sample is cloudy. How does this affect the measurement and how can I fix it?
Cloudy samples cause light scattering, which violates the fundamental principles of the Beer-Lambert law by reducing the transmitted light detected without actual molecular absorption. This results in falsely high and inaccurate absorbance readings [8]. The solution is to clarify the sample by centrifugation or filtration through a 0.45 µm or 0.22 µm membrane filter. For samples that cannot be filtered, derivatization to create a soluble chromophore may be necessary [12].
Q3: My calibration curve is non-linear at high concentrations. Is this due to impurities?
While impurities can exacerbate non-linearity, the primary cause at high concentrations (absorbance >1.0 AU) is often the instrumental effect of stray light or molecular interactions [8]. Impurities are a more likely culprit if non-linearity occurs at low-to-mid concentrations. To diagnose, prepare fresh calibration standards from a purity-verified reference standard. If non-linearity persists, dilute your samples to bring them into the validated linear range of 0.2-1.0 AU [8] [9].
Q4: When should I move from UV-Vis to a hyphenated technique like LC-MS?
Consider transitioning when facing these challenges: Suspected Co-eluting Impurities where HPLC-UV shows an impurity peak but UV-Vis alone cannot resolve it [11]; Quantifying Trace Impurities below the UV detection limit, especially potentially genotoxic impurities requiring control at ppm levels [11] [12]; and Unidentified Impurities needing structural characterization, where MS fragmentation data is essential for identification [11] [12].
Experimental Protocols for Impurity Investigation
Protocol 1: Forced Degradation Study to Identify Labile Impurities
Forced degradation studies help identify potential degradation products that could form under various stress conditions and interfere with analysis [11].
- Acidic/Basic Hydrolysis: Add a weighed sample of the drug substance to 0.1 M HCl and 0.1 M NaOH separately. Heat at 60°C for 1-8 hours. Neutralize and analyze by HPLC-UV [11].
- Oxidative Degradation: Expose the sample to 3% hydrogen peroxide (H₂O₂) at room temperature for 24 hours. Monitor the reaction by HPLC-UV [11].
- Thermal Degradation: Place the solid drug substance in an oven at 105°C for 1-7 days. Analyze samples periodically [11].
- Photolytic Degradation: Expose the solid drug substance to UV light (e.g., in a photostability chamber) for a defined period (e.g., 24-48 hours) [14].
Protocol 2: HPLC-UV/PDA Method for Separating and Quantifying Impurities
This protocol is adapted from a validated method for a triple-combination drug product [14].
- Equipment: HPLC system with a photodiode array (PDA) detector, Bakerbond C18 column (250 mm × 4.6 mm, 5 µm) [14].
- Mobile Phase: A: pH-2 buffer (5.44 g/L potassium dihydrogen phosphate and 0.5 g/L sodium 1-octanesulfonate). B: Acetonitrile:Methanol (90:10 %v/v) [14].
- Gradient Program:
- 0-15 min: 100% A
- 15-30 min: Linear gradient from 100% A to 70% A
- 30-40 min: Hold at 70% A [14]
- Flow Rate: 0.8 mL/min [14]
- Detection: Monitor at 220 nm and 240 nm for different impurities [14].
- Sample Preparation: Dissolve the drug product in a mixture of methanol and water (50:50 %v/v) at a concentration of 0.5 mg/mL. Filter through a 0.45 µm membrane [14].
Analytical Workflows and Signaling Pathways
Impurity Investigation Workflow
The following diagram outlines the logical decision process for investigating and addressing impurity interference in UV-Vis analysis, incorporating advanced techniques when necessary.
The Scientist's Toolkit: Key Research Reagent Solutions
The following table lists essential materials and reagents used in impurity profiling and analysis, as cited in the research.
| Item Name | Function/Brief Explanation |
|---|---|
| ODS C18 Column | A standard reverse-phase HPLC column used to separate complex mixtures of drugs and their impurities based on hydrophobicity [11] [14]. |
| Bakerbond C18 Column | A specific type of C18 column (250 mm × 4.6 mm, 5 µm) used in validated impurity methods for triple-combination drugs [14]. |
| Acetonitrile (ACN) | A common organic solvent used as a mobile phase component in HPLC to elute less polar compounds [11] [14]. |
| Triethylamine (TEA) | Used to adjust the pH of the mobile phase to suppress silanol activity on the column, improving peak shape for basic compounds [11]. |
| Ammonium Formate | A volatile salt used in mobile phases for LC-MS/MS to facilitate ionization and maintain compatibility with the mass spectrometer [11]. |
| Formic Acid (FA) | A volatile acid added to the mobile phase in LC-MS to promote protonation of analytes in positive electrospray ionization mode [11]. |
| Hydrogen Peroxide (H₂O₂) | Used in forced degradation studies to induce oxidative degradation and generate relevant oxidative impurities for method validation [11]. |
| Potassium Dihydrogen Phosphate | A component of the aqueous buffer for HPLC mobile phases, helping to control pH and ionic strength [14]. |
| Quartz Cuvettes | Essential for UV-Vis spectroscopy in the UV range due to their high transmission of ultraviolet light, unlike plastic or glass cuvettes [6]. |
| 0.45 µm Membrane Filter | Used to remove particulate matter from samples and mobile phases before injection into the HPLC system to prevent column blockage [11] [14]. |
In pharmaceutical research and drug development, UV-Vis spectroscopy is a fundamental technique for characterizing compounds, monitoring reactions, and ensuring quality control. However, the accuracy of this method can be critically compromised by a hidden variable: trace impurities. This guide explores a seminal case study involving saturated fatty acids, where impurities led to decades of misinterpreted UV absorption data, and provides a practical troubleshooting framework for researchers to identify and mitigate such issues in their work.
The Core Case: Impurities in Nonanoic Acid
Background and Historical Context
For over 90 years, since first reports in 1931, liquid saturated fatty acids like nonanoic acid [CH₃(CH₂)₇COOH] were reported to exhibit a weak shoulder absorption band between 250-330 nm, in addition to their primary absorption peak at ~210 nm [15]. This absorption within the solar spectrum reaching Earth's surface was thought to have significant atmospheric implications, potentially contributing to photochemical reactions that form volatile organic compounds and secondary organic aerosols [15].
The Critical Discovery
A 2023 study demonstrated conclusively that this long-observed UV absorption signature does not originate from the saturated fatty acids themselves, but from trace impurities present in commercial reagents [15] [16]. These impurities, constituting 0.1% or less of the sample, were sufficient to create absorption patterns that had been misinterpreted for decades as an intrinsic property of the fatty acids.
Experimental Protocols: Detection and Elimination of Impurities
Purification Methodology
Researchers developed a specialized recrystallization protocol to systematically remove impurities from nonanoic acid reagents [15]:
- Apparatus: Recrystallization was performed at low temperatures under anaerobic conditions using a custom-built device.
- Process: Commercial nonanoic acid (purity >98.0%) underwent 15 successive recrystallization cycles.
- Effectiveness: The purification efficacy plateaued after 10-15 cycles, with additional recrystallization providing no significant improvement in purity.
Analytical Techniques for Impurity Detection
Multiple analytical techniques confirmed the presence and subsequent removal of impurities:
- High-Performance Liquid Chromatography (HPLC): Detected at least seven distinct impurities in the unpurified commercial nonanoic acid, each exhibiting substantial UV absorption peaks between 250-300 nm, suggesting carbonyl or conjugated structures [15].
- Nuclear Magnetic Resonance (NMR) Spectroscopy: Using an 18.8-T cryo-probe NMR, researchers identified impurity peaks with intensities 0.1-3% relative to nonanoic acid signals. The most abundant impurity (~3%) was identified as 2-methyloctanoic acid [15].
Absorption Cross-Section Measurements
To obtain accurate absorption data, researchers measured purified nonanoic acid using multiple optical path lengths (0.0185 mm to 90 mm) to avoid absorption saturation across a wide wavelength range (190-310 nm) [15].
Table 1: UV Absorption Cross-Sections of Nonanoic Acid Before and After Purification
| Wavelength | Absorption Cross-Section (Before Purification) | Absorption Cross-Section (After 15× Recrystallization) | Reduction Factor |
|---|---|---|---|
| 205 nm | 2.6 × 10⁻¹⁹ cm² | 2.4 × 10⁻¹⁹ cm² | 1.1× |
| 250 nm | 1.3 × 10⁻²¹ cm² | 2.6 × 10⁻²³ cm² | 50× |
| 295 nm | 3.1 × 10⁻²² cm² | 1.3 × 10⁻²³ cm² | 24× |
Quantitative Impact: From Scientific Error to Corrected Values
The purification process resulted in dramatic changes to the reported optical properties [15]:
- The characteristic absorption shoulder at 250-330 nm almost completely disappeared after purification.
- At 295 nm (environmentally relevant wavelength), the absorption cross-section decreased by a factor of 24.
- The corrected absorption cross-sections for purified nonanoic acid at wavelengths >250 nm are three to five orders of magnitude smaller than those of common atmospheric carbonyl compounds (e.g., formaldehyde, acetaldehyde, acetone).
- The upper limit of the photolysis rate for pure nonanoic acid is now understood to be vastly lower than previously estimated.
Troubleshooting Guide: Addressing Impurity Issues in Your Research
Frequently Asked Questions
How can I tell if my UV-Vis spectrum is affected by impurities?
Unexpected peaks, shoulders, or elevated baselines, particularly in regions where your compound should not absorb strongly, often indicate contamination [6]. If your sample's absorption spectrum changes significantly after purification or differs from literature values for pure compounds, impurities are likely interfering [15].
My sample is "analytical grade" (>99% pure). Could impurities still affect my measurements?
Yes. As demonstrated in the case study, even 98-99% pure commercial reagents contained sufficient impurities (0.1%) to completely dominate the UV absorption spectrum at specific wavelengths [15]. This effect is particularly pronounced when measuring samples at high concentrations or with long optical path lengths, as these conditions enhance the detection of trace components [15] [6].
What purification methods are most effective for removing UV-absorbing impurities?
The appropriate method depends on your sample matrix [15] [10]:
- Liquid samples: Recrystallization, distillation, or column chromatography
- Solid samples: Recrystallization, sublimation, or preparative chromatography
- General approaches: Always consider multiple purification techniques when possible, as different methods target different impurity types
Which analytical techniques are most sensitive for detecting impurities?
- Chromatography: HPLC and GC are excellent for separating and detecting impurities [10]
- Spectroscopy: NMR (especially high-sensitivity models), and LC-MS or GC-MS hyphenated techniques [15] [10]
Diagnostic Workflow: Identifying UV-Vis Spectroscopy Problems
The following troubleshooting algorithm helps systematically diagnose common UV-Vis issues, starting with the most prevalent cause - sample impurities:
Essential Research Reagent Solutions
Table 2: Key Materials and Methods for Impurity Management
| Item/Method | Function in Impurity Control | Application Notes |
|---|---|---|
| Recrystallization Apparatus | Purifies solids by repeated crystallization | Critical for removing intrinsic impurities; requires multiple cycles (10-15x) [15] |
| Anaerobic Chamber | Maintains oxygen-free environment during sample prep | Prevents oxidation that creates new impurities during purification [15] |
| HPLC with PDA Detector | Separates and identifies impurity compounds | Detects multiple impurities simultaneously; identifies carbonyl/conjugated structures [15] [10] |
| High-Field NMR with Cryo-Probe | Detects trace impurities at ~0.1% levels | Provides structural information on impurities; high sensitivity required [15] |
| Quartz Cuvettes | Holds samples for UV-Vis measurement | Essential for UV range measurements; must be meticulously clean [6] |
| Multiple Pathlength Cells (0.0185-90 mm) | Prevents signal saturation in absorbance measurements | Enables accurate cross-section measurement across wide concentration ranges [15] |
Implications for Pharmaceutical Research
The nonanoic acid case study provides crucial insights for drug development [10]:
- Method Validation: Pharmaceutical impurity profiling must include controls for UV-absorbing impurities that could interfere with analytical methods.
- Stability Studies: Trace impurities can catalyze degradation or be mistaken for degradation products themselves.
- Quality Control: Stringent purification and multiple analytical techniques are essential when characterizing reference standards.
- Regulatory Compliance: Impurities must be identified, characterized, and quantified to meet FDA, EMA, and pharmacopeia standards [10].
To reduce impurity interference in UV-Vis spectroscopy for pharmaceutical research:
- Assume impurities are present even in high-purity reagents and plan appropriate controls.
- Implement systematic purification and verify effectiveness with complementary analytical techniques.
- Use multiple path lengths to avoid saturation effects and obtain accurate absorption cross-sections.
- Employ orthogonal detection methods (HPLC, NMR, MS) to confirm purity when unexpected absorption occurs.
- Document purification and analytical procedures thoroughly to ensure reproducibility and regulatory compliance.
By applying these principles, researchers can avoid the pitfalls demonstrated in the fatty acid case study and ensure the accuracy of their UV-Vis spectroscopic data in pharmaceutical applications.
The Beer-Lambert Law and Its Limitations in Complex Matrices
Troubleshooting Guides
Why is my calibration curve non-linear at high concentrations?
The Beer-Lambert Law assumes a linear relationship between absorbance and concentration. However, several factors can cause deviation from linearity, especially in complex matrices like drug formulations.
- Primary Cause: At high concentrations (typically leading to absorbance values above 1.2-1.5 AU), the linear relationship between absorbance and concentration breaks down due to molecular interactions and changes in the refractive index of the solution [8].
- Electromagnetic Effects: At high concentrations, the absorptivity coefficient (ε) is not constant. Molecular interactions and electrostatic effects between closely packed molecules can alter a substance's ability to absorb light [17] [18].
- Stray Light: The impact of stray light within the instrument becomes more significant at high absorbances, leading to negative deviations from the expected linear relationship [8].
Experimental Protocol for Verification and Resolution:
- Prepare Dilutions: Create a series of standard solutions covering a wide concentration range. Ensure that several dilutions fall within the accepted linear range (absorbance typically between 0.1 and 1.0 AU) [8] [7].
- Measure Absorbance: Using a properly calibrated spectrophotometer, measure the absorbance of each standard at the relevant analytical wavelength.
- Plot Calibration Curve: Graph absorbance versus concentration.
- Identify Linear Range: Statistically evaluate the curve (e.g., using R² value) to identify the concentration range over which the relationship is linear.
- Dilute Samples: Any sample producing an absorbance outside the linear range should be diluted with the appropriate solvent and re-measured [8].
How do I correct for scattering in turbid biological samples?
Turbid or cloudy samples, common in biological matrices, scatter light rather than absorbing it uniformly. This violates a core assumption of the Beer-Lambert Law, which treats attenuation as solely due to absorption [8].
- Primary Cause: Particulate matter or macromolecules in a sample cause light to be scattered, leading to an erroneously high absorbance reading because less light reaches the detector in a straight path [8].
Experimental Protocol for Correction:
- Filtration or Centrifugation: The most direct method is to clarify the sample by passing it through a 0.2 μm or 0.45 μm syringe filter or by centrifugation. This removes the light-scattering particles [8].
- Use of a Blank: Prepare a blank reference that matches the sample matrix as closely as possible, including any solvents and clarifying agents.
- Derivative Spectroscopy: Modern spectrophotometer software often includes algorithms for derivative spectroscopy. This technique can help resolve underlying absorption features by minimizing the broad baseline effects caused by scattering [8].
- Path Length Reduction: Use a cuvette with a shorter path length (e.g., 1 mm instead of 10 mm). This reduces the probability of light scattering events within the sample, thereby increasing the transmitted light signal [6].
What causes unexpected peaks or baseline shifts in my spectra?
Unexpected spectral features are often related to instrumental issues, sample preparation errors, or chemical interference.
- Primary Causes:
- Stray Light and Baseline Drift: Instability in the light source, temperature fluctuations, or dirty optics can cause the baseline to shift [8] [19].
- Solvent Absorption: The solvent itself may have significant absorption bands, especially in the UV range below 250 nm (e.g., ethanol absorbs strongly below 210 nm), which can obscure the analyte signal [8].
- Sample Contamination: Impurities introduced during handling or preparation can contribute their own absorption peaks [6].
- Cuvette Issues: Scratched, dirty, or mismatched cuvettes can scatter light and cause erratic readings [6] [19].
Experimental Troubleshooting Protocol:
- Check Solvent Cut-Off: Always consult solvent transparency charts. Ensure the solvent does not absorb significantly at your analytical wavelength. Use high-purity, spectrophotometric-grade solvents [8].
- Inspect and Clean Cuvettes: Visually inspect cuvettes for scratches or residue. Clean them thoroughly with an appropriate solvent and use lint-free wipes. Handle cuvettes only by the non-optical sides to prevent fingerprints [6].
- Run a System Suitability Test: Perform a baseline correction with a blank cuvette filled with pure solvent. Scan the baseline over your wavelength range; a flat, stable baseline indicates a healthy instrument. Test wavelength accuracy using certified reference materials like holmium oxide [8] [19].
- Verify Sample Purity: Re-examine sample preparation steps to identify potential sources of contamination.
Frequently Asked Questions (FAQs)
How does the sample matrix affect the Beer-Lambert Law?
The Beer-Lambert Law is rigorously accurate only for ideal, dilute solutions. In complex matrices like drug formulations, biological fluids, or suspension formulations, several matrix-related issues arise [8] [18]:
- Matrix Effects: Excipients, proteins, or other dissolved solids can scatter light, altering the effective path length and leading to inaccurate absorbance measurements [8].
- Chemical Interactions: The analyte can interact with other components in the matrix (e.g., binding to proteins), which can change its absorptivity (ε) and shift its absorption maximum (λ_max). The law assumes the analyte behaves identically in the standard and sample matrices, which is often not the case [17] [18].
- Refractive Index Changes: At high concentrations, the refractive index of the solution changes, which can affect the light path and lead to deviations from the Beer-Lambert Law [18].
What is the optimal absorbance range for quantitative work, and why?
For reliable quantitative analysis, it is recommended to maintain absorbance readings between 0.1 and 1.0 Absorbance Units (AU) [8] [7] [20].
This is because the relationship between concentration and absorbance remains highly linear in this range. At low absorbances (<0.1 AU), the signal-to-noise ratio is poor, making detection unreliable. At high absorbances (>1.0 AU), the amount of light reaching the detector is very small (less than 10% of I₀ at A=1), and the effects of stray light and instrument noise become significant, causing negative deviations from linearity [8] [20].
Are there limitations to the Beer-Lambert Law itself?
Yes, the Beer-Lambert Law is an approximation with fundamental limitations that become apparent under specific conditions [17] [18]:
- Electromagnetic Theory Incompatibility: The law does not fully account for the wave nature of light. Effects such as interference from light reflecting within cuvette walls or thin films can cause fluctuations in measured intensity that the law does not predict [17] [18].
- Molecular Shading is a Myth: A common misconception is that "molecular shading" (one molecule blocking another) causes deviation at high concentrations. This is incorrect, as light interacts with molecules as a wave, not a ray. Real causes are changes in molecular behavior and refractive index [18].
- Assumption of Monochromatic Light: The law is strictly valid only for perfectly monochromatic light. Real instruments use light with a finite bandwidth, which can lead to deviations, especially with sharp absorption peaks [8].
How often should I calibrate my UV-Vis spectrophotometer?
Regular calibration is critical for data integrity. The frequency depends on use, regulatory requirements, and instrument stability [8].
- Routine Performance Checks: Should be performed daily or weekly, depending on workload. This often involves measuring a standard at a fixed wavelength to verify absorbance accuracy.
- Full Calibration: A comprehensive calibration, checking parameters like wavelength accuracy, stray light, and photometric linearity, should be conducted quarterly or annually. This must be performed whenever the lamp is replaced or the instrument is moved [8].
- Regulatory Standards: Follow standards such as USP <857> or Ph. Eur. chapter 2.2.25, which specify calibration procedures and frequencies for pharmaceutical analysis [8].
The following table summarizes key quantitative limits and recommendations for applying the Beer-Lambert Law effectively in pharmaceutical research.
| Parameter | Optimal Range / Limit | Implication & Rationale |
|---|---|---|
| Absorbance (for quantitation) | 0.2 - 0.8 AU (Ideal);0.1 - 1.0 AU (Acceptable) [8] [7] [20] | Maintains linearity and a good signal-to-noise ratio. Outside this range, noise and stray light effects dominate. |
| Wavelength Range (Standard UV-Vis) | 190 - 1100 nm [8] [7] | Limits analysis to ultraviolet and visible light. Far-UV and near-infrared regions require specialized instrumentation. |
| Stray Light Threshold | Absorbance values become unreliable (typically >1.2-1.5 AU) [8] | Stray light causes negative deviation from the Beer-Lambert Law, leading to underestimation of concentration. |
| Solvent Cut-Off | Varies by solvent (e.g., Ethanol: <210 nm) [8] | The solvent itself absorbs light below its cut-off wavelength, interfering with analyte measurement. |
Experimental Workflow for Mitigating Matrix Interference
The diagram below outlines a systematic workflow to identify, diagnose, and correct for common matrix interferences in UV-Vis spectroscopy.
The Scientist's Toolkit: Essential Research Reagents & Materials
Selecting the appropriate materials is fundamental for obtaining accurate and reproducible UV-Vis results in drug research.
| Item | Function & Importance |
|---|---|
| Quartz Cuvettes | Required for UV range analysis (<350 nm) as quartz is transparent to UV light. Glass and plastic cuvettes absorb UV light and are suitable only for visible range measurements [7] [6]. |
| Spectrophotometric Grade Solvents | High-purity solvents with low UV absorption and defined "cut-off" wavelengths. Essential for preparing samples and blanks to minimize background interference [8] [21]. |
| Certified Reference Materials (CRMs) | Standards such as Holmium Oxide solution are used for mandatory wavelength calibration to ensure instrumental accuracy. CRMs traceable to NIST or ISO 17034 are recommended [8]. |
| Syringe Filters (0.2/0.45 µm) | Used to clarify turbid samples by removing particulate matter that causes light scattering, a common issue in biological and complex matrices [8] [6]. |
| Digital Pipettes & Volumetric Flasks | Critical for accurate and precise sample and standard preparation. Errors in dilution are a major source of inaccuracy in quantitative analysis [8]. |
Practical Spectroscopic Techniques for Interference Correction in Drug Development
In pharmaceutical research, ensuring the purity and accurate quantification of active pharmaceutical ingredients (APIs) is paramount. Ultraviolet-visible (UV-Vis) spectroscopy is a widely used technique for this purpose due to its simplicity, cost-effectiveness, and speed [21]. However, analysts frequently encounter two major challenges: overlapping peaks from multiple absorbing compounds or impurities, and baseline shifts caused by instrumental drift or matrix effects [22] [23]. These issues can obscure critical spectral details, leading to inaccurate quantification and potentially compromising drug safety and efficacy.
Derivative spectroscopy provides a powerful mathematical solution to these problems. By converting a standard zero-order absorption spectrum into its first or higher-order derivatives, this technique enhances resolution of overlapping signals and eliminates interference from baseline shifts [24] [25]. This technical support center provides practical guidance for implementing derivative spectroscopy to reduce impurity interference in drug development.
FAQs on Fundamental Principles
1. How does derivative spectroscopy physically resolve two overlapping peaks?
Derivative spectroscopy enhances the resolution of overlapping peaks by transforming broad, featureless absorption bands into spectra with sharper, more distinct features [25]. While a zero-order absorption spectrum of two overlapping compounds may appear as a single broad peak, its first derivative plot will show a distinct maximum and minimum corresponding to the inflection points of the original band [24]. Higher-order derivatives (e.g., second, third, or fourth) further accentuate these features, creating a spectrum with multiple peaks and troughs that allow for the identification and quantification of individual components in a mixture [26]. This transformation effectively "sharpens" the spectral data, revealing details that are inaccessible in the parent spectrum.
2. Why is derivative spectroscopy particularly effective at eliminating baseline shifts?
Baseline shifts often manifest as a slow, linear, or polynomial drift across a range of wavelengths. The mathematical process of differentiation is highly sensitive to the rate of change of the signal. Since a flat or slowly drifting baseline has a very low rate of change (approaching zero), its contribution to the derivative spectrum is minimized or entirely eliminated [25] [23]. In contrast, the absorption bands of analytes change more rapidly with wavelength, and these rapid changes are amplified in the derivative spectrum. This property makes derivative processing an excellent tool for discriminating against broad-band spectral interference and producing a stable, corrected signal for accurate quantification [24].
3. What are the main limitations of derivative spectrophotometry?
The primary limitations include:
- Lower Reproducibility: Results can be sensitive to instrumental parameters like scanning speed and slit width [24].
- Dependence on Initial Conditions: The shape and intensity of the derivative peak are strongly influenced by the parameters used when recording the original zero-order spectrum [25].
- Signal-to-Noise Reduction: While it can enhance resolution, the derivatization process can also amplify high-frequency noise present in the original signal. This often requires a trade-off between the degree of smoothing and the level of resolution enhancement [27].
- Lack of Standardized Protocols: The absence of homogeneous protocols for optimizing derivatization parameters can make it difficult to compare results across different laboratories [24].
Troubleshooting Guides
Problem 1: Inadequate Resolution of Overlapping Peaks
Symptom: The derivative spectrum fails to clearly separate the peaks of the API and an impurity, leading to inaccurate quantification.
Solutions:
- Increase the Derivative Order: Progress from first-order to higher-order derivatives (e.g., second, third, or fourth). Each successive order of differentiation further narrows peak widths and can resolve more complex mixtures [27] [26]. For example, a third-order derivative was successfully used to resolve the overlapping spectra of Lamivudine and Tenofovir Disoproxil Fumarate in a fixed-dose combination [26].
- Optimize Data Acquisition Parameters: Ensure the initial zero-order spectrum is recorded with high fidelity. Use a slower scanning speed and a narrower spectral bandwidth (slit width) to improve the initial signal resolution before derivatization [24] [25].
- Apply Smoothing Algorithms: Utilize built-in or post-processing smoothing functions (e.g., Savitzky-Golay filters) to reduce high-frequency noise that can be amplified during differentiation. Find a balance that suppresses noise without excessively broadening the peaks [27].
Problem 2: Excessive Noise in the Derivative Spectrum
Symptom: The derivative spectrum is too "noisy" or "jagged," making it difficult to distinguish real peaks from artifacts.
Solutions:
- Widen the Spectral Bandwidth: Slightly increasing the spectrometer's slit width will allow more light to reach the detector, improving the signal-to-noise ratio (SNR) of the original spectrum, which carries through to the derivative [24].
- Use a Stronger Smoothing Function: Apply a more aggressive smoothing algorithm to the zero-order spectrum before derivatization. Be cautious, as over-smoothing can lead to a loss of spectral resolution and distorted peak shapes [27].
- Signal Averaging: Acquire multiple scans of the zero-order spectrum and average them. This is a highly effective method for improving the SNR of the base data [7].
Problem 3: Poor Reproducibility Between Analyses
Symptom: Results vary significantly when the same sample is analyzed multiple times or across different instruments.
Solutions:
- Standardize Instrumental Parameters: Strictly control and document all instrumental settings, including scan speed, slit width, and data interval, for every analysis. Even minor changes can affect the derivative spectrum [24] [25].
- Validate the Method: Perform a full method validation, assessing precision, accuracy, and robustness under the defined parameters. This is critical for regulatory compliance in pharmaceutical QA/QC [21] [26].
- Implement a Rigorous Baseline Correction Protocol: Always run a blank (solvent only) using the same cuvette type and under the same conditions as the sample. Subtract this blank spectrum from all sample spectra before performing derivative calculations to correct for solvent and cuvette effects [7] [23].
Experimental Protocols
Protocol 1: Resolving a Binary Mixture using Third-Order Derivative Spectroscopy
This protocol is adapted from a study determining Lamivudine (LAM) and Tenofovir Disoproxil Fumarate (TDF) in fixed-dose combinations [26].
- Objective: To simultaneously quantify LAM and TDF in a mixture despite their overlapping zero-order spectra.
Materials:
- UV-Vis spectrophotometer with derivative processing capability
- Quartz cuvettes (1 cm path length)
- LAM and TDF reference standards
- Fixed-dose combination tablet samples
- 0.1 M Hydrochloric acid (HCl) as solvent
Methodology:
- Preparation of Standard Solutions: Accurately weigh 50 mg each of LAM and TDF reference standards. Transfer to separate 50 mL volumetric flasks, dissolve, and dilute to volume with 0.1 M HCl to obtain stock solutions of 1000 µg/mL [26].
- Acquisition of Zero-Order Spectra: Dilute the standard and sample solutions to appropriate concentrations. Scan them in the UV range from 200 to 350 nm against a 0.1 M HCl blank to obtain the zero-order absorption spectra. Note the λmax for LAM (~260 nm) and TDF (~270 nm) and observe the spectral overlap [26].
- Derivative Transformation: Using the spectrometer's software, calculate the third-order derivative (D³) spectra of both the standard and sample solutions.
- Quantification: In the third-order derivative spectrum, measure the amplitude (peak-to-trough) for LAM at 262.5 nm and for TDF at 240 nm. Construct calibration curves by plotting the derivative amplitudes of standard solutions against their concentrations [26].
The workflow for this protocol is summarized in the diagram below:
Protocol 2: Method Validation for Regulatory Compliance
For any derivative method used in pharmaceutical analysis, validation is essential as per ICH Q2(R1) guidelines [21] [10].
- Linearity and Range: Prepare and analyze at least five standard solutions of the analyte across a specified range (e.g., 50-150% of the expected concentration). The derivative response should be linearly proportional to concentration (R² ≥ 0.998) [26].
- Accuracy (Recovery): Spike a pre-analyzed sample with known quantities of the standard API. The percentage recovery of the added analyte should be between 98-102% [26].
- Precision: Analyze multiple replicates (n=6) of a homogeneous sample. The relative standard deviation (RSD) of the results should be ≤ 2.0%.
- Specificity: Demonstrate that the method can unequivocally assess the analyte in the presence of potential impurities and excipients. The derivative spectrum should show resolved peaks for the API and all known interferents [25] [10].
The following table summarizes typical validation data for a derivative spectroscopic method, as demonstrated in the analysis of Lamivudine and Tenofovir [26].
Table 1: Example Method Validation Parameters for a Derivative Spectroscopic Assay
| Parameter | Lamivudine (LAM) | Tenofovir Disoproxil Fumarate (TDF) |
|---|---|---|
| Linear Range | 2 - 10 μg/mL | 8 - 24 μg/mL |
| Correlation Coefficient (R²) | ≥ 0.998 | ≥ 0.998 |
| Limit of Detection (LOD) | 0.46 μg/mL | 2.61 μg/mL |
| Limit of Quantification (LOQ) | 1.40 μg/mL | 7.90 μg/mL |
| Recovery (%) | 94.80 - 100.33 | 94.80 - 100.33 |
The Scientist's Toolkit: Key Research Reagent Solutions
Table 2: Essential Materials for Derivative Spectroscopy in Pharmaceutical Analysis
| Item | Function / Explanation |
|---|---|
| UV-Vis Spectrophotometer | Instrument with derivative software; must allow control of scan speed and slit width for reproducible results [7] [26]. |
| Quartz Cuvettes | Required for UV range analysis as glass and plastic absorb UV light [7]. |
| Deuterium & Tungsten Lamps | High-intensity light sources for UV and visible regions, respectively; stability is critical for baseline integrity [7]. |
| High-Purity Solvents | Water, methanol, 0.1 M HCl, or propylene glycol; must be UV-transparent in the region of interest to minimize baseline contribution [22] [23]. |
| Certified Reference Standards | High-purity APIs and impurities for method development, calibration, and validation [26] [10]. |
| Data Processing Software | For advanced smoothing, baseline correction, and derivative calculations beyond the instrument's built-in functions [26]. |
Workflow and Logical Relationships
The following diagram illustrates the logical decision-making process for implementing and troubleshooting a derivative spectroscopy method in a pharmaceutical context.
Isoabsorbance (Multi-Wavelength) Measurements for Single Interferent Scenarios
Frequently Asked Questions
What is the fundamental principle of isoabsorbance measurements for overcoming interference? Isoabsorbance measurements are used to eliminate interference from a known interfering compound. The method selects a wavelength where the interferent shows the same absorbance as it does at the primary analytical wavelength. By subtracting the absorbance at this isoabsorbance point from the total absorbance at the analytical wavelength, the residual absorbance provides the correct value for the analyte of interest [1].
My software does not load the isoabsorbance plot data, even though the spectral file exists. What could be wrong?
This issue can occur even when the spectral data file (e.g., DAD1.UV) is present. One confirmed cause is that the software (e.g., OpenLab CDS Chemstation) does not recognize that spectral data was acquired. If you receive an error such as "No Spectra were acquired with file," it indicates a discrepancy between the acquired data and the software's method file. First, verify that your acquisition method is correctly configured to collect spectra and has not been altered. Ensure the method is set to collect all spectra or at regular intervals, rather than being triggered solely by a peak, which might not be met if a threshold condition fails [28].
Why would an acquisition method fail to collect spectral data even when it is set up correctly? A common reason is the peak threshold setting. If the method is configured to save spectra only on a peak trigger, and the peak does not meet the set height threshold (e.g., the smallest expected peak is below the 0.1 to 1000.0 mAU limit), the system will not save any spectra. Verify and adjust the threshold value in your method to ensure spectra are collected under your expected sample conditions [28].
What are the limitations of using the isoabsorbance technique? This approach is most practical when only a single interferent is present and its absorbance characteristics are well-known. It is also beneficial if the interferent's maximum absorbance wavelength is far removed from the absorbing wavelength of the main analyte. For samples with multiple interferents or significant spectral overlap, techniques like multicomponent analysis or derivative spectroscopy are more appropriate [1].
Troubleshooting Guides
Problem: Inconsistent or Incorrect Absorbance Subtraction in Isoabsorbance
| Potential Cause | Diagnostic Steps | Corrective Action |
|---|---|---|
| Incorrect Wavelength Selection | Review pure interferent spectrum; confirm isoabsorbance points. | Select a wavelength where the interferent's absorbance is identical at both analytical and reference wavelengths [1]. |
| Presence of Additional Interferents | Check sample composition and analyte/impurity spectra for overlaps. | Use multicomponent analysis techniques or derivative spectroscopy to handle multiple interfering substances [1]. |
| Physical Light Scattering | Observe baseline instability or high background from suspended solids. | Filter or centrifuge the sample; if sample volume is too small (μL), reduce the gap between the sample cuvette and detector [1]. |
Problem: Failed Acquisition of Spectral Data for Plot Generation
| Potential Cause | Diagnostic Steps | Corrective Action |
|---|---|---|
| Faulty Peak Threshold Trigger | Check acquisition log/method; see if peaks are below threshold. | Lower the peak threshold setting or change spectral acquisition to a time-based mode, not peak-triggered [28]. |
| Corrupted or Altered Method | Reload the original acquisition method in data analysis; check for "save method" prompts. | Reload the correct, unaltered acquisition method; contact instrument support if file recognition issues persist [28]. |
The Scientist's Toolkit: Essential Reagents and Materials
The following table lists key items used in UV-Vis spectroscopic analysis for impurity profiling.
| Item | Function |
|---|---|
| High-Purity Solvents | Serve as the matrix for analyte dissolution; purity is critical to avoid introducing additional spectral interferences. |
| Standard Reference Materials | High-purity analyte and impurity standards used for instrument calibration and method validation. |
| Filters (Syringe or Membrane) | Remove suspended solid impurities from samples to mitigate physical light scattering interferences [1]. |
| pH Buffers | Control the ionization state of analytes and impurities, which can significantly affect their UV-Vis absorption spectra. |
| Centrifuges | Rapidly separate suspended particles from liquid samples, especially when filtration is not feasible due to small volumes [1]. |
Experimental Protocol: Applying Isoabsorbance Measurement
This protocol details the steps to implement the isoabsorbance technique for correcting interference from a single known compound in a UV-Vis assay for a pharmaceutical active ingredient.
1. Define Analytical Requirements: Identify the primary analyte and the single known interferent. Determine the primary analytical wavelength (λ_analytical) based on the maximum absorbance of the analyte.
2. Characterize the Interferent: Prepare a standard solution of the pure interfering compound. Scan this solution across the UV-Vis range to obtain its full absorbance spectrum.
3. Identify the Isoabsorbance Wavelength: On the interferent's spectrum, find a wavelength (λiso) where its absorbance is exactly equal to its absorbance at λanalytical. This is the point where a horizontal line from Aλanalytical intersects the spectrum again [1].
4. Establish the Calibration Curve:
- Prepare a series of standard solutions of the pure analyte at known concentrations.
- Measure the absorbance of each standard at both λanalytical and λiso.
- For each standard, calculate the corrected absorbance: Acorrected = Aλanalytical - Aλ_iso.
- Plot A_corrected against the analyte concentration to create the calibration curve [1].
5. Analyze Unknown Samples:
- For any unknown sample, measure the absorbance at both λanalytical and λiso.
- Apply the same correction: Acorrected = Aλanalytical - Aλ_iso.
- Use the calibration curve to determine the analyte concentration from the A_corrected value.
Experimental Workflow and Troubleshooting Logic
The diagram below outlines the key steps for performing an isoabsorbance experiment and the logical path for diagnosing common issues.
Three-Point Correction Method for Non-Linear Background Absorbance
The Three-Point Correction Method is a technique used in UV-Vis spectrophotometry to compensate for non-linear background absorbance caused by complex sample matrices or interfering impurities [2]. This method is particularly valuable in pharmaceutical research where accurate analyte quantification is essential, and spectral interference from impurities can significantly compromise results [5].
In this method, two wavelengths are selected close to the analytical wavelength but on either side of it [2]. The interference of background can be accurately estimated using linear interpolation between these points [2]. This approach is specifically applicable for non-linear background absorbance resulting from complex sample matrices [2].
Mathematical Principle
The three-point correction method utilizes a polynomial correction function. For a 3-point calibration, this involves a degree 2 polynomial correction of the form y = a + bx + cx² [29]. The coefficients a, b, and c are calculated so that at all three calibration points (x₁,y₁), (x₂,y₂), and (x₃,y₃), the values returned by the calibration are exactly y₁, y₂, and y₃ respectively [29]. This polynomial fitting allows the correction to account for non-linear background effects that simple baseline offset cannot address.
Workflow Implementation
The following diagram illustrates the logical sequence for implementing the three-point correction method:
Experimental Protocol
Wavelength Selection Criteria
- Primary Analytical Wavelength (λ₂): Select the wavelength maximum for your target analyte.
- Reference Wavelength 1 (λ₁): Choose a wavelength slightly shorter than λ₂ where the analyte exhibits minimal absorption but potential interferers contribute to background.
- Reference Wavelength 2 (λ₃): Choose a wavelength slightly longer than λ₂ with the same considerations as λ₁.
- Spacing: The two reference wavelengths should be positioned symmetrically around λ₂ when possible, with spacing typically between 5-20 nm depending on the spectral features.
Step-by-Step Methodology
- Sample Preparation: Prepare the sample solution according to standard protocols, ensuring it is representative of your test matrix.
- Spectrum Acquisition: Obtain the full absorbance spectrum of the sample across a range encompassing all three selected wavelengths.
- Absorbance Measurement: Record the absorbance values at the three designated wavelengths: A₁ (at λ₁), A₂ (at λ₂), and A₃ (at λ₃).
- Background Calculation: Calculate the estimated background absorbance at the analytical wavelength (λ₂) using linear interpolation:
Background at λ₂ = A₁ + [(A₃ - A₁) × (λ₂ - λ₁) / (λ₃ - λ₁)] - Correction Application: Subtract the calculated background from the measured absorbance at λ₂:
Corrected A₂ = Measured A₂ - Background at λ₂ - Quantification: Use the corrected absorbance value for all subsequent calculations of analyte concentration.
Troubleshooting Guide
Common Issues and Solutions
| Problem | Possible Cause | Solution |
|---|---|---|
| Inconsistent Results | Reference wavelengths placed in regions of high spectral variance | Check the spectral shape around reference wavelengths; select more stable regions |
| Over-correction | Reference wavelengths too close to analytical peak | Increase distance between λ₂ and reference wavelengths, ensuring they remain in linear background regions |
| Poor Accuracy | Severely non-linear background that cannot be approximated linearly | Consider alternative methods like derivative spectroscopy [2] |
| High Noise | Sample turbidity or particulate matter | Centrifuge or filter sample to remove light-scattering particulates [30] |
Frequently Asked Questions
What types of background interference can the three-point method correct?
The three-point correction method is specifically designed to compensate for background absorbance with a constant slope [2]. It works best for linearly sloping backgrounds and can provide reasonable approximation for mildly curved backgrounds when the reference wavelengths are appropriately positioned.
How does this method compare to other background correction techniques?
The table below compares the three-point correction method with other common background correction approaches:
| Method | Principle | Best For | Limitations |
|---|---|---|---|
| Three-Point Correction | Linear interpolation between two reference wavelengths | Non-linear background with constant slope | Less effective for highly irregular backgrounds |
| Single-Point Correction | Subtracts absorbance at single reference wavelength [30] | Constant background offset | Cannot correct sloping backgrounds |
| Derivative Spectroscopy | Converting normal spectrum to first or higher derivatives [2] | Eliminating constant baseline shifts and resolving overlapping peaks | Reduced signal-to-noise ratio in higher derivatives |
| Iso-absorbance Measurements | Using wavelengths where interferers have equal absorbance [2] | Known interferents with characteristic spectra | Requires specific knowledge of interferent properties |
When should I use three-point correction versus derivative spectroscopy?
Use three-point correction when dealing with a relatively smooth, sloping background that can be approximated linearly between your reference wavelengths. Choose derivative spectroscopy when you need to resolve overlapping peaks or eliminate constant baseline shifts, particularly when working with complex mixtures where background characteristics are not consistently linear [2].
Can this method correct for all types of spectral interference?
No technique can correct for all interference types. The three-point method primarily addresses background with a constant slope [2]. It cannot completely eliminate interference from compounds absorbing at the analytical wavelength or correct for highly structured, non-linear backgrounds without additional complementary techniques.
Research Reagent Solutions
Essential Materials for Implementation
| Reagent/Material | Function in Three-Point Correction |
|---|---|
| High-Purity Solvents | Minimize background absorbance from solvent impurities [5] |
| Reference Standards | Verify wavelength accuracy and instrument performance |
| Filter Membranes (0.45 μm or 0.2 μm) | Remove particulates causing light scattering [30] |
| Matched Cuvettes | Ensure consistent path length for sample and reference measurements |
| Certified Reference Materials | Validate the correction method accuracy with known standards |
Multicomponent Analysis for Deconvoluting Spectrally Overlapping Compounds
Troubleshooting Guides and FAQs
My deconvolution results are inaccurate. What could be wrong?
Inaccurate deconvolution can stem from issues with your sample, instrument, or the fundamental assumptions of the method. The table below summarizes common problems and their solutions.
| Problem Area | Specific Issue | Recommended Solution |
|---|---|---|
| Sample Preparation | High concentration / Non-linearity | Dilute sample to an absorbance below 1.2 AU (ideal range 0.2-1.0 AU) to maintain Beer-Lambert law linearity. [8] |
| Cloudy or particulate samples | Filter samples to remove light-scattering particles that violate deconvolution assumptions. [8] | |
| Inappropriate solvent | Ensure the solvent does not absorb strongly in your measurement range. Use a matched blank for correction. [8] | |
| Instrument Performance | Stray light | Perform regular instrument calibration and stray light checks as per guidelines (e.g., USP 857). [8] |
| Unstable baseline | Allow the lamp to warm up for ~20 minutes for stable output. Use a double-beam instrument to correct for real-time drift. [8] [6] | |
| Method & Assumptions | Perfectly overlapping spectra | The method requires spectra to be not completely identical in at least part of the measured range. [31] |
| Incorrect reference spectra | Ensure the pure component spectra used for deconvolution are accurate and not affected by interactions. [31] |
How do I choose and validate a deconvolution algorithm?
Selecting and validating an algorithm is crucial for reliable results. Here is a comparison of common approaches:
| Algorithm Type | Key Principle | Advantages | Limitations |
|---|---|---|---|
| Non-Negative Least Squares (NNLS) [32] | Finds the best-fit combination of components with non-negative concentrations. | Prevents physically meaningless negative concentrations; reliable for chemical mixtures. | Requires known pure component spectra; fit can be poor if wrong references are used. |
| Search-Based Algorithm [31] | Systematically tests concentration ratios to find the combination with the lowest Root Mean Square Error (RMSE). | Finds a global minimum RMSE, avoiding local minima; higher result reliability. | Computationally intensive for more than 3 components; requires user-defined search range. |
Validation Protocol: To verify your deconvolution method, prepare a standard mixture with known concentrations of the analytes. Resolve its spectrum using your chosen algorithm and compare the calculated concentrations to the known values. A well-validated method will show a low Root Mean Square Error (e.g., 1.29 μM in a verified study) and excellent mass conservation (e.g., 100.4% ± 0.458%). [31]
The deconvolution process is creating artifacts. How can I fix this?
Artifacts, or the appearance of non-existent components, often occur when the algorithm over-fits the data.
- Use Constrained Algorithms: Employ methods like Non-Negative Least Squares (NNLS) that restrict concentrations to positive values, which is more chemically realistic. [32]
- Limit Component Number: When using mathematical deconvolution into Gaussian bands, manually restrict the number of components to only those you have reason to believe are present. Allowing the algorithm to add bands freely to minimize error can generate artifacts. [31]
- Verify with Reference Spectra: If possible, use the second deconvolution approach, which fits the mixture spectrum using the known spectra of the suspected pure components. This method is less susceptible to artifacts. [31]
Experimental Protocols
Detailed Methodology for Spectral Deconvolution of a Ternary Mixture
This protocol outlines the steps to resolve the spectrum of a three-component mixture using a search-based algorithm, as demonstrated with chlorophenol compounds. [31]
1. Prerequisite: Obtain Pure Component Spectra
- Prepare standard solutions of each suspected pure component (e.g., 2,4,5-Trichlorophenol, 2-Chlorophenol, 4-Chlorophenol).
- Buffer all solutions to a consistent pH to ensure a uniform chemical form.
- Record the UV-Vis absorption spectrum for each pure component over a defined wavelength range (e.g., 230–350 nm) using a diode-array spectrophotometer.
2. Measure the Mixture Spectrum
- Prepare the sample mixture containing the unknown quantities of the three components.
- Using the same instrument and settings, record the absorption spectrum of the mixture.
3. Data Preprocessing
- Normalize each pure component spectrum and the mixture spectrum by dividing all absorbance values by their respective maximum optical density (O.D.). This creates normalized vectors (XN(\lambda)), (YN(\lambda)), (ZN(\lambda)), and (MixN(\lambda)). [31]
4. Computational Deconvolution
- The core calculation assumes the mixture spectrum is a linear combination of the normalized component spectra:
Calculated = X_N(λ) + K1 * Y_N(λ) + K2 * Z_N(λ), where K1 and K2 are the ratios of Y and Z to X, respectively. [31] - The algorithm systematically searches through a user-defined range of values for K1 and K2.
- For each (K1, K2) pair, it calculates a
Calculated_Nspectrum and computes the Root Mean Square Error (RMSE) against the actualMix_N(λ)spectrum. - The pair that yields the lowest RMSE is identified as the best fit.
5. Concentration Calculation
- From the optimal K1 and K2 values, the scalars (A, B, C) representing the actual contribution of each component to the original mixture spectrum are derived.
- Using the known concentrations of the standard solutions, these scalars are converted into the concentrations of each component in the mixture.
Workflow for Multicomponent Spectral Deconvolution
The following diagram illustrates the logical workflow for the experimental deconvolution process.
The Scientist's Toolkit
Essential Materials and Reagents for Reliable Deconvolution
This table lists key items required for the experiments described in this guide.
| Item | Function in the Experiment |
|---|---|
| Quartz Cuvettes | Standard sample holders for UV-Vis spectroscopy. They provide high transmission in the UV and visible light regions, unlike plastic or glass. [6] |
| Certified Reference Materials | High-purity standards (e.g., Holmium Oxide for wavelength calibration) traceable to bodies like NIST. Essential for accurate instrument calibration. [8] |
| pH Buffers | Used to control the protonation state of ionizable analytes (e.g., phenols), ensuring a uniform chemical species and a stable, reproducible spectrum. [31] |
| Appropriate Solvents | High-purity solvents that do not absorb strongly in the spectral region of interest, preventing interference with the analyte signal. [8] |
| Syringe Filters | For removing particulates from solution samples to prevent light scattering, which can cause deviations from the Beer-Lambert law. [8] |
| MATLAB / Linear Algebra Software | A programming environment ideal for implementing and running matrix-based deconvolution algorithms due to its efficient handling of vectors and matrices. [31] |
Algorithm Selection and Application Logic
Choosing the right computational approach is critical. The diagram below outlines the decision-making process.
Troubleshooting Guides
Guide 1: High Background Scattering in UV-Vis Measurements
- Problem: Unusually high or noisy baseline in the UV-Vis spectrum, making accurate quantification of the analyte at 260 nm difficult.
- Explanation: This is a classic symptom of light scattering caused by suspended particulate matter or undissoved impurities in your sample [1]. These particles deflect light away from the detector, leading to an elevated and unstable background signal that obscures the true absorbance of your analyte [33] [21].
- Solution:
- Visual Inspection: Confirm the sample is not cloudy or turbid.
- Centrifugation: Subject the sample to high-speed centrifugation (e.g., 10,000-15,000 RPM for 10-15 minutes) to pellet particulate matter [34].
- Filtration: Carefully pass the supernatant through a compatible syringe filter (e.g., 0.22 µm or 0.45 µm pore size) [34]. For precious µl-size samples, centrifugation is the preferred method to avoid analyte loss on the filter membrane [1].
- Re-measure: Analyze the clarified supernatant or filtrate.
Guide 2: Inconsistent Replicate Measurements
- Problem: Significant variation in absorbance readings between technical replicates of the same sample.
- Explanation: Inconsistent scattering due to a non-homogeneous sample, where the number and size of scattering particles are not uniform across aliquots [1]. This is common in samples containing aggregates or precipitated material.
- Solution:
- Homogenize: Gently but thoroughly vortex or mix the sample before aliquoting.
- Systematic Clarification: Implement a standardized sample preparation protocol that includes both centrifugation and filtration for all samples prior to dilution and measurement [34].
- Verify Instrument: Ensure the cuvette is clean and properly positioned.
Guide 3: Suspected Analyte Loss During Filtration
- Problem: Lower-than-expected analyte concentration after filtration, indicating the target molecule may be binding to the filter membrane.
- Explanation: Certain filter membranes can adsorb specific analytes, such as proteins or nucleic acids, leading to a loss of signal [34].
- Solution:
- Filter Compatibility: Switch to a low-protein-binding filter membrane material, such as polyethersulfone (PES) or cellulose acetate.
- Pre-rinse: Pre-rinse the filter with a small volume of the solvent or buffer to saturate non-specific binding sites.
- Alternative Method: If loss persists, rely on centrifugation as the primary clarification method and ensure the sample is centrifuged thoroughly to achieve a clear supernatant [1] [34].
Frequently Asked Questions (FAQs)
Scattering in UV-Vis primarily arises from physical interferences [1]. In the context of drug research, this is most often caused by:
- Undissolved API or Excipients: Incomplete dissolution of the drug substance or formulation components.
- Particulate Contaminants: Dust or impurities from containers, buffers, or the environment.
- Complex Formulations: The presence of delivery nanoparticles (e.g., lipid or polymeric NPs) designed to encapsulate the drug, which inherently scatter light [33].
When should I choose filtration over centrifugation, or vice versa?
The choice depends on your sample volume, properties, and the risk of analyte loss. The following table summarizes the key differences:
| Method | Ideal Use Case | Key Advantage | Potential Drawback |
|---|---|---|---|
| Filtration | Larger volumes (>1 mL); rapid processing; requires crystal-clear supernatant [34]. | Effectively removes all particles larger than the pore size. | Risk of analyte adsorption to the filter membrane [34]. |
| Centrifugation | Small (µl-size) samples; precious or sticky analytes that bind to filters [1]. | Avoids a filtration step, thereby minimizing the risk of analyte loss. | May not achieve absolute clarity if very fine particles remain suspended. |
Can I use these methods for nanoparticle-containing formulations?
Yes, but with a critical distinction. Filtration and centrifugation are excellent for removing unwanted particulate impurities from a sample. However, if the nanoparticles themselves (e.g., LNPs, polymer NPs) are the subject of your study, these methods could remove or alter your target analyte [33]. For quantifying RNA within intact nanoparticles, specialized techniques like Scatter-Free Absorption Spectroscopy (SFAS) have been developed to mathematically subtract the scattering signal, eliminating the need for physical disruption or purification that could change the formulation [33].
What is the recommended workflow to minimize scattering?
A robust, generalized workflow for sample preparation is as follows:
Are there any other techniques to handle scattering?
Yes, if physical removal of scattering particles is not feasible, instrumental or mathematical corrections can be applied:
- Integrating Sphere: Instruments equipped with an integrating sphere can capture scattered light, allowing for a scatter-free absorption measurement [33].
- Derivative Spectroscopy: This computational technique can help resolve overlapping peaks and correct for baseline shifts caused by broadband scattering [1].
The Scientist's Toolkit: Research Reagent Solutions
| Item | Function & Application |
|---|---|
| Syringe Filters (0.22 µm / 0.45 µm) | For sterile clarification of buffers and samples. Pore size 0.45 µm is standard, while 0.22 µm provides sterilization [34]. |
| Low-Protein-Binding Filters (PES) | Minimizes loss of biological analytes like proteins or nucleic acids during filtration [34]. |
| Micro-Centrifuges | Essential for pelleting particles from small-volume samples (e.g., 0.5-2.0 mL tubes) [34]. |
| High-Speed Preparative Centrifuges | Used for pelleting denser or finer particles that require higher g-forces. |
| Quartz Cuvettes | Provide optimal clarity for UV-Vis measurements and are resistant to most solvents. Ensure they are meticulously clean to avoid scattering artifacts [21]. |
Troubleshooting Spectral Interference: A Proactive Guide for Complex Drug Matrices
This guide provides a systematic approach for researchers and scientists to diagnose and resolve unknown interferences in UV-Vis spectroscopy, specifically within the context of drug development and impurity analysis.
Diagnostic Flowchart: Troubleshooting UV-Vis Interferences
The following flowchart outlines a systematic procedure to identify the source of interference in your UV-Vis measurements. Follow the logical path based on your observations to diagnose the issue.
Detailed Investigation Protocols
Sample-Related Issues
Sample Purity and Contamination Verification
Unexpected peaks in your spectrum often indicate contamination introduced during sample preparation [6].
Protocol:
- Prepare fresh solvent blanks using high-purity solvents from newly opened containers
- Clean all glassware with appropriate solvents (e.g., HPLC-grade methanol, acetone)
- Use certified clean cuvettes and handle only with gloved hands to avoid fingerprints [6]
- Repeat sample preparation in a controlled environment to exclude airborne contaminants
- Analyze blanks independently to establish a clean baseline before sample measurement
Cuvette and Substrate Qualification
Improper cuvette selection or condition can cause scattering, absorption artifacts, and inaccurate readings [6].
Protocol:
- Select appropriate cuvette material:
- Quartz: Required for UV range (190-400 nm) and visible range
- Glass: Suitable only for visible range (400-700 nm)
- Disposable plastic: For visible range with compatible solvents only [6]
- Inspect for physical damage: Check for scratches, cracks, or cloudiness
- Verify pathlength: Ensure consistent light path through sample
- Clean properly: Rinse with compatible solvents and dry with inert gas
- Test cuvette blanks: Measure empty cuvette against air to check for inherent absorption
Instrument-Related Issues
Light Source Diagnostics
Aging or faulty lamps cause energy fluctuations, drift, and inconsistent readings [35] [36].
Protocol:
- Check lamp hours: Replace deuterium lamps after ~1000 hours, tungsten lamps after ~2000 hours
- Visual inspection: For tungsten lamps, look for blackening; for deuterium, check for diminished purple glow [36]
- Energy test: Run instrument self-test; "NG9" or "D2-failure" errors indicate lamp replacement needed [36]
- Warm-up time: Allow 20 minutes for tungsten halogen or arc lamps, few minutes for LED sources [6]
- Beam alignment: Verify light path is correctly aligned through sample and reference paths
Wavelength Accuracy and Calibration
Inaccurate wavelength calibration leads to incorrect peak identification and quantification.
Protocol:
- Use certified wavelength standards: Holmium oxide or didymium filters for validation
- Check resolution: Verify instrument meets specified resolution (e.g., ≤1 nm) [35]
- Monitor baseline stability: Excessive noise indicates detector or source problems
- Validate with known standards: Measure compounds with characteristic absorption maxima
- Regular maintenance: Follow manufacturer's calibration schedule and procedures
Methodology-Related Issues
Solvent and Matrix Interference Assessment
Solvents can absorb at analytical wavelengths, masking or distorting sample peaks [37].
Protocol:
- Match reference and sample matrices: Ensure identical solvent composition in blank and sample
- Select transparent solvents: Choose solvents with minimal absorption at analytical wavelengths
- Account for pH effects: Buffer samples to maintain consistent ionization states
- Consider temperature stability: Maintain constant temperature to avoid refractive index changes
- Evaluate inner-filter effects: For fluorescence, ensure absorbance <0.1 at excitation wavelength [38]
Concentration Optimization
Overly concentrated samples cause non-linear Beer-Lambert behavior and signal saturation [6].
Protocol:
- Dilution series: Prepare 3-5 concentrations to verify linearity (absorbance 0.1-1.0 AU) [38]
- Pathlength adjustment: Use shorter pathlength cuvettes (e.g., 1mm vs. 10mm) for concentrated samples [6]
- Multiple wavelength analysis: Compare ratios at different wavelengths for consistency
- Standard addition: For complex matrices, use standard addition to account for matrix effects
- Evaporation control: Seal samples to prevent concentration changes during extended measurements [6]
Research Reagent Solutions
Table: Essential Materials for UV-Vis Pharmaceutical Analysis
| Reagent/Material | Function | Application Notes |
|---|---|---|
| Quartz Cuvettes | Sample containment with optimal UV-Vis transmission | Reusable; pathlength 1-10mm; handle with gloves [6] |
| HPLC-Grade Solvents | Sample dissolution and dilution | High purity minimizes background absorption [6] |
| Certified Reference Standards | Instrument calibration and validation | Holmium oxide for wavelength verification [35] |
| Buffer Systems | pH control for consistent analyte ionization | Phosphate, acetate, borate at appropriate concentrations |
| Stabilizing Agents | Prevent analyte degradation (e.g., mercury) | Gold stabilizes mercury in impurity analysis [39] |
| Digestion Reagents | Sample preparation for elemental impurity analysis | Acid mixtures (HNO₃, HCl) for total digestion [39] |
| Collision/Reaction Gases | Interference correction in ICP-MS | Helium, hydrogen for polyatomic interference removal [39] |
Frequently Asked Questions
Sample Preparation
Q: Why do I see unexpected peaks in my spectrum? A: Unexpected peaks typically indicate contamination. Check your sample preparation process, ensure cuvettes are properly cleaned, verify solvent purity, and handle samples with gloves to avoid fingerprints [6].
Q: How does sample concentration affect my results? A: Excessive concentration causes non-linear absorbance and signal saturation. Maintain absorbance between 0.1-1.0 AU for accurate quantification. For concentrated samples, either dilute or use shorter pathlength cuvettes [6] [38].
Instrument Performance
Q: My spectrophotometer shows "energy error" or "low signal" - what should I check? A: Start by verifying the light source. Deuterium lamps typically need replacement after ~1000 hours. Check that the lamp is properly ignited and ensure nothing is blocking the light path. Also inspect for dirty optics or misaligned components [35] [36].
Q: Why does my baseline drift during measurements? A: Baseline drift can indicate lamp warm-up instability, temperature fluctuations, or solvent evaporation. Allow sufficient warm-up time (20 minutes for conventional lamps), maintain constant temperature, and ensure sample compartment is properly sealed [35] [6].
Method Development
Q: How do I minimize solvent interference in pharmaceutical analysis? A: Match the reference blank to your sample matrix exactly. Use high-purity solvents transparent at your analytical wavelengths. For complex formulations, consider standard addition methods to account for matrix effects [37].
Q: What are the key considerations for transferring methods between laboratories? A: Develop clear standard operating procedures (SOPs) that account for instrument variability. Characterize method performance with multiple approaches during validation. Document all critical parameters including digestion conditions, stabilizing agents, and interference correction methods [39].
Regulatory Compliance
Q: How do I address elemental impurity analysis per ICH Q3D and USP <232>/<233>? A: Implement a risk-based approach with appropriate sample preparation (total digestion or exhaustive extraction). Use interference correction methods like collision/reaction gases in ICP-MS. Include stabilizers for volatile elements like mercury and validate methods across the required concentration ranges [39].
Troubleshooting Guides
Guide to Path Length Optimization
Problem: Inconsistent or inaccurate sample concentration readings, especially with highly concentrated samples or small sample volumes.
Explanation: The path length, the distance light travels through your sample, is a critical factor governed by the Beer-Lambert Law. An incorrect path length can lead to absorbance values outside the ideal linear range, causing inaccurate concentration calculations [6] [8].
Solutions:
- For high-concentration samples: Reduce the path length to decrease the probability of light scattering and bring the absorbance signal into the optimal range [6].
- For small sample volumes: Use a micro-volume cuvette or one specifically designed with a shorter path length to ensure the excitation beam passes entirely through the sample [6].
- Ensure proper alignment: For thin film samples, position the sample holder to be perpendicular to the light source and detector to ensure a consistent and defined path length [6].
Experimental Protocol: Determining Optimal Path Length
- Prepare Sample: Start with a representative sample solution.
- Initial Measurement: Use a standard 10 mm path length cuvette and measure the absorbance at your target wavelength.
- Evaluate: If the absorbance is too high (e.g., >1.5 AU), the signal may be outside the linear dynamic range [8].
- Iterate: Switch to a cuvette with a shorter path length (e.g., 2 mm or 5 mm) and remeasure.
- Validate: The ideal absorbance for the sample should fall within the instrument's verified linear range, typically between 0.1 and 1.0 Absorbance Units (AU) for the highest accuracy [40].
Guide to Wavelength Selection and Stray Light
Problem: Noisy baseline, shifted peaks, or inaccurate absorbance measurements, particularly at low wavelengths or with high-absorbance samples.
Explanation: Wavelength selection is crucial for targeting the analyte's absorption peak while avoiding regions where the solvent or impurities absorb strongly. Stray light, unwanted light outside the chosen wavelength, becomes a significant source of error at high absorbance levels and can cause non-linearity [8].
Solutions:
- Solvent Compatibility Check: Always use a solvent blank and confirm that your solvent does not have significant absorption at your analyte's peak wavelength. For UV measurements below 340 nm, use quartz cuvettes, as glass and plastic absorb strongly in this region [40].
- Instrument Calibration: Perform regular wavelength accuracy calibration using certified reference standards like Holmium Oxide [8].
- Minimize Stray Light: Ensure the sample compartment lid is closed securely and that the instrument's internal optics are clean. For high-precision work, select an instrument with low stray light characteristics [8].
Experimental Protocol: Wavelength Selection and Validation
- Perform a Full Scan: Run an initial scan (e.g., from 200 nm to 800 nm) of your sample and blank to identify the analyte's peak of interest and potential solvent cut-off wavelengths.
- Select Analytic Wavelength: Choose the wavelength maximum (( \lambda_{\text{max}} )) for your quantitative measurements.
- Verify Solvent Transparency: Ensure your solvent has minimal absorbance at your selected ( \lambda_{\text{max}} ). For example, ethanol absorbs strongly below 210 nm [8].
- Check for Impurity Peaks: Examine the full spectrum for unexpected peaks that may indicate contamination or overlapping impurities [6].
Guide to Managing Dynamic Range and Linearity
Problem: The relationship between absorbance and concentration is not linear, violating the Beer-Lambert Law and making accurate quantification impossible.
Explanation: The dynamic range of a UV-Vis instrument is the concentration range over which it can measure absorbance accurately. Deviations from linearity occur at high concentrations due to molecular interactions or instrumental factors like stray light [8].
Solutions:
- Optimal Absorbance Range: Prepare samples to have absorbance values between 0.2 and 1.0 AU, ideally below 1.2 AU, where the Beer-Lambert Law is most reliable [8] [40].
- Systematic Dilution: If the sample is too concentrated, perform a serial dilution until the measured absorbance falls within the linear range.
- Validation: Establish a calibration curve with multiple standard concentrations to define the linear working range for your specific method [8].
Experimental Protocol: Establishing Method Linearity
- Prepare Standard Solutions: Create a series of at least 5 standard solutions of known concentration, covering the expected range of your samples.
- Measure Absorbance: Measure the absorbance of each standard at the target wavelength.
- Plot Calibration Curve: Create a plot of Absorbance (y-axis) vs. Concentration (x-axis).
- Assess Linearity: Calculate the correlation coefficient (( R^2 )). A value of >0.995 typically indicates acceptable linearity. The usable dynamic range is where this linear relationship holds.
Optimization Parameter Tables
Table 1: Path Length Scenarios and Solutions
| Scenario | Symptom | Recommended Path Length Adjustment | Rationale |
|---|---|---|---|
| High Concentration Sample | Absorbance >1.5 AU [8] | Decrease path length (e.g., from 10 mm to 2 mm) | Shortens the light travel distance, reducing absorbance into the linear range [6]. |
| Low Concentration Sample | Weak, noisy signal | Increase path length (e.g., from 10 mm to 50 mm) | Lengthens the light travel distance, increasing the absorbance signal. |
| Limited Sample Volume | Beam does not pass through sample [6] | Use a micro-volume cuvette | Specialized design ensures the beam passes through the small sample volume. |
Table 2: Dynamic Range and Absorbance Best Practices
| Parameter | Optimal Range | Consequence of Deviation | Corrective Action |
|---|---|---|---|
| Absorbance (for quantitation) | 0.1 - 1.0 AU [40] | High Abs: Non-linearity, stray light error [8]. Low Abs: High relative noise. | Dilute sample (for high abs) or concentrate sample (for low abs). |
| Sample Concentration | Within linear range of calibration curve | Incorrect concentration results. | Perform serial dilution to bring into the established linear range [8]. |
| Instrument Validation | Wavelength accuracy: ±1 nm; Stray light <0.1% | Inaccurate peaks and absorbance values. | Regular calibration with certified reference materials (e.g., Holmium Oxide) [8]. |
Frequently Asked Questions (FAQs)
Q1: My sample is very concentrated, and I cannot dilute it without affecting the chemistry. How can I reduce the absorbance? A: Dilution is the primary method, but if it's not possible, the most effective alternative is to reduce the path length. Using a cuvette with a shorter path length (e.g., 1 mm or 2 mm instead of 10 mm) will lower the measured absorbance without altering your sample's chemical composition [6] [8].
Q2: How does stray light affect my measurements, and how can I minimize it? A: Stray light causes deviations from the Beer-Lambert Law, particularly at high absorbance values (typically above 1.2 AU), leading to falsely low absorbance readings. To minimize it, ensure your instrument is well-maintained and calibrated, keep the sample compartment clean and closed, and use cuvettes that are clean and free of scratches [8].
Q3: What is the single most important practice for ensuring accurate UV-Vis results in drug research? A: While several factors are critical, consistent and proper sample preparation is foundational. This includes using the correct solvent for the blank, ensuring cuvettes are impeccably clean and matched, and verifying that sample concentrations are within the instrument's validated linear dynamic range through dilution or path length adjustment [6] [40].
Q4: My blank zeroes correctly, but I get negative absorbance for my sample. What does this mean? A: A negative absorbance value typically indicates that your sample is transmitting more light than your blank. This usually happens if the cuvette used for the sample is cleaner or has better optical properties than the one used for the blank, or if the blank solution itself is "dirtier" (has a higher background) than your sample. For the highest precision, always use the exact same cuvette for both the blank and sample measurements [40].
Workflow and Data Interpretation Diagrams
Optimization Workflow
Spectral Deconvolution
The Scientist's Toolkit: Research Reagent Solutions
Table 3: Essential Materials for UV-Vis Analysis in Drug Research
| Item | Function | Importance for Reducing Interference |
|---|---|---|
| Quartz Cuvettes | Sample holder for UV-Vis measurements. | Essential for UV range (<340 nm); glass/plastic absorb UV light and cause error [40]. |
| Spectrophotometric Grade Solvents | High-purity solvents for sample preparation and blanks. | Minimize background absorbance, especially in the UV range, ensuring the signal comes from the analyte [8]. |
| Certified Reference Materials (e.g., Holmium Oxide) | Standards for instrument wavelength calibration. | Ensures wavelength accuracy, which is critical for correct peak identification and quantification [8]. |
| Matched Cuvette Pairs | Cuvettes with nearly identical optical properties. | Prevents errors in blanking, which can lead to negative absorbance or baseline drift [40]. |
| Syringe Filters (0.45 μm or 0.2 μm) | For filtering samples before analysis. | Removes particulates that cause light scattering, a common source of interference and inaccurate high absorbance [8]. |
Addressing Challenges in Biologics and Complex Formulations
Troubleshooting Guides
Guide 1: Addressing Baseline Anomalies and Ghost Peaks in HPLC-UV
Problem: Unstable baseline, drifting signal, or unexpected "ghost peaks" are observed during HPLC analysis, compromising impurity quantification.
Questions and Answers:
Q: My detector baseline is noisy and unstable. What are the primary causes?
- A: Baseline anomalies often stem from chemical, physical, or instrumentation issues. Key culprits include [41]:
- Mobile Phase Impurities: Reagents or solvents may contain highly retained impurities that accumulate on the column and elute as broad baseline drifts or sharp ghost peaks [41].
- Inconsistent Mobile Phase Composition: Pump problems, such as a sticky check valve or trapped air bubbles, can cause inconsistent flow from one pump head in a binary system, leading to a saw-tooth pattern in the baseline [41].
- Detector Temperature Fluctuations: Refractive index (RI) detectors are notoriously sensitive to temperature changes, and UV detectors can also exhibit baseline drift if the laboratory environment is not stable [41].
- A: Baseline anomalies often stem from chemical, physical, or instrumentation issues. Key culprits include [41]:
Q: How can I troubleshoot and resolve mobile phase-related baseline issues?
- A: Follow this systematic protocol [41]:
- Prepare Fresh Mobile Phase: Use high-purity solvents and additives from different manufacturers or lots to rule out contamination.
- Flush the Column: Perform a strong solvent wash to elute any accumulated impurities.
- Run a Blank Gradient: Inject a pure solvent sample to see if the ghost peaks persist. If they do, the issue is with the mobile phase or system, not your sample.
- Inspect the Pump: Check for air bubbles in the pump heads and ensure check valves are functioning correctly.
- A: Follow this systematic protocol [41]:
Q: The software indicates my peak is pure, but I suspect co-elution. What should I do?
- A: UV-based peak purity assessment has limitations. A "pure" result from the software is not a definitive guarantee [42].
- Manually Review Spectra: Examine the overlaid spectra from the upslope, apex, and downslope of the peak. Any spectral variation indicates a potential impurity [42].
- Use Orthogonal Detection: If available, confirm peak purity using LC-MS, which detects co-elution based on mass differences, providing a more definitive assessment [42].
- A: UV-based peak purity assessment has limitations. A "pure" result from the software is not a definitive guarantee [42].
Guide 2: Managing Spectral Overlap in Multicomponent UV-Vis Analysis
Problem: UV-Vis spectra of active pharmaceutical ingredients (APIs) in a complex formulation overlap, making individual quantification difficult and increasing interference from impurities.
Questions and Answers:
Q: Can UV-Vis spectroscopy be used for quantification in mixtures with severe spectral overlap?
- A: Yes, by coupling UV-Vis with chemometric models. Traditional univariate analysis fails with overlapping spectra, but multivariate calibration tools like Partial Least Squares (PLS) and Multivariate Curve Resolution with Alternating Least Squares (MCR-ALS) can resolve and quantify individual components [43]. These methods use full spectral data rather than a single wavelength.
Q: What is a proven experimental protocol for quantifying two drugs in a combined formulation using UV-Vis and chemometrics?
- A: A protocol for analyzing Clofazimine (CLZ) and Dapsone (DAP) can be adapted for other mixtures [43]:
- Solution Preparation: Prepare stock solutions of each pure API. Use an experimental design (e.g., a factorial design) to create a calibration set of synthetic mixtures covering the expected concentration ranges of both components.
- Spectra Acquisition: Using a UV-Vis spectrophotometer, measure the absorption spectra of all pure and mixture solutions within the 200-800 nm range.
- Model Development:
- PLS Regression: Correlate the spectral data matrix with the known concentration matrix of the calibration set to build a predictive model.
- MCR-ALS: Decompose the spectral data matrix from the mixtures to resolve the pure spectral profile and concentration of each component iteratively, applying constraints like non-negativity.
- Model Validation: Use an independent set of test samples (with known concentrations) to validate the predictive accuracy of the models. Compare the results against a reference method like HPLC.
- A: A protocol for analyzing Clofazimine (CLZ) and Dapsone (DAP) can be adapted for other mixtures [43]:
Q: What are the advantages of this chemometric approach over HPLC?
- A: The UV-Vis/chemometrics approach offers a faster, more cost-effective, and greener alternative. It reduces the consumption of organic solvents, requires less sample preparation, and shortens analysis time, making it suitable for routine analysis [43].
Guide 3: Ensuring Stability of Biologic Therapeutics During Analysis
Problem: Biologics such as monoclonal antibodies (mAbs), fusion proteins, and gene therapies are prone to degradation (aggregation, fragmentation, deamidation) during sample preparation and analysis, leading to inaccurate impurity profiles.
Questions and Answers:
Q: What are the key stability challenges with monoclonal antibodies and fusion proteins during analytical handling?
- A: These large proteins are susceptible to both conformational instability (unfolding) and colloidal instability (aggregation), which can be triggered by fluctuations in pH, temperature, or mechanical stress. This often results in the formation of aggregates, a critical quality attribute that must be monitored [44].
Q: What strategies can I use to stabilize a biologic during method development?
- A: Implement stabilization strategies throughout the analytical process [44]:
- Formulation Buffers: Use optimized buffering agents and stabilizers like sugars or amino acids in the sample solvent to maintain pH and structural integrity.
- Temperature Control: Keep samples at recommended storage temperatures (e.g., 2-8°C) and minimize exposure to room temperature. Use chilled autosamplers.
- Lyophilization: For long-term storage of reference standards or sensitive biologics, lyophilization (freeze-drying) can greatly enhance stability.
- A: Implement stabilization strategies throughout the analytical process [44]:
Q: How should I design a stability study for a biologic drug substance?
- A: Follow a phased approach aligned with regulatory guidelines (ICH Q1A) [45]:
- Phase 1 (Early Development): Use short-term accelerated studies (e.g., 1-3 months at 40°C) to identify major degradation pathways.
- Phase 2 (Comprehensive Assessment): Conduct intermediate (e.g., 6-12 months at 25°C/60% RH) and long-term studies (e.g., up to 12 months at 5°C) on larger batches.
- Phase 3 (Registration): Execute long-term studies on at least three production batches over the proposed shelf life (e.g., 24 months) to establish the expiration date.
- Testing Intervals: Test at minimum at 0, 3, 6, 9, and 12 months in the first year, and every 6 months thereafter [45].
- A: Follow a phased approach aligned with regulatory guidelines (ICH Q1A) [45]:
Frequently Asked Questions (FAQs)
Q1: What advanced analytical techniques are most critical for impurity profiling in biologics? Techniques like HPLC-MS/MS and LC-MS are pivotal due to their high sensitivity and specificity in detecting and characterizing trace-level impurities, including post-translational modifications and degradation products in complex biologic matrices [10] [46]. Peak Purity Assessment using Photodiode Array (PDA) detectors is also essential for identifying co-eluting impurities in HPLC methods [42].
Q2: How does the use of viral vectors in gene therapy create unique analytical challenges? Viral vectors, such as adeno-associated viruses (AAVs), are inherently brittle and prone to degradation during storage and handling. This can impact their therapeutic efficacy by reducing gene encapsulation efficiency and transduction capability, requiring the use of specialized stabilizers and excipients [44].
Q3: My UV-Vis sample is turbid due to a biologic suspension. How does this affect the analysis? Turbidity causes significant light scattering, which dominates the absorption signal and makes quantification of soluble analytes unreliable. In such cases, the measurement primarily reflects optical density (OD), which is useful for estimating cell biomass concentration but cannot distinguish between viable cells, cell debris, or other solid particles [47].
Q4: What regulatory guidelines govern impurity profiling and stability testing? Key guidelines include ICH Q2(R1) for analytical method validation, ICH Q6B for setting specifications for biologics, and ICH Q1A for stability testing protocols. Compliance with these, along with FDA and EMA regulations, is mandatory for market authorization [21] [46] [45].
Experimental Data and Protocols
Table 1: Quantification of Antibiotics in a Multicomponent Formulation via UV-Vis and Chemometrics
This table summarizes the performance of two chemometric models in quantifying Clofazimine (CLZ) and Dapsone (DAP) in combined tablets, compared to an HPLC reference method [43].
| Analytic | Chemometric Model | Correlation Coefficient (R²) | Root Mean Square Error of Prediction (RMSEP) | Relative Performance |
|---|---|---|---|---|
| Clofazimine (CLZ) | PLS | >0.99 | Reported | Good |
| MCR-ALS | >0.99 | Lower than PLS | Superior | |
| Dapsone (DAP) | PLS | >0.99 | Reported | Good |
| MCR-ALS | >0.99 | Similar to PLS | Very Good |
Table 2: The Scientist's Toolkit: Key Reagents and Materials for Complex Formulation Analysis
Essential materials for developing and troubleshooting analytical methods for biologics and complex drugs.
| Item | Function/Application | Key Considerations |
|---|---|---|
| High-Purity Mobile Phase Solvents & Additives | Prevents baseline drift and ghost peaks in HPLC by minimizing introduced impurities [41]. | Use LC-MS grade solvents; source from reputable suppliers. |
| Stabilizing Excipients (e.g., Sucrose, Trehalose) | Maintains conformational stability of biologic therapeutics (mAbs, proteins) in solution during sample preparation and storage [44]. | Compatibility with analytical columns and detectors must be verified. |
| Deuterated Solvents (e.g., D₂O, CDCl₃) | Essential for NMR spectroscopy; provides a locking signal and avoids interference in the proton spectrum for structural elucidation and impurity profiling [21]. | High isotopic purity is required for optimal results. |
| Chemometric Software | Enables resolution of overlapping UV-Vis spectra for accurate multicomponent quantification using models like PLS and MCR-ALS [43]. | Requires proper calibration and validation with standard mixtures. |
| Optimized Lipid Compositions | Critical for stabilizing mRNA therapeutics and lipid nanoparticles (LNPs) against degradation, a key challenge in advanced therapeutics [44]. | Particle size and encapsulation efficiency are critical quality attributes. |
Workflow Diagrams
Diagram 1: Systematic Troubleshooting for HPLC-UV Baseline Issues
Diagram 2: Workflow for UV-Vis Analysis of Multicomponent Formulations Using Chemometrics
For researchers in drug development, Real-Time Reaction Monitoring with UV-Vis Spectroscopy is a powerful technique for tracking reaction progress and quantifying analytes directly within a reactor. This non-destructive method provides immediate data on concentration changes, helping to identify intermediates and endpoints without the delays of offline analysis. However, its effectiveness can be severely compromised by spectral interference from impurities, a significant pitfall in pharmaceutical research. This guide addresses common challenges and provides proven solutions to ensure data accuracy and reliability in your experiments.
FAQs and Troubleshooting Guides
My UV-Vis readings are inconsistent and drift over time. What should I check?
Inconsistent readings often stem from instrument or sample handling issues. Follow this systematic approach:
- Check the Instrument: Ensure the light source (e.g., tungsten halogen or arc lamp) has been allowed to warm up for the recommended time, typically around 20 minutes, to achieve stable output [6]. An aging lamp can also cause fluctuations and may need replacement [48].
- Inspect the Cuvette: Examine the cuvette for scratches, residue, or fingerprints. Thoroughly wash and handle cuvettes only with gloved hands. Ensure it is properly aligned in the holder and that the light beam passes through the sample uniformly [6] [48].
- Verify Calibration: Regularly calibrate the instrument with the appropriate solvent and certified reference standards. Always perform a baseline correction with your reference solution before measuring samples [49] [48].
How can I tell if my sample is the source of the problem?
Sample-related issues are a leading cause of problematic data [6].
- Check for Contamination: Unexpected peaks in your spectrum often indicate contamination during preparation, decanting, or dissolution [6].
- Assess Concentration: An overly concentrated sample can lead to high absorbance values where readings become unstable or non-linear. If the absorbance is too high (e.g., above 1.0 AU), the signal can become unreliable [49] [6]. Dilute your sample or use a cuvette with a shorter path length.
- Consider Environmental Factors: Sample temperature can affect reaction rates and solubility, thereby changing concentration. Similarly, solvent evaporation over time can increase concentration. Maintain consistent temperature and seal samples to prevent evaporation [6].
I suspect spectral interference from impurities. How can I confirm and correct for this?
Spectral interference occurs when impurities in the sample absorb light in the same spectral region as your analyte, leading to significant concentration errors [5]. This is a critical challenge in complex pharmaceutical samples.
- Confirmation: A combination of UV-Vis spectrophotometry and constrained refractometry can detect the presence of unaccounted impurities. A large disagreement in concentration values obtained from the two techniques strongly suggests interference [5].
- Solution - Refractometry Assistance: Using a solvent whose refractive index differs from the analyte by at least 0.15 units can dramatically reduce the error from impurities. This "constrained refractometry" approach has been shown to reduce estimation errors from over 50% to about 2% in model systems, even with highly absorbing impurities [5].
When is in situ UV-Vis monitoring the right choice, and what are its limitations?
In situ monitoring is ideal for specific scenarios but not for every reaction [50].
- Ideal Use Cases:
- Reactions with transient, labile intermediates that would degrade during offline sampling.
- Fast reactions where manual sampling is impractical.
- Reactions sensitive to oxygen or moisture, where opening the reactor is undesirable.
- Slow reactions where automated monitoring saves time.
- Experiments with expensive or limited sample volumes [50].
- Limitations and Pitfalls:
- Spectral Overlap: Complex mixtures can make it difficult to resolve individual components without advanced data analysis (chemometrics) [50].
- Probe Fouling: Material can build up on the probe tip, leading to stagnant or drifting signals. Positioning the probe in a high-shear zone of the reactor can minimize this [50].
- Path Length Variability: In non-ATR systems, changes in the meniscus or air bubbles can alter the effective path length, introducing error.
Experimental Protocols
Protocol 1: Overcoming Spectral Interference with Refractive Index Assistance
This methodology is adapted from a technique demonstrated to significantly reduce errors in analyte concentration caused by spectrally interfering impurities [5].
1. Principle UV-Vis spectrophotometry is highly sensitive but prone to large errors from minor, highly absorbing impurities. Refractometry is less sensitive but experiences a much smaller and more predictable error from the same impurities. By combining the two techniques, the presence of interference can be detected, and a more accurate concentration can be determined [5].
2. Materials and Equipment
- UV-Vis spectrophotometer (e.g., Shimadzu UV-2600) [5].
- Refractometer with high precision (e.g., ATAGO RX-7000i, least count ~1×10⁻⁵) [5].
- Quartz cuvette (e.g., 1 cm path length).
- High-purity solvents (e.g., cyclohexane).
- Analyte standard (e.g., benzene).
- Eppendorf tubes.
3. Procedure
- Step 1: UV-Vis Analysis. Record the UV absorption spectrum of your sample. Determine the analyte concentration (c'_a) using a pre-established calibration curve at a specific wavelength, ignoring potential impurities [5].
- Step 2: Constrained Refractometry Analysis. Measure the refractive index of your sample solution at a controlled temperature (e.g., 20 ± 0.01°C). Prepare the solution in a solvent chosen so that its refractive index differs from that of your pure analyte by at least 0.15 units. Use the Lorentz-Lorenz equation to calculate the analyte concentration (v'_a) based on the refractive index measurement [5].
- Step 3: Data Interpretation and Error Assessment. Compare the concentration values (c'a from UV-Vis and v'a from refractometry).
- Strong Agreement: If the values are very close, spectral interference is likely minimal.
- Significant Disagreement: A large discrepancy indicates substantial spectral interference from impurities. In this case, the concentration value derived from constrained refractometry (v'_a) should be considered more reliable, as its maximum error is predictable and often lower [5].
Protocol 2: Validating an In Situ UV-Vis Method for Reaction Monitoring
1. Principle Before relying solely on in situ UV-Vis data for critical decisions, the method must be validated against a primary analytical technique to ensure quantitative accuracy [50].
2. Materials and Equipment
- In situ UV-Vis spectrometer with a suitable immersion probe.
- Reactor system (e.g., batch or flow reactor).
- Reference analytical instrument (e.g., HPLC, GC, NMR) [50].
- Calibration standards for all reactants and products.
3. Procedure
- Step 1: Feasibility and Calibration. Collect reference spectra of all pure components (reactants, products, suspected intermediates) ex situ. Perform calibration runs with known concentrations of these components in the reaction solvent to establish a calibration model [50].
- Step 2: In Situ Reaction Monitoring. Run the reaction while collecting in situ UV-Vis spectra continuously. Use a data collection interval appropriate for the reaction speed (e.g., every few seconds for fast reactions, every few minutes for slow ones) [50].
- Step 3: Sample Withdrawal and Offline Analysis. At key time points during the reaction (e.g., at t=0, at suspected half-life, and at reaction completion), withdraw small samples from the reactor. Immediately analyze these samples using your reference method (e.g., HPLC) [50].
- Step 4: Data Correlation. Correlate the concentration trends obtained from the in situ UV-Vis data (after processing with your calibration model) with the quantitative results from the offline analysis. The agreement between the two datasets validates the in situ method for future use [50].
Data Presentation
Table 1: Quantifying the Impact and Solution for Spectral Interference
This table summarizes data from a model system (benzene in cyclohexane with N,N-Dimethylaniline impurity) demonstrating the power of combined techniques [5].
| Method Used for Analysis | Reported Analyte Concentration | True Impurity Level | Resulting Error | Key Condition |
|---|---|---|---|---|
| UV-Vis Spectrophotometry | Overestimated | 1% NND | 53.4% | NND absorbs 70x more strongly than benzene |
| Constrained Refractometry | Much more accurate | 1% NND | ~2.0% | Solvent RI differed from analyte by ≥ 0.15 |
Table 2: Research Reagent Solutions for UV-Vis Analysis in Drug Research
| Reagent / Material | Function in Experiment | Key Consideration |
|---|---|---|
| Bakerbond C18 Column | Stationary phase for HPLC-UV impurity profiling; separates complex mixtures before detection [14]. | Particle size (e.g., 5µm), column dimensions (e.g., 250 x 4.6 mm), and temperature control (e.g., 35°C) impact resolution [14]. |
| Quartz Cuvettes | Sample holder for UV-Vis measurements in the UV and visible light range [6]. | Must be used for UV measurements due to high transparency; reusable but require meticulous cleaning to avoid contamination [6]. |
| Potassium Dihydrogen Phosphate (KH₂PO₄) Buffer | Component of the mobile phase in HPLC; maintains a stable pH to ensure consistent separation [14]. | pH must be adjusted (e.g., to 2.0 with phosphoric acid) for optimal peak shape and selectivity [14]. |
| Sodium 1-Octanesulfonate | Ion-pairing agent in HPLC mobile phase; helps separate and resolve ionic or ionizable analytes [14]. | Concentration is critical for controlling retention times of charged molecules like glycopyrronium [14]. |
| Acetonitrile:Methanol Mixture | Organic modifier in HPLC mobile phase; used in gradient elution to gradually increase elution strength [14]. | The ratio (e.g., 90:10) is optimized to achieve separation of all impurities within a reasonable run time [14]. |
Workflow and Signaling Diagrams
In Situ UV-Vis Reaction Monitoring Workflow
Technique Selection for Impurity Interference
Beyond UV-Vis: Orthogonal Methods and Advanced Validation for Impurity Profiling
Core Principles and Methodology
This section outlines the fundamental theory and practical workflow for implementing Refractive Index (RI)-assisted UV/Vis spectrophotometry to manage spectral interference.
The Problem: Spectral Interference from Impurities in UV/Vis Spectroscopy
Ultraviolet-Visible (UV/Vis) absorption spectrophotometry is a cornerstone technique for quantitative analysis in drug development. It operates on the Beer-Lambert Law (A = εbc), which relates absorbance (A) to analyte concentration (c). A significant limitation arises from spectral interference, where impurities in the sample also absorb light at the analytical wavelength, leading to overestimation of the target analyte's concentration [5].
The error can be severe. For instance, a mere 1% nucleic acid contamination can cause a 26.3% error in the quantification of Bovine Serum Albumin (BSA) at 280 nm [5]. Such errors compromise data integrity in pharmaceutical research, where precise concentration measurement is critical for dosage accuracy, stability studies, and purity assessments.
The Solution: Combining Constrained Refractometry with UV/Vis
The novel approach uses constrained refractometry as an orthogonal method to aid UV/Vis analysis. Refractometry measures a solution's refractive index, a bulk property dependent on the concentration of all dissolved species. The theoretical foundation is based on the Lorentz-Lorenz equation [5]:
μ_solution = (1/V_solution) × (μ_a v_a + μ_sol v_sol + Σ μ_i v_i)
Where μ is a function of refractive index (n), defined as μ = (n²-1)/(n²+2), and v represents volume. The subscripts a, sol, and i refer to the analyte, solvent, and impurity, respectively [5].
The key advantage lies in the physical properties of the measurements:
- Molar Absorptivity (ε in UV/Vis): Can vary dramatically (over several orders of magnitude) between different compounds. A tiny amount of a high-ε impurity causes a large UV/Vis error [5].
- Refractive Index (n in Refractometry): For most liquids,
nfalls within a narrow range (1.3–1.6). This means theμvalues for different substances are much closer, making the refractive index less sensitive to minor, high-absorptivity impurities [5].
By combining both techniques, researchers can detect discrepancies that signal interference and use the RI measurement, which is less affected by specific chromophores, to obtain a more accurate concentration estimate.
Experimental Workflow for Impurity Detection and Correction
The following diagram illustrates the integrated workflow for using RI-assisted UV/Vis to identify and correct for spectral interference.
Troubleshooting Guides
Troubleshooting Refractive Index Measurements
Refractive Index (RI) detectors are highly sensitive to environmental changes. The table below summarizes common problems and solutions.
Table: Troubleshooting Guide for Refractive Index Detectors
| Problem Symptom | Potential Cause | Solution |
|---|---|---|
| Baseline drift | Temperature fluctuations in the lab or mobile phase. | Use a column oven set to the same temperature as the RI detector. Insulate connecting tubing. Block direct airflow from vents [51]. |
| Cycling baseline | Pump pressure fluctuations due to faulty check valves, leaky seals, or air bubbles. | Purge the pump to remove bubbles. Sonicate check valves in methanol or replace them [51]. |
| Noisy baseline | Incomplete mobile phase degassing or improper detector warm-up. | Ensure the in-line degasser is functioning. Allow the instrument to warm up for the recommended time (can be several hours) [51]. |
| Poor sensitivity | Refractive index of the solvent is too close to that of the analyte. | Use a solvent with a refractive index that differs from the analyte by at least 0.15 units ("constrained refractometry") [5]. |
| Broadened peaks | Large detector volume (e.g., from heat exchangers). | This is a inherent design compromise. Use systems with minimized extra-column volume for better resolution [51]. |
Troubleshooting UV/Vis Spectroscopy Measurements
Many common UV/Vis errors originate from sample handling and preparation.
Table: Common UV/Vis Errors and How to Avoid Them
| Mistake | Impact on Results | Correction |
|---|---|---|
| Dirty or scratched cuvettes | Light scattering leads to inaccurate, high absorbance readings. | Clean cuvettes thoroughly with appropriate solvents. Inspect for scratches and replace damaged cuvettes [6] [52]. |
| Incorrect sample concentration | Absorbance outside the ideal range (0.1-1.0 AU) causes saturation or low sensitivity. | Dilute or concentrate samples to be within the linear range. Use a cuvette with a shorter path length for highly concentrated samples [6] [52]. |
| Not using a blank properly | Absorbance from the solvent or cuvette is attributed to the analyte. | Always zero the instrument with a blank made of the pure solvent/solution used for the sample [52]. |
| Neglecting temperature control | Changes in sample temperature can affect the refractive index and absorption properties. | Use a thermostatic cell holder for temperature-sensitive samples and allow all samples to equilibrate before measurement [6] [52]. |
| Using absorbing solvents | The solvent itself absorbs light, raising the baseline and causing interference. | Select solvents with high transparency in the spectral region of interest (e.g., water for low UV, acetonitrile) [52]. |
Frequently Asked Questions (FAQs)
Q1: What types of impurities can this combined technique correct for? It is most effective against unknown organic impurities that have high molar absorptivity but are present in small volumes relative to the analyte. The method has been demonstrated to correct interference in protein assays (e.g., BSA with DNA/RNA) and in artificial systems like benzene in cyclohexane corrupted by N,N-Dimethylaniline [5].
Q2: When is constrained refractometry NOT applicable? This technique is not suitable if the analyte of interest is not the major component in the solution. The refractive index is a bulk property, and if the impurity is present at a high concentration, it will dominate the RI signal, making accurate analyte quantification impossible [5].
Q3: My RI detector is very noisy. What should I check first? First, ensure your mobile phase is thoroughly degassed, as dissolved air is a common source of noise. Second, verify that the instrument has been allowed to warm up sufficiently (often 30+ minutes) and that the laboratory environment is free from drafts and temperature swings [51].
Q4: How does this method fit into ICH guidelines for impurity profiling? The ICH guidelines emphasize the need to identify and quantify impurities in APIs. This technique provides an orthogonal method to detect the presence of unaccounted impurities that could cause inaccurate potency measurements using UV/Vis alone. It helps in ensuring that the reported concentration of the main drug substance is not skewed by interfering contaminants, thereby supporting compliance with purity requirements [53].
Q5: Can I perform this technique with any standard laboratory equipment? The core requirement is access to both a UV/Vis spectrophotometer and a refractometer. The refractometer should have good sensitivity (least count of ~1x10⁻⁵ RI units is sufficient). The "constrained" aspect involves consciously selecting solvents whose refractive index differs sufficiently from the analyte [5].
The Scientist's Toolkit: Essential Research Reagents and Materials
Successful implementation of this methodology requires specific materials and an understanding of their role.
Table: Key Reagents and Materials for Refractive-Index-Assisted UV/Vis
| Item | Function and Critical Specification |
|---|---|
| High-Purity Solvents | Used to prepare analyte and blank solutions. Must have low UV absorbance in the spectral region of interest and a known refractive index that differs from the analyte by >0.15 units [5] [52]. |
| Quartz Cuvettes | Hold the sample for UV/Vis measurement. Must be scratch-free and clean to prevent light scattering. Standard path length is 1 cm [6] [52]. |
| Refractometer | Measures the refractive index of the solution. Requires a small sample volume and should be capable of measurements with high precision (e.g., ±0.00001 units) [5]. |
| Standard Reference Materials | Used for calibrating both instruments. Examples include potassium dichromate for UV/Vis calibration and certified RI standards for the refractometer [52]. |
| Temperature Control Unit | Maintains consistent temperature for both RI and UV/Vis measurements, as refractive index is highly temperature-dependent [51] [52]. |
The Confirmatory Role of NMR and HPLC in Impurity Identification and Quantification
In drug research, a significant challenge in UV-Vis spectrophotometry is spectral interference from impurities, which can lead to substantial errors in analyte concentration determination [5]. Even minute quantities of contaminants can cause large inaccuracies, as demonstrated by a 1% DNA contamination resulting in a 26.3% error in BSA analysis [5]. This technical support center provides comprehensive guidance on leveraging the complementary techniques of Nuclear Magnetic Resonance (NMR) and High-Performance Liquid Chromatography (HPLC) to confirm impurity identity and quantity, thereby overcoming the limitations of UV-Vis spectroscopy. By integrating these orthogonal methods, researchers can achieve more reliable characterization of pharmaceutical compounds while satisfying rigorous regulatory requirements for impurity profiling [54] [55].
HPLC Troubleshooting Guide: Resolving Common Instrumentation and Method Issues
Pressure Abnormalities
| Symptom | Possible Causes | Recommended Solutions |
|---|---|---|
| High Pressure | Clogged column, salt precipitation, blocked inlet frits, contaminated samples [56] | Flush column with pure water at 40-50°C followed by methanol or other organic solvents; backflush if applicable; reduce flow rate temporarily [56] |
| Low Pressure | Leaks in tubing/fittings, worn pump seals, excessively low flow rates [56] | Inspect and tighten connections; replace damaged seals; increase flow to recommended levels [56] |
| Pressure Fluctuations | Air bubbles from insufficient degassing, malfunctioning pump/check valves [56] | Degas mobile phases thoroughly; purge air from pump; clean or replace check valves [56] |
Peak Shape and Resolution Problems
| Symptom | Possible Causes | Recommended Solutions |
|---|---|---|
| Peak Tailing | Column degradation, inappropriate stationary phase, sample-solvent incompatibility [56] | Use compatible solvents; adjust sample pH; replace or clean columns; maintain column temperature with ovens [56] |
| Broad Peaks | System not equilibrated, injection solvent too strong, injection volume too high, temperature fluctuations [57] | Equilibrate with 10 column volumes of mobile phase; ensure injection solvent is same or weaker than mobile phase; reduce injection volume [57] |
| Poor Resolution | Unsuitable column, sample overload, poorly optimized method [56] | Optimize mobile phase composition and flow rate; improve sample preparation; consider alternate columns [56] |
Retention Time and Baseline Issues
| Symptom | Possible Causes | Recommended Solutions |
|---|---|---|
| Retention Time Shifts | Mobile phase composition variations, column aging, inconsistent pump flow [56] | Prepare mobile phases consistently; equilibrate columns before runs; service pumps regularly [56] |
| Baseline Noise/Drift | Contaminated solvents, detector lamp issues, temperature instability [56] | Use high-purity solvents; degas thoroughly; maintain and clean detector flow cells; stabilize lab temperature [56] |
| Varying Retention | Temperature fluctuations, contaminated column, blocked solvent frits [57] | Use thermostatically controlled column oven; wash column with appropriate solvent; ultrasonicate reservoir frits [57] |
NMR Spectroscopy Troubleshooting: Addressing Sensitivity and Spectral Challenges
Sensitivity and Quantification Issues
| Symptom | Possible Causes | Recommended Solutions |
|---|---|---|
| Insufficient Sensitivity | Low magnetic field strength, improper solvent choice, concentration too low [55] | Use high-field instruments (400MHz+); optimize solvent selection; increase sample concentration [55] |
| Unresolved Component Signals | Spectral overlap, multiple interfering compounds [58] | Employ HPLC for initial separation; use iterative Full Spin Analysis; leverage hyphenated techniques [58] [55] |
| Difficulty Detecting Minor Impurities | Signal-to-noise limitations, dynamic range issues [55] | Extend acquisition times; increase sample concentration; utilize specialized NMR probes for sensitivity [55] |
HPLC and NMR Methodologies for Impurity Analysis
HPLC Separation and Quantification Protocols
HPLC with UV-DAD Detection [58]
- Instrumentation: HPLC system with UV Diode Array Detector capable of multiple wavelengths
- Column Selection: Functionalized silica stationary phase based on analyte properties
- Mobile Phase Preparation: Mixture of acetonitrile (apolar) and water (polar) in ratios optimized for separation
- Calibration Method Selection:
- External Calibration: Prepare standard solutions of precise concentrations; inject to establish calibration curve; analyze unknowns by comparing responses to curve (ideal for sample series without matrix effects) [58]
- Standard Addition: Add known quantities of standard to sample; measure responses before and after addition; calculate initial concentration from response increase (superior for compensating matrix effects) [58]
Method Validation Parameters [54]
- Accuracy and Precision: Ensure reliable, reproducible results
- Sensitivity and Specificity: Demonstrate detection and quantification capabilities at required levels
- Linearity and Range: Establish accurate quantification over specified concentration range
- Robustness: Assess method reliability under varying conditions
Quantitative NMR Analysis for Impurity Profiling
Sample Preparation and Experimental Conditions [55]
- Instrument Requirements: 400MHz or higher field strength NMR spectrometer
- Solvent Selection: Choose deuterated solvents that minimize signal overlap with analyte peaks
- Sample Concentration: Optimize for detection of impurities at 0.05% threshold or lower [55]
- Acquisition Parameters: Sufficient scans to achieve adequate signal-to-noise for minor components
- Data Processing: Apply appropriate window functions and zero-filling; utilize iterative Full Spin Analysis for complex signal patterns [55]
Regulatory Compliance Considerations [54] [55]
- Adhere to ICH Q3A(R2) and Q3B(R2) guidelines for impurity reporting, identification, and qualification
- Establish reporting thresholds (typically 0.1% for drug substances)
- Implement identification thresholds (usually 0.1% for drug substances and products)
- Apply qualification thresholds requiring safety evaluation
Integrated Workflow for Impurity Identification and Confirmation
The following workflow illustrates the complementary relationship between HPLC and NMR in comprehensive impurity analysis:
Overcoming UV-Vis Spectral Interference Using Complementary Techniques
Limitations of UV-Vis Spectrophotometry
UV-Vis absorption spectrophotometry faces significant challenges from spectral interference when compounds other than the analyte absorb in the same spectral region [5]. The percentage error in UV/Vis spectrophotometry can be represented mathematically as:
Where ε is molar absorptivity, c is concentration, subscript 'a' refers to analyte, and 'i' to impurities [5]. This equation demonstrates that even low impurity concentrations can cause large errors if the ratio εi/εa is substantial [5].
Alternative Approaches for Spectral Interference Mitigation
Refractive Index-Assisted UV/Vis Spectrophotometry [5]
- Principle: Combine UV/Vis with constrained refractometry where solvents have refractive indices within predefined limits
- Implementation: Select solvent with refractive index differing from analyte by at least 0.15 units
- Benefits: Reduces error to approximately 2% even with impurity-to-analyte volume ratio of 1:100
- Limitations: Lower resolution and sensitivity than UV/Vis; not applicable when analyte isn't major component
Mathematical Correction Techniques [1]
- Isoabsorbance Measurements: Select wavelength where interferent shows same absorbance as at analytical wavelength; subtract from total absorbance
- Multicomponent Analysis: Subtract absorbance of pure interferent from measured absorbance when spectral overlap occurs
- Three-Point Correction: Estimate background interference using two wavelengths on either side of analytical wavelength
- Derivative Spectroscopy: Utilize first and second derivatives to differentiate closely spaced or overlapping absorbance peaks
Essential Research Reagent Solutions for Impurity Analysis
| Reagent/Equipment | Function in Impurity Analysis | Technical Specifications |
|---|---|---|
| HPLC Columns | Separation of complex mixtures into individual components | Functionalized silica stationary phases; varied pore sizes and surface chemistries [58] |
| Deuterated Solvents | NMR sample preparation without interfering signals | Deuterium enrichment >99.8%; variety of polar and non-polar options [55] |
| Reference Standards | Quantification and method calibration | Certified purity; traceable to reference materials [58] [54] |
| Chromatography Solvents | Mobile phase preparation; sample dissolution | HPLC grade purity; low UV cutoff; minimal particulate matter [58] [57] |
| Buffer Components | Control of pH for ionizable compounds | High purity; minimal UV absorbance; volatile options for LC-MS [57] |
Frequently Asked Questions (FAQs) on Impurity Analysis Techniques
General Method Selection Questions
Q1: When should I choose HPLC over NMR for impurity quantification? HPLC is preferable when dealing with complex mixtures requiring separation, when impurities are present at very low concentrations, or when analyzing compounds with overlapping NMR signals [58]. NMR is ideal when structural identification is needed, when dealing with unknown impurities, or when minimal sample preparation is desired [58] [55].
Q2: How can I determine if spectral interference is affecting my UV-Vis results? Signs of spectral interference include non-linear calibration curves, absorbance values that don't correlate with expected concentrations, and unusual spectral shapes [5]. Cross-validation with refractometry or HPLC can confirm interference [5].
Technical Implementation Questions
Q3: What are the key regulatory thresholds I should be aware of for impurity reporting? For drug substances, ICH guidelines recommend reporting thresholds of 0.05% or 0.03% (w/w) depending on maximum daily intake [55]. Identification thresholds are typically 0.1% for both drug substances and products, while qualification thresholds require toxicological assessment [54].
Q4: My HPLC peaks are tailing - what could be causing this? Peak tailing can result from column degradation, inappropriate stationary phase selection, sample-solvent incompatibility, voided columns, or injection solvent that is stronger than the mobile phase [56] [57]. Replace guard cartridges, ensure injection solvent is same or weaker than mobile phase, and reduce injection volume if needed [57].
Q5: Can NMR really detect impurities at the levels required by regulatory guidelines? Yes, high-field NMR (400MHz or above) can readily detect impurities at the 0.01% level with proper solvent selection and experimental optimization [55]. Benchtop NMR instruments (60MHz) have higher detection limits around 2% and may not meet regulatory requirements [55].
Data Interpretation Questions
Q6: How do I interpret conflicting results between HPLC and NMR? Conflicting results often indicate specific limitations of each technique [58]. When NMR shows unresolved component signals, HPLC can separate individual components into distinct peaks [58]. When HPLC suggests impurities that NMR doesn't detect, consider whether the impurities lack chromophores or have significantly different molar absorptivities [58].
Q7: What is the recommended approach for cross-validating impurity methods? Use HPLC and NMR in a complementary manner [58]. First, employ HPLC for separation and quantification of known impurities. Then, use NMR for structural confirmation of unknown impurities detected by HPLC. Finally, compare quantitative results from both techniques for consistency [58].
Integrating UV-Vis with SPR and Mass Spectrometry for Comprehensive Analysis
FAQs and Troubleshooting Guides
UV-Vis Spectroscopy FAQs
Q: What are the most common sources of error in UV-Vis spectroscopy, and how can I mitigate them?
A: Common errors stem from sample preparation, instrument setup, and measurement conditions. To ensure accuracy, verify sample purity, use appropriate cuvettes, and maintain consistent measurement environments [6].
- Sample Issues: Contaminated samples or unclean cuvettes introduce unexpected peaks. Always use high-purity solvents, clean quartz cuvettes, and handle materials with gloved hands to avoid fingerprints [6].
- Instrument Issues: Low signal intensity can arise from improper alignment or a light source that hasn't stabilized. Allow tungsten halogen or arc lamps to warm up for ~20 minutes before measurement [6].
- Methodology Issues: High sample concentration can cause excessive light scattering. Reduce concentration or use a cuvette with a shorter path length. Also ensure the sample is properly positioned within the beam path [6].
Q: How can UV-Vis spectroscopy be used to ensure drug purity in pharmaceutical research?
A: UV-Vis is a foundational technique for identifying and quantifying components in a sample based on their specific light absorption characteristics [59]. It helps quantify impurities and verify the purity of samples, including nucleic acids like DNA and RNA, which is critical for sequencing and pharmaceutical development [59]. Its high precision (<0.2% RSD) is essential for meeting pharmaceutical potency specifications (e.g., 98.0-102.0%) as per ICH guidelines [60].
Surface Plasmon Resonance (SPR) FAQs
Q: How can I reduce non-specific binding (NSB) in my SPR experiments?
A: Non-specific binding is a frequent challenge that inflates signals and skews data. Several strategies can mitigate it [61] [62] [63]:
- Buffer Optimization: Add surfactants like Tween-20 or blocking agents like BSA (typically at 1%) to the running buffer to disrupt hydrophobic or non-specific interactions [61] [63].
- Surface Chemistry: Select a sensor chip (e.g., CM5 with carboxymethylated dextran) tailored to reduce NSB. Using a reference channel for subtraction is also crucial [61] [63].
- Charge Adjustment: A positively charged analyte may bind to a negatively charged surface. Adjusting the buffer pH to the protein's isoelectric point or increasing salt concentration (e.g., NaCl) can shield these charge-based interactions [63].
Q: My SPR baseline is unstable and drifts. What could be the cause?
A: Baseline drift often stems from surface regeneration issues or buffer incompatibility [61].
- Inefficient Regeneration: Residual material buildup on the sensor surface can cause drift. Ensure you are using an effective regeneration buffer (e.g., 10 mM glycine pH 2.0, 10 mM NaOH, or 2 M NaCl) to clean the surface completely between analyte injections without damaging the ligand [61] [62].
- Buffer Components: Certain buffer salts or detergents can destabilize the sensor surface. Check for compatibility and switch to a more suitable buffer if needed [61].
Mass Spectrometry (LC-MS) FAQs
Q: What are the key priorities when troubleshooting sensitivity issues in LC-MS?
A: Sensitivity loss can be complex, but a structured approach is key.
- Ionization Efficiency: The root cause is not always the MS itself. Focus on controlling the ionization process, which can be affected by mobile phase composition and source contamination [64].
- System Calibration: Ensure the MS is properly calibrated using appropriate calibration mixes and compound tuning to maintain optimal performance [64].
- Sample Purity: Impurities can suppress ionization. Thorough sample purification before injection is paramount for maintaining sensitivity and precision [61] [64].
Experimental Protocols
Standard Protocol for UV-Vis Sample Analysis
Objective: To accurately identify and quantify a chromophoric compound in a drug substance sample.
- Instrument Warm-up: Turn on the UV-Vis spectrometer and allow the light source (e.g., deuterium or tungsten lamp) to stabilize for approximately 20 minutes [6].
- Blank Measurement: Fill a quartz cuvette with the solvent used for your sample (e.g., water, buffer). Clean the cuvette exterior and place it in the sample holder. Record a baseline spectrum over your desired wavelength range (e.g., 190-800 nm) [59] [6].
- Sample Preparation: Dilute the drug sample in the same solvent to an concentration expected to yield an absorbance reading between 0.1 and 1.0 AU to remain within the linear range of the Beer-Lambert law [59] [6].
- Sample Measurement: Replace the blank cuvette with the sample cuvette. Ensure the light path is clear and through a uniform area of the sample. Run the measurement [6].
- Data Analysis: The software will generate a spectrum. Identify the compound by comparing the absorption peak (λmax) to reference standards. Calculate the concentration using the Beer-Lambert law (A = ε * b * c), where A is absorbance, ε is the molar absorptivity, b is the path length, and c is the concentration [59] [60].
Standard Protocol for SPR Binding Kinetics
Objective: To determine the affinity (KD) and kinetics (ka, kd) of an interaction between a drug candidate (analyte) and its protein target (ligand).
- System Setup: Prime the SPR instrument with a degassed running buffer (e.g., HBS-EP) [61] [63].
- Ligand Immobilization:
- Select a suitable sensor chip (e.g., CM5 for covalent coupling, NTA for His-tagged proteins) [61] [63].
- Activate the carboxymethylated dextran surface with a mixture of EDC and NHS (for covalent coupling) [61].
- Inject the ligand (target protein) in a low-sodium acetate buffer (pH typically 4.0-5.0) to achieve an optimal immobilization level (Response Units, RU). Aim for a lower density to avoid mass transport effects [63].
- Deactivate any remaining active esters with ethanolamine [61].
- Analyte Binding Kinetics:
- Prepare a dilution series of the analyte (drug candidate) with a minimum of 5 concentrations, ideally spanning from 0.1 to 10 times the expected KD value. Use serial dilution for accuracy [63].
- Inject each analyte concentration over the ligand and reference surfaces at a constant flow rate (e.g., 30 µL/min) for a sufficient association time.
- Monitor dissociation by switching back to running buffer.
- Regenerate the surface with a suitable buffer (e.g., 10 mM glycine, pH 2.0) to remove bound analyte without damaging the ligand [62] [63].
- Data Analysis: Fit the resulting sensorgrams (response vs. time curves) to a 1:1 binding model using the instrument's software to extract the association rate (ka), dissociation rate (kd), and equilibrium dissociation constant (KD = kd/ka) [63].
Data Presentation
Quantitative Data for Analytical Techniques
Table 1: Comparison of key analytical techniques used in integrated drug analysis.
| Technique | Key Quantitative Parameters | Typical Measurement Range | Common Applications in Drug Research |
|---|---|---|---|
| UV-Vis Spectroscopy [59] [60] | Absorbance (AU), Concentration (M), Molar Absorptivity (L·mol⁻¹·cm⁻¹), λmax (nm) | 190 - 800 nm | Identify & quantify chromophores, verify DNA/RNA purity, monitor reactions [59]. |
| Surface Plasmon Resonance (SPR) [63] | Affinity, KD (M), Association rate, ka (M⁻¹s⁻¹), Dissociation rate, kd (s⁻¹), Response Units (RU) | Analyte concentrations from low nM to µM | Real-time binding kinetics, specificity, and affinity of biomolecular interactions [61] [63]. |
| Liquid Chromatography-Mass Spectrometry (LC-MS) [64] [60] | Mass-to-Charge Ratio (m/z), Retention Time (min), Signal Intensity (Counts) | Wide mass range, dependent on instrument | Identify unknown impurities, quantify metabolites, perform multi-residue analysis [64]. |
Research Reagent Solutions
Table 2: Essential reagents and materials for integrated spectroscopy experiments.
| Item | Function/Description | Application Notes |
|---|---|---|
| Quartz Cuvettes [6] | Sample holder for UV-Vis with high transmission in UV and visible light regions. | Required for UV range below ~350 nm; reusable and must be kept meticulously clean. |
| CM5 Sensor Chip [61] [63] | Gold surface with a carboxymethylated dextran matrix for covalent ligand immobilization. | Versatile chip for immobilizing proteins, peptides, and other biomolecules via amine coupling. |
| NTA Sensor Chip [61] [63] | Surface functionalized with nitrilotriacetic acid for capturing His-tagged proteins. | Provides a directed immobilization strategy, often improving ligand orientation and activity. |
| HBS-EP Buffer [61] [63] | Common running buffer (HEPES buffered saline with EDTA and surfactant polysorbate). | Provides a stable pH and ionic strength environment while minimizing non-specific binding in SPR. |
| EDC/NHS Chemistry [61] | Crosslinkers for activating carboxyl groups on sensor chips for covalent ligand attachment. | Standard chemistry for amine coupling on carboxymethylated surfaces. |
| Regeneration Buffer (e.g., 10 mM Glycine, pH 2.0) [62] [63] | Solution used to remove bound analyte from the ligand without denaturing it. | Must be empirically determined for each specific ligand-analyte pair. |
Workflow and Relationship Visualizations
Integrated Drug Analysis Workflow
SPR Troubleshooting Logic
In the field of drug research, ensuring the safety, efficacy, and quality of pharmaceutical products is paramount. Impurity profiling has become a critical component of this process, as impurities—introduced through synthesis, excipients, residual solvents, or degradation—can pose significant challenges to product quality [10]. UV-Vis spectrophotometry is widely used for quantitative determination of analytes, but it faces a significant challenge: spectral interference from impurities can lead to substantial analytical errors, even when contaminants are present in minuscule concentrations [5]. Within this context, adherence to robust validation protocols, specifically the International Council for Harmonisation (ICH) guidelines, provides the foundational framework for ensuring that analytical methods produce reliable, accurate, and reproducible data. For researchers focused on reducing impurity interference, a deep understanding of ICH Q2(R2) is not merely regulatory compliance but a scientific necessity for generating trustworthy results that safeguard public health.
Understanding ICH Q2(R2): Validation of Analytical Procedures
The ICH Q2(R2) guideline, titled "Validation of Analytical Procedures," provides a comprehensive framework for validating analytical methods used in the pharmaceutical industry. This guideline presents elements for consideration during the validation of analytical procedures included in registration applications and provides guidance on how to derive and evaluate various validation tests [65]. It applies to new or revised analytical procedures used for release and stability testing of commercial drug substances and products, both chemical and biological/biotechnological [65]. The guideline can also be applied to other analytical procedures used as part of the control strategy following a risk-based approach.
In July 2025, the ICH released comprehensive training materials on ICH Q2(R2) and ICH Q14 ("Analytical Procedure Development") to support a harmonized global understanding and consistent application of these new guidelines [66]. These resources illustrate both minimal and enhanced approaches to analytical development and validation, providing crucial implementation guidance for the scientific community.
Key Validation Parameters in ICH Q2(R2)
The following table summarizes the core validation characteristics typically evaluated for analytical procedures, as outlined in the ICH guidelines:
Table 1: Key Validation Parameters According to ICH Q2(R2)
| Validation Parameter | Definition | Importance in UV-Vis Analysis for Impurity Detection |
|---|---|---|
| Accuracy | The closeness of agreement between accepted reference and test values | Ensures impurity quantification is correct despite potential spectral interference |
| Precision (Repeatability, Intermediate Precision) | The closeness of agreement between independent test results | Confirms consistent impurity detection across multiple measurements, analysts, or days |
| Specificity | The ability to assess the analyte unequivocally in the presence of components | Critical for distinguishing target analytes from interfering impurities in UV-Vis spectra |
| Detection Limit (LOD) | The lowest amount of analyte that can be detected | Determines sensitivity for trace impurity detection |
| Quantitation Limit (LOQ) | The lowest amount of analyte that can be quantified | Establishes the threshold for reliable impurity quantification |
| Linearity | The ability to obtain results directly proportional to analyte concentration | Essential for creating reliable calibration curves for both APIs and impurities |
| Range | The interval between upper and lower concentration levels with suitable precision, accuracy, and linearity | Defines the concentration span over which the method is applicable for impurity detection |
| Robustness | The capacity to remain unaffected by small, deliberate variations in method parameters | Evaluates method reliability under normal operational variations in UV-Vis spectroscopy |
FAQs: ICH Validation in the Context of UV-Vis Spectroscopy and Impurity Interference
Q1: Why is specificity particularly challenging for UV-Vis spectroscopic methods when analyzing pharmaceutical compounds with potential impurities?
Specificity is challenging in UV-Vis spectroscopy because the technique often measures total absorption at a given wavelength without automatically separating contributions from different compounds. When impurities have absorption bands that overlap with the analyte of interest, they cause spectral interference that leads to inaccurate concentration measurements [5]. For example, research has demonstrated that just 1% DNA contamination can result in a 26.3% error in BSA protein analysis at 280 nm [5]. This inherent limitation of UV-Vis spectroscopy makes method validation for specificity particularly crucial.
Q2: How can ICH Q2(R2) validation help mitigate risks associated with impurity interference in UV-Vis analysis?
Proper validation under ICH Q2(R2) provides a systematic approach to identify, quantify, and control the impact of impurities on analytical results. Through rigorous specificity testing, you can:
- Identify potential interfering substances likely to be present in your sample matrix
- Demonstrate the method's ability to unequivocally quantify the analyte despite these interferents
- Establish the range over which the method remains accurate despite potential interference
- Validate the detection and quantitation limits that are realistic in the presence of expected impurities [65] [10]
Q3: What recent updates have been made to ICH validation guidelines, and how do they impact UV-Vis method development?
The ICH recently published comprehensive training materials for both Q2(R2) and Q14 (July 2025), emphasizing enhanced approaches to analytical development [66]. These updates encourage a more holistic, lifecycle approach to analytical procedures, promoting better understanding of method capabilities and limitations. For UV-Vis spectroscopy dealing with impurity interference, this means:
- Implementing a systematic, risk-based approach to identify potential sources of interference early in method development
- Establishing Analytical Target Profiles (ATPs) that explicitly define requirements for specificity in the presence of impurities
- Developing more robust methods that can handle expected variations in impurity profiles [66]
Q4: How should we approach validation of UV-Vis methods for elemental impurity analysis per ICH Q3D?
Elemental impurity analysis follows ICH Q3D guidelines, and validation of these methods presents unique challenges. A recent study highlighted several considerations:
- Standardization of digestion methods and acid mixtures is crucial for reproducible results
- Interference correction approaches need validation, particularly when using collision/reaction cell gases
- Mercury stabilization requires careful method development and validation due to significant loss over time
- Clear, explicit standard operating procedures (SOPs) are essential for successful method transfer between laboratories [39]
Troubleshooting Guides: Addressing Common UV-Vis Spectroscopy Issues in Pharmaceutical Analysis
Troubleshooting Methodology and Instrument Issues
Table 2: Common UV-Vis Instrument Issues and Solutions
| Problem | Potential Causes | Solutions | Preventive Measures |
|---|---|---|---|
| Inconsistent readings or drift | Aging lamps, insufficient warm-up time, voltage instability [67] [36] | Allow 20 min warm-up for tungsten halogen/arc lamps, replace aged lamps, install voltage stabilizer [6] [36] | Follow scheduled lamp replacement, maintain stable power supply |
| Low light intensity or signal error | Misaligned cuvette, debris in light path, dirty optics, damaged optical fibers [6] [67] | Clean optics, ensure proper cuvette alignment, check/replace damaged optical fibers [6] | Handle cuvettes with gloved hands, regular maintenance checks |
| High absorbance readings or "over" error | Sample concentration too high, incorrect path length, light path obstruction [6] [36] | Dilute sample, use cuvette with shorter path length, check for obstructions [6] | Verify sample concentration falls within instrument's linear range |
| Wavelength accuracy failures | Deuterium lamp failure, moisture-damaged optical filters, aging components [36] | Replace deuterium lamp, repair/replace damaged optical components [36] | Regular instrument calibration, proper storage to control humidity |
Troubleshooting Sample-Related Issues
Table 3: Sample Preparation and Methodology Issues
| Problem | Potential Causes | Solutions | Impact on Validation |
|---|---|---|---|
| Unexpected peaks in spectrum | Contaminated sample or cuvette, unclean substrates [6] | Thoroughly wash cuvettes/substrates, use fresh solvents, handle with gloved hands [6] | Compromises specificity, may affect accuracy and precision |
| Spectral interference from impurities | Impurities with overlapping absorption, high ε impurities [5] | Apply refractive-index assisted method, consider alternative wavelengths, sample purification [5] | Directly affects specificity and accuracy - requires method modification |
| Changing absorbance over time | Solvent evaporation, sample degradation, temperature effects [6] | Seal samples to prevent evaporation, control temperature, minimize analysis time [6] | Impacts precision and robustness of the method |
| High background signal | Impure solvents, dirty cuvettes, incorrect blank [6] [67] | Use high-purity solvents, ensure proper cleaning, verify blank solution [6] | Affects detection and quantitation limits, reduces accuracy |
Advanced Methodology: Refractive Index-Assisted UV/Vis Spectrophotometry to Overcome Spectral Interference
Experimental Principle and Workflow
Traditional UV-Vis absorption spectrophotometry faces significant challenges from spectral interference by impurities, where compounds other than the analyte absorb in the same spectral region. A novel approach combining UV-Vis spectrophotometry with constrained refractometry has been demonstrated to significantly reduce errors caused by such interference [5].
The methodology is based on the complementary principles of the Beer-Lambert law (governing spectrophotometry) and the Lorentz-Lorenz equation (governing refractometry). While UV-Vis errors can be large even for minor impurities with high molar absorptivity, refractometry errors are constrained because refractive indices of most liquids fall within a narrow range (1.3-1.6) [5]. By selecting solvents whose refractive indices differ from the analyte by at least 0.15 units, the maximum error in refractometry can be limited to below 2%, even with impurity-to-analyte ratios of 1:100 [5].
Detailed Experimental Protocol
Materials and Equipment:
- UV-Vis spectrophotometer (e.g., Shimadzu UV-2600)
- Refractometer with high precision (e.g., ATAGO RX-7000i, least count ~1×10⁻⁵ units)
- Quartz cuvettes (1 cm path length)
- High-purity solvents selected based on refractive index constraints
- Analytical balance
- Temperature control system (20 ± 0.01°C for refractometry)
Procedure:
Sample Preparation:
- Prepare standard solutions of the analyte in solvents with refractive indices differing from the analyte by at least 0.15 units [5].
- For impurity-spiked samples, introduce known interferents at relevant concentration ratios (e.g., 100:1 analyte:impurity).
UV-Vis Spectrophotometry:
- Record UV absorption spectra between 200-320 nm at 1 nm resolution.
- Perform baseline correction using pure solvent.
- Measure absorbance at the analytical wavelength and calculate concentration using the Beer-Lambert law.
Constrained Refractometry:
- Maintain temperature at 20 ± 0.01°C for all measurements [5].
- Measure refractive index at 589.3 nm.
- Calculate analyte concentration using the Lorentz-Lorenz equation.
Data Analysis and Error Correction:
- Compare concentration results from both techniques.
- Large disagreements indicate significant spectral interference.
- Apply constrained refractometry results to correct UV-Vis data.
- Use the relationship: Error Reduction = (ErrorUV - ErrorRI)/Error_UV × 100%
Validation Data: In a model system with benzene in cyclohexane corrupted by N,N-Dimethylaniline (NND) in ratio 100:1, this approach reduced estimation error from 53.4% (UV spectrophotometry alone) to 2% (constrained refractometry) [5].
Research Reagent Solutions
Table 4: Essential Materials for Advanced Impurity-Resistant UV-Vis Analysis
| Reagent/Equipment | Function/Specification | Application Notes |
|---|---|---|
| Quartz Cuvettes | High transmission in UV-Vis region | Reusable, appropriate path length (typically 1 cm); handle with gloved hands to avoid fingerprints [6] |
| High-Purity Solvents | Sample dissolution and dilution | Select based on refractive index difference from analyte (≥0.15 units); ensure spectral purity [5] |
| Certified Reference Materials | Method calibration and accuracy verification | Establish calibration curves; validate method performance [67] |
| Stabilizing Agents (e.g., Gold salts) | Mercury stabilization in elemental impurity analysis | Prevent mercury loss during sample preparation and analysis [39] |
| Optical Fibers (SMA connectors) | Light guidance in modular systems | Ensure compatible connectors for tight seal; replace if damaged or signal transmission is low [6] |
The integration of robust ICH Q2(R2) validation protocols with advanced analytical techniques provides a powerful framework for overcoming the challenge of spectral interference in UV-Vis spectroscopy. By implementing rigorous validation practices, employing innovative methodologies like refractive-index assisted spectrophotometry, and maintaining strict troubleshooting protocols, researchers can generate reliable, accurate data crucial for pharmaceutical development and quality control. The recent updates to ICH guidelines emphasize a lifecycle approach to analytical methods, encouraging deeper scientific understanding and more effective control strategies—ultimately contributing to safer and more effective pharmaceutical products for patients worldwide.
Conclusion
Effectively managing impurity interference in UV-Vis spectroscopy is not a one-size-fits-all endeavor but requires a strategic, multi-faceted toolkit. Mastering foundational concepts enables accurate problem diagnosis, while robust methodological corrections like derivative spectroscopy and multi-wavelength analysis provide powerful solutions for quantitation. A proactive troubleshooting mindset is essential for navigating the complexities of modern drug formulations, from small molecules to large biologics. Crucially, confidence in analytical results is cemented by validating UV-Vis data with orthogonal techniques such as refractometry, NMR, and HPLC, ensuring regulatory compliance and drug safety. The future of impurity analysis lies in the intelligent integration of these techniques, paving the way for more robust, efficient, and reliable drug development processes that can keep pace with innovative therapeutic modalities.
References
- 1. How to overcome interferences in UV – Visible ... [https://lab-training.com/overcome-interferences-uv-visible-spectroscopic-studies/]
- 2. UV – Visible Spectroscopic Studies [https://scientiaricerca.com/srcops/SRCOPS-01-00014.php]
- 3. UV spectrophotometric methods for simultaneous ... [https://www.nature.com/articles/s41598-023-45378-8]
- 4. Rapid UV-Vis spectrophotometric method aided by firefly-PLS ... [https://pmc.ncbi.nlm.nih.gov/articles/PMC11406862/]
- 5. Refractive index-assisted UV/Vis spectrophotometry to ... [https://www.sciencedirect.com/science/article/abs/pii/S0003267020312691]
- 6. UV-Vis Spectroscopy Troubleshooting Made Easy [https://www.ossila.com/pages/troubleshooting-uv-vis-spectroscopy]
- 7. UV-Vis Spectroscopy: Principle, Strengths and Limitations ... [https://www.technologynetworks.com/analysis/articles/uv-vis-spectroscopy-principle-strengths-and-limitations-and-applications-349865]
- 8. UV-VIS Spectroscopy Not Working? Common Limitations ... [https://www.pgeneral.com/service-maintenance-and-repair/uv-vis-spectroscopy-not-working-common-limitations-and-how-to-overcome-them/]
- 9. UV-VIS Spectrophotometer Troubleshooting and FAQs [https://www.vernier.com/til/3044?srsltid=AfmBOoqUVv5fNgDn8FYK_cmcVhaMvtjprqhseqxtplWagbDaRNXJSAnX]
- 10. Advances in Impurity Profiling of Pharmaceutical ... [https://biomedres.us/fulltexts/BJSTR.MS.ID.009393.php]
- 11. Identification and Determination of Impurities in a New ... [https://pmc.ncbi.nlm.nih.gov/articles/PMC10421711/]
- 12. Research Methods of Drug Impurities [https://www.bocsci.com/blog/research-methods-of-drug-impurities/?srsltid=AfmBOoqyYbtnRRQnbGxZ6yGKyy5b_NDkbnbXa32G8kMqImeZ73BCVPjj]
- 13. Analytical approach of elemental impurities in ... [https://www.sciencedirect.com/science/article/abs/pii/S0584854723000769]
- 14. Impurity profiling HPLC–UV/PDA method development ... [https://link.springer.com/article/10.1007/s44371-025-00366-x]
- 15. Impurity contribution to ultraviolet absorption of saturated fatty ... [https://pmc.ncbi.nlm.nih.gov/articles/PMC10511181/]
- 16. Impurity contribution to ultraviolet absorption of saturated ... [https://arxiv.org/abs/2407.08142]
- 17. The Bouguer‐Beer‐Lambert Law: Shining Light on the ... [https://pmc.ncbi.nlm.nih.gov/articles/PMC7540309/]
- 18. Understanding the Limits of the Bouguer-Beer-Lambert Law [https://www.spectroscopyonline.com/view/understanding-the-limits-of-the-bouguer-beer-lambert-law]
- 19. Spectrophotometer Selection and Troubleshooting [https://sperdirect.com/blogs/news/spectrophotometer-selection-and-troubleshooting-a-practical-guide?srsltid=AfmBOor4WFcNEg1eK79GP4eiMb-qONFO9oq8PD1h2YB_Gy8H-zpHc_xR]
- 20. Beer-Lambert Law | Transmittance & Absorbance [https://www.edinst.com/resource/the-beer-lambert-law/]
- 21. Spectroscopic Methods in Pharma QA/QC: UV-Vis, IR, and ... [https://www.labmanager.com/spectroscopic-methods-in-pharma-qa-qc-uv-vis-ir-and-nmr-applications-34005]
- 22. Spectrophotometric approach for deconvolving overlapped ... [https://pmc.ncbi.nlm.nih.gov/articles/PMC12257698/]
- 23. Absorbance Baselines and Corrections in Spectroscopies , UV - Vis [https://garanord.md/1-understanding-baseline-od-spectrum-a-beginners-guide-to-absorbance-baselines/]
- 24. Derivative spectrophotometry—recent applications and ... [https://www.sciencedirect.com/science/article/abs/pii/S0039914004002152]
- 25. Derivative UV-vis absorption spectra as an invigorated ... [https://www.sciencedirect.com/science/article/abs/pii/S0165993615301357]
- 26. Comparative application of derivative spectrophotometric and ... [https://fjps.springeropen.com/articles/10.1186/s43094-023-00471-7]
- 27. Derivative shape estimations with resolved overlapped ... [https://link.springer.com/article/10.1007/s10910-023-01500-9]
- 28. Isoabsorbance plot data randomly doesn't load for some ... [https://community.agilent.com/technical/lc/f/forum/10566/isoabsorbance-plot-data-randomly-doesn-t-load-for-some-sequences]
- 29. Documentation on the 3-point user-calibration mechanism [https://www.dracal.com/en/dracal_calibration_documentation/]
- 30. Baseline Correction | Technical Note 119 [https://www.denovix.com/tn-119-baseline-correction/]
- 31. Using a Matlab Implemented Algorithm for UV-vis Spectral ... [https://pmc.ncbi.nlm.nih.gov/articles/PMC2805423/]
- 32. Deconvolution of multicomponent ultraviolet/visible spectra [https://www.sciencedirect.com/science/article/pii/S0003267000836260]
- 33. Scatter-Free UV–Visible Spectroscopy for Accurate and ... [https://pmc.ncbi.nlm.nih.gov/articles/PMC12631730/]
- 34. Sample Preparation: A Comprehensive Guide [https://www.organomation.com/sample-preparation-a-comprehensive-guide]
- 35. Spectrophotometer Selection and Troubleshooting [https://sperdirect.com/blogs/news/spectrophotometer-selection-and-troubleshooting-a-practical-guide?srsltid=AfmBOorrUJjhalr3j54GF1AKQ-5NyPo-c6GVNlEDOMpxF_irGKJCp3D8]
- 36. 20 Common Problems for Spectrophotometers [https://www.hinotek.com/20-common-problems-and-solutions-for-uv-vis-spectrophotometers/]
- 37. 4 Important Lessons to Learn About UV-Vis Spectroscopy [https://www.natchezdemocrat.com/2025/07/23/4-important-lessons-to-learn-about-uv-vis-spectroscopy/]
- 38. Fluorescence/UV-VIS Spectrophotometer Troubleshooting ... [https://www.vernier.com/til/3918?srsltid=AfmBOoo2e9LFulhjVSceQQaqt8Yu3uh0XN-HfCvu92qnNu6cw57cp6KT]
- 39. How Do We Improve Elemental Impurity Analysis in ... [https://www.spectroscopyonline.com/view/how-do-we-improve-elemental-impurity-analysis-in-pharmaceutical-quality-control-]
- 40. Spectrophotometer Troubleshooting [https://www.hinotek.com/spectrophotometer-troubleshooting/]
- 41. Essentials of LC Troubleshooting, Part IV: What Is Going ... [https://www.chromatographyonline.com/view/essentials-of-lc-troubleshooting-part-iv-what-is-going-on-with-the-baseline-]
- 42. Peak Purity in HPLC: Assessment, Troubleshooting, and ... [https://www.sepscience.com/peak-purity-in-hplc-assessment-troubleshooting-and-best-practices-11506]
- 43. Quantification of antibiotics in multicomponent drug ... [https://www.sciencedirect.com/science/article/abs/pii/S0169743925000395]
- 44. A Review on the Stability Challenges of Advanced Biologic ... [https://pmc.ncbi.nlm.nih.gov/articles/PMC12114724/]
- 45. Statistical Tools for Biologics Stability Testing [https://www.bioprocessintl.com/qa-qc/comprehensive-stability-assessment-of-biotechnological-products-degradation-mechanisms-statistical-tools-and-regulatory-compliance-part-1]
- 46. Quality Control in Biotechnology for Safer Biologics ... [https://amsbiopharma.com/quality-control-in-biotechnology/]
- 47. The Use of UV-Vis Spectroscopy in Bioprocess and ... [https://www.mdpi.com/2311-5637/4/1/18]
- 48. Spectrophotometer Selection and Troubleshooting [https://sperdirect.com/blogs/news/spectrophotometer-selection-and-troubleshooting-a-practical-guide?srsltid=AfmBOorfRQaGLEGfn0ZymI_LufmXEI4hv27wyokrtxuj3ymwDIze_kFX]
- 49. UV-VIS Spectrophotometer Troubleshooting and FAQs [https://www.vernier.com/til/3044?srsltid=AfmBOop_KbUUaF3y2jI_mTJyRCmJaW9mOP2R6vrKJBDtOMvz961XSGLQ]
- 50. Seven Essential Steps for In Situ Reaction Monitoring [https://www.spectroscopyonline.com/view/seven-essential-steps-situ-reaction-monitoring]
- 51. Avoiding Refractive Index Detector Problems [https://www.chromatographyonline.com/view/avoiding-refractive-index-detector-problems-0]
- 52. Top 10 Mistakes to Avoid in UV-Vis Spectrophotometry [https://labindia-analytical.com/Blog_detail/view/Top-10-Mistakes-to-Avoid-in-UV-Vis-Spectrophotometry?srsltid=AfmBOooiGVlp2sQcDM9RThAFzsAbAgOO62A-hBnfld85RmXDBhxcwiFg]
- 53. Recent trends in the impurity profile of pharmaceuticals [https://pmc.ncbi.nlm.nih.gov/articles/PMC3255420/]
- 54. impurity-profiling-and-characterization-for-generic-project [https://resolvemass.ca/impurity-profiling-and-characterization-for-generic-project/]
- 55. Pharmaceutical analysis by NMR can accommodate strict ... [https://www.sciencedirect.com/science/article/pii/S0731708522001303]
- 56. Expert Guide to Troubleshooting Common HPLC Issues [https://aelabgroup.com/expert-guide-to-troubleshooting-common-hplc-issues/]
- 57. Chromatography Troubleshooting Guides-Liquid ... [https://www.thermofisher.com/us/en/home/industrial/chromatography/chromatography-learning-center/chromatography-consumables-resources/chromatography-troubleshooting-guides/chromatography-troubleshooting-guides-liquid-chromatography.html]
- 58. HPLC, a modular technique that complements NMR [https://specificpolymers.com/hplc-a-modular-technique-that-complements-nmr/]
- 59. What Is the Principle of UV-Vis Spectroscopy and Why It ... [https://connect.ssllc.com/learning-center/principle-of-uv-vis-spectroscopy/]
- 60. Ultraviolet Detectors: Perspectives, Principles, and Practices [https://www.chromatographyonline.com/view/ultraviolet-detectors-perspectives-principles-and-practices]
- 61. Troubleshooting and Optimization Tips for SPR Experiments [https://www.creative-proteomics.com/resource/troubleshooting-optimization-tips-for-spr-experiments.htm]
- 62. Surface Plasmon Resonance Troubleshooting - SPR ... [https://bitesizebio.com/31665/spr-instrument-troubleshooting-surface-plasmon-resonance-assay-technology/]
- 63. Top 10 tips for high quality SPR data | SPR Guide [https://nicoyalife.com/blog/spr-tips/top-10-tips-for-high-quality-spr-data/]
- 64. LC-MS Troubleshooting: From Frustration to Fix [https://www.chromatographyonline.com/view/lc-ms-troubleshooting-from-frustration-to-fix]
- 65. ICH Q2(R2) Validation of analytical procedures [https://www.ema.europa.eu/en/ich-q2r2-validation-analytical-procedures-scientific-guideline]
- 66. ICH publishes Training Materials on Q2(R2) and Q14 [https://www.gmp-compliance.org/gmp-news/ich-publishes-training-materials-on-q2r2-and-q14]
- 67. Spectrophotometer Selection and Troubleshooting [https://sperdirect.com/blogs/news/spectrophotometer-selection-and-troubleshooting-a-practical-guide?srsltid=AfmBOoqXv4Q4PLnQQCRYoiAzJKo93w9dD16ULQO7whzS9CtbIWd9NBEh]