Type Standardization for OES Spectrometers: A Complete Guide to Enhanced Accuracy and Troubleshooting
This article provides a comprehensive guide to Type Standardization, a critical calibration procedure for Optical Emission Spectrometry (OES) used to achieve superior analytical accuracy.
Type Standardization for OES Spectrometers: A Complete Guide to Enhanced Accuracy and Troubleshooting
Abstract
This article provides a comprehensive guide to Type Standardization, a critical calibration procedure for Optical Emission Spectrometry (OES) used to achieve superior analytical accuracy. Aimed at researchers and scientists, it covers the foundational principles of why OES requires this specialized calibration to correct for matrix effects and instrumental drift. The guide details a step-by-step methodological approach for implementation, explores advanced troubleshooting for persistent deviations, and validates the procedure against other calibration methods. By synthesizing these core intents, the article serves as an essential resource for professionals seeking to ensure data integrity and optimize spectrometer performance in demanding analytical environments.
Understanding Type Standardization: Why Basic OES Calibration Isn't Always Enough
The Principle of Relative Measurement in Spark OES
Optical Emission Spectrometry (OES) employing a spark source is a dominant technique for the direct elemental analysis of solid metals. A foundational concept that underpins this method is its reliance on relative measurement rather than absolute measurement. Unlike analytical techniques that measure absolute quantities, Spark OES instruments determine the concentration of an element in an unknown sample by comparing the intensity of its characteristic spectral lines to the intensities measured from reference materials of known composition [1]. This principle is crucial because the absolute intensity of light emitted from the spark-induced plasma is susceptible to numerous instrumental and environmental variables. The instrument's detector measures light intensities from the plasma at the sample surface, and the software then compares these spectral line intensities with those from known elemental concentrations to return useful quantitative information to the user [1]. The initial calibration, which establishes the relationship between light intensity and elemental concentration, is therefore not merely a preliminary step but an essential process that makes the instrument practically useful for analysis [1].
The reliance on relative measurement makes the traceability of the calibration to certified reference materials (CRMs) a non-negotiable aspect of quality assurance. As noted by industry experts, OES performance is directly tied to the quality of the standards used, as "results can ONLY be as good as certified standards that were used in the initial calibrations" [2]. This establishes a clear chain of comparability from the unknown sample back to national or international measurement standards through the CRMs.
The Spark OES Analytical Process
The process of relative measurement in Spark OES unfolds through a sequence of physical and electronic events, each critical to the final analytical result.
Physical and Electronic Workflow
The analytical sequence begins when a high-energy spark discharge is applied to the surface of the metal sample, causing localized vaporization of the material. This vaporized material, consisting of atoms and ions, is then excited within the spark plasma [3]. As these excited atoms and ions return to lower energy states, they emit element-specific radiation. The collected light is passed to a spectrometer, where it is dispersed into its constituent wavelengths [3]. Within the spectrometer, the intensity of selected characteristic spectral lines for each element is measured using detectors such as CCDs or photomultiplier tubes (PMTs) [3]. Finally, the software converts these measured light intensities into elemental concentrations by comparing them to a stored set of calibration curves derived from reference materials [3]. The following workflow diagram illustrates this integrated process:
The Critical Role of Calibration Curves
The calibration curve represents the mathematical heart of the relative measurement principle. It transforms the raw analytical signal—photon intensity at a specific wavelength—into the required analytical result, which is elemental concentration. During initial calibration, a series of certified reference materials with known concentrations are sparked, and the intensities at specific wavelengths for each element are recorded. A curve is then plotted for each element, establishing the functional relationship between intensity and concentration [3]. This stored calibration model is subsequently used to convert the intensity measured from an unknown sample into a concentration value. The proportional relationship between radiation intensity and elemental concentration in the sample is fundamental to this process, though this relationship must be regularly verified against standards to maintain its validity over time [3] [1].
Calibration Methodologies and Protocols
Maintaining the accuracy of Spark OES measurements requires a structured approach to calibration, encompassing initial setup, routine verification, and matrix-specific corrections.
Calibration Hierarchy and Workflow
A systematic calibration strategy ensures that measurements remain traceable and accurate throughout the instrument's operational lifetime. The process involves multiple tiers of calibration activities, from fundamental setup to application-specific adjustments, as illustrated below:
Types of Calibration Procedures
Table 1: Summary of Spark OES Calibration Methods
| Method | Purpose | When Performed | Key Requirements |
|---|---|---|---|
| Initial Calibration | Establish fundamental relationship between intensity and concentration [1]. | New instrument installation; after major maintenance [1]. | Multiple Certified Reference Materials (CRMs) covering expected concentration ranges [2]. |
| Drift Correction | Correct for minor changes in instrumental response over time [1]. | Daily or before each use; typically automated [1]. | Stable, homogeneous drift correction standards provided by instrument manufacturer [2]. |
| Type Standardization | Improve accuracy for specific alloy types that deviate from the general calibration [1]. | When analyzing alloys with compositions differing from initial calibration standards [1]. | CRM or proven sample very similar in composition to the test sample [1]. |
Detailed Experimental Protocol: Type Standardization
Type standardization is an advanced calibration procedure used when highest accuracy is required for specific alloy compositions. The following protocol provides step-by-step guidance:
Principle
Type standardization fine-tunes the existing calibration for a specific alloy composition by applying a correction factor based on a single, closely-matched reference material. It is not a replacement for fundamental calibration but rather a refinement applied on top of a valid existing calibration [1].
Prerequisites
- A valid and recently verified initial calibration must be established on the instrument [1].
- A certified reference material (CRM) or proven reliable sample whose composition is very close to the unknown sample to be analyzed must be available [1].
- The reference material should ideally match the unknown sample in both chemical composition and metallurgical structure.
Procedure
- Recalibration Verification: Ensure that a full recalibration has been performed immediately prior to beginning the type standardization procedure [1].
- Reference Material Analysis: Spark the selected type standardization reference material repeatedly (a minimum of 3-5 repetitions) to establish a precise intensity measurement.
- Result Comparison: Compare the average measured concentration values for each element to the certified values of the reference material.
- Correction Factor Calculation: The instrument software automatically calculates the difference between measured and certified values, determining a correction factor (bias) for each element.
- Application of Correction: The correction factors are stored and applied to subsequent analyses of unknown samples that are similar in composition to the type standardization sample [1].
Limitations and Considerations
- Specificity: A type standardization is valid only for unknown materials that are similar in composition to the standardization sample used [1].
- Scope: It is not an alternative to basic calibration and cannot correct for large systematic deviations across different material types [1].
- Management: Laboratories must maintain and apply different type standardizations for every different alloy or composition they need to measure [1].
The Scientist's Toolkit: Essential Research Reagents and Materials
Table 2: Essential Materials for Spark OES Calibration and Analysis
| Material/Reagent | Function | Critical Specifications |
|---|---|---|
| Certified Reference Materials (CRMs) | Provide the known concentration values for establishing and verifying calibration curves; ensure traceability [2]. | Certified to national/international standards; matrix-matched to samples; documented uncertainty. |
| Drift Correction Standards | Monitor and correct for short-term instrumental drift in signal response [1] [2]. | Highly homogeneous; stable over time; provided or approved by instrument manufacturer. |
| Control Samples | Independently verify calibration stability and analytical accuracy between CRM measurements [1]. | Known composition; similar to production samples; homogeneous and stable. |
| Type Standardization Samples | Fine-tune calibration for specific alloy compositions to improve analytical accuracy [1]. | Composition very close to specific test samples; certified or proven reliability. |
Advanced Calibration Techniques: Multi-Energy Calibration
Recent research has explored innovative calibration strategies to address matrix effects in complex samples. Multi-Energy Calibration (MEC) is a promising approach that can be adapted for plasma-based spectrometry techniques [4] [5]. Unlike traditional external calibration that uses a single wavelength per element and multiple standards, MEC utilizes multiple emission lines (wavelengths) for each element but requires only two calibration solutions per sample [4]. In this method, one solution (S1) consists of 50% sample and 50% standard solution containing the analytes, while the second solution (S2) consists of 50% sample and 50% blank solution [4]. The calibration curve is constructed by plotting signals from multiple wavelengths of the analyte in S1 against signals from the same wavelengths in S2 [4].
The significant advantage of MEC is its inherent ability to identify and mitigate spectral interferences, as affected wavelengths appear as outliers on the calibration plot [5]. This technique has demonstrated improved accuracy (with recoveries of 80-105%) for determining essential minerals in complex matrices like animal feeds when compared to traditional external calibration [5]. While MEC has been more frequently applied with ICP-OES due to the richer spectrum it generates, its use with Spark OES represents a potential avenue for future methodological development in metal analysis, particularly for challenging applications where matrix effects pose significant problems.
Identifying the Limits of Standard Calibration with CRMs
Optical Emission Spectrometry (OES) is an industry-standard technique for the elemental analysis of a wide range of metals and alloys, providing rapid elemental analysis of solid metallic samples with exceptional accuracy and precision [6]. The technique operates on the principle of relative rather than absolute measurements—the detector measures the intensity and wavelength of light emitted after a localized plasma is created on the sample by a spark, but these raw measurements alone cannot determine chemical composition without proper calibration [7].
Certified Reference Materials (CRMs) serve as the foundational link between these measured intensities and quantitative chemical analysis. Officially defined as "a material or substance of sufficient homogeneity for which one or more property values are sufficiently well established to be used for the calibration of measuring instruments, the assessment of measurement methods or for assigning property values" [7], CRMs create essential calibration curves through extensive databases based on numerous samples and tests. These calibration curves enable OES instruments to interpret detected results and deliver accurate quantitative chemical analysis, making them indispensable for ensuring measurement result accuracy and reliability [7].
Theoretical Limits of Standard CRM-Based Calibration
Fundamental Constraints in CRM Methodology
Despite their critical role in OES calibration, CRM-based approaches encounter several inherent limitations that constrain their effectiveness in certain analytical scenarios. These constraints originate from methodological, material, and instrumental factors that can compromise measurement accuracy if not properly addressed.
Statistical Reliability Boundaries: The calibration of a spectrometer should utilize as many CRMs as possible to reduce statistical variation, with the uncertainty of the calibration curve ideally not exceeding ± 2SR, where SR represents statistical reliability [7]. This statistical reliability can be calculated using the formula provided in established guidelines, but achieving optimal statistical performance requires extensive CRM resources that may not always be available in routine laboratory settings.
Matrix and Structural Limitations: A significant limitation arises from the synthetic manufacturing of most CRMs, which cannot guarantee correspondence to the composition or structure of actual production samples being analyzed [8]. This disparity becomes particularly problematic when analyzing exotic alloys that deviate strongly from the matrix material used in CRM production, leading to measurement inaccuracies that standard calibration cannot correct [8].
Instrumental Drift Effects: OES instruments are engineered for extreme sensitivity to detect elements at very low detection limits, but this sensitivity makes them susceptible to environmental parameters over the mid to long term, causing results to 'drift' over time and reducing accuracy [1]. While modern OES systems include features to monitor and correct for drift, this fundamental instrumental characteristic remains a constraint for standard CRM-based calibration.
Quantitative Limitations of Standard Calibration
Table 1: Quantitative Limitations of Standard CRM-Based Calibration
| Limitation Factor | Impact on Measurement Accuracy | Typical Manifestation |
|---|---|---|
| CRM Uncertainty | Baseline inaccuracy in calibration | Variation based on testing labs involved in certification process [7] |
| Exotic Alloy Deviation | Strong deviation from actual values | Measured values significantly different from true composition [8] |
| Structural Mismatch | Inaccurate representation of sample | Discrepancy between synthetic CRM structure and actual sample structure [8] |
| Instrument Drift | Progressive accuracy degradation | Slow change in instrument sensitivity over time [8] [1] |
Experimental Protocols for Identifying Calibration Limits
Protocol 1: CRM Verification and Acceptance Testing
Objective: To establish statistically valid acceptance criteria for CRM measurements and identify when standard calibration exceeds operational limits.
Materials and Equipment:
- Certified Reference Materials (CRMs) with documented uncertainties
- Properly calibrated OES spectrometer
- Control samples of known composition
- Data recording and statistical analysis software
Methodology:
- Calibrate the OES spectrometer using multiple CRMs according to manufacturer specifications and documented procedures [7].
- Measure each CRM repeatedly (minimum 6 measurements) to establish baseline intensity values and statistical distributions.
- Calculate the statistical reliability (SR) using the established formula for uncertainty assessment.
- Determine acceptance limits as ± 2SR from the certified values based on the statistical reliability calculation.
- Compare measured values against the certified values using the defined acceptance criteria.
- Investigate any instances where CRM measurements fall outside acceptance limits to determine root causes (e.g., wrong sample loading, incorrect method application, instrumental issues) [7].
Interpretation: Consistent deviations beyond ± 2SR indicate fundamental limitations in the standard calibration approach for the specific material type being analyzed and signal the need for supplemental standardization procedures.
Protocol 2: Control Sample Validation Procedure
Objective: To validate calibration stability using control samples and detect instrumental drift or matrix-related inaccuracies.
Materials and Equipment:
- Control samples comparable to production materials
- Certified Reference Materials for baseline establishment
- Sample preparation equipment (grinders, milling machines)
Methodology:
- Ensure the OES instrument is properly calibrated with CRMs before beginning control sample measurements.
- Prepare control samples using standardized preparation techniques (grinding or milling) to ensure consistent surface conditions [6].
- Measure control samples at least ten times to establish average values and standard deviations for key elements [1].
- Implement regular control sample measurements at predetermined intervals (e.g., after every 100 production samples) or when results are questionable.
- Record all control sample measurements for statistical process control and quality assurance purposes.
- Evaluate whether control sample measurements remain within established tolerance limits of the determined values [7].
Interpretation: Systematic deviations in control sample measurements from expected values indicate calibration drift or matrix-specific inaccuracies that standard CRM-based calibration cannot adequately address, necessitating type standardization.
Uncertainty Quantification Methods
For laboratories accredited to DIN EN ISO/IEC 17025, determining measurement uncertainty is mandatory for retaining accreditation [7]. Two established approaches exist for quantifying uncertainty in OES measurements:
Bottom-up Method (GUM): This method follows the Guide to the Expression of Uncertainty in Measurement and requires deep understanding of spark emission spectroscopy and statistical mathematics. While comprehensive, this approach is complex and resource-intensive to implement properly [7].
Top-down Method: This practical alternative relies on measurement results of CRMs and incorporates sample variables such as extraction method from the melt and sample preparation. The method is described in the Nordtest report TR537 "Handbook for calculating of uncertainty in environmental laboratories" and provides a more accessible approach for routine laboratory implementation [7].
Visualization of Calibration Limits and Solutions
Diagram 1: OES Calibration Limits and Correction Workflow. This workflow illustrates the systematic process for identifying limitations in standard CRM-based calibration and implementing type standardization to address specific accuracy deviations.
Research Reagent Solutions for Calibration Studies
Table 2: Essential Research Materials for OES Calibration Studies
| Reagent/Material | Specification Requirements | Research Application |
|---|---|---|
| Certified Reference Materials (CRMs) | Documented uncertainty from certified providers (e.g., NIST, Brammer Standards) [2] | Establish primary calibration curves and reference values [7] |
| Control Samples | Composition similar to production materials; precise homogeneity [7] | Verify calibration stability and detect instrument drift between CRM measurements [1] |
| High-Purity Acids | Trace metal grade (e.g., Suprapur, Merck) [9] | Sample preparation and digestion without introducing elemental contaminants |
| Monoelemental Calibration Solutions | SI-traceable with minimal uncertainties (e.g., TraceCERT) [10] | Method validation and specific element verification |
| Type Standardization Samples | Proven reliable specimens with composition closely matching test materials [8] [1] | Correct matrix-specific deviations in standard calibration |
Standard calibration with CRMs provides the essential foundation for accurate OES analysis but encounters significant limitations when confronted with exotic alloys, structural mismatches between CRMs and production samples, and inevitable instrumental drift. These constraints manifest as measurable deviations beyond established statistical reliability boundaries (± 2SR), signaling the need for supplemental approaches.
The experimental protocols outlined provide systematic methodologies for identifying these calibration limits through CRM verification testing, control sample validation, and proper uncertainty quantification. When standard calibration reaches its operational boundaries, type standardization serves as a targeted correction—not replacement—for basic calibration, specifically addressing matrix-specific inaccuracies for similar materials while maintaining traceability to primary CRMs [8] [1]. This hierarchical approach ensures optimal analytical accuracy while acknowledging the inherent constraints of standardized reference materials in practical metallurgical analysis.
Optical Emission Spectrometry (OES) is a dominant analytical technique for determining the elemental composition of materials, particularly in metallurgy, pharmaceuticals, and material science. Despite its speed and accuracy, OES performance can degrade without proper maintenance, verification, and recalibration [8] [11]. Type Standardization is a critical calibration procedure applied after initial calibration with Certified Reference Materials (CRMs) to correct for specific inaccuracies, particularly when analyzing materials with compositions that deviate from the original calibration standards [8]. This application note details the key indicators that signal the necessity for Type Standardization, providing researchers with clear diagnostic protocols and methodologies for its implementation.
Key Indicators for Type Standardization
Regular monitoring of specific performance metrics can pre-empt analytical inaccuracies. The following table summarizes the primary indicators that necessitate Type Standardization.
Table 1: Key Indicators Requiring Type Standardization
| Indicator Category | Specific Manifestations | Impact on Analytical Accuracy |
|---|---|---|
| Persistent Deviations | Discrepancies between OES results and values from CRM or control samples, despite a valid initial calibration [8] [11]. | Leads to incorrect composition analysis, affecting product quality and compliance. |
| Analysis of Exotic Alloys | Analysis of alloys that deviate strongly from the matrix of the CRMs used for initial calibration [8]. | Standard calibration models fail, resulting in significant concentration errors for key elements. |
| Sample Matrix Mismatch | Synthetic CRMs do not correspond to the actual composition or metallurgical structure of the production samples being analyzed [8] [11]. | Causes systematic errors due to differences in how the sample and standard materials respond to excitation. |
| Instrument Drift | Slow, continuous change in instrument sensitivity over time, observed as a gradual shift in results for stable control samples [8]. | Results in a progressive loss of accuracy, potentially going unnoticed without rigorous control procedures. |
| Inadequate Calibration Accuracy | The standard calibration does not fulfill the required accuracy level for the specific application, even without obvious drift [11]. | The instrument is fundamentally incapable of meeting the required precision and accuracy specifications. |
Experimental Protocol for Identifying Deviations and Drift
Objective: To systematically monitor OES performance and quantitatively determine the need for Type Standardization.
Materials and Reagents:
- Certified Reference Materials (CRMs)
- Well-characterized in-house control samples
- OES spectrometer with calibrated settings
Methodology:
- Daily Control Sample Analysis: Analyze a minimum of two control samples with known composition at the beginning and end of each analytical sequence [8].
- Data Recording: Record the measured concentrations for all elements of interest.
- Deviation Calculation: Calculate the percentage deviation of the measured values from the accepted reference values for each control sample.
- Formula:
% Deviation = [(Measured Value - Reference Value) / Reference Value] * 100
- Formula:
- Trend Analysis: Plot the results of the control samples over time on a control chart to visualize drift and identify persistent deviations that exceed pre-defined acceptance criteria (e.g., ±2σ from the historical mean) [8].
Interpretation: A consistent, statistically significant trend in the control data or repeated, uncorrectable deviations indicates that the standard calibration is no longer sufficient and Type Standardization is required.
The Type Standardization Procedure
Type Standardization fine-tunes the existing calibration for a specific alloy type just before analyzing one or more samples of that type [8] [11]. It is not a global correction method and is only valid for correcting unknown materials that are similar in composition to the standardization sample used [8].
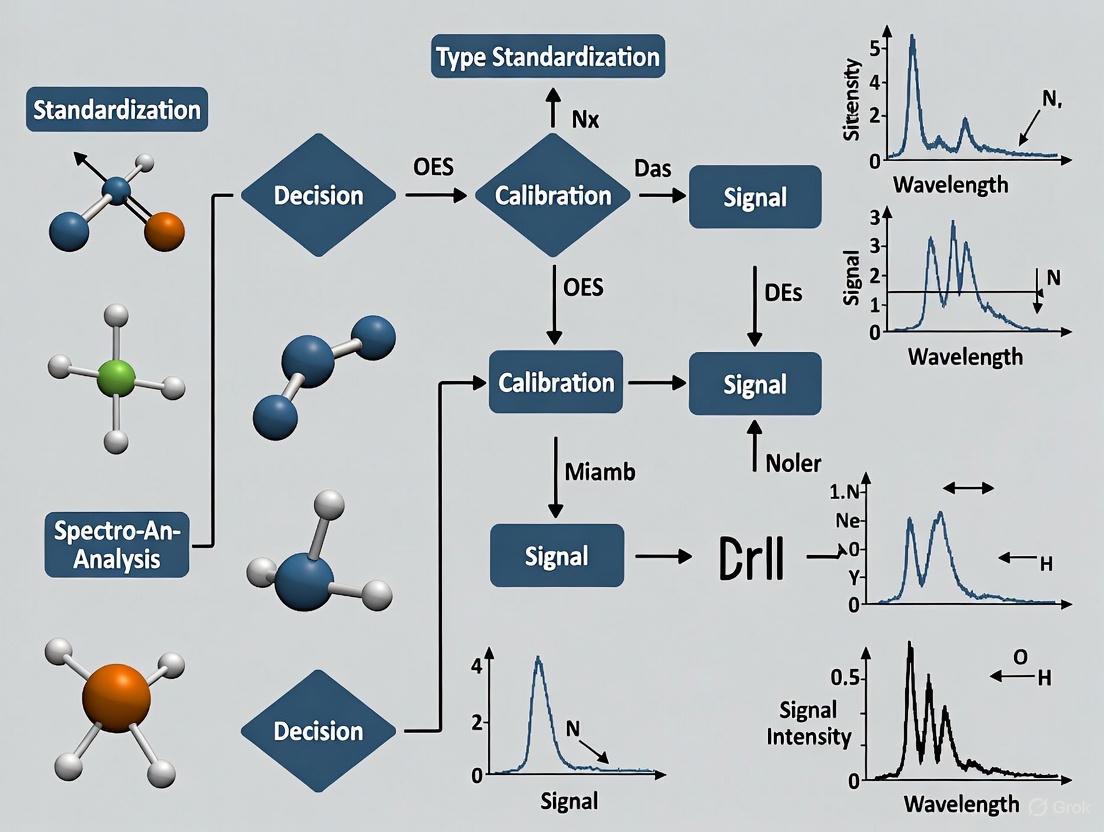
The following diagram illustrates the logical decision pathway for determining when and how to apply Type Standardization.
Experimental Protocol for Executing Type Standardization
Objective: To perform Type Standardization to correct for observed deviations and restore analytical accuracy for a specific alloy type.
Materials and Reagents:
- High-quality Type Standardization sample (preferably a CRM) with a composition very similar to the unknown production samples [8].
- Recently prepared and easy-to-measure control samples.
- Properly calibrated OES spectrometer.
Methodology:
- Verification: Confirm that the basic calibration with CRMs is at its optimal level of accuracy before beginning [8].
- Sample Preparation: Ensure the standardization sample is prepared according to the manufacturer's specifications (e.g., surfaced on a belt sander, lathe, or milling machine) to present a clean, homogeneous analysis surface [12].
- Instrument Setup: Access the Type Standardization function within the OES software.
- Sample Analysis: Run the Type Standardization sample. The instrument will measure the deviations between the expected values (certified concentrations) and the measured values.
- Calculation of Corrections: The instrument software automatically calculates and stores a set of correction factors (additive or multiplicative) for each elemental channel based on the analyzed sample [8].
- Validation: Immediately analyze one or more independent control samples of the same alloy type to verify that the standardization has successfully brought the results within acceptable limits.
Critical Note: Type Standardization should be performed just before running the unknown samples of that specific alloy type to ensure the correction factors are current and valid [11].
The Scientist's Toolkit: Essential Research Reagents & Materials
Successful implementation of Type Standardization and ongoing OES accuracy relies on several key materials.
Table 2: Essential Research Reagents and Materials for OES Calibration
| Item | Function & Importance |
|---|---|
| Certified Reference Materials (CRMs) | High-purity standards with certified elemental concentrations; form the foundation of initial instrument calibration and validation of analytical methods [8] [11]. |
| Type Standardization Samples | Well-characterized samples, ideally CRMs, with a composition nearly identical to the production samples; used to fine-tune the calibration for a specific alloy matrix [8]. |
| In-House Control Samples | Homogeneous, stable samples of known composition analyzed regularly to monitor instrument stability, track performance over time, and identify drift [8] [11]. |
| Natural Deep Eutectic Solvents (NADES) | Emerging as green alternatives for sample preparation in elemental analysis; can be used to create homogeneous suspensions for calibration in techniques like XRF, minimizing matrix effects [13]. |
For researchers and scientists relying on OES for critical elemental analysis, recognizing the indicators for Type Standardization is paramount for data integrity. Persistent deviations, matrix mismatches, and instrument drift are clear signals that the standard calibration is no longer sufficient. By implementing the detailed monitoring and standardization protocols outlined in this document, laboratories can proactively maintain the highest levels of analytical accuracy, ensure product quality, and comply with stringent regulatory standards.
The Impact of Exotic Alloys and Sample Structure on Accuracy
Optical Emission Spectrometry (OES) is a fundamental tool for the precise determination of elemental composition in metals and alloys. However, the accuracy of this technique is highly dependent on the relationship between the calibration standards and the unknown samples being analyzed. This application note examines a critical challenge in OES analysis: the significant impact that exotic alloys and sample structure have on analytical accuracy. We explore the underlying causes of these inaccuracies and present Type Standardization as a targeted procedure to correct them, framing this discussion within broader research on advanced OES calibration protocols for scientific and industrial professionals [8] [11].
The Underlying Challenge: Matrix Effects and Structural Disparities
The core of the problem lies in the fact that OES is a comparative technique; it measures the intensity of spectral lines from an unknown sample and compares them to a calibration curve established using Certified Reference Materials (CRMs) [8] [1]. Accuracy degrades when the physical or chemical nature of the sample diverges from that of the CRMs.
The primary factors leading to these deviations are summarized in the table below.
Table 1: Factors Leading to Analytical Deviations in OES
| Factor | Description | Impact on Accuracy |
|---|---|---|
| Exotic/Complex Alloys [8] [1] | Alloys that deviate strongly from the common matrix material (e.g., high-alloy steels, specialty superalloys). | Causes significant deviations in the excitation characteristics within the plasma, leading to incorrect concentration calculations. |
| Synthetic CRM Structure [8] [11] | Most CRMs are manufactured synthetically, which does not guarantee correspondence to the actual composition or structure of a production sample. | The difference in metallurgical structure (e.g., grain size, phase distribution) between the CRM and the sample affects how material is sputtered and excited, altering emission intensities. |
| Sample Homogeneity & Surface Finish [14] [15] | Variations in the homogeneity of the elemental distribution or imperfections in the sample surface prepared for analysis. | Rough surfaces, swirl marks, or contaminants scatter light and cause unstable spark conditions, reducing the reproducibility and reliability of results [14]. |
These factors introduce systematic errors that a standard calibration, even with high-quality CRMs, cannot fully correct. When routine quality control using control samples indicates persistent deviations, a more specific correction procedure—Type Standardization—is required [1].
Quantitative Impacts and Diagnostic Signals
The deviations caused by matrix and structural mismatches are not merely theoretical but have quantifiable effects on analytical performance. The following table outlines common diagnostic indicators and their consequences.
Table 2: Quantitative Impacts and Diagnostic Signals of Accuracy Deviations
| Diagnostic Signal / Impact | Quantitative/Descriptive Measure | Notes & Implications |
|---|---|---|
| Drift in Instrument Sensitivity [8] [16] | Slow change over time (mid- to long-term). | Can be monitored via daily control samples. Hitachi High-TTech OES analyzers automate spectral position monitoring across 130-800 nm for early detection [8]. |
| Systematic Bias for Specific Elements | Consistent positive or negative deviation from expected values in control samples. | Indicates a matrix effect. The need for Type Standardization is often identified through this daily monitoring [11]. |
| Insufficient Calibration Accuracy [8] | Deviation remains despite calibration with multiple CRMs. | Suggests the required accuracy level is above what the standard calibration can deliver for that specific sample type. |
| Influence of High-Concentration Elements [17] | Elements at high concentrations (≥500 ppm / µg/mL) in the sample. | Can alter plasma conditions (electron temperature/concentration), changing the sensitivity for other analytes. |
Experimental Protocol for Type Standardization
Type Standardization is a post-calibration correction procedure designed to fine-tune the calibration for a specific, narrowly defined alloy type. The following protocol ensures optimal results.
Prerequisites and Initial Setup
- Verified Base Calibration: Before beginning, confirm that the instrument's basic calibration using CRMs is optimal and up-to-date [1].
- Reference Material Acquisition: Secure a Proven Reliable Specimen (PRS) or a CRM that is very close in composition and structure to the unknown samples you intend to analyze. This material must be homogeneous and certified for the elements of interest [1] [11].
- Sample Preparation: Prepare the PRS and subsequent test samples to a high surface finish.
- Grinding/Milling: Use a spectroscopic grinding or milling machine to achieve a flat, homogeneous surface free of contaminants, oxides, and imperfections like swirl marks [15] [16].
- Cooling Control (for cast materials): When analyzing cast iron for carbon, ensure rapid cooling (e.g., using copper moulds) to promote white solidification, which prevents carbon nodule formation and ensures homogeneity [16].
Step-by-Step Standardization Procedure
- Spark the Standardization Sample: Analyze the prepared PRS using the same analytical program and conditions used for the unknown samples.
- Input Certified Values: The OES software will display the measured concentrations for the PRS. Enter the certified concentration values for the PRS into the instrument.
- Calculate Correction Factors: The instrument software automatically calculates additive and/or multiplicative correction factors for each element channel. These factors are determined by the difference between the measured and certified values of the PRS.
- Apply the Standardization: Save and apply the calculated correction factors. This creates a "Type Standardization" curve for that specific alloy type.
Workflow Visualization
The following diagram illustrates the logical relationship between the problem of analytical deviations and the solution provided by the Type Standardization protocol.
Diagram 1: Type Standardization Diagnostic and Correction Workflow (76 characters)
The Scientist's Toolkit: Essential Research Reagents and Materials
Successful implementation of the protocols described above requires specific high-quality materials and equipment.
Table 3: Essential Materials for High-Accuracy OES Analysis
| Item | Function & Importance | Specification & Best Practices |
|---|---|---|
| Certified Reference Materials (CRMs) [8] [18] | Establish the fundamental calibration curve. Provides the known elemental concentrations to which unknown samples are compared. | Must be traceable to national standards (e.g., NIST). Ideally, acquire 10-20 standards for common material grades [18]. |
| Proven Reliable Specimen (PRS) [1] | Serves as the standard for Type Standardization. Its composition and structure must be exceptionally close to the production samples. | Can be a well-characterized in-house sample or a specially certified CRM. Critical for correcting matrix-specific deviations. |
| Spectroscopic Grinding/Milling Machine [15] [16] | Produces a flat, homogeneous, and contamination-free surface on solid samples. | Ensures consistent spark conditions and light emission. Using a cup wheel grinder for cast iron is recommended for optimal carbon analysis [16]. |
| Correct Abrasive Media [16] | Removes surface oxides and contaminants to expose fresh, representative metal. | Use aluminium oxide for steel, nickel, cobalt, and titanium. Change paper every 5-10 samples to prevent cross-contamination. |
| Control Samples [1] [11] | Used for daily performance verification and drift monitoring. | Should be similar in composition to routine production samples. Measuring them repeatedly establishes a control chart for instrument stability. |
Critical Considerations and Limitations
Type Standardization is a powerful correction, but it is not a universal solution. Researchers must be aware of its boundaries:
- Narrow Applicability: The procedure is only valid for correcting unknown materials that are very similar in composition to the PRS used for the standardization. It is named "Type Standardization" for this reason [8] [11].
- Not a Replacement for Calibration: Type Standardization is an additional correction step applied on top of a valid and stable base calibration. It cannot compensate for a poor or outdated initial calibration [1].
- Corrects Systematic Bias, Not Random Error: This method is designed to correct for consistent, systematic deviations. It does not improve the precision (repeatability) of the analysis.
Within the broader context of OES calibration research, Type Standardization emerges as a vital, targeted procedure to achieve the highest levels of analytical accuracy. By understanding and addressing the specific challenges posed by exotic alloys and sample structure, researchers and drug development professionals can significantly enhance data quality. The successful application of this protocol hinges on a robust base calibration, the use of a well-matched Proven Reliable Specimen, and meticulous sample preparation. When applied correctly within its defined scope, Type Standardization is an indispensable tool for ensuring material quality and advancing research in fields requiring precise elemental analysis.
How Type Standardization Corrects for Matrix-Specific Biases
Optical Emission Spectrometry (OES) is an industry-standard analytical technique for determining the elemental composition of metals and alloys, playing a crucial role in quality and process control within metallurgical facilities [19]. However, its quantitative accuracy is frequently compromised by matrix effects, where the sample's overall composition influences the emission intensity of analyte elements, even when their concentrations are identical [20]. Type Standardization is a advanced calibration procedure designed to correct these matrix-specific biases, enabling high-precision analysis essential for material specification and research integrity.
This matrix effect manifests as a change in the slope of the calibration curve, which can be either positive or negative depending on the sample's physical and chemical properties [20]. Traditional calibration using Certified Reference Materials (CRMs) alone is often insufficient, as synthetically manufactured CRMs may not perfectly correspond to the composition or microstructure of the actual samples being analyzed [8]. Type Standardization addresses this limitation by fine-tuning the instrument's calibration using a sample that is chemically similar to the test materials, thereby correcting for biases induced by specific matrix compositions.
The Problem of Matrix Effects in Spectrochemical Analysis
Origins and Types of Matrix Effects
Matrix effects in OES arise from complex interactions between the sample matrix and the excitation source. These effects can be categorized as follows:
- Spectral Interferences: Occur when emission lines from matrix elements overlap with analyte lines, leading to falsely elevated intensity readings [20]. For instance, in steel analysis, the aluminum line at Al II 193.1 nm can interfere with the important carbon line at C I 193.07 nm [20].
- Physical Matrix Effects: Result from variations in sample properties such as thermal conductivity, heat capacity, and absorption coefficient, which alter the laser-sample interaction dynamics and subsequent emission intensities [21].
- Chemical Matrix Effects: Stem from chemical interactions within the sample, including the formation of stable compounds or differences in ionization potentials that alter excitation and emission behavior of analytes [21].
Consequences for Quantitative Analysis
The primary consequence of uncorrected matrix effects is reduced analytical accuracy, where the same analyte concentration in different matrices produces different measured signals. This effect is particularly pronounced in "exotic alloys" that deviate significantly from the matrix material of available CRMs [8]. Furthermore, instrument drift—the slow change in instrumental sensitivity over time—can compound these matrix effects, further distorting results without appropriate correction protocols [8].
Theoretical Foundation of Type Standardization
Type Standardization operates on the principle that while general calibrations establish baseline relationships between intensity and concentration, matrix-specific deviations from this baseline can be quantified and corrected using a well-characterized standard of similar composition to the unknown samples.
The fundamental correction principle can be understood through the lens of influence coefficient algorithms commonly used in spectrochemistry. For a single interfering element, the matrix effect correction takes the form:
Corrected Intensity = Uncorrected Intensity × (1 ± k × Concentration_Interfering_Element)
where k is the correction factor [20]. Type Standardization effectively determines these correction factors empirically by measuring the instrument response to a standard with known composition that closely matches the test samples.
The mathematical foundation extends to scenarios with multiple interfering elements through the equation:
C_i = A_0 + A_1 × I_i × (1 ± Σ k_ij × C_j)
where the summation is over the j subscript of the interfering elements [20]. Type Standardization provides a practical approach to implementing these corrections without requiring explicit knowledge of all interference coefficients.
Protocol for Implementing Type Standardization
Prerequisites and Preparation
Before performing Type Standardization, ensure the following prerequisites are met:
- The OES instrument has a valid initial calibration performed with multiple CRMs.
- Type Standardization samples are available with known composition that closely matches the test materials.
- The instrument is in a stable condition, with the optical system thermally stabilized.
Step-by-Step Standardization Procedure
- Verification of Initial Calibration: Run a control sample to verify the current calibration status. Note any significant deviations from expected values [8].
- Selection of Standardization Samples: Obtain one or more samples of the same alloy type as your test materials with known chemical composition. These should be recently prepared and easy to measure [8].
- Instrument Preparation: Ensure the OES analyzer is properly configured with the correct analytical program for the specific alloy type.
- Sample Measurement: Run the standardization sample multiple times (typically 3-5 repetitions) to establish a precise measurement value.
- Calculation of Correction Factors: The instrument software compares the measured values to the known values of the standardization sample and calculates correction factors for each element.
- Application of Corrections: The correction factors are applied to subsequent measurements of unknown samples of similar composition.
- Verification: Run a control sample of known composition to verify the accuracy of the Type Standardization.
Table 1: Troubleshooting Guide for Type Standardization
| Problem | Potential Cause | Solution |
|---|---|---|
| Large corrections required | Initial calibration has drifted significantly | Recalibrate the instrument before standardization |
| Poor repeatability | Sample heterogeneity or surface preparation issues | Verify sample preparation method; use multiple measurements |
| Some elements show poor correction | Incorrect analytical line selection | Verify spectral line interferences and consider alternative lines |
| Standardization fails verification | Standardization sample does not match test material composition | Source a more appropriate standardization sample |
Post-Standardization Quality Control
After performing Type Standardization, implement these quality control measures:
- Daily Control Samples: Use control samples to monitor the spectrometer's performance daily [8].
- Recalibration Schedule: Establish a regular schedule for complete recalibration based on instrument usage and stability requirements.
- Documentation: Maintain detailed records of standardization procedures, including sample identities, measurement results, and correction factors applied.
Experimental Validation and Case Studies
Performance Metrics for Validation
The effectiveness of Type Standardization can be quantified using several performance metrics:
- Accuracy Improvement: Measure the reduction in bias between measured and known values of control samples.
- Precision: Assess the repeatability of measurements on homogeneous samples before and after standardization.
- Long-term Stability: Monitor how correction factors remain valid over time through regular control sample measurements.
Table 2: Typical Performance Improvement After Type Standardization
| Parameter | Before Standardization | After Standardization |
|---|---|---|
| Accuracy (relative to CRM) | 5-15% deviation | 0.5-3% deviation |
| Repeatability (RSD) | 2-8% | 0.5-2% |
| Long-term stability (drift per week) | 3-10% | 0.5-2% |
Case Study: Analysis of Complex Alloys
In the analysis of nickel silvers (copper-nickel-zinc alloys), the addition of zinc was found to significantly change the slope of the nickel calibration curve, a classic matrix effect [20]. Traditional calibration using copper-based CRMs showed deviations of up to 12% when analyzing these materials. After Type Standardization using a nickel silver standard with certified composition, the deviations were reduced to less than 2%, demonstrating the procedure's effectiveness for matrix-specific correction.
Advanced Applications and Method Integration
Integration with Other Calibration Techniques
Type Standardization can be effectively combined with other calibration methods to enhance analytical performance:
- Internal Standardization: The addition of internal standard elements to correct for instrumental fluctuations can complement Type Standardization's matrix effect correction [22].
- Standard Addition Method: Particularly useful for complex matrices where blanks are unavailable, this method involves adding known quantities of analyte to the sample itself [23].
- Multi-Wavelength Methods: New approaches like Multi-Wavelength Internal Standardization (MWIS) use multiple emission wavelengths for analytes and internal standards to create numerous signal ratios for improved calibration [22].
The workflow below illustrates how Type Standardization integrates with other calibration methods in a comprehensive quality assurance system.
The Researcher's Toolkit for Type Standardization
Table 3: Essential Materials and Reagents for Type Standardization Protocols
| Item | Specification | Function in Protocol |
|---|---|---|
| Certified Reference Materials (CRMs) | NIST-traceable, matrix-matched | Establish initial calibration curves |
| Type Standardization Samples | Well-characterized composition, similar to test materials | Correct for matrix-specific biases |
| Internal Standard Elements | High purity, not present in samples | Correct for instrumental fluctuations [22] |
| Sample Preparation Equipment | Grinding machines, milling tools | Ensure consistent surface preparation [19] |
| Quality Control Samples | Stable, homogeneous reference materials | Verify standardization effectiveness |
Type Standardization represents a critical procedure in the OES analytical workflow, specifically designed to correct for matrix-specific biases that conventional calibration cannot address. By using well-characterized standards that closely match the composition of test materials, this method significantly improves analytical accuracy for precise material specification and research applications. The procedure is most effective when implemented as part of a comprehensive quality assurance system that includes regular instrument calibration, appropriate sample preparation, and ongoing verification through control samples. As OES technology continues to evolve, with developments in solid-state generators, reduced gas consumption, and faster analysis times [17], Type Standardization remains an essential tool for ensuring measurement accuracy in the face of complex matrix effects.
Executing Type Standardization: A Step-by-Step Protocol for Precision
In Optical Emission Spectrometry (OES), a valid and recent base calibration forms the essential foundation for all subsequent analytical measurements. Type Standardization, a procedure for fine-tuning the instrument's calibration using a sample of known composition, is entirely dependent on this initial baseline being accurate and stable [8]. Without this prerequisite, even a perfectly executed Type Standardization will yield incorrect results, leading to material misidentification and significant financial losses. This application note details the protocols for establishing, verifying, and maintaining the base calibration critical for advanced OES research and pharmaceutical development.
The Critical Role of Base Calibration in Type Standardization
Type Standardization is not a standalone calibration but a corrective procedure applied on top of an existing base calibration. It is designed to correct for minor, alloy-specific drifts and is only valid for materials similar in composition to the standardization sample [8] [7].
The relationship between base calibration and Type Standardization can be visualized as a hierarchical process, as shown in the workflow below.
If the base calibration is invalid, the Type Standardization will amplify these inaccuracies. Research indicates that attempting to use Type Standardization for initial charge or ladle correction when the instrument cannot reproduce Certified Reference Material (CRM) values can yield disastrous results [2].
Establishing a Valid Base Calibration
The Foundation: Certified Reference Materials (CRMs)
A primary base calibration requires CRMs. These are materials of sufficient homogeneity with property values that are sufficiently well established for the calibration of measuring instruments [7]. The calibration should be performed with as many CRMs as possible to reduce statistical variation and create a more accurate calibration curve [7].
Key Instrument Parameters for Robust Methods
The following table summarizes optimized ICP-OES parameters from pharmaceutical method development, demonstrating the level of detail required for a robust base calibration.
Table 1: Optimized ICP-OES Parameters for Elemental Impurity Analysis in Pharmaceuticals
| Parameter | Setting for Lead (Pb) | Setting for Palladium (Pd) | Setting for Zinc (Zn) |
|---|---|---|---|
| Wavelength (nm) | 220.3 nm | 340.4 nm | 213.8 nm |
| Plasma View | Axial | Axial | Radial |
| RF Power | 1150 W | 1150 W | 1150 W |
| Nebulizer Gas Flow | 0.40 L/min | 0.40 L/min | 0.40 L/min |
| Auxiliary Gas Flow | 0.5 L/min | 0.5 L/min | 0.5 L/min |
| Linear Range | > 0.9990 (R²) | > 0.9990 (R²) | > 0.9990 (R²) |
| Sample Preparation | Dissolution in H₂O₂, HCl, H₂SO₄; Centrifugation [24] | Dissolution in H₂O₂, HCl, H₂SO₄; Centrifugation [24] | Dissolution in H₂O₂, HCl, H₂SO₄; Centrifugation [24] |
Protocols for Verification and Maintenance of Base Calibration
Ongoing Verification Using Control Samples
Regular verification is essential to ensure the base calibration remains valid over time. This is done using control samples (also called drift control samples). These are stable, homogeneous samples whose composition has been linked to the original CRM-based calibration [7].
Procedure:
- Linking Control Samples: Immediately after a successful base calibration, measure the control sample at least six times to establish a precise reference value and acceptable tolerance limits [7].
- Routine Checks: Analyze the control sample at regular intervals (e.g., daily, every 100 samples, or at the start of each shift) [7].
- Evaluation: Compare the results against the established control limits. Consistent deviation indicates instrument drift and signals that the base calibration may no longer be valid, necessitating a recalibration.
Internal Standardization for Enhanced Accuracy
The use of internal standards (IS) is a critical technique to correct for variations in sample matrices and analyte intensities, ensuring data accuracy, especially in complex pharmaceutical samples [25].
Protocol for Internal Standard Implementation:
- Selection: Choose IS elements not present in the samples and free from spectral interferences. Yttrium (Y) and Scandium (Sc) are common choices, but the selection must be method-specific [25].
- Concentration: The IS concentration must produce sufficient intensity for good precision (RSD < 2% in calibration solutions) while remaining within the linear range [25].
- Introduction: The IS must be added at the same concentration to all analytical solutions (blanks, standards, and samples), typically via an automated pump channel to ensure consistency [25].
- Data Evaluation: Monitor IS recoveries. Recoveries in samples should typically be within 70-120% of the average recovery in the calibration standards. Poor precision in IS replicates (>3% RSD) indicates issues with mixing or sample introduction [25].
Frequency of Recalibration
The base calibration is not permanent. It is subject to drift over time due to changes in instrument sensitivity [8]. Recalibration is required when:
- Control sample results consistently fall outside pre-defined tolerance limits [7].
- After major instrument maintenance or component replacement [26].
- As stipulated by quality assurance protocols, such as regular six-monthly inspections, to ensure ongoing compliance with standards like ISO 17025 [2] [7].
The Scientist's Toolkit: Key Research Reagent Solutions
Table 2: Essential Materials for OES Calibration and Analysis
| Reagent/Material | Function & Importance | Application Notes |
|---|---|---|
| Certified Reference Materials (CRMs) | Primary calibrators for establishing the fundamental calibration curve. Provide traceability to international standards. | Must be matrix-matched to the analyzed samples where possible. Require a sufficient number to reduce statistical uncertainty [7]. |
| Control Samples (Drift Standards) | Stable samples for daily verification of calibration stability. Monitor instrument drift between CRM-based recalibrations. | More cost-effective than CRMs for routine use. Must be "linked" to the initial calibration [7]. |
| Internal Standard Solutions | Elements added to all solutions to correct for physical and matrix-related interferences, improving accuracy and precision. | Yttrium (Y) and Scandium (Sc) are common, but selection is critical to avoid interferences [25]. |
| High-Purity Acids & Solvents | For sample preparation and digestion to introduce samples into the ICP-OES in a soluble form without introducing contaminants. | Includes HNO₃, HCl, H₂O₂ of trace metal grade. Purity is paramount to avoid elevating method blanks [24] [27]. |
| Multi-Element Standard Solutions | Used for preparing calibration standards for multiple analytes simultaneously, ensuring consistency and saving preparation time. | Commercially available with well-characterized concentrations (e.g., 1000 mg/L). Used for constructing the calibration curve [24] [27]. |
A valid and recent base calibration is the non-negotiable foundation for any reliable OES analysis, including the application of Type Standardization. This foundation, built on high-quality CRMs, verified regularly with control samples, and corrected using internal standards, ensures data integrity and result traceability. For researchers in drug development, adhering to these rigorous protocols is essential for complying with regulatory guidelines and guaranteeing the safety and efficacy of pharmaceutical products by accurately controlling elemental impurities.
Sourcing and Selecting Appropriate Reference Materials
Reference Materials (RMs) and Certified Reference Materials (CRMs) are fundamental to achieving accurate and reliable calibration for Optical Emission Spectrometers (OES). These materials, characterized by their homogeneity and well-established property values, form the basis for creating calibration curves that translate instrument signal intensity into quantitative chemical composition [7]. Within the context of Type Standardization—a procedure to correct for matrix-specific deviations and enhance measurement accuracy after a general calibration—the selection of appropriate RMs becomes even more critical [8]. Type Standardization is valid only for correcting analyses of unknown materials that are similar in composition to the standardization sample itself [8]. This application note details the protocols for sourcing, selecting, and verifying RMs to support robust Type Standardization procedures in OES calibration research.
Reference Material Classification and Properties
Types of Reference Materials
RMs used in OES calibration serve distinct purposes, from initial instrument calibration to ongoing quality control. Their roles in the calibration ecosystem are summarized in the table below.
Table 1: Types of Materials for OES Calibration and Control
| Material Type | Primary Function | Key Characteristics | Role in Type Standardization |
|---|---|---|---|
| Certified Reference Materials (CRMs) | Establish the primary calibration curve [7]. | Supplied with a certificate of analysis detailing element concentrations and associated uncertainties [28] [7]. | Serves as the foundational benchmark for accuracy. |
| Control Samples | Daily verification of spectrometer functionality and drift checking [7]. | Homogeneous, larger in size, and more cost-effective than CRMs; composition is linked to the CRM calibration [7]. | Used to monitor instrument stability before performing Type Standardization. |
| Type Standardization Samples | Correct for matrix effects and improve accuracy for specific alloy types post-initial calibration [8]. | Should closely match the production sample's composition and structure; often a well-characterized production sample. | The core material for the Type Standardization procedure. |
Essential Characteristics of High-Quality RMs
The effectiveness of any RM hinges on several key properties:
- Homogeneity: The composition must be uniform throughout the entire sample to ensure consistent spark excitation and reliable results. Homogeneity is evaluated according to standards such as ASTM E826-1996 [28].
- Certified Uncertainty: Each certified element must have a documented uncertainty, which quantifies the confidence in the certified value and is derived from inter-laboratory testing [28] [7].
- Matrix Matching: The RM should closely mirror the chemical composition and metallurgical structure of the samples being analyzed. Synthetically manufactured CRMs do not always correspond to the composition or structure of a production sample, which can lead to deviations [8].
Experimental Protocols for RM Evaluation and Application
Protocol 1: Sourcing and Procurement of RMs
Objective: To acquire CRMs and control samples that meet analytical requirements and quality standards.
- Identify Needs: Define the alloy types (e.g., iron-based, aluminum-based, copper-based) and concentration ranges of interest [28].
- Select Suppliers: Source CRMs from accredited producers (e.g., BAM in Germany, NIST) or specialized commercial manufacturers. For certain applications, internal laboratory reference materials may be calibrated against primary CRMs [29] [7].
- Verify Documentation: Ensure each CRM is supplied with a certificate detailing certified values, uncertainties, and recommended storage conditions.
- Procure Control Samples: Acquire homogeneous control samples that are chemically comparable to production samples for daily instrument verification [7].
Protocol 2: Verification of RM Suitability for Type Standardization
Objective: To experimentally confirm that a candidate Type Standardization sample is free from interferences and is fit for purpose.
- Analyze Major Components: Run single-element standards for all major matrix components at expected concentrations (e.g., 1% or 10,000 mg/L). Overlay the resulting spectra with the analyte peaks of the candidate RM [30].
- Check for Interferences: Examine the spectral regions around the analyte wavelengths in the candidate RM. Identify any spectral overlaps from major components. A wavelength is unsuitable if peaks from interferents sit directly over the analyte peak [30].
- Compare Peak Shapes: After analysis, compare the peak shapes of the candidate RM with those from a pure standard. Significantly different peak shapes indicate a potential interference, necessitating a different RM or analytical wavelength [30].
- Validate with CRM: Analyze the candidate Type Standardization sample as an unknown against a CRM of similar but not identical composition. The results should fall within the certified uncertainty range of the CRM to confirm the sample's suitability.
Protocol 3: Establishing Acceptance Limits for CRMs
Objective: To define statistical criteria for accepting a CRM into the calibration curve.
- Calibrate with Multiple CRMs: Perform an initial calibration using as many CRMs as possible to reduce statistical variation and build a robust calibration curve [7].
- Calculate Statistical Reliability (SR): Measure each CRM multiple times and use the formula for Statistical Reliability (SR), which is the standard deviation of the residuals, to assess the scatter of the data points around the calibration curve [7].
- Set Acceptance Criteria: The uncertainty of the calibration curve should not exceed ± 2SR [7]. A CRM measurement that deviates significantly beyond this limit should be investigated for issues such as incorrect sample loading or method application.
Diagram 1: Workflow for Sourcing and Validating Reference Materials for Type Standardization.
The Scientist's Toolkit: Key Research Reagent Solutions
Table 2: Essential Materials for OES Calibration and Type Standardization Research
| Reagent / Material | Function | Specific Application Notes |
|---|---|---|
| Certified Reference Materials (CRMs) | Provide the traceable foundation for all calibration activities, enabling quantitative analysis [7]. | Use a high number of CRMs to reduce statistical variation. Always check certificate validity and uncertainty. |
| Type Standardization Samples | Fine-tune calibration for a specific alloy type to correct matrix-induced deviations [8]. | Must be similar in composition and structure to production samples. Can be a well-characterized, homogeneous production sample. |
| Control Samples / Check Samples | Monitor spectrometer stability, perform statistical process control, and check for instrumental drift [7]. | A cost-effective alternative to frequent CRM use. Must be "linked to the calibration" by repeated measurement after initial calibration. |
| Single-Element Standards | Investigate and identify spectral interferences from major matrix components during method development [30]. | Run at high concentrations (e.g., 1-10%) to map potential interferences across analyte wavelengths. |
| Internal Standard Elements (e.g., Sc, Y) | Compensate for signal fluctuations caused by physical differences in samples, instrument drift, or matrix effects [31] [32]. | Must be added consistently to all samples and standards. Should not be present in the original sample and must behave similarly to the analytes in the plasma. |
The meticulous sourcing and selection of reference materials are paramount for achieving top accuracy in OES analysis, particularly when employing advanced calibration procedures like Type Standardization. By adhering to the protocols outlined herein—including rigorous verification for spectral interferences, establishing statistical acceptance limits, and utilizing the appropriate type of standard for each specific task—researchers can ensure their OES spectrometers provide data of the highest reliability. This systematic approach to reference materials forms the foundation for robust and accurate Type Standardization, ultimately enhancing quality control and research outcomes in metallurgical analysis.
In elemental analysis using Optical Emission Spectrometry (OES), the reliability of results is fundamentally dependent on procedures performed before the analysis itself begins. Inadequate sample preparation is a primary contributor to analytical errors, responsible for as much as 60% of all spectroscopic analytical inaccuracies [15]. Simultaneously, verifying instrument status through calibration and standardization is critical because OES spectrometers are highly sensitive instruments whose performance can deteriorate without frequent maintenance and verification [8]. This application note establishes a definitive pre-analysis checklist, framed within OES Type Standardization research, to ensure data integrity for researchers, scientists, and drug development professionals.
Sample Preparation Techniques for OES
Proper sample preparation is the first critical control point for data quality. The physical state and presentation of the sample directly influence its interaction with the spark source, plasma stability, and the resulting spectral emissions.
Solid Metallic Samples
OES is an industry-standard technique for the elemental analysis of a range of metals and alloys, typically using Arc/Spark excitation for solid metallic samples [33]. Preparation aims to create a homogeneous, representative surface for analysis.
- Grinding and Milling: Use spectroscopic grinding or milling machines to create a flat, homogeneous surface [15]. This minimizes light scattering and ensures consistent spark interaction. Select equipment based on material hardness to avoid contamination; harder materials require more powerful machinery with specialized grinding surfaces.
- Surface Finish: The final surface quality must be optimized for the specific analysis. For quantitative OES, a consistent surface finish across all samples and standards is vital as it affects spark penetration and plasma formation.
Liquid Samples
While direct analysis of solids is a key advantage of Arc/Spark OES, some applications require liquid analysis via related techniques like Inductively Coupled Plasma OES (ICP-OES). Sample preparation must ensure complete dissolution and compatibility with the introduction system.
- Dissolution and Digestion: Solid samples must undergo total dissolution using appropriate acids or mixtures. The dissolution method must be validated for complete recovery of all target analytes.
- Dilution and Filtration: Dilution places analyte concentrations within the instrument's optimal detection range and reduces matrix effects [15]. Filtration (e.g., using 0.45 μm membrane filters) removes suspended particles that could clog the nebulizer [15].
- Acidification: High-purity acidification with nitric acid (e.g., to 2% v/v) keeps metal ions in solution, preventing precipitation and adsorption to container walls [15].
Table 1: Common Sample Preparation Errors and Impacts on OES Analysis
| Preparation Error | Impact on OES Analysis |
|---|---|
| Irregular or Rough Surface | Inconsistent spark discharge, poor reproducibility, and light scattering [15] |
| Sample Contamination | Introduction of spurious spectral signals from foreign material [15] |
| Inhomogeneous Sample | Non-representative sampling, leading to incorrect composition reporting [15] |
| Improper Dilution | Matrix effects or instrument detection issues (over-range or poor detectability) [15] [34] |
Instrument Status Verification and Calibration
Verifying that the spectrometer is fit for its intended purpose is a mandatory step before any analytical run. This involves a multi-tiered approach from fundamental qualification to application-specific standardization.
Analytical Instrument Qualification (AIQ)
Regulated laboratories require a structured qualification process. According to regulatory perspectives, Analytical Instrument Qualification (AIQ) and Computerized System Validation (CSV) should be integrated to ensure no gaps exist [35]. The foundational model is the 4Qs:
- Design Qualification (DQ): For a spectrometer, a supplier selection report typically replaces DQ, confirming the chosen instrument meets user requirements [35].
- Installation Qualification (IQ): Verifies the instrument is correctly installed as per specifications.
- Operational Qualification (OQ): Demonstrates the instrument operates as intended in the selected environment.
- Performance Qualification (PQ): For CSV, this confirms the overall suitability of the system against the User Requirements Specification (URS) [35].
Routine Calibration and Type Standardization
OES spectrometers use relative measurements, making calibration with Certified Reference Materials (CRMs) essential. Type Standardization is a finer correction applied on top of the standard calibration to achieve the highest accuracy for specific alloy types [8].
Indications for Type Standardization:
- Observed deviations despite a calibration with numerous CRMs.
- Analysis of "exotic" alloys that deviate strongly from the matrix of the standard CRMs.
- A discrepancy between the synthetic composition of CRMs and the actual composition/structure of the production sample.
- The instrument's calibration is no longer sufficient for the required accuracy level, potentially due to long-term drift [8].
Benefits and Limitations:
- Benefit: Delivers a significant improvement in the accuracy of OES results for specific alloy types similar to the standardization sample [8].
- Limitation: It is not a global correction and is only valid for materials similar in composition to the standardization sample [8].
Table 2: Key Materials for Instrument Calibration and Standardization
| Material / Reagent | Function in OES Analysis | Critical Specifications |
|---|---|---|
| Certified Reference Materials (CRMs) | Establishes the primary calibration curve; verifies instrument performance [8] | Matrix-matched to samples; certified concentrations traceable to national standards |
| Type Standardization Samples | Provides a finer, secondary correction for specific alloy types to enhance accuracy [8] | Well-characterized, homogeneous production sample with a known composition |
| High-Purity Gases | Maintains plasma (Argon) and provides a purged environment for optical path | High-purity Argon (e.g., 99.996% minimum) to ensure stable plasma formation |
Experimental Protocol: Type Standardization for OES
This protocol details the steps for performing a Type Standardization to correct for deviations in a calibrated OES spectrometer for a specific alloy type.
Principle
Type Standardization fine-tunes the instrument's existing calibration for a specific alloy family by analyzing one or more samples of that known composition. It corrects for minor deviations arising from differences between synthetic CRMs and actual production samples or from long-term instrumental drift [8].
Materials and Equipment
- OES Spectrometer with established, valid baseline calibration.
- Homogeneous, well-characterized Type Standardization sample(s) of the target alloy.
- Certified Reference Materials (CRMs) for verification.
- Appropriate sample preparation tools (grinder, cutter, etc.).
- Personal protective equipment (safety glasses, gloves).
Step-by-Step Procedure
- Pre-Standardization Check: Ensure the OES spectrometer has a current and optimal baseline calibration performed with the appropriate CRMs.
- Sample Preparation: Prepare the Type Standardization sample identically to production samples. For a metal, this involves grinding to create a fresh, flat, clean surface.
- Sample Analysis: Run the prepared Type Standardization sample on the OES. The instrument software will compare the measured values to the known, stored values for this standard.
- Apply Correction: The instrument's software calculates a correction factor (or set of factors) based on the measured deviation. Apply this correction as per the manufacturer's instructions.
- Verification: Immediately after standardization, analyze a different CRM or a control sample of the same alloy type to verify that the standardization has correctly improved the accuracy without over-correction.
- Documentation: Record the date, time, operator, standardization sample ID, correction factors applied, and verification results in the instrument logbook.
The Scientist's Toolkit: Essential Research Reagents and Materials
Table 3: Key Research Reagent Solutions for OES Analysis
| Item | Function / Application |
|---|---|
| High-Purity Acids (e.g., HNO₃) | For sample digestion of non-metallic samples and acidification of liquid samples to stabilize analytes [15] [34]. |
| Certified Reference Materials (CRMs) | To establish a traceable calibration, verify analytical method accuracy, and monitor instrument performance [8]. |
| Type Standardization Samples | To perform a secondary, fine correction on the standard calibration for specific alloy types to achieve top accuracy [8]. |
| Grinding Media & Belts | To prepare a flat, homogeneous, and contamination-free surface on solid metallic samples for Spark OES analysis [15]. |
| High-Purity Argon Gas | To create and maintain the stable plasma required for excitation in the OES source [36]. |
Adherence to a rigorous pre-analysis checklist for sample preparation and instrument status is non-negotiable for generating reliable OES data. Proper sample preparation mitigates up to 60% of potential analytical errors, while a robust instrument qualification and calibration strategy, culminating in Type Standardization where needed, ensures the spectrometer itself is a reliable measuring tool. For researchers in drug development and other regulated environments, this integrated approach is the foundation of data integrity, ensuring that results for elemental composition are accurate, reproducible, and fit for their intended purpose.
Optical Emission Spectrometry (OES) is a powerful technique for determining the elemental composition of materials, particularly in metal analysis. However, the technique relies on relative rather than absolute measurements, making calibration a critical factor for analytical accuracy [1] [8]. Type Standardization represents an advanced calibration procedure that fine-tunes an OES instrument's calibration for specific alloy types or sample matrices. This specialized procedure addresses situations where even a well-calibrated instrument may yield deviations due to unique sample characteristics.
This protocol outlines the complete sequence for performing Type Standardization, providing researchers and analytical professionals with a systematic approach to enhance measurement accuracy for specialized applications. The procedure is particularly valuable when analyzing exotic alloys that deviate strongly from standard matrix materials or when the physical structure of certified reference materials (CRMs) does not perfectly match that of production samples [8]. When implemented correctly, Type Standardization delivers the precision required for rigorous quality control and research applications.
Prerequisites and Preparatory Steps
Instrument Readiness Verification
Before initiating Type Standardization, confirm that the OES spectrometer meets critical operational prerequisites. The instrument must first have a valid basic calibration established using certified reference materials (CRMs) [1] [8]. This foundational calibration should be recently verified or performed immediately before the Type Standardization procedure. Additionally, ensure the instrument has stabilized optically and thermally by maintaining the plasma in a stable state for approximately 20 minutes before calibration [37]. Verify that all spectrometer maintenance is current, including electrode condition, spark stand cleanliness, and purge gas supply.
Control Sample Qualification and Acceptance Criteria
The foundation of successful Type Standardization rests on using appropriate control samples. These samples must be homogeneous and proven reliable specimens with compositions nearly identical to the unknown materials you intend to analyze [1] [7]. The control samples should match both the chemical composition and metallurgical structure of your production samples. When measuring control samples to establish baseline values, perform at least ten repeated measurements on newly prepared samples and record both the average and standard deviation [1]. The acceptance criteria for these measurements should follow statistical reliability guidelines, typically not exceeding ±2SR (where SR represents statistical reliability) [7].
Table 1: Control Sample Acceptance Criteria
| Parameter | Specification | Purpose |
|---|---|---|
| Sample Composition | Nearly identical to unknown samples [1] | Ensures standardization relevance |
| Sample Structure | Matches production sample structure [8] | Eliminates structural interference |
| Measurement Replicates | Minimum of 10 measurements [1] | Establishes reliable baseline values |
| Statistical Acceptance | Not exceeding ±2SR [7] | Ensures measurement reliability |
| Sample Homogeneity | Sufficient for consistent spark results [7] | Prevents measurement variation |
Type Standardization Procedure
Step-by-Step Operational Sequence
Once prerequisites are confirmed, execute the Type Standardization sequence in the following order:
Verify Basic Calibration: Confirm the instrument's basic calibration is optimal using CRMs before beginning Type Standardization [8]. Rectify any significant drift or calibration issues before proceeding.
Select Appropriate Standards: Choose one or more reference materials or proven reliable specimens that closely match the composition of your sample type [1]. For the highest accuracy, use certified reference materials with traceable certificates.
Prepare Samples Meticulously: Ensure all standardization samples are properly prepared with consistent surface finish, cleanliness, and geometry. Inadequate sample preparation represents a common source of standardization error.
Execute Type Standardization Routine: Access the Type Standardization function in your instrument software. Follow the manufacturer-specific prompts to measure the standardization samples. Most systems require at least two measurements per standard to establish the new calibration curve.
Validate with Control Samples: After completing the Type Standardization, immediately measure qualified control samples to verify the improved accuracy. Document these validation results for quality records.
Analyze Unknown Samples: Proceed with measuring your unknown samples while the instrument remains in the standardized state. For optimal results, run Type Standardization just before analyzing samples of a specific alloy type [8].
Critical Methodological Considerations
Several critical factors must be addressed to ensure the validity of the Type Standardization process. The procedure is alloy-specific, meaning each distinct alloy composition requires its own Type Standardization [1]. Furthermore, Type Standardization is only valid for correcting unknown materials that are similar in composition to the standardization sample [1] [8]. Never employ this method to correct for unusually high systematic deviations when analyzing fundamentally different materials. The resulting calibration remains specific to that sample type only, requiring different Type Standardizations for every different alloy or composition you need to measure [1].
Materials and Equipment Specifications
Research Reagent Solutions
The following materials are essential for executing a proper Type Standardization procedure:
Table 2: Essential Research Reagents and Materials
| Material/Reagent | Specification | Function in Procedure |
|---|---|---|
| Certified Reference Materials (CRMs) | Matrix-matched, certified values [7] [38] | Establishes traceable baseline calibration |
| Type Standardization Samples | Homogeneous, composition-matched to unknowns [1] | Creates specific calibration adjustments |
| Control Samples | Proven reliability, similar to production samples [1] [7] | Verifies standardization performance |
| Purge Gas | High purity (Ar or N₂) [37] | Maintains optical path clarity |
| Sample Preparation Supplies | Appropriate abrasives, cleaning solvents [1] | Ensures consistent sample presentation |
Quality Assurance and Validation
Performance Monitoring and Documentation
Robust quality assurance measures are essential for maintaining standardization integrity. Implement daily control samples to monitor spectrometer performance and detect early signs of drift [8]. Maintain comprehensive records of all Type Standardization procedures, including sample identifiers, measurement dates, results from validation checks, and operator information. For laboratories operating under accredited standards such as DIN EN ISO/IEC 17025, these records are mandatory for audit compliance [38].
Statistical process control represents the most effective approach for monitoring instrument stability. Record calibration values obtained with both recalibration samples and control samples, then evaluate them using statistical methods [7]. This approach provides insight into operational safety, actual instrument stability, and optimal recalibration frequency, ultimately conserving valuable reference materials.
Troubleshooting and Limitations
Addressing Common Implementation Challenges
Despite careful execution, analysts may encounter specific challenges during Type Standardization:
- Persistent Deviations: If accuracy deviations continue after Type Standardization, verify that control samples perfectly match the unknown sample matrix in both composition and physical structure [8].
- High Systematic Errors: Type Standardization is not appropriate for correcting major systematic deviations; instead, perform a complete instrument recalibration [1].
- Limited Applicability: Remember that Type Standardization provides a localized correction specific to a single alloy type and cannot replace comprehensive calibration [1].
The procedure's fundamental limitation lies in its narrow scope of application. Type Standardization should be viewed as a precision refinement tool rather than a general correction method, making it most valuable for high-volume analysis of specific alloy types where maximal accuracy is required.
Workflow Visualization
The following workflow diagram illustrates the logical sequence and decision points in the Type Standardization procedure:
This workflow emphasizes the sequential nature of Type Standardization, where each step establishes the foundation for the next. The process begins with fundamental calibration verification and progresses through sample selection, procedure execution, and final validation, creating a comprehensive approach to measurement refinement.
Optical Emission Spectrometry (OES) is an industry-standard analytical technique for determining the elemental composition of metals and alloys, widely used in quality and process control within metallurgical facilities [19]. The technique works by generating a localized plasma on the sample surface via an electrical spark, causing the material to vaporize and emit element-specific light in the ultraviolet and visible ranges [19]. The fundamental principle behind type standardization recognizes that despite a successful initial calibration using certified reference materials (CRMs), analytical accuracy can remain compromised for specific sample types. This occurs particularly when analyzing exotic alloys that strongly deviate from the matrix material of the CRMs, or when the synthetic manufacturing process of CRMs results in a microstructure that does not correspond to that of the production samples [8].
Type standardization serves as a supplementary correction procedure applied after the fundamental calibration to fine-tune the analytical results for a specific alloy type or sample form. It is not a replacement for the basic calibration but rather a precision-enhancement technique that accounts for matrix effects and structural differences that initial calibration cannot fully address [1] [8]. This application note provides detailed protocols for the correct application of type standardization and the subsequent analysis of unknown samples, ensuring researchers can maximize analytical accuracy within their specific research contexts.
When to Apply Type Standardization
Indications for Type Standardization
Type standardization should be implemented when specific analytical challenges persist despite the instrument demonstrating successful calibration and passing routine quality control checks. The decision to perform type standardization should be based on the following technical indicators:
- Consistent Deviations with Specific Alloys: When measurements of control samples with known composition consistently show statistically significant deviations for particular alloy types, despite the instrument being in calibration [8].
- Exotic or Specialized Alloys: When analyzing alloys with compositions that deviate strongly from the matrix materials used in the available CRMs [1] [8].
- Microstructural Mismatch: When the microstructure of the CRM does not match that of the production samples due to differences in solidification, heat treatment, or processing history [8].
- Demanding Accuracy Requirements: When the research or quality control requirements demand a higher level of accuracy than what the standard calibration provides [8].
Prerequisites for Type Standardization
Prior to initiating type standardization, researchers must verify the following conditions:
- The OES instrument has a valid and recent basic calibration using appropriate CRMs [1].
- The instrument is in optimal technical condition, with no mechanical, optical, or electrical issues affecting performance.
- Sufficient quantities of representative reference materials are available for the specific alloy type being standardized.
- The operator understands that the type standardization correction will only be valid for unknown samples that are compositionally similar to the standardization sample [1] [8].
Table 1: Decision Matrix for Type Standardization Application
| Situation | Recommended Action | Expected Accuracy Improvement |
|---|---|---|
| Deviations across all sample types | Recalibrate with CRMs | High |
| Deviations only with specific alloys | Perform Type Standardization | High for similar materials |
| Minor inaccuracies with control samples | Check instrument status, then consider Type Standardization | Moderate |
| Analyzing materials with significantly different composition | Not recommended; perform separate calibrations | None or negative |
Experimental Protocols for Type Standardization
Materials and Equipment Requirements
The following research-grade reagents and materials are essential for performing a valid type standardization procedure:
Table 2: Essential Research Reagents and Materials for Type Standardization
| Item | Specification | Function | Quality Verification |
|---|---|---|---|
| Standardization Samples | Homogeneous, composition close to unknown samples | Provides reference values for correction | Certified or proven reliable specimens |
| Certified Reference Materials (CRMs) | Certified for elemental composition | Verifies basic calibration status | Traceable to national standards |
| Control Samples | Similar to production samples composition | Monitors instrument drift | Determined composition linked to calibration |
| Sample Preparation Equipment | Grinding discs, milling machines | Creates uniform, contamination-free surface | Appropriate for material hardness |
Step-by-Step Type Standardization Protocol
- Verify Basic Calibration Status: Confirm the OES instrument has a recent calibration using CRMs. Measure a control sample to ensure the instrument is within specified tolerance limits before proceeding [7].
- Prepare Standardization Samples: Select at least one reference material with composition very close to the unknown samples to be analyzed. Prepare the sample surface using standardized preparation techniques (grinding, milling) to ensure a clean, uniform analysis surface [1] [8].
- Perform Preliminary Measurements: Spark the standardization sample multiple times (recommended minimum: 3 measurements) to establish a baseline measurement value. Ensure stable spark conditions and consistent sample presentation.
- Initiate Type Standardization Procedure: Access the type standardization function in the instrument software. The specific navigation path varies by manufacturer but is typically found within the calibration or method adjustment menus.
- Input Certified Values: Enter the certified or known composition values for the standardization sample when prompted by the software.
- Execute Standardization: The instrument calculates correction factors based on the difference between measured and certified values. This creates a type-specific adjustment that will be applied to future measurements of similar materials.
- Verify Standardization Effectiveness: Measure the standardization sample again to confirm the corrected values now match the certified values within acceptable tolerances.
- Document the Procedure: Record all standardization parameters, including date, standardization sample identification, measured values before and after standardization, and the operator's name.
Workflow for Analysis of Unknown Samples Post-Standardization
The following diagram illustrates the complete workflow for analyzing unknown samples after performing type standardization, highlighting critical decision points and quality control checks:
Diagram 1: Workflow for analyzing unknown samples after type standardization. Critical decision points (diamonds) determine the analytical path based on instrument status and sample characteristics.
Data Analysis and Quality Assurance
Validation of Standardization Effectiveness
Following type standardization and analysis of unknown samples, researchers must implement rigorous validation procedures to ensure analytical accuracy:
- Control Sample Verification: Analyze a control sample of known composition that is similar to, but distinct from, the standardization sample. The measured values should fall within the accepted tolerance limits of the known composition [7].
- Statistical Process Control: Monitor the analytical results over time using control charts to detect any drift or systematic errors that might develop after standardization [7].
- Uncertainty Calculation: Determine measurement uncertainty using established protocols such as the top-down method described in the Nordtest report TR537, which accounts for sample variables and preparation methods [7].
Table 3: Troubleshooting Guide for Post-Standardization Analysis
| Issue | Potential Causes | Corrective Actions |
|---|---|---|
| Inconsistent results across similar samples | Improper sample preparation, insufficient standardization sample similarity | Standardize sample preparation; verify standardization sample representativeness |
| Gradual deviation from expected values over time | Instrument drift, environmental changes, electrode degradation | Perform regular drift checks; monitor environmental conditions; replace consumables [1] |
| Large systematic errors | Incorrect certified values in standardization sample, major instrument malfunction | Verify standardization sample certification; perform full instrument diagnostic |
| Poor precision in replicate analyses | Unstable spark conditions, sample heterogeneity, instrument instability | Check spark stand integrity; ensure sample homogeneity; verify instrument stability |
Limitations and Scope of Type Standardization
Researchers must recognize the fundamental limitations of type standardization to avoid misapplication:
- Narrow Applicability: Type standardization corrections are only valid for unknown samples that are compositionally similar to the standardization sample used in the procedure [1] [8].
- Not a Substitute for Calibration: Type standardization cannot correct for fundamental calibration errors or significant instrument malfunctions [8].
- Temporary Correction: The type standardization remains in effect until the instrument is recalibrated or a new type standardization is performed for a different material [1].
- Error Propagation: If the standardization sample itself has certification errors or is unrepresentative, these errors will propagate to all subsequent analyses using that standardization.
The application of type standardization in OES analysis represents a powerful precision-enhancement technique when implemented correctly following the protocols outlined in this document. By understanding the specific conditions under which type standardization is appropriate, following the step-by-step experimental protocol, and implementing rigorous quality assurance measures, researchers can significantly improve analytical accuracy for specific sample types. The critical success factor remains the judicious application of this technique only to unknown samples that share compositional similarity with the standardization materials, while maintaining comprehensive documentation of all standardization procedures and results. When implemented within these parameters, type standardization serves as an invaluable tool for advancing research accuracy in metallurgical analysis and materials characterization.
Optical Emission Spectrometry (OES) is an industry-standard analytical solution for metallurgical applications, widely used for the analysis of a vast range of metals and alloys [19]. This technique relies on generating a localized plasma on the sample surface through a spark, which causes the material to emit element-specific light; the spectrometer's detector then measures the intensities of these spectral lines [7] [1]. However, because OES is a relative measurement technique rather than an absolute one, it depends critically on calibration to convert measured light intensities into meaningful concentration data [1]. The initial calibration, performed using Certified Reference Materials (CRMs), establishes the fundamental relationship between intensity and concentration for each element [7].
Type Standardization emerges as a crucial secondary calibration procedure designed to correct for specific analytical deviations that persist after the basic calibration. It functions as a fine-tuning process to enhance accuracy for particular sample types but operates within well-defined boundaries [8] [1]. This application note delineates the critical limitations and operational scope of Type Standardization, providing researchers and scientists with a framework for its judicious application within rigorous analytical methodologies. Understanding these constraints is paramount for ensuring data integrity in quality control, materials research, and pharmaceutical development where metallic impurities are of concern.
Fundamental Constraints of the Type Standardization Procedure
Type Standardization is a powerful corrective tool, but its efficacy is bounded by several inherent constraints. These limitations must be thoroughly comprehended to prevent misapplication and ensure the validity of analytical results.
Matrix Specificity and the "Similarity" Requirement
The most significant limitation of Type Standardization is its strict dependence on sample matrix similarity. The procedure is only valid for correcting results from unknown materials that share a nearly identical composition with the standardization sample [8] [1].
- Narrow Applicability Scope: A Type Standardization performed for one specific alloy grade (e.g., 304 Stainless Steel) is not applicable to a different alloy grade (e.g., 316 Stainless Steel) or a different material class (e.g., an aluminum alloy) [8]. The correction factors derived are matrix-specific.
- Condition for Use: The process should be executed just prior to analyzing one or more samples of a specific alloy type. This temporal proximity helps minimize the impact of instrumental drift on the fine-tuned calibration [8].
- Not a Global Correction: It is critically important to understand that Type Standardization cannot be utilized as a universal correction technique for materials with significantly divergent chemical compositions. Its very name, Type Standardization, underscores its limited, type-specific scope [8].
Inability to Correct for Fundamental Defects
Type Standardization is designed to address minor deviations in the calibration curve. It cannot compensate for underlying instrumental problems or sample-related issues.
- Underlying Instrument Status: The procedure cannot rectify accuracy problems stemming from an analyzer's poor fundamental condition. Requesting a level of accuracy that surpasses the instrument's inherent capability, as defined by its base calibration, is a misuse of the technique [8].
- Sample Preparation Flaws: Imperfections in sample preparation, such as inadequate surface grinding, which can introduce contamination or alter the spark characteristics, are not corrected by Type Standardization.
- Severe Spectral Interferences: While it can offer minor adjustments, Type Standardization is not a substitute for proper spectral line selection or advanced inter-element correction models that address significant line overlaps [20].
Dependence on a Valid Baseline Calibration
Type Standardization is not a standalone process or an alternative to a fundamental calibration. Its success is entirely contingent upon a stable and accurate initial calibration performed with CRMs.
- Prerequisite Calibration Check: Before initiating a Type Standardization, the operator must verify that the OES analyzer has achieved an optimal level of accuracy from its basic calibration with CRMs [8]. The foundational calibration must be sound.
- Amplification of Baseline Errors: Attempting Type Standardization on a poorly calibrated instrument can propagate or even amplify existing inaccuracies, leading to systematically erroneous results across all subsequent analyses of that sample type.
Statistical and Operational Limitations
The procedure is subject to practical constraints related to statistical reliability and operational workflow.
- Requirement for Proven Reliable Specimens: The accuracy of the Type Standardization is directly dependent on the quality and representativeness of the reference material or "proven reliable specimen" used for the procedure [1]. This sample must be homogenous and its composition must be known with a high degree of certainty.
- Increased Workflow Complexity: Maintaining multiple type standardizations for various alloys increases the complexity of laboratory management. Each standardization must be carefully tracked and applied only to its designated sample type to avoid cross-contamination of results.
- Limited Diagnostic Capability: Relying on Type Standardization to correct persistent deviations can mask gradual instrumental drift or the onset of component failure, potentially delaying necessary maintenance or troubleshooting.
Table 1: Summary of Critical Limitations of Type Standardization
| Limitation Category | Specific Constraint | Consequence of Misapplication |
|---|---|---|
| Matrix Specificity | Valid only for unknown materials similar in composition to the standardization sample [8] [1]. | Introduction of significant systematic errors in analyses of dissimilar materials. |
| Corrective Scope | Cannot correct for fundamental instrument problems, poor sample preparation, or major spectral interferences [8]. | Inaccurate results and potential oversight of required instrument maintenance. |
| Calibration Dependence | Requires a valid and recent base calibration as a prerequisite [8]. | Amplification of baseline inaccuracies, compromising all results. |
| Operational Complexity | Requires a separate standardization for each distinct alloy type or composition. | Increased workload, risk of applying the wrong standardization, and data management challenges. |
Experimental Protocols for Scope Validation
To empirically demonstrate the boundaries of Type Standardization, the following experimental protocols can be employed. These methodologies allow researchers to validate its scope and confirm the necessity of the procedure before implementation.
Protocol 1: Establishing Baseline Calibration with CRMs
1. Objective: To establish a fundamental calibration curve with certified reference materials, forming the benchmark against which Type Standardization will be evaluated. 2. Materials & Reagents: * OES Spectrometer with calibrated spark source and optical system. * Suite of at least 5-6 Certified Reference Materials (CRMs) covering the expected concentration ranges for all elements of interest [7]. * Sample preparation equipment (e.g., surface grinder or milling machine). 3. Methodology: * Prepare the surface of each CRM according to the instrument manufacturer's specifications (e.g., grinding to a fine finish). * Set up the analytical method on the OES spectrometer, defining the analytical lines and measurement conditions. * Analyze each CRM repeatedly (e.g., 5-10 sparks) to establish a stable intensity reading. * Allow the instrument software to construct the calibration curve for each element using the known concentrations and measured intensities. The statistical reliability of the curve should be monitored, aiming for an uncertainty within ±2SR, where SR is the statistical reliability calculated from repeated measurements [7]. * Validate the baseline calibration by analyzing a separate, known CRM not used in the calibration set. Report percent recovery for all elements.
Protocol 2: Assessing the Need for Type Standardization
1. Objective: To determine whether deviations in accuracy necessitate a Type Standardization. 2. Materials & Reagents: * OES Spectrometer with a validated baseline calibration (from Protocol 1). * Control Samples or "proven reliable specimens" that are compositionally similar to production samples [1]. 3. Methodology: * Aspirate or spark the control sample a minimum of ten times under repeatability conditions [1]. * Calculate the average concentration and standard deviation for each element from these measurements. * Compare the average measured concentration against the accepted reference value for the control sample. * Determine if the observed deviations are consistent and exceed the predefined acceptance criteria for the analytical method. Type Standardization should only be considered if significant, systematic deviations are observed for a specific sample type, and all other sources of error (e.g., sample prep, instrument stability) have been ruled out.
Protocol 3: Executing a Type Standardization
1. Objective: To perform a Type Standardization to improve accuracy for a specific, well-defined sample type. 2. Materials & Reagents: * OES Spectrometer with a valid and recent baseline calibration. * A single, homogenous "standardization sample" of known composition that is virtually identical to the unknown production samples to be analyzed [8] [1]. 3. Methodology: * Ensure the baseline calibration is stable and has been checked immediately prior to this procedure. * Introduce the standardization sample to the spectrometer. * Initiate the Type Standardization routine within the instrument software. This process typically involves measuring the standardization sample and allowing the software to calculate small, additive or multiplicative correction factors for each element's calibration curve. * Once completed, the new standardization will be stored and must be selected whenever analyzing the specific sample type for which it was created. * Critical Verification Step: Analyze a second, independently certified sample of the same type to verify the effectiveness and accuracy of the Type Standardization. Do not use the standardization sample itself for verification.
Table 2: Essential Research Reagent Solutions for OES Calibration
| Reagent / Material | Function in Calibration & Standardization | Critical Specifications |
|---|---|---|
| Certified Reference Materials (CRMs) | To establish the primary, instrument-wide calibration curves by providing known intensity-concentration relationships for a wide range of elements [7]. | Certificate of traceability, documented uncertainty, matrix-matched to general sample type. |
| Type Standardization Sample | To fine-tune the existing calibration for a very specific alloy composition, correcting for minor deviations not addressed by the broad CRM calibration [8] [1]. | Composition nearly identical to production samples; homogeneity; proven reliability. |
| Control Samples | To monitor instrument performance and calibration stability over time, and to identify the need for recalibration or Type Standardization [7] [1]. | Similar composition to routine samples; stable and homogenous; available in large quantity. |
| Wavelength Calibration Solution | To calibrate the wavelength alignment of the polychromator, ensuring spectral lines are measured at the correct position [37]. | Contains specific elements with well-defined emission lines; high purity. |
Workflow Visualization: Applying Type Standardization
The following diagram illustrates the logical decision process for determining when Type Standardization is an appropriate and valid corrective action, highlighting its position within the overall OES calibration hierarchy.
Diagram 1: OES Calibration and Type Standardization Decision Workflow. This chart outlines the process for identifying when Type Standardization is a suitable corrective action, emphasizing its limited scope of application.
Type Standardization is a precise tool with a defined and narrow purpose within OES spectrometry. Its primary value lies in its ability to correct for small, systematic deviations observed in specific, well-characterized sample types, provided the underlying instrumental calibration is sound and stable. However, it is not a panacea for analytical inaccuracy. Researchers and scientists must recognize that its application is strictly bounded by the critical limitations of matrix specificity, dependence on baseline calibration, and inability to rectify fundamental instrument or method flaws. A rigorous approach, involving initial calibration with high-quality CRMs, ongoing verification with control samples, and a clear understanding of this protocol's scope, is essential for leveraging Type Standardization effectively to achieve and maintain top analytical accuracy without compromising data integrity.
Advanced Troubleshooting: Solving Persistent Accuracy Deviations in OES Analysis
In Optical Emission Spectrometry (OES), the accuracy of elemental analysis is paramount, particularly in regulated environments such as pharmaceutical development where compliance with standards like USP 〈233〉 for elemental impurities is required [39]. A fundamental challenge for analysts lies in determining the root cause of inaccurate results: does the error originate from the instrument itself or from the characteristics of the sample? Misdiagnosis can lead to costly and time-consuming corrective actions that fail to resolve the underlying issue. This application note provides a structured framework and detailed protocols to help researchers, scientists, and drug development professionals systematically diagnose error sources, differentiating between instrument-related failures and sample-related anomalies. The procedures are contextualized within advanced calibration strategies, including Type Standardization, to ensure data integrity for critical quality assessments.
Theoretical Background: Understanding Error Types
In spectroscopic measurements, accuracy is defined as the closeness of a measured value to its expected value and is governed by two factors: precision (the repeatability of measurements) and trueness (the agreement between the mean of measurements and the expected value) [40]. Errors that compromise accuracy can be categorized into three primary types:
- Gross Errors: These are spurious errors resulting from process failures, such as using an incorrect measurement routine, analyzing a sample with cavities in the measurement area, or sample contamination during preparation. They are typically obvious and can be avoided through strict adherence to procedure and training [40].
- Systematic Errors: These errors cause a consistent offset in results and are related to the trueness of the mean. They often stem from equipment issues like poor calibration, worn parts, or inadequate maintenance. Systematic errors can be measured and corrected for using a correction factor [40].
- Random Errors: These unpredictable fluctuations affect measurement precision and can arise from sample inhomogeneity, minor environmental changes, or the inherent uncertainty of the reference standards. They are estimated statistically and minimized through robust procedures and well-maintained equipment [40].
The following diagram illustrates the logical decision process for diagnosing the root cause of an OES error, guiding the analyst through key investigative steps.
Diagnostic Tables for Error Source Identification
The following tables consolidate key symptoms, causes, and corrective actions to facilitate rapid diagnosis.
Table 1: Diagnosing Instrument Status Errors
| Error Symptom | Potential Cause | Corrective Action |
|---|---|---|
| Calibration failures across all wavelengths [41] | Incorrect uptake delay time; Worn pump tubing; Loose tube connections; Blocked nebulizer | Increase uptake delay for longer tubing; Check/replace peristaltic pump tubing; Inspect and secure all connections; Clean or unblock nebulizer [41] |
| Wavelength calibration failure [41] | Polychromator temperature instability; Plasma not lit; No recent detector calibration | Allow Peltier cooler to stabilize; Ensure plasma is ignited for wavelength calibration; Perform detector (dark current) calibration first [41] |
| Poor precision (%RSD > 2-3%) [42] | Unstable sample delivery; Worn peristaltic pump tubing; Uneven spray chamber draining | Check pump speed consistency; Replace worn tubing; Ensure spray chamber drains evenly [42] |
| Signal drift over time [1] [8] | Instrument sensitivity drift; Environmental parameter changes; Aging components | Perform regular recalibration; Use control samples to monitor drift; Implement Type Standardization if needed [1] [8] |
| Low signal intensity for all analytes [41] | Blocked torch injector tube; Blocked nebulizer; Nebulizer gas leak | Clean the torch injector tube; Check nebulizer backpressure and clean if blocked; Reconnect or replace nebulizer gas line [41] |
| Orange glow in plasma central channel [42] | High dissolved solids content in sample | Use a matrix-matched calibration; Dilute sample if possible; Use a specialized sample introduction system [42] |
Table 2: Diagnosing Sample Characteristics Errors
| Error Symptom | Potential Cause | Corrective Action |
|---|---|---|
| Calibration failure for specific wavelengths [41] | Spectral interferences; Chemically unstable standards; Contaminated blank | Check for and select alternative analytical lines; Prepare fresh standard solutions; Prepare a new, uncontaminated blank [41] |
| Unstable signals for elements like Al, Fe [42] | Colloid formation (e.g., hydroxides) at non-optimal pH | Stabilize elements in a more acidic environment (lower pH) [42] |
| Inaccurate results despite valid calibration [8] | Sample matrix deviates strongly from CRM matrix; Sample structure differs from synthetic CRM | Perform Type Standardization using a reference material very close to the sample composition [8] |
| Poor surface repeatability in spark OES [43] | Improper sample surface preparation; Surface too rough or polished like a mirror; Cracks in sample | Re-prepare sample surface to be flat using a vertical grinder; Avoid mirror-like finishes; Ensure sample is representative and free of defects [43] |
| Internal standard suppression in ICP-MS (<75% recovery) [42] | High matrix load causing signal suppression | Dilute sample and re-analyze; Use argon gas dilution; Condition interface cones with a dummy sample for 30 mins [42] |
| Contamination and elevated blanks [42] [44] | Impurities from sample vials/caps; Contamination from laboratory environment | Rinse vials and caps with dilute nitric acid prior to use; Clean/condition peristaltic pump tubing with acidic solution [42] |
Table 3: The Scientist's Toolkit: Essential Research Reagents & Materials
| Item | Function & Importance in OES Analysis |
|---|---|
| Certified Reference Materials (CRMs) | Essential for initial calibration and verifying analytical accuracy. Provides a known benchmark to quantify elemental concentrations [1]. |
| Control Samples | Samples of known composition, similar to production samples, used to monitor instrument stability and detect drift between recalibrations [1]. |
| Type Standardization Samples | Reference materials with a composition and structure exceptionally close to the specific sample alloy under investigation. Used for fine-tuning calibration to achieve top accuracy for that specific material type [8]. |
| High-Purity Argon | The plasma gas. Its purity is critical, as water vapor or impurities can absorb spectral lines and cause unstable results, particularly in the far UV region [43]. |
| High-Purity Acids & Reagents | Used for sample preparation, digestion, and dilution. Essential for avoiding unintended contamination that leads to elevated blanks and inaccurate results [42] [44]. |
| Intralipid Phantom | A liquid phantom used for calibrating and validating the performance of reflectance and fluorescence spectroscopy systems, ensuring accurate determination of optical properties [45]. |
Detailed Experimental Protocols
Protocol 1: Systematic Diagnosis of Instrument Calibration Failure
This protocol provides a step-by-step methodology to troubleshoot a complete calibration failure, as commonly encountered in ICP-OES operation [41].
1. Initial Setup Verification:
- Ensure the plasma is ignited and stable for a wavelength calibration [41].
- Confirm the Peltier cooler has reached its set temperature and the water chiller is operational [41].
- Verify that a detector (dark current) calibration has been performed recently, as it is a prerequisite for wavelength calibration [41].
2. Sample Introduction System Check:
- Uptake Delay Time: On the instrument software's Conditions page, verify the uptake delay time is sufficient for the sample to travel from the autosampler to the spray chamber. Increase the time if tubing length has been extended or pump rate decreased [41].
- Pump Tubing: Visually inspect the sample and drain tubing for signs of wear, cracking, or perishing. Replace if necessary. Ensure all tubing connections are secure and not loose or detached [41].
- Nebulizer Backpressure Test: Run the instrument's nebulizer backpressure test.
- A high backpressure indicates a blockage. Follow manufacturer instructions to carefully clean the nebulizer [41].
- A low backpressure suggests a leak in the connection between the nebulizer and the gas line. Reconnect the nebulizer and retest. Replace the gas line and fitting if the issue persists [41].
3. Torch and Spray Chamber Inspection:
- Injector Tube: Check the innermost tube of the torch for deposits or blockage, which would decrease signal intensity. Clean the torch according to the manufacturer's recommended procedure [41].
- Spray Chamber: Meticulously clean the spray chamber to remove any contamination from previous high-concentration samples that could cause memory effects or calibration instability [41].
Protocol 2: Evaluating and Mitigating Sample-Induced Errors
This protocol outlines procedures to identify and address errors originating from the sample itself.
1. Investigation of Spectral Interferences and Unstable Elements:
- If specific wavelengths consistently fail calibration, review the selected analytical lines for potential spectral interferences using the software's "Possible Interferences" graph. Switch to an alternative, interference-free line for the element [41].
- For elements known to be unstable (e.g., Al, Fe in certain matrices), verify the stability of the standard solutions. Prepare fresh standards if there is any doubt. For elements that form colloids, ensure the sample is stabilized in a sufficiently acidic medium (e.g., pH < 2 for Al and Fe) to prevent hydroxide formation and signal instability [42].
2. Sample Preparation and Surface Verification (Spark OES):
- Homogenization: Ensure the sample is representative of the whole. For solids like coal, soil, or food, this may require grinding or milling [44].
- Surface Preparation: For spark OES, prepare the sample surface using a vertical grinder to achieve a flat, smooth finish. Avoid both excessive roughness and a mirror-like polish, as both can hinder accurate measurement [43]. The sample must be free of cracks or porosity.
- Contamination Control: To prevent contamination from sample vials and caps—a common source of Al, Zn, Ni, and Cu—rinse all plasticware with dilute nitric acid before use. Similarly, briefly condition new peristaltic pump tubing with a dilute acid solution [42].
Protocol 3: Implementing Type Standardization for Exotic Alloys
When standard calibration with CRMs is insufficient for accuracy, particularly with exotic alloys or when the sample structure differs from synthetic CRMs, Type Standardization is the recommended procedure [8].
1. Pre-requisites and Initial Steps:
- Ensure the instrument has a valid and recent basic calibration using appropriate CRMs. Type Standardization is an additional fine-tuning step, not a replacement for basic calibration [1] [8].
- Obtain one or more reliable reference materials or proven specimens that are exceptionally close in both composition and structure to the unknown samples you need to measure.
2. Standardization Execution:
- Run the Type Standardization procedure as per the manufacturer's instructions, analyzing the high-purity, matrix-matched reference material.
- The software will create a correction specific to that alloy type.
3. Post-Standardization Validation:
- Analyze a control sample of the same alloy type to verify that the results now fall within the expected range.
- Crucial Note: A Type Standardization is only valid for unknown materials that are similar in composition to the standardization sample. It is not a global correction and must be performed for each distinct alloy or composition type you analyze [8].
The workflow for this advanced calibration procedure is outlined below.
Accurately diagnosing the source of error in OES—whether from instrument status or sample characteristics—is a critical skill that ensures data reliability, maintains regulatory compliance, and optimizes laboratory efficiency. By adopting the systematic diagnostic approach and detailed protocols outlined in this application note, researchers and scientists can move beyond guesswork. The implementation of rigorous procedures for instrument maintenance, combined with a deep understanding of sample-specific challenges and advanced calibration techniques like Type Standardization, provides a robust foundation for achieving the highest levels of analytical accuracy in pharmaceutical development and research.
The Role of Daily Control Samples in Ongoing Performance Monitoring
In the context of Optical Emission Spectrometry (OES) calibration and Type Standardization procedures, ongoing performance monitoring represents a critical quality assurance activity. Daily control samples serve as the primary tool for verifying that an OES spectrometer remains within its specified performance parameters between formal calibration or standardization events. For researchers and scientists in drug development, where material composition critically impacts product safety and efficacy, this daily verification provides the essential data needed to confirm analytical method reliability and detect instrumental drift before it compromises analytical results [11] [1]. Within a rigorous quality framework, daily control samples function as an early warning system, enabling proactive maintenance and ensuring that subsequent Type Standardization procedures are built upon a stable instrumental foundation.
The Critical Importance of Daily Control Samples
Defining Daily Control Samples
Daily control samples are certified reference materials (CRMs) or proven reliable specimens with known chemical composition that are analyzed daily to verify spectrometer performance. These samples should be similar in composition to the production materials routinely analyzed [1]. Unlike calibration standards used to establish the analytical curve, control samples serve as independent verification specimens analyzed to confirm that the instrument's calibration remains valid over time.
Relationship to Type Standardization and Calibration
In the hierarchy of OES quality assurance, daily control samples provide the ongoing monitoring that informs decisions about when Type Standardization or recalibration is needed. While standard calibration establishes the fundamental relationship between elemental emission intensity and concentration, and Type Standardization fine-tunes this relationship for specific alloy types, daily control samples provide the continuous performance assessment that ensures both calibration and standardization remain valid [11] [8].
The relationship between these activities can be visualized as a quality pyramid, with fundamental calibration forming the base, Type Standardization providing intermediate refinement for specific applications, and daily control samples serving as the ongoing verification mechanism at the apex of routine quality control.
Detecting Instrument Drift
OES spectrometers are extremely sensitive instruments that measure relative rather than absolute values, making them subject to performance drift over time [11] [1]. This drift represents a slow change in instrument sensitivity that can progressively distort analytical results. Daily control samples enable the quantification of this drift through statistical comparison of current results against established reference values and control limits.
As noted in OES performance guidelines, "The most reliable method of determining whether you need to recalibrate your instrument is by measuring control samples" [1]. The practice of regularly analyzing these samples creates a performance baseline that makes subtle deviations immediately apparent, allowing for corrective action before analytical accuracy is compromised.
Key Parameters Monitored Through Daily Control Samples
Quantitative Performance Metrics
Daily control samples track several critical spectrometer performance parameters. The table below summarizes the key metrics, their significance, and typical acceptance criteria.
Table 1: Key Performance Parameters Monitored with Daily Control Samples
| Parameter | Significance | Measurement Approach | Typical Acceptance Criteria |
|---|---|---|---|
| Elemental Accuracy | Verifies calibration validity for each element | Compare measured values to certified reference values | ±2-3% of reference value for major elements |
| Measurement Precision | Assesses instrument reproducibility | Calculate relative standard deviation (RSD) from multiple measurements | RSD <1-2% for major elements |
| Signal Stability | Detects plasma or optical system degradation | Monitor intensity fluctuations for key wavelengths | Intensity RSD <2% over measurement sequence |
| Detection Capability | Confirms sensitivity for trace elements | Verify measurement of low-concentration elements | Consistent results near method detection limits |
Quality Control Tests for Method Validation
Beyond basic performance metrics, comprehensive quality assessment incorporates additional tests that can be implemented through control sample protocols. These tests, adapted from ICP-OES validation approaches, provide sophisticated monitoring of analytical method performance [31].
Table 2: Quality Control Tests for Method Validation
| QC Test Type | Purpose | Implementation with Control Samples |
|---|---|---|
| Recovery Tests | Verify calibration validity | Analyze control sample with known concentration; calculate percent recovery |
| Paired Sample Tests | Assess method reproducibility | Analyze duplicate control samples; calculate relative percent difference |
| Spike Tests | Identify matrix effects | Spike control sample with analytes; measure recovery efficiency |
| Continuous Tests | Monitor real-time performance | Track internal standard recovery and replicate analysis RSD during runs |
For drug development applications, these quality control tests ensure that spectroscopic methods maintain their validated state, providing regulatory-compliant data for quality assessment of pharmaceutical materials [10].
Implementing a Daily Control Sample Protocol
Sample Selection and Preparation
The foundation of effective daily monitoring lies in selecting appropriate control samples. Optimal control samples should:
- Match Production Materials: Be similar in composition and structure to routine production samples [1]
- Cover Relevant Elements: Contain all elements of interest at appropriate concentration levels
- Exhibit Homogeneity: Demonstrate consistent composition throughout the sample material
- Maintain Stability: Show minimal composition change over time with proper storage
New control samples should be characterized through multiple measurements (at least ten replicates) to establish reference values and acceptable variance ranges before implementation in daily monitoring protocols [1].
Execution and Data Collection Workflow
A standardized workflow ensures consistent execution of daily performance monitoring. The following diagram illustrates the complete protocol from preparation through data interpretation:
Diagram 1: Daily Control Sample Workflow
Data Interpretation and Response Protocol
When control sample results deviate from expected values, a structured investigation protocol ensures appropriate corrective actions. The decision pathway below outlines the systematic response to control sample deviations:
Diagram 2: Deviation Response Protocol
Essential Materials for Daily Performance Monitoring
Successful implementation of daily control sample protocols requires specific materials and reagents. The following table details the essential research reagent solutions and materials needed for robust OES performance monitoring.
Table 3: Essential Research Reagent Solutions for OES Performance Monitoring
| Material/Reagent | Function | Specification Requirements |
|---|---|---|
| Certified Reference Materials (CRMs) | Primary control samples for accuracy verification | Matrix-matched to production samples; certified values for all elements of interest |
| Internal Standard Solutions | Correction for physical interferences and signal drift | High-purity elements (Sc, Y) compatible with analyte wavelengths [31] |
| Calibration Verification Standards | Independent verification of calibration validity | Different source than calibration standards; known concentrations |
| Sample Preparation Reagents | Cleaning and surface preparation | High-purity solvents; non-contaminating abrasives for solid samples |
| Internal Standard Mixing Kit | Automated addition of internal standard | Precision dispensing; compatibility with introduction system [31] |
For pharmaceutical applications requiring compliance with Good Manufacturing Practices (GMP), all reagents and reference materials should be qualified and accompanied by appropriate certification documenting traceability to national or international standards [35] [10].
Integration with Type Standardization Procedures
Daily control sample data directly informs decisions regarding Type Standardization needs. When control sample results consistently show deviations despite being within calibration specifications, Type Standardization may be required to improve accuracy for specific alloy types or material compositions [11] [8].
This relationship is particularly important when:
- Working with exotic alloys that deviate strongly from the matrix material of primary calibration standards
- Analyzing materials where synthetically manufactured CRMs may not correspond to the composition or structure of actual samples
- Persistent deviations are observed for specific elements despite acceptable performance with general calibration verification
In these scenarios, data from daily control samples provides the empirical evidence needed to justify Type Standardization procedures. The control sample results both trigger the standardization need and subsequently verify its effectiveness, creating a closed-loop quality system.
For drug development professionals, this integrated approach ensures that OES spectrometry maintains the accuracy and precision required for pharmaceutical quality assessment, supporting regulatory compliance through documented performance monitoring and structured response to deviations [35] [10].
Optimizing Accuracy for Light and Trace Element Analysis
Optical Emission Spectrometry (OES) is a powerful analytical technique used to determine the elemental composition of a broad range of metals, capable of analyzing elements from hydrogen to uranium in solid metal samples [46]. Achieving high accuracy in light and trace element analysis is particularly critical in pharmaceutical and materials research, where even minute elemental impurities can significantly impact drug safety, material performance, and regulatory compliance. The fundamental principle of OES involves using an electrical spark or arc to excite atoms in a sample, causing them to emit light at characteristic wavelengths [46]. This emitted light is then separated into spectral lines and measured, with the intensity of each wavelength being proportional to the concentration of the corresponding element [46].
The performance of an OES analyzer begins to suffer without frequent maintenance, verification, and recalibration because these instruments use relative rather than absolute measurements [8] [1]. This relative measurement system means that the instrument's detector measures light intensities from the plasma at the sample surface, and software then compares these intensities with those from known elemental concentrations to provide useful concentration information to the user [1]. For researchers and drug development professionals, maintaining optimal accuracy is not merely a technical requirement but a fundamental necessity for producing reliable, reproducible data that meets stringent regulatory standards across pharmaceutical, medical device, and advanced material applications [47].
Method Development for Trace Element Analysis
Key Method Development Considerations
Developing a robust analytical method for trace element analysis using OES requires careful consideration of multiple interdependent parameters. As with many analytical techniques, success in the laboratory depends heavily upon the quality of the methods developed for the specific application work being conducted [48]. Even with modern ICP-OES instruments that provide automated, intuitive operation with parts-per-billion detection limits, developing a well-optimized analytical method can be a labor-intensive and time-consuming process [48]. The quality of any developed method can be assessed by various figures of merit, including accuracy, precision, sensitivity, speed, working range, ease-of-use, and reproducibility [48].
Critical parameters that must be optimized during method development include:
- Analytical wavelengths appropriate for the elements of interest and desired performance attributes
- Spectral and non-spectral interferences that may affect accuracy
- Plasma parameters that influence excitation efficiency
- Data acquisition parameters that balance speed and precision
- Comprehensive method validation to ensure reliability [48]
It is important to note that method development must begin with optimized sample preparation procedures, as any deficiencies in sample preparation—including contamination, loss of volatile elements, incomplete dissolution, creation of an unstable solution, or alteration of elemental species—will produce poor quality data regardless of the robustness of the instrument method [48].
Wavelength Selection and Interference Management
Selecting appropriate analytical wavelengths is a fundamental step in OES method development for trace element analysis. The chosen wavelengths directly impact the method's detection capability, accuracy, and working range. For trace element analysis in pharmaceutical applications or other contexts requiring maximum detection capability, the most sensitive wavelength should typically be chosen for each element, with all potential interferences carefully identified and corrected [48]. A systematic approach to wavelength selection is recommended, beginning with choosing two or three candidate wavelengths for each element of interest (including both analyte elements and any internal standards), collecting wavelength scans for blanks, standards, and representative samples, visually inspecting emission peaks for proper shape and size, reviewing numerical data for intensity and precision, and finally eliminating unsuitable wavelengths [48].
Interference management represents another critical component of method development, particularly when analyzing complex matrices. The three common types of interferences in OES analysis include:
- Spectral interferences occur when emission lines from different elements overlap or when background emission affects the analyte signal
- Physical interferences related to differences in nebulization or transport efficiency between standards and samples
- Chemical interferences resulting from differences in plasma behavior between standards and samples, including easily ionized element (EIE) effects [48]
Table 1: Interference Types and Correction Methods in OES Analysis
| Interference Type | Cause | Correction Methods |
|---|---|---|
| Spectral | Overlapping emission lines from different elements; background emission | Alternative wavelengths; interference correction algorithms; background correction |
| Physical | Differences in viscosity, density, or dissolved solids affecting nebulization/transport | Matrix-matched standards; internal standardization; sample dilution |
| Chemical | Easily ionized elements (EIEs) affecting plasma conditions; molecular species | Ionization buffers; plasma condition optimization; chemical separation |
For trace element analysis, physical interferences can typically be overcome by using internal standards and preparing calibration standards in a matrix that matches the samples [48]. Chemical interferences, particularly from easily ionized elements like sodium, potassium, and lithium, can be corrected by adding an ionization suppressant (such as 1000 ppm cesium solution) to all solutions before analysis [48].
Diagram 1: OES Method Development Workflow for Trace Element Analysis. This workflow outlines the systematic process for developing robust OES methods, from initial wavelength selection through final validation.
Type Standardization for Enhanced Accuracy
Principles and Applications of Type Standardization
Type Standardization represents an advanced calibration procedure that can significantly improve analytical accuracy beyond what is achievable through basic calibration with certified reference materials (CRMs) alone. This technique is particularly valuable when analyzing exotic alloys or when the structure of commercially available CRMs does not adequately match the structure of production samples [8] [1]. Despite regular calibration with multiple CRMs, deviations in accuracy may still occur for several reasons, including significant matrix differences between the CRM and sample material, or the synthetic manufacturing processes used for most CRMs that may not perfectly correspond to the composition or structure of the actual sample being analyzed [8].
The fundamental principle of Type Standardization involves creating a customized calibration using reference materials or proven reliable specimens that closely match the specific sample type being analyzed. It is important to understand that Type Standardization is not an alternative to basic calibration but rather a supplementary procedure performed after initial calibration [1]. This technique is only valid for correcting results from unknown materials that are similar in composition to the standardization sample and should not be used as a global correction method for analyzing materials with significantly different chemical compositions [8]. When properly implemented, Type Standardization fine-tunes the calibration specifically for the analysis of similar materials, effectively correcting for minor matrix effects that basic calibration cannot fully address.
Implementation Protocol for Type Standardization
Implementing Type Standardization requires careful attention to procedural details to ensure meaningful accuracy improvements. The following protocol outlines the key steps for effective Type Standardization:
Verify Basic Calibration: Before beginning Type Standardization, ensure the OES instrument has a recent and valid basic calibration using appropriate certified reference materials. The optimal accuracy of this basic calibration should be confirmed before proceeding [8].
Select Appropriate Standardization Samples: Obtain reference materials or reliable specimens with compositions as close as possible to the samples being analyzed. These materials should be homogeneous, well-characterized, and representative of the production materials in both composition and metallurgical structure [1].
Prepare Fresh Calibration Materials: Have multiple recently prepared and easy-to-measure materials ready for analysis, similar to what would be used for control samples during routine recalibration [8].
Perform Type Standardization Procedure: Run the Type Standardization protocol according to the instrument manufacturer's specifications, analyzing the selected standardization samples. This process should be performed immediately before running samples of the same alloy type to maximize accuracy [8].
Validate Results: After completing Type Standardization, analyze control samples of known composition to verify that the procedure has improved accuracy without introducing additional errors.
Document the Process: Record all details of the Type Standardization, including the samples used, instrument conditions, and validation results, to ensure traceability and reproducibility.
It is crucial to recognize that Type Standardization is material-specific. Different Type Standardizations must be performed for each distinct alloy type or composition class being analyzed [1]. This specificity means that while Type Standardization can significantly improve accuracy for routine analysis of similar materials, it does not replace the need for comprehensive calibration when analyzing diverse sample types.
Diagram 2: Type Standardization Implementation Protocol. This protocol outlines the sequential steps for properly implementing Type Standardization to enhance analytical accuracy for specific sample types.
Comparative Performance of OES Instrumentation
Technical Specifications and Capabilities
The analytical performance of OES systems varies significantly depending on the instrument type and configuration. Understanding these differences is essential for selecting the most appropriate technology for specific trace element analysis applications. Modern OES systems generally fall into two main categories: sequential instruments that measure elements one at a time, and simultaneous instruments that measure multiple elements concurrently [49] [50]. Additionally, technological approaches differ between spark OES systems designed primarily for solid metal samples and inductively coupled plasma OES (ICP-OES) systems that typically analyze liquid samples following digestion [47] [46].
Table 2: Performance Comparison of OES Instrumentation Types for Trace Element Analysis
| Parameter | Sequential OES | Simultaneous OES | ICP-OES | Spark OES |
|---|---|---|---|---|
| Analysis Speed | Slower (sequential element measurement) | Faster (parallel element measurement) [50] | Rapid multi-element analysis [47] | Very fast (3-30 seconds) [46] |
| Detection Limits | Low ppm range | Low ppm range | ppm to ppb range [47] | Varies by element |
| Element Range | B to U [47] | B to U [47] | B to U [47] | Hydrogen to Uranium [46] |
| Sample Throughput | Lower | Higher [49] | High [47] | High [46] |
| Cost Considerations | Lower initial cost [50] | Higher initial cost [50] | High initial and operational cost | Moderate initial cost |
| Ideal Application | Limited element sets; budget-conscious labs | High-throughput laboratories; fixed element sets [50] | Liquid samples; trace/ultra-trace analysis [47] | Solid metal samples; production control [46] |
For pharmaceutical and research applications requiring trace element analysis, ICP-OES often provides the best performance balance, offering detection limits at the ppm level with the ability to analyze a wide range of elements in various sample matrices [47]. The technique utilizes a plasma source reaching temperatures up to 10,000°K to excite atoms and ions, causing them to emit light at characteristic wavelengths that are measured to determine concentrations with high precision and accuracy [47]. ICP-OES is particularly well-suited for pharmaceutical impurity testing according to standards like ICH Q3D, where comprehensive elemental characterization is required for drug products and active pharmaceutical ingredients [47].
Technique Selection Guidance
Selecting the most appropriate OES technique for specific analytical requirements involves considering multiple factors beyond basic performance specifications. For laboratories primarily analyzing solid metal samples, spark OES systems provide direct analysis capability without sample digestion, offering speed advantages for quality control and production environments [46]. The technique's ability to analyze important elements such as carbon, sulfur, phosphorous, boron, and nitrogen—including being currently the only method that can analyze carbon and nitrogen on-site outside the laboratory—makes it invaluable for metallurgical analysis [46].
For laboratories requiring the ultimate in detection capabilities for trace elements, particularly in pharmaceutical applications, the combination of ICP-OES with other techniques may provide the optimal solution. As noted by Lucideon, "Common industry practice pairs ICP-MS for trace/ultra-trace with ICP-OES for majors/minors," highlighting how complementary techniques can be combined to cover a very wide concentration range efficiently [47]. This approach balances the exceptional sensitivity of ICP-MS (parts-per-trillion level) for ultra-trace elements with the robust, high-throughput capabilities of ICP-OES for major and minor elements [47].
Research Reagent Solutions for OES Analysis
Table 3: Essential Research Reagents and Materials for OES Analysis
| Reagent/Material | Function/Purpose | Application Notes |
|---|---|---|
| Certified Reference Materials (CRMs) | Primary calibration; method validation | NIST or governmental body standards; matrix-matched to samples [18] [8] |
| Type Standardization Samples | Enhanced accuracy for specific matrices | Compositionally similar to production samples; well-characterized [8] [1] |
| High-Purity Acids | Sample digestion/dissolution | HNO₃, HCl; trace metal grade to minimize contamination |
| Internal Standard Solutions | Correction for physical interferences | Elements not present in samples; added to all standards and samples [48] |
| Ionization Suppressants | Minimize chemical interferences | High-purity Cs or Li solutions (1000 ppm) for EIE effects [48] |
| Quality Control Materials | Ongoing performance verification | Independent CRMs; different source from calibration standards |
| High-Purity Argon Gas | Plasma generation (ICP-OES) | ≥99.996% purity; consistent supply critical for plasma stability |
The selection and proper use of high-quality reagents and reference materials are fundamental to achieving reliable OES results, particularly for trace element analysis. Certified Reference Materials (CRMs) form the foundation of OES calibration and accuracy verification, with prices for OES calibration standards ranging as low as $125 per sample when sourced from specialized suppliers [18]. Each CRM should come with certification from a calibration lab to guarantee chemical composition accuracy [18]. For optimal calibration, it is recommended to have multiple standards for each material type, with some applications requiring 10-20 steel and stainless steel samples for commonly analyzed materials [18].
For Type Standardization procedures, the selection of appropriate standardization samples is particularly critical. These materials must be very close in composition to the production samples being analyzed and should ideally match in metallurgical structure as well [1]. The standardization samples can be certified reference materials or proven reliable specimens from production, but they must be homogeneous and well-characterized to effectively improve measurement accuracy for specific alloy types or material classes [8] [1].
Optimizing accuracy for light and trace element analysis using OES requires a systematic approach encompassing proper method development, strategic calibration protocols, and appropriate technique selection. The implementation of Type Standardization as a supplementary procedure to basic calibration can significantly enhance measurement accuracy for specific material types, particularly when analyzing exotic alloys or when commercial reference materials do not perfectly match production samples. For pharmaceutical researchers and drug development professionals, these accuracy optimization procedures are not merely analytical exercises but essential components of quality assurance programs that ensure compliance with regulatory standards such as ICH Q3D for elemental impurities.
The continuous evolution of OES technology, including advancements in detection capabilities, automated sample introduction systems, and intelligent software for interference correction, continues to expand the possibilities for trace element analysis. By understanding and implementing the principles outlined in these application notes—from fundamental method development through advanced Type Standardization procedures—researchers can achieve the high levels of accuracy and precision required for critical applications in pharmaceutical development, advanced materials characterization, and regulatory compliance monitoring.
Managing Environmental Factors and Component Degradation
Optical Emission Spectrometry (OES) is an industry-standard analytical technique for determining the elemental composition of metals and alloys, playing a critical role in quality control and material verification [19]. The accuracy and reliability of OES measurements, however, are fundamentally dependent on rigorous calibration procedures that account for environmental factors and component degradation [51] [52]. Within the broader context of Type Standardization research, this application note provides detailed protocols for managing these variables to ensure measurement traceability, data comparability, and long-term instrument stability. The procedures outlined herein are designed to help researchers and scientists establish a standardized foundation for OES spectrometer calibration, which is vital for data integrity in research and drug development where metallic materials and catalysts are utilized.
The Impact of Environmental Conditions on Calibration Stability
Environmental factors can introduce significant measurement uncertainty by affecting both the spectrometer's operation and the sample's physical characteristics. A controlled laboratory environment is essential for achieving reproducible and accurate calibration results [53].
Table 1: Environmental Factors and Control Parameters for OES Calibration
| Environmental Factor | Impact on Calibration & Measurement | Recommended Control Parameter | Control Method |
|---|---|---|---|
| Temperature [53] | Causes dimensional changes in optical components; alters electrical properties of electronics; causes sample/standard expansion/contraction. | Maintain a stable temperature specific to instrument specifications (e.g., 20°C ± 2°C). | Use temperature-controlled laboratories; allow instrument and standards to acclimate. |
| Humidity [53] | High levels cause condensation on optics/electronics, leading to corrosion/short circuits; low levels promote static electricity buildup. | Maintain relative humidity between 40% and 60%. | Use laboratory humidification/dehumidification systems; utilize desiccant materials in instrument cabinets. |
| Vibration & Mechanical Stability [53] | Causes misalignment of sensitive optical components (gratings, mirrors), leading to signal drift and erroneous readings. | Operate in a vibration-free environment. | Use vibration-dampening optical tables or isolation platforms; install instruments away from machinery and heavy traffic. |
| Electromagnetic Interference (EMI) [53] | Introduces signal noise and distortion in electronic components and signal pathways. | Shield from external EMI sources. | Use shielded rooms or Faraday cages; ensure proper instrument grounding; use shielded cables. |
| Stray Light [53] | Ambient light can interfere with optical detection systems, elevating background signal and degrading detection limits. | Control ambient light levels in the laboratory. | Use light-blocking curtains or enclosures; perform calibrations in a dim environment. |
The following diagram illustrates the logical workflow for diagnosing and correcting for environmental instabilities in OES calibration.
Monitoring and Managing Component Degradation
The performance of an OES spectrometer decays over time due to the wear of critical components. A proactive maintenance and monitoring schedule is essential for predictive management of this degradation [51] [52].
Table 2: OES Component Degradation: Signs and Management
| Spectrometer Component | Degradation Mode & Signs | Monitoring Protocol | Corrective Action & Standardization |
|---|---|---|---|
| Electrode [51] | Wear and contamination from spark discharge. Signs: unstable spark, signal intensity drift, poor reproducibility. | Visual inspection; track signal stability and precision of control samples. | Replace electrode per manufacturer schedule or upon performance drop. Re-calibrate after replacement. |
| Optical System (Grating, Mirrors) [51] | Gradual contamination or misalignment. Signs: overall sensitivity loss, resolution decline, wavelength shift. | Regularly measure signal intensity and background for certified reference materials (CRMs). | Schedule professional cleaning/purging and re-alignment. Verify wavelength calibration post-maintenance. |
| Detector (PMT/CCD) [51] | Decreased sensitivity (aging); increased dark noise. Signs: higher detection limits, poor signal-to-noise ratio. | Monitor detector dark current and response for a stable light source over time. | Establish baseline performance; detector replacement may be required for severe degradation. |
| Sample Introduction System | Erosion of nebulizer or clogging of tubing. Signs: signal drift, poor sample uptake, increased particle size. | Monitor sample uptake rate and pressure readings; analyze precision of replicates. | Clean or replace nebulizer and tubing; re-optimize gas flow rates post-maintenance. |
Calibration Standardization Protocols for Matrix Effects and Accuracy
Protocol 1: Establishing Traceable Calibration with Matrix-Matched Standards
Principle: Matrix matching minimizes physicochemical differences between calibration standards and samples, ensuring similar analyte behavior in the plasma and improving accuracy [54].
Materials:
- High-purity acids (e.g., HNO₃, HCl) [54] [55]
- Certified single- or multi-element stock solutions with documented uncertainty
- High-purity water (e.g., 18 MΩ·cm)
- Certified Reference Materials (CRMs) for validation
Procedure:
- Sample Analysis Planning: Determine or analyze the approximate matrix composition of the sample (e.g., major elements, acid type, and concentration).
- Standard Preparation:
- Prepare a serial dilution of stock solutions to create calibration points. The calibration range should bracket the expected analyte concentrations in the samples [56].
- Acid Matching: Match the type and concentration of acid in the calibration standards to that in the digested/processed samples. The tolerance for assay work should be tight (e.g., 5.00% ± 0.05%) [54].
- Elemental Matching: Where possible, add major matrix elements to the calibration standards at concentrations similar to the samples [54] [55].
- Calibration Curve Generation: Run the matrix-matched calibration standards and construct the curve of intensity vs. concentration.
- Validation: Analyze a CRM with a matrix similar to the samples. If the recovery for all elements is within 90-110%, the calibration is acceptable. If not, investigate the preparation or potential interferences.
Protocol 2: Standard Additions Calibration for Complex or Unknown Matrices
Principle: This method corrects for matrix effects by adding known quantities of the analyte to the sample itself, making the calibration and analysis subject to the same interferences [54].
Materials:
- Sample aliquot
- Concentrated analyte stock solution
- All materials from Protocol 1
Procedure:
- Sample Aliquoting: Precisely transfer four or five equal aliquots of the sample into separate volumetric flasks.
- Spiking: Leave one aliquot unspiked (blank). Add increasing known amounts of the analyte stock solution to the other aliquots.
- Dilution: Dilute all aliquots to the same final volume with the appropriate matrix-matching solvent.
- Analysis and Calculation: Analyze all solutions. Plot the measured signal intensity against the concentration of the added analyte. The absolute value of the x-intercept of the linear regression line corresponds to the analyte concentration in the original sample.
Protocol 3: Utilizing Internal Standardization
Principle: An internal standard (IS) is an element added at a known concentration to all samples, blanks, and standards. It corrects for instrument drift and some matrix effects by ratioing the analyte signal to the IS signal [54].
Materials:
- Internal standard solution (e.g., Y, In, Sc, Lu). The IS should not be present in the samples and should have similar excitation/ionization behavior to the analytes.
- Online injection system or precise pipettes.
Procedure:
- IS Addition: Add the internal standard to all calibration standards and samples at a consistent concentration.
- Calibration: Run the calibration standards and construct a calibration curve using the ratio of (analyte signal / IS signal) vs. analyte concentration.
- Sample Analysis: Analyze samples and calculate concentrations based on the (analyte signal / IS signal) ratio and the calibration curve.
The Researcher's Toolkit for OES Calibration
Table 3: Essential Research Reagent Solutions for OES Calibration
| Item | Function / Purpose | Specification / Examples |
|---|---|---|
| Certified Reference Materials (CRMs) | To validate calibration accuracy and method trueness. | NIST-traceable CRMs with matrix similar to samples (e.g., pure metals, alloys) [52]. |
| High-Purity Acids | For sample digestion/dilution and standard preparation to minimize contamination. | Trace metal grade HNO₃, HCl; OmniTrace-grade or equivalent [57] [55]. |
| Internal Standard Solution | To correct for instrumental drift and physical interferences during sample introduction. | Yttrium (Y), Indium (In), Scandium (Sc) at consistent concentration [54]. |
| Matrix-Modifying Reagents | To overwhelm variable native matrix effects with a consistent, dominant matrix. | Ethanol, Tartaric Acid, etc., used in Matrix Overcompensation Calibration (MOC) [57]. |
| Environmental Monitors | To continuously log laboratory conditions (T, RH, pressure) for data integrity. | Calibrated, NIST-traceable data loggers [53]. |
The following workflow integrates the protocols and tools into a complete quality assurance cycle for OES calibration.
When to Seek Accredited Calibration Services (ISO 17025)
ISO/IEC 17025 is the international standard specifying the general requirements for the competence, impartiality, and consistent operation of testing and calibration laboratories [58] [59]. It is applicable to all organizations performing laboratory activities, providing a framework to demonstrate they operate competently and can generate valid results [59]. For researchers utilizing Optical Emission Spectrometry (OES), working with an ISO 17025 accredited calibration laboratory provides assurance of measurement traceability, technical competence, and data integrity, which is crucial for research credibility and reproducibility [58] [60].
Accreditation differs significantly from certification; while ISO 9001 certifies an organization's overall Quality Management System, ISO/IEC 17025 provides accreditation based on a laboratory's specific technical competence, verifying it has the qualified personnel, validated methods, and calibrated equipment necessary to produce precise and technically valid results [60]. This distinction is critical for research applications where measurement data accuracy directly impacts scientific conclusions.
The Role of Accredited Calibration in OES Spectrometry
The Critical Need for Calibration in OES
Optical Emission Spectrometers take relative measurements rather than absolute ones. The instrument's detector measures light intensities from the plasma at the sample surface, and the software compares these spectral line intensities with those of known elemental concentrations to return useful concentration information [1]. Without proper calibration, the measured intensity and wavelength provide limited meaningful data about the sample composition [7].
Spark spectrometers are engineered for extreme sensitivity to detect elements at very low detection limits. This sensitivity makes them subject to environmental parameters over the mid to long term, causing results to 'drift' over time and reducing accuracy [1]. Regular recalibration is therefore essential to bring these results back into alignment and ensure the instrument remains capable of detecting elements with accuracy, particularly in demanding applications such as non-ferrous alloy melt verification or pharmaceutical material analysis [1].
How Accreditation Ensances Research Integrity
ISO/IEC 17025 accreditation provides multiple safeguards for research integrity through its stringent requirements [58]:
- Measurement Traceability: Proving all calibrations are traceable to the International System of Units (SI) through an unbroken chain of comparisons to national or international standards [60].
- Validated Methods: Requiring use of calibration procedures that are validated, appropriate for the task, and clearly documented [58].
- Personnel Competence: Ensuring all staff are properly trained, qualified, and authorized to perform specific tests and calibrations [58] [60].
- Technical Requirements: Addressing equipment specifications, environmental conditions, and testing methodologies that affect result accuracy [58].
For OES spectrometry in research settings, these requirements ensure that calibration procedures meet internationally recognized standards, providing confidence in analytical results and facilitating acceptance of research data across international boundaries [59] [60].
Decision Framework: When Accredited Calibration is Essential
Quantitative Decision Matrix
Table 1: Decision matrix for seeking ISO 17025 accredited calibration
| Research Context | Accreditation Necessity | Key Rationale | Recommended Frequency |
|---|---|---|---|
| Regulatory submissions (FDA, EMA) | Mandatory | Regulatory compliance requirement | Before critical studies & quarterly controls |
| Method validation & transfer studies | Mandatory | Data integrity requirements | Upon method development & transfer |
| Peer-reviewed publication | Highly Recommended | Journal reproducibility standards | Biannually & when drift exceeds limits |
| Routine quality control | Recommended | Internal quality standards | Quarterly control checks |
| Exploratory research | Optional | Preliminary data purposes | Annually or per manufacturer's schedule |
Experimental Protocol: Verification of OES Calibration Status
Objective: To determine whether an OES instrument requires ISO 17025 accredited calibration.
Materials:
- Certified Reference Materials (CRMs) traceable to national standards
- Control samples of known composition similar to test materials
- Statistical process control software or worksheets
Procedure:
- Define Control Limits: Establish acceptable tolerance limits for each element based on research requirements and manufacturer specifications [7].
- Measure Control Samples: Analyze control samples using standard operating procedures. For new samples, measure at least ten times to establish average and standard deviation [1].
- Statistical Evaluation: Calculate the uncertainty of measurement following GUM (Guide to the Expression of Uncertainty in Measurement) or Nordtest TR537 methodologies [7].
- Deviation Assessment: Compare results against certified values. Investigate any results exceeding ±2SR (where SR is statistical reliability) [7].
- Decision Point: If values fall outside acceptable limits or show progressive drift, seek accredited calibration immediately.
Acceptance Criteria: Control sample measurements must remain within statistical control limits with no significant drift trend observed over time.
Implementation Protocols for Accredited OES Calibration
Workflow for Accredited Calibration Procedures
Diagram 1: OES calibration workflow with accreditation
Protocol: Implementing ISO 17025 Accredited OES Calibration
Principle: This protocol describes the complete procedure for obtaining and verifying ISO/IEC 17025 accredited calibration for Optical Emission Spectrometers, ensuring measurement traceability and compliance with research quality standards.
Materials and Reagents:
- Certified Reference Materials (CRMs): Certified for elemental composition with stated uncertainties [7]
- Control Samples/SUS Samples: Homogeneous samples for routine calibration verification [7]
- ICP-OES Wavelength Calibration Solution: Specifically formulated for wavelength calibration (commercial or prepared according to manufacturer specifications) [37]
- Documentation System: For maintaining calibration certificates and quality records
Procedure:
Laboratory Selection and Verification
- Select an ISO/IEC 17025 accredited calibration laboratory [61]
- Verify the laboratory's scope of accreditation specifically includes OES calibration methods relevant to your instrument type and analytical requirements [58]
- Confirm traceability of their reference standards to national metrology institutes [60]
Pre-Calibration Instrument Preparation
- Perform detector calibration (dark current calibration) to correct for detector and electronic background signals [37]
- Purge the polychromator and snout for approximately 20 minutes before starting calibration [37]
- Ensure environmental conditions (temperature, humidity) are within manufacturer specifications
- Stabilize the plasma for approximately 20 minutes (extended if instrument has been offline) [37]
Calibration Execution
- Aspirate calibration solution using manual sample introduction for continuous flow [37]
- Select appropriate calibration mode: default radial, axial, or organic wavelength calibration based on instrument configuration and application needs [37]
- Execute calibration following accredited procedures documented in the laboratory's quality system [58]
- Document all calibration parameters, including date, analyst, instrument conditions, and reference materials used
Post-Calibration Verification
- Analyze control samples of known composition similar to research materials [1]
- Verify calibration by measuring CRMs not used in the calibration process
- Calculate measurement uncertainty for key analytical lines [7]
- Aspirate rinse solution to thoroughly clean the sample introduction system after calibration [37]
Documentation and Quality Assurance
- Obtain ISO 17025 accredited certificate of calibration with evidence of traceability [60]
- Review certificate for completeness, including measurement uncertainties and traceability statements
- File certificate in research quality records system
- Establish schedule for ongoing calibration verification based on instrument usage and criticality of applications [1]
Troubleshooting:
- Failure at low UV wavelengths: Indicates insufficient purge time; rerun after extended purge [37]
- Failure across wide wavelength range: Check sample introduction components or prepare fresh calibration solution [37]
- Progressive drift in control samples: May indicate need for more frequent calibration or instrument service
Essential Research Materials for OES Calibration
Table 2: Essential research reagents and materials for OES calibration
| Material/Reagent | Technical Function | Quality Requirements | Application Context |
|---|---|---|---|
| Certified Reference Materials (CRMs) | Establishes calibration curves for quantitative analysis | Certified values with stated uncertainties; traceable to national standards | Primary calibration; method validation |
| Control Samples | Verifies calibration stability; monitors instrument drift | Homogeneous; composition determined relative to CRMs | Daily/Weekly instrument performance verification |
| Wavelength Calibration Solution | Calibrates polychromator wavelength accuracy | Specific elemental mix for instrument type; stable composition | Initial calibration; periodic wavelength verification |
| Type Standardization Samples | Adjusts for specific matrix effects | Composition closely matched to test materials; proven reliability | Analysis of specific alloy types or specialized materials |
| Calibration Verification Samples | Independent assessment of calibration validity | Different source than calibration materials; certified values | Quality assurance; regulatory compliance |
Incorporating ISO/IEC 17025 accredited calibration services into research practices provides the foundation for measurement credibility in OES spectrometry. The decision framework and implementation protocols outlined in this document offer researchers a systematic approach to maintaining instrument performance that meets international standards for technical competence. Through proper calibration practices, documented traceability, and rigorous verification procedures, research professionals can ensure the integrity of their analytical data throughout the drug development process and scientific investigation.
Validating Performance: How Type Standardization Compares to Other Calibration Strategies
Calibration is a critical step in quantitative analytical chemistry, ensuring the accurate translation of instrument response into analyte concentration. Within optical emission spectrometry (OES), External Calibration (EC) represents the most fundamental approach, while Type Standardization encompasses advanced procedures including matrix-matched calibration, internal standardization, and modern techniques like Multi-Energy Calibration (MEC) designed to correct for matrix effects. This analysis provides a structured comparison of these methodologies, highlighting their principles, applications, and performance in the context of plasma-based OES techniques such as ICP-OES and MIP-OES. The objective is to guide researchers and drug development professionals in selecting and implementing optimal calibration strategies for complex matrices, thereby improving the accuracy and reliability of elemental analysis in pharmaceutical research and quality control.
Principles and Methodologies
External Calibration (EC)
The EC method is the most straightforward calibration strategy. It is termed "external" because the certified pure substances or standard solutions used are external to the sample [62]. The fundamental principle involves establishing a mathematical relationship—typically a linear function (IR = a + bC, where IR is instrument response, a is the y-intercept, b is the slope, and C is analyte concentration)—between the instrument response and known analyte concentrations in a series of standard solutions [62]. This calibration curve is then used to determine unknown analyte concentrations in samples via interpolation.
EC operates on the key assumption that matrix effects are absent or have a negligible impact on the analytical signal, making it suitable for the analysis of simple aqueous solutions or samples where the matrix has been effectively eliminated during preparation [62]. The use of ordinary least-squares (OLS) regression for constructing the calibration curve is recommended only when data is normally distributed and homoscedastic (shows homogeneous variance); otherwise, weighted least-squares (WLS) must be applied to maintain accuracy, particularly at lower concentrations [62].
Type Standardization Procedures
Type Standardization refers to a suite of calibration procedures designed to compensate for matrix effects and improve analytical accuracy where EC falls short.
- Matrix-Matched Calibration (MMC): This method involves preparing calibration standards in a matrix that closely mimics the composition of the sample. By doing so, it corrects for signal enhancement or suppression caused by the sample matrix, ensuring that analyte responses in standards and samples are comparable [63] [62].
- Internal Standardization (IS): IS involves adding a known concentration of a non-analyte element (the internal standard) to all samples, blanks, and calibration standards. The analyte response is then normalized to the response of the internal standard. This effectively corrects for instrumental drift, plasma fluctuations, and sample-specific matrix effects, provided the internal standard is carefully chosen to have physical and chemical properties similar to the analyte [63].
- Multi-Energy Calibration (MEC): A novel calibration strategy, MEC utilizes multiple emission lines (wavelengths) for each element simultaneously instead of relying on a single line [5]. It requires only two calibration solutions per sample. A fundamental advantage is its ability to visually identify and exclude emission lines affected by spectral interferences, which appear as outliers on the calibration plot, thereby improving accuracy in complex matrices [5].
Comparative Performance Analysis
The performance of EC and various Type Standardization methods can be evaluated based on key analytical figures of merit. The following table summarizes a quantitative comparison derived from the analysis of animal feed samples using ICP-OES and MIP-OES [5].
Table 1: Comparative Analytical Performance of External Calibration vs. Multi-Energy Calibration
| Element | Calibration Method | Instrument | Limit of Quantification (LOQ) (mg kg⁻¹) | Recovery (%) |
|---|---|---|---|---|
| Mn | External Calibration (EC) | ICP-OES | 0.4 | Varies, generally lower |
| Multi-Energy Calibration (MEC) | ICP-OES | 0.09 | 80 – 105 | |
| Co | External Calibration (EC) | ICP-OES | 0.4 | Varies, generally lower |
| Multi-Energy Calibration (MEC) | ICP-OES | Data not specified | 80 – 105 | |
| Ca | External Calibration (EC) | ICP-OES | 195 (for K) | Varies, generally lower |
| Multi-Energy Calibration (MEC) | ICP-OES | 31 | 80 – 105 | |
| Fe | External Calibration (EC) | MIP-OES | 607 | Varies, generally lower |
| Multi-Energy Calibration (MEC) | MIP-OES | Data not specified | 80 – 105 | |
| P | External Calibration (EC) | MIP-OES | 607 (for Fe) | Varies, generally lower |
| Multi-Energy Calibration (MEC) | MIP-OES | 354 | 80 – 105 |
The data demonstrates that MEC, as a Type Standardization method, consistently provides superior performance compared to traditional EC. Key improvements include significantly lower Limits of Quantification (LOQs) and analyte recoveries within the ideal 80-105% range, indicating enhanced accuracy and sensitivity for complex matrices like animal feed [5].
Further comparative advantages and limitations are outlined below.
Table 2: Strategic Comparison of Calibration Methods
| Aspect | External Calibration (EC) | Type Standardization (MMC, IS, MEC) |
|---|---|---|
| Complexity & Workflow | Simple and straightforward [62] | More complex; requires additional steps (matrix matching, adding internal standard, multi-line processing) [63] [5] |
| Resource Demand | Lower; requires only analyte standards [62] | Higher; may require matrix-matched standards, internal standard elements, or specialized data processing [63] |
| Matrix Effect Correction | Poor; susceptible to signal suppression/enhancement [62] | Excellent; specifically designed to correct for matrix effects [63] [5] |
| Data Reliability in Complex Matrices | Low to moderate; results can be biased [62] | High; improves accuracy and precision [5] |
| Ideal Application Domain | Simple aqueous solutions, samples with minimal matrix | Complex matrices (e.g., biological fluids, pharmaceuticals, food, environmental samples) [63] [5] [10] |
| Handling of Spectral Interferences | Limited; may require alternative, interference-free lines | Good, especially for MEC, which can identify and exclude affected wavelengths [5] |
Experimental Protocols
Protocol for External Calibration in ICP-OES
This protocol is adapted for the determination of trace elements in digested samples [62] [10].
- Standard Solution Preparation:
- Prepare a multi-element stock standard solution from certified reference materials (CRMs) [10].
- Serially dilute the stock solution with 1% (v/v) high-purity nitric acid to create a calibration curve. A minimum of 6-8 standard concentrations is recommended, bracketing the expected analyte concentration in the samples [62].
- Include a blank solution (1% HNO₃) as the zero-point standard.
- ICP-OES Analysis:
- Establish robust plasma conditions. A measure of robustness (e.g., Mg II (280.270 nm) / Mg I (285.213 nm) ratio) should be ≥ 9.7 [64].
- Introduce the calibration standards, blank, and digested samples into the ICP-OES system.
- Measure the analytical signal (emission intensity) at the selected wavelength for each target element.
- Calibration and Calculation:
- Construct a calibration curve by plotting the net intensity (intensity of standard minus intensity of blank) against the known concentration of each standard.
- Perform linear regression (OLS or WLS) to determine the slope, intercept, and correlation coefficient.
- Interpolate the net intensity of the sample onto the calibration curve to determine the analyte concentration.
Protocol for Multi-Energy Calibration in ICP-OES
This protocol outlines the MEC strategy for the analysis of minerals in animal feed samples [5].
- Calibration and Sample Solution Preparation:
- Prepare only two calibration solutions per sample.
- Solution A: A diluted sample solution. For example, a digested feed sample [5].
- Solution B: The sample solution (same as A) fortified with a known addition of all target analytes.
- ICP-OES Analysis and Data Acquisition:
- Introduce Solutions A and B into the ICP-OES.
- For each target element, simultaneously measure the emission intensity at multiple (n) characteristic wavelengths (atomic and ionic lines).
- Data Processing and Calculation:
- For each of the n wavelengths, calculate the slope of the "mini-calibration" line using the data from the two solutions (A and B).
- Plot the calculated slopes for all wavelengths of a single element. Slopes from wavelengths free of interference will cluster together, while slopes from interfered wavelengths will appear as outliers.
- Discard outlier slopes and use the average of the consistent slopes to calculate the analyte concentration in the original sample, significantly improving accuracy and reliability.
Workflow Visualization
The Scientist's Toolkit: Essential Research Reagents and Materials
The following table details key reagents and materials essential for implementing the discussed calibration strategies in ICP-OES analysis.
Table 3: Essential Research Reagent Solutions for OES Calibration
| Item Name | Function / Purpose | Critical Specifications & Notes |
|---|---|---|
| Single-Element & Multi-Element CRMs | Serve as the primary standards for preparing calibration curves in both EC and Type Standardization [63]. | High-purity, fully NIST-traceable. Inorganic Ventures provides a comprehensive catalog [63]. |
| Internal Standard Solutions | Added to all samples and standards to correct for instrumental drift and matrix effects via signal ratioing [63]. | Element should not be present in samples and should have similar properties to analytes (e.g., Rh, In, Sc, Y) [63] [64]. |
| High-Purity Acids & Solvents | Used for sample digestion, dilution, and preparation of calibration standards to minimize blank contamination [10]. | Trace metal grade, sub-boiling distilled. 1% HNO₃ is a common diluent [10]. |
| Matrix-Matching Reagents | Added to calibration standards to mimic the sample's chemical composition, correcting for non-spectral interferences [63] [62]. | Composition depends on sample type (e.g., organic base for biological samples, easily ionized elements for MMC) [62]. |
| Certified Reference Materials (CRMs) | Used for method validation and verification of analytical accuracy across all calibration methods. | Matrix-matched to the samples being analyzed. |
Synergy and Differences with Matrix-Matched Calibration (MMC)
Matrix-Matched Calibration (MMC) serves as a fundamental calibration strategy in analytical chemistry, designed to compensate for matrix effects that significantly influence analytical response and can detrimentally affect the accuracy, precision, and sensitivity of a method [65]. The core principle of MMC involves preparing calibration standards in a matrix that is identical to or closely mimics the sample matrix, thereby ensuring that the signal produced by the analyte accurately reflects its quantity [65] [62]. This technique is particularly vital for inductively coupled plasma (ICP) spectroscopic techniques, which are highly matrix-dependent [54].
In practical terms, matrix effects can manifest as ionization suppression or enhancement, variations in nebulization efficiency, or changes in plasma temperature [65] [54] [66]. These effects occur because components in the sample matrix, such as acids, salts, or organic compounds, can alter the physical properties of the solution and the behavior of the analyte during excitation and detection [54]. By matching the matrix of the standards to that of the samples, these interferences are minimized, leading to more reliable and accurate quantification, especially for complex samples [54] [62].
Theoretical Foundations and Synergistic Relationships
The Problem of Matrix Effects
Matrix effects present a substantial challenge in quantitative analysis, particularly in techniques like ICP-OES and ICP-MS. In ICP-OES, matrix differences can influence spray chamber efficiency, plasma temperature, and ionization efficiency [65]. High concentrations of dissolved solids or easily ionized elements (EIEs) can cause significant signal suppression or enhancement [25] [54]. For instance, a matrix component that alters nebulization efficiency from 1.0% to 0.8% can cause a relative signal drop of approximately 20% [54]. Furthermore, elements with high ionization potentials can lower plasma temperature, affecting the signal intensity of analytes, particularly those with high excitation potentials [54].
Synergy with Other Calibration and Correction Techniques
MMC does not exist in isolation but often functions synergistically with other calibration methods to enhance analytical accuracy.
Synergy with Internal Standardization (IS): While MMC addresses bulk physical and chemical interferences by matching the overall sample composition, Internal Standardization corrects for more subtle, time-varying fluctuations in instrument response and sample-specific matrix effects. Internal standards are elements not found in the samples that are added at a consistent concentration to all solutions—samples, blanks, and calibration standards [25]. The instrument software then corrects analyte intensities based on the recovery of the internal standard. The selection of an appropriate internal standard is critical; it should behave similarly to the analyte. For example, if an analyte is viewed at an atomic (atom) wavelength, the internal standard should also be an element measured at an atomic line. Conversely, for analytes measured at ionic (ion) wavelengths, an internal standard with an ion line should be selected [25]. This synergistic use of MMC and IS provides a robust framework for compensating for a wide range of interference types [54].
Complementarity with Standard Addition (SA): The Standard Addition method involves adding known quantities of the analyte directly to the sample [65] [62]. This technique is highly effective for correcting matrix effects in complex or unknown sample matrices where creating a perfectly matched standard is impractical [65] [54]. However, SA is labor-intensive, time-consuming, and requires a larger amount of sample compared to external calibration methods [65]. MMC, when feasible, offers a more convenient and high-throughput alternative. A hybrid approach has also been developed for solids analysis via LA-ICP-MS, where a thin layer of analyte is deposited onto the sample surface, effectively using a standard addition principle to create a matrix-matched standard [67].
Foundation for External Calibration (EC): The External Standard method is the most straightforward calibration technique but assumes that matrix effects are absent or negligible [62]. MMC transforms the EC method from a simplistic approach to a highly accurate one by eliminating the core assumption. When calibration standards are matrix-matched to samples, the external calibration curve becomes a reliable tool for quantification, as the matrix-induced biases have been preemptively corrected [62].
The following workflow diagram illustrates the decision-making process for selecting and implementing these synergistic calibration strategies.
Comparative Analysis: MMC vs. Alternative Methods
Understanding the advantages and limitations of MMC relative to other techniques is crucial for method selection. The table below provides a structured comparison.
Table 1: Comparative Analysis of Traditional Calibration Methods
| Method | Key Principle | Advantages | Limitations | Ideal Use Case |
|---|---|---|---|---|
| Matrix-Matched Calibration (MMC) [65] [62] | Calibration standards prepared in a matrix identical to the sample. | - Compensates for a wide range of matrix effects.- High accuracy when properly executed.- Suitable for high-throughput analysis. | - Requires prior knowledge of the sample matrix.- Can be laborious to prepare matched matrices.- May not be feasible for unique or highly variable samples. | Routine analysis of samples with a known, consistent, and reproducible matrix. |
| External Calibration (EC) [62] | Calibration standards prepared in a simple, clean matrix (e.g., dilute acid). | - Simple and fast.- Minimal standard preparation.- Wide linear range. | - Highly susceptible to matrix effects.- Inaccurate results if matrices differ.- Assumes no interferences. | Analysis of simple, clean samples with minimal matrix, or where matrix separation is complete. |
| Standard Addition (SA) [65] [62] | Known amounts of analyte are added directly to the sample aliquot. | - Effectively corrects for matrix effects, even in unknown matrices.- High accuracy for complex samples. | - Labor-intensive and time-consuming.- Requires more sample.- Poorer precision than external calibration. | Analysis of samples with complex, unknown, or variable matrices where MMC is not possible. |
| Internal Standardization (IS) [25] [54] | A reference element is added to all samples and standards to correct for signal fluctuations. | - Corrects for instrument drift and sample introduction variability.- Can correct for some plasma-related matrix effects. | - Requires careful selection of an element not in the sample.- May not correct for all types of interferences (e.g., spectral).- Requires multiple internal standards for multi-analyte analysis. | Used complementarily with EC, MMC, or SA to improve precision and correct for specific matrix effects. |
Detailed Experimental Protocol for Implementing MMC in ICP-OES
This protocol outlines the steps for the accurate determination of trace metals in a complex matrix, such as industrial wastewater, using Matrix-Matched Calibration with ICP-OES.
Research Reagent Solutions and Materials
Table 2: Essential Materials and Reagents for MMC
| Item | Specification/Function |
|---|---|
| ICP-OES Instrument | Equipped with radial and/or axial view plasma, a high-resolution spectrometer, and a peristaltic pump [66]. |
| Single-Element or Multi-Element Stock Standards | High-purity, certified reference materials (CRMs) for target analytes (e.g., Cu, Pb, Cd, Zn) [63]. |
| Internal Standard Solution | A solution containing elements not present in the samples (e.g., Y, Sc, In, Rh). Used to correct for drift and plasma effects [25] [54]. |
| High-Purity Acids | HNO₃, HCl, etc., of trace metal grade. Used for sample preservation and standard preparation [54]. |
| Matrix-Matching Components | High-purity salts or solutions (e.g., NaCl, CaCO₃) used to replicate the high-concentration elemental background of the sample [54]. |
| High-Purity Water | 18 MΩ·cm deionized water. |
Step-by-Step Procedural Workflow
Step 1: Sample Preparation and Matrix Analysis
- Collect wastewater samples and stabilize with high-purity nitric acid (HNO₃) to a pH < 2.
- Perform a semi-quantitative SCAN analysis using ICP-OES to identify the major matrix components (e.g., high levels of sodium, calcium, chloride) and total dissolved solids (TDS) [54].
Step 2: Preparation of Matrix-Matched Stock Solution
- Based on the SCAN analysis results, prepare a concentrated matrix-matching stock solution. For example, if the sample contains ~1000 mg/L Na and ~500 mg/L Ca, prepare a stock solution containing these elements at 10x concentration in the same acid medium (e.g., 2% v/v HNO₃) as the samples [54].
Step 3: Preparation of Calibration Standards
- Prepare a series of calibration standards (e.g., blank, 0.1, 0.5, 1.0, 5.0 mg/L) by diluting multi-element stock standards.
- Crucially, add the matrix-matching stock solution to each calibration standard and the calibration blank to achieve the same final concentration of major matrix components as in the prepared samples (e.g., 1000 mg/L Na, 500 mg/L Ca) [65] [54].
- Match the acid type and concentration exactly between standards and samples [54].
Step 4: Internal Standard Addition
- Add a suitable internal standard (e.g., Yttrium at 1 mg/L) to all solutions: samples, calibration standards, and blanks. This can be done manually via pipetting or automatically using a second channel on the peristaltic pump [25].
- Ensure the internal standard is compatible with the analytes; use an ion line internal standard (e.g., Y 371 nm) for analytes measured at ion lines and an atom line internal standard (e.g., Ge 265 nm) for analytes measured at atom lines [25].
Step 5: Instrumental Analysis and Data Acquisition
- Set up the ICP-OES method, ensuring the internal standard is monitored in the same plasma view (axial or radial) as the analytes [25].
- Optimize instrument parameters (RF power, nebulizer gas flow, auxiliary gas flow) for robust plasma conditions, especially given the high-TDS matrix [66].
- Run the calibration standards to establish the calibration curve. The correlation coefficient (R²) should be >0.995.
- Analyze the samples, ensuring that the internal standard recovery for each sample is within a predefined acceptance criteria (e.g., 80-120%) [25].
Step 6: Data Evaluation and Quality Control
- Investigate any samples with internal standard recoveries outside the acceptable range, as this may indicate incorrect internal standard addition, spectral interference, or extreme matrix effects [25].
- Run a continuing calibration verification (CCV) standard and a blank after the samples to confirm the stability of the calibration throughout the sequence.
Applications and Case Studies Across Industries
MMC finds critical application in diverse fields where matrix complexity threatens analytical accuracy:
- Petroleum Industry: Analysis of trace metals in various oil-based matrices requires meticulously matched standards. Custom standards are available in matrices including mineral oil, diesel fuel, crude oil, and gasoline to compensate for the significant differences in viscosity, carbon content, and volatility that can affect analyte response in the plasma [65].
- Environmental Science: Determining trace metals in mining brines or seawater necessitates standards that contain high concentrations of salts (e.g., Na, K, Ca) to account for ionization interferences and changes in nebulization efficiency [54].
- Food Safety and Biomedicine: The principle of MMC is also applied in LC-MS for organic compound analysis. For example, quantifying contaminants like ochratoxin A in flour requires calibration in a matched flour matrix to correct for ionization suppression effects caused by co-eluting compounds [68]. Similarly, quantitative proteomics uses matrix-matched calibration curves in a relevant biological sample matrix to determine the lower limits of accurate quantification for peptides [69].
- Materials Science: The analysis of solid materials by LA-ICP-MS is hampered by a lack of certified reference materials. A novel approach uses standard addition by spraying analytes onto the sample surface, creating an in-situ matrix-matched standard for accurate quantification [67].
Matrix-Matched Calibration stands as a powerful and often essential strategy for achieving high analytical accuracy in the presence of complex sample matrices. Its synergy with internal standardization and its role as a foundational improvement to external calibration make it a cornerstone of reliable quantitative analysis, particularly in ICP spectroscopy. While the method requires a priori knowledge of the sample composition and careful preparation, its implementation is justified when data quality is paramount. The choice between MMC, standard additions, and other methods ultimately depends on a balance between the known composition of the sample matrix, the required throughput, and the necessary level of analytical accuracy.
Benchmarking Against Accredited Calibration Standards
For researchers utilizing Optical Emission Spectrometry (OES) in critical fields such as pharmaceutical development, the accuracy and traceability of analytical results are paramount. Accredited calibration standards, established within a quality framework defined by international standards like DIN EN ISO/IEC 17025:2018, provide the foundational benchmark for ensuring measurement confidence and regulatory compliance [38]. These standards are not merely reference points; they are part of a rigorously monitored system where the calibration service is regularly audited by an accreditation body, ensuring international recognition of the certificates issued [38].
The process of "benchmarking" an OES spectrometer against these accredited standards is a critical exercise in quantifying the instrument's performance and verifying its analytical validity. For scientific research, particularly when data supports drug development applications, this practice is non-negotiable. It demonstrates a commitment to data integrity and provides a defensible chain of traceability to the International System of Units (SI) [9] [70]. This document outlines the application notes and experimental protocols for performing such benchmarking, contextualized within a broader research thesis on Type Standardization procedures for OES calibration.
The Role of Accredited Calibration in Metrological Traceability
Metrological traceability is the unbroken chain of calibrations linking instrument measurements to recognized reference standards. For OES, this chain typically culminates in Certified Reference Materials (CRMs) whose elemental mass fractions are determined with high accuracy, often by National Metrology Institutes (NMIs) [9]. The production and certification of these monoelemental calibration solutions involve meticulous methodologies, such as the Primary Difference Method (PDM) or direct assay techniques like gravimetric titration, to define the purity of a metal standard with minimal uncertainty [9].
Utilizing standards calibrated by a laboratory accredited under ISO/IEC 17025:2018 integrates your measurements into this globally accepted framework. These laboratories use certified, traceable reference materials from recognized producers (e.g., NIST, BAM) and their processes are independently assessed, providing the highest assurance of quality [38]. This is especially crucial in regulated industries, where audits and compliance with standards like IATF 16949 are mandatory [38].
Experimental Protocol for Benchmarking OES Performance
This protocol describes the procedure for benchmarking the analytical performance of an OES spectrometer using accredited calibration standards and control samples.
Research Reagent Solutions and Essential Materials
The following table details the key materials required for the benchmarking procedure.
Table 1: Essential Research Reagents and Materials for OES Benchmarking
| Item | Function & Importance |
|---|---|
| Accredited Calibration Standards | Certified Reference Materials (CRMs) with a valid certificate from an ISO/IEC 17025 accredited laboratory. These are the primary benchmarks for establishing traceable calibration curves [18] [38]. |
| Control Samples | Stable, homogenous samples of known composition, similar to the materials routinely analyzed. Used to verify the ongoing accuracy of the calibration [1] [8]. |
| High-Purity Nitric Acid | Used for preparing calibration solutions and sample digestion. High purity (e.g., Traceselect grade or purified by sub-boiling distillation) is essential to avoid introducing metallic contaminants [10] [9]. |
| Ultrapure Water | Water with a resistivity of >18 MΩ·cm is required for preparing all solutions to minimize background elemental interference [10] [9]. |
Step-by-Step Benchmarking Workflow
The following diagram illustrates the logical workflow for the benchmarking protocol.
Protocol Steps
- Initial Instrument Calibration: Perform a full calibration of the OES spectrometer using a set of accredited, matrix-matched CRMs. This process establishes the initial correlation between light intensity and elemental concentration [1] [38]. The instrument's detector and wavelength scale should be calibrated as per manufacturer guidelines prior to this step [37].
- Measurement of Control Samples: Aspirate or analyze a control sample of known composition. This sample should be different from the CRMs used for initial calibration but similar to your production or research samples. Measure this control sample at least ten times to gather a robust data set [1].
- Data Analysis: Calculate the average concentration and standard deviation for each element from the replicate measurements.
- Benchmarking Against Certified Values: Compare the calculated average concentration for each element to the certified value of the control sample. Calculate the relative error or deviation.
- Decision Point: Determine if the observed deviations are within the pre-defined acceptable limits for your application. These limits should be based on the required analytical precision and the stated uncertainties of the CRMs.
- Resolution:
- If deviations are acceptable, the instrument is considered benchmarked and calibrated for use.
- If deviations are unacceptable, a root cause analysis must be initiated. For persistent deviations, especially with exotic alloys or when the CRM structure does not match the sample, a Type Standardization procedure may be required as a corrective action to fine-tune the calibration for that specific material type [8].
Quantitative Benchmarking Data Analysis
The following table provides an example structure for compiling and assessing quantitative data from the benchmarking exercise. The "Observed Deviation" is a hypothetical example.
Table 2: Example Benchmarking Data for a Stainless Steel Control Sample
| Element | Certified Value (wt%) | Measured Average (wt%) | Standard Deviation (wt%) | Observed Deviation (%) | Acceptable Limit (±%) | Status |
|---|---|---|---|---|---|---|
| Chromium (Cr) | 18.05 | 18.12 | 0.04 | +0.39 | 1.0 | Pass |
| Nickel (Ni) | 8.12 | 8.23 | 0.05 | +1.35 | 1.5 | Pass |
| Molybdenum (Mo) | 0.51 | 0.49 | 0.01 | -3.92 | 2.0 | Fail |
Integrating Benchmarking with Type Standardization Research
The benchmarking process described above serves as the diagnostic tool that can trigger the need for a Type Standardization. Type Standardization is a specialized correction applied after a successful basic calibration to improve accuracy for a specific, narrowly defined material type [8].
Deviations in benchmarking, as seen for Molybdenum in Table 2, can occur for several research-worthy reasons:
- Matrix Effects: The synthetic manufacturing of many CRMs may not perfectly correspond to the composition or metallurgical structure of real-world samples, leading to systematic errors [8].
- Exotic Alloys: Alloys with unusual or high concentrations of certain elements can deviate strongly from the calibration curve established by common matrix materials [8].
- Instrument Drift: The high sensitivity of OES spectrometers makes them subject to environmental factors, causing a slow change in instrument sensitivity (drift) over the mid to long term [1] [8].
When benchmarking identifies significant and consistent deviations for a specific material type, a Type Standardization is the prescribed solution. It is not an alternative to calibration but an additional step that uses a reference material with a composition very close to the target sample to fine-tune the results [1] [8]. This procedure is a critical focus area for advancing OES calibration research, aiming to extend the accuracy of the technique to a wider range of advanced materials used in scientific and industrial applications.
The accurate elemental analysis of complex concentrated alloys (CCAs) is critical for developing advanced materials, such as those for biomedical implants requiring a specific balance of low Young’s modulus and high yield strength [71]. Optical Emission Spectrometry (OES) is a cornerstone technique for this quality control. However, its sensitivity makes it susceptible to instrumental drift and matrix effects from complex chemical compositions, which can lead to significant analytical discrepancies [1] [8]. This case study demonstrates how Type Standardization, a advanced calibration procedure, can resolve these inaccuracies for CCAs, ensuring data reliability for critical research and development.
Traditional calibration using Certified Reference Materials (CRMs) may prove insufficient for exotic alloys whose composition or metallurgical structure deviates strongly from the standard reference samples [8]. This can result in persistent deviations, compromising the accuracy of chemical composition data and, consequently, the performance predictions of newly designed alloys.
Experimental Design
The Problem: Inaccurate Calibration in Complex Alloys
The primary challenge in OES analysis of CCAs stems from the technique's use of relative measurements. The instrument compares the light intensity from a sample against a calibration curve built from CRMs [1]. Over time, instrument sensitivity can drift, and more importantly, a mismatch between the CRM and the sample's specific matrix or physical structure introduces systematic errors [8]. For instance, synthetically manufactured CRMs may not correspond to the actual composition or structure of a lab-created CCA, leading to inaccurate readings for key elements that dictate material properties like modulus and strength [8].
Proposed Solution: Type Standardization Protocol
Type Standardization is a corrective calibration procedure performed after a successful basic calibration. It fine-tunes the instrument for a specific, narrowly defined alloy type or composition, effectively correcting for minor matrix effects that basic calibration cannot address [1] [8]. The procedure is not a global correction and is only valid for samples that are very similar in composition to the standardization sample.
The following workflow outlines the step-by-step protocol for performing a Type Standardization to resolve analytical discrepancies in complex alloys.
Detailed Experimental Protocols
Protocol 1: Initial Calibration and Problem Identification
This protocol establishes the baseline calibration and identifies the need for Type Standardization.
Basic Instrument Calibration:
Control Sample Analysis:
Identification of Discrepancies:
- Compare the average measured values from the control sample against its known certified values.
- Calculate the relative error for each key element. Persistent, statistically significant deviations indicate that the basic calibration is insufficient and Type Standardization is required [8].
Protocol 2: Type Standardization Procedure
This protocol details the corrective Type Standardization process.
Prerequisite: Ensure a successful basic calibration has been performed immediately prior to this procedure [8].
Sample Preparation for Standardization:
- Secure one or more reference samples that are proven reliable and whose composition is very close to the complex alloy samples being analyzed. These can be customer-specific reference materials or well-characterized specimens from a previous, accurate production batch [1] [8].
- Ensure the samples are properly prepared (e.g., cleaned, polished) to meet the OES analyzer's requirements for analysis.
Execution of Type Standardization:
- Access the Type Standardization function within the OES spectrometer's software.
- Follow the instrument's prompts to analyze the prepared reference samples.
- The software will use the known values of these samples to create a custom, localized correction for the analytical curve, specifically for that alloy type.
Validation:
- Re-analyze the original control sample.
- Confirm that the measured values now fall within the acceptable limits of deviation from the known values. The Type Standardization is now complete and valid for analyzing unknown samples of a very similar composition [8].
Advanced Method: Multi-Energy Calibration (MEC)
For laboratories dealing with extremely complex matrices, an emerging calibration strategy is Multi-Energy Calibration (MEC). This method, applicable to plasma-based OES, uses multiple emission lines (wavelengths) for each element instead of a single line [5].
- Principle: The method requires only two calibration solutions per sample. By using multiple wavelengths, it becomes possible to visually identify and eliminate emission lines that are affected by spectral interferences, which appear as outliers on the calibration plot [5].
- Benefit for Complex Alloys: MEC inherently improves accuracy in complex matrices by mitigating interference and offering built-in matrix-matching capabilities [5]. This approach has shown improved recoveries (80–105%) compared to traditional external calibration in complex sample types [5].
Results and Discussion
Comparative Data Analysis
The following table summarizes a hypothetical data set, consistent with published findings [8], demonstrating the corrective effect of Type Standardization on the analysis of a Ti-Zr-Hf-Nb-Ta-Mo-Sn CCA control sample.
Table 1: Comparison of Analytical Results for a CCA Control Sample Before and After Type Standardization
| Element | Certified Value (wt%) | Basic Calibration Result (wt%) | Relative Error (%) | Type Standardization Result (wt%) | Relative Error (%) |
|---|---|---|---|---|---|
| Niobium (Nb) | 32.5 | 31.9 | -1.85% | 32.4 | -0.31% |
| Titanium (Ti) | 25.8 | 26.3 | +1.94% | 25.9 | +0.39% |
| Tantalum (Ta) | 12.2 | 11.8 | -3.28% | 12.1 | -0.82% |
| Zirconium (Zr) | 11.5 | 11.9 | +3.48% | 11.6 | +0.87% |
The data in Table 1 clearly shows that the Basic Calibration results in significant relative errors, exceeding 3% for some elements. After applying the Type Standardization procedure, the relative errors for all elements are reduced to below 1%, demonstrating a marked improvement in analytical accuracy.
Implications for Alloy Design and Quality Control
Inaccurate composition data directly compromises the reliability of predictive models for material properties. For example, the development of CCAs for biomedical implants uses machine learning models that require precise compositional input to predict critical properties like Young's modulus and yield strength [71]. Erroneous input data can lead to flawed predictions and failed alloy development efforts. Implementing a robust calibration framework, including Type Standardization, ensures the integrity of the analytical data that underpins these advanced design strategies.
Furthermore, adhering to such validated analytical procedures is aligned with quality standards like ISO 9001, which emphasizes measurement traceability, competence, and reliable monitoring equipment to ensure product quality [73].
The Scientist's Toolkit
Table 2: Essential Research Reagent Solutions for OES Analysis of Complex Alloys
| Item | Function & Description | Critical Parameters |
|---|---|---|
| Certified Reference Materials (CRMs) | Establish the primary calibration curve. CRMs are samples with certified elemental concentrations, traceable to national or international standards [73]. | Matrix matching to general alloy type; certified uncertainty values. |
| Type Standardization Samples | Fine-tune the calibration for a specific alloy composition. These are high-quality reference materials with a composition nearly identical to the test samples [1] [8]. | Extreme closeness in composition and structure to the unknown production samples. |
| Control Samples | Monitor instrument performance and verify calibration accuracy over time. These are stable, homogenous samples with known composition [1]. | Similarity to routine production samples; stability for long-term use. |
| High-Purity Nitric Acid (HNO₃) | Digest alloy samples (if required for solution-based ICP-OES) and prepare calibration standards. | Traceselect or similar high-purity grade to minimize introduction of elemental contaminants [10]. |
| Multi-element Calibration Standards | Used for calibration in ICP-OES. Certified reference solutions containing multiple elements at known concentrations [10]. | Compatibility with the sample matrix; acid concentration matching. |
This case study demonstrates that Type Standardization is a vital and effective procedure for resolving analytical discrepancies in the OES analysis of complex concentrated alloys. Moving beyond basic calibration, it corrects for matrix effects and instrumental drift specific to an alloy type, ensuring data accuracy that is crucial for advanced alloy design and quality control. For the most challenging matrices, emerging strategies like Multi-Energy Calibration offer a promising path for further improving analytical precision and reliability.
Within the framework of advanced research on Optical Emission Spectrometry (OES) calibration, Type Standardization is a critical procedure for achieving the highest level of analytical accuracy. While basic calibration using Certified Reference Materials (CRMs) establishes a fundamental correlation between light intensity and elemental concentration, real-world analysis of complex or "exotic" alloys often reveals residual systematic deviations [8]. Type Standardization corrects for these specific, sample-related inaccuracies that fall outside the scope of the initial calibration. This application note provides a detailed protocol for executing Type Standardization and, more importantly, defines the quantitative metrics required to rigorously validate the resultant gains in analytical accuracy and precision, thereby supporting robust scientific research in spectrometer methodology.
Experimental Protocols
Core Principle of Type Standardization
Type Standardization is a post-calibration correction technique. It is not an alternative to a basic calibration but an enhancement performed after a successful calibration to fine-tune results for a specific alloy type or composition [1]. The procedure relies on using a Proven Reliable Specimen—a sample with a composition very close to the unknown test samples and whose chemical composition is known with a high degree of certainty [1] [8]. The instrument uses the measured values of this specimen to calculate a correction factor that is subsequently applied to unknown samples of a nearly identical matrix.
Detailed Step-by-Step Procedure
The following workflow outlines the comprehensive Type Standardization process, from prerequisite checks to data validation.
Pre-Procedure Requirements:
- Verified Basic Calibration: Ensure the spectrometer has a fresh, valid calibration performed with a sufficient number of CRMs to establish a statistically reliable calibration curve [7].
- Proven Reliable Specimen: Secure a sample that is compositionally nearly identical to the subsequent unknown samples. The specimen must be homogeneous and its composition certified or proven through repeated, reliable analysis [1].
Procedure Execution:
- Preparation: Ensure the Proven Reliable Specimen and all control samples are prepared to meet the spectrometer's requirements for surface finish, cleanliness, and homogeneity.
- Analysis: Spark the Proven Reliable Specimen on the OES spectrometer using the standard analytical method.
- Correction: In the spectrometer software, initiate the Type Standardization routine. The instrument will compare its measured values for the specimen against the known certified values and store the calculated correction factors.
- Validation: Analyze control samples (samples of known composition, similar to the specimen) to quantify the improvement. This step is critical for generating the metrics detailed in Section 3.
Critical Considerations:
- Specificity: A Type Standardization is valid only for the specific alloy type it was created for. A new standardization must be run for every different alloy or composition [1].
- Non-Applicability: This procedure must not be used to correct for large, systematic errors or to analyze materials with significantly different chemical compositions. It is a fine-tuning step [8].
Key Metrics for Quantifying Improvement
The success of a Type Standardization must be evaluated by comparing analytical data obtained before and after its application. The following quantitative metrics, derived from the measurement of control samples, provide this evidence.
Table 1: Key Quantitative Metrics for Assessing Type Standardization Improvement
| Metric | Description | Formula/Calculation | Interpretation of Improvement |
|---|---|---|---|
| Bias (Absolute Error) | Difference between measured mean and certified value [7]. | ( \text{Bias} = \bar{X} - C_{CRM} ) | A reduction in absolute bias value indicates enhanced accuracy. |
| Relative Standard Deviation (RSD) | Standard deviation normalized to the mean, expressed as a percentage [25]. | ( \text{RSD} = \left( \frac{s}{\bar{X}} \right) \times 100\% ) | A lower RSD indicates enhanced precision and measurement stability. |
| Uncertainty of Calibration Curve | Statistical reliability of the calibration, reduced by using more CRMs [7]. | ( U_c \propto \frac{1}{\sqrt{n}} ) (Guideline: ±2SR) | A tighter uncertainty range post-standardization indicates a more robust calibration. |
| Internal Standard Recovery | Accuracy of the internal standard correction, critical for ICP-OES [25]. | ( \text{Recovery} = \left( \frac{\text{Measured}{IS}}{\text{Expected}{IS}} \right) \times 100\% ) | Recoveries within a tight range (e.g., 80-120%) confirm stable sample introduction and matrix correction. |
The data from a Type Standardization procedure can be visualized as a direct comparison of pre- and post-correction results for a control sample.
Table 2: Illustrative Data: Analysis of a Low-Alloy Steel Control Sample (Element: Chromium, Certified Value: 1.05%)
| Condition | Mean Measured Value (%) | Standard Deviation (s) | Bias (%) | RSD (%) | Internal Standard Recovery (%) |
|---|---|---|---|---|---|
| Post-Calibration (Pre-Type Std.) | 1.02 | 0.015 | -0.03 | 1.47 | 85-115 |
| Post-Type Standardization | 1.049 | 0.008 | -0.001 | 0.76 | 95-105 |
The Scientist's Toolkit: Essential Research Reagents & Materials
The integrity of Type Standardization is contingent on the quality of materials used. The following table details the essential reagents and specimens required.
Table 3: Essential Research Materials for OES Calibration and Type Standardization
| Item | Function & Critical Attributes | Research-Grade Application |
|---|---|---|
| Certified Reference Materials (CRMs) | To establish the primary calibration curve with traceable accuracy. Must be of a matrix similar to the general sample type [7]. | Foundational for instrument calibration; the benchmark for all subsequent accuracy measurements. |
| Proven Reliable Specimens | To generate the correction factors for Type Standardization. Must be compositionally nearly identical to the unknown test samples [1]. | Serves as the specific calibrant for fine-tuning analytical accuracy for a narrow alloy family. |
| Control Samples | Samples of known composition, independent of those used for calibration or standardization, used to verify method performance [1] [7]. | Crucial for the independent validation of accuracy and precision gains post-Type Standardization. |
| Internal Standards (e.g., Y, Sc) | Elements added at a constant concentration to all samples and standards to correct for physical interferences and drift in ICP-OES [25]. | Must be absent from samples and free of spectral interferences. Monitored recovery (ideally 95-105%) validates data quality. |
Concluding Remarks
The Type Standardization procedure is a powerful tool for pushing the boundaries of analytical accuracy in OES. However, its application must be guided by rigorous scientific practice. By adhering to the detailed protocol and, most critically, employing quantitative metrics—such as reduced bias, lower RSD, and stable internal standard recovery—researchers can objectively quantify the improvement. This data-driven approach ensures that the enhanced results reported for novel or complex materials are statistically significant, reliable, and defensible within the broader context of analytical science and drug development.
Conclusion
Type Standardization is not a replacement for a robust fundamental calibration but a powerful, targeted tool for achieving the highest level of accuracy in OES analysis, particularly for specific, well-defined sample matrices. Its correct application, as detailed across the foundational, methodological, troubleshooting, and validation intents, allows researchers to overcome the limitations of standard calibrations when analyzing exotic alloys or samples with unique structures. By integrating this procedure into a comprehensive quality assurance program that includes regular maintenance, control samples, and an understanding of its specific scope, scientists can ensure data reliability, comply with stringent quality standards, and push the boundaries of precision in material characterization. Future developments will likely focus on integrating these calibration principles with automated software tools and advanced calibration methodologies like Multi-Energy Calibration (MEC) to further streamline the path to uncompromising analytical accuracy.
References
- 1. How to calibrate your OES analyzer for accurate and ... [https://hha.hitachi-hightech.com/en/blogs-events/blogs/2021/02/01/oes-calibration-non-ferrous-melt-control/]
- 2. Optical Emission Spectrometer Calibration to a National or ... [https://elsmar.com/elsmarqualityforum/threads/optical-emission-spectrometer-calibration-to-a-national-or-international-standard.43259/]
- 3. The Working Principle of Arc/Spark OES Elemental Analysis [https://www.spectro.com/products/optical-emission-spectroscopy/arc-spark-stationary-oes-working-principle]
- 4. Multi-energy calibration and induced plasma optical ... [https://www.sciencedirect.com/science/article/abs/pii/S0889157524008329]
- 5. Multi-energy calibration in plasma emission spectrometry [https://www.frontiersin.org/journals/analytical-science/articles/10.3389/frans.2025.1527110/full]
- 6. Optical Emission Spectrometry Academy [https://www.thermofisher.com/us/en/home/industrial/spectroscopy-elemental-isotope-analysis/oes-xrd-xrf-analysis/optical-emission-spectrometry/resources/academy.html]
- 7. Calibrating OES: Your questions answered [https://hha.hitachi-hightech.com/en/blogs-events/blogs/2020/08/24/cast-iron-webinar-q-and-a/]
- 8. A Guide to Achieving Top Accuracy with an OES ... [https://www.azom.com/article.aspx?ArticleID=17562]
- 9. Comparison of different characterization approaches for ... [https://pmc.ncbi.nlm.nih.gov/articles/PMC12003560/]
- 10. Validation of ICP-OES and γ-spectrometry methodologies ... [https://link.springer.com/article/10.1007/s10967-025-10270-4]
- 11. Using OES To Consistently Achieve Top Accuracy [https://hha.hitachi-hightech.com/en/blogs-events/blogs/2019/01/08/how-to-consistently-achieve-top-accuracy/]
- 12. R&D Opportunities in Arc/Spark Optical Emission ... [https://www.spectroscopyonline.com/view/rd-opportunities-arcspark-optical-emission-spectrometry]
- 13. A green analytical method using natural eutectic deep ... [https://www.sciencedirect.com/science/article/abs/pii/S0026265X25035088]
- 14. Metal Sample Preparation for OES Analysis [https://verichek.net/metal-sample-preparation.html]
- 15. Spectroscopic Sample Preparation: Techniques for ... [https://www.metkon.com/spectroscopic-sample-preparation/]
- 16. Sample Preparation for the Perfect OES Carbon Analysis [https://hha.hitachi-hightech.com/en/blogs-events/blogs/2018/12/05/the-secret-to-perfect-oes-carbon-analysis-perfect-sample-prep/]
- 17. ICP-OES Capabilities, Developments, Limitations, and Any ... [https://www.spectroscopyonline.com/view/icp-oes-capabilities-developments-limitations-and-any-potential-challengers]
- 18. Optical Emission Spectrometer Calibration Standards [https://uscorrosion.com/index.php/optical-emission-spectrometer-calibration-standards/]
- 19. Optical Emission Spectroscopy (OES) Academy [https://www.thermofisher.com/us/en/home/industrial/spectroscopy-elemental-isotope-analysis/spectroscopy-elemental-isotope-analysis-learning-center/elemental-structural-analysis-information/oes-academy.html]
- 20. Interelement Corrections in Spectrochemistry [https://www.spectroscopyonline.com/view/interelement-corrections-spectrochemistry]
- 21. A Matrix Effect Calibration Method of Laser-Induced ... [https://www.mdpi.com/2076-3417/15/15/8640]
- 22. Multi-wavelength internal standardization using inductively ... [https://www.sciencedirect.com/science/article/abs/pii/S0003267025007809]
- 23. Compensation for Matrix Effects in High-Dimensional ... [https://www.mdpi.com/1424-8220/25/3/612]
- 24. Development and validation of a simple and rapid ICP-OES ... [https://fjps.springeropen.com/articles/10.1186/s43094-020-00159-2]
- 25. Key Points to Remember When Using Internal Standards ... [https://www.spectroscopyonline.com/view/key-points-to-remember-when-using-internal-standards-for-sample-analysis-by-icp-oes]
- 26. System validation & certification of calibration [https://www.elementar.com/en-us/services-support/system-validation-certification]
- 27. Development and validation of an ICP-OES method for ... [https://www.sciencedirect.com/science/article/abs/pii/S0731708513002574]
- 28. (RM) for Optical Emission Reference Materials Spectrometer [https://www.razi-center.net/En/OES-standard%20sample.aspx]
- 29. possibilities and modifier use in ETV ICP Calibration ... OES [https://pubmed.ncbi.nlm.nih.gov/19468719/]
- 30. How to Choose the Correct Wavelength in ICP-OES [https://www.spectroscopyonline.com/view/how-choose-correct-wavelength-icp-oes]
- 31. ICP-OES Data Analysis [https://www.thermofisher.com/us/en/home/industrial/spectroscopy-elemental-isotope-analysis/spectroscopy-elemental-isotope-analysis-learning-center/trace-elemental-analysis-tea-information/icp-oes-information/icp-oes-data-analysis.html]
- 32. What are Effective Calibration Methods in ICP-OES Analysis [https://www.drawellanalytical.com/what-are-effective-calibration-methods-in-icp-oes-analysis/]
- 33. Optical Emission Spectrometry | Thermo Fisher Scientific - US [https://www.thermofisher.com/us/en/home/industrial/spectroscopy-elemental-isotope-analysis/oes-xrd-xrf-analysis/optical-emission-spectrometry.html]
- 34. Rapid and easy ICP OES determination of selected major, ... [https://www.sciencedirect.com/science/article/pii/S0039914022004465]
- 35. Do We Qualify or Validate a Spectrometer? [https://www.spectroscopyonline.com/view/do-we-qualify-or-validate-a-spectrometer-]
- 36. ICP-OES & ICP-AES Spectrometers [https://www.spectro.com/products/icp-oes-aes-spectrometers]
- 37. ICP-OES Detector and Instrument Calibration - Articles [https://community.agilent.com/knowledge/icp-oes-portal/kmp/icp-oes-articles/kp354.icp-oes-detector-and-instrument-calibration]
- 38. SPECTRO Calibration Service | DIN EN ISO/IEC 17025:2018 [https://www.spectro.com/support/customer-support-center/calibration-17025]
- 39. <233> Elemental Impurities—Procedures [https://www.usp.org/harmonization-standards/pdg/general-chapters/elemental-impurities]
- 40. Spectroscopy Accuracy | OES | Measurement Errors [https://hha.hitachi-hightech.com/en/blogs-events/blogs/2019/10/01/what-causes-errors-in-measurements-and-how-to-reduce-them/]
- 41. Calibration Failure Troubleshooting on ICP-OES Systems [https://community.agilent.com/knowledge/icp-oes-portal/kmp/icp-oes-articles/kp698.calibration-failure-troubleshooting-on-icp-oes-systems]
- 42. Understanding the Fundamental Components of Sample ... [https://www.spectroscopyonline.com/view/understanding-the-fundamental-components-of-sample-introduction-for-icp-oes-and-icp-ms]
- 43. Solve the 80% error problem of the Optical Emission ... [https://www.jinyibo.com/blog/solve-the-80-error-problem-of-the-optical-emission-spectrometer-pay-attention-to-these-3-points_b32]
- 44. Best practices for sample preparation in elemental analysis [https://www.elementar.com/en-us/blog/best-practices-for-sample-preparation-in-elemental-analysis]
- 45. Characterizing factors influencing calibration and optical ... [https://pmc.ncbi.nlm.nih.gov/articles/PMC8988964/]
- 46. Optical Emission Spectroscopy Overview | OES [https://hha.hitachi-hightech.com/en/blogs-events/blogs/2017/10/25/optical-emission-spectroscopy-(oes)/]
- 47. Trace Elemental Analysis (ICP-MS & ICP-OES) [https://www.lucideon.com/testing-characterisation/techniques/trace-elemental-analysis]
- 48. The Importance of Method Development for Trace-Element ... [https://www.spectroscopyonline.com/view/importance-method-development-trace-element-analysis-inductively-coupled-plasma-optical-emission-spe]
- 49. ICP-Optical Emission Spectrometer (ICP-OES) Analysis ... [https://www.archivemarketresearch.com/reports/icp-optical-emission-spectrometer-icp-oes-501557]
- 50. ICP-OES Spectrometer Market Report | Global Forecast ... [https://dataintelo.com/report/global-icp-oes-spectrometer-market]
- 51. How Arc Spark OES Spectrometer Works — In One Simple Flow ... [https://www.linkedin.com/pulse/how-arc-spark-oes-spectrometer-works-one-simple-flow-p3mof/]
- 52. Equipment Calibration: The Ultimate Guide for Managers (2025) [https://f7i.ai/blog/equipment-calibration-isnt-a-chore-its-your-competitive-edge-the-strategic-guide-for-2025]
- 53. The Impact of Environmental Conditions on Calibration [https://ips-us.com/the-impact-of-environmental-conditions-on-calibration/]
- 54. Calibration Curves [https://www.inorganicventures.com/icp-guide/calibration-curves]
- 55. ICP-OES as a Viable Alternative to ICP-MS for Trace Analysis [https://www.spectroscopyonline.com/view/icp-oes-as-a-viable-alternative-to-icp-ms-for-trace-analysis-meeting-the-detection-limits-challenge]
- 56. Calibration: Effects on Accuracy and Detection Limits in ... [https://www.spectroscopyonline.com/view/calibration-effects-on-accuracy-and-detection-limits-in-atomic-spectroscopy]
- 57. A new strategy to correct matrix effects of carbon origin in ... [https://www.sciencedirect.com/science/article/abs/pii/S0003267024004768]
- 58. A Guide to ISO 17025 Calibration Standards and Compliance [https://www.garbermetrology.com/blog/iso-17025/]
- 59. ISO - ISO/IEC 17025 — Testing and calibration laboratories [https://www.iso.org/ISO-IEC-17025-testing-and-calibration-laboratories.html]
- 60. What is ISO 17025? Definitions & Calibration Guide [https://www.tek.com/en/blog/what-is-iso-17025]
- 61. ISO/IEC 17025 Calibration Laboratory Accreditation - ANAB [https://anab.ansi.org/accreditation/iso-iec-17025-calibration-laboratory/?srsltid=AfmBOorm_ngpvp-_c0isuLXVm4oKuWvzecccD8dVihVfXHGXZXZ8Fkmo]
- 62. Traditional Calibration Methods in Atomic Spectrometry and ... [https://pmc.ncbi.nlm.nih.gov/articles/PMC6242947/]
- 63. Calibration Standards for ICP Spectroscopy [https://www.inorganicventures.com/blog/news/calibration-standards-icp-spectroscopy]
- 64. Determination of metals in wine by ICP-OES: Comparative ... [https://www.sciencedirect.com/science/article/pii/S0889157525011470]
- 65. What is Matrix Matching and How is it Affecting Your Results? [https://info.asistandards.com/blog/what-is-matrix-matching-and-how-is-it-affecting-your-results]
- 66. How to Enhance Detection Limits in ICP-OES for Trace ... [https://www.drawellanalytical.com/how-to-enhance-detection-limits-in-icp-oes-for-trace-metal-analysis/]
- 67. A versatile approach for the preparation of matrix-matched ... [https://www.sciencedirect.com/science/article/pii/S0039914023000565]
- 68. a case study of ochratoxin A in flour [https://pmc.ncbi.nlm.nih.gov/articles/PMC10761375/]
- 69. Matrix-Matched Calibration Curves for Assessing Analytical ... [https://pmc.ncbi.nlm.nih.gov/articles/PMC7175947/]
- 70. Laboratory Calibration Comparison of Hyperspectral ... [https://www.mdpi.com/2072-4292/17/22/3692]
- 71. A multi-objective synergistic design for low modulus and ... [https://www.nature.com/articles/s41524-025-01713-3]
- 72. Calibration in atomic spectrometry: A tutorial review ... [https://www.sciencedirect.com/science/article/abs/pii/S0584854710001394]
- 73. ISO 9001 Calibration Requirements and Procedures ... [https://www.bprhub.com/blogs/iso-9001-calibration-requirements-procedures]