UV-Vis Spectrophotometry: A Comprehensive Guide to Principles, Applications, and Method Validation for Pharmaceutical Professionals
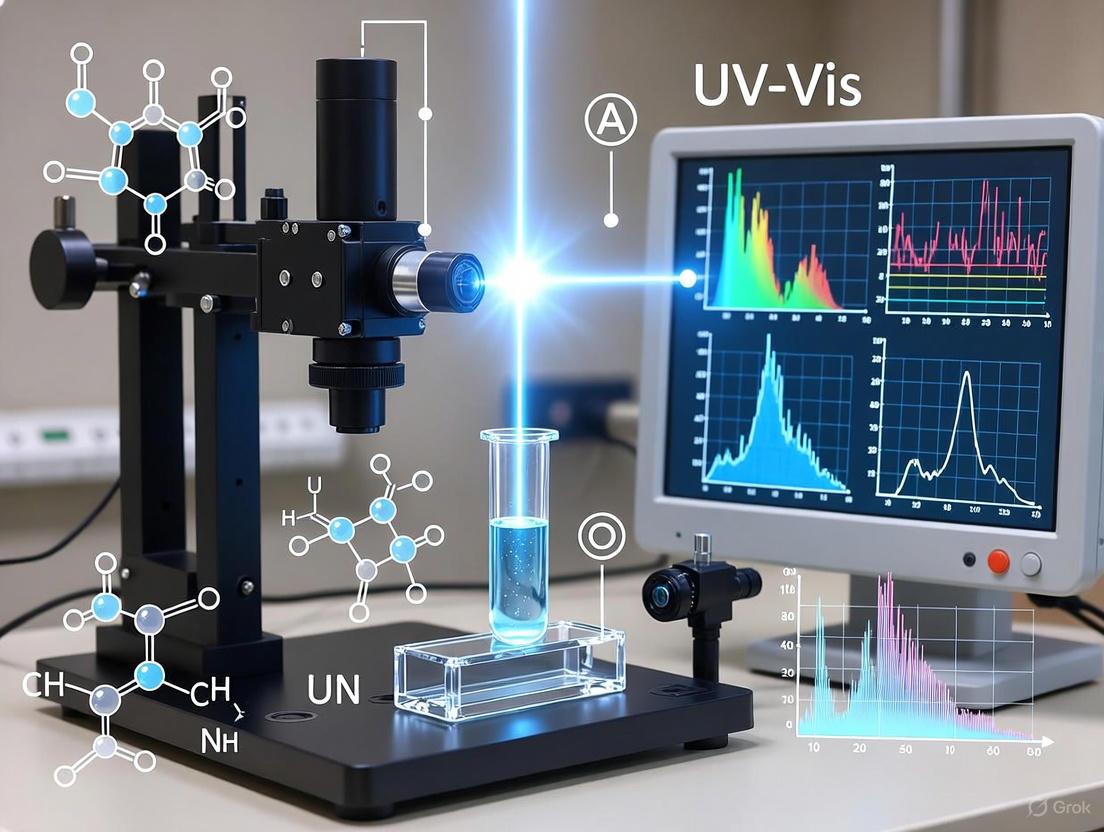
This article provides a comprehensive examination of UV-Vis spectrophotometry, from its fundamental operating principles to advanced applications in drug development and quality control.
UV-Vis Spectrophotometry: A Comprehensive Guide to Principles, Applications, and Method Validation for Pharmaceutical Professionals
Abstract
This article provides a comprehensive examination of UV-Vis spectrophotometry, from its fundamental operating principles to advanced applications in drug development and quality control. Tailored for researchers, scientists, and pharmaceutical professionals, it explores the instrumentation behind UV-Vis systems, detailed methodological protocols for accurate analysis, practical troubleshooting strategies for common issues, and rigorous validation frameworks compliant with ICH guidelines. The content bridges theoretical concepts with practical implementation, enabling professionals to leverage this versatile analytical technique for precise quantification, purity assessment, and regulatory compliance in pharmaceutical research and development.
Understanding UV-Vis Spectroscopy: Core Principles and Instrumentation Design
Light-matter interactions form the cornerstone of numerous analytical techniques in scientific research and drug development. These interactions, governed by the principles of quantum electrodynamics, involve the absorption, emission, and scattering of light by atoms and molecules [1]. When a photon interacts with an atom or molecule, three primary outcomes are possible: the photon may be scattered (emergent photon has the same energy), participate in a non-linear interaction (emergent photon has different energy), or be absorbed with energy dissipated as heat [2]. The specific outcome depends on the electronic structure of the material and the energy of the incident photons. For researchers utilizing UV-Vis spectrophotometry, understanding these fundamental processes is essential for proper experimental design, data interpretation, and method development in pharmaceutical analysis and quality control.
The energy of photons in the ultraviolet and visible regions of the electromagnetic spectrum (190-800 nm) corresponds precisely to the energy required to promote electrons from ground states to excited states in molecules [3]. This resonance condition enables UV-Vis spectroscopy to probe electronic transitions in chromophores—molecules that absorb specific wavelengths of light. The measured absorption patterns provide characteristic fingerprints for compound identification, while the absorption intensity relates directly to concentration through the Beer-Lambert law [4]. This whitepaper examines the physics underlying these processes within the context of UV-Vis spectrophotometer operation, providing researchers with a comprehensive framework for leveraging this technique in drug development applications.
Electronic Transitions and Energy Absorption Mechanisms
Quantum Mechanical Foundations
At the heart of light-matter interactions are electronic transitions between discrete energy levels. Atomic energy levels are determined by the interactions of electrons with the atomic nucleus and other electrons, while molecular energy levels are further influenced by vibrational and rotational states [5]. When a photon with energy matching the difference between two electronic states (ΔE) interacts with a molecule, it may be absorbed, promoting an electron to a higher energy orbital. The energy relationship follows the equation:
ΔE = hν = hc / λ
where h is Planck's constant, c is the speed of light, ν is the frequency, and λ is the wavelength of the light [5]. This fundamental relationship connects the quantum mechanical energy gap to the measurable wavelength of light, enabling spectroscopic characterization.
For organic molecules, four primary types of electronic transitions occur in the UV-Vis range, each with different energy requirements and probabilities [4]:
- σ → σ* transitions: High-energy transitions typically occurring in the far-UV region (<150 nm) involving electrons in single bonds.
- n → σ* transitions: Moderate-energy transitions of non-bonding electrons to antibonding σ orbitals (150-250 nm).
- π → π* transitions: Lower-energy transitions in compounds with unsaturation, often in the 200-700 nm range.
- n → π* transitions: The lowest-energy transitions involving non-bonding electrons to antibonding π orbitals (250-500 nm).
The probability of each transition is described by its oscillator strength, a dimensionless quantity indicating transition probability, with higher values corresponding to stronger, more likely transitions [6]. These transition probabilities are quantitatively characterized by the transition cross section σ(ν), which describes the strength or probability that the interaction will occur [5].
Electronic Transitions in UV-Vis Spectroscopy
Quantitative Characterization of Transitions
The following table summarizes the key quantitative parameters that characterize electronic transitions relevant to UV-Vis spectroscopy:
| Parameter | Symbol/Relationship | Significance in UV-Vis Spectroscopy |
|---|---|---|
| Energy Gap | ΔE = hc/λ | Determines wavelength of absorption; related to molecular structure |
| Transition Cross Section | σ(ν) = Sg(ν) | Probability of transition occurring; determines absorption strength |
| Oscillator Strength | Dimensionless quantity | Indicates transition probability; higher values = stronger absorption |
| Molar Absorptivity | ε (L·mol⁻¹·cm⁻¹) | Measure of how strongly a chemical species absorbs light at a specific wavelength |
| Absorption Coefficient | μₐ (cm⁻¹) | Macroscopic measure of absorption per unit path length |
Quantitative Parameters Characterizing Electronic Transitions
The transition cross section σ(ν) is particularly important for understanding the wavelength dependence of absorption. This value is centered on the resonance frequency (ν₀), where σ(ν) is largest, and drops as ν deviates from ν₀ [5]. Key quantities include the peak transition cross section (σ₀ = σ(ν₀)), the linewidth (Δν) representing the full width at half maximum value (FWHM), and the transition strength (S), also called oscillator strength [5]. The lineshape function g(ν) is a normalized function with unity area that describes the frequency dependence of the transition probability.
For conjugated organic compounds, recent research has demonstrated the efficacy of using modified Pekarian functions to fit UV-Vis absorption spectra with high accuracy and reproducibility [7]. This approach optimizes five parameters that define band shape: S (Huang-Rhys factor, representing the mean number of phonons accompanying the optical transition), ν₀ (central frequency), Ω (vibrational wavenumber), σ₀ (Gaussian broadening parameter), and δ (global correction for contributions of other modes) [7]. This advanced fitting method provides deeper insights into electronic structures compared to traditional Gaussian or Lorentzian fitting approaches.
UV-Vis Spectrophotometer Instrumentation and Operation
Core Components and Their Functions
A UV-Vis spectrophotometer consists of several integrated components that work together to measure light absorption across ultraviolet and visible wavelengths [8]. The following table details the essential components and their functions in analytical measurements:
| Component | Function | Common Implementations |
|---|---|---|
| Light Source | Emits broadband UV and/or visible light | Deuterium lamp (UV), Tungsten/Halogen lamp (Vis), Xenon lamp |
| Monochromator | Selects specific wavelengths from broadband source | Prism, diffraction grating, slit assembly |
| Sample Holder | Contains sample solution for measurement | Cuvette (various path lengths), flow cells, microvolume pedestals |
| Detector | Measures intensity of transmitted light | Photomultiplier tube, photodiode, CCD array |
| Signal Processor | Converts detector signal to absorbance values | Analog-to-digital converter, microprocessor |
UV-Vis Spectrophotometer Components and Functions
The instrumentation follows either a single-beam or double-beam configuration. Single-beam instruments measure the difference in absorption before and after placing the sample, while double-beam instruments split the light from the source, simultaneously measuring sample and reference pathways for immediate comparison [3]. Modern instruments often incorporate microvolume analysis capabilities, allowing measurement of samples as small as 0.5 microliters, which is particularly valuable for precious biological samples in drug development research [8].
Operational Workflow and Data Acquisition
The fundamental measurement process in UV-Vis spectroscopy follows a systematic workflow that ensures accurate quantification of light absorption by samples.
UV-Vis Spectrophotometer Workflow
The process begins with the light source emitting broadband radiation across UV and visible wavelengths. The monochromator then selectively transmits a narrow band of wavelengths to the sample compartment [4]. Light passing through the sample is measured by the detector, which converts photon intensity to electrical signals. The spectrophotometer compares the intensity of light passing through the sample (I) to that passing through a reference (I₀) to calculate absorbance (A = log₁₀(I₀/I)) [4]. For quantitative analysis, the Beer-Lambert law establishes the relationship between absorbance and concentration: A = εbc, where ε is the molar absorptivity coefficient, b is the path length, and c is the concentration [6] [4].
Critical performance considerations include spectral bandwidth, which affects resolution and accuracy, wavelength accuracy, and stray light levels that can cause significant measurement errors, especially at high absorbances [4]. Modern instruments incorporate advanced features such as double monochromators to reduce stray light, enabling accurate measurements across wider absorbance ranges [4].
Experimental Protocols and Methodologies
Quantitative Analysis of Nitrate in Water Samples
A recent study demonstrated an integrated method combining UV-Vis spectroscopy, difference spectrum analysis, and a hybrid prediction model to address accuracy challenges in nitrate quantification caused by turbidity [9]. The methodology followed this detailed protocol:
Sample Preparation: Collect standard and natural water samples. For standard samples, prepare nitrate solutions of known concentrations (0-10 mg/L) using potassium nitrate. For natural samples, filter through 0.45μm membrane filters to remove large particulates.
Spectrum Acquisition: Measure UV-Vis absorption spectra across 200-400 nm range using a double-beam spectrophotometer. Use deionized water as reference blank. Maintain constant path length (typically 1 cm) for all measurements.
Difference Spectrum Analysis: Calculate difference spectra by subtracting the absorbance of pure water from sample spectra. Analyze the linear relationship between difference spectrum magnitude and turbidity levels.
Turbidity Compensation: Apply the Mixed Difference Nitrate Method (MDNM) to compensate for turbidity effects. This novel strategy uses the difference spectrum-turbidity relationship to mathematically correct absorption measurements.
Hybrid Prediction Modeling: Employ a framework integrating linear regression and threshold-based waveband selection. Use specific absorption peaks (220 nm and 275 nm) for nitrate quantification with multivariate calibration.
This protocol achieved impressive accuracy with R² = 0.9982 and RMSE = 0.2629 mg/L for standard samples, and R² = 0.9663 and RMSE = 0.7835 mg/L for natural water samples [9]. The method demonstrates effective compensation for turbidity interference, a common challenge in environmental and pharmaceutical samples.
Spectral Deconvolution of Conjugated Molecules
For analyzing complex spectra of conjugated organic compounds, particularly relevant to pharmaceutical compounds with aromatic structures, a modified Pekarian function fitting approach provides superior results compared to traditional methods [7]:
Instrument Calibration: Verify wavelength accuracy using holmium oxide or didymium filters. Check photometric accuracy with potassium dichromate solutions. Ensure spectral bandwidth is set appropriately (typically 1-2 nm for most organic compounds).
Temperature Control: Maintain constant temperature during measurements (±0.1°C) using Peltier-controlled cuvette holders, as electronic transitions in organic compounds exhibit temperature dependence [7].
Baseline Correction: Record baseline with matched solvent in both sample and reference paths. For organic solvents, ensure reference and sample cells are matched to minimize solvent effects.
Spectrum Acquisition: Collect absorption spectra with high wavelength resolution (0.5-1 nm intervals) across relevant range (typically 200-800 nm depending on chromophores). Use slow scan speeds for higher signal-to-noise ratio.
Pekarian Function Fitting: Apply the modified Pekarian function for absorption spectra:
PFₐ = Σ [Sᵏ exp(-S)/k!] × G(1, ν₀ + kΩ - δk(k-1), σ₀)
where k = 0-8, and optimize the five parameters (S, ν₀, Ω, σ₀, δ) using commercial PeakFit or Origin software or custom Python scripts [7].
Quantum Mechanical Validation: Compare fitted parameters with theoretical predictions from time-dependent density functional theory (TD-DFT) calculations. Validate by comparing weighted averages 〈νge*〉 = ν₀ + Ω × S with calculated excitation energies [7].
This methodology enables accurate decomposition of overlapping electronic transitions, providing deeper insights into molecular electronic structures essential for pharmaceutical development.
Essential Research Reagents and Materials
The following table details key reagents and materials essential for UV-Vis spectroscopic analysis in research and drug development contexts:
| Research Reagent/Material | Function/Application | Technical Considerations |
|---|---|---|
| Quartz/Crystalline CUVETTES | Sample containment for UV measurements | Quartz transmits UV light (190-2500 nm); path lengths from 0.1-10 cm |
| Solvent Systems (HPLC-grade) | Sample dissolution and reference | Low UV cutoff: acetonitrile (190 nm), water (190 nm), methanol (205 nm) |
| Standard Reference Materials | Instrument calibration and validation | Holmium oxide (wavelength), potassium dichromate (photometric), neutral density filters |
| Buffer Systems | pH control for biological molecules | Phosphate, Tris, carbonate; check UV transparency |
| Derivatization Agents | Enhance detection of non-chromophoric analytes | Dansyl chloride, OPA, TNBS for amines; DNPH for carbonyls |
| Microvolume Accessories | Enable small sample analysis (0.5-2 μL) | Pedestals, capillary systems; essential for precious biological samples |
Essential Research Reagents and Materials for UV-Vis Spectroscopy
Proper selection of solvents is particularly critical, as many organic solvents have significant UV absorption that must be considered when selecting appropriate reference blanks [4]. Similarly, buffer components should be selected for minimal UV absorption in the spectral region of interest to avoid interference with analyte measurements. For pharmaceutical applications, compliance with pharmacopeial requirements for wavelength accuracy (<1 nm) and stray light specifications is essential for regulatory submissions [4].
Advanced Applications in Drug Development and Research
Pharmaceutical Quality Control and Analysis
UV-Vis spectrophotometry plays a crucial role in the pharmaceutical industry for identifying and quantifying compounds in pharmaceutical products, ensuring their quality and efficacy [8]. Specific applications include:
Active Pharmaceutical Ingredient (API) Quantification: Direct measurement of API concentration in formulations using validated Beer-Lambert law applications with correlation coefficients (R²) >0.999 for linearity.
Impurity Profiling: Detection and quantification of synthetic intermediates, degradation products, and related compounds at levels as low as 0.1-1.0% depending on chromophore strength.
Dissolution Testing: Continuous monitoring of drug release from dosage forms using flow-through cell spectrophotometers with automated sampling.
Content Uniformity: Rapid assessment of dosage form consistency through extraction and measurement of active ingredients.
The technique is particularly valued for its compliance with pharmacopeial standards worldwide, including the United States Pharmacopeia (USP) and European Pharmacopoeia (Ph. Eur.), which specify strict requirements for spectrophotometer performance including stray light limits and wavelength accuracy [4].
Biomolecular Analysis in Preclinical Research
In drug discovery and development, UV-Vis spectroscopy provides critical data on biomolecular interactions and properties:
Nucleic Acid Quantification: Determination of DNA/RNA concentration and purity through A₂₆₀ measurements with 260/280 and 260/230 ratios for quality assessment [8] [3].
Protein Characterization: Measurement of protein concentration using absorbance at 280 nm (aromatic residues) or colorimetric assays (Bradford, BCA, Lowry).
Binding Constants Determination: Monitoring absorbance changes during titration experiments to calculate binding affinities for drug-target interactions.
Kinetic Studies: Time-based absorbance measurements to monitor enzyme activity and inhibition for drug mechanism studies.
Modern instruments like the DeNovix DS-11 Series combine full-spectrum UV-Vis analysis with fluorescence capability, enabling rapid nucleic acid and protein quantification with sample-to-data results in under 3 seconds [8]. This speed and efficiency makes UV-Vis indispensable in high-throughput screening environments common in pharmaceutical research.
Emerging Frontiers and Enhanced Light-Matter Interactions
Recent research has revealed that certain "forbidden" light emissions previously considered practically unattainable can be enabled through novel approaches using confined waves within atomically thin, 2-D materials [1]. This breakthrough could open new areas of technology based on enhanced light-matter interactions:
Plasmon-Enhanced Spectroscopy: Using graphene and other 2D materials to confine light as plasmons—electromagnetic oscillations with wavelengths hundreds of times shorter than photons—dramatically enhancing interaction probabilities [1].
Accessing "Forbidden" Transitions: Enabling electronic transitions that normally require billions of years to occur within nanoseconds under special confinement conditions, effectively brightening dark regions of spectrograms [1].
Multiphoton Processes: Facilitating simultaneous emission of multiple plasmons and two-step light-emitting transitions between energy levels through enhanced interaction strengths.
Quantum Light Sources: Generating entangled photon pairs through simultaneous emission processes enabled by these enhanced interactions, with potential applications in quantum computing and cryptography [1].
These advances demonstrate potential for tailoring optical properties of materials in previously impossible ways, potentially enabling more sensitive spectroscopic detection, ultrathin solar cells, organic LEDs with higher efficiencies, and novel photon sources for quantum computing devices [1]. For pharmaceutical researchers, these developments may eventually translate to significantly enhanced detection sensitivities and new analytical modalities for studying molecular interactions.
The continued evolution of light-matter interaction understanding, combined with advanced computational approaches like Pekarian function fitting and hybrid prediction models, ensures that UV-Vis spectroscopy will maintain its essential role in scientific research and drug development while expanding into new analytical frontiers.
Ultraviolet-visible (UV-Vis) spectrophotometry is a foundational analytical technique in scientific research and industrial laboratories. Its operation hinges on the principle of measuring how much a chemical substance absorbs light across the ultraviolet and visible regions of the electromagnetic spectrum [4]. The reliability of this technique for identifying and quantifying compounds is directly governed by the performance and integration of its three core components: the light source, the monochromator for wavelength selection, and the detection system [10] [11]. This guide provides an in-depth examination of these essential subsystems, detailing their principles of operation, key characteristics, and how they synergistically function within the context of a UV-Vis spectrophotometer to enable precise and accurate measurements.
The Illumination Source: Generating Broad-Spectrum Light
The light source is the starting point of the spectroscopic process, providing the initial broad-spectrum electromagnetic energy that the sample will interact with. The primary requirement for this component is a steady and intense emission across a wide range of wavelengths, covering both the UV and visible regions [10].
No single lamp is ideal across the entire UV-Vis range; therefore, instruments often combine two light sources to achieve optimal performance from approximately 190 nm to 3300 nm [10] [11]. The most common combination is a deuterium lamp for the UV region and a tungsten-halogen lamp for the visible and near-infrared regions.
Table 1: Common Light Sources in UV-Vis Spectrophotometers
| Source Type | Spectral Range | Principle of Operation | Key Characteristics |
|---|---|---|---|
| Deuterium Lamp | 190 - 350 nm [11] | Continuous arc source; excitation of deuterium molecules [11]. | High intensity in the UV; long-term stability lower than halogen lamps [10] [11]. |
| Tungsten-Halogen Lamp | 330 - 3200 nm [11] | Incandescence; light emitted from a heated filament [10]. | Robust and stable output; commonly used for visible light [10] [11]. |
| Xenon Lamp | UV & Visible Ranges | High-intensity arc source, similar to deuterium [10]. | Covers both UV and visible ranges without switching; higher cost and less stable than tungsten/halogen [10]. |
During operation, the instrument must smoothly transition between lamps when scanning across a wide wavelength range. This switchover typically occurs between 300 and 350 nm, where the light emission from both sources is comparable, ensuring a seamless measurement [10].
The Monochromator: Isolating Specific Wavelengths
Following the light source, the monochromator performs the critical function of wavelength selection. Its purpose is to isolate a narrow band of wavelengths from the broad-spectrum output of the source, providing the monochromatic light required for probing the electronic transitions of a sample's chromophores [11].
Core Components and the Grating
A monochromator typically consists of an entrance slit, a dispersion element (usually a diffraction grating), and an exit slit [10] [11]. The diffraction grating, a key element, is rotated to select specific wavelengths. It contains a series of grooves (measured in grooves per mm) that diffract light into several beams [11]. The quality of the grating directly impacts the optical resolution; for instance, blazed holographic diffraction gratings tend to provide significantly better quality measurements compared to ruled gratings due to fewer physical imperfections [10].
The relationship between the slit width and the resulting spectral bandwidth (SBW) is given by: ∆λ = (d ∙ cosβ) / (n ∙ f) ∆x where d is the groove spacing, β is the diffraction angle, n is the diffraction order, f is the focal length, and ∆x is the slit width [11]. This formula highlights that the slit width directly controls the SBW.
Spectral Bandwidth and Resolution
The spectral bandwidth is defined as the full width at half maximum (FWHM) of the triangular intensity distribution of the light exiting the monochromator [11]. It is a more appropriate parameter for comparing instruments than slit width alone, as it accounts for the grating's resolution.
Table 2: Impact of Spectral Bandwidth on Measurements
| Bandwidth Setting | Light Throughput | Signal-to-Noise Ratio | Spectral Resolution | Typical Use Case |
|---|---|---|---|---|
| Narrow Slits / Small SBW | Low | Lower (more noise) | High (sharp peaks) | Differentiating closely spaced absorption peaks [11]. |
| Wide Slits / Large SBW | High | Higher (less noise) | Low (broadened peaks) | Measuring in low-light regions (e.g., NIR) or when high resolution is not critical [11]. |
A fundamental trade-off exists: narrower slits provide better resolution but reduce light intensity at the detector, potentially increasing noise, while wider slits improve the signal-to-noise ratio at the cost of peak resolution [11]. The bandwidth should generally be set to 1/10 of the sample peak's FWHM for optimal results [11].
The Detection System: Converting Light to Signal
The final core component is the detector, which measures the intensity of light that has passed through the sample and converts it into a quantifiable electronic signal. The type and material of the detector determine the sensitivity and operational wavelength range of the instrument [11]. All common detectors exploit the photoelectric effect, where incident photons cause the emission or movement of electrons, generating a measurable current [10] [11].
Types of Detectors
Table 3: Common Detectors in UV-Vis Spectrophotometry
| Detector Type | Operating Principle | Spectral Range | Key Features |
|---|---|---|---|
| Photomultiplier Tube (PMT) | Photoelectric effect & electron multiplication via dynodes [11]. | UV-Visible [11] | Very high sensitivity and low noise; excellent for low-light detection [10] [11]. |
| Silicon Photodiode | Semiconductor; photons create electron-hole pairs generating photocurrent [11]. | UV-Visible (broad) [11] | Fast response, robust, and lower cost than PMT; less sensitive [10] [11]. |
| InGaAs Photodiode | Semiconductor photodiode for NIR [11]. | NIR region [11] | High sensitivity in NIR, but with a shorter wavelength range than PbS [11]. |
| PbS Detector | Photoconductive cell; resistance decreases with light intensity [11]. | NIR region [11] | Broad NIR range; less sensitive than InGaAs [11]. |
The choice of detector depends on the application's specific needs, balancing factors like sensitivity, wavelength range, response speed, and cost [11]. For instance, a PMT is preferred for trace-level analysis, while a photodiode may be sufficient for routine quantitative measurements.
System Integration: Single vs. Double Beam Configurations
The components described above can be arranged in different optical configurations, primarily single-beam and double-beam, which have significant implications for measurement stability and procedure [11].
Diagram: Comparison of Single-Beam and Double-Beam Optical Configurations.
- Single-Beam Systems: In this simpler arrangement, the optical components are arranged in series. A measurement involves first taking a reference reading (with the blank solvent) to establish I₀, and then a sample reading to determine I [11]. While simpler and more cost-effective, this design is susceptible to errors from fluctuations in the light source intensity over time, as it cannot simultaneously monitor the reference [11].
- Double-Beam Systems: These systems use a beam splitter to divide the monochromatic light into two paths: one passing through the sample and the other through a reference blank [11]. The detector(s) then measure both beams, and the instrument calculates the absorbance as the ratio of the two. This configuration compensates for real-time light source fluctuations, voltage variations, and lamp drift, providing a more stable and reliable baseline [11].
Essential Research Reagent Solutions
The following table lists key materials and reagents essential for conducting reliable UV-Vis spectroscopy experiments, particularly in a pharmaceutical development context.
Table 4: Essential Research Reagents and Materials for UV-Vis Spectroscopy
| Item | Function & Importance |
|---|---|
| Quartz Cuvettes | Sample holders that are transparent to UV light (down to ~190 nm). Standard path length is 1 cm [10]. Glass or plastic cuvettes are unsuitable for UV measurements as they absorb UV light [10]. |
| High-Purity Solvents | Water or organic solvents (e.g., ethanol) used to dissolve samples. Must not absorb significantly in the spectral region of interest. Solvent polarity and pH can affect the absorption spectrum [4]. |
| Buffers (e.g., Phosphate Buffer) | Used to maintain a constant pH, which is critical as the absorption spectrum of many analytes (e.g., proteins, tyrosine) is pH-dependent [4]. |
| Certified Reference Standards | Pure, known compounds with traceable concentration used to create calibration curves, enabling accurate quantification of unknown samples via the Beer-Lambert law [12]. |
Critical Experimental Protocols and Considerations
The Beer-Lambert Law and Quantitative Analysis
The fundamental principle for quantitative analysis is the Beer-Lambert Law: A = ε · c · L where A is the measured absorbance, ε is the molar absorptivity (L·mol⁻¹·cm⁻¹), c is the concentration (mol·L⁻¹), and L is the path length (cm) [10] [4]. For accurate results, the absorbance of the sample should ideally be kept below 1 (within the instrument's dynamic range) to avoid deviations from linearity, often achieved by diluting the sample or using a shorter path length cuvette [10].
Key Experimental Parameters and Potential Errors
- Stray Light: This is any light that reaches the detector at wavelengths other than the one selected by the monochromator [4]. It becomes a significant source of error at high absorbances, causing the reported absorbance to be lower than the true value and leading to negative deviations from the Beer-Lambert law [11] [4]. Double-monochromator instruments are used to minimize this effect [11].
- Sample Preparation: The sample solution must be clear and free of undissolved particles, which can scatter light and lead to inaccurate absorbance readings [12]. Techniques like derivative spectroscopy can sometimes be employed to mitigate challenges with turbid samples [12].
- Validation and Compliance: In regulated industries like pharmaceuticals, spectrophotometers must perform according to strict pharmacopeial requirements (e.g., USP, Ph. Eur.), which mandate checks for factors like wavelength accuracy and stray light levels [4].
The sophisticated operation of a UV-Vis spectrophotometer is a symphony performed by its three essential components. The light source provides the initial electromagnetic energy, the monochromator refines it into a specific, precise wavelength, and the detector captures the resulting interaction with the sample. Understanding the principles, characteristics, and limitations of each subsystem—from the choice of lamp and grating to the selection of a single or double-beam configuration—is paramount for researchers and scientists. This knowledge enables them to not only operate the instrument effectively but also to troubleshoot issues, validate methods, and generate reliable, high-quality data that drives discovery and ensures quality in fields ranging from drug development to environmental science.
This technical guide provides an in-depth analysis of deuterium and tungsten-halogen lamps, the principal light sources in UV-Vis spectrophotometry. We examine their fundamental operating principles, spectral characteristics, and performance parameters to establish a scientific basis for source selection in pharmaceutical and analytical applications. By integrating quantitative comparison data with experimental methodology, this work serves as a comprehensive reference for researchers optimizing spectrophotometer configurations for specific analytical requirements within the broader context of understanding UV-Vis instrumentation.
The light source is a critical component of a UV-Vis spectrophotometer, directly influencing the instrument's sensitivity, accuracy, and analytical range [13]. An ideal source must fulfill several key requirements: high brightness across a wide wavelength range, exceptional temporal stability, a long service life, and reasonable cost [13]. No single light source excels in all these areas across the entire UV-Vis spectrum, necessitating the use of complementary sources. Consequently, most conventional spectrophotometers combine a deuterium lamp for the ultraviolet (UV) region and a tungsten-halogen lamp for the visible (VIS) region, automatically switching between them to achieve optimal performance across the full wavelength range [13] [10]. This guide deconstructs the operation and characteristics of these two sources, providing a framework for their optimal selection and use in research and drug development.
Fundamental Operating Principles
Deuterium Lamps: Gas Discharge in the UV Spectrum
A deuterium lamp is a type of gas-discharge light source where light is generated by an arc discharge within low-pressure deuterium gas [14]. Unlike incandescent lamps, the filament is not the primary light emitter; instead, a tungsten filament acts as a hot cathode to initiate a stable arc to an anode [14]. This process requires a pre-heating period of approximately 10-20 seconds for the cathode before the arc can be started [13] [14].
The analytical emission originates from the excitation of molecular deuterium ((D_2)). The electric arc excites the deuterium molecules to a higher energy state. As they transition back to their ground state, they emit a continuous spectrum of UV radiation through a molecular emission process [14]. The key emission range is continuous from 180 nm to 370 nm, with the usable spectrum extending up to approximately 400 nm [13] [15]. The lamp's envelope, constructed from fused quartz or specialized UV glass, is essential for transmitting these short UV wavelengths which would be blocked by ordinary glass [14].
Tungsten-Halogen Lamps: Incandescence and the Regenerative Cycle
Tungsten-halogen lamps operate on the principle of incandescence, where a solid body—the tungsten filament—emits light upon being heated to a high temperature [16]. These lamps are an advanced version of traditional incandescent lamps, featuring a quartz envelope filled with an inert gas and a small amount of a halogen compound, such as hydrogen bromide [13] [16].
Their superior performance and longevity are attributed to the halogen regenerative cycle. In a standard incandescent lamp, evaporated tungsten blackens the bulb walls, reducing light output over time. In a halogen lamp, the evaporated tungsten reacts with the halogen vapor at the hot bulb wall to form a gaseous tungsten halide. This compound circulates back to the high-temperature filament, where it decomposes and redeposits tungsten back onto the filament [16]. This cycle keeps the bulb walls clean and allows the filament to operate at a higher temperature, resulting in a brighter, more stable light output and a longer lifespan [13] [16]. The spectral output typically spans from 350 nm to 3500 nm, with a significant portion of energy emitted as infrared radiation (heat) [13] [16].
Technical Comparison and Performance Data
The following tables summarize the key technical characteristics and performance data for deuterium and tungsten-halogen lamps, providing a direct comparison to inform selection.
Table 1: Spectral and Physical Characteristics
| Parameter | Deuterium Lamp | Tungsten-Halogen Lamp |
|---|---|---|
| Primary Operating Principle | Gas arc discharge [14] | Incandescence with halogen cycle [16] |
| Usable Wavelength Range | 165–400 nm (continuous) [13] [17] | 350–1100 nm [13] [18] |
| Spectral Region | Ultraviolet (UV) [13] | Visible (VIS) to Near-Infrared (NIR) [13] [16] |
| Envelope Material | Fused quartz, UV glass [14] | Quartz, borosilicate glass [16] |
| Typical Warm-up Time | ~10–20 seconds [13] [14] | Nearly instantaneous [13] |
Table 2: Performance and Economic Factors
| Parameter | Deuterium Lamp | Tungsten-Halogen Lamp |
|---|---|---|
| Typical Lifetime | ~2,000 hours [13] [15] | ~2,000 hours (up to 10,000 available) [13] [18] |
| Output Stability (Fluctuation) | ~0.005% (peak-to-peak) [15] | Highly stable over time [13] |
| Relative Cost | More expensive [13] | Affordable / Cost-effective [13] [16] |
| Power Supply | Large, complex (300-500V start) [13] [14] | Simpler |
| Key Strength | High, stable intensity in UV [15] | Bright, stable output in VIS/NIR [13] |
Methodology: Instrument Operation and Source Switching
In a double-beam spectrophotometer, light from the source is directed through a monochromator, which uses a diffraction grating to isolate a specific wavelength [10]. This monochromatic light is then split, passing simultaneously through the sample and a reference cuvette. Detectors, such as photomultiplier tubes (PMTs) or charge-coupled devices (CCDs), measure the intensity of the transmitted light [10]. The instrument's software then calculates the absorbance based on the Beer-Lambert Law [10] [19].
Light Source Switching Mechanism
The instrument automatically switches between the deuterium and halogen lamps within the 300 nm to 350 nm range, where their emission intensities are approximately equal [13] [10]. This transition can be achieved by physically moving the lamps or, more commonly, by rotating a reflector positioned between them. As shown in Figure 3, changing the tilt of this reflector directs the light beam from either the deuterium or halogen lamp into the monochromator, ensuring a seamless spectral scan from UV to visible wavelengths [13].
Essential Research Reagent Solutions
The table below outlines key materials and their functions for experiments utilizing UV-Vis spectrophotometry, such as drug stability testing.
Table 3: Essential Materials for UV-Vis Spectrophotometry
| Item | Function / Application |
|---|---|
| Quartz Cuvettes | Sample holder; transparent to UV light (down to ~190 nm), essential for UV range measurements [10]. |
| UV-Transparent Buffers | Solvent for sample preparation; must not absorb significantly in the UV region of interest to avoid interference [10]. |
| NIST-Traceable Standards | For instrument validation and wavelength calibration [13]. |
| Halogen Lamps | Replacement source for visible light measurements (e.g., colorimetry, reflectometry) [18]. |
| Deuterium Lamps | Replacement source for ultraviolet measurements (e.g., HPLC detection, peptide analysis) [15]. |
Application in Drug Stability Testing
UV-Vis spectrophotometry plays a critical role in pharmaceutical development, particularly in drug stability testing [20]. This process involves subjecting drug formulations to stressors like light, temperature, and pH changes to simulate aging [20]. The spectrophotometer is used to monitor key indicators of stability, such as:
- Potency Determination: Quantifying the concentration of the Active Pharmaceutical Ingredient (API) by measuring its absorbance at a specific wavelength and applying the Beer-Lambert Law [20].
- Impurity Identification: Detecting the formation of degradants by observing changes in the absorption spectrum, such as the appearance of new absorbance peaks or shifts in existing ones [20].
Early and rapid stability testing using UV-Vis allows researchers to predict the commercial viability of drug candidates, guiding resource allocation decisions early in the development pipeline [20].
The selection between deuterium and tungsten-halogen lamps is not a matter of superiority but of spectral appropriateness. The deuterium lamp is the unequivocal source for high-stability, high-intensity measurements in the ultraviolet range (165-400 nm), making it indispensable for analyzing APIs, nucleic acids, and other UV-absorbing compounds [13] [15]. Conversely, the tungsten-halogen lamp provides bright, stable, and cost-effective illumination across the visible spectrum (350-1100 nm), ideal for colorimetric assays, cell density measurements, and visible absorption studies [13] [18].
Understanding the operating principles, performance specifications, and integration mechanics of these two light sources empowers researchers and drug development professionals to optimize their UV-Vis spectrophotometric methods. This knowledge ensures the generation of reliable, high-quality data, from routine quality control to predictive stability testing, solidifying the role of robust spectrophotometry in successful scientific and commercial outcomes.
Within the framework of understanding UV-Vis spectrophotometer operation, the monochromator stands as a critical component responsible for generating pure monochromatic light essential for precise spectroscopic measurements. A monochromator is an optical device that transmits a mechanically selectable narrow band of wavelengths of light or other radiation chosen from a wider range of wavelengths available at the input [21]. The name itself derives from Greek roots: mono- (single), chroma (color), and the Latin suffix -ator (denoting an agent) [21]. In UV-Vis spectrophotometers, this device is typically placed between the light source and the sample compartment, ensuring that only light of a specific wavelength interacts with the analyte [22] [23].
The fundamental purpose of a monochromator within a spectrophotometer is to provide the high-precision wavelength selection necessary for applications based on the Lambert-Beer law, which describes the proportional relationship between absorbance and sample concentration [23]. This capability makes monochromators indispensable across diverse scientific fields, from pharmaceutical quality control and environmental monitoring to advanced materials research [24] [25] [26]. Traditional monochromator-based instruments differ from modern diode-array instruments in their operational principle; the latter reverses the optical path by passing white light through the sample first before dispersing it across an array detector without using a monochromator [22].
Table 1: Core Components of a Monochromator System
| Component | Function | Common Types/Configurations |
|---|---|---|
| Entrance Slit | Controls the amount of light entering and helps define the initial optical beam [21] | Fixed or adjustable width slits |
| Collimating Mirror | Converts diverging light from the slit into a parallel (collimated) beam [21] | Spherical or toroidal curved mirrors |
| Dispersive Element | Spatially separates white light into its constituent wavelengths [21] | Diffraction grating, prism (rare in modern systems) |
| Focusing Mirror | Refocuses the dispersed light onto the focal plane where the exit slit is located [21] | Spherical or toroidal curved mirrors |
| Exit Slit | Selects the desired narrow wavelength band to exit the monochromator [21] | Fixed or adjustable width slits, often linked to entrance slit |
Diffraction Gratings: The Heart of Wavelength Dispersion
Fundamental Principles and Grating Types
In modern spectrophotometers, diffraction gratings have largely replaced prisms as the preferred dispersive element due to their superior dispersion characteristics and linear wavelength separation [23]. A diffraction grating consists of a surface with a large number of parallel and closely spaced grooves—typically 300-2000 grooves per millimeter for ultraviolet and visible regions [21]. When exposed to collimated white light, the grating exploits the phenomenon of interference to disperse light in a direction perpendicular to its grooves, directing specific wavelength components at specific angles according to the diffraction order [21] [23].
The two primary types of master gratings are ruled gratings and holographic gratings, each with distinct characteristics. Ruled gratings are mechanically engraved with triangular-shaped grooves, with the groove slope typically optimized or "blazed" to enhance the brightness of a particular diffraction order [21]. However, these gratings may contain imperfections that produce faint "ghost" diffraction orders, potentially raising the stray light level of a monochromator [21]. Holographic gratings are created using a photolithographic technique based on a holographic interference pattern, resulting in sinusoidal grooves that typically provide lower scattered light levels than blazed gratings, though they may be less bright [21]. Most monochromators use carefully manufactured replica gratings derived from these master gratings to balance performance and cost [21].
Practical Considerations and Overlapping Orders
A critical consideration in grating monochromator design involves managing overlapping spectral orders. Because the fundamental grating equation (mλ = d(sinα + sinβ)) permits multiple wavelengths (λ, λ/2, λ/3, ...) to satisfy the relationship at different orders (m = 1, 2, 3, ...), a monochromator set to a specific wavelength might simultaneously transmit harmonics of that wavelength [21]. This challenge is frequently addressed by incorporating broadband pre-selector filters in the optical path to limit the width of diffraction orders so they do not overlap [21]. In more sophisticated double monochromator systems, this can be achieved by placing a prism monochromator in series with a grating monochromator, where the prism's non-linear dispersion naturally filters out overlapping orders [21].
Table 2: Comparison of Grating Types in Monochromators
| Characteristic | Ruled (Blazed) Gratings | Holographic Gratings |
|---|---|---|
| Manufacturing Process | Mechanical ruling with diamond tools on master substrate [21] | Photolithographic exposure using holographic interference pattern [21] |
| Groove Profile | Triangular (blazed) shape [21] | Sinusoidal shape [21] |
| Primary Advantage | Higher efficiency in the blazed wavelength region [21] | Lower stray light and reduced ghost artifacts [21] |
| Primary Disadvantage | Potential for higher stray light due to ruling imperfections [21] | Typically lower peak efficiency compared to blazed gratings [21] |
| Typical Applications | General purpose spectroscopy where high throughput is prioritized [21] | High-precision measurements requiring minimal stray light [21] |
Slit Widths and Spectral Bandwidth Control
The Role of Slits in Spectral Purity
The entrance and exit slits in a monochromator play a crucial role in defining both the intensity and spectral purity of the output light. The entrance slit, located at the focal point of the collimating mirror, defines the physical size of the light beam entering the optical system [21]. After dispersion by the grating, the focusing mirror creates a series of images of the entrance slit at the focal plane—each image corresponding to a different wavelength [21]. The exit slit, positioned in this focal plane, selectively transmits only the image of the entrance slit corresponding to the desired wavelength, while blocking others [21].
The width of these slits directly controls the spectral bandwidth, which is defined as the width of the wavelength band passing through the exit slit, typically measured as Full Width at Half Maximum (FWHM) [21]. In most monochromators, the entrance and exit slit widths are adjusted together, maintaining a fixed relationship throughout operation [21]. The narrowness of the band of colors that a monochromator can generate is fundamentally related to the focal length of the monochromator collimators, with longer focal lengths generally enabling finer spectral resolution [21].
The Resolution-Throughput Tradeoff
A fundamental tradeoff in monochromator operation exists between spectral resolution and signal-to-noise ratio. Narrower slit widths produce a narrower spectral bandwidth, improving the instrument's ability to distinguish between closely spaced spectral features [22]. However, this comes at the cost of reduced light throughput, which decreases the signal-to-noise ratio and may require longer measurement times [22]. Conversely, wider slit widths increase light intensity at the detector but reduce spectral resolution by allowing a broader range of wavelengths to pass through the exit slit [22].
This relationship is quantified by the spectral bandwidth, typically expressed in nanometers, which represents the compromise between resolution and signal intensity that researchers must balance based on their specific analytical requirements [21] [22]. For example, a monochromator with a spectral bandwidth of 1 nm might be suitable for most quantitative absorption measurements, while characterization of sharp spectral features might require a bandwidth of 0.1 nm or less, despite the associated reduction in signal intensity [21].
Advanced Monochromator Configurations and Performance Characteristics
Double Monochromators and Stray Light Reduction
For applications requiring exceptionally high spectral purity, double monochromators provide significant advantages over single monochromator designs. In this configuration, two monochromators are connected in series, with their mechanical systems operating in tandem so they both select the same wavelength [21]. While this arrangement does not primarily improve the narrowness of the spectrum (bandwidth), it dramatically reduces stray light—defined as the intensity of light of other colors in the exit beam relative to the peak intensity [21].
Whereas a typical high-quality single monochromator might achieve a stray light level of approximately 0.1% (0.001 of the peak value), a double monochromator can reduce this to about one millionth of the peak value (0.000001) by multiplying the individual cutoffs of each section [21]. This exceptional performance makes double monochromators particularly valuable for measuring high optical densities, with instruments capable of measuring narrow band optical attenuation of up to one million-fold (6 Absorbance Units) [21]. Achieving low stray light represents a critical aspect of practical monochromator design and is essential for many demanding analytical applications.
Key Performance Parameters and Their Relationships
Several interrelated parameters define monochromator performance and suitability for specific applications. Dispersion characterizes how effectively the monochromator separates wavelengths spatially, typically expressed as nanometers of spectrum per millimeter of slit width [21]. This factor remains relatively constant for grating-based monochromators but varies with wavelength in prism-based systems [21]. The wavelength range defines the operational limits of the instrument, with many monochromators covering the visible spectrum and extending into the nearby ultraviolet and infrared regions [21]. Dynamic range specifies the maximum attenuation that can be accurately measured when the monochromator is incorporated into a complete spectrophotometer system [21].
Table 3: Monochromator Performance Characteristics and Tradeoffs
| Performance Parameter | Definition | Impact on Measurement | Typical Values/Ranges |
|---|---|---|---|
| Spectral Bandwidth (FWHM) | Width of wavelength band at half maximum intensity [21] | Determines ability to resolve fine spectral features [21] | 0.1 nm to 5 nm (depending on application) [21] |
| Stray Light Level | Ratio of unwanted light to peak intensity at selected wavelength [21] | Affects accuracy at high absorbance values and limits dynamic range [21] | 0.1% for single, 0.0001% for double monochromators [21] |
| Dispersion | Spatial separation of wavelengths per unit slit width [21] | Determines how much slit width affects bandwidth [21] | 1 nm/mm to 10 nm/mm (depends on focal length and grating) [21] |
| Dynamic Range | Maximum optical attenuation that can be accurately measured [21] | Determines suitability for measuring highly absorbing samples [21] | Up to 6 AU for double monochromator systems [21] |
Experimental Considerations and Protocols
Wavelength Calibration and Verification
Regular wavelength calibration represents an essential maintenance procedure for ensuring long-term measurement accuracy in monochromator-based systems. For instruments using deuterium lamps, the intense emission lines at 486.0 nm and 656.1 nm provide built-in calibration references [23]. The experimental protocol involves directing the light source to the monochromator without a sample in place, then scanning through the spectral region surrounding these known emission lines while monitoring detector output. The recorded peak positions are compared against the reference wavelengths, and any systematic offset is corrected through instrument software or hardware adjustment.
For comprehensive calibration across the entire spectral range, holmium oxide or didymium glass filters provide multiple sharp absorption peaks at precisely known wavelengths. The experimental workflow involves placing the reference filter in the sample compartment and collecting a transmission spectrum across the relevant wavelength range. The recorded absorption maxima are then compared to certified reference values, typically at 241.0, 279.3, 287.5, 333.7, 360.8, 418.5, 453.0, 536.0, and 637.5 nm for holmium oxide filters. This procedure should be performed during initial instrument installation, following lamp replacement, and at regular intervals (typically every 3-6 months) depending on usage intensity and required measurement accuracy.
Spectral Bandwidth Selection and Optimization
Determining the optimal spectral bandwidth for a specific application requires empirical testing balanced with theoretical understanding of the resolution-throughput tradeoff. A general protocol involves preparing a standard sample with known spectral features, such as a solution of benzene vapor in hexane or a holmium oxide filter, which exhibits sharp absorption peaks. The measurement is repeated at progressively narrower slit widths (decreasing bandwidth) while monitoring both the resolution of closely spaced spectral features and the signal-to-noise ratio of the baseline.
The optimal bandwidth typically represents the point where further narrowing no longer improves resolution but begins to significantly degrade signal quality through increased noise. For quantitative analysis based on the Lambert-Beer law, the spectral bandwidth should generally be less than one-tenth of the natural width of the absorption band being measured [23]. In practice, most analytical applications in pharmaceutical and chemical research utilize bandwidths between 1-2 nm, while characterization of materials with sharp spectral features may require bandwidths of 0.1-0.5 nm despite the associated reduction in light throughput [21] [22].
The Scientist's Toolkit: Essential Research Reagents
Table 4: Key Reagents and Materials for Monochromator Characterization
| Reagent/Material | Function | Application Context |
|---|---|---|
| Holmium Oxide Filter | Provides sharp, well-characterized absorption peaks for wavelength calibration [23] | Verification of wavelength accuracy across UV-Vis spectrum |
| Deuterium Lamp | Source of continuous UV spectrum with characteristic emission lines [23] | Built-in wavelength calibration reference at 486.0 and 656.1 nm |
| Neutral Density Filters | Known attenuation standards for verifying photometric accuracy [21] | Validation of absorbance measurement linearity and dynamic range |
| Stray Light Filters | Sharp-cutoff filters that block specific wavelength regions [21] | Measurement and verification of monochromator stray light performance |
| Diffraction Gratings | Dispersive elements with specific groove density and blaze wavelength [21] | Core component determining dispersion and efficiency characteristics |
Emerging Trends and Future Perspectives
The field of monochromator technology continues to evolve, driven by demands for higher resolution, miniaturization, and integration with computational methods. Traditional grating-based monochromators now face competition from novel approaches, including computational spectrometers that employ multilayer thin-film filter arrays combined with deep learning algorithms to reconstruct spectral information from compressed measurements [27]. These emerging technologies offer advantages in compact size, rapid measurement time, and potential for commercialization in portable devices [27].
The high-resolution monochromator market reflects these trends, with a current valuation of approximately $500 million in 2024 and projected growth at a compound annual growth rate of 7.5% through 2030 [28]. Key innovation areas include improved spectral resolution through advanced grating technology, miniaturization and integration for portable instrumentation, and the development of specialized monochromators for specific applications in pharmaceutical research, environmental monitoring, and materials characterization [24] [25]. The Asia-Pacific region is expected to show the highest growth potential, driven by increasing industrialization and research investment [28] [25].
Another significant trend involves the integration of monochromators with advanced detector technology and computational processing to overcome traditional limitations. Recent research demonstrates how computational reconstruction methods can augment the performance of diffractive optical elements, enabling high-quality imaging with meta-optics that previously suffered from chromatic aberrations [29]. Similarly, context-aware adaptive processing and physics-constrained data fusion are transforming spectral data preprocessing, enabling unprecedented detection sensitivity achieving sub-ppm levels while maintaining >99% classification accuracy [26]. These innovations point toward a future where monochromator technology increasingly combines precision optical engineering with sophisticated computational methods to expand analytical capabilities across scientific disciplines.
Ultraviolet-Visible (UV-Vis) spectroscopy serves as a fundamental analytical technique in research and drug development, measuring how molecules absorb light in the ultraviolet and visible regions of the electromagnetic spectrum [10]. The core principle involves directing a beam of light through a sample and precisely quantifying the intensity of light that emerges. The detector component is paramount in this process, as it converts faint light signals into measurable electrical currents. The choice of detector directly governs the instrument's sensitivity, dynamic range, and ultimate suitability for specific applications, from checking nucleic acid purity to quantifying protein concentrations [10]. This technical guide provides an in-depth comparison of two primary detector technologies—Photomultiplier Tubes (PMTs) and Silicon Photodiodes—evaluating their operational principles, performance characteristics, and optimal use cases within the context of a UV-Vis spectrophotometer.
Operating Principles and Fundamental Technology
Photomultiplier Tubes (PMTs)
Photomultiplier Tubes are vacuum tube-based detectors that achieve extremely high sensitivity through a multi-stage electron amplification process [30] [31]. The operation begins when a photon of sufficient energy strikes a photocathode, ejecting a primary electron via the photoelectric effect [31]. This electron is then accelerated by a high voltage (typically 1-3 kV) toward a series of electrodes called dynodes [32] [30]. Each dynode is held at a progressively more positive potential. When the electron strikes the first dynode, it knocks out several secondary electrons. These electrons are then accelerated toward the second dynode, and the process repeats, creating a cascading "electron avalanche" [30] [31]. If each of n dynodes produces δ secondary electrons per incident electron, the overall gain G is approximately δⁿ, enabling amplifications as high as 100 million times [30] [31]. This makes PMTs exceptionally capable of detecting single photons.
Silicon Photodiodes
Silicon photodiodes are semiconductor devices that convert light directly into an electrical current without internal gain [33] [34]. They are constructed from high-purity silicon wafers featuring a P-N junction. When a photon with energy greater than the semiconductor's bandgap is absorbed in the active area—particularly within the depletion region around the P-N junction—it generates an electron-hole pair [34]. An internal electric field within the depletion region separates these charge carriers, causing electrons to migrate to the N-type region and holes to the P-type region, thereby generating a photocurrent [34]. This process is known as the photovoltaic effect. In their basic form, photodiodes operate as nearly unity-gain devices; each absorbed photon produces one electron-hole pair, resulting in quantum efficiencies that can reach up to 80% but offering no internal amplification [33] [34]. For applications requiring higher sensitivity, Avalanche Photodiodes (APDs) operate under a higher reverse bias, where a strong electric field accelerates photogenerated carriers to cause impact ionization and limited internal current multiplication [33].
Detection Workflow in a UV-Vis Spectrophotometer
The following diagram illustrates the logical sequence of how light is processed and detected within a UV-Vis instrument, culminating in the distinct operational stages for PMT and photodiode detectors.
Performance Comparison: Sensitivity and Operational Range
Key Performance Metrics
The selection between a PMT and a photodiode hinges on several key performance parameters that define a detector's sensitivity and operational range.
- Gain: This is the internal multiplication factor of the generated photocurrent. PMTs provide extremely high gain (10⁶ to 10⁸), while standard photodiodes have no internal gain (gain = 1) [32] [33] [31].
- Spectral Response: This defines the range of wavelengths a detector can sense. PMT response is dictated by the photocathode material, typically covering 150-1700 nm, but often with lower efficiency in the red/NIR region [32] [33]. Silicon photodiodes inherently cover ~200-1100 nm, with a peak response in the near-infrared [34].
- Quantum Efficiency (QE) vs. Photon Detection Efficiency (PDE): QE is the probability that an incident photon will liberate a photoelectron (for PMTs) or create an electron-hole pair (for photodiodes) [32] [34]. PMTs typically have peak QE values of ~35-40% around 420 nm [32]. Silicon photodiodes have a significantly higher inherent QE, which can reach up to 80% or more, meaning they are more efficient at converting photons into electrical charge [33] [34]. For SiPMs, the relevant metric is PDE, which is the product of QE, the probability of initiating an avalanche, and the geometric fill factor of the microcells [32].
- Noise and Dark Current: This is the electrical current generated in the absence of light, setting the lower detection limit. PMTs exhibit very low dark current, often corresponding to dark count rates of just a few Hz to kHz at room temperature [32] [33]. Photodiodes and especially APDs/SiPMs have higher inherent noise due to thermal generation of carriers in silicon [32] [33].
- Dynamic Range: This is the span between the minimum detectable light level and the level at which the detector saturates. PMTs offer a very broad dynamic range due to their linear response over many orders of magnitude [33]. The dynamic range of a SiPM is mechanically limited by its finite number of microcells [32] [33].
Quantitative Detector Comparison
The following table summarizes the key quantitative and qualitative differences between PMTs, standard photodiodes, and the more advanced Silicon Photomultiplier (SiPM).
Table 1: Performance Comparison of Photomultiplier Tubes and Silicon-Based Detectors
| Parameter | Photomultiplier Tube (PMT) | Silicon Photodiode (PD) | Silicon Photomultiplier (SiPM) |
|---|---|---|---|
| Operating Principle | Photoelectric effect & secondary emission [30] [31] | Photovoltaic effect [34] | Geiger-mode APD array [32] [33] |
| Internal Gain | 10⁶ – 10⁸ (Very High) [32] [31] | 1 (None) [33] | 10⁵ – 10⁶ (High) [32] |
| Operating Voltage | 1 – 3 kV (High) [32] | 0 – 50 V (Low; may be reverse biased) [34] | 35 – 60 V (Low) [32] |
| Spectral Range | 150 – 1700 nm [32] | ~200 – 1100 nm [34] | 250 – 980 nm [32] |
| Peak QE / PDE | ~40% QE @ 420 nm [32] | Up to ~90% QE [33] | Up to 63% PDE @ 420 nm [32] |
| Dark Current / Noise | Very Low (Hz–kHz) [32] | Low | High (100s kHz/mm² at room temp) [32] |
| Dynamic Range | Very Broad [33] | Wide (with external amp) [33] | Limited by microcell count [32] [33] |
| Magnetic Field Immunity | Poor (requires shielding) [32] | Excellent | Excellent [32] |
| Robustness | Fragile (glass vacuum tube) [32] | Rugged (solid-state) [32] | Rugged (solid-state) [32] |
| Primary Cost Driver | High voltage circuitry, tube itself [33] | Inexpensive [33] | Moderate |
Experimental Protocol for Detector Characterization
Researchers evaluating detectors for a specific UV-Vis application can adapt the following general methodology to quantify and compare critical performance parameters.
- Objective: To quantitatively determine the sensitivity, noise, and dynamic range of a PMT and a photodiode detector within a UV-Vis instrument setup.
- Materials and Reagents:
- UV-Vis Spectrophotometer: Configured with interchangeable detector modules for PMT and photodiode.
- Stable Light Source: A deuterium lamp (UV) and tungsten halogen lamp (Vis) calibrated for output stability.
- Neutral Density (ND) Filters: A calibrated set of filters to attenuate light intensity accurately over a wide range (e.g., OD 0.1 to 4.0).
- Standard Reference Materials: NIST-traceable spectral standards (e.g., holmium oxide for wavelength accuracy, metalized quartz for transmittance).
- Stray Light Reference Solution: A high-purity potassium chloride or sodium iodide solution to measure stray light performance.
- Signal Recording Equipment: A low-noise digital oscilloscope and a precision picoammeter for current measurement.
- Methodology:
- Wavelength Accuracy Calibration: Using the holmium oxide filter, scan the characteristic absorption peaks and record the deviation of measured peaks from certified values for each detector.
- Signal-to-Noise (SNR) Measurement: Block the light path to measure the dark signal (Idark). Then, illuminate the detector with a low, constant intensity at 500 nm. Record the total signal (Isignal + Idark) over time. Calculate SNR as (Mean Signal - Mean Dark) / Standard Deviation of Dark.
- Dynamic Range and Linearity: Using the set of ND filters, measure the detector's output current across attenuation levels from maximum transmission to near darkness. Plot the measured photocurrent versus the calculated incident intensity (based on filter calibration) to identify the linear range and saturation point.
- Spectral Responsivity: Scan the monochromator across the operational range (e.g., 200-800 nm) with a constant slit width, using a calibrated reference detector to normalize the output of the test detector. This generates a relative responsivity curve.
The Scientist's Toolkit: Essential Research Reagents and Materials
Table 2: Key Reagents and Materials for UV-Vis Detector Evaluation and Spectroscopy
| Item | Function / Explanation |
|---|---|
| Holmium Oxide Filter | A NIST-traceable wavelength standard used to verify the accuracy of the spectrophotometer's wavelength scale, a critical pre-requisite for any detector comparison [10]. |
| Neutral Density Filters | Calibrated filters that attenuate light uniformly across a range of wavelengths. They are essential for experimentally determining the dynamic range and linearity of a detector [10]. |
| Stray Light Solution | A solution like Potassium Chloride (for UV cutoff) used to assess the level of stray light within the instrument, which can impact the apparent sensitivity and accuracy of the detector at low light levels [10]. |
| Quartz Cuvettes | Required for UV measurements below 300 nm, as glass and plastic cuvettes absorb UV light significantly. Ensures that detector performance is measured without interference from the sample holder [10]. |
| Deuterium Lamp | A UV light source used for performance testing in the ultraviolet range. Its stability is crucial for obtaining reproducible sensitivity measurements [10] [35]. |
Application Scenarios and Selection Guidelines
The optimal detector choice is dictated by the specific requirements of the application. The following diagram outlines a decision-making workflow to guide the selection process.
- Choose a PMT when your application demands the ultimate in sensitivity for detecting extremely low light levels, down to individual photons [32] [31]. This makes PMTs ideal for fluorescence spectroscopy, Raman spectroscopy, and low-light scattering experiments [31]. They are also the preferred choice when a very wide dynamic range is needed to measure samples with highly variable concentrations without needing to adjust the detector gain [33].
- Choose a Silicon Photodiode when the light intensity is relatively high, and the primary requirements are cost-effectiveness, small size, and operational simplicity [33] [34]. They are perfectly suited for standard absorbance measurements in colorimetric assays, DNA/RNA quantification, and quality control in industrial settings where high gain is not necessary [10].
- Choose an APD or SiPM when you need a balance of solid-state robustness and higher sensitivity than a standard photodiode can provide. APDs are a strong choice for red to near-infrared detection [33]. SiPMs, with their high gain and immunity to magnetic fields, are becoming the detector of choice for emerging applications like integrated PET/MRI scanners and portable, battery-powered radiation monitors [32]. Their low-voltage operation also simplifies instrument design.
Both Photomultiplier Tubes and Silicon Photodiodes offer distinct advantages that make them suitable for different challenges within UV-Vis spectroscopy and related analytical fields. The traditional PMT remains unparalleled for applications requiring the highest possible gain and the lowest noise for single-photon counting, despite its larger size, fragility, and high operating voltage. In contrast, silicon photodiodes provide a compact, rugged, and cost-effective solution for routine measurements with ample light. The emergence of advanced solid-state technologies like SiPMs is blurring these historical boundaries, offering PMT-like gain in a solid-state package with magnetic immunity. For the researcher or drug development professional, the optimal choice is not a question of which technology is universally superior, but which detector's performance profile—in sensitivity, spectral range, dynamic range, and practical integration—best aligns with the specific analytical problem at hand.
In the realm of analytical science, UV-Vis spectrophotometry serves as a fundamental technique for quantifying and qualifying molecular species in solution. This methodology operates on the principle of measuring the absorption of ultraviolet or visible light by a sample, which provides critical data on concentration and purity, integral to fields such as pharmaceutical development and biochemical research [36] [37]. The reliability of this data, however, is fundamentally governed by the stability of the instrument itself. Within this context, the architectural dichotomy between single-beam and double-beam spectrophotometers presents a critical consideration for researchers. This technical guide examines the core operational principles of these two designs, with a focused analysis on their inherent stability. Framed within broader research on UV-Vis functionality, this paper elucidates how instrument design compensates for intrinsic and external variables to ensure data integrity, a non-negotiable requirement in drug development and high-precision research.
Fundamental Operational Principles
The Working Principle of a UV-Vis Spectrophotometer
At its core, a UV-Vis spectrophotometer operates on the Beer-Lambert Law, which establishes a logarithmic relationship between the attenuation of light passing through a sample and the properties of that sample [36]. The law is mathematically expressed as ( A = \epsilon \cdot c \cdot l ), where ( A ) is the absorbance, ( \epsilon ) is the molar absorptivity coefficient, ( c ) is the concentration of the analyte, and ( l ) is the path length of light through the sample. The instrument is designed to measure the intensity of light before ( I0 ) and after ( I ) it passes through the sample, with absorbance calculated as ( A = \log{10}\frac{I_0}{I} ) [38] [37]. To execute this measurement, all UV-Vis spectrophotometers consist of several key components: a light source (e.g., tungsten, deuterium, or xenon flash lamp), a monochromator (or grating) to select specific wavelengths, a sample holder (cuvette or micro-volume platform), and a detector (e.g., photodiode, CCD) to convert light intensity into an electrical signal [36] [37].
Single-Beam Spectrophotometer Design
A single-beam spectrophotometer employs a singular, undivided optical path. The light beam originates from the source, is conditioned by the monochromator to a specific wavelength, and passes through the sample cuvette before reaching the detector [39] [38]. The measurement process is sequential. First, a blank (reference) solution is placed in the sample holder to measure the initial light intensity ( I_0 ). This blank is then manually replaced with the sample to measure the transmitted light intensity ( I ) [40]. The simplicity of this design, with fewer optical components, is its primary advantage, resulting in a lower initial cost and a more compact instrument footprint [39] [41] [42].
Double-Beam Spectrophotometer Design
A double-beam spectrophotometer introduces a beamsplitter (e.g., a half-mirrored device or rotating chopper) into the optical path immediately after the monochromator. This device divides the incoming monochromatic light into two beams of equal intensity: the sample beam and the reference beam [39] [38]. The sample beam is directed through the sample cuvette, while the reference beam is simultaneously directed through an identical cuvette containing only the pure solvent or blank. Two detectors, or a single detector that alternately reads the two beams, measure the intensities of the transmitted light ( Is ) and ( Ir ) from the sample and reference, respectively. The absorbance is then calculated based on the ratio of these two intensities ( A = \log{10}\frac{Ir}{I_s} ) [41] [38]. This simultaneous measurement is the cornerstone of the double-beam design's enhanced stability.
The following diagram illustrates the key differences in the light paths and operational workflows of these two designs:
Comparative Analysis: Stability Under Scrutiny
Stability in spectrophotometry refers to an instrument's ability to provide consistent, drift-free measurements over time, unaffected by external disturbances or internal component variations. The fundamental design differences between single- and double-beam instruments lead to significant disparities in their performance regarding stability.
Mechanisms of Stability and Error Compensation
Double-Beam Compensating Mechanism: The double-beam design's primary advantage is its real-time, ratiometric compensation for disturbances [38]. Key fluctuations, such as voltage variations, light source intensity drift (e.g., as the lamp warms up or ages), and electronic circuit instabilities, affect both the sample and reference beams equally [39] [38]. Since the absorbance result is derived from the ratio ( \frac{Ir}{Is} ), these common-mode disturbances cancel out. This provides a high level of immunity to drift, ensuring that the baseline remains stable over extended periods and that measurements are highly reproducible [40] [38]. Furthermore, this design negates the need for a lengthy lamp warm-up period, conserving lamp life and improving sample throughput [39] [41].
Single-Beam Susceptibility: The single-beam instrument lacks this compensatory mechanism. Any fluctuation in the light source intensity or detector sensitivity between the separate blank and sample measurements directly introduces error into the calculated absorbance value ( A = \log{10}\frac{I0}{I} ), because ( I_0 ) is no longer an accurate reference for the new ( I ) [39] [38]. This makes the single-beam design highly susceptible to drift over time, mechanical component instability, and ambient temperature fluctuations, which can cause abnormal results and reduce the reliability of data, especially in long-running experiments [39] [40].
Quantitative Performance Comparison
The following table summarizes the critical performance characteristics of each design, with a focus on stability and related metrics:
| Performance Characteristic | Single-Beam Spectrophotometer | Double-Beam Spectrophotometer |
|---|---|---|
| Measurement Mode | Sequential (blank then sample) | Simultaneous (sample & reference) |
| Stability (Drift Compensation) | Low; susceptible to source and electronic drift [40] [38] | High; automatically compensates for source fluctuations and drift [39] [38] |
| Accuracy | Limited; errors increase at high/low absorbance due to drift [38] | Superior; maintained across a wider absorbance range via ratiometric measurement [38] |
| Precision (Reproducibility) | Lower due to baseline drift and noise [38] | Significantly higher due to reduced drift and noise [40] [38] |
| Dynamic Range | Limited; can saturate at high/low absorbance [38] | Wider; ratiometric measurement allows accurate analysis of high/low absorbance samples [38] |
| Signal-to-Noise Ratio | Lower (sensitive to fluctuations) | Improved via fluctuation compensation [39] |
| Typical Measurement Time | Slower (requires separate blank measurement) [42] | Faster (simultaneous measurement) [42] |
| Typical Warm-Up Time | Required, can impact stability | Little to no warm-up time required [39] [41] |
Experimental Protocols for Stability Assessment
For researchers validating instrument performance or incorporating stability metrics into their methodology, the following protocols are essential.
Protocol 1: Baseline Drift Over Time
- Objective: To quantify the instrument's baseline stability, a critical factor for measurement accuracy over extended periods.
- Methodology:
- Instrument Preparation: For a double-beam instrument, place matched, pure solvent blanks in both the sample and reference cuvette holders. For a single-beam instrument, place a single blank and take an initial reference measurement.
- Data Acquisition: Set the spectrophotometer to monitor absorbance at a specific, commonly used wavelength (e.g., 340 nm). For a double-beam instrument, the baseline absorbance (the difference between two blanks) should be recorded. For a single-beam instrument, the instrument is zeroed at the start, and the drift from zero is recorded.
- Duration: Record the absorbance value(s) every minute for a period of 60-120 minutes without any user intervention or re-calibration.
- Data Analysis: Plot absorbance versus time. The slope of the resulting line and the peak-to-peak noise are key metrics. A double-beam instrument is expected to demonstrate a flatter slope and lower noise, indicating superior baseline hold and stability [38].
Protocol 2: Absorbance Reproducibility
- Objective: To evaluate the precision and reproducibility of measurements, which is directly impacted by instrumental stability.
- Methodology:
- Sample Preparation: Prepare a stable standard solution with an absorbance in the mid-range (e.g., ~0.5 AU), such as a potassium dichromate solution.
- Measurement: For a single-beam instrument, a fresh blank measurement must be taken before each sample measurement. For a double-beam instrument, the blank remains in the reference holder.
- Replication: Measure the absorbance of the standard solution ten (10) times sequentially.
- Data Analysis: Calculate the mean, standard deviation, and coefficient of variation (CV) for the ten measurements. A double-beam instrument, by compensating for real-time fluctuations, will typically yield a significantly lower CV, demonstrating higher precision and reproducibility [38].
The Scientist's Toolkit: Essential Research Reagent Solutions
The following reagents and materials are fundamental for conducting rigorous UV-Vis experiments, particularly those focused on stability and method validation.
| Reagent / Material | Function & Importance in Stability Analysis |
|---|---|
| High-Purity Solvents (e.g., HPLC-grade water, spectral-grade organic solvents) | Serves as the blank/reference and sample matrix. High purity is essential to minimize background absorbance, which can introduce noise and mask instrumental drift [39] [38]. |
| Stable Absorbance Standards (e.g., Potassium Dichromate, Holmium Oxide filters) | Used for instrument calibration and validation. These materials provide known, stable absorbance peaks at specific wavelengths, allowing researchers to verify wavelength accuracy and photometric scale accuracy over time [38]. |
| Matched Quartz Cuvettes | The gold-standard for UV-Vis analysis. Quartz is transparent down to 190 nm. Using a "matched pair" ensures that the sample and reference paths in a double-beam instrument are identical, which is critical for accurate ratiometric measurement and stability [39] [38]. |
| Neutral Density Filters | These are stable, solid-state filters with known absorbance values. They are ideal for performing reproducibility tests without the variability associated with chemical solutions, providing a direct measure of instrumental precision [38]. |
The choice between single-beam and double-beam spectrophotometer designs is fundamentally a trade-off between initial cost and analytical performance, with stability being the pivotal factor. Single-beam instruments, with their simpler optics and lower cost, are suitable for educational settings or dedicated, routine analyses in quality control where cost and simplicity are prioritized, and high long-term stability is not critical [40] [42]. However, for the core demands of scientific research and drug development—where accuracy, precision, and reproducibility over time are non-negotiable—the double-beam design is unequivocally superior. Its inherent ability to perform simultaneous, ratiometric measurement provides automatic compensation for the primary sources of instrumental drift and instability. This robust design ensures data integrity, mitigates the risk of analytical errors, and fulfills the stringent requirements of a modern research laboratory, thereby solidifying its role as a cornerstone instrument in the pursuit of reliable scientific discovery.
The Beer-Lambert Law (also referred to as Beer's Law) represents a fundamental principle in optical spectroscopy that establishes a quantitative relationship between the attenuation of light through a substance and the properties of that substance [43]. This law serves as the mathematical cornerstone for quantitative analysis across numerous scientific disciplines, enabling researchers to determine concentrations of absorbing species in solution through precise optical measurements [44]. When integrated with UV-Vis spectrophotometry, the Beer-Lambert Law provides researchers and drug development professionals with a powerful, non-destructive analytical tool for material characterization, purity assessment, and concentration determination [45].
The law synthesizes historical contributions from multiple scientists: Pierre Bouguer (1729) who first observed the exponential attenuation of light through the atmosphere, Johann Heinrich Lambert (1760) who mathematically formalized the relationship between absorption and path length, and August Beer (1852) who later established the proportional relationship between absorption and solute concentration [44]. This collective legacy has produced one of the most valuable tools in modern analytical chemistry, particularly in pharmaceutical analysis where it enables rapid, accurate quantification of active compounds during drug development and quality control processes [46].
Mathematical Foundation
Fundamental Concepts: Transmittance and Absorbance
When monochromatic light passes through a sample solution, its intensity decreases from the initial incident intensity ((I_0)) to a lower transmitted intensity ((I)) [43]. This interaction is quantified through two fundamental parameters:
- Transmittance ((T)) is defined as the fraction of incident light that passes through the sample: (T = \frac{I}{I0}) [43] [47]. It is commonly expressed as a percentage: (\%T = \frac{I}{I0} \times 100) [43].
- Absorbance ((A)) is defined as the negative logarithm of transmittance: (A = -\log{10}(T) = \log{10}\left(\frac{I_0}{I}\right)) [43] [47]. This logarithmic relationship converts the exponential attenuation of light into a linear quantity suitable for quantitative analysis [44].
The inverse logarithmic relationship between transmittance and absorbance means that each unit increase in absorbance corresponds to a tenfold decrease in transmittance [43] [44].
Table 1: Relationship Between Absorbance and Transmittance
| Absorbance (A) | Transmittance (T) | Percent Transmittance (\%T) |
|---|---|---|
| 0 | 1 | 100% |
| 0.3 | 0.5 | 50% |
| 1 | 0.1 | 10% |
| 2 | 0.01 | 1% |
| 3 | 0.001 | 0.1% |
The Beer-Lambert Equation
The Beer-Lambert Law establishes a linear relationship between absorbance and the properties of the absorbing species [43]. The fundamental equation is:
[A = \varepsilon \cdot c \cdot l]
Where:
- (A) is the measured absorbance (dimensionless) [47]
- (\varepsilon) is the molar absorptivity or molar absorption coefficient (typically in L·mol⁻¹·cm⁻¹) [43] [47]
- (c) is the concentration of the absorbing species (typically in mol·L⁻¹) [43] [47]
- (l) is the optical path length through the sample (typically in cm) [43] [47]
The molar absorptivity ((\varepsilon)) is a substance-specific constant at a given wavelength that represents how strongly a chemical species absorbs light at that wavelength [43]. The path length ((l)) is typically determined by the width of the cuvette used for measurement, with 1 cm being the most common standard [43] [10].
Beer-Lambert Law Relationship Between Light Attenuation and Sample Properties
Practical Implementation in UV-Vis Spectrophotometry
UV-Vis spectrophotometers operationalize the Beer-Lambert Law through several key components that work in concert to measure light absorption by samples [45] [10]:
Light Source: Typically utilizes two lamps - a deuterium lamp for UV light (190-400 nm) and a tungsten or halogen lamp for visible light (400-800 nm) [45] [10]. The instrument switches between sources during scanning, with the transition typically occurring between 300-350 nm where light emission from both sources is comparable [10].
Wavelength Selector: A monochromator containing a diffraction grating selects specific wavelengths from the broad-spectrum light source [45] [10]. The grating groove frequency (typically 1200-2000 grooves per mm) determines the optical resolution, with blazed holographic diffraction gratings providing superior quality measurements compared to ruled diffraction gratings [10].
Sample Container: Cuvettes hold the sample and reference solutions. For UV measurements, quartz cuvettes are essential as they are transparent to UV light, while glass and plastic cuvettes are unsuitable due to significant UV absorption [10]. Standard path lengths are 1 cm, though shorter path lengths (e.g., 1 mm) may be used when sample availability is limited [10].
Detection System: Modern instruments employ detectors based on photoelectric coatings (photomultiplier tubes) or semiconductors (photodiodes, charge-coupled devices) that convert transmitted light intensity into electronic signals proportional to light intensity [10].
UV-Vis Spectrophotometer Component Workflow
Quantitative Analysis Methodology
The primary application of the Beer-Lambert Law in research involves determining unknown concentrations through calibration curves [43]. The experimental protocol involves:
Step 1: Preparation of Standard Solutions A series of standard solutions with known concentrations are prepared using precise dilution techniques [46]. For example, in the development of a method for terbinafine hydrochloride, standard solutions were prepared in the concentration range of 5-30 μg/mL by diluting a stock solution (100 μg/mL) with distilled water [46].
Step 2: Spectral Measurement The absorbance of each standard solution is measured at the wavelength of maximum absorption (λmax) [46]. The reference (blank) solution contains only the solvent used to prepare the samples, enabling correction for solvent absorption and reflection losses [10]. For terbinafine hydrochloride, the λmax was determined to be 283 nm [46].
Step 3: Calibration Curve Construction A calibration curve is generated by plotting absorbance versus concentration for the standard solutions [43]. The curve should yield a straight line passing through the origin, with the slope equal to the product of the molar absorptivity and path length (ε·l) [43]. Linear regression analysis provides the equation for the line, typically in the form (y = mx + b), where (m) represents the slope and (b) the y-intercept [46]. In the terbinafine hydrochloride study, the linear regression equation was reported as (Y = 0.0343X + 0.0294) with a correlation coefficient (r²) of 0.999, indicating excellent linearity [46].
Step 4: Determination of Unknown Concentrations The absorbance of unknown samples is measured under identical conditions, and their concentrations are calculated using the regression equation derived from the calibration curve [43].
Table 2: Validation Parameters for UV-Vis Spectrophotometric Methods
| Validation Parameter | Experimental Approach | Acceptance Criteria |
|---|---|---|
| Linearity | Measure absorbance of standard solutions across concentration range | Correlation coefficient (r²) ≥ 0.999 [46] |
| Accuracy | Recovery studies at 80%, 100%, 120% of target concentration | Recovery 98-102% [46] [48] |
| Precision | Repeat analysis (n=6) at same concentration | Relative Standard Deviation (RSD) < 2% [46] |
| Limit of Detection (LOD) | Based on standard deviation of response and slope | LOD = 3.3 × σ/S [46] |
| Limit of Quantification (LOQ) | Based on standard deviation of response and slope | LOQ = 10 × σ/S [46] |
Advanced Applications in Pharmaceutical Research
Method Development and Validation
The Beer-Lambert Law provides the foundation for developing and validating UV-spectrophotometric methods for pharmaceutical analysis [46]. These methods must demonstrate suitable linearity, accuracy, precision, and sensitivity according to International Conference on Harmonisation (ICH) guidelines [46]. For example, a validated method for terbinafine hydrochloride exhibited linearity in the concentration range of 5-30 μg/mL, with accuracy (98.54-99.98% recovery) and precision (%RSD < 2) suitable for quality control of pharmaceutical formulations [46].
Similar validation approaches have been applied to diverse compounds, including chalcones, where a method demonstrated linearity from 0.3-17.6 μg/mL with recoveries of 98-102% [48]. The specificity of these methods can be established by demonstrating accurate quantification of the target compound in the presence of potential interferents, as shown for trans-chalcone quantification in the presence of flavanols, flavones, and flavonols [48].
Research Reagent Solutions and Materials
Table 3: Essential Research Reagents and Materials for UV-Vis Spectrophotometry
| Reagent/Material | Function/Purpose | Application Example |
|---|---|---|
| Quartz Cuvettes | Sample container with defined path length; transparent in UV-Vis range | Essential for UV measurements below 350 nm [10] |
| Reference Solvent | Matches solvent used for sample preparation; corrects for solvent absorption | Water, methanol, acetonitrile, or buffer solutions [46] |
| Standard Compounds | High-purity reference materials for calibration curves | Terbinafine hydrochloride (≥99% purity) [46] |
| Deuterium Lamp | UV light source for 190-400 nm range | Provides continuous spectrum in UV region [10] |
| Tungsten/Halogen Lamp | Visible light source for 400-800 nm range | Provides continuous spectrum in visible region [10] |
| Diffraction Grating | Wavelength selection within monochromator | Blazed holographic gratings provide better optical resolution [10] |
Limitations and Practical Considerations
While the Beer-Lambert Law provides an excellent foundation for quantitative analysis, researchers must recognize its limitations and the conditions required for valid application:
Fundamental Limitations
Concentration Limitations: The law assumes that molar absorptivity (ε) remains constant with concentration, but at higher concentrations (typically >0.01 M), electrostatic interactions between molecules can alter absorption characteristics [49]. Additionally, at high concentrations, the refractive index of the solution changes with concentration, leading to deviations from linearity [50].
Optical Effects: The derivation of the Beer-Lambert Law neglects the wave nature of light and associated phenomena such as interference and diffraction [49] [50]. In thin films or samples with highly reflective surfaces, interference effects can cause significant deviations from predicted absorbance values [49].
Spectral Bandwidth: The law assumes truly monochromatic light, but practical instruments have finite spectral bandwidths [49]. If the bandwidth is significant compared to the width of the absorption peak, deviations from linearity will occur [50].
Chemical Deviations: Chemical reactions such as association, dissociation, or complex formation can alter the absorption characteristics of the analyte and cause deviations from Beer-Lambert behavior [50]. These effects are particularly pronounced in pH-sensitive systems or when analyte-solvent interactions occur [49].
Instrumental and Measurement Considerations
Stray Light: Imperfections in monochromators allow light outside the nominal wavelength to reach the detector, causing negative deviations from the Beer-Lambert Law, particularly at high absorbances [50].
Optical Mismatch: Differences in refractive index between sample and reference solutions can lead to disparate reflection losses, introducing errors in absorbance measurements [49] [50]. This effect becomes more pronounced with larger differences in refractive index.
Fluorescence: If the absorbing species fluoresces, the emitted light may reach the detector, resulting in measured transmittance values that are higher than true transmittance [50].
Optimal Absorbance Range: For accurate quantification, absorbance values should generally be maintained between 0.1 and 1.0 AU [10]. Below this range, detector sensitivity limitations introduce error; above this range, insufficient light reaches the detector for reliable measurement [10].
The Beer-Lambert Law remains an indispensable mathematical foundation for quantitative concentration analysis using UV-Vis spectrophotometry. Its integration into modern instrumentation provides researchers and pharmaceutical professionals with a robust, reproducible methodology for determining analyte concentrations across diverse applications from drug development to quality control. While the law has specific limitations that must be considered in experimental design and data interpretation, its proper application following validated protocols enables precise, accurate quantification of chemical species in solution. As spectroscopic technologies advance, the fundamental relationship described by the Beer-Lambert Law continues to underpin innovative analytical methods that drive discovery and ensure product quality in the pharmaceutical industry and beyond.
The Beer-Lambert Law (also known as Beer's Law) is a fundamental principle in spectroscopy that relates the attenuation of light to the properties of a material through which light is traveling. This law provides the theoretical foundation for quantitative analysis in UV-Vis spectrophotometry, enabling researchers to determine concentrations of analytes in solution [47] [43]. At its core, the law states that the absorbance of light by a solution is directly proportional to the concentration of the absorbing species and the path length of the light through the solution [47]. This relationship is mathematically expressed as A = εcl, where A represents absorbance, ε is the molar absorptivity, c is the molar concentration, and l is the path length [47] [51]. This equation serves as the cornerstone for most quantitative spectroscopic methods used in research and drug development.
The physical phenomenon described by this law involves the interaction of photons with molecules in solution. When monochromatic light passes through a solution containing absorbing species, photons are absorbed when their energy matches the energy required to promote electrons to higher energy states. The subsequent measurement of how much light is absorbed provides critical information about the nature and quantity of the absorbing species [47]. For researchers and drug development professionals, understanding the precise application and limitations of this relationship is essential for accurate analytical measurements, method development, and validation in pharmaceutical and biochemical applications.
Fundamental Parameters of Absorbance
Molar Absorptivity (ε)
Molar absorptivity, also known as the molar extinction coefficient, is a fundamental physical constant that measures how strongly a chemical species absorbs light at a specific wavelength [52] [51]. It is an intrinsic property of the substance that depends on the molecular structure, solvent, temperature, and wavelength of light [53]. The parameter ε is defined as the absorbance of a solution with a concentration of 1 M measured with a path length of 1 cm [47] [51]. Substances with high molar absorptivity values are very effective at absorbing light, enabling detection at lower concentrations, which is particularly valuable in analytical chemistry and pharmaceutical testing where analyte concentrations may be very small [52].
The terminology surrounding this parameter has evolved, and researchers should be aware that "molar absorptivity" or "molar absorption coefficient" are the preferred terms according to IUPAC recommendations, while "extinction coefficient" is considered obsolete and discouraged in modern scientific literature [51] [53]. The SI units for molar absorptivity are square meters per mole (m²/mol), but in practice, quantities are usually expressed in M⁻¹·cm⁻¹ or L·mol⁻¹·cm⁻¹, which are numerically equivalent to 0.1 m²/mol [51]. In biochemical contexts, the molar absorption coefficient of proteins at 280 nm depends primarily on the number of aromatic residues, particularly tryptophan, and can be predicted from the amino acid sequence [51].
Path Length (l)
Path length represents the distance that light travels through the sample solution, typically measured in centimeters. In conventional spectrophotometry, this is determined by the width of the cuvette used for measurement, with 1 cm being the standard [47] [43]. According to the Beer-Lambert Law, absorbance is directly proportional to path length [47]. This means that if the path length is doubled, the absorbance will also double, assuming constant concentration and molar absorptivity. This relationship holds true for homogeneous solutions measured under standard conditions.
The path length factor becomes particularly important in specialized sampling techniques. Micro-volume methods with reduced path lengths (e.g., 0.1 cm or less) enable the measurement of highly concentrated samples without requiring excessive dilution. Conversely, long-pathlength cells are employed for analyzing very dilute solutions where enhanced detection sensitivity is needed. The linear relationship between path length and absorbance forms the basis for these methodological adaptations in analytical practice.
Concentration (c)
Concentration represents the quantity of the absorbing species present in the solution, typically expressed in moles per liter (M) [47] [43]. The Beer-Lambert Law establishes that absorbance is directly proportional to concentration, which is the principle that enables quantitative analysis using UV-Vis spectroscopy [47] [43]. This linear relationship allows researchers to construct calibration curves using standards of known concentration, which can then be used to determine unknown concentrations in test samples.
It is important to note that the concentration must be based on the number of molecules in a given volume (e.g., molar concentration) rather than mass or weight fractions for the Beer-Lambert relationship to hold true [49]. The linear dependence on concentration has fundamental limitations that become apparent at higher concentrations, where the assumption of non-interacting molecules breaks down [54]. For this reason, analytical measurements typically utilize dilute solutions where the linear relationship between absorbance and concentration remains valid.
Theoretical Framework and Mathematical Relationships
The Beer-Lambert Law has its origins in the work of Pierre Bouguer (1729) and Johann Heinrich Lambert (1760), who established the relationship between light attenuation and the thickness of the absorbing medium [49]. Beer later extended this principle to incorporate concentration dependence, resulting in the modern formulation of the law [49]. The fundamental mathematical relationship is derived from the logarithmic dependence of absorbance on the ratio of incident to transmitted light intensity [47] [43].
The absorbance (A) is defined as:
[A = \log{10} \left( \frac{I0}{I} \right)]
Where (I_0) is the intensity of incident light, and (I) is the intensity of transmitted light [47] [43]. The complete Beer-Lambert equation is then expressed as:
[A = \epsilon l c]
Where:
- (A) is the measured absorbance (dimensionless)
- (\epsilon) is the molar absorptivity (M⁻¹·cm⁻¹)
- (l) is the path length (cm)
- (c) is the concentration (M) [47] [51]
This logarithmic relationship means that each unit of absorbance corresponds to a tenfold reduction in light intensity [43]. For example, an absorbance of 1 indicates that 10% of the incident light is transmitted, while an absorbance of 2 indicates only 1% transmission [47] [43]. This relationship holds under specific conditions, primarily when using monochromatic light, dilute solutions, and in the absence of chemical interactions or scattering phenomena [54] [49].
Diagram 1: UV-Vis Spectrophotometry Workflow based on the Beer-Lambert Law.
Critical Experimental Considerations and Protocols
Control of Absorbance Using Potassium Dichromate
The calibration of UV-Vis spectrophotometers for absorbance accuracy is typically performed using certified reference materials, with potassium dichromate in sulfuric acid being one of the most common standards [55]. The detailed experimental protocol involves:
Preparation of Standard Solution: Dry potassium dichromate by heating to constant weight at 130°C. Accurately weigh between 57.0 mg and 63.0 mg and transfer to a 1000 mL volumetric flask. Dissolve and dilute to volume with 0.005M sulfuric acid [55].
Measurement Procedure: Measure the absorbance of the prepared potassium dichromate solution at four critical wavelengths: 235 nm, 257 nm, 313 nm, and 350 nm [55].
Calculation: Determine the specific absorptivity A(1%, 1 cm) at each wavelength using the formula: [ A(1\%, 1 \text{ cm}) = \frac{\text{Absorbance} \times 10000}{\text{Weight of potassium dichromate in mg}} ] [55]
Acceptance Criteria: The calculated A(1%, 1 cm) values must fall within established tolerance limits as shown in Table 1 [55].
Table 1: Acceptance Criteria for Potassium Dichromate Absorbance Standard
| Wavelength (nm) | A(1%, 1 cm) Limit Range |
|---|---|
| 235 | 122.9 - 126.2 |
| 257 | 142.8 - 145.7 |
| 313 | 47.0 - 50.3 |
| 350 | 105.6 - 108.2 |
Resolution Power Assessment
The resolution power of a spectrophotometer determines its ability to distinguish between closely spaced absorption peaks. The experimental protocol for verifying resolution power uses a toluene in hexane solution [55]:
Preparation of Solution: Prepare a 0.02% v/v solution of toluene in hexane. Prior to use, verify that hexane exhibits transmittance not less than 97% between 260-420 nm using water as a blank [55].
Spectral Measurement: Record the absorption spectrum of the toluene solution in the range of 260 nm to 420 nm.
Calculation and Acceptance: Identify the absorbance maximum at approximately 269 nm and the minimum at approximately 266 nm. Calculate the ratio of absorbance at 269 nm to that at 266 nm. The instrument meets resolution specifications if this ratio is not less than 1.5 [55].
Stray Light Verification
Stray light, defined as detected light outside the nominal wavelength band, can seriously affect absorbance accuracy, particularly at high absorbance values. The experimental protocol for assessing stray light limits uses potassium chloride solution [55]:
Preparation of Solution: Accurately prepare a 1.2% w/v solution of potassium chloride in water.
Measurement Procedure: Measure the absorbance of the potassium chloride solution at 198.0, 199.0, 200.0, 201.0, and 202.0 nm using water as a blank.
Acceptance Criteria: The measured absorbance at each wavelength must be greater than 2.0, confirming minimal stray light contribution to the signal [55].
Limitations and Deviations from the Beer-Lambert Law
While the Beer-Lambert Law provides a fundamental framework for spectrophotometric analysis, several critical limitations affect its practical application. Understanding these limitations is essential for proper experimental design and data interpretation in research and pharmaceutical development.
Fundamental Limitations
Recent research has revealed that the Beer-Lambert Law has inherent limitations beyond the commonly recognized experimental factors. According to electromagnetic theory, absorbance at a particular spectral point does not necessarily depend linearly on concentration, even in the absence of molecular interactions or instrumental nonlinearities [54]. This deviation arises because the absorption band shape changes with concentration due to the relationship between the absorption index and the complex index of refraction [54]. These fundamental limitations become particularly significant at higher concentrations where the assumption of non-interacting molecules breaks down.
The integrated absorbance (area under the absorption band) rather than peak absorbance demonstrates linear dependence on concentration [54]. Numerical integration studies have shown that deviations from linearity for integrated absorbance remain below 0.1%, making it a more reliable parameter for quantitative work, especially for complex samples or higher concentration ranges [54]. This approach aligns with quantum mechanical interpretations where integrated absorbance reflects transition probability, which should indeed remain constant with concentration changes [54].
Practical Limitations
Several well-known practical limitations can affect adherence to the Beer-Lambert relationship:
Chemical Interactions: Molecular interactions such as association, dissociation, complex formation, or polymerization can alter molar absorptivity, leading to deviations from predicted absorbance [54] [49]. These effects become more pronounced at higher concentrations.
Instrumental Factors: Finite spectral bandwidth, stray light, detector nonlinearity, and insufficient spectral resolution can all contribute to measurement deviations [54]. Regular instrument calibration and validation are essential to minimize these effects.
Refractive Effects: The wave nature of light causes interference effects, particularly in thin films or samples with parallel interfaces, leading to fluctuations in measured intensity that are not accounted for in the simple Beer-Lambert formulation [49]. These effects can alter both band intensities and shapes in infrared spectroscopy.
Microheterogeneity: Samples that are not microhomogeneous, such as suspensions, emulsions, or porous materials, can scatter light, leading to apparent absorbance that does not follow the Beer-Lambert relationship [49]. Scattering effects become particularly problematic when particle sizes approach the wavelength of measurement light.
Table 2: Research Reagent Solutions for Spectrophotometric Analysis
| Reagent | Function | Application Context |
|---|---|---|
| Potassium Dichromate | Absorbance Standard | Instrument calibration and validation |
| 0.005M Sulfuric Acid | Solvent Medium | Provides acidic environment for stability |
| Toluene in Hexane | Resolution Standard | Verification of instrument resolution power |
| Potassium Chloride | Stray Light Standard | Assessment of stray light limitations |
| High-Purity Water | Blank Solvent | Reference measurements and dilution |
Advanced Applications in Research and Drug Development
The precise understanding of molar absorptivity, path length, and their impact on absorbance measurements enables sophisticated applications in pharmaceutical and biochemical research. The quantitative determination of protein concentration using UV absorbance at 280 nm relies on the known molar absorptivities of aromatic amino acids (tryptophan, tyrosine, and phenylalanine) and disulfide bonds [51]. Algorithms have been developed to predict molar absorptivity based on amino acid sequence, allowing researchers to calculate extinction coefficients for recombinant proteins without pure standards [51].
In drug development, dissolution testing often employs UV-Vis spectroscopy to monitor API (Active Pharmaceutical Ingredient) release from dosage forms. The path length factor becomes critical in flow-through cell systems where unconventional path lengths may be employed. Method validation must account for the linear dynamic range of detection, which is directly influenced by the molar absorptivity of the API at the monitored wavelength.
For nucleic acid quantification, the molar absorptivity at 260 nm enables determination of concentration and purity in DNA and RNA samples, with specific coefficients known for each nucleotide base [51]. The A260/A280 ratio assessment for nucleic acid purity relies on the differential molar absorptivities of nucleic acids versus protein contaminants.
Diagram 2: Interrelationship of Beer-Lambert Law Parameters and Limitations.
The parameters of molar absorptivity and path length form the foundation of quantitative absorbance measurements in UV-Vis spectroscopy. While the Beer-Lambert Law provides a straightforward mathematical relationship between these parameters and measured absorbance, researchers must recognize both the practical and fundamental limitations of this relationship. Proper instrument calibration using standardized protocols, understanding of the integrated absorbance approach for concentration determination, and awareness of matrix effects on molar absorptivity are essential for accurate analytical results. For drug development professionals and researchers, these considerations are particularly critical in method development, validation, and regulatory compliance, where accurate concentration measurements directly impact product quality and patient safety. As spectroscopic techniques continue to evolve, the fundamental principles of the Beer-Lambert Law remain essential for translating measured absorbance into meaningful chemical and biological information.
Practical Implementation: Method Development and Pharmaceutical Applications
In UV-Vis spectrophotometry, sample preparation is a critical foundational step that directly determines the accuracy, reliability, and reproducibility of analytical results. This technique measures the absorption of ultraviolet and visible light by a sample, which is quantitatively described by the Beer-Lambert Law. This law states that the absorbance (A) of a solution is directly proportional to the concentration (c) of the absorbing species, the path length (l) of the light through the sample, and the molar absorptivity (ε) of the species: A = εlc [8] [19]. Proper sample preparation ensures that this relationship holds true by minimizing interferences, controlling matrix effects, and providing optimal conditions for measurement. Without well-prepared samples, even the most sophisticated spectrophotometer can yield deceptive results that lead to incorrect interpretations [56]. This guide provides researchers and drug development professionals with comprehensive best practices for solvent selection, dilution techniques, and contamination prevention specifically within the context of UV-Vis spectroscopic analysis.
Fundamentals of UV-Vis Spectrophotometry
A UV-Vis spectrophotometer operates by passing a beam of light through a sample and measuring the intensity of light transmitted through it. The instrument compares this transmitted light intensity (I) to the original incident light intensity (I₀) to calculate transmittance and subsequently absorbance [8]. Modern instruments typically consist of several key components: a light source (often deuterium for UV and tungsten for visible regions), a monochromator or polychromator with diffraction gratings to select specific wavelengths, a sample compartment, and a detector (such as photomultiplier tubes, CCD, or CMOS detectors) to capture the transmitted light [8] [19].
The absorption of light occurs when photons interact with the electronic and vibrational states of molecules. Each molecular species possesses a unique set of energy levels associated with its chemical bonds, leading to characteristic absorption spectra that serve as qualitative identification fingerprints [19]. For quantitative analysis, the Beer-Lambert Law provides the mathematical foundation, enabling researchers to determine unknown concentrations from absorbance measurements at specific wavelengths when the molar absorptivity and path length are known [8] [19].
Solvent Selection Criteria for UV-Vis Analysis
Choosing an appropriate solvent is paramount in UV-Vis sample preparation as the solvent medium directly affects the absorption characteristics, stability, and apparent concentration of analytes.
Key Solvent Properties
- Purity and Grade: Always use high-purity solvents specifically graded for spectroscopic applications. HPLC grade or spectrophotometric grade solvents are essential as they contain minimal UV-absorbing impurities that can cause false peaks or elevated baselines [57]. For example, in pharmaceutical research where identifying and quantifying compounds is crucial, solvent impurities can significantly interfere with accurate results [8].
- Polarity: Solvent polarity should match the chemical nature of the analyte. Polar solvents like water, methanol, and acetonitrile effectively dissolve polar compounds, while non-polar solvents such as hexane and toluene are suitable for non-polar analytes [57]. The polarity also influences spectral shifts; some compounds may exhibit different absorption maxima in solvents of varying polarity due to solvatochromism.
- UV Transparency: The solvent must be transparent in the spectral region where the analyte absorbs. As shown in Table 1, different solvents have specific UV cut-off wavelengths below which they absorb too strongly to be useful [57]. For example, if measuring absorbance below 205 nm, solvents like water (cut-off ~190 nm) are preferable to acetonitrile (cut-off ~190 nm) or methanol (cut-off ~205 nm).
- Volatility: Consider the evaporation rate during sample handling and measurement. Highly volatile solvents may evaporate during analysis, leading to concentration changes [57]. However, volatile solvents are advantageous when sample concentration is required prior to analysis.
- Chemical Compatibility: The solvent must not react chemically with the analyte. Additionally, it should be compatible with the sample cell or cuvette material (e.g., quartz, glass, plastic) to prevent dissolution or degradation of the cell [57].
Table 1: Properties of Common Solvents Used in UV-Vis Spectroscopy
| Solvent | UV Cut-off (nm) | Polarity | Common Applications | Boiling Point (°C) | Safety Considerations |
|---|---|---|---|---|---|
| Water | ~190 [57] | High | Biomolecules, salts [57] | 100 [57] | Low toxicity, minimal safety concerns |
| Methanol | ~205 [57] | High | LC-MS, organic compounds [57] | 64.7 [57] | Flammable, toxic by ingestion/inhalation |
| Acetonitrile | ~190 [57] | Moderate | LC-MS, pharmaceuticals [57] | 81.6 [57] | Flammable, releases toxic vapors when heated |
| Hexane | ~210 [57] | Low | Lipids, hydrocarbons [57] | 68.7 [57] | Highly flammable, irritant |
| Ethanol | ~210 [57] | High | GC/LC, broad applications [57] | 78.4 [57] | Flammable, requires ventilation |
| Isopropanol | ~210 [57] | Moderate | Protein precipitation [57] | 82.6 [57] | Flammable, proper ventilation required |
| Toluene | ~285 [57] | Low | Aromatics, polymers [57] | 110.6 [57] | Flammable, toxic, requires fume hood |
Specialty Solvents and Additives
For challenging analytical scenarios, specialty solvents and additives may be employed:
- Solvent Blends and Mixtures: Custom mixtures can optimize solubility for complex samples or create specific elution profiles. Always ensure solvent compatibility to prevent precipitation [57].
- Ion-Pairing Reagents: Reagents like trifluoroacetic acid (TFA) or heptafluorobutyric acid (HFBA) can enhance the separation and analysis of ionic compounds in hyphenated techniques like LC-UV [57].
- Derivatization Reagents: These chemicals modify the analyte structure to improve volatility, detectability, or absorption characteristics. Common examples include silylation, alkylation, and acylation agents [57].
Dilution Techniques and Concentration Optimization
Proper dilution is essential for obtaining measurable absorbance values that fall within the instrument's optimal detection range, typically between 0.1 and 1.0 absorbance units [56].
Determining Optimal Concentration
The target concentration depends on the analyte's molar absorptivity and the measurement path length. Using the Beer-Lambert Law, you can estimate the required concentration:
- Determine the analyte's molar absorptivity (ε) at the target wavelength from literature or preliminary experiments.
- For a standard 1 cm path length and target absorbance of 0.5-1.0, calculate concentration as c = A/(εl).
- If the estimated concentration is too low (resulting in weak signal) or too high (causing complete light absorption), adjust accordingly [56].
For analytes with unknown extinction coefficients, perform a dilution series to establish the linear range of the absorbance-concentration relationship.
Practical Dilution Methods
- Serial Dilution: This method provides high accuracy for creating multiple concentration standards. Use clean, dedicated glassware for each dilution step to prevent carryover:
- Prepare a stock solution of known concentration.
- Transfer a known volume of stock to a fresh container.
- Add precisely measured solvent to achieve the desired dilution factor.
- Mix thoroughly but gently to ensure homogeneity without introducing bubbles [58].
- Single-Step Dilution: Suitable when only one dilution is needed. Always use calibrated volumetric equipment such as pipettes, burettes, or volumetric flasks [58].
- Path Length Adjustment: For highly concentrated samples, use cuvettes with shorter path lengths (e.g., 1 mm instead of 10 mm) to effectively reduce absorbance without physical dilution. Some modern microvolume spectrophotometers automatically adjust the path length to extend the dynamic range [56] [19].
Contamination Prevention and Quality Assurance
Contamination control is fundamental to obtaining reliable UV-Vis results, as impurities can significantly alter absorption measurements.
Cuvette Handling and Cleaning
The sample container plays a critical role in measurement accuracy:
- Cleaning Protocol: Before use, thoroughly clean cuvettes using a standard glassware washing procedure. As a minimum, rinse them with the solvent to be used in the measurement, followed by rinsing with a compatible solvent like acetone, isopropanol, or deionized water [56].
- Handling Technique: Always handle cuvettes by the non-optical surfaces to prevent fingerprints and smudges that scatter light. Use lint-free wipes for drying [56].
- Compatibility Check: Ensure the cuvette material (quartz, glass, or plastic) is compatible with your solvent. For example, organic solvents may dissolve certain plastic cuvettes [56].
- Reference Measurement: Always take a reference (blank) measurement using the cuvette filled only with the pure solvent. This corrects for any absorbance or reflectance from the cuvette itself and the solvent [56].
Sample Preparation Integrity
- Complete Dissolution: Ensure samples are completely dissolved before measurement. Undissolved particles cause light scattering, leading to erroneously high absorbance readings [56].
- Filtration: Filter solutions through appropriate membrane filters (0.2 µm or 0.45 µm) to remove particulates that could scatter light or clog instrumentation in hyphenated systems [56] [57].
- Storage Conditions: Store prepared samples appropriately to prevent degradation or evaporation. Use tightly sealed containers, and protect light-sensitive samples from photodegradation [57].
- Cross-Contamination Prevention: Use dedicated glassware and clean pipette tips for each sample and solvent to prevent cross-contamination [57].
Experimental Protocols for UV-Vis Sample Preparation
Protocol 1: Standard Solution Preparation for Quantitative Analysis
This protocol outlines the steps for preparing solution samples for concentration measurement in quartz cuvettes.
Table 2: Research Reagent Solutions for UV-Vis Analysis
| Item | Function | Application Notes |
|---|---|---|
| Quartz Cuvette | Holds sample for measurement | Preferred for UV range; transparent down to ~190 nm [56] |
| Spectrophotometric Grade Solvent | Dissolves analyte without interference | Minimal UV-absorbing impurities [57] |
| Volumetric Flasks | Precise solution preparation | Class A glassware for accurate dilutions |
| Micro-pipettes | Accurate liquid handling | Calibrated for precise volume transfer |
| Syringe Filters | Removes particulate matter | 0.2 µm or 0.45 µm pore size [57] |
Procedure:
- Cuvette Preparation: Clean quartz cuvettes using an appropriate washing procedure. Rinse thoroughly with the solvent to be used, then with a rinsing agent like acetone or isopropanol, and finally with the sample solvent itself [56].
- Solvent Blank: Fill a cuvette with the pure solvent to be used for sample preparation. This will serve as the reference blank [56].
- Stock Solution Preparation: Weigh the analyte accurately and dissolve in a known volume of solvent to create a stock solution. Ensure complete dissolution [56].
- Dilution Series: Using serial dilution techniques, prepare a range of standard concentrations from the stock solution. Use volumetric flasks or precise pipetting for accuracy [58].
- Filtration: Filter each standard solution through a 0.2 µm or 0.45 µm syringe filter to remove particulates [57].
- Measurement: Load each standard into clean cuvettes and measure absorbance at the target wavelength. Always use the solvent blank to zero the instrument before measurements [56].
Protocol 2: Thin Film Sample Preparation
For solid samples or materials that cannot be dissolved, thin film preparation is an alternative approach.
Procedure:
- Substrate Selection: Use appropriate substrates such as quartz glass for UV-transparent measurements or specialized reflective substrates for absorbance studies [56].
- Substrate Cleaning: Thoroughly clean substrates before film deposition to ensure uniform coating and adhesion. Remove all organic residues using appropriate solvents [56].
- Film Deposition: Deposit samples using techniques such as spin-coating, drop-casting, or spray-coating. For spin-coating, optimize spin speed and precursor concentration to control film thickness [56].
- Film Quality Control: Prepare films as smooth and uniform as possible. Defects, pinholes, or inconsistencies will scatter light and affect measurements [56].
- Thickness Optimization: Ensure the film thickness is appropriate—if too thick, insufficient light will transmit; if too thin, the signal may be too weak to measure accurately [56].
UV-Vis Sample Preparation Workflow
Advanced Considerations for Specific Applications
Nucleic Acid and Protein Quantification
UV-Vis spectroscopy is extensively used for nucleic acid and protein analysis. Specific considerations apply:
- Nucleic Acids: Measure absorbance at 260 nm. The A260/A280 ratio indicates purity (ideal values: ~1.8 for DNA, ~2.0 for RNA). The A260/A230 ratio assesses organic compound contamination [8] [19].
- Proteins: Use absorbance at 280 nm (tryptophan and tyrosine absorption) or specialized protein assays (Bradford, BCA). For microvolume analysis, modern instruments can measure samples as small as 0.5 µL [8] [19].
Pharmaceutical Applications
In drug development, UV-Vis serves multiple roles from compound identification to quality control:
- Compound Identification: Absorption spectra provide characteristic fingerprints for raw material verification [8].
- Quality Control: Monitor batch-to-batch consistency and detect impurities through spectral deviations [8].
- Dissolution Testing: Assess drug release profiles from formulations [8].
Microvolume Sampling
Modern spectrophotometers enable microvolume analysis (typically 0.5-2 µL) without cuvettes:
- Advantages: Conserves precious samples, eliminates cuvette cleaning, enables high-throughput analysis [8] [19].
- Technique: The sample is held between two pedestals by surface tension. The instrument automatically detects and adjusts the path length (often 0.05-1 mm) [19].
- Considerations: Ensure the sample completely covers the measurement surface without bubbles. Clean pedestals thoroughly between measurements [19].
Proper sample preparation is both an art and a science in UV-Vis spectrophotometry. By carefully selecting appropriate solvents, implementing precise dilution techniques, and maintaining rigorous contamination control, researchers can ensure the accuracy and reliability of their spectroscopic data. These practices are particularly crucial in drug development where decisions based on spectroscopic results can have significant implications for product quality and patient safety. As UV-Vis instrumentation continues to advance with features like microvolume sampling and virtual dilution capabilities, the fundamental principles of good sample preparation remain constant. Mastering these techniques enables researchers to fully leverage the power of UV-Vis spectroscopy as a robust analytical tool in both research and quality control environments.
In UV-Vis spectrophotometry, the cuvette serves as the critical interface between the sample and the instrument, ensuring light passes through the liquid in a controlled and defined manner. These small, typically rectangular vessels feature polished optical windows on either two or four sides, designed to hold liquid samples for spectral analysis [59] [60]. The primary function of a cuvette is to provide a consistent and accurate optical path length—the distance light travels through the sample—which is a fundamental parameter in the Beer-Lambert law for determining analyte concentration [61].
The selection of an appropriate cuvette is not merely a procedural step but a foundational aspect of method development. An improper choice can lead to inaccurate absorbance readings, reduced measurement linearity, and compromised data integrity. Key considerations extend beyond basic dimensions to encompass material transparency at target wavelengths, chemical compatibility with samples, and physical compatibility with the spectrometer's sample chamber [62] [59]. This guide provides a comprehensive framework for researchers to make informed cuvette selections, ensuring the reliability of their spectroscopic data across diverse applications from drug development to quality control.
The Science of Cuvette Materials
The material of a cuvette directly dictates its optical performance by determining which wavelengths of light can pass through with minimal absorption or distortion. Each material possesses a unique molecular structure that interacts with photons of specific energy levels, thereby defining its characteristic transmission window.
Fundamental Operating Principle of a UV-Vis Spectrophotometer
Understanding how a spectrophotometer works clarifies the cuvette's role. The instrument operates by passing a beam of light through the sample and measuring the intensity of light that emerges [61].
Figure 1: Schematic workflow of a UV-Vis spectrophotometer
- Light Source: Provides broad-spectrum light, often using a combination of lamps (e.g., tungsten/halogen for visible light and deuterium for UV light) to cover the full UV-Vis range [10].
- Wavelength Selection: A monochromator or filter isolates a specific, narrow band of wavelengths from the broad-spectrum source to probe the sample [10].
- Sample Analysis: The selected wavelength passes through the sample held in the cuvette. A reference or "blank" measurement is essential for background correction [10].
- Detection: A detector converts the transmitted light intensity into an electrical signal [10].
- Data Output: The instrument calculates and outputs absorbance (A) or transmittance (T) based on the initial (I₀) and transmitted (I) light intensities: A = -log(T) = -log(I/I₀) [61]. This relationship allows for concentration determination via the Beer-Lambert Law: A = εcl, where ε is the molar absorptivity, c is concentration, and l is the path length [61].
Comparative Analysis of Cuvette Materials
The core differentiator among cuvettes is the material, which governs their transmission range, chemical resistance, and optimal use cases.
Quartz Cuvettes (Fused Silica)
Quartz, specifically synthetic fused silica, is the premium material for high-precision spectroscopy. Its amorphous structure and high purity grant it exceptional optical properties [63].
- UV-Grade Quartz (ES Quartz): This is the gold standard for UV-Vis spectroscopy, offering excellent transmission from approximately 190 nm to 2500 nm [64] [60]. This broad range seamlessly covers deep UV, visible, and near-infrared regions, making it universally applicable for measurements including nucleic acids (260 nm) and proteins (280 nm) [63].
- IR Quartz: Specialized for experiments extending into the infrared, with a typical transmission range from 220 nm to 3500 nm [64].
Beyond its optical performance, fused quartz exhibits high chemical resistance to most acids and solvents (except hydrofluoric acid and hot, concentrated alkalis) and can withstand extreme thermal stress, with some types rated for temperatures over 1000°C [63].
Optical Glass Cuvettes
Typically made from borosilicate or other specialty optical glasses, these cuvettes are workhorses for visible light applications. They provide good transmission from about 340 nm to 2500 nm [64] [65]. Their primary limitation is strong absorption of ultraviolet light below approximately 340 nm, rendering them unsuitable for UV spectroscopy [62] [61]. While chemically resistant to many aqueous solutions, they are more susceptible to damage from strong alkalis compared to quartz [63].
Plastic Cuvettes
Manufactured from polymers like polystyrene (PS) or polymethyl methacrylate (PMMA), plastic cuvettes are cost-effective and disposable [62] [65].
- Standard Plastic: Transparent primarily in the visible region, from 380 nm to 780 nm [64] [60].
- UV-Transparent Plastic: Made from specialized plastics (e.g., UVT acrylic or polystyrene) that extend transmission down to ~220-270 nm, serving as a disposable alternative for some UV applications [60].
The significant trade-off for low cost and disposability is poor chemical resistance. Plastic cuvettes are easily damaged or dissolved by many organic solvents [63].
Table 1: Comparative Properties of Common Cuvette Materials
| Property | Quartz (Fused Silica) | Optical Glass | Plastic (PS/PMMA) |
|---|---|---|---|
| Wavelength Range | 190–2500 nm (UV-Vis-NIR) [64] [60] | 340–2500 nm (Vis-NIR) [64] [65] | 380–780 nm (Visible) [64] [60] |
| UV Transparency | Excellent (Essential for <300 nm) [63] | Opaque below ~340 nm [62] | Opaque below ~380 nm [60] |
| Chemical Resistance | High (Resists most acids & solvents) [63] | Moderate (Degrades with strong bases) [63] | Low (Attacked by solvents like acetone) [63] |
| Max Temperature | 150–1200 °C [63] | ~90 °C [63] | ~60 °C [63] |
| Autofluorescence | Very Low [63] | Moderate [63] | High [63] |
| Relative Cost | High [65] | Moderate [65] | Low (Disposable) [65] |
| Lifespan | Years (with proper care) [63] | Months to Years [63] | Single-use or limited uses [65] |
Selection Guide by Application
Choosing the correct cuvette is a strategic decision based on the experimental goals, sample properties, and instrumental requirements. The following guidelines and visual workflow ensure optimal selection.
Decision Workflow for Cuvette Selection
A logical, step-by-step approach prevents common errors and ensures reliable data.
Figure 2: Cuvette selection decision workflow
Application-Specific Recommendations
UV-Vis Absorbance Measurements (e.g., DNA/RNA, Protein Quantification): Quartz cuvettes are mandatory for any application involving ultraviolet light [63] [65]. This includes the standard assays for nucleic acid concentration and purity (260/280 nm ratio) and protein characterization [60]. Using glass or standard plastic cuvettes for these measurements will result in signal loss and highly inaccurate data because these materials block UV light [63].
Fluorescence Spectroscopy: For fluorescence, where light is detected at a 90-degree angle to the excitation beam, a four-window quartz cuvette is required [63] [59]. All four sides must be optically polished to allow for the excitation and emission light paths. Quartz's exceptionally low autofluorescence is critical for minimizing background noise and achieving high sensitivity [63].
Visible Light Absorbance Only (e.g., Colorimetric Assays, Bacterial OD): For measurements strictly within the visible range (e.g., 600 nm for bacterial culture density, or colorimetric assays like Bradford or BCA for proteins), optical glass or plastic cuvettes are sufficient and more economical [60] [61]. Plastic disposables are ideal for high-throughput screens or to avoid cross-contamination [65].
Experiments with Organic Solvents or Extreme Conditions: Quartz offers superior chemical resistance against most acids and organic solvents [63]. Glass is a second choice but can be attacked by strong bases. Standard plastic cuvettes should never be used with organic solvents as they can dissolve or craze the material [63] [60].
Practical Considerations and Protocols
Successful implementation extends beyond material selection to encompass physical dimensions, handling, and standardized experimental procedures.
Cuvette Sizes, Volume, and Path Length
Path Length: The 10 mm path length is the global standard [63] [61]. This dimension directly corresponds to the path length (l) in the Beer-Lambert law, simplifying concentration calculations. While other path lengths (e.g., 2 mm, 5 mm) are available for highly concentrated or scarce samples, the 10 mm remains the default for its balance of sensitivity and convenience [64].
Volume and Z-Dimension: Cuvettes are categorized by their required sample volume, which is linked to the internal dimensions and the instrument's Z-dimension (the height of the light beam) [62] [59].
- Macro: >3.5 mL
- Standard: 3.5 mL
- Semi-Micro: 0.35 mL - 3.5 mL
- Micro-Volume: < 0.35 mL The sample volume must be sufficient to fully cover the light path. A common rule is to fill the cuvette to no more than 80% of its total capacity to prevent spills, but ensure the meniscus is well above the Z-dimension beam height [64] [59].
Table 2: Standard Cuvette Types by Volume and Path Length
| Type | Typical Path Length | Typical Volume | Primary Use Case |
|---|---|---|---|
| Macro | 10 mm | 3.5 mL to 35 mL [60] | Abundant samples, temperature-controlled studies [60] |
| Standard | 10 mm | 3.5 mL [61] | Routine analysis, general purpose [61] |
| Semi-Micro | 10 mm | 0.35 mL - 3.5 mL [59] | Limited sample availability |
| Micro | 10 mm (short path also available) | 20 μL - 350 μL [59] | Precious or expensive samples |
Standard Experimental Protocol for UV-Vis Absorbance Measurement
This protocol outlines the general procedure for conducting a cuvette-based absorbance measurement, such as for DNA quantification.
Research Reagent Solutions:
- Spectrophotometer: Instrument that measures light absorption.
- Quartz Cuvette (1 cm path length): Holds sample; quartz is essential for UV light transmission [63].
- DNA Sample: The analyte of interest, prepared in a suitable buffer (e.g., TE buffer).
- Blank Solution: The reference solution containing everything except the analyte (e.g., TE buffer only) [10].
- Micropipettes and Tips: For accurate and precise liquid handling.
- Lint-Free Wipes: For cleaning and drying the cuvette's optical surfaces without scratching.
Methodology:
- Instrument Warm-up and Setup: Power on the UV-Vis spectrophotometer and allow the lamps to stabilize for at least 15 minutes. Set the desired wavelength (e.g., 260 nm for DNA) [10].
- Cuvette Handling: Using gloves, handle the quartz cuvette only by its frosted or opaque sides to prevent fingerprints on the optical windows [65].
- Blank Measurement: Fill the cuvette with the blank solution to about 80% capacity (~3 mL for a standard cuvette). Wipe the outside with a lint-free wipe. Place it in the sample compartment and initiate the "blank" or "auto-zero" function to calibrate the instrument [10].
- Sample Measurement: Carefully empty the cuvette. Rinse it twice with a small amount of your DNA sample to prevent dilution. Fill it with the DNA sample, wipe the exterior, place it in the compartment, and record the absorbance value [10].
- Data Analysis: The instrument provides the absorbance (A). For double-stranded DNA, an absorbance of 1.0 at 260 nm corresponds to a concentration of approximately 50 µg/mL (A = εcl, where ε is the known absorptivity constant) [60].
- Post-Use Cleaning: Immediately after use, clean the cuvette thoroughly with an appropriate solvent (e.g., water for aqueous solutions), followed by rinsing with high-purity water and air-drying upside down on a clean tissue [65].
Cuvette Care and Handling Best Practices
- Cleaning: Clean immediately after use. For reusable cuvettes, use mild detergents or solvents compatible with the material. Rinse extensively with high-purity water to remove all residues [65].
- Storage: Store cuvettes in their original protective cases to prevent scratches and chips. Keep them in a clean, dry environment.
- Lifetime Management: Quartz and glass cuvettes can last for years with proper care. Regularly inspect optical surfaces for scratches, cloudiness, or cracks that can scatter light and affect data accuracy.
The Scientist's Toolkit: Essential Materials
Table 3: Essential Reagents and Materials for Cuvette-Based Spectroscopy
| Item | Function/Description |
|---|---|
| Quartz Cuvettes (10 mm path, 2- and 4-window) | The standard vessel for UV-Vis and fluorescence measurements; 4 windows are essential for fluorescence assays [63]. |
| Optical Glass Cuvettes (10 mm path) | A cost-effective, reusable option for experiments confined to the visible light spectrum [61]. |
| Disposable Plastic Cuvettes | Ideal for high-throughput visible-light assays or when cross-contamination is a concern [65]. |
| High-Purity Solvents (e.g., HPLC-grade Water) | Used for preparing samples, blanks, and rinsing cuvettes to minimize background contamination and scattering. |
| Lint-Free Wipes | For safely cleaning the optical surfaces of cuvettes without introducing scratches or fibers. |
| TE Buffer or Appropriate Sample Solvent | A common buffer for nucleic acid samples; the blank must match the sample's solvent composition [10]. |
| Micropipettes and Certified Tips | For accurate and precise measurement and transfer of sample and blank solutions. |
Selecting the appropriate cuvette is a critical determinant of success in UV-Vis spectroscopy. The choice between quartz, glass, and plastic hinges primarily on the required wavelength range, with quartz being indispensable for UV light transmission and fluorescence applications due to its broad spectral range and low autofluorescence [63]. For visible-light-only analyses, optical glass or plastic provide cost-effective alternatives [61]. Secondary factors, including chemical compatibility, thermal stability, and sample volume, further refine the selection process. By adhering to the guidelines and protocols outlined in this document, researchers and drug development professionals can ensure the integrity of their spectroscopic data, thereby reinforcing the reliability of their scientific conclusions and the quality of their developmental outputs.
This technical guide details the core principles of method development in Ultraviolet-Visible (UV-Vis) spectroscopy, a foundational technique in pharmaceutical research and drug development. The process is framed within the broader thesis of understanding how a UV-Vis spectrophotometer functions as a complete analytical system, from light-matter interactions to data interpretation for precise quantitative analysis.
Instrumental Principles: The Foundation of Method Development
A thorough understanding of UV-Vis spectrophotometer operation is crucial for robust method development. The instrument's components directly impact the quality of the data acquired for wavelength selection and calibration [10].
- Light Source: A single xenon lamp provides a high-intensity beam across both UV and visible ranges, while a two-lamp system (deuterium for UV and tungsten/halogen for visible) offers an alternative. The instrument switches between sources around 300-350 nm for seamless scanning [10] [66].
- Wavelength Selection: A monochromator, typically using a blazed holographic diffraction grating (often with ≥1200 grooves/mm), separates broadband light from the source into discrete wavelengths. This selects the specific wavelength passed through the sample, which is critical for defining the analytical method [10].
- Sample Analysis: The sample is contained in a cuvette placed in the light path. For UV measurements, quartz cuvettes are essential as they are transparent to UV light, unlike glass or plastic. A "blank" or reference sample containing only the solvent is always measured to correct for solvent absorption [10] [66].
- Detection: A photodetector converts the transmitted light intensity into an electrical signal. Common detectors include photomultiplier tubes (PMTs) for high sensitivity and photodiodes or charge-coupled devices (CCDs) for general use [10].
The following workflow diagrams the logical process of instrumental operation and its connection to analytical method development.
UV-Vis Spectrophotometer Operation and Method Development Logic
Wavelength Selection Strategies
The primary goal of wavelength selection is to identify the wavelength of maximum absorbance (λ_max) for the analyte, as this provides the highest sensitivity and minimizes the relative error in concentration measurement [10].
Experimental Protocol for Single-Component Analysis
This protocol outlines the steps to determine the λ_max for a pure analyte.
- Sample Preparation: Prepare a standard solution of the analyte in a suitable solvent. The solvent must be transparent in the spectral region of interest. Common solvents for UV-Vis include ethanol, water, or hexane [66] [67].
- Instrument Calibration: Using a cuvette filled only with the solvent, record a baseline spectrum (the "blank"). This corrects for any absorption from the solvent or cuvette [10].
- Spectral Acquisition: Place the analyte standard solution in the spectrophotometer and scan the absorption spectrum across a relevant wavelength range (e.g., 200-400 nm for UV analysis).
- Peak Identification: From the resulting absorption spectrum, identify the wavelength at which the highest absorption peak occurs. This is the λmax. An example is Telmisartan, which has a λmax of 295.7 nm [67].
Advanced Techniques for Multi-Component Mixtures
For mixtures where components' absorption spectra overlap, advanced strategies are required.
- Successive Spectrophotometric Resolution: This group of univariate methods mathematically resolves overlapping spectra. Successive Ratio Subtraction (SRS) and Successive Derivative Subtraction (SDS), often coupled with Constant Multiplication (CM), can isolate the contribution of individual analytes. For instance, a first-derivative spectrum (SDS-CM) can be used to quantify Telmisartan at the peak amplitude between 282.5–313 nm, even in the presence of Chlorthalidone and Amlodipine [67].
- Multivariate Calibration: Techniques like Partial Least Squares (PLS) regression utilize full-spectrum data. When combined with variable selection methods such as Interval-PLS (iPLS) and Genetic Algorithm-PLS (GA-PLS), they significantly improve model performance by focusing on the most informative wavelengths and reducing noise [67].
Calibration Curves and Linear Range Determination
The calibration curve is the quantitative link between the instrument's absorbance reading and the analyte's concentration, founded on the Beer-Lambert Law [68].
Principles of the Beer-Lambert Law
The law states that absorbance (A) is directly proportional to concentration (c) and path length (L): A = εlc, where ε is the molar absorptivity coefficient (in L mol⁻¹ cm⁻¹). This relationship holds true for a given analyte at a specified wavelength and is the foundation of quantitative UV-Vis analysis [10].
Experimental Protocol for Calibration Curve Construction
This protocol provides a detailed methodology for establishing a valid calibration model.
- Stock Solution Preparation: Accurately weigh a reference standard of the analyte and dissolve it in a volumetric flask with the chosen solvent to create a stock solution of known concentration (e.g., 500 µg/mL) [67].
- Standard Solution Preparation: Precisely pipette different aliquots of the stock solution into a series of volumetric flasks (e.g., 10-mL flasks). Dilute each to the mark with the solvent to create a set of standard solutions spanning a range of concentrations [67].
- Absorbance Measurement: Measure the absorbance of each standard solution at the predetermined λ_max. Always use the solvent blank to zero the instrument before measurements.
- Data Plotting and Linear Regression: Plot the measured absorbance (y-axis) against the corresponding concentration (x-axis) for each standard. Use linear regression to calculate the best-fit line, which yields the calibration curve's equation: y = mx + b, where
mis the slope (related to ε) andbis the y-intercept. An ideal curve has a high correlation coefficient (R² > 0.999) and an intercept that is not statistically different from zero.
Defining the Linear Range
The linear range is the concentration interval over which the measured absorbance demonstrates a statistically valid linear relationship with concentration, in accordance with the Beer-Lambert Law. To determine it [10]:
- Prepare standard solutions that cover a wide concentration range.
- After generating the calibration curve, visually and statistically assess the plot.
- The upper limit of the linear range is typically the concentration where the plot begins to curve downward due to instrumental factors (e.g., insufficient light reaching the detector at high absorbance). A practical rule is to maintain absorbance values below 1.0, as an absorbance of 1 means 90% of the light is absorbed, which can challenge detector sensitivity [10].
The table below summarizes the linear ranges established for a ternary pharmaceutical mixture, as demonstrated in a recent study.
Table: Experimental Linear Ranges for an Antihypertensive Drug Combination
| Drug Compound | Linear Range (µg/mL) | Wavelength (λ_max) | Reference |
|---|---|---|---|
| Telmisartan (TEL) | 5.0 – 40.0 | 295.7 nm | [67] |
| Chlorthalidone (CHT) | 10.0 – 100.0 | 275.0 nm | [67] |
| Amlodipine (AML) | 5.0 – 25.0 | 359.5 nm | [67] |
The Scientist's Toolkit: Essential Research Reagent Solutions
The following table details key materials and reagents required for robust UV-Vis method development, particularly in a pharmaceutical context.
Table: Essential Reagents and Materials for UV-Vis Method Development
| Item | Function / Purpose | Technical Considerations |
|---|---|---|
| Reference Standards | To prepare calibration solutions of known purity and concentration. | Certified pure materials (e.g., 99+% purity) are essential for accurate quantitation [67]. |
| Quartz Cuvettes | To hold liquid samples in the light path. | Transparent to UV and visible light; standard path length is 1.0 cm [10] [67]. |
| UV-Transparent Solvents | To dissolve the analyte without interfering in the analysis. | Ethanol, water, hexane. The solvent's absorbance cutoff (wavelength below which it absorbs strongly) must be below the analyte's λ_max [66] [67]. |
| Volumetric Flasks | For precise preparation of stock and standard solutions. | High-precision glassware ensures accurate dilution and concentration calculations [67]. |
| Digital Pipettes | For accurate and reproducible transfer of liquid aliquots. | Critical for preparing the serial dilutions required for calibration curves [67]. |
Application in Pharmaceutical Analysis: A Workflow Example
The methodologies described are integral to pharmaceutical quality control. The following workflow visualizes their application in the analysis of a fixed-dose combination tablet, aligning with pharmacopeia standards [69].
Pharmaceutical QC Workflow for Combination Tablet Analysis
This guide establishes that rigorous method development in UV-Vis spectroscopy—encompassing systematic wavelength selection, careful calibration, and defined linear ranges—is fundamental to generating reliable data. When executed within a framework of understanding the instrument's operation, these practices form the bedrock of scientific validity in drug development and quality assurance.
Ultraviolet-visible (UV-Vis) spectrophotometry is a fundamental analytical technique in molecular biology that measures the absorption of light by chemical substances. This methodology is particularly crucial for nucleic acid analysis, providing researchers with a rapid, non-destructive means to assess both the concentration and purity of DNA and RNA samples prior to downstream applications. The technique operates on the principle that molecules absorb specific wavelengths of light in the UV and visible regions of the electromagnetic spectrum, with nucleic acids demonstrating characteristic absorption peaks due to their constituent purine and pyrimidine bases. The adenine, guanine, cytosine, and thymine (or uracil in RNA) bases contain conjugated double bonds that absorb light in the ultraviolet range, with a maximum absorbance at approximately 260 nanometers (nm) [8] [45].
The analytical power of UV-Vis spectrophotometry for nucleic acid quantification stems from the Beer-Lambert Law, which establishes a direct relationship between light absorption and analyte concentration. This law states that the absorbance (A) of a solution is directly proportional to the concentration (c) of the absorbing species and the path length (l) of the light through the solution, expressed mathematically as A = εcl, where ε is the molar absorptivity coefficient [45] [70] [4]. For double-stranded DNA, an absorbance of 1.0 at 260 nm corresponds to approximately 50 µg/mL of DNA, while for single-stranded DNA and RNA, this value is approximately 33 µg/mL and 40 µg/mL, respectively [71]. This relationship enables researchers to accurately determine nucleic acid concentrations by simply measuring absorbance at 260 nm, making it an indispensable tool in everything from basic research to pharmaceutical development and clinical diagnostics.
Working Principles of UV-Vis Spectrophotometers
Instrument Components and Functionality
A UV-Vis spectrophotometer consists of several integrated optical and electronic components that work in concert to measure light absorption by samples. The fundamental components include: (1) a light source that emits radiation across the UV and visible wavelengths, typically employing a deuterium lamp for UV light (190-400 nm) and a tungsten or halogen lamp for visible light (400-800 nm) [45]; (2) a monochromator containing a prism or diffraction grating to separate the broad-spectrum light into individual wavelengths, allowing selection of specific wavelengths for measurement [8] [45]; (3) a sample holder where the nucleic acid solution is placed, typically using quartz cuvettes for UV measurements as they do not absorb UV light like glass or plastic alternatives [45] [70]; and (4) a detector that measures the intensity of light passing through the sample and converts it into an electrical signal, with photomultiplier tubes and CCD detectors being common implementations [8] [45].
The measurement process involves passing monochromatic light through the sample and comparing its intensity to that of a blank reference solution. The instrument measures both the incident light intensity (I₀) and the transmitted light intensity (I), with the ratio I/I₀ representing transmittance [45] [4]. Absorbance is then calculated as the negative logarithm of transmittance (A = -log₁₀T), providing a dimensionless value that follows the Beer-Lambert Law relationship with concentration [4]. Modern microvolume spectrophotometers have advanced this technology by enabling measurements of minute sample volumes (as low as 0.5-2 µL) without requiring cuvettes, instead using surface tension to hold the sample between optical measurement surfaces [8] [72]. This innovation has been particularly valuable for precious nucleic acid samples where conservation of material is critical.
Figure 1: UV-Vis Spectrophotometer Workflow for Nucleic Acid Analysis. This diagram illustrates the sequential process of nucleic acid purity assessment and quantification, from light source to data interpretation.
Critical Technical Considerations for Accurate Measurements
Several technical factors must be controlled to ensure accurate spectrophotometric measurements of nucleic acids. Stray light, defined as any light reaching the detector that is not of the selected wavelength, can cause significant measurement errors, particularly at high absorbances [4]. Spectral bandwidth, the range of wavelengths transmitted through the sample, affects resolution, with narrower bandwidths providing higher accuracy, especially for samples with sharp absorption peaks [4]. Wavelength accuracy is particularly critical for purity ratios because nucleic acid absorbance at 280 nm is measured on a steep portion of the spectral curve, meaning even small wavelength errors can substantially alter 260/280 ratios [73]. Instruments with higher wavelength accuracy specifications (e.g., ±0.5 nm versus ±1 nm) provide more reliable purity ratios [73] [74].
Sample preparation factors also significantly impact measurement accuracy. The ionic strength and pH of the solution can alter absorbance readings, with acidic conditions under-representing 260/280 ratios by 0.2-0.3 and basic conditions over-representing them by a similar margin [73] [75] [74]. For this reason, the blank solution should closely match the sample buffer in both pH and ionic composition. Sample concentration also affects accuracy, with ideal absorbance readings falling between 0.1 and 1.0 AU for most instruments [71] [75]. Highly concentrated samples require dilution, while very dilute samples (<10 ng/µL) may yield unreliable purity ratios [73] [74].
Interpretation of Nucleic Acid Purity Ratios
The 260/280 nm Ratio: Protein and Phenol Contamination
The 260/280 ratio serves as the primary indicator of protein or phenol contamination in nucleic acid samples. This ratio leverages the differential absorption properties of nucleic acids versus proteins: nucleic acids absorb most strongly at 260 nm due to their constituent bases, while proteins absorb at 280 nm primarily due to aromatic amino acids (tryptophan, tyrosine, and phenylalanine) [73] [71]. The presence of residual protein from incomplete purification will therefore increase absorbance at 280 nm relative to 260 nm, lowering the ratio below ideal values [71] [75].
Table 1: Interpretation Guidelines for 260/280 Nucleic Acid Purity Ratios [73] [71] [75]
| Sample Type | Ideal Ratio | Acceptable Range | Low Ratio Indicates | High Ratio Indicates |
|---|---|---|---|---|
| DNA | ~1.8 | 1.7-2.0 | Protein or phenolic contamination | Possible RNA contamination |
| RNA | ~2.0 | 1.9-2.2 | Protein or phenolic contamination | - |
| Protein | ~0.6 | - | - | DNA contamination |
Deviations from these ideal ranges provide diagnostic information about sample quality. For DNA samples, ratios significantly below 1.7 typically indicate protein contamination, as commonly occurs when proteinase K digestion during extraction is incomplete or when organic phase separation is inefficient [71] [75]. Phenol contamination, which can result from incomplete removal during nucleic acid precipitation, also lowers the 260/280 ratio, as phenol absorbs strongly at 270 nm [73] [72]. Conversely, ratios substantially above 2.0 may indicate RNA contamination in DNA samples or general sample degradation [73].
The 260/230 nm Ratio: Chemical Contaminant Assessment
The 260/230 ratio serves as a secondary purity indicator, primarily detecting contamination by common purification reagents such as chaotropic salts, organic compounds, and carbohydrates. These contaminants are frequently introduced during nucleic acid isolation procedures and can inhibit downstream enzymatic reactions including PCR, restriction digestion, and sequencing [73] [72]. Guanidine salts (used in silica-based purification methods), phenol, TRIzol, and EDTA all absorb strongly around 230 nm, reducing the 260/230 ratio when present in significant quantities [73] [75] [72].
Table 2: Interpretation Guidelines for 260/230 Nucleic Acid Purity Ratios [73] [71] [75]
| Sample Type | Ideal Ratio | Acceptable Range | Low Ratio Indicates | Troubleshooting Approach |
|---|---|---|---|---|
| DNA/RNA | ~2.0-2.2 | 1.8-2.4 | Guanidine salts, phenol, carbohydrates, EDTA | Additional ethanol precipitation, column washing |
| DNA/RNA | >2.5 | - | Possible particulate contamination | Centrifugation, filtration |
For pure nucleic acid samples, the 260/230 ratio typically falls between 2.0 and 2.2 [73] [75]. Values significantly below this range suggest carryover of purification reagents, with specific contaminants imparting characteristic spectral signatures [72]. Guanidine hydrochloride and sodium acetate both increase absorbance below 240 nm and shift the spectral minimum from 230 nm to 240 nm [72]. Phenol contamination shows a similar pattern with an additional absorption peak at 270 nm [72]. Carbohydrate contamination, common in plant-derived nucleic acid preparations, also reduces the 260/230 ratio [73] [75].
Comprehensive Purity Assessment Workflow
A robust purity assessment integrates multiple absorbance measurements to form a complete picture of sample quality. The following decision pathway illustrates a systematic approach to interpreting nucleic acid purity metrics:
Figure 2: Nucleic Acid Purity Assessment Decision Pathway. This workflow outlines a systematic approach for interpreting spectrophotometric purity ratios to determine sample suitability for downstream applications.
Experimental Protocols for Nucleic Acid Quality Assessment
Standardized Spectrophotometric Analysis Protocol
Materials Required:
- UV-transparent cuvette or microvolume spectrophotometer
- Matching blank solution (typically TE buffer or molecular grade water)
- Nucleic acid sample
- Pipettes and appropriate tips
- Laboratory notebook for documentation
Procedure:
- Instrument Preparation: Power on the spectrophotometer and allow it to initialize according to manufacturer specifications. For instruments with dual lamps, a warm-up period of at least 15 minutes ensures stable output [45].
Blank Measurement: Pipette an appropriate volume of blank solution into a clean cuvette or onto the measurement surface. The blank should closely match the chemical composition of the sample solution, particularly regarding pH and ionic strength [73] [75]. Execute the blank measurement to establish the baseline reference.
Sample Measurement: For cuvette-based systems, pipette the same volume of nucleic acid sample as used for the blank into a clean cuvette. For microvolume systems, apply 0.5-2 µL of sample to the measurement surface [8] [72]. Ensure no air bubbles are present in the light path, as these scatter light and affect accuracy.
Absorbance Recording: Measure absorbance at 230 nm, 260 nm, 280 nm, and optionally 320 nm. The 320 nm measurement detects turbidity caused by particulate matter, which can interfere with accurate quantification [71] [72].
Data Analysis: Calculate sample concentration using the absorbance at 260 nm with the appropriate conversion factor (50 µg/mL for dsDNA, 40 µg/mL for RNA, 33 µg/mL for ssDNA). Apply turbidity correction if necessary: Corrected A₂₆₀ = Measured A₂₆₀ - A₃₂₀ [71].
Purity Assessment: Calculate 260/280 and 260/230 ratios. Compare these values to established purity standards (Tables 1 and 2) to assess sample quality.
Documentation: Record all absorbance values, calculated ratios, and sample information. Note any deviations from expected values for troubleshooting purposes.
Troubleshooting Common Purity Ratio Problems
Unexpected purity ratios require systematic investigation and remediation:
Problem: Low 260/280 ratio (<1.7 for DNA, <1.9 for RNA)
- Potential Causes: Protein contamination, phenolic compounds, acidic buffer conditions [73] [75].
- Solutions:
Problem: Low 260/230 ratio (<1.8)
- Potential Causes: Carryover of guanidine salts, carbohydrates, EDTA, or other purification reagents [73] [72].
- Solutions:
- Additional ethanol precipitation with 70% ethanol washes
- Column purification with additional wash steps
- Dilute sample and remeasure to minimize salt effects
- For carbohydrate contamination, use specialized purification kits designed for plant tissues [73]
Problem: Inconsistent ratios between measurements
- Potential Causes: Very dilute samples, improper blanking, instrument wavelength inaccuracy, sample evaporation during measurement [73] [75].
- Solutions:
- Concentrate dilute samples using ethanol precipitation or centrifugal evaporation
- Verify blank solution matches sample matrix
- Check instrument calibration using certified standards
- Ensure rapid measurement to prevent evaporation in microvolume systems [73]
The Scientist's Toolkit: Essential Research Reagents and Materials
Table 3: Essential Reagents and Materials for Nucleic Acid Purity Assessment
| Item | Function/Application | Technical Considerations |
|---|---|---|
| UV-Transparent Cuvettes | Sample holder for traditional spectrophotometers | Quartz for UV range; compatibility with sample volumes |
| Microvolume Spectrophotometer | Instrument for low-volume (0.5-2 µL) measurements | Eliminates need for cuvettes; ideal for precious samples [8] [72] |
| TE Buffer (10 mM Tris, 1 mM EDTA) | Standard nucleic acid storage and dilution buffer | Tris stabilizes pH; EDTA inhibits nucleases; can affect A₂₃₀ at high concentrations |
| Nuclease-Free Water | Blank solution and sample dilution | Low absorbance in UV range; ensures no enzymatic degradation |
| Ethanol (70-100%) | Nucleic acid precipitation and washing | Removes salts and organic contaminants; purity critical for clean preps |
| Phenol:Chloroform:Isoamyl Alcohol | Organic extraction of proteins | Removes protein contamination; can lower A₂₆₀/A₂₈₀ if residual [73] |
| Guanidine Hydrochloride/Thiocyanate | Chaotropic salt for silica-based binding | Common contaminant that reduces A₂₆₀/A₂₃₀ ratio [73] [72] |
| Sodium Acetate (3M, pH 5.2) | Salt for ethanol precipitation | Can reduce A₂₆₀/A₂₃₀ if carryover occurs; pH important for efficiency |
| Proteinase K | Protein degradation during extraction | Reduces protein contamination; requires inactivation to prevent interference |
Advanced Considerations and Methodological Comparisons
Complementary Quality Assessment Methods
While UV spectrophotometry provides valuable information about nucleic acid concentration and purity, researchers should consider complementary methods for comprehensive quality assessment:
Fluorometric Methods: Fluorescence-based quantification using DNA-binding dyes such as PicoGreen offers superior sensitivity (down to 25 pg/mL) and specificity for double-stranded DNA compared to absorbance methods [71] [75]. These dyes minimize contributions from single-stranded DNA, RNA, and free nucleotides, providing more accurate quantification for dilute samples or those with significant contamination [71]. However, they require specialized instrumentation and generation of standard curves for accurate quantification [71].
Agarose Gel Electrophoresis: This technique provides information about nucleic acid integrity and size distribution in addition to approximate quantification [71] [75]. Intact genomic DNA appears as a high molecular weight band, while degraded samples show a smear of lower molecular weight fragments [75]. Electrophoresis can also reveal RNA contamination in DNA samples and vice versa. While less quantitative than spectrophotometric or fluorometric methods, it remains invaluable for assessing sample integrity [71].
Capillary Electrophoresis: Advanced systems such as Agilent's Bioanalyzer or Fragment Analyzer provide automated, highly precise assessment of nucleic acid integrity, concentration, and size distribution. These systems are particularly valuable for next-generation sequencing applications where sample quality critically impacts data quality [75].
Impact of Sample Source on Quality Metrics
The biological source material significantly influences nucleic acid quality and common contaminants:
Blood-Derived DNA: Typically yields high-quality DNA with good purity ratios, though heme compounds from incomplete erythrocyte lysis can interfere with spectrophotometric measurements [75].
Tissue-Derived DNA: Frozen tissues generally provide high-molecular-weight DNA, while formalin-fixed paraffin-embedded (FFPE) tissues often yield fragmented DNA with suboptimal purity ratios due to crosslinking and chemical modifications [75].
Plant-Derived DNA: Frequently contains carbohydrate and polyphenolic contaminants that reduce 260/230 ratios and may inhibit downstream enzymatic reactions [73] [75]. Specialized extraction protocols incorporating CTAB or other polysaccharide-precipitating agents are often necessary.
Saliva-Derived DNA: Can show bacterial contamination and food residues if collection protocols are not rigorously followed [75].
Method Validation and Quality Control in Regulated Environments
In pharmaceutical development and clinical diagnostics, nucleic acid quality assessment must comply with rigorous regulatory standards. Method validation should establish:
- Accuracy and Precision: Through replicate measurements of reference standards
- Linearity: Across the expected concentration range (typically 2-1000 ng/µL for most applications)
- Robustness: To minor variations in buffer composition, temperature, and measurement timing
- Specificity: Ability to detect common contaminants in the relevant sample matrices
Regular instrument calibration and performance verification using NIST-traceable standards are essential for maintaining data integrity in regulated environments [4]. Documentation should include complete spectral scans from 220 nm to 350 nm rather than just ratio calculations to provide a comprehensive quality record [71] [72].
The accurate interpretation of 260/280 and 260/230 absorbance ratios remains a cornerstone of nucleic acid quality assessment in research and diagnostic applications. When properly contextualized within a comprehensive understanding of UV-Vis spectrophotometry principles and potential confounding factors, these simple ratios provide invaluable insights into sample purity and suitability for downstream applications. As technological advances continue to enhance the sensitivity, speed, and convenience of spectrophotometric measurements, the fundamental principles outlined in this guide will continue to inform effective experimental design and robust quality control practices across the life sciences.
Ultraviolet-visible (UV-Vis) spectroscopy is an indispensable analytical technique in pharmaceutical development, enabling precise quantification of Active Pharmaceutical Ingredients (APIs) and comprehensive impurity profiling. This analytical method measures the amount of discrete wavelengths of ultraviolet or visible light (typically 190-800 nm) that are absorbed by or transmitted through a sample compared to a reference or blank sample [10] [45]. The fundamental principle underpinning this technique is that molecules containing chromophores—functional groups with conjugated pi-electron systems—absorb specific wavelengths of light, promoting electrons to higher energy states [76]. The extent of light absorption provides critical information about sample composition, identity, and concentration, making UV-Vis spectroscopy particularly valuable for drug substance analysis where accuracy, precision, and reliability are paramount for regulatory compliance and patient safety.
The application of UV-Vis spectroscopy spans the entire drug development lifecycle, from early API characterization to final product quality control. Its non-destructive nature, rapid analysis capability, and quantitative precision render it ideal for monitoring critical quality attributes (CQAs) of drug substances, including potency, purity, and stability [8] [77]. When coupled with separation techniques like liquid chromatography (LC), UV-Vis detection becomes a powerful tool for resolving and characterizing complex impurity profiles, even at trace levels [78]. This technical guide explores the fundamental principles, methodological approaches, and practical applications of UV-Vis spectroscopy for API quantification and impurity profiling within the broader context of pharmaceutical development.
Fundamental Principles of UV-Vis Spectroscopy
Light-Matter Interactions and Electronic Transitions
UV-Vis spectroscopy operates on the principle that molecules undergo electronic transitions when exposed to specific wavelengths of light. The energy carried by photons in the UV-Vis range (approximately 143-36 kcal/mole) corresponds to the energy required to promote molecular electrons from ground state orbitals to higher energy excited states [76]. These transitions occur primarily in chromophores—structural elements with conjugated pi-electron systems such as C=C, C=O, and aromatic rings—which absorb characteristic wavelengths depending on their electronic structure and degree of conjugation [76].
The specific wavelength and intensity of absorption provide a molecular "fingerprint" useful for both qualitative identification and quantitative analysis. Bathochromic shifts (to longer wavelengths) and hyperchromic effects (increased absorption intensity) often occur with extended conjugation, which is particularly relevant for analyzing complex pharmaceutical compounds with aromatic systems [76]. For instance, a simple conjugated diene like 1,3-butadiene absorbs at approximately 217 nm, while more complex polycyclic aromatic compounds found in many APIs absorb at significantly longer wavelengths with greater intensity [76].
The Beer-Lambert Law and Quantitative Analysis
The quantitative foundation of UV-Vis spectroscopy is the Beer-Lambert Law, which establishes a direct proportional relationship between absorbance, sample concentration, and path length. This relationship enables precise API quantification in drug substances and products [10] [45]. The Beer-Lambert Law is mathematically expressed as:
A = εcl
Where:
- A = Absorbance (unitless)
- ε = Molar absorptivity (L·mol⁻¹·cm⁻¹)
- c = Concentration (mol·L⁻¹)
- l = Path length (cm) [10] [45]
For accurate quantitative analysis, absorbance values should ideally fall between 0.1 and 1.0 Absorbance Units (AU), which corresponds to 10-90% light transmission [10]. Values outside this range may compromise measurement accuracy due to detector limitations, necessitating sample dilution or path length adjustment [10]. The linear relationship defined by the Beer-Lambert Law enables construction of calibration curves using standard solutions of known concentration, allowing researchers to determine unknown API concentrations in test samples with high precision [45].
UV-Vis Spectrophotometer Instrumentation and Operation
Core System Components
A UV-Vis spectrophotometer consists of several integrated components that work in concert to measure light absorption accurately. Table 1 summarizes the function and characteristics of each essential component.
Table 1: Core Components of a UV-Vis Spectrophotometer
| Component | Function | Common Types | Key Characteristics |
|---|---|---|---|
| Light Source | Emits broad-spectrum light | Deuterium lamp (UV), Tungsten/Halogen lamp (Vis), Xenon lamp (both) | Must provide stable, intense light across UV-Vis range; switching typically occurs at 300-350 nm [10] [45] |
| Wavelength Selector | Isolates specific wavelengths | Monochromators (diffraction gratings), Absorption/Interference filters | Monochromators with 1200+ grooves/mm provide optimal resolution; blazed holographic gratings reduce defects [10] |
| Sample Container | Holds sample and reference | Cuvettes (quartz, glass, plastic) | Quartz essential for UV range (<300 nm); path length typically 1 cm; micro-volume systems available for 0.5-2 μL samples [10] [8] [77] |
| Detector | Measures light intensity after sample | Photomultiplier tubes (PMT), Photodiodes, Charge-coupled devices (CCD) | PMTs offer high sensitivity for low light; semiconductor detectors provide robustness and rapid response [10] [8] |
Instrument Operation Workflow
The following diagram illustrates the sequential process of absorbance measurement in a UV-Vis spectrophotometer:
Diagram 1: UV-Vis spectrophotometer measurement workflow. The instrument compares light intensity through the sample (I) versus the reference (I₀) to calculate absorbance across wavelengths.
Modern spectrophotometers employ either single-beam or double-beam configurations. Single-beam instruments measure the light source intensity before and after inserting the sample, requiring manual reference measurement [45]. Double-beam systems, as depicted above, simultaneously measure sample and reference pathways, automatically compensating for source fluctuations and providing superior stability [45]. For pharmaceutical applications requiring high precision and throughput, double-beam configurations are generally preferred, particularly when analyzing multiple samples or conducting stability studies.
API Quantification Methodologies
Direct Spectrophotometric Assay
Direct UV-Vis spectrophotometry provides a straightforward approach for quantifying APIs with strong chromophores. The methodology involves preparing a series of standard solutions at known concentrations, measuring their absorbance at the wavelength of maximum absorption (λmax), and constructing a calibration curve [45]. The concentration of unknown samples is then determined by interpolating their absorbance values using the established calibration function. This approach is particularly effective for purity assessment, where the absorbance ratio at different wavelengths (e.g., A260/A280) indicates potential contamination [45]. For nucleic acid analysis, a ratio of approximately 1.8 suggests pure DNA, while a ratio near 2.0 indicates pure RNA [45]. Deviations from these expected ratios signal potential impurities that may require further investigation.
In-line Process Monitoring and Control
UV-Vis spectroscopy serves as a powerful Process Analytical Technology (PAT) tool for real-time monitoring of API concentration during manufacturing. Table 2 outlines the experimental protocol for in-line API quantification during hot melt extrusion, a common pharmaceutical processing technique [79].
Table 2: Experimental Protocol for In-line UV-Vis Monitoring of API Content During Hot Melt Extrusion
| Parameter | Specification | Purpose/Rationale |
|---|---|---|
| API & Excipient | Piroxicam (API), Kollidon VA64 (polymer) | Model system for solubility enhancement via amorphous solid dispersion [79] |
| Extrusion Conditions | Barrel temp: 120-140°C, Screw speed: 200 rpm, Feed rate: 7 g/min | Optimized process parameters for stable extrusion [79] |
| UV-Vis Setup | Fiber optic probes in transmission mode, Wavelength range: 230-816 nm, Resolution: 1 nm | Enables real-time transmittance measurement through extrudate [79] |
| Data Collection | Frequency: 0.5 Hz, Scans per spectrum: 10 averages | Balances temporal resolution with signal quality [79] |
| Validation Approach | Accuracy profile strategy per ICH Q2(R1), Tolerance limits: ±5% | Statistical approach ensuring method reliability across concentration range [79] |
| Critical Attributes | Colour parameters (L, a, b*), Transmittance | Links physical appearance to API content; detects potential degradation [79] |
This PAT application demonstrates how UV-Vis spectroscopy enables real-time release testing (RTRT) by continuously verifying that critical quality attributes (CQAs) remain within predefined limits throughout manufacturing [79]. The method's validation using accuracy profiles and compliance with ICH guidelines ensures regulatory acceptance while supporting Quality by Design (QbD) principles in pharmaceutical development [79].
Impurity Profiling Applications
LC/UV Diode Array Spectral Matching
Hyphenated techniques combining liquid chromatography with UV-Vis diode array detection (LC/UV-DAD) significantly enhance impurity profiling capabilities. The chromatographic separation resolves individual components, while subsequent UV spectral analysis facilitates identification through library matching [78]. This approach is particularly valuable for distinguishing between process-related impurities and degradation products, especially when reference standards are unavailable [78].
The following diagram illustrates the workflow for impurity identification using LC/UV-DAD:
Diagram 2: LC/UV-DAD workflow for pharmaceutical impurity profiling. Full spectrum collection enables identification through spectral matching and unknown assessment.
This methodology successfully identifies impurities at levels below 0.1% area, demonstrating sufficient sensitivity for most pharmaceutical impurity monitoring requirements [78]. Critical factors influencing technique effectiveness include detector sensitivity, lamp intensity, and the presence of structurally related impurities with similar UV spectra that may complicate identification [78].
Orthogonal Techniques for Comprehensive Profiling
While UV-Vis spectroscopy provides valuable impurity screening capabilities, comprehensive profiling often requires orthogonal analytical techniques to characterize compounds with weak chromophores or similar UV spectra. As demonstrated in ophthalmics impurity analysis, compounds undetectable by LC/MS may require alternative approaches like Gas Chromatography Quadrupole Time-of-Flight (GC/QTOF) mass spectrometry for definitive identification [80]. This highlights the importance of technique selection based on impurity characteristics and the complementary role UV-Vis spectroscopy plays within a broader analytical strategy.
Essential Research Reagents and Materials
Successful implementation of UV-Vis methods for pharmaceutical analysis requires appropriate selection of reagents and materials. Table 3 catalogizes essential solutions and their specific functions in API quantification and impurity profiling.
Table 3: Essential Research Reagent Solutions for UV-Vis Pharmaceutical Analysis
| Reagent/Material | Specification | Function in Analysis |
|---|---|---|
| Reference Standards | Certified API (e.g., USP Reference Standards) | Primary calibrants for quantitative method development and validation [79] |
| HPLC-Grade Solvents | Methanol, Acetonitrile, Water (low UV absorbance) | Sample dissolution and mobile phase preparation; minimal UV background interference [78] |
| Buffer Systems | Phosphate, Acetate (appropriate pH control) | Maintains consistent ionization state of analytes; affects spectral properties [10] |
| Column Chromatography | C18, C8 stationary phases (LC/UV applications) | Separates API from impurities prior to UV detection [78] |
| Microvolume Accessories | Fixed pathlength cuvettes (0.1-0.7 mm), Microplates | Enables analysis of limited sample volumes (0.5-2 μL) without dilution [77] |
| Quality Control Materials | NIST Reference Materials (mAb, Tryptophan) | Instrument qualification and method verification [77] |
Method Validation and Regulatory Considerations
Implementation of UV-Vis methods for pharmaceutical analysis requires rigorous validation to ensure reliability, accuracy, and regulatory compliance. The International Council for Harmonisation (ICH) guidelines Q2(R1) provide the framework for validating analytical procedures, addressing key parameters including accuracy, precision, specificity, linearity, range, and robustness [79]. For UV-Vis methods employed as Process Analytical Technology (PAT), the validation approach incorporates accuracy profiles—statistical tools that establish tolerance intervals around measurement results, ensuring they meet predefined acceptance criteria (typically ±5% for API quantification) [79].
The application of Analytical Quality by Design (AQbD) principles further strengthens method robustness by systematically identifying and controlling critical method parameters [79]. This begins with establishing an Analytical Target Profile (ATP) that defines method performance requirements, followed by risk assessment tools like Failure Mode and Effects Analysis (FMEA) to identify and mitigate potential method failures [79]. Such systematic approaches align with regulatory expectations for modern pharmaceutical analysis and support real-time release testing (RTRT) strategies in continuous manufacturing platforms [79].
UV-Vis spectroscopy remains a cornerstone analytical technique for drug substance analysis, offering robust solutions for API quantification and impurity profiling throughout the pharmaceutical development lifecycle. Its fundamental principles, rooted in the Beer-Lambert Law and electronic transitions of chromophores, provide the theoretical foundation for both simple spectrophotometric assays and sophisticated hyphenated techniques. When properly validated according to ICH guidelines and implemented within Quality by Design frameworks, UV-Vis methods deliver the precision, accuracy, and reliability required for pharmaceutical quality control. As manufacturing paradigms evolve toward continuous processing, the integration of UV-Vis spectroscopy as a Process Analytical Technology will continue to grow, enabling real-time quality assurance and advancing the ultimate goal of delivering safe and effective medicines to patients.
Dissolution Testing and Solid Dosage Form Analysis for Quality Control
Dissolution testing is a critical analytical methodology employed within pharmaceutical development and quality control to evaluate the rate and extent of release of an active pharmaceutical ingredient (API) from a solid oral dosage form, such as a tablet or capsule, under standardized conditions [81] [82]. This test serves as a vital surrogate for predicting the in vivo performance of a drug product, ensuring that it will dissolve adequately in the gastrointestinal tract to be available for absorption [81]. The data generated from dissolution testing are indispensable for formulation development, establishing bioequivalence, setting quality control specifications, and monitoring product stability throughout its shelf life [83] [82].
The fundamental principle of this test is relatively straightforward: the dosage form is placed into a vessel containing a dissolution medium, which is maintained at a physiologically relevant temperature of 37 ± 0.5°C [81]. The medium is agitated at a specified speed, and samples are withdrawn at predetermined time intervals to determine the amount of drug substance dissolved [83]. The entire process—from the release of the API from the dosage form to the quantitative analysis of the dissolved drug—must be meticulously developed and validated to ensure the reliability and reproducibility of the results, making it a cornerstone of pharmaceutical quality assurance [81] [83].
Regulatory and Compendial Framework
Dissolution testing is governed by stringent regulatory and compendial requirements to ensure consistency, safety, and efficacy of drug products. The U.S. Food and Drug Administration (FDA) provides comprehensive guidance on dissolution testing for immediate-release and modified-release solid oral dosage forms [81] [82]. A key regulatory application is supporting biowaivers for certain Biopharmaceutics Classification System (BCS) Class I and III drugs, where demonstrating similar dissolution profiles can obviate the need for costly in vivo bioequivalence studies [82]. Furthermore, comparative dissolution profiles are required when implementing manufacturing changes, formulation modifications, or site transfers to ensure product consistency [82].
The United States Pharmacopeia (USP) provides the definitive standard methods for dissolution testing. Key general chapters include:
- USP <711> Dissolution: Defines the standard apparatuses and procedures for performing the test [81] [83].
- USP <1092> The Dissolution Procedure: Development and Validation: Offers detailed guidance on developing a robust dissolution method and validating its performance [81] [83].
- USP <1711> Oral Dosage Forms – Performance Tests: Provides additional context on performance tests for oral dosage forms [81].
Adherence to these standards is mandatory for regulatory submissions and for ensuring that each commercial batch meets its predefined dissolution specifications, often expressed as a Q value (e.g., not less than 80% dissolved within 30 minutes) [82].
Developing a Dissolution Method
Selection of Dissolution Apparatus
The choice of apparatus is fundamental to method development and is based on the dosage form's characteristics and release mechanism. The most commonly used apparatuses for solid oral dosage forms are detailed in the table below.
Table 1: Standard USP Dissolution Apparatuses for Solid Oral Dosage Forms
| USP Apparatus | Apparatus Name | Typical Agitation Speed | Common Application |
|---|---|---|---|
| I | Basket | 50 - 100 rpm | Solid oral dosage forms, particularly those that tend to float [81] [82] |
| II | Paddle | 50 - 75 rpm | Immediate-release tablets, extended-release formulations, and multiparticulate systems [81] [82] |
| III | Reciprocating Cylinder | Variable | Bead-type modified-release dosage forms [83] |
| IV | Flow-Through Cell | Variable | Poorly soluble drugs, modified-release forms, and suppositories [83] |
For immediate-release tablets, USP Apparatus 2 (paddle) is most frequently used, often at 50 or 75 rpm [83]. Agitation speed must be optimized; excessive speed can cause foaming and fail to discriminate between inequivalent formulations, while insufficient speed may not provide adequate mixing [81].
Development of Dissolution Medium
The composition of the dissolution medium is critical to achieving sink conditions and physiological relevance.
Table 2: Key Parameters for Dissolution Medium Development
| Parameter | Considerations | Typical Range / Examples |
|---|---|---|
| pH | - Weak acids dissolve faster at high pH; weak bases dissolve faster at low pH.- Select a pH that provides sink conditions and is physiologically relevant (e.g., pH 1.2 to 7.5).- Buffer capacity must be sufficient to maintain constant pH [81]. | 1.2 (simulated gastric fluid) to 6.8 (simulated intestinal fluid) [83] |
| Surfactants | - Used to improve solubility of poorly soluble drugs (e.g., BCS Class II).- Selection depends on drug substance characteristics (e.g., avoid anionic surfactants with cationic drugs) [81]. | Sodium lauryl sulfate (SLS), Polysorbate 80, Bile salts [81] [83] |
| Volume | - Determined by the equilibrium solubility needed to maintain sink conditions.- Must be sufficient to dissolve at least three times the amount of API in the dosage form [81]. | 500, 900, or 1000 mL for Apparatus 1 and 2 [81] |
| Deaeration | - Removes dissolved air bubbles that can adhere to the dosage form or apparatus, affecting results.- Typically done by heating, filtering, and applying vacuum [81]. | Described in USP <711> [81] |
Other critical considerations include avoiding the use of purified water due to its variable pH and quality, ensuring the absence of a common-ion effect for ionizable drug substances, and confirming the stability of the drug substance in the selected medium throughout the test duration [81].
Study Design and Acceptance Criteria
The dissolution study design must adequately characterize the dissolution profile.
- Immediate-Release Dosage Forms: Testing typically lasts 30-60 minutes. A single time point specification may be sufficient for quality control, but multiple time points are necessary for profile characterization during development [83].
- Extended-Release Dosage Forms: At least three time points are required: an early point (1-2 hours) to show no dose dumping, an intermediate point to define the profile, and a final point to show essentially complete release [83].
Acceptance criteria, often defined by a Q value, are derived from batch data that includes pivotal clinical and stability batches. The Q value is typically set at 75-80% dissolved for a given time point, allowing for assay and content uniformity variability [83] [82]. The method must demonstrate discriminatory power—the ability to detect meaningful changes in formulation or manufacturing process. This is often validated by comparing dissolution profiles of batches intentionally manufactured with variations, using a similarity factor (f2); an f2 value of <50 indicates a difference between the batches [81].
The Role of UV-Vis Spectrophotometry in Analysis
Fundamental Principles of UV-Vis Spectrophotometry
Ultraviolet-Visible (UV-Vis) Spectrophotometry is a widely used analytical technique for quantifying the concentration of an analyte in solution based on its absorption of light in the ultraviolet (190-400 nm) and visible (400-800 nm) regions of the electromagnetic spectrum [45] [84]. The operating principle is governed by the Beer-Lambert Law (or Beer's Law), which states a linear relationship between absorbance and concentration [8] [45]: A = ecl Where:
- A is the measured absorbance.
- e is the molar absorptivity (a compound-specific constant at a given wavelength).
- c is the concentration of the analyte in the solution.
- l is the path length of the light through the sample (typically 1 cm) [45] [84].
This relationship allows for the direct determination of API concentration in dissolution samples by measuring absorbance at a specific wavelength, making it a rapid, cost-effective, and non-destructive choice for dissolution analysis [8] [85].
Instrumentation and Workflow
A UV-Vis spectrophotometer consists of several key components that work in sequence:
- Light Source: A deuterium lamp (for UV) and a tungsten or halogen lamp (for visible light) provide a broad spectrum of light [45].
- Monochromator: This component, often containing a prism or grating, disperses the light and selects a specific, narrow band of wavelengths to pass through the sample [45] [84].
- Sample Container: The sample is held in a cuvette, typically made of quartz or fused silica for UV transparency [45].
- Detector: This measures the intensity of the light beam after it has passed through the sample (I) and converts it into an electrical signal. The instrument compares this intensity to that which passed through a blank reference solution (I₀) to compute absorbance (A = -log(I/I₀)) [45] [84].
The following diagram illustrates the workflow of a UV-Vis spectrophotometer, integrating the function of each component from light source to detection and data output.
Application in Dissolution Testing
In the context of dissolution testing, UV-Vis spectrophotometry serves as the "analytical finish." After a sample aliquot is withdrawn from the dissolution vessel at a specific time point, it is typically filtered to remove any undissolved particles. The filtrate is then placed in a cuvette, and its absorbance is measured at a wavelength specific to the API [83] [85]. Using a pre-established calibration curve of absorbance versus concentration, the amount of drug dissolved at that time point is calculated [45].
A specific research example demonstrates this application: a dissolution test for andrographolide dispersible tablets was developed and validated using UV-Vis spectrophotometry. The analysis involved forming a complex between andrographolide, Cu(II) metal, and Alizarin Red S (ARS) reagent at pH 7. The complex exhibited maximum absorbance at 518 nm, which allowed for accurate and validated quantification of the dissolved drug [85]. This case highlights how UV-Vis can be adapted for compounds that may require derivatization for optimal detection.
Advanced Methodologies and Validation
Analytical Quality by Design (AQbD) in Dissolution
A modern, proactive approach to analytical method development is Analytical Quality by Design (AQbD). This systematic, risk-based methodology ensures that method performance is built in from the outset, rather than merely tested at the end [86]. The AQbD workflow for a dissolution method involves:
- Defining an Analytical Target Profile (ATP), which specifies the required method performance (e.g., "accurately quantify dissolved percentage of API X and API Y") [86].
- Identifying Critical Method Parameters (e.g., medium pH, paddle speed, volume) through risk assessment and using Design of Experiments (DoE) to optimize them [86].
- Establishing a Method Operable Design Region (MODR), which is the multidimensional combination of parameters within which method performance is guaranteed. Monte Carlo simulations can be used to define this region and set guard bands for acceptance criteria, minimizing consumer and producer risk [86].
- Implementing a control strategy, such as a Hazard Analysis and Critical Control Point (HACCP) plan, to monitor method performance throughout its lifecycle [86].
This approach was successfully applied to develop a discriminative dissolution method for a fixed-dose combination pediatric dispersible tablet containing isoniazid (INH) and rifampicin (RIF), resulting in a robust method with defined measurement uncertainty [86].
Method Validation
Validation of the dissolution procedure is mandatory to demonstrate that the method is suitable for its intended purpose. The validation encompasses both the dissolution step and the analytical finish [81]. Key validation parameters include:
- Specificity: The ability to unequivocally assess the analyte in the presence of excipients, degradation products, or other potential interferents [85].
- Linearity and Range: The method should produce results that are directly proportional to the concentration of the analyte within a specified range.
- Accuracy: The closeness of the test results to the true value, often recovered by spiking known amounts of API into the dissolution medium.
- Precision: The degree of agreement among individual test results under prescribed conditions, including repeatability (intra-day) and intermediate precision (inter-day, different analysts) [85].
- Robustness: A measure of the method's capacity to remain unaffected by small, deliberate variations in method parameters (e.g., ±0.1 pH unit, ±2% rpm), providing an indication of its reliability during normal usage [81].
Essential Research Reagents and Materials
The following table catalogs key reagents, materials, and equipment essential for conducting dissolution testing supported by UV-Vis analysis.
Table 3: Research Reagent Solutions and Essential Materials for Dissolution Testing
| Item | Function / Application |
|---|---|
| Dissolution Apparatus (USP I, II, III, IV) | Standardized equipment to simulate gastrointestinal agitation and contain the dissolution medium and dosage form [81] [82]. |
| Dissolution Media (Buffers, HCl, Simulated Gastric/Intestinal Fluids) | Aqueous solvents that mimic physiological conditions to dissolve the API from the dosage form [81] [83]. |
| Surfactants (e.g., Sodium Lauryl Sulfate) | Wetting agents that lower surface tension to improve solubility and dissolution of poorly soluble drugs [81]. |
| Deaeration Equipment | Apparatus to remove dissolved gases from the medium to prevent bubble formation on the dosage form or apparatus, which can affect dissolution rates [81]. |
| UV-Vis Spectrophotometer | Instrument used to quantify the concentration of the dissolved API in sample aliquots by measuring light absorbance [8] [85]. |
| Quartz or Fused Silica Cuvettes | Sample holders for spectrophotometers that are transparent to UV and visible light [45]. |
| Syringe Filters (0.45 µm or smaller) | Used to filter withdrawn dissolution samples to remove undissolved particles before spectrophotometric analysis, preventing skewing of results [83]. |
| Reference Standards (Highly pure API) | Used to prepare calibration standards for validating the analytical method and constructing the calibration curve for quantification [85]. |
Dissolution testing is an indispensable tool in the pharmaceutical sciences, providing a critical link between the manufacturing process of a solid oral dosage form and its anticipated performance in the body. The integration of a rigorously developed and validated dissolution method with a robust analytical technique like UV-Vis spectrophotometry creates a powerful quality control system. This system ensures that every batch of medicine released to the public is consistent, effective, and safe. The adoption of advanced frameworks like Analytical Quality by Design further strengthens this system by building product and method understanding directly into the development process, ultimately enhancing the reliability of quality control and protecting patient health.
Ultraviolet-Visible (UV-Vis) spectrophotometry stands as a cornerstone analytical technique in biochemical laboratories, providing researchers with a powerful, rapid, and non-destructive method for analyzing proteins [8] [87]. Its principle of operation—measuring the absorption of light by molecules—makes it indispensable for foundational tasks such as determining protein concentration and assessing sample purity [87]. Beyond these routine applications, UV-Vis spectroscopy also offers a window into more complex biomolecular phenomena, including monitoring structural changes induced by environmental factors or ligand binding events [87]. This technical guide delves into the core principles, detailed methodologies, and practical applications of UV-Vis spectrophotometry for protein analysis, framing it within the broader context of research aimed at understanding protein function and interaction.
Fundamental Principles of UV-Vis Spectrophotometry
How a UV-Vis Spectrophotometer Works
A UV-Vis spectrophotometer operates by measuring the absorption of light across the ultraviolet and visible regions of the electromagnetic spectrum (typically 200 to 900 nm) as it passes through a sample solution [19]. The instrument quantifies the intensity of light transmitted through the sample and compares it to a reference measurement of the incident light source [8]. The core optical components include a light source (e.g., a Xenon flash lamp), a monochromator or polychromator to separate wavelengths, a sample holder, and a detector (such as a CCD or CMOS linear camera) that measures the intensity of the transmitted light [8] [19].
The fundamental measurement is absorbance, which is calculated from the ratio of transmitted light (I) to incident light (I₀). This relationship is quantitatively described by the Beer-Lambert Law, which states that the absorbance (A) of a solution is directly proportional to the concentration (c) of the absorbing species, the pathlength (l) of the light through the sample, and the molar absorptivity (ε) of the species [8] [19]. The law is expressed mathematically as:
A = ε * c * l
Where:
- A is the measured absorbance (unitless)
- ε is the molar absorptivity or extinction coefficient (L·mol⁻¹·cm⁻¹)
- c is the concentration of the analyte (mol·L⁻¹)
- l is the pathlength of the light through the sample (cm)
This linear relationship is the foundation for quantitative analysis, allowing researchers to determine the concentration of a protein in solution by measuring its absorbance at a specific wavelength [8].
Protein Absorbance in the UV Range
Proteins absorb ultraviolet light primarily due to their constituent aromatic amino acids, namely tryptophan (Trp), tyrosine (Tyr), and phenylalanine (Phe). The peptide bonds within the protein backbone also contribute to absorption [87]. The absorbance maximum for proteins typically occurs at or near 280 nm, a characteristic feature driven mainly by the electron-rich aromatic rings of tryptophan and tyrosine residues [87]. This specific absorbance property is exploited for concentration determination, as the absorbance at 280 nm (A₂₈₀) can be directly related to protein concentration via the Beer-Lambert law, provided the extinction coefficient is known.
Determining Protein Concentration
Core Methodology and Calculations
The most direct method for determining protein concentration using UV-Vis is measurement at 280 nm. The required protocol is straightforward but requires precision.
Experimental Protocol: Direct Concentration Measurement at 280 nm
- Instrument Preparation: Turn on the UV-Vis spectrophotometer and allow the lamp to warm up for the recommended time. Initialize the software.
- Blank Measurement: Prepare a blank solution identical to the protein buffer (e.g., phosphate-buffered saline, Tris-HCl) but without the protein. Pipette the blank into a suitable cuvette, place it in the sample holder, and execute a blank measurement to establish a baseline [88].
- Sample Measurement: Replace the blank cuvette with a cuvette containing your protein sample. Ensure the sample is homogenous. For microvolume instruments, a small drop (e.g., 0.5 - 2 µL) is placed directly onto the sample pedestal [8] [19].
- Data Acquisition: Measure the absorbance of the sample at 280 nm.
- Calculation: Calculate the protein concentration using the Beer-Lambert law.
For a known protein with a known molar extinction coefficient (ε), the molar concentration is: c (M) = A₂₈₀ / (ε * l)
For a known protein with a known mass extinction coefficient for a 1% (10 g/L) solution (A₁%1cm), the mass concentration is: c (mg/mL) = A₂₈₀ / (A₁%1cm * l)
Table 1: Key Protein Quantification Methods and Their Characteristics
| Method | Principle | Key Application in Drug Development | Tolerance to Interfering Substances | Dynamic Range & Detection Limits |
|---|---|---|---|---|
| UV-Vis (A₂₈₀) | Absorbance by aromatic amino acids | Release testing, quality control of pure protein [89] | Low - sensitive to buffer components that absorb at 280 nm [89] | Broad range; suitable for µg to mg amounts [19] |
| Colorimetric Assays (BCA, Lowry) | Color change from protein-dye binding | Drug discovery for low purity/precision samples [89] | Varies; can be affected by detergents, reducing agents [89] | High sensitivity; nanogram levels [89] |
| Amino Acid Analysis | Hydrolysis and quantification of amino acids | Definitive quantification for release testing; calibration of secondary standards [89] | High - can account for buffer interference [89] | Highly reproducible; absolute quantification [89] |
Assessing Sample Purity
A major advantage of UV-Vis is the ability to rapidly assess sample purity using spectral ratios. The most common metric is the A₂₆₀/A₂₈₀ ratio. Nucleic acids, which contaminate protein preparations, have an absorbance maximum at 260 nm. A high A₂₆₀/A₂₈₀ ratio indicates nucleic acid contamination, while a lower-than-expected ratio can suggest other impurities [87]. A "pure" protein sample typically has an A₂₆₀/A₂₈₀ ratio of approximately 0.6, but this varies with the protein's specific amino acid composition. A full spectral scan from 240 nm to 350 nm provides a more comprehensive purity profile.
Monitoring Protein Structural Changes
UV-Vis spectrophotometry is highly effective for monitoring changes in protein structure and conformation in real-time. These changes can be induced by environmental factors or ligand binding.
Experimental Workflow for Structural Studies
The following diagram illustrates a generalized workflow for monitoring protein structural changes using UV-Vis spectrophotometry.
Key Applications for Structural Monitoring
- Ligand-Binding Studies: When a ligand binds to a protein, it can cause a shift in the absorbance spectrum of the aromatic residues, a phenomenon known as a difference spectrum. By titrating the ligand and monitoring these spectral shifts, researchers can deduce binding affinities (Kd) and mechanisms [87].
- Environmental Stability Studies: Factors such as pH, temperature, and the presence of denaturants or metal ions can profoundly impact protein folding and stability. UV-Vis can track these changes by monitoring the absorbance spectrum, providing insights into protein stability and misfolding, which is crucial for understanding diseases and developing stable biotherapeutics [87].
- Kinetic Studies: The progress of enzymatic reactions or protein folding/unfolding can be tracked by monitoring changes in absorbance over time. This allows for the determination of kinetic parameters such as Vmax and Km for enzymes [87].
Table 2: Research Reagent Solutions for Protein Analysis with UV-Vis
| Item | Function/Description | Application Notes |
|---|---|---|
| Cuvettes | Holds liquid sample in the light path. | Quartz for UV range (essential for 280 nm); optical glass or plastic for visible range only [19]. |
| Buffer Solutions | Dissolve and stabilize the protein (e.g., PBS, Tris-HCl). | The blank must match the sample buffer to cancel out its absorbance [88]. |
| Standard Protein | A protein of known concentration and extinction coefficient. | Used for calibration and method validation, e.g., Bovine Serum Albumin (BSA) [89]. |
| Chemical Denaturants | Agents that unfold proteins (e.g., Urea, Guanidine HCl). | Used in stability studies to monitor unfolding via spectral changes [87]. |
Advanced Considerations and Method Validation
Limitations and Complementary Techniques
While powerful, UV-Vis has limitations. It exhibits lower sensitivity and selectivity compared to methods like fluorescence and can be susceptible to interference from any buffer component that absorbs in the UV range [8] [89]. For absolute quantification of therapeutic proteins in complex matrices, orthogonal methods are often required. As outlined in Table 1, techniques like amino acid analysis provide definitive, reproducible results for regulatory submission and release testing, while colorimetric assays and HPLC with UV detection are common for impurity detection and quantification [89].
Method Validation for Regulated Environments
In pharmaceutical development, protein quantification methods must be rigorously validated. According to International Council for Harmonisation (ICH) guidelines, key validation parameters for a quantitative UV-Vis assay include [89]:
- Accuracy: How close the measured value is to the true value.
- Precision: The closeness of agreement between a series of measurements (repeatability and intermediate precision).
- Linearity: The ability to obtain results proportional to the concentration of the analyte.
- Range: The interval between the upper and lower concentration levels for which linearity, accuracy, and precision are demonstrated.
- Specificity: The ability to assess the analyte unequivocally in the presence of other components.
The following diagram illustrates the logical relationships and workflow involved in selecting and validating a protein quantification method for a specific context, such as drug development.
UV-Vis spectrophotometry remains an essential and versatile tool in the biomolecular toolkit. Its speed, ease of use, and non-destructive nature make it ideal for the routine quantification of proteins and assessment of sample purity [8] [87]. Furthermore, its application in monitoring ligand binding and environmental stability provides critical insights into protein structure and function. While newer, more sensitive techniques exist, the foundational role of UV-Vis in basic research, quality control, and the initial stages of biotherapeutic development is secure. By understanding its principles, methodologies, and limitations, researchers and drug development professionals can effectively leverage this technology to advance their scientific objectives.
High-throughput analysis (HTA) has become a cornerstone of modern scientific discovery, particularly in fields such as drug development, biomaterials research, and clinical diagnostics. This methodology enables researchers to rapidly conduct millions of chemical, genetic, or pharmacological tests through the integration of robotics, sophisticated data processing software, liquid handling devices, and sensitive detectors [90]. The primary goal of HTA is to dramatically accelerate the pace of research by quickly identifying active compounds, antibodies, or genes that modulate specific biomolecular pathways, thus providing valuable starting points for drug design and understanding biological interactions [90].
In the context of analytical instrumentation, high-throughput approaches have transformed traditional sample preparation and analysis from a significant bottleneck into a streamlined, efficient process. Surveys have consistently demonstrated that time, along with cost and solvent consumption, ranks among the most significant challenges for analysts, who often spend the majority of total analysis time solely on sample preparation steps [91]. Modern high-throughput systems address these limitations through three primary approaches: parallel sample processing, comprehensive automation, and optimization of process kinetics [91]. This technical guide explores the integration of automated sample handling with advanced multi-wavelength spectroscopic methods, with particular emphasis on their application within UV-Vis spectrophotometry frameworks commonly employed in pharmaceutical and biomedical research.
Fundamentals of UV-Vis Spectrophotometry in HTA
Core Principles of UV-Vis Spectroscopy
Ultraviolet-visible (UV-Vis) spectroscopy is an analytical technique that measures the amount of discrete wavelengths of UV or visible light absorbed by or transmitted through a sample in comparison to a reference or blank sample [10]. This measurement principle provides information about sample composition and analyte concentration, making it invaluable for quantitative analysis in high-throughput environments. The technique operates on the fundamental property that light carries energy inversely proportional to its wavelength, with shorter wavelengths possessing higher energy [10]. Specific energy amounts are required to promote electrons in substances to higher energy states, detectable as absorption signals, with different bonding environments requiring distinct energy inputs, thus causing absorption at characteristic wavelengths for different substances [10].
The Beer-Lambert law forms the mathematical foundation for quantitative UV-Vis measurements, establishing a linear relationship between absorbance (A), molar absorptivity (ε), path length (L), and analyte concentration (c): A = εLc [10]. This relationship enables researchers to determine concentrations of target analytes in complex mixtures, a capability particularly valuable in high-throughput screening environments where rapid quantification is essential. The technique normally measures absorbance across the wavelength range of approximately 100-380 nm (UV) and 380-780 nm (visible), corresponding to the spectrum humans perceive as violet to red light [10].
Instrumentation Components
A UV-Vis spectrophotometer, whether configured for conventional or high-throughput analysis, consists of several essential components:
Light Source: High-intensity lamps that emit light across a wide wavelength range are fundamental. Single xenon lamps provide coverage for both UV and visible ranges, though they carry higher costs and stability concerns compared to alternative sources [10]. Dual-lamp systems typically employ a tungsten or halogen lamp for visible light and a deuterium lamp for UV light, with automated switching occurring between 300-350 nm where light emission from both sources is comparable [10].
Wavelength Selection: Monochromators containing diffraction gratings represent the most versatile wavelength selection method, separating light into narrow bands through rotated gratings that select desired wavelengths [10]. Typical diffraction gratings for UV-Vis spectroscopy contain 300-2000 grooves per mm, with a minimum of 1200 grooves per mm being standard, where higher groove frequencies provide better optical resolution but narrower usable wavelength ranges [10]. Supplementary filters, including absorption, interference, cutoff, and bandpass filters, are often used in conjunction with monochromators to further refine wavelength selection and improve signal-to-noise ratios [10].
Sample Analysis: Sample presentation varies significantly between conventional and high-throughput configurations. Traditional systems utilize cuvettes, with quartz being essential for UV examination due to its transparency across most UV wavelengths, while plastic cuvettes are unsuitable as they absorb UV light [10]. High-throughput systems predominantly utilize microtiter plates with 96, 384, 1536, or even higher well densities, enabling parallel processing of dozens to hundreds of samples simultaneously [90].
Detection: Following sample interaction, detectors convert transmitted light into readable electronic signals. Photomultiplier tubes (PMTs) operate based on the photoelectric effect, ejecting electrons upon light exposure and multiplying them to generate measurable current, making them particularly valuable for detecting very low light levels [10]. Semiconductor-based detectors, including photodiodes and charge-coupled devices (CCDs), represent alternative technologies that generate current proportional to light intensity when exposed [10].
Table 1: Key Components of UV-Vis Spectrophotometers for High-Throughput Applications
| Component | Standard Technology | High-Throughput Adaptation | Performance Considerations |
|---|---|---|---|
| Light Source | Tungsten/halogen (vis), deuterium (UV) | Enhanced stability xenon lamps | Switching precision at 300-350 nm critical for dual-lamp systems |
| Wavelength Selector | Monochromator with diffraction grating | Enhanced scanning speed gratings | 1200+ grooves/mm typical; holographic gratings reduce defects |
| Sample Holder | Quartz cuvettes (UV), glass/plastic (vis) | 96-1536 well microplates | Path length reduction (to 1mm) for scarce samples |
| Detection System | Photomultiplier tube (PMT) | Multi-channel detectors, CCD arrays | PMTs superior for low-light detection; CCDs enable parallel detection |
Automated Sample Handling Systems
Microplate Technologies and Automation
The microtiter plate represents the fundamental labware unit in high-throughput screening systems, serving as the primary vessel for simultaneous processing of multiple samples [90]. These disposable plastic plates feature standardized grids of small wells, with common formats including 96, 192, 384, 1536, 3456, and 6144 wells—all multiples of the original 96-well format with 8×12 well arrangements and 9 mm spacing [90]. This standardization has driven the development of complementary devices including repeating pipettes, vacuum manifolds, and automated liquid handling systems that facilitate rapid sample preparation and processing [91].
High-throughput screening facilities typically maintain extensive libraries of stock plates containing carefully catalogued chemical compounds or biological reagents [90]. Rather than using these valuable stock plates directly in experiments, researchers create assay plates by transferring small liquid volumes (often nanoliters) from stock plates to empty plates using precision liquid handling systems [90]. This approach preserves original stock materials while enabling the creation of specialized plates tailored to specific experimental needs.
Robotic Integration and Automation Systems
Automation constitutes an essential element in harnessing the full potential of high-throughput analysis [90]. Integrated robotic systems typically comprise one or more robots that transport assay microplates between specialized stations for sample and reagent addition, mixing, incubation, and final readout or detection [90]. Modern HTA systems can simultaneously prepare, incubate, and analyze numerous plates, dramatically accelerating data collection processes. Contemporary HTS robots capable of testing up to 100,000 compounds per day exist, with ultra-high-throughput screening (uHTS) referring to systems processing in excess of 100,000 compounds daily [90].
The core advantage of automated sample handling lies in its ability to overcome the traditional bottleneck of sample preparation, which surveys have identified as consuming the majority of total analysis time in conventional analytical procedures [91]. By implementing parallel processing strategies and eliminating manual intervention, automated systems significantly enhance throughput while improving reproducibility through reduction of human error [92].
Automated Sample Preparation Techniques
Various sample preparation techniques have been successfully adapted for high-throughput operation through automation and microplate compatibility:
Protein Precipitation: Automated liquid handlers (e.g., Packard Multiprobe II, Tecan Genesis, Gilson 215, Tomtec Microtape) can perform protein precipitation in well plates by adding water-miscible organic solvent (typically 3:1 v/v ratio) to biological matrices [92]. Following protein collection by centrifugation, the handlers transfer aliquots of clear liquid to well plates for subsequent LC-MS injection, while simultaneously managing internal standard addition for calibration and quality control [92].
Liquid-Liquid Extraction (LLE): Systems like the Tomtec Quadra96 automate LLE using microplate platforms by mixing biological matrices with immiscible organic solvents (e.g., chloroform and ether) [92]. While certain steps like decapping tubes or vortexing may require manual intervention, organic layer removal can be automated, with aqueous layer freezing implemented to reduce sampling errors [92].
Solid-Phase Extraction (SPE): SPE can be automated offline using SPE microplates or through multiple-tip liquid-handling workstations (e.g., Zymark XP series) [92]. Online automation is achievable through systems like the Prospekt from Spark Holland, which incorporates solvent delivery units, cartridge transport, sealing mechanisms, and autosamplers [92]. This system loads samples via autosampler to disposable cartridges (2 mm × 10 mm), uses weak solvents to elute unretained salts and polar matrix components, then employs optimized solvent sequences to wash trapped analytes to analytical columns for HPLC separation and detection [92].
Table 2: Automated Sample Preparation Methods for High-Throughput Analysis
| Method | Automation Approach | Typical Applications | Advantages |
|---|---|---|---|
| Protein Precipitation | Automated liquid handlers with well plates | Biological sample cleanup prior to LC-MS | Rapid processing, compatible with diverse matrices |
| Liquid-Liquid Extraction (LLE) | Microplate platforms with liquid handlers | Extraction of compounds from aqueous matrices | High recovery for appropriate analytes, effective cleanup |
| Solid-Phase Extraction (SPE) | SPE microplates or online systems like Prospekt | Sample concentration and cleanup | Excellent cleanup efficiency, compatible with online analysis |
| Turbulent Flow Chromatography (TFC) | Online column switching systems | Direct injection of biological fluids | Minimal sample handling, rapid analysis of small molecules |
Multi-Wavelength Spectrophotometric Methods
Principles of Multi-Wavelength Measurements
Multi-wavelength spectrophotometry represents a significant advancement over single-wavelength measurements, expanding the capabilities of modern analytical laboratories [93]. While single-wavelength analyses remain most common, multi-wavelength approaches have grown increasingly important for measuring multiple components in complex mixtures, correcting for interferences, and enhancing sensitivity [93]. The fundamental principle underlying multi-wavelength techniques leverages the differential absorption characteristics of various compounds across distinct wavelengths, enabling mathematical deconvolution of overlapping spectral features.
These methods are particularly valuable in high-throughput environments where complex biological matrices often contain multiple absorbing species that can interfere with accurate quantification of target analytes. By incorporating measurements at multiple strategically selected wavelengths, analysts can compensate for background absorption, light scattering, and other confounding factors that compromise data quality in single-wavelength determinations [93]. This capability proves especially crucial in clinical chemistry applications, where accurate measurements must be obtained from complex biological fluids like blood, serum, or urine containing numerous interfering compounds [93].
Technical Implementations of Multi-Wavelength Spectroscopy
Several technical approaches facilitate multi-wavelength measurements in high-throughput environments:
Dual-Wavelength Spectrophotometry: This method employs measurements at two carefully selected wavelengths to compensate for background interference and turbidity [93]. The approach typically uses a primary wavelength corresponding to the absorption maximum of the target analyte and a secondary wavelength where the analyte exhibits minimal absorption but interfering substances show similar absorption to the primary wavelength [93]. The difference between measurements at these wavelengths effectively corrects for background interference, enabling more accurate quantification [93].
Multi-Wavelength Excitation Methods: Advanced approaches like multi-wavelength excitation Brillouin spectroscopy computationally reconstruct pure spectral components from multiple spectra acquired using different excitation wavelengths [94]. This methodology effectively removes baseline distortions caused by molecular filter absorption, fluorescent emission, ambient room light, or other constant contaminants that compromise spectral quality [94]. The technique iteratively reconstructs undistorted signals through algorithms such as Lucy-Richardson deconvolution, significantly improving the accuracy of spectral parameter measurements even from highly challenging samples [94].
Derivative Spectroscopy: Derivative approaches enhance spectral resolution by emphasizing subtle spectral features while suppressing constant background interference [93]. By converting conventional absorption spectra into their first, second, or higher derivatives, these techniques effectively resolve overlapping bands and eliminate baseline offsets, though they typically require specialized instrumentation or sophisticated computational processing [93].
Quantitative Applications in Pharmaceutical Analysis
Multi-wavelength spectrophotometry finds extensive application in pharmaceutical analysis, particularly in diffusion coefficient measurements critical for understanding drug release kinetics. Recent methodological advances enable precise determination of diffusion coefficients for both small molecules and proteins using modified UV-Vis spectrometers [95]. By attaching 3D-printed covers with open slits to standard UV-Vis cuvettes, researchers can restrict incident UV light to measure local drug concentrations as compounds diffuse from cuvette bottoms to slit positions [95]. Concentration measurements as a function of time enable diffusion coefficient calculation based on Fick's law of diffusion using both analytical and numerical approaches, providing accurate and reproducible results with instrumentation readily available in most pharmaceutical laboratories [95].
These approaches demonstrate particular utility for investigating dissolution media effects on drug diffusivity, with studies revealing that different media affect diffusion coefficients of small molecules by less than 10% and proteins by less than 15% [95]. Such findings have profound implications for predicting in vivo performance from in vitro dissolution testing, a critical consideration in pharmaceutical development.
Integrated Workflows and Experimental Design
Complete HTA Workflow Integration
The integration of automated sample handling with multi-wavelength detection creates optimized workflows for high-throughput analysis. The following diagram illustrates a comprehensive HTA workflow incorporating both elements:
Multi-Wavelength Methodology
The implementation of multi-wavelength spectroscopy follows specific methodological sequences to ensure data quality:
Research Reagent Solutions and Essential Materials
Successful implementation of high-throughput analysis with automated sample handling and multi-wavelength methods requires specific research reagents and specialized materials. The following table details key components essential for establishing robust HTA workflows:
Table 3: Essential Research Reagents and Materials for High-Throughput Analysis
| Category | Specific Items | Function & Application | Technical Considerations |
|---|---|---|---|
| Microplate Formats | 96, 384, 1536-well plates | Standardized sample vessels for parallel processing | Well spacing, volume capacity, material compatibility (UV-transparent) |
| Liquid Handling | Automated pipetting systems, multi-channel pipettes | Precise reagent/sample transfer in microliter-nanoliter range | Accuracy, precision, cross-contamination prevention |
| Reference Materials | Negative controls, positive controls, blank solvents | Quality control, background subtraction, signal normalization | Biological relevance, stability, matrix matching |
| Biological Reagents | Cells, enzymes, proteins, assay buffers | Biological context for screening, target engagement assessment | Viability, activity, lot-to-lot consistency |
| Detection Reagents | Fluorophores, chromogens, luminescent substrates | Signal generation for detection and quantification | Excitation/emission characteristics, stability, compatibility |
| Automation Consumables | Disposable tips, reagent reservoirs, cartridge seals | Robotic system operation, contamination prevention | Compatibility with automation systems, reliability |
Experimental Protocols and Methodologies
High-Throughput Diffusion Coefficient Measurement
The determination of diffusion coefficients represents a critical application of UV-Vis spectroscopy in pharmaceutical development. The following protocol adapts traditional methodology for high-throughput implementation [95]:
Sample Preparation: Prepare drug solutions at relevant concentrations in appropriate dissolution media. For protein-based therapeutics, maintain physiological pH and ionic strength to preserve native conformation.
Instrument Modification: Attach 3D-printed covers with precisely dimensioned open slits to standard UV-Vis cuvettes. Ensure slit dimensions provide adequate light passage while restricting measurement zone.
Reference Measurement: Fill modified cuvettes with dissolution media without analyte and record baseline absorbance across target wavelength range (e.g., 250-400 nm for small molecules, 280 nm for proteins).
Sample Loading: Carefully layer drug solution beneath dissolution media in cuvette to establish initial concentration gradient without mixing.
Kinetic Measurement: Initiate absorbance measurements at predetermined time intervals (e.g., 30-second intervals for 60-90 minutes) at multiple wavelengths selected based on analyte absorption characteristics.
Data Analysis: Calculate diffusion coefficients based on Fick's law of diffusion using either analytical solutions or numerical approaches fitting concentration-time data.
This methodology has demonstrated high reproducibility and accuracy for both small molecules and proteins, with different media affecting diffusion coefficients of small molecules by <10% and proteins by <15% [95].
Quantitative High-Throughput Screening (qHTS)
Quantitative HTS represents an advanced screening paradigm that generates full concentration-response relationships for each compound in a library [90]:
Assay Plate Preparation: Create dilution series of test compounds directly in assay plates using automated liquid handlers, typically spanning 4-8 concentrations in serial dilution format.
Biological System Introduction: Add target biological systems (cells, enzymes, tissue homogenates) in appropriate assay buffer to all wells, ensuring consistent timing and handling conditions.
Incubation: Maintain plates under controlled environmental conditions (temperature, humidity, CO₂ for cells) for predetermined duration to enable compound-target interaction.
Multi-Wavelength Detection: Measure assay endpoint using multi-wavelength absorbance readings to correct for background interference, inner filter effects, or light scattering.
Data Processing: Calculate response values for each compound concentration, then fit to appropriate model (e.g., four-parameter logistic curve) to determine EC₅₀, maximal response, and Hill coefficient values.
Hit Selection: Identify active compounds based on efficacy and potency thresholds, then prioritize for confirmatory studies based on chemical attractiveness and structure-activity relationships.
This qHTS approach enables comprehensive pharmacological profiling of entire compound libraries, providing rich datasets for structure-activity relationship analysis even in primary screening stages [90].
Data Analysis and Quality Control in HTA
Quality Control Metrics
Robust quality control represents an essential component of reliable high-throughput analysis. Several well-established metrics ensure data quality and experimental validity:
Z-Factor: This widely adopted metric assesses assay quality by comparing the separation between positive and negative controls relative to their dynamic range: Z-factor = 1 - (3σₚ + 3σₙ)/|μₚ - μₙ|, where σₚ and σₙ represent standard deviations of positive and negative controls, and μₚ and μₙ their respective means [90]. Assays with Z-factors >0.5 are considered excellent, while those between 0.5 and 0 are considered marginal to poor [90].
Strictly Standardized Mean Difference (SSMD): SSMD has emerged as a robust metric for assessing data quality in HTS assays, particularly valuable for evaluating the degree of differentiation between positive controls and negative references [90]. This approach provides advantages over traditional signal-to-noise ratios by offering more consistent performance across diverse experimental conditions.
Signal-to-Background Ratio: This fundamental metric calculates the ratio of signal intensity in positive controls to that in negative controls, providing a basic indication of assay window size and detection capability [90].
Hit Selection Strategies
Hit selection methodologies vary depending on screening design and replication strategy:
Screens Without Replicates: For primary screens typically conducted without replicates, z-score methods normalize compound signals relative to plate controls, though these approaches assume consistent variability across all compounds [90]. Robust variations such as z-score, SSMD, B-score, and quantile-based methods offer improved performance with outlier-prone data common in HTS experiments [90].
Screens With Replicates: Confirmatory screens incorporating replicates enable direct estimation of variability for each compound, making SSMD or t-statistic approaches more appropriate as they don't rely on the uniform variability assumption of z-score methods [90]. While t-statistics and associated p-values are commonly employed, they are affected by both sample size and effect size, making SSMD preferable for directly assessing compound effect size independent of sample size considerations [90].
Future Perspectives and Emerging Technologies
The field of high-throughput analysis continues to evolve with emerging technologies promising enhanced capabilities and efficiency. Recent advances include the application of drop-based microfluidics, enabling screening rates approximately 1,000 times faster than conventional techniques while using one-millionth the reagent volumes [90]. This approach replaces traditional microplate wells with fluid drops separated by oil, allowing continuous analysis and hit sorting during reagent flow through microchannels.
Silicon lens arrays represent another innovation, with sheets of lenses placed over microfluidic arrays enabling simultaneous fluorescence measurement of 64 different output channels with a single camera, achieving analysis rates of approximately 200,000 drops per second [90]. Such technological advances continue to push the boundaries of throughput while dramatically reducing reagent consumption and associated costs.
The integration of high-throughput analysis with artificial intelligence and machine learning represents another promising direction, enabling more sophisticated data analysis, pattern recognition, and predictive modeling from the massive datasets generated by HTA systems. These computational approaches will increasingly complement experimental automation, further enhancing the efficiency and effectiveness of drug discovery and biological research.
As these technologies mature, high-throughput analysis will continue to transform scientific discovery across pharmaceutical development, clinical diagnostics, and basic biological research, enabling increasingly sophisticated questions to be addressed through the power of scale, automation, and integrated analytical methodologies.
Optimizing Performance: Troubleshooting Common Issues and Enhancing Data Quality
In UV-Vis spectrophotometry, the stability and integrity of the light source are foundational to data quality and instrument performance. Spectrophotometers typically utilize a combination of light sources to cover the full ultraviolet and visible wavelength range: a deuterium lamp for the UV region and a tungsten-halogen lamp for the visible region. [10] The operation involves the light source emitting a broad spectrum of wavelengths, from which a monochromator selects discrete wavelengths to pass through the sample. [10] The fundamental principle is that molecules in the sample absorb light at specific wavelengths, promoting electrons to higher energy states; the amount of light absorbed provides quantitative and qualitative information about the sample composition. [10] Any fluctuation or degradation in the light source output directly compromises the accuracy of these absorbance measurements, making proactive lamp life monitoring and replacement an essential laboratory practice.
Understanding Lamp Specifications and Typical Lifetimes
The expected operational lifespan of a UV-Vis light source varies significantly by lamp type and is influenced by usage patterns and intrinsic manufacturing variability. The following table summarizes the typical lifetime specifications and real-world observations for common lamps.
Table 1: Lifetime Specifications and Real-World Performance of Common UV-Vis Lamps
| Lamp Type | Typical Manufacturer-Stated Lifetime | Real-World Observed Range | Key Influencing Factors |
|---|---|---|---|
| Deuterium (D2) | 1,000 - 2,000 hours [96] | 700 - 8,000 hours [96] | Number of on/off cycles, operating wavelengths, electronic feedback systems [96] |
| Tungsten-Halogen (Visible) | ~650 hours (for some models) [97] | Not specified in results | Less commonly reported to fail prematurely |
| Xenon (FLD) | Not specified by hours (monitored via % life) [98] | Can exceed 4,000 hours [98] | Number of high/low power flashes, condition of trigger pack [98] |
A critical insight from user experiences is that a deuterium lamp's useful life is wavelength-dependent. A lamp that has become too weak for reliable measurements at low UV wavelengths (e.g., 210 nm) may still perform adequately for analyses at higher wavelengths (e.g., 280 nm or 340 nm). [96] This is because the lamp's output degrades more rapidly in the deep UV region. [96] Furthermore, real-world lifespans often exceed the conservative manufacturer warranties, with reports of lamps lasting 4,000 to 8,000 hours when managed carefully. [96]
Symptoms and Diagnostics of a Failing Lamp
Recognizing the signs of a deteriorating lamp is the first step in proactive maintenance. Key indicators include a consistent decline in detected light intensity (e.g., intensity counts dropping to one-tenth of the expected value) and an increasingly noisy baseline. [96] These symptoms are most detrimental when analyzing samples with low concentration or when working at the lower limits of detection, as the signal-to-noise ratio can become unacceptably low. [96]
Modern spectrophotometers are equipped with self-diagnostic software to aid in this assessment. For instance, Agilent's LabAdvisor software can perform an intensity test and report lamp life as a percentage, factoring in complex usage patterns. [98] Similarly, the Diagnosis features on Agilent 1100 or 1200 series detectors can measure spectral parameters against factory specifications to determine if a lamp is within performance tolerances. [96] It is also important to note that low output is not always due to the lamp itself; over time (3-5 years), contaminated or degraded mirrors in the optical path can also cause a significant drop in energy, a problem that will persist even after installing a new lamp. [96]
Lamp Performance Decision Workflow
The following diagram outlines a systematic protocol for diagnosing the cause of low light intensity and determining the appropriate corrective action.
Step-by-Step Lamp Replacement and System Maintenance Protocol
Once diagnostics confirm that lamp replacement is necessary, a systematic protocol ensures a successful and safe outcome.
- Procurement and Safety: Secure a replacement lamp that is compatible with your specific spectrophotometer model. Note that deuterium lamps can have a limited shelf life (approximately 12 months), so avoid over-stocking. [99] [96] Before starting, consult the manufacturer's manual and power down the instrument completely.
- Lamp Replacement: After the instrument has cooled, carefully remove the old lamp according to the manufacturer's instructions. Avoid touching the quartz window of the new lamp with bare hands, as oils can contaminate the surface and reduce performance. Install the new lamp as a drop-in replacement, ensuring it is securely seated. [99]
- Instrument Initialization and Calibration: Power the instrument on and allow the new lamp to warm up and stabilize as recommended in the manual (typically 15-30 minutes). Execute the instrument's initialization sequence, which often includes an energy calibration or baseline correction.
- Performance Verification: After stabilization, run the diagnostic software again to confirm that light intensity and other parameters are within the specified ranges. Perform a functional test using a known standard to verify that analytical performance has been restored.
To maximize lamp longevity, minimize the number of on/off cycles. If the instrument is used daily, leaving the lamp on is often preferable to switching it off each night. For automated systems, create a sequence that turns the lamp and pump off at the end of a run. [96]
Essential Research Reagent Solutions and Materials
Proper maintenance of a UV-Vis spectrophotometer involves several key consumables and reagents, as detailed below.
Table 2: Essential Materials and Reagents for UV-Vis Spectrophotometer Operation and Maintenance
| Item Name | Function / Purpose | Critical Specifications |
|---|---|---|
| Deuterium (D2) Lamp | High-intensity source of ultraviolet light. [10] | Model-specific compatibility (e.g., for Agilent Cary, Dionex UVD). [99] [97] |
| Tungsten-Halogen Lamp | Source of visible wavelength light. [10] | Model-specific compatibility (e.g., for Agilent Cary 100/300). [97] |
| Quartz Cuvettes | Sample holder for UV light analysis. [10] | Quartz material (transparent to UV); specified path length (e.g., 1 cm). [10] |
| Spectrophotometric Solvents | High-purity solvent for dissolving samples and as a blank/reference. | UV-transparent, HPLC-grade purity to minimize background absorbance. |
| NIST-Traceable Standards | Validation of wavelength accuracy and photometric linearity. | Materials like holmium oxide or didymium filters. |
A disciplined approach to lamp life monitoring and replacement is not merely a maintenance task but a critical component of quality assurance in analytical science. By understanding the performance characteristics of light sources, utilizing built-in diagnostic tools, and adhering to a structured replacement protocol, researchers and drug development professionals can ensure their UV-Vis spectrophotometers consistently deliver the high-quality, reliable data required for rigorous scientific research.
Stray light is a fundamental parameter that defines the performance and accuracy of spectroscopic instruments, particularly UV-Vis spectrophotometers. Within the context of understanding how a UV-Vis spectrophotometer works, grasping the nature of stray light is crucial, as it is one of the most critical specifications of an instrument [100]. It is defined as any light that reaches the detector which is outside the spectral region isolated by the monochromator [101]. In simpler terms, it is electromagnetic radiation detected by the system that was not intended for measurement, often described as "unwanted" or "false" light [102] [103].
For researchers, scientists, and drug development professionals, stray light is not merely a technical curiosity; it is a primary source of instrumental error that directly impacts the validity of quantitative analyses [104]. It introduces deviations from the Beer-Lambert law, the fundamental principle governing absorption spectroscopy, leading to inaccurate absorbance readings, especially at high absorbance values where precision is often most critical for sample concentration determination [104] [105]. This whitepaper provides an in-depth examination of stray light's origins, its profound effect on photometric linearity, standardized methods for its detection, and the strategies employed for its mitigation.
Fundamental Causes of Stray Light
Stray light originates from a variety of sources, both internal and external to the spectrophotometer. A comprehensive understanding of these causes is the first step in its control and remediation.
The primary source of stray light within a well-designed instrument is often the monochromator itself. Imperfections in the diffraction grating, such as periodic variations in the spacing of grooves in ruled gratings, can lead to ghost orders and scattered light [104] [100]. While modern holographic gratings produced by photo-lithographic processes exhibit lower stray light than older mechanically ruled gratings, they remain a significant contributor [101].
Other critical internal sources include [104] [100] [106]:
- Imperfections on optical surfaces: Scratches, dust, or imperfections on lenses, mirrors, and other optical components can cause light to scatter unpredictably.
- Unwanted reflections: Reflections from lens surfaces, mechanical mounts, housing walls, or other supporting structures can accidentally re-enter the optical path. Anti-reflection coatings are vital to mitigate this [100].
- Higher-order diffraction effects: The monochromator may transmit light from higher diffraction orders, which is of a different wavelength than the selected one.
- Light leaks: Gaps in the instrument's enclosure can allow ambient light to enter the system, though this is a sign of poor design or damage [104].
Stray light can also originate from the sample or the external environment:
- Sample phenomena: While less common, the sample itself can fluoresce, phosphoresce, or luminesce, generating light of a different wavelength that is detected [104]. Light scattering from particulate matter in a sample can also be a factor.
- Strong external sources: A strong light source (like the sun) outside the field of view can cause light to scatter off mechanical or optical components onto the detector [107].
Impact on Photometric Linearity and Accuracy
The most significant consequence of stray light is its disruptive effect on photometric linearity, leading to a negative deviation from the Beer-Lambert law [104] [105]. The underlying mechanism and its quantitative impact are detailed below.
The Mechanism of Photometric Error
The Beer-Lambert law states that absorbance (A) is proportional to the concentration of the absorbing species: A = εlc, where ε is the molar absorptivity, l is the path length, and c is the concentration. In an ideal instrument, the detector measures only the light transmitted at the selected wavelength (I). However, in a real instrument, the detected signal is the sum of the desired transmitted light (I) and the stray light (Is). The *measured* transmittance (Tmeas) and absorbance (A_meas) thus become [108]:
Tmeas = (I + Is) / I₀ Ameas = -log(Tmeas)
Where I₀ is the incident light intensity. As the true absorbance of the sample increases (i.e., the sample becomes more concentrated and I approaches zero), the constant stray light component (Is) constitutes an increasingly larger fraction of the total signal reaching the detector. This causes Tmeas to be higher than the true transmittance and, consequently, A_meas to be lower than the true absorbance [108] [101]. The effect is an apparent plateau in absorbance readings at high concentrations, as the measured value can never exceed the limit set by the stray light [108].
Quantitative Analysis of the Error
The following table summarizes the relationship between stray light levels, the maximum measurable absorbance, and the resulting photometric error, illustrating the critical need for instruments with low stray light for high-accuracy work.
Table 1: Impact of Stray Light on Photometric Linearity
| Stray Light Level (%T) | Theoretical Maximum Absorbance Limit | Absorbance at 1% Error Level | Observed Effect |
|---|---|---|---|
| 0.0001% T | 6.0 A | > 4.0 A | Maintains linearity over a very wide dynamic range. |
| 0.001% T | 4.0 A | ~4.0 A | Linearity begins to deviate significantly after 4 A [108]. |
| 0.01% T | 3.0 A | ~2.0 A | Significant negative deviation at high concentrations. |
| 0.1% T | 2.0 A | ~1.0 A | Prevents accurate absorption measurements [104]. |
As shown, an instrument with a stray light specification of 0.1%T cannot reliably measure absorbances beyond 2.0, and the error becomes significant at much lower absorbances [104]. For instance, with 0.001%T stray light, the photometric error does not become significant (~1%) until around an absorbance of 4, after which it increases dramatically [108].
Detection and Measurement of Stray Light
Standardized experimental protocols exist to quantify stray light in UV-Vis spectrophotometers. These methods typically involve using solutions or filters that block the primary wavelength of interest, ensuring any detected signal is due to stray light.
Standardized Experimental Protocols
Table 2: Standard Reagents and Protocols for Stray Light Testing
| Research Reagent / Material | Composition / Type | Function in Stray Light Test | Applicable Wavelength |
|---|---|---|---|
| Sodium Iodide Solution | 10 g/L aqueous solution in a sealed cuvette [105]. | Cut-off filter; absorbs light strongly below ~220 nm [105]. | 220 nm |
| Sodium Nitrite Solution | 50 g/L aqueous solution in a sealed cuvette [105]. | Cut-off filter; absorbs light strongly below ~340 nm & 370 nm [105]. | 340 nm & 370 nm |
| Potassium Chloride Solution | 12 g/L solution [105]. | Pharmacopoeial standard; should have absorbance ≥2A at 198 nm [105]. | 198 nm |
| Liquid Cut-Off Filters | Pre-made solutions with sharp spectral cut-offs [105]. | Convenient, standardized method for specific wavelengths. | Wavelength-specific |
| Solid Cut-Off Filters | Glass or other solid-state filters [105]. | Can test stray light across a broader range of wavelengths [105]. | Broad Spectrum |
The following workflow outlines the general procedure for measuring stray light using these reagents, based on ASTM and pharmacopoeial methods [105].
Figure 1: Workflow for Stray Light Measurement
Detailed Methodology (ASTM Procedure Example) [105]:
- Instrument Preparation: Ensure the spectrophotometer is powered on and has been warmed up according to the manufacturer's specifications. Allow the light source and detector to stabilize.
- Baseline Correction: Perform a baseline or blank correction with an empty cuvette or a solvent-filled cuvette matched to the one used for the test.
- Sample Preparation: Prepare a certified cut-off standard solution, such as a 10 g/L sodium iodide solution for testing at 220 nm. Ensure the solution is homogeneous and free of particulates. Transfer the solution to a high-quality, clean, and matched spectrophotometric cuvette.
- Measurement: a. Place the cuvette containing the cut-off solution into the sample compartment. b. Set the monochromator to the target wavelength (e.g., 220 nm for sodium iodide). c. The cut-off filter will absorb nearly all light at the target wavelength. Therefore, any light detected by the sensor at this wavelength is, by definition, stray light. d. Record the measured %Transmittance (%T) value. This value represents the stray light level at that specific wavelength. For example, a reading of 0.1%T indicates a stray light level of 0.1%.
- Validation: According to pharmacopoeial methods such as the European Pharmacopoeia, a 12 g/L potassium chloride solution should yield an absorbance of 2A or higher at 198 nm. A lower reading indicates significant stray light interference [105].
Mitigation Strategies and Advanced Analysis
Controlling stray light involves a multi-faceted approach, encompassing instrument design, operational protocols, and advanced post-processing techniques.
Instrument Design and Component Selection
- Double Monochromators: Using two monochromators in series significantly reduces stray light, as the stray light ratio becomes the product of the ratios for each individual unit. A system with two monochromators each having 10⁻³ stray light can achieve a combined ratio of 10⁻⁶ [100] [101].
- High-Quality Optical Components: Employing holographic diffraction gratings instead of ruled gratings reduces inherent scattering [101]. Using anti-reflection coatings on lens surfaces and employing light-absorbing (Acktar) coatings on mechanical baffles and housing interiors minimizes unwanted reflections and scattering [100] [102].
- Optical Filtering: Innovative systems integrate filter wheels within the spectrometer. Using order-sorting or long-pass filters physically blocks out-of-band light from entering the monochromator, dramatically reducing the potential for stray light generation, akin to a double monochromator [103].
Stray Light Analysis and Simulation
Modern engineering relies on optical simulation software to proactively address stray light long before a physical prototype is built [106]. Tools like Zemax OpticStudio and Ansys Speos allow engineers to model the entire optical system, including mechanical housing and mounts [107] [106].
Ray tracing software simulates the paths of millions of rays as they travel through and interact with the system, identifying critical stray light paths such as ghost images from multiple reflections or scatter from mechanical edges [107] [106]. This enables designers to optimize the placement of baffles, light traps, and coatings to block or absorb unwanted light effectively [106]. The process of converting a sequential optical system to a non-sequential model for this analysis is a critical step in virtual prototyping [107].
Mathematical Correction
For advanced spectroradiometers, a mathematical correction can be applied. This method involves characterizing the instrument's stray light properties by measuring its Line Spread Function (LSF) across all wavelengths using a tunable laser or Optical Parametric Oscillator (OPO) [103]. This data forms a Stray Light Distribution Function (SDF) matrix. During subsequent sample measurements, this matrix is used in computational algorithms to distinguish and subtract the stray light component from the measured signal, potentially reducing stray light by one to two orders of magnitude [103].
Stray light is an inherent and performance-limiting factor in UV-Vis spectrophotometry that directly compromises photometric linearity by causing negative deviations from the Beer-Lambert law. Its origins are diverse, stemming from optical imperfections, internal reflections, and design limitations. For professionals in research and drug development, where accuracy at high absorbances is paramount, understanding and monitoring stray light is non-negotiable.
Standardized detection methods using cut-off filters provide a straightforward means of quantifying this instrument parameter. Ultimately, mitigating its effects requires a comprehensive strategy combining superior instrument design with features like double monochromators and light-absorbing coatings, advanced simulation-driven engineering to identify paths of failure, and sophisticated mathematical corrections. Effectively managing stray light is fundamental to ensuring the reliability of spectroscopic data, the integrity of scientific conclusions, and the quality of developed pharmaceutical products.
Spectral bandwidth (SBW) represents a fundamental parameter in ultraviolet-visible (UV-Vis) spectrophotometry that directly governs both the resolution and signal-to-noise ratio (SNR) of measurements. Defined as the width of the wavelength interval at half the maximum intensity of the light beam exiting the monochromator, SBW determines the instrument's ability to distinguish between adjacent spectral features while maintaining sufficient light throughput for detection. In pharmaceutical development and research applications, proper SBW selection is critical for achieving accurate, reproducible results that comply with regulatory requirements.
The relationship between SBW and measurement accuracy stems from the inherent compromise between spectral resolution and signal intensity. Narrower bandwidths provide better resolution of closely spaced absorption peaks but reduce the light energy reaching the detector, potentially degrading SNR. Conversely, wider bandwidths improve signal intensity but may obscure fine spectral details through peak broadening and absorption depression, where measured absorbance values decrease due to inclusion of wavelengths where the analyte absorbs less strongly [109]. This guide examines the principles and practical methodologies for optimizing SBW to balance these competing factors within the context of UV-Vis spectrophotometer operation.
Theoretical Foundations of Bandwidth Selection
The Instrumental Basis of Spectral Bandwidth
Spectral bandwidth in a UV-Vis spectrophotometer is primarily determined by the monochromator slit width and the dispersion characteristics of the optical system. The product of the physical slit width and the linear dispersion of the monochromator gives the spectral bandwidth, typically measured in nanometers. Modern instruments often provide selectable bandwidths ranging from 0.1 nm to 5 nm or more, allowing users to match instrumental capabilities to analytical requirements.
The fundamental relationship between SBW and measurement accuracy was extensively studied by researchers including Lee and Robinson, who demonstrated that the ratio of spectral bandwidth to natural bandwidth (SBW/NBW) of the analyte should ideally not exceed 0.1 for minimum photometric error [109]. The natural bandwidth represents the width of the analyte's absorption band at half its maximum height. When SBW exceeds approximately 10% of the natural bandwidth, measured absorbance values begin to decrease significantly, leading to non-linear calibration curves and reduced analytical accuracy.
Mathematical Relationship Between SBW and Photometric Accuracy
The theoretical relationship between relative bandwidth (RBW = SBW/NBW) and observed-to-true absorbance ratio (Aobs/A) follows a predictable pattern as illustrated in Table 1 [109]:
Table 1: Theoretical Relationship Between Relative Bandwidth and Absorbance Measurement
| Relative Bandwidth (RBW) | Aobs/A | Relative Bandwidth (RBW) | Aobs/A |
|---|---|---|---|
| 0.01 | 0.9995 | 0.09 | 0.9962 |
| 0.02 | 0.9995 | 0.10 | 0.9954 |
| 0.03 | 0.9995 | 0.20 | 0.9819 |
| 0.04 | 0.9992 | 0.30 | 0.9604 |
| 0.05 | 0.9988 | 0.40 | 0.9321 |
| 0.06 | 0.9983 | 0.50 | 0.8987 |
| 0.07 | 0.9977 | ||
| 0.08 | 0.9970 |
This quantitative relationship demonstrates that as RBW increases beyond 0.1, the depression of measured absorbance values becomes increasingly significant. At RBW = 0.2, nearly 2% of the true absorbance is lost, and this error exceeds 10% when RBW reaches 0.5 [109]. These data provide the mathematical foundation for bandwidth optimization strategies in analytical applications.
Practical Consequences of Improper Bandwidth Selection
Pharmaceutical Analysis Case Study
The critical impact of proper SBW selection is vividly demonstrated in pharmaceutical quality control, particularly in antibiotic analysis. Research has shown that testing penicillin sodium with different bandwidths produces significantly varied absorbance readings [109]:
Table 2: Bandwidth-Dependent Absorbance Variations in Penicillin Sodium Analysis
| Spectral Bandwidth (nm) | Measured Absorbance | Absolute Error (vs. 0.3 nm) | Relative Error (%) |
|---|---|---|---|
| 2.0 | 0.805 | -0.060 | 6.9% |
| 1.0 | 0.825 | -0.040 | 4.6% |
| 0.3 | 0.865 | 0.000 | 0.0% |
| 0.2 | 0.823 | -0.042 | 4.9% |
These data reveal that both excessively narrow and excessively wide bandwidths can produce suboptimal results. The 0.3 nm bandwidth provided the highest absorbance reading, while the commonly used 1 nm and 2 nm bandwidths underestimated the true absorbance by 4.6% and 6.9%, respectively [109]. Surprisingly, the 0.2 nm bandwidth also produced depressed absorbance values, demonstrating that bandwidth optimization rather than simple minimization is required for accurate analysis.
Regulatory Considerations and Compliance Issues
The pharmaceutical industry operates under strict regulatory frameworks that often specify instrumental parameters. Many pharmacopoeias, including the United States Pharmacopeia (USP) and European Pharmacopoeia (Ph. Eur.), mandate that UV-Vis spectrophotometers used for official testing must have a spectral bandwidth of 2 nm or less [109]. Despite these clear requirements, studies have identified pharmaceutical quality control laboratories using instruments with 5 nm bandwidths, resulting in potential compliance issues and analytical errors approaching 3% - exceeding the 1% tolerance often specified in monographs [109].
Methodologies for Bandwidth Optimization
Systematic Approach to Bandwidth Selection
Optimizing spectral bandwidth requires a methodical experimental approach that considers both the instrumental capabilities and the analytical requirements. The following step-by-step protocol provides a reproducible methodology for determining optimal SBW:
Protocol 1: Empirical Bandwidth Optimization Procedure
Preliminary Scanning: Using a representative analyte solution at the expected working concentration, obtain a full spectrum scan using the instrument's smallest available bandwidth to identify the wavelength of maximum absorption (λmax) and estimate the natural bandwidth (NBW) of the analyte.
Natural Bandwidth Determination: Measure the width of the absorption peak at half its maximum height (Full Width at Half Maximum, FWHM) to determine the NBW. Calculate the target SBW as 10% of this value.
Bandwidth Titration: At the identified λmax, measure the absorbance of the analyte solution using a series of progressively increasing bandwidths, starting from the minimum instrument capability up to approximately 20% of the NBW.
Absorbance Plateau Identification: Identify the bandwidth range where measured absorbance remains constant (plateau region). The optimal SBW typically resides at the lower end of this plateau, balancing resolution and SNR.
Precision Assessment: For the candidate bandwidths identified in step 4, perform replicate measurements (n ≥ 6) to determine the precision and signal-to-noise ratio at each setting.
Final Selection: Choose the bandwidth that provides acceptable absorbance values (within the theoretical maximum), good precision (RSD < 1%), and sufficient resolution for the application.
Integrated Consideration of Absorbance Range
Bandwidth optimization must be conducted in conjunction with appropriate absorbance range selection to minimize photometric errors. Research demonstrates that the theoretically optimal absorbance for minimum concentration error is 0.434 Abs, with practical analytical work best conducted between 0.3-0.7 Abs [109]. Beyond this range, both noise (at low absorbance) and stray light (at high absorbance) introduce significant measurement errors. Table 3 summarizes the relationship between absorbance range and primary error sources:
Table 3: Absorbance Ranges and Dominant Error Sources in UV-Vis Spectrophotometry
| Absorbance Range | Dominant Error Source | Impact on Measurements | Recommended Action |
|---|---|---|---|
| < 0.1 Abs | Photon noise, Detector noise | Signal淹没在噪声中,吸光度与浓度不呈正比 | 浓缩样品或使用光程更长的比色皿 |
| 0.1-0.3 Abs | Moderate noise influence | 可接受的分析误差,但不是最优范围 | 考虑适度浓缩样品 |
| 0.3-0.7 Abs | Optimal balance | 最小的相对误差和绝对误差 | 维持此范围进行分析 |
| 0.7-2.0 Abs | Increasing stray light | 测试结果偏离比耳定律,数据可能偏小 | 稀释样品至最佳范围 |
| > 2.0 Abs | Significant stray light | 吸光度与浓度不呈正比,可能出现反常现象 | 必须稀释样品 |
Advanced Applications and Future Directions
Integration with Machine Learning Approaches
Emerging technologies are addressing bandwidth optimization challenges through intelligent computational methods. Deep learning approaches applied to spectral analysis demonstrate potential for automatically determining optimal instrumental parameters while extracting multiple performance indicators from single measurements [110]. These systems utilize target detection networks that simultaneously classify modulation formats, estimate optical signal-to-noise ratio (OSNR), measure bandwidth, and identify center wavelengths without manual intervention [110].
The architectural framework of these intelligent systems typically incorporates both target classification and target localization modules, allowing comprehensive spectral characterization while adapting to varying instrumental conditions [110]. This approach represents a paradigm shift from traditional manual optimization toward automated, self-optimizing spectrophotometric systems capable of real-time parameter adjustment based on sample characteristics.
Implementation in Fluorescence-Based Imaging
Bandwidth optimization principles extend beyond traditional absorption spectrophotometry to advanced applications including fluorescence-based wound imaging. Patent literature describes integrated devices that employ optimized spectral bandwidths for simultaneous bright-field and fluorescence imaging of biological tissues, enabling quantitative assessment of parameters including wound area, bacterial load, and tissue viability [111]. These medical devices demonstrate the translation of fundamental bandwidth optimization principles to clinical diagnostic applications.
Table 4: Research Reagent Solutions for Spectral Bandwidth Studies
| Item | Function in Bandwidth Optimization | Application Notes |
|---|---|---|
| Penicillin sodium reference standard | Model compound for bandwidth validation | Demonstrates significant absorbance variation with different SBW settings (0.805-0.865 Abs) |
| Holmium oxide filter | Wavelength calibration and bandwidth verification | Provides sharp absorption peaks for resolution assessment |
| Neutral density filters | Absorbance range verification | Validates instrument linearity across different SBW settings |
| Stray light reference solutions | Stray light assessment at different SBWs | Determines upper absorbance limits for each SBW setting |
| Certified reference materials | Method validation and accuracy verification | Confirms optimal SBW selection for specific analyte classes |
| Cuvettes of varying path lengths | Absorbance range adjustment | Enables optimization of absorbance to 0.3-0.7 range without dilution |
Spectral bandwidth optimization remains an essential consideration in UV-Vis spectrophotometry, directly influencing measurement accuracy, regulatory compliance, and analytical outcomes. The optimal bandwidth balances the competing demands of spectral resolution and signal-to-noise ratio while considering the natural bandwidth of the analyte and the photometric accuracy requirements of the application. Through systematic implementation of the methodologies outlined in this guide - including empirical bandwidth titration, absorbance range optimization, and precision assessment - researchers can achieve robust, reliable spectroscopic analyses that meet the rigorous demands of pharmaceutical development and scientific research.
As spectrophotometric technologies evolve, integration of machine learning algorithms and automated optimization protocols promises to simplify bandwidth selection while improving analytical performance. These advances will further enhance the accessibility and reliability of UV-Vis spectrophotometry across diverse application domains, from pharmaceutical quality control to clinical diagnostics and beyond.
Baseline Correction Techniques and Blank Measurement Strategies
In ultraviolet-visible (UV-Vis) spectroscopy, baseline correction and blank measurement are fundamental techniques that ensure the accuracy and reliability of spectroscopic data. Baseline correction addresses instrumental noise and sample-specific interferences that cause offset in absorbance measurements, while blank measurement establishes the reference point against which sample absorbance is calculated [112] [10]. These procedures are particularly critical in pharmaceutical research and development where precise quantification of analytes in complex matrices directly impacts drug quality, efficacy, and safety assessments.
The fundamental principle underlying these corrections stems from the Beer-Lambert Law, which states that absorbance (A) is proportional to the concentration (c) of the absorbing species, the path length (L) of the sample, and the molar absorptivity (ε) [10] [19]. Mathematically, this relationship is expressed as:
A = ε × c × L
Proper baseline correction and blank measurement effectively isolate the absorbance attributable to the analyte of interest by subtracting background contributions from the solvent, cuvette, and other interfering substances [10] [113]. Without these critical corrections, reported absorbance values—and consequently calculated concentrations—can be significantly erroneous. For example, an uncorrected baseline offset at 340 nm could lead to approximately 20% higher reported absorbance at 260 nm and consequently inaccurate concentration calculations for nucleic acids [112].
Theoretical Foundations
The Role of Blank Measurements
Blank measurements serve as the reference standard in UV-Vis spectroscopy, capturing the combined absorbance contributions from everything except the analyte of interest [10] [114]. This includes the solvent, sample holder, and any other components present in the measurement system. When a blank measurement is performed, the instrument records this baseline absorbance profile and subsequently sets it to zero, ensuring that subsequent sample measurements specifically reflect the absorbance of the target analyte [113] [114].
The critical importance of blank quality cannot be overstated. A compromised blank measurement—whether due to contaminated solvent, dirty measurement surfaces, or inappropriate wavelength selection—directly propagates error into all subsequent sample measurements [114]. As illustrated in Figure 1, different buffer solutions exhibit varying absorbance profiles, with some showing significant absorption at wavelengths commonly used for analysis (e.g., 280 nm for proteins) [114].
Table 1: Comparison of Single-Beam and Double-Beam Spectrophotometer Blank Measurements
| Aspect | Single-Beam Instruments | Double-Beam Instruments |
|---|---|---|
| Measurement Approach | Sequential measurement of blank and sample using only the sample beam [115] | Simultaneous measurement using both sample and reference beams [115] |
| Blank Correction | Based on absolute intensity of sample beam during blank measurement (SBlank) [115] | Based on ratio of sample to reference beam during blank measurement (SBlank/RBlank) [115] |
| Light Fluctuation Handling | Requires system stabilization (1-2 hours after power-on); sensitive to source fluctuations [115] | Real-time compensation through continuous reference beam measurement [115] |
| Stability Performance | Moderate; vulnerable to drift over time [115] | Superior long-term stability [115] |
Physical Principles of Baseline Artifacts
Baseline artifacts in UV-Vis spectroscopy primarily arise from two physical phenomena: light scattering and non-specific absorption. Rayleigh and Mie scattering from particulates, soluble protein aggregates, or large molecules can cause significant baseline offsets that interfere with accurate concentration measurements [116]. These scattering effects are particularly problematic in biological samples containing macromolecules, viral particles, or insoluble aggregates [116].
The fundamental principle of light-matter interaction reveals that each molecule possesses a unique set of energy levels associated with its chemical bonds, resulting in characteristic absorption of specific wavelengths [19]. This forms the basis for identifying substances through their absorption spectra. However, when scattering particles are present, they deflect light from the optical path, creating elevated baseline absorbance that follows specific wavelength-dependent patterns [116].
Advanced correction methods based on Rayleigh and Mie scattering equations have been developed to address these artifacts through curve-fitting approaches that also account for instrument-specific baseline contributions [116]. These methods have demonstrated effectiveness across diverse sample types including protein size standards, induced protein aggregates, lentivirus preparations, and synthetic nanospheres [116].
Technical Protocols and Methodologies
Standard Baseline Correction Procedure
The following protocol provides a systematic approach for establishing proper baseline correction using DeNovix DS-11 Series instruments, adaptable to other UV-Vis spectrophotometers with appropriate modifications [112]:
Initial Cleaning: Ensure both top and bottom measurement surfaces are impeccably clean before beginning measurements [112].
Wavelength Range Selection: Launch the UV-Vis application and deselect the default 220-750 nm range to enable the full 190-840 nm spectrum for comprehensive assessment [112].
Baseline Setting: Access the Baseline Correction option from the Overflow menu (three vertical dots) and select 'None' to disable automatic correction during baseline establishment [112].
Blank Measurement: Pipette 1 μL of distilled water (dH₂O) onto the measurement surface and perform a blank measurement. Remove the water completely with a dry laboratory wipe [112].
Blank Verification: Pipette a fresh 1 μL aliquot of dH₂O and measure again. The resulting spectrum should display a relatively flat line along the baseline. Significant absorbance in any region indicates contaminated samples or dirty surfaces, requiring repeated cleaning and re-measurement [112].
Buffer Assessment: Pipette 1 μL of the sample buffer onto the measurement surface and perform a measurement. Verify that the buffer does not exhibit significant absorbance at the wavelength planned for baseline correction [112].
Sample Assessment: Pipette 1 μL of the sample onto the surface and measure. Confirm that the sample shows minimal absorbance at the intended correction wavelength [112].
Wavelength Selection: Empirically determine the optimal baseline correction wavelength where neither buffer nor sample components demonstrate significant absorption [112].
Application of Correction: Apply the determined baseline correction wavelength to all subsequent measurements through the instrument software [112].
Advanced Correction Methodologies
Adjusted Blank Correction (ABC) Method
For analyses involving complex matrices or interfering substances, the Adjusted Blank Correction method provides enhanced accuracy over conventional single-point blank subtraction [117]. This approach is particularly valuable when analyzing samples with low analyte concentrations where background interference represents a significant fraction of the total absorbance [117].
The ABC method employs a scaling factor to account for variations in background interferent concentrations between field blanks and actual samples [117]. The procedure involves:
Identification of Unique Wavelength: Determine a wavelength where only the interfering substance absorbs light, not the target analyte [117].
Spectrum Acquisition: Measure full spectra for both unexposed filter (background interferent) and standard solutions of the target analyte [117].
Scaling Factor Calculation: For each sample, calculate a scaling factor based on the absorbance at the unique wavelength of the interfering substance [117].
Blank Adjustment: Apply the scaling factor to adjust the field blank spectrum to match the sample's background interferent concentration [117].
Absorbance Correction: Subtract the adjusted blank spectrum from the sample spectrum at the analytical wavelength [117].
This method has proven particularly effective in environmental monitoring applications, such as UV-Vis analysis of PTIO-coated filters used in nitrogen oxide passive samplers, where it accurately corrects for PTIO contribution at the 545 nm analytical wavelength despite variations in PTIO concentration with filter age and degradation during exposure [117].
Baseline Manipulation Spectroscopy
Baseline manipulation spectroscopy represents an innovative approach for simultaneous determination of multiple analytes in mixture formulations [118]. This methodology exploits the selective blank composition to isolate analytical wavelengths specific to individual components:
Singular Baseline Manipulation: The blank composition remains constant throughout the analysis, containing one of the analytes at fixed concentration. This approach is ideal for binary mixtures and requires fewer dilutions compared to conventional methods [118].
Multiple Baseline Manipulation: The blank composition is systematically varied to estimate different analytes from complex mixtures. This advanced approach can be extended to ternary mixtures by employing different blank compositions to isolate specific analytical wavelengths for each component [118].
In pharmaceutical applications, this technique has been successfully validated for simultaneous determination of drotaverine and etoricoxib in combined tablet dosage forms, with amplitudes at 274 nm and 351 nm selected for quantification of each drug respectively [118].
Application-Specific Implementation
Wavelength Selection Guidelines
Optimal baseline correction wavelength selection varies significantly across application domains. The following table summarizes recommended practices for different spectroscopic applications:
Table 2: Baseline Correction Wavelength Guidelines for Various Applications
| Application Type | Recommended Wavelength | Special Considerations | Instrument Platform Examples |
|---|---|---|---|
| Nucleic Acids (DNA/RNA) | 340 nm (traditional: 320 nm) [112] | Modern microvolume instruments use longer wavelengths [112] | DeNovix dsDNA, ssDNA, RNA Apps [112] |
| Protein Analysis (A280) | 340 nm [112] | Standard for most protein quantification assays [112] | DeNovix Protein A280 App [112] |
| Microarray/Labeled Proteins | 750 nm (default) [112] | For dyes with maxima >700 nm, use ≥800 nm [112] | DeNovix Microarray and Labeled Protein Apps [112] |
| General UV-Vis Analysis | 340 nm (UV-only); 750 nm (UV-Vis) [112] | Empirically determine for each sample type [112] | DeNovix UV-Vis App [112] |
| Colorimetric Assays | Preconfigured per assay [112] | Typically not user-modifiable [112] | DeNovix Colorimetrics App [112] |
| Kinetics Studies | Empirically determined [112] | Required for all kinetic methods [112] | DeNovix Kinetics App [112] |
| OD600 Measurements | None (unless specified) [112] | Measures light scattering, not absorption [112] | DeNovix OD600 App [112] |
Pharmaceutical Analysis Case Study
The application of baseline manipulation spectroscopy to pharmaceutical quality control is exemplified by a validated method for simultaneous determination of drotaverine (DRT) and etoricoxib (ETR) in combined tablet dosage forms [118]. This approach demonstrates how strategic blank composition enables accurate multicomponent analysis:
Experimental Protocol [118]:
Standard Solutions: Prepare separate stock solutions of DRT (100 μg/mL) and ETR (90 μg/mL) in methanol.
Working Standards: Prepare mixed standard solutions containing 4-20 μg/mL of DRT and 4.5-22.5 μg/mL of ETR through serial dilution.
Spectrum Acquisition: Scan mixed standard solutions against a blank containing 20 μg/mL of DRT in distilled water.
Quantification: Measure instrument response at 274 nm for ETR and 351 nm for DRT against the DRT-containing blank.
Validation: Perform accuracy studies at 50%, 100%, and 150% levels with three determinations each, and precision studies through replicate analyses.
Results and Validation [118]:
- The method demonstrated excellent linearity with Fischer variance ratio confirming significance.
- Recovery studies confirmed accuracy and reproducibility with percentage recoveries within acceptable limits.
- Precision studies showed minimal intra-day and inter-day variations with percentage RSD <2%.
- Robustness testing confirmed method reliability despite deliberate alterations in extraction time, wavelength, and reference concentration.
This pharmaceutical case study illustrates how advanced baseline manipulation strategies can streamline quality control processes for combination drug products while maintaining compliance with ICH validation guidelines [118].
The Scientist's Toolkit: Essential Research Reagents and Materials
Table 3: Key Research Reagent Solutions for UV-Vis Spectroscopy
| Reagent/Material | Function/Purpose | Application Notes |
|---|---|---|
| High-Purity Solvents (methanol, dH₂O) [118] | Blank solution; sample dissolution | Spectroscopic grade minimizes background absorption [118] |
| Buffer Solutions (RIPA, T-PER, M-PER) [114] | Sample matrix maintenance | Verify absence of absorption at analytical wavelengths [114] |
| Nitrite Standards (NaNO₂) [117] | Calibration reference for environmental analysis | Used for NOx passive sampler calibration [117] |
| PTIO-coated Filters [117] | Nitrogen oxide collection in passive samplers | Requires adjusted blank correction for accurate analysis [117] |
| Protein Size Standards [116] | Validation of light scattering corrections | Assess Rayleigh and Mie scattering corrections [116] |
| Reference Analytes (DRT, ETR) [118] | Method development and validation | Pharmaceutical quality control applications [118] |
Troubleshooting and Quality Control
Common Issues and Solutions
High Background in Blank Measurements:
- Cause: Contaminated blank solution or improperly cleaned measurement surfaces [114].
- Solution: Verify blank quality by remeasuring the blank solution, which should produce a flat spectrum. Implement automated blank control systems that warn users of high background absorbance in critical wavelength ranges [114].
Inconsistent Baseline Offset:
- Cause: Particulate matter in samples causing light scattering [116].
- Solution: Centrifuge samples to remove particulates or apply Rayleigh-Mie scattering correction algorithms that fit scattering profiles to the baseline [116].
Inaccurate Concentration Calculations:
- Cause: Improper baseline correction wavelength selection [112].
- Solution: Empirically determine optimal correction wavelength for each sample type, ensuring neither buffer nor sample components absorb significantly at this wavelength [112].
Validation Strategies
Blank Quality Verification: Modern spectrophotometer software often includes automatic blank control features that analyze blank measurements for high background absorbance across multiple wavelength regions (e.g., 250-280 nm, 280-340 nm, etc.) and alert users to potential issues before sample measurement [114].
Method Robustness Testing: Establish method robustness by deliberately varying key parameters including:
- Extraction time (±5 minutes) [118]
- Wavelength of measurement (±2 nm) [118]
- Reference concentration in baseline manipulation (±2 μg/mL) [118]
Precision Assessment: Conduct intra-day and inter-day precision studies with at least nine determinations (three concentrations with three replicates each) to establish method reproducibility [118].
Proper implementation of baseline correction techniques and blank measurement strategies is fundamental to generating accurate, reliable spectroscopic data in pharmaceutical research and development. The methodologies outlined in this technical guide—from fundamental single-point corrections to advanced approaches like Adjusted Blank Correction and Baseline Manipulation Spectroscopy—provide researchers with a comprehensive toolkit for addressing diverse analytical challenges. By selecting application-appropriate wavelengths, validating correction methods according to regulatory guidelines, and implementing robust quality control procedures, scientists can ensure the integrity of spectroscopic measurements throughout the drug development pipeline. As UV-Vis instrumentation continues to evolve with enhanced software capabilities and automated quality checks, these fundamental principles remain essential for extracting meaningful analytical information from complex samples.
Ultraviolet-visible (UV-Vis) spectrophotometry is a fundamental analytical technique used to quantify and qualify samples by measuring their absorption of light across the ultraviolet and visible regions of the electromagnetic spectrum (typically 200-900 nm) [19]. The core principle relies on the Beer-Lambert Law, which states that the absorbance of light by a sample is directly proportional to its concentration, the path length of light through the sample, and the sample's intrinsic molar absorptivity [119] [120]. This relationship, expressed as A = εbc, forms the basis for precise quantitative analysis in diverse fields from pharmaceutical development to biochemical research [8].
The integrity of this measurement is paramount. Even minor deviations in procedure can introduce significant errors, compromising data reliability. Proper cuvette handling and the elimination of air bubbles are not merely procedural details but are critical factors in ensuring that the measured absorbance accurately reflects the sample's properties rather than experimental artifacts. This guide details the best practices to uphold this measurement integrity, framed within the operational context of how a UV-Vis spectrophotometer functions.
How a UV-Vis Spectrophotometer Works
Understanding the instrument's operation is essential for appreciating how errors are introduced. A modern UV-Vis spectrophotometer consists of several key components that work in sequence [8] [19]:
- Light Source: A lamp (e.g., Tungsten, Deuterium, or Xenon Flash) emits radiation across the UV and visible wavelengths.
- Monochromator: This component separates the broad-spectrum light into specific, discrete wavelengths.
- Sample Holder: The cuvette, containing the sample solution, is placed here.
- Detector: This measures the intensity of the light beam after it has passed through the sample.
- Processor/Readout: The detector's signal is converted into an absorbance or transmittance value for the user.
The instrument operates by comparing the intensity of light transmitted through the sample (I) to the intensity of the original incident light (I₀). The absorbance (A) is then calculated as A = log₁₀(I₀/I) [119]. The following diagram illustrates this workflow and the critical points where handling errors can occur.
UV-Vis Spectrophotometry Workflow and Error Points
Figure 1: The UV-Vis spectrophotometer workflow, highlighting critical points where cuvette handling and air bubbles can introduce errors into the final absorbance reading.
The Scientist's Toolkit: Essential Materials and Reagents
The following table details key reagents and materials essential for proper sample preparation and cuvette handling in UV-Vis spectrophotometry.
Table 1: Essential Research Reagent Solutions and Materials for UV-Vis Spectrophotometry
| Item | Function & Importance | Technical Specifications & Notes |
|---|---|---|
| Spectrophotometric Cuvettes | Holds the liquid sample in the instrument's light path. Material must be transparent to the wavelengths used. | Quartz: For UV range (<350 nm) and visible light. Glass: For visible range only (≥350 nm). Plastic (PS, PMMA): Disposable; for visible range; avoid with organic solvents. |
| Sample Buffer/Solvent | The medium in which the analyte is dissolved. It is used to zero the instrument (blank). | Must be transparent at the measurement wavelength. The blank must be chemically identical to the sample medium minus the analyte. |
| Lint-Free Wipes | For cleaning and drying the optical surfaces of the cuvette without introducing scratches or fibers. | Essential for maintaining clarity and preventing light scatter. Use non-abrasive materials like microfiber or specialized laboratory wipes. |
| Dewar Flask or Water Bath | For temperature-controlled sample incubation when measuring temperature-sensitive samples or kinetics. | Temperature can affect absorbance and reaction rates. Ensures consistent experimental conditions. |
| Calibration Standards | Solutions of known concentration used to create a calibration curve for quantitative analysis. | Must be of high purity and prepared with high accuracy using volumetric glassware. Verifies instrument performance and enables concentration determination. |
| Compressed Air Duster | For removing persistent dust particles from cuvette surfaces without physical contact. | Prevents scratching that can occur from wiping. Must be used carefully to avoid introducing static or contaminating the sample area. |
Air Bubble Elimination: Protocols and Best Practices
Air bubbles are a common and significant source of error in UV-Vis spectrophotometry. They act as miniature lenses, scattering and reflecting the incident light beam. This scattering leads to an artificially high absorbance reading, as the detector perceives less light having passed through the sample [120]. The following protocol and diagram outline a systematic approach to bubble prevention and removal.
Detailed Experimental Protocol for Bubble Elimination
- Cuvette Selection and Preparation: Choose a cuvette of appropriate material and pathlength for your sample and analytical wavelength. Visually inspect the cuvette for internal scratches or cracks that could nucleate bubble formation.
- Sample Introduction Technique:
- Tilt the cuvette at a 45-degree angle.
- Using a pipette, gently dispense the sample solution against the inner wall of the cuvette. Avoid dispensing directly into the center of the cuvette's base.
- Slowly return the cuvette to an upright position. This technique allows liquid to flow smoothly down the wall, displacing air upwards and minimizing turbulent entrapment.
- Bubble Identification and Removal: After filling, hold the cuvette up to the light and visually inspect the optical path for any bubbles, particularly near the bottom or corners.
- If bubbles are present, gently tap the side of the cuvette with a finger. This often dislodges bubbles stuck to the walls.
- For persistent bubbles, use a brief, low-speed centrifugation (e.g., 1000-2000 rpm for 10-15 seconds) to pull bubbles to the top of the liquid meniscus, away from the light path.
- Final Verification: Before placing the cuvette in the instrument, perform a final visual check to ensure the light path is entirely clear.
Bubble Elimination and Cuvette Handling Protocol
Figure 2: A systematic protocol for preventing and eliminating air bubbles during cuvette filling, incorporating key handling best practices.
Comprehensive Cuvette Handling and Cleaning Procedures
Improper cuvette handling directly impacts the two variables in the Beer-Lambert law related to the sample container: the pathlength (b) and the clarity of the optical path. Fingerprints, smudges, or scratches on the optical surfaces will scatter light, leading to inaccurate, typically elevated, absorbance readings [120]. The following table summarizes the critical best practices.
Table 2: Cuvette Handling Best Practices and Error Prevention
| Practice | Correct Procedure | Consequence of Deviation |
|---|---|---|
| Handling | Always handle cuvettes by the opaque sides or frosted walls. Avoid any contact with the transparent optical faces. | Fingerprints/Oils on optical surfaces scatter light, increasing measured absorbance and introducing significant error. |
| Cleaning | Rinse thoroughly with an appropriate solvent (e.g., water, ethanol) after use. Dry externally with lint-free, non-abrasive wipes. | Residue from previous samples contaminates new samples, leading to cross-contamination and inaccurate concentration values. Improper wiping can cause scratches. |
| Storage | Store in a clean, dry container, ideally in the original protective case or a dedicated rack. Ensure they are completely dry before storage. | Dust accumulation and physical damage (chips, scratches) occur, rendering cuvettes unreliable for precise measurement. |
| Inspection | Visually inspect optical surfaces before each use against a light background for scratches, cracks, or etching. | Using a damaged cuvette introduces uncontrolled light scattering, invalidating the assumptions of the Beer-Lambert law. |
| Orientation | Always place the cuvette in the holder with the same orientation (e.g., using a manufacturer's marking). Ensure it is seated correctly. | Inconsistent pathlength or misalignment of the optical faces with the light beam causes variation between replicate measurements. |
In the context of research and drug development, where decisions are based on precise quantitative data, robust and reproducible methodology is non-negotiable. The foundational science of how a UV-Vis spectrophotometer works—measuring the interaction of light with matter—is straightforward. However, the practical accuracy of this measurement is entirely dependent on the analyst's technique. Adherence to the detailed protocols for air bubble elimination and meticulous cuvette handling outlined in this guide is not a matter of optional perfectionism but a fundamental requirement for generating reliable, publication-quality data. By integrating these best practices into standard laboratory procedure, researchers can effectively minimize a significant source of analytical error and ensure the integrity of their spectroscopic results.
In the context of research on how a UV-Vis spectrophotometer works, understanding and managing environmental conditions is not merely a procedural detail but a fundamental aspect of ensuring data integrity. UV-Vis spectrophotometry functions by measuring the amount of ultraviolet or visible light absorbed by a sample, a process fundamentally governed by the Beer-Lambert Law (A = εbc) [120] [4]. This technique is a cornerstone in analytical chemistry, biochemistry, and drug development for identifying and quantifying substances [10] [4]. However, the precision of this measurement is exceptionally vulnerable to external environmental factors.
Fluctuations in temperature and humidity can introduce significant errors, compromising the very principle of reproducible and accurate absorbance measurements [121]. For researchers and scientists in drug development, where results directly impact product quality and regulatory compliance, controlling these variables is non-negotiable. This guide provides an in-depth technical examination of how temperature and humidity affect UV-Vis spectroscopy, offering detailed protocols and visual tools to empower professionals in upholding the highest standards of analytical accuracy in their research.
Core Principles and Impact of Environmental Factors
The operation of a UV-Vis spectrophotometer involves a light source, a wavelength selector (like a monochromator), a sample holder, and a detector [10]. The entire optical and electronic system is calibrated under the assumption of a stable environment. Deviations from this stability can alter physical components, sample properties, and the instrument's response, leading to analytical inaccuracies that can be difficult to trace.
The table below summarizes the primary environmental factors and their specific impacts on the spectrophotometric system.
Table 1: Impact of Environmental Factors on UV-Vis Spectrophotometry
| Environmental Factor | Impact on the Instrument | Impact on the Sample | Consequence for Absorbance Measurements |
|---|---|---|---|
| Temperature Instability [121] | • Thermal expansion/contraction of optical components, causing misalignment.• Drift in detector response and light source intensity. | • Alters molar absorptivity (ε) [4].• Can shift chemical equilibria (e.g., in pH-sensitive compounds).• May cause evaporation or condensation in open cuvettes. | • Inconsistent readings for the same sample over time.• Inaccurate concentration values due to changes in ε. |
| High Humidity/Moisture [121] | • Oxidation of internal electrical and optical components.• Clouding of the aperture lens.• Contamination of the integrating sphere (in reflectance measurements). | • Hygroscopic samples (e.g., salts, certain APIs) change mass and concentration.• Alters solvent evaporation rates in open cuvettes. | • Increased signal noise and baseline drift.• Systematic error in quantitative analysis. |
| Direct Sunlight & Ambient Light [121] | • Localized heating of the instrument, creating internal temperature gradients.• Stray light reaching the detector if the sample compartment is not fully sealed. | • Can initiate photodegradation in light-sensitive compounds. | • Inaccurate measurements due to instrument heating.• False absorbance values if stray light is detected. |
| Dust & Chemical Vapors [121] | • Contamination of optical surfaces (lenses, mirrors, calibration tiles).• Long-term degradation of the sphere's coating in reflectance instruments. | • Potential for sample contamination. | • Reduced long-term accuracy and shortened instrument lifespan.• Scratched calibration tiles from cleaning contaminated surfaces. |
Quantitative Data and Specifications
Adherence to specified environmental operating ranges is critical for achieving the performance metrics promised by the instrument manufacturer. The following table consolidates quantitative data and best practices for environmental control.
Table 2: Quantitative Specifications and Best Practices for Environmental Control
| Parameter | Optimal / Acceptable Range | Observed Effect of Deviation | Evidence / Source |
|---|---|---|---|
| Ambient Temperature | Optimal: 21 – 25°C (70 – 77°F)Must be stable [121] | A variation of just 4°C can cause a color difference (dE) of 0.4, which is 1.75x the typical variation capability of a high-end instrument [121]. | Datacolor business solutions blog [121] |
| Relative Humidity | Operating Range: 20% – 85% (clean, dust-free atmosphere)Optimal: 65% ±2% [121] | Humidity outside the optimum can cause color differences; textiles are more susceptible than paints and plastics [121]. Hygroscopic samples can change concentration. | Datacolor business solutions blog [121] |
| Light Exposure | Away from direct sunlight; windowless room recommended [121] | Sunlight heats the instrument, leading to inaccurate measurements and potential sample degradation. | Datacolor business solutions blog [121] |
| Atmospheric Purity | Dust-free atmosphere, free from chemical vapors and smoke [121] | Contaminants drastically reduce the operational life of the sphere and long-term accuracy. | Datacolor business solutions blog [121] |
Experimental Protocols for Monitoring and Validation
To ensure ongoing data integrity, laboratories must implement protocols for monitoring environmental conditions and validating instrument performance under those conditions.
Protocol 1: Establishing an Environmental Baseline
This protocol outlines the methodology for characterizing the laboratory environment to establish a baseline.
- Equipment Setup:
- Place a calibrated data logger for temperature and humidity in close proximity (within 1 meter) to the spectrophotometer.
- Ensure the logger is not in direct sunlight or in the path of HVAC vents.
- Data Collection:
- Record temperature and humidity at 5-minute intervals over a minimum period of 7 consecutive days, including both working and non-working hours.
- Data Analysis:
- Calculate the mean, standard deviation, and total range for both temperature and humidity.
- Identify any cyclical patterns (e.g., daily fluctuations from HVAC cycles, weekday vs. weekend variations).
- Baseline Definition:
- The established range (mean ± 3 standard deviations) becomes the documented environmental baseline for the instrument location. Any mitigation efforts (e.g., installing an environmental enclosure) should be validated by repeating this protocol.
Protocol 2: Validating Instrument Stability Under Ambient Conditions
This experiment tests the spectrophotometer's performance stability in its actual operating environment using a stable reference standard.
- Reagent:
- A certified neutral density filter or a stable chemical standard in a sealed cuvette (e.g., holmium oxide filter for wavelength verification, or a 0.1 M potassium dichromate solution in 0.05 M sulfuric acid for absorbance checks).
- Methodology:
- Turn on the instrument and allow it to warm up for the manufacturer-recommended time (typically 30-60 minutes).
- Perform a full instrumental baseline correction with a reference blank.
- Measure the absorbance of the stable standard at its characteristic peak wavelength (e.g., ~350 nm for potassium dichromate). Record this value as A₀.
- Without moving the standard, program the instrument to automatically measure and record the absorbance at the same wavelength every 5 minutes for 4 hours.
- Data Analysis and Acceptance Criteria:
- Plot absorbance versus time.
- Calculate the mean absorbance (Ā) and the standard deviation (σ) of all measurements.
- The system is considered stable for the duration of the test if the coefficient of variation (CV = (σ / Ā) × 100%) is less than 0.5% and no discernible drift (consistent upward or downward trend) is observed. A drift greater than 0.001 AU/hour may indicate environmental sensitivity.
Workflow for Environmental Management
The following diagram illustrates the logical workflow for implementing a comprehensive environmental management strategy for UV-Vis spectrophotometry.
Diagram 1: Environmental Management Workflow
The Scientist's Toolkit: Essential Research Reagent Solutions
The following table details key materials and reagents required for executing the environmental validation protocols and ensuring robust UV-Vis measurements.
Table 3: Essential Materials and Reagents for Environmental and Analytical Validation
| Item / Reagent | Function / Purpose | Technical Notes |
|---|---|---|
| Certified Reference Materials (CRMs) | To verify the wavelength and photometric accuracy of the spectrophotometer, decoupling instrument drift from environmental effects. | Holmium oxide filter (wavelength standard); Neutral density filters or potassium dichromate solution (absorbance standard) [4]. |
| Sealed Cuvette | To hold liquid standards without evaporation, preventing concentration changes due to humidity or temperature fluctuations. | Ensure windows are made of quartz for UV studies, as glass and plastic absorb UV light [10] [70] [56]. |
| High-Purity Solvents | For dissolving samples and as a blank reference. The solvent must not absorb significantly at the wavelengths of interest. | Different solvents have different UV cutoffs. Water and ethanol are common, but ethanol absorbs weakly in some UV ranges [4]. Always match the solvent of the blank and sample. |
| Temperature & Humidity Data Logger | To provide continuous, documented evidence of ambient conditions, crucial for troubleshooting and regulatory compliance. | Should be calibrated. Placed near the instrument, away from vents and direct light [121]. |
| Quartz Cuvettes | The standard sample holder for UV-Vis measurements. Quartz is transparent throughout the UV and visible range. | Must be kept meticulously clean. Rinse with the solvent to be used before loading the sample [10] [56]. |
| Syringe Filters (0.45 μm or 0.2 μm) | To remove particulate contaminants from solutions before measurement, which can cause light scattering and erroneously high absorbance [56]. | Essential for preparing clear, homogeneous solutions, especially for samples that may aggregate. |
| Environmental Enclosure | A temperature-controlled chamber that houses the spectrophotometer, providing a stable microclimate independent of the room's conditions. | The ultimate solution for labs with significant environmental fluctuations. Ensures consistent conditions 24/7. |
Within the broader research into how ultraviolet-visible (UV-Vis) spectrophotometers function, performance verification stands as a critical practice ensuring the instrument's output is reliable and accurate. A UV-Vis spectrophotometer operates on the principle of measuring the amount of discrete wavelengths of UV or visible light absorbed by a sample, a property governed by the Beer-Lambert law [10] [8]. This technique is foundational in many areas, including drug development, where it is used for tasks ranging from nucleic acid purity checks to quality control in the beverage industry and stability testing of pharmaceuticals [10] [20] [88].
However, the integrity of this data is entirely dependent on the correct operational performance of the instrument's core components: its wavelength selector and its photometric system. This guide provides an in-depth technical overview of validating wavelength accuracy and performing photometric calibration, framing these essential procedures within the context of ensuring data integrity for scientific and regulatory purposes.
Principles of Instrument Operation and the Need for Calibration
A foundational understanding of the instrument's operation is necessary to appreciate the critical nature of its calibration. A UV-Vis spectrophotometer functions by passing a beam of light through a sample and measuring the intensity of light that emerges [10] [8].
Core Components and Workflow
The process involves several key components working in sequence [10] [8]:
- Light Source: Provides a broad spectrum of UV and/or visible light (e.g., deuterium, tungsten, or xenon lamps).
- Wavelength Selector (Monochromator): This crucial component separates the broad light into a narrow band of specific wavelengths. This is typically achieved using a diffraction grating that can be rotated to select the desired wavelength [10].
- Sample Holder: The sample, contained in a cuvette or other holder, is placed in the path of the selected light beam.
- Detector: Measures the intensity of the light after it has passed through the sample (I) and converts it into an electronic signal, which is then compared to the intensity of the light before it passes through the sample (I₀) to calculate absorbance [10].
The entire process is governed by the Beer-Lambert Law, which states that the absorbance (A) of a sample is directly proportional to its concentration (c), the path length (L), and a molecular constant known as the molar absorptivity (ε) [10] [19]. The relationship is expressed as: A = ε c L
Why Performance Verification is Critical
Over time, factors such as mechanical wear in the monochromator, aging of the light source, or environmental conditions can cause the instrument to drift from its calibrated state [122]. This manifests as two primary types of error:
- Wavelength Inaccuracy: The instrument reports an incorrect wavelength, leading to misidentification of compounds or inaccurate absorptivity values in quantitative calculations [123].
- Photometric Inaccuracy: The instrument reports an incorrect absorbance value, which directly invalidates any concentration determination based on the Beer-Lambert law [123] [55].
Performance verification is, therefore, not optional but a mandatory practice in regulated laboratories to ensure compliance with pharmacopeial standards like USP, EP, and JP, and to guarantee the quality of analytical results [88] [122].
Wavelength Accuracy Validation
Wavelength accuracy confirms that the wavelength selected or reported by the spectrophotometer corresponds to the actual wavelength of light passing through the sample.
Principle and Methodology
Validation is performed by measuring a reference material with sharp, well-characterized absorption peaks across the UV and visible spectrum [123] [55]. The instrument's reported peak maxima are then compared to the certified values of the reference material.
Primary Reagent: Holmium Oxide (HoO₃) Solution is the most common standard, certified by organizations like NIST (Standard Reference Material 2034) [123]. It provides at least 14 sharp absorption bands between 240 nm and 650 nm.
Experimental Protocol
- Preparation: Fill a quartz cuvette with the holmium oxide filter or solution. Use air or an appropriate solvent blank for the baseline correction.
- Scanning: Scan the holmium oxide standard over a suitable wavelength range (e.g., 240-650 nm) using a slow scan speed and narrow spectral bandwidth (e.g., 1 nm or less) to properly resolve the peaks [123].
- Measurement: Record the wavelength at which each characteristic absorption peak reaches its maximum absorbance. Most instruments have software features to automatically identify and report these peak maxima.
- Analysis: Compare the measured wavelength values against the certified values. The difference between the measured value and the certified value is the wavelength error.
Acceptance Criteria and Data Interpretation
The table below summarizes the certified wavelengths for holmium oxide and typical acceptance limits [123] [55].
Table 1: Certified Wavelengths for Holmium Oxide Solution and Acceptance Criteria
| Band Number | Certified Wavelength (nm) | Measured Wavelength (nm) | Wavelength Error (nm) | Acceptance Limit (nm) |
|---|---|---|---|---|
| 1 | 241.5 | |||
| 2 | 249.8 | |||
| 3 | 278.2 | ± 0.5 nm | ||
| 4 | 287.2 | |||
| 5 | 333.7 | |||
| 6 | 360.9 | |||
| 7 | 418.4 | |||
| 8 | 453.2 | |||
| 9 | 536.4 |
For most modern UV-Vis spectrophotometers, the wavelength error should not exceed ± 0.5 nm across the measured range [55]. Some pharmacopeial methods may require stricter tolerances, such as ± 0.3 nm at specific wavelengths [55].
The following workflow diagram outlines the key steps in the wavelength validation process:
Wavelength Accuracy Validation Workflow
Photometric Calibration
Photometric calibration verifies the accuracy and linearity of the instrument's absorbance scale.
Principle and Methodology
This calibration is performed using a set of reference standards with known, certified absorbance values across a range of concentrations [123] [55]. The measured absorbance is plotted against the known absorbance (or concentration) to assess accuracy and linearity. The Beer-Lambert law dictates a linear relationship, and any deviation indicates a photometric problem.
Primary Reagent: Potassium Dichromate (K₂Cr₂O₇) in Dilute Acid is the primary standard for this purpose, traceable to NIST SRM 935a [123] [55]. It provides stable and reproducible absorbance values at several wavelengths.
Experimental Protocol for Absorbance Accuracy and Linearity
- Preparation: Accurately prepare a series of potassium dichromate solutions in 0.005M sulfuric acid, typically spanning concentrations from ~0.02 mg/mL to 0.14 mg/mL [123] [55]. This range produces absorbances from below 0.1 to above 2.0 Absorbance Units (AU) at a 1 cm pathlength.
- Measurement: Using a fixed pathlength cuvette (typically 1 cm), measure the absorbance of each solution at key wavelengths, such as 235 nm, 257 nm, 313 nm, and 350 nm [55].
- Calculation: For each standard, calculate the apparent specific absorbance value A(1%, 1 cm), which is the absorbance of a 1% (10 mg/mL) solution in a 1 cm pathlength cell. The formula is: A(1%, 1 cm) = (Measured Absorbance × 10000) / Concentration of Potassium Dichromate (mg/mL) [55]
- Analysis: Compare the calculated A(1%, 1 cm) values to the certified values at each wavelength.
Acceptance Criteria and Data Interpretation
The table below provides the acceptance criteria for potassium dichromate absorbance standards [55].
Table 2: Acceptance Criteria for Potassium Dichromate Absorbance Standards
| Wavelength (nm) | Certified A(1%, 1 cm) Value | Acceptance Range |
|---|---|---|
| 235 | 124.5 | 122.9 - 126.2 |
| 257 | 144.0 | 142.8 - 145.7 |
| 313 | 48.6 | 47.0 - 50.3 |
| 350 | 106.6 | 105.6 - 108.2 |
Additionally, the response should be linear across the measured absorbance range. A linear regression of measured versus expected absorbance should have a correlation coefficient (R²) of 0.999 or better.
Additional Performance Verification Tests
A comprehensive performance qualification includes several other critical tests.
Stray Light Testing
Stray light is radiation that reaches the detector without passing through the sample, causing deviations from the Beer-Lambert law, especially at high absorbances [10] [122].
- Principle: A solution that acts as an optical filter, absorbing almost all light at a specific wavelength, is used. Any light detected at that wavelength is stray light.
- Reagent: A 1.2% w/v Potassium Chloride (KCl) solution is standard for checking stray light at wavelengths below 200 nm (e.g., at 198-202 nm) [55]. For 240 nm, a 1% Potassium Iodide (KI) solution is used, traceable to NIST SRM 2032 [123].
- Protocol & Acceptance: The absorbance of the KCl solution is measured at ~200 nm using water as a blank. The absorbance should be greater than 2.0 AU [55]. For KI at 240 nm, the measured stray light is reported as % transmittance, and should typically be < 0.2% T for a well-designed instrument [123].
Resolution Power
This test verifies the instrument's ability to distinguish between closely spaced absorption peaks.
- Reagent: A 0.02% v/v solution of toluene in hexane [55].
- Protocol & Acceptance: Scan the solution and identify the absorbance maximum at ~269 nm and the minimum at ~266 nm. The ratio of the absorbance at the maximum to that at the minimum should be not less than 1.5 [55].
The Scientist's Toolkit: Essential Reagents for Verification
The following table details the key materials required for a full performance verification of a UV-Vis spectrophotometer.
Table 3: Key Research Reagent Solutions for UV-Vis Performance Verification
| Reagent / Standard | Primary Function | Technical Explanation |
|---|---|---|
| Holmium Oxide (HoO₃) Solution | Wavelength Accuracy | A solution with multiple sharp, well-defined absorption peaks at certified wavelengths from 240-650 nm. Serves as a ruler to calibrate the monochromator's wavelength scale [123]. |
| Potassium Dichromate (K₂Cr₂O₇) Set | Photometric Accuracy & Linearity | A set of solutions with certified absorbance values. Used to verify the accuracy of the absorbance scale and the linearity of the detector's response across a range of concentrations (e.g., 0.02 - 0.14 mg/mL) [123] [55]. |
| Potassium Chloride (KCl) or Potassium Iodide (KI) | Stray Light Detection | A solution that acts as a sharp-cut filter, absorbing all incident light below a cutoff wavelength. Any signal detected at this wavelength is measured as stray light [123] [55]. |
| Toluene in Hexane | Resolution Power | A solution with closely spaced absorption peaks at 266 nm and 269 nm. Tests the instrument's ability to resolve fine spectral features, which is dependent on the spectral bandwidth [55]. |
| Neutral Density Filters | Optional Photometric Check | Solid filters with certified transmittance or absorbance values. Provide a quick, solution-free check of photometric performance at specific wavelengths [122]. |
The relationship between these tests and the instrument's components is summarized below:
Linking Performance Tests to Instrument Components
Rigorous performance verification through wavelength accuracy validation and photometric calibration is not merely a regulatory hurdle; it is a fundamental scientific practice that underpins the reliability of all data generated by a UV-Vis spectrophotometer. By integrating these procedures into a regular schedule—from daily baseline checks to annual comprehensive qualification—researchers and drug development professionals can ensure their instruments are functioning within specified parameters [122]. This diligence guarantees the integrity of analytical results in critical applications, from quantifying active pharmaceutical ingredients and assessing drug stability to ensuring the purity of biological samples, thereby supporting the overall validity of scientific research and quality control.
A UV-Vis spectrophotometer is a sophisticated analytical instrument that measures the absorption of light across the ultraviolet and visible regions of the electromagnetic spectrum [124]. Its operation is based on the Beer-Lambert Law, which states that the amount of light a sample absorbs is directly proportional to its concentration [124] [8]. These instruments are vital in pharmaceutical research, quality control, and various scientific disciplines for identifying and quantifying substances [10] [8].
Preventive maintenance is not merely a routine task; it is a critical safeguard for performance and data accuracy [125]. Regular maintenance minimizes instrument downtime, ensures measurement accuracy, extends the instrument's operational life, and is often essential for meeting compliance standards in regulated industries [125]. Instrument validation, a key part of maintenance, is the process of verifying that the instrument performs according to defined specifications and is free of problems, ensuring that products meet expected quality standards [126]. This guide provides a detailed framework for maintaining and validating UV-Vis spectrophotometers to ensure their continued reliability and performance.
How a UV-Vis Spectrophotometer Works
Understanding the fundamental components and operation of a UV-Vis spectrophotometer is crucial for effective maintenance. The instrument functions by passing a beam of light through a sample and measuring the intensity of light that is transmitted [127] [10].
The following diagram illustrates the typical workflow and key components involved in a spectrophotometric measurement.
The core components, each requiring specific maintenance attention, include [10] [8]:
- Light Source: Provides broad-wavelength light. Instruments often use two lamps: a deuterium lamp for UV light (typically 190–400 nm) and a tungsten-halogen lamp for visible light (320–1100 nm) [10] [125].
- Monochromator: This component isolates a specific wavelength of light from the broad spectrum emitted by the source. It often uses a diffraction grating to disperse the light [10].
- Sample Holder: Typically a cuvette that holds the liquid sample. Quartz cuvettes are essential for UV work, as glass and plastic absorb UV light [10].
- Detector: Converts the light intensity into an electrical signal. Common types include photomultiplier tubes (PMTs) and photodiodes [10].
In a common double-beam configuration, the light from the monochromator is split into two paths: one passes through the sample (I), and the other passes through a reference blank (I₀) [127]. The detector measures the intensity of both beams, and the instrument's processor calculates the absorbance (A) using the formula A = log(I₀/I) [127] [10].
Preventive Maintenance Schedules and Procedures
A proactive maintenance schedule is essential to prevent instrument failure and data inaccuracy. The following table summarizes the key maintenance tasks and their recommended frequencies.
Table 1: Preventive Maintenance Schedule for UV-Vis Spectrophotometers
| Component | Maintenance Task | Frequency | Key Procedures & Acceptance Criteria |
|---|---|---|---|
| Lamps [125] | Replacement | Every 2000 hours (or as performance degrades) | Replace deuterium (D₂) and tungsten-halogen (WI) lamps. Record usage hours. |
| Optical Components [126] [125] | Inspection & Cleaning | Quarterly or as needed | Use air blow to remove dust from mirrors. Check for oxidation or physical damage. |
| Cuvettes [125] | Cleaning | Before and after every use | Use lint-free wipes; ensure no scratches or contamination that impact transmittance. |
| System Validation [126] | Performance Verification | Periodically and after maintenance/movement | Check wavelength accuracy, photometric accuracy, stray light, and noise level. |
| General Environment [125] | Condition Check | Continuous | Ensure a dust-free atmosphere, stable power supply, and absence of vibrating machinery. |
Detailed Maintenance Protocols
Light Source Maintenance Lamps are consumable items with a finite lifespan. A degraded lamp manifests as reduced light intensity, increased noise in the signal, or failure to energize [126] [125]. Adhere to the manufacturer's recommended replacement schedule, typically around 2000 hours of operation [125]. When replacing a lamp, technicians should also perform an air blow cleaning of the source mirror located in the lamp compartment, as dust and heat can reduce its reflectivity and affect energy throughput [125]. Always allow the instrument to cool before handling lamps and avoid touching the quartz glass envelope with bare hands.
Optical Component Cleaning The optical path includes several mirrors and lenses that direct and focus the light beam. Over time, these components can accumulate dust or deteriorate, leading to increased stray light and reduced throughput [126] [125].
- Procedure: Use a gentle stream of clean, dry, oil-free air to dislodge dust from optical surfaces. For more persistent contamination, consult the manufacturer's guidelines, as cleaning may require specialized solvents and lint-free swabs to avoid scratching delicate coatings.
- Verification: After cleaning, perform a system validation to ensure performance has been restored, paying particular attention to baseline stability and stray light levels [126].
Cuvette Handling and Cleaning Cuvettes must be kept impeccably clean and free of scratches. Scratches or residues can scatter or absorb light, causing errors and fluctuations in readings [125].
- Procedure: Rinse cuvettes with an appropriate solvent (e.g., the solvent used for the sample). For stubborn residues, use a mild detergent followed by multiple rinses with purified water and then a volatile solvent like acetone. Allow to air dry.
- Inspection: Visually inspect cuvettes against a bright background for scratches or cracks. Hold them by the upper ribs to avoid leaving fingerprints on the optical surfaces.
System Validation and Performance Verification
Instrument validation is a diagnostic process to confirm that the spectrophotometer performs according to specifications and is adequate for its intended use [126]. It involves verifying key performance parameters as prescribed by standards such as JIS K0115 [126].
The following diagram outlines the logical workflow for executing a system validation.
Key Validation Parameters and Experimental Protocols
Wavelength Accuracy Wavelength accuracy is the agreement between the wavelength indicated by the instrument and the true wavelength [126].
- Protocol: Use a reference material with sharp, known emission or absorption peaks, such as the emission lines of a deuterium lamp (e.g., 656.1 nm, 486.0 nm) or a holmium oxide filter [126]. Measure the spectrum of the standard and determine the wavelength of the peak maximum.
- Acceptance Criteria: The difference between the measured peak wavelength and the certified value is the wavelength accuracy. The permissible error depends on the application, but an accuracy of ±0.1 nm is often adequate for most routine analyses [126].
Stray Light Stray light is radiation outside the selected wavelength band that reaches the detector. It causes absorbance errors, particularly at high absorbance values, and can distort the calibration curve [126].
- Protocol: Use a solution that completely blocks the selected wavelength. For example, a sodium iodide (NaI) solution does not transmit light at 220 nm [126]. First, measure the transmittance with a shutter block (value X), then with the NaI solution in the light path (value Y).
- Acceptance Criteria: The stray light is defined as (Y – X). A high-quality instrument should have very low stray light, typically <0.01% [126].
Photometric Accuracy and Noise Level Photometric accuracy verifies the correctness of the absorbance or transmittance reading [126].
- Protocol: Use certified neutral density filters or standard solutions with known absorbance values at specific wavelengths. Measure the absorbance of the standard and compare it to the certified value.
- Noise Level: This indicates the condition of the light source and electronic stability [126]. Measure the absorbance over one minute at a specific wavelength near 0 Abs. The noise level is the maximum peak-to-trough deviation. An increase in noise often signals a lamp nearing the end of its life [126].
Table 2: System Validation Tests and Methods
| Performance Item | Validation Method | Standard / Material Used | Typical Acceptance Criteria |
|---|---|---|---|
| Wavelength Accuracy [126] | Measure known emission/absorption peak | Deuterium lamp emission (656.1 nm) or Holmium oxide filter | Error ≤ ±0.1 nm to ±1.0 nm (application-dependent) |
| Stray Light [126] | Measure blocking solution transmittance | Sodium Iodide (for 220 nm) or Potassium Chloride | Stray light < 0.01% (application-dependent) |
| Photometric Accuracy [126] | Measure certified absorbance standard | Neutral Density Filters or Potassium Dichromate solutions | Absorbance error within ±0.001 to ±0.010 |
| Noise Level [126] | Measure baseline stability over time | No sample (air-air or solvent-solvent) | Maximum deviation within specified limit over 1 minute |
| Resolution [126] | Measure ability to distinguish close peaks | Toluene in hexane spectrum (peak at 269 nm) | Clearly resolved fine structure |
The Scientist's Toolkit: Essential Materials for Maintenance and Validation
Successful maintenance and validation require specific reagents, tools, and consumables. The following table details the essential items for a well-equipped laboratory.
Table 3: Essential Research Reagent Solutions and Materials for Maintenance
| Item | Function / Purpose | Key Details & Considerations |
|---|---|---|
| Deuterium (D₂) Lamp [125] | UV light source (190-400 nm) | Consumable; replace every ~2000 hours. Degradation increases noise. |
| Tungsten-Halogen (WI) Lamp [125] | Visible light source (320-1100 nm) | Consumable; replace every ~2000 hours. |
| Certified Quartz Cuvettes [125] | Holds liquid sample in the light path | Must be scratch-free and clean. Quartz is required for UV range. |
| Wavelength Standard [126] | Validates wavelength scale accuracy | E.g., Holmium oxide filter or Didymium filter with certified peaks. |
| Stray Light Solution [126] | Evaluates stray light performance | E.g., Sodium Iodide (for 220 nm), Potassium Chloride (for 200 nm). |
| Absorbance Standard [126] | Validates photometric (A/T) scale | E.g., Neutral Density Filters or Potassium Dichromate solutions. |
| Source Mirror [125] | Reflects and directs light in the optical bench | Spare part for replacement; can lose reflectivity over time. |
| Lint-free Wipes/Swabs [125] | For cleaning optical components and cuvettes | Prevents scratching and lint contamination. |
Modern spectrophotometers often include automated validation software, such as Shimadzu's UV Performance Validation Software, which simplifies the setup of inspection items, automates measurements and calculations, and generates reports, thereby reducing effort and potential for human error [126].
A rigorous and documented program of preventive maintenance and system validation is fundamental to the operation of any analytical laboratory relying on UV-Vis spectrophotometry. By adhering to a scheduled maintenance plan—encompassing regular replacement of consumables like lamps, careful cleaning of optical components and cuvettes, and periodic performance verification—researchers and drug development professionals can ensure the integrity of their data, comply with regulatory standards, and extend the functional lifespan of their critical instrumentation. This proactive approach transforms the spectrophotometer from a simple measuring device into a reliable partner in scientific discovery and quality assurance.
Method Validation and Comparative Analysis: Ensuring Regulatory Compliance
Ultraviolet-Visible (UV-Vis) spectrophotometry is a fundamental analytical technique that measures the absorption of light in the ultraviolet and visible regions of the electromagnetic spectrum (typically 190-800 nm) by a sample [10]. The core principle relies on electronic transitions, where molecules absorb specific wavelengths of light, promoting electrons to higher energy states [3]. This absorption is quantitatively described by the Beer-Lambert Law, which states that absorbance (A) is directly proportional to the concentration (c) of the absorbent species, the path length (L) of the sample, and its molar absorptivity (ε) [10]. The resulting absorption spectrum provides a unique profile for substance identification and quantification [10].
In pharmaceutical research and drug development, the reliability of UV-Vis data is paramount. Method validation transforms a general analytical procedure into a trusted tool for generating high-quality data, ensuring that measurements are accurate, precise, and fit for their intended purpose [128] [20]. This process is rigorously guided by international standards, primarily the International Council for Harmonisation (ICH) guidelines [128]. For researchers investigating how UV-Vis spectrophotometers work, understanding these validation parameters is not merely a regulatory hurdle; it is a critical exercise in confirming that the instrument and method together produce scientifically defensible results that can reliably inform decisions on drug stability, efficacy, and commercial viability [20]. This guide provides an in-depth examination of the four core validation parameters—linearity, precision, accuracy, and sensitivity—within the context of rigorous pharmaceutical analysis.
Core Principles of UV-Vis Spectroscopy and Instrumentation
A UV-Vis spectrophotometer operates by passing a beam of light through a sample and measuring the intensity of light that is transmitted. The fundamental components of the instrument work in concert to achieve this [10] [8]:
- Light Source: Provides continuous radiation across the UV and visible range. Common sources include deuterium lamps (UV) and tungsten or halogen lamps (visible light) [10] [3].
- Wavelength Selector: A monochromator containing a diffraction grating is typically used to isolate a specific, narrow band of wavelengths from the broad spectrum emitted by the source [10].
- Sample Holder: A cuvette that contains the solution under investigation. For UV measurements, quartz cuvettes are essential as they are transparent to UV light [10].
- Detector: Converts the intensity of the transmitted light into an electrical signal. Common detectors include photomultiplier tubes (PMTs) and charge-coupled devices (CCDs) [10].
The following diagram illustrates the logical workflow of a UV-Vis analysis, from sample preparation to data interpretation, highlighting where validation parameters are derived.
Detailed Examination of Validation Parameters
Linearity
Linearity assesses the ability of the method to produce test results that are directly proportional to the concentration of the analyte within a given range [128]. This range is a critical method characteristic [128]. The relationship is verified by preparing and analyzing a series of standard solutions at different concentration levels.
A recent study validating a method for Rifampicin quantification in PBS and biological matrices demonstrated excellent linearity across a defined range, achieving a correlation coefficient (r²) of 0.999 [128]. Similarly, a method for estimating total chalcone content reported a linear range of 0.3 to 17.6 µg/mL with an r² of 0.9994 [48]. These high r² values indicate a strong linear relationship, which is foundational for accurate quantification.
Experimental Protocol for Linearity Assessment [128] [48]:
- Prepare Stock Solution: Accurately weigh and dissolve the reference standard to make a primary stock solution.
- Dilute to Working Concentrations: Serially dilute the stock solution to obtain at least five different concentration levels spanning the expected range (e.g., 0%, 50%, 100%, 150% of the target concentration).
- Measure Absorbance: Analyze each solution in triplicate using the validated spectrophotometric method.
- Plot and Calculate: Plot the average absorbance versus concentration and perform linear regression analysis. The resulting calibration curve provides the slope, intercept, and correlation coefficient (r²).
Precision
Precision expresses the closeness of agreement between a series of measurements obtained from multiple sampling of the same homogeneous sample under the prescribed conditions. It is typically investigated at three levels: repeatability, intermediate precision, and reproducibility [128].
Precision is reported as the % Relative Standard Deviation (%RSD), which is the standard deviation expressed as a percentage of the mean. The Rifampicin study reported precision values ranging from %RSD 2.06% to 13.29%, meeting regulatory requirements [128]. The chalcone method showed excellent repeatability with %RSD values of 1.92% and 2.08% [48].
Experimental Protocol for Precision Assessment (Repeatability) [128] [129]:
- Prepare Homogeneous Samples: Prepare six independent samples at a single concentration (e.g., 100% of the test concentration).
- Analyze Under Same Conditions: A single analyst should analyze all six samples using the same instrument, on the same day, and with the same reagents.
- Calculate Mean and Standard Deviation: Compute the mean concentration and standard deviation for the six measurements.
- Compute %RSD: Calculate the %RSD as (Standard Deviation / Mean) × 100%.
Accuracy
Accuracy indicates the closeness of agreement between the value found and the value accepted as a true or reference value. It is often determined by recovery studies, where a known amount of standard is added to a sample, and the measured value is compared to the theoretical value [128].
Accuracy is reported as % Recovery or % Relative Error (%RE). A recovery of 100% indicates perfect accuracy. The Rifampicin method validation showed high accuracy, with recovery values ranging from %RE -11.62% to 14.88% [128]. The chalcone method reported recoveries between 98% and 102% [48].
Experimental Protocol for Accuracy (Recovery) Assessment [128]:
- Prepare Pre-analyzed Sample: Start with a sample matrix (e.g., placebo or blank biological fluid) to which no analyte has been added.
- Spike with Analyte: Add known quantities of the analyte standard to the matrix at three levels (e.g., 50%, 100%, and 150% of the target concentration). Each level should be prepared and analyzed in triplicate.
- Analyze Spiked Samples: Process and analyze the spiked samples using the validated method.
- Calculate % Recovery: For each spike level, calculate the % Recovery as (Measured Concentration / Theoretical Concentration) × 100%.
Sensitivity (LOD and LOQ)
Sensitivity is the ability of a method to reliably detect or quantify small amounts of the analyte. It is defined by two parameters: the Limit of Detection (LOD) and the Limit of Quantification (LOQ) [128].
The LOD is the lowest concentration that can be detected but not necessarily quantified, while the LOQ is the lowest concentration that can be quantified with acceptable precision and accuracy. In the Rifampicin study, LOD values of approximately 0.25-0.49 µg/mL were achieved across all media [128].
Experimental Protocol for Determining LOD and LOQ: LOD and LOQ can be determined based on the standard deviation (SD) of the response and the slope (S) of the calibration curve.
- Generate a Low-Concentration Calibration Curve: Prepare a series of very dilute standard solutions near the expected detection limit.
- Measure Response and Calculate SD: Analyze these solutions and calculate the standard deviation of the response (absorbance).
- Calculate LOD and LOQ: Use the formulas:
- LOD = 3.3 × (SD / S)
- LOQ = 10 × (SD / S) Where SD is the standard deviation of the blank or the y-intercept residuals of the regression line, and S is the slope of the calibration curve.
The following tables consolidate the typical acceptance criteria for each validation parameter and examples of experimental data from recent studies.
Table 1: Typical Acceptance Criteria for UV-Vis Method Validation Parameters
| Parameter | Definition | Typical Acceptance Criteria | Key Statistical Measure |
|---|---|---|---|
| Linearity | The proportional relationship between concentration and signal. | Correlation coefficient (r²) ≥ 0.998 | r² (Coefficient of determination) |
| Precision | The closeness of repeated measurements of the same sample. | %RSD ≤ 2% (Repeatability) | %RSD (Relative Standard Deviation) |
| Accuracy | The closeness of a measured value to a true or reference value. | % Recovery = 98–102% | % Recovery or % Relative Error (%RE) |
| Sensitivity | The ability to detect or quantify small amounts of analyte. | LOD: Signal-to-Noise ~ 3:1 LOQ: Signal-to-Noise ~ 10:1 | LOD (Limit of Detection) LOQ (Limit of Quantification) |
Table 2: Experimental Validation Data from Cited Studies
| Study & Analyte | Matrix | Linearity (Range & r²) | Precision (%RSD) | Accuracy (% Recovery or %RE) | Sensitivity (LOD) |
|---|---|---|---|---|---|
| Rifampicin [128] | PBS, Plasma, Brain Tissue | r² = 0.999 | 2.06% to 13.29% | -11.62% to 14.88% (RE) | 0.25–0.49 µg/mL |
| Total Chalcone [48] | Carbon Tetrachloride | 0.3–17.6 µg/mL, r² = 0.9994 | 1.92% and 2.08% (Repeatability) | 98–102% (Recovery) | Not Specified |
| Terbinafine & Ketoconazole [129] | Pharmaceutical Tablets | Demonstrated for multiple advanced spectrophotometric methods | High precision with low %RSD reported | High accuracy with % recoveries close to 100% | Successfully determined for all methods |
The Scientist's Toolkit: Essential Reagents and Materials
The following table lists key materials and reagents required for a typical UV-Vis method validation study in pharmaceutical analysis.
Table 3: Essential Research Reagent Solutions and Materials for UV-Vis Validation
| Item | Function / Purpose | Example / Specification |
|---|---|---|
| High-Purity Reference Standard | Serves as the benchmark for identity, purity, and concentration for calibration curves [128]. | Certified Active Pharmaceutical Ingredient (API) with known purity (e.g., 99.2% Terbinafine HCl [129]). |
| Appropriate Solvent | Dissolves the analyte without interfering in the target wavelength range; used for preparing blank and standard solutions [10]. | Methanol, distilled water, Phosphate-Buffered Saline (PBS) at specific pH levels [128] [129]. |
| Matrix Components | Used in accuracy (recovery) studies to simulate the real sample environment and test for interference [128]. | Placebo formulation (without API), simulated biological fluids (plasma), or homogenized tissue [128]. |
| Volumetric Glassware | Ensures precise and accurate measurement and dilution of solutions during sample preparation [128]. | Class A volumetric flasks and pipettes. |
| Spectrophotometer Cuvettes | Holds the sample solution in the light path. Material must be suitable for the wavelength range [10]. | Quartz cuvettes for UV range analysis (below 350 nm); glass or plastic may be used for visible light only [10]. |
Advanced Application: UV-Vis in Drug Stability Testing
The role of UV-Vis spectrophotometry extends beyond initial method development into critical areas like drug stability testing, which is essential for predicting commercial viability [20]. Stability testing helps determine a drug's shelf life and appropriate storage conditions by monitoring how environmental stressors like light, temperature, and pH cause chemical changes over time [20]. These changes can affect Active Pharmaceutical Ingredient (API) levels and introduce impurities. UV-Vis spectrophotometry offers a fast and economical way to quantify these changes, allowing researchers to make critical decisions early in the drug development process [20]. The technique's ability to provide objective, quantitative data on potency and contaminants under forced, accelerated, and real-time aging conditions makes it an indispensable tool in the pharmaceutical scientist's arsenal [20].
Rigorous validation of UV-Vis spectrophotometric methods is a non-negotiable standard in pharmaceutical research and development. As demonstrated, the core parameters of linearity, precision, accuracy, and sensitivity provide a comprehensive framework for ensuring that the analytical data generated is reliable and reproducible. Adherence to established protocols and acceptance criteria, such as those outlined in ICH guidelines, is crucial. Mastering these validation principles not only fulfills regulatory requirements but also empowers researchers to confidently utilize UV-Vis spectroscopy as a robust tool for advancing drug delivery systems, ensuring product quality, and ultimately bringing safer and more effective medicines to market.
Ultraviolet-visible (UV-Vis) spectroscopy is an indispensable analytical technique in pharmaceutical development, serving critical roles from drug substance quantification to impurity profiling. Its principle is based on measuring the amount of discrete wavelengths of ultraviolet or visible light absorbed by a sample, which occurs when electrons in molecular chromophores transition to higher energy states upon photon absorption [10] [3]. The resulting absorption spectrum provides both qualitative identification through characteristic absorption patterns and quantitative data via the Beer-Lambert Law, which establishes that absorbance is directly proportional to the concentration of the absorbing species and the path length of light through the sample [10] [8]. Within the framework of ICH Q2(R1) guidelines, UV-Vis methods must undergo rigorous validation to demonstrate suitability for intended purposes, ensuring that analytical data submitted to regulatory agencies possesses the necessary accuracy, reliability, and reproducibility to support drug approval and commercialization [130] [131].
The integration of UV-Vis methodology into regulated pharmaceutical analysis necessitates a comprehensive understanding of both instrumental fundamentals and regulatory expectations. This guide provides a detailed roadmap for developing, validating, and documenting UV-Vis methods that comply with ICH Q2(R1) requirements, facilitating successful regulatory submissions across global jurisdictions including FDA, EMA, and other international health authorities.
Fundamentals of UV-Vis Spectrophotometry
Instrumentation and Operating Principles
A UV-Vis spectrophotometer operates through a coordinated sequence of optical and electronic processes designed to measure light absorption with precision. The instrument consists of several key components: a light source (typically deuterium for UV and tungsten/halogen for visible regions), a wavelength selector (monochromator with diffraction gratings), a sample compartment, and a detector (photomultiplier tube or photodiode array) [10] [8]. Modern instruments often employ a polychromatic optical setup where the full spectrum from a xenon flash lamp passes through the sample before being separated by a polychromator and captured by a CCD or CMOS detector, enabling rapid full-spectrum acquisition [19].
The fundamental mechanism involves directing light of specific wavelengths through a sample solution contained in an appropriate holder (typically quartz cuvettes for UV analysis), and precisely measuring the intensity of transmitted light relative to a blank reference [10]. The resulting absorbance value (A) is calculated logarithmically from the ratio of incident to transmitted light intensity (A = log₁₀(I₀/I)) and related to analyte concentration (c), path length (L), and molar absorptivity (ε) through the Beer-Lambert law: A = εLc [10] [19]. This relationship forms the mathematical foundation for quantitative analysis, though its linear application requires validation across the intended concentration range, with absorbance values optimally maintained below 1.0 to ensure detector sensitivity and quantitative accuracy [10].
Advanced Instrument Capabilities
Contemporary UV-Vis systems offer enhanced capabilities critical for pharmaceutical applications. Microvolume analysis enables accurate measurements with sample volumes as low as 0.3-0.5 μL through specialized pedestal technology that creates a controlled liquid column without traditional cuvettes [8] [19]. Variable pathlength technology extends the dynamic range by effectively creating "virtual dilution," allowing concentrated samples to be analyzed without manual dilution steps [19]. Regulatory-compliant instruments incorporate security-enabled software with features supporting 21 CFR Part 11 compliance, including electronic signatures, audit trails, and user access controls [69] [132]. Additionally, temperature-controlled cuvette holders and built-in vortexers enhance methodological robustness for stability-indicating methods and heterogeneous samples, respectively [19].
Figure 1: UV-Vis Spectrophotometer Workflow. This diagram illustrates the sequential components and processes in UV-Vis spectrophotometry from light generation to data output.
Analytical Method Development for UV-Vis
Systematic Method Development Approach
The development of a robust UV-Vis analytical method follows a structured, iterative process that progresses from fundamental parameter selection through comprehensive optimization. Initially, developers must define the Analytical Target Profile (ATP) specifying the method's purpose, target analytes, required sensitivity, and performance criteria [130]. This is followed by technique selection where UV-Vis is chosen based on the compound's chromophoric properties, concentration range, and matrix considerations [131]. For UV-Vis methods, critical parameters including detection wavelength, solvent compatibility, linear dynamic range, and sample preparation methodology are systematically evaluated [130].
Method optimization employs a systematic approach to establish ideal conditions for accurate and reproducible analysis. Wavelength selection typically identifies λmax through full spectrum scanning (200-400 nm for UV, 400-800 nm for visible) to maximize sensitivity and minimize spectral interference [10] [3]. Solvent compatibility must be verified to ensure analyte stability and appropriate UV transparency—common pharmaceutical solvents include water, buffered aqueous solutions, methanol, and acetonitrile, with careful attention to their UV cutoff limits [10]. Path length optimization balances sensitivity requirements with dynamic range considerations, with standard 1 cm path lengths often modified to 0.1 cm or less for highly concentrated samples [19]. The sample preparation scheme is refined to eliminate matrix effects, with techniques including dilution, filtration, and extraction validated for reproducibility and efficiency [130] [131].
Analytical Target Profile and Risk Assessment
A comprehensively defined Analytical Target Profile (ATP) serves as the foundation for method development and subsequent validation activities. The ATP explicitly states the method's purpose (identification, assay, impurity quantification), target acceptance criteria aligned with regulatory expectations, and measurement quality attributes [130]. For a UV-Vis assay method, the ATP typically includes target uncertainty, precision requirements, and the applicable concentration range. Concurrent with ATP establishment, a systematic risk assessment identifies potential variables affecting method performance, including instrument parameters (stray light, wavelength accuracy), sample-related factors (matrix interference, stability), and procedural elements (dilution accuracy, temperature control) [131]. This risk-based approach prioritizes development efforts toward critical parameters that most significantly impact method robustness and reliability.
Validation Parameters per ICH Q2(R1)
ICH Q2(R1) validation requires demonstration that the analytical procedure is suitable for its intended purpose through defined parameters. The following table summarizes the core validation characteristics and typical acceptance criteria for UV-Vis analytical methods:
Table 1: ICH Q2(R1) Validation Parameters and Acceptance Criteria for UV-Vis Methods
| Validation Parameter | Definition | Experimental Approach | Typical Acceptance Criteria |
|---|---|---|---|
| Specificity | Ability to assess analyte unequivocally with interference | Compare analyte spectrum with placebo, degradants, matrix | No interference at λmax; peak purity >99% |
| Accuracy | Closeness between accepted reference and found value | Recovery studies at 80%, 100%, 120% of target concentration | 98-102% recovery (API); RSD <2% |
| Precision | Degree of scatter under normal operating conditions | Multiple preparations/analyses of homogeneous sample | RSD ≤1% for repeatability; ≤2% intermediate precision |
| Linearity | Ability to obtain results proportional to analyte concentration | Minimum 5 concentrations across specified range | Correlation coefficient (R²) ≥0.999 |
| Range | Interval between upper and lower concentration | Demonstrated through linearity, accuracy, precision | Typically 80-120% of test concentration for assay |
| Robustness | Capacity to remain unaffected by small parameter variations | Deliberate changes in pH, mobile phase, different instruments | System suitability criteria met despite variations |
| LOD/LOQ | Detection: Lowest detectable amountQuantification: Lowest quantifiable amount | Signal-to-noise (3:1 LOD; 10:1 LOQ) or residual standard deviation | Verified with actual samples at claimed levels |
Protocol for Specificity and Selectivity Assessment
Specificity demonstrates that the measured analytical response is attributable solely to the analyte of interest. For UV-Vis methods, specificity is established through the following protocol:
- Prepare solutions of the analyte (at target concentration), placebo/formulation matrix, known impurities/degradation products, and stressed samples (acid/base/thermal/oxidative degradation)
- Record spectra from 200-400 nm for all solutions using matched quartz cuvettes (1 cm path length) and the same solvent system in both sample and reference beams [10]
- Overlay spectra to verify absence of interference at the analyte λmax; any interference necessitates wavelength selection or sample preparation refinement [130] [131]
- Confirm peak purity using photodiode array detectors when available, ensuring spectral homogeneity across the peak [132]
For drug product assays, specificity must be established against all formulation components, while impurity methods require demonstration that degradants and related substances do not interfere with the analyte quantification [130].
Protocol for Linearity and Range Determination
Linearity establishes that the analytical procedure produces results directly proportional to analyte concentration. The experimental protocol includes:
- Prepare standard solutions at a minimum of five concentration levels spanning the claimed range (typically 50-150% of target concentration) [130]
- Analyze solutions in triplicate using the finalized method parameters, randomizing the sequence to minimize drift effects
- Plot mean absorbance versus concentration and apply linear regression analysis
- Calculate correlation coefficient (R²), y-intercept, slope, and residual sum of squares [130]
Acceptance criteria typically require R² ≥ 0.999, y-intercept not significantly different from zero (p > 0.05), and visually random residual distribution [131]. The validated range encompasses concentrations where linearity, accuracy, and precision have been demonstrated [130].
Experimental Protocols for UV-Vis Method Validation
Standard Operating Procedure for Assay Validation
This protocol provides a detailed methodology for validating a UV-Vis assay method for drug substance quantification:
Materials and Equipment
- Validated UV-Vis spectrophotometer with photometric accuracy ±0.002 AU [132]
- Matched quartz cuvettes (1 cm path length) [10]
- Reference standard of known purity (e.g., USP reference standard)
- Appropriate solvent (HPLC grade or higher)
- Volumetric flasks (Class A), pipettes (certified accuracy)
Sample Preparation
- Standard Solution: Accurately weigh approximately 25 mg of reference standard into a 50 mL volumetric flask. Dissolve and dilute to volume with solvent to obtain approximately 500 μg/mL stock solution.
- Test Solutions: Prepare six independent preparations of the test sample at target concentration (100%) following the same procedure.
- Placebo Solution: Prepare placebo equivalent to the test solution concentration.
- Specificity Solutions: Prepare individual solutions of known impurities (0.5-1.0%) and stressed samples.
Analysis Procedure
- Spectrophotometer Qualification: Verify wavelength accuracy using holmium oxide filter; confirm photometric accuracy with potassium dichromate solution [132]
- λmax Determination: Scan standard solution from 200-400 nm to identify maximum absorption wavelength
- Method Validation: Using fixed wavelength at λmax, analyze solutions in following sequence:
- Blank (solvent)
- Standard solution (six replicates)
- Test solutions (six preparations)
- Specificity solutions
- System suitability standard (after test solutions)
Calculation and Acceptance Criteria
- Accuracy: Mean recovery 98-102% with RSD <2%
- Precision: RSD of six test preparations ≤1%
- Linearity: R² ≥ 0.999 across 50-150% of target concentration
- Specificity: No interference at λmax from placebo, impurities, degradants
System Suitability Testing Protocol
System suitability tests verify that the complete analytical system (instrument, reagents, columns, and analyst) is functioning adequately at the time of analysis. For UV-Vis methods, system suitability includes:
- Photometric Accuracy: Measure absorbance of qualified reference standard (e.g., potassium dichromate) at specified wavelengths; measured values must be within ±1% of certified values [132]
- Wavelength Accuracy: Verify using holmium oxide filter or deuterium emission lines; measured wavelengths must be within ±1 nm of established values [132]
- Stray Light: Assess using appropriate cutoff filters (e.g., potassium chloride solution for 200 nm); absorbance must exceed 2.0 AU [8]
- Resolution: For methods measuring multiple wavelengths, verify resolution capability using standard solutions
System suitability must be established prior to sample analysis and typically repeated at the end of analytical sequences to verify sustained system performance [131] [132].
Essential Research Reagents and Materials
Successful UV-Vis method implementation requires carefully selected reagents and materials that meet regulatory standards for quality and traceability. The following table catalogues essential materials for pharmaceutical UV-Vis analysis:
Table 2: Essential Research Reagents and Materials for UV-Vis Method Development
| Material/Reagent | Specification | Function/Purpose | Quality Considerations |
|---|---|---|---|
| Reference Standards | USP/EP/JP primary standards or certified reference materials | Method development, calibration, qualification | Certified purity, proper storage, documentation |
| Solvents | HPLC grade or better, UV cutoff below measurement wavelength | Sample preparation, dilution, blank preparation | Spectral purity, low particulate matter, expiration dating |
| Quartz Cuvettes | Matched pairs, 1 cm path length (standard) | Sample containment for measurement | Optical clarity, cleanliness, absence of scratches |
| Buffer Components | Analytical grade, low UV absorbance | Mobile phase preparation for aqueous samples | pH accuracy, filtration requirements, stability |
| Validation Kits | NIST-traceable reference materials | Instrument qualification, method validation | Certification documentation, stability, proper handling |
| Filters | 0.45 μm or 0.2 μm membrane filters | Sample clarification, solvent filtration | Low extractables, compatibility with solvents |
Regulatory Documentation and Compliance
Validation Documentation Requirements
Comprehensive documentation demonstrating method validity is essential for regulatory submissions. The validation package must include:
- Validation Protocol: Pre-approved document detailing objectives, methodology, acceptance criteria, and responsibilities [131]
- Complete Experimental Data: Raw data, calculations, and spectra supporting each validation parameter [130]
- Validation Report: Summary comparing results against acceptance criteria, discussing deviations, and concluding method suitability [131]
- System Suitability Tests: Ongoing verification of method performance during routine use [132]
Electronic records must comply with 21 CFR Part 11 requirements, including audit trails, electronic signatures, and data integrity safeguards [69] [132]. Contemporary UV-Vis systems with enhanced security software facilitate compliance through features like user access controls, data encryption, and comprehensive audit trails that track all method modifications and data processing steps [69].
Lifecycle Management and Post-Approval Changes
Adherence to the analytical procedure lifecycle concept, as outlined in emerging ICH Q14 guidelines, ensures continued method validity following regulatory approval. Lifecycle management includes:
- Performance Monitoring: Ongoing assessment of method performance through system suitability tests and control charts [130]
- Change Control: Formal process for evaluating, testing, and documenting modifications to approved methods [131]
- Periodic Review: Scheduled revalidation to confirm method robustness, particularly when transferring between laboratories or sites [131]
- Knowledge Management: Continuous documentation of method performance, failures, and improvements throughout the method lifespan [130]
Effective lifecycle management necessitates robust change control procedures and documentation practices that demonstrate continuous method validity while accommodating necessary improvements [130] [131].
Figure 2: UV-Vis Method Validation Lifecycle. This diagram illustrates the cyclical process from method development through post-approval lifecycle management.
The development of ICH Q2(R1)-compliant UV-Vis methods requires meticulous attention to both scientific principles and regulatory expectations. By integrating robust instrument qualification, systematic method development, comprehensive validation, and complete documentation, pharmaceutical scientists can establish UV-Vis methods that generate reliable, reproducible data acceptable to global regulatory agencies. The structured approach outlined in this guide—from fundamental spectrophotometric principles through advanced validation protocols—provides a framework for developing UV-Vis methods that meet the rigorous standards required for regulatory submissions, ultimately supporting the development of safe, effective, and high-quality pharmaceutical products.
The quantitative analysis of active pharmaceutical ingredients (APIs) and the monitoring of impurities are critical pillars in drug development and quality control (QC). Within this framework, ultraviolet-visible (UV-Vis) spectroscopy and high-performance liquid chromatography (HPLC) emerge as two foundational analytical techniques. This whitepaper provides a comparative analysis of UV-Vis spectroscopy and HPLC, framing their operational principles within the context of a broader thesis on how a UV-Vis spectrophotometer works. The discussion is supported by experimental data, detailed protocols, and a clear delineation of the strengths and limitations of each method to guide researchers and scientists in selecting the appropriate technique for their analytical challenges.
Fundamental Principles and Instrumentation
How UV-Vis Spectroscopy Works
UV-Vis spectroscopy measures the amount of ultraviolet or visible light absorbed by a sample. The fundamental principle is that molecules can absorb light energy, promoting electrons from a ground state to a higher energy excited state. The wavelength at which this absorption occurs and its magnitude provide qualitative and quantitative information about the analyte [10] [4].
A UV-Vis spectrophotometer operates through a sequence of key components, as shown in the workflow below.
Light Source: A stable source emitting light across a broad wavelength range is required. Instruments may use a single xenon lamp or a combination of lamps, such as a tungsten or halogen lamp for the visible region and a deuterium lamp for the UV region [10].
Wavelength Selection: The broad spectrum from the source is passed through a monochromator, which uses a diffraction grating to isolate a specific, narrow band of wavelengths. This allows the instrument to scan through a range of wavelengths or measure at a fixed wavelength [10].
Sample Analysis: The selected wavelength of light passes through a sample contained in a cuvette. It is imperative to use a reference or "blank" sample containing only the solvent to correct for any light absorption by the solvent or cuvette itself. For UV measurements, quartz cuvettes are essential as glass and plastic absorb UV light [10] [120].
Detection: After passing through the sample, the transmitted light strikes a detector, such as a photomultiplier tube (PMT) or a photodiode, which converts the light intensity into an electrical signal. The instrument then calculates the absorbance (A) based on the initial (I₀) and transmitted (I) light intensities [10].
The relationship between absorbance and concentration is governed by the Beer-Lambert Law: A = εbc, where 'ε' is the molar absorptivity, 'b' is the path length, and 'c' is the concentration [120] [4]. This linear relationship is the foundation for quantitative analysis.
How HPLC Works
HPLC is a separation technique used to separate, identify, and quantify components in a mixture. It relies on pumping a pressurized liquid mobile phase containing the sample mixture through a column packed with a solid stationary phase [133] [134].
The following diagram illustrates the fluidic path and core components of a typical HPLC system.
Separation Principle: Separation occurs because different compounds in the sample mixture interact differently with the stationary phase. Those with stronger interactions (e.g., more hydrophobic molecules in reversed-phase chromatography) are retained longer in the column than those with weaker interactions, leading to separation as they elute at different times, known as retention times [133] [134].
Detection: As separated compounds elute from the column, they pass through a detector. The most common detector is a UV-Vis spectrophotometer, which measures the absorbance of each compound at a specific wavelength. Other detectors include photodiode arrays (PDA), which capture full spectra, mass spectrometers (MS), and evaporative light scattering detectors (ELSD) [135] [134]. The detector generates a signal output as a function of time, producing a chromatogram where each peak corresponds to a different compound, and the peak area is proportional to its concentration [133].
Comparative Performance Analysis
Quantitative Comparison of Key Analytical Parameters
The choice between UV-Vis and HPLC is dictated by the specific analytical requirements. The table below summarizes their performance across critical parameters, drawing from direct comparative studies.
Table 1: Direct comparison of UV-Vis spectroscopy and HPLC for pharmaceutical analysis
| Parameter | UV-Vis Spectroscopy | HPLC with UV Detection | Experimental Context & Citations |
|---|---|---|---|
| Analytical Scope | Single analyte in solution (after verification of specificity). | Multiple analytes simultaneously (API, impurities, degradants). | Analysis of repaglinide tablets; UV-Vis cannot separate components [136]. |
| Separation Capability | None. Measures total absorbance of the solution. | Excellent. Physically separates components based on chemical properties. | HPLC chromatograms show baseline separation of API, impurities, and degradants [135]. |
| Linearity | Excellent (R² > 0.999) in studied range. | Excellent (R² > 0.999) over a wider range. | Repaglinide analysis: 5-30 μg/mL for UV-Vis vs. 5-50 μg/mL for HPLC [136]. |
| Precision (Repeatability) | Good (%RSD < 1.5). | Excellent (%RSD < 1.5, often ~0.1%). | Intra-day precision for repaglinide was better for HPLC [136] [135]. |
| Accuracy (% Recovery) | High (99.6 - 100.5%). | High (99.7 - 100.3%). | Standard addition method for repaglinide tablet analysis [136]. |
| Sensitivity (LOQ) | Moderate. Sufficient for API assay in formulations. | High. Can quantify trace impurities down to ~0.01%. | HPLC is required for low-level impurity quantification as per regulatory standards [135]. |
| Analysis Time | Very fast (minutes), including sample preparation. | Longer (10-30 minutes per run). | HPLC includes runtime plus column equilibration [136] [137]. |
| Specificity/Selectivity | Low unless the analyte's spectrum is unique. Susceptible to interference. | Very High. Specificity comes from combination of retention time and spectral data. | In bakuchiol analysis, UV-Vis failed with emulsion samples; HPLC provided clear quantitation [137]. |
Analysis of a Case Study: Repaglinide Tablet Assay
A direct comparison of UV-Vis and HPLC for the analysis of the antidiabetic drug repaglinide in tablets highlights these performance differences in a practical context [136].
Objective: To develop and validate simple, fast, and economical methods for quantifying repaglinide in tablets using HPLC and UV-spectrophotometry [136].
Key Experimental Parameters:
- UV-Vis Method: Absorbance measured at λ_max = 241 nm in methanol. Calibration curve was linear from 5-30 μg/mL [136].
- HPLC Method:
- Column: Agilent TC-C18 (250 mm × 4.6 mm, 5 μm)
- Mobile Phase: Methanol:Water (80:20 v/v, pH adjusted to 3.5 with orthophosphoric acid)
- Flow Rate: 1.0 mL/min
- Detection: UV at 241 nm
- Linearity Range: 5-50 μg/mL [136].
Findings: Both methods were validated and found to be reliable for quality control. The HPLC method demonstrated a wider linear range and better precision. A crucial finding was that the UV method could only be applied if it was first verified that no other absorbing interferents were present in the sample matrix at 241 nm. In contrast, HPLC inherently separates repaglinide from other components, making it more selective and suitable for stability-indicating methods where degradants must be monitored separately from the API [136].
Experimental Protocols for Pharmaceutical Analysis
Detailed Methodology: UV-Vis Spectrophotometric Assay
This protocol outlines the steps for quantifying an API, such as repaglinide, using UV-Vis spectroscopy [136].
Research Reagent Solutions
- Analytical Reference Standard: High-purity API for preparing calibration standards.
- HPLC-grade Solvent (e.g., Methanol): A solvent that dissolves the API and does not absorb significantly at the wavelength of interest.
- Sample Matrix: Placebo formulation or solvent for preparing the blank/reference.
Step-by-Step Procedure:
- Preparation of Standard Stock Solution: Accurately weigh about 100 mg of the reference standard and transfer it to a 100 mL volumetric flask. Dissolve and make up to volume with methanol to obtain a stock solution of 1000 μg/mL.
- Preparation of Calibration Standards: Pipette appropriate aliquots (e.g., 0.5, 1.0, 1.5, 2.0, 2.5, 3.0 mL) of the stock solution into a series of 100 mL volumetric flasks. Dilute to volume with methanol to obtain concentrations spanning 5-30 μg/mL.
- Sample Preparation: Weigh and finely powder not less than 20 tablets. Transfer an accurately weighed portion of the powder equivalent to about 10 mg of the API into a 100 mL volumetric flask. Add about 70 mL of methanol, sonicate for 15-30 minutes to ensure complete dissolution, cool, and dilute to volume with methanol. Filter the solution and then dilute a portion of the filtrate further with methanol to bring it within the calibration range.
- Instrument Measurement:
- Turn on the UV-Vis spectrophotometer and allow the lamp to warm up for the time specified by the manufacturer.
- Fill a quartz cuvette with the pure solvent (methanol) and place it in the sample holder. Use this as the blank to zero the instrument at the analytical wavelength (e.g., 241 nm).
- Rinse the cuvette with a small portion of the first standard solution. Then fill the cuvette with the standard, place it in the spectrophotometer, and record the absorbance.
- Repeat for all calibration standards and the prepared sample solution.
- Data Analysis:
- Plot a graph of absorbance versus concentration for the standard solutions and determine the equation of the line of best fit (calibration curve).
- Use this equation to calculate the concentration of the API in the sample solution and, subsequently, the content per tablet.
Detailed Methodology: HPLC Assay for API and Impurities
This protocol describes an HPLC method for the simultaneous assay of an API and its related impurities, as applied in stability studies [135].
Research Reagent Solutions
- Analytical Reference Standards: API and all known impurities/degradants.
- HPLC-grade Solvents (e.g., Water, Acetonitrile/Methanol): Used to prepare the mobile phase.
- Buffers and Additives (e.g., Ammonium Formate, Formic Acid, Orthophosphoric Acid): Used to adjust pH and ionic strength of the mobile phase to optimize separation and peak shape.
- Internal Standard (if used): A compound with known properties not present in the sample, used to improve quantitative accuracy.
Step-by-Step Procedure:
- Mobile Phase Preparation: Prepare the mobile phase as specified. For example, for a reversed-phase gradient method, prepare mobile phase A (e.g., 20 mM ammonium formate buffer, pH 3.7) and mobile phase B (e.g., acetonitrile). Filter and degas all solvents before use.
- Standard and Sample Preparation:
- System Suitability Solution: Prepare a solution containing the API spiked with key impurities and degradants at appropriate levels.
- Calibration Standards: Prepare a series of standard solutions of the API across the concentration range (e.g., 5-50 μg/mL) using the mobile phase or a compatible solvent.
- Sample Solution: Prepare the sample as described in the UV-Vis protocol (e.g., powdering tablets, dissolution, sonication, dilution, and filtration), ensuring the final diluent is compatible with the mobile phase.
- HPLC System Setup and Equilibration:
- Install the specified column (e.g., a C18 column, 100-250 mm long, particle size 3-5 μm).
- Set the column oven temperature (e.g., 40 °C).
- Set the flow rate (e.g., 0.8-1.0 mL/min) and the detector wavelength.
- Program the gradient elution profile. For example: start at 5% B, ramp to 15% B in 2 min, then to 40% B in 10 min, and finally a wash at 90% B.
- Prime the system and equilibrate the column with the initial mobile phase composition until a stable baseline is achieved.
- Analysis and Data Acquisition:
- Inject the system suitability solution to ensure the resolution, tailing factor, and theoretical plates meet predefined criteria.
- Inject the calibration standards to construct the calibration curve.
- Inject the sample solutions.
- Data Analysis:
- Identify the API and impurity peaks in the sample chromatogram by comparing their retention times with those in the standard solutions.
- Integrate the peak areas.
- Use the calibration curve to calculate the concentration of the API and any impurities in the sample.
The Scientist's Toolkit: Essential Research Reagents and Materials
Table 2: Key reagents, materials, and equipment for UV-Vis and HPLC analysis
| Item | Function/Application | Technical Considerations |
|---|---|---|
| HPLC-grade Solvents (Acetonitrile, Methanol, Water) | Mobile phase preparation and sample dissolution. | High purity is critical to minimize baseline noise and UV absorption background. |
| Buffer Salts & pH Modifiers (Ammonium formate, Potassium phosphate, Formic acid) | Control pH and ionic strength of the mobile phase to optimize separation and peak shape. | Volatile salts (e.g., ammonium formate) are preferred for LC-MS compatibility. |
| Analytical Reference Standards | Qualitative and quantitative calibration. | High-purity characterized material is essential for accurate results. |
| HPLC Column (e.g., C18, C8) | The heart of the separation system. | Selection is based on analyte chemistry (reversed-phase is most common). Particle size and column dimensions affect resolution and pressure. |
| Quartz Cuvettes | Sample holder for UV-Vis spectroscopy. | Quartz is transparent down to ~200 nm; glass and plastic are not suitable for UV. |
| Syringe Filters (Nylon, PVDF, 0.45 μm or 0.22 μm) | Clarification of sample solutions prior to injection in HPLC. | Prevents particulate matter from damaging the HPLC column and system. |
| Volumetric Glassware (Flasks, Pipettes) | Precise preparation and dilution of standard and sample solutions. | Accuracy is fundamental for reliable quantitative results. |
UV-Vis spectroscopy and HPLC are complementary, not competing, techniques in the pharmaceutical analyst's arsenal. UV-Vis spectroscopy offers simplicity, speed, and cost-effectiveness for specific, well-defined applications such as the quantitative assay of a pure API in a formulation where there is no spectral interference. Its operation is fundamentally based on the Beer-Lambert law and the absorption of light by chromophores.
HPLC, however, provides powerful separation capabilities, high specificity, and the ability to conduct simultaneous multi-component analysis. It is indispensable for impurity and degradant profiling, stability-indicating assays, and analyses of complex mixtures.
The choice between them should be guided by the analytical problem's specific requirements regarding specificity, sensitivity, and the need for separation. For a comprehensive quality control strategy, HPLC-UV is often the preferred workhorse due to its robustness and versatility, while UV-Vis remains a valuable tool for rapid, targeted quantitation.
The quantitative analysis of multiple active pharmaceutical ingredients (APIs) in combined dosage forms presents a significant analytical challenge, particularly when these compounds exhibit overlapping spectral profiles. Derivative spectroscopy has emerged as a powerful technique to resolve such challenges, enabling the simultaneous quantification of components without the need for prior separation. This technique is grounded in the fundamental principles of UV-Vis spectroscopy but employs mathematical differentiation to enhance spectral resolution and selectivity.
In the context of a broader thesis on UV-Vis spectrophotometer operation, derivative spectroscopy represents a sophisticated application of this foundational analytical technology. By transforming traditional absorbance spectra through derivative calculations, analysts can effectively "deconvolute" overlapping signals, isolate specific spectral features, and quantify individual components within complex mixtures [138]. This case study explores the practical implementation of derivative spectroscopy for simultaneous API quantification, detailing methodological considerations, experimental protocols, and applications relevant to drug development professionals and researchers.
Theoretical Foundations and Instrumentation
Principles of Derivative Spectroscopy
Derivative spectroscopy operates on the mathematical transformation of zero-order absorbance spectra into their first- or higher-order derivatives. This process fundamentally alters the information presented in spectral data:
First-derivative spectra (dA/dλ) convert absorption peaks into zero-crossing points while transforming the steepest sections of the original spectrum into maxima and minima. This is particularly valuable for identifying precise wavelengths where one component shows zero cross-over while another demonstrates significant amplitude [138] [139].
Second-derivative spectra (d²A/dλ²) further enhance spectral features by converting original absorption bands into negative peaks with narrower bandwidths, effectively improving resolution and enabling better discrimination between overlapping signals [138].
The transformation from a standard absorption spectrum to its derivative form provides two primary advantages: suppression of matrix interferences and resolution of overlapping bands. As noted in research on food colorant analysis, "derivative techniques are playing a very important role in the binary analysis of mixtures by UV-VIS molecular absorption spectrophotometry" by resolving band overlapping in quantitative analysis [140].
UV-Vis Spectrophotometer Fundamentals
Understanding derivative spectroscopy requires familiarity with the core components and operation of UV-Vis spectrophotometers. These instruments measure the attenuation of light passing through a sample to determine analyte concentration based on the Beer-Lambert law [10].
Key instrumental components include:
- Light sources (typically tungsten/halogen lamps for visible light and deuterium lamps for UV regions)
- Wavelength selection systems (monochromators with diffraction gratings being most common)
- Sample compartment with appropriate cuvettes (quartz for UV applications)
- Detection systems (photomultiplier tubes, photodiodes, or CCD arrays) [10]
Modern spectrophotometers interface with computer systems that perform the mathematical derivatization of spectral data digitally, allowing for flexible application of various derivative orders and parameters without re-scanning samples.
Addressing Spectral Overlap Through Mathematical Processing
The core challenge in simultaneous API quantification arises when two or more compounds exhibit significant spectral overlap, making direct absorbance measurement at a single wavelength impossible without interference. Derivative spectroscopy addresses this through several mechanisms:
Zero-crossing technique: Selecting wavelengths where one component's derivative spectrum crosses zero (shows no amplitude) while the other demonstrates significant derivative amplitude enables specific quantification of the second component without interference from the first [141] [139].
Peak-to-trough measurements: The distance between derivative maxima and minima can be correlated with analyte concentration, providing an alternative quantification approach less susceptible to baseline drift or background interference [140].
Signal narrowing: Derivative transformations, particularly second-order derivatives, produce narrower spectral features than the original absorption bands, effectively increasing apparent resolution and enabling better discrimination between closely spaced peaks [138].
These mathematical enhancements to conventional spectroscopy make derivative methods particularly valuable for quality control laboratories where rapid, cost-effective analysis of multi-component formulations is essential.
Experimental Design and Methodologies
Selection of Derivative Order and Parameters
The choice of derivative order represents a critical methodological decision that depends on the specific analytical challenge and spectral characteristics of the target analytes:
First-order derivatives are most commonly employed for binary mixtures with moderate spectral overlap, where a zero-crossing point can be identified for one component while the other shows measurable amplitude [141] [139]. This approach was successfully implemented for simultaneous determination of brinzolamide and timolol maleate, where "the peak amplitude of BRZ was quantified at the zero-crossing point of TML, i.e., 248.80 nm, whereas TML was determined by measuring absorbance at 297.60 nm" [141].
Second-order derivatives provide enhanced resolution for more complex mixtures or cases with extensive spectral overlap. The transformation of "a single-peak spectrum into a three-peak spectrum" in second-derivative mode offers additional feature points for quantification and can enable dual-component analysis even without complete baseline separation [138].
Key parameters requiring optimization include:
- Δλ value (wavelength increment over which derivative is calculated)
- Scaling factors for visual presentation
- Smoothing functions to manage signal-to-noise ratio amplification inherent in derivative processing
Method Development and Optimization
Successful implementation of derivative spectroscopic methods requires systematic optimization of several experimental parameters:
Wavelength selection involves scanning standard solutions of individual components to identify characteristic zero-crossing points and amplitude maxima in derivative spectra. For example, in the analysis of lamivudine and zidovudine, researchers identified that "LAM showed dA/dλ zero at 279 nm in contrast to ZID that has considerable dA/dλ at this wavelength. Further, ZID has zero dA/dλ at 300 nm while at this wavelength LAM has significant dA/dλ" [139].
Selection of appropriate solvent systems must consider UV transparency in the spectral region of interest and analyte solubility. Aqueous buffers are commonly employed for water-soluble pharmaceuticals, though organic modifiers may be necessary for poorly soluble compounds [142] [139].
Validation of analytical performance follows ICH guidelines, establishing linearity ranges, precision, accuracy, and detection limits. For the brinzolamide and timolol maleate method, validation demonstrated "excellent correlation coefficient values (R2 > 0.9998)" with accuracy and precision results within acceptable limits (%Relative standard deviation, RSD <2 %) for both analytes [141].
Table 1: Method Validation Parameters for Selected Derivative Spectroscopy Applications
| Analytical System | Linear Range (μg/mL) | Correlation Coefficient (R²) | LOD (μg/mL) | LOQ (μg/mL) | Reference |
|---|---|---|---|---|---|
| Brinzolamide & Timolol Maleate | BRZ: 4-24, TML: 5-25 | > 0.9998 | BRZ: 0.38, TML: 0.98 | BRZ: 0.91, TML: 2.99 | [141] |
| Lamivudine & Zidovudine | 10-50 (both) | 0.9998-0.9999 | - | - | [139] |
| Ketorolac & Olopatadine | KET: 3-12, OLO: 4-40 | - | - | - | [142] |
| Carmoisine & Ponceau 4R | 2-10 (both) | 0.9994-0.9998 | 0.071-0.091 | 0.236-0.304 | [140] |
Case Studies in Pharmaceutical Applications
Ophthalmic Formulation Analysis
The fixed-dose combination of brinzolamide and timolol maleate in ophthalmic preparations presents a challenging analytical scenario due to spectral overlap. Researchers developed a first-order derivative method that successfully quantified both components simultaneously by identifying two critical wavelengths [141]:
At 248.80 nm, timolol maleate exhibits a zero-crossing point in its first-derivative spectrum, while brinzolamide demonstrates measurable amplitude. Conversely, at 297.60 nm, brinzolamide shows minimal derivative amplitude, allowing specific quantification of timolol maleate. This approach enabled determination of both APIs in marketed ophthalmic preparations with precision (%RSD < 2%) and accuracy meeting regulatory validation criteria [141].
Notably, the method demonstrated excellent green chemistry credentials, with the authors highlighting its "minimal impact on environment" compared to alternative chromatographic methods [141]. This environmental consideration aligns with growing emphasis on sustainable analytical practices in pharmaceutical development [143].
Analysis of Antiretroviral Combinations
The simultaneous determination of lamivudine and zidovudine in combined tablet formulations illustrates the utility of derivative spectroscopy for antiretroviral drug quality control. The method employed 0.1N HCl as a solvent system, offering advantages over previously reported methods that used more expensive and environmentally problematic organic solvents [139].
The first-derivative spectra revealed complementary zero-crossing points that enabled specific quantification: lamivudine at 300 nm (where zidovudine showed zero amplitude) and zidovudine at 279 nm (where lamivudine showed zero amplitude). This approach demonstrated excellent linearity across 10-50 μg/mL for both drugs with correlation coefficients of 0.9998 and 0.9999 for lamivudine and zidovudine, respectively [139].
Recovery studies confirmed method accuracy, with results ranging from 98.65% to 100.43% for both drugs, while precision data showed %RSD values below 2% for both intra-day and inter-day measurements [139]. The successful application to commercial tablet formulations (Combivir) yielded percentage recoveries of 99.98% for lamivudine and 98.56% for zidovudine, validating the method for routine quality control applications [139].
Complex Formulation Challenges
Some pharmaceutical formulations present particularly challenging scenarios due to extreme concentration ratios between components or interference from excipients. The analysis of ketorolac tromethamine and olopatadine hydrochloride in ophthalmic solutions exemplifies such a challenge, with a 4:1 ratio (KET:OLO) where the minor component (OLO) also possesses lower absorptivity [142].
Researchers addressed this challenge by combining derivative spectroscopy with the standard addition method. Ketorolac was determined directly from fundamental UV absorption spectra at 323 nm, while olopatadine required more sophisticated approaches due to its status as "the weakly absorbing species as well as the minor component" [142]. Two derivative methods were employed: dual wavelength measurements (ΔA between 243 and 291 nm) and first derivative ratio spectrometry using ketorolac as a divisor with measurements at 234 nm minima [142].
The multiple standard addition method was critical for accurate olopatadine quantification, overcoming the challenges posed by the unfavorable concentration ratio and differing absorptivities. This approach highlights the potential for combining derivative spectroscopy with additional chemometric techniques to address complex analytical scenarios in pharmaceutical formulations [142].
Table 2: Analytical Performance of Derivative Spectroscopy Methods for API Mixtures
| Drug Combination | Derivative Technique | Wavelengths Used | Accuracy (% Recovery) | Precision (% RSD) | Reference |
|---|---|---|---|---|---|
| Brinzolamide & Timolol Maleate | First-order derivative | 248.80 nm & 297.60 nm | Within acceptance limits | < 2% | [141] |
| Lamivudine & Zidovudine | First-order derivative | 279 nm & 300 nm | 98.65-100.43% | < 2% | [139] |
| Ketorolac & Olopatadine | Dual wavelength & first derivative ratio | 243/291 nm & 234 nm | KET: 99.63%, OLO: 100.31-100.90% | - | [142] |
| Carmoisine & Ponceau 4R | Multiple derivative methods | Various (method-dependent) | Comparable to reference HPLC | - | [140] |
Advanced Derivative Techniques
Ratio Derivative Spectrophotometry
Ratio derivative spectroscopy represents a significant advancement beyond conventional derivative approaches, offering enhanced selectivity for challenging determinations. This technique involves dividing the absorption spectrum of a mixture by a standardized spectrum of one component (the "divisor") before generating derivative spectra [140] [142].
In the analysis of ketorolac and olopatadine, researchers employed first derivative ratio spectra using "3.0 µg/mL KET as a divisor and measuring OLO responses at 234 nm (minima)" [142]. This approach effectively cancelled the contribution of ketorolac to the combined spectrum, enabling specific quantification of olopatadine despite the challenging 4:1 concentration ratio.
The selection of an appropriate divisor concentration represents a critical optimization parameter in ratio derivative methods. Ideally, the divisor spectrum should provide a consistent baseline while maintaining adequate signal intensity for accurate derivative transformations.
Derivative Differential Method
The derivative differential method combines aspects of derivative spectroscopy with differential absorbance measurements across different pH conditions or solvent environments. This approach was successfully applied to the analysis of carmoisine and ponceau 4R food colorants, where measurements were based on "the measurement of difference absorptivities derivatized in first order of solution of drink samples in 0,1 N NaOH relative to that of an equimolar solution in 0,1 N HCl" [140].
By exploiting the differential spectral behavior of analytes under varying chemical conditions, this technique provides an additional dimension of selectivity beyond spectral derivatives alone. The method demonstrated excellent performance for colorant analysis, with correlation coefficients of 0.9996 and 0.9998 for carmoisine and ponceau 4R, respectively [140].
Three-Way Calibration Methods
Emerging approaches combine derivative spectroscopy with multi-way calibration methods to address increasingly complex analytical challenges. These techniques incorporate additional data dimensions, such as pH variation or temporal changes, to build more comprehensive analyte models [144].
In one application for allura red determination in energy drinks, researchers implemented "three-way analysis-based pH-UV-Vis spectroscopy" which enabled quantification without chromatographic separation while simultaneously determining the colorant's pKa value [144]. This approach involved arranging absorbance measurements at different pH levels as a three-way array (wavelength × sample × pH) and applying parallel factor analysis (PARAFAC) to decompose the data into spectral, pH, and concentration profiles [144].
Such advanced methodologies demonstrate the continuing evolution of derivative spectroscopy toward increasingly sophisticated chemometric frameworks capable of addressing complex real-world samples with minimal sample preparation.
Practical Implementation and Workflow
Experimental Protocols
A generalized protocol for implementing derivative spectroscopy in simultaneous API quantification includes the following critical steps:
Instrument Calibration and Qualification
- Verify spectrophotometer performance using holmium oxide or other wavelength standards
- Confirm absorbance accuracy using certified reference materials
- Ensure proper baseline stability and noise characteristics across the spectral range of interest
Standard Solution Preparation
- Prepare individual stock solutions of reference standards for each API
- Dilute to appropriate working concentrations using a suitable solvent
- For ratio derivative methods, identify optimal divisor concentrations through preliminary experiments
Spectral Acquisition and Processing
- Scan standard solutions across relevant wavelength range (typically 200-400 nm for UV-active pharmaceuticals)
- Apply derivative transformations using instrument software or external computational tools
- Optimize derivative parameters (Δλ, smoothing factor) to balance resolution and signal-to-noise ratio
Method Validation
- Establish linearity across expected concentration ranges for each analyte
- Determine precision through replicate measurements
- Evaluate accuracy using standard addition or comparison with validated reference methods
- Assess specificity in the presence of expected excipients and potential degradation products
Diagram 1: Derivative Method Development Workflow
The Scientist's Toolkit: Essential Research Reagents and Materials
Successful implementation of derivative spectroscopic methods requires appropriate selection of reagents, standards, and instrumentation. The following table details essential components of the analytical toolkit for derivative spectroscopy applications:
Table 3: Essential Research Reagents and Materials for Derivative Spectroscopy
| Item | Specification | Function | Example Application |
|---|---|---|---|
| API Reference Standards | High purity (>98%), pharmacopeial grade when available | Quantitative calibration and method development | All quantitative applications [141] [139] |
| Spectrophotometric Solvent | UV-transparent in region of interest (e.g., water, methanol, 0.1N HCl) | Sample dissolution and spectral measurement | 0.1N HCl for lamivudine/zidovudine [139] |
| Quartz Cuvettes | 1 cm pathlength, matched pairs | Sample containment with minimal UV attenuation | All UV region measurements [10] |
| pH Adjustment Reagents | Buffer components (e.g., BR buffer, phosphate buffers) | Modify spectral properties for differential methods | pH-dependent analyses [144] |
| Filtration Apparatus | 0.45 μm membrane filters | Sample clarification for turbid solutions | Beverage and formulation analysis [140] |
Comparison with Alternative Methodologies
Advantages Over Conventional UV Spectroscopy
Derivative spectroscopy offers several distinct advantages compared to conventional zero-order UV spectrophotometry for simultaneous API quantification:
Enhanced Selectivity: The transformation of overlapping absorption bands into distinct derivative features enables resolution of mixtures that would be inseparable using zero-order spectroscopy. Research on food colorants noted that "serious analytical problems can be resolved by this common technique" when enhanced with derivative processing [140].
Background Suppression: Broadband background absorption from excipients or sample matrix is effectively minimized in derivative spectra, as slowly varying baseline effects are mathematically eliminated through differentiation [138].
Noise Management: While derivative processing inherently amplifies high-frequency noise, modern spectrophotometers incorporate digital smoothing algorithms that maintain favorable signal-to-noise characteristics while preserving spectral resolution [138] [10].
Position Relative to Chromatographic Methods
Chromatographic techniques, particularly HPLC and UPLC, represent the gold standard for pharmaceutical analysis but impose significant resource requirements in terms of equipment cost, solvent consumption, and operational complexity [143] [145].
Derivative spectroscopy occupies a valuable niche between conventional UV spectroscopy and chromatographic methods:
Resource Efficiency: Derivative methods offer "resource savings (cost, time, and solvents) and reduce generated waste" compared to chromatographic approaches, aligning with green analytical chemistry principles [141].
Throughput Advantage: The ability to quantify multiple components without physical separation significantly reduces analysis time, making derivative spectroscopy particularly valuable for high-throughput quality control environments [141] [139].
Complementary Role: For complex formulations or stability-indicating methods, derivative spectroscopy may serve as a rapid screening tool while reserving chromatographic methods for definitive quantification or impurity profiling [142].
The environmental advantages of derivative methods have been quantitatively assessed using green metrics tools. In one study, "the novel Analytical GREEnness (AGREE) metrics, the analytical eco-scale, and the green analytical procedure index (GAPI) were utilized to evaluate the developed technique's environmental sustainability and compare it to the HPLC method" [141].
Diagram 2: Analytical Decision Pathway for Mixture Analysis
Emerging Trends and Innovations
The continued evolution of derivative spectroscopy is closely linked to advancements in several complementary fields:
Integration with Multi-Way Calibration: The combination of derivative processing with multi-way calibration methods, such as parallel factor analysis (PARAFAC), represents a powerful approach for addressing increasingly complex analytical challenges. These methods enable "mathematical extraction of individual spectral bands" from complex matrices without physical separation [144].
Automation and Digital Transformation: Automated sample preparation systems that perform "dilution, filtration, solid-phase extraction (SPE), liquid-liquid extraction (LLE), and derivatization" are increasingly integrated with spectroscopic analysis, reducing manual intervention and improving reproducibility [146]. Such automation aligns with the principles of green analytical chemistry by minimizing solvent consumption and waste generation [143].
Advanced Chemometric Integration: Future developments will likely incorporate machine learning algorithms for optimal wavelength selection and derivative parameter optimization, further enhancing method robustness and expanding the application scope of derivative spectroscopy.
Derivative spectroscopy represents a sophisticated application of UV-Vis spectrophotometry that effectively addresses the challenge of simultaneous API quantification in complex mixtures. Through mathematical transformation of spectral data, this technique enhances resolution, suppresses matrix interference, and enables specific quantification of individual components without physical separation.
The case studies presented demonstrate the practical utility of derivative methods across diverse pharmaceutical applications, from ophthalmic preparations to antiretroviral combinations. When properly validated, these methods provide accuracy and precision comparable to chromatographic techniques while offering significant advantages in terms of analysis speed, cost efficiency, and environmental impact.
As pharmaceutical formulations grow increasingly complex and sustainability considerations become more prominent, derivative spectroscopy is positioned to play an expanding role in quality control and drug development workflows. Future innovations incorporating advanced chemometrics, automation, and multi-way calibration will further enhance the capabilities of this versatile analytical approach, ensuring its continued relevance for pharmaceutical analysis.
Limit of Detection (LOD) and Limit of Quantification (LOQ) Determination Methods
In analytical chemistry, particularly in the context of UV-Vis spectrophotometry and other instrumental techniques, the Limit of Detection (LOD) and Limit of Quantification (LOQ) are fundamental performance characteristics that define the capabilities of an analytical procedure. The LOD represents the lowest concentration of an analyte that can be reliably detected by the method, though not necessarily quantified with precision. In contrast, the LOQ is the lowest concentration that can be quantitatively determined with acceptable accuracy and precision [147] [148]. These parameters are essential for validating analytical methods, especially in pharmaceutical development, environmental monitoring, and clinical diagnostics, where measuring trace concentrations is often critical. Proper determination of LOD and LOQ ensures that an analytical method is "fit for purpose" and provides reliable data at the lower end of the measurement range [147].
Within the framework of research on how a UV-Vis spectrophotometer works, understanding these limits is crucial for method development and instrument validation. The fundamental principles governing LOD and LOQ apply across various analytical techniques, from simple UV spectrophotometry to more complex chromatographic systems, though the specific determination methods may vary based on the technique and regulatory requirements [149] [148].
Fundamental Concepts and Definitions
Limit of Blank (LoB)
The Limit of Blank (LoB) is a foundational concept for understanding detection limits. It is defined as the highest apparent analyte concentration expected to be found when replicates of a blank sample containing no analyte are tested. Statistically, the LoB represents the 95th percentile of blank measurements, meaning that only 5% of blank measurements would exceed this value due to random variation [147]. The formula for calculating LoB is:
LoB = mean~blank~ + 1.645(SD~blank~)
This calculation assumes a Gaussian distribution of the raw analytical signals from blank samples. In practical terms for UV-Vis spectrophotometry, the "blank" would typically be the solvent or matrix without the analyte, and the "signal" would be the absorbance reading [147].
Limit of Detection (LOD)
The Limit of Detection (LOD) is the lowest analyte concentration that can be reliably distinguished from the LoB. While a sample containing analyte at the LOD concentration should produce a signal greater than the analytical noise, there is no guarantee of precise quantification at this level. The LOD is calculated using both the LoB and data from samples with low analyte concentrations [147]:
LOD = LoB + 1.645(SD~low concentration sample~)
This statistical approach acknowledges that there is an overlap between the analytical responses of blank and low-concentration samples. At the LOD concentration, approximately 95% of measurements will correctly exceed the LoB, while 5% may fall below it and be erroneously classified as blank (a Type II error) [147].
Limit of Quantitation (LOQ)
The Limit of Quantitation (LOQ), also referred to as the Limit of Quantification, is the lowest concentration at which the analyte can not only be detected but also measured with specified accuracy and precision. The LOQ meets predefined goals for bias and imprecision and may be equivalent to or much higher than the LOD, depending on the analytical requirements [147]. A related concept is "functional sensitivity," which is often defined as the concentration that results in a specific coefficient of variation (e.g., 20%) [147]. The relationship between these parameters is consistent across analytical techniques, including UV-Vis spectrophotometry, where the LOQ represents the lowest concentration that can be quantified while maintaining acceptable performance specifications for the intended application.
Table 1: Summary of Key Parameters for Low-Level Concentration Measurements
| Parameter | Definition | Sample Type | Key Formula |
|---|---|---|---|
| Limit of Blank (LoB) | Highest apparent analyte concentration expected when testing blank samples | Sample containing no analyte | LoB = mean~blank~ + 1.645(SD~blank~) |
| Limit of Detection (LOD) | Lowest analyte concentration reliably distinguished from LoB | Low concentration analyte samples | LOD = LoB + 1.645(SD~low concentration sample~) |
| Limit of Quantitation (LOQ) | Lowest concentration measurable with specified accuracy and precision | Low concentration samples at or above LOD | LOQ ≥ LOD |
Methodologies for Determining LOD and LOQ
Several standardized approaches exist for determining LOD and LOQ values, each with specific applications, advantages, and limitations. The choice of method depends on the analytical technique, regulatory requirements, and the specific characteristics of the method being validated.
Signal-to-Noise Ratio Method
The signal-to-noise (S/N) ratio method is commonly used, particularly in chromatographic and spectroscopic techniques. This approach compares the magnitude of the analyte signal to the background noise level. For LOD, a S/N ratio of 3:1 is typically required, while for LOQ, a ratio of 10:1 is generally expected [148]. In UV-Vis spectrophotometry, this would involve comparing the absorbance signal of the analyte to the baseline noise of the instrument. Although straightforward, this method can be somewhat subjective, as the results may vary depending on how noise is measured and defined [148].
Standard Deviation of Blank and Calibration Curve Method
The International Council for Harmonisation (ICH) guideline Q2(R1) describes approaches based on the standard deviation of the blank response and the slope of the calibration curve [148]. This method provides a more statistical basis for determining detection and quantification limits:
LOD = 3.3σ / S
LOQ = 10σ / S
Where σ represents the standard deviation of the response and S is the slope of the calibration curve. The standard deviation (σ) can be determined in several ways: (1) based on the standard deviation of blank measurements, (2) from the residual standard deviation of the regression line, or (3) from the standard deviation of the y-intercepts of regression lines [148]. For UV-Vis spectrophotometry, the calibration curve would typically be generated using absorbance measurements at various known concentrations of the analyte.
Alternative Statistical Approaches
Several other statistical approaches exist for determining LOD and LOQ values, each with specific applications:
- 3σ and 10σ Approaches: These normative approaches use the mean blank signal value as a reference point, with LOD calculated as 3 times the standard deviation and LOQ as 10 times the standard deviation of the blank [150].
- ULA2 Approach: The Upper Limit Approach utilizes the upper bound of the signal versus concentration confidence band for obtaining concentration counterparts of the signal LOD and LOQ values [150].
- MDL Approach: The Method Detection Limit approach, recommended by the Environmental Protection Agency (EPA), uses appropriate critical values from Student's t-distribution that reflect the limited number of observations for the relevant concentration level [150].
- PBA Approach: The Precision-Based Approach employs the dependence of relative standard deviation as a function of analyte concentration, with inverse transformation from RSD domain (±33%) to concentration domain representing LOD value and (±10%) representing LOQ value [150].
Table 2: Comparison of LOD and LOQ Determination Methods
| Method | Basis | LOD Calculation | LOQ Calculation | Applications |
|---|---|---|---|---|
| Signal-to-Noise | Ratio of analyte signal to background noise | S/N ≥ 3:1 | S/N ≥ 10:1 | Chromatography, spectroscopy |
| ICH Q2(R1) | Standard deviation of response and calibration slope | 3.3σ / S | 10σ / S | Pharmaceutical analysis, regulated methods |
| 3σ / 10σ | Standard deviation of blank measurements | 3 × SD~blank~ | 10 × SD~blank~ | General analytical chemistry |
| MDL Approach | Student's t-distribution with limited observations | Variable based on degrees of freedom | Variable based on degrees of freedom | Environmental monitoring (EPA) |
Experimental Protocols and Procedures
Sample Preparation and Analysis
Proper experimental design is crucial for accurate determination of LOD and LOQ values. For UV-Vis spectrophotometric methods, such as the determination of levofloxacin in pharmaceutical formulations, careful sample preparation is essential [149]. The experimental workflow typically involves:
Preparation of Blank Samples: Multiple blank samples (typically n=20 for verification, n=60 for establishment) containing the matrix without the analyte are prepared and analyzed to determine the baseline response and standard deviation [147].
Preparation of Low-Concentration Samples: Samples with known low concentrations of the analyte are prepared, often through serial dilution of a stock solution. For the levofloxacin method, the linear range was established as 1.0-12.0 μg/mL, with λ~max~ at 292 nm [149].
Instrumental Analysis: All samples are analyzed using the validated instrumental conditions. For UV-Vis spectrophotometry, this includes appropriate wavelength selection, solvent system optimization (e.g., water:methanol:acetonitrile in 9:0.5:0.5 ratio for levofloxacin), and validation of method specificity [149].
Data Collection: Absorbance readings for blanks and low-concentration samples are recorded, with sufficient replication to ensure statistical reliability [147].
The following diagram illustrates the experimental workflow for determining LOD and LOQ values:
Data Analysis and Calculations
For the calibration curve method, data analysis typically involves linear regression of the calibration data. As demonstrated in an HPLC example, the standard error from the regression analysis can be used as σ in the ICH equations [148]:
Generate Calibration Curve: Analyze standards of known concentration across the expected range, including low concentrations near the expected limits.
Perform Linear Regression: Use statistical software to perform linear regression analysis, obtaining the slope (S) and standard error (σ) of the calibration curve.
Calculate LOD and LOQ: Apply the ICH formulas: LOD = 3.3σ / S and LOQ = 10σ / S.
Validation: Experimentally verify the calculated values by analyzing multiple samples (e.g., n=6) at the proposed LOD and LOQ concentrations to confirm they meet the required performance characteristics [148].
In a practical example for lead determination in drinking water using electrothermal atomic absorption spectrometry, the calibration curve showed the equation A = 0.0061 ± 0.0002·c + 0.003 ± 0.003 with R² = 0.9982. Using the 3σ and 10σ approaches, LOD and LOQ values of 1.6 μg L⁻¹ and 5.4 μg L⁻¹, respectively, were obtained [150].
The Scientist's Toolkit: Essential Research Reagents and Materials
The accurate determination of LOD and LOQ values requires specific reagents, materials, and instrumentation. The following table outlines key components essential for these analyses in the context of UV-Vis spectrophotometry and related techniques.
Table 3: Essential Research Reagents and Materials for LOD/LOQ Studies
| Item | Function | Application Example |
|---|---|---|
| High-Purity Solvents | Sample dissolution and dilution; blank matrix | Water:methanol:acetonitrile mixture for levofloxacin analysis [149] |
| Analytical Reference Standards | Preparation of calibration standards and spiked samples | Certified reference materials for accurate concentration assignment |
| Blank Matrix | Establishing baseline signal and LoB | Analyte-free solvent or sample matrix matching test samples [147] |
| UV-Vis Spectrophotometer | Absorbance measurement at specific wavelengths | Instrument with appropriate wavelength accuracy and low stray light |
| Matched Cuvettes | Holding samples for absorbance measurement | Pair of cuvettes with identical pathlength for sample and reference |
| Precision Volumetric Glassware | Accurate preparation of standards and dilutions | Class A volumetric flasks and pipettes for concentration accuracy |
| Data Analysis Software | Statistical calculation of LOD, LOQ, and regression parameters | Software capable of linear regression and standard error calculation [148] |
Critical Considerations and Best Practices
Method Validation and Verification
Regardless of the calculation method used, experimental validation of LOD and LOQ values is essential. The ICH requires that analysts perform a suitable number of sample preparations at or near the proposed LOD and LOQ concentrations to demonstrate that the method performs as expected at these levels [148]. This validation should include assessment of precision, accuracy, and specificity at the limit concentrations. Additionally, as LOD and LOQ are considered "non-rugged validation parameters," their values should be verified whenever major changes are made to the analytical method or instrumentation [150].
Practical Implementation in UV-Vis Spectrophotometry
When implementing LOD and LOQ determinations in UV-Vis spectrophotometry, several factors require special attention:
Wavelength Selection: Proper identification of λ~max~ is crucial for maximum sensitivity, as demonstrated in the levofloxacin method where 292 nm was used [149].
Solvent System: The choice of solvent can significantly affect baseline noise and analyte absorbance. Optimized solvent systems, such as the water:methanol:acetonitrile mixture used for levofloxacin, help minimize background interference [149].
Instrument Performance: Regular calibration and maintenance of the spectrophotometer are essential, as instrumental drift or increased noise can adversely affect detection and quantification limits.
Matrix Effects: For real-world samples, the matrix composition can influence analytical signals, particularly at low concentrations. Using matrix-matched standards or accounting for matrix effects in calculations is often necessary.
The relationship between blank samples, low-concentration samples, and the statistical definitions of LoB, LOD, and LOQ can be visualized as follows:
Regulatory and Harmonization Aspects
Different regulatory bodies may recommend slightly different approaches for determining LOD and LOQ. The Clinical and Laboratory Standards Institute (CLSI) EP17 guideline provides protocols specifically for clinical laboratory methods [147], while the ICH Q2(R1) guideline is widely used for pharmaceutical analysis [148]. Environmental methods often follow EPA guidelines, which may use the MDL approach [150]. When developing analytical methods, it is important to consult the relevant guidelines for the specific application and regulatory jurisdiction. Harmonization between different approaches remains a challenge, and analysts should clearly document which methodology was used to establish detection and quantification limits.
Robustness testing is a critical component of analytical method validation, defined as the measure of a method's capacity to remain unaffected by small, deliberate variations in method parameters, providing an indication of its reliability during normal usage [151] [152]. This systematic evaluation serves as a predictive tool for identifying potential sources of variability before a method is transferred between laboratories or implemented for routine analysis. Within the context of UV-Vis spectrophotometry research and pharmaceutical development, robustness testing ensures that analytical methods consistently produce reliable results despite inevitable minor fluctuations in experimental conditions that occur in different laboratory environments [151] [153].
The concept of robustness/ruggedness testing emerged from observed transfer problems during inter-laboratory studies designed to assess method reproducibility [152]. Initially performed at the end of the validation process, robustness testing is now recommended during method development or optimization phases, allowing for early identification and rectification of potential issues before significant resources are invested [151] [152]. For UV-Vis spectrophotometric methods used in drug development, robustness testing provides essential data for establishing system suitability test (SST) limits based on experimental evidence rather than arbitrary decisions [151] [152]. The International Conference on Harmonisation (ICH) recommends that "one consequence of the evaluation of robustness should be that a series of system suitability parameters is established to ensure that the validity of the analytical procedure is maintained whenever used" [152].
Fundamental Principles of UV-Vis Spectrophotometry
Ultraviolet-visible (UV-Vis) spectrophotometry is an analytical technique that measures the amount of discrete wavelengths of UV or visible light absorbed by or transmitted through a sample in comparison to a reference or blank sample [10]. This measurement provides information about sample composition and concentration, making it invaluable across numerous scientific domains from pharmaceutical research to quality control in various industries [10] [88].
Instrumentation and Working Principles
A UV-Vis spectrophotometer operates on the fundamental principle that molecules absorb specific wavelengths of light corresponding to energy transitions. When incident light hits a sample, it can be absorbed, reflected, or transmitted, with the spectrophotometer measuring the intensity of light absorbed across UV and visible ranges [8]. The basic components of a conventional UV-Vis spectrophotometer include:
- Light source: Typically a xenon lamp for both UV and visible ranges, or separate deuterium (UV) and tungsten/halogen (visible) lamps [10].
- Wavelength selector: Monochromators containing diffraction gratings are most common, separating light into narrow wavelength bands [10].
- Sample holder: Cuvettes made of quartz (for UV), glass, or plastic, with newer instruments offering cuvette-free microvolume analysis [10] [19].
- Detector: Photomultiplier tubes (PMT), photodiodes, or charge-coupled devices (CCD) that convert light intensity into electrical signals [10].
The fundamental relationship governing UV-Vis spectrophotometry is the Beer-Lambert Law, which states that the absorbance (A) of light by a sample is directly proportional to the concentration (c) of the absorbing species, the path length (L) of the sample holder, and the molar absorptivity (ε) of the species [10] [19]. This relationship is expressed mathematically as:
A = ε × c × L
Where A is dimensionless absorbance, ε has units of L·mol⁻¹·cm⁻¹, c is in mol·L⁻¹, and L is in cm [10]. The absorbance is calculated as A = log₁₀(I₀/I), where I₀ is the intensity of incident light and I is the intensity of transmitted light [10]. This foundational principle enables the quantitative application of UV-Vis spectrophotometry across various research and quality control scenarios.
Critical Parameters in UV-Vis Spectrophotometry
Understanding the key parameters in UV-Vis spectrophotometry is essential for designing appropriate robustness tests. These parameters can be categorized into operational factors directly specified in the method and environmental factors that may influence results despite not being explicitly defined in the procedure [152].
Table 1: Key Parameters in UV-Vis Spectrophotometry for Robustness Testing
| Parameter Category | Specific Factors | Typical Variations in Robustness Testing | Potential Impact on Results |
|---|---|---|---|
| Instrumental Parameters | Wavelength accuracy [151] | ±1-2 nm | Shift in absorbance maxima, affecting quantification |
| Stray light [8] | Not deliberately varied but monitored | Non-linearity at high absorbance | |
| Spectral bandwidth [10] | Variation in slit width | Reduced resolution for multi-component analysis | |
| Path length [10] [19] | Different cuvette sizes or microvolume pedestals | Direct impact on absorbance values via Beer-Lambert Law | |
| Sample Parameters | Solvent composition [152] | Variation in buffer pH (±0.2 units) or organic modifier percentage | Shift in absorption spectrum |
| Sample concentration [10] | Different dilution factors | Deviation from Beer-Lambert Law at high concentrations | |
| Temperature [151] [152] | ±2-5°C | Changes in absorption coefficients and equilibrium | |
| Environmental Factors | Analysis time [151] | Different elapsed times after sample preparation | Sample degradation or evaporation effects |
| Reagent batches [151] [152] | Different lots from same or different manufacturers | Variation in impurity profiles affecting background |
For UV-Vis spectrophotometry specifically, wavelength accuracy is particularly critical as it directly affects the accuracy of absorbance measurements, especially when measuring at absorption maxima [151]. Similarly, path length variations significantly impact results according to the Beer-Lambert Law, making this parameter essential for robustness evaluation [10] [19]. pH variations in solvent systems can cause spectral shifts for ionizable compounds, while temperature fluctuations may affect both chemical equilibria and instrumental performance [151] [152].
Methodological Approaches to Robustness Testing
Experimental Design Strategies
Two primary methodological approaches exist for conducting robustness tests: the One Factor At a Time (OFAT) approach and structured Design of Experiments (DoE) [154].
One Factor At a Time (OFAT) Approach The OFAT method involves varying a single parameter while keeping all others constant, allowing direct observation of that parameter's effect on method responses [154]. This straightforward approach is accessible to analysts without specialized statistical training and is easily interpretable. An example OFAT experimental setup for a UV-Vis method is shown in Table 2.
Table 2: Example OFAT Experimental Design for UV-Vis Spectrophotometry Method
| Experiment Number | Actual Execution Order | pH Variation | Wavelength (nm) | Path Length (cm) | Response (Absorbance) |
|---|---|---|---|---|---|
| 1 | 3 | Nominal | Nominal | +0.01 | 0.451 |
| 2 | 6 | Nominal | Nominal | -0.01 | 0.443 |
| 3 | 5 | Nominal | +2 | Nominal | 0.427 |
| 4 | 1 | Nominal | -2 | Nominal | 0.449 |
| 5 | 4 | +0.2 | Nominal | Nominal | 0.468 |
| 6 | 2 | -0.2 | Nominal | Nominal | 0.432 |
| 7 | 7 | Nominal | Nominal | Nominal | 0.447 |
While OFAT provides simplicity, it has significant limitations: it cannot detect interactions between parameters, may require more experimental runs to study multiple factors, and could identify false optimal conditions when factors are correlated [154] [153].
Design of Experiments (DoE) Approach DoE methodologies, such as fractional factorial or Plackett-Burman designs, allow simultaneous variation of multiple parameters in a structured matrix [151] [152]. These designs efficiently screen a large number of factors with minimal experimental runs while enabling detection of interaction effects between parameters [152]. For example, a robustness test with eight factors can be examined in a 12-experiment Plackett-Burman design rather than the 256 experiments required for a full factorial approach [151]. The selection of factor levels is critical in DoE, with extremes chosen symmetrically around the nominal value (e.g., nominal level ± uncertainty) to represent variations expected during method transfer [151].
Experimental Workflow for Robustness Testing
The robustness testing process follows a systematic workflow from planning through execution to data analysis and decision-making. The diagram below illustrates this comprehensive process:
Robustness Testing Workflow Diagram
This workflow begins with careful planning, including factor selection and experimental design, proceeds through systematic execution, and concludes with data-driven decisions about method suitability [151] [152]. The cyclic nature of the process between P8 and P2 highlights that methods may require multiple optimization iterations before achieving sufficient robustness.
Implementation in Pharmaceutical and UV-Vis Applications
UV-Vis Spectrophotometry in Pharmaceutical Analysis
UV-Vis spectrophotometry serves critical functions in pharmaceutical analysis, including drug discovery, quality control, and stability testing [88] [20]. In pharmaceutical settings, robustness testing of UV-Vis methods ensures reliability in various applications:
- Drug stability testing: UV-Vis spectrophotometry quantifies active pharmaceutical ingredient (API) levels and identifies degradation products in stability studies, with robustness ensuring consistent results under varying laboratory conditions [20].
- Dissolution testing: UV-Vis analysis of dissolution samples requires robust methods to accurately monitor drug release profiles, with parameters like wavelength accuracy being particularly critical [88] [155].
- Content uniformity and assay: Quantification of API in final dosage forms demands robust methods that account for potential excipient interference and sample preparation variability [88].
- Purity assessment: Spectral purity scans and ratio comparisons at multiple wavelengths require robust wavelength accuracy across the spectral range [88] [8].
The emerging technique of UV dissolution imaging exemplifies advanced applications where robustness is essential. This technology generates spatially and temporally resolved absorbance maps, exploiting the UV absorbance of drug compounds to visualize dissolution processes in real-time [155]. Such sophisticated applications increase the importance of method robustness, as multiple parameters can influence the quantitative imaging results.
Essential Research Reagents and Materials
Robustness testing in UV-Vis spectrophotometry requires specific reagents and materials that represent normal method operation. The selection of appropriate materials is crucial for meaningful robustness evaluation.
Table 3: Essential Research Reagents and Materials for UV-Vis Robustness Testing
| Material/Reagent | Specification | Function in Robustness Testing | Considerations for Variation |
|---|---|---|---|
| Reference Standards | Certified purity (>99.5%) | Quantification and method calibration | Different lots or suppliers to test method sensitivity |
| Solvents/Buffers | HPLC or spectroscopic grade | Sample dissolution and medium | Variation in pH (±0.2 units), ionic strength, or supplier |
| Cuvettes | Quartz (UV), glass/plastic (Vis) | Sample containment with defined path length | Different manufacturers, path lengths (0.01-10 cm), or material types |
| Filter Membranes | 0.45 μm or 0.22 μm pore size | Sample clarification | Different materials (nylon, PVDF, PTFE) or pore sizes |
| Neutral Density Filters | Certified absorbance values | Instrument performance verification | Different absorbance values to test linearity and accuracy |
When conducting robustness tests, using representative samples that cover the expected concentration range and matrix complexity is essential [152]. For pharmaceutical applications, this includes testing with placebo formulations (containing all components except API), synthetic mixtures, and actual product samples to evaluate matrix effects [152].
Data Analysis and Interpretation
Calculation of Factor Effects
The statistical analysis of robustness test data begins with calculating the effect of each factor on the measured responses. For both OFAT and DoE approaches, the effect of a factor (Eₓ) is calculated as the difference between the average response when the factor is at its high level and the average response when the factor is at its low level [151] [152]. The mathematical representation is:
Eₓ = (ΣY₊ ÷ N₊) - (ΣY₋ ÷ N₋)
Where Eₓ is the effect of factor X on response Y, ΣY₊ is the sum of responses when factor X is at its high level, N₊ is the number of experiments at high level, ΣY₋ is the sum of responses when factor X is at its low level, and N₋ is the number of experiments at low level [152].
In DoE approaches, this calculation is performed for all factors simultaneously using the structured experimental matrix. For Plackett-Burman designs, dummy factors (imaginary factors without real variation) are included, and their effects estimate the experimental error, providing a reference for evaluating the significance of real factor effects [151] [152].
Statistical and Graphical Analysis
After calculating factor effects, both graphical and statistical methods determine the significance of these effects. Normal probability plots or half-normal probability plots visually display effects, with insignificant effects falling along a straight line through the origin while significant effects deviate from this line [151].
Statistical significance testing compares calculated effects to critical values derived from dummy factors or using algorithms like Dong's method [151]. For a factor effect to be considered statistically significant, it should exceed the critical effect value at a chosen significance level (typically α = 0.05).
The relationship between experimental design, data analysis, and conclusions in robustness testing follows a logical progression as shown in the diagram below:
Robustness Data Analysis Logic Flow
This logical framework ensures systematic interpretation of robustness test data, leading to scientifically sound conclusions about method suitability [151] [152]. When significant effects are identified, they inform decisions about which parameters require tighter control in the method procedure or which aspects of the method need optimization before implementation [152].
Case Study: Robustness Testing of a UV-Vis Assay Method
To illustrate practical implementation, consider a case study involving the robustness testing of a UV-Vis spectrophotometric method for ibuprofen quantification according to USP and EP monographs [88]. The method employs detection at 220 nm using a phosphate buffer system (pH 7.2) with a 1 cm path length quartz cuvette.
Experimental Design and Parameters
A robustness test was conducted using a Plackett-Burman design with 12 experiments examining eight factors, including three dummy factors to estimate experimental error. The tested factors and their levels were:
- Wavelength accuracy: 218 nm (-), 220 nm (nominal), 222 nm (+)
- pH of buffer: 7.0 (-), 7.2 (nominal), 7.4 (+)
- Buffer concentration: 45 mM (-), 50 mM (nominal), 55 mM (+)
- Analyst variation: Two different analysts
- Instrument variation: Two different spectrophotometers
- Cuvette type: Two different quartz cuvettes from separate manufacturers
- Dummy 1 and Dummy 2: Imaginary factors for error estimation
The response measured was percent recovery of ibuprofen from a synthetic mixture mimicking tablet formulation, with acceptance criteria of 98.0-102.0% recovery.
Results and Interpretation
Statistical analysis of the results revealed that wavelength variation and pH changes produced significant effects on ibuprofen recovery, exceeding the critical effect value derived from dummy factors. The buffer concentration and analyst variation showed negligible effects within the tested ranges. Based on these findings, the method procedure was modified to include stricter wavelength verification checks and tighter pH control specifications (±0.05 units rather than ±0.1). System suitability test limits were established requiring absorbance values for standard solutions to fall within 5% of the historical mean when performed under the revised controlled conditions.
This case demonstrates how robustness testing provides experimental evidence for setting meaningful method controls, ultimately enhancing method reliability during technology transfer and routine use in pharmaceutical quality control [88].
Robustness testing represents a critical evaluation in the validation of UV-Vis spectrophotometric methods, particularly in regulated pharmaceutical environments. By systematically challenging method parameters through structured experimental designs, analysts can identify potential sources of variability before they impact method performance during transfer or routine use. The combination of appropriate experimental designs—whether OFAT for simple assessments or DoE for comprehensive evaluation—with statistical analysis of effects provides a scientific foundation for establishing method controls and system suitability criteria.
For UV-Vis spectrophotometry in drug development contexts, robustness testing ensures methods remain reliable despite minor variations in wavelength accuracy, sample preparation, environmental conditions, and instrumental performance. As analytical technologies advance, with techniques like UV dissolution imaging emerging [155], the principles of robustness testing remain essential for demonstrating method reliability. Ultimately, incorporating robustness testing during method development rather than after full validation represents a proactive approach to quality by design, potentially reducing costly method failures and investigations during the product lifecycle.
In the realm of analytical chemistry, particularly within pharmaceutical development and research, specificity is a fundamental parameter of method validation. It is defined as the ability to assess unequivocally the analyte in the presence of components that may be expected to be present, such as impurities, degradants, or matrix components [156]. Within the context of UV-Vis spectrophotometry, specificity refers to the method's capacity to accurately measure the target analyte's absorption without interference from other substances in the sample that may also absorb light in similar spectral regions. This characteristic is paramount for ensuring the identity, purity, strength, and quality of pharmaceutical compounds, as lack of specificity can lead to inaccurate quantitation and potentially compromise drug safety and efficacy.
The related concept of selectivity is often used interchangeably with specificity, but carries a distinct meaning. While specificity refers to the ability to discern one single analyte, selectivity describes the method's ability to respond to several different analytes of interest within a sample, identifying and quantifying each one distinctly [156]. For techniques like UV-Vis spectrophotometry that often measure combined absorption signals without physical separation, demonstrating specificity can be particularly challenging when analyzing complex matrices where multiple components may have overlapping absorption spectra. This technical guide explores the systematic assessment of specificity when employing UV-Vis spectrophotometry within pharmaceutical research and development frameworks.
Fundamentals of UV-Vis Spectrophotometry
Operational Principles
UV-Vis spectrophotometry operates on the principle of measuring the absorption of ultraviolet or visible light by a sample. When light in the 200-900 nm wavelength range passes through a sample, molecules with electrons in bonding orbitals can absorb photons of specific energies to transition to higher energy anti-bonding orbitals [10]. This absorption is quantitatively related to the sample's properties through the Beer-Lambert Law, which states that absorbance (A) is proportional to the concentration (c) of the absorbing species, the path length (L) of light through the sample, and the molar absorptivity (ε), a compound-specific constant at a given wavelength [10] [19]. The mathematical expression is: A = ε × c × L.
Each chemical compound possesses a unique absorption spectrum—a plot of absorbance versus wavelength—that serves as a molecular fingerprint due to its specific electronic configuration [10]. This characteristic spectrum enables both identification and quantification of substances. For pharmaceutical applications, this means that active pharmaceutical ingredients (APIs), excipients, impurities, and degradation products can, in principle, be distinguished based on their spectral signatures, provided their absorption profiles differ sufficiently in the UV-Vis range.
Instrumentation Components
A modern UV-Vis spectrophotometer consists of several key components that work in concert to measure light absorption accurately [10]:
- Light Source: Typically a xenon lamp for full UV-Vis coverage, or separate deuterium (UV) and tungsten/halogen (visible) lamps.
- Wavelength Selector: Either a monochromator (using diffraction gratings) or filters to select specific wavelengths from the broad-spectrum source.
- Sample Holder: Cuvettes made of quartz (for UV), optical glass, or plastic (visible only), or modern microvolume pedestals that eliminate the need for cuvettes.
- Detector: Photomultiplier tubes (PMTs), photodiodes, or charge-coupled devices (CCDs) that convert transmitted light intensity into an electrical signal.
The optical setup can follow either a monochromatic path (where light is wavelength-selected before passing through the sample) or a polychromatic path (where full-spectrum light passes through the sample before being dispersed onto a detector array) [19]. The latter design, employed in instruments like the NanoPhotometer, enables rapid full-spectrum acquisition, which is particularly advantageous for specificity assessment as it provides complete spectral data rather than single-wavelength measurements.
Specificity Assessment Methodologies
Experimental Protocols for Specificity Verification
Establishing the specificity of a UV-Vis spectrophotometric method requires a systematic experimental approach designed to challenge the method's ability to measure the target analyte accurately in the presence of potential interferents. The following protocols provide a framework for comprehensive specificity assessment:
Forced Degradation Studies: Stress samples of the drug substance or product should be prepared under various conditions including acid/base hydrolysis, thermal degradation, oxidative stress, and photolytic exposure [156]. The stressed samples are then analyzed via full UV-Vis scanning (200-400 nm typically) to determine whether degradation products interfere with the analyte measurement. Specificity is demonstrated when the analyte peak purity is maintained and degradation products either do not absorb at the analytical wavelength or their contributions can be mathematically discriminated through spectral analysis.
Matrix Interference Testing: Prepare samples containing the analyte in the presence of all expected matrix components (excipients, preservatives, etc.) at their maximum expected concentrations. Compare the absorption spectrum of the analyte in the matrix to that of a pure standard solution at the same concentration [156]. The absence of spectral shifts and a match in absorption maxima (within ±1-2 nm) indicates specificity. For quantitative methods, acceptable specificity is demonstrated when the measured analyte concentration in the spiked matrix is within 98-102% of the known value.
Spectral Purity and Overlay Analysis: Collect full UV-Vis spectra (200-400 nm) of the pure analyte, potential interferents individually, and their mixtures. Utilize spectral overlay techniques to identify isosbestic points and assess the degree of overlap [10]. Modern spectrophotometers with software capabilities can calculate correlation coefficients between spectra or perform derivative spectroscopy to enhance spectral resolution. A correlation coefficient of >0.999 between the standard and sample spectrum at equivalent concentrations typically indicates high specificity.
Wavelength Selection Optimization: When developing a quantitative UV-Vis method, systematically evaluate multiple wavelength options across the absorption maximum and surrounding regions. The optimal analytical wavelength demonstrates maximum analyte absorption with minimum interference from other components. This is determined by measuring standard solutions of the analyte and potential interferents individually and calculating the specificity factor: SF = Aanalyte / (Aanalyte + ΣA_interferents), where values approaching 1.0 indicate high specificity.
Specificity Assessment Workflow
The following diagram illustrates the comprehensive workflow for assessing specificity in UV-Vis spectrophotometric methods:
Quantitative Data Presentation
Specificity Assessment Results Table
The following table summarizes typical experimental data collected during specificity assessment of a hypothetical active pharmaceutical ingredient (API) against known potential interferents:
Table 1: Specificity Assessment of Hypothetical API Against Potential Interferents
| Sample Component | Concentration (µg/mL) | Absorbance at λmax (API) | Absorbance at λmax (Interferent) | Interference (%) | Specificity Factor |
|---|---|---|---|---|---|
| API (Standard) | 10.0 | 0.455 | - | - | 1.00 |
| Impurity A | 2.0 | - | 0.025 | 5.5 | 0.95 |
| Impurity B | 2.0 | - | 0.018 | 4.0 | 0.96 |
| Degradant C | 2.0 | - | 0.032 | 7.0 | 0.93 |
| Excipient D | 50.0 | - | 0.015 | 3.3 | 0.97 |
| API + Mixture | 10.0 + All | 0.448 | - | 8.2 | 0.92 |
Regulatory Acceptance Criteria for Specificity
For a method to be considered specific according to regulatory standards, it must meet certain performance criteria as outlined in guidelines such as ICH Q2(R1). The following table summarizes these key criteria:
Table 2: Regulatory Acceptance Criteria for Specificity Assessment
| Assessment Parameter | Experimental Requirement | Acceptance Criteria |
|---|---|---|
| Peak Purity | Spectral overlay of sample vs standard | Match ±1-2 nm at absorption maxima; Correlation coefficient >0.999 |
| Forced Degradation | Analysis of stressed samples | No interference from degradation products at analytical wavelength |
| Matrix Interference | Spike recovery in presence of matrix components | 98-102% recovery of known amount |
| Wavelength Specificity | Measurement at alternative wavelengths | Consistent absorbance ratios across wavelengths |
| Sample Solution Stability | Repeated analysis over time | No significant spectral changes during analysis period |
The Scientist's Toolkit: Essential Research Reagents and Materials
Table 3: Essential Research Reagents and Materials for UV-Vis Specificity Assessment
| Item | Function/Significance | Technical Specifications |
|---|---|---|
| High-Purity Reference Standard | Serves as the benchmark for spectral comparison and purity assessment | Certified purity >99.5%; Structurally characterized; Stored under appropriate conditions |
| Pharmaceutical-Grade Solvents | Dissolve samples without introducing interfering absorptions | UV-Vis grade; Low absorbance in spectral region of interest; Stored in amber bottles |
| Quartz Cuvettes | Contain samples for measurement without absorbing UV light | Precision quartz; 1 cm pathlength standard; Matched sets for sample and reference |
| Matrix Components | Challenge the method with potential interferents | Include all excipients, preservatives, and stabilizers at maximum expected concentrations |
| Forced Degradation Reagents | Create stress conditions to generate potential degradants | Acid (HCl), base (NaOH), oxidant (H₂O₂), thermal and photolytic stress conditions |
| Spectral Validation Standards | Verify wavelength accuracy and photometric linearity | Holmium oxide filter (wavelength validation); Neutral density filters (photometric accuracy) |
| Buffer Systems | Maintain physiological or controlled pH conditions | High-purity buffers; Transparent in spectral region of interest; Appropriate ionic strength |
Regulatory Context and Pharmaceutical Applications
In pharmaceutical analysis, UV-Vis spectrophotometry plays a critical role in multiple quality control applications where specificity is paramount. Regulatory bodies including the FDA and international pharmacopeias (USP, EP, JP) require specificity demonstration for methods used in identity testing, assay content, and impurity quantification [88] [157]. Key pharmaceutical applications include:
Identity Testing: Confirmation of a drug substance's identity through spectral matching, where specificity is demonstrated by the exact correspondence of absorption maxima and overall spectral shape to a reference standard [157]. The USP and EP commonly include UV-Vis identification tests in monographs for drugs like ibuprofen, where specificity must be established against potential related substances and formulation matrix components [88].
Dissolution Testing: UV-Vis spectroscopy routinely analyzes dissolution samples to determine drug release rates from solid dosage forms [88] [157]. Specificity must be demonstrated against dissolution medium components and potential tablet excipients that may leach into the medium, typically through spectral overlay and recovery studies at the analytical wavelength.
Impurity and Degradation Product Monitoring: While chromatographic techniques are often preferred for specific impurity quantification, UV-Vis spectrophotometry provides a rapid screening tool for overall purity assessment [157]. Specificity is demonstrated when the method can detect increases in impurity levels through absorbance changes at appropriate wavelengths without interference from the main analyte.
Content Uniformity and Assay: For well-characterized compounds with established specificity, UV-Vis provides a rapid, cost-effective method for potency determination [88]. The method must demonstrate specificity against all known formulation components through rigorous spike recovery experiments and spectral purity assessment.
The regulatory expectation for specificity is clearly articulated in ICH Q2(R1) guidelines, which require that specificity be established using samples spiked with potential interferents or through comparison with a reference method of known specificity [156]. For UV-Vis methods, this typically involves a combination of the experimental protocols outlined in Section 3, with documentation including spectral overlays, recovery data, and statistical analysis of results.
Advanced Techniques for Enhanced Specificity
When conventional UV-Vis spectrophotometry lacks sufficient specificity due to significant spectral overlap, several advanced techniques can enhance discrimination:
Derivative Spectroscopy: This mathematical transformation of zero-order absorption spectra enhances resolution of overlapping bands and eliminates baseline offsets. The second derivative spectrum is particularly valuable for resolving closely spaced absorption maxima and identifying shoulder peaks that might indicate impurities or matrix interference.
Multi-Wavelength and Ratio Methods: Instead of single-wavelength measurement, these approaches utilize absorbance values at multiple wavelengths to mathematically correct for background interference. The dual-wavelength method selects two wavelengths where the interferent has equal absorbance but the analyte differs significantly, while multi-wavelength analysis uses regression equations based on full spectral data.
Chemometric Techniques: Multivariate statistical methods including Principal Component Analysis (PCA) and Partial Least Squares (PLS) regression can extract specific analyte information from complex spectral mixtures. These approaches require calibration sets with carefully varied compositions but can provide exceptional specificity even with heavily overlapping spectra.
Difference Spectroscopy: This technique measures the absorbance difference between two related samples (e.g., before and after a chemical reaction specific to the analyte), effectively canceling out background interference. The method is particularly useful for quantifying specific functional groups or measuring enzymatic activities in complex biological matrices.
Each of these advanced approaches extends the utility of UV-Vis spectrophotometry for specific analytical challenges in pharmaceutical development, providing researchers with tools to establish method specificity even for complex sample matrices with multiple absorbing components.
Ultraviolet-Visible (UV-Vis) spectrophotometry is an analytical technique that measures the amount of discrete wavelengths of ultraviolet or visible light absorbed by or transmitted through a sample in comparison to a reference or blank sample [10]. This property is influenced by the sample composition, providing information on both the identity and concentration of analytes [10]. The technique operates on the principle that electrons in molecules can absorb specific amounts of energy to transition to higher energy states when exposed to photons of appropriate wavelengths [3] [45]. The fundamental law governing quantitative analysis in UV-Vis spectroscopy is the Beer-Lambert Law, which states that absorbance is directly proportional to the concentration of the absorbing species and the path length of light through the sample [45].
The significance of UV-Vis spectroscopy spans numerous scientific disciplines, including pharmaceutical analysis, quality control in food and beverages, environmental monitoring, and life science research [3] [88]. Its non-destructive nature, rapid analysis capability, and user-friendly operation make it particularly valuable for both research and industrial applications [8]. Within the pharmaceutical industry specifically, UV-Vis plays a critical role in drug discovery, development, and quality control, enabling researchers to quantify active pharmaceutical ingredients (APIs), identify impurities, and perform dissolution testing [20] [88].
Fundamental Principles and Instrumentation
Core Operating Principle
The underlying principle of UV-Vis spectroscopy involves the interaction between ultraviolet/visible light and matter, resulting in the absorption of specific wavelengths by molecules known as chromophores [3]. When light in the UV (190-400 nm) or visible (400-800 nm) range interacts with a molecule, electrons absorb specific wavelengths and become excited, moving from their ground state to a higher energy state [3] [10]. This electronic transition occurs only when the energy of the incident photon matches the energy difference between the molecular orbitals [45]. The specific wavelengths absorbed are characteristic of particular molecular structures, enabling both qualitative identification and quantitative measurement through application of the Beer-Lambert Law [45].
The Beer-Lambert Law establishes the mathematical relationship between absorbance and concentration: A = εcl, where A is absorbance, ε is the molar absorptivity (a compound-specific constant), c is the concentration, and l is the path length [45]. This relationship forms the basis for quantitative analysis, allowing researchers to determine unknown concentrations by measuring absorbance at specific wavelengths and comparing to standards of known concentration [10].
Instrument Components and Function
A UV-Vis spectrophotometer consists of several key components that work together to enable precise absorbance measurements:
Light Source: Provides broad-spectrum radiation across UV and visible wavelengths. Common configurations include a single xenon lamp or a combination of deuterium (UV) and tungsten/halogen (visible) lamps [11] [10]. The light source must deliver stable, continuous emission throughout the operational wavelength range [11].
Wavelength Selector (Monochromator): Isolates specific wavelengths from the broad-spectrum source. Modern instruments typically use diffraction gratings that can be rotated to select discrete wavelengths [11] [158]. The monochromator itself contains entrance and exit slits to control beam alignment and spectral bandwidth, along with mirrors to collimate and focus the light [11].
Sample Container: Holds the sample in the light path. For liquid samples, this typically consists of cuvettes with specific path lengths (commonly 1 cm) made from materials transparent in the measured range (quartz for UV, glass or plastic for visible only) [10] [45].
Detector: Converts transmitted light intensity into an electrical signal. Different detector types offer varying sensitivity and wavelength response ranges, including photomultiplier tubes (PMTs), silicon photodiodes, and for extended range into NIR, PbS and InGaAs detectors [11] [10].
Two principal optical designs exist: single-beam and double-beam configurations. In single-beam instruments, all radiation passes through the sample as one beam, requiring separate measurements of reference and sample [11] [45]. Double-beam instruments split the light into sample and reference paths simultaneously, compensating for source fluctuations and providing more stable baselines [11].
Figure 1: Schematic diagram of a double-beam UV-Vis spectrophotometer showing key components and light path.
Current Technology Trends
Miniaturization and Portable Devices
The trend toward miniaturization has transformed UV-Vis spectroscopy from a exclusively benchtop technique to one that can be deployed in diverse field settings. Modern portable spectrophotometers maintain analytical performance while offering significantly reduced footprint and power requirements [8]. These advancements have been enabled by developments in micro-opto-electro-mechanical systems (MOEMS), integrated optics, and surface-mount electronics that allow entire optical pathways to be condensed into handheld formats [8].
Key benefits of miniaturized systems include:
- Field Deployment: Enables on-site analysis in environmental monitoring, food safety inspection, and pharmaceutical manufacturing without sample transport [8].
- Reduced Sample Volume: Microvolume systems require as little as 0.5-2 μL of sample, preserving precious biological materials and reducing reagent consumption [8].
- Point-of-Care Applications: Portable instruments bring analytical capability to clinical settings, agricultural sites, and educational environments previously limited by cost and space constraints [88].
The performance trade-offs of miniaturization typically involve slightly reduced spectral resolution and increased susceptibility to environmental factors compared to research-grade benchtop systems. However, for many quantitative applications, modern portable instruments provide sufficient accuracy with greatly enhanced operational flexibility [8].
Advanced Detector Systems
Detector technology represents a critical area of innovation in UV-Vis spectroscopy, directly impacting instrument sensitivity, signal-to-noise ratio, and operational wavelength range [11]. Recent advancements focus on enhancing detection limits, expanding dynamic range, and enabling multi-channel detection for high-throughput applications.
Table 1: Performance Characteristics of UV-Vis Detector Technologies
| Detector Type | Operating Principle | Wavelength Range | Sensitivity | Applications | Advantages/Limitations |
|---|---|---|---|---|---|
| Photomultiplier Tube (PMT) | Photoelectric effect with electron multiplication through dynodes [11] [10] | UV-Vis (190-800 nm) [11] | High (detects very low light levels) [10] | Low-light applications, high-resolution spectroscopy [11] | Advantages: Wide dynamic range, high gain, excellent signal-to-noise [11]Limitations: Larger size, requires high voltage [11] |
| Silicon Photodiode | Semiconductor p-n junction creates photocurrent when photons are absorbed [11] | UV-Vis-NIR (190-1100 nm) [11] | Moderate [11] | Routine analysis, portable instruments [11] [8] | Advantages: Compact, low cost, quick response [11]Limitations: Lower sensitivity than PMT [11] |
| InGaAs Photodiode | Semiconductor photodiode with different bandgap than silicon [11] | Extended NIR (800-1700 nm) [11] | High in NIR region [11] | NIR spectroscopy, material characterization [11] | Advantages: Superior NIR sensitivity compared to PbS [11]Limitations: Smaller wavelength range than PbS, higher cost [11] |
| CCD/CMOS Array | Multi-channel detection with semiconductor pixels [10] | UV-Vis-NIR (according to coating) [10] | High with integration capability [10] | Rapid scanning, multichannel spectroscopy, imaging applications [155] | Advantages: Simultaneous multi-wavelength detection, fast acquisition [10]Limitations: Potentially higher dark current, fixed pixel resolution [10] |
Emerging detector technologies focus on overcoming traditional sensitivity limitations while maintaining portability. Innovations include back-thinned CCDs with enhanced quantum efficiency, CMOS sensors with integrated amplification, and specialized coatings that extend wavelength response while minimizing stray light effects [11] [10]. These developments particularly benefit applications requiring rapid kinetics monitoring, such as dissolution testing and reaction profiling [155].
Modern UV-Vis instruments incorporate advanced optical designs that improve performance while facilitating miniaturization. Key developments include:
Holographic Grating Monochromators: Blazed holographic diffraction gratings provide significantly better quality measurements compared to ruled gratings due to reduced physical imperfections and stray light [10]. Modern systems typically employ gratings with 1200-2000 grooves per mm, balancing resolution and usable wavelength range [10].
Solid-State Light Sources: Light-emitting diodes (LEDs) and laser diodes are increasingly replacing traditional deuterium and tungsten lamps in portable instruments [8]. These sources offer longer lifetime, lower power consumption, reduced heat generation, and instant-on capability while providing sufficient intensity for many analytical applications [8].
Integrated Optical Systems: Micro-mirror arrays, integrated fiber optics, and microfluidic flow cells enable complex optical paths in compact formats. These systems reduce alignment requirements and enhance mechanical stability while minimizing sample volume requirements [8].
Applications in Pharmaceutical Research and Drug Development
Drug Stability and Commercial Viability Assessment
UV-Vis spectrophotometry provides a fast, economical, and accurate method for assessing critical drug stability indicators throughout the development process [20]. Stability testing helps pharmaceutical companies determine appropriate shelf-life, storage conditions, and usage instructions while predicting commercial viability early in development [20].
Environmental stressors including light, temperature, pH changes, oxidation, and hydrolysis can cause chemical changes that destabilize medication structure [20]. UV-Vis enables researchers to monitor active pharmaceutical ingredient (API) levels and identify contaminants in response to forced, accelerated, and real-time aging studies [20]. This allows informed decisions regarding resource allocation, as drugs with poor stability profiles may be removed from development despite clinical efficacy [20].
Dissolution Testing and Release Kinetics
UV dissolution imaging represents an emerging application that generates spatially and temporally resolved absorbance maps by exploiting the UV absorbance of drug compounds [155]. This technique provides visualization of dissolution processes at the solid-liquid interface, offering insights into release mechanisms not captured by traditional offline measurements [155].
Table 2: UV-Vis Spectroscopy Applications in Pharmaceutical Analysis
| Application Area | Specific Uses | Methodological Approach | Key Parameters Measured |
|---|---|---|---|
| Quality Control | Verification of raw materials, intermediate products, final dosage forms [88] | Absorbance scanning at characteristic wavelengths, comparison with reference standards [88] | Identity confirmation, purity assessment, compliance with pharmacopeial standards [88] |
| Impurity Profiling | Detection and quantification of process-related impurities, degradation products [88] | High-resolution scanning with derivative spectroscopy, peak separation algorithms [45] | Impurity levels relative to API, identification of unknown contaminants [88] |
| Dissolution Testing | Drug release from solid oral dosage forms, intrinsic dissolution rate determination [155] [88] | Continuous or interval-based monitoring of dissolution media, UV imaging with spatial resolution [155] | Release kinetics, dissolution efficiency, conformance to regulatory requirements [155] |
| Content Uniformity | Assurance of consistent API distribution in solid dosage forms [88] | Multiple sampling from different batch units, statistical analysis of absorbance measurements [88] | API concentration per unit, batch homogeneity [88] |
| Biomolecule Analysis | Nucleic acid and protein quantification in biopharmaceuticals [8] [88] | Absorbance at characteristic wavelengths (260 nm for DNA/RNA, 280 nm for proteins) [8] | Concentration, purity ratios (260/280, 260/230), biomolecular integrity [8] |
Figure 2: UV-Vis spectroscopy applications throughout the pharmaceutical development workflow.
Advanced UV Imaging Techniques
UV dissolution imaging technology represents a significant advancement beyond traditional spectrophotometry, enabling researchers to visualize and quantify drug release processes with high spatial and temporal resolution [155]. This technique typically employs high-brightness light sources, high-resolution CCD detectors, and specialized flow cells to monitor concentration gradients and solid-form changes during dissolution [155].
Applications of UV imaging in pharmaceutical research include:
- Intrinsic Dissolution Rate (IDR) Determination: Measuring dissolution rates from pure drug substances under standardized conditions, providing critical data for form selection [155].
- Formulation Screening: Observing drug-excipient interactions and their impact on release profiles during early development [155].
- Whole Dosage Form Analysis: Monitoring release from complete tablets or capsules using specialized USP type IV-like cells that accommodate larger samples [155].
- Non-Oral Formulation Assessment: Studying release from transdermal patches, implants, and other non-oral delivery systems by imaging concentration gradients [155].
Experimental Protocols and Methodologies
Standard Operating Procedure for Drug Stability Testing
Principle: This protocol describes the use of UV-Vis spectrophotometry to assess drug stability under accelerated conditions, providing predictive data for shelf-life determination [20].
Materials and Equipment:
- Double-beam UV-Vis spectrophotometer with temperature-controlled sample holder [10]
- Quartz cuvettes (1 cm path length) [10]
- Reference standard of the active pharmaceutical ingredient (API) [88]
- Appropriate solvent meeting spectrophotometric purity requirements [10]
- Forced degradation equipment (temperature-controlled oven, photostability chamber) [20]
Procedure:
- Sample Preparation:
- Prepare stock solution of API at known concentration in suitable solvent
- Aliquot samples into sealed containers for exposure to different stress conditions (elevated temperature, light, humidity, oxidative conditions) [20]
- Maintain control samples under protected conditions at controlled temperature
Instrument Calibration:
- Power on spectrophotometer and allow lamps to warm up for recommended time (typically 30 minutes)
- Perform wavelength calibration using holmium oxide or didymium filters [88]
- Verify photometric accuracy using potassium dichromate or other standard reference materials [88]
- Establish calibration curve using API reference standards at minimum five concentrations covering expected range [10]
Stability Monitoring:
- At predetermined time intervals, remove stressed samples and controls
- Dilute samples as needed to remain within linear range of Beer-Lambert relationship (typically absorbance <1.5) [10]
- Scan samples across appropriate wavelength range (typically 200-400 nm for most APIs) [3]
- Record absorbance at wavelength of maximum absorption (λmax)
- Compare spectra and absorbance values with control samples
Data Analysis:
- Calculate remaining API percentage at each time point using calibration curve
- Plot degradation kinetics to determine rate constants
- Identify degradation products through appearance of new absorption peaks [20]
- Establish correlation between accelerated conditions and real-time stability
Microvolume Nucleic Acid Quantification Protocol
Principle: This procedure enables rapid quantification of DNA and RNA samples using minimal volume, with simultaneous assessment of sample purity [8].
Materials and Equipment:
- UV-Vis spectrophotometer with microvolume capability [8]
- DNA or RNA standards for calibration (optional)
- Appropriate buffer (TE buffer, pH 8.0 recommended for DNA; nuclease-free water for RNA)
Procedure:
- Instrument Preparation:
- Initialize spectrophotometer and select nucleic acid application module
- Perform blank measurement using the same buffer as sample diluent
- Clean measurement surface according to manufacturer instructions
Sample Measurement:
- Apply 0.5-2 μL sample to measurement pedestal
- Lower measurement arm to create liquid column
- Initiate measurement to acquire spectrum from 220-350 nm
- Record absorbance values at 230, 260, and 280 nm
- Clean measurement surface between samples
Data Interpretation:
- Calculate nucleic acid concentration using established conversion factors (50 μg/mL for double-stranded DNA, 40 μg/mL for RNA per 1 AU at 260 nm) [8]
- Determine purity ratios: A260/A280 (protein contamination) and A260/A230 (organic compound contamination) [45]
- Acceptable purity ranges: A260/A280 ~1.8 for pure DNA, ~2.0 for pure RNA; A260/A230 >2.0 for both [45]
Tablet Dissolution Testing Methodology
Principle: This method describes the quantification of drug release from solid oral dosage forms using UV-Vis spectrophotometry, complying with pharmacopeial requirements [88].
Materials and Equipment:
- USP-compliant dissolution apparatus (Type I basket or Type II paddle) [88]
- UV-Vis spectrophotometer with flow-through cells or automated sampling capability
- Dissolution medium meeting compendial requirements
- Reference standard of API
Procedure:
- Media Preparation:
- Prepare dissolution medium according to monograph specifications
- Degas medium by heating to 41°C with stirring or by vacuum filtration
- Verify medium pH and temperature before testing
Dissolution Test Setup:
- Place tablets in vessels containing pre-warmed dissolution medium (typically 500-1000 mL)
- Operate apparatus at specified rotation speed (e.g., 50 rpm for paddles, 100 rpm for baskets)
- Maintain temperature at 37±0.5°C throughout test
Sampling and Analysis:
- Withdraw samples automatically or manually at predetermined time points (e.g., 10, 15, 20, 30, 45, 60 minutes)
- Filter samples through appropriate membrane filters (e.g., 0.45 μm porosity)
- Measure absorbance at predetermined wavelength specific to API
- Calculate concentration using established calibration curve
- Plot cumulative release versus time to generate dissolution profile
Data Interpretation:
- Compare dissolution profile with acceptance criteria (e.g., Q-value specification in pharmacopeias)
- Calculate dissolution efficiency and mean dissolution time
- Perform statistical analysis of replicate measurements (typically n=6-12)
The Scientist's Toolkit: Essential Research Reagents and Materials
Table 3: Essential Research Reagents and Materials for UV-Vis Pharmaceutical Analysis
| Item | Specification | Function/Purpose | Application Notes |
|---|---|---|---|
| Quartz Cuvettes | 1 cm path length, high UV transmission [10] | Sample containment with minimal light absorption | Required for UV measurements below 350 nm; handle by opaque sides to prevent fingerprints [10] |
| Microvolume Pedestals | Surface tension-based measurement, no cuvette required [8] | Enables measurement of samples as small as 0.5 μL | Ideal for precious samples; requires careful cleaning between measurements [8] |
| Spectrophotometric Solvents | HPLC grade or better, low UV absorbance [10] | Sample dissolution and reference blank | Must have minimal absorbance in measurement region; common choices: water, methanol, acetonitrile [10] |
| Holmium Oxide Filter | NIST-traceable wavelength standard [88] | Wavelength accuracy verification | Characteristic sharp peaks at 241, 279, 287, 333, 345, 361, 416, 451, 536 nm [88] |
| Potassium Dichromate | ACS reagent grade, dried before use [88] | Photometric accuracy verification | Absorbance measured at 235, 257, 313, 350 nm in perchloric acid solution [88] |
| Neutral Density Filters | Certified transmittance values [88] | Stray light verification | Measures instrument's ability to reject non-monochromatic light [88] |
| Caffeine Standard | USP reference standard [88] | System suitability testing for pharmacopeial compliance | Verify absorbance ratio A273/A244 meets specified range [88] |
| pH Buffers | Spectrophotometric grade, appropriate pH range [20] | Maintain consistent ionization state of analytes | Critical for compounds whose absorption varies with pH [20] |
| Dissolution Media | USP-specified compositions [88] | Simulate physiological conditions for drug release testing | Common media: 0.1N HCl, pH 4.5-7.5 buffers, surfactants for poorly soluble drugs [88] |
The field of UV-Vis spectrophotometry continues to evolve through technological advancements in miniaturization, detector systems, and optical designs. These developments enhance the technique's applicability across the pharmaceutical development pipeline, from early drug discovery through quality control of finished products. The integration of advanced detector technologies, particularly in portable and microvolume instruments, has expanded the analytical capabilities available to researchers while reducing resource requirements.
Current trends indicate continued refinement of miniaturized systems with enhanced sensitivity approaching that of traditional benchtop instruments. Additionally, the integration of UV-Vis with complementary techniques such as dissolution imaging provides unprecedented insight into drug release processes. As these technologies mature, UV-Vis spectrophotometry will maintain its essential role in pharmaceutical research while expanding into new applications enabled by technological innovation.
Conclusion
UV-Vis spectrophotometry remains an indispensable analytical technique in pharmaceutical research and drug development, offering an optimal balance of accessibility, precision, and versatility. By understanding the fundamental principles of light-matter interactions, implementing robust methodological protocols, proactively addressing performance issues, and adhering to rigorous validation standards, researchers can leverage this technology for reliable quantification, purity assessment, and quality control throughout the drug development pipeline. Future directions point toward increased automation, miniaturization for point-of-care applications, enhanced data analysis through artificial intelligence integration, and continued development as a complementary technique within comprehensive analytical workflows. For biomedical and clinical research, these advancements promise more accessible, high-throughput analytical capabilities that can accelerate discovery while maintaining the stringent data quality required for regulatory approval and patient safety.
References
- 1. Study opens new realms of light-matter interaction [https://news.mit.edu/2016/forbidden-light-emissions-sensors-0714]
- 2. Light-Matter Interactions | Biophotonics Imaging Laboratory [https://biophotonics.illinois.edu/imaging-technology/light-matter-interactions]
- 3. What Is the Principle of UV-Vis Spectroscopy and Why It ... [https://connect.ssllc.com/learning-center/principle-of-uv-vis-spectroscopy/]
- 4. Ultraviolet–visible spectroscopy [https://en.wikipedia.org/wiki/Ultraviolet%E2%80%93visible_spectroscopy]
- 5. Light-Matter Interactions in Lasers [https://www.newport.com/n/laser-light-matter-interactions]
- 6. Light-matter interactions: absorption, emission, and scattering [https://fiveable.me/photochemistry/unit-1/light-matter-interactions-absorption-emission-scattering/study-guide/iRklLVEpLbO1Spq0]
- 7. Analyzing experimental UV–vis spectra of conjugated ... [https://pubs.rsc.org/en/content/articlehtml/2025/nj/d4nj05537c]
- 8. What is a UV-Vis Spectrophotometer? [https://www.denovix.com/what-is-a-uv-vis-spectrophotometer/]
- 9. A quantitative prediction strategy for UV-vis spectroscopy ... [https://pubs.rsc.org/en/content/articlelanding/2025/ay/d5ay01268f]
- 10. UV-Vis Spectroscopy: Principle, Strengths and Limitations ... [https://www.technologynetworks.com/analysis/articles/uv-vis-spectroscopy-principle-strengths-and-limitations-and-applications-349865]
- 11. Instrumentation of a UV-Visible Spectrophotometer - JASCO Inc [https://jascoinc.com/learning-center/theory/spectroscopy/uv-vis-spectroscopy/instrumentation/]
- 12. UV-Vis Spectrophotometer: Essential Tool [https://www.pion-inc.com/blog/what-is-a-uv-vis-spectrophotometer]
- 13. Light Sources for Spectrophotometers [https://www.shimadzu.com/an/service-support/technical-support/uv/essential_knowledge/lightsources.html]
- 14. Deuterium arc lamp [https://en.wikipedia.org/wiki/Deuterium_arc_lamp]
- 15. Deuterium Lamp for UV-Visible Spectroscopy [https://tec5usa.com/product/deuterium-lamp/]
- 16. Tungsten-Halogen Lamps - ZEISS Microscopy Online Campus [https://zeiss-campus.magnet.fsu.edu/articles/lightsources/tungstenhalogen.html]
- 17. Deuterium Lamp vs Xenon Lamp [The Ultimate Comparison ... [https://www.hitentechno.in/deuterium-lamp-xenon-lamp]
- 18. Tungsten Halogen UV-Vis Lamps for Spectrophotometer [https://tec5usa.com/product/tungsten-halogen-uv-vis-lamps/]
- 19. How UV/Vis Spectrophotometer Works [https://www.implen.com/uv-vis-spectrophotometer/]
- 20. Using UV-Vis Spectrophotometry In Drug Stability Testing ... [https://www.hunterlab.com/blog/using-uv-vis-spectrophotometry-in-drug-stability-testing-can-predict-commercial-viability/]
- 21. Monochromator [https://en.wikipedia.org/wiki/Monochromator]
- 22. What is a monochromator in a UV-Vis spectrophotometer? [https://knowledge.cphnano.com/en/pages/what-is-a-spectral-bandwidth]
- 23. The Structure of a Spectrophotometer [https://www.shimadzu.com/an/service-support/technical-support/uv/overview/structure.html]
- 24. High Resolution Monochromators 2025-2033 Trends [https://www.archivemarketresearch.com/reports/high-resolution-monochromators-484547]
- 25. Regional Insights into Optical Monochromator Market Growth [https://www.marketreportanalytics.com/reports/optical-monochromator-38769]
- 26. A review on spectral data preprocessing techniques for ... [https://www.sciencedirect.com/science/article/pii/S258900422501020X]
- 27. Deep learning-based single-shot computational ... [https://www.nature.com/articles/s41598-025-06691-6]
- 28. High Resolution Monochromators Market by Application [https://www.linkedin.com/pulse/high-resolution-monochromators-market-application-2025-zguac/]
- 29. Beating spectral bandwidth limits for large aperture ... [https://pmc.ncbi.nlm.nih.gov/articles/PMC11953342/]
- 30. How does a photomultiplier tube work? [https://www.ssi.shimadzu.com/service-support/faq/uv-vis/instrument-design/9/index.html]
- 31. Photomultiplier tube [https://en.wikipedia.org/wiki/Photomultiplier_tube]
- 32. Silicon Photomultipliers (SiPMs) vs ... [https://www.aptechnologies.co.uk/news/308-silicon-photomultipliers-sipms-vs-photomultiplier-tubes-pmts-why-choose-sipms]
- 33. APD vs PMT and Beyond: Flow Cytometry Light Detectors [https://www.thermofisher.com/blog/life-in-the-lab/apd-vs-pmt-and-beyond-flow-cytometry-light-detectors/]
- 34. A Primer on Photodiode Technology [https://home.sandiego.edu/~ekim/photodiode/pdtech.html]
- 35. Working Process of a UV-Vis Spectrophotometer - Optosky [https://www.optosky.net/www.uv-vis.com]
- 36. 什么是紫外可见分光光度计– Implen [https://implen.cn/zh-CN/uv-vis-spectrophotometer/]
- 37. UV-Vis Spectrophotometer: 一种关键的光谱分析工具 - 电泳仪 [http://www.liuyi17.com/jishu/800.html]
- 38. single and double-beam UV-Visible spectrophotometers. ... [https://www.drawellanalytical.com/the-difference-between-single-and-double-beam-uv-visible-spectrophotometers/]
- 39. Tech Compare: Single vs. Double Beam Spectrophotometers [https://www.labcompare.com/10-Featured-Articles/592706-Tech-Compare-Single-vs-Double-Beam-Spectrophotometers/]
- 40. What's the Difference Between Single and Dual Beam ... [https://sperdirect.com/blogs/news/whats-the-difference-between-single-and-dual-beam-spectrophotometers?srsltid=AfmBOooN9IkwEIG6lxWlVf0h2vzxjV3aaz-KLAKM8rZqyN5hATuaGYxR]
- 41. Single Beam vs. Double Beam Spectrophotometer [https://www.hunterlab.com/blog/single-beam-vs-double-beam-spectrophotometer/]
- 42. Single Beam and Double Beam Spectrophotometers [https://www.drawellanalytical.com/single-beam-and-double-beam-spectrophotometers-how-to-choose/]
- 43. Beer-Lambert Law | Transmittance & Absorbance [https://www.edinst.com/resource/the-beer-lambert-law/]
- 44. Beer-Lambert Law Spectrophotometer [https://www.hinotek.com/an-in-depth-analysis-of-the-beer-lambert-law-spectrophotometer/]
- 45. UV-Vis Spectroscopy: Principle, Parts, Uses, Limitations [https://microbenotes.com/uv-vis-spectroscopy/]
- 46. Development and validation of the UV-spectrophotometric ... [https://pmc.ncbi.nlm.nih.gov/articles/PMC3658052/]
- 47. The Beer-Lambert Law [https://chem.libretexts.org/Bookshelves/Physical_and_Theoretical_Chemistry_Textbook_Maps/Supplemental_Modules_(Physical_and_Theoretical_Chemistry)/Spectroscopy/Electronic_Spectroscopy/Electronic_Spectroscopy_Basics/The_Beer-Lambert_Law]
- 48. Development and validation of a UV–Vis ... [https://www.sciencedirect.com/science/article/pii/S2215016124005703]
- 49. Understanding the Limits of the Bouguer-Beer-Lambert Law [https://www.spectroscopyonline.com/view/understanding-the-limits-of-the-bouguer-beer-lambert-law]
- 50. The Bouguer‐Beer‐Lambert Law: Shining Light on the ... [https://pmc.ncbi.nlm.nih.gov/articles/PMC7540309/]
- 51. Molar absorption coefficient [https://en.wikipedia.org/wiki/Molar_absorption_coefficient]
- 52. What is “molar absorptivity”? [https://www.ssi.shimadzu.com/service-support/faq/uv-vis/light-and-theory/9/index.html]
- 53. Molar Absorption Coefficients - Spectra and Spectral Data [https://guides.lib.utexas.edu/chemistry/spectra/molabscoeff]
- 54. Beer's Law‐Why Integrated Absorbance Depends Linearly ... [https://pmc.ncbi.nlm.nih.gov/articles/PMC6899465/]
- 55. Calibration of UV / Visible Spectrophotometer [https://www.pharmaguideline.com/2010/05/calibration-of-uv-visible.html]
- 56. Sample Preparation for UV-Vis Spectroscopy [https://www.ossila.com/pages/preparing-samples-uv-vis-spectroscopy]
- 57. Solvents in Sample Preparation for Chromatography and ... [https://www.organomation.com/solvents-in-sample-preparation-for-chromatography-and-mass-spectrometry]
- 58. Solvent: Mastering Dilution Techniques: Choosing the ... [https://fastercapital.com/content/Solvent--Mastering-Dilution-Techniques--Choosing-the-Perfect-Solvent.html]
- 59. Guide to Cuvettes [https://spectrecology.com/blog/guide-to-cuvettes/]
- 60. Selecting The Right Cuvette: A Comprehensive Guide To ... [https://cuvet.co/selecting-the-right-cuvette-a-comprehensive-guide-to-types-materials-and-usage/]
- 61. What is Spectrophotometers and what is the role of Cuvettes [https://uniglobalbusiness.com/blogs/scientific-instruments/what-are-spectrophotometers-and-what-is-the-role-of-cuvettes?srsltid=AfmBOopMLLcH-zpeovF7LmrcqGt8X4YYe1sLMWwPzI0rNxFgTDJN8wfj]
- 62. Which Cuvette Is the Right One? Glass vs. Plastic, VIS ... [https://www.eppendorf.com/us-en/lab-academy/lab-solutions/other/which-cuvette-is-the-right-one-glass-vs-plastic-vis-vs-uv-micro-volume-vs-macro-volume/]
- 63. Quartz Cuvette: Complete & Essential Guide for ... [https://qvarz.com/quartz-cuvette/?srsltid=AfmBOorfEzhySS0F6Bs1sCeVp532zyDW0I2RtMaNzYx9c6KRFQw01XCH]
- 64. UV-vis Spectrophotometer Cuvette Selection Guide [https://airekacells.com/blog/cuvette-guide]
- 65. How to Select Cuvette Material for UV-VIS Absorbance ... [https://lab-training.com/select-right-cuvette-material-uv-vis-absorbance-studies/]
- 66. What Is UV-Vis Spectroscopy & How Does It Work? [https://tec5usa.com/uv-vis-spectroscopy/]
- 67. Univariate and multivariate signal processing ... [https://www.nature.com/articles/s41598-025-22700-0]
- 68. UV-VIS Spectrophotometry: Principles, Methods, and ... [https://aelabgroup.com/uv-vis-spectrophotometer-method/]
- 69. Pharma-Compliant Analysis with Flexible UV-Vis [https://www.spectroscopyonline.com/view/pharma-compliant-analysis-with-flexible-uv-vis]
- 70. UV-Visible Spectroscopy and the Beer-Lambert Law [https://byjus.com/chemistry/principle-of-uv-visible-spectroscopy/]
- 71. How do I determine the concentration, yield and purity of ... [https://www.promega.com/resources/pubhub/enotes/how-do-i-determine-the-concentration-yield-and-purity-of-a-dna-sample/]
- 72. DNA purity ratio for nucleic acid quality [https://www.bmglabtech.com/en/application-notes/dna-purity-ratio-fast-and-easy-absorbance-based-evaluation-of-nucleic-acid-quality/]
- 73. Purity Ratios | Nucleic Acid Ratios | Technical Note 130 [https://www.denovix.com/tn-130-purity-ratios-explained/]
- 74. Everything you need to know about purity ratios [https://www.news-medical.net/whitepaper/20220901/Everything-you-need-to-know-about-purity-ratios.aspx]
- 75. DNA Source Selection for Downstream Applications Based ... [https://pmc.ncbi.nlm.nih.gov/articles/PMC4991598/]
- 76. UV-Visible Spectroscopy [https://www2.chemistry.msu.edu/faculty/reusch/virttxtjml/spectrpy/uv-vis/spectrum.htm]
- 77. UV/Vis Spectroscopy for DNA & Protein Analysis [https://www.unchainedlabs.com/uv-vis-spectroscopy/]
- 78. Active drug substance impurity profiling part I. LC/UV diode ... [https://pubmed.ncbi.nlm.nih.gov/9535194/]
- 79. Development and Validation of an in-line API ... [https://pmc.ncbi.nlm.nih.gov/articles/PMC7076712/]
- 80. Through the Lens of GC/QTOF: Tracking Down Impurities ... [https://www.nelsonlabs.com/through-the-lens-of-gc-qtof-tracking-down-impurities-in-ophthalmics/]
- 81. Resources for Dissolution Testing of IR Solid Oral Dosage ... [https://www.fda.gov/animal-veterinary/new-animal-drug-applications/compilation-fda-guidance-and-resources-in-vitro-dissolution-testing-immediate-release-solid-oral-dosage]
- 82. Dissolution Testing of Pharmaceuticals: Techniques, ... [https://contractlaboratory.com/dissolution-testing-of-pharmaceuticals-techniques-equipment-and-regulatory-standards/]
- 83. Developing and Validating Dissolution Procedures [https://www.chromatographyonline.com/view/developing-and-validating-dissolution-procedures-0]
- 84. 2.1.5: Spectrophotometry [https://chem.libretexts.org/Bookshelves/Physical_and_Theoretical_Chemistry_Textbook_Maps/Supplemental_Modules_(Physical_and_Theoretical_Chemistry)/Kinetics/02%3A_Reaction_Rates/2.01%3A_Experimental_Determination_of_Kinetics/2.1.05%3A_Spectrophotometry]
- 85. Development and validation of a dissolution test for ... [https://pharmacyeducation.fip.org/pharmacyeducation/article/view/2713]
- 86. Analytical quality by design and measurement uncertainty ... [https://www.sciencedirect.com/science/article/abs/pii/S0731708525003358]
- 87. What Is UV-Vis Spectrophotometry Used For in Biochemistry? [https://synapse.patsnap.com/article/what-is-uv-vis-spectrophotometry-used-for-in-biochemistry]
- 88. UV-Vis Spectrophotometer Applications [https://www.thermofisher.com/us/en/home/industrial/spectroscopy-elemental-isotope-analysis/molecular-spectroscopy/uv-vis-spectrophotometry/applications.html]
- 89. Current Status of Protein Quantification Technologies [https://www.bioprocessintl.com/assays/current-status-of-protein-quantification-technologies]
- 90. High-throughput screening [https://en.wikipedia.org/wiki/High-throughput_screening]
- 91. Exploring the Possibilities of High-Throughput Sample ... [https://www.chromatographyonline.com/view/exploring-possibilities-high-throughput-sample-preparation]
- 92. High Throughput Analysis - an overview [https://www.sciencedirect.com/topics/chemistry/high-throughput-analysis]
- 93. Introduction to Multiple-Wavelength Spectrophotometric ... [https://link.springer.com/chapter/10.1007/978-1-4613-3418-7_2]
- 94. Multi-wavelength excitation Brillouin spectroscopy - PMC [https://pmc.ncbi.nlm.nih.gov/articles/PMC8224496/]
- 95. Application of a UV-vis spectrometer to investigate the ... [https://www.sciencedirect.com/science/article/pii/S0022354924004131]
- 96. what is the lifetime of a Deuterium lamp? [http://www.chromforum.org/viewtopic.php?t=7748]
- 97. Part Number: 5610021700 [https://www.agilent.com/store/en_US/Prod-5610021700/5610021700?srsltid=AfmBOopyKpyfBUvrRhXaMFnslvBMyWgMBXdhDE_MAncFfOw8R_lURscb]
- 98. FLD Lamp hours - Forum - Liquid Chromatography [https://community.agilent.com/technical/lc/f/forum/1556/fld-lamp-hours]
- 99. Fisherbrand Replacement Deuterium Lamp for Dionex UV ... [https://www.fishersci.com/shop/products/replacement-deuterium-lamp-dionex-uv-visible-hplc-detector-2/14500724]
- 100. Stray light [https://en.wikipedia.org/wiki/Stray_light]
- 101. What is stray light? [https://www.ssi.shimadzu.com/service-support/faq/uv-vis/resolution-and-stray-light/3/index.html]
- 102. Understanding Stray Light: Impact, Causes, and Solutions ... [https://acktar.com/understanding-stray-light-impact-causes-and-solutions-in-optical-systems/]
- 103. Stray Light Causes and Reduction Gigahertz-Optik [https://www.gigahertz-optik.com/en-us/service-and-support/knowledge-base/stray-light-suppression-correction-in-spectroradiometers/]
- 104. Stray Light - an overview [https://www.sciencedirect.com/topics/engineering/stray-light]
- 105. What is Stray light and how it is monitored? [https://lab-training.com/what-is-stray-light-and-how-it-is-monitored/]
- 106. What is Stray Light and How is it Analyzed? [https://www.ansys.com/simulation-topics/what-is-stray-light]
- 107. Introduction to stray light analysis - Part 1 [https://optics.ansys.com/hc/en-us/articles/42661769585939-Introduction-to-stray-light-analysis-Part-1]
- 108. How does stray light influence high absorbance ... [https://www.ssi.shimadzu.com/service-support/faq/uv-vis/resolution-and-stray-light/4/index.html]
- 109. 紫外可见分光光度计最佳吸光度范围和光谱带宽选择方法的 ... [https://www.instrument.com.cn/news/20220926/633222.shtml]
- 110. 基于多目标检测的深度学习智能光谱分析方法及系统 [https://patents.google.com/patent/CN110532901A/zh]
- 111. Device and method for fluorescence-based imaging and ... [https://patents.google.com/patent/CN104939806A/en]
- 112. Baseline Correction | Technical Note 119 [https://www.denovix.com/tn-119-baseline-correction/]
- 113. Principles of UV/vis spectroscopy (6) Baseline and blank [https://www.jasco-global.com/principle/principles-of-uv-vis-spectroscopy-6-baseline-and-blank/]
- 114. Accurate UV-Vis Spectrophotometer Blank Control [https://www.implen.com/uv-vis-spectrophotometer-blank-control/]
- 115. How do spectrophotometers use the blank? [https://www.ssi.shimadzu.com/service-support/faq/uv-vis/instrument-design/22/index.html]
- 116. Correcting Ultraviolet-Visible Spectra for Baseline Artifacts [https://www.sciencedirect.com/science/article/pii/S0022354923003350]
- 117. Adjusted blank correction method for UV–vis spectroscopic ... [https://www.sciencedirect.com/science/article/abs/pii/S1352231008011412]
- 118. Development and validation of UV-Visible ... [https://pmc.ncbi.nlm.nih.gov/articles/PMC3658078/]
- 119. UV-Visible Spectrophotometry: Introduction, Quantification, ... [https://www.intechopen.com/chapters/1201950]
- 120. 4.4: UV-Visible Spectroscopy [https://chem.libretexts.org/Bookshelves/Analytical_Chemistry/Physical_Methods_in_Chemistry_and_Nano_Science_(Barron)/04%3A_Chemical_Speciation/4.04%3A_UV-Visible_Spectroscopy]
- 121. What are the Right Environmental Conditions for My ... [https://www.datacolor.com/business-solutions/blog/right-environmental-conditions-spectrophotometer/]
- 122. Spectrophotometer Calibration and Validation Guide [https://aelabgroup.com/spectrophotometer-calibration-and-validation-guide/]
- 123. What is the UV-vis Calibration Spectrophotometer PQ Kit [https://www.mtc-usa.com/uvcal_1]
- 124. What is a Spectrophotometer? Working, Diagram, Types, ... [https://www.prestogroup.com/blog/what-is-a-spectrophotometer-working-diagram-types-and-practical-uses/]
- 125. Maintenance of UV-VIS Spectrophotometer & PM Kit [https://nexusanalyticals.com/maintenance-of-uv-vis-spectrophotometer-pm-kit/]
- 126. Instrument Validation and Inspection Methods [https://www.ssi.shimadzu.com/service-support/technical-support/analysis-basics/fundamentals-uv/validation.html]
- 127. UV-Visible Spectroscopy [https://www2.chemistry.msu.edu/faculty/reusch/virttxtjml/spectrpy/uv-vis/uvspec.htm]
- 128. Validation of UV-Vis spectrophotometric colorimetric ... [https://pubmed.ncbi.nlm.nih.gov/40366746/]
- 129. Innovative spectrophotometric methods for the analysis of ... [https://www.nature.com/articles/s41598-025-25067-4]
- 130. Introduction to Analytical Method Development and ... [https://www.labmanager.com/introduction-to-analytical-method-development-and-validation-33922]
- 131. The Hidden Risks in Analytical Method Validation - [https://pharmuni.com/2025/05/16/the-hidden-risks-in-analytical-method-validation/]
- 132. UV-Vis Spectrophotometer Features [https://www.thermofisher.com/us/en/home/industrial/spectroscopy-elemental-isotope-analysis/molecular-spectroscopy/uv-vis-spectrophotometry/features.html]
- 133. High-performance liquid chromatography [https://en.wikipedia.org/wiki/High-performance_liquid_chromatography]
- 134. High Performance Liquid Chromatography (HPLC) Basics [https://www.ssi.shimadzu.com/service-support/faq/liquid-chromatography/knowledge-base/hplc-basics/index.html]
- 135. The Essence of Modern HPLC: Advantages, Limitations ... [https://www.chromatographyonline.com/view/essence-modern-hplc-advantages-limitations-fundamentals-and-opportunities]
- 136. Comparison of UV spectrophotometry and high ... [https://pmc.ncbi.nlm.nih.gov/articles/PMC3658086/]
- 137. Comparison of Quantification Using UV-Vis, NMR, and ... [https://www.mdpi.com/1422-0067/26/14/6638]
- 138. Derivative Spectroscopy: Benefits in Analytical Techniques [https://www.pion-inc.com/blog/derivative-spectroscopy]
- 139. Derivative Spectrophotometric Method for Estimation of ... [https://pmc.ncbi.nlm.nih.gov/articles/PMC3846014/]
- 140. Four Derivative Spectrophotometric Methods for the ... [https://pmc.ncbi.nlm.nih.gov/articles/PMC3942328/]
- 141. First-order derivative spectrophotometric method for ... [https://www.sciencedirect.com/science/article/pii/S2772577424000077]
- 142. UV spectrophotometric methods for simultaneous ... [https://www.nature.com/articles/s41598-023-45378-8]
- 143. HPLC 2025 Preview: The Road To Sustainable Analytical ... [https://www.chromatographyonline.com/view/hplc-2025-preview-the-road-to-sustainable-analytical-chemistry]
- 144. Three-way analysis-based pH-UV-Vis spectroscopy for ... [https://pmc.ncbi.nlm.nih.gov/articles/PMC9261852/]
- 145. Selected new approaches and future perspectives in liquid ... [https://www.sciencedirect.com/science/article/pii/S0928098725001009]
- 146. Chromatography 2025: Sample Preparation Goes Automated [https://www.sepscience.com/chromatography-2025-sample-preparation-goes-automated-11259]
- 147. Limit of Blank, Limit of Detection and Limit of Quantitation [https://pmc.ncbi.nlm.nih.gov/articles/PMC2556583/]
- 148. Determining LOD and LOQ Based on the Calibration Curve [https://www.sepscience.com/hplc-solutions-126-chromatographic-measurements-part-5-determining-lod-and-loq-based-on-the-calibration-curve-6959]
- 149. Development and validation of a simple UV ... [https://www.sciencedirect.com/science/article/pii/S2095177912000834]
- 150. Strategy for determination of LOD and LOQ values [https://www.sciencedirect.com/science/article/abs/pii/S0039914013008710]
- 151. Robustness Tests [https://www.chromatographyonline.com/view/robustness-tests]
- 152. Guidance for robustness/ruggedness tests in method ... [https://www.sciencedirect.com/science/article/abs/pii/S073170850000529X]
- 153. Analytical Method Robustness → Term [https://fashion.sustainability-directory.com/term/analytical-method-robustness/]
- 154. 10.3 Different ways to evaluate robustness [https://sisu.ut.ee/lcms_method_validation/103-different-ways-evaluate-robustness/]
- 155. Application of UV dissolution imaging to pharmaceutical ... [https://www.sciencedirect.com/science/article/abs/pii/S0169409X21003422]
- 156. What is the difference between specificity and selectivity? [https://mpl.loesungsfabrik.de/en/english-blog/method-validation/specificity-selectivity]
- 157. UV Spectrophotometry as a Pharmaceutical Testing Solution [https://www.hunterlab.com/blog/uv-spectrophotometry-as-a-pharmaceutical-testing-solution/]
- 158. How does a spectrophotometer function? [https://www.ssi.shimadzu.com/service-support/faq/uv-vis/instrument-design/1/index.html]