UV-Vis Spectroscopy vs. HPLC for Drug Quantification: A Comprehensive Comparative Analysis for Scientists
This article provides a systematic comparison of Ultraviolet-Visible (UV-Vis) spectroscopy and High-Performance Liquid Chromatography (HPLC) for drug quantification, addressing the critical needs of researchers and drug development professionals.
UV-Vis Spectroscopy vs. HPLC for Drug Quantification: A Comprehensive Comparative Analysis for Scientists
Abstract
This article provides a systematic comparison of Ultraviolet-Visible (UV-Vis) spectroscopy and High-Performance Liquid Chromatography (HPLC) for drug quantification, addressing the critical needs of researchers and drug development professionals. We explore the foundational principles of both techniques, detail methodological applications across diverse pharmaceutical scenarios—from simple APIs to complex formulations and drug delivery systems—and offer practical troubleshooting guidance. The analysis extends to rigorous method validation parameters and a direct performance comparison, supported by recent case studies, to empower informed analytical method selection that balances accuracy, cost, and regulatory compliance.
Core Principles: Understanding the Fundamentals of UV-Vis and HPLC
Ultraviolet-Visible (UV-Vis) Spectroscopy is a fundamental analytical technique in pharmaceutical research, used to identify and quantify compounds based on their light absorption properties. For drug development professionals, the choice between UV-Vis and High-Performance Liquid Chromatography (HPLC) represents a critical decision point, balancing factors of speed, cost, and analytical precision. This guide objectively compares these methodologies within the context of drug quantification, providing experimental data and protocols to inform analytical strategy.
The Fundamental Principle: How UV-Vis Spectroscopy Works
UV-Vis spectroscopy measures the amount of ultraviolet (100-400 nm) or visible (400-800 nm) light absorbed by a chemical substance in solution [1] [2]. The core principle involves passing a beam of light through a sample and measuring the intensity of the transmitted light relative to the initial incident light.
When a molecule absorbs this light energy, electrons are promoted from a ground state to a higher energy excited state [1] [2]. The instrument, a spectrophotometer, consists of a light source, a monochromator to select specific wavelengths, a sample holder (cuvette), and a detector [1]. The resulting absorbance spectrum, a plot of absorbance versus wavelength, provides characteristic information about the electronic structure of the molecule [3].
The Beer-Lambert Law: The Foundation of Quantification
The quantitative power of UV-Vis spectroscopy rests almost entirely on the Beer-Lambert Law (also known as Beer's Law). This law establishes a linear relationship between the absorbance of a solution and the concentration of the absorbing species [4] [1].
The law is expressed by the equation: A = εcl
Where:
- A is the measured Absorbance (unitless) [4] [2].
- ε is the Molar Absorptivity (or extinction coefficient), a constant characteristic of the substance at a specific wavelength (M⁻¹cm⁻¹) [4].
- c is the Molar Concentration of the absorbing solute (M) [4] [1].
- l is the Path Length, the distance the light travels through the sample (cm) [4] [1].
This principle allows researchers to determine an unknown concentration by measuring absorbance, provided the molar absorptivity and path length are known [3]. In practice, a calibration curve is first constructed by plotting the absorbance of standard solutions of known concentration, with the slope of the linear curve being (εl) [4] [1].
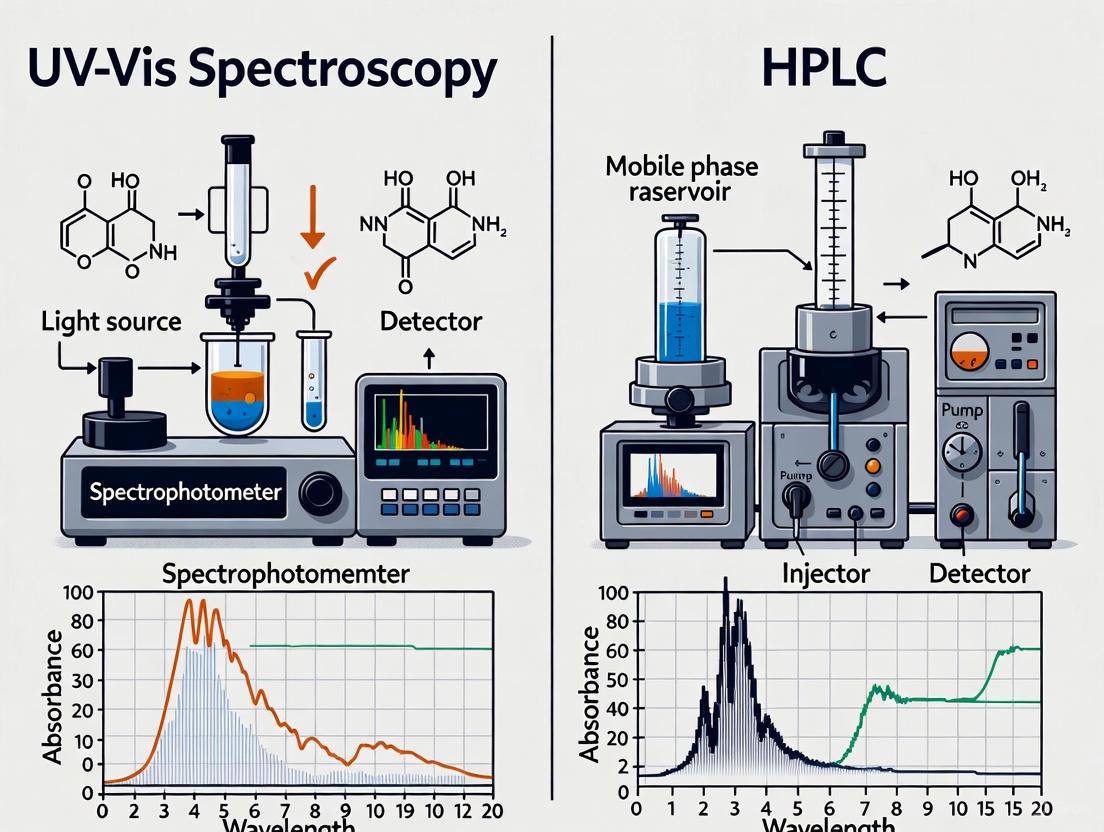
Figure 1: The UV-Vis Spectroscopy Workflow for Quantitative Analysis.
UV-Vis vs. HPLC: A Head-to-Head Comparison for Drug Analysis
While UV-Vis is often used as a stand-alone technique, it also serves as a common detector in HPLC systems. The choice between using a simple UV-Vis spectrophotometer versus a full HPLC system depends heavily on the analytical goals and sample complexity.
Table 1: Technical Comparison of UV-Vis Spectroscopy and HPLC for Drug Quantification
| Feature | UV-Vis Spectroscopy | High-Performance Liquid Chromatography (HPLC) |
|---|---|---|
| Principle of Analysis | Measures light absorption by chromophores [2]. | Separates components via liquid chromatography before detection (often by UV-Vis) [5] [6]. |
| Analytical Selectivity | Low; cannot distinguish multiple absorbers without chemometrics [1] [7]. | High; physically separates analytes, allowing individual quantification [5] [6]. |
| Sample Complexity | Best for simple, pure solutions or single analytes in a matrix [1]. | Ideal for complex mixtures (e.g., drug formulations, biological samples) [5] [8]. |
| Key Instrument Components | Light source, monochromator, cuvette, detector [1]. | Pump, injector, column, detector (e.g., UV-Vis) [5] [6]. |
| Analysis Speed | Very fast (seconds to minutes) [1]. | Slower due to separation step (minutes to tens of minutes) [6]. |
| Cost & Operational Complexity | Relatively inexpensive, simple to operate [1]. | Higher cost, requires more skilled operation and maintenance [7]. |
| Environmental Impact | Lower solvent consumption as a stand-alone technique [1]. | Higher consumption of organic solvents [7]. |
Supporting Experimental Data: Direct Method Comparisons
Independent studies directly comparing the two techniques for specific drug assays highlight the practical implications of their differences.
Table 2: Experimental Recovery Data for Levofloxacin from a Complex Drug-Delivery System [5] [8]
| Method | Spiked Concentration (µg/ml) | Mean Recovery Rate (%) | Standard Deviation |
|---|---|---|---|
| HPLC | 5 (Low) | 96.37 | ± 0.50 |
| 25 (Medium) | 110.96 | ± 0.23 | |
| 50 (High) | 104.79 | ± 0.06 | |
| UV-Vis | 5 (Low) | 96.00 | ± 2.00 |
| 25 (Medium) | 99.50 | ± 0.00 | |
| 50 (High) | 98.67 | ± 0.06 |
Table 3: Validation Parameters for the Analysis of Repaglinide in Tablets [6]
| Validation Parameter | UV-Vis Spectroscopy | HPLC |
|---|---|---|
| Linearity Range | 5 - 30 µg/ml | 5 - 50 µg/ml |
| Correlation Coefficient (R²) | > 0.999 | > 0.999 |
| Precision (% R.S.D.) | < 1.50 | < 1.50 |
| Mean Recovery | 99.63 - 100.45% | 99.71 - 100.25% |
Key Experimental Protocols from Cited Studies
1. Protocol for Levofloxacin Analysis in Composite Scaffolds [5] [8]
- Objective: Compare HPLC and UV-Vis for determining Levofloxacin released from mesoporous silica/nano-hydroxyapatite scaffolds.
- HPLC Method: A Sepax BR-C18 column was used with a mobile phase of 0.01 mol/L KH₂PO₄, methanol, and 0.5 mol/L tetrabutylammonium hydrogen sulphate (75:25:4). The flow rate was 1 ml/min, and detection was at 290 nm.
- UV-Vis Method: The standard solution of Levofloxacin was scanned from 200–400 nm to find the maximum absorption wavelength for quantification.
- Conclusion: For this complex drug-delivery system with potential interfering substances, HPLC was determined to be the preferred and more accurate method.
2. Protocol for Repaglinide Analysis in Tablets [6]
- Objective: Develop and validate simple, fast UV-Vis and HPLC methods for quality control of repaglinide tablets.
- UV-Vis Method: The drug was dissolved in methanol, and absorbance was measured at 241 nm.
- HPLC Method: An Agilent TC-C18 column was used with an isocratic mobile phase of methanol and water (80:20 v/v, pH 3.5). The flow rate was 1.0 ml/min with detection at 241 nm.
- Conclusion: Both methods were found reliable for the quality control of the drug in pharmaceutical formulations, demonstrating that for simpler matrices like tablets, UV-Vis can be sufficient.
Advanced UV-Vis Techniques: Overcoming Limitations
The primary limitation of UV-Vis—poor selectivity in mixtures—can be addressed using chemometric models. A 2025 study on quantifying antibiotics clofazimine (CLZ) and dapsone (DAP) in a combined leprosy therapy used Partial Least Squares (PLS) and Multivariate Curve Resolution with Alternating Least Squares (MCR-ALS) to analyze overlapping UV-Vis spectra [7]. This approach successfully handled the sample matrix effect and interferents, offering a greener and faster alternative to HPLC for this specific application while maintaining reliability.
The Scientist's Toolkit: Essential Research Reagents and Materials
Table 4: Key Reagents and Materials for UV-Vis and HPLC Drug Analysis
| Item | Function/Description | Example Use Case |
|---|---|---|
| Cuvette | A transparent container (typically with 1 cm path length) for holding liquid samples during analysis [1] [3]. | Standard sample holder in UV-Vis spectrophotometry. |
| Methanol & Acetonitrile (HPLC Grade) | High-purity organic solvents used to prepare mobile phases and standard/sample solutions [5] [6] [9]. | Ensures minimal background interference in HPLC and UV-Vis analysis. |
| C18 Chromatography Column | A reverse-phase column packed with octadecylsilane; the stationary phase for separating compounds in HPLC [5] [6]. | Critical for the physical separation of drug components in a mixture during HPLC. |
| Simulated Body Fluid (SBF) | A buffer solution that mimics the ionic composition of human blood plasma [5] [8]. | Used in drug release studies from scaffolds or implants to simulate in-vivo conditions. |
| Standard Reference Compound | A high-purity sample of the analyte drug used for calibration and method validation [5] [6]. | Essential for creating accurate calibration curves in both HPLC and UV-Vis. |
Figure 2: A Decision Framework for Selecting Between UV-Vis and HPLC.
UV-Vis spectroscopy, grounded in the robust Beer-Lambert Law, is a powerful, simple, and cost-effective tool for drug quantification, particularly for pure samples or simple formulations. However, HPLC provides superior selectivity and accuracy for complex mixtures, such as those found in novel drug-delivery systems or biological matrices. The choice is not a matter of which technique is universally better, but which is more appropriate for the specific analytical challenge, weighing the need for speed and simplicity against the demands of selectivity and precision in pharmaceutical research.
High-Performance Liquid Chromatography (HPLC) is a powerful analytical technique used to separate, identify, and quantify components in a mixture. This separation is achieved by exploiting the differential interactions of sample components with a stationary phase (a solid packing material inside a column) and a mobile phase (a liquid solvent pumped through the system under high pressure) [10] [11]. The fundamental principle is straightforward: components that interact more strongly with the stationary phase are retained longer in the column and thus have longer retention times, while components with greater affinity for the mobile phase elute more quickly [10] [12]. The advent of HPLC revolutionized analytical chemistry by providing high-resolution separations for compounds that are non-volatile, thermally unstable, or have high molecular weights, making it indispensable in pharmaceutical, environmental, and biological research [13] [11].
Core Principles of HPLC Separation
The Separation Mechanism
At its heart, HPLC is a mass transfer process involving adsorption and/or partition [11]. The separation occurs inside a column packed with fine particles of the stationary phase. When a sample mixture is introduced into the flowing mobile phase, its individual components are carried into the column. Each component then partitions between the stationary and mobile phases based on its chemical nature and the affinity it has for each phase [10] [11]. This continuous partitioning process, combined with the high pressure used to force the mobile phase through the tightly packed column, results in highly efficient separation. The high operational pressure (typically 50–1400 bar) is a defining characteristic of HPLC, setting it apart from traditional liquid chromatography and enabling the use of much smaller stationary phase particles for superior resolution [11].
Primary HPLC Separation Modes
The specific chemical interactions governing separation depend on the selected mode of HPLC. The most common modes are summarized in the table below.
Table 1: Common HPLC Separation Modes and Their Principles
| Separation Mode | Primary Interaction | Stationary Phase | Mobile Phase | Typical Applications |
|---|---|---|---|---|
| Reversed-Phase (RP) [10] [13] | Hydrophobicity | Non-polar (e.g., C18) | Polar (e.g., water, methanol, acetonitrile) | Small molecule pharmaceuticals, vitamins [10] |
| Normal-Phase (NP) [10] [12] | Hydrophilicity / Polarity | Polar (e.g., silica, diol) | Non-polar organic solvents | Saccharides, nucleic acids [10] |
| Ion-Exchange (IEX) [10] [13] | Electrostatic / Charge | Charged functional groups | Aqueous buffers with varying pH and ionic strength | Inorganic ions, amino acids, proteins [10] |
| Size-Exclusion (SEC) [10] [13] | Molecular Size | Porous particles | Aqueous or organic solvents | Synthetic polymers, biopolymers [10] |
| Hydrophilic Interaction (HILIC) [14] | Partitioning into water-rich layer | Hydrophilic (e.g., amide, zwitterionic) | High concentration of organic solvent in water | Polar compounds, small organic acids, basic drugs [14] |
Reversed-Phase Chromatography (RPC) is the most widely used mode, particularly for small molecules. It separates compounds based on hydrophobicity, with more non-polar compounds retaining longer on the non-polar stationary phase [10]. In contrast, Normal-Phase Chromatography (NPC) utilizes a polar stationary phase and is better suited for separating polar compounds [10] [12]. Hydrophilic Interaction Liquid Chromatography (HILIC) is a variant that acts as a "reverse normal-phase" mode; it uses a hydrophilic stationary phase with a mobile phase containing a high proportion (e.g., 50-95%) of an organic solvent like acetonitrile. HILIC is particularly valuable for retaining and separating highly polar compounds that elute too quickly in RPC [14].
HPLC in Practice: Instrumentation and Workflow
Key System Components
A standard HPLC system consists of several integrated components designed to deliver precision and reproducibility [13].
- Pump: Delivers the mobile phase at a constant, high pressure and controlled flow rate. Many systems feature gradient pumps that can mix solvents to create a changing mobile phase composition over time [11].
- Injector: Introduces a precise, small volume of the sample mixture into the high-pressure mobile phase stream [13].
- Column: The heart of the separation, typically a stainless-steel tube packed with micron-scale particles coated with the stationary phase. Column chemistry (e.g., C18, silica, ion-exchange) is selected based on the application [10] [13].
- Detector: Monitors the eluting stream from the column, generating a signal when a component is present. Common detectors include UV-Vis (measuring light absorbance), fluorescence, and mass spectrometry (MS) [13] [11].
- Data System: A computer and software that control the instrument, acquire data from the detector, and process the resulting chromatogram for qualitative and quantitative analysis [15].
The following diagram illustrates the logical flow and key components of a generic HPLC system.
The Researcher's Toolkit: Essential Reagents and Materials
Successful HPLC analysis requires careful selection of consumables and reagents. The following table details key items used in a typical HPLC experiment.
Table 2: Essential Research Reagent Solutions and Materials for HPLC
| Item | Function / Description | Example from Literature |
|---|---|---|
| Stationary Phase Columns | The medium where separation occurs; choice dictates separation mechanism (e.g., C18 for reversed-phase). | Sepax BR-C18 column [8]; Atlantis columns for polar compounds [16]. |
| HPLC-Grade Solvents | High-purity solvents (e.g., water, methanol, acetonitrile) used to prepare the mobile phase; minimize background noise. | Methanol (HPLC-grade) used in mobile phase for analysis [8] [17]. |
| Buffer Salts | Added to mobile phase to control pH and ionic strength, critical for separating ionizable compounds. | Potassium dihydrogen phosphate (KH₂PO₄), Tetrabutylammonium hydrogen sulphate [8]. |
| Analytical Standards | Pure reference compounds used to identify analytes by retention time and to create calibration curves for quantitation. | Levofloxacin standard from National Institutes for Food and Drug Control [8]. |
| Internal Standards | A known compound added to the sample to correct for variability during sample preparation and injection. | Ciprofloxacin used as an internal standard in levofloxacin analysis [8]. |
HPLC vs. UV-Vis Spectroscopy for Drug Quantification: An Experimental Comparison
Fundamental Differences in Principle
While both HPLC and Ultraviolet-Visible (UV-Vis) Spectroscopy can be used for drug quantification, their underlying principles are fundamentally different. UV-Vis spectroscopy measures the absorbance of light by a sample at specific wavelengths, providing a single, collective measurement for all absorbing species in a solution. It cannot distinguish between individual compounds in a mixture without prior separation [8]. In contrast, HPLC is primarily a separation technique that physically resolves the components of a mixture. Each pure component is then quantified as it elutes from the column, typically using a UV-Vis detector itself. This combination of separation and detection is what gives HPLC its superior specificity for complex samples [8] [11].
Quantitative Experimental Comparison: Levofloxacin Analysis
A direct comparison of HPLC and UV-Vis for quantifying Levofloxacin released from a novel drug-delivery system (mesoporous silica microspheres/nano-hydroxyapatite composite scaffolds) highlights the practical performance differences [8].
Table 3: Quantitative Comparison of HPLC and UV-Vis for Levofloxacin Analysis
| Parameter | HPLC Method | UV-Vis Method |
|---|---|---|
| Regression Equation | y = 0.033x + 0.010 [8] | y = 0.065x + 0.017 [8] |
| Coefficient of Determination (R²) | 0.9991 [8] | 0.9999 [8] |
| Recovery Rate (Low Conc.) | 96.37 ± 0.50% [8] | 96.00 ± 2.00% [8] |
| Recovery Rate (Medium Conc.) | 110.96 ± 0.23% [8] | 99.50 ± 0.00% [8] |
| Recovery Rate (High Conc.) | 104.79 ± 0.06% [8] | 98.67 ± 0.06% [8] |
| Key Advantage | Accurate in complex matrices; separates target drug from excipients and impurities. | Simpler and faster for pure solutions. |
The experimental data demonstrates that while UV-Vis can exhibit excellent linearity (R²=0.9999), its accuracy can be compromised in complex sample matrices. The HPLC method provided more consistent and accurate recovery rates across concentrations, especially at the medium level where its recovery was closer to the true value. The study concluded that UV-Vis measurement is not accurate for determining drug concentration loaded on biodegradable composite scaffolds due to impurity interference, and that HPLC is the preferred method for evaluating the sustained release characteristics of Levofloxacin [8].
Detailed Experimental Protocols
- Objective: To accurately determine the concentration of Levofloxacin released from a composite scaffold in simulated body fluid.
- Chromatographic Conditions:
- Column: Sepax BR-C18 (250 × 4.6 mm, 5 µm particle size).
- Mobile Phase: A mixture of 0.01 mol/L KH₂PO₄, methanol, and 0.5 mol/L tetrabutylammonium hydrogen sulphate in a ratio of 75:25:4.
- Flow Rate: 1.0 mL/min.
- Column Temperature: 40°C.
- Detection Wavelength: 290 nm.
- Injection Volume: 10 µL.
- Sample Preparation:
- The sample solution is mixed with an internal standard (Ciprofloxacin).
- The mixture is vortexed for 5 minutes.
- Dichloromethane is added for liquid-liquid extraction, followed by another 5 minutes of vortexing.
- The solution is centrifuged at 7,155 × g for 5 minutes.
- The supernatant is extracted, dried under nitrogen in a 50°C water bath, and reconstituted for injection.
- Quantitation: A calibration curve is constructed using levofloxacin standards, and sample concentrations are calculated based on peak areas.
- Objective: To determine the concentration of Levofloxacin via direct absorbance measurement.
- Instrument Setup:
- Instrument: UV-Vis Spectrophotometer.
- Wavelength Scan: 200–400 nm to identify the maximum absorption wavelength (λmax) for Levofloxacin.
- Procedure:
- Standard solutions of Levofloxacin are prepared at known concentrations (e.g., 5, 25, and 50 µg/mL).
- The absorbance of each standard is measured at the predetermined λmax.
- A calibration curve is plotted (Absorbance vs. Concentration).
- The absorbance of the unknown sample is measured and its concentration is interpolated from the calibration curve.
The decision-making process for selecting the appropriate analytical technique is summarized below.
Advanced HPLC Techniques and Applications
Technological Advancements
HPLC technology continues to evolve, leading to more powerful and efficient techniques.
- Ultra-High-Performance Liquid Chromatography (UHPLC): UHPLC utilizes columns packed with smaller particles (typically less than 2 µm) and operates at significantly higher pressures. This results in faster analysis times, higher resolution, and increased sensitivity compared to conventional HPLC [13] [16].
- Multidimensional HPLC (2D-LC): This technique couples two independent separation mechanisms (e.g., reversed-phase and ion-exchange) to dramatically increase peak capacity for extremely complex mixtures. It is particularly valuable in proteomics and metabolomics research [13].
Representative Applications in Research
HPLC's versatility is demonstrated by its wide range of applications. In pharmaceutical analysis, it is used for purity testing, stability studies, and drug formulation validation [13]. A specific example is the quality control of fermented Cordyceps sinensis products, where HPLC fingerprints combined with quantitative analysis of multiple nucleosides (e.g., uracil, uridine, adenosine) are used to differentiate between samples and ensure consistent quality [17]. In environmental testing, HPLC enables the detection and quantification of pollutants like pesticides and pharmaceuticals in water and soil [13]. Furthermore, specialized software tools like HappyTools have been developed to enable high-throughput, automated processing of HPLC data, facilitating large-scale clinical and biopharmaceutical studies [15].
In pharmaceutical research, the accurate quantification of active pharmaceutical ingredients (APIs) and the assessment of drug delivery systems are fundamental to drug development and quality control. Among the plethora of analytical techniques available, Ultraviolet-Visible (UV-Vis) Spectroscopy and High-Performance Liquid Chromatography (HPLC) stand as two cornerstone methodologies. While both techniques leverage the principle of light absorption by molecules, their instrumental complexity, applications, and performance characteristics differ significantly.
UV-Vis spectroscopy is an analytical technique that measures the amount of discrete wavelengths of UV or visible light absorbed by a sample in comparison to a reference [18] [19]. Its simplicity and speed make it attractive for direct concentration measurements. HPLC, conversely, is a separation technique that resolves complex mixtures before detection, most commonly using a UV-Vis based detector [20] [21]. This fundamental difference—direct analysis versus separation followed by analysis—dictates their respective roles in the laboratory. This guide provides an objective, data-driven comparison of their instrumentation and performance to help researchers select the appropriate tool for drug quantification research.
Core Instrumentation Compared
The architectures of UV-Vis spectrophotometers and HPLC systems with UV detectors reveal their different purposes: one is designed to measure bulk absorption, the other to monitor separated analytes.
UV-Vis Spectrophotometry: A Direct Absorption Measurement
A UV-Vis spectrophotometer functions by passing a beam of light through a sample and measuring the intensity of the transmitted light [18] [19]. Its key components work in sequence as shown in Figure 1 and include:
- Light Source: Typically, a combination of a deuterium lamp (for the UV region, 190-380 nm) and a tungsten or halogen lamp (for the visible region, 380-900 nm) [18] [22]. The instrument switches between sources during a scan.
- Wavelength Selector (Monochromator): This critical component uses a diffraction grating to disperse the broad-spectrum light and select a specific, narrow band of wavelengths to pass through the sample [18] [19]. This ensures that the measured absorption is specific to a chosen wavelength.
- Sample Compartment: The sample, typically dissolved in a suitable solvent, is held in a cuvette with a standard path length of 1 cm. For UV light, quartz cuvettes are essential as they are transparent to UV radiation, unlike glass or plastic [18] [19].
- Detector: The transmitted light is converted into an electrical signal by a detector. Common types include Photomultiplier Tubes (PMTs), which are highly sensitive for low-light detection, and semiconductor-based photodiodes or Charge-Coupled Devices (CCDs) [18] [19].
The following diagram illustrates the streamlined workflow of a UV-Vis spectrophotometer.
HPLC-UV: Separation Followed by Detection
An HPLC system is more complex, as its primary goal is to separate the components of a mixture before they reach the detector. The key modules are [20] [21]:
- Pump: Delivers a constant, high-pressure flow of the mobile phase (solvent).
- Injector: Introduces the sample mixture into the mobile phase stream.
- Chromatography Column: The heart of the system, where the separation of analytes occurs based on their chemical interactions with the stationary phase.
- UV Detector: After separation, the analytes pass through a flow cell, where a UV-Vis detection system measures their absorption. Two main types of UV detectors are prevalent:
- Variable Wavelength Detector (VWD): Uses a monochromator to select a single, specific wavelength to pass through the flow cell. This offers high sensitivity for targeted analysis [20] [21].
- Diode Array Detector (DAD or PDA): Passes a broad spectrum of light through the flow cell, then disperses it onto an array of photodiodes. This allows for the simultaneous collection of all wavelengths, enabling spectral analysis and peak purity assessment for each separated compound [20] [22] [23].
The sequential process of an HPLC system, highlighting the detector's role, is shown in Figure 2.
Performance Comparison in Drug Analysis
The theoretical differences in instrumentation translate directly into practical performance outcomes. A comparison of experimental data from peer-reviewed studies clearly illustrates the strengths and limitations of each technique.
Table 1: Experimental Comparison of UV-Vis and HPLC for Drug Quantification
| Performance Metric | UV-Vis Spectroscopy | HPLC with UV Detection |
|---|---|---|
| Application Context | Direct measurement of Levofloxacin released from composite scaffolds [8] [5] | Direct measurement of Levofloxacin released from composite scaffolds [8] [5] |
| Linear Range | 0.05 - 300 µg/mL [8] [5] | 0.05 - 300 µg/mL [8] [5] |
| Recovery (Low Conc.) | 96.00% ± 2.00 [8] [5] | 96.37% ± 0.50 [8] [5] |
| Recovery (Medium Conc.) | 99.50% ± 0.00 [8] [5] | 110.96% ± 0.23 [8] [5] |
| Recovery (High Conc.) | 98.67% ± 0.06 [8] [5] | 104.79% ± 0.06 [8] [5] |
| Key Limitation | Inaccurate in complex matrices due to impurity interference [8] [5] | Accurate for complex matrices due to separation power [8] [5] |
| Application Context | Repaglinide in tablet dosage form [6] | Repaglinide in tablet dosage form [6] |
| Linearity (R²) | > 0.999 [6] | > 0.999 [6] |
| Precision (% RSD) | < 1.50% [6] | Better than UV method [6] |
| Key Advantage | Simple, fast, and economical [6] | Highly precise and robust for quality control [6] |
Interpretation of Comparative Data
The data in Table 1 reveals a clear trend:
HPLC Offers Superior Specificity and Accuracy in Complex Matrices: The study on Levofloxacin highlights a critical limitation of UV-Vis. While both methods showed good linearity, the recovery rates for HPLC were closer to 100% and more consistent across concentration levels, especially at medium and high concentrations. The study concluded that UV-Vis was inaccurate for measuring drug release from the composite scaffolds because it could not distinguish the Levofloxacin signal from interfering substances in the complex scaffold matrix. HPLC's separation power eliminated this problem [8] [5].
UV-Vis is a Viable Option for Simple Mixtures: The Repaglinide study demonstrates that for a relatively simple matrix like a tablet formulation, UV-Vis can perform well, with excellent linearity and acceptable precision. This makes it a suitable, cost-effective option for routine quality control of raw materials or simple formulations where interference from other components is minimal [6].
Essential Research Toolkit
Selecting the correct materials and reagents is fundamental to the success of any analytical method. The following table details key components and their functions for both techniques.
Table 2: Essential Research Reagents and Materials
| Item | Function / Description | Critical Consideration |
|---|---|---|
| HPLC-Grade Solvents | High-purity solvents (e.g., methanol, acetonitrile, water) used as the mobile phase to dissolve samples and elute the column [8] [6]. | Minimizes UV-absorbing impurities that cause high background noise and baseline drift [24]. |
| UV-Vis Cuvettes | Container for holding liquid samples during analysis in a UV-Vis spectrophotometer. | Must be quartz for UV range analysis (below ~350 nm); glass or plastic can only be used for visible light measurements [18] [19]. |
| HPLC Column | The core component where chemical separation occurs. Typically a reverse-phase C18 column [8] [6]. | Column chemistry, length, and particle size must be selected based on the analytes of interest for optimal separation. |
| Standard Compounds | Highly purified analytes used for calibration and method validation [8] [6]. | Essential for accurate quantification. Purity should be certified and traceable. |
| Buffers & Additives | (e.g., Phosphate buffers, tetrabutylammonium salts) Modify the mobile phase to control pH and ionic strength, improving separation and peak shape [24] [8]. | The UV "cut-off" wavelength of the buffer must be considered to avoid background absorption at the detection wavelength [24]. |
Experimental Protocols for Method Comparison
To empirically compare the performance of UV-Vis and HPLC for a specific drug, a researcher can implement the following protocols, adapted from the literature [8] [6].
Sample Preparation Protocol
- Standard Stock Solution: Accurately weigh the drug reference standard and dissolve it in an appropriate solvent (e.g., methanol or the mobile phase) to prepare a stock solution of known concentration (e.g., 1000 µg/mL).
- Calibration Standards: Dilute the stock solution serially to prepare a series of standard solutions covering the expected concentration range (e.g., 5-50 µg/mL).
- Sample Solution: For a tablet formulation, weigh and powder tablets. Dissolve a portion of the powder equivalent to the drug's label claim in solvent, sonicate, filter, and dilute to the required concentration.
UV-Vis Spectroscopy Method
- Instrument Calibration: Use a blank solvent to zero the spectrophotometer.
- Wavelength Selection: Scan a standard solution to identify the wavelength of maximum absorption (λmax) for the drug.
- Measurement: Measure the absorbance of each calibration standard and the sample solution at the predetermined λmax.
- Quantification: Construct a calibration curve of absorbance versus concentration and use the linear regression equation to determine the concentration in the sample [6].
HPLC-UV Method
- Chromatographic Conditions:
- Column: C18 (250 x 4.6 mm, 5 µm)
- Mobile Phase: Methanol:Water (e.g., 80:20 v/v, pH optionally adjusted with orthophosphoric acid)
- Flow Rate: 1.0 mL/min
- Detection Wavelength: As determined from the drug's UV spectrum (e.g., 241 nm for Repaglinide, 290 nm for Levofloxacin)
- Injection Volume: 20 µL [8] [6]
- Analysis: Inject each calibration standard and the sample solution.
- Quantification: Construct a calibration curve of peak area versus concentration and use the linear regression equation to determine the concentration in the sample.
The choice between UV-Vis spectroscopy and HPLC for drug quantification is not a matter of which instrument is universally superior, but which is fit-for-purpose.
- UV-Vis Spectrophotometry is an excellent tool for rapid, cost-effective analysis of pure substances or simple mixtures where specificity is not a concern. Its simplicity and speed are its greatest assets.
- HPLC with UV detection is the indispensable choice for complex mixtures, such as drug release studies from sophisticated delivery scaffolds, stability-indicating methods, or purity assays. Its power to separate before detection provides unmatched specificity and accuracy, which is non-negotiable in rigorous pharmaceutical research and regulatory quality control.
Researchers must base their selection on the sample complexity, required specificity, and the goals of the analysis. When results from a simple UV-Vis method seem inconsistent, the presence of interfering compounds should be suspected, and the superior separation capability of HPLC should be employed to verify the findings.
Inherent Strengths and Limitations of Each Technique
In the field of pharmaceutical analysis, the selection of an appropriate analytical technique is a critical decision that directly impacts the accuracy, efficiency, and cost-effectiveness of drug quantification research. Ultraviolet-Visible (UV-Vis) spectroscopy and High-Performance Liquid Chromatography (HPLC) represent two foundational methodologies with distinct operational principles and application domains. UV-Vis spectroscopy measures the absorption of ultraviolet or visible light by analytes, providing a straightforward approach to quantification based on the Beer-Lambert law [19]. In contrast, HPLC separates complex mixtures using a pressurized liquid mobile phase and a stationary phase, followed by detection of individual components, typically using UV-Vis detectors among other options [25]. This article provides a systematic comparison of these techniques, examining their inherent strengths and limitations through experimental data and methodological considerations to guide researchers and drug development professionals in selecting the optimal approach for specific analytical challenges.
Fundamental Principles and Instrumentation
UV-Vis Spectroscopy
UV-Vis spectroscopy operates on the principle that molecules absorb specific wavelengths of light in the ultraviolet (100-400 nm) and visible (400-780 nm) regions of the electromagnetic spectrum. When light passes through a sample, the amount of absorption at characteristic wavelengths provides quantitative information about the analyte concentration based on the Beer-Lambert law, which states that absorbance is proportional to concentration, path length, and a compound-specific molar absorptivity coefficient [19]. A typical UV-Vis spectrophotometer consists of a light source (often combining deuterium and tungsten/halogen lamps), a wavelength selection component (monochromator or filters), a sample holder, and a detector (such as a photomultiplier tube or photodiode) [19].
High-Performance Liquid Chromatography
HPLC is a separation technique that resolves complex mixtures into individual components through differential partitioning between a liquid mobile phase and a stationary phase packed into a column. The separated analytes then pass through a detector for identification and quantification. Various detectors are available for HPLC systems, with UV-Vis detectors being among the most common due to their versatility and reliability for many pharmaceutical compounds [25]. Other detector options include photodiode array (PDA) detectors, which capture absorbance across multiple wavelengths simultaneously; fluorescence detectors for compounds with natural fluorescence or those that can be derivatized; refractive index detectors for universal detection; mass spectrometry for structural identification; and conductivity detectors for ionic species [25].
Experimental Comparison in Pharmaceutical Analysis
Method Development and Validation Protocols
To objectively compare the performance of UV-Vis spectroscopy and HPLC for drug quantification, we examine experimental protocols and validation data from studies that applied both techniques to the same pharmaceutical compounds.
For UV-Vis analysis of repaglinide, the methodology involved preparing standard stock solutions in methanol, with further dilutions to achieve concentrations ranging from 5-30 μg/mL. Absorbance was measured at 241 nm using a Shimadzu 1700 Double beam UV-Vis spectrophotometer with 1.0-cm quartz cells [6].
For HPLC analysis of repaglinide, researchers used an Agilent 1120 Compact LC system with a TC-C18 column (250 mm × 4.6 mm, 5 μm particle size). The mobile phase consisted of methanol and water (80:20 v/v, pH adjusted to 3.5 with orthophosphoric acid) at a flow rate of 1.0 mL/min. Detection was performed at 241 nm, with injection volume of 20 μL and a linearity range of 5-50 μg/mL [6].
Both methods were validated according to International Conference on Harmonisation (ICH) guidelines, assessing parameters including linearity, precision, accuracy, specificity, and detection limits [6].
Table 1: Validation Parameters for Repaglinide Analysis Using UV-Vis and HPLC Methods
| Validation Parameter | UV-Vis Method | HPLC Method |
|---|---|---|
| Linearity range | 5-30 μg/mL | 5-50 μg/mL |
| Correlation coefficient (r²) | >0.999 | >0.999 |
| Precision (% RSD) | <1.50% | <1.50% |
| Accuracy (% Recovery) | 99.63-100.45% | 99.71-100.25% |
| Detection Limit | Based on standard deviation of y-intercept and slope | Based on standard deviation of y-intercept and slope |
Comparative Case Study: Levofloxacin Analysis
A direct comparison of HPLC and UV-Vis spectroscopy for determining Levofloxacin released from mesoporous silica microspheres/nano-hydroxyapatite composite scaffolds revealed significant methodological differences. The regression equation for HPLC was y=0.033x+0.010 (R²=0.9991), while for UV-Vis it was y=0.065x+0.017 (R²=0.9999) [8].
Recovery rates at low, medium, and high concentrations (5, 25, and 50 μg/mL) demonstrated notable differences between the techniques:
Table 2: Recovery Rates for Levofloxacin Determination Using HPLC and UV-Vis Methods
| Concentration Level | HPLC Recovery Rate | UV-Vis Recovery Rate |
|---|---|---|
| Low (5 μg/mL) | 96.37 ± 0.50% | 96.00 ± 2.00% |
| Medium (25 μg/mL) | 110.96 ± 0.23% | 99.50 ± 0.00% |
| High (50 μg/mL) | 104.79 ± 0.06% | 98.67 ± 0.06% |
The study concluded that UV-Vis provided less accurate measurements for drugs loaded on biodegradable composite scaffolds, likely due to interference from scaffold components, and recommended HPLC as the preferred method for evaluating sustained release characteristics in such complex systems [8].
Inherent Strengths and Limitations
UV-Vis Spectroscopy
Strengths:
- Simplicity and ease of use: UV-Vis spectrophotometers are generally straightforward to operate with minimal training requirements [19].
- Rapid analysis: Measurements can be performed quickly, often in minutes, making the technique suitable for high-throughput applications [6].
- Cost-effectiveness: Both initial equipment investment and ongoing maintenance costs are typically lower than HPLC systems [26] [19].
- Minimal solvent consumption: The technique requires small sample volumes and generates little waste compared to chromatographic methods [27].
Limitations:
- Limited selectivity for complex mixtures: UV-Vis spectroscopy cannot resolve individual components in mixtures without prior separation, as it provides only a composite spectrum of all absorbing species [19].
- Interference susceptibility: Excipients, impurities, or formulation additives can interfere with absorbance measurements, compromising accuracy [8] [25].
- Structural requirements: Analytes must contain chromophores (aromatic rings, conjugated systems) that absorb in the UV-Vis range [25] [19].
- Dynamic range constraints: For accurate quantification, absorbance values should generally be kept below 1, which may require sample dilution and additional preparation steps [19].
High-Performance Liquid Chromatography
Strengths:
- High selectivity and resolution: HPLC can separate complex mixtures into individual components, enabling precise quantification of specific analytes even in the presence of interfering substances [6] [25].
- Excellent sensitivity: With appropriate detectors, HPLC can achieve very low detection limits, often in the nanogram or picogram range [25].
- Versatility: Various detector options (UV-Vis, PDA, fluorescence, MS) and column chemistries allow method customization for diverse analytical needs [25].
- Robust quantification in complex matrices: HPLC effectively handles samples with multiple components, such as biological fluids or formulated products, with minimal interference [8].
Limitations:
- Higher complexity and cost: HPLC systems require significant financial investment, specialized training, and regular maintenance [25].
- Time-consuming method development: Optimizing separation parameters (mobile phase composition, column type, gradient profile) can be labor-intensive [27].
- Substantial solvent consumption: HPLC methods typically use significant volumes of high-purity solvents, generating waste that requires proper disposal [27].
- Longer analysis times: Chromatographic separations often require more time than direct spectroscopic measurements [6].
Advanced Applications and Hybrid Approaches
Chemometrics-Enhanced UV-Vis Spectroscopy
To address the limitation of spectral overlap in mixtures, advanced chemometric approaches have been successfully applied to UV-Vis spectroscopy. Researchers developed a method for simultaneous determination of propranolol, rosuvastatin, and valsartan in ternary mixtures using UV-Vis spectroscopy coupled with artificial neural networks (ANN) [27]. The firefly algorithm was used as a variable selection procedure to optimize ANN models, resulting in improved predictive performance with lower relative root mean square error of prediction values compared to full-spectrum ANN models [27]. This approach maintained the simplicity and cost advantages of UV-Vis spectroscopy while overcoming its traditional limitation in analyzing multi-component mixtures.
HPLC with Advanced Detection Technologies
The combination of HPLC separation with sophisticated detectors significantly expands analytical capabilities. Photodiode array detectors enable peak purity assessment by capturing complete spectra of eluting compounds [25]. Mass spectrometry detectors provide structural information through mass-to-charge ratios, enabling definitive compound identification [25]. Such hybrid approaches deliver both the separation power of chromatography and the identification capability of spectroscopic techniques, making them invaluable for impurity profiling, metabolite identification, and complex formulation analysis.
Research Reagent Solutions and Essential Materials
Table 3: Key Research Reagents and Materials for UV-Vis and HPLC Analysis
| Item | Function/Purpose | Example Specifications |
|---|---|---|
| HPLC-grade solvents | Mobile phase preparation; sample dissolution | Low UV absorbance; high purity (e.g., methanol, acetonitrile, water) [6] |
| Buffer salts | Mobile phase pH control | Orthophosphoric acid for pH adjustment [6] |
| Stationary phases | Chromatographic separation | C18 columns (250 mm × 4.6 mm, 5 μm) [6] |
| Reference standards | Method calibration and validation | High-purity authenticated compounds [6] |
| Spectroscopic cells | Sample holder for UV-Vis | Quartz cuvettes (1 cm path length) for UV transparency [19] |
| Filters | Sample clarification | 0.45 μm syringe filters for particulate removal [6] |
| Internal standards | Quantification reference | Certified reference materials [8] |
Workflow and Application Decision Framework
The following diagram illustrates the fundamental operational workflows for both techniques and their relationship to application suitability:
Both UV-Vis spectroscopy and HPLC offer distinct advantages for drug quantification research, with their suitability dependent on specific analytical requirements. UV-Vis spectroscopy provides a rapid, cost-effective solution for routine analysis of single components or simple mixtures, particularly when resources are limited or high throughput is essential. In contrast, HPLC delivers superior selectivity and sensitivity for complex mixtures, stability studies, and impurity profiling, despite requiring greater instrumental investment and methodological expertise. The emerging trend of combining HPLC separation with sophisticated detection technologies, alongside chemometrics-enhanced UV-Vis spectroscopy, continues to expand the capabilities of both techniques. Researchers should base their selection on comprehensive consideration of factors including sample complexity, required sensitivity, available resources, and analytical objectives to optimize their pharmaceutical analysis outcomes.
Practical Deployment: Selecting and Applying Methods for Real-World Drug Analysis
For researchers and drug development professionals selecting analytical methods, the choice between Ultraviolet-Visible (UV-Vis) spectroscopy and High-Performance Liquid Chromatography (HPLC) represents a fundamental trade-off between speed, cost, and simplicity versus separation power, specificity, and ability to handle complex mixtures.
The following table summarizes the core characteristics of each technique:
| Feature | UV-Vis Spectroscopy | HPLC |
|---|---|---|
| Core Principle | Measures light absorption by molecules at specific wavelengths [19] | Separates components in a mixture via a column before detection [28] [29] |
| Analysis Speed | Very fast (seconds to minutes) [30] [31] | Slower (minutes to tens of minutes) [32] [28] |
| Cost | Lower instrument and operational costs [31] | Higher initial investment and running costs [32] [28] |
| Sample Preparation | Minimal; often just dissolution or dilution [19] [33] | Can be extensive; may require derivatization, filtration [28] |
| Specificity | Lower; can struggle with spectrally overlapping compounds [31] [33] | High; separates analytes from impurities and excipients [28] [29] |
| Primary Use Case | Quantification of pure analytes or simple mixtures [30] [34] | Complex mixture analysis, impurity profiling, stability studies [28] [29] |
Key Experimental Evidence: Direct Performance Comparisons
Case Study 1: Analysis of Levofloxacin in a Drug Delivery System
A direct comparison of HPLC and UV-Vis for quantifying Levofloxacin released from a mesoporous silica microspheres/nano-hydroxyapatite composite scaffold revealed critical performance differences [8].
Table 1: Method Performance Metrics for Levofloxacin Analysis
| Method | Regression Equation (y=concentration, x=absorbance/peak area) | R² | Recovery Rate at 25 µg/ml |
|---|---|---|---|
| HPLC | y = 0.033x + 0.010 | 0.9991 | 110.96% ± 0.23% |
| UV-Vis | y = 0.065x + 0.017 | 0.9999 | 99.50% ± 0.00% |
While UV-Vis showed a better R² value and excellent recovery in this specific test, the study concluded that HPLC is the preferred method for this complex drug-delivery system. The central finding was that UV-Vis was less accurate for measuring drug concentration loaded onto the biodegradable composite due to potential interference from other scaffold components, which HPLC could separate out [8].
Case Study 2: Monitoring Nucleoside Transformations
Research into enzymatic nucleoside phosphorylation reactions demonstrated how a advanced UV-Vis assay could compete with HPLC for specific applications [32].
Table 2: HPLC vs. Advanced UV-Vis for Reaction Monitoring
| Parameter | HPLC-Based Analysis | UV-Vis with Spectral Unmixing |
|---|---|---|
| Cost | Baseline (1x) | Approximately 5-fold lower [32] |
| Analysis Time | Baseline (1x) | 20-fold faster [32] |
| Precision | High | Comparable [32] |
| Throughput | Low | High (96-well plate format) [32] |
This study highlights that for well-defined reactions involving compounds with distinct UV spectra, modern UV-Vis methods employing algorithms like spectral unmixing can provide high-throughput, cost-effective analysis without sacrificing precision [32].
Detailed Protocols for Key Applications
Protocol 1: High-Throughput Protein and Nucleic Acid Quantification
This is a quintessential UV-Vis application due to its speed and simplicity for pure samples [34].
Workflow Diagram: Protein and DNA Quantification via UV-Vis
Step-by-Step Methodology:
- Sample Preparation: Dissolve or dilute the purified protein or nucleic acid sample in a compatible aqueous buffer (e.g., phosphate-buffered saline) [34] [33].
- Instrument Setup: Use a UV-Vis spectrophotometer, ideally with micro-volume capabilities (e.g., 2 µL pathlength) to conserve precious samples and avoid dilutions [34].
- Measurement: Transfer the sample to a quartz cuvette or a micro-volume platform. Acquire the absorbance spectrum, typically between 230 nm and 350 nm [34].
- Data Analysis:
- For protein concentration, measure absorbance at 280 nm (A280). Apply the Beer-Lambert law: Concentration = (A280 / ε) / pathlength, where ε is the protein's extinction coefficient [34].
- For nucleic acid concentration, measure absorbance at 260 nm (A260). Use the relationship: DNA concentration (ng/µL) = A260 × 50 ng/µL × dilution factor [34].
- Purity Assessment: Check the A260/A280 ratio. Expected values are ~1.8 for pure DNA and ~0.6 for pure protein, indicating minimal contamination [34].
Protocol 2: UV-Vis with Chemometrics for Antibiotic Mixtures
This advanced UV-Vis protocol uses chemometrics to resolve spectral overlaps, encroaching on a traditional HPLC strength [35].
Workflow Diagram: Quantification of Antibiotic Mixtures with Chemometrics
Step-by-Step Methodology:
- Calibration Set Design: Prepare a training set of synthetic mixtures containing the fluoroquinolone antibiotics (e.g., Ciprofloxacin, Lomefloxacin, Enrofloxacin) at varying concentration levels using an experimental design (e.g., fractional factorial design) [35].
- Spectral Acquisition: Record the UV absorption spectra (e.g., from 200-400 nm) for all calibration mixtures [35].
- Chemometric Modeling:
- Variable Selection: Employ the Firefly Algorithm (FA) to identify the most significant wavelengths for quantifying each antibiotic, reducing model complexity and improving predictive power [35].
- Model Calibration: Use the selected wavelengths to build a Partial Least Squares (PLS) regression model, which correlates spectral data with the known concentrations in the calibration set [35].
- Validation: Test the model's predictive performance using an independent validation set of mixtures not used in the calibration step. Figures of merit like Recovery % and Relative Standard Deviation (RSD) are calculated [35].
- Analysis of Unknowns: For an unknown sample, simply acquire its UV spectrum and use the calibrated PLS model to simultaneously predict the concentration of each antibiotic present [35].
Essential Research Reagent Solutions
The following table lists key materials and their functions for implementing the protocols described above.
Table 3: Essential Reagents and Materials for UV-Vis and HPLC Analysis
| Item | Function / Application | Key Considerations |
|---|---|---|
| Quartz Cuvettes / Micro-Volume Plates | Sample holder for UV-Vis measurement [19] [34] | Quartz is transparent to UV light; plastic and glass absorb it. Micro-volume systems (e.g., 2 µL) save sample [19] [34]. |
| High-Purity Solvents & Buffers | Dissolving and diluting samples for both UV-Vis and HPLC [30] [19] | Must be UV-transparent at measured wavelengths; common choices are water, methanol, acetonitrile, and aqueous buffers [19]. |
| Certified Reference Standards | For calibration curve generation in both UV-Vis and HPLC [34] [29] | Essential for accurate quantification. Purity should be certified and traceable (e.g., NIST standards) [34]. |
| Deuterated Solvents (for NMR) | Used in NMR spectroscopy, a powerful technique for structural elucidation [30] | Avoids interference with proton signals in NMR analysis (e.g., D₂O, CDCl₃) [30]. |
| HPLC Columns (C18) | The stationary phase for separating components in reverse-phase HPLC [28] [8] | The workhorse column for many pharmaceutical applications; particle size and column dimensions affect resolution and pressure [28]. |
| Chemometric Software | For developing PLS and other multivariate models for advanced UV-Vis analysis [35] | Required to resolve spectral overlaps in mixtures (e.g., MATLAB, PLS_Toolbox) [35]. |
UV-Vis spectroscopy is the unequivocal choice for high-throughput, cost-effective quantification of pure, well-characterized substances like single-component APIs, proteins, and nucleic acids. Its value is amplified in early-stage development, routine QC of simple formulations, and reaction monitoring where speed is critical.
However, for stability-indicating methods, impurity profiling, and analysis of complex mixtures where specificity is paramount, HPLC remains the gold standard. The emergence of UV-Vis coupled with advanced chemometrics offers a powerful hybrid approach, providing a middle ground for certain multi-analyte determinations without the full cost and complexity of HPLC. The informed scientist strategically deploys each technique based on the specific analytical question at hand.
In the field of drug quantification research, scientists often face a critical decision: when to use High-Performance Liquid Chromatography (HPLC) versus UV-Visible (UV-Vis) spectroscopy. While UV-Vis spectroscopy offers simplicity and cost-effectiveness, HPLC provides superior separation capabilities essential for complex analytical challenges. This guide objectively compares the performance of these techniques, supported by experimental data, to help researchers make informed methodological choices based on their specific analytical needs.
Core Principles and Technical Differences
UV-Vis Spectroscopy operates on the Lambert-Beer Law, where the absorption of light by a sample is directly proportional to the concentration of the absorbing species [36]. This technique provides a simple, rapid means of quantification but lacks inherent separation capabilities, making it susceptible to interference from other absorbing compounds in complex mixtures.
HPLC, in contrast, separates components based on their differential partitioning between a mobile phase and a stationary phase packed within a column [37]. A high-pressure pump forces the mobile phase containing the sample through the column, where different constituents interact with the stationary phase to varying degrees based on physicochemical properties like size, polarity, and charge [37]. This separation mechanism allows HPLC to resolve individual components in complex mixtures before detection.
The following diagram illustrates the fundamental workflow and decision process for selecting between these techniques:
Comparative Performance Data
Experimental studies directly comparing HPLC and UV-Vis spectroscopy demonstrate significant performance differences across key analytical parameters:
Table 1: Method Comparison for Drug Quantification
| Analytical Parameter | HPLC Performance | UV-Vis Performance | Comparative Study Findings |
|---|---|---|---|
| Linearity Range | 0.05-300 µg/mL (Levofloxacin) [8] | 0.05-300 µg/mL (Levofloxacin) [8] | Both techniques demonstrated wide linear ranges |
| Regression Equation | y = 0.033x + 0.010 [8] | y = 0.065x + 0.017 [8] | Both showed excellent correlation (R² > 0.999) |
| Recovery Rates (Low Concentration) | 96.37 ± 0.50% [8] | 96.00 ± 2.00% [8] | Comparable performance at low concentrations |
| Recovery Rates (Medium Concentration) | 110.96 ± 0.23% [8] | 99.50 ± 0.00% [8] | HPLC showed higher deviation at medium concentration |
| Recovery Rates (High Concentration) | 104.79 ± 0.06% [8] | 98.67 ± 0.06% [8] | HPLC showed higher deviation at high concentration |
| Precision (RSD) | <1.50% (Repaglinide) [6] | <1.50% (Repaglinide) [6] | Both demonstrated acceptable precision |
Table 2: Application-Based Method Selection Guide
| Analytical Scenario | Recommended Technique | Experimental Evidence |
|---|---|---|
| Complex Drug Formulations | HPLC | UV-Vis inaccurately measured Levofloxacin in composite scaffolds due to impurity interference [8] |
| Impurity Profiling | HPLC | Effectively separated and quantified multiple Clonidine HCl impurities and degradation products [38] |
| Stability Studies | HPLC | Forced degradation studies under acidic, basic, oxidative, photolytic, and thermal conditions confirmed method specificity [38] |
| Simple Tablet Formulations | UV-Vis or HPLC | Both techniques successfully quantified Lamivudine and Repaglinide in tablets with comparable accuracy [6] [9] |
| Multicomponent Mixtures | HPLC with Advanced Detection | Successfully resolved ternary mixtures of cardiovascular drugs where UV-Vis showed spectral overlap [27] |
| Herbal Medicine Analysis | UV-Vis or HPLC | Strong correlation (R² > 0.99) between techniques for flavonoid quantification in Bauhinia forficata [39] |
HPLC Experimental Protocols
Stability-Indicating Method for Clonidine HCl
Objective: To develop a stability-indicating HPLC method for identification and quantification of Clonidine HCl impurities and degradation products in tablet formulations [38].
Chromatographic Conditions:
- Column: Kromasil C8 (250 × 4.6 mm, 5 µm)
- Mobile Phase: Phosphate buffer (pH 6.9) and acetonitrile (50:50 v/v)
- Flow Rate: 0.8 mL/min
- Injection Volume: 50µL
- Detection: 210 nm (Diode Array Detector)
- Column Temperature: 30°C [38]
Sample Preparation:
- Twenty tablets were crushed and powder equivalent to 1 mg of Clonidine HCl was transferred to a 25 mL volumetric flask
- 15 mL of mobile phase was added and sonicated for 15 minutes with intermittent shaking
- After cooling, volume was made up to mark with mobile phase
- Solution was centrifuged at 4000 RPM for 5 minutes
- Supernatant was filtered through 0.45 µm PVDF membrane filter, discarding first 2 mL of filtrate [38]
Forced Degradation Studies:
- Acidic/Basic Stress: Treatment with HCl/NaOH at room temperature or elevated temperatures
- Oxidative Stress: Treatment with hydrogen peroxide
- Photolytic Stress: Exposure to UV light
- Thermal Stress: Heating solid samples in oven [38]
Comparison Protocol for Levofloxacin Analysis
Objective: To compare HPLC and UV-Vis methods for determining Levofloxacin released from mesoporous silica microspheres/nano-hydroxyapatite composite scaffolds [8].
HPLC Conditions:
- Column: Sepax BR-C18 (250×4.6 mm, 5 µm particle diameter)
- Mobile Phase: 0.01 mol/l KH₂PO₄, methanol and 0.5 mol/l tetrabutylammonium hydrogen sulphate (75:25:4)
- Flow Rate: 1 ml/min
- Detection Wavelength: 290 nm
- Injection Volume: 10 µl for assay determination [8]
UV-Vis Conditions:
- Wavelength Selection: Scanning standard solutions at 200-400 nm
- Quantification Wavelength: Maximum absorption wavelength for Levofloxacin
- Sample Preparation: Direct analysis of samples after appropriate dilution [8]
Essential Research Reagent Solutions
Table 3: Key Reagents and Materials for HPLC Analysis
| Reagent/Material | Function in Analysis | Example Application |
|---|---|---|
| C18 Chromatography Columns | Stationary phase for reverse-phase separation | Levofloxacin separation [8], Repaglinide analysis [6] |
| Methanol and Acetonitrile (HPLC-grade) | Mobile phase components | Organic modifiers in mobile phase [8] [6] |
| Phosphate Buffers | Aqueous mobile phase component | pH control and ion pairing [8] [38] |
| Tetrabutylammonium Salts | Ion-pairing reagents | Improve separation of ionic compounds [8] |
| Internal Standards (e.g., Ciprofloxacin) | Reference for quantification accuracy | Compensation for procedural variations [8] |
| PVDF Membrane Filters | Sample clarification | Removal of particulate matter before injection [38] |
Advanced Applications and Signaling Pathways
HPLC's separation capability is particularly valuable in stability studies and impurity profiling, where it enables the detection and quantification of degradation products that may form under various stress conditions. The following diagram illustrates the degradation pathways and analytical approach for pharmaceutical stability testing:
The choice between HPLC and UV-Vis spectroscopy for drug quantification depends primarily on sample complexity, required specificity, and analytical objectives. UV-Vis spectroscopy serves as an efficient, cost-effective tool for simple formulations where no significant interference exists. However, HPLC emerges as the unequivocal choice for complex mixtures, impurity profiling, and stability studies due to its superior separation capabilities, specificity, and ability to provide comprehensive information about multiple components simultaneously. As demonstrated in comparative studies, while UV-Vis may sometimes show comparable accuracy for specific simple applications, HPLC provides the necessary separation power to ensure accurate results across diverse pharmaceutical analysis scenarios, particularly in regulated environments where comprehensive impurity characterization is mandatory.
The accurate quantification of active pharmaceutical ingredients (APIs) is fundamental to developing effective drug delivery systems. For antibiotics like levofloxacin, a broad-spectrum fluoroquinolone, precise measurement is particularly crucial in controlled-release formulations designed to maintain therapeutic levels while minimizing side effects [8] [5]. Researchers primarily utilize two analytical techniques for this purpose: High-Performance Liquid Chromatography (HPLC) and Ultraviolet-Visible Spectrophotometry (UV-Vis).
While UV-Vis spectroscopy offers simplicity and rapid analysis, HPLC provides separation capabilities that are critical in complex matrices. This case study examines a direct comparison of these methods for quantifying levofloxacin released from an innovative mesoporous silica microspheres/nano-hydroxyapatite (n-HA) composite scaffold, demonstrating HPLC's superior accuracy in this advanced drug delivery context [8].
Methodological Comparison: Experimental Protocols
Drug Delivery System and Sample Preparation
The study utilized a novel biodegradable composite scaffold as a drug-delivery system. The synthesis process involved:
- Synthesis of Mesoporous Silica Nanoparticles (MSNs): MSNs were synthesized using cetyltrimethylammonium bromide (CTAB) as a template and tetraethyl orthosilicate as a silica source, with Fe₃O₄ stabilized by oleic acid to create magnetic nanoparticles [8] [5].
- Drug Loading: Levofloxacin (1,500 µg/ml) was loaded into the MSNs via electrostatic attraction [5].
- Scaffold Fabrication: Nano-hydroxyapatite/polyurethane (n-HA/PU) composite porous scaffolds were synthesized using an in situ foaming method, then immersed in the Levofloxacin-MSN suspension to create the final drug-loaded scaffold [8] [5].
- Sample Collection: The release of levofloxacin was measured in simulated body fluid (SBF), with samples collected at various time points for analysis by both HPLC and UV-Vis methods [8].
HPLC Methodology
The established HPLC protocol provided high specificity for levofloxacin quantification [8]:
- Equipment: Shimadzu liquid chromatograph with LC-2010AHT gradient pump and UV-Visible detector [8].
- Column: Sepax BR-C18 (250 × 4.6 mm, 5 µm particle diameter) maintained at 40°C [8].
- Mobile Phase: 0.01 mol/l KH₂PO₄, methanol, and 0.5 mol/l tetrabutylammonium hydrogen sulphate in proportion (75:25:4), delivered at 1 ml/min flow rate [8].
- Detection: UV detection at 290 nm with injection volumes of 10-20 µl [8].
- Internal Standard: Ciprofloxacin was used to improve quantification accuracy [8].
- Sample Preparation: Samples were mixed with internal standard, vortexed, extracted with dichloromethane, centrifuged, and the supernatant was dried under nitrogen before reconstitution [8].
UV-Vis Methodology
The UV-Vis method provided a simpler alternative but with limitations:
- Equipment: UV-2600 UV-Vis spectrophotometer [8].
- Wavelength Selection: Scanning of standard levofloxacin solutions at 200-400 nm to determine maximum absorption wavelength [8].
- Sample Preparation: Direct measurement of samples without extensive pre-processing [8].
The experimental workflow below illustrates the parallel paths for method comparison:
Critical Comparison: Performance Data and Analytical Outcomes
Quantitative Method Performance
Direct comparison of validation parameters reveals significant differences between the two techniques:
Table 1: Analytical Method Performance Comparison for Levofloxacin Quantification
| Performance Parameter | HPLC Method | UV-Vis Method |
|---|---|---|
| Linear Range | 0.05–300 µg/ml | 0.05–300 µg/ml |
| Regression Equation | y = 0.033x + 0.010 | y = 0.065x + 0.017 |
| Correlation Coefficient (R²) | 0.9991 | 0.9999 |
| Recovery (Low Concentration, 5 µg/ml) | 96.37 ± 0.50% | 96.00 ± 2.00% |
| Recovery (Medium Concentration, 25 µg/ml) | 110.96 ± 0.23% | 99.50 ± 0.00% |
| Recovery (High Concentration, 50 µg/ml) | 104.79 ± 0.06% | 98.67 ± 0.06% |
While both methods demonstrated excellent linearity across the concentration range, the recovery data reveals HPLC's superior consistency, particularly at medium and high concentrations [8]. The precision of HPLC recovery rates (as indicated by smaller standard deviations) highlights its better reproducibility in complex samples.
Accuracy in Complex Drug Delivery Systems
The composite scaffold environment presented particular challenges that differentiated the methods:
- Matrix Interference: The mesoporous silica microspheres/n-HA composite scaffold contained multiple components that could interfere with accurate quantification [8]. HPLC's separation capability effectively isolated levofloxacin from these potential interferents.
- Specificity Challenges: UV-Vis spectroscopy measures total absorbance at a specific wavelength without separation power, making it susceptible to interference from degradation products or scaffold components that co-absorb at similar wavelengths [8] [40].
- Recovery Discrepancies: The consistently higher and more variable recovery rates obtained with HPLC, especially at medium and high concentrations (110.96% and 104.79% respectively), suggest that UV-Vis may underestimate levofloxacin concentration in the presence of scaffold materials [8].
The study concluded that "it is not accurate to measure the concentration of drugs loaded on the biodegradable composite composites by UV-Vis" and identified "HPLC as the preferred method to evaluate sustained release characteristics of Levofloxacin" in such complex drug delivery systems [8].
Essential Research Reagent Solutions
Successful implementation of these analytical methods requires specific high-quality reagents and materials:
Table 2: Essential Research Reagents for Levofloxacin Analysis
| Reagent/Material | Specification | Analytical Function |
|---|---|---|
| Levofloxacin Reference Standard | Pharmaceutical grade (>98% purity) | Primary calibration standard for quantification [8] |
| Ciprofloxacin | Analytical standard grade | Internal standard for HPLC to improve accuracy [8] |
| Methanol | HPLC-grade | Mobile phase component and extraction solvent [8] |
| Tetrabutylammonium Bromide | Analytically pure | Ion-pairing agent in mobile phase to improve separation [8] |
| Potassium Dihydrogen Phosphate (KH₂PO₄) | Analytical grade | Buffer component for mobile phase [8] |
| Simulated Body Fluid (SBF) | Physiological pH and ion composition | Release medium mimicking in vivo conditions [8] |
| Dichloromethane | HPLC-grade | Extraction solvent for sample preparation [8] |
Discussion: Implications for Drug Delivery Research
Method Selection Framework
The comparative data supports a clear decision framework for analytical method selection:
- UV-Vis Applications: Suitable for simple quality control of pure levofloxacin formulations without complex matrices, or for rapid screening when highest accuracy is not critical [40].
- HPLC Applications: Essential for drug release studies from complex delivery systems, stability-indicating assays, impurity profiling, and whenever specific quantification in complex matrices is required [8] [41].
Stability-Indicating Capabilities
Beyond routine quantification, HPLC offers critical stability-indicating properties essential for drug delivery system characterization. A validated stability-indicating RP-HPLC method can separate levofloxacin from its degradation products and process-related impurities, which is crucial for understanding API stability in the delivery system [41] [42]. Forced degradation studies under various stress conditions (acid, base, oxidative, thermal, photolytic) have demonstrated HPLC's ability to monitor levofloxacin stability while detecting degradation products, a capability absent in conventional UV-Vis spectroscopy [42].
Advanced HPLC Configurations
Recent methodological advances further enhance HPLC's applicability for levofloxacin analysis:
- Dual Detection Systems: Simultaneous UV and fluorescence detection provides enhanced sensitivity and confirmation capabilities [43].
- Multi-Component Analysis: HPLC methods can simultaneously quantify levofloxacin alongside other drugs (e.g., amoxicillin, lansoprazole) in combination therapies [44] [45].
- Mass Spectrometry Detection: LC-MS/MS methods offer ultimate specificity and sensitivity for complex biological samples or trace analysis [46] [42].
The following diagram illustrates the decision pathway for method selection based on research objectives:
This case study demonstrates that while UV-Vis spectroscopy offers simplicity and rapid analysis for levofloxacin quantification, HPLC provides definitively superior accuracy and reliability for characterizing drug release from advanced delivery systems like mesoporous silica/n-HA composite scaffolds. The separation capability of HPLC proves essential in complex matrices where scaffold components or degradation products could interfere with accurate quantification.
The experimental evidence shows that HPLC should be the method of choice for precise characterization of levofloxacin release profiles, stability studies, and quality control of complex drug delivery systems. As pharmaceutical formulations grow more sophisticated, the need for specific, stability-indicating analytical methods like HPLC becomes increasingly critical to ensure accurate pharmacokinetic predictions and therapeutic efficacy.
The quantification of active ingredients, such as bakuchiol, in complex cosmetic matrices presents significant challenges for researchers and quality control professionals. Bakuchiol, a meroterpene natural product isolated from Psoralea corylifolia, has gained prominence in cosmetics as a retinoid alternative due to its anti-aging, antioxidant, and anti-inflammatory properties without the associated side effects of retinal derivatives [47] [48]. The complexity of cosmetic formulations, which often include oils, emulsifiers, preservatives, and other functional ingredients, creates a challenging environment for accurate analytical measurement. This case study, framed within a broader thesis comparing UV-Vis spectroscopy with HPLC for drug quantification, examines the limitations of UV-Vis and demonstrates how more sophisticated techniques like HPLC and NMR provide superior analytical solutions for reliable bakuchiol quantification in cosmetic products.
Analytical Methodologies: A Comparative Framework
UV-Vis Spectrophotometry
Experimental Protocol: For bakuchiol analysis via UV-Vis, researchers typically proceed with the following steps [47]:
- Standard Preparation: Prepare a standard solution of pure bakuchiol in ethanol or methanol.
- Sample Preparation: Dissolve or extract the cosmetic product in ethanol. For emulsion-type products, this may involve partial dissolution followed by centrifugation or filtration to obtain a clear supernatant.
- Spectrum Acquisition: Scan the standard and sample solutions across the 200-400 nm range to identify the maximum absorption wavelength (λmax).
- Calibration: Prepare a series of standard solutions at known concentrations and measure their absorbance at λmax (established at 262 nm for bakuchiol) to create a calibration curve.
- Quantification: Measure the absorbance of the sample solution at 262 nm and calculate the bakuchiol concentration using the calibration curve.
The fundamental limitation of this method arises from its lack of separation power; it measures total absorbance at a specific wavelength without distinguishing between the target analyte and other matrix components that may absorb at the same wavelength [5].
High-Performance Liquid Chromatography (HPLC)
Experimental Protocol (HPLC-FLD for Bakuchiol): A developed reversed-phase HPLC method with fluorescence detection offers a more robust approach [49]:
- Extraction: Weigh 0.5 g of cosmetic product accurately. Add tetrahydrofuran (THF) as an extraction solvent in a 1:4 (weight:volume) ratio. Vortex the mixture for 5 minutes.
- Centrifugation: Centrifuge the extract at 14,000 rpm for 10 minutes at 25°C to separate insoluble excipients.
- Chromatographic Separation:
- Column: Zorbax Eclipse Plus C18 (100 × 4.6 mm, 3.5 µm particle size).
- Mobile Phase: Gradient elution with water and acetonitrile.
- Flow Rate: 1.0 mL/min.
- Column Temperature: 25°C.
- Detection: Fluorescence detection with excitation at 264 nm and emission at 338 nm.
- Injection Volume: Typically 10-20 µL.
- Quantification: Identify bakuchiol based on its retention time (approximately 31.8 minutes in some methods [47]) and quantify using a calibration curve constructed from standard solutions.
This method effectively separates bakuchiol from other cosmetic ingredients, mitigating the interference issues plaguing UV-Vis analysis [47] [49].
Quantitative Nuclear Magnetic Resonance (qNMR)
Experimental Protocol (1H qNMR): A protocol for quantifying bakuchiol in cosmetics via 1H qNMR is as follows [47]:
- Sample Preparation: Mix approximately 20-30 mg of the cosmetic product with a deuterated solvent (e.g., CDCl3). For quantitative analysis, add a known amount of an internal standard, such as nicotinamide, which is selected for its stability, lack of reactivity, and suitable solubility.
- Data Acquisition: Acquire 1H NMR spectra on a suitable spectrometer (e.g., 400 MHz). Use specific parameters to ensure quantitative conditions, including a relaxation delay (d1) of at least 5 times the longest T1 relaxation time of the signals of interest.
- Signal Identification and Integration: Identify the characteristic signals of bakuchiol in the spectrum. For quantification, signals in the aromatic and olefinic region (above 5.5 ppm) are often selected due to less interference from excipient signals. Similarly, identify and integrate a characteristic signal from the internal standard.
- Calculation: The concentration of bakuchiol is calculated using the relative integrals of the selected bakuchiol proton signals and the internal standard signal, along with their known proton equivalents and the precise weight of the internal standard.
qNMR provides an absolute quantitative method that does not require identical standards for calibration and can simultaneously confirm the compound's identity [47].
Results & Discussion: Performance Data and Comparative Analysis
Direct Comparison of Analytical Performance
The application of all three methods to the same set of commercial cosmetic sera revealed critical differences in performance and reliability [47].
Table 1: Comparative Analysis of Bakuchiol in Cosmetic Samples Using Different Techniques
| Cosmetic Sample | Declared Bakuchiol | UV-Vis Result | HPLC Result | 1H qNMR Result | Notes on UV-Vis Limitations |
|---|---|---|---|---|---|
| Sample 1 | ~1% | Quantified | 0.51% | Confirmed | Quantification possible but less accurate |
| Sample 2 | Present | Not Detected | Not Detected | Not Detected | Agreement on absence of bakuchiol |
| Sample 3 | ~1% | Quantified | ~1% | Confirmed | Matched declaration, but HPLC more reliable |
| Sample 4 | Not Specified | Quantified | 3.6% | Confirmed | Highest content, UV-Vis prone to over/underestimation |
| Sample 5 | Present | Qualitative Only | Quantified | Confirmed | Emulsion matrix prevented complete extraction/dissolution for UV-Vis |
| Sample 6 | Present | Qualitative Only | Quantified | Confirmed | Emulsion matrix prevented complete extraction/dissolution for UV-Vis |
The data demonstrates a clear concordance between HPLC and qNMR findings. In contrast, UV-Vis failed to provide reliable quantitative data for two emulsion-based samples (Samples 5 and 6) due to incomplete dissolution and extraction, highlighting its susceptibility to matrix effects [47]. Furthermore, while UV-Vis suggested the presence of bakuchiol in Samples 1, 3, and 4, it lacked the specificity to verify the analyte's identity or ensure the accuracy of the quantification without confirmation from another technique.
Validation Parameters and Figures of Merit
The superiority of chromatographic and NMR methods is further evidenced by their rigorous validation parameters.
Table 2: Analytical Figures of Merit for Bakuchiol Determination Methods
| Parameter | UV-Vis Spectrophotometry | HPLC with UV/FLD Detection | 1H qNMR |
|---|---|---|---|
| Linear Range | Information Missing | 0.5–50.0 μg/g [49] (HPLC-FLD); Wider ranges possible [47] | Not directly applicable (absolute quantification) |
| Detection Limit | Higher (matrix-dependent) | 0.1 μg/g [49] (HPLC-FLD) | Comparable to HPLC [47] |
| Quantification Limit | Higher (matrix-dependent) | 0.5 μg/g [49] (HPLC-FLD) | Comparable to HPLC [47] |
| Precision (%RSD) | Lower (often >2%) | <2.5% (HPLC-UV) [47]; <6% (HPLC-FLD) [49] | High (comparable to HPLC) [47] |
| Accuracy (Recovery) | Variable, matrix-dependent | 93.37–106.39% [49] (HPLC-FLD) | High, based on internal standard [47] |
| Specificity/Selectivity | Low - Susceptible to spectral overlaps | High - Separates analyte from interferents | High - Identifies and quantifies via unique chemical shifts |
| Analysis Time | Fastest (minutes) | Medium (~20-30 min/sample) | Shortest per sample (<5 min post-prep) [47] |
| Key Advantage | Rapid, low-cost, simple operation | High sensitivity and selectivity | Absolute quantification, structural confirmation |
The findings from a parallel study on Levofloxacin reinforce this conclusion, demonstrating that UV-Vis, while showing a good standard curve (R²=0.9999), produced less accurate recovery rates (96.00–99.50%) compared to HPLC (96.37–110.96%) in a complex scaffold matrix, leading to the recommendation of HPLC as the preferred method for accurate determination in complex delivery systems [5] [8].
The Scientist's Toolkit: Essential Research Reagent Solutions
Successful analysis requires carefully selected reagents and materials. The following table details key solutions used in the featured experiments.
Table 3: Essential Research Reagents and Materials for Bakuchiol Analysis
| Item | Function/Application | Key Considerations |
|---|---|---|
| Bakuchiol Standard | Primary standard for calibration curve construction in UV-Vis and HPLC; reference for identity confirmation in NMR. | High purity (>90%, often ~95%) is critical for accurate quantification. Natural or synthetic sources available [49] [48]. |
| Tetrahydrofuran (THF) | Extraction solvent for bakuchiol from various cosmetic matrices (sera, creams). | Selected for its high extraction efficiency (>90% for most products) compared to acetonitrile, methanol, or ethanol [49]. |
| Nicotinamide | Internal standard for quantitative 1H NMR (qNMR). | Chosen for its stability, non-reactivity, suitable solubility in CDCl3, and distinct NMR signals that do not overlap with bakuchiol [47]. |
| Deuterated Chloroform (CDCl3) | Solvent for NMR spectroscopy. | Excellent solvent for dissolving lipophilic cosmetic formulations and providing a good signal for NMR locking [47]. |
| C18 Reverse-Phase Column | Stationary phase for HPLC separation. | Endcapped columns (e.g., Zorbax Eclipse Plus C18) provide optimal separation of bakuchiol from cosmetic matrix components [47] [49]. |
| Acetonitrile (HPLC grade) | Component of the mobile phase for HPLC. | Ensures low UV background and high chromatographic performance. Used in gradient elution with water [47] [49]. |
This case study clearly demonstrates that while UV-Vis spectroscopy offers speed and operational simplicity, its utility for the accurate quantification of bakuchiol in complex cosmetic matrices is severely limited by a lack of specificity and susceptibility to matrix interferences. The technique fails with emulsion-type products and cannot distinguish the target analyte from other absorbing compounds, leading to potentially inaccurate results.
HPLC, particularly with fluorescence detection, and 1H qNMR emerge as robust, complementary techniques that overcome these limitations. HPLC provides excellent sensitivity, selectivity, and reliable quantification, making it ideal for routine quality control. qNMR offers the unique advantage of absolute quantification without a pure identical standard and provides structural verification simultaneously.
For researchers and scientists in drug and cosmetic development, the following recommendations are made:
- For Routine QC: HPLC with UV or fluorescence detection is the recommended workhorse for its balance of accuracy, precision, and throughput.
- For Method Development and Verification: qNMR should be employed as a orthogonal method to confirm HPLC results, especially when validating new formulations or investigating discrepancies.
- For Initial Screening: UV-Vis can be used for a rapid, qualitative check of raw materials or simple solutions, but its quantitative results for finished products must be interpreted with caution and confirmed by a separation-based technique.
The evolution from simple spectroscopic to advanced chromatographic and spectroscopic techniques underscores a critical principle in analytical chemistry: as active ingredients and their delivery systems grow more complex, so too must the analytical methods employed to ensure product quality, safety, and efficacy.
Experimental Workflows and Signaling Pathways
The quantification of multiple neuromodulating agents in pharmaceutical formulations and biological samples represents a significant challenge in analytical chemistry and pharmaceutical sciences. Researchers and drug development professionals routinely face the decision between employing Ultraviolet-Visible (UV-Vis) spectroscopy or High-Performance Liquid Chromatography with Ultraviolet detection (HPLC-UV) for their analytical workflows. While UV-Vis spectroscopy offers simplicity and rapid analysis, HPLC-UV provides superior separation capabilities for complex mixtures. This comparison guide objectively evaluates the performance of both techniques within the context of simultaneous multi-drug analysis, with specific application to neuromodulating agents. The critical need for reliable analytical methods is particularly pronounced for anti-epileptic drugs, which exhibit narrow therapeutic windows and require precise monitoring to balance efficacy with toxicity concerns [50] [51].
The fundamental distinction between these techniques lies in their operational principles: UV-Vis measures aggregate absorbance without separation, while HPLC-UV combines chromatographic separation with specific detection. This distinction becomes critically important when analyzing complex mixtures such as combination therapies, where specificity and selectivity determine analytical success. For neuromodulating agents like levetiracetam, gabapentin, and piracetam, which are often co-administered in epilepsy treatment protocols, the separation capability of HPLC-UV provides distinct advantages for reliable quantification [50].
Performance Comparison: HPLC-UV vs. UV-Vis Spectroscopy
Quantitative Comparison of Analytical Capabilities
Table 1: Direct performance comparison between HPLC-UV and UV-Vis methods for pharmaceutical analysis
| Performance Parameter | HPLC-UV | UV-Vis Spectroscopy |
|---|---|---|
| Linear Range | 0.1–1000 μg/mL (depending on analyte) [50] [52] | 2–30 μg/mL for repaglinide [6] |
| Correlation Coefficient (r²) | >0.99 consistently [50] [52] [53] | >0.99 achievable [6] |
| Precision (% RSD) | Typically <2% [54] [6] | <1.5% for repaglinide [6] |
| Accuracy (% Recovery) | 95–105% [54] | 99.63–100.45% for repaglinide [6] |
| Limit of Detection | As low as 0.1 μg/mL [52] | Varies by compound [6] |
| Analysis Time | 15–25 minutes [50] [51] | Several minutes (no separation) |
| Multi-analyte Capability | Excellent (9+ simultaneous analytes) [53] | Poor (limited by spectral overlap) |
| Specificity in Mixtures | High (separation-based) [54] | Low (spectral deconvolution required) |
Case Study Evidence: Direct Method Comparisons
Direct comparative studies demonstrate the contextual superiority of each method. For levofloxacin analysis in drug delivery systems, HPLC demonstrated significantly better accuracy (96.37–110.96% recovery) compared to UV-Vis (96.00–99.50% recovery) in complex matrices [8]. Similarly, for repaglinide analysis in tablets, both methods showed excellent precision, though HPLC offered a wider linear range (5–50 μg/mL) compared to UV-Vis (5–30 μg/mL) [6].
The critical advantage of HPLC-UV emerges in complex matrices: while UV-Vis struggles with spectral interference from excipients and degradation products, HPLC-UV provides physical separation that eliminates these interferences [54] [6]. This makes HPLC-UV particularly valuable for stability-indicating methods where degradation products must be monitored separately from the active pharmaceutical ingredients [54].
HPLC-UV Methodologies for Simultaneous Multi-Drug Analysis
Experimental Protocol for Neuromodulating Agent Analysis
A validated HPLC-UV method for simultaneous determination of piracetam (PIR), gabapentin (GBP), and levetiracetam (LEV) exemplifies robust analytical development [50]:
Chromatographic Conditions:
- Column: Inertsil ODS-3 C18 (250 × 4.6 mm, 5.0 μm)
- Mobile Phase: Methanol:water (15:85, v/v) isocratic elution
- Flow Rate: 1.0 mL/min
- Detection: 210 nm
- Temperature: Ambient
- Injection Volume: 20 μL [50]
Sample Preparation:
- Pharmaceutical formulations: Powdered tablets equivalent to 20 mg of each drug extracted with methanol-water (1:1)
- Filtration through 0.45 μm membrane before injection [50]
Validation Parameters:
- Linearity: 30.0–1000.0 μg/mL for GBP; 10.0–100.0 μg/mL for LEV and PIR
- Precision: %RSD <2%
- Accuracy: 98–102% recovery
- Specificity: No interference from excipients [50]
This method successfully addressed the analytical challenge of simultaneously quantifying three neuromodulating agents with different chemical properties, demonstrating the versatility and robustness of HPLC-UV for complex pharmaceutical analysis [50].
Advanced Applications: Bioanalysis and Therapeutic Drug Monitoring
HPLC-UV methods extend beyond pharmaceutical formulations to biological samples. A validated method for antiretroviral agents in plasma achieved simultaneous quantification of nine drugs using solid-phase extraction and gradient elution [53]:
- Separation: C18 column (150 mm × 4.6 mm, 3.5 μm) with acetonitrile/acetate buffer gradient
- Detection: Dual wavelengths (260 nm and 305 nm) for different analytes
- Linearity: R² >0.99 for all nine analytes across therapeutic ranges [53]
For therapeutic drug monitoring of antiepileptics, an HPLC-UV method for lamotrigine and oxcarbazepine metabolites demonstrated excellent correlation with UHPLC-MS/MS results, highlighting its sufficient sensitivity for clinical applications [51]. The mean bias between HPLC-UV and MS methods was 0.575 mg/L for lamotrigine, well within acceptable clinical limits [51].
Analytical Workflow: From Sample to Results
Figure 1: HPLC-UV Analytical Workflow for Multi-Drug Analysis
The workflow illustrates the systematic process from sample preparation to final quantification. Critical decision points include extraction method selection (dependent on sample matrix) and detection wavelength optimization (specific to analyte chromophores) [50] [53] [51]. For biological samples, the sample preparation stage typically includes protein precipitation or solid-phase extraction to remove interfering matrix components [53] [55].
The Scientist's Toolkit: Essential Research Reagents and Materials
Table 2: Key research reagent solutions for HPLC-UV method development
| Reagent/Material | Function | Example Specifications |
|---|---|---|
| C18 Chromatographic Column | Reverse-phase separation of analytes | 150-250 mm length, 4.6 mm ID, 3-5 μm particle size [50] [53] |
| HPLC-Grade Methanol/Acetonitrile | Mobile phase components | Low UV cutoff, high purity [50] [52] |
| Buffer Salts | Mobile phase modification | Phosphate, acetate buffers for pH control [52] [53] |
| Solid-Phase Extraction Cartridges | Sample clean-up (biological matrices) | C18, mixed-mode, or specialized sorbents [53] [55] |
| Reference Standards | Method calibration and validation | Certified purity (>98%) [50] [51] |
| Membrane Filters | Sample clarification | 0.45 μm porosity [50] [52] |
The selection of appropriate chromatographic columns proves critical for successful method development. While C18 columns serve as the workhorse for most applications [50] [53], alternative stationary phases such as CN (cyano) columns can provide different selectivity for challenging separations of complex drug mixtures [52].
HPLC-UV establishes itself as the superior technique for simultaneous multi-drug analysis of neuromodulating agents when compared to UV-Vis spectroscopy. Its principal advantages of excellent specificity, multi-analyte capability, and proven reliability in both pharmaceutical and biological matrices make it particularly valuable for quality control and therapeutic drug monitoring applications. While UV-Vis maintains utility for simple, single-analyte determinations in pure formulations, its limitations in spectral resolution render it inadequate for complex mixture analysis.
The experimental data presented demonstrates that properly developed and validated HPLC-UV methods can achieve performance characteristics approaching those of more sophisticated techniques like LC-MS/MS, but with significantly lower operational costs and greater accessibility [55] [51]. This positions HPLC-UV as an ideal solution for routine analytical laboratories requiring robust, cost-effective methods for simultaneous quantification of neuromodulating agents in various matrices.
Overcoming Challenges: Strategies for Enhanced Performance and Reliability
In the field of drug research and development, the accurate quantification of active pharmaceutical ingredients (APIs) is fundamental to ensuring product safety, efficacy, and quality. Ultraviolet-visible (UV-Vis) spectroscopy has long been a cornerstone analytical technique in pharmaceutical laboratories due to its simplicity, cost-effectiveness, and rapid analysis time [19] [56]. The technique measures the absorption of discrete wavelengths of UV or visible light by a sample, providing quantitative data based on the Beer-Lambert law, which describes the linear relationship between absorbance and concentration [19].
However, despite its widespread use, UV-Vis spectroscopy faces three significant limitations that can compromise its accuracy in complex pharmaceutical analyses: spectral overlap in multi-component mixtures, interference from excipients and formulation matrix components, and an inherent lack of specificity for confirming compound identity [8] [27]. This article objectively examines these limitations and compares the performance of UV-Vis spectroscopy with High-Performance Liquid Chromatography (HPLC), a separation-based technique that has become the gold standard for pharmaceutical analysis [57] [58].
Core Limitations of UV-Vis Spectroscopy in Drug Analysis
Spectral Overlap in Multi-Component Analysis
UV-Vis spectroscopy produces a composite spectrum when multiple light-absorbing compounds are present in a sample. This becomes problematic in pharmaceutical analysis when:
- A drug product contains multiple active ingredients
- Degradation products form with chromophores similar to the parent drug
- Impurities or related substances coexist with the main analyte
The fundamental issue is that UV-Vis cannot distinguish between different compounds absorbing at similar wavelengths without prior separation [27]. The absorption spectrum represents the sum total of all light-absorbing species in the pathlength, making individual quantification impossible without sophisticated chemometric approaches [27].
Excipient and Matrix Interference
Pharmaceutical formulations rarely contain pure API. They include various excipients, fillers, stabilizers, and coloring agents that may themselves absorb UV or visible light. Common sources of interference include:
- Preservatives like butyl hydroxyanisole (BHA) which contain chromophores [28]
- Polymeric coatings and shellac components
- * Antioxidants* and stabilizing agents
- Colorants and dyes used in tablet identification
These matrix components can lead to falsely elevated absorbance readings, resulting in overestimation of API content [8]. While sample preparation techniques can mitigate some interference, they cannot resolve fundamental issues of co-absorption.
Lack of Specificity for Compound Identification
The absorption spectrum from UV-Vis spectroscopy, while characteristic for some compounds, does not provide definitive proof of a compound's identity. This limitation is significant in regulated pharmaceutical environments where positive identification is crucial. UV-Vis cannot:
- Distinguish between structurally similar compounds like isomers and stereoisomers
- Differentiate between a parent drug and its metabolites or degradation products with similar chromophores
- Provide structural information about unknown impurities [56]
This lack of specificity makes UV-Vis insufficient as a standalone technique for identity confirmation in most modern pharmaceutical quality control environments [58].
HPLC as a Comprehensive Solution
High-Performance Liquid Chromatography addresses UV-Vis limitations through a fundamentally different approach that separates components before detection. A standard HPLC system consists of a high-pressure pump, injector, chromatographic column, detector, and data system [57]. The core advantage lies in the chromatographic column where different compounds interact differently with the stationary phase, resulting in separation over time [57] [58].
HPLC provides two dimensions of information—retention time and detector response—compared to UV-Vis's single dimension of absorbance at varying wavelengths. This separation capability allows HPLC to resolve complex mixtures, distinguish APIs from excipients, and provide specificity through characteristic retention times [58] [28]. When coupled with mass spectrometry (MS) or diode array detection (DAD), the specificity increases dramatically through additional spectral confirmation [58].
Comparative Experimental Data: UV-Vis vs. HPLC Performance
Direct comparison studies provide compelling evidence of the performance differences between these techniques. The following table summarizes key findings from controlled experiments:
Table 1: Comparative Performance of HPLC and UV-Vis in Drug Analysis
| Drug Analyzed | Analytical Parameter | HPLC Results | UV-Vis Results | Reference |
|---|---|---|---|---|
| Levofloxacin | Recovery Rate (Medium conc.) | 110.96% ± 0.23% | 99.50% ± 0.00% | [8] |
| Levofloxacin | Recovery Rate (High conc.) | 104.79% ± 0.06% | 98.67% ± 0.06% | [8] |
| Repaglinide | Precision (%RSD) | <1.50% | <1.50% | [6] |
| Repaglinide | Mean Recovery | 99.71-100.25% | 99.63-100.45% | [6] |
| Lamivudine | Agreement with Label Claim | Yes | Yes | [9] |
| Cardiovascular Drugs* | Spectral Overlap Resolution | Complete separation | Required ANN modeling | [27] |
*Propranolol, rosuvastatin, and valsartan in ternary mixtures [27]
A particularly revealing study on Levofloxacin quantification demonstrated that UV-Vis spectrophotometry was "not accurate to measure the concentration of drugs loaded on biodegradable composite composites" compared to HPLC, which was established as "the preferred method" [8]. The recovery rates shown in Table 1 illustrate that HPLC provided more consistent and accurate results across different concentration levels.
Another comparative study on repaglinide tablet analysis found that while both methods showed acceptable precision, the HPLC method offered a wider linear range (5-50 μg/mL) compared to UV-Vis (5-30 μg/mL), extending its utility for quantitative analysis [6].
Detailed Experimental Protocols
Protocol 1: HPLC Analysis of Related Substances in Drug Products
This stability-indicating method exemplifies HPLC's ability to resolve APIs from degradants and impurities [28]:
Figure 1: HPLC Method Development Workflow for Drug Analysis
Key Steps:
- Sample Preparation: Tablet powder equivalent to API weight is dissolved in appropriate solvent, sonicated for 15 minutes, and filtered [6].
- Chromatographic Conditions:
- Detection: UV detection at compound-specific wavelength (e.g., 290 nm for Levofloxacin)
- Quantification: Peak area comparison against reference standards [8]
This method successfully separates not only the API but also process impurities, degradants, and formulation components, allowing individual quantification of each species [28].
Protocol 2: UV-Vis Analysis with Advanced Chemometrics
For UV-Vis to handle multi-component mixtures, sophisticated computational approaches are required [27]:
Figure 2: Advanced UV-Vis Workflow for Multi-Component Analysis
Key Steps:
- Experimental Design: A partial factorial design with multiple concentration levels creates a calibration set covering the expected concentration range [27].
- Spectrum Acquisition: Full UV spectra (200-400 nm) are collected for all calibration and validation samples using 1 cm quartz cells [27].
- Data Processing: The firefly algorithm selects the most informative wavelengths to optimize the artificial neural network (ANN) model [27].
- Multivariate Modeling: ANN establishes relationships between spectral data and known concentrations through backpropagation training [27].
- Validation: Model performance is verified using an independent validation set and compliance with ICH guidelines [27].
This approach successfully quantified propranolol, rosuvastatin, and valsartan in ternary mixtures, but required significant computational resources and method development time [27].
The Scientist's Toolkit: Essential Research Reagents and Materials
Table 2: Key Reagents and Materials for Pharmaceutical Analysis
| Item | Function in HPLC | Function in UV-Vis |
|---|---|---|
| C18 Chromatographic Column | Stationary phase for compound separation; the core of HPLC selectivity | Not applicable |
| Methanol/Acetonitrile (HPLC grade) | Mobile phase components; elute compounds from column | Sample dissolution and solvent medium |
| Buffer Salts (e.g., KH₂PO₄, ammonium formate) | Mobile phase modifiers; control pH and ionic strength | Not typically used |
| Reference Standards | System calibration and peak identification | Method calibration and wavelength verification |
| Quartert Cuvettes | Not typically used | Sample holder for spectral measurements |
| 0.45 μm Syringe Filters | Sample clarification and particulate removal | Sample clarification (for turbid solutions) |
| Tetrabutylammonium Salts | Ion-pairing reagents for separating ionic compounds | Not applicable |
The choice between UV-Vis spectroscopy and HPLC for drug quantification depends on the specific analytical requirements:
UV-Vis spectroscopy remains valuable for:
- Routine quality control of single-component formulations
- Dissolution testing where specificity is established
- Stability studies of chemically stable compounds
- Situations with budget constraints or need for rapid analysis [56] [9]
HPLC is essential for:
- Regulatory compliance and method validation
- Complex formulations with multiple actives
- Stability-indicating methods for degradant quantification
- Impurity profiling and related substances testing
- Chiral separations and isomer differentiation [58] [28]
For researchers and pharmaceutical professionals, HPLC provides the specificity, precision, and robustness required in modern drug development, particularly when spectral overlap, excipient interference, or specificity concerns exist. While UV-Vis offers simplicity and cost benefits, these advantages come at the expense of analytical confidence in complex matrices. The experimental evidence clearly demonstrates that HPLC's separation power before detection makes it fundamentally superior for resolving the core limitations inherent to UV-Vis spectroscopy.
In the field of drug development and quality control, High-Performance Liquid Chromatography (HPLC) stands as a cornerstone analytical technique for the separation, identification, and quantification of chemical compounds. The optimization of HPLC methods represents a critical undertaking for researchers and pharmaceutical scientists seeking to achieve precise, reliable, and efficient analyses. This process primarily revolves around three fundamental parameters: the selection of an appropriate chromatography column, the composition of the mobile phase, and the design of an effective elution program. Within the broader context of analytical method selection, a comparison with Ultraviolet-Visible (UV-Vis) spectroscopy for drug quantification reveals significant differences in capability and application. This guide provides a comprehensive, data-driven comparison of these techniques and outlines systematic approaches for optimizing key HPLC parameters, supported by experimental data and practical protocols.
Analytical Technique Comparison: HPLC vs. UV-Vis Spectroscopy
The choice between HPLC and UV-Vis spectroscopy for drug quantification depends on the specific analytical requirements, including sensitivity, specificity, and sample complexity. The following comparison summarizes the core differences, with Table 1 presenting quantitative performance data from controlled studies.
Table 1: Quantitative Comparison of HPLC and UV-Vis Methods for Drug Analysis
| Parameter | HPLC Method (for Repaglinide) | UV-Vis Method (for Repaglinide) | HPLC Method (for Levofloxacin) | UV-Vis Method (for Levofloxacin) |
|---|---|---|---|---|
| Linear Range (μg/mL) | 5 - 50 [6] | 5 - 30 [6] | 0.05 - 300 [8] | 0.05 - 300 [8] |
| Regression Equation (y = mx + c) | y = 0.065x + 0.017 [6] | y = 0.033x + 0.010 [8] | y = 0.065x + 0.017 [6] | y = 0.033x + 0.010 [8] |
| Correlation Coefficient (R²) | > 0.999 [6] | > 0.999 [6] | 0.9991 [8] | 0.9999 [8] |
| Recovery (%) - Low Concentration | 99.71 - 100.25 [6] | 99.63 - 100.45 [6] | 96.37 ± 0.50 [8] | 96.00 ± 2.00 [8] |
| Recovery (%) - Medium Concentration | - | - | 110.96 ± 0.23 [8] | 99.50 ± 0.00 [8] |
| Recovery (%) - High Concentration | - | - | 104.79 ± 0.06 [8] | 98.67 ± 0.06 [8] |
| Precision (% R.S.D.) | < 1.50 [6] | < 1.50 [6] | - | - |
Specificity and Interference: HPLC offers superior specificity due to its ability to physically separate components in a mixture before detection. This is crucial for analyzing drugs in complex matrices, such as drug-loaded scaffold materials, where UV-Vis can be inaccurate due to interference from other UV-absorbing impurities [8]. For simpler formulations, like tablets, UV-Vis can be a valid, cost-effective option if no interferences are present [6] [59].
Sensitivity and Linear Range: As shown in Table 1, both techniques can demonstrate excellent linearity. However, HPLC consistently provides more accurate recovery rates across a wide range of concentrations, especially in complex samples, as evidenced by the data for Levofloxacin [8].
Application Context: UV-Vis is a simpler, faster, and more economical technique suitable for routine analysis of pure raw materials or unformulated drugs [6] [59]. HPLC is the unequivocal choice for research involving complex samples, stability studies, impurity profiling, and formulations with multiple active ingredients or excipients that may interfere [8].
Decision Workflow for Method Selection
The following diagram illustrates the decision-making process for selecting an analytical technique.
HPLC Column Selection and Comparison
The choice of column is one of the most influential factors in HPLC method development, as it directly governs the selectivity of the separation.
Column Characterization and Selectivity
Hydrophobic Subtraction Model (HSM): This model quantitatively describes column selectivity using five parameters: H (hydrophobicity), S* (steric resistance), A (hydrogen bond acidity), B (hydrogen bond basicity), and C (charge interaction at a specific pH) [60]. A similarity factor (Fs) is calculated to compare two columns. A small Fs value indicates that two columns are very similar, while a large Fs indicates they are different [60] [61].
Practical Column Comparison: In a study comparing five USP L1-type C18 columns, distinct selectivity differences were observed. For example, a high surface coverage C18 phase (HSS C18, 3.2 µmol/m²) showed a different chromatographic profile compared to a residual silanol-rich counterpart (HSS C18 SB, 1.6 µmol/m²). Despite their pronounced physicochemical differences, multidimensional modeling revealed a shared Method Operable Design Region (MODR) where both phases demonstrated interchangeable chromatographic performance at tG = 12 min, T = 30 °C, and pH = 2.5 [61].
Table 2: Selected Column Parameters from the Hydrophobic Subtraction Model Database [60]
| Column Name | Manufacturer | H | S* | A | B | C (pH 2.8) | Phase Type |
|---|---|---|---|---|---|---|---|
| Zorbax Eclipse XDB-C18 | Agilent Technologies | 1.07 | 0.02 | -0.06 | -0.03 | 0.05 | C18 |
| Zorbax StableBond C18 | Agilent Technologies | 0.99 | -0.03 | 0.26 | 0.00 | 0.13 | C18 |
| Kromasil 100-5 C18 | Kromasil by Nouryon | 1.05 | 0.03 | -0.07 | -0.02 | 0.03 | C18 |
| Zorbax SB-Phenyl | Agilent Technologies | 0.62 | -0.16 | 0.06 | 0.03 | 0.03 | Phenyl |
Batch-to-Batch and System Reproducibility
Batch-to-Batch Variation: A study of 12 identical bridged ethylene-hybrid (BEH) UHPLC columns from different batches showed strong overall agreement. However, notable differences were identified in specific regions of the design space, underscoring the need to select robust method conditions within a shared inter-column MODR to ensure consistent performance [61].
Instrument-to-Instrument Variability: Method transfer between different HPLC systems (e.g., binary vs. quaternary pumps with different dwell volumes) can lead to shifts in separation MODRs. Selecting method conditions from the shared instrument-specific MODR, with or without prior compensation for system volumes, ensures a robust transfer [61].
Mobile Phase Composition and Optimization
The mobile phase acts as a liquid tunable parameter, fine-tuning the separation by modulating analyte interactions with the stationary phase.
pH and Buffer Selection: The pH of the mobile phase is one of the most influential parameters for selectivity, especially for ionizable compounds. It affects the ionization state of both the analyte and the residual silanols on the stationary phase surface [61] [62]. Using a buffer is essential to maintain a consistent pH. For example, a study on basic compounds used 0.1% (v/v) trifluoroacetic acid as a buffering agent [62].
Organic Modifier and Linear Solvent Strength (LSS) Theory: The LSS theory describes the relationship between the retention factor (k) and the volume fraction of organic modifier (φ), such as acetonitrile or methanol, in the mobile phase: log k = log kw - Sφ [63]. Here, kw is the extrapolated retention factor in pure water, and S is the solvent strength parameter for the solute. This model allows for the prediction of retention times as a function of solvent composition, facilitating systematic method development [63].
Role of Additives: The addition of small amounts (1-3% v/v) of an ancillary solvent like n-butanol can significantly improve the re-equilibration time of the column between gradient runs by enhancing the wetting of the stationary phase [62].
Gradient Elution Optimization
Gradient elution, where the mobile phase composition changes during the analysis, is a powerful technique for separating complex mixtures with a wide range of analyte polarities.
Gradient vs. Isocratic Elution
Speed and Efficiency: For samples that can be separated isocratically, gradient elution can provide a shorter overall analysis time with similar resolution of the critical pair, without sacrificing repeatability in retention time, peak area, or linearity of the calibration curve [64].
Application Scope: Gradient elution is often essential for the direct separation of complex mixtures [65]. Isocratic elution remains preferable when the sample contains fewer than 10 weakly retained components or when the gradient baseline interferes with trace analysis [64].
Re-equilibration and System Volumes
Achieving Full Equilibrium: After a gradient run, the column must be re-equilibrated to the initial conditions before the next injection. For basic compounds in buffered eluents, studies show that about five column volumes of re-equilibration are required to achieve "full equilibrium" (time-invariant retention). The use of n-butanol as an additive was found to ensure adequate stationary phase wetting, making the re-equilibration volume requirement independent of flow rate [62].
System Dwell Volume: The dwell volume (VD) of an HPLC system is the volume between the point where the solvents are mixed and the head of the column. Differences in dwell volume between instruments can lead to retention time shifts and must be accounted for during method transfer. A common experimental compensation is to use an initial isocratic hold to account for these differences [61].
Advanced Modeling and In-Silico Prediction
Multidimensional Modeling: Advanced modeling approaches use a limited number of initial experiments (e.g., a 2×2×3 = 12 input runs for a 3-parameter model) to calibrate a highly descriptive model. These models can accurately map separation patterns, helping to identify robust MODRs for method development, column selection, and system comparison [61].
Data-Driven Prediction (In-Silico HPLC): Emerging methodologies aim to predict retention times without experiments by combining Quantitative Structure-Property Relationships (QSPR) using molecular descriptors, Linear Solvation Energy Relationships (LSER), and Linear Solvent Strength (LSS) theory. This data-driven approach can significantly reduce the experimental load and accelerate HPLC method development [63].
The following diagram summarizes the key parameters and their interactions in an optimized gradient elution workflow.
The Scientist's Toolkit: Essential Research Reagent Solutions
Table 3: Key Reagents and Materials for HPLC Method Development
| Reagent/Material | Function in HPLC Analysis | Exemplary Use-Case |
|---|---|---|
| C18 Stationary Phase | Reversed-phase separation of non-polar to medium polarity compounds; most common stationary phase. | Separation of repaglinide [6], canagliflozin [59], and levofloxacin [8]. |
| Acetonitrile & Methanol | Organic modifiers in the mobile phase to control retention and selectivity. | Methanol:Water (80:20) for repaglinide [6]; Acetonitrile:Orthophosphoric acid (50:50) for canagliflozin [59]. |
| Trifluoroacetic Acid (TFA) | Ion-pairing agent and pH modifier; enhances peak shape for ionizable compounds, especially basics. | Used at 0.1% (v/v) with n-butanol for fast re-equilibration of basic drugs [62]. |
| Potassium Dihydrogen Phosphate (KH₂PO₄) | Component of aqueous buffer to control mobile phase pH. | Used in the mobile phase for levofloxacin analysis [8]. |
| n-Butanol | Ancillary solvent additive to improve stationary phase wetting and reduce re-equilibration time. | Added at 1% (v/v) to achieve full column equilibrium with only ~5 column volumes [62]. |
| Tetrabutylammonium Salts | Ion-pairing reagents for separating ionic or ionizable compounds. | Tetrabutylammonium hydrogen sulphate was used in the mobile phase for levofloxacin [8]. |
Optimizing an HPLC method is a multivariate challenge that requires a systematic understanding of how column chemistry, mobile phase composition, and gradient profile interact. As demonstrated, HPLC provides distinct advantages over UV-Vis spectroscopy for quantifying drugs in complex matrices due to its superior specificity and accuracy. The use of comparative models, such as the Hydrophobic Subtraction Model for column selection and the Linear Solvent Strength theory for mobile phase optimization, provides a scientific framework for method development. Furthermore, embracing advanced modeling and in-silico prediction tools can dramatically reduce experimental time and cost. By applying the principles and data outlined in this guide, scientists and drug development professionals can develop robust, reliable, and efficient HPLC methods tailored to their specific analytical needs.
In the field of pharmaceutical analysis, researchers must constantly balance the need for precise, reliable data with practical considerations of cost, time, and environmental impact. High-performance liquid chromatography (HPLC) stands as a powerful, sensitive, and highly specific technique for drug quantification, often considered the gold standard for complex analyses [27]. However, its significant drawbacks—high instrumentation and maintenance costs, substantial solvent consumption, and operational complexity—can limit its accessibility and sustainability [40]. Ultraviolet-visible (UV-Vis) spectroscopy emerges as a compelling alternative that can effectively mitigate these drawbacks for a wide range of applications, offering a simpler, faster, and more economical approach without compromising data quality where its use is appropriate [6] [66]. This guide provides an objective comparison of these two techniques to help scientists make informed methodological choices.
Direct Technique Comparison: HPLC vs. UV-Vis
The choice between HPLC and UV-Vis spectroscopy involves trade-offs across several technical and operational parameters. The table below summarizes a direct comparison of their core characteristics.
Table 1: Core Characteristics of HPLC and UV-Vis Spectroscopy
| Feature | HPLC | UV-Vis Spectroscopy |
|---|---|---|
| Cost & Equipment | High cost; complex instrumentation [40] | Low cost; simple setup [40] [26] |
| Selectivity & Specificity | High; excellent separation capabilities for complex mixtures [40] [27] | Limited; spectral overlaps are common, best for simple or predefined mixtures [40] |
| Sensitivity | Superior; can detect low-level impurities and analytes [40] [67] | Good for standard assays, but generally less sensitive than HPLC [40] |
| Sample Preparation | Often requires optimized mobile phases, extensive cleanup [40] | Minimal preparation required [40] |
| Analysis Speed | Moderate to slow; run times can be lengthy [40] | Very fast; analysis is nearly instantaneous [40] |
| Solvent Consumption & Environmental Impact | High solvent use; generates significant waste [40] [27] | Very low solvent consumption; greener profile [66] [27] |
| Operational Skill Required | Requires skilled technicians for operation and maintenance [40] | Simple to operate; minimal training needed [40] |
| Ideal Use Cases | Complex formulations, impurity profiling, stability-indicating methods [40] | Routine QC of simple APIs, single-component analysis, rapid screening [40] |
Supporting Experimental Data and Case Studies
Independent research and validation studies provide concrete evidence of how UV-Vis methods can serve as reliable alternatives to HPLC in specific contexts, mitigating the stated drawbacks.
Table 2: Summary of Experimental Comparisons from Peer-Reviewed Studies
| Study Focus | Experimental Protocol Summary | Key Findings & Performance Data |
|---|---|---|
| Determination of Repaglinide in Tablets [6] | UV-Vis: Absorbance measured at 241 nm in methanol.HPLC: RP-HPLC with C18 column, mobile phase MeOH:Water (80:20, pH 3.5), detection at 241 nm. | Linearity: Both showed excellent linearity (R² > 0.999).Precision: Both showed RSD < 1.5%.Accuracy: Mean recovery was 99.63-100.45% (UV) and 99.71-100.25% (HPLC).Conclusion: The UV method was found to be reliable, simple, fast, and economical for quality control. |
| Analysis of Levofloxacin from Composite Scaffolds [8] | HPLC: C18 column, complex mobile phase with phosphate buffer and ion-pairing reagent.UV-Vis: Direct absorbance measurement in simulated body fluid. | Recovery Rates: HPLC showed variable recovery (96.37% to 110.96%), while UV-Vis showed consistent recovery (96.00% to 99.50%).Conclusion: In this complex matrix with impurity interference, UV-Vis was deemed inaccurate. HPLC was the preferred method, highlighting its superiority for complex samples. |
| Eco-Friendly Analysis of Efonidipine and Telmisartan [66] | UV-Vis: Simultaneous equation method using 251 nm and 296 nm.HPLC: DOE-optimized RP-HPLC with Ethanol:ACN:Water mobile phase. | Validation: Both methods were validated per ICH guidelines, showing linearity, precision, and accuracy.Greenness: The study emphasized the low solvent consumption and environmental sustainability of the UV method, and the use of greener solvents like ethanol in the optimized HPLC method. |
The Scientist's Toolkit: Essential Reagent Solutions
The following table outlines key reagents and materials used in these analytical methods, with their specific functions.
Table 3: Key Research Reagents and Their Functions
| Reagent/Material | Primary Function in Analysis |
|---|---|
| Methanol / Acetonitrile (HPLC-grade) | Common organic solvents used in mobile phases to elute analytes from the HPLC column [6] [8]. |
| C18 Reverse-Phase Column | The most common HPLC column; its non-polar stationary phase separates compounds based on hydrophobicity [6] [66]. |
| Buffer Salts (e.g., KH₂PO₄) | Used to control the pH of the mobile phase, which is critical for achieving sharp peaks and reproducible separations [8]. |
| Orthophosphoric Acid | Used to adjust and stabilize the pH of aqueous mobile phases in RP-HPLC [66]. |
| Reference Standard | A highly purified and characterized form of the analyte used to prepare calibration standards and ensure method accuracy [6]. |
Decision Workflow: Selecting the Right Analytical Tool
The following diagram illustrates a logical workflow to guide the selection of the most appropriate technique based on the analytical challenge and practical constraints.
UV-Vis spectroscopy presents a viable strategy for mitigating the cost, solvent consumption, and operational complexity associated with HPLC. For routine quality control of raw materials and simple formulations, UV-Vis offers a rapid, cost-effective, and environmentally friendlier solution without sacrificing accuracy or precision [40] [6]. The emergence of advanced chemometric tools like Artificial Neural Networks (ANN) coupled with algorithms such as the Firefly Algorithm (FA) further enhances the capability of UV-Vis to resolve complex, overlapping spectral data, expanding its application range [27].
However, HPLC remains indispensable for complex matrices, requiring high specificity for impurity profiling, stability studies, and analysis of compounds without chromophores [40] [8]. The ongoing development of UHPLC and green HPLC methods using eco-friendly solvents aims to directly address some of HPLC's inherent drawbacks [40] [66].
Ultimately, the choice is not about one technique superseding the other, but about selecting the right tool for the specific analytical problem, available resources, and sustainability goals. A thorough understanding of both methodologies empowers researchers to optimize their workflow efficiently.
In the field of pharmaceutical research and forensic science, the accurate quantification of active pharmaceutical ingredients (APIs) and the identification of illicit substances represent a critical analytical challenge. For years, High-Performance Liquid Chromatography (HPLC) and Ultraviolet-Visible (UV-Vis) spectroscopy have served as the cornerstone techniques for drug quantification, each with well-documented advantages and limitations. HPLC offers high sensitivity and specificity but requires extensive method development, costly solvents, and regular calibration with reference standards. UV-Vis spectroscopy, while simpler and more cost-effective, often lacks the specificity for complex mixtures and is susceptible to interference from excipients or cutting agents [6] [5]. Within this context, benchtop Nuclear Magnetic Resonance (NMR) spectroscopy has emerged as a compelling alternative. The recent integration of advanced data processing techniques, namely Global Spectral Deconvolution (GSD) and Quantum Mechanical Modelling (QMM), has significantly enhanced the quantitative capabilities of benchtop NMR, positioning it as a robust, complementary technique for drug quantification in both pharmaceutical and forensic applications [68].
Quantitative Performance Comparison Across Analytical Techniques
The efficacy of any analytical technique is ultimately judged by its accuracy, precision, and practicality. The following table summarizes key performance metrics for UV-Vis, HPLC, and benchtop NMR across different drug quantification scenarios, based on recent comparative studies.
Table 1: Performance Comparison of UV-Vis, HPLC, and Benchtop NMR for Drug Analysis
| Analytical Technique | Analyzed Drug | Key Performance Metrics | Reported Advantages | Reported Limitations |
|---|---|---|---|---|
| UV-Vis Spectrophotometry | Repaglinide [6] | Linearity (R²): >0.999; Precision (%RSD): <1.5; Recovery: 99.63-100.45% | Simple, fast, economical; suitable for bulk drug and formulation analysis [6]. | Lacks specificity in complex mixtures; prone to interference [5]. |
| UV-Vis Spectrophotometry | Levofloxacin [5] | Linearity (R²): 0.9999; Recovery (Low/Med/High): 96.00±2.00%, 99.50±0.00%, 98.67±0.06% | Simple and direct measurement. | Inaccurate for drugs loaded on complex biodegradable composites; recovery rates less reliable [5]. |
| HPLC-UV | Repaglinide [6] | Linearity (R²): >0.999; Precision (%RSD): <1.5; Recovery: 99.71-100.25% | High precision, accurate, specific; reliable for quality control [6]. | Requires method development, reference standards, and costly solvents [68] [69]. |
| HPLC-UV | Levofloxacin [5] | Linearity (R²): 0.9991; Recovery (Low/Med/High): 96.37±0.50%, 110.96±0.23%, 104.79±0.06% | Preferred method for complex drug-delivery systems; handles impurity interference [5]. | Higher operational complexity and cost [68]. |
| HPLC-UV | Various Drugs [69] | High specificity and sensitivity | Versatile; wide choice of stationary/mobile phases; hyphenated systems (e.g., HPLC-MS) available [69]. | Demanding for body fluid analysis; requires sample pre-treatment [69]. |
| Benchtop NMR (with QMM) | Methamphetamine [68] | RMSE: 2.1 (vs. 1.1 for HPLC-UV) for purity quantification | Cost-effective, robust; simultaneous quantification of active substances and impurities; reduced solvents/calibration [68]. | Slightly lower precision than HPLC-UV [68]. |
The data reveals a clear trend: while HPLC maintains superior precision in most cases, benchtop NMR equipped with advanced data processing achieves a level of accuracy that is competitive for many applications. For instance, in the analysis of methamphetamine hydrochloride in mixtures with cutting agents, benchtop NMR with QMM achieved a Root Mean Square Error (RMSE) of 2.1, which is remarkably close to the 1.1 achieved by HPLC-UV [68]. This performance, coupled with its other advantages, makes it a viable tool for quantitative analysis.
Experimental Protocols for Benchtop NMR Analysis
To achieve the quantitative results cited, specific experimental and data processing protocols must be followed. The following workflow details the standard procedure for quantifying a drug substance, such as methamphetamine, using a benchtop NMR system.
Sample Preparation and Data Acquisition
- Instrumentation: A 60-MHz benchtop NMR spectrometer is used for analysis. These compact instruments are designed to fit on a laboratory bench, offering a cost-effective and accessible alternative to high-field NMR systems [68] [70].
- Sample Preparation: Samples containing the target analyte (e.g., methamphetamine hydrochloride) across a purity range of 10 to 90 mg per 100 mg of sample are prepared. These are mixed with common cutting agents (e.g., methylsulfonylmethane, caffeine, N-isopropylbenzylamine hydrochloride) and potential impurities (e.g., pseudoephedrine hydrochloride) to simulate real-world conditions [68].
- Data Acquisition: The proton (1H) NMR spectrum is acquired under standard conditions. The resulting spectrum contains all the information on the molecular structure and quantity but is often complicated by signal overlap and noise [68].
Advanced Data Processing: GSD and QMM
The raw NMR spectrum requires sophisticated processing to extract accurate quantitative data. This is where GSD and QMM play a transformative role.
Global Spectral Deconvolution (GSD): GSD is a powerful algorithm that automatically reduces a complex frequency-domain spectrum into a list of individual Lorentzian peaks. It effectively strips away noise and baseline drift, outputting a clean set of parameters for each spectral line: frequency, amplitude, line width, and phase [71].
- Function: GSD dramatically enhances resolution, turning shoulder peaks into distinct, identifiable signals. This is crucial for accurately quantifying overlapping peaks, such as those found in complex drug mixtures [71].
- Solvent Recognition: A key feature of GSD is its integrated fuzzy-logic expert system that automatically identifies and labels solvent peaks (e.g., chloroform, DMSO, water), even when they overlap with compound resonances. This prevents interference during quantitative analysis [71].
Quantum Mechanical Modelling (QMM): Following deconvolution, QMM is applied for the most accurate quantification. This method uses a quantum mechanical model of the spin system to iteratively optimize spectral parameters, fitting the theoretical spectrum to the experimental data [68] [71].
- Performance: In the comparative study of methamphetamine, the QMM approach yielded the lowest error among NMR methods, with an RMSE of 1.3-mg analyte per 100 mg of sample, demonstrating its superior accuracy for purity determination [68].
Table 2: Key Research Reagent Solutions for Benchtop NMR Experiments
| Item Name | Function / Role in the Experiment |
|---|---|
| Benchtop NMR Spectrometer | Compact instrument (typically 60 MHz) for acquiring NMR data on a laboratory bench; enables structural elucidation and quantification [68] [70]. |
| Deuterated Solvent | Provides the signal for instrument locking and shimming; also serves as the dissolution medium for the sample (e.g., CDCl3, DMSO-d6) [71]. |
| Global Spectral Deconvolution (GSD) Algorithm | Advanced software algorithm that deconvolves overlapping peaks in the raw NMR spectrum, producing a clean list of individual Lorentzian peaks for analysis [68] [71]. |
| Quantum Mechanical Model (QMM) | Quantitative software tool that uses a first-principles quantum mechanical calculation to fit and quantify the deconvolved spectral data with high accuracy [68]. |
| Cutting Agent Standards | Pure reference compounds (e.g., caffeine, phenethylamine HCl) used to identify and quantify substances mixed with the primary analyte in forensic samples [68]. |
The Role of GSD in Automated NMR Analysis
The automation of NMR spectral analysis is vital for high-throughput applications. GSD addresses the fundamental challenge of distinguishing compound peaks from artefacts like solvent residues and impurities.
As illustrated in Figure 2, GSD, combined with a fuzzy-logic expert system, classifies peaks based on their properties. For example, it can identify a solvent peak like DMSO not only by its chemical shift but also by its characteristic quintet multiplicity and the presence of 13C satellites, even if the shift varies slightly due to concentration or temperature [71]. This automated classification is a critical prerequisite for reliable, high-throughput quantitative analysis.
The integration of advanced data processing techniques like Global Spectral Deconvolution and Quantum Mechanical Modelling has fundamentally upgraded the capabilities of benchtop NMR spectroscopy. While HPLC-UV remains the gold standard for sensitivity in drug quantification, benchtop NMR with QMM presents a highly competitive, cost-effective, and robust alternative [68]. Its ability to simultaneously identify and quantify multiple components in a mixture—including active ingredients, impurities, and cutting agents—with minimal solvent use and without absolute dependence on calibrated standards, makes it exceptionally valuable for forensic science and harm-reduction drug checking services [68]. Furthermore, its utility in pharmaceutical quality control and academic research is significant. As these algorithms continue to evolve, potentially incorporating artificial intelligence, benchtop NMR is poised to become an even more powerful and indispensable tool in the analytical scientist's toolkit.
Ensuring Excellence: Method Validation, Regulatory Compliance, and Direct Comparison
In the field of pharmaceutical analysis, the choice of analytical technique is critical for ensuring drug quality, safety, and efficacy. High-performance liquid chromatography (HPLC) and ultraviolet-visible (UV-Vis) spectroscopy represent two fundamentally different approaches to drug quantification, each with distinct advantages and limitations. This comparison guide examines these techniques through the lens of key validation parameters—specificity, linearity, accuracy, precision, limit of detection (LOD), and limit of quantification (LOQ)—providing researchers and drug development professionals with experimental data to inform analytical method selection.
Technical Comparison of UV-Vis Spectroscopy and HPLC
Table 1: Fundamental Characteristics of UV-Vis Spectroscopy and HPLC
| Feature | UV-Vis Spectroscopy | High-Performance Liquid Chromatography (HPLC) |
|---|---|---|
| Principle | Measures electronic transitions in molecules at specific wavelengths [72] | Separates components based on partitioning between mobile and stationary phases [6] |
| Analysis Type | Provides collective information without separation | Provides individual compound separation and quantification |
| Sample Preparation | Typically minimal, may require dissolution and filtration [9] | Often more extensive, may require derivatization or extraction [73] |
| Analysis Speed | Rapid (seconds to minutes) [7] | Slower (minutes to tens of minutes) [6] |
| Cost | Lower instrument and operational costs [7] | Higher instrument costs and solvent consumption [7] |
| Automation Potential | Moderate | High |
| Solvent Consumption | Low | Significant [7] |
Comparative Experimental Data on Validation Parameters
Experimental data from direct comparison studies provides valuable insights into the performance characteristics of UV-Vis spectroscopy and HPLC for pharmaceutical analysis.
Table 2: Comparison of Validation Parameters for Repaglinide Determination [6]
| Validation Parameter | UV-Vis Spectroscopy Results | HPLC Results |
|---|---|---|
| Linearity Range | 5-30 μg/mL | 5-50 μg/mL |
| Correlation Coefficient (r²) | >0.999 | >0.999 |
| Precision (% RSD) | <1.50% | <1.50% (more precise) |
| Accuracy (% Recovery) | 99.63-100.45% | 99.71-100.25% |
| LOD/LOQ | Not specified in study | Not specified in study |
Table 3: Method Performance in Complex Mixtures (Levofloxacin Study) [8]
| Parameter | UV-Vis Spectroscopy | HPLC |
|---|---|---|
| Linear Range | 0.05-300 μg/mL | 0.05-300 μg/mL |
| Regression Equation | y=0.065x+0.017 | y=0.033x+0.010 |
| Correlation (R²) | 0.9999 | 0.9991 |
| Recovery at Low Concentration | 96.00±2.00% | 96.37±0.50% |
| Recovery at Medium Concentration | 99.50±0.00% | 110.96±0.23% |
| Recovery at High Concentration | 98.67±0.06% | 104.79±0.06% |
Detailed Experimental Protocols
- Column: Agilent TC-C18 (250 mm × 4.6 mm i.d., 5 μm particle size)
- Mobile Phase: Methanol and water (80:20 v/v, pH adjusted to 3.5 with orthophosphoric acid)
- Flow Rate: 1.0 mL/min
- Detection: UV at 241 nm
- Injection Volume: 20 μL
- Standard Preparation: Stock solution of 1000 μg/mL repaglinide in methanol, diluted with mobile phase to concentrations of 5-50 μg/mL
- Sample Preparation: Twenty tablets weighed and finely powdered. A portion equivalent to 10 mg repaglinide dissolved in 30 mL methanol, sonicated for 15 minutes, diluted to 100 mL, and filtered. Filtrate diluted with mobile phase to final concentration within linearity range.
- Instrument: Double beam UV-Vis spectrophotometer with 1.0 cm quartz cells
- Wavelength: 241 nm
- Solvent: Methanol
- Standard Preparation: Stock solution of 1000 μg/mL repaglinide in methanol, diluted with methanol to concentrations of 5-30 μg/mL
- Sample Preparation: Tablet powder processed similarly to HPLC method, but final dilution performed with methanol instead of mobile phase
- Challenge: Simultaneous quantification of clofazimine (CLZ) and dapsone (DAP) in combined formulations with significant spectral overlap
- Solution: Application of multivariate calibration models (Partial Least Squares - PLS and Multivariate Curve Resolution with Alternating Least Squares - MCR-ALS) to UV-Vis spectral data
- Procedure: UV-Vis spectra recorded for synthetic mixtures of CLZ and DAP prepared according to factorial design. Chemometric models built using calibration set and validated with test set. Models successfully quantified both drugs in combined tablets and dissolution tests despite sample matrix effects and interferents.
Visual Comparison of Method Workflows
Figure 1: Analytical Workflow Comparison between UV-Vis Spectroscopy and HPLC
Essential Research Reagent Solutions
Table 4: Key Reagents and Materials for Pharmaceutical Analysis
| Reagent/Material | Function | Example Applications |
|---|---|---|
| HPLC-Grade Methanol & Acetonitrile | Mobile phase components for reverse-phase chromatography | Repaglinide analysis [6], Lamivudine analysis [9] |
| Buffer Salts (e.g., KH₂PO₄) | Mobile phase modification for pH control | Levofloxacin analysis [8] |
| Orthophosphoric Acid | Mobile phase pH adjustment | Repaglinide analysis (pH 3.5) [6] |
| C18 Chromatographic Columns | Stationary phase for reverse-phase separation | Repaglinide [6], Levofloxacin [8], Lamivudine [9] |
| Spectroscopic-Grade Solvents | Sample dissolution and dilution for UV-Vis | Methanol for repaglinide [6], 0.01N HCl for lamivudine [9] |
| Standard Reference Compounds | Method calibration and validation | Essential for all quantitative analyses [6] [8] |
Advanced Applications and Modern Approaches
Enhancement of UV-Vis Spectroscopy with Chemometrics
For complex mixtures where traditional UV-Vis spectroscopy faces limitations due to spectral overlap, advanced computational approaches have been developed:
Multivariate Calibration Models: Techniques such as Partial Least Squares (PLS) and Multivariate Curve Resolution with Alternating Least Squares (MCR-ALS) enable simultaneous quantification of multiple analytes despite significant spectral overlap, as demonstrated for clofazimine and dapsone in combined formulations [7].
Artificial Neural Networks (ANN): Coupled with optimization algorithms like the Firefly Algorithm, ANN models can effectively resolve ternary mixtures of cardiovascular drugs (propranolol, rosuvastatin, and valsartan) using UV fingerprint data, achieving accuracy and precision compliant with ICH guidelines [27].
Baseline Manipulation Methodology: Novel approaches like singular and multiple baseline manipulation methods enable simultaneous determination of drug combinations (e.g., drotaverine and etoricoxib) without chromatographic separation by using strategic blank solutions to isolate analytical wavelengths [74].
The selection between UV-Vis spectroscopy and HPLC for drug quantification depends on multiple factors including analytical requirements, sample complexity, and available resources. HPLC provides superior specificity for complex mixtures and multi-component analyses through physical separation of compounds, with enhanced precision and broader linear dynamic ranges. UV-Vis spectroscopy offers advantages in speed, cost-effectiveness, and simplicity for single-component analyses or well-characterized systems. Modern enhancements with chemometric approaches have significantly expanded UV-Vis capabilities for complex mixture analysis. For routine quality control of single-component formulations, UV-Vis remains a robust and efficient choice, while HPLC is indispensable for method development, complex matrices, and regulatory applications requiring uncompromised specificity.
The reliability of pharmaceutical analysis is paramount to ensuring drug safety, efficacy, and quality. This landscape is governed by a framework of guidelines from the International Council for Harmonisation (ICH), the United States Pharmacopeia (USP), and the U.S. Food and Drug Administration (FDA). These standards provide the foundation for validating analytical methods to guarantee their accuracy, precision, and specificity. For researchers and drug development professionals, understanding the interplay between these guidelines is crucial when selecting and validating analytical techniques like UV-Visible spectrophotometry (UV-Vis) and High-Performance Liquid Chromatography (HPLC). This guide objectively compares these two common techniques within the current regulatory context, supported by experimental data and a clear overview of the governing principles.
The regulatory framework for analytical procedures is evolving. ICH Q2(R1) has long been the cornerstone for validation, outlining key parameters like accuracy, precision, and specificity. The forthcoming ICH Q2(R2) and ICH Q14 guidelines are expected to further emphasize a lifecycle approach, integrating analytical procedure development with robust, data-driven validation [75]. Similarly, the FDA's 2025 guidance on bioanalytical method validation for biomarkers references ICH M10, while acknowledging that biomarker assays may require different considerations than traditional drug assays [76] [77]. Furthermore, USP monographs provide legally enforceable standards for drug substances and products, including specific tests and acceptance criteria [78] [79].
Comparative Analysis: UV-Vis Spectroscopy vs. HPLC
The choice between UV-Vis and HPLC hinges on the application's specific requirements for sensitivity, specificity, and throughput. The following comparison synthesizes data from recent studies to highlight the performance characteristics of each method.
Performance Comparison for Drug Quantification
Table 1: Comparison of UV-Vis and HPLC based on validation parameters for single-drug analysis (Repaglinide) [6]
| Validation Parameter | UV-Vis Method | HPLC Method |
|---|---|---|
| Analyte | Repaglinide | Repaglinide |
| Linearity Range | 5–30 μg/mL | 5–50 μg/mL |
| Regression Coefficient (r²) | > 0.999 | > 0.999 |
| Precision (% R.S.D.) | < 1.50% | < 1.50% |
| Accuracy (% Recovery) | 99.63–100.45% | 99.71–100.25% |
| Limit of Detection (LOD) / Quantitation (LOQ) | Calculated per ICH | Calculated per ICH |
Table 2: Method comparison for Levofloxacin release from a complex drug-delivery system [8]
| Parameter | UV-Vis Method | HPLC Method |
|---|---|---|
| Application Context | Levofloxacin in composite scaffolds | Levofloxacin in composite scaffolds |
| Linearity Range | 0.05–300 μg/mL | 0.05–300 μg/mL |
| Regression Equation | y=0.065x+0.017 | y=0.033x+0.010 |
| Regression Coefficient (r²) | 0.9999 | 0.9991 |
| Recovery (5 μg/mL - Low) | 96.00% ± 2.00 | 96.37% ± 0.50 |
| Recovery (25 μg/mL - Medium) | 99.50% ± 0.00 | 110.96% ± 0.23 |
| Recovery (50 μg/mL - High) | 98.67% ± 0.06 | 104.79% ± 0.06 |
| Conclusion | Less accurate due to impurity interference | Preferred for accurate assessment |
The data demonstrates that for a simple formulation like repaglinide tablets, both methods can be validated to meet ICH guidelines with excellent linearity, precision, and accuracy [6]. However, the HPLC method offered a wider linear range. In a more complex scenario involving a drug-delivery system with potential interferents, HPLC was clearly superior. The recovery data for levofloxacin showed that UV-Vis was less accurate, likely because it could not distinguish the drug from other components released from the scaffold, whereas HPLC could separate them [8].
Advanced Data Processing for UV-Vis in Mixture Analysis
A significant limitation of conventional UV-Vis is its inability to resolve spectrally overlapping compounds in a mixture. However, advanced chemometric methods can overcome this challenge. A 2025 study successfully quantified a ternary mixture of propranolol, rosuvastatin, and valsartan using UV-Vis spectroscopy coupled with Firefly Algorithm-enhanced Artificial Neural Networks (FA-ANN) [27].
The FA-ANN model used the full UV spectrum as input and, after variable selection, achieved excellent predictive accuracy validated per ICH guidelines. This approach transforms UV-Vis from a tool for simple solutions to a potent, green alternative for analyzing complex mixtures, provided robust multivariate calibration models are developed and validated [27].
Experimental Protocols and Workflows
- Objective: To develop a simple, validated RP-HPLC method for the determination of repaglinide in tablet dosage forms.
- Chromatographic Conditions:
- Column: Agilent TC-C18 (2) (250 mm × 4.6 mm, 5 μm particle size).
- Mobile Phase: Methanol and water in a ratio of 80:20 v/v, with pH adjusted to 3.5 using orthophosphoric acid.
- Flow Rate: 1.0 mL/min.
- Detection: UV at 241 nm.
- Injection Volume: 20 μL.
- Sample Temperature: Ambient.
- Standard Solution Preparation: A stock solution of repaglinide (1000 μg/mL) was prepared in methanol. Working standard solutions in the range of 5–50 μg/mL were prepared by dilution with the mobile phase.
- Sample Preparation (Tablets): Twenty tablets were weighed and finely powdered. A portion equivalent to 10 mg of repaglinide was transferred to a 100 mL volumetric flask, dissolved in 30 mL of methanol, sonicated for 15 minutes, and diluted to volume. The solution was filtered, and the filtrate was further diluted with mobile phase to a concentration within the linear range.
- Validation: The method was validated for linearity, precision, accuracy (recovery), specificity, and ruggedness as per ICH Q2(R1) guidelines.
HPLC Method Development Workflow
- Objective: To simultaneously determine propranolol, rosuvastatin, and valsartan in ternary mixtures using UV-Vis and machine learning.
- Instrumentation: Shimadzu UV-1800 spectrophotometer with 1 cm quartz cells; spectra recorded from 200–400 nm.
- Software: MATLAB R2016a for model development.
- Solution Preparation: Individual stock solutions (100 μg/mL) of each drug were prepared in distilled water.
- Experimental Design:
- Calibration Set: A partial factorial design (3 factors, 5 levels) generated 25 different mixture samples.
- Validation Set: A central composite design generated 20 samples for external validation.
- ANN Model Development:
- The UV spectra of all mixtures were recorded.
- The firefly algorithm (FA) was applied for wavelength selection to optimize the model input.
- A backpropagation artificial neural network (ANN) was trained using the selected wavelengths as input and the known drug concentrations as output.
- The model architecture (number of hidden layers/neurons) was optimized.
- Validation: The final FA-ANN model was validated using the external validation set and assessed for accuracy, precision, and selectivity per ICH guidelines. The method was also applied to commercial tablets.
Advanced UV-Vis with Chemometrics Workflow
The Scientist's Toolkit: Key Reagents and Materials
Table 3: Essential research reagents and solutions for pharmaceutical analysis
| Item | Function / Application | Example from Protocols |
|---|---|---|
| HPLC-Grade Methanol | Mobile phase component; solvent for standard/sample preparation. | Used in mobile phase for repaglinide HPLC [6]. |
| HPLC-Grade Water | Mobile phase component; dilution solvent. | Used with methanol for repaglinide analysis [6]. |
| Orthophosphoric Acid | Mobile phase pH modifier to improve peak shape and separation. | Used to adjust mobile phase to pH 3.5 [6]. |
| Reference Standards | Highly pure analyte used for calibration and recovery studies. | Repaglinide from USV Lab [6]; Levofloxacin from national control agency [8]. |
| Chromatographic Column | Stationary phase for compound separation (e.g., C18). | Agilent TC-C18 column [6]; Sepax BR-C18 column [8]. |
| Simulated Body Fluid (SBF) | Release medium for testing drug delivery systems. | Used for levofloxacin release studies from scaffolds [8]. |
| Internal Standard | Compound added to correct for analytical variability in HPLC. | Ciprofloxacin used in levofloxacin HPLC analysis [8]. |
Adherence to regulatory guidelines is not optional. The FDA emphasizes that validated analytical methods are "indispensable" for generating reliable data to demonstrate drug safety and efficacy [80]. For drug quantification in quality control, USP monographs often dictate specific tests and acceptance criteria [79]. The emerging trend is a risk-based, lifecycle approach to analytical methods, as reflected in modern ICH guidelines [75]. This means validation should be "fit-for-purpose," with the rigor aligned to the method's context of use—a principle explicitly acknowledged in biomarker validation [80] and applicable to technique selection.
- Choose HPLC when: Analyzing drugs in complex matrices (e.g., formulations with interferents, biological samples), characterizing impurity profiles, or when a USP monograph specifies a chromatographic method. It is the unequivocal choice for superior specificity and accuracy in challenging scenarios [8].
- Choose UV-Vis when: Performing routine quality control of simple formulations where the analyte has a distinct chromophore and no spectral interferents are present. It offers a fast, cost-effective, and solvent-efficient solution [6].
- Consider Advanced UV-Vis with Chemometrics when: Analyzing multi-component mixtures in a quality control environment. When combined with machine learning models like FA-ANN, UV-Vis can become a powerful, green, and rapid alternative to HPLC, provided the model is rigorously validated [27].
The choice between UV-Vis and HPLC is a balance of specificity, cost, speed, and regulatory requirements. HPLC remains the gold standard for its separation power and specificity, especially in regulated environments. However, UV-Vis, particularly when enhanced with advanced data analytics, presents a compelling, sustainable alternative for specific, well-defined applications. A firm understanding of ICH, USP, and FDA expectations ensures that the selected method will not only generate reliable data but also withstand regulatory scrutiny.
In the field of pharmaceutical research and quality control, the accurate quantification of active pharmaceutical ingredients (APIs) is paramount. High-performance liquid chromatography (HPLC) and ultraviolet-visible (UV-Vis) spectroscopy represent two foundational analytical techniques employed for this purpose. The selection between these methods involves critical trade-offs between analytical performance and practical considerations. This guide provides an objective, data-driven comparison of HPLC and UV-Vis spectroscopy for drug quantification, empowering researchers and drug development professionals to make informed methodological choices based on their specific project requirements, constraints, and data quality needs.
Technical Comparison: UV-Vis vs. HPLC
The following table summarizes the core technical characteristics of UV-Vis spectroscopy and HPLC based on experimental data from pharmaceutical studies.
Table 1: Technical Performance Comparison of UV-Vis and HPLC for Drug Quantification
| Parameter | UV-Vis Spectroscopy | High-Performance Liquid Chromatography (HPLC) |
|---|---|---|
| Principle | Measures absorbance of ultraviolet or visible light by a sample. | Separates components in a mixture followed by detection (often by UV-Vis). |
| Selectivity | Low; measures total absorbance without separation. | High; separates analytes from impurities before detection [8] [5]. |
| Sensitivity | Good for compounds with strong chromophores. | Generally higher; enhanced by the separation process [81]. |
| Accuracy in Complex Mixtures | Can be inaccurate due to interference from excipients or impurities [8] [5]. | High; capable of accurate quantification even in complex matrices like drug-loaded scaffolds [8] [5]. |
| Linear Range | Demonstrated for Levofloxacin: 0.05-300 µg/ml [8] [5]. | Demonstrated for Levofloxacin: 0.05-300 µg/ml [8] [5]. |
| Key Advantage | Rapid, simple, and low-cost. | High selectivity and certainty in identifying and quantifying target analytes. |
Experimental Data and Case Studies
Case Study 1: Quantification of Levofloxacin
A 2019 study directly compared HPLC and UV-Vis for measuring Levofloxacin released from a complex mesoporous silica microspheres/nano-hydroxyapatite composite scaffold, a typical drug-delivery system [8] [5].
- Objective: To determine the more reliable method for assessing sustained release characteristics.
- Key Findings:
- Linearity: Both methods showed excellent linearity (R² > 0.999) over the concentration range of 0.05-300 µg/ml [8] [5].
- Accuracy (Recovery): The recovery rates, which indicate accuracy, revealed a critical difference. For UV-Vis, recoveries were 96.00% ± 2.00, 99.50% ± 0.00, and 98.67% ± 0.06% for low, medium, and high concentrations, respectively. However, HPLC demonstrated superior and more consistent accuracy with recoveries of 96.37% ± 0.50, 110.96% ± 0.23, and 104.79% ± 0.06% for the same levels [8] [5].
- Conclusion: The study concluded that UV-Vis was not accurate for measuring drug concentration in this complex, multi-component biodegradable composite. HPLC was identified as the preferred method due to its superior ability to separate the drug from other components in the scaffold, thereby providing reliable quantification [8] [5].
Case Study 2: Determination of Repaglinide
A 2012 study developed and validated both UV and reversed-phase HPLC (RP-HPLC) methods for determining repaglinide in tablets [6].
- Objective: To establish fast and reliable methods for formulation screening and quality control.
- Key Findings:
- Conclusion: While both methods were deemed suitable for the quality control of repaglinide, HPLC offered advantages in precision and sensitivity [6].
Cost of Ownership Analysis
Beyond technical performance, the total cost of ownership is a crucial practical consideration.
Table 2: Cost and Operational Considerations
| Factor | UV-Vis Spectroscopy | High-Performance Liquid Chromatography (HPLC) |
|---|---|---|
| Instrument Cost | Lower initial investment. | Significantly higher initial purchase price [81]. |
| Operational Complexity | Low; minimal training required. | High; requires skilled operators for method development and troubleshooting. |
| Consumables & Running Costs | Low; primarily cuvettes and solvents. | High; includes costly columns, high-purity solvents, and other consumables [81]. |
| Sample Analysis Time | Very fast (minutes or less). | Longer per sample (typically 10-20 minutes per run). |
| Throughput | High for simple, routine analysis. | Lower throughput per instrument, but can be automated. |
The investment in an HPLC system is often justified in high-stakes R&D or when unambiguous compound identification is required, as it can prevent costly errors and provide a clear return on investment [81].
The Scientist's Toolkit: Essential Research Reagents and Materials
The following table details key materials and reagents used in the featured experiments for drug quantification.
Table 3: Essential Research Reagents and Materials for Drug Quantification Studies
| Item | Function / Application | Example from Literature |
|---|---|---|
| Reference Standard | Serves as the benchmark for identifying and quantifying the target analyte with high purity. | Repaglinide reference standard from USV Lab. Pvt. Ltd. [6]; Levofloxacin from National Institutes for Food and Drug Control [8] [5]. |
| HPLC-Grade Solvents | Used for mobile phase and sample preparation; high purity is critical to prevent baseline noise and column damage. | Methanol (HPLC-grade) [6] [8]. |
| Chromatography Column | The heart of the HPLC system where chemical separation occurs. | Agilent TC-C18 column [6]; Sepax BR-C18 column [8] [5]. |
| Internal Standard | A known compound added to samples to correct for variability in sample preparation and analysis. | Ciprofloxacin used in HPLC analysis of Levofloxacin [8] [5]. |
| Simulated Body Fluid (SBF) | A solution with ion concentrations similar to human blood plasma, used to study drug release in biologically relevant conditions. | Used as a solvent and release medium in the Levofloxacin scaffold study [8] [5]. |
Experimental Workflow Visualization
The diagrams below illustrate the generalized workflows for drug quantification using UV-Vis spectroscopy and HPLC, highlighting the fundamental difference in complexity and the step where selectivity is introduced.
UV-Vis Workflow: A simpler, direct measurement process.
HPLC Workflow: A multi-step process incorporating separation for enhanced selectivity.
The choice between UV-Vis spectroscopy and HPLC is not a matter of one technique being universally superior, but rather of selecting the right tool for the specific analytical challenge.
- UV-Vis Spectroscopy is a robust, cost-effective choice for routine quality control of pure substances or simple formulations where the analyte is known and no interfering substances are present. Its speed and low cost make it ideal for high-throughput environments [82].
- HPLC is the unequivocal choice for complex matrices, such as drug-delivery scaffolds, biological samples, or multi-component formulations, where selectivity is paramount. Its higher initial and operational costs are justified by the superior reliability, accuracy, and certainty of the results it provides, which are critical in drug development and regulatory submissions [8] [81] [5].
Researchers are advised to base their decision on the sample complexity, required data integrity, available resources, and the necessary balance between speed and selectivity. For the most demanding applications, the definitive identification power of HPLC coupled with mass spectrometry (MS) may be the necessary standard [81].
In the field of pharmaceutical research and quality control, the selection of an appropriate analytical technique is paramount for obtaining reliable and accurate results. High-performance liquid chromatography (HPLC) and ultraviolet-visible (UV-Vis) spectroscopy represent two fundamental pillars in drug quantification, each with distinct advantages, limitations, and application domains. While HPLC offers superior separation capabilities and specificity, UV-Vis spectroscopy provides simplicity, cost-effectiveness, and rapid analysis. This guide provides an objective comparison of these techniques through experimental performance metrics—specifically root mean square error (RMSE) and recovery rates—drawn from recent scientific studies, offering researchers a data-driven foundation for methodological selection in drug development and analysis.
High-Performance Liquid Chromatography (HPLC) is a separation technique that utilizes a liquid mobile phase to force analytes through a column packed with a stationary phase. Separation occurs based on differential partitioning between phases, and detection is typically achieved via UV-Vis, fluorescence, or mass spectrometric detection. Its greatest strength lies in its ability to separate and quantify individual components in complex mixtures, making it indispensable for analyzing drugs in the presence of degradants or formulation excipients [8] [83].
Ultraviolet-Visible (UV-Vis) Spectroscopy measures the absorption of light by a compound in solution. The amount of absorbed light is directly proportional to the concentration of the analyte, as described by the Beer-Lambert law. It is a straightforward, rapid, and cost-effective technique. However, its application is limited to compounds containing chromophores and can suffer from interference in samples where multiple components absorb at similar wavelengths [6] [36].
The selection of a detector for HPLC is influenced by the chemical nature of the analytes, potential impurities, sample matrix, and required sensitivity. For compounds with weak UV chromophores, HPLC methods may require specialized detectors like charged aerosol (CAD), evaporative light scattering (ELSD), or mass spectrometric (MS) detection, which adds to method complexity and cost [83].
Performance Metrics and Experimental Protocols
Key Metrics for Analytical Method Comparison
To objectively evaluate analytical techniques, specific performance metrics are employed during method validation:
- Recovery Rate: This measures the accuracy of the method by determining the percentage of a known, added amount of analyte that can be quantified. It reflects the method's ability to correctly measure the target concentration without significant interference from the sample matrix. Values close to 100% are ideal [8] [6].
- Root Mean Square Error (RMSE): A measure of the differences between values predicted by a model and the values observed. In analytical chemistry, a lower RMSE indicates higher predictive accuracy and precision of the method [84] [27].
- Linearity (R²): The correlation coefficient of the calibration curve, indicating how well the data points fit a straight line. A value closer to 1.000 denotes excellent linearity over the concentration range studied [6] [85].
Representative Experimental Protocols
The following are summarized protocols from key studies that directly compared HPLC and UV-Vis for drug quantification.
Protocol 1: Analysis of Levofloxacin in Composite Scaffolds [8]
- Objective: To determine the preferred method for assessing Levofloxacin release from a mesoporous silica/nano-hydroxyapatite composite scaffold.
- HPLC Method: A Sepax BR-C18 column was used with a mobile phase of 0.01 mol/L KH₂PO₄, methanol, and 0.5 mol/L tetrabutylammonium hydrogen sulphate. Detection was at 290 nm.
- UV-Vis Method: The maximum absorption wavelength was identified, and standard solutions were measured directly.
- Sample Preparation: The drug-loaded composite scaffolds were immersed in simulated body fluid, and samples were withdrawn at intervals for analysis.
Protocol 2: Analysis of Lamivudine in Tablet Formulation [85]
- Objective: To develop and compare methods for the quantification of the antiviral drug Lamivudine.
- HPLC Method: A Shimadzu C18 column with an isocratic mobile phase of methanol:water (70:30 v/v) was used. The flow rate was 1.0 mL/min, and detection was at 271 nm.
- UV-Vis Method: The absorption maximum of Lamivudine was determined to be 271 nm in methanol.
- Sample Preparation: Tablets were powdered, dissolved in methanol, sonicated, filtered, and diluted to the required concentration.
Protocol 3: Analysis of Repaglinide in Tablets [6]
- Objective: To support formulation screening and quality control with fast and reliable methods.
- HPLC Method: An Agilent TC-C18 column with a mobile phase of methanol and water (80:20 v/v, pH 3.5) was employed. Detection was at 241 nm.
- UV-Vis Method: Methanol was used as the solvent, and measurements were taken at 241 nm.
- Sample Preparation: Tablet powder was dissolved in methanol, sonicated, and diluted.
Comparative Performance Data from Recent Research
The following tables synthesize quantitative performance data from recent peer-reviewed studies, enabling a direct comparison of HPLC and UV-Vis spectroscopy.
Table 1: Comparison of Linear Range and Correlation for Drug Quantification
| Drug Analyzed | Analytical Method | Linear Range (μg/mL) | Correlation Coefficient (R²) | Reference |
|---|---|---|---|---|
| Levofloxacin | HPLC | 0.05 - 300 | 0.9991 | [8] |
| Levofloxacin | UV-Vis | 0.05 - 300 | 0.9999 | [8] |
| Repaglinide | HPLC | 5 - 50 | > 0.999 | [6] |
| Repaglinide | UV-Vis | 5 - 30 | > 0.999 | [6] |
| Lamivudine | HPLC | 2 - 12 | 0.9993 | [85] |
| Lamivudine | UV-Vis | 2 - 12 | 0.9980 | [85] |
| Naringenin | HPLC | 2.5 - 100 | > 0.999 | [86] |
| Naringenin | UV-Vis | 2 - 12 | > 0.999 | [86] |
Table 2: Recovery Rate and Precision Data
| Drug Analyzed | Analytical Method | Recovery Rate (%) (Low/Med/High Conc.) | Precision (% RSD) | Reference |
|---|---|---|---|---|
| Levofloxacin | HPLC | 96.37 / 110.96 / 104.79 | N/R | [8] |
| Levofloxacin | UV-Vis | 96.00 / 99.50 / 98.67 | N/R | [8] |
| Repaglinide | HPLC | 99.71 - 100.25 | < 1.50 | [6] |
| Repaglinide | UV-Vis | 99.63 - 100.45 | < 1.50 | [6] |
| Lamivudine | HPLC | 99.27 - 101.18 | < 2.0 | [85] |
| Lamivudine | UV-Vis | 98.40 - 100.52 | < 2.0 | [85] |
Table 3: RMSE and Error Data from Advanced Chemometric Models
| Application Context | Analytical Technique | Model Type | RMSEP / RRMSEP* | Reference |
|---|---|---|---|---|
| Montelukast & Levocetirizine | UV-Vis with Chemometrics | GA-PLS | 0.1872 (RMSEP) | [84] |
| Propranolol, Rosuvastatin, Valsartan | UV-Vis with Chemometrics | FA-ANN | 0.7516 (RRMSEP)* | [27] |
Note: RRMSEP (Relative Root Mean Square Error of Prediction) allows for comparison across different concentration scales.
Workflow and Decision Pathway for Method Selection
The following diagram illustrates the typical experimental workflow for a comparative analytical study and the key decision points for selecting between HPLC and UV-Vis spectroscopy.
The Scientist's Toolkit: Essential Research Reagents and Materials
Successful analytical method development relies on high-quality reagents and instruments. The following table lists key materials commonly used in the cited studies.
Table 4: Essential Research Reagents and Equipment for HPLC and UV-Vis Analysis
| Item | Function in Analysis | Example from Research |
|---|---|---|
| C18 Reverse-Phase Column | The stationary phase for separating compounds based on hydrophobicity in HPLC. | Sepax BR-C18 [8], Shimadzu C18 [85], Agilent TC-C18 [6] |
| HPLC-Grade Methanol / Acetonitrile | Used as components of the mobile phase to elute analytes from the HPLC column. | Used in mobile phases for Repaglinide [6], Lamivudine [85], and Naringenin [86] |
| Phosphate Buffers / Ion-Pair Reagents | Modify the mobile phase to control pH and improve separation of ionic compounds. | KH₂PO₄ and tetrabutylammonium hydrogen sulphate for Levofloxacin [8] |
| Ultrasonic Bath | Ensures complete dissolution and extraction of the active drug from solid samples. | Used for tablet sample preparation for Lamivudine [85] and Repaglinide [6] |
| Analytical Balance | Provides precise weighing of standard compounds and sample powders. | Mettler-Toledo balance [8], Shimadzu balance [84] |
| Syringe Filters | Removes particulate matter from samples before injection into the HPLC system. | 0.45 μm filters used in pharmaceutical sample preparation [27] |
| Volumetric Glassware | Used for accurate preparation and dilution of standard and sample solutions. | Used in all cited studies for preparing standard stock solutions [8] [6] [85] |
The empirical data from recent studies consistently demonstrates that HPLC generally provides superior accuracy and reliability in complex scenarios, such as analyzing drugs within intricate matrices like composite scaffolds [8] or when stability-indicating methods are required [85]. Its separation power mitigates interference, leading to more trustworthy quantification. However, UV-Vis spectroscopy remains a robust, cost-effective, and efficient alternative for routine quality control of formulations where the analyte is free from interfering substances and possesses a strong chromophore [6] [86].
The emerging integration of UV-Vis with advanced chemometric models (e.g., GA-PLS, FA-ANN) is significantly enhancing its capability to resolve complex mixtures, bridging the performance gap with HPLC for specific applications [84] [27]. This evolution, coupled with the inherent greenness and low cost of UV-Vis, positions it as a sustainable and increasingly powerful tool in the analytical scientist's arsenal. The choice between HPLC and UV-Vis should therefore be guided by a balanced consideration of the required accuracy, sample complexity, available resources, and environmental impact.
Analytical chemistry is undergoing a transformative shift, driven by technological advancements and a growing emphasis on sustainability. This evolution is characterized by the move from traditional, standalone techniques toward integrated, high-performance systems that offer superior accuracy, efficiency, and minimal environmental impact. Key trends include the adoption of Ultra-High-Performance Liquid Chromatography (UHPLC) for superior separation capabilities, the widespread integration of Liquid Chromatography-Mass Spectrometry (LC-MS) for unparalleled identification and quantification power, and the integration of Green Analytical Chemistry (GAC) principles to create more sustainable and eco-friendly methodologies. This guide objectively compares the performance of these emerging approaches against traditional alternatives, providing a framework for researchers and drug development professionals to select optimal techniques for their specific quantification needs.
Core Technique Comparison: UV-Vis Spectroscopy vs. HPLC for Drug Quantification
The choice between Ultraviolet-Visible (UV-Vis) spectroscopy and High-Performance Liquid Chromatography (HPLC) is fundamental in pharmaceutical analysis. While both are used for drug quantification, their operating principles, capabilities, and appropriate applications differ significantly.
Fundamental Principles and a Comparative Experiment
A direct comparison study quantified Levofloxacin released from a mesoporous silica microspheres/nano-hydroxyapatite composite scaffold, a complex drug-delivery system. The results highlight the critical performance differences between the two techniques [8].
Table 1: Experimental Comparison of HPLC and UV-Vis for Levofloxacin Quantification
| Parameter | HPLC Performance | UV-Vis Performance |
|---|---|---|
| Regression Equation | y = 0.033x + 0.010 | y = 0.065x + 0.017 |
| Linearity (R²) | 0.9991 | 0.9999 |
| Recovery (5 µg/mL) | 96.37 ± 0.50% | 96.00 ± 2.00% |
| Recovery (25 µg/mL) | 110.96 ± 0.23% | 99.50 ± 0.00% |
| Recovery (50 µg/mL) | 104.79 ± 0.06% | 98.67 ± 0.06% |
| Conclusion | Preferred method; accurate despite complex matrix | Less accurate; prone to interference from scaffold components |
The study concluded that UV-Vis is not accurate for measuring drug concentration in complex, multi-component scaffolds due to its inability to distinguish the target analyte from other UV-absorbing substances released from the biodegradable composite. HPLC, with its chromatographic separation step prior to detection, is the preferred method for evaluating the sustained release characteristics in such systems [8].
Protocol for Drug Quantification: HPLC vs. UV-Vis
HPLC Method for Levofloxacin [8]:
- Equipment: Shimadzu LC-2010AHT system with UV detector.
- Column: Sepax BR-C18 (250 × 4.6 mm, 5 µm particle size).
- Mobile Phase: 0.01 mol/L KH₂PO₄, Methanol, 0.5 mol/L tetrabutylammonium hydrogen sulphate (75:25:4 ratio).
- Flow Rate: 1.0 mL/min.
- Detection: 290 nm.
- Injection Volume: 10 µL for assay.
- Sample Preparation: The sample is vortex-mixed with an internal standard (Ciprofloxacin), extracted with dichloromethane, centrifuged, and the supernatant is dried under nitrogen before reconstitution.
UV-Vis Method for Levofloxacin [8]:
- Equipment: UV-2600 UV-Vis Spectrophotometer.
- Sample Preparation: The release medium is collected and directly analyzed without extensive cleanup.
- Detection: Maximum absorbance wavelength (e.g., ~280-290 nm for Levofloxacin).
- Calibration: Standard solutions of the drug in the same release medium.
A similar methodology was successfully applied for the analysis of the antiretroviral drug Lamivudine in tablet formulations, confirming that both HPLC and UV-Vis can comply with content uniformity specifications, though HPLC offers greater specificity [9].
The UHPLC and LC-MS Revolution: Enhanced Performance and Applications
The progression from HPLC to UHPLC and the hyphenation of chromatography with mass spectrometry (LC-MS) represent significant leaps in analytical capability.
UHPLC-MS/MS for Complex Mixtures
UHPLC employs sub-2-µm particles and higher operating pressures to deliver superior resolution, speed, and sensitivity compared to traditional HPLC. When coupled with tandem mass spectrometry (MS/MS), it becomes a powerful tool for targeted quantification in complex matrices.
A study on the quantification of mycotoxins in food exemplifies this. UPLC-MS/MS significantly reduced the analysis time from 30 minutes (with HPLC-MS/MS) to just 13 minutes, while simultaneously detecting and quantifying multiple targets like aflatoxins, enniatins, and zearalenone with high sensitivity and specificity [87]. The method used a Waters ACQUITY HSS T3 column (100 mm × 2.1 mm, 1.8 µm) and a methanol/water gradient with ammonium formate and formic acid for optimal ionization [87].
Another application developed a rapid 16-minute UHPLC-MS/MS method for the simultaneous identification and quantification of 25 oxygen heterocyclic compounds and terpenes in grapefruit essential oils. The method exhibited excellent linearity (R² > 0.99), low limits of detection (as low as 6 × 10⁻⁸ mg g⁻¹), and high precision, proving essential for safety assessment [88].
High-Resolution LC-MS for Metabolite Profiling
Liquid Chromatography coupled with High-Resolution Mass Spectrometry (LC-HR-MS) is ideal for untargeted analysis and the identification of unknown compounds. A study on Piper sarmentosum organs used UHPLC-ESI-QqTOF-MS to characterize the metabolic profiles of leaves, roots, stems, and fruits [89]. The high mass accuracy and resolution of the QqTOF instrument allowed for the tentative identification of 154 metabolites, revealing that flavonoids, lignans, and phenylpropanoids were predominant in leaves, while piperamides were concentrated in fruits [89]. This demonstrates the power of LC-HR-MS in comparative metabolomics and biomarker discovery.
Table 2: Comparison of LC-MS Platforms and Their Ideal Applications
| LC-MS Platform | Key Characteristics | Ideal Applications |
|---|---|---|
| Triple Quadrupole (QqQ) | High sensitivity and selectivity for targeted quantitation (MRM). | Forensic toxicology, pharmacokinetic studies, regulated contaminant testing (e.g., mycotoxins, PFAS) [87] [90]. |
| Q-TOF (Quadrupole Time-of-Flight) | High-resolution, accurate mass; suitable for untargeted screening. | Metabolite identification, metabolomics, lipidomics, unknown compound elucidation [89]. |
| Orbitrap | Very high resolution and mass accuracy; versatile. | Biopharma development, proteomics, multi-omics, structural elucidation [91]. |
The Green Analytical Chemistry (GAC) Framework
Green Analytical Chemistry aims to minimize the environmental impact of analytical methods by reducing or eliminating hazardous reagents, waste, and energy consumption [92].
Principles and Trends in GAC
The main trends in GAC include [93]:
- Miniaturization: Downsizing instruments and scaling down sample preparation to consume dramatically fewer reagents.
- Alternative Solvents: Replacing hazardous organic solvents with safer alternatives like deep eutectic solvents.
- Solventless Extraction Techniques: Using methods like solid-phase microextraction (SPME).
- On-Site Analysis: Developing portable devices for in-situ measurements to avoid sample transport.
- Waste Reduction: Implementing techniques that generate minimal or no waste.
Practical Implementation
Several practical techniques align with GAC principles:
- Blend & Inject LC-MS/MS: This approach tackles complex food matrices with minimal sample preparation, eliminating the need for extensive extraction and cleanup, thereby reducing solvent consumption and waste [90].
- Green Sample Preparation: Methods like dispersive liquid-liquid microextraction (DLLME) and bar adsorptive microextraction are being employed as greener alternatives to traditional solid-phase extraction (SPE) for mycotoxin analysis [87].
- Alternative Solvents: Research into natural deep eutectic solvents (NADES) as green extraction media is a rapidly growing field, offering a less toxic and renewable alternative to conventional organic solvents [93].
The Scientist's Toolkit: Essential Research Reagent Solutions
Selecting the right consumables and reagents is critical for success in modern chromatographic applications.
Table 3: Key Research Reagents and Consumables for HPLC/UHPLC-MS
| Item | Function/Description | Application Example |
|---|---|---|
| C18 Chromatography Column | A reverse-phase stationary phase for separating non-polar to medium-polarity compounds. | The workhorse column for most drug analyses; used in Levofloxacin separation [8]. |
| HSS T3 Column | A UHPLC column designed for retaining very polar compounds in reverse-phase mode. | Ideal for mycotoxin analysis and other challenging polar compounds [87]. |
| Methanol & Acetonitrile (HPLC-grade) | High-purity mobile phase components to ensure low UV background and minimal system contamination. | Used in the mobile phase for virtually all HPLC/UHPLC methods [8] [87]. |
| Ammonium Formate / Formic Acid | Common mobile phase additives that promote protonation and improve ionization efficiency in positive ESI-MS mode. | Critical for achieving good sensitivity in LC-MS methods for mycotoxins and pharmaceuticals [87]. |
| Tetrabutylammonium Salts | Ion-pairing reagents used to improve the chromatography of ionic compounds. | Used in the HPLC analysis of Levofloxacin to aid separation [8]. |
Visualizing Workflows and Relationships
The following diagrams illustrate a generalized analytical technique selection workflow and the configuration of a hybrid LC-MS instrument.
Analytical Technique Selection Workflow
Hybrid LC-MS Instrument Configuration
The field of analytical chemistry is defined by the integration of powerful techniques like UHPLC and LC-MS, guided by the sustainable principles of Green Analytical Chemistry. For drug quantification, the choice between simpler techniques like UV-Vis and more advanced chromatographic methods depends entirely on the complexity of the sample matrix and the required level of specificity. While UV-Vis can be adequate for simple, pure formulations, HPLC and UHPLC provide the necessary separation to handle complex biological and drug-delivery systems. The coupling of these separation techniques with mass spectrometry unlocks unparalleled capabilities for both targeted quantification and untargeted discovery, making it the cornerstone of modern pharmaceutical analysis. As the field moves forward, the continued miniaturization of equipment, development of greener solvents, and creation of more robust and user-friendly instrumentation will further enhance the efficiency and sustainability of chemical analysis.
Conclusion
The choice between UV-Vis spectroscopy and HPLC is not a matter of which technique is universally superior, but which is most fit-for-purpose. UV-Vis remains a powerful, cost-effective tool for high-throughput, routine analysis of simple drug formulations where selectivity is not a primary concern. In contrast, HPLC is indispensable for complex matrices, requiring high specificity, precise impurity profiling, and rigorous regulatory compliance, despite its higher operational costs and complexity. Future directions point toward the integration of these techniques in hybrid methods like HPLC-UV, the widespread adoption of UHPLC and LC-MS for unparalleled sensitivity, and a strong industry shift toward green chemistry principles to minimize environmental impact. For researchers, a strategic approach that leverages the speed of UV-Vis for screening and the power of HPLC for definitive quantification will ensure both efficiency and unwavering data integrity in pharmaceutical development.
References
- 1. Visible UV : Spectroscopy , Methods & Applications Principles [https://www.vedantu.com/chemistry/uv-visible-spectroscopy]
- 2. –visible Ultraviolet - Wikipedia spectroscopy [https://en.wikipedia.org/wiki/Ultraviolet%E2%80%93visible_spectroscopy]
- 3. - UV | Algor Cards Vis Spectroscopy [https://cards.algoreducation.com/en/content/QNDfva9p/uv-vis-spectroscopy-beer-lambert-law]
- 4. Video: UV – Vis : Spectroscopy – Beer Lambert Law [https://www.jove.com/science-education/v/12290/uvvis-spectroscopy-beerlambert-law]
- 5. Spandidos Publications: Experimental and Therapeutic Medicine [https://www.spandidos-publications.com/10.3892/etm.2019.7238]
- 6. Comparison of UV spectrophotometry and high performance liquid chromatography methods for the determination of repaglinide in tablets - PMC [https://www.ncbi.nlm.nih.gov/pmc/articles/PMC3658086/]
- 7. Quantification of antibiotics in multicomponent drug formulations using UV–Vis spectrometer with PLS and MCR-ALS - ScienceDirect [https://www.sciencedirect.com/science/article/abs/pii/S0169743925000395]
- 8. of Comparison - high and... performance liquid chromatography [https://pmc.ncbi.nlm.nih.gov/articles/PMC6425260/]
- 9. analysis of lamivudine in two commercially available... Comparative [https://www.ajol.info/index.php/epj/article/view/35088]
- 10. Understanding the Principle of HPLC : SHIMADZU Separation [https://www.shimadzu.com/an/service-support/technical-support/liquid-chromatography/overview/plinciple.html]
- 11. High-performance liquid chromatography - Wikipedia [https://en.wikipedia.org/wiki/High-performance_liquid_chromatography]
- 12. Lab 2: High Performance Liquid Chromatography - Chemistry LibreTexts [https://chem.libretexts.org/Courses/University_of_California_Davis/CHE_115:_Instrumental_Analysis_-_Lab_Manual/Lab_2:_High_Performance_Liquid_Chromatography]
- 13. Exploring HPLC Techniques - Chrom Tech, Inc. Separation [https://chromtech.com/blog/exploring-hplc-separation-techniques/]
- 14. Hydrophilic Interaction Liquid Chromatography [https://www.sigmaaldrich.com/US/en/technical-documents/technical-article/analytical-chemistry/small-molecule-hplc/hilic]
- 15. HappyTools: A software for high-throughput HPLC data processing and quantitation - PMC [https://pmc.ncbi.nlm.nih.gov/articles/PMC6034860/]
- 16. Column Comparison Chart for UPLC, UHPLC, HPLC [https://www.waters.com/waters/en_US/Column-Comparison-Chart-for-UPLC,-UHPLC,-HPLC/nav.htm?cid=135047266&locale=en_US]
- 17. Analysis of the High-Performance Liquid Chromatography Fingerprints and Quantitative Analysis of Multicomponents by Single Marker of Products of Fermented Cordyceps sinensis - PMC [https://pmc.ncbi.nlm.nih.gov/articles/PMC5914105/]
- 18. -visible Ultraviolet slide.pptx spectroscopy [https://www.slideshare.net/slideshow/ultravioletvisible-spectroscopy-slidepptx-259809470/259809470]
- 19. - UV : Principle, Strengths and... | Technology Networks Vis Spectroscopy [https://www.technologynetworks.com/analysis/articles/uv-vis-spectroscopy-principle-strengths-and-limitations-and-applications-349865]
- 20. Ultraviolet Detectors: Perspectives, Principles, and Practices | LCGC International [https://www.chromatographyonline.com/view/ultraviolet-detectors-perspectives-principles-and-practices]
- 21. How HPLC Detectors Work | Thermo Fisher Scientific - US [https://www.thermofisher.com/us/en/home/industrial/chromatography/chromatography-learning-center/liquid-chromatography-information/hplc-system-components/how-hplc-detectors-work.html]
- 22. 7. Principle and Feature of Various Detection Methods (1) : Hitachi ... [https://www.hitachi-hightech.com/global/products/science/tech/ana/lc/basic/course7.html]
- 23. Diode Array Detector HPLC | DAD | SCION Instruments [https://scioninstruments.com/us/blog/diode-array-detector-hplc/]
- 24. The LCGC Blog: UV Detection for HPLC – Fundamental Principle, Practical Implications | LCGC International [https://www.chromatographyonline.com/view/lcgc-blog-uv-detection-hplc-fundamental-principle-practical-implications]
- 25. The Eyes of HPLC : Strategic Use of Detectors [https://www.qbdgroup.com/en/blog/hplc-detectors-drug-development-quality-control]
- 26. (PDF) A Review on Instrumentation and Validation Method of... [https://www.academia.edu/143227639/A_Review_on_Instrumentation_and_Validation_Method_of_Uv_Visible_Spectroscopy_and_HPLC_for_the_Analysis_of_Drugs]
- 27. UV-Vis spectroscopy coupled with firefly algorithm-enhanced artificial neural networks for the determination of propranolol, rosuvastatin, and valsartan in ternary mixtures | Scientific Reports [https://www.nature.com/articles/s41598-025-89187-7]
- 28. The Essence of Modern HPLC: Advantages, Limitations, Fundamentals, and Opportunities | LCGC International [https://www.chromatographyonline.com/view/essence-modern-hplc-advantages-limitations-fundamentals-and-opportunities]
- 29. Choices of chromatographic methods as stability indicating assays for pharmaceutical products: A review - PMC [https://pmc.ncbi.nlm.nih.gov/articles/PMC8027279/]
- 30. Methods in Pharma QA/ Spectroscopic : QC - UV , IR... | Lab Manager Vis [https://www.labmanager.com/spectroscopic-methods-in-pharma-qa-qc-uv-vis-ir-and-nmr-applications-34005]
- 31. ACTTR Inc. - What Are The Advantages And Disadvantages of An UV-Vis Spectrophotometer? [https://www.acttr.com/en/en-faq/en-faq-uv-vis/134-en-faq-uv-vis-advantage-disadvantage.html]
- 32. A UV/Vis Spectroscopy-Based Assay for Monitoring of Transformations Between Nucleosides and Nucleobases - PMC [https://pmc.ncbi.nlm.nih.gov/articles/PMC6789650/]
- 33. UV-Visible Spectroscopy | Laboratory Analysis Services | Measurlabs [https://measurlabs.com/methods/uv-visible-spectroscopy/]
- 34. UV/Vis Spectroscopy for DNA & Protein Analysis | Unchained Labs | Unchained Labs [https://www.unchainedlabs.com/uv-vis-spectroscopy/]
- 35. Rapid UV - Vis spectrophotometric method aided by firefly-PLS models... [https://bmcchem.biomedcentral.com/articles/10.1186/s13065-024-01286-0]
- 36. uv-vis spectroscopy hplc: Topics by Science.gov [https://www.science.gov/topicpages/u/uv-vis+spectroscopy+hplc.html]
- 37. Principles and Applications of High - Performance ... Liquid [https://biomedpharmajournal.org/vol18no2/principles-and-applications-of-high-performance-liquid-chromatography-hplc-a-review/]
- 38. A comprehensive stability indicating method for clonidine... [https://link.springer.com/article/10.1007/s44371-025-00238-4]
- 39. (PDF) Comparative evaluation of UV / VIS and HPLC ... - Academia.edu [https://www.academia.edu/74893223/Comparative_evaluation_of_UV_VIS_and_HPLC_analytical_methodologies_applied_for_quantification_of_flavonoids_from_leaves_of_Bauhinia_forficata]
- 40. Study of Comparative And UV Methods for Estimation of HPLC Drug [https://www.ijsrtjournal.com/article/Comparative+Study+of+UV+And+HPLC+Methods+for+Estimation+of+Drug]
- 41. A validated stability-indicating RP- HPLC for method in... levofloxacin [https://pubmed.ncbi.nlm.nih.gov/19632800/]
- 42. A validated stability-indicating RP-HPLC method for levofloxacin in the presence of degradation products, its process related impurities and identification of oxidative degradant - ScienceDirect [https://www.sciencedirect.com/science/article/abs/pii/S0731708509003537]
- 43. DEVELOPMENT AND VALIDATION OF RP-HPLC METHOD FOR DETERMINATION OF LEVOFLOXACIN IN TABLET USING UV AND FLUORESCENCE DETECTORS SIMELTANIOUSLY | INTERNATIONAL JOURNAL OF PHARMACEUTICAL SCIENCES AND RESEARCH [https://ijpsr.com/bft-article/development-and-validation-of-rp-hplc-method-for-determination-of-levofloxacin-in-tablet-using-uv-and-fluorescence-detectors-simeltaniously/]
- 44. Simultaneous Determination of Amoxicillin, Lansoprazole, and... [https://link.springer.com/article/10.1007/s41664-020-00121-4]
- 45. Simultaneous Determination of Amoxicillin, Lansoprazole, and... [https://acikerisim.sakarya.edu.tr/handle/20.500.12619/95806]
- 46. Pharmacological evaluation of levofloxacin residue depletion and hemato-biochemical alterations in broiler chickens using a validated HPLC method | Scientific Reports [https://www.nature.com/articles/s41598-025-17575-0]
- 47. of Quantification Using UV-Vis, Comparison , and NMR ... HPLC [https://www.mdpi.com/1422-0067/26/14/6638]
- 48. Bakuchiol, a natural constituent and its pharmacological benefits - PMC [https://pmc.ncbi.nlm.nih.gov/articles/PMC10683784/]
- 49. Development of a new chromatographic method for the determination of bakuchiol in cosmetic products | Scientific Reports [https://www.nature.com/articles/s41598-023-41076-7]
- 50. A sustainable multi -task HPLC - UV for method ... simultaneous [https://pubmed.ncbi.nlm.nih.gov/40596528/]
- 51. Development and validation of an improved HPLC - UV for... method [https://jast-journal.springeropen.com/articles/10.1186/s40543-019-0198-9]
- 52. Development of an HPLC-UV Method for the Analysis of Drugs Used for Combined Hypertension Therapy in Pharmaceutical Preparations and Human Plasma - PMC [https://pmc.ncbi.nlm.nih.gov/articles/PMC3619551/]
- 53. Development of an HPLC–UV assay method for the simultaneous quantification of nine antiretroviral agents in the plasma of HIV-infected patients - PMC [https://pmc.ncbi.nlm.nih.gov/articles/PMC5762929/]
- 54. Validation of Stability-Indicating HPLC Methods for Pharmaceuticals: Overview, Methodologies, and Case Studies | LCGC International [https://www.chromatographyonline.com/view/validation-of-stability-indicating-hplc-methods-for-pharmaceuticals-overview-methodologies-and-case-studies]
- 55. Evaluation of the clinical and quantitative performance of a practical... [https://jphcs.biomedcentral.com/articles/10.1186/s40780-023-00298-7]
- 56. sciencedirect.com/topics/chemistry/ uv - vis - spectroscopy [https://www.sciencedirect.com/topics/chemistry/uv-vis-spectroscopy]
- 57. Application of HPLC Technology in Drug Detection [https://www.solutions.bocsci.com/resources/application-of-hplc-technology-in-drug-detection.html]
- 58. HIGH PERFOMANCE LIQUID CHROMATOGRAPHY IN PHARMACEUTICAL ANALYSES - PMC [https://pmc.ncbi.nlm.nih.gov/articles/PMC7250120/]
- 59. Comparison of UV Spectrophotometric and HPLC Method for Estimating Canagliflozin in Bulk and Tablet Dosage Form [https://www.ijpsonline.com/articles/comparison-of-uv-spectrophotometric-and-hplc-method-for-estimating-canagliflozin-in-bulk-and-tablet-dosage-form-3584.html]
- 60. - HPLC selectivity measurements of more... Columns HPLC column [https://www.hplccolumns.org/database/compare.php]
- 61. Leveraging Multidimensional Modeling to Resolve Frequent Separation... [https://www.chromatographyonline.com/view/leveraging-multidimensional-modeling-to-resolve-frequent-separation-challenges-in-hplc]
- 62. High Speed Gradient Elution Reversed Phase Liquid Chromatography of Bases in Buffered Eluents Part II: Full Equilibrium - PMC [https://pmc.ncbi.nlm.nih.gov/articles/PMC3202332/]
- 63. In Silico High - Performance Method... Liquid Chromatography [https://pmc.ncbi.nlm.nih.gov/articles/PMC11983366/]
- 64. Isocratic and gradient elution chromatography: a comparison in terms of speed, retention reproducibility and quantitation - PubMed [https://pubmed.ncbi.nlm.nih.gov/16460742/]
- 65. gradient elution hplc: Topics by Science.gov [https://www.science.gov/topicpages/g/gradient+elution+hplc]
- 66. Eco-Friendly UV and RP- Spectroscopic ... | Research Square HPLC [https://www.researchsquare.com/article/rs-6433370/v1]
- 67. High-performance liquid chromatography with ultraviolet detection for therapeutic drug monitoring of everolimus - PubMed [https://pubmed.ncbi.nlm.nih.gov/15664339/]
- 68. Analysis of Comparative and HPLC-UV for Illicit Drug... Benchtop NMR [https://pubmed.ncbi.nlm.nih.gov/40820675/]
- 69. High perfomance liquid chromatography in pharmaceutical analyses - PubMed [https://pubmed.ncbi.nlm.nih.gov/15629016/]
- 70. What is Benchtop Spectrometer? Nuclear Magnetic Resonance Nmr [https://www.linkedin.com/pulse/what-benchtop-nuclear-magnetic-resonance-nmr-spectrometer-6g2qe]
- 71. A new approach to improving automated analysis of proton NMR ... [https://www.spectroscopyeurope.com/td-column/new-approach-improving-automated-analysis-proton-nmr-spectra-through-global-spectral]
- 72. A Review of the Latest Spectroscopic Research in Pharmaceutical and Biopharmaceutical Applications | Spectroscopy Online [https://www.spectroscopyonline.com/view/review-latest-spectroscopic-research-pharmaceutical-and-biopharmaceutical-applications]
- 73. (PDF) Impurity profiling of carbocisteine by HPLC -CAD, qNMR and... [https://www.academia.edu/99834885/Impurity_profiling_of_carbocisteine_by_HPLC_CAD_qNMR_and_UV_vis_spectroscopy]
- 74. Development and validation of UV-Visible spectrophotometric baseline manipulation methodology for simultaneous analysis of drotraverine and etoricoxib in pharmaceutical dosage forms - PMC [https://www.ncbi.nlm.nih.gov/pmc/articles/PMC3658078/]
- 75. Trends In 2025 ... | Agno Pharmaceuticals Pharmaceutical Analytical [https://agnopharma.com/blog/trends-in-pharmaceutical-analytical-methods-development-validation/]
- 76. for Industry on FDA ... Guidance Bioanalytical Method Validation [https://labs.iqvia.com/blog/fda-guidance-bioanalytical-method-validation-biomarkers]
- 77. The 2025 Biomarker FDA : Understanding the Evolution from... Guidance [https://www.linkedin.com/pulse/2025-fda-biomarker-guidance-understanding-lxoke]
- 78. .org/get-involved/partner/compounding- usp monographs [https://www.usp.org/get-involved/partner/compounding-monographs]
- 79. 2025 pdf free download (United State Pharmacopeia 48 - NF 43) USP [https://www.webofpharma.com/2025/03/usp-2025-pdf-free-download-united-state.html]
- 80. Revised FDA on the Guidance of analytical validation ... methods [https://www.gmp-compliance.org/gmp-news/revised-fda-guidance-on-the-validation-of-analytical-methods]
- 81. Different Compare Detector Types | Torontech HPLC [https://torontech.com/types-of-hplc-detectors/]
- 82. Mind the Graph vs Piktochart: Head-to-Head Comparison - MTG [https://mindthegraph.com/blog/mind-the-graph-vs-piktochart/]
- 83. - High Methods for Determining... Performance Liquid Chromatography [https://pubmed.ncbi.nlm.nih.gov/38180794/]
- 84. Four chemometric models enhanced by Latin hypercube sampling... [https://bmcchem.biomedcentral.com/articles/10.1186/s13065-024-01158-7]
- 85. study of Comparative , RP- UV and HPTLC... spectroscopy HPLC [https://fjps.springeropen.com/articles/10.1186/s43094-024-00651-z]
- 86. Correlation of two validated methods for the quantification of naringenin in its solid dispersion: HPLC and UV spectrophotometric methods | Discover Applied Sciences [https://link.springer.com/article/10.1007/s42452-020-2536-3]
- 87. Ultra Performance Liquid Chromatography-Tandem Mass Spectrometry - an overview | ScienceDirect Topics [https://www.sciencedirect.com/topics/chemistry/ultra-performance-liquid-chromatography-tandem-mass-spectrometry]
- 88. An Ultrahigh-Performance Liquid Chromatography Coupled with Tandem Mass Spectrometry (UHPLC-MS/MS) Method for Toxicity and Safety Level Assessment of Oxygen Heterocyclic Compounds and Terpene in Cold-Pressed Grapefruit Essential Oils - PubMed [https://pubmed.ncbi.nlm.nih.gov/40686995/]
- 89. metabolite analysis of Piper sarmentosum organs... Comparative [https://link.springer.com/article/10.1007/s13659-024-00453-z]
- 90. Liquid Chromatography Mass Spectrometry (LC/MS) [https://www.perkinelmer.com/category/liquid-chromatography-mass-spectrometry-lc-ms]
- 91. Orbitrap LC-MS Comparison Chart | Thermo Fisher Scientific - US [https://www.thermofisher.com/us/en/home/industrial/mass-spectrometry/liquid-chromatography-mass-spectrometry-lc-ms/lc-ms-systems/orbitrap-lc-ms/orbitrap-lc-ms-comparison-chart.html]
- 92. sciencedirect.com/journal/ green - analytical - chemistry [https://www.sciencedirect.com/journal/green-analytical-chemistry]
- 93. : Summary of Existing... | SpringerLink Green Analytical Chemistry [https://link.springer.com/chapter/10.1007/978-981-13-9105-7_15]