UV-Vis vs. IR Spectroscopy: A Strategic Guide to Raw Material Identification in Pharmaceutical Development
This article provides a comprehensive comparative analysis of Ultraviolet-Visible (UV-Vis) and Infrared (IR) spectroscopy for raw material identification, specifically tailored for researchers and professionals in drug development.
UV-Vis vs. IR Spectroscopy: A Strategic Guide to Raw Material Identification in Pharmaceutical Development
Abstract
This article provides a comprehensive comparative analysis of Ultraviolet-Visible (UV-Vis) and Infrared (IR) spectroscopy for raw material identification, specifically tailored for researchers and professionals in drug development. It explores the fundamental principles governing each technique, from electronic transitions in UV-Vis to molecular vibrations in IR. The content details methodological best practices, application-specific protocols, and advanced troubleshooting strategies to ensure data integrity. A direct, intent-driven comparison equips scientists with the knowledge to select the optimal technique, or synergistic combination, for their specific analytical challenges, enhancing efficiency and compliance in pharmaceutical quality control.
Core Principles: How UV-Vis and IR Spectroscopy Work for Molecular Analysis
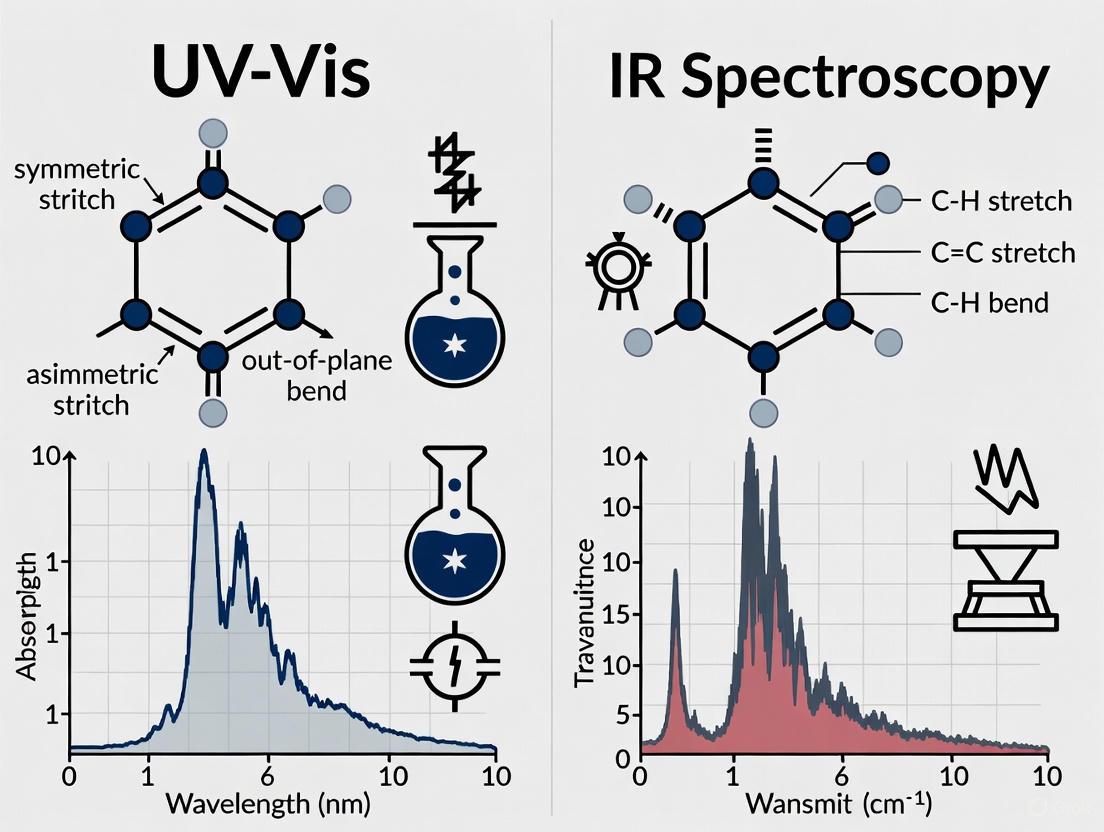
Ultraviolet-Visible (UV-Vis) and Infrared (IR) spectroscopy are foundational analytical techniques in pharmaceutical research and development, yet they probe fundamentally different light-matter interactions. UV-Vis spectroscopy involves the promotion of electrons to higher energy orbitals when molecules absorb ultraviolet or visible light [1]. In contrast, IR spectroscopy measures the absorption of infrared radiation, which corresponds directly to the vibrational energy of chemical bonds [2]. This fundamental difference dictates their respective applications: UV-Vis primarily serves quantitative analysis (determining "how much" of a substance is present), while IR excels at qualitative identification (determining "what" the substance is) [3] [4]. For researchers involved in raw material identification, understanding these distinctions is crucial for selecting the appropriate technique and correctly interpreting analytical data.
Fundamental Principles and Theoretical Background
UV-Vis Spectroscopy: Probing Electronic Transitions
UV-Vis spectroscopy measures the absorption of light in the ultraviolet (190-380 nm) and visible (380-800 nm) regions of the electromagnetic spectrum [1] [4]. Absorption occurs when the energy of incoming photons matches the energy required to promote electrons from their ground state to an excited state. The most common transitions involve π → π and n → π transitions in molecules containing chromophores—functional groups with valence electrons of low excitation energy, such as C=C, C=O, or aromatic rings [3] [1]. The resulting spectrum provides information about electronic structure and is quantified using the Beer-Lambert law, which relates absorbance to concentration [1].
IR Spectroscopy: Exciting Molecular Vibrations
IR spectroscopy operates in the infrared region, typically between 4000-670 cm⁻¹, which corresponds to the energy required to excite molecular vibrations [2]. For a molecule to absorb IR radiation, the vibration must cause a net change in the dipole moment of the molecule. Molecular vibrations fall into two main categories: stretching (changes in inter-atomic distance along bond axes) and bending (changes in the angle between two bonds, including rocking, scissoring, wagging, and twisting) [2]. The specific vibrational frequencies at which absorption occurs create a unique "fingerprint" that allows for the identification of functional groups and molecular structure.
Comparative Theoretical Framework
The diagram below illustrates the fundamental differences in the energy transitions and analytical outputs for UV-Vis and IR spectroscopy.
Comparative Analysis: UV-Vis vs. IR Spectroscopy
The table below provides a direct comparison of the key technical and application parameters between UV-Vis and IR spectroscopy.
Table 1: Direct comparison of UV-Vis and IR spectroscopy characteristics
| Parameter | UV-Vis Spectroscopy | IR Spectroscopy |
|---|---|---|
| Fundamental Process | Electronic transitions | Molecular vibrations |
| Energy Transitions | π → π, n → π [3] | Stretching, bending [2] |
| Typical Wavelength Range | 190-800 nm [4] | 4000-670 cm⁻¹ [2] |
| Primary Applications in Pharma | Drug quantification, dissolution testing, assay of solutions [3] | Raw material identification, functional group analysis [3] [4] |
| Quantitative/Qualitative Strength | Quantitative (how much) [3] | Qualitative (what it is) [3] |
| Sample Preparation | Requires optically clear solutions, specific solvent compatibility [4] | KBr pellets, ATR accessories, uniform films [4] |
| Key Measured Parameters | Absorbance at λmax, extinction coefficient (ε) [5] | Absorption bands, wavenumber, transmittance |
| Detection Limits | μM concentrations [6] | Varies with technique and sample |
Experimental Protocols and Methodologies
UV-Vis Spectroscopy Experimental Workflow
The standard protocol for quantitative analysis using UV-Vis spectroscopy involves a systematic process to ensure accurate and reproducible results, particularly for pharmaceutical applications such as drug assay and concentration determination [4].
Detailed Protocol:
- Sample Preparation: Dissolve the sample in an appropriate solvent that doesn't absorb significantly in the spectral region of interest. Filter or centrifuge if necessary to remove particulate matter that could cause light scattering [4]. For accurate quantification, ensure absorbance values fall within the optimal linear range (0.1-1.0 AU) by diluting with solvent if required.
- Instrument Calibration: Perform baseline correction with the pure solvent as a blank. Calibrate the instrument using standard solutions of known concentration to establish a calibration curve [4].
- Spectral Acquisition: Measure sample absorbance across the relevant wavelength range (typically 190-800 nm) or at the specific absorption maximum (λmax) for quantitative work. Modern array detectors can capture full spectra without scanning [6].
- Data Analysis: Apply the Beer-Lambert law (A = εcl) to determine unknown concentrations, where A is absorbance, ε is the molar absorptivity, c is concentration, and l is path length [1].
Advanced UV-Vis Methodologies
Recent advancements have expanded UV-Vis capabilities beyond conventional applications. UV/vis Diffusion-Ordered Spectroscopy (UV/vis-DOSY) represents an innovative approach that simultaneously probes molecular size and electronic absorption spectra [6]. This technique adapts concepts from NMR diffusion-ordered spectroscopy, creating a two-dimensional spectrum with absorption wavelength on one axis and diffusion coefficient (related to molecular size) on the other. The experimental setup involves:
- Simultaneously injecting sample solution and pure solvent into a thin chamber
- Stopping flow to allow differential diffusion based on molecular size
- Recording time-dependent absorption spectra in the initially solvent-filled region
- Transforming time-dependent data into diffusion-constant information using mathematical models [6]
This method has been successfully demonstrated for separating and identifying components in mixed dye solutions, biomolecules, and complex mixtures like coffee extracts, all at concentrations in the μM range [6].
IR Spectroscopy Experimental Workflow
IR spectroscopy follows a distinct methodological approach focused on qualitative identification, particularly valuable for raw material verification in pharmaceutical quality control [4].
Detailed Protocol:
- Sample Preparation: For solids, mix with potassium bromide (KBr) and press into pellets, or use Attenuated Total Reflectance (ATR) accessories that require minimal preparation. For liquids, use appropriate transmission cells or ATR crystal plates. Ensure uniform contact and avoid atmospheric contamination (e.g., CO₂, moisture) [4].
- Background Measurement: Collect a background spectrum without the sample to account for instrumental and environmental contributions.
- Spectral Acquisition: Acquire the sample spectrum across the mid-IR region (4000-670 cm⁻¹), where most molecular vibrations occur [2]. Modern FTIR instruments rapidly collect high-resolution data.
- Data Interpretation: Identify characteristic functional group absorptions (e.g., O-H stretch at 3200-3600 cm⁻¹, C=O stretch at 1700-1750 cm⁻¹) and compare the complete spectral "fingerprint" with reference libraries to confirm molecular identity [4].
Advanced Applications and Research Frontiers
Advanced Spectral Analysis in UV-Vis Spectroscopy
Sophisticated computational approaches are enhancing the information extracted from UV-Vis spectra. The Pekarian function (PF) fitting approach enables high-accuracy analysis of conjugated organic compound spectra in solution [7]. This method optimizes five parameters (S, ν₀, Ω, σ₀, and δ) that define band shape for both vibronically resolved and unresolved bands, providing more physically meaningful interpretations than traditional Gaussian or Lorentzian fitting functions [7]. The approach is particularly valuable for:
- Analyzing temperature-dependent spectral changes
- Resolving overlapping electronic transitions
- Comparing experimental spectra with quantum mechanical calculations
- Studying charge transfer transitions where parameters relate to specific physical models [7]
For example, applying PF fitting to rubrene (5,6,11,12-tetraphenyltetracene) in toluene revealed detailed temperature dependencies of vibrational parameters and enabled precise resolution of the complex absorption profile [7].
High-Throughput and Data-Driven Approaches
The automation of spectral data extraction and computational prediction represents a growing frontier. Large-scale text mining of scientific literature using tools like ChemDataExtractor has enabled the creation of extensive databases containing 18,309 records of experimental UV/vis absorption maxima (λmax) and extinction coefficients (ε) [5]. These experimental datasets are complemented by high-throughput quantum chemical calculations using density functional theory, creating paired experimental-computational resources that support machine learning and data-driven materials discovery for optoelectronic applications [5].
The Scientist's Toolkit: Essential Research Reagents and Materials
Table 2: Key research reagents and materials for spectroscopic analysis
| Item | Function | Application Notes |
|---|---|---|
| UV-Grade Solvents (HPLC-grade acetonitrile, methanol, water) | Sample dissolution and reference measurements | Must exhibit low absorbance in UV region; degas if necessary to avoid bubble formation [4] |
| Quartz Cuvettes | Sample containment for UV-Vis measurements | Required for UV range; various path lengths (typically 1 cm) for concentration adjustment [4] |
| Potassium Bromide (KBr) | Matrix for solid sample preparation in IR | High purity, IR-transparent; hygroscopic, requires dry handling [4] |
| ATR Crystals (diamond, ZnSe) | Contact element for attenuated total reflectance | Enables direct solid/liquid analysis without extensive preparation; crystal selection depends on chemical compatibility [4] |
| Deuterated Solvents (D₂O, CDCl₃, DMSO-d₆) | Solvents for NMR spectroscopy (complementary technique) | Avoids interference with proton signals; requires filtration to eliminate undissolved solids [4] |
| Standard Reference Materials | Instrument calibration and method validation | Certified compounds with known spectra for quality control and analytical method verification [4] |
UV-Vis and IR spectroscopy offer complementary approaches to material characterization rooted in their distinct light-matter interaction mechanisms. UV-Vis spectroscopy, monitoring electronic transitions, provides exceptional quantitative capabilities for concentration determination and kinetic studies in pharmaceutical analysis. IR spectroscopy, probing molecular vibrations, delivers unparalleled qualitative identification through unique spectral fingerprints of functional groups and molecular structures. The continuing advancement of these techniques—including sophisticated spectral analysis methods like Pekarian function fitting and innovative approaches like UV/vis-DOSY—ensures their enduring relevance in pharmaceutical research and raw material identification. For comprehensive material characterization, these techniques are most powerful when employed together, leveraging their respective strengths to provide both quantitative and qualitative analytical information.
Ultraviolet-Visible (UV-Vis) and Infrared (IR) spectroscopy are fundamental analytical techniques that probe molecular interactions with electromagnetic radiation across adjacent but distinct energy ranges. UV-Vis spectroscopy operates in the 200 to 800 nm range, encompassing both ultraviolet and visible light, and functions primarily by promoting electrons to higher energy molecular orbitals [8] [9]. The energy absorbed in these electronic transitions corresponds to the energy difference between the highest occupied molecular orbital (HOMO) and the lowest unoccupied molecular orbital (LUMO) [10]. This process provides critical information about the extent of conjugated π-electron systems within molecules, which are the primary chromophores responsible for absorption in this region [8].
In contrast, IR spectroscopy typically utilizes the mid-infrared region from 4000 to 400 cm⁻¹ (approximately 2.5 to 25 μm), which extends beyond the visible spectrum but falls well within the user-specified range up to 1 mm [11]. Instead of electronic transitions, IR spectroscopy measures the absorption of infrared light that causes molecules to undergo vibrational transitions [10]. These vibrations include stretching and bending motions of chemical bonds, with different functional groups absorbing characteristic frequencies that serve as molecular fingerprints [11]. The fundamental distinction between these techniques lies in the nature of the transitions they induce: UV-Vis spectroscopy probes electronic structure, while IR spectroscopy investigates molecular vibrations.
The following diagram illustrates the core working principles of both techniques and their relationship to the electromagnetic spectrum:
Experimental Protocols and Methodologies
UV-Vis Spectroscopy Experimental Protocol
The standard methodology for UV-Vis analysis of raw materials involves specific instrumentation and sample preparation techniques. Modern UV-Vis spectrophotometers generally incorporate a deuterium lamp for UV light (200-400 nm) and a tungsten or halogen lamp for visible light (400-800 nm), with the instrument automatically switching between sources around 300-350 nm [9]. The light is passed through a monochromator containing a diffraction grating (typically with 1200 grooves per mm or more) to isolate specific wavelengths before passing through the sample [9].
For liquid samples, the protocol requires:
- Sample Preparation: Dissolve the raw material in an appropriate solvent (e.g., ethanol-water mixtures for plant extracts) to achieve optimal concentration [12]. The solution is typically centrifuged at 4000 rpm for 15 minutes to remove particulate matter [12].
- Reference Measurement: Fill a quartz cuvette (with 1 cm standard path length) with the pure solvent and use it as a blank to calibrate 100% transmittance [9]. Quartz is essential for UV analysis as glass absorbs strongly in the UV region [9].
- Sample Measurement: Replace the blank with the sample solution and acquire the absorption spectrum from 200-800 nm [12]. Instrument parameters should include a fixed slit width (e.g., 0.5 nm) and moderate scanning speed (e.g., 400 nm/min) [12].
- Data Processing: Apply smoothing algorithms (e.g., Savitzky-Golay 23-point quadratic polynomial) to reduce noise, and use derivative spectroscopy (first to fourth-order derivatives) to resolve overlapping peaks [12].
IR Spectroscopy Experimental Protocol
Modern IR spectroscopy predominantly utilizes Fourier-Transform Infrared (FTIR) instruments with Attenuated Total Reflectance (ATR) accessories, which have significantly simplified sample preparation [11]:
- Sample Preparation: For solid raw materials, grind a few milligrams into a fine powder using a ball mill [12]. For ATR-FTIR, simply place the powder directly onto the ATR crystal, ensuring good contact [11]. Liquid samples require just a single drop applied directly to the crystal.
- Instrument Setup: Ensure the sample and instrument are at room temperature (68-77°F) to prevent thermal interference [11]. The ATR crystal (typically diamond) provides minimal path length, eliminating the need for dilution in most cases.
- Spectral Acquisition: Collect the background spectrum without the sample present, then acquire the sample spectrum in the mid-IR range (4000-400 cm⁻¹) [11]. Most modern instruments complete this process in 2-3 minutes [11].
- Spectral Analysis: Compare the acquired spectrum to reference libraries using matching algorithms, with at least 90% match typically required for positive identification [11]. Spectral subtraction techniques can identify contaminants by revealing extra or shifted peaks [11].
Performance Comparison and Experimental Data
Quantitative Technical Comparison
The table below summarizes the key performance characteristics of UV-Vis and IR spectroscopy based on experimental data:
Table 1: Technical performance comparison between UV-Vis and IR spectroscopy
| Parameter | UV-Vis Spectroscopy | IR Spectroscopy |
|---|---|---|
| Effective Wavelength Range | 175-3300 nm (typical 200-800 nm) [13] [9] | 4000-400 cm⁻¹ (mid-IR); NIR up to ~12500 cm⁻¹ [11] |
| Sample Concentration Requirements | ~10⁻⁵ to 10⁻² M (for 1 cm path) [8] | Neat solids, liquids, or ~1% in KBr pellets [11] |
| Detection Limits | ~10⁻⁶ M for strong chromophores [8] | ~1-5% for most impurities [11] |
| Path Length | 1 mm to 10 cm (typically 1 cm) [9] | ATR: few microns; Transmission: 0.1-1 mm [11] |
| Analysis Time | 2-5 minutes per sample [12] | 2-3 minutes with ATR [11] |
| Spectral Resolution | 0.1-5 nm depending on monochromator [9] | 1-4 cm⁻¹ for standard FTIR [11] |
| Quantitative Precision | ~1-2% RSD with good technique [9] | ~2-5% RSD for ATR measurements [11] |
| Water Compatibility | Aqueous solutions ideal [9] | Water shows strong absorption; requires drying [11] |
Application-Specific Performance Data
In practical applications for raw material identification, each technique demonstrates distinct strengths:
UV-Vis Performance Characteristics:
- Successfully authenticated medicinal plant materials from different geographical origins with 98.04% accuracy when combined with pattern recognition techniques [12]
- Detects conjugated systems with molar absorptivities ranging from 10 to >100,000 L·mol⁻¹·cm⁻¹, with higher values indicating greater transition probabilities [8]
- Successfully differentiates between polynuclear aromatic hydrocarbons based on extent of conjugation, with λmax shifting to longer wavelengths with increased conjugation [8]
IR Performance Characteristics:
- Correctly identifies functional groups with >95% accuracy when reference libraries are comprehensive [11]
- Detects water contamination as low as 0.1% through characteristic broad peaks at 3200-3600 cm⁻¹ and 1640 cm⁻¹ [11]
- Identifies polymorphic forms in pharmaceuticals with high specificity in the fingerprint region (<1500 cm⁻¹) [11]
- Recognizes solvent contaminants (e.g., ethanol shows sharp peaks at 2970 cm⁻¹ and 1050 cm⁻¹) even at low concentrations [11]
Essential Research Reagent Solutions
Successful implementation of both spectroscopic techniques requires specific materials and reagents, as detailed below:
Table 2: Essential research reagents and materials for spectroscopic analysis
| Item | Function/Purpose | Technical Specifications |
|---|---|---|
| Quartz Cuvettes | Sample holder for UV-Vis analysis | 1 cm path length; transparent down to 200 nm [9] |
| ATR Crystals | Internal reflection element for FTIR | Diamond (durable), ZnSe (high refractive index), or Ge (IR transparent) [11] |
| Deuterium Lamp | UV light source for UV-Vis | Covers 190-400 nm range; typical lifetime ~1000 hours [9] |
| HPLC-Grade Solvents | Sample dissolution and dilution | Low UV cutoff; minimal impurity interference [12] |
| Certified Reference Materials | Library development and validation | Authenticated samples for building spectral databases [11] [12] |
| KBr Pellets | Traditional IR sample preparation | FTIR grade potassium bromide; transparent in mid-IR [11] |
| NIST-Traceable Standards | Instrument calibration and verification | Provides measurement traceability to standards [11] |
Application Workflows in Pharmaceutical Development
The complementary nature of UV-Vis and IR spectroscopy is evident in their application workflows for raw material identification in pharmaceutical development. The following diagram illustrates a typical integrated approach:
In regulatory applications, UV-Vis spectroscopy provides critical quantitative data for Beer-Lambert law calculations of analyte concentration [9], while IR spectroscopy delivers definitive functional group identification required by pharmacopeial standards for excipients and active pharmaceutical ingredients (APIs) [11]. For polymorph screening, IR's fingerprint region (<1500 cm⁻¹) detects subtle crystalline differences that can affect drug bioavailability, while UV-Vis confirms the chemical identity of the chromophoric system [11]. This complementary approach provides a robust framework for raw material verification that meets the stringent requirements of regulatory bodies including the FDA and USP [11].
UV-Vis vs IR Spectroscopy for Raw Material Identification
In pharmaceutical raw material identification, the choice of analytical technique is pivotal for ensuring quality, safety, and regulatory compliance. Ultraviolet-Visible (UV-Vis) Spectroscopy and Infrared (IR) Spectroscopy are two foundational techniques that offer distinct approaches to molecular analysis. UV-Vis spectroscopy probes the electronic structure of molecules, measuring the excitation of electrons to higher energy orbitals when exposed to ultraviolet or visible light [14]. This process provides quantitative data primarily on analyte concentration and the presence of chromophores. In contrast, IR spectroscopy examines molecular vibrations, where chemical bonds absorb specific frequencies of infrared light, creating a unique "molecular fingerprint" that reveals functional groups and overall molecular structure [15] [16].
The fundamental distinction lies in their analytical focus: UV-Vis provides quantitative concentration data of specific chromophores, while IR offers qualitative identification of molecular structures through their vibrational signatures. This comparative guide examines the performance characteristics, applications, and practical implementation of both techniques within pharmaceutical research and development workflows, providing scientists with evidence-based insights for technique selection.
Technical Comparison: Analytical Capabilities
Table 1: Fundamental Characteristics of UV-Vis and IR Spectroscopy
| Parameter | UV-Vis Spectroscopy | IR Spectroscopy |
|---|---|---|
| Analytical Basis | Electronic transitions (chromophores) [14] | Molecular vibrations (functional groups) [15] |
| Primary Output | Concentration, absorbance maxima (λmax) [14] | Molecular fingerprint, functional group identification [17] [16] |
| Quantitative Strength | Excellent for concentration determination [14] | Limited; primarily qualitative [17] |
| Qualitative Strength | Limited to chromophore detection [14] | Excellent for molecular identification [17] [16] |
| Sample Form | Primarily liquids (solutions) [14] | Liquids, solids, gases [18] |
| Detection Limits | High sensitivity for UV-absorbing compounds [14] | Generally less sensitive than UV-Vis [18] |
| Structural Information | Limited to conjugated systems [14] | Detailed bond and functional group data [17] |
Table 2: Pharmaceutical Raw Material Application Scenarios
| Application Scenario | UV-Vis Effectiveness | IR Effectiveness |
|---|---|---|
| Raw Material Identity Testing | Limited (lacks specificity) | High (molecular fingerprint) [19] |
| Quantifying API Concentration | High (direct concentration measurement) [14] | Moderate (requires calibration) |
| Detecting Impurities/Degradants | Selective (only UV-active impurities) | High (detects structural changes) [18] |
| Polymorph Characterization | None | High (sensitive to crystal form) [19] |
| Reaction Monitoring | High (kinetics via concentration change) | Moderate (structural changes) |
| Regulatory Compliance | Supports quantitative specs | High (pharmacopeial identity test) [19] |
Experimental Protocols and Data Output
UV-Vis Spectroscopy: Concentration Analysis
Protocol for Active Pharmaceutical Ingredient (API) Quantification:
- Sample Preparation: Dissolve raw material in suitable solvent (e.g., methanol, water) to achieve concentration within linear Beer-Lambert range (typically 0.1-100 μM) [14]. Use 2% DMSO as co-solvent for poorly soluble compounds [14].
- Instrument Calibration: Blank with pure solvent. Measure standards of known concentration to establish calibration curve.
- Spectral Acquisition: Scan from 230 nm to 400 nm in 1 nm increments using spectrophotometer [14]. Measure sample absorbance at λmax.
- Data Analysis: Calculate unknown concentration from calibration curve. Apply background subtraction for interfering substances [14].
Representative Data Output: UV-Vis yields concentration values (μg/mL or μM) with typical accuracy of 93.4-103.1% recovery [18]. The primary output includes absorbance values at specific wavelengths and the wavelength of maximum absorbance (λmax), which is characteristic of the chromophore present [14].
IR Spectroscopy: Molecular Fingerprinting
Protocol for Raw Material Identity Testing:
- Sample Preparation (Varies by Technique):
- KBr Pellet (FT-IR): Grind 1-2 mg sample with 100-200 mg dried potassium bromide. Press under vacuum to form transparent pellet.
- ATR (Attenuated Total Reflectance): Place solid or liquid sample directly on ATR crystal. Apply consistent pressure for good contact.
- Instrument Setup: Acquire background spectrum. Set resolution to 4 cm⁻¹, accumulate 16-32 scans for adequate signal-to-noise ratio.
- Spectral Acquisition: Collect spectrum from 4000-400 cm⁻¹. Ensure absorbance values between 0.5-1.0 AU for optimal quantification.
- Data Analysis: Compare sample spectrum to reference standard. Identify key functional groups: hydroxyl (3200-3600 cm⁻¹), carbonyl (1630-1800 cm⁻¹), and fingerprint region (1500-500 cm⁻¹) [17].
Representative Data Output: IR spectroscopy produces a spectrum with peaks corresponding to molecular vibrations. Critical identification regions include:
- OH/NH Region (3600-3200 cm⁻¹): Broad "tongue-like" peaks indicate alcohols; sharper peaks may indicate amines [17].
- Carbonyl Region (1800-1650 cm⁻¹): Strong "sword-like" peaks reveal esters, ketones, acids [17].
- Fingerprint Region (1500-500 cm⁻¹): Complex pattern unique to each molecule for definitive identification [15].
Workflow Integration and Advanced Applications
Emerging Technological Enhancements
AI and Machine Learning Integration: Both techniques benefit from advanced data processing. For UV-Vis, attention-based recurrent neural networks (LSTM) can predict spectra from molecular structure alone (UV-adVISor), with reported R² values of 0.71 for test sets [14]. In IR, convolutional neural networks (CNNs) achieve 96% classification accuracy with preprocessed data, significantly outperforming traditional chemometric methods (89%) [20].
Portable and Hyphenated Systems: Miniaturization enables point-of-use testing with portable IR spectrometers, particularly benchtop models holding 30.62% market share in 2025 [19]. Hyphenated techniques combining HPLC with UV-Vis diode array detection provide both separation and identification capabilities [14], while FT-IR microscopy enables chemical mapping at micro and nanoscale levels [19].
Essential Research Reagent Solutions
Table 3: Key Materials and Their Functions in Spectroscopic Analysis
| Reagent/ Material | Function | Application |
|---|---|---|
| HPLC-grade Solvents (Methanol, Acetonitrile) | Sample dissolution; mobile phase for HPLC-UV-Vis [14] | UV-Vis sample preparation |
| Potassium Bromide (KBr) | IR-transparent matrix for pellet preparation [15] | FT-IR solid sample analysis |
| ATR Crystals (Diamond, ZnSe) | Internal reflection element for direct sampling [19] | FT-IR with minimal preparation |
| NIST-traceable Standards | Instrument calibration and method validation [18] | Quantitative accuracy assurance |
| Reference Materials (USP, EP) | Spectral comparison and identity confirmation [19] | Pharmacopeial compliance testing |
| Microplates (UV-STAR) | Low UV absorption for microvolume analysis [14] | High-throughput UV-Vis screening |
UV-Vis and IR spectroscopy offer complementary capabilities for pharmaceutical raw material identification. UV-Vis spectroscopy excels in quantitative analysis of chromophore-containing compounds, providing precise concentration data with minimal sample preparation. Its integration with HPLC systems makes it invaluable for purity assessment and kinetic studies. IR spectroscopy provides definitive qualitative identification through molecular fingerprinting, detecting functional groups and structural features with high specificity. Its non-destructive nature and minimal sample requirements make it ideal for identity confirmation per pharmacopeial standards.
The optimal analytical approach leverages both techniques: UV-Vis for quantitative assessment of specific analytes and IR for structural confirmation and polymorph identification. As spectroscopic technologies evolve with AI integration and miniaturization, both techniques continue to expand their capabilities in pharmaceutical quality control, delivering enhanced accuracy and efficiency for drug development professionals.
The Role of Chromophores and Molecular Motions in Spectral Generation
The fundamental principles governing spectral generation in ultraviolet-visible (UV-Vis) and infrared (IR) spectroscopy revolve around how molecules interact with electromagnetic radiation, though the specific mechanisms differ significantly. UV-Vis spectroscopy measures electronic transitions resulting from the excitation of valence electrons when molecules absorb energy in the ultraviolet and visible regions (typically 190-800 nm) [9]. This absorption occurs specifically in molecules containing chromophores, which are functional groups with electrons that can be excited to higher energy states. The energy required for these electronic transitions corresponds to the UV-Vis range of the electromagnetic spectrum, making the technique particularly sensitive to molecules with conjugated systems or multiple bonds.
In contrast, IR spectroscopy probes molecular vibrations that occur when molecules absorb infrared radiation (typically measured in wavenumbers from 4000-400 cm⁻¹) [4]. Rather than exciting electrons, IR radiation causes changes in the molecular motions of bonds, including stretching, bending, and twisting vibrations. These vibrational transitions provide information about the specific functional groups present in a molecule, creating a "fingerprint" that is unique to each compound. The different energy requirements for electronic transitions versus vibrational transitions explain why these techniques provide complementary information about molecular structure and composition. While UV-Vis spectroscopy reveals the presence of chromophores and conjugated systems, IR spectroscopy provides detailed information about the functional groups and molecular framework through their characteristic vibrational frequencies [9] [4].
Theoretical Foundations: Chromophores and Molecular Motions
Chromophores in UV-Vis Spectroscopy
Chromophores are light-absorbing molecular moieties that form the fundamental basis of UV-Vis spectroscopy. These functional groups contain valence electrons that undergo transitions from ground states to excited states when they absorb specific wavelengths of ultraviolet or visible light [9]. The most common electronic transitions include π→π, n→π, σ→σ, and n→σ transitions, each with characteristic energy requirements and absorption properties. Molecules with single bonds typically undergo high-energy σ→σ* transitions that absorb in the far UV region below 200 nm, while compounds with unsaturated centers containing π-electrons or heteroatoms with non-bonding electrons exhibit transitions at longer wavelengths that are more readily measurable.
The absorption characteristics of chromophores depend heavily on their chemical environment and molecular structure. Extended conjugation in organic molecules leads to a red shift (bathochromic effect) in absorption maxima because the energy gap between molecular orbitals decreases as the conjugated system grows larger [9]. Similarly, auxochromes—functional groups without significant absorption of their own but containing heteroatoms with non-bonding electrons—can alter absorption patterns when attached to chromophores through mesomeric or inductive effects. Common chromophores include C=C, C=O, NO₂, and aromatic rings, with their specific combination and arrangement determining the overall UV-Vis spectral profile. This sensitivity to electronic environment makes UV-Vis spectroscopy particularly valuable for studying conjugated systems, detecting impurities, and quantifying analyte concentrations through the well-established Beer-Lambert law [9].
Molecular Motions in IR Spectroscopy
Infrared spectroscopy probes the fundamental vibrational modes of molecules, which arise from the continuous motions of atoms and bonds. These molecular vibrations include stretching (both symmetric and asymmetric) and bending (deformation) motions, each with characteristic energy requirements corresponding to specific frequencies in the infrared region of the electromagnetic spectrum [4]. When the frequency of incident IR radiation matches the natural vibrational frequency of a chemical bond, absorption occurs, leading to transitions between vibrational energy levels.
The vibrational frequencies observed in IR spectra are highly specific to particular functional groups and their chemical environments. Hooke's law approximation provides a fundamental relationship where vibrational frequency is proportional to the bond strength and inversely proportional to the reduced mass of the vibrating atoms [4]. This explains why strong bonds with light atoms (such as O-H and N-H stretches) appear at higher wavenumbers (around 3600-3200 cm⁻¹), while weaker bonds with heavier atoms (such as C-I stretches) absorb at lower wavenumbers. The presence of dipole moment changes during vibration is a prerequisite for IR absorption, making the technique particularly sensitive to polar functional groups. The resulting IR spectrum serves as a molecular "fingerprint" with two main regions: the functional group region (4000-1500 cm⁻¹) where characteristic stretches appear, and the fingerprint region (1500-400 cm⁻¹) with complex patterns unique to each compound [4].
Experimental Comparison: Methodologies and Protocols
Quantitative Comparison of Spectral Techniques
Table 1: Fundamental Characteristics of UV-Vis and IR Spectroscopy
| Parameter | UV-Vis Spectroscopy | IR Spectroscopy |
|---|---|---|
| Spectral Range | 190-800 nm [9] | Mid-IR: 4000-400 cm⁻¹ [4] |
| Physical Process | Electronic transitions (π→π, n→π) [9] | Molecular vibrations (stretching, bending) [4] |
| Molecular Information | Chromophore presence, conjugation extent | Functional groups, molecular structure |
| Detection Limit | High sensitivity for chromophores [9] | Moderate to high sensitivity [19] |
| Quantitative Strength | Excellent (Beer-Lambert law) [9] | Moderate [4] |
| Qualitative Strength | Limited to chromophore identification | Excellent (molecular fingerprinting) [4] |
| Sample Form | Liquid solutions primarily [9] | Solids, liquids, gases (various forms) [4] |
| Water Compatibility | High (with quartz cuvettes) [9] | Low (strong water absorption) [21] |
Table 2: Experimental Considerations for Pharmaceutical Raw Material Identification
| Factor | UV-Vis Spectroscopy | IR Spectroscopy |
|---|---|---|
| Sample Preparation | Requires dissolution; concentration adjustment needed [4] | Minimal with ATR-FTIR; may require KBr pellets [4] |
| Analysis Speed | Very fast (seconds) [9] | Fast (seconds to minutes) [19] |
| Automation Potential | High [22] | Moderate to high [23] |
| Regulatory Acceptance | High for quantification [4] | High for identity testing [4] |
| Molecular Specificity | Low to moderate [4] | High (fingerprint capability) [4] |
| Equipment Cost | Low to moderate [22] | Moderate to high [19] |
| Technician Skill Requirement | Lower [19] | Higher (spectral interpretation) [19] |
Detailed Experimental Protocols
UV-Vis Spectroscopy Protocol for Raw Material Identification
Principle: This protocol utilizes the characteristic absorption of chromophores in the UV-Vis region to identify and quantify raw materials based on their electronic transition patterns [9].
Materials and Equipment:
- UV-Vis spectrophotometer (single or double beam) with deuterium and tungsten lamps [9]
- High-quality quartz cuvettes (1 cm path length) [9] [4]
- Analytical balance (±0.1 mg sensitivity)
- Appropriate solvent (HPLC grade) transparent in spectral region of interest [4]
- Micro-pipettes and volumetric flasks
- Filtration apparatus (0.45 μm membrane filters)
Procedure:
- Instrument Calibration: Warm up the spectrophotometer for 30 minutes. Perform wavelength accuracy verification using holmium oxide filter. Validate photometric accuracy with potassium dichromate standard solutions [4].
Sample Preparation: Accurately weigh approximately 10 mg of raw material. Dissolve in suitable solvent and dilute to known volume in volumetric flask to achieve target concentration (typically yielding absorbance 0.1-1.0 AU). Filter if necessary to remove particulates [4].
Blank Preparation: Prepare reference solution containing solvent only, matching sample solvent composition.
Spectral Acquisition: Place blank in spectrophotometer and record baseline. Replace with sample solution and scan from 190-800 nm at moderate scan speed (100 nm/min). Maintain constant temperature throughout analysis.
Data Analysis: Identify λ_max (wavelength of maximum absorption). Calculate molar absorptivity using Beer-Lambert law (A = εcl). Compare with reference standards for identification [9].
Quality Control: System suitability testing with standard solutions before sample analysis. Documentation following ALCOA+ principles for regulatory compliance [4].
IR Spectroscopy Protocol for Raw Material Identification
Principle: This protocol employs molecular vibration signatures in the infrared region to create unique fingerprint patterns for raw material identification [4].
Materials and Equipment:
- FT-IR spectrometer with DTGS or MCT detector [24]
- ATR accessory (diamond or ZnSe crystal) or KBr pellet apparatus [4]
- Hydraulic press (10-15 tons for KBr pellets)
- Anhydrous potassium bromide (spectroscopic grade)
- Sample cards for diffuse reflectance
Procedure:
- Instrument Preparation: Purge spectrometer with dry air or nitrogen to minimize atmospheric water and CO₂ interference. Background spectrum collection with clean ATR crystal or empty sample holder [4].
ATR Method (Preferred): Place small amount of raw material powder directly on ATR crystal. Apply consistent pressure using anvil to ensure good crystal contact. Collect spectrum with 4 cm⁻¹ resolution, 16-32 scans from 4000-400 cm⁻¹ [4].
KBr Pellet Method (Alternative): Thoroughly mix approximately 1 mg sample with 100 mg dry KBr in mortar. Press mixture in hydraulic press at 10-12 tons for 1-2 minutes to form transparent pellet. Mount pellet in holder for transmission measurement [4].
Spectral Acquisition: Collect sample spectrum using identical parameters to background measurement. Ensure absorbance values below 1.0 for optimal spectral quality.
Data Analysis: Examine functional group region (4000-1500 cm⁻¹) for characteristic stretches. Analyze fingerprint region (1500-400 cm⁻¹) for unique pattern matching. Compare with reference spectrum in database using correlation algorithms [4].
Quality Control: Verify instrument performance with polystyrene standard before analysis. Maintain controlled humidity environment during analysis [4].
Data Analysis and Interpretation Workflows
Spectral Interpretation Pathways
Diagram 1: Spectral Data Interpretation Workflow for Material Identification. This diagram illustrates the complementary analytical pathways for UV-Vis and IR spectroscopy, highlighting how electronic transitions and molecular vibrations provide different but complementary information for material characterization.
Advanced Integration with Machine Learning
Diagram 2: Machine Learning Integration in Modern Spectroscopy. This workflow shows how advanced data processing and machine learning enhance spectroscopic analysis, enabling real-time decision making in automated laboratories [21] [23] [25].
Essential Research Reagent Solutions
Table 3: Key Research Reagents and Materials for Spectroscopic Analysis
| Reagent/Material | Function | Application Specifics |
|---|---|---|
| Quartz Cuvettes | Sample holder for UV-Vis analysis | Transparent down to 190 nm; required for UV measurements [9] |
| ATR Crystals (Diamond/ZnSe) | Contact element for FT-IR sampling | Enables minimal sample preparation; diamond durable for hard materials [4] |
| Potassium Bromide (KBr) | Matrix for IR pellet preparation | Transparent in IR region; forms pellets under pressure [4] |
| Deuterated Solvents | Solvent for spectral analysis | Minimal interference in regions of interest; CDCl₃, DMSO-d₆ for NMR [4] |
| Holmium Oxide Filter | Wavelength calibration standard | Validates spectrophotometer wavelength accuracy [4] |
| Polystyrene Film | IR frequency calibration | Provides characteristic peaks for instrument validation [4] |
| NIST-Traceable Standards | Quantitative calibration | Ensures measurement accuracy and regulatory compliance [4] |
Application in Pharmaceutical Raw Material Identification
The selection between UV-Vis and IR spectroscopy for pharmaceutical raw material identification depends heavily on the specific analytical requirements, with each technique offering distinct advantages. IR spectroscopy, particularly ATR-FTIR, has become the gold standard for identity testing of raw materials due to its exceptional fingerprinting capability [4]. The technique provides specific information about functional groups and molecular structure that enables definitive identification of pharmaceutical compounds. Modern ATR accessories require minimal sample preparation, making the analysis rapid and suitable for high-throughput environments. The non-destructive nature of IR analysis preserves samples for additional testing if required. Regulatory agencies including the FDA and EMA recognize IR spectroscopy as a validated method for identity testing in pharmaceutical quality control systems [4].
UV-Vis spectroscopy plays a complementary but different role in raw material characterization, offering exceptional quantitative capabilities for chromophore-containing compounds [4]. While it provides less specific structural information than IR spectroscopy, UV-Vis excels at quantifying analyte concentration through the well-established Beer-Lambert law. This makes it invaluable for concentration verification of active pharmaceutical ingredients (APIs) and reference standards. The technique's high sensitivity enables detection of impurities at low levels, while its simplicity and speed facilitate rapid analysis in quality control workflows. Recent advances combining UV-Vis with machine learning algorithms have further enhanced its application for real-time monitoring and automated analysis in pharmaceutical manufacturing environments [21] [23].
The pharmaceutical industry increasingly leverages both techniques within integrated quality control systems, recognizing their complementary strengths. IR spectroscopy provides definitive identity confirmation through molecular fingerprinting, while UV-Vis spectroscopy offers precise quantification of chromophoric compounds. This combined approach ensures comprehensive raw material characterization that meets regulatory requirements while maintaining efficiency in pharmaceutical manufacturing operations [4].
Practical Protocols: Implementing UV-Vis and IR in Pharmaceutical Raw Material Testing
In the field of analytical chemistry, the accurate identification of raw materials is a critical step in ensuring the quality, safety, and efficacy of final products, particularly in the pharmaceutical industry. Within this context, ultraviolet-visible (UV-Vis) and infrared (IR) spectroscopy have emerged as two foundational techniques for material verification. While often discussed in terms of their underlying principles—electronic transitions for UV-Vis versus vibrational transitions for IR—their practical utility in a laboratory setting is equally governed by their sample handling requirements and material versatility. This guide provides an objective comparison of UV-Vis and IR spectroscopy, focusing on their respective capabilities in analyzing solid, liquid, and gas samples, supported by experimental data and standardized protocols to inform method selection in research and drug development.
Fundamental Differences in Sample-Tech Compatibility
The interaction between the sample and the spectroscopic technique is a cornerstone of analytical effectiveness. UV-Vis spectroscopy probes the excitation of electrons within molecules, typically requiring those molecules to be in a solution to ensure a uniform pathlength and accurate absorbance measurements [26]. This inherently limits its direct application for many solid materials.
In contrast, IR spectroscopy measures the vibrational energies of molecular bonds, a process that is less dependent on the sample's physical state. Modern IR instruments, especially those equipped with Attenuated Total Reflectance (ATR) accessories, can directly analyze solids, liquids, and pastes with minimal preparation, making them exceptionally versatile for raw material identification [26] [11]. The following table summarizes these core differences.
Table 1: Core Differences Between UV-Vis and IR Spectroscopy
| Aspect | UV-Vis Spectroscopy | IR Spectroscopy |
|---|---|---|
| Core Interaction | Electronic transitions [26] | Vibrational transitions and molecular rotations [26] |
| Primary Sample Form | Liquid solutions [26] | Solids, liquids, pastes, and gases [26] [11] |
| Typical Preparation | Dissolution and dilution [26] | Minimal; often direct placement on ATR crystal [11] |
| Key Information | Concentration, electronic structure [26] | Molecular fingerprint, functional groups, molecular structure [26] |
Sample Preparation Methods and Versatility
The required preparation methods for each technique directly impact analysis time, cost, and suitability for different sample types.
UV-Vis Spectroscopy Sample Handling
UV-Vis spectroscopy is predominantly a solution-based technique.
- Liquid Samples: The primary requirement is that the analyte must be dissolved in a solvent that is transparent in the spectral region of interest. A common protocol involves serial dilution to bring the analyte concentration within the instrument's ideal linear range (often an absorbance between 0.1 and 1.0) [26]. The sample is then placed in a transparent cuvette with a defined pathlength for analysis.
- Solid Samples: Analyzing solids with UV-Vis is challenging. They often require extraction or dissolution into a suitable solvent. Some solid samples can be analyzed with specialized tools, but this is less common and can introduce significant complexity [26].
IR Spectroscopy Sample Handling
IR spectroscopy offers a much broader array of preparation techniques, accommodating various physical states.
- Solid Samples: Several well-established methods exist:
- ATR (Attenuated Total Reflectance): This is the most common modern method. A small amount of solid (a few milligrams) is placed directly on a diamond or zinc selenide crystal and clamped to ensure good contact. The IR beam reflects within the crystal, interacting with the sample at the point of contact. This method requires no prior preparation and is non-destructive [11].
- KBr Pellets: The traditional method involves finely grinding approximately 1 mg of solid sample with 100 mg of potassium bromide (KBr) and then compressing the mixture under high pressure to form a transparent pellet. KBr is used because it is transparent to IR radiation [27].
- Nujol Mull: The sample is ground with a few drops of Nujol (mineral oil) to form a mull, which is then sandwiched between two IR-transparent salt plates [27].
- Liquid Samples: A drop of the liquid is simply placed directly onto the ATR crystal or between two salt plates (e.g., NaCl or KBr) to form a thin film [11] [27].
- Gas Samples: While less common in routine raw material ID, gases can be analyzed using specialized gas cells with long pathlengths to compensate for low sample density [27].
Table 2: Experimental Protocols for Common Sample Types
| Sample Type | UV-Vis Protocol | IR Protocol (ATR Method) |
|---|---|---|
| Powdered Raw Material (e.g., API) | Dissolve in suitable solvent (e.g., methanol, water). Perform serial dilution to achieve target concentration. Transfer to cuvette for analysis. [26] | Place a few milligrams of powder directly onto the ATR crystal. Apply pressure with an anvil to ensure good optical contact. Initiate scan. [11] |
| Liquid Sample (e.g., Solvent) | Often analyzed directly after verifying solvent transparency. May require dilution if absorbance is too high. Use appropriate cuvette. [26] | Place a single drop of the liquid onto the ATR crystal. Initiate scan. Clean crystal with appropriate solvent after analysis. [11] |
| Paste or Gel | Often requires extraction or dissolution in a solvent, followed by filtration or centrifugation to remove particulates. [26] | Apply a small amount directly to the ATR crystal and flatten. Initiate scan. The high pressure of the ATR clamp can help ensure good contact. [11] |
Experimental Data and Comparison
Empirical data and standardized workflows highlight the practical implications of choosing one technique over the other.
Workflow for Raw Material Identity Testing
For raw material verification, both techniques can be used, but their workflows differ significantly in terms of speed and steps required. The following diagram illustrates the typical workflow for identity testing using IR spectroscopy, which is the more common application for this purpose.
Quantitative Comparison of Versatility and Performance
The following table synthesizes experimental data and characteristics related to the versatility of each technique.
Table 3: Versatility and Performance Comparison
| Parameter | UV-Vis Spectroscopy | IR Spectroscopy (with ATR) |
|---|---|---|
| Analysis Speed | Fast (minutes per sample, excluding dissolution time) [26] | Very Fast (2-3 minutes per sample, including preparation) [11] |
| Sample Throughput | High for liquids, lower for solids requiring dissolution | Very High for all states [11] |
| Material Versatility | Limited primarily to liquids and soluble solids [26] | High (powders, crystals, liquids, pastes, some gases) [11] |
| Sensitivity to Water | Can be used with aqueous solvents | Water has strong IR absorption; can interfere in the 3200-3600 cm⁻¹ region [11] |
| Detection Limit for Impurities | Excellent for trace analysis (low ppm/ppb possible) | Limited (typically 1-5% for impurities) [11] |
| Quantitative Strength | Excellent sensitivity and linearity for concentration measurement [26] | Good for quantitative analysis of major components, but primarily used for qualitative ID [26] [11] |
The Scientist's Toolkit: Key Materials and Reagents
Successful sample preparation relies on specific consumables and accessories. The following table details essential items for both techniques.
Table 4: Essential Research Reagent Solutions for Spectroscopy
| Item | Function | Common Examples & Notes |
|---|---|---|
| UV-Vis Cuvettes | Holds liquid sample in the light path. | Glass (for Vis), Quartz (for UV-Vis); various pathlengths (e.g., 1 cm). |
| Spectroscopic Solvents | Dissolves analyte without interfering absorbance. | Methanol, water, hexane, acetonitrile. Must be UV/Vis grade for low impurity background. |
| ATR Crystals | The interface for sample measurement in ATR-IR. | Diamond (durable, universal), ZnSe (common, avoid acids). The crystal material defines the spectral range [27]. |
| IR Transparent Salts | Windows for liquid cells or gas cells. | NaCl, KBr. Note: Highly hygroscopic; must be stored in a desiccator [27]. |
| KBr (Potassium Bromide) | Matrix for creating solid pellets for transmission IR. | FT-IR grade, purified. The pellet formation requires a hydraulic press [27]. |
| Reference Materials | For instrument calibration and spectral verification. | Stable compounds with known spectra (e.g., polystyrene film for IR). |
The choice between UV-Vis and IR spectroscopy for raw material identification is fundamentally guided by the physical nature of the samples and the analytical question at hand. UV-Vis spectroscopy remains the superior technique for quantitative analysis of solutions and concentration determination. However, for comprehensive material versatility—encompassing solids, liquids, and pastes with minimal preparation—IR spectroscopy, particularly with ATR accessories, offers a distinct and powerful advantage. Its non-destructive nature, speed, and ability to provide a unique molecular fingerprint make it an indispensable tool for rapid identity testing in regulated industries like pharmaceuticals. Researchers and quality control professionals must weigh these factors, often finding that UV-Vis and IR serve as complementary, rather than competing, techniques within a well-equipped analytical laboratory.
In the field of analytical chemistry, the choice of spectroscopic technique is pivotal for the accurate and efficient identification of raw materials. UV-Visible (UV-Vis) and Infrared (IR) spectrophotometry are two cornerstone methods, each with distinct strengths in revealing the chemical composition of substances. This guide provides a detailed, objective comparison of their instrumentation, performance, and applicability, equipping researchers and drug development professionals with the data needed to select the optimal technique for their specific raw material identification challenges.
Core Principles and Instrumentation
The fundamental difference between UV-Vis and IR spectroscopy lies in the regions of the electromagnetic spectrum they probe and the corresponding molecular transitions they measure.
UV-Vis spectrophotometry deals with the ultraviolet (200–400 nm) and visible (400–800 nm) regions of the electromagnetic spectrum. It operates on the principle of electronic transitions, where molecules absorb light, promoting electrons to higher energy orbitals [28].
IR spectrophotometry operates in the infrared region (typically 2,500–16,000 nm or, in wavenumbers, 4000–400 cm⁻¹). It measures the absorption of radiation due to vibrational transitions—changes in the vibrational energy of chemical bonds [11] [28]. The resulting spectrum is a unique "fingerprint" of the molecule [11].
Instrument Design Configurations
The path from the light source to the detector can be configured in different ways, each with specific advantages.
- Filter Photometer: This is the simplest instrument for molecular UV/Vis absorption. It uses an absorption or interference filter to isolate a band of radiation and is a single-beam instrument. Its advantages are portability, ruggedness, and low cost. However, it cannot record a full absorption spectrum, and its large effective bandwidth limits the linearity of its calibration curve [29].
- Single-Beam Spectrophotometer: An instrument that uses a monochromator for wavelength selection is called a spectrophotometer. A single-beam spectrophotometer is calibrated to 0% transmittance with a shutter and to 100% T with a blank before measuring the sample's transmittance. Its accuracy is limited by the stability of its source and detector over time [29].
- Double-Beam Spectrophotometer: This design minimizes the limitations of single-beam instruments by using a chopper to alternate the radiation path between the sample, a blank, and a shutter. The signal processor resolves the signal into the transmission of the blank (P0) and the sample (PT), allowing for continuous adjustment and more stable, accurate readings [29].
The logical flow of components and configurations in a spectrophotometer is summarized in the diagram below.
Performance Comparison: UV-Vis vs. IR Spectroscopy
The following tables summarize the core operational differences and experimental performance data of UV-Vis and IR spectroscopy.
Table 1: Fundamental Operational Comparison between UV-Vis and IR Spectrophotometry [28]
| Aspect | UV-Vis Spectrophotometry | IR Spectrophotometry |
|---|---|---|
| Wavelength Range | 200–800 nm | 2,500–16,000 nm (4,000–400 cm⁻¹) |
| Fundamental Principle | Electronic transitions | Vibrational transitions |
| Primary Applications | Quantitative analysis of chromophores, metal ions, organic compounds, and biological molecules | Identification of functional groups, studying molecular conformations and structures |
| Selectivity | Less selective; good for conjugated double bonds or aromatic rings | More selective; provides detailed functional group information |
| Sensitivity | Often more sensitive for trace amounts of substances | Highly sensitive to specific functional groups |
| Sample Requirements | Versatile (liquids, gases); often requires cuvettes | Requires specific forms (thin films, transparent); ATR technique simplifies preparation |
Table 2: Experimental Performance in Plant Nutrient Analysis Using Different Spectrometers [30]
| Spectrometer Type | Spectral Range | Sample State | Key Findings |
|---|---|---|---|
| Portable VisNIR | Visible & Near-Infrared | Dry-Intact & Ground | Accurately predicted N, P, K, S, Mg, Mn, Fe. Ground scans yielded superior accuracy. |
| Portable MIR | Mid-Infrared | Dry-Intact & Ground | Accurately predicted N, P, Mg, Mn, Fe, Zn. Performance of some portable devices was comparable to lab-only instruments. |
| Lab-only Benchtop | Mid-Infrared | Dry-Intact & Ground | Provided the highest accuracy for ground samples, but sample grinding is a tedious, time-consuming step. |
Experimental Protocols for Raw Material Verification
To ensure the validity and reproducibility of results, adherence to standardized experimental protocols is essential.
IR Spectroscopy Protocol for Raw Material Identity Testing
This protocol leverages the common Attenuated Total Reflectance (ATR) accessory, which minimizes sample preparation [11].
Sample Preparation:
- Bring the raw material sample and instrument to room temperature (68–77°F) to prevent thermal interference.
- For solids (powders, crystals), use a few milligrams to fully cover the ATR crystal surface.
- For liquids, a single drop applied with a dropper is sufficient.
Spectral Acquisition:
- Place the sample in direct contact with the ATR crystal.
- Scan the sample across the mid-infrared range (4,000–400 cm⁻¹).
- The instrument records absorption peaks corresponding to specific molecular bond vibrations.
Spectral Comparison & Verification:
- Compare the acquired spectrum against a validated reference library.
- Advanced software algorithms calculate the match percentage between the test sample and the reference material.
- A match of ≥90% is typically required to confirm the material's identity and purity.
UV-Vis Protocol for Quantitative Analysis
This protocol outlines a general method for determining the concentration of a chromophore in a solution using a double-beam UV-Vis spectrophotometer [29].
Sample Preparation:
- Dissolve the analyte in a suitable solvent that does not absorb significantly in the region of interest.
- The analyte must contain a chromophore to absorb UV or visible light.
Instrument Calibration & Measurement:
- Calibrate the instrument for 0% T (with a shutter) and 100% T (with a pure solvent blank).
- Fill a clean cuvette with the sample solution and place it in the sample compartment.
- Set the instrument to the wavelength of maximum absorption (λmax) for the analyte.
- Measure the absorbance of the sample.
Quantification:
- Use the Beer-Lambert law (A = εlc) to calculate the concentration of the analyte, where A is absorbance, ε is the molar absorptivity, l is the path length, and c is concentration.
- This is often done by constructing a calibration curve from standard solutions of known concentration.
The workflow for the IR spectroscopy identity test, which is critical for raw material verification, is shown below.
The Scientist's Toolkit: Key Research Reagent Solutions
The following table details essential materials and their functions in spectroscopic analysis, particularly for raw material verification.
Table 3: Essential Materials and Reagents for Spectroscopic Analysis
| Item | Function | Application Context |
|---|---|---|
| ATR Crystal | Enables sample analysis with minimal preparation by measuring the interaction between infrared light and the sample at the crystal surface. | IR spectroscopy for solids, liquids, and pastes [11]. |
| Certified Reference Materials (CRMs) | Authenticated, high-purity materials used to build and validate instrument calibration curves and reference spectral libraries. | Essential for both UV-Vis quantification and IR identity testing to ensure accuracy and regulatory compliance [11]. |
| Deuterated Solvents | Solvents with deuterium atoms replacing hydrogen to eliminate interfering H-atom signals in the spectrum. | Primarily for NMR spectroscopy; not required for routine IR or UV-Vis [31]. |
| Molecularly Imprinted Polymers (MIPs) | Synthetic polymers with cavities designed to bind specific target molecules, enhancing selectivity. | Used in SERS sensors to mitigate matrix interference and detect trace toxins in food [18]. |
| UV-Vis Cuvettes | Small, transparent containers (typically glass or quartz) for holding liquid samples during analysis. | UV-Vis spectrophotometry; quartz is required for UV-range analysis [29]. |
Advanced Trends and Future Outlook
The field of spectroscopy is being transformed by technological advancements and the integration of artificial intelligence.
- Evolving Instrument Design: Modern UV-Vis instruments are emphasizing user-friendly interfaces, faster scan speeds, smaller benchtop footprints, and improved connectivity with digital lab ecosystems [32]. Similarly, portable IR and VisNIR spectrometers are now achieving performance levels comparable to laboratory-only instruments, enabling on-site analysis [30].
- AI-Driven Structure Elucidation: A significant breakthrough is the application of transformer-based AI models to predict molecular structures directly from IR spectra. Recent models have achieved a Top-1 accuracy of 63.79% in identifying the correct molecule from its IR spectrum alone, moving beyond simple functional group identification to full structure elucidation [33] [31].
- Advanced Spectral Analysis: For complex UV-Vis spectra, such as those from conjugated molecules or reactive species in solution, advanced fitting functions like the modified Pekarian function (PF) are being used. This allows for high-accuracy deconvolution of overlapping bands, providing more quantitative information from experimental data [7] [34].
In the context of raw material identification, the choice between Ultraviolet-Visible (UV-Vis) and Infrared (IR) spectroscopy is fundamentally guided by the analytical question: "What is it?" versus "How much is there?". While IR spectroscopy excels in identifying functional groups and confirming molecular structures—making it ideal for qualitative raw material verification—UV-Vis spectroscopy establishes its critical role as a powerful quantitative tool. This guide focuses on the application of the Beer-Lambert Law, the cornerstone principle that enables researchers to transform simple light absorption measurements into precise concentration data for substances in solution [28] [3].
The Beer-Lambert Law postulates a linear relationship between the absorbance of light by a solution and the concentration of the absorbing species within it [35]. This relationship is formally expressed as: A = εlc where A is the measured absorbance, ε is the molar absorptivity (a compound-specific constant), l is the path length of light through the solution (typically 1 cm), and c is the concentration of the analyte [35]. This law enables the construction of a calibration curve from standards of known concentration, which can then be used to determine the concentration of unknown samples from their absorbance readings.
Core Principles and Key Differences from IR Spectroscopy
Understanding the distinct mechanisms of UV-Vis and IR spectroscopy is crucial for selecting the appropriate technique. The table below summarizes their key characteristics.
Table 1: Fundamental Comparison of UV-Vis and IR Spectroscopy
| Feature | UV-Vis Spectroscopy | IR Spectroscopy |
|---|---|---|
| Primary Mechanism | Electronic transitions (e.g., π→π, n→π) [28] | Vibrational transitions of chemical bonds [28] |
| Wavelength Range | 200 - 800 nm [28] | 2,500 - 16,000 nm [28] |
| Main Application | Quantitative analysis (determining concentration) [3] | Qualitative analysis (identifying functional groups and structures) [28] [3] |
| Typical Sample Form | Liquids (solutions) [28] | Solids (thin films, KBr pellets), liquids [28] |
| Key Quantitative Principle | Beer-Lambert Law [35] | Limited quantitative use; deviations from Beer-Lambert Law are more common due to scattering [36] |
The following workflow diagram illustrates the standard quantitative analytical process in UV-Vis spectroscopy, from sample preparation to concentration determination.
Diagram 1: UV-Vis Quantitative Analysis Workflow
Essential Reagents and Materials for UV-Vis Analysis
The reliability of quantitative UV-Vis analysis depends on the quality of reagents and equipment used. The following toolkit details the essential components.
Table 2: The Scientist's Toolkit for UV-Vis Quantitative Analysis
| Item / Reagent | Function & Importance |
|---|---|
| High-Purity Solvent | Dissolves the analyte without absorbing in the measured range; serves as the blank to zero the instrument [35]. |
| Standard (Certified Reference Material) | Used to prepare calibration standards of known concentration; purity is critical for accuracy [37]. |
| Cuvettes | High-quality, matched cuvettes (typically with 1 cm path length) hold the sample and solvent blank [35]. |
| UV-Vis Spectrophotometer | The core instrument that measures the intensity of light before (I₀) and after (I) it passes through the sample [35]. |
| Volumetric Glassware | Precise flasks and pipettes are essential for accurate dilution and preparation of standard solutions [37]. |
Experimental Protocol: Applying the Beer-Lambert Law
This section provides a detailed methodology for determining the concentration of an unknown sample, using a standard calibration curve approach.
Preparation of Standard Solutions
- Stock Solution: Accurately weigh a known mass of the high-purity standard analyte and dissolve it in the chosen solvent in a volumetric flask to make a stock solution of known concentration.
- Serial Dilution: Using precise volumetric pipettes and flasks, perform a series of dilutions of the stock solution to prepare at least 5 standard solutions of different concentrations, covering the expected range of the unknown [37].
Instrumental Measurement and Calibration
- Blank Measurement: Fill a cuvette with the pure solvent and place it in the spectrophotometer. Use this to set the 0 absorbance (100% transmittance) baseline across the desired wavelength range [35].
- Scan Standard Solutions: Replace the blank with each standard solution and measure its absorbance at the wavelength of maximum absorption (λ_max).
- Construct Calibration Curve: Plot the measured absorbance (y-axis) against the known concentration (x-axis) for each standard. Perform linear regression to obtain the equation of the best-fit line (y = mx + b), which should yield a straight line with a slope of εl [37] [35].
Analysis of Unknown Sample
- Measure Unknown: Under the same instrumental conditions, measure the absorbance of the prepared unknown sample solution.
- Calculate Concentration: Use the equation from the calibration curve to calculate the concentration of the unknown: c = A / (εl), where the slope of the calibration curve is εl.
Performance Comparison: Linearity and Limitations
The Beer-Lambert Law is a powerful model, but its validity has bounds. Understanding its performance under various conditions is key to obtaining accurate data. The following diagram illustrates the ideal behavior and common deviations.
Diagram 2: Beer-Lambert Law Deviation Types
Empirical research provides insights into the boundaries of the law's linearity. A 2021 study investigating lactate concentration in different media offers valuable quantitative data on this front [36].
Table 3: Empirical Investigation of Beer-Lambert Law Deviations for Lactate [36]
| Medium (Scattering Level) | Concentration Range Studied | Evidence of Significant Nonlinearity | Recommended Model Type |
|---|---|---|---|
| Phosphate Buffer (Non-scattering) | 0 - 600 mmol/L | No substantial nonlinearities detected, even at very high concentrations. | Linear models (e.g., PLS, PCR) are sufficient. |
| Human Serum (Moderate Scattering) | Physiological range | Suggests nonlinearities may be present. | Justifies complex, nonlinear models (e.g., SVR, ANN). |
| Sheep Blood (High Scattering) | Physiological range | Suggests nonlinearities may be present. | Justifies complex, nonlinear models (e.g., SVR, ANN). |
This data underscores that the primary challenge to the Beer-Lambert Law's linearity in quantitative analysis often arises not from high analyte concentration alone, but from the scattering properties of the sample matrix itself [36].
Within the framework of raw material identification and drug development, UV-Vis spectroscopy and the Beer-Lambert Law provide an indispensable, robust, and cost-effective platform for quantitative analysis [38]. Its proficiency in answering "how much" complements the structural identification power of IR spectroscopy. While users must be mindful of its limitations—particularly in highly scattering media—the Beer-Lambert Law remains a fundamentally sound and critically important tool. Its continued relevance is reinforced by technological advancements in instrumentation, including miniaturization, diode-array detectors, and integration with AI-powered data analysis, which further enhance its accuracy and application scope [39] [40].
Infrared (IR) spectroscopy is a powerful analytical technique that identifies chemical compounds based on their interaction with infrared light. When IR radiation is passed through a sample, covalent bonds within the molecules absorb specific frequencies, causing the bonds to bend, rotate, or stretch more vigorously [41]. The resulting spectrum provides a unique molecular "fingerprint" that reveals the presence of specific functional groups and the overall structure of the molecule [41]. Unlike UV-Visible spectroscopy, which primarily analyzes electronic transitions and is often used for quantitative analysis of chromophores, IR spectroscopy provides detailed information about molecular vibrations, making it exceptionally well-suited for identifying functional groups and determining molecular structure [28]. For researchers in drug development and raw material identification, mastering IR spectral interpretation is crucial for verifying material identity, detecting impurities, and understanding molecular properties.
IR vs. UV-Vis Spectroscopy: A Fundamental Comparison
Understanding the distinct capabilities of IR and UV-Vis spectroscopy is essential for selecting the appropriate analytical technique for a given application.
Table 1: Comparative Analysis: IR vs. UV-Vis Spectroscopy
| Feature | IR Spectroscopy | UV-Vis Spectroscopy |
|---|---|---|
| Wavelength Range | Typically 2,500 - 16,000 nm (Mid-IR) [28] | 200 - 800 nm [28] |
| Underlying Principle | Measures absorption due to vibrational transitions in chemical bonds [28] | Measures absorption due to electronic transitions between molecular orbitals [28] |
| Primary Information Obtained | Identification of functional groups; detailed molecular structure [28] [41] | Concentration of chromophores; limited structural information [28] |
| Typical Applications | Qualitative analysis of organic compounds, polymers; identifying functional groups [28] [41] | Quantitative analysis of metal ions, organic compounds, and biological molecules [28] |
| Selectivity & Sensitivity | Highly selective for functional groups; sensitivity varies [28] | Generally less selective; often more sensitive for trace analysis [28] |
| Sample Requirements | Can require specific forms (e.g., thin films); KBr pellets, ATR crystal [28] [42] | Versatile; analyzes liquids and gases easily [28] |
The core difference lies in the nature of the absorption process. IR spectroscopy is unparalleled for qualitative analysis and functional group identification, while UV-Vis is often the preferred method for quantitative determination of known analytes in solution [28]. For a comprehensive raw material identification protocol, the two techniques are often used complementarily.
Systematic Interpretation of IR Spectra
Successful interpretation of an IR spectrum requires a structured methodology to avoid misassignment. The following workflow outlines a proven process for analyzing spectra [42].
Pre-Interpretation Essentials
Before analyzing peaks, ensure the spectrum is of high quality. A good spectrum has low noise, a flat baseline near zero absorbance, and peaks that are on-scale (between 0 and 2 absorbance units) [42]. Additionally, identify and ignore common spectral artifacts, such as peaks from water vapor (around 3500 cm⁻¹ and 1600 cm⁻¹) and carbon dioxide (around 2350 cm⁻¹), which arise from changes in the instrument's atmosphere [42].
The Functional Group Region (4000–1500 cm⁻¹)
The high-wavenumber region of the spectrum is richest in information about specific functional groups. The strategy is to read the spectrum from left to right, noting the presence or absence of key absorptions [42].
Table 2: Characteristic IR Absorptions of Major Functional Groups
| Functional Group | Bond(s) | Absorption Range (cm⁻¹) | Peak Intensity & Shape |
|---|---|---|---|
| Alcohol | O-H | 3230–3550 | Broad, Strong [41] |
| Carboxylic Acid | O-H | 2500–3300 | Very Broad, Strong [41] |
| Amine | N-H | 3200–3500 | Medium, Sharp or Broad [41] |
| Alkyne | C-H | 3270–3330 | Medium, Sharp [41] |
| Alkane/Aromatic | C-H | 2800–3300 | Strong, Sharp (exact position indicates hybridization) [41] |
| Nitrile | C≡N | 2200–2300 | Medium, Sharp [41] |
| Aldehyde/Ketone | C=O | 1630–1815 | Very Strong, Sharp [41] |
| Alkene/Aromatic | C=C | 1550–1700 | Variable Sharpness [41] |
The Fingerprint Region (1500–500 cm⁻¹)
The region from 1500 cm⁻¹ to 500 cm⁻¹ is known as the fingerprint region. This area contains a complex set of absorptions arising from coupled vibrations, C-C, C-O, and C-N single bond stretches, as well as bending vibrations [43] [41]. While it is often too complex for direct functional group identification, the overall pattern is unique to every molecule, much like a human fingerprint [43]. It is primarily used to confirm the identity of a compound by comparing the entire spectrum with a reference spectrum from a known standard [43] [44].
Experimental Protocols for IR Analysis
Sample Preparation and Measurement
The choice of sampling technique depends on the physical state of the sample and can affect the spectral appearance [42].
- Solid Samples: Can be prepared as KBr pellets (where the sample is mixed with potassium bromide and pressed into a transparent disc) or analyzed using Attenuated Total Reflectance (ATR), which requires minimal preparation and is now the most common method [42] [45]. ATR involves pressing the sample directly against a crystal (e.g., diamond).
- Liquid Samples: Can be analyzed as a thin film between two salt plates (NaCl or KBr) or using a liquid ATR cell [41].
- Solution Samples: For quantitative work, samples can be dissolved in a suitable solvent (e.g., CHCl₃) and analyzed in a sealed liquid cell. The solvent peaks must be accounted for during interpretation [42].
The Scientist's Toolkit: Essential Research Reagents and Materials
Table 3: Key Materials for IR Spectroscopy Analysis
| Item | Function & Application |
|---|---|
| FT-IR Spectrophotometer | The core instrument that uses an interferometer and Fourier transform to obtain the infrared spectrum of a sample. It is faster and more sensitive than older dispersive instruments [44]. |
| ATR Accessory (Diamond crystal) | Allows for direct analysis of solids and liquids with minimal sample preparation, making it ideal for raw material identification [42]. |
| Potassium Bromide (KBr) | Used to create pellets for transmission analysis of solid samples. It is transparent to IR radiation [45]. |
| Solvent (e.g., Chloroform-d) | For preparing sample solutions. It should be anhydrous and have minimal IR absorption in the regions of interest [42]. |
| Salt Plates (NaCl or KBr) | Used for constructing liquid cells for transmission measurements. They are transparent to IR light but are water-sensitive [41]. |
Advanced Applications and Future Directions
The application of IR spectroscopy continues to expand with technological advancements. Fourier Transform Infrared (FTIR) spectroscopic imaging is a cutting-edge development, particularly in the pharmaceutical industry. This technique allows for in-line monitoring during bioprocessing, such as tracking the stability of protein formulations like therapeutic antibodies directly during chromatography purification steps [46]. Furthermore, the integration of machine learning (ML) with FT-IR imaging is poised to revolutionize data analysis, enabling faster and more accurate pattern recognition for complex mixtures and solid-dose formulations [46]. These advancements ensure that IR spectroscopy remains a vital tool for modern scientists, bridging the gap between traditional qualitative analysis and advanced process analytical technology (PAT).
In the pharmaceutical industry, the identification and characterization of raw materials are critical steps in ensuring drug safety and efficacy. Two foundational analytical techniques employed for this purpose are Ultraviolet-Visible (UV-Vis) and Infrared (IR) spectroscopy. While both methods measure the absorption of electromagnetic radiation, they operate on fundamentally different principles and provide complementary information, making them suited for distinct applications within drug development and quality control. This guide objectively compares the performance of UV-Vis and IR spectroscopy, supported by experimental data and detailed protocols, to aid professionals in selecting the appropriate technique for their specific needs.
Core Principles and Comparative Analysis
UV-Vis and IR spectroscopy probe different molecular interactions, which directly influences their application in pharmaceutical analysis.
UV-Vis Spectrophotometry involves the absorption of light in the ultraviolet (200-400 nm) and visible (400-800 nm) regions of the electromagnetic spectrum. This absorption is due to electronic transitions, where electrons in molecules are excited from a ground state to an excited state. It is particularly effective for molecules with conjugated double bonds or aromatic rings, known as chromophores [28].
Infrared Spectrophotometry deals with the absorption of infrared radiation, typically in the range of 2,500 to 16,000 nm. This absorption corresponds to vibrational transitions, involving the stretching, bending, and contracting of chemical bonds within a molecule. This makes IR exceptionally well-suited for identifying specific functional groups (e.g., carbonyl, hydroxyl, amine) in organic compounds [28] [3].
The table below summarizes the key differences between these two techniques:
Table 1: Fundamental Comparison of UV-Vis and IR Spectrophotometry
| Feature | UV-Vis Spectrophotometry | Infrared (IR) Spectrophotometry |
|---|---|---|
| Wavelength Range | 200 - 800 nm [28] | 2,500 - 16,000 nm [28] |
| Fundamental Principle | Electronic transitions [28] | Vibrational transitions of bonds [28] [3] |
| Primary Information | Concentration of chromophores [28] | Identification of functional groups [28] [3] |
| Primary Pharma Application | Quantitative analysis (e.g., drug assay, dissolution testing) [3] | Qualitative analysis (e.g., raw material identification) [3] |
| Typical Sample Form | Liquids, gases [28] | Thin films, solids transparent to IR [28] |
| Key Advantage | High sensitivity for trace analysis [28] | High selectivity for molecular structure [28] |
Performance Data in Pharmaceutical Applications
The theoretical distinctions translate directly into measurable differences in performance for specific tasks in drug development. The following table consolidates experimental data highlighting the capabilities of each technique.
Table 2: Experimental Performance Data for Pharmaceutical Applications
| Application | Technique | Experimental Performance / Key Findings |
|---|---|---|
| API Quantification in HME | In-line UV-Vis | Accurately predicted piroxicam content within ±5% acceptance limits; high sensitivity with millisecond integration times [47]. |
| Penetration Depth in Tablets | UV-Vis Spectroscopy | Experimental penetration depth up to 0.4 mm; maximum theoretical penetration of 1.38 mm (Kubelka-Munk model); effective sample volume of 2.01 mm³ [48]. |
| Functional Group Identification | IR Spectroscopy | Convolutional Neural Networks (CNNs) automatically classified 37 functional groups with high accuracy using a dataset of >50,000 spectra [49]. |
| Raw Material ID | IR Spectroscopy | Achieved F1 scores above 0.7 for identifying 17 functional groups using neural networks trained on standard reference data [50]. |
Detailed Experimental Protocols
To ensure reproducibility and compliance, detailed methodologies for key experiments are provided below.
Protocol for In-line UV-Vis API Quantification in Hot Melt Extrusion
This protocol is adapted from a study quantifying piroxicam in a Kollidon VA64 polymer matrix [47].
1. Objective: To develop and validate an in-line UV-Vis spectroscopic method for real-time monitoring of API content during hot melt extrusion (HME) using Analytical Quality by Design (AQbD) principles.
2. Materials:
- API: Piroxicam.
- Polymer: Kollidon VA64.
- Equipment: Co-rotating twin-screw extruder (e.g., Leistritz Nano 16), in-line UV-Vis spectrophotometer (e.g., Inspectro X ColVisTec) with transmission probes installed in the extruder die.
3. Method:
- Preparation: Blend PRX and KOL to achieve a homogeneous powder mixture at the target concentration (e.g., 15% w/w).
- Extrusion Setup: Set the extruder temperature profile (e.g., zones: 120°C, 130°C, 140°C), screw speed (e.g., 200 rpm), and feed rate (e.g., 7 g/min).
- UV-Vis Configuration:
- Collect a reference transmittance signal with an empty die at process temperature (140°C).
- Set data collection from 230 to 816 nm with a resolution of 1 nm.
- Configure data collection frequency to 0.5 Hz, with each spectrum as an average of 10 scans.
- Data Analysis & Validation:
- Use the accuracy profile strategy based on total error (trueness and precision) for validation, with acceptance limits set at ±5%.
- Test method robustness by varying critical process parameters (e.g., screw speed 150-250 rpm; feed rate 5-9 g/min).
4. Outcome: A validated, robust PAT tool for real-time release testing (RTRT) of API content during continuous manufacturing [47].
Protocol for Functional Group Identification in Organic Molecules using IR and Neural Networks
This protocol leverages modern machine learning to automate the interpretation of IR spectra [50].
1. Objective: To train a neural network model for the automated identification of functional groups present in organic molecules from their IR spectra.
2. Materials:
- Data: Standardized IR spectra dataset (e.g., NIST SRD 35 containing 5,228 spectra) in JCAMP-DX format [50].
- Software: Python with deep learning libraries (e.g., TensorFlow, PyTorch).
3. Method:
- Data Preprocessing: Standardize all spectra to a consistent resolution (e.g., 8 cm⁻¹) and wavenumber range. Normalize absorbance values.
- Model Architecture: Implement a convolutional neural network (CNN) or a network based on learning split representations designed to process the raw spectral data.
- Training:
- Define the set of functional groups to be classified (e.g., 17 common groups).
- Split the data into training, validation, and test sets.
- Train the model to learn the spectral features associated with each functional group directly from the data, avoiding handcrafted features.
- Validation: Evaluate model performance using metrics such as F1 scores (>0.7 achieved for 17 groups) on a held-out test set to ensure accuracy and generalizability [50].
4. Outcome: A high-throughput, automated system for identifying functional groups in organic molecules, reducing reliance on manual expert interpretation [50].
Workflow and Logical Relationship Visualization
The logical pathway for selecting and applying UV-Vis or IR spectroscopy, from fundamental principles to final application, is outlined in the diagram below.
The Scientist's Toolkit: Essential Research Reagent Solutions
The following table details key materials and software solutions referenced in the experimental protocols and relevant to this field.
Table 3: Key Reagents, Materials, and Software for Spectroscopy in Pharma
| Item Name | Function / Application |
|---|---|
| Kollidon VA64 | A polymer carrier used in hot melt extrusion (HME) to form amorphous solid dispersions, enhancing API solubility [47]. |
| LAMBDA 365+ UV/Vis Spectrophotometer | An instrument designed for pharmaceutical workflows, supporting compliance with global pharmacopoeia standards (USP, Eur. Ph., JP) and 21 CFR Part 11 [51]. |
| Spectrum UV Software | Enhanced security (ES) software with client-server architecture for streamlined data management, validation, and regulatory compliance in UV-Vis analysis [51]. |
| NIST SRD 35 Database | A commercial database of 5,228 infrared spectra used as a standard reference for training and validating machine learning models for functional group identification [50]. |
| Chemotion Repository | An open-access research data repository serving as a valuable source of real-world IR spectra to supplement model training and improve classification performance [50]. |
| In-line UV-Vis Probes (e.g., TPMP) | Optical probes installed directly into process equipment (e.g., an extruder die) for real-time, in-line measurement of UV-Vis transmittance spectra during manufacturing [47]. |
Solving Common Challenges: A Troubleshooting Guide for Reliable Spectroscopy
In the rigorous field of raw material identification, the choice between UV-Vis and Infrared (IR) spectroscopy is often dictated by the molecular information required. However, the analytical integrity of both techniques is fundamentally dependent on proper sample preparation. Errors in handling, such as contamination, incorrect cuvette selection, or overlooking solvent effects, can introduce significant artifacts, leading to inaccurate spectra and erroneous conclusions. This guide provides a structured comparison of UV-Vis and IR spectroscopy, focusing on how to mitigate these prevalent sample preparation errors to ensure data reliability and support robust material verification in pharmaceutical and research settings.
Understanding the fundamental differences between UV-Vis and IR spectroscopy is essential for selecting the appropriate technique and understanding its specific sample preparation requirements.
- UV-Vis Spectroscopy measures the absorption of ultraviolet and visible light, which promotes electrons in a molecule from a ground state to a higher energy excited state [52]. This technique is particularly sensitive to molecules with conjugated π-electron systems or chromophores [53].
- IR Spectroscopy probes the vibrational motions of chemical bonds within a molecule upon absorption of infrared radiation [52]. It is highly sensitive to specific functional groups and provides a unique "fingerprint" for compounds [11] [54].
The table below summarizes the core characteristics of each technique, highlighting their distinct informational outputs and sample form factors.
Table 1: Fundamental Comparison of UV-Vis and IR Spectroscopy
| Feature | UV-Vis Spectroscopy | IR Spectroscopy |
|---|---|---|
| Primary Information | Electronic transitions, concentration [53] | Molecular vibrations, functional groups, structural details [52] [53] |
| Typical Wavelength Range | 190 - 900 nm [53] | ~700 nm to 1 mm (typically 4000 - 400 cm⁻¹ for mid-IR) [11] [53] |
| Common Sample Form | Solutions (primarily) [53] | Solids, liquids, and gases [53] |
| Key Application in Raw Material ID | Quantitative analysis, concentration checks, studying chromophores [52] [9] | Identity testing (fingerprinting), functional group confirmation, polymorph detection [55] [11] |
Experimental Protocols: Mitigating Sample Preparation Errors
Adherence to standardized protocols is critical for generating reliable and reproducible spectroscopic data. The following workflows and guidelines address common pitfalls in sample preparation.
Workflow for UV-Vis Sample Preparation
The diagram below outlines a systematic protocol for preparing a liquid sample for UV-Vis analysis, incorporating key checks to avoid common errors.
Protocol for IR Sample Preparation (ATR Method)
Modern IR spectroscopy often uses Attenuated Total Reflectance (ATR) accessories, which greatly simplify sample preparation.
- Sample State Consideration: Ensure the sample is in a form compatible with the ATR crystal (e.g., fine powder for solids, liquid film for non-volatile liquids) [11].
- Crystal Preparation: Clean the ATR crystal (e.g., diamond) thoroughly with a suitable solvent and lint-free cloth. Ensure it is completely dry before applying the sample [11].
- Sample Application:
- Background Measurement: Acquire a background spectrum with a clean crystal immediately before measuring the sample to account for atmospheric contributions (e.g., water vapor, CO₂) [55].
- Spectral Acquisition: Collect the sample spectrum and compare it to a validated reference library. A match of at least 90% is often required for identity confirmation [11].
Detailed Analysis of Key Preparation Errors
Cuvette Selection and Effects
The choice of cuvette is a critical, yet often overlooked, variable in UV-Vis spectroscopy. Using an inappropriate material can lead to significant signal loss and inaccurate data.
Table 2: Cuvette Material Properties and Selection Guide
| Material | Transmission Range | Key Applications & Advantages | Chemical Resistance & Limitations |
|---|---|---|---|
| Optical Glass | 340 - 2,500 nm [56] | Cost-effective for visible range measurements only [56]. | Resistant to most aqueous solutions; not for UV analysis [56]. |
| UV Quartz | 190 - 2,500 nm [56] | Essential for UV range analysis; reusable [9] [56]. | High resistance to organic solvents and corrosive chemicals when "All Fused" [56]. |
| IR Quartz | 220 - 3,500 nm [56] | Extended range for UV-Vis-IR measurements [56]. | Similar robustness as UV quartz [56]. |
| Plastic (PS/PMMA) | 380 - 780 nm [56] | Disposable; ideal for visible light assays to prevent cross-contamination [56]. | Low cost but not resistant to organic solvents [56]. |
Experimental Consideration: The path length of the cuvette must also be controlled. A standard path length is 10 mm, with a typical manufacturing tolerance of ±0.05 mm [56]. For concentrated samples yielding high absorbance (>1.0), a shorter path length cuvette (e.g., 1 mm or 2 mm) should be used to bring the measurement back within the instrument's linear dynamic range [9].
Contamination and Solvent Interference
Contamination and solvent choice can obscure the analytical signal in both UV-Vis and IR spectroscopy.
Table 3: Common Contaminants and Solvent Effects
| Error Source | Impact on UV-Vis Spectrum | Impact on IR Spectrum | Preventive/Mitigation Strategy |
|---|---|---|---|
| Water Contamination | Can contribute to a rising background at lower wavelengths. | Shows broad, intense peaks at ~3,200-3,600 cm⁻¹ (O-H stretch) and ~1,640 cm⁻¹ (H-O-H bend), masking functional group peaks [11]. | Use anhydrous solvents; ensure sample is dry; use desiccators. |
| Organic Solvent Residue | Will absorb at its characteristic λmax, potentially overlapping with the analyte peak. | Produces sharp peaks in its fingerprint region (e.g., ethanol C-H and C-O stretches) [11]. | Ensure proper cleaning of cuvettes and ATR crystals between uses. |
| Incorrect Solvent Choice | Solvent absorption band overlaps with analyte peak, leading to signal loss and inaccurate Beer-Lambert law application. | Solvent itself has a strong IR spectrum that obscures the sample's signal. | Select UV-transparent solvents for UV-Vis (e.g., acetonitrile, water for higher UV). For IR, use solvents with minimal fingerprint regions (e.g., CCl₄, CS₂) or use ATR. |
| Sample Impurities/Adulteration | Alters the absorption spectrum, leading to incorrect concentration calculations or misidentification. | Introduces extra or shifted peaks; spectral subtraction can reveal contaminants [11]. | Source high-purity materials; use spectral subtraction against a pure reference standard [11]. |
The Scientist's Toolkit: Essential Research Reagent Solutions
The following table details key materials and reagents required for robust spectroscopic analysis.
Table 4: Essential Reagents and Materials for Spectroscopic Sample Preparation
| Item | Function & Application | Technical Considerations |
|---|---|---|
| High-Purity Quartz Cuvettes (10 mm) | Holds liquid samples for UV-Vis analysis; essential for measurements in the UV range [9] [56]. | Opt for "All Fused" fabrication for maximum resistance to organic and corrosive solvents [56]. |
| Diamond/ZnSe ATR Crystal | The sampling surface in FTIR for measuring solids, liquids, and pastes without extensive preparation [11]. | Diamond is durable and chemically inert; ZnSe is a lower-cost alternative but can be damaged by acids. |
| Spectroscopic Grade Solvents | Used to dissolve samples for UV-Vis and as a medium for liquid IR cells. Minimizes interference from solvent absorbance [9]. | Look for "UV-Vis grade" or "HPLC grade" solvents, which are certified for low UV absorbance. |
| Certified Reference Materials (CRMs) | Provides an authenticated standard spectrum for identity testing and quantitative calibration [55] [11]. | Critical for building a validated in-house spectral library; ensures compliance with USP and other pharmacopeias [11]. |
| KBr Powder (IR Grade) | For preparing pressed pellets for transmission IR analysis of solid powders, diluting the sample in a transparent matrix [55]. | Must be kept dry in a desiccator, as KBr is hygroscopic and will show water bands in the spectrum. |
In the critical work of raw material identification, the analytical data is only as reliable as the sample preparation process that precedes it. For UV-Vis spectroscopy, the paramount concerns are the selection of a spectroscopically suitable cuvette and UV-transparent solvent, alongside rigorous cleaning to prevent contamination. For IR spectroscopy, ensuring good optical contact with the ATR crystal and meticulously controlling for atmospheric water vapor are the key success factors. By systematically addressing the errors of contamination, cuvette selection, and solvent effects through the protocols and comparisons outlined in this guide, researchers and drug development professionals can enhance the accuracy of their spectroscopic results, thereby strengthening the foundation of product quality and safety.
In the pharmaceutical industry, the identification of raw materials is a critical first step to ensure the safety, efficacy, and quality of final drug products. Vibrational and molecular spectroscopy techniques, particularly Fourier-Transform Infrared (FT-IR) and Ultraviolet-Visible (UV-Vis) spectroscopy, serve as cornerstone analytical methods for this purpose [57] [4]. FT-IR spectroscopy probes molecular vibrational transitions, generating a unique structural fingerprint based on functional groups, making it ideal for conclusive identification and polymorph detection [58] [4]. UV-Vis spectroscopy measures electronic transitions, providing excellent quantitative capabilities for determining analyte concentration and purity assessment [59] [4]. The analytical performance of both techniques is highly dependent on proper instrument configuration and sample presentation. Key parameters such as lamp warm-up time, sample path length, and analyte concentration must be optimized to ensure data integrity, method robustness, and reliable raw material identification, which is essential for regulatory compliance and patient safety [60] [4].
Table 1: Fundamental comparison between UV-Vis and IR spectroscopy for raw material identification.
| Feature | UV-Vis Spectroscopy | IR Spectroscopy |
|---|---|---|
| Physical Principle | Electronic transitions in molecules [59] | Vibrational transitions of molecular bonds [58] |
| Primary Application in Pharma QA/QC | Concentration determination, dissolution testing, impurity monitoring [4] | Raw material identity verification, polymorph screening, structural verification [19] [4] |
| Sample Preparation | Requires optically clear solutions; matched quartz cuvettes [60] [4] | Solids: KBr pellets or ATR; Liquids: transmission cells or ATR [4] |
| Strengths | Fast, simple, inexpensive, excellent for quantification [4] | Excellent for qualitative analysis, provides structural fingerprints [4] |
| Typical Warm-Up Time | ~20 minutes for tungsten halogen/arc lamps; a few minutes for LEDs [60] | Typically less than 30 minutes (varies by instrument and source) |
Optimizing Critical Measurement Parameters
Lamp Warm-Up and Source Stability
The stability of the light source is fundamental to achieving a stable optical output and a reliable spectral baseline. Inadequate warm-up time is a common methodological error that leads to signal drift and imprecise measurements [60].
- UV-Vis Spectroscopy: For instruments using tungsten halogen or arc lamps, users should allow approximately 20 minutes after turning the lamp on before taking measurements to achieve consistent output and stable illumination. For modern instruments with LED light sources, a shorter warm-up period of a few minutes is typically sufficient [60].
- IR Spectroscopy: While specific warm-up times for IR sources (e.g., silicon carbide globars) are less frequently detailed in application literature, the principle remains critical. Modern FT-IR instruments often have built-in stabilization protocols. Best practice is to follow manufacturer recommendations and consistently allow the instrument to stabilize before analysis to ensure energy throughput is constant, which is crucial for obtaining high signal-to-noise ratio spectra.
Sample Path Length and Concentration
The interaction between path length and analyte concentration is mathematically described by the Beer-Lambert law, which forms the basis for quantitative spectroscopic analysis. Optimizing these two parameters is essential to maintain measurements within the ideal linear range and avoid common pitfalls.
- UV-Vis Spectroscopy: Samples with high analyte concentration can lead to excessive light absorption (high absorbance) and increased scattering, reducing the signal detected and compromising accuracy [60]. To resolve this:
- Reduce the sample concentration by dilution with a compatible solvent.
- Use a cuvette with a shorter path length, which reduces the distance light travels through the sample, thereby decreasing the probability of scattering and lowering the measured absorbance into the optimal range (typically 0.1–1.0 AU) [60] [4].
- IR Spectroscopy: Path length is a critical consideration for liquid sample transmission cells. For solid samples analyzed via Attenuated Total Reflectance (ATR), the effective path length is intrinsically controlled by the crystal material and the depth of penetration of the evanescent wave, making it highly reproducible and minimizing the need for user adjustment [4].
Table 2: Troubleshooting guide for common measurement condition issues.
| Problem | Impact on Spectrum | Recommended Corrective Action |
|---|---|---|
| Insufficient Lamp Warm-Up | Drifting baseline, unstable signal [60] | Allow recommended warm-up time (20 min for Tungsten/arc lamps). |
| Excessive Sample Concentration (UV-Vis) | Absorbance values >1.0 AU, non-linear response, reduced light detection [60] | Dilute sample or use a cuvette with a shorter path length [60]. |
| Inappropriate Path Length (UV-Vis) | Signal too low or too high for accurate quantification. | Select a cuvette with a path length suited to the expected concentration. |
| Unclean Cuvettes/ATR Crystal | Unexpected peaks or general spectral noise [60] | Thoroughly clean and dry sample presentation accessories before measurement. |
Experimental Protocols for Method Optimization
Protocol: Establishing Optimal Path Length and Concentration for UV-Vis
This protocol is designed to systematically determine the ideal combination of path length and concentration for a given analyte.
- Sample Preparation: Prepare a stock solution of the analyte at a known, relatively high concentration. Serially dilute this stock to create a dilution series (e.g., 100%, 50%, 25%, 12.5%).
- Initial Measurement: Using a standard 10 mm path length quartz cuvette, measure the absorbance across the UV-Vis range for each dilution.
- Data Analysis: Identify the dilution whose maximum absorbance at the wavelength of interest (λmax) falls within the ideal range of 0.1–1.0 AU.
- Path Length Adjustment: If the maximum absorbance for even the most dilute sample is still too high, repeat the measurement of that sample using cuvettes with shorter path lengths (e.g., 2 mm or 1 mm).
- Validation: The optimal condition is the combination of concentration and path length that yields an absorbance at λmax near the center of the linear range of the calibration curve, typically around 0.4-0.6 AU.
Workflow Diagram: UV-Vis Method Optimization
The following diagram outlines the logical decision process for optimizing UV-Vis measurement conditions.
Protocol: Verifying IR Spectrometer Performance for ATR Analysis
For IR spectroscopy, especially with ATR, the focus is on instrument readiness and sample preparation.
- System Warm-Up and Background Check: Power on the FT-IR spectrometer and allow it to complete its initialization and stabilization cycle. Acquire a fresh background spectrum with a clean ATR crystal.
- ATR Crystal Inspection and Cleaning: Visually inspect the ATR crystal (e.g., Diamond, ZnSe) for residue or damage. Clean the crystal with a soft cloth and a compatible solvent (e.g., methanol), followed by drying.
- Performance Validation: Apply a known standard (e.g., a film of polystyrene) to the ATR crystal and acquire a spectrum. Compare the resulting spectrum to a library reference to verify the instrument's resolution, wavelength accuracy, and signal-to-noise ratio are within specified limits.
- Sample Analysis: Place a representative amount of the raw material directly onto the ATR crystal, ensuring good contact. Apply consistent pressure via the instrument's anvil and acquire the sample spectrum.
The Scientist's Toolkit: Essential Research Reagent Solutions
Table 3: Key materials and reagents for spectroscopic analysis in pharmaceutical research.
| Item | Function | Application Notes |
|---|---|---|
| Quartz Cuvettes | Holds liquid samples for UV-Vis transmission measurements. | Optically clear in UV & Vis regions; requires proper cleaning and handling [60]. |
| ATR Crystal (Diamond/ZnSe) | Enables direct solid/liquid sample measurement via internal reflection. | Diamond is robust and chemically inert; ZnSe offers a cost-effective alternative but is softer [4]. |
| Potassium Bromide (KBr) | Matrix for preparing solid pellets for transmission IR spectroscopy. | Requires grinding with sample and pressing under high pressure; hygroscopic [4]. |
| Deuterated Solvents | Solvents for NMR and sometimes IR/UV-Vis with minimal spectral interference. | Used for sample preparation in NMR to avoid H2O signal interference [4]. |
| Certified Reference Materials | Provides known spectral fingerprints for instrument calibration and method validation. | Critical for confirming the identity of raw materials against a pharmacopeial standard [4]. |
| Optical Fibers | Guides light in modular spectrometer setups. | Must have compatible connectors and be checked for damage or signal attenuation [60]. |
The rigorous optimization of measurement conditions is not merely a procedural step but a fundamental requirement for leveraging the full analytical potential of both UV-Vis and IR spectroscopy. For pharmaceutical researchers, a disciplined approach to lamp warm-up, and a systematic methodology for balancing analyte concentration and path length, directly translates to reliable, reproducible, and defensible data. By adhering to the detailed protocols and guidelines outlined herein, scientists and drug development professionals can ensure their spectroscopic methods are robust, meet stringent regulatory standards, and effectively support the critical task of raw material identification, thereby upholding the highest standards of drug quality and patient safety.
Spectroscopic techniques like Ultraviolet-Visible (UV-Vis) and Infrared (IR) spectroscopy are fundamental for raw material identification in drug development. However, the analytical reliability of these methods can be compromised by common instrumental issues including low signal-to-noise ratio (S/N), optical misalignment, and stray light. Effectively addressing these problems is crucial for generating accurate, reproducible data in pharmaceutical research and quality control. This guide objectively compares how UV-Vis and IR spectroscopy perform under these challenges, supported by experimental data and protocols.
Instrumental Challenges: A Comparative Framework
The performance of UV-Vis and IR spectrometers when confronting typical instrumental problems varies significantly due to their distinct underlying technologies. The table below summarizes key performance differentiators based on instrumental principles.
Table 1: Fundamental Comparison of UV-Vis and IR Spectroscopy Technologies
| Attribute | Typical UV-Vis Spectrometer | Fourier-Transform IR (FTIR) Spectrometer |
|---|---|---|
| Core Technology | Dispersive (grating monochromator) [61] | Interferometer (e.g., Michelson) [61] |
| Wavelength Selection | Grating before sample [61] | Interferometer; all wavelengths measured simultaneously [61] |
| Primary Detectors | Photomultiplier Tube (PMT), Photodiode [9] | Semiconductor (e.g., DTGS, MCT) [61] |
| Critical Alignment Components | Grating angle, entrance/exit slits [61] | Moving mirror, laser reference [61] |
| Susceptibility to Stray Light | Higher (from out-of-band wavelengths) [9] | Lower (defined by interferometer and laser) [61] |
Correcting for Low Signal-to-Noise Ratio (S/N)
A low S/N ratio obscures spectral features, leading to poor quantification and identification.
Experimental Protocols for S/N Improvement
- Path Length and Concentration Adjustment (UV-Vis): For quantitation, ensure absorbance values remain below 1. For highly absorbing samples, either dilute the sample or use a cuvette with a shorter path length (e.g., 1 mm instead of 10 mm) to bring the signal into the instrument's dynamic range [9].
- Signal Averaging (Both Techniques): Collect and average multiple scans of the same sample. The noise, being random, averages out, while the true signal reinforces. The improvement in S/N is proportional to the square root of the number of scans [61].
- Spectral Smoothing (Post-Processing): Apply algorithms like Savitzky-Golay to the acquired spectra. This fits a polynomial to successive segments of the data, reducing high-frequency noise. For instance, a 23-point quadratic polynomial has been used to pre-process UV-Vis data of plant extracts [12].
- Instrument-Specific Optimizations: In dispersive UV-Vis systems, the optical path can be altered for optimal signal amplitude independently in different spectral regions [61]. For FTIR, ensure the instrument's optical path is purged with dry, CO₂-free air to minimize absorption from atmospheric water vapor, which can severely degrade the signal, particularly in the mid-IR region.
Comparative Performance Data
The inherent S/N performance differs between technologies. In a direct comparison, modern dispersive NIR spectrometers (related to UV-Vis technology) demonstrated an S/N ratio 2–60 times greater than that of FT-NIR systems when data acquisition times were matched [61]. Furthermore, the noise level in dispersive systems remains nearly constant across a wide spectral range (400-2500 nm), whereas the noise in FT systems can increase dramatically towards the spectral limits due to optical limitations [61].
Table 2: Strategies for Mitigating Low Signal-to-Noise Ratio
| Strategy | Application in UV-Vis | Application in IR (FTIR) | Key Experimental Consideration |
|---|---|---|---|
| Path Length/Concentration | Highly effective and straightforward [9] | Less common for solid samples (e.g., ATR) | Verify linearity within Beer-Lambert law post-adjustment. |
| Signal Averaging | Effective; speed allows for high scan numbers [61] | Core to FTIR operation; more scans increase acquisition time [61] | Balance between S/N gain and total analysis time. |
| Source Intensity | Use high-intensity Xenon lamp for broad range [9] | Ensure source is properly aligned and functioning. | Source stability is critical for quantitative work. |
| Smoothing (Post-Process) | Common using Savitzky-Golay filters [12] | Common using Savitzky-Golay filters | Can artificially broaden sharp peaks; use with caution. |
Diagnosing and Correcting Alignment Problems
Misalignment in the optical path degrades resolution, reduces signal intensity, and causes wavelength inaccuracies.
Experimental Protocols for Alignment Verification
- Wavelength Accuracy Check (UV-Vis): Use certified reference materials with sharp, known absorption peaks. Holmium oxide filters are standard for calibrating wavelength accuracy and precision in UV-Vis instruments [61] [9]. The measured peak positions should fall within the manufacturer's specified tolerance (e.g., ±0.3 nm) [12].
- Laser & Mirror Alignment (FTIR): FTIR instruments use an internal helium-neon (HeNe) laser to precisely track the moving mirror's position. If resolution and S/N degrade, the laser and interferometer mirrors may require professional realignment [61].
- Photometric Accuracy Check (UV-Vis): Use neutral density filters or standard solutions (e.g., potassium dichromate) with known absorbance values to verify the instrument's photometric scale is accurate (e.g., ±0.004 A) [12] [9].
- Routine Validation: Incorporate these checks into a routine preventative maintenance schedule using certified reference materials to ensure consistent performance.
The workflow for diagnosing and correcting common alignment issues can be summarized as follows:
Managing Stray Light
Stray light is radiation that reaches the detector without passing through the sample or at wavelengths outside the intended band. It causes absorbance readings to deviate from the Beer-Lamb
ert law, particularly at high absorbance values.
Experimental Protocols for Stray Light Assessment
- Stray Light Test (UV-Vis): Use sharp-cutoff filters or concentrated solutions that absorb strongly in a specific region. For example, a potassium chloride solution (12 g/L) will cut off all light below ~200 nm. When measured against water in this region, the transmittance reading indicates the level of stray light [9].
- Minimizing Stray Light (UV-Vis): Ensure the sample compartment is clean and free of dust or fingerprints. Use high-quality matched cuvettes with clear, unscratched windows. Employing bandpass or cutoff filters in conjunction with the monochromator can further reduce stray light [9].
- Stray Light in FTIR: While less common due to the interferometric design, stray light can occur from scattering by poorly prepared solid samples (e.g., KBr pellets). Ensuring proper sample preparation is the key mitigation strategy.
The Scientist's Toolkit: Key Reagent Solutions
The following table details essential materials and reagents used for the experimental protocols described in this guide.
Table 3: Key Research Reagents for Instrument Correction Protocols
| Reagent/Material | Function | Example Experimental Use |
|---|---|---|
| Holmium Oxide (Ho₂O₃) Filter | Wavelength accuracy standard [61] | Calibrating and verifying the wavelength scale of UV-Vis spectrometers against certified peak positions. |
| Potassium Dichromate (K₂Cr₂O₇) | Photometric accuracy standard [9] | Checking the accuracy of the absorbance readout of a UV-Vis spectrometer at specific wavelengths. |
| Potassium Chloride (KCl) | Stray light assessment solution [9] | A 12 g/L solution is used to measure stray light levels in the far-UV region of a UV-Vis spectrometer. |
| Neutral Density Filters | Photometric calibration reference [9] | Certified filters used to validate the linearity and accuracy of the photometric scale across a range of absorbance values. |
| NIST-Traceable Cuvettes | Precision sample containment [9] | Matched quartz cuvettes with known path length ensure consistent and accurate light passage in UV-Vis measurements. |
| Anhydrous Potassium Bromide (KBr) | IR-transparent matrix [61] | Used to prepare solid pellets for transmission-mode FTIR analysis of raw materials, minimizing scattering. |
For researchers in drug development, selecting between UV-Vis and IR spectroscopy involves weighing their respective resiliencies to instrumental artifacts. UV-Vis spectroscopy, with its dispersive design, offers high S/N and straightforward alignment but requires vigilant management of stray light for accurate high-absorbance measurements. FTIR spectroscopy, based on interferometry, is less prone to stray light but demands meticulous mirror alignment and environmental control to maintain its signal-to-noise advantage. A rigorous, protocol-driven approach to correcting for low signal, alignment problems, and stray light is non-negotiable for ensuring the integrity of spectroscopic data in raw material identification and beyond.
In the pharmaceutical industry and research laboratories, the identification and verification of raw materials are critical steps to ensure the safety, efficacy, and quality of final products. Spectroscopy techniques, particularly UV-Visible (UV-Vis) and Infrared (IR) spectroscopy, serve as cornerstone analytical methods for these purposes. While both techniques measure the interaction of light with matter to reveal information about molecular structure and concentration, they operate on fundamentally different principles and offer complementary strengths and limitations. UV-Vis spectroscopy probes electronic transitions occurring when molecules absorb ultraviolet or visible light, typically involving the promotion of electrons in conjugated π-bond systems or chromophores to higher energy states [28] [62]. This technique is renowned for its high sensitivity and excellent quantitative capabilities for compounds that absorb in these regions. In contrast, IR spectroscopy investigates molecular vibrational modes, providing detailed information about functional groups and molecular structure through their characteristic absorption of infrared radiation [28] [62].
The reliability of analytical results from both techniques hinges critically on proper management of the absorbance range and rigorous validation of calibration curves. The linear relationship between absorbance and concentration, as defined by the Beer-Lambert law, forms the foundational principle for quantitative analysis in both UV-Vis and IR spectroscopy [63] [64]. However, this linear relationship holds true only within specific absorbance ranges, beyond which instrumental limitations and chemical factors lead to deviation. Similarly, calibration curves must be properly constructed and validated to ensure accurate quantification, particularly for regulatory applications in pharmaceutical quality control [65] [66]. This guide provides a detailed comparative analysis of these critical methodological aspects, supported by experimental data and protocols relevant to researchers and drug development professionals.
Theoretical Foundations: Absorbance and the Beer-Lambert Law
Fundamental Principles
The Beer-Lambert law (also known simply as Beer's law) establishes the fundamental relationship between the absorption of light and the properties of the material through which the light is passing. According to this principle, the absorbance (A) of a sample is directly proportional to the concentration (c) of the absorbing species and the path length (b) of the light through the sample [63]. The mathematical expression of this relationship is:
A = εbc
Where:
- A is the measured absorbance (dimensionless)
- ε is the molar absorptivity or absorption coefficient (L·mol⁻¹·cm⁻¹)
- b is the path length (cm)
- c is the concentration (mol·L⁻¹)
For IR spectroscopy, the absorption coefficient a(ν) varies at different wavenumbers, meaning different functional groups have different absorption strengths at their characteristic vibrational frequencies [63]. The law applies specifically to absorbance spectra, not transmittance spectra, because absorbance demonstrates direct proportionality to concentration, whereas transmittance does not [63]. Consequently, when performing quantitative analysis using infrared spectroscopy, the transmittance spectrum must be converted into an absorbance spectrum for accurate calculations.
Absorbance Range Considerations
The practical working range for absorbance measurements typically falls between 0.1 and 1.0 absorbance units for both UV-Vis and IR spectroscopy, though modern instruments may extend this range somewhat. At very low absorbances (<0.1), detector sensitivity and signal-to-noise ratio become limiting factors, while at high absorbances (>1.0), deviations from linearity occur due to instrumental factors (stray light, polychromatic radiation) and chemical considerations (association phenomena, refractive index changes) [63] [64].
For mixtures containing multiple components, the total absorbance at any given wavenumber represents the sum of individual absorbances from all N components present [63]:
Atotal(ν) = Σ ai(ν)bc_i
This additive property enables quantitative analysis of multi-component systems, though it necessitates careful selection of characteristic absorption peaks that minimize spectral overlap between components.
UV-Vis Spectroscopy: Technical Implementation
Instrumentation and Measurement
Modern UV-Vis spectrophotometers incorporate several key components that work together to provide accurate absorbance measurements [62]:
- Light Source: Deuterium lamps (UV region) and tungsten/halogen lamps (visible region) provide stable, continuous illumination across the spectral range.
- Monochromator: Utilizing diffraction gratings or prisms, this component isolates specific wavelengths with minimal stray light.
- Sample Holder: Quartz cuvettes are essential for UV measurements due to their transparency in this region, while glass or plastic may suffice for visible-only applications.
- Detector: Photomultiplier tubes (PMTs) offer high sensitivity for low-light detection, while photodiode arrays (PDAs) enable simultaneous multi-wavelength measurement.
Instrument designs vary from simple filter photometers with fixed wavelength selection to sophisticated double-beam spectrophotometers that continuously alternate between sample and reference paths, compensating for source instability and detector drift [67]. The latter design significantly enhances measurement reliability, particularly for analyses requiring high precision.
Quantitative Analysis Protocol
The following experimental protocol outlines a standardized approach for quantitative analysis using UV-Vis spectroscopy:
Step 1: Preparation of Standard Solutions
- Create a concentrated stock solution of the analyte of known concentration.
- Perform serial dilutions to generate at least five standard solutions spanning the expected concentration range of samples.
- Ensure the solvent system remains consistent across all standards and samples.
Step 2: Instrument Calibration
- Initialize the spectrophotometer and allow lamps to warm up according to manufacturer specifications.
- Select the appropriate analytical wavelength (typically λ_max for the analyte).
- Using a matched cuvette filled with pure solvent, collect a blank measurement to establish 100% transmittance (zero absorbance) baseline.
Step 3: Absorbance Measurement
- Measure the absorbance of each standard solution across the defined concentration series.
- Ensure measurements fall within the validated linear range of the instrument (typically 0.1-1.0 AU).
- If sample absorbance exceeds the upper limit, dilute appropriately and remeasure.
Step 4: Calibration Curve Construction
- Plot absorbance (y-axis) versus concentration (x-axis) for all standard measurements.
- Perform linear regression analysis to establish the calibration function: A = mc + b
- Calculate the correlation coefficient (R²) to assess linearity, with values ≥0.999 indicating excellent linear correlation for quantitative work [64].
Step 5: Sample Analysis
- Measure absorbance of unknown samples under identical experimental conditions.
- Calculate sample concentration using the established calibration function.
- For maximum accuracy, analyze samples in triplicate and report mean values.
UV-Vis Quantitative Analysis Workflow
Research Reagent Solutions for UV-Vis Spectroscopy
Table 1: Essential reagents and materials for UV-Vis spectroscopic analysis
| Reagent/Material | Function/Application | Technical Specifications |
|---|---|---|
| Quartz Cuvettes | Sample holder for UV measurements | High transparency down to 190 nm, path length typically 1 cm |
| Deuterium Lamp | UV light source | Continuous spectrum 190-400 nm, limited lifetime ~1000 hours |
| Tungsten-Halogen Lamp | Visible light source | Continuous spectrum 350-1100 nm, longer lifetime than deuterium |
| Solvent (HPLC-grade) | Dissolution medium for analytes | High purity, low UV absorbance (e.g., acetonitrile, methanol) |
| Standard Reference Materials | Calibration standards | Certified purity >99%, traceable to reference standards |
| Buffer Solutions | pH control for ionizable analytes | Appropriate buffer with minimal UV absorption at analytical wavelength |
IR Spectroscopy: Technical Implementation
Instrumentation and Sampling Techniques
Modern IR spectroscopy predominantly utilizes Fourier Transform Infrared (FTIR) technology, which employs an interferometer instead of a monochromator to simultaneously measure all infrared frequencies [62]. This approach provides significant advantages over traditional dispersive instruments, including higher signal-to-noise ratio, faster data acquisition, and improved spectral resolution [62]. Key sampling techniques include:
- Attenuated Total Reflectance (ATR): Requires minimal sample preparation, ideal for solids, liquids, and powders; simply place a small amount of sample onto the ATR crystal for analysis [65] [11].
- Diffuse Reflectance: Suitable for powdered samples and analysis through packaging materials [68].
- Transmission Mode: Traditional approach requiring sample preparation as KBr pellets or thin films between IR-transparent windows [63].
The mid-infrared region (4,000-400 cm⁻¹) provides the most valuable information for functional group identification and quantitative analysis, with specific absorption bands corresponding to characteristic molecular vibrations [11].
Quantitative Analysis Protocol
Step 1: Sample Preparation
- For ATR measurements: Ensure good contact between sample and crystal surface; apply consistent pressure for reproducible results.
- For transmission measurements: Prepare KBr pellets with carefully controlled sample-to-matrix ratio, or create uniform thin films for liquid samples.
- Maintain consistent sample preparation methodology across all standards and unknowns.
Step 2: Spectral Acquisition
- Convert transmittance spectrum to absorbance spectrum as required by Beer's law [63].
- Select a characteristic, well-resolved absorption peak specific to the analyte with minimal interference from other components.
- For mixture analysis, identify peaks unique to each component or employ multivariate calibration methods.
Step 3: Absorbance Measurement Methods
- Peak Height Method: Measure absorbance from a properly defined baseline, typically drawn as a tangent connecting the lowest points on either side of the absorption peak [63].
- Peak Area Method: Integrate the absorption band across a defined wavenumber range; generally provides better accuracy as it is less affected by band shape changes [63].
Step 4: Calibration and Validation
- Prepare standard mixtures spanning the concentration range of interest, using a consistent matrix composition.
- Measure absorbance (peak height or area) for each standard.
- Construct calibration curve and validate according to ICH Q2(R1) guidelines for pharmaceutical applications [65].
Step 5: Sample Analysis
- Measure unknown samples under identical conditions.
- Apply the calibration model to determine concentration.
- For complex mixtures, utilize multivariate calibration techniques (PLS, PCR) available in modern IR software [63].
IR Spectroscopy Quantitative Analysis Workflow
Research Reagent Solutions for IR Spectroscopy
Table 2: Essential reagents and materials for IR spectroscopic analysis
| Reagent/Material | Function/Application | Technical Specifications |
|---|---|---|
| ATR Crystals | Sample interface for attenuated total reflectance | Diamond, ZnSe, or Ge crystals; durable, chemically inert |
| Potassium Bromide (KBr) | Matrix for pellet preparation | IR-transparent, spectroscopic grade, low moisture content |
| IR Transparent Windows | Sample cells for transmission measurements | NaCl, KBr, or CaF₂ windows; hygroscopic materials require care |
| Reference Libraries | Spectral comparison and compound identification | Custom libraries built with authenticated reference materials [11] |
| Internal Standards | Quantitative reference for normalization | Chemically similar, non-interfering compound with characteristic IR band |
| Desiccants | Moisture control for hygroscopic samples | Protection of KBr and hygroscopic crystals from atmospheric moisture |
Comparative Analysis: UV-Vis vs. IR Spectroscopy
Technical Performance Comparison
Table 3: Direct comparison of UV-Vis and IR spectroscopy for quantitative analysis
| Parameter | UV-Vis Spectroscopy | IR Spectroscopy |
|---|---|---|
| Fundamental Principle | Electronic transitions (π→π, n→π) [28] [62] | Molecular vibrations (stretching, bending) [28] [62] |
| Linear Range | Typically 2-3 orders of magnitude [66] | Varies; generally more limited than UV-Vis |
| Sensitivity | Excellent for chromophores; suitable for trace analysis [28] | Moderate; generally less sensitive than UV-Vis [28] |
| Structural Information | Limited to chromophore identification [28] | Detailed functional group and structural information [28] |
| Sample Requirements | Liquids, solutions; versatile form factors [28] | Solids, liquids, powders; may require specific preparation [28] |
| Quantitative Accuracy | High (typically 1-2% relative error) [64] | Good (1-5% for single-component systems) [63] |
| Multicomponent Analysis | Possible with multivariate calibration | Possible with multivariate calibration (PLS, PCR) [63] |
| Regulatory Acceptance | Widely accepted for quantification | Accepted for identity testing; growing for quantification [11] |
Calibration Curve Management: Best Practices
Calibration Standard Preparation
- Prepare calibration standards at concentrations bracketing the expected sample concentrations [66].
- Use high-purity reference materials with documented provenance.
- For low-level analysis, exclude high-concentration standards from the calibration curve to improve accuracy near detection limits [66].
- Ensure the calibration blank has minimal analyte contamination, as blank signal is subtracted from all measurements [66].
Linearity Assessment
- Use correlation coefficient (R²) as an initial indicator, but don't rely on it exclusively [66].
- Examine residual plots to detect systematic deviations from linearity.
- For UV-Vis, verify linearity across the working range using standard reference materials.
Validation Parameters For regulatory applications such as pharmaceutical analysis, complete method validation should include:
- Specificity: Ability to measure analyte response in the presence of other components [65].
- Linearity and Range: Demonstrable linear relationship across the working concentration range [65].
- Accuracy: Percentage recovery of known spiked samples; typically 98-102% for pharmaceutical applications [65].
- Precision: Repeatability (intra-day) and intermediate precision (inter-day, inter-analyst) with %RSD <1-2% [65].
- LOD/LOQ: Limit of Detection and Quantitation, calculated as 3.3σ/S and 10σ/S respectively, where σ is the standard deviation of the response and S is the slope of the calibration curve [65].
Experimental Data from Comparative Studies
Table 4: Experimental validation data for FT-IR quantification of pharmaceutical compounds
| Validation Parameter | Experimental Results | Acceptance Criteria |
|---|---|---|
| Linearity (Range: 0.25-0.75 mg) | R² = 0.9991 [65] | R² ≥ 0.995 |
| Accuracy (% Recovery) | 99.9-100% at 80%, 100%, 120% levels [65] | 98-102% |
| Precision (% RSD) | <1% [65] | ≤2% |
| LOD | 0.0674 mg [65] | N/A |
| LOQ | 0.2042 mg [65] | N/A |
| Specificity | No interference from excipients [65] | Peak purity confirmed |
Advanced Applications and Case Studies
Pharmaceutical Raw Material Verification
IR spectroscopy has become a well-established technique for raw material identification in pharmaceutical quality control due to its specificity and minimal sample preparation requirements [11]. Modern FTIR systems with ATR accessories enable rapid verification (2-3 minutes per sample) without consuming the sample, making them ideal for high-value materials [11]. The technique can differentiate between polymorphic forms of the same compound, which is critical for pharmaceutical applications where different crystal forms can significantly impact a drug's bioavailability and stability [11]. Furthermore, IR spectroscopy can detect contaminants and adulterants through spectral subtraction techniques, where extra or shifted peaks indicate the presence of contamination or substitution [11].
Through-Packaging Analysis with FT-NIR
Fourier Transform Near-Infrared (FT-NIR) spectroscopy offers unique capabilities for analyzing raw materials through their packaging, addressing challenges related to sterility maintenance, spoilage prevention, and personnel safety [68]. Advanced chemometric techniques like Advanced-ID algorithms can effectively separate the spectral contribution of packaging materials from that of the contained raw material, enabling accurate identification without opening containers [68]. Experimental studies demonstrate successful identification of materials including lactose, dextrose, and aspartame through various packaging types including clear polyethylene bags, colored static-dissipative bags, opaque polyethylene bags, and paper envelopes with >98% correlation to reference spectra [68].
Green Chemistry Applications
FTIR spectroscopy has emerged as an environmentally friendly alternative to traditional chromatographic methods for pharmaceutical quantification, significantly reducing solvent consumption and hazardous waste generation [65]. A validated green FTIR method for the antiviral drug entecavir demonstrated excellent linearity (R² = 0.9991), accuracy (99.9-100% recovery), and precision (<1% RSD) while eliminating the need for hazardous solvents typically used in HPLC methods [65]. This approach aligns with green chemistry principles by preventing waste generation at the analytical stage while maintaining regulatory compliance with ICH guidelines.
Both UV-Vis and IR spectroscopy offer robust approaches for quantitative analysis in raw material identification and pharmaceutical development, yet each exhibits distinct advantages and limitations. UV-Vis spectroscopy provides superior sensitivity and established quantitative capabilities for chromophore-containing compounds, making it ideal for concentration determination in solution. IR spectroscopy excels in structural characterization and raw material identification, with growing applications in quantitative analysis, particularly with the advent of advanced FTIR instrumentation and multivariate calibration methods.
Effective management of absorbance range and rigorous validation of calibration curves remain critical for both techniques to ensure data quality and regulatory compliance. Researchers must carefully consider their specific analytical needs—whether prioritizing sensitivity, structural information, minimal sample preparation, or through-packaging capabilities—when selecting between these complementary spectroscopic approaches. The continued advancement of instrumentation and chemometric methods further expands the applications of both techniques in pharmaceutical research and quality control environments.
Head-to-Head Comparison: Selecting the Right Technique for Your Analytical Needs
The choice between Ultraviolet-Visible (UV-Vis) and Infrared (IR) spectroscopy for raw material identification hinges on a clear understanding of their fundamental operating principles. These techniques probe different molecular interactions with light, which directly dictates their analytical capabilities and limitations in a research setting.
UV-Vis spectroscopy measures the absorption of ultraviolet and visible light, which induces electronic transitions within molecules. When a molecule absorbs UV or visible light, electrons are promoted from a lower-energy molecular orbital (e.g., HOMO) to a higher-energy one (e.g., LUMO). This process is characteristic of molecules with chromophores, typically involving conjugated π-systems or atoms with non-bonding electrons [69] [26]. The resulting spectrum provides information on these electronic transitions.
IR spectroscopy, in contrast, measures the absorption of infrared light, which excites vibrational transitions in molecular bonds. The absorbed energy causes bonds to stretch and bend. Since different functional groups (e.g., C=O, O-H, N-H) vibrate at characteristic energies, IR spectroscopy is a powerful tool for identifying the specific chemical groups present in a molecule [69] [28].
The diagram below illustrates the core workflows and primary outputs of each technique, highlighting their distinct roles in material identification.
Direct Technical Comparison
The fundamental differences in the light-matter interactions of UV-Vis and IR spectroscopy lead to distinct technical performance profiles. The following table provides a direct, feature-by-feature comparison critical for method selection in pharmaceutical and material science research.
Table 1: Direct technical feature comparison between UV-Vis and IR spectroscopy.
| Feature | UV-Vis Spectroscopy | IR Spectroscopy |
|---|---|---|
| Primary Analytical Strength | Excellent for quantification and concentration analysis [28] [26]. | Superior for qualitative identification and structural elucidation [28] [26]. |
| Sensitivity | High sensitivity, suitable for trace analysis and dilute solutions [26]. | Generally considered less sensitive than UV-Vis for dilute solutions [28]. |
| Quantitative Power | Excellent; wide linear dynamic range and straightforward calibration via Beer-Lambert Law [70] [26]. | Moderate; more challenging due to complex spectra and deviations from Beer-Lambert Law [26]. |
| Structural Information | Low; provides information on chromophores and conjugated systems, but limited detailed structural data [69] [28]. | High; identifies specific functional groups and provides a molecular "fingerprint" [69] [28]. |
| Spectral Range | 200 - 700 nm [28] [26]. | Typically 2,500 - 16,000 nm (or 4,000 - 400 cm⁻¹) [28]. |
| Sample Preparation | Relatively simple; often uses liquid samples in cuvettes [26]. Solid samples possible with accessories. | More varied; can analyze solids, liquids, and gases. ATR technique has simplified solid sample analysis [26]. |
Experimental Protocols for Raw Material Analysis
UV-Vis Protocol for Concentration Assay
This protocol is designed for quantifying the concentration of a chromophore-containing compound in solution, a common application in drug substance analysis [71].
1. Principle: The concentration of an analyte in solution is determined using the Beer-Lambert Law (A = εbc), where absorbance (A) is proportional to concentration (c), pathlength (b), and the molar absorptivity (ε) [70].
2. Key Reagent Solutions: Table 2: Essential reagents and materials for UV-Vis analysis.
| Item | Function/Description |
|---|---|
| UV-Transparent Solvent | High-purity solvent (e.g., HPLC-grade water, methanol) that does not absorb significantly in the spectral region of interest. |
| Standard Reference Material | High-purity analyte for preparing calibration standards. |
| Quartz Cuvettes | Cuvettes transparent to UV light; standard pathlength is 1 cm [69]. |
| UV-Vis Spectrophotometer | Instrument with a deuterium lamp (UV) and tungsten/halogen lamp (Vis), a monochromator, and a detector (e.g., photomultiplier tube or photodiode array) [69]. |
3. Procedure: a. Standard Preparation: Prepare a series of standard solutions covering a concentration range where the analyte's absorbance is linear (typically up to 1-2 AU). b. Blank Measurement: Fill a cuvette with the pure solvent and place it in the spectrometer. Collect a baseline spectrum or set the blank to 100% transmittance (0 Absorbance). c. Standard Measurement: Replace the blank with each standard solution and measure the absorbance at the predetermined wavelength of maximum absorption (λmax). d. Calibration Curve: Plot the absorbance of the standards versus their known concentrations and perform linear regression. e. Sample Measurement: Measure the absorbance of the unknown sample solution at the same λmax. f. Quantification: Calculate the sample concentration using the linear regression equation from the calibration curve.
IR Protocol for Functional Group Identification
This protocol, utilizing Attenuated Total Reflectance (ATR), is ideal for the rapid identification of raw materials and functional group analysis [26].
1. Principle: A sample is pressed against a high-refractive-index crystal. IR light travels through the crystal and generates an evanescent wave that penetrates the sample, where it is absorbed at characteristic vibrational frequencies, producing a fingerprint spectrum [69].
2. Key Reagent Solutions: Table 3: Essential reagents and materials for ATR-IR analysis.
| Item | Function/Description |
|---|---|
| ATR Accessory | Typically equipped with a diamond, ZnSe, or Ge crystal. Diamond is durable and suitable for most samples. |
| Background Material | The atmosphere (air) is typically used for a background measurement. |
| Clean Solvents | e.g., Methanol, acetone for cleaning the ATR crystal between measurements. |
3. Procedure: a. Background Collection: With no sample on the ATR crystal, collect a background spectrum of the clean crystal and the atmosphere. b. Sample Preparation: For solids, place a few milligrams of finely powdered material directly onto the ATR crystal. For liquids, place a drop on the crystal. Ensure good contact by engaging the pressure clamp. c. Sample Measurement: Collect the IR spectrum of the sample (e.g., over 4000-600 cm⁻¹). d. Spectral Interpretation: Identify key absorption bands and correlate them to known functional groups (e.g., C=O stretch ~1700 cm⁻¹, O-H stretch ~3300 cm⁻¹, amide I & II bands for proteins) [69]. e. Validation: Compare the sample's spectrum to a reference spectrum from a validated library for positive identification.
The workflow for these two distinct experimental paths is summarized below.
Application in Pharmaceutical Raw Material Identification
Within the drug development pipeline, UV-Vis and IR spectroscopy play complementary but distinct roles in raw material identification (ID) and testing.
IR Spectroscopy for Primary Identity Confirmation: IR is the gold standard for unequivocal identification of raw materials. Its high specificity for functional groups allows it to generate a unique "fingerprint" for a compound. The common practice is to compare the IR spectrum of an incoming raw material directly against a reference spectrum of the authentic material, often from a pharmacopeial monograph. Techniques like ATR-FTIR have made this test rapid, non-destructive, and requiring minimal sample preparation [24] [26].
UV-Vis Spectroscopy for Complementary and Quantitative Tests: While less specific for primary ID, UV-Vis is indispensable for related tests on raw materials. It is routinely used to:
- Quantify Impurities: Measure the concentration of a specific chromophoric impurity.
- Assay Potency: Determine the strength (concentration) of a raw material in a solution.
- Monitor Reactions: Track the consumption of a starting material or formation of a product during synthetic steps for active pharmaceutical ingredients (APIs) [71].
The choice between these techniques is not mutually exclusive. A comprehensive raw material testing protocol will often employ IR for qualitative identity confirmation and UV-Vis for quantitative assays, leveraging the respective strengths of each technique to ensure both the identity and purity of the material.
In the field of analytical chemistry, particularly for raw material identification in pharmaceutical and industrial settings, spectroscopic techniques provide indispensable tools for non-destructive, rapid characterization of chemical substances. Among the most prevalent techniques are Ultraviolet-Visible (UV-Vis) and Infrared (IR) spectroscopy, each operating on different physical principles and offering complementary information about molecular structure and composition. UV-Vis spectroscopy measures the absorption of ultraviolet or visible light by a sample, resulting from the excitation of electrons to higher energy levels. This technique is primarily used for quantifying concentrations of analytes and detecting the presence of chromophores. In contrast, IR spectroscopy measures the absorption of infrared light, which corresponds to the vibrational energies of molecular bonds, providing a fingerprint for functional group identification and structural elucidation. The strategic selection between these techniques, or their combined application, depends heavily on the specific analytical question, sample characteristics, and required information depth.
The global marketplace reflects the critical importance of both techniques. The UV-Vis spectroscopy market is projected to grow from $1.57 billion in 2024 to $2.12 billion by 2029, demonstrating a compound annual growth rate (CAGR) of 6.7% [22]. Simultaneously, the IR spectroscopy market shows parallel expansion, estimated to reach USD 1.40 billion in 2025 and grow at a CAGR of 7.3% to USD 2.29 billion by 2032 [19]. This growth is largely fueled by stringent quality control regulations in the pharmaceutical industry and technological advancements in both techniques. This guide provides an objective, scenario-based comparison to enable researchers and drug development professionals to make informed decisions about technique selection for raw material identification.
Technical Principles and Data Interpretation
UV-Vis Spectroscopy Fundamentals
UV-Vis spectroscopy operates on the principle that molecules absorb specific wavelengths of light in the ultraviolet (100-400 nm) and visible (400-700 nm) regions of the electromagnetic spectrum. When a photon of light with energy matching the energy gap between a molecule's ground and excited electronic states is absorbed, it promotes an electron to a higher energy orbital. The resulting absorption spectrum provides information about electronic transitions within the molecule. The fundamental relationship governing quantitative analysis is the Beer-Lambert Law, which states that absorbance (A) is proportional to the concentration (c) of the absorbing species, the path length (L) of the sample, and the molar absorptivity (ε): A = ε × c × L [9].
The instrumentation typically consists of a light source (often deuterium for UV and tungsten/halogen for visible), a wavelength selector (monochromator or filters), a sample compartment, and a detector (such as photomultiplier tubes or photodiodes) [9]. Modern instruments often integrate advanced software for data analysis and method development. Key output parameters include absorbance maxima (wavelengths of maximum absorption, λ_max), which are characteristic of specific chromophores, and absorbance values used for quantitative determination. For raw material identification, the UV-Vis spectrum serves as a preliminary screening tool, confirming the presence of expected chromophores and providing quantitative analysis of specific components.
IR Spectroscopy Fundamentals
IR spectroscopy probes the vibrational energy levels of molecules, which correspond to the stretching and bending motions of chemical bonds. When infrared radiation (typically 4000-400 cm⁻¹) matches the natural vibrational frequency of a specific bond, absorption occurs, producing characteristic peaks in the IR spectrum. The resulting spectral fingerprint is highly specific to molecular structure, making IR spectroscopy exceptionally powerful for functional group identification and compound verification [19].
Fourier-Transform Infrared (FT-IR) spectrometers represent the most common modern implementation, employing an interferometer and mathematical Fourier transformation to generate spectra with high signal-to-noise ratios and rapid acquisition times. Key technological advancements include the development of portable handheld devices for field analysis, IR microscopy for microscopic samples, and QCL (Quantum Cascade Laser) based systems offering enhanced sensitivity and resolution [24]. The interpretation of IR spectra focuses on the correlation of absorption bands with specific functional groups: O-H stretching (3200-3600 cm⁻¹), C=O stretching (1650-1780 cm⁻¹), C-H stretching (2850-3000 cm⁻¹), and fingerprint region (1500-400 cm⁻¹) providing unique molecular signatures. For raw material identification, this technique offers definitive confirmation of molecular identity through direct comparison with reference spectra.
Table 1: Characteristic Spectral Regions for Common Functional Groups
| Functional Group | IR Absorption Range (cm⁻¹) | UV-Vis Absorption (nm) | Information Provided |
|---|---|---|---|
| Hydroxyl (O-H) | 3200-3600 (broad) | - | Hydrogen bonding, alcohols, water |
| Carbonyl (C=O) | 1650-1780 | - | Ketones, aldehydes, carboxylic acids |
| Aromatic C=C | 1500-1600 | 250-280 | Aromatic compounds, conjugation |
| Nitro (NO₂) | 1500-1600 & 1300-1400 | ~260 | Nitro compounds |
| Conjugated dienes | - | 220-250 | Degree of unsaturation |
| Chromophores | - | 200-800 | Extended conjugation, quantitative analysis |
Comparative Performance Analysis
Strengths and Limitations
Each spectroscopic technique exhibits distinct advantages and constraints that dictate its applicability to specific analytical scenarios in raw material identification.
UV-Vis Spectroscopy Strengths:
- High sensitivity for quantitative analysis, with detection limits often reaching nanomolar concentrations for strong chromophores [9]
- Excellent quantitative precision with linear dynamic ranges typically spanning 2-3 orders of magnitude when following Beer-Lambert Law [9]
- Simplified data interpretation focused on specific absorbance maxima rather than complex fingerprint regions
- Compatibility with aqueous solutions without significant interference, making it ideal for biological and pharmaceutical applications [22]
- Rapid analysis times and potential for real-time monitoring using in-line systems, with the in-line UV-Vis market projected to reach USD 2.5 Billion by 2033 [72]
UV-Vis Spectroscopy Limitations:
- Limited structural information primarily restricted to identifying chromophores rather than complete molecular characterization [9]
- Susceptibility to interference from turbidity, air bubbles, or impurities that scatter light [9]
- Inability to detect non-chromophoric compounds without derivatization, limiting application for many raw materials
- Solvent restrictions as many common solvents absorb in the UV region, requiring expensive alternatives like spectral-grade solvents
IR Spectroscopy Strengths:
- Comprehensive molecular fingerprinting capable of distinguishing between closely related compounds and polymorphs [19]
- Universal detection capability as virtually all organic compounds contain IR-active vibrational modes [73]
- Minimal sample preparation requirements with options for solid, liquid, and gas analysis using techniques like ATR (Attenuated Total Reflectance) [24]
- Non-destructive analysis preserving sample integrity for additional testing, particularly valuable for rare or expensive materials [73]
- Advanced spatial mapping capabilities with IR microscopy, enabling contamination identification and heterogeneity assessment [24]
IR Spectroscopy Limitations:
- Relatively poor sensitivity for trace analysis compared to UV-Vis, with detection limits typically in the percentage range for most compounds [19]
- Significant water interference complicating analysis of aqueous samples and hydrated materials
- Complex spectral interpretation requiring expert knowledge or comprehensive spectral libraries for accurate identification
- Sample morphology effects particularly for solid samples where particle size, crystallinity, and pressure can alter spectral features
Quantitative Comparison of Analytical Figures of Merit
Table 2: Direct Technique Comparison for Key Analytical Parameters
| Parameter | UV-Vis Spectroscopy | IR Spectroscopy | Combined Approach |
|---|---|---|---|
| Detection Limit | ppm to ppb for chromophores | 0.1-1% for most compounds | Enhanced through complementary detection |
| Structural Information | Limited to chromophores | Comprehensive functional group analysis | Maximum structural elucidation |
| Quantitative Precision | Excellent (RSD < 1%) | Good (RSD 1-5%) | Method-dependent |
| Sample Throughput | High (seconds per sample) | Moderate to high (minutes per sample) | Sequential analysis required |
| Water Compatibility | Excellent | Problematic | Complementary strengths |
| Polymorph Discrimination | Limited | Excellent | Definitive polymorph identification |
| Regulatory Acceptance | High for quantitative analysis | High for identity testing | Comprehensive regulatory compliance |
Scenario-Based Selection Guidelines
Decision Framework for Technique Selection
The following workflow provides a systematic approach to selecting the appropriate spectroscopic technique based on specific analytical requirements:
Application-Specific Scenarios
Pharmaceutical Raw Material Verification
In pharmaceutical manufacturing, raw material identification is a critical quality control step mandated by regulatory authorities. IR spectroscopy typically serves as the primary identity confirmation method due to its exceptional specificity. The distinct molecular fingerprints provided by IR spectra enable discrimination between polymorphic forms, which is crucial for API (Active Pharmaceutical Ingredient) characterization as different polymorphs can exhibit varying bioavailability and stability profiles [19]. Recent advancements in IR microscopy, such as the Bruker LUMOS II ILIM and Protein Mentor systems, allow for chemical imaging of heterogeneous samples, identifying and mapping contaminants or polymorphic impurities at the microscopic level [24].
UV-Vis spectroscopy complements this approach by quantifying specific chromophoric impurities or verifying the concentration of solutions. For instance, the quantification of a known impurity with a distinctive chromophore at trace levels would fall outside the detection capabilities of conventional IR spectroscopy but is well-suited to UV-Vis analysis. The integration of in-line UV-Vis systems in continuous manufacturing processes enables real-time monitoring of solution concentrations during pharmaceutical production, with the global in-line UV-Vis market expected to grow at 8.5% CAGR [72].
Food and Agricultural Material Authentication
The food and agriculture industries extensively employ both techniques for authenticity verification and quality assessment. UV-Vis spectroscopy provides rapid screening for specific quality markers, such as antioxidant content in edible oils or adulteration indicators [22]. IR spectroscopy, particularly in the near-infrared (NIR) region, excels in the non-destructive analysis of intact samples, enabling the assessment of compositional parameters like moisture, protein, and fat content without extensive sample preparation [74].
A research study applying UV-Vis and NIR spectroscopy to authenticate edible oils demonstrated that a variable selection algorithm (MPS-SIMCA) improved classification performance, with selected variables aligning with chemically meaningful spectral regions [75]. This approach highlights how complementary spectral data from different regions can enhance authentication models. For raw material identification in food applications, the combined use of UV-Vis for specific pigment or additive quantification and NIR for bulk composition analysis provides comprehensive material characterization.
Environmental Sample Screening
Environmental testing laboratories face the challenge of screening diverse sample types for contaminant identification and quantification. UV-Vis spectroscopy offers rapid, sensitive detection of pollutants with chromophoric properties, such as polyaromatic hydrocarbons, nitrates, and heavy metal complexes [73]. Portable UV-Vis systems enable field-based analysis, reducing sample degradation during transport.
IR spectroscopy complements this approach by providing definitive identification of unknown organic contaminants, particularly when coupled with advanced library search algorithms. The emergence of handheld IR devices has revolutionized field analysis, allowing first responders to quickly identify hazardous materials on-site [24]. For comprehensive environmental characterization, the sequential application of both techniques maximizes the advantages of each: rapid screening and quantification with UV-Vis, followed by confirmatory identification with IR spectroscopy.
Experimental Protocols and Methodologies
Standard Operating Procedure for Raw Material Identification
Protocol 1: IR Spectroscopy for Primary Identity Confirmation
Sample Preparation: For solid samples, use the ATR (Attenuated Total Reflectance) accessory with minimal sample preparation. Apply gentle pressure to ensure good contact between the sample and ATR crystal. For powdered materials, ensure uniform distribution on the crystal surface.
Instrument Calibration: Perform daily wavelength verification using a polystyrene standard. Confirm the instrument meets manufacturer specifications for peak positions (e.g., 1601.8 cm⁻¹ and 3060.0 cm⁻¹).
Data Acquisition: Collect background spectrum with a clean ATR crystal. Place sample on crystal and acquire spectrum with the following parameters:
- Spectral range: 4000-400 cm⁻¹
- Resolution: 4 cm⁻¹
- Scans: 32-64 for optimal signal-to-noise ratio
- Apodization: Happ-Genzel
Spectral Processing: Apply atmospheric suppression (for CO₂ and water vapor), baseline correction, and normalization as needed.
Library Matching: Compare acquired spectrum against validated reference libraries using correlation algorithms or Euclidean distance measurements. A match score exceeding the established threshold (typically >0.85-0.95 depending on algorithm) confirms identity.
Protocol 2: UV-Vis Spectroscopy for Quantitative Analysis
Sample Preparation: Prepare sample solution in appropriate solvent at concentration expected to yield absorbance between 0.1-1.0 AU. For raw materials with unknown absorptivity, perform preliminary scan to determine appropriate dilution.
Instrument Calibration: Verify wavelength accuracy using holmium oxide or didymium filters. Confirm photometric accuracy with potassium dichromate standards.
Method Development:
- Determine λ_max from initial scan
- Establish linearity range (typically 0.05-2.0 AU) using standard solutions
- Verify adherence to Beer-Lambert Law (R² > 0.995)
- Determine molar absorptivity (ε) for quantitative applications
Data Acquisition:
- Use matched quartz cuvettes with 1 cm path length
- Set spectral bandwidth appropriately for analysis (typically 1-2 nm)
- Acquire spectrum from 200-800 nm or targeted range
- Measure blank solvent concurrently
Quantitative Analysis: Apply Beer-Lambert Law for concentration determination using established calibration curve or known molar absorptivity.
Case Study: Acetylsalicylic Acid Characterization
A recent study demonstrates the complementary nature of these techniques through the synthesis and characterization of acetylsalicylic acid (ASA) [76]. Researchers compared experimental spectra with computational predictions, achieving exceptional correlation (R² values of 0.9933 and 0.9995), validating both the analytical methods and computational approaches.
Experimental Results:
- UV-Vis Analysis: Confirmed the presence of the aromatic chromophore with characteristic absorption maxima. Computational simulation accurately predicted solvent effects, including redshift in aqueous media.
- IR Spectroscopy: Provided definitive identification through characteristic functional group absorptions: carbonyl stretching (1750 cm⁻¹), ester C-O stretching (1200 cm⁻¹), and aromatic C=C bending (1600 cm⁻¹).
- Combined Approach: The integrated methodology resolved ambiguous peak assignments caused by spectral overlap or impurities, demonstrating how the techniques complement each other for comprehensive molecular characterization.
This case study illustrates the power of combining experimental and computational approaches, with direct relevance to raw material identification where both qualitative confirmation and quantitative assessment are required.
Essential Research Reagent Solutions
Table 3: Key Materials and Reagents for Spectroscopic Analysis
| Item | Function | Technique | Selection Considerations |
|---|---|---|---|
| ATR Crystals (diamond, ZnSe, Ge) | Enables direct solid and liquid analysis without extensive preparation | IR Spectroscopy | Diamond: durability, chemical resistance; ZnSe: general purpose; Ge: high refractive index for hard materials |
| Quartz Cuvettes | Sample containment for liquid analysis | UV-Vis Spectroscopy | High-purity quartz for UV range; matched pairs for quantitative work; various path lengths (0.1-10 cm) |
| Spectroscopic Solvents | Sample dissolution and reference background | Both | HPLC-grade solvents with low UV cutoff; deuterated solvents for IR; minimal water contamination |
| Calibration Standards | Instrument performance verification | Both | Polystyrene films (IR); holmium oxide filters (UV-Vis); NIST-traceable reference materials |
| Spectral Libraries | Reference databases for compound identification | IR Spectroscopy | Industry-specific libraries (pharmaceutical, polymer, forensic); custom library development capability |
| Software Packages | Data acquisition, processing, and analysis | Both | Instrument-specific control; multivariate analysis; chemometric tools; regulatory compliance features (21 CFR Part 11) |
The strategic selection between UV-Vis and IR spectroscopy for raw material identification hinges on a clear understanding of their complementary strengths and limitations. UV-Vis spectroscopy excels in quantitative analysis of chromophoric compounds, offering exceptional sensitivity, rapid throughput, and simplified data interpretation. Conversely, IR spectroscopy provides comprehensive molecular fingerprinting, universal detection capability, and definitive identity confirmation through functional group analysis. For most challenging analytical scenarios, particularly in regulated industries like pharmaceuticals, a combined approach leveraging both techniques delivers the most robust material characterization, fulfilling both qualitative identification and quantitative assessment requirements. As technological advancements continue to enhance instrument sensitivity, portability, and data analysis capabilities, the strategic implementation of these complementary spectroscopic tools will remain fundamental to quality assurance in research and industrial settings.
Within the broader context of analytical techniques for raw material identification, such as UV-Vis and IR spectroscopy, thermal analysis methods provide a distinct and complementary approach. Among these, Thermogravimetric Analysis (TGA) and Pyrolysis-Gas Chromatography-Mass Spectrometry (Py-GC-MS) are pivotal for characterizing thermal behavior and chemical composition. While UV-Vis and IR spectroscopy probe molecular energy transitions and vibrational modes, TGA and Py-GC-MS provide insights into thermal stability and decomposition pathways. This guide offers an objective comparison of Py-GC-MS and TGA to help researchers select the appropriate technique based on their specific analytical needs.
Technical Principles and Analytical Capabilities
Pyrolysis-Gas Chromatography-Mass Spectrometry (Py-GC-MS) is a hyphenated technique that thermally decomposes a sample in an inert atmosphere and separates and identifies the resulting volatile products. The pyrolysis probe serves as the thermal degradation unit, directly coupled to a GC-MS system that separates the complex mixture of pyrolysates and provides identification via mass spectral libraries [77] [78]. This technique is particularly valuable for analyzing insoluble and infusible materials that are not amenable to direct GC-MS analysis, including cross-linked polymers and complex biological or environmental matrices [79]. The resulting chromatogram and mass spectra provide a "fingerprint" specific to the original polymer, enabling both qualitative identification and, with proper calibration, quantitative analysis [78] [80].
Thermogravimetric Analysis (TGA) measures a sample's mass change as a function of temperature or time under a controlled atmosphere. The fundamental measurement is weight loss due to the evolution of volatile components, which provides information on thermal stability, composition, and decomposition kinetics [81]. Modern TGA systems are often coupled with FTIR or MS detectors for evolved gas analysis (EGA), which adds qualitative information about the gases evolved during thermal decomposition [81]. However, standalone TGA provides primarily quantitative weight loss data without direct chemical identification capabilities.
Table 1: Fundamental Characteristics of Py-GC-MS and TGA
| Feature | Py-GC-MS | TGA |
|---|---|---|
| Primary Analytical Focus | Chemical identification of decomposition products | Mass change measurement during thermal treatment |
| Sample Form | Any physical state (solid, liquid) | Primarily solids |
| Sample Preparation | Minimal often required | May require specific geometry |
| Destructive/Nondestructive | Destructive | Destructive |
| Information Output | Qualitative and quantitative chemical composition | Quantitative mass loss; thermal stability |
| Key Applications | Polymer identification, complex mixture analysis, microplastics detection | Thermal stability, composition analysis, kinetic studies |
Performance Comparison: Experimental Data
Direct comparative studies reveal significant differences in the performance characteristics of Py-GC-MS and TGA, particularly regarding sensitivity and the type of information generated.
Sensitivity and Sample Requirements
A comparative study investigating the sensitivity of Py-EGA-MS (a variant of Py-GC-MS) versus DTG (the derivative of TGA) demonstrated a remarkable 420-fold superior signal-to-noise ratio for Py-EGA-MS when analyzing the same 0.20 mg polystyrene sample [81]. This dramatic difference in sensitivity enables Py-GC-MS to work effectively with substantially smaller sample masses, which provides the additional advantage of minimizing temperature gradients within the sample during pyrolysis.
The same study also documented that increasing sample mass caused shifts in pyrolysis peak temperatures to higher regions in both techniques, though this effect was more pronounced in the pyrolyzer system [81]. This finding highlights the importance of consistent sample handling when comparing results across studies or techniques.
Comparative Analysis of Real-World Samples
A method comparison study consecutively applied hyperspectral FTIR imaging and Py-GC-MS to the exact same environmental samples to assess microplastic contamination [82]. While both techniques showed similar overall contamination trends, differences emerged in the specific polymer compositions identified, underscoring their complementary nature and the impact of underlying detection principles.
Py-GC-MS provided direct mass-based quantification of polymers, whereas FTIR generated particle count data that required mathematical conversion to estimate mass concentrations [82]. This fundamental difference in output – mass concentration versus particle count – significantly influences data interpretation and comparability across techniques.
Table 2: Quantitative Performance Comparison Based on Experimental Data
| Performance Metric | Py-GC-MS | TGA | Experimental Context |
|---|---|---|---|
| Signal-to-Noise Ratio | 420x superior to DTG | Baseline (1x) | Polystyrene analysis (0.20 mg) [81] |
| Sample Mass Range | Sub-mg sufficient [81] | Typically 5-10 mg [81] | Polymer characterization |
| Polymer Quantification | Direct mass measurement [82] | Requires calculation from mass loss [82] | Environmental microplastics analysis |
| Identification Specificity | High (specific pyrolysis products) [78] | Limited without EGA [81] | Polymer blends and mixtures |
| Limit of Quantification | Lower, matrix-dependent [78] | Higher, dependent on balance sensitivity | Microplastics in complex matrices |
Experimental Protocols and Methodologies
Standard Py-GC-MS Methodology for Polymer Analysis
Sample Preparation: For synthetic polymers, samples are typically used as received without extensive preparation. For quantitative analysis, masses ranging from 0.1-0.5 mg are optimal. When analyzing complex matrices such as environmental samples, extensive pretreatment is often necessary, including enzymatic digestion for biological tissues, density separation for sediments, and filtration for aqueous samples [80] [82].
Pyrolysis Conditions: Pyrolysis is typically performed in an inert atmosphere (helium or nitrogen) at temperatures between 500-800°C, depending on the polymer stability. For microplastics analysis, a thermal desorption step at 300°C is often incorporated prior to pyrolysis to remove volatile interferents [80] [83]. The pyrolysis time is generally brief, ranging from seconds to minutes.
GC-MS Parameters: Separation employs non-polar or mid-polar capillary GC columns (e.g., DB-5) with temperature programming from 50°C to 280-300°C. Mass spectrometry detection uses electron ionization at 70 eV, with scanning across a mass range of 30-550 m/z [84]. Identification is achieved by comparing mass spectra against reference libraries such as NIST.
Quantification Approach: Quantification requires establishing calibration curves using polymer-specific characteristic pyrolysis products. For example, styrene is monitored for polystyrene, while 4-vinylcyclohexene serves as a marker for styrene-butadiene rubber in tire wear particles [78] [83]. The most abundant and characteristic pyrolysis product is typically selected for quantification, while secondary products provide qualitative confirmation [80].
Standard TGA Methodology for Polymer Characterization
Sample Preparation: Samples of 5-10 mg are precisely weighed into alumina or platinum crucibles. The sample should be representative and evenly distributed to ensure consistent thermal contact.
Temperature Program: Analysis typically employs a linear temperature ramp from ambient to 600-800°C at rates of 10-20°C/min under nitrogen or air atmosphere. Multiple heating rates may be used for kinetic studies.
Data Analysis: The primary TGA curve (mass vs. temperature) and its derivative (DTG) identify decomposition steps. Weight loss percentages are calculated for each step, with degradation onset temperatures determined by tangent method. For kinetic analysis, model-free methods such as Kissinger and Ozawa-Doyle are preferred for calculating activation energies without assuming a specific reaction model [85].
Application Workflows and Decision Pathways
The selection between Py-GC-MS and TGA depends on analytical objectives, sample characteristics, and required information output. The following workflow diagram illustrates the decision process for technique selection:
Essential Research Reagents and Materials
Successful implementation of Py-GC-MS and TGA methodologies requires specific reagents, reference materials, and instrumentation components.
Table 3: Essential Research Materials for Py-GC-MS and TGA Analysis
| Category | Specific Items | Function/Purpose |
|---|---|---|
| Reference Materials | Certified polymer standards (PE, PP, PS, PA, PC) | Method calibration and quantification [78] |
| Calibration Solutions | Deuterated internal standards (e.g., d8-styrene, d8-naphthalene) | Internal standardization for quantitative Py-GC-MS [83] |
| Sample Preparation | Enzymatic cocktails (proteases, lipases), Density separation media (ZnCl₂), Filtration membranes (aluminum oxide, glass fiber) | Matrix digestion and MP extraction from environmental samples [80] [82] |
| Py-GC-MS Consumables | Pyrolysis cups, GC columns (DB-5 type), High-purity helium carrier gas | Sample introduction, chromatographic separation [84] [83] |
| TGA Accessories | Platinum and alumina crucibles, High-purity gases (N₂, air) | Sample containment, atmosphere control [81] |
Py-GC-MS and TGA offer complementary approaches for thermal material characterization, with distinct advantages and limitations. Py-GC-MS provides superior chemical identification capabilities and sensitivity, making it ideal for complex mixture analysis and unknown identification. TGA excels in quantifying thermal stability and decomposition kinetics with straightforward quantification of mass changes. The choice between techniques should be guided by analytical objectives: Py-GC-MS when chemical identification of decomposition products is paramount, TGA when focusing on thermal stability and decomposition profiles. For comprehensive material characterization, these techniques may be employed synergistically to provide a complete picture of both thermal behavior and chemical composition.
The fundamental choice between ultraviolet-visible (UV-Vis) and infrared (IR) spectroscopy for raw material identification has long been guided by their core principles: UV-Vis probes electronic transitions, offering excellent quantitative capabilities for chromophores, while IR spectroscopy investigates molecular vibrations, providing a detailed fingerprint for qualitative functional group analysis [26] [86]. Technological advancements are not replacing these principles but are instead amplifying their inherent strengths and mitigating their weaknesses. This evolution is reshaping analytical protocols in pharmaceutical development and manufacturing, pushing the boundaries of what these classical techniques can achieve. The integration of portability, artificial intelligence (AI), and hyphenated systems is creating a new generation of tools that offer faster, more detailed, and more accessible molecular insights.
The following diagram illustrates the core principles that underpin the discussed technological advancements.
Advancements in Portable Spectroscopy
The miniaturization of spectrometers is moving the laboratory directly to the sample, enabling real-time, on-site analysis critical for raw material verification and quality control.
Performance Comparison: Portable UV-Vis and IR/NIR Spectrometers
Portable instruments must be evaluated against their traditional benchtop counterparts and each other to guide appropriate selection. The table below summarizes key performance metrics.
Table 1: Comparison of Portable Spectrometer Technologies for Raw Material Identification
| Feature | Portable UV-Vis | Portable IR (FTIR) / Near-Infrared (NIR) |
|---|---|---|
| Typical Weight/Size | Handheld, battery-operated single-beam instruments are available [29]. | Wide range: from micro-devices (<60g, e.g., MicroNIR) to larger portable units (~1-2 kg, e.g., Phazir) [87]. |
| Primary Mechanism | Electronic transitions in chromophores (e.g., conjugated systems) [26]. | Molecular vibrations (IR) and overtone/combination bands (NIR) [26] [86]. |
| Sample Preparation | Minimal; typically requires dilution for liquid samples [26]. | Minimal, especially with ATR-FTIR and NIR diffuse reflectance; often no preparation needed [11] [87]. |
| Key Strength in Portability | Rapid concentration checks and colorimetric assay development in the field. | Direct, non-destructive identification of solids and liquids; versatile sampling [88] [11]. |
| Quantitative Performance | Excellent sensitivity and linearity for quantitative analysis [26]. | Good for major constituents (e.g., fat, protein, moisture); requires robust calibration [87]. |
| Qualitative Performance | Limited to molecules with UV-Vis chromophores; less specific. | Excellent for identification via fingerprinting; high specificity for functional groups [26] [11]. |
| Example Application | Verification of drug concentration in solution, analysis of dyes. | Raw material identity testing, polymorph detection, analysis of dairy components (fat, protein) [11] [87]. |
Experimental Protocol: On-Site Raw Material Identity Verification using Handheld NIR/FTIR
Objective: To verify the identity of an incoming raw material (e.g., an active pharmaceutical ingredient or excipient) against a certified reference standard at the point of receipt.
Methodology:
- Instrument Calibration: The handheld NIR or ATR-FTIR spectrometer is calibrated according to manufacturer specifications. A background spectrum is collected.
- Reference Library Creation: Spectra of authenticated reference standard materials are collected under controlled conditions to build a validated spectral library. For robust results, libraries should include spectra from multiple batches [11].
- Sample Analysis: A representative sample of the incoming material is placed in a suitable container (for NIR diffuse reflectance) or directly on the ATR crystal (for FTIR). No preparation is typically required. Multiple spectra are acquired from different sample spots to ensure homogeneity.
- Spectral Comparison & Data Analysis: The sample's spectrum is compared to the reference library using software algorithms (e.g., correlation, spectral angle mapping, or principal component analysis). A match score (e.g., >90-95%) is used for acceptance [11].
- Polymorph Screening (with FTIR): The fingerprint region (below 1500 cm⁻¹) is closely examined for any peak shifts or shape changes that might indicate an incorrect crystalline form (polymorph), which is critical for drug performance [11].
Advancements in AI-Powered Data Analysis
Artificial intelligence and machine learning (ML) are revolutionizing the interpretation of complex spectral data, moving beyond traditional analysis to uncover hidden patterns and predict material properties.
AI Techniques and Applications in Spectroscopy
Table 2: AI/ML Applications in UV-Vis and IR Spectroscopy
| AI/ML Technique | Function | Application in UV-Vis | Application in IR/Raman |
|---|---|---|---|
| Principal Component Analysis (PCA) | Unsupervised dimensionality reduction; identifies major patterns in data. | Differentiating samples based on overall spectral profiles. | Classifying samples, identifying outliers, and reducing data complexity before modeling [89]. |
| Autoencoders | Neural networks for non-linear dimensionality reduction and noise removal. | Processing complex absorption spectra from multi-analyte solutions. | Creating compressed "latent spaces" for efficient pattern recognition and anomaly detection in spectral datasets [89]. |
| Graph Neural Networks (GNNs) & Machine-Learned Potentials | Predicts properties based on molecular structure and atomic interactions. | Predicting spectral properties of novel compounds. | Accurately predicting vibrational spectra and phonon dynamics without exhaustive quantum simulations [89]. |
| SHAP/LIME | Model-agnostic methods for explaining AI predictions (XAI). | Interpreting which wavelengths contributed most to a concentration prediction. | Identifying the specific spectral bands (vibrations) that drive a classification model, adding interpretability [90]. |
Experimental Protocol: Developing an AI Model for Detecting Adulterants with NIR
Objective: To develop a machine learning model that can detect and quantify melamine adulteration in protein-rich sports nutrition supplements using portable NIR spectroscopy [11].
Methodology:
- Dataset Creation: A large set of calibration samples is created by adulterating pure protein powder with melamine at known concentrations (e.g., 0.1% - 5% w/w). NIR spectra are collected for all samples using a portable spectrometer.
- Data Preprocessing: Spectra are preprocessed to remove scattering effects and noise. Techniques include Standard Normal Variate (SNV), multiplicative scatter correction (MSC), and Savitzky-Golay derivatives.
- Model Training: The dataset is split into training and test sets. A regression model (e.g., Partial Least Squares regression or Support Vector Regression) is trained on the training set to learn the relationship between the spectral features and the melamine concentration [90] [11].
- Model Validation & Explainability: The model's performance is validated using the independent test set. Metrics like Root Mean Square Error of Prediction (RMSEP) and R² are reported. An XAI method like SHAP is then applied to a prediction to identify which NIR wavelengths were most important, providing a chemical rationale (e.g., linking them to melamine's vibrational modes) and building user trust [90].
- Deployment: The final validated model is deployed on the portable spectrometer, allowing for non-destructive, on-site screening of supplements in minutes.
The workflow for this AI-powered analysis is shown below.
Advancements in Hyphenated Systems
Hyphenation combines the superior separation power of chromatography with the identification capabilities of spectroscopy, providing unparalleled ability to resolve and characterize individual components in complex mixtures.
Table 3: Common Hyphenated Techniques and Their Characteristics
| Hyphenated Technique | Separation Method | Detection Method | Key Advantage | Challenge |
|---|---|---|---|---|
| LC-MS (Liquid Chromatography-Mass Spectrometry) | High-Performance Liquid Chromatography (HPLC) | Mass Spectrometry (MS) | Provides molecular weight and fragment pattern for definitive identification; high sensitivity [91]. | "Soft" ionization may yield little fragmentation; requires tandem MS (MS-MS) for structural details [91]. |
| LC-FTIR (Liquid Chromatography-FTIR) | HPLC | Fourier-Transform Infrared Spectroscopy | Provides detailed functional group and structural information for unambiguous identification [91]. | Strong IR absorption by common mobile phases (e.g., water) requires solvent elimination interfaces, complicating the setup [91]. |
| LC-PDA (Photodiode Array) | HPLC | UV-Vis Spectroscopy (DAD/PDA) | Collects full UV-Vis spectrum for each eluting peak, aiding in peak purity assessment and provisional identification of chromophores [91]. | Limited to UV-absorbing compounds; provides less structural information than IR or MS. |
| Raman-LIBS | Not a chromatographic technique; a combined spectroscopic probe. | Raman Spectroscopy & Laser-Induced Breakdown Spectroscopy | Complementary molecular (Raman) and elemental (LIBS) data from the same microspot; extremely useful for microplastic characterization and planetary exploration [92]. | Complex instrumentation and data fusion required. |
Experimental Protocol: Analyzing a Natural Product Extract using LC-UV-MS
Objective: To separate, detect, and tentatively identify the major constituents in a complex natural product extract for drug discovery (dereplication) [91].
Methodology:
- Separation (LC): The crude extract is dissolved in a suitable solvent and injected into an HPLC system. A gradient elution method is developed to optimally separate the various chemical constituents over a runtime of 20-60 minutes.
- On-line UV-Vis Detection (PDA): A photodiode array detector placed in-line after the HPLC column collects the full UV-Vis spectrum (e.g., 200-600 nm) for each eluting peak. This helps assess peak purity (by comparing spectra across the peak) and gives clues about the compound's class (e.g., presence of flavonoids, alkaloids based on λ_max) [91].
- On-line Mass Spectrometric Detection (MS): The effluent from the HPLC is directly introduced into a mass spectrometer via an interface like electrospray ionization (ESI). The MS operates in a scanning mode to determine the molecular weight of each eluting compound by identifying its molecular ion ([M+H]⁺ or [M-H]⁻) [91].
- Data Correlation and Dereplication: The software correlates the retention time, UV spectrum, and mass spectrum for each peak. This combined dataset is searched against natural product databases. The molecular weight from MS and the UV fingerprint together allow for rapid tentative identification of known compounds, avoiding the re-isolation of previously discovered molecules [91].
The logical relationship and workflow of a hyphenated system is summarized in the following diagram.
The Scientist's Toolkit: Essential Research Reagent Solutions
Table 4: Key Materials and Reagents for Advanced Spectroscopic Analysis
| Item | Function/Description | Application Context |
|---|---|---|
| Certified Reference Materials (CRMs) | Authenticated, high-purity substances with certified properties. Used for instrument calibration and building validated spectral libraries [11]. | Essential for developing reliable AI/ML models and for verifying raw material identity via portable/hyphenated methods. |
| ATR Crystals (e.g., Diamond, ZnSe) | The internal reflection element in ATR-FTIR. Allows for direct analysis of solids and liquids with minimal sample preparation [11]. | Critical for portable FTIR spectrometers used in raw material verification; diamond is durable for harsh environments. |
| HPLC-Grade Solvents | Ultra-pure solvents with low UV absorbance and minimal impurities. | Necessary for mobile phases in LC-UV and LC-MS to prevent baseline noise and column/ion source contamination. |
| Derivatization Reagents (e.g., TMS) | Compounds that chemically modify analytes to make them more volatile or detectable. | Used in GC-MS analysis of polar compounds (e.g., sugars, amino acids) that are not amenable to direct analysis [91]. |
| Stable Isotope-Labeled Standards | Internal standards where atoms are replaced with stable isotopes (e.g., ¹³C, ²H). | Used in quantitative MS to correct for matrix effects and ionization variability, ensuring accurate quantification in hyphenated systems. |
The technological frontiers of portability, AI, and hyphenation are synergistically addressing the traditional limitations of UV-Vis and IR spectroscopy. Portable devices bring the instrument to the sample, enabling immediate decisions. AI-powered analysis extracts deeper, often predictive, insights from the resulting complex data. Hyphenated systems provide the ultimate tool for deconvoluting intricate mixtures. For the researcher focused on raw material identification, this means that IR spectroscopy's superior qualitative fingerprinting can now be performed at the loading dock with a handheld device, with data processed in real-time by an AI model that also flags potential adulterants. Meanwhile, UV-Vis remains a powerful quantitative tool, whose utility in hyphenated systems like LC-PDA is enhanced by AI for peak purity analysis. The choice between UV-Vis and IR is no longer just about their inherent principles, but about how these modern advancements can be leveraged to create faster, smarter, and more robust analytical workflows in pharmaceutical research and development.
Conclusion
UV-Vis and IR spectroscopy are not competing but complementary techniques that form a cornerstone of modern pharmaceutical raw material identification. UV-Vis excels as a highly sensitive tool for quantitative concentration analysis, while IR spectroscopy is unparalleled for qualitative molecular fingerprinting and functional group verification. The choice between them hinges on the specific analytical question—whether it is quantifying an analyte or identifying an unknown structure. Future directions point toward the increased integration of artificial intelligence for data analysis, the proliferation of portable and handheld devices for on-site testing, and the development of hyphenated systems that combine multiple techniques for unparalleled analytical power. For drug development professionals, mastering both techniques and understanding their synergistic application is crucial for accelerating development cycles, ensuring stringent quality control, and maintaining regulatory compliance.
References
- 1. UV/VIS Spectroscopy - an overview [https://www.sciencedirect.com/topics/chemistry/uv-vis-spectroscopy]
- 2. Infra red Absorption Spectroscopy - Theoretical Principles [https://teaching.shu.ac.uk/hwb/chemistry/tutorials/molspec/irspec1.htm]
- 3. UV vs IR Spectroscopy: Key Differences in Pharma [https://www.linkedin.com/posts/dhruv-jayswal-b40243264_uv-ir-chemistry-activity-7371131011364990977-Fbd3]
- 4. Spectroscopic Methods in Pharma QA/QC: UV-Vis, IR, and ... [https://www.labmanager.com/spectroscopic-methods-in-pharma-qa-qc-uv-vis-ir-and-nmr-applications-34005]
- 5. Comparative dataset of experimental and computational ... [https://www.nature.com/articles/s41597-019-0306-0]
- 6. UV/Visible Diffusion-Ordered Spectroscopy: A Simultaneous ... [https://pmc.ncbi.nlm.nih.gov/articles/PMC11428122/]
- 7. Analyzing experimental UV–vis spectra of conjugated ... [https://pubs.rsc.org/en/content/articlehtml/2025/nj/d4nj05537c]
- 8. UV-Visible Spectroscopy [https://www2.chemistry.msu.edu/faculty/reusch/virttxtjml/spectrpy/uv-vis/spectrum.htm]
- 9. UV-Vis Spectroscopy: Principle, Strengths and Limitations ... [https://www.technologynetworks.com/analysis/articles/uv-vis-spectroscopy-principle-strengths-and-limitations-and-applications-349865]
- 10. 4.5: Ultraviolet and visible spectroscopy [https://chem.libretexts.org/Bookshelves/Organic_Chemistry/Book%3A_Organic_Chemistry_with_a_Biological_Emphasis_v2.0_(Soderberg)/04%3A_Structure_Determination_I-_UV-Vis_and_Infrared_Spectroscopy_Mass_Spectrometry/4.05%3A_Ultraviolet_and_visible_spectroscopy]
- 11. How IR Spectroscopy Ensures Raw Material Quality [https://allanchem.com/how-ir-spectroscopy-ensures-raw-material-quality/]
- 12. Feasibility of UV–Vis spectroscopy combined with pattern ... [https://jast-journal.springeropen.com/articles/10.1186/s40543-024-00428-2]
- 13. Ultraviolet/Visible/Near Infrared Spectroscopy (UV/VIS/NIR) [https://www.eag.com/techniques/spectroscopy/uv-vis-spectroscopy/]
- 14. UV-adVISor: Attention-Based Recurrent Neural Networks to ... [https://pmc.ncbi.nlm.nih.gov/articles/PMC9137254/]
- 15. Infrared Spectroscopy [https://chem.libretexts.org/Bookshelves/Physical_and_Theoretical_Chemistry_Textbook_Maps/Supplemental_Modules_(Physical_and_Theoretical_Chemistry)/Spectroscopy/Vibrational_Spectroscopy/Infrared_Spectroscopy]
- 16. About Infrared Spectroscopy | FT-IR Molecular Analysis ... [https://www.diamond.ac.uk/default/industry/Techniques-Available/Spectroscopy/Infrared--IR--Spectroscopy/About-IR--Spectroscopy.html]
- 17. Infrared (IR) Spectroscopy: A Quick Primer On Interpreting ... [https://www.masterorganicchemistry.com/2016/11/23/quick_analysis_of_ir_spectra/]
- 18. A Review of the Latest Spectroscopic Research in Food ... [https://www.spectroscopyonline.com/view/latest-spectroscopic-research-in-food-and-beverage-analysis]
- 19. Global IR Spectroscopy Market Size & Analysis, 2025-2032 [https://www.coherentmarketinsights.com/industry-reports/global-ir-spectroscopy-market]
- 20. Artificial Intelligence in Analytical Spectroscopy, Part II [https://www.spectroscopyonline.com/view/artificial-intelligence-in-analytical-spectroscopy-part-ii-examples-in-spectroscopy]
- 21. New UV–Visible Spectroscopy Method Harnesses ... [https://www.spectroscopyonline.com/view/new-uv-visible-spectroscopy-method-harnesses-machine-learning-to-detect-contamination-in-microalgae-cultures]
- 22. Ultraviolet-Visible Spectroscopy Global Market Report 2025 [https://www.thebusinessresearchcompany.com/report/ultravioletvisible-spectroscopy-global-market-report]
- 23. AI-Powered 'IR-Bot' Brings Real-Time Spectrochemical ... [https://www.spectroscopyonline.com/view/ai-powered-ir-bot-brings-real-time-spectrochemical-analysis-to-autonomous-labs]
- 24. 2025 Review of Spectroscopic Instrumentation [https://www.spectroscopyonline.com/view/2025-review-of-spectroscopic-instrumentation]
- 25. A review on spectral data preprocessing techniques for ... [https://www.sciencedirect.com/science/article/pii/S258900422501020X]
- 26. 6 Differences between UV-Vis Spectroscopy and IR ... [https://thesiliconreview.com/2024/04/6-differences-between-uv-vis-spectroscopy-and-ir-spectroscopy]
- 27. 4.2: IR Spectroscopy [https://chem.libretexts.org/Bookshelves/Analytical_Chemistry/Physical_Methods_in_Chemistry_and_Nano_Science_(Barron)/04%3A_Chemical_Speciation/4.02%3A_IR_Spectroscopy]
- 28. UV-Visible Spectrophotometry vs. Infrared ... [https://www.mrclab.com/uv-visible-spectrophotometry-vs-infrared-spectrophotometry]
- 29. 10.3: UV/Vis and IR Spectroscopy [https://chem.libretexts.org/Bookshelves/Analytical_Chemistry/Analytical_Chemistry_2.1_(Harvey)/10%3A_Spectroscopic_Methods/10.03%3A_UV_Vis_and_IR_Spectroscopy]
- 30. Comparison of UV, visible and near-infrared, and mid- ... [https://www.sciencedirect.com/science/article/abs/pii/S0168169923003897]
- 31. Leveraging infrared spectroscopy for automated structure ... [https://www.nature.com/articles/s42004-024-01341-w]
- 32. How UV-Vis is Evolving in 2025 for Better Lab Efficiency [https://www.richmondscientific.com/how-uv-vis-is-evolving-in-2025-for-better-lab-efficiency?srsltid=AfmBOooeSuRtusWhWXeKyuUsEblsPRLHnnuDSG_xHoQi-dTZ5SrUtbNB]
- 33. Setting new benchmarks in AI-driven infrared structure ... [https://pubs.rsc.org/en/content/articlehtml/2025/dd/d5dd00131e]
- 34. Theoretical and experimental investigation of UV–Vis ... [https://link.springer.com/article/10.1140/epjd/s10053-025-01074-y]
- 35. Beer-Lambert Law | Transmittance & Absorbance [https://www.edinst.com/resource/the-beer-lambert-law/]
- 36. An empirical investigation of deviations from the Beer ... [https://www.nature.com/articles/s41598-021-92850-4]
- 37. Misuse of Beer–Lambert Law and other calibration curves [https://pmc.ncbi.nlm.nih.gov/articles/PMC8808104/]
- 38. The Role of Spectroscopy in Modern Pharmaceutical Industry [https://www.simsonpharma.com/us/blog-details/the-role-of-spectroscopy-in-modern-pharmaceutical-industry]
- 39. UV & Visible Spectroscopy Insightful Analysis [https://www.archivemarketresearch.com/reports/uv-visible-spectroscopy-504455]
- 40. UV Spectroscopy Market Size & Share Analysis [https://www.mordorintelligence.com/industry-reports/uv-spectroscopy-market]
- 41. Interpreting Infrared Spectra [https://specac.com/theory-articles/interpreting-infra-red-spectroscopy/]
- 42. A Process for Successful Infrared Spectral Interpretation [https://www.spectroscopyonline.com/view/process-successful-infrared-spectral-interpretation]
- 43. 12.7: Interpreting Infrared Spectra [https://chem.libretexts.org/Bookshelves/Organic_Chemistry/Organic_Chemistry_(Morsch_et_al.)/12%3A_Structure_Determination_-_Mass_Spectrometry_and_Infrared_Spectroscopy/12.07%3A_Interpreting_Infrared_Spectra]
- 44. IR Spectroscopy in Qualitative and Quantitative Analysis [https://www.intechopen.com/chapters/83478]
- 45. Spectroscopy FTIR and UV-Vis [https://www.honeymanlaboratories.com/chemistry-testing/spectroscopy/]
- 46. The Future of FT-IR Imaging [https://www.spectroscopyonline.com/view/the-future-of-ft-ir-imaging]
- 47. Development and Validation of an in-line API ... [https://pmc.ncbi.nlm.nih.gov/articles/PMC7076712/]
- 48. Penetration depth and effective sample size ... [https://www.sciencedirect.com/science/article/pii/S0022354925003417]
- 49. Automatic materials characterization from infrared spectra ... [https://www.sciencedirect.com/org/science/article/pii/S2041652023061370]
- 50. Infrared spectrum analysis of organic molecules with neural ... [https://jcheminf.biomedcentral.com/articles/10.1186/s13321-025-00960-2]
- 51. Pharma-Compliant Analysis with Flexible UV-Vis [https://www.spectroscopyonline.com/view/pharma-compliant-analysis-with-flexible-uv-vis]
- 52. Difference Between UV, IR, and NMR Spectroscopy [https://www.creative-biostructure.com/difference-between-uv-ir-and-nmr-spectroscopy.htm?srsltid=AfmBOoo16PB-Rdgl5ZshuAHNb2xjZAz0yQgZRZZmpqVfEbQyOYVZXHb9]
- 53. UV-Visible Spectrophotometry and Infrared ... [https://www.drawellanalytical.com/uv-visible-spectrophotometry-and-infrared-spectrophotometry-what-are-the-key-distinctions-between-them/]
- 54. Infrared Spectroscopy [https://chem.libretexts.org/Bookshelves/Physical_and_Theoretical_Chemistry_Textbook_Maps/Supplemental_Modules_(Physical_and_Theoretical_Chemistry)/Spectroscopy/Vibrational_Spectroscopy/Infrared_Spectroscopy/Infrared_Spectroscopy]
- 55. How to Properly Compare Spectra, and Determining ... [https://www.spectroscopyonline.com/view/how-properly-compare-spectra-and-determining-alkane-chain-length-infrared-spectra]
- 56. UV vis Spectrophotometer and Fluorescence Cuvettes [https://cotslab.com/guide-uv-vis-spectrophotometer-and-fluorescence-cuvettes/]
- 57. A Review of the Latest Spectroscopic Research in ... [https://www.spectroscopyonline.com/view/review-latest-spectroscopic-research-pharmaceutical-and-biopharmaceutical-applications]
- 58. IR Spectroscopy: From Experimental Spectra to High ... [https://pmc.ncbi.nlm.nih.gov/articles/PMC12621253/]
- 59. 7.2: UV/Vis and IR Spectroscopy [https://chem.libretexts.org/Courses/University_of_San_Diego/USD_CHEM_220%3A_Fall_2022_(Gillette)/07%3A_Molecular_Spectroscopy/7.02%3A_UV_Vis_and_IR_Spectroscopy]
- 60. UV-Vis Spectroscopy Troubleshooting Made Easy [https://www.ossila.com/pages/troubleshooting-uv-vis-spectroscopy]
- 61. A Technology Comparison of Near- Infrared Spectroscopy [https://www.azom.com/article.aspx?ArticleID=14371]
- 62. Difference Between UV, IR, and NMR Spectroscopy [https://www.creative-biostructure.com/difference-between-uv-ir-and-nmr-spectroscopy.htm?srsltid=AfmBOopRxYDeYdB_Mzrx6QorcW6FVHsUnSYKgSaeZLHXye7hLnmLdiRC]
- 63. Quantitative Analysis by Infrared Spectroscopy - T,C&A LAB [https://tcalab.alfa-chemistry.com/quantitative-analysis-by-infrared-spectroscopy-methods-and-procedures.html]
- 64. What Is a Calibration Curve in a Spectrophotometer? [https://www.hunterlab.com/blog/what-is-a-calibration-curve-in-a-spectrophotometer/]
- 65. Green chemistry approach: method development and ... [https://fjps.springeropen.com/articles/10.1186/s43094-021-00211-9]
- 66. Calibration: Effects on Accuracy and Detection Limits in ... [https://www.spectroscopyonline.com/view/calibration-effects-on-accuracy-and-detection-limits-in-atomic-spectroscopy]
- 67. 1.3: UV/Vis and IR Spectroscopy [https://chem.libretexts.org/Courses/Cornell_College/CC_CHM_411%3A_Advanced_Analytical_Chemistry/01%3A_Spectroscopic_Methods/1.03%3A_UV_Vis_and_IR_Spectroscopy]
- 68. Verifying Raw Materials Using FT-NIR [https://www.azom.com/article.aspx?ArticleID=16240]
- 69. Difference Between UV, IR, and NMR Spectroscopy [https://www.creative-biostructure.com/difference-between-uv-ir-and-nmr-spectroscopy.htm?srsltid=AfmBOoqtH2XG0xk2PgfZLh2be0FBniuzMcZNAFi4BU4dTXtaYlX7jr1Z]
- 70. Advancements in ultraviolet (UV) spectroscopy and ... [https://link.springer.com/article/10.1007/s41062-025-02304-3]
- 71. In-Line UV-Vis Spectroscopy Market Size 2025 to 2034 [https://www.precedenceresearch.com/in-line-uv-vis-spectroscopy-market]
- 72. In-line UV-Vis Spectroscopy Market Transformation 2025 [https://www.linkedin.com/pulse/in-line-uv-vis-spectroscopy-market-transformation-2025-o5zzc]
- 73. IR Spectroscopy Equipment in the Real World: 5 Uses You' ... [https://www.linkedin.com/pulse/ir-spectroscopy-equipment-real-world-5-uses-tcp0f/]
- 74. Unveiling the transformative power of near-infrared ... [https://www.sciencedirect.com/science/article/pii/S0928098725001745]
- 75. Paolo Oliveri [https://www.sciencedirect.com/author/24341831500/paolo-oliveri]
- 76. Accuracy and feasibility analysis of computational ... [https://pmc.ncbi.nlm.nih.gov/articles/PMC12225354/]
- 77. A statistical data-processing methodology of Py–GC/MS ... [https://www.sciencedirect.com/science/article/abs/pii/S0169743911002152]
- 78. Identification of Plastics in Mixtures and Blends through ... [https://pmc.ncbi.nlm.nih.gov/articles/PMC10780318/]
- 79. Polymer Identification Using Pyrolysis Products Fingerprints [https://www.perkinelmer.com/library/app-polymer-identification-using-pyrolysis-products-fingerprints.html]
- 80. Standardizing pyrolysis gas chromatography mass ... [https://www.nature.com/articles/s44454-025-00001-5]
- 81. A comparative study between thermogravimetry and ... [https://www.sciencedirect.com/science/article/abs/pii/S0142941814002712]
- 82. Comparison of pyrolysis gas chromatography/mass ... [https://pmc.ncbi.nlm.nih.gov/articles/PMC7680748/]
- 83. Refinement of a microfurnace pyrolysis-GC–MS method for ... [https://www.sciencedirect.com/science/article/pii/S004896972300921X]
- 84. Py-GC-MS Investigation of Pyrolysis Behaviours and ... [https://www.chromatographyonline.com/view/py-gc-ms-investigation-of-pyrolysis-behaviours-and-decomposition-products-of-and-2-7-11-cembratriene-4-6-diols]
- 85. Thermogravimetric analysis, kinetic study, and pyrolysis–GC ... [https://pmc.ncbi.nlm.nih.gov/articles/PMC5833888/]
- 86. Difference Between UV, IR, and NMR Spectroscopy [https://www.creative-biostructure.com/difference-between-uv-ir-and-nmr-spectroscopy.htm?srsltid=AfmBOooCdt489xlE3TYCi4DnFp0gEfGeP999sztOPLa2zivgrbNgh9iW]
- 87. Recent Advances in Portable and Handheld NIR ... [https://pmc.ncbi.nlm.nih.gov/articles/PMC8535602/]
- 88. Portable and Wearable Spectrometers in Our Future [https://www.spectroscopyonline.com/view/portable-and-wearable-spectrometers-in-our-future]
- 89. AI Shakes Up Spectroscopy as New Tools Reveal the ... [https://www.spectroscopyonline.com/view/ai-shakes-up-spectroscopy-as-new-tools-reveal-the-secret-life-of-molecules]
- 90. Explainable artificial intelligence for spectroscopy data [https://pmc.ncbi.nlm.nih.gov/articles/PMC11958459/]
- 91. Introduction to hyphenated techniques and their ... [https://pmc.ncbi.nlm.nih.gov/articles/PMC3658024/]
- 92. Hyphenated Raman spectroscopic systems: applications in ... [https://www.sciencedirect.com/science/article/pii/B9780443218347000256]