UV-Vis vs. NMR for Impurity Profiling: A 2025 Guide for Pharmaceutical Analysis
This article provides a comprehensive comparison of Ultraviolet-Visible (UV-Vis) and Nuclear Magnetic Resonance (NMR) spectroscopy for impurity profiling in pharmaceutical development.
UV-Vis vs. NMR for Impurity Profiling: A 2025 Guide for Pharmaceutical Analysis
Abstract
This article provides a comprehensive comparison of Ultraviolet-Visible (UV-Vis) and Nuclear Magnetic Resonance (NMR) spectroscopy for impurity profiling in pharmaceutical development. Tailored for researchers and drug development professionals, it explores the fundamental principles, practical methodologies, and optimization strategies for both techniques. Drawing on recent studies, including advancements in benchtop NMR and chemometric models for UV-Vis, the content delivers actionable insights for method selection, troubleshooting, and validation to ensure regulatory compliance and enhance drug safety.
Understanding the Core Principles: How UV-Vis and NMR Detect Impurities
The objective comparison of Ultraviolet-Visible (UV-Vis) spectroscopy and Nuclear Magnetic Resonance (NMR) spectroscopy for impurity profiling requires a fundamental understanding of their divergent physical bases. UV-Vis spectroscopy probes electronic transitions within molecules, measuring the excitation of electrons from ground state to higher energy states when exposed to ultraviolet or visible light [1] [2]. In contrast, NMR spectroscopy exploits the magnetic properties of atomic nuclei, detecting transitions between nuclear spin states under an external magnetic field [1] [3]. This fundamental difference in the observed phenomena dictates their respective applications, sensitivities, and capabilities in identifying and quantifying impurities in pharmaceutical compounds and other complex mixtures.
For impurity profiling, each technique offers distinct advantages and limitations. UV-Vis provides rapid quantitative analysis with high sensitivity for chromophoric impurities, while NMR delivers unparalleled structural elucidation power, capable of identifying unknown impurities without prior calibration [4]. This guide provides an objective comparison of their performance, supported by experimental data and detailed methodologies relevant to researchers in drug development.
The underlying mechanisms of UV-Vis and NMR spectroscopy originate from截然不同的physical interactions between matter and energy, which directly impact their utility in impurity profiling.
UV-Vis Spectroscopy: Electronic Transitions
UV-Vis spectroscopy operates on the principle of electronic excitation. When molecules are exposed to ultraviolet (typically 200-400 nm) or visible (400-800 nm) light, they can absorb energy, promoting electrons from ground state molecular orbitals to higher-energy excited states [2] [5]. The energy required for these transitions follows the equation E = hν, where E is energy, h is Planck's constant, and ν is the frequency of light [5]. The primary transitions observed include:
- π → π* transitions: Occur in molecules with conjugated π-electron systems, typically appearing at longer wavelengths with increased conjugation [2] [5]
- n → π* transitions: Involve excitation of non-bonding electrons, generally occurring at longer wavelengths with lower absorption intensity [2]
- σ → σ* transitions: Require high energy and appear in the far-UV region, making them less practically useful for routine analysis [5]
The measurement follows the Beer-Lambert Law, which states that absorbance is directly proportional to the concentration of the absorbing species and the path length, forming the basis for quantitative analysis in impurity profiling [1] [6].
NMR Spectroscopy: Nuclear Spin Phenomena
NMR spectroscopy relies on the magnetic properties of certain atomic nuclei. Nuclei with an odd mass number (such as (^1H), (^{13}C), (^{19}F), or (^{31}P)) possess intrinsic spin angular momentum and a corresponding magnetic moment [3] [7]. When placed in a strong external magnetic field (B₀), these nuclear spins adopt specific orientations characterized by different energy levels. The core principles include:
- Nuclear Spin Alignment: In an external magnetic field, nuclear spins occupy discrete energy states, typically aligned with or against the field direction [8] [3]
- Larmor Precession: Spinning nuclei precess around the axis of the external magnetic field at a characteristic frequency (the Larmor frequency) defined by ω₀ = γB₀, where γ is the gyromagnetic ratio [8]
- Resonance Absorption: When subjected to radiofrequency radiation matching the Larmor frequency, nuclei undergo transitions between spin states, absorbing energy [8] [3]
- Relaxation Processes: After excitation, nuclei return to equilibrium through spin-lattice (T₁) and spin-spin (T₂) relaxation mechanisms [8]
The precise resonance frequency of a nucleus is influenced by its local electronic environment, resulting in the chemical shift phenomenon that provides critical structural information for impurity identification [3].
Table 1: Fundamental Properties of UV-Vis and NMR Spectroscopy
| Property | UV-Vis Spectroscopy | NMR Spectroscopy |
|---|---|---|
| Physical Basis | Electronic transitions between molecular orbitals | Transitions between nuclear spin states |
| Energy Source | Ultraviolet/visible light (190-900 nm) [1] | Radiofrequency waves (e.g., 60-1000 MHz for (^1H)) [3] |
| Energy Regime | Higher energy (electron excitation) | Lower energy (nuclear spin flipping) |
| Measured Quantity | Absorbance of light [2] | Absorption of radiofrequency [3] |
| Key Equation | Beer-Lambert Law (A = εcl) [2] | Larmor Equation (ω₀ = γB₀) [8] |
| Information Obtained | Concentration, chromophore presence, conjugation | Molecular structure, functional groups, molecular dynamics |
Experimental Protocols for Impurity Profiling
UV-Vis Spectroscopy Methodology
UV-Vis spectroscopy provides a straightforward approach for detecting and quantifying impurities that contain chromophores or can be derivatized to form colored compounds.
Sample Preparation Protocol:
- Solvent Selection: Choose a solvent that does not absorb significantly in the spectral region of interest. Common choices include water, hexane, acetonitrile, and methanol [1]
- Cuvette Selection: Use quartz cuvettes for UV measurements (190-400 nm) and glass or plastic for visible range (400-900 nm) [1] [9]
- Concentration Optimization: Adjust sample concentration to achieve absorbance values between 0.1-1.0 AU for optimal detection linearity [2]
- Reference Solution: Prepare a blank containing only the solvent for background correction [1]
Instrumentation and Data Acquisition:
- Light Source: Instrument employs deuterium lamps for UV range and tungsten/halogen lamps for visible range [9]
- Monochromator: Uses diffraction grating or prism to isolate specific wavelengths [9]
- Detection: Photomultiplier tubes or photodiode arrays convert transmitted light to electrical signals [9]
- Spectral Collection: Scan from 190-900 nm or target specific wavelengths based on analyte properties [2]
Quantification Approach:
- Calibration Curve: Prepare standard solutions of known concentrations and measure absorbance at λ_max [2]
- Direct Calculation: Apply Beer-Lambert Law (A = εcl) using known molar absorptivity (ε) [2]
- Multi-component Analysis: Use simultaneous equations or derivative spectroscopy for overlapping peaks [6]
NMR Spectroscopy Methodology
NMR spectroscopy offers comprehensive structural information for impurity identification, particularly valuable for unknown compounds.
Sample Preparation Protocol:
- Solvent Selection: Use deuterated solvents (CDCl₃, D₂O, DMSO-d₆) to minimize interference while providing a lock signal [1]
- NMR Tube: Place sample in specialized glass tubes (typically 5 mm outer diameter, 15-20 cm length) [1]
- Internal Standard: Add tetramethylsilane (TMS) for (^1H) and (^{13}C) chemical shift referencing, or other standards for quantitative analysis [1] [4]
- Concentration: Typically requires higher concentrations (mM range) compared to UV-Vis [4]
Instrumentation and Data Acquisition:
- Magnet System: Superconducting magnets producing strong, stable fields (up to 28 Tesla in modern systems) [3]
- RF System: Radiofrequency transmitter and receiver coils for excitation and signal detection [8]
- Pulse Sequences: Apply tailored pulse sequences (e.g., 1D (^1H), (^{13}C), 2D COSY, HSQC) for specific information needs [8]
- Signal Acquisition: Collect Free Induction Decay (FID) signals following RF excitation [8]
- Signal Processing: Apply Fourier Transform to convert time-domain FID to frequency-domain spectrum [8]
Quantification Approaches:
- Direct Integration: Compare integrated signal areas relative to a known standard [4]
- Electronic Reference: Use electronic reference standards for precise quantification [4]
- Advanced Processing: Apply quantum mechanical modeling (QMM) or global spectral deconvolution for complex mixtures [4]
Performance Comparison in Impurity Profiling
Quantitative Analysis Capabilities
Recent comparative studies provide objective data on the performance of UV-Vis and NMR spectroscopy for quantifying compounds in complex mixtures. A 2025 study analyzing methamphetamine hydrochloride in binary and ternary mixtures demonstrated their relative capabilities.
Table 2: Quantitative Performance Comparison for Mixture Analysis [4]
| Analytical Method | Quantification Approach | Root Mean Square Error (RMSE) | Key Advantages | Key Limitations |
|---|---|---|---|---|
| Benchtop NMR (60 MHz) | Quantum Mechanical Model (QMM) | 1.3 mg/100 mg sample | Simultaneous identification and quantification of all species | Lower sensitivity than HPLC-UV |
| Benchtop NMR (60 MHz) | Global Spectral Deconvolution (qGSD) | Not specified (higher than QMM) | Handles moderate peak overlap | Requires specialized software |
| Benchtop NMR (60 MHz) | Traditional Integration | 4.7 mg/100 mg sample | Simple implementation | Fails with significant peak overlap |
| HPLC-UV | External calibration | 1.1 mg/100 mg sample | High precision for targeted compounds | Requires specific standards for each analyte |
Detection Sensitivity and Structural Elucidation
The complementary strengths of UV-Vis and NMR spectroscopy become apparent when evaluating their sensitivity and structural information capabilities.
Table 3: Sensitivity and Structural Information Comparison
| Parameter | UV-Vis Spectroscopy | NMR Spectroscopy |
|---|---|---|
| Detection Limit | Typically 10⁻⁴ to 10⁻⁶ M [2] | Typically 10⁻² to 10⁻⁴ M (higher for benchtop systems) [4] |
| Structural Specificity | Low - identifies chromophores but not detailed structure [2] | High - provides complete molecular structure through chemical shifts, coupling constants, and integration [3] [6] |
| Sample Throughput | High - analysis completed in minutes [1] [6] | Low to moderate - typically requires 5-20 minutes per sample [8] |
| Spectral Resolution | Broad absorption bands [1] | High resolution with sharp peaks (0.5-5 Hz linewidths) [8] |
| Multi-component Analysis | Possible with chemometrics or derivative spectroscopy [6] | Excellent - resolves multiple components simultaneously [4] |
| Unknown Identification | Limited - requires reference standards [6] | Excellent - can identify completely unknown structures [4] [6] |
Visualizing Fundamental Mechanisms
UV-Vis Electronic Transition Pathways
The following diagram illustrates the electronic transition mechanisms in UV-Vis spectroscopy, highlighting the different transition types and their energy relationships.
Diagram 1: UV-Vis Electronic Transition Pathways showing σ→σ, π→π, and n→π transitions between molecular orbitals.*
NMR Nuclear Spin Phenomena
The following diagram illustrates the fundamental nuclear spin phenomena underlying NMR spectroscopy, including alignment, precession, and resonance.
Diagram 2: NMR Nuclear Spin Phenomena showing energy states, Larmor precession, and resonance condition.
Essential Research Reagent Solutions
Successful impurity profiling requires appropriate selection of reagents and materials optimized for each analytical technique.
Table 4: Essential Research Reagents and Materials for Impurity Profiling
| Category | Item | Technical Function | Technique |
|---|---|---|---|
| Solvents | High-purity HPLC grade solvents (water, acetonitrile, methanol) | Dissolve samples without introducing interfering UV absorbance | UV-Vis |
| Solvents | Deuterated solvents (CDCl₃, DMSO-d₆, D₂O) | Dissolve samples while providing field frequency lock without interfering proton signals | NMR |
| Sample Containers | Quartz cuvettes (1 cm path length) | Optimal UV transmission down to 190 nm | UV-Vis |
| Sample Containers | High-quality NMR tubes (5 mm OD) | Uniform spinning and minimal magnetic susceptibility variations | NMR |
| Reference Standards | Certified reference materials of target analytes | Quantitative calibration and method validation | Both |
| Reference Standards | Tetramethylsilane (TMS) or other chemical shift references | Provides δ = 0 ppm reference point for chemical shifts | NMR |
| Quantification Aids | Electronic reference solutions | Precise concentration determination without internal standards | NMR |
| Software Tools | Quantum Mechanical Modeling (QMM) software | Advanced spectral deconvolution for overlapping signals | NMR |
| Software Tools | Global Spectral Deconvolution algorithms | Handle peak overlap in complex mixtures | NMR |
UV-Vis and NMR spectroscopy offer complementary approaches to impurity profiling with fundamentally different mechanisms and application strengths. UV-Vis spectroscopy excels in rapid quantification of chromophoric impurities with high sensitivity and simple operation, making it ideal for routine quality control of known compounds [1] [6]. Conversely, NMR spectroscopy provides unparalleled structural elucidation capabilities, enabling identification of unknown impurities without purified standards through detailed analysis of chemical shifts, coupling constants, and integration patterns [4].
The choice between these techniques depends on specific analytical needs: UV-Vis is preferable for high-throughput quantification of known chromophores, while NMR is indispensable for structural characterization of unknown impurities and complex mixtures. Modern advancements, including benchtop NMR systems with quantum mechanical modeling and improved UV-Vis detection systems, continue to expand the capabilities of both techniques for comprehensive impurity profiling in pharmaceutical research and drug development [4].
Absorption Bands vs. Structural Fingerprints
Impurity profiling is a critical component of pharmaceutical development, essential for ensuring drug safety, efficacy, and quality by identifying and quantifying undesirable chemical substances that may arise during manufacturing or storage [10]. The selection of appropriate analytical techniques is paramount, with ultraviolet-visible (UV-Vis) spectroscopy and nuclear magnetic resonance (NMR) spectroscopy representing two fundamentally different approaches. UV-Vis spectroscopy characterizes impurities based on their absorption bands from electronic transitions in chromophores, while NMR provides structural fingerprints by detecting the magnetic environments of specific nuclei within the molecule [11] [12]. This guide objectively compares the performance, applications, and limitations of these techniques to inform strategic method selection in pharmaceutical research and quality control.
Performance Comparison: UV-Vis vs. NMR
The choice between UV-Vis and NMR spectroscopy involves trade-offs between sensitivity, structural information, and operational considerations. The table below summarizes their comparative performance based on experimental data.
Table 1: Comparative Performance of UV-Vis and NMR in Analytical Applications
| Performance Characteristic | UV-Vis Spectroscopy | NMR Spectroscopy |
|---|---|---|
| Fundamental Basis | Electronic transitions in chromophores [13] | Magnetic properties of specific nuclei (e.g., 1H, 13C) [12] |
| Primary Analytical Output | Absorption bands / spectra [14] | Structural fingerprints (chemical shift, coupling) [11] |
| Key Strength | High sensitivity for chromophores; quantification [11] | Universal detection for all 1H-containing compounds; structural elucidation [12] |
| Quantitative Performance | Bakuchiol analysis: Comparable to HPLC for simple samples [11] | Benchtop NMR with QMM for MA: RMSE of 2.1 vs. HPLC-UV RMSE of 1.1 [4] |
| Limitation | Cannot detect compounds lacking a chromophore [12] | Lower sensitivity compared to optical spectroscopy; requires deuterated solvents [12] |
| Sample Throughput | Typically high speed; rapid analysis [14] | Longer experiment times, but can quantify multiple compounds simultaneously [12] |
| Handling Complex Mixtures | Requires chemometrics (e.g., MCR-ALS) to resolve overlapping signals [14] | Advanced processing (e.g., QMM) can deconvolute overlapping peaks [4] |
| Detection Capability for Non-Chromophores | Fails to detect or quantify (e.g., Imp 2 of Mavacamten) [12] | Effectively detects and quantifies (e.g., Imp 2 of Mavacamten) [12] |
Experimental Protocols and Data Analysis
UV-Vis Spectroscopy in Practice
UV-Vis methodology relies on measuring the absorption of light by analyte chromophores. A typical protocol for quantifying an active ingredient like bakuchiol in cosmetic serums involves dissolving the sample in ethanol, recording the spectrum, and using the maximum absorbance at a specific wavelength (e.g., 262 nm for bakuchiol) for quantification against a standard curve [11]. However, a significant limitation arises with non-chromophore compounds or complex matrices. For instance, mavacamten impurity 2 (1-phenylethanamine) contains a weakly absorbing chromophore and could only be detected at 210 nm, a wavelength where baseline instability makes reliable quantification infeasible [12]. In complex plant metabolite studies, advanced chemometric methods like Multivariate Curve Resolution-Alternating Least Squares (MCR-ALS) are employed to resolve the strong spectral overlaps typical of UV-Vis fingerprints [14].
NMR Spectroscopy in Practice
NMR protocols focus on preparing a stable solution in a deuterated solvent and optimizing acquisition parameters. For the simultaneous quantification of mavacamten and its two impurities, researchers optimized parameters including solvent (DMSO-d6), relaxation delay (D1 = 31s), number of scans (NS = 33), and data points (TD = 64k) to achieve reproducible results [12]. A key advantage is NMR's ability to quantify multiple components at once without separation. In a study on methamphetamine (MA) mixtures, benchtop NMR coupled with a Quantum Mechanical Model (QMM) analyzed samples containing MA and cutting agents, generating a theoretical spectrum based on chemical shifts and coupling constants to fit the measured data, achieving an RMSE of 1.3-2.1 mg/100 mg [4]. Quantitative NMR (qNMR) was successfully validated for mavacamten impurity analysis, showing high precision (%RSD < 0.72 for repeatability) and accuracy (98% recovery) [12].
Table 2: Summary of Key Research Reagent Solutions
| Reagent / Material | Function in Analysis | Example Application |
|---|---|---|
| Deuterated Solvents (e.g., DMSO-d6, CDCl3) | Provides an NMR-invisible locking signal and solvent environment for analysis [11] [12] | Dissolving samples for 1H NMR analysis; DMSO-d6 was used for mavacamten and its impurities [12]. |
| Internal Standard (e.g., DMF, Nicotinamide) | Provides a reference peak with known concentration for quantitative NMR (qNMR) [12] | DMF was used as an internal standard for quantifying mavacamten and its impurities via 1H qNMR [12]. |
| Chemometric Software (e.g., MCR-ALS) | Resolves overlapping spectral signals from complex mixtures into pure component profiles [14] | Applied to UV-Vis spectral fingerprints of yerba mate extracts to resolve seven distinct components [14]. |
| Quantum Mechanical Model (QMM) Software | Models ideal NMR spectra based on chemical shifts/j-couplings for quantitation in overlapped spectra [4] | Used with benchtop NMR to quantify methamphetamine in complex mixtures with high accuracy [4]. |
Workflow for Method Selection
The decision to use UV-Vis, NMR, or an orthogonal approach depends on the nature of the impurity and the analysis goals. The following diagram outlines a logical workflow for technique selection.
Diagram 1: Technique Selection Workflow
UV-Vis and NMR spectroscopy offer complementary capabilities for impurity profiling. UV-Vis provides a highly sensitive and efficient method for quantifying impurities with chromophores, while NMR delivers unparalleled structural fingerprinting and universal detection for a comprehensive impurity profile. The emerging trend of combining these techniques with advanced data processing models (MCR-ALS, QMM) and benchtop NMR technology is enhancing their power to solve complex analytical challenges. Researchers are advised to base their selection on the chemical nature of the target impurities, the required information level, and the sample matrix complexity, using the provided workflow and comparative data as a guide for informed method development.
Impurity profiling is a critical component of pharmaceutical development and quality control, serving as a systematic approach to identify, characterize, and quantify undesirable substances in active pharmaceutical ingredients (APIs) and final drug products. These impurities—which can arise from synthesis processes, excipients, residual solvents, or degradation products—pose significant challenges to the safety, efficacy, and stability of pharmaceuticals [10]. Even at trace levels, impurities can have toxicological consequences, making their detection and control essential for regulatory compliance and patient safety. The International Conference on Harmonisation (ICH) guidelines establish strict thresholds for reporting impurities, typically at levels of 0.05% or 0.03% (w/w) depending on maximum daily intake, creating a demanding analytical challenge for pharmaceutical scientists [15].
The selection of appropriate analytical techniques is paramount for effective impurity profiling. No single methodology universally addresses all impurity characterization needs, rather, a combination of complementary techniques provides the comprehensive data required for structural elucidation and quantification. Among the numerous analytical tools available, UV-Visible (UV-Vis) spectroscopy and Nuclear Magnetic Resonance (NMR) spectroscopy represent two fundamentally different approaches with distinct strengths and limitations. UV-Vis spectroscopy measures electronic transitions in molecules, while NMR spectroscopy exploits the magnetic properties of atomic nuclei to provide structural information [1]. This guide provides an objective comparison of these techniques, supported by experimental data and methodologies, to inform researchers and drug development professionals in their analytical selection process.
Fundamental Principles and Technical Comparison
Understanding the fundamental operating principles of UV-Vis and NMR spectroscopy reveals why these techniques offer complementary information in impurity profiling applications. UV-Visible spectroscopy is based on the interaction of sample molecules with electromagnetic radiation in the wavelength region of 190–900 nm. Such interactions lead to the excitation of electrons from ground state to higher energy states, with the extent of absorption being directly proportional to the concentration of the absorbing species (following the Beer-Lambert law) and dependent on the presence of chromophoric groups in the molecules [1]. This technique is particularly sensitive to compounds with conjugated double bonds or aromatic systems that create characteristic absorption patterns.
In contrast, NMR spectroscopy operates on completely different principles, exploiting the magnetic properties of atomic nuclei. When placed in a strong magnetic field, nuclei with spin (such as ^1H, ^13C, ^19F) absorb electromagnetic radiation in the radio frequency range. The resulting NMR spectra provide detailed information about the chemical environment of each nucleus, enabling comprehensive structural elucidation [1]. Unlike UV-Vis, NMR does not rely on chromophores but rather on the presence of magnetically-active nuclei, making it applicable to a broader range of chemical structures.
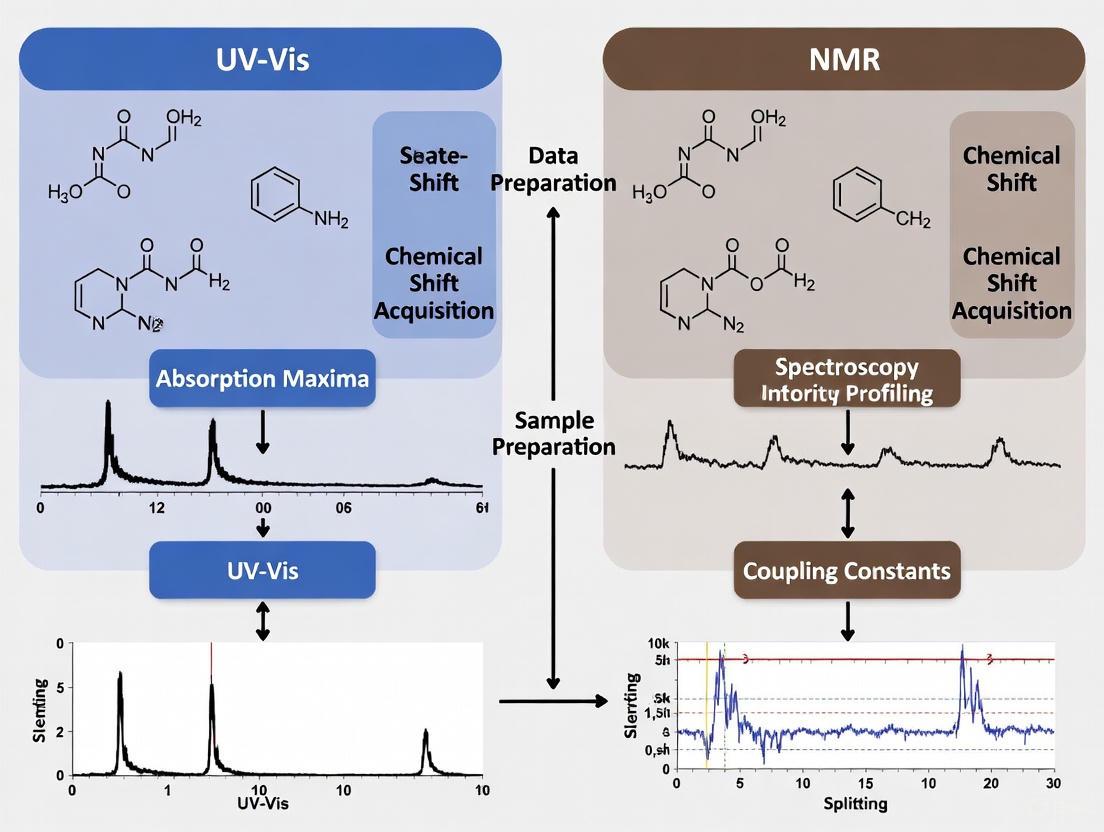
The following diagram illustrates the fundamental operational differences between these two analytical techniques:
Figure 1: Fundamental operating principles of UV-Vis and NMR spectroscopy
Technical Specifications and Performance Metrics
The table below summarizes the key technical characteristics and performance metrics of both techniques:
Table 1: Technical comparison between UV-Vis and NMR spectroscopy for impurity profiling
| Parameter | UV-Vis Spectroscopy | NMR Spectroscopy |
|---|---|---|
| Fundamental Basis | Electronic transitions | Nuclear spin transitions |
| Spectral Range | 190-900 nm | Chemical shift (ppm) relative to reference |
| Detection Limit | nM-μM range | μM-mM range (varies with field strength) |
| Structural Information | Limited to chromophore presence | Comprehensive atom-by-atom connectivity |
| Quantitative Capability | Excellent (Beer-Lambert law) | Good (direct proportionality) |
| Analysis Time | Seconds to minutes | Minutes to hours |
| Sample Form | Solution in UV-transparent solvent | Solution (often deuterated solvents) |
| Sample Volume | 0.5-3 mL (standard cuvettes) | 300-600 μL (standard NMR tubes) |
| Chromophore Requirement | Essential | Not required |
| Destructive Nature | Non-destructive | Non-destructive |
Key Applications in Impurity Profiling
UV-Vis Spectroscopy Applications
UV-Vis spectroscopy serves as a versatile workhorse in impurity profiling, particularly when integrated with separation techniques. Its exceptional quantitative capabilities make it ideal for monitoring impurity levels against established calibration curves. In pharmaceutical analysis, High-Performance Liquid Chromatography with UV detection (HPLC-UV) represents one of the most widely applied methodologies for related substance determination. For instance, researchers developed an optimized HPLC-UV method for estazolam that achieved enhanced sensitivity and resolution for quantitatively analyzing related substances in generic estazolam tablets from multiple manufacturers [16]. The method successfully separated and quantified eight known and unknown impurities, demonstrating the power of UV detection when coupled with efficient separation techniques.
Beyond conventional quantification, UV-Vis spectroscopy finds unique applications in specialized impurity profiling scenarios. Nanoparticle synthesis and characterization represents one such area, where UV-Vis serves as a critical monitoring tool. Researchers at Kaunas University of Technology analyzed colloidal silver nanoparticles created via silver salt reduction by monitoring the chemical reduction process throughout the reaction using UV-Vis spectroscopy in the 300-700 nm wavelength range [17]. They observed that colloidal silver exhibits a wide absorption band from 350-550 nm with a characteristic peak at 445 nm. As nanoparticles formed, absorption increased, and as particles grew, the absorption peak redshifted—providing crucial information about particle size and formation kinetics that would be challenging to obtain with other techniques.
Another innovative application involves humidity detection using nano-hydrogel colloidal (NHC) array photonic crystals. Researchers used UV-Vis spectroscopy during precipitation polymerization synthesis to monitor the optical properties of novel humidity sensors [17]. The resulting hydrogels swelled and changed volume in response to humidity, causing measurable shifts in absorption bands across the visible spectrum (400-760 nm) corresponding to humidity levels from 20-99.9%. This application demonstrates how UV-Vis spectroscopy can characterize impurity-induced or excipient-induced material changes in pharmaceutical formulations.
NMR Spectroscopy Applications
NMR spectroscopy offers unparalleled capabilities in structural elucidation of unknown impurities, making it indispensable when confronted with novel degradation products or process-related impurities that cannot be identified through library matching alone. The technique's ability to provide direct structural information without requiring chromophores makes it particularly valuable for profiling impurities that lack strong UV absorption. Recent advances have demonstrated that NMR sensitivity is sufficient for pharmaceutical impurity analysis, contrary to widespread beliefs. Research has verified the suitability of ^1H NMR spectroscopy for detecting impurities at ICH-recommended thresholds, establishing a limit of detection (LOD) of 0.01% for a choline impurity in a 400 MHz instrument [15].
Quantitative NMR (qNMR) has emerged as a powerful approach for purity determination, with the Journal of Medicinal Chemistry now accepting absolute quantitative ^1H NMR spectroscopy for establishing compound purity of tested compounds [18]. This technique offers significant advantages for impurity profiling: it requires small samples, is non-destructive, provides high accuracy and precision, and can detect impurities that might co-elute in chromatographic methods or escape detection by elemental analysis. The method involves accurate weighing of samples and standards, with the ability to detect inorganic impurities, solvent residues, and water through characteristic signatures in the NMR spectrum.
A compelling application of NMR in impurity profiling involves the characterization of midostaurin degradation products. Researchers subjected midostaurin softgel capsules to stress testing per ICH guidelines and identified four degradation products using a combination of analytical techniques [19]. After initial separation by HPLC, the peak fractions of degradation products were isolated and characterized using multiple spectroscopic techniques, including LC-MS, ^1H and ^13C NMR, IR, and UV-Vis. The NMR data provided critical structural information that enabled identification of the major degradation product, demonstrating the essential role of NMR in comprehensive impurity identification.
Hyphenated and Combined Techniques
The integration of multiple analytical techniques creates powerful hybrid approaches that overcome the limitations of individual methods. Combined LC-NMR-MS systems represent the pinnacle of such hyphenated techniques, offering unparalleled capabilities for impurity identification. These systems incorporate a split of the mobile phase, with a small percentage (≈5%) directed to an MS instrument and the majority (≈95%) continuing to the NMR spectrometer [20]. This configuration enables MS to guide NMR analysis, ensuring that extended NMR data acquisition time is invested in the correct components. The MS data provides molecular weight and fragment information, while NMR delivers detailed structural elucidation, creating a comprehensive analytical picture.
Another innovative approach combines in situ illumination with NMR and UV-Vis spectroscopy (UVNMR-illumination) to study photochemical processes relevant to impurity formation. Researchers developed a fully automated setup incorporating a UV-Vis reflection dip probe with an LED-illumination device inside an NMR spectrometer [21]. This configuration enabled simultaneous, time-resolved detection of both paramagnetic and diamagnetic species during photochemical reactions. In one application, the system monitored a consecutive photoinduced electron transfer (conPET) process, where UV-Vis spectroscopy tracked the formation of radical anions (detected at 698 and 794 nm) while NMR provided quantitative data on diamagnetic reactants and decomposition products [21]. Such integrated systems are particularly valuable for studying photosensitive pharmaceuticals and predicting potential light-induced degradation pathways.
The following workflow illustrates a typical integrated approach for comprehensive impurity profiling:
Figure 2: Integrated impurity profiling workflow combining separation and detection techniques
Experimental Protocols and Methodologies
HPLC-UV Method for Related Substance Analysis
The development and validation of stability-indicating methods represents a cornerstone of modern impurity profiling. The following protocol for estazolam impurity analysis demonstrates a systematic approach to method development [16]:
Sample Preparation: Prepare test solutions by accurately weighing estazolam active pharmaceutical ingredient (API) or powdered tablets equivalent to approximately 50 mg of API. Transfer to volumetric flasks, dissolve in mobile phase, and dilute to volume. For related substance quantification, prepare at approximately 1.0 mg/mL concentration. For assay determination, prepare at approximately 0.1 mg/mL concentration.
Chromatographic Conditions:
- Column: C18 column (250 × 4.6 mm, 5 μm particle size)
- Mobile Phase: Optimized gradient mixture of buffer (e.g., ammonium formate or phosphate) and organic modifier (acetonitrile or methanol)
- Flow Rate: 1.0 mL/min
- Detection Wavelength: 220-280 nm (optimized for specific chromophores)
- Injection Volume: 10-20 μL
- Column Temperature: 25-40°C
- Run Time: 25-60 minutes (depending on complexity)
Method Validation: Perform comprehensive validation according to ICH guidelines including:
- Specificity: Demonstrate separation from known impurities and degradation products
- Linearity: Prepare calibration curves over range of 0.05-5.0% of target analyte concentration
- Accuracy: Conduct recovery studies at multiple levels (50%, 100%, 150% of specification)
- Precision: Evaluate repeatability (six replicate injections) and intermediate precision (different days, analysts)
- Limit of Detection (LOD) and Quantitation (LOQ): Determine via signal-to-noise ratio of 3:1 and 10:1 respectively
Quantitative NMR (qNMR) Protocol
Absolute quantitative ^1H NMR spectroscopy provides an orthogonal method for purity determination and impurity quantification [18]. The following protocol ensures accurate results:
Sample Preparation: Precisely weigh the analyte (2-10 mg) into a clean vial. Add an exact amount of certified quantitative NMR reference standard (such as 1,4-bis(trimethylsilyl)benzene or maleic acid) with known purity. Transfer the mixture to a volumetric flask and dilute with deuterated solvent to achieve known concentration. Typical analyte concentration ranges from 1-10 mM.
NMR Acquisition Parameters:
- Instrument: High-field NMR spectrometer (400 MHz or higher)
- Probe: Quantitative inverse detection probe
- Temperature: 25-30°C (controlled)
- Pulse Sequence: Single-pulse experiment with sufficient relaxation delay
- Relaxation Delay (D1): ≥5×T1 (longest T1 of interest, typically 20-30 seconds)
- Acquisition Time: 2-4 seconds
- Scans: 64-256 (depending on concentration and sensitivity needs)
- Receiver Gain: Set automatically or manually to avoid saturation
Data Processing and Quantification:
- Fourier transformation with exponential line broadening (0.1-0.3 Hz)
- Phase correction and baseline correction
- Reference chemical shift to internal standard or solvent peak
- Integrate target peaks for both analyte and reference standard
- Calculate purity using the formula: Purity = (Iunknown/Istd) × (Nstd/Nunknown) × (Munknown/Mstd) × (mstd/munknown) × P_std Where I = integral, N = number of protons, M = molecular weight, m = mass, P = purity
Forced Degradation Studies
Forced degradation studies provide critical information about potential impurities and degradation pathways. The midostaurin case study exemplifies a systematic approach [19]:
Stress Conditions:
- Acidic Degradation: Treat with 0.1-1.0 M HCl at 60-80°C for 1-24 hours
- Alkaline Degradation: Treat with 0.1-1.0 M NaOH at 60-80°C for 1-24 hours
- Oxidative Degradation: Treat with 1-3% H2O2 at room temperature for 1-24 hours
- Thermal Degradation: Expose solid state to 70-105°C for 1-7 days
- Photolytic Degradation: Expose to UV (320-400 nm) and visible light for 1-7 days
- Hydrolytic Degradation: Treat with water at elevated temperatures
Sample Analysis:
- Monitor degradation progress at various time points using HPLC-UV
- Isulate major degradation products using preparative chromatography
- Characterize isolated degradation products using LC-MS/MS, NMR, IR, and UV-Vis
- Establish degradation pathways and identify critical quality attributes
Comparative Experimental Data
Performance Metrics for Impurity Detection
The table below summarizes quantitative performance data for UV-Vis and NMR techniques in specific impurity profiling applications:
Table 2: Comparative performance data for impurity detection techniques
| Application | Technique | LOD | LOQ | Key Findings | Reference |
|---|---|---|---|---|---|
| Choline impurity analysis | 1H NMR (400 MHz) | 0.01% | 0.03% | Meets ICH thresholds for impurity detection | [15] |
| Choline impurity analysis | 1H NMR (60 MHz) | 2% | 6.7% | Limited utility for low-level impurities | [15] |
| Estazolam related substances | HPLC-UV | Not specified | Complies with ICH Q3 | Successfully quantified 8 known/unknown impurities across 12 manufacturers | [16] |
| Midostaurin degradation products | HPLC-UV with MS/NMR characterization | Sensitivity demonstrated for 4 degradation products | Structural elucidation of major degradation product (DP1) | [19] | |
| Silver nanoparticle monitoring | UV-Vis spectroscopy | nM range | Particle size determination and reaction monitoring via absorption at 445 nm | [17] | |
| Quantitative purity assessment | Absolute quantitative 1H NMR | <5% (relative) | Orthogonal method to HPLC and elemental analysis | [18] |
Research Reagent Solutions and Essential Materials
The following table details key reagents, materials, and instrumentation essential for implementing the discussed impurity profiling techniques:
Table 3: Essential research reagents and materials for impurity profiling
| Item | Function/Application | Technical Specifications | Notes |
|---|---|---|---|
| Deuterated Solvents | NMR sample preparation | Chloroform-d, DMSO-d6, Methanol-d4 | Essential for field frequency locking in NMR; purity >99.8% D |
| qNMR Standards | Quantitative NMR reference | Certified maleic acid, 1,4-bis(trimethylsilyl)benzene | High-purity compounds with known stoichiometry |
| HPLC Columns | Chromatographic separation | C18, 250 × 4.6 mm, 5 μm particle size | Optimal for pharmaceutical impurity separation |
| Mobile Phase Buffers | HPLC separation | Ammonium formate, ammonium acetate, phosphate buffers | 10-50 mM concentration; pH adjustment critical |
| UV Cuvettes/NMR Tubes | Sample containment | Quartz cuvettes (1 cm path); NMR tubes (5 mm OD) | High-quality quartz for UV; matched NMR tubes for reproducibility |
| Forced Degradation Reagents | Stress testing | HCl, NaOH, H2O2 at various concentrations | ACS grade or higher for controlled degradation studies |
| Column Ovens | Temperature control | 25-40°C range | Improved retention time reproducibility |
| Photostability Chambers | Light-induced degradation studies | Controlled UV and visible exposure | ICH Q1B compliant conditions |
UV-Vis and NMR spectroscopy offer complementary capabilities in the multifaceted domain of impurity profiling. UV-Vis spectroscopy, particularly when hyphenated with separation techniques like HPLC, provides exceptional sensitivity and quantitative capabilities for routine analysis and monitoring of known impurities. Its speed, ease of use, and cost-effectiveness make it ideal for high-throughput environments where quantitative data on chromophore-containing impurities is required.
NMR spectroscopy delivers unparalleled structural elucidation power, enabling identification of novel or unexpected impurities that defy library-based identification. The technique's ability to characterize both known and unknown compounds without requiring chromophores, combined with its growing utility in quantitative applications (qNMR), positions it as an essential orthogonal technique for comprehensive impurity profiling. Recent advancements demonstrating NMR sensitivity at levels meeting ICH requirements further strengthen its case for pharmaceutical applications [15].
The most effective impurity profiling strategies leverage the strengths of both techniques within integrated workflows. Combined approaches like LC-NMR-MS and in situ UVNMR-illumination represent the future of impurity characterization, offering comprehensive analytical capabilities that exceed what any single technique can achieve. As pharmaceutical compounds grow more complex and regulatory requirements more stringent, such multidimensional analytical approaches will become increasingly essential for ensuring drug safety and efficacy.
Impurity profiling is a critical component of pharmaceutical development and quality control, serving as a systematic approach to identify, characterize, and quantify undesirable chemical components in drug substances and products. These impurities, which can arise from raw materials, synthesis processes, residual solvents, or degradation during storage, pose significant challenges to the safety, efficacy, and stability of pharmaceuticals [10]. Even at trace levels, certain impurities can exhibit toxic, mutagenic, or carcinogenic properties, potentially leading to serious health risks for patients [10]. Furthermore, impurities can interfere with the therapeutic activity of the Active Pharmaceutical Ingredient (API), particularly in drugs with a narrow therapeutic index, and can accelerate product degradation, thereby reducing shelf life [10].
Regulatory bodies worldwide have established comprehensive guidelines to ensure rigorous impurity control. The International Council for Harmonisation (ICH) provides globally recognized guidelines that set acceptable limits for impurities and mandate robust analytical methods for their detection and quantification [10]. These guidelines, adopted by major regulatory agencies like the FDA (Food and Drug Administration, USA) and EMA (European Medicines Agency), create a framework that safeguards public health by minimizing risks associated with impurities in pharmaceuticals [10]. For mutagenic impurities specifically, the ICH M7 guideline outlines four control options, ranging from direct testing of the drug substance to relying solely on process controls based on scientific knowledge of fate and purification [22]. Adherence to these standards, including validation according to ICH Q2(R1) for analytical procedures, is not merely a regulatory formality but a fundamental commitment to drug safety and quality throughout the product lifecycle [23].
Analytical Techniques for Impurity Profiling: UV-Vis versus NMR
The selection of appropriate analytical techniques is paramount for effective impurity profiling. While various methods exist, UV-Vis spectroscopy and Nuclear Magnetic Resonance (NMR) spectroscopy offer distinct advantages and limitations. The following table provides a comparative overview of these two techniques based on key operational and performance parameters.
Table 1: Comparison of UV-Vis and NMR Spectroscopy for Impurity Profiling
| Parameter | UV-Vis Spectroscopy | NMR Spectroscopy |
|---|---|---|
| Fundamental Principle | Measures electronic transitions (e.g., π→π, n→π) in chromophores [24]. | Probes magnetic properties of atomic nuclei (e.g., ¹H, ¹³C) to reveal structure and dynamics [23]. |
| Primary Information | Concentration, presence of chromophores, some structural hints via λmax shifts [24]. | Detailed molecular structure, stereochemistry, atomic connectivity, and quantitative data [23]. |
| Quantitative Capability | Excellent for routine quantification of known chromophores [23]. | Inherently quantitative; signal intensity directly proportional to nucleus count [23]. |
| Specificity | Category C technique per SWGDRUG; less specific, can be susceptible to matrix interference [4]. | Category A technique per SWGDRUG; high specificity due to detailed structural information [4]. |
| Sensitivity | High; suitable for trace analysis [23]. | Traditionally lower than UV-Vis, but benchtop NMR with QMM achieves RMSE of 2.1 mg/100 mg [4]. |
| Sample Preparation | Requires optically clear solutions, specific solvent compatibility, and dilution within linear absorbance range [23]. | Requires deuterated solvents, filtration/centrifugation, and optimization of concentration [23]. |
| Key Advantage | Fast, simple, inexpensive, and ideal for high-throughput routine analysis [23]. | Non-destructive, provides simultaneous identification and quantification without analyte-specific standards [4]. |
| Major Limitation | Limited structural information; requires a chromophore; not suitable for identification alone [24]. | Higher instrument cost; lower sensitivity compared to chromatographic or mass spectrometric methods [4]. |
Experimental Protocols and Workflows
A standardized experimental workflow is essential for generating reliable and reproducible data in impurity profiling. The following diagram outlines the key stages for both UV-Vis and NMR analyses, from sample preparation to data interpretation.
Diagram 1: Experimental workflow for UV-Vis and NMR analysis
Detailed UV-Vis Methodology
For UV-Vis analysis, the sample must first be dissolved in a suitable solvent that is transparent in the wavelength range of interest, such as ethanol [11]. The solution must be optically clear, free from particulate matter that can cause light scattering [23]. The sample is then placed in a quartz cuvette (for UV measurements) or a glass/plastic cuvette (for visible measurements), and the absorbance is measured at a predetermined wavelength—for instance, 262 nm for bakuchiol [11]. The concentration of the analyte is determined by comparing the absorbance to a calibration curve constructed from standard solutions [11] [23]. A key limitation is that complex matrices, such as oil-in-water emulsions, can prevent complete dissolution or proper extraction of the analyte, making accurate quantification difficult or impossible [11].
Detailed NMR Methodology
For quantitative ¹H NMR (qNMR), the sample is dissolved in a high-purity deuterated solvent like CDCl₃ or DMSO-d₆ [11] [23]. The sample must be filtered or centrifuged to remove any undissolved solids, which can broaden spectral peaks and degrade resolution [23]. An internal standard, such as nicotinamide, is often added for quantification; this compound is selected for its stability, lack of reactivity, and solubility similar to the analyte [11]. The spectrum is acquired with a sufficient number of scans to achieve an adequate signal-to-noise ratio. Quantification can be performed using traditional peak integration of well-resolved signals or, more effectively for complex mixtures, using advanced processing algorithms like Quantum Mechanical Modelling (QMM). QMM uses known NMR parameters (chemical shifts, coupling constants) to generate an ideal spectrum, which is then fitted to the experimental data to quantify components even in cases of significant spectral overlap [4].
Performance Comparison and Experimental Data
Direct comparisons in research studies highlight the relative performance of UV-Vis and NMR for quantification in complex matrices. A study on methamphetamine hydrochloride (MA) in binary and ternary mixtures compared benchtop NMR with the gold-standard HPLC-UV. When using the QMM processing method, benchtop NMR achieved a Root Mean Square Error (RMSE) of 2.1 mg/100 mg for quantifying MA purity across all samples, which was comparable to, though slightly higher than, the RMSE of 1.1 mg/100 mg achieved by HPLC-UV [4]. This demonstrates that NMR can approach the precision of chromatographic methods for this application.
A separate study quantifying bakuchiol in cosmetic products further validated NMR's accuracy. The results showed a strong correlation between ¹H qNMR and HPLC analysis, confirming the viability of NMR for routine quality control [11]. The bakuchiol content determined by HPLC was 3.6% in the highest sample, 1% in a sample matching its label claim, and 0.51% in a sample containing only half of its declared content [11]. These values were consistent with the qNMR findings. The study also underscored a key limitation of UV-Vis: for two emulsion-based samples (Samples 5 and 6), bakuchiol could not be properly extracted or quantified via UV-Vis due to the matrix, whereas NMR was able to analyze them [11].
Table 2: Summary of Experimental Performance Data from Cited Studies
| Study/Analyte | Technique | Key Performance Metric | Result | Contextual Findings |
|---|---|---|---|---|
| Methamphetamine HCl [4] | Benchtop NMR (QMM) | RMSE (all samples) | 2.1 mg/100 mg | Performance was comparable to HPLC-UV. |
| Methamphetamine HCl [4] | HPLC-UV | RMSE (all samples) | 1.1 mg/100 mg | Gold standard for comparison. |
| Bakuchiol [11] | HPLC-DAD | Content in Sample 4 | 3.6% | Highest content among samples. |
| Bakuchiol [11] | HPLC-DAD | Content in Sample 3 | 1.0% | Matched the product label claim. |
| Bakuchiol [11] | HPLC-DAD | Content in Sample 1 | 0.51% | Contained only 50% of declared content. |
| Bakuchiol [11] | ¹H qNMR | Result Agreement | Consistent with HPLC | NMR viable for routine QC; significantly shorter analysis time. |
The Scientist's Toolkit: Essential Reagents and Materials
Successful impurity profiling requires not only sophisticated instrumentation but also high-purity reagents and consumables. The following table details key materials essential for conducting UV-Vis and NMR experiments.
Table 3: Essential Research Reagent Solutions for Impurity Profiling
| Item | Function/Application | Technical Notes |
|---|---|---|
| Deuterated Solvents (CDCl₃, DMSO-d₆) [11] [23] | Solvent for NMR spectroscopy; provides a deuterium lock for field stability. | High purity is critical to avoid extraneous solvent signals in the ¹H NMR spectrum. |
| Internal Standard (e.g., Nicotinamide) [11] | Reference compound for quantitative NMR (qNMR). | Must be pure, stable, non-reactive, and have a well-resolved signal not overlapping with the analyte. |
| HPLC-Grade Solvents (Acetonitrile, Methanol) [11] | Mobile phase for HPLC; solvent for UV-Vis sample preparation. | Low UV cutoff and high purity are required to minimize baseline noise and interference. |
| Quartz Cuvettes [23] [24] | Sample holder for UV-Vis spectroscopy in the UV range. | Quartz is transparent down to ~190 nm; glass or plastic can be used for visible light only. |
| NMR Tubes [23] | Sample holder for NMR spectroscopy. | Must be clean, undamaged, and of consistent quality to maintain magnetic field homogeneity. |
| Certified Reference Standards [4] [10] | Used for calibration curves (UV-Vis, HPLC) and method validation. | Essential for accurate quantification and for confirming the identity of impurities. |
Strategic Selection and Regulatory Pathways
Choosing between UV-Vis and NMR, or employing them in a complementary manner, is a strategic decision based on the specific needs of the impurity profiling study. The following decision pathway outlines the key considerations for technique selection aligned with regulatory goals.
Diagram 2: Decision pathway for analytical technique selection
Alignment with ICH M7 Control Strategies
The ICH M7 guideline for mutagenic impurities presents four control options, creating opportunities to leverage different analytical approaches [22]. While Option 1 involves direct testing of the drug substance (where UV-Vis is often applied for quantification), Option 4 represents a paradigm shift. It allows for the omission of analytical testing if scientific justification—through purge factor calculations that evaluate an impurity's reactivity, solubility, and volatility throughout the synthesis process—provides sufficient confidence that the impurity will be below the acceptable limit [22]. A calculated purge factor greater than 1000 generally supports an Option 4 submission [22]. In this context, NMR is particularly valuable for Options 1 and 3, as it can provide structural confirmation of an impurity's identity and its level of purge during process development, thereby strengthening the scientific argument for less burdensome control strategies.
UV-Vis and NMR spectroscopy are both powerful yet distinct tools within the impurity profiling toolkit, each aligned with the rigorous demands of ICH guidelines. UV-Vis spectroscopy remains the workhorse for routine, high-throughput quantification of chromophores, offering simplicity, speed, and cost-effectiveness. In contrast, NMR spectroscopy provides unparalleled structural elucidation capabilities and inherent quantification, enabling simultaneous identification and measurement of multiple components, even in complex mixtures. Modern advancements, such as benchtop NMR instruments coupled with quantum mechanical modeling (QMM), are enhancing the accessibility and quantitative precision of NMR, making it a compelling complementary technique to traditional HPLC-UV methods.
The strategic choice between these techniques depends on the specific analytical question, the nature of the sample matrix, and the regulatory control strategy. For straightforward quantification, UV-Vis is often sufficient. However, for structural confirmation, profiling unknown impurities, or analyzing complex matrices where chromatographic methods fail, NMR is indispensable. Furthermore, a thorough understanding of ICH M7 options empowers scientists to potentially justify the reduction or elimination of specific impurity tests through scientific reasoning and process understanding. Ultimately, a synergistic approach, leveraging the strengths of both UV-Vis and NMR within the established regulatory framework, provides the most robust strategy for ensuring drug safety and quality.
Practical Application: Implementing UV-Vis and NMR Methods in the Lab
Ultraviolet-visible (UV-Vis) spectroscopy is an analytical technique that measures the amount of ultraviolet or visible light absorbed by a sample. The fundamental principle involves electronic transitions where molecules absorb light energy, promoting electrons from ground state to higher energy states. The technique operates within the wavelength range of 190-800 nm, making it valuable for quantifying compounds with chromophoric groups or conjugated systems [25] [26] [27].
In pharmaceutical impurity profiling, UV-Vis spectroscopy serves as a widely accessible and cost-effective tool for quantitative analysis. The technique is particularly valuable for routine concentration measurements of known impurities during method development. While other techniques like NMR provide superior structural elucidation capabilities, UV-Vis remains important for initial screening and quantification when appropriate validation demonstrates its suitability for specific impurity profiling applications [28] [10].
Fundamental Principles and Comparison with NMR
Theoretical Basis of UV-Vis Spectroscopy
UV-Vis spectroscopy relies on the Beer-Lambert Law, which states that absorbance (A) is proportional to concentration (c) according to the equation A = εbc, where ε is the molar absorptivity coefficient, b is the path length, and c is the concentration [25] [26]. The absorption occurs when the energy of incoming photons matches the energy required for electronic transitions, primarily involving π-π, n-π, σ-σ, and n-σ transitions in organic chromophores [26]. The resulting absorption spectrum provides both qualitative information based on absorption maxima (λmax) and quantitative data through absorbance values at specific wavelengths [25] [27].
Comparative Analysis: UV-Vis vs. NMR Spectroscopy
The following table outlines key differences between UV-Vis and NMR spectroscopy for impurity profiling applications:
Table 1: Fundamental Differences Between UV-Vis and NMR Spectroscopy
| Parameter | UV-Visible Spectroscopy | NMR Spectroscopy |
|---|---|---|
| Physical Basis | Electronic transitions in chromophores [1] | Nuclear spin transitions in magnetic nuclei [1] |
| Sample Form | Primarily liquids and solutions [25] | Liquids, solids, gases [26] |
| Sample Container | Quartz or glass cuvettes (typically 1 cm path length) [1] | Glass NMR tubes (typically 5 mm diameter) [1] |
| Solvent Requirements | Any solvent transparent in measured range; requires blank/reference [25] | Typically deuterated solvents (CDCl₃, DMSO-d₆) [1] |
| Speed of Analysis | Fast (seconds to minutes) [1] | Slow (minutes to hours) [1] |
| Information Obtained | Concentration, presence of chromophores [25] | Molecular structure, quantitative mixture analysis [4] |
| Detection Limit | High sensitivity for UV-absorbing compounds [27] | Generally lower sensitivity than UV-Vis [4] |
| Quantitative Approach | Calibration curves based on Beer-Lambert Law [25] | Direct proportionality between signal area and nuclei number [4] |
Decision Framework for UV-Vis vs. NMR in Impurity Profiling
Quantitative Performance Comparison
Experimental Data from Comparative Studies
Recent research directly compares the quantitative performance of UV-Vis (typically implemented as HPLC-UV) and NMR for impurity analysis. A 2025 study examining methamphetamine quantification in complex mixtures provides valuable experimental data:
Table 2: Quantitative Performance Comparison for Methamphetamine Analysis
| Analytical Technique | Quantification Method | Root Mean Square Error (RMSE) | Key Advantages | Key Limitations |
|---|---|---|---|---|
| HPLC-UV [4] | External calibration curve | 1.1 mg/100 mg sample | High precision, well-established methodology | Requires specific standards for each analyte |
| Benchtop NMR with QMM [4] | Quantum Mechanical Modeling | 1.3 mg/100 mg sample | Simultaneous identification and quantification | Reduced sensitivity vs. high-field NMR |
| Benchtop NMR with Integration [4] | Peak integration | 4.7 mg/100 mg sample | Simple data processing | Challenging with spectral overlap |
Practical Considerations for Quantitative Analysis
Several practical factors significantly impact the accuracy and reliability of UV-Vis quantitative measurements:
- Spectral Bandwidth: The range of wavelengths transmitted through the sample simultaneously affects resolution. Narrower bandwidth provides higher resolution but requires more energy and time [26].
- Stray Light: Any light reaching the detector that isn't the selected wavelength causes significant errors, especially at high absorbances (>2 AU) [26].
- Wavelength Accuracy: Measurements should be performed near absorbance peaks where the change in molar absorptivity with wavelength is minimal [26].
- Deviations from Beer-Lambert Law: At high concentrations, absorption bands saturate, leading to non-linear responses. This can be tested by varying path length while maintaining constant concentration [26].
Method Development Protocols
Wavelength Selection Methodology
Proper wavelength selection is critical for method sensitivity and specificity. The recommended protocol includes:
- Preliminary Scanning: Dissolve the analyte in appropriate solvent and scan from 200-800 nm to identify maximum absorption wavelengths (λmax) [25] [27].
- Peak Identification: Locate the wavelength with highest absorbance for maximum sensitivity. For complex mixtures, secondary wavelengths may be selected to avoid overlaps [26].
- Specificity Verification: Confirm that excipients, matrix components, or other impurities don't interfere at the selected wavelength [10].
- Buffer/Solvent Compatibility: Ensure the chosen solvent maintains transparency throughout the measurement range [25].
For impurity profiling, the optimal wavelength typically corresponds to the λmax of the target impurity, provided it differs sufficiently from the API's absorption spectrum.
Calibration Curve Development
Establishing a valid calibration curve requires careful experimental design:
- Standard Solution Preparation: Prepare at least five concentrations spanning the expected sample range using volumetric glassware for accuracy [25].
- Concentration Range: Standards should bracket the unknown concentration, typically from below expected to approximately one order of magnitude higher [25].
- Blank Measurement: Use solvent without analyte as reference to zero the instrument [25] [27].
- Absorbance Measurement: Measure all standards at the selected wavelength, ensuring absorbance values remain within the instrument's linear range (generally <1.0 AU) [27].
- Statistical Analysis: Plot absorbance versus concentration and determine the correlation coefficient (R²). Acceptable calibrations typically have R² ≥ 0.9 [25].
UV-Vis Method Development Workflow for Impurity Profiling
Solvent Selection Criteria
Solvent choice profoundly affects UV-Vis spectra through solvent-solute interactions:
- Transparency Range: The solvent must not absorb significantly at the measurement wavelength. Water and ethanol are common for visible region, while high-purity solvents are essential for UV measurements [26].
- Polarity Effects: Solvent polarity can cause shifts in absorption maxima. Polar solvents typically cause red shifts (bathochromic effect) in π-π* transitions and blue shifts (hypsochromic effect) in n-π* transitions [26].
- pH Considerations: For ionizable compounds, pH control is essential as protonation states significantly influence absorption spectra. Buffers should be transparent in the measurement region [26].
- Sample Compatibility: The solvent must fully dissolve the analyte without chemical reaction or decomposition [25].
Research Reagent Solutions
Successful UV-Vis method implementation requires specific materials and reagents:
Table 3: Essential Reagents and Materials for UV-Vis Method Development
| Reagent/Material | Specification Requirements | Function in Method Development |
|---|---|---|
| Reference Standards | Certified purity, traceable to reference materials | Calibration curve establishment, method validation |
| Solvents (HPLC Grade) | UV-transparent at measurement wavelength | Sample dissolution, blank preparation |
| Buffer Components | High purity, UV-transparent | pH control for ionizable analytes |
| Volumetric Glassware | Class A precision | Accurate standard solution preparation |
| Quartz Cuvettes | 1 cm path length, matched pairs | Sample containment with UV transparency |
| Filters (if needed) | 0.45 μm pore size, solvent-compatible | Sample clarification for suspended particles |
Applications in Impurity Profiling
Pharmaceutical Impurity Analysis
UV-Vis spectroscopy, particularly when coupled with separation techniques like HPLC, plays a crucial role in pharmaceutical impurity profiling:
- Degradation Product Monitoring: Tracking formation of impurities under stress conditions (heat, light, pH) [10].
- Conjugated System Detection: Identifying impurities with chromophoric groups, even at low concentrations [26].
- Routine Quality Control: Quantitative assessment of specified impurities in drug substances and products [10].
Regulatory guidelines (ICH Q3A, Q3B) establish thresholds for identification and qualification of impurities, making accurate quantification essential [10].
Complementary Role with NMR
While NMR provides superior structural elucidation for unknown impurities, UV-Vis offers practical advantages for routine quantification:
- High Sensitivity: For compounds with strong chromophores, UV-Vis can detect lower concentrations than benchtop NMR [4].
- Rapid Analysis: Faster sample throughput makes UV-Vis suitable for high-volume testing [1].
- Cost Effectiveness: Lower instrumentation and operational costs increase accessibility [4].
The techniques should be viewed as complementary rather than competitive, with NMR providing structural information and UV-Vis enabling sensitive quantification in well-characterized systems.
UV-Vis spectroscopy remains a fundamental tool in impurity profiling method development, offering robust quantitative capabilities for chromophore-containing compounds. Proper wavelength selection, calibration curve design, and solvent optimization are critical for developing valid methods. While NMR spectroscopy provides unparalleled structural elucidation power for unknown impurities, UV-Vis delivers superior sensitivity and cost-effectiveness for routine quantification of known impurities. The optimal analytical approach often combines both techniques, leveraging their complementary strengths to ensure comprehensive impurity characterization throughout the drug development lifecycle.
In the landscape of analytical techniques for impurity profiling and quantitative analysis, Nuclear Magnetic Resonance (NMR) spectroscopy has emerged as a powerful complement to traditional methods like UV-Vis spectroscopy and High-Performance Liquid Chromatography (HPLC). While UV-Vis remains widely used for its simplicity and cost-effectiveness, it often lacks the specificity for complex mixtures and requires complete dissolution of samples for accurate quantification, which can be problematic for emulsions or poorly soluble compounds [11]. NMR, particularly quantitative NMR (qNMR), provides unparalleled structural elucidation capabilities alongside inherent quantification, enabling simultaneous identification and quantification of multiple components in complex mixtures—a critical advantage for comprehensive impurity profiling [4]. This guide examines the key parameters in NMR method development—solvent choice, internal standards, and pulse sequences—and provides a comparative analysis with UV-Vis methodology to inform researchers' analytical strategies.
Performance Comparison: NMR Versus UV-Vis and HPLC
Quantitative Accuracy in Complex Mixtures
Table 1: Comparison of Quantitative Method Performance for Compound Analysis
| Analytical Method | Application Context | Reported Accuracy/Error | Key Advantages | Key Limitations |
|---|---|---|---|---|
| Benchtop NMR with QMM | Methamphetamine HCl in binary/ternary mixtures [4] | RMSE: 1.3-2.1 mg/100 mg | Simultaneous quantification of multiple components; minimal sample preparation | Slightly lower precision than HPLC |
| HPLC-UV | Methamphetamine HCl purity quantification [4] | RMSE: 1.1 mg/100 mg | High precision; established gold standard | Requires specific standards for each analyte |
| ( ^1H ) qNMR | Bakuchiol in cosmetic products [11] | Comparable results to HPLC; significantly shorter analysis time | Non-destructive; requires no compound-specific standards | Lower sensitivity than HPLC |
| UV-Vis | Bakuchiol in cosmetic products [11] | Unable to quantify in emulsion formulations | Rapid analysis; low-cost instrumentation | Limited to single-component analysis; requires complete dissolution |
| Low-Field qNMR (80 MHz) | Pharmaceutical products in deuterated solvents [29] | 97-103% recovery rate (SNR=300) | Cost-effective; suitable for routine analysis | Lower resolution and sensitivity than HF NMR |
| Low-Field qNMR (non-deuterated solvents) [29] | Pharmaceutical products with solvent suppression [29] | 95-105% recovery rate (SNR=300) | Reduces solvent costs; enables direct analysis | Potential signal loss near suppression regions |
Practical Considerations for Method Selection
The choice between NMR and UV-Vis depends on several factors beyond mere quantitative accuracy. NMR provides superior structural information, enabling identification of unknown impurities without prior availability of reference standards [30]. This is particularly valuable in forensic applications and when analyzing novel psychoactive substances where certified reference materials may be unavailable or prohibitively expensive [4]. Additionally, NMR's non-destructive nature allows for sample recovery after analysis, which is crucial when dealing with limited or valuable materials [11].
UV-Vis spectroscopy, while limited in structural elucidation capabilities, offers advantages in sensitivity for specific chromophores and rapid analysis time for single-component quantification [11]. However, its application becomes problematic in complex mixtures where spectral overlaps occur, or in emulsion formulations where complete extraction cannot be guaranteed [11]. HPLC-UV bridges some of these gaps but requires specific calibration standards for each analyte and extensive method development [4].
Experimental Protocols for Robust NMR Method Development
Solvent Selection and Solvent Suppression Techniques
The choice of solvent in NMR analysis significantly impacts spectral quality and quantitative accuracy. While deuterated solvents are preferred for high-field NMR to provide a lock signal and minimize solvent interference, recent advances have made the use of non-deuterated solvents with solvent suppression techniques increasingly viable, particularly for low-field applications [29].
Protocol for Solvent Suppression in Non-Deuterated Solvents [30]:
- Pulse Sequence Selection: Binomial-like sequences (e.g., W5, Robust5) generally provide the most robust and reliable solvent suppression across various field strengths. The 1D-NOESYpr sequence, while popular in metabolomics, shows greater variability in quantitative applications.
- Parameter Optimization: For presaturation sequences, carefully optimize the duration and field strength of the presaturation pulse. Typical values range from 4.5-20 seconds at an effective RF field strength of 50 Hz.
- Carrier Frequency Adjustment: Precisely set the carrier frequency on the solvent resonance, as small variations can significantly impact suppression efficiency.
- Excitation Profile Assessment: Determine how close to the suppression region signals can be accurately quantified. This is particularly crucial for protons resonating near the solvent frequency.
- Relaxation Considerations: Measure T1 relaxation times using inversion-recovery sequences adapted for non-deuterated solvents to set appropriate repetition times (>5×T1) for quantitative accuracy.
For low-field NMR (80 MHz) in non-deuterated solvents, specific suppression regions have been established: δ 7.5-7.0/1.5-1.0 ppm for chloroform, δ 5.0-4.0 ppm for water, δ 5.0-4.0/3.5-2.5 ppm for methanol, and δ 4.0-3.0/2.9-2.0 ppm for dimethyl sulfoxide [29].
Internal Standard Selection and Sample Preparation
Protocol for Internal Standard Method in qNMR [29]:
- Standard Selection Criteria: Choose internal standards with:
- High chemical purity (>99%)
- Solubility in the selected solvent
- Non-reactivity with analyte or solvent
- Well-resolved signals not overlapping with analyte peaks
- Similar relaxation times to the analyte
Commonly Used Standards:
- Maleic acid (MA) - avoid in acidic methanol solutions due to ester formation
- Benzoic acid (BA)
- Dimethyl sulfone (DMS)
- Nicotinic acid amide (NSA)
- Potassium hydrogen phthalate (KHP)
Sample Preparation:
- Weigh approximately 30-50 mg of analyte and 20-30 mg of internal standard
- Dissolve in 1-2 mL of appropriate solvent (deuterated or non-deuterated)
- For solid samples, crush tablets or separate capsule contents
- Shake for 30 minutes, use ultrasonic bath at 50°C if necessary
- Centrifuge for 15 minutes at 13,500 rpm and filter if needed
- Transfer 600 μL of clear supernatant to NMR tube
Quantification Calculation: [ \text{Analyte mass} = \frac{I{\text{analyte}} \times N{\text{IS}} \times M{\text{analyte}} \times m{\text{IS}}}{I{\text{IS}} \times N{\text{analyte}} \times M_{\text{IS}}} ] Where I = integral, N = number of protons, M = molecular weight, m = mass of internal standard.
Advanced Pulse Sequences for Quantitative Applications
Protocol for Pulse Sequence Selection and Optimization [30]:
- Basic Quantitative Experiments: For deuterated solvents, use a standard 90° 1D pulse sequence with acquisition time of 3.2-6.4 seconds and repetition time >5×T1 of the slowest relaxing signal.
- Solvent Suppression Sequences: For non-deuterated solvents:
- Evaluate binomial-like sequences (W5, Robust5) first for their robust performance
- Consider JRS (Jump-and-return Sandwiches) or WADE (Water Irradiation Devoid) pulses for high-field applications with strong radiation damping
- Test PURGE sequences as an alternative z-filtering approach
- Parameter Optimization:
- Set repetition time based on actual T1 measurements of both analyte and standard "in-matrix"
- Use sufficient acquisition time to ensure proper digitization (typically 3.2-6.4 seconds for LF NMR)
- Adjust number of scans to achieve signal-to-noise ratio >300 for high-accuracy quantification [29]
- Validation: Compare results from different pulse sequences and suppression parameters to identify optimal conditions for specific analyte-solvent combinations.
Workflow Visualization: NMR Method Development Pathway
Essential Research Reagent Solutions
Table 2: Key Reagents and Materials for NMR Method Development
| Reagent/Material | Function/Purpose | Application Notes |
|---|---|---|
| Deuterated solvents (CDCl₃, DMSO-d₆, D₂O, MeOD) | Provides lock signal; minimizes solvent interference | Essential for high-field precision qNMR; higher cost [29] |
| Non-deuterated solvents (CHCl₃, DMSO, H₂O, MeOH) | Cost-effective alternative; enables direct analysis | Requires solvent suppression; suitable for LF NMR [29] |
| Maleic acid (MA) | Internal standard for quantification | High purity; avoid in acidic methanol solutions [29] |
| Benzoic acid (BA) | Internal standard for quantification | Stable; well-characterized [29] |
| Nicotinic acid amide (NSA) | Internal standard for quantification | Suitable for aqueous and organic solutions [29] |
| Potassium hydrogen phthalate (KHP) | Internal standard for quantification | High purity; water-soluble [29] |
The development of robust NMR methods for impurity profiling requires careful consideration of solvent systems, internal standards, and pulse sequences. While UV-Vis and HPLC maintain important roles in quantitative analysis, NMR spectroscopy offers unique advantages for structural elucidation and simultaneous multi-component quantification without requirement for compound-specific standards. Recent advancements in benchtop NMR technology, coupled with improved solvent suppression techniques and quantum mechanical modeling approaches, have significantly expanded NMR's accessibility and application range. By following the optimized protocols outlined in this guide—particularly for solvent suppression in non-deuterated systems and internal standard selection—researchers can implement cost-effective NMR methods that deliver accuracy comparable to established techniques like HPLC-UV, while providing superior structural information essential for comprehensive impurity profiling in pharmaceutical development and forensic analysis.
The accurate quantification of active pharmaceutical ingredients in the presence of cutting agents and impurities represents a significant analytical challenge in forensic science and pharmaceutical development. Traditional techniques like High-Performance Liquid Chromatography with Ultraviolet detection (HPLC-UV) offer precision but face limitations including solvent dependency, requirement for specific calibration standards, and inability to simultaneously identify unknown components [4]. Within this context, Benchtop Nuclear Magnetic Resonance (NMR) spectroscopy coupled with Quantum Mechanical Modelling (QMM) has emerged as a powerful complementary technique that addresses several of these limitations while providing robust quantitative data [31] [4]. This comparison guide objectively evaluates the performance of Benchtop NMR-QMM against HPLC-UV and other NMR quantification methods, focusing on their application for analysing methamphetamine hydrochloride in complex binary and ternary mixtures—a scenario highly relevant to impurity profiling and forensic analysis [31].
The fundamental advantage of NMR spectroscopy lies in its inherent quantitative nature and ability to provide rich structural information without requiring identical reference standards for every compound [4]. However, conventional high-field NMR instruments have been limited by cost and size constraints in many laboratory settings. The development of high-resolution benchtop NMR spectrometers has addressed these accessibility issues, though their lower magnetic field strength (typically 60-MHz) presents challenges with spectral resolution and peak overlap [4]. Quantum Mechanical Modelling (QMM) approaches have emerged to overcome these limitations by utilizing key NMR parameters such as chemical shifts and coupling constants to generate ideal spectra that are fitted to experimental data, effectively modelling peak overlaps that complicate traditional integration methods [4]. This technical evolution makes benchtop NMR-QMM particularly suited for the analysis of complex mixtures where multiple components with overlapping signals must be quantified simultaneously.
Experimental Protocols & Methodologies
Sample Preparation and Instrumentation
The comparative study analyzed samples containing methamphetamine hydrochloride at purities ranging from approximately 10 to 90 mg per 100 mg of sample. These were prepared alongside pharmaceutically relevant cutting agents including methylsulfonylmethane (MSM), N-isopropylbenzylamine hydrochloride, caffeine, and phenethylamine hydrochloride, with pseudoephedrine hydrochloride included as a potential impurity [31] [4]. This approach created realistic binary and ternary mixture models for method validation.
A 60-MHz benchtop NMR spectrometer was employed for all NMR-based analyses [31]. The comparative HPLC-UV analyses were conducted using established protocols that represent the current gold standard for quantitative drug analysis in forensic laboratories [4]. For the NMR measurements, spectral data processing employed four distinct approaches to enable comprehensive method comparison: (1) traditional peak integration, (2) Global Spectral Deconvolution (GSD), (3) quantitative GSD (qGSD), and (4) the quantitative Quantum Mechanical Model (QMM) which uses quantum mechanics-total-line-shape fitting to account for spectral variations induced by factors such as pH changes or peak overlap [4].
Quantitative Assessment Metrics
Method performance was evaluated using root mean square error (RMSE) calculated for methamphetamine hydrochloride purity quantification across all sample types. This robust statistical metric provides a standardized approach to compare analytical accuracy across different technological platforms [31] [4]. The RMSE values were expressed as mg of analyte per 100 mg of sample, enabling direct comparison of measurement error across the working range of concentrations evaluated in the study.
Performance Comparison: Quantitative Data Analysis
Direct Method Comparison for Methamphetamine Quantification
Table 1: Quantitative Performance Comparison of Analytical Methods for Methamphetamine Hydrochloride Purity Determination
| Analytical Method | RMSE (mg/100 mg sample) | Spectral Processing Approach | Applicable Sample Types |
|---|---|---|---|
| Benchtop NMR with QMM | 1.3 | Quantum Mechanical Model | Binary & ternary mixtures |
| Benchtop NMR with QMM | 2.1 | Quantum Mechanical Model | Extended mixture sets |
| HPLC-UV | 1.1 | Chromatographic integration | All samples |
| Benchtop NMR with Integration | 4.7 | Peak integration | Binary & ternary mixtures |
| Benchtop NMR with GSD | Not specified | Global Spectral Deconvolution | Binary & ternary mixtures |
| Benchtop NMR with qGSD | Not specified | Quantitative GSD | Binary & ternary mixtures |
The data reveals that benchtop NMR with QMM achieved RMSE values as low as 1.3 mg/100 mg sample when determining methamphetamine hydrochloride purity across binary and ternary mixtures [31]. When applied to more extensive mixture sets, the method maintained strong performance with an RMSE of 2.1 mg/100 mg sample [31]. While HPLC-UV demonstrated marginally superior precision with an RMSE of 1.1 mg/100 mg sample across all samples [31], this advantage must be considered alongside the technique's limitations in simultaneously identifying unknown mixture components.
Comprehensive Technique Comparison
Table 2: Technical and Operational Comparison of Benchtop NMR-QMM and HPLC-UV for Mixture Analysis
| Characteristic | Benchtop NMR with QMM | HPLC-UV | Traditional NMR Integration |
|---|---|---|---|
| Quantification Accuracy (RMSE) | 1.3-2.1 mg/100 mg [31] | 1.1 mg/100 mg [31] | 4.7 mg/100 mg [31] |
| SWGDRUG Category | Category A [4] | Category B/C [4] | Category A [4] |
| Structural Identification | Simultaneous with quantification [4] | Requires separate techniques [4] | Simultaneous with quantification |
| Solvent Consumption | Reduced reliance [31] [4] | High (toxic/expensive solvents) [4] | Reduced reliance |
| Standard Requirements | Minimal (potentially none for QMM) [31] [4] | Specific standards for each analyte [4] | Requires standards |
| Spectral Overlap Challenge | Effectively managed by QMM [4] | Separated chromatographically | Problematic with low-field instruments |
| Operational Costs | Cost-effective after initial investment [31] | Recurrent costs for solvents and standards [4] | Cost-effective after initial investment |
The comparative data demonstrates that benchtop NMR with QMM significantly outperforms traditional NMR integration methods (RMSE of 1.3-2.1 versus 4.7 mg/100 mg) while approaching the quantification accuracy of HPLC-UV [31]. The operational advantages of benchtop NMR-QMM include reduced solvent consumption and minimal dependence on specific calibration standards, which is particularly valuable for analyzing novel psychoactive substances where reference standards may be unavailable or prohibitively expensive [4].
The Scientist's Toolkit: Essential Research Reagents and Materials
Table 3: Key Research Reagents and Materials for Benchtop NMR-QMM Analysis of Complex Mixtures
| Reagent/Material | Function/Application | Relevance to Method |
|---|---|---|
| Methamphetamine hydrochloride | Primary analyte of interest | Target quantification compound for method validation [31] [4] |
| Methylsulfonylmethane (MSM) | Cutting agent representative | Common diluent in illicit drug mixtures [4] |
| N-isopropylbenzylamine hydrochloride | Cutting agent representative | Adulterant frequently encountered in forensic samples [4] |
| Caffeine | Cutting agent representative | Common stimulant used in drug mixtures [31] [4] |
| Phenethylamine hydrochloride | Cutting agent representative | Precursor or adulterant in amphetamine-type mixtures [4] |
| Pseudoephedrine hydrochloride | Impurity representative | Common precursor with pharmacological activity [31] [4] |
| Deuterated solvent | NMR solvent | Provides field frequency lock for NMR measurements |
| Q2NMR software | Spectral processing platform | Implements QMM for quantitative analysis [4] |
| Mnova software | Spectral analysis suite | Provides GSD and qGSD processing capabilities [4] |
| 60-MHz Benchtop NMR Spectrometer | Primary analytical instrument | Compact, cost-effective alternative to high-field NMR [31] [4] |
This collection of reagents and materials represents the essential components for implementing benchtop NMR-QMM methodology in forensic and pharmaceutical laboratory settings. The selection of cutting agents and impurities reflects commonly encountered substances in real-world drug mixtures, particularly relevant to the New Zealand context of illicit drug profiling where this study was conducted [4].
Visualizing Workflows and Technical Relationships
Benchtop NMR-QMM Analytical Workflow
Analytical Workflow Comparison - This diagram illustrates the comprehensive workflow for analysing complex mixtures using benchtop NMR with multiple spectral processing approaches, culminating in performance comparison against the HPLC-UV reference method.
Technique Selection Decision Pathway
Technique Selection Guide - This decision pathway guides analysts in selecting the most appropriate analytical technique based on their specific identification and quantification needs, resource constraints, and available standards.
Discussion and Implications for Impurity Profiling
The experimental data demonstrates that benchtop NMR with Quantum Mechanical Modelling represents a viable alternative to HPLC-UV for the quantification of methamphetamine in complex mixtures, with RMSE values of 1.3-2.1 mg/100 mg sample compared to 1.1 mg/100 mg sample for HPLC-UV [31]. While HPLC-UV maintains a slight advantage in quantitative precision, benchtop NMR-QMM offers the significant benefit of simultaneous identification and quantification of multiple mixture components without requiring reference standards for every compound [4]. This capability is particularly valuable in impurity profiling research where unknown components may be present in samples.
From the perspective of UV-Vis versus NMR comparison for impurity profiling research, each technique offers distinct advantages. HPLC-UV provides exceptional sensitivity for targeted quantification but limited structural information for unknown impurities [4]. In contrast, benchtop NMR-QMM offers comprehensive structural elucidation capabilities while providing adequate quantification accuracy for most forensic and pharmaceutical applications [31] [4]. The reduced reliance on solvents and specific calibration standards with benchtop NMR-QMM also presents significant economic and environmental advantages for high-volume testing laboratories [31].
The implementation of benchtop NMR-QMM is particularly impactful for harm-reduction drug-checking services and forensic laboratories where rapid, comprehensive analysis of complex mixtures is essential [31] [4]. The methodology's ability to simultaneously quantify active substances, cutting agents, and impurities with a single analysis provides a powerful tool for understanding drug composition and potential health risks associated with adulterated products. Furthermore, as benchtop NMR technology continues to evolve with improvements in magnetic field strength and sensitivity, the performance gap with HPLC-UV for quantification purposes is likely to narrow further, potentially establishing benchtop NMR-QMM as a primary rather than complementary technique for complex mixture analysis.
The quantitative analysis of illicit drugs, such as methamphetamine hydrochloride (MA), and their cutting agents is a critical task in forensic chemistry and public health. Accurate quantification is essential for legal proceedings, understanding pharmacological impact, and guiding harm-reduction strategies. High-performance liquid chromatography with ultraviolet detection (HPLC-UV) is traditionally considered the gold standard for quantification. However, the emergence of benchtop Nuclear Magnetic Resonance (NMR) spectroscopy presents a compelling alternative. This case study, framed within broader research comparing UV-Vis and NMR for impurity profiling, objectively compares the performance of benchtop NMR and HPLC-UV for the quantification of methamphetamine hydrochloride in complex mixtures, providing detailed experimental data and protocols [31] [4] [32].
Experimental Comparison: Benchtop NMR vs. HPLC-UV
A direct comparative study was conducted to evaluate the performance of a 60-MHz benchtop NMR spectrometer against HPLC-UV for quantifying methamphetamine hydrochloride in binary and ternary mixtures with common cutting agents and impurities [31] [4].
Experimental Materials and Sample Preparation
- Analyte and Mixtures: The study focused on methamphetamine hydrochloride (MA) at purities ranging from approximately 10 to 90 mg per 100 mg of sample. MA was mixed with cutting agents, including methylsulfonylmethane (MSM), N-isopropylbenzylamine hydrochloride, caffeine, and phenethylamine hydrochloride, as well as an impurity, pseudoephedrine hydrochloride, to create binary and ternary mixtures [31] [4].
- Sample Preparation for NMR: Samples were prepared for benchtop NMR analysis without the need for deuterated solvents, as some modern benchtop systems do not require a deuterium lock [33] [34]. This simplifies preparation and reduces cost.
- Sample Preparation for HPLC-UV: This method typically requires extensive sample preparation, including dissolution and filtration, and relies on large volumes of toxic and expensive organic solvents, such as acetonitrile [4] [32].
Instrumentation and Analytical Protocols
- Benchtop NMR Protocol:
- Instrument: 60-MHz benchtop NMR spectrometer [31] [4].
- Quantification Methods: Spectral data were processed using four distinct methods to overcome the challenge of spectral overlap at lower magnetic fields:
- Integration: Traditional method of integrating peak areas [31].
- Global Spectral Deconvolution (GSD): A technique to separate overlapping peaks [31].
- Quantitative GSD (qGSD): An enhancement of GSD for quantitative analysis [31].
- Quantitative Quantum Mechanical Model (QMM): A sophisticated algorithm that models the complete spectral profile of each molecule based on its fundamental NMR parameters (chemical shifts, coupling constants) and fits these models to the experimental data for quantification [31] [4] [35].
- HPLC-UV Protocol:
- Instrument: Standard HPLC system coupled with a UV detector [31].
- Quantification Method: This technique relies on separating mixture components via chromatography and quantifying them based on UV absorption. It requires calibration with specific certified reference standards for each analyte [4] [32].
Performance Data and Results
The quantitative accuracy of each method was assessed using the Root Mean Square Error (RMSE) in mg of analyte per 100 mg of sample.
The table below summarizes the performance of benchtop NMR techniques and HPLC-UV for quantifying methamphetamine hydrochloride purity [31] [4]:
| Analytical Technique | Data Processing Method | Root Mean Square Error (RMSE) |
|---|---|---|
| Benchtop NMR | Spectral Integration | 4.7 mg |
| Benchtop NMR | Global Spectral Deconvolution (GSD) | Data not specified |
| Benchtop NMR | Quantitative GSD (qGSD) | Data not specified |
| Benchtop NMR | Quantum Mechanical Model (QMM) | 1.3 mg |
| Benchtop NMR (all samples) | Quantum Mechanical Model (QMM) | 2.1 mg |
| HPLC-UV (all samples) | External Calibration | 1.1 mg |
Discussion: Strengths and Limitations in Context
The experimental data reveals a nuanced comparison between the two techniques, highlighting their respective roles in impurity profiling.
- Accuracy and Precision: HPLC-UV demonstrated marginally higher precision (RMSE of 1.1) compared to the best benchtop NMR method (RMSE of 2.1 for all samples) [31]. This confirms its status as a highly precise quantitative tool. However, benchtop NMR with QMM achieved a level of accuracy that is a robust and sufficient for many forensic and harm-reduction applications [32].
- Simultaneous Identification and Quantification: A key advantage of benchtop NMR is its ability to simultaneously identify and quantify all components in a mixture in a single, non-destructive measurement. As a SWGDRUG Category A technique, NMR provides structural information that is definitive for identification [4] [34]. HPLC-UV, a combination of Category B and C techniques, is not considered definitive for identification and cannot easily identify unknown components [4] [32].
- Operational and Economic Considerations: Benchtop NMR offers significant operational benefits. It requires minimal sample preparation, uses water as a solvent instead of toxic organic solvents, and does not require a reference standard for every compound [32]. The Quantitative Quantum Mechanical Model (QMM) is particularly advantageous as it enables accurate quantification without needing calibration curves for known substances, which is a strict requirement for HPLC-UV [4] [35].
The following workflow contrasts the operational steps and outputs of the two techniques:
The Scientist's Toolkit: Essential Research Reagents and Materials
The following table details key materials and software solutions essential for conducting this type of analysis, based on the cited experiments.
| Item | Function in the Experiment |
|---|---|
| 60-MHz Benchtop NMR | Compact, low-maintenance instrument for acquiring quantitative spectral data from drug mixtures [31] [34]. |
| QMM Software (e.g., Q2NMR) | Advanced software that uses quantum mechanical models to deconvolve overlapping NMR signals for accurate quantification [31] [4] [35]. |
| Methylsulfonylmethane (MSM) | A common, pharmacologically inactive cutting agent used to bulk up illicit drug samples [31] [4]. |
| N-isopropylbenzylamine | A cutting agent that mimics the physical properties of methamphetamine [4] [36]. |
| Maleic Acid / Dimethyl Sulfone | High-purity internal standards used for quantitative NMR to determine absolute concentrations [37] [34]. |
| HPLC-UV System | The traditional gold-standard instrument for quantifying analyte concentration with high precision [31] [4]. |
This case study demonstrates that benchtop NMR spectroscopy, particularly when enhanced with a Quantum Mechanical Model, is a viable and powerful alternative to HPLC-UV for quantifying methamphetamine hydrochloride and cutting agents. While HPLC-UV retains a slight edge in pure precision, benchtop NMR with QMM offers a unique combination of sufficient quantitative accuracy, definitive qualitative identification, and simultaneous multi-component analysis in a cost-effective and operationally simpler platform [31] [4] [32]. For impurity profiling research, benchtop NMR fulfills a crucial need for a technique that bridges the gap between qualitative screening and quantitative gold-standard methods, enabling comprehensive drug characterization that is accessible to a wider range of forensic and public health laboratories.
In the pharmaceutical industry, impurity profiling is a critical component of drug development and quality control, ensuring patient safety and drug efficacy. While techniques like UV-Visible (UV-Vis) spectroscopy and Nuclear Magnetic Resonance (NMR) spectroscopy are well-established for this purpose, advanced approaches combining vibrational spectroscopy with multivariate analysis are emerging as powerful alternatives [10] [23]. This case study explores the specific application of Fourier-Transform Infrared (FTIR) spectroscopy coupled with chemometrics for quantifying isotopic impurities in deuterated pharmaceutical reagents—a task that presents significant challenges for traditional analytical methods.
Deuterated drug molecules, such as deutetrabenazine (Austedo), have gained prominence due to their ability to alter pharmacokinetic and pharmacodynamic profiles via the deuterium kinetic isotope effect, which strengthens chemical bonds and potentially extends bioavailability [38] [39]. Controlling isotopic purity is essential since isotopic impurities can compromise the metabolic stability advantages of deuterated drugs. This analysis focuses on the quantification of d0-, d1-, and d2-methylamine hydrochloride isotopic impurities in d3-methylamine hydrochloride, a reagent used in deuterated pool synthesis [38].
Analytical Challenge: Isotopic Impurity Profiling
The Problem with Traditional Techniques
Isotopic impurities are difficult to analyze using traditional chromatographic or spectroscopic methods because they possess nearly identical physicochemical properties to their deuterated counterparts, differing only slightly in molecular mass [38]. Although LC-MS (Liquid Chromatography-Mass Spectrometry) and GC-MS (Gas Chromatography-Mass Spectrometry) offer high sensitivity, they present challenges for low molecular weight, polar, non-chromophore compounds like methylamine hydrochloride, where chromatographic method development can be complex [38] [10]. Furthermore, while NMR spectroscopy provides exceptional structural elucidation capabilities and can detect impurities at levels as low as 0.01% on high-field instruments (400 MHz or above) [15], it requires significant instrumentation resources and expertise.
FTIR with Chemometrics as a Strategic Alternative
FTIR spectroscopy offers a complementary approach by exploiting vibrational frequency differences between C–H and C–D bonds, which absorb at distinct infrared wavelengths due to mass differences between hydrogen and deuterium atoms [38]. When combined with chemometrics—the mathematical extraction of chemical information from measured data—FTIR transforms from a primarily qualitative technique into a powerful quantitative tool capable of meeting rigorous pharmaceutical quality control standards [40].
Table 1: Key Techniques for Isotopic Impurity Analysis
| Technique | Mechanism | Advantages | Limitations for Isotopic Impurities |
|---|---|---|---|
| FTIR + Chemometrics | Vibrational frequency shifts (C–H vs. C–D) | Non-destructive, simple sample prep, fast analysis, cost-effective | Requires model development/validation, limited to vibrational-active bonds |
| LC-MS / GC-MS | Mass-to-charge ratio separation/detection | High sensitivity, wide applicability | Method development challenging for polar compounds, destructive analysis |
| NMR Spectroscopy | Magnetic properties of atomic nuclei | Definitive structural elucidation, non-destructive, quantitative | Lower sensitivity than MS, requires deuterated solvents, high instrument cost |
Experimental Protocol: FTIR-Chemometrics Workflow
Materials and Calibration Standards
The development of a validated FTIR-chemometric method for isotopic impurity analysis requires carefully prepared calibration samples [38]:
- Analytes: d3-methylamine hydrochloride (CD₃NH₂·HCl) as the primary material with d0-, d1-, and d2-methylamine hydrochloride as isotopic impurities.
- Calibration Set Preparation: 21 calibration samples were created with known concentrations of all three isotopic impurities (d0, d1, d2) spanning the expected specification range, thoroughly mixed to ensure homogeneity.
- Reference Method: LC-MS analysis provided reference concentration values for chemometric modeling, serving as the primary validation data.
Instrumentation and Spectral Acquisition
- FTIR Spectrometer: Standard research-grade FTIR instrument equipped with a deuterated triglycine sulfate (DTGS) detector.
- Spectral Collection Parameters: 32 co-added scans per spectrum at 4 cm⁻¹ resolution across the 4000–400 cm⁻¹ range.
- Sample Presentation: Samples were prepared as potassium bromide (KBr) disks to ensure consistent pathlength and minimal scattering effects [38] [23].
Critical Chemometric Modeling Steps
The transformation of raw spectral data into a quantitative model involves several crucial steps:
- Spectral Region Selection: Initial analysis identified the region from 1010 to 968 cm⁻¹ as most predictive, corresponding to the C–N symmetrical stretch vibration where isotopic impurities show distinct spectral differences [38].
- Data Preprocessing: Multiple preprocessing techniques were evaluated, including:
- Mean Centering: Adjusts the baseline by subtracting the average spectrum.
- Standard Normal Variate (SNV): Corrects for scatter effects and pathlength variations.
- Derivative Processing: First and second derivatives were tested to resolve overlapping peaks and enhance spectral features.
- Partial Least Squares (PLS) Regression: The core chemometric algorithm that builds a model relating spectral variations (X-matrix) to impurity concentrations (Y-matrix) provided by LC-MS reference data. PLS is particularly effective for handling collinear spectral data [38] [40].
- Model Validation: The final model was rigorously validated according to ICH Q2(R1) guidelines, assessing specificity, linearity, accuracy, precision, and robustness [38].
Figure 1: Experimental workflow for FTIR-chemometric analysis of isotopic impurities
Results and Discussion
Quantitative Performance and Validation
The validated PLS model demonstrated strong performance characteristics for quantifying all three isotopic impurities in d3-methylamine hydrochloride [38] [39]:
Table 2: Validation Parameters of the FTIR-Chemometrics Model
| Validation Parameter | d0-Impurity | d1-Impurity | d2-Impurity |
|---|---|---|---|
| Linear Range (wt%) | 0–5.0% | 0–5.0% | 0–5.0% |
| Limit of Quantitation (wt%) | 0.31% | 0.31% | 0.34% |
| Accuracy (% Recovery) | 98–102% | 98–102% | 98–102% |
| Precision (% RSD) | <2.0% | <2.0% | <2.0% |
The model achieved excellent accuracy with recovery rates between 98–102% across all impurity types, demonstrating its suitability for quality control applications. The limits of quantification (0.31–0.34 wt%) were sufficient for monitoring isotopic impurities at pharmaceutically relevant levels [38].
Comparative Method Performance
When evaluated against established techniques for impurity analysis, the FTIR-chemometrics approach demonstrates distinct advantages for this specific application:
Table 3: Technique Comparison for Isotopic Impurity Analysis
| Performance Metric | FTIR + Chemometrics | LC-MS | qNMR |
|---|---|---|---|
| Analysis Time | ~5 minutes/sample | 15–30 minutes/sample | 10–30 minutes/sample |
| Sample Preparation | Moderate (KBr disks) | Complex (derivatization possible) | Moderate (deuterated solvent) |
| Destructive to Sample | No | Yes | No |
| Equipment Cost | Moderate | High | High |
| Sensitivity | 0.31–0.34% LOQ | 0.01–0.1% LOQ | 0.01% LOD [15] |
| Specificity | High (with chemometrics) | High | Very High |
Advantages and Limitations
Key Advantages:
- Rapid Analysis: FTIR measurements require only minutes per sample after model development, enabling high-throughput quality control [38].
- Non-destructive: Samples remain intact after analysis and can be recovered for additional testing if needed [23].
- Cost-Effective: Utilizes instrumentation typically available in most pharmaceutical QC laboratories, avoiding the need for highly specialized equipment [38].
- Green Chemistry: Minimal solvent consumption compared to chromatographic methods.
Inherent Limitations:
- Model Dependency: Requires careful model development and validation; not suitable for one-off analyses.
- Sensitivity Constraints: While sufficient for many pharmaceutical applications, the LOQ of ~0.3% may not meet needs for ultra-trace analysis where NMR or MS can detect impurities at 0.01% or lower [15].
- Spectral Interpretation Complexity: Chemometric models function as "black boxes" without expert interpretation, potentially limiting mechanistic insights compared to NMR [41] [23].
The Scientist's Toolkit: Essential Research Reagents and Materials
Successful implementation of FTIR-chemometric methods requires specific materials and computational resources:
Table 4: Essential Research Reagents and Materials
| Item | Function/Purpose | Critical Specifications |
|---|---|---|
| d3-Methylamine HCl | Primary deuterated reagent for analysis | High isotopic purity (≥96%), structural confirmation |
| Isotopic Impurity Standards | (d0-, d1-, d2-methylamine HCl) | Certified reference materials for calibration |
| Potassium Bromide (KBr) | FTIR sample matrix | FTIR-grade purity, low water content |
| Deuterated Solvents | (e.g., D₂O, CDCl₃) | For NMR confirmation testing [15] [23] |
| Chemometrics Software | Data processing and modeling | PLS algorithm capability, spectral processing tools |
This case study demonstrates that FTIR spectroscopy combined with chemometrics represents a viable, complementary technique to UV-Vis and NMR for specific impurity profiling applications in pharmaceutical development. While NMR remains unparalleled for definitive structural elucidation at trace levels (~0.01% LOD) [15], and LC-MS offers superior sensitivity for general impurity monitoring, the FTIR-chemometrics approach provides an excellent balance of speed, cost-effectiveness, and adequate sensitivity for quantifying isotopic impurities in deuterated reagents at the 0.3% level.
The successful implementation of this methodology for analyzing d3-methylamine hydrochloride illustrates how traditional spectroscopic techniques can be enhanced through multivariate analysis to solve modern pharmaceutical challenges. As deuterated drugs continue to emerge as important therapeutic options, such hybrid analytical approaches will play an increasingly valuable role in ensuring drug quality and patient safety. Future developments in artificial intelligence and machine learning are expected to further enhance the capabilities and applications of chemometric methods in spectroscopic impurity analysis [40].
Overcoming Challenges: Optimization and Troubleshooting for Accurate Results
Ultraviolet-Visible (UV-Vis) spectroscopy has long been a cornerstone technique in pharmaceutical analysis due to its simplicity, cost-effectiveness, and straightforward quantitative capabilities based on the Beer-Lambert law [27] [26]. The technique measures the absorption of discrete wavelengths of UV or visible light by a sample, with the absorbed energy promoting electrons to higher energy states [27]. For organic chromophores, this typically involves π-π, n-π, σ-σ, and n-σ transitions [26]. However, despite its widespread use, UV-Vis spectroscopy faces two fundamental limitations in pharmaceutical impurity profiling: its dependence on chromophores and significant solvent interference.
These limitations become particularly problematic in impurity profiling, where regulatory guidelines such as ICH Q3A recommend reporting thresholds for regular impurities at levels of 0.05% or 0.03% (w/w) depending on the maximum daily intake [15]. This article examines how Nuclear Magnetic Resonance (NMR) spectroscopy addresses these UV-Vis limitations while providing supporting experimental data and methodological comparisons to guide researchers in selecting appropriate techniques for impurity analysis.
Technical Comparison: UV-Vis Versus NMR for Impurity Analysis
Table 1: Fundamental Characteristics of UV-Vis and NMR Spectroscopy for Impurity Profiling
| Characteristic | UV-Vis Spectroscopy | NMR Spectroscopy |
|---|---|---|
| Chromophore Requirement | Mandatory; requires UV-active functional groups | None; detects all nuclei with net spin (e.g., 1H, 13C, 19F, 31P) |
| Solvent Interference | Significant; solvents must be transparent in measurement region | Manageable; solvent signals can be suppressed techniques |
| Structural Information | Limited to chromophore identification | Comprehensive atomic connectivity, stereochemistry, conformation |
| Quantitation Basis | Beer-Lambert law (A = εcL) | Direct signal proportionality to nucleus number |
| Detection Sensitivity | High for chromophores (μM range) | Lower than MS but sufficient for ICH limits (0.01% LOD demonstrated) |
| Sample Preparation | Critical solvent selection; path length optimization | Minimal; mostly dependent on dissolution |
| Regulatory Compliance | Well-established but limited by technique constraints | Meets ICH requirements with proper validation [15] |
Experimental Evidence: Quantitative Performance Comparison
Detection Sensitivity and ICH Compliance
A critical investigation designed to verify the suitability of ¹H NMR spectroscopy for impurity detection established that high-field NMR (400 MHz) can achieve a limit of detection (LOD) of 0.01% for impurities when analyzing choline and its known impurity O-(2-hydroxyethyl)choline [15]. This demonstrates that NMR sensitivity easily fulfills ICH reporting thresholds, contrary to widespread beliefs about NMR's insufficient sensitivity for pharmaceutical impurity analysis [15]. The study emphasized that solvent choice is a critical parameter for achieving optimal LOD in NMR, similar to UV-Vis constraints but for different reasons.
For UV-Vis, the fundamental requirement for chromophores creates an inherent detection gap for compounds lacking conjugated systems or appropriate functional groups. Furthermore, solvent interference poses a significant constraint in UV-Vis, as the solvent must be transparent in the spectral region of interest, with plastic and glass cuvettes absorbing significantly in the UV range [27]. Quartz cuvettes are required for UV examination, adding to analysis costs.
Structural Elucidation Capabilities
The structural information provided by both techniques differs dramatically. UV-Vis primarily identifies the presence of chromophores through absorption maxima (λmax) but offers limited molecular structure information [27] [26]. In contrast, NMR provides comprehensive structural data including atomic connectivity, spatial geometry, conformation, and stereochemistry through parameters such as chemical shifts, signal multiplicity, and spin-spin coupling constants [42] [43].
This structural elucidation power makes NMR particularly valuable for "de novo" structural determination of unknown impurities, especially when coupled with two-dimensional techniques (COSY, NOESY, HSQC, HMBC) that provide through-bond and through-space connectivity information [43]. While mass spectrometry can provide molecular weights and fragmentation patterns, it often cannot distinguish between isomers—a limitation where NMR excels [43].
Table 2: Methodological Comparison for Impurity Identification Experiments
| Experimental Parameter | UV-Vis Protocol | NMR Protocol |
|---|---|---|
| Sample Preparation | Dissolution in spectrally transparent solvent; concentration adjustment to maintain 0.1-1.0 AU range | Dissolution in deuterated solvent; addition of TMS reference standard |
| Instrument Calibration | Wavelength accuracy verification using holmium oxide filter; stray light assessment | Magnetic field shimming; pulse width calibration |
| Data Acquisition | Full spectrum scan (200-800 nm); slit width optimization for resolution | Single or multi-pulse sequences; solvent suppression where needed |
| Quantitation Method | Standard curve using Beer-Lambert law; verification of linearity | Direct integration of resolved signals; internal standard reference |
| Identification Approach | λmax comparison with standards; Woodward-Fieser rules for conjugated systems | Chemical shift, coupling patterns, 2D correlation experiments |
| Validation Requirements | Linearity, accuracy, precision, LOD/LOQ, specificity | Signal-to-noise ratio, resolution, quantitative precision |
Methodological Workflows for Impurity Profiling
The fundamental differences between UV-Vis and NMR spectroscopy necessitate distinct experimental approaches to impurity profiling. The following workflow diagrams illustrate the typical processes for each technique, highlighting critical decision points where their limitations and strengths become apparent.
The workflow visualization clearly demonstrates NMR's superior capabilities for structural elucidation, while also showing UV-Vis's dependency on chromophores and solvent transparency. In practice, these techniques are often used complementarily, with UV-Vis providing rapid screening and quantitation for chromophore-containing impurities, while NMR delivers definitive structural characterization.
Advanced NMR Applications in Impurity Profiling
Hyphenated Techniques and Quantitative Applications
The combination of separation techniques with NMR has significantly enhanced its utility in impurity profiling. LC-NMR and related hyphenated systems enable the separation of complex mixtures followed by structural characterization of individual components, overcoming potential signal overlap challenges [42]. This approach is particularly valuable for complex impurity products (CIPs) that may form interlinked molecular networks or unknown compounds through multi-step reactions during synthesis or degradation [28].
For quantitative applications, quantitative NMR (qNMR) leverages the direct proportionality between signal intensity and the number of nuclei, enabling impurity quantification without reference standards [43]. This "standard-free" quantitation capability is particularly valuable during early drug development when impurity standards are unavailable [43]. The linear relationship between integrated intensities and molar contents forms the basis of qNMR applications, with ¹H qNMR (qHNMR) benefiting from the nearly equal response of protons regardless of their chemical environment [43].
Research Reagent Solutions for NMR Impurity Profiling
Table 3: Essential Research Materials for NMR-Based Impurity Profiling
| Reagent/Material | Function in Analysis | Technical Considerations |
|---|---|---|
| Deuterated Solvents (D₂O, CDCl₃, DMSO-d₆) | NMR-invisible signal; provides locking signal | Choice affects solubility and chemical shifts; must be >99.9% deuterated |
| Internal Standards (TMS, DSS) | Chemical shift reference (0 ppm) | Must be inert and soluble; provides consistent reference point |
| Quantitative Standards (maleic acid, DMSO) | qNMR concentration reference | High purity certified standards from NIST for SI traceability |
| Cryoprobes | Sensitivity enhancement | Reduces thermal noise; requires liquid helium cooling |
| Shigemi Tubes | Sample volume optimization for limited samples | Matched magnetic susceptibility to solvent; ideal for <500 μL samples |
| Solvent Suppression Systems (WET, PRESAT) | Reduces dominant solvent signals | Enables detection of solute signals near solvent resonance |
Regulatory Compliance and Analytical Quality Control
Regulatory frameworks for impurity control continue to evolve, with ICH guidelines Q3A, Q3B, and Q3D defining thresholds for identification, qualification, and reporting of impurities [28] [44]. The pharmaceutical industry must identify and control all impurities above reporting thresholds (typically 0.05-0.15% depending on daily dose) to ensure product safety and efficacy [15] [43].
While UV-Vis remains valuable for specific applications where chromophores are present and solvent interference is manageable, NMR spectroscopy provides orthogonal verification and more comprehensive structural data required for regulatory submissions. Recent advancements in NMR instrumentation, including cryogenic probes, higher field magnets, and microcoil technology, have significantly improved sensitivity—traditionally considered NMR's primary limitation [43].
Regulatory perspectives increasingly recognize NMR's value, with pharmacopeias incorporating NMR methods into quality control monographs [43]. The technique's ability to provide global information about samples in a single analysis, combined with multiple calibration options and minimal method development requirements, positions NMR as a powerful complementary technique to chromatographic and mass spectrometric methods in modern pharmaceutical analysis [43].
UV-Vis spectroscopy faces fundamental limitations in impurity profiling due to its dependence on chromophores and vulnerability to solvent interference. While it remains valuable for quantitative analysis of UV-active compounds, these constraints restrict its application for comprehensive impurity characterization. NMR spectroscopy effectively addresses these limitations through its universal detection capability for NMR-active nuclei, minimal solvent restrictions, and unparalleled structural elucidation power.
Experimental evidence demonstrates that modern high-field NMR instruments can achieve detection limits of 0.01%—surpassing ICH reporting thresholds—while providing complete structural characterization of impurities without prior separation [15]. The complementary use of both techniques, often in conjunction with separation methods and mass spectrometry, provides pharmaceutical researchers with a comprehensive analytical toolkit for impurity profiling that ensures drug safety, efficacy, and regulatory compliance.
For researchers and scientists in drug development, impurity profiling is a critical component of ensuring pharmaceutical safety and efficacy. The International Council for Harmonisation (ICH) guidelines set stringent reporting thresholds for impurities, often as low as 0.03% to 0.05% for drug substances, demanding highly sensitive analytical techniques [45]. While traditional methods like HPLC-UV are widely used, Nuclear Magnetic Resonance (NMR) spectroscopy offers a powerful alternative for structural elucidation and quantification. However, the application of NMR, particularly in impurity analysis, is often challenged by perceived sensitivity limitations. This guide objectively compares NMR and UV-based methods, focusing on how field strength and sample concentration impact the critical Limit of Detection (LOD) to help professionals select the optimal technique for their impurity profiling research.
NMR vs. UV-Vis for Impurity Profiling: A Technical Comparison
The choice between NMR and UV-based methods involves a trade-off between sensitivity, structural information, and operational convenience. The table below summarizes their core characteristics.
| Feature | NMR Spectroscopy | HPLC-UV |
|---|---|---|
| Fundamental Principle | Exploits magnetic properties of nuclei in an external magnetic field; detects transitions between nuclear spin states [46]. | Measures absorption of ultraviolet or visible light by analyte molecules. |
| Primary Role in Impurity Profiling | Identification, structural elucidation, and quantification of impurities [10] [4]. | Separation and quantification of impurities [10]. |
| Key Strength | Provides rich structural information; inherently quantitative without need for identical calibration standards for every analyte [4]. | High sensitivity and precision for quantifying target analytes at low concentrations [4]. |
| Key Limiting Factor | Relatively lower sensitivity compared to UV; requires higher sample amounts [45]. | Relies on chromophores (light-absorbing groups); requires specific standards for each analyte and frequent recalibration [4]. |
| Impact of Field Strength (NMR) | Critical. LOD improves significantly with higher magnetic field strength. For example, a 400 MHz instrument detected an impurity at 0.01%, while a 60 MHz benchtop system's LOD was 2% [45]. | Not Applicable. |
| Quantitative Performance (RMSE) | Benchtop NMR with Quantum Mechanical Modelling (QMM) achieved an RMSE of 2.1 mg/100 mg for methamphetamine quantification [4]. | HPLC-UV demonstrated high precision with an RMSE of 1.1 mg/100 mg for the same analyte [4]. |
| Regulatory Standing | Category A technique (SWGDRUG) for identification [4]. | Combination of Category B (HPLC) and C (UV) techniques [4]. |
Experimental Protocols: Probing the Limits of Detection
Protocol: Determining LOD for a Choline Impurity via ¹H NMR
This methodology, derived from a study on choline chloride, outlines the steps for determining the Limit of Detection (LOD) of a known impurity using high-field NMR [45].
- Objective: To establish the lowest detectable level of O-(2-hydroxyethoxyethyl)trimethylammonium (Impurity 2) in the presence of choline (Compound 1).
- Sample Preparation:
- Accurately weigh choline chloride (1) and the impurity standard (2) to five decimal places.
- Prepare sample mixtures in controlled ratios, dissolving them in 0.5 mL of an appropriate deuterated solvent (e.g., DMSO-d6 or D2O).
- For D2O, include an internal reference standard like DSS-d6, referenced to 0.0000 ppm, to ensure accurate chemical shift calibration [45].
- Instrumentation: Acquire ¹H NMR spectra on a high-field spectrometer (e.g., 400 MHz). For comparison, spectra can also be acquired on a low-field benchtop instrument (e.g., 60 MHz) [45].
- Data Acquisition: The LOD is determined as the lowest concentration at which the impurity's signal is reliably observable, typically defined by a signal-to-noise (S/N) ratio of 3:1 [45].
- Key Findings: This experiment demonstrated that a 400 MHz NMR spectrometer could achieve an LOD of 0.01% for the impurity, whereas a 60 MHz benchtop NMR spectrometer had an LOD of 2% [45]. The study also highlighted that the choice of solvent is a critical parameter for optimizing LOD [45].
Protocol: Quantitative Analysis of Methamphetamine via Benchtop NMR and HPLC-UV
This protocol compares the quantitative performance of benchtop NMR and HPLC-UV for a forensic application, showcasing advanced data processing to overcome sensitivity limitations [4].
- Objective: To quantify methamphetamine hydrochloride (MA) purity in binary and ternary mixtures containing cutting agents and impurities.
- Sample Preparation: Prepare mixtures of MA with substances like methylsulfonylmethane (MSM) and pseudoephedrine hydrochloride, with purities ranging from ~10 to 90 mg per 100 mg of sample [4].
- Instrumentation & Analysis:
- Data Processing & Quantification:
- Quantification accuracy is assessed using the Root Mean Square Error (RMSE) across all samples.
- For NMR, the QMM approach, which uses known NMR parameters to generate and fit ideal spectra, yielded the best results [4].
- Key Findings: The RMSE for MA purity using benchtop NMR with QMM was 2.1 mg/100 mg, which was comparable, though slightly less precise, than the 1.1 mg/100 mg achieved by HPLC-UV [4]. This demonstrates that benchtop NMR, when paired with advanced modeling, is a viable quantitative tool.
Visualizing Method Selection and Workflow
The following diagrams outline the logical decision pathway for method selection and the standard workflow for an NMR-based impurity detection experiment.
Diagram 1: Analytical Method Selection for Impurity Profiling
Diagram 2: NMR Impurity Detection Workflow
The Scientist's Toolkit: Essential Reagent Solutions
The table below details key reagents and materials essential for conducting sensitive NMR-based impurity analyses, as referenced in the experimental protocols.
| Item | Function & Importance |
|---|---|
| Deuterated Solvents (D2O, DMSO-d6) | Provides the locking signal for the NMR spectrometer and allows for the analysis of samples in a solution state without interfering proton signals [45]. |
| Internal Reference Standard (e.g., DSS-d6) | Added to the sample to provide a precise reference point (0.000 ppm) for chemical shift calibration, which is crucial for accurate peak assignment and quantification, especially in solvents like D2O [45]. |
| High-Precision Balance | Essential for accurately weighing milligram quantities of the active pharmaceutical ingredient (API) and impurity standards to five decimal places, ensuring the preparation of samples with exact and known concentrations [45]. |
| Quantum Mechanical Model (QMM) Software | Advanced processing tool that uses known NMR parameters (chemical shifts, coupling constants) to generate ideal spectra. It fits these to experimental data, enabling accurate quantification even in complex, overlapping spectra from benchtop NMR systems [4]. |
| Cryoprobe (High-Field NMR) | A specialized probe that cools the detection electronics to reduce thermal noise, significantly boosting the signal-to-noise ratio (S/N) and thereby improving sensitivity and lowering the LOD [45]. |
The journey to solve NMR sensitivity issues reveals a clear landscape. HPLC-UV remains the gold standard for high-precision quantification of known impurities, offering superior sensitivity and lower RMSE values [4]. However, NMR spectroscopy, particularly at high field strengths (e.g., 400 MHz), is fully capable of meeting strict ICH detection thresholds (0.01-0.05%) while providing unparalleled structural information [45]. The emergence of benchtop NMR, especially when enhanced by advanced data processing like Quantum Mechanical Modelling, presents a cost-effective and robust alternative for both identification and quantification, reducing reliance on analyte-specific standards [4]. The choice between these techniques ultimately depends on the specific application: HPLC-UV for targeted, high-sensitivity quantification, and NMR for structural elucidation, unknown impurity identification, and analyses where its inherent quantitative nature provides a strategic advantage.
Impurity profiling is a critical systematic approach in pharmaceutical development for identifying, characterizing, and quantifying unknown impurities to ensure drug safety, efficacy, and stability [10]. This process relies on highly sensitive and selective analytical techniques to detect trace amounts of impurities that can arise from synthesis processes, excipients, residual solvents, or degradation products [10]. The complex nature of pharmaceutical samples often results in overlapping spectral signals that complicate accurate identification and quantification. Deconvolution strategies become essential to resolve these complex mixtures, with Ultra-Violet Visible (UV-Vis) spectroscopy and Nuclear Magnetic Resonance (NMR) spectroscopy representing two powerful but fundamentally different approaches.
The comparative analysis of these techniques reveals distinct advantages and limitations. UV-Vis spectroscopy operates on the principle of electronic transitions, measuring the excitation of electrons from ground state to higher energy states when molecules absorb light in the 190-900 nm range [1]. In contrast, NMR spectroscopy exploits the magnetic properties of nuclei, inducing transitions between spin states under a strong magnetic field to provide detailed structural information [1]. This fundamental difference in operating principles dictates their respective applications, performance characteristics, and deconvolution strategies for impurity profiling in pharmaceutical research.
Fundamental Differences Between UV-Vis and NMR Spectroscopy
The core principles of UV-Vis and NMR spectroscopy dictate their applicability to impurity profiling. UV-Vis spectroscopy depends on the presence of chromophoric groups in molecules, with absorption directly proportional to the concentration of absorbing species in the beam path [1]. This technique offers rapid analysis with excitation events occurring in femtoseconds, making it suitable for real-time monitoring applications [1]. However, its reliance on chromophores limits its universality, and spectral bands are often broad, leading to significant overlap in complex mixtures.
NMR spectroscopy provides atomic-level detail through the excitation and detection of nuclear spin transitions, typically requiring longer measurement times (up to several minutes) but delivering unparalleled structural information [1]. The technique benefits from extremely narrow line widths and large chemical shift dispersion, particularly along the 13C dimension in heteronuclear experiments, which significantly reduces peak overlap compared to homonuclear spectra [47]. NMR does not require specific chromophores for detection, making it applicable to a wider range of chemical compounds, though it demands specialized deuterated solvents and more complex instrumentation.
The table below summarizes the fundamental technical differences between these two spectroscopic methods:
Table 1: Fundamental Technical Comparison Between UV-Vis and NMR Spectroscopy
| Parameter | UV-Vis Spectroscopy | NMR Spectroscopy |
|---|---|---|
| Physical Principle | Electronic transitions | Nuclear spin transitions |
| Spectral Range | 190-900 nm | Chemical shift (ppm) relative to reference |
| Detection Limit | High (μM-nM) | Moderate-low (mM-μM) |
| Sample Form | Solution in transparent solvents | Solution in deuterated solvents |
| Sample Container | Quartz cuvettes (typically 1 cm path length) | Glass tubes (5 mm diameter) |
| Analysis Speed | Very fast (seconds) | Slow (minutes to hours) |
| Structural Information | Low (functional group identification) | High (atomic-level molecular structure) |
| Quantification Basis | Beer-Lambert Law (direct proportionality) | Signal integration (direct proton count) |
Deconvolution Strategies for UV-Vis Spectroscopy
Mathematical Approaches and Experimental Protocols
UV-Vis spectral deconvolution employs mathematical algorithms to resolve overlapping absorption bands from multiple components in a mixture. The experimental protocol begins with sample preparation, where the pharmaceutical sample is dissolved in an appropriate solvent and placed in a standard 1 cm quartz cuvette [1]. The spectrometer records absorbance across the UV-Vis range (190-900 nm), generating a composite spectrum that may represent multiple overlapping chromophores.
The deconvolution process typically involves fitting the experimental spectrum with a linear combination of reference spectra from pure individual components. Advanced implementations use iterative least-squares optimization to minimize residuals between experimental and reconstructed spectra. For example, in vanadium redox flow battery electrolytes, researchers continuously recorded optical spectra in flow-through cells during operation and applied deconvolution to extract contributions from various vanadium compounds (V(II), V(III), V(IV), V(V)) [48]. This approach enabled accurate determination of individual species concentrations despite significant spectral overlap in the 400-700 nm region.
Quantitative Performance and Applications
UV-Vis deconvolution demonstrates robust quantitative performance in impurity profiling, particularly for compounds with distinct chromophores. The technique successfully quantified pigments (chlorophylls and carotenoids) and phenolic compounds in extra-virgin olive oil, correlating these components with nutritional and quality properties [49]. The method offers high sensitivity with detection limits suitable for many impurity profiling applications, though it may struggle with structurally similar compounds exhibiting nearly identical absorption spectra.
Table 2: Performance Metrics of UV-Vis Spectral Deconvolution in Mixture Analysis
| Application Context | Target Analytes | Accuracy/Error | Key Experimental Parameters |
|---|---|---|---|
| Vanadium Electrolyte Analysis [48] | V(II), V(III), V(IV), V(V) species | High accuracy for SOC determination | Flow-through cells; 400-700 nm range; H2SO4/H3PO4 electrolyte |
| Olive Oil Quality Assessment [49] | Pigments, polyphenols, oxidation products | Strong correlation with reference methods | Direct analysis in hexane; UV-Vis and chemometrics |
| Pharmaceutical Impurity Profiling [10] | Degradation products, related substances | Varies with chromophore strength | Stability-indicating methods; stress testing |
The following diagram illustrates the typical workflow for UV-Vis spectral deconvolution in impurity profiling:
Deconvolution Strategies for NMR Spectroscopy
Advanced Pulse Sequences and Computational Methods
NMR spectroscopy offers sophisticated deconvolution approaches that leverage both advanced pulse sequences and computational algorithms. For complex mixture analysis, researchers employ multidimensional NMR techniques such as 1H-1H TOCSY (Total Correlation Spectroscopy) and 13C-1H HSQC (Heteronuclear Single Quantum Coherence) to disperse overlapping signals into additional frequency dimensions [47]. The 13C-1H HSQC spectrum particularly benefits from large chemical shift dispersion along the proton-decoupled 13C-dimension, creating very narrow lines that minimize cross-peak overlap [47].
The DeCoDeC (Demixing by Consensus Deconvolution and Clustering) method represents a significant innovation for analyzing highly complex mixtures. This approach extracts 1D consensus spectral traces from 2D NMR data using covariance processing and hierarchical clustering [47]. The mathematical foundation involves calculating consensus traces q(kk′) for each cross-peak entry (k,k′) according to:
qj(kk′) = min(Ckj,Ck′j) (for covariance TOCSY)
where C represents the covariance matrix, followed by quantitative comparison of traces via inner product similarity measures and clustering [47]. This method successfully deconvoluted metabolite signals in E. coli cell lysate, identifying individual components despite strong spectral overlap.
Quantum Mechanical Modeling and Quantitative Performance
For quantitative analysis, particularly with lower-field benchtop NMR systems, Quantum Mechanical Modeling (QMM) has emerged as a powerful deconvolution approach. QMM generates ideal spectra using fundamental NMR parameters (chemical shifts, coupling constants) and fits them to experimental data, effectively addressing spectral overlap limitations [4]. In the quantification of methamphetamine hydrochloride in binary and ternary mixtures, benchtop NMR with QMM achieved a root mean square error (RMSE) of 1.3 mg analyte per 100 mg sample, approaching the precision of HPLC-UV (RMSE 1.1) [4].
The triple-rank (3R) correlation method represents another advanced strategy, combining pairs of standard 2D Fourier transform spectra that share a common frequency dimension to construct correlation spectra with ultrahigh resolution across all dimensions [47]. This approach effectively spreads out 1D TOCSY traces of individual spin systems along the 13C dimension according to the chemical shifts of the directly attached 13C spins, significantly enhancing separation of overlapping signals.
Table 3: Performance Metrics of NMR Deconvolution Methods in Mixture Analysis
| Method/Application | Target Analytes | Accuracy/Precision | Key Experimental Parameters |
|---|---|---|---|
| DeCoDeC for Metabolites [47] | 8-compound metabolite model; E. coli extract | Successful component identification | 2D 1H-1H TOCSY; 13C-1H HSQC; consensus clustering |
| QMM for Pharmaceuticals [4] | Methamphetamine HCl in mixtures | RMSE 1.3-2.1 mg/100 mg | 60 MHz benchtop NMR; quantum mechanical fitting |
| 3R NMR Spectroscopy [47] | Metabolite spin systems | High resolution in all dimensions | Pairs of 2D FT spectra with common dimension |
The following diagram illustrates the NMR deconvolution workflow using consensus clustering approaches:
Comparative Experimental Data and Performance Metrics
Direct Comparison in Pharmaceutical Applications
While direct side-by-side comparisons of UV-Vis and NMR for pharmaceutical impurity profiling are limited in the literature, evidence from related fields provides valuable insights. In olive oil authentication, both techniques successfully characterized chemical components related to quality and authenticity, but with complementary strengths [49]. UV-Vis spectroscopy rapidly quantified pigments and oxidation products, while 1H and 13C NMR provided detailed information about fatty acid composition, diacylglycerols, and phenolic compounds [49].
For quantitative accuracy, advanced NMR methods like QMM approach the performance of established techniques like HPLC-UV. In the analysis of methamphetamine hydrochloride, benchtop NMR with QMM achieved an RMSE of 2.1 mg/100 mg compared to 1.1 mg/100 mg for HPLC-UV [4]. This demonstrates that with proper deconvolution strategies, NMR can provide quantitative data comparable to chromatographic methods while simultaneously offering structural identification capabilities.
Analysis Scope and Limitations Comparison
The scope of analysis differs significantly between these techniques. UV-Vis deconvolution primarily targets chromophoric compounds, making it excellent for conjugated systems, aromatic impurities, and colored degradation products but potentially missing aliphatic impurities or compounds with weak chromophores [1]. NMR possesses universal detection for all hydrogen-containing compounds (1H NMR) or carbon-containing compounds (13C NMR), providing a more comprehensive impurity profile but with generally lower sensitivity than UV-Vis [1].
The table below provides a direct comparison of the deconvolution capabilities and performance metrics for impurity profiling applications:
Table 4: Comprehensive Comparison of Deconvolution Capabilities for Impurity Profiling
| Characteristic | UV-Vis Spectroscopy | NMR Spectroscopy |
|---|---|---|
| Information Depth | Chromophore presence and concentration | Molecular structure and dynamics |
| Spectral Resolution | Moderate (broad bands) | High (sharp peaks) |
| Multi-component Analysis | Limited by chromophore similarity | Excellent with 2D methods |
| Structural Elucidation Power | Low | High |
| Quantitative Accuracy | Good with distinct chromophores | Excellent (inherently quantitative) |
| Sensitivity | High (μM-nM) | Moderate (mM-μM) |
| Sample Throughput | High | Low to moderate |
| Instrument Cost | Low | High |
| Regulatory Acceptance | Established for specific applications | Well-established |
| Expertise Required | Moderate | High |
Essential Research Reagents and Materials
Successful implementation of deconvolution strategies for impurity profiling requires specific research reagents and materials tailored to each technique. The following table details essential components for both UV-Vis and NMR methodologies:
Table 5: Essential Research Reagents and Materials for Spectral Deconvolution
| Item | Function/Application | Technique |
|---|---|---|
| Deuterated Solvents (CDCl3, D2O, d6-DMSO) | NMR solvent with minimal interference; provides lock signal | NMR |
| Quartz Cuvettes | UV-transparent sample container for UV-Vis measurement | UV-Vis |
| Tetramethylsilane (TMS) | Internal chemical shift reference standard for NMR | NMR |
| Aprotic Solvents (ACN, hexane) | Sample dissolution without proton interference | UV-Vis/NMR |
| Reference Compounds | For spectral libraries and quantification standards | UV-Vis/NMR |
| pH Buffers | Control ionization state affecting chemical shifts | NMR |
| Stabilizing Additives | Prevent degradation during analysis | UV-Vis/NMR |
| Covalently Bound Magnetic Particles | Sample purification and concentration | NMR [47] |
Both UV-Vis and NMR spectroscopy offer powerful but distinct approaches to deconvoluting overlapping signals in complex mixtures for impurity profiling. UV-Vis spectroscopy provides rapid, sensitive analysis for chromophoric compounds with relatively simple deconvolution mathematics, making it suitable for high-throughput screening and routine analysis. NMR spectroscopy delivers unparalleled structural information through advanced pulse sequences and computational deconvolution algorithms, enabling comprehensive impurity identification and characterization despite significant spectral overlap.
The choice between these techniques depends on specific application requirements. UV-Vis excels in scenarios requiring rapid analysis of known chromophoric impurities, while NMR provides definitive structural elucidation for unknown impurities and complex degradation products. The emerging trend toward hyphenated techniques and benchtop NMR systems with advanced deconvolution algorithms like QMM is making comprehensive impurity profiling more accessible across the pharmaceutical industry. Furthermore, the combination of both techniques within analytical workflows leverages their complementary strengths, providing both rapid screening capability and definitive structural characterization for comprehensive impurity profiling in pharmaceutical development.
Sample Preparation Best Practices for Both Techniques
In pharmaceutical impurity profiling, the choice of analytical technique directly impacts the reliability and accuracy of results. Ultraviolet-Visible (UV-Vis) spectroscopy and Nuclear Magnetic Resonance (NMR) spectroscopy offer complementary approaches for detecting and quantifying impurities, yet they demand distinctly different sample preparation strategies. Proper sample preparation is not merely a preliminary step but a critical determinant of data quality, influencing detection limits, quantitative accuracy, and methodological robustness. This guide provides a detailed comparison of best practices for preparing samples for both UV-Vis and NMR analysis, equipping researchers with the knowledge to optimize their workflows for impurity profiling in drug development.
Fundamental Principles and Comparison of Techniques
Understanding the core principles of UV-Vis and NMR spectroscopy is essential for appreciating their respective sample preparation requirements and applications in impurity profiling.
UV-Vis Spectroscopy measures the absorption of ultraviolet or visible light by a compound as electrons transition between energy levels. It is primarily used for quantifying concentrations of analytes that contain chromophores—functional groups that absorb light in this region. In pharmaceutical quality control, UV-Vis is a workhorse for ensuring consistent concentration of active pharmaceutical ingredients (APIs) and assessing product uniformity [23].
NMR Spectroscopy, in contrast, investigates the magnetic properties of atomic nuclei (such as ¹H and ¹³C) when placed in a strong magnetic field. It provides unparalleled detail on molecular structure, dynamics, and environment. NMR is indispensable for structural elucidation of unknown impurities and can be used for quantitative analysis (qNMR) without the need for identical reference standards [23].
The table below summarizes their core characteristics:
Table 1: Fundamental Comparison of UV-Vis and NMR Spectroscopy
| Feature | UV-Vis Spectroscopy | NMR Spectroscopy |
|---|---|---|
| Primary Information | Absorbance at specific wavelengths; concentration | Chemical shift, spin-spin coupling; molecular structure |
| Key Application in Impurity Profiling | Quantification of known impurities with chromophores | Structural identification and quantification of known/unknown impurities |
| Quantitative Nature | Requires calibration curve with pure standards | Inherently quantitative (qNMR); areas proportional to number of nuclei |
| Sample Destructiveness | Non-destructive | Non-destructive |
| Sensitivity | High (can detect low concentrations) | Moderate (requires more analyte than UV-Vis) |
Sample Preparation for UV-Vis Spectroscopy
The primary goal in UV-Vis sample preparation is to obtain an optically clear solution with an absorbance within the instrument's linear range, free from interference.
Core Workflow
The following diagram illustrates the key steps in UV-Vis sample preparation.
Detailed Protocols and Best Practices
Solvent Selection: The solvent must be transparent in the spectral region of interest and capable of dissolving the analyte. Common pharmaceutical solvents include water, methanol, and acetonitrile. A solvent's UV cutoff (the wavelength below which it absorbs strongly) is a critical parameter; for example, methanol is suitable down to about 205 nm, while acetonitrile can be used down to 190 nm [23].
Solution Clarity: Samples must be free of particulate matter that causes light scattering, leading to erroneously high absorbance readings. Filtration through a 0.45 µm or 0.22 µm membrane filter or centrifugation is standard practice to ensure an optically clear solution [23].
Concentration and Path Length Optimization: The analyte concentration and cuvette path length must be adjusted so that the measured absorbance falls within the linear range of the Beer-Lambert law, typically between 0.1 and 1.0 absorbance units (AU). Absorbance outside this range reduces quantitative accuracy. This often requires serial dilution of the sample [23].
Use of Cuvettes: High-quality, matched quartz cuvettes are required for UV range analysis. They must be scrupulously clean to avoid contamination from previous samples or fingerprints.
Sample Preparation for NMR Spectroscopy
NMR sample preparation focuses on creating a homogeneous, particle-free solution in a deuterated solvent to ensure high-resolution spectra and stable instrument operation.
Core Workflow
The following diagram outlines the critical steps for preparing a sample for NMR analysis.
Detailed Protocols and Best Practices
Sample Amount: For a standard ¹H NMR spectrum of a small organic molecule (like a typical API or impurity), 5-25 mg of material is typically sufficient. For ¹³C NMR or less sensitive nuclei, 50-100 mg may be required. Using too much sample can lead to broadened lineshapes and difficult shimming [50] [51].
Deuterated Solvent Selection: The solvent must dissolve the sample and be chemically compatible. Common deuterated solvents include chloroform-d (CDCl₃), dimethyl sulfoxide-d6 (DMSO-d6), and deuterium oxide (D₂O). The deuterium provides a signal for the instrument lock system, which stabilizes the magnetic field, and makes the solvent protons "invisible" in the ¹H spectrum [50] [52].
Sample Volume and Tube Quality: The standard volume for a 5 mm NMR tube is 0.6-0.7 mL, providing an optimal filling height of about 4 cm. Using too much or too little solvent complicates the shimming process [50] [51]. High-quality, clean, and unscratched NMR tubes are essential, as defects or particles can distort the magnetic field homogeneity, leading to poor spectral resolution [51].
Solution Filtration: To remove solid particles that distort the magnetic field, the sample solution should be filtered directly into the NMR tube using a Pasteur pipette packed with a small plug of glass wool. Cotton should be avoided as solvents can leach contaminants from it [51].
Internal Standard for Quantification (qNMR): For quantitative NMR, an internal standard is added directly to the sample. Nicotinamide is sometimes used for its stability and suitable solubility [11], while tetramethylsilane (TMS) is the classic reference for chemical shift calibration in organic solvents. For aqueous samples, DSS or TSP are used [50] [51]. The internal standard must be added accurately for reliable quantification.
Comparative Analysis: Application in Impurity Profiling
The distinct strengths of UV-Vis and NMR are highlighted when they are applied to the challenge of impurity profiling.
Quantitative Performance and Experimental Data
A 2025 study comparing methods for quantifying bakuchiol in cosmetic products provides concrete data on the performance of these techniques. The results demonstrate that ¹H qNMR produced results comparable to HPLC analysis, a gold standard for quantification, but with a significantly shorter analysis time [11]. This makes qNMR a powerful tool for the rapid quantification of impurities.
Another 2025 study on quantifying methamphetamine hydrochloride in mixtures compared benchtop NMR with HPLC-UV. While HPLC-UV maintained slightly higher precision (Root Mean Square Error, RMSE of 1.1), benchtop NMR coupled with quantum mechanical modelling (QMM) achieved an excellent RMSE of 2.1, confirming its viability as a quantitative technique without the need for specific calibration standards for each analyte [4].
The table below summarizes key comparative metrics:
Table 2: Comparison of UV-Vis and NMR for Impurity Analysis
| Parameter | UV-Vis Spectroscopy | NMR Spectroscopy |
|---|---|---|
| Primary Use in Impurity Profiling | Quantification of known chromophoric impurities | Structural identification and quantification of impurities |
| Sample Throughput | High (rapid analysis) | Moderate to Low (longer acquisition times) |
| Structural Specificity | Low (confirmation by retention time/λmax only) | Very High (provides definitive structural data) |
| Quantitative Workflow | Requires pure reference standard for calibration | Inherently quantitative with internal standard (qNMR) |
| Key Limitation | Cannot identify structurally novel or non-chromophoric impurities | Lower sensitivity; requires higher sample amounts |
The Scientist's Toolkit: Essential Research Reagents
Table 3: Key Reagents and Materials for UV-Vis and NMR Analysis
| Item | Function | Technique |
|---|---|---|
| Deuterated Solvents (CDCl₃, DMSO-d₆) | Dissolves sample, provides deuterium lock signal | NMR |
| High-Purity HPLC/Spectroscopic Solvents | Dissolves sample without introducing UV-absorbing impurities | UV-Vis |
| Internal Standards (TMS, DSS, Nicotinamide) | Provides reference for chemical shift and quantification in qNMR | NMR (qNMR) |
| Membrane Filters (0.45 µm, 0.22 µm) | Removes particulate matter to ensure solution clarity | UV-Vis, NMR |
| Quartz Cuvettes | Holds sample; transparent in UV-Vis range | UV-Vis |
| Precision NMR Tubes | Holds sample; high-quality glass ensures magnetic homogeneity | NMR |
UV-Vis and NMR spectroscopy are powerful, non-destructive techniques that play distinct yet complementary roles in pharmaceutical impurity profiling. The choice between them hinges on the analytical question: UV-Vis is optimal for rapid, sensitive quantification of known impurities, while NMR is unparalleled for structural elucidation and standard-independent quantification.
Ultimately, the reliability of data from either technique is fundamentally rooted in rigorous sample preparation. Adhering to the best practices outlined—prioritizing solvent selection, solution clarity, and optimal concentration for UV-Vis, and focusing on deuterated solvents, quantitative transfers, and internal standards for NMR—ensures data integrity. A well-prepared sample is the foundation upon which accurate impurity profiles are built, directly contributing to drug safety and efficacy.
Comparative Analysis of Speed, Cost, and Ease of Use
In the field of pharmaceutical development, impurity profiling is critical for ensuring drug safety and efficacy, as mandated by the International Council for Harmonisation (ICH) guidelines. The selection of an appropriate analytical technique is a fundamental decision for researchers and drug development professionals. This guide provides an objective comparison between Nuclear Magnetic Resonance (NMR) spectroscopy and Ultraviolet-Visible (UV-Vis) spectroscopy, focusing on the core practical aspects of speed, cost, and ease of use for impurity analysis. While UV-Vis is a longstanding staple in quality control labs, NMR is increasingly recognized for its ability to provide definitive structural information for impurities without the need for reference standards. This analysis aims to equip scientists with the data necessary to select the most efficient and effective tool for their specific impurity profiling challenges.
Theoretical Foundations and Technical Comparison
The fundamental differences in what each technique measures—electronic transitions for UV-Vis versus nuclear spin transitions for NMR—underpin their varied applications and performance.
UV-Vis Spectroscopy: This technique operates on the principle of electronic excitation. When a molecule is exposed to UV or visible light, its electrons absorb energy and transition from a ground state to an excited state [1]. The extent of absorption at specific wavelengths is directly proportional to the concentration of the absorbing species and is dependent on the presence of chromophoric groups in the molecules [1]. This makes it highly sensitive for compounds that contain these light-absorbing structures.
NMR Spectroscopy: In contrast, NMR spectroscopy exploits the magnetic properties of atomic nuclei. When placed in a strong magnetic field, nuclei with spin (such as ^1H or ^13C) can absorb radiofrequency energy and transition between spin states [53] [1]. The precise frequency of this absorption (the chemical shift) provides a rich tapestry of information about the local chemical environment of the nucleus, enabling detailed structural elucidation.
A critical differentiator is sensitivity. The energy difference (ΔE) between spin states in NMR is exceptionally small—approximately 2.6510^-25 J for ^1H at 400 MHz. This is about 15,000 times smaller than the thermal energy at room temperature. As a result, the population excess in the lower energy state is minuscule, with only about 32 more spins per million in the lower state [53]. Conversely, the ΔE for a UV-Vis electronic transition at 500 nm is 3.9810^-19 J, about 100 times greater than the thermal energy. This results in nearly all molecules residing in the ground state, creating a large population difference and contributing to UV-Vis's significantly higher inherent sensitivity, requiring analyte concentrations in the nM to µM range compared to NMR's mM requirements [53].
Table 1: Fundamental Comparison of NMR and UV-Vis Spectroscopy
| Parameter | NMR Spectroscopy | UV-Vis Spectroscopy |
|---|---|---|
| Physical Principle | Transitions between nuclear spin states [1] | Electronic transitions from ground to excited states [1] |
| Energy Difference | ~2.65 × 10⁻²⁵ J (for ¹H at 400 MHz) [53] | ~3.98 × 10⁻¹⁹ J (for λ = 500 nm) [53] |
| Typical Analyte Concentration | mM range [53] | nM to µM range [53] |
| Key Spectral Output | Chemical shift (ppm), spin-spin coupling [1] | Absorbance vs. Wavelength [1] |
| Structural Information | High; direct information on molecular structure and functional groups [4] | Low; indicates presence of chromophores but limited structural detail [54] |
Performance Comparison: Speed, Cost, and Operational Factors
When selecting a technique for impurity profiling, practical considerations such as analysis speed, cost, and ease of use are as critical as technical capabilities.
Analysis Speed
UV-Vis spectroscopy holds a significant advantage in terms of speed. The excitation and detection processes in UV-Vis are extremely fast, on the order of femtoseconds, allowing for rapid data acquisition, often in a matter of seconds [1]. This makes it ideal for high-throughput environments and kinetics studies. NMR analysis is inherently slower, with response times that can extend to a minute or longer for a single scan [1]. To achieve an acceptable signal-to-noise ratio, especially for low-concentration impurities, multiple scans need to be accumulated, which can prolong the total experiment time to several minutes or even hours.
Cost of Instrumentation and Operation
The financial investment for these techniques varies dramatically, influencing their accessibility.
- Instrument Cost: NMR spectrometers represent a substantially higher capital expenditure. Prices for a new benchtop NMR start at around $40,000 for a 60 MHz system and can reach $150,000 for higher-field models [55]. Full-scale, high-resolution superconducting NMR instruments used in research begin around $150,000 for a 300 MHz system and can soar to $5 million for a top-tier 900 MHz system [55]. In stark contrast, a new UV-Vis spectrophotometer can be acquired for a much lower cost, with entry-level models ranging from $1,500 to $5,000 and advanced research-grade models typically falling between $5,000 and $15,000 [56].
- Operational Costs: NMR operating costs are also higher. It requires expensive deuterated solvents (e.g., deuterated chloroform, D₂O) for signal locking [1] [45]. UV-Vis is more economical to run, as it can use any solvent in which the sample is soluble, with a simple blank as reference [1]. Standard quartz or plastic cuvettes are also less costly than high-quality NMR tubes.
Table 2: Practical Comparison for Impurity Profiling
| Aspect | NMR Spectroscopy | UV-Vis Spectroscopy |
|---|---|---|
| Analysis Speed | Slow (minutes to hours) [1] | Fast (seconds) [1] |
| Instrument Cost (New) | $40,000 to $5,000,000+ [55] | $1,500 to $15,000 [56] |
| Sample Preparation | More complex; requires deuterated solvents, precise tube filling [1] [45] | Simple; dissolve in any solvent, use cuvette [1] |
| Solvent Cost | High (deuterated solvents) [1] | Low (standard HPLC or spectroscopic grade solvents) |
| Quantification | Inherently quantitative without need for analyte-specific standards [4] [45] | Requires calibration with pure reference standards for each analyte [4] |
| Sensitivity (LOD) | Can detect impurities at ~0.01% with high-field NMR [45] | Highly sensitive; can detect impurities <0.1% by area [54] |
Ease of Use and Sample Handling
UV-Vis is generally considered more user-friendly. Sample preparation is straightforward: the analyte is dissolved in a suitable solvent, placed in a cuvette, and measured against a blank [1]. NMR sample preparation is more involved. It requires the use of special glass tubes, and the solvent must be deuterated, which adds cost and requires consideration of solubility [1]. Furthermore, the sample tube must be spun within the magnet to average out field inhomogeneities [1].
A key advantage of NMR for impurity profiling is its inherently quantitative nature. Because the signal intensity is directly proportional to the number of nuclei giving rise to that signal, NMR can be used for accurate quantification without the need for calibration curves or identical reference standards for every single impurity [4]. This is particularly valuable for identifying and quantifying novel or unknown impurities. UV-Vis, on the other hand, typically requires a purified reference standard of each analyte to create a calibration curve for accurate quantification [4].
Experimental Protocols for Impurity Profiling
NMR Protocol for Detecting an Impurity in Choline Chloride
This protocol, based on a study that successfully detected an impurity (O-(2-hydroxyethyl)choline) in choline chloride at levels meeting ICH guidelines, highlights the steps for a sensitive NMR-based impurity analysis [45].
- Objective: To detect and identify process-related impurities in a drug substance or dietary ingredient at levels as low as 0.01% (w/w).
- Materials and Instrumentation:
- API/Substance of Interest: Choline chloride (≥ 10 mg) [45].
- NMR Spectrometer: 400 MHz or higher field strength is recommended for optimal sensitivity [45].
- Solvent: Deuterated solvent (D₂O or DMSO-d₆). The choice of solvent is critical for optimal signal resolution and should be selected based on analyte solubility [45].
- NMR Tube: Standard 5 mm outer diameter NMR tube [45].
- Internal Standard: DSS-d₆, for chemical shift referencing in D₂O [45].
- Procedure:
- Sample Preparation: Precisely weigh the choline chloride sample (e.g., 10 mg). Dissolve it in 0.5 mL of a deuterated solvent (e.g., D₂O spiked with 1.5% w/v DSS-d₆) [45].
- Data Acquisition: Transfer the solution to a 5 mm NMR tube. Acquire the ^1H NMR spectrum using a cryoprobe-equipped instrument if available. To achieve a sufficient signal-to-noise ratio for low-level impurities, a large number of transients (scans) must be collected [45].
- Data Processing and Analysis: Process the Free Induction Decay (FID) to generate the spectrum. The LOD for the impurity can be determined as the concentration where the signal-to-noise ratio (S/N) of a characteristic impurity proton resonance equals 3 [45]. Advanced processing techniques like iterative Full Spin Analysis (HiFSA) can be used to subtract the signals of the main component, thereby exposing and aiding in the identification of impurities [45].
- Key Findings: A 400 MHz NMR spectrometer was able to achieve an LOD of 0.01% for the target impurity in choline chloride, which is well below the ICH identification threshold. In contrast, a 60 MHz benchtop NMR instrument had a significantly higher LOD of 2% for the same impurity, demonstrating the importance of field strength for trace analysis [45].
UV-Vis Protocol for Impurity Profiling via HPLC-UV
This protocol outlines the standard use of HPLC-UV for quantifying impurities in a drug substance, a workhorse method in pharmaceutical quality control labs.
- Objective: To separate, detect, and quantify multiple impurities in a drug substance using HPLC with UV detection.
- Materials and Instrumentation:
- HPLC-UV System: Consisting of a pump, autosampler, column oven, and a diode array detector (DAD) [54].
- Chromatography Column: A suitable reverse-phase C18 column [54].
- Mobile Phase: Typically a mixture of aqueous buffer and an organic solvent like acetonitrile or methanol.
- Reference Standards: Highly purified samples of the main drug substance and all known impurities for calibration [54].
- Procedure:
- System Preparation: Develop and validate a gradient elution method that achieves baseline separation between the main peak and all impurity peaks [54].
- Calibration: Prepare a series of standard solutions of the known impurities at different concentrations. Inject these and record the peak areas. Construct a calibration curve (peak area vs. concentration) for each impurity [4].
- Sample Analysis: Dissolve the test drug substance sample in the mobile phase or a suitable solvent. Inject the sample and run the HPLC-UV method.
- Data Analysis: Identify impurity peaks by comparing their retention times and UV spectra to those of the reference standards [54]. Quantify the amount of each impurity by interpolating its peak area on the corresponding calibration curve.
- Key Findings: HPLC-UV is highly precise for quantification, with studies showing it can reliably differentiate and quantify impurities at levels less than 0.1% by area [54]. Its primary limitation is the dependency on reference standards for both identification and accurate quantification, which can be a challenge for unknown impurities.
Workflow Visualization
The following diagram illustrates the core logical workflows for impurity profiling using NMR and UV-Vis, highlighting their fundamental differences in standardization and identification.
Essential Research Reagent Solutions
Successful impurity profiling requires specific consumables and reagents for each technique. The following table details these essential items and their functions.
Table 3: Key Reagents and Materials for Impurity Analysis
| Item | Function/Application | Associated Technique |
|---|---|---|
| Deuterated Solvents (e.g., D₂O, CDCl₃) | Provides a signal for the NMR spectrometer's lock system and dissolves the sample without adding interfering ^1H signals. | NMR [1] [45] |
| NMR Tubes | High-precision glass tubes designed to hold the sample within the sensitive region of the NMR magnet. | NMR [1] |
| Internal Reference Standards (e.g., DSS, TMS) | Provides a reference peak (typically at 0 ppm) for calibrating the chemical shift scale. | NMR [1] [45] |
| HPLC-UV Reference Standards | Highly pure compounds used to create calibration curves for accurate quantification and to confirm the identity of impurities via retention time and UV spectrum matching. | UV-Vis (HPLC-UV) [54] |
| HPLC-Grade Solvents | High-purity solvents used to prepare the mobile phase and sample solutions, minimizing background UV absorption and noise. | UV-Vis (HPLC-UV) |
| Cuvettes | Containers (often quartz for UV) that hold the liquid sample in the beam path for analysis. | UV-Vis [1] |
The choice between NMR and UV-Vis spectroscopy for impurity profiling is not a matter of one technique being universally superior, but rather of selecting the right tool for the specific research question and context.
- UV-Vis Spectroscopy (typically via HPLC-UV) is the undisputed champion of speed, throughput, and cost-effectiveness. It is the ideal choice for routine quality control in regulated environments where the impurities are known, reference standards are available, and high-precision quantification at low levels is the primary goal [4] [54].
- NMR Spectroscopy is a powerful orthogonal technique that excels in providing definitive structural information and the ability to quantify both known and unknown impurities without reference standards. While slower and more expensive to purchase and operate, its value is immense for structural elucidation, method development, and investigative analysis when a new or unexpected impurity is detected [4] [45].
For a comprehensive impurity profiling program, the most robust strategy often involves leveraging the strengths of both techniques. HPLC-UV can be used for rapid, sensitive routine monitoring, while NMR is employed to confirm the structure of new or unknown impurities identified by HPLC-UV, creating a synergistic approach that ensures both efficiency and scientific rigor.
Head-to-Head Validation: Comparing Performance, Precision, and Cost-Effectiveness
The selection of an appropriate analytical technique is fundamental to the success of impurity profiling in drug development. Sensitivity and the Limit of Detection (LOD) are two pivotal parameters in this choice, directly determining an technique's ability to identify and quantify trace-level impurities that may have significant toxicological implications. This guide provides a detailed, data-driven comparison of two cornerstone techniques: High-Field Nuclear Magnetic Resonance (NMR) spectroscopy and Ultraviolet-Visible (UV-Vis) spectrophotometry. The objective is to equip researchers, scientists, and drug development professionals with a clear understanding of the performance characteristics of each method, framed within the context of modern impurity profiling research. By comparing inherent sensitivities, experimental requirements, and applications, this analysis aims to support informed decision-making in analytical protocol development.
Core Principles and Quantitative Comparison
UV-Vis spectroscopy measures the absorption of ultraviolet or visible light by a sample, which occurs when electrons in molecules are promoted to higher energy states. The absorbance follows the Beer-Lambert law, which relates the absorption of light to the properties of the material through which the light is traveling. Its widespread use is driven by its simplicity, cost-effectiveness, and robust quantitative capabilities for chromophore-containing compounds [27].
High-Field NMR spectroscopy, in contrast, exploits the magnetic properties of atomic nuclei. When placed in a strong magnetic field, nuclei can absorb and re-emit electromagnetic radiation. The frequency and pattern of this absorption provide detailed information on the molecular structure, dynamics, and environment. A primary strategy to overcome NMR's inherent low sensitivity is to increase the strength of the external magnetic field (B₀) [57]. Ultra-high field NMR instruments (e.g., 1.0 - 1.2 GHz) significantly improve both sensitivity and spectral resolution, which is crucial for studying complex biomolecules and detecting low-abundance impurities [58] [57].
The table below summarizes the key performance metrics and characteristics of the two techniques.
Table 1: Direct Comparison of UV-Vis and High-Field NMR for Analytical Applications
| Feature | UV-Vis Spectrophotometry | High-Field NMR Spectroscopy |
|---|---|---|
| Typical LOD Range | Low ppm range (e.g., 0.005 - 1 ppm) [59] [60] | Varies; ng to µg with HPLC-NMR [61]; mg/mL with benchtop NMR [4] |
| Key Sensitivity Factor | Molar absorptivity of the analyte [27] | Magnetic field strength (B₀); higher is better [57] |
| Quantitative Basis | Beer-Lambert Law [27] | Direct proportionality of signal area to number of nuclei [4] |
| Structural Information | Limited; identifies chromophores | High-level; provides atomic-level structural elucidation |
| Impurity Profiling | Effective for UV-active impurities | Comprehensive; can identify and quantify all species, even non-chromophoric impurities [4] [62] |
| Sample Preparation | Generally simple; may require derivatization | Can be complex; often requires deuterated solvents |
| Analysis Time | Rapid (seconds to minutes) | Slower (minutes to hours) |
Experimental Protocols for Impurity Assessment
UV-Vis Protocol for Trace Analysis
The following methodology, adapted from a study on detecting potassium bromate in bread, exemplifies a validated UV-Vis protocol for trace-level quantification [59].
- Sample Preparation: The sample is homogenized and extracted with a suitable solvent, typically deionized water or an aqueous buffer. The extract is then centrifuged and filtered to obtain a clear solution.
- Derivatization: For analytes lacking a strong chromophore (like potassium bromate), a derivatization step is crucial. In this protocol, the clear sample extract is reacted with Promethazine (PTZ) in an acidic medium (e.g., 1 M HCl). The target analyte oxidizes PTZ, forming a pink-colored promethazininium radical cation.
- Instrumental Analysis: The absorbance of the resulting solution is measured in a 1 cm quartz cuvette using a double-beam UV-Vis spectrophotometer. The characteristic absorption peak for the PTZ radical cation is measured at 515 nm.
- Quantification: The analyte concentration is determined using a calibration curve of known standard solutions treated with the same derivatization protocol. The method's validity is confirmed through parameters including linearity (R² = 0.9962), precision (%RSD = 0.126%), and recovery (82.97% - 108.54%) [59].
High-Field NMR Protocol for Mixture Quantification
A study on quantifying methamphetamine in complex mixtures using benchtop NMR with advanced processing demonstrates a modern NMR quantification approach, with High-Field NMR offering further enhanced sensitivity and resolution [4].
- Sample Preparation: The sample (e.g., a drug substance mixture) is accurately weighed and dissolved in a deuterated solvent (e.g., D₂O or CDCl₃). An internal standard for quantification is added.
- Data Acquisition: The sample is analyzed using a standard ¹H NMR pulse sequence. Key acquisition parameters include a sufficient number of scans (NS) to achieve an adequate signal-to-noise ratio, a relaxation delay (d1) longer than 5 times the longitudinal relaxation time (T1) of the nuclei of interest to ensure quantitative accuracy, and a spectral window that captures all relevant chemical shifts [4].
- Data Processing & Quantification: The Free Induction Decay (FID) is processed (Fourier transformation, phasing, baseline correction). Quantification is performed not by simple integration but by advanced processing techniques like a Quantum Mechanical Model (QMM). QMM uses known chemical shifts and coupling constants to generate a complete spectral model, which is then fitted to the experimental data, effectively deconvoluting overlapping signals. This method achieved a Root Mean Square Error (RMSE) of 1.3 mg/100 mg for methamphetamine purity, performance comparable to HPLC-UV [4].
Workflow and Sensitivity Relationship
The following diagrams illustrate the generalized workflows for impurity analysis using both techniques and the conceptual relationship between NMR field strength and sensitivity.
Diagram 1: Comparative workflows for impurity analysis using UV-Vis and High-Field NMR. The NMR pathway highlights its capability for simultaneous quantification and identification (ID).
Diagram 2: The relationship between NMR magnetic field strength and its key performance metrics. Higher field strength directly enhances both sensitivity and spectral resolution, which is critical for detecting low-abundance impurities in complex mixtures [57].
The Scientist's Toolkit: Essential Reagents and Materials
Successful implementation of either technique requires specific reagents and materials. The following table details essential items for the experimental protocols described in this guide.
Table 2: Key Research Reagent Solutions for UV-Vis and NMR Experiments
| Item Name | Function / Application | Critical Specification / Note |
|---|---|---|
| Promethazine (PTZ) | Chromogenic reagent for derivatizing non-chromophoric analytes (e.g., KBrO₃) in UV-Vis [59]. | Purity ≥99%; prepares a stable colored complex for sensitive detection. |
| Quartz Cuvettes | Sample holder for UV-Vis spectrophotometric measurement [27]. | Must be used for UV range; plastic/glass absorb UV light. |
| Deuterated Solvents (e.g., D₂O, CDCl₃) | Solvent for NMR samples provides the field-frequency lock signal [4]. | Isotopic purity ≥99.8%; essential for stable NMR signal. |
| Internal Standard (e.g., TMS) | Reference compound for chemical shift calibration and quantification in NMR [4]. | Chemically inert and provides a sharp, well-defined resonance. |
| Monochromatic Light Source (e.g., Deuterium & Tungsten Lamps) | Provides UV and visible light for absorption measurement [27]. | Requires stable output; instruments often use two lamps for full range. |
In impurity profiling, the choice between High-Field NMR and UV-Vis is not a matter of one technique being universally superior, but rather of selecting the right tool for the specific analytical challenge.
UV-Vis spectrophotometry excels in scenarios demanding rapid, cost-effective, and highly sensitive quantification of specific chromophore-containing impurities. Its low LOD in the ppm to ppb range, especially with derivatization, makes it ideal for targeted analysis and routine quality control where the impurity's identity and spectral properties are known.
High-Field NMR spectroscopy is a powerful orthogonal technique that provides a comprehensive view of a sample's composition. Its principal strength lies in its ability to simultaneously identify and quantify multiple components—including structurally similar impurities and those lacking chromophores—without requiring compound-specific methods or standards. While its absolute sensitivity for direct measurement is generally lower than that of UV-Vis, the use of hyphenated techniques like LC-NMR and advanced processing algorithms like QMM significantly closes this gap. NMR is indispensable for structural elucidation of unknown impurities, method development, and in-depth investigations where a complete understanding of the sample matrix is required.
Therefore, a synergistic approach is often the most effective strategy in modern drug development. UV-Vis can be employed for high-throughput, sensitive monitoring of known impurities, while High-Field NMR serves as a definitive tool for structural discovery, resolving complex mixtures, and validating the quantitative results from other methods.
In pharmaceutical impurity profiling, the accurate quantification of unwanted chemicals is paramount to ensuring drug safety and efficacy. As per ICH guidelines, impurities often have identification and qualification thresholds as low as 0.10% and 0.15%, respectively, demanding analytical techniques of the highest sensitivity and reliability [43]. Within this context, Root Mean Square Error (RMSE) serves as a critical statistical metric for evaluating the predictive performance of analytical models. RMSE measures the average difference between a model's predicted values and the actual observed values, effectively representing the standard deviation of the residuals—the distance between the data points and the regression line [63]. A lower RMSE indicates a model with less error and more precise predictions, making it an indispensable tool for comparing the quantitative accuracy of different analytical techniques such as UV-Vis spectroscopy and NMR spectroscopy [63].
This article provides a direct comparison of UV-Vis and NMR spectroscopy for impurity profiling, using RMSE as a primary measure of quantitative accuracy. It details experimental methodologies, presents comparative performance data, and explores the implications for researchers and drug development professionals seeking to select the most appropriate analytical tool for their specific applications.
Understanding Root Mean Square Error (RMSE)
Mathematical Definition and Interpretation
The Root Mean Square Error (RMSE) is the square root of the average of squared differences between predicted values (( \hat{yi} )) and observed values (( yi )). The formula for a sample is:
[ RMSE = \sqrt{\frac{\sum{i=1}^{n} (yi - \hat{y_i})^2}{n}} ]
Where:
- ( y_i ) is the actual value for the i-th observation
- ( \hat{y_i} ) is the predicted value for the i-th observation
- ( n ) is the number of observations [63] [64]
RMSE values range from zero to positive infinity and retain the units of the dependent variable, providing an intuitive measure of the typical error magnitude [63]. For example, in a model predicting student exam scores (on a 0-100 scale) with an RMSE of 4, the interpretation is that the model's predictions typically deviate from actual scores by about 4 points [63]. Furthermore, assuming residuals follow a normal distribution, approximately 95% of observed values will fall within ±2 × RMSE of the predicted values, offering a practical prediction interval [63].
Strengths and Limitations in Analytical Science
RMSE offers particular strengths for analytical comparisons:
- Intuitive Interpretation: As an absolute measure of average error in the variable's original units, RMSE is straightforward to interpret, even for those without deep statistical expertise [63].
- Standard Metric: RMSE is widely used across scientific fields, including climatology, forecasting, and pharmaceutical analysis, making it a universally understood performance indicator [63].
However, RMSE also has important limitations:
- Sensitivity to Outliers: The squaring process gives disproportionate weight to larger errors, making RMSE sensitive to outliers [65] [63].
- Scale Dependence: Since RMSE is sensitive to the scale of the dependent variable, comparisons across different datasets or measurement units can be invalid without normalization [65] [63].
- Risk of Overfitting: RMSE can decrease when additional variables are added to a model, even through chance correlations, potentially creating the appearance of a better model [63].
Analytical Techniques for Impurity Profiling: UV-Vis vs. NMR
Ultraviolet-Visible (UV-Vis) Spectroscopy
UV-Vis spectroscopy measures the absorption of ultraviolet and visible light by molecules, which occurs with the excitation of electrons to higher energy molecular orbitals [66]. The resulting absorption spectrum varies with wavelength and provides a characteristic fingerprint for compound identification and quantification [66]. In pharmaceutical analysis, UV-Vis spectroscopy is routinely employed as part of high-performance liquid chromatography (HPLC) systems with photodiode array (PDA) detectors, enabling continuous spectrum measurement during chromatographic separation [66].
Recent advances include machine learning approaches like UV-adVISor, which utilizes Long-Short Term Memory (LSTM) and attention-based neural networks to predict UV-Vis spectra from molecular structures alone, achieving test set median RMSE values as low as 0.064 [66]. Modern UV-Vis-NIR spectrophotometers offer enhanced capabilities, with some models providing wavelength ranges from 165 to 3300 nm, high resolution (up to 0.1 nm), and ultra-low stray light (0.00005% at 340 nm) for improved accuracy [67].
Nuclear Magnetic Resonance (NMR) Spectroscopy
NMR spectroscopy is an information-rich analytical technique that provides detailed molecular structural information, including atomic connectivity, spatial geometry, conformation, and stereochemistry [43]. It functions as a quasi-universal detector for proton-bearing compounds, making it particularly valuable for organic impurity analysis [43]. In pharmaceutical impurity profiling, NMR can simultaneously detect and quantify multiple components in a sample without physical separation, a significant advantage over chromatographic methods [43].
Quantitative NMR (qNMR) leverages the linear relationship between integrated resonance intensities and molar contents, enabling both absolute quantification (using internal standards) and relative quantification [43]. While traditionally considered less sensitive than mass spectrometry, with limits of detection (LOD) in the low mM range, modern advancements including cryogenic probes, higher magnetic field strengths, and microcoil technology have enhanced NMR sensitivity to the nanomolar range [43]. NMR is particularly powerful for distinguishing between isomers—a challenge for mass spectrometric methods—and for de novo structural elucidation of unknown impurities [43].
Experimental Comparison: Methodologies and RMSE Assessment
Experimental Workflow for Technique Comparison
The following diagram illustrates a generalized experimental workflow for comparing UV-Vis and NMR techniques in impurity profiling, highlighting key stages where methodological differences arise and where RMSE can be calculated to assess performance.
Detailed Experimental Protocols
UV-Vis Spectroscopy Protocol for Impurity Analysis
Sample Preparation:
- Prepare stock solutions of reference standards and samples in appropriate solvents (methanol or DMSO) at concentrations of 200 μM [66].
- For HPLC-DAD analysis, utilize a C18 column with a mobile phase of water-acetonitrile-0.1% formic acid with an acetonitrile gradient [66].
- Alternatively, for direct spectrophotometer measurement, dilute samples 50-fold to 200 μM with water and transfer to UV-transparent microplates [66].
Data Acquisition:
- Acquire spectra across the 220-400 nm wavelength range in 1 nm increments [66].
- Determine compound retention times from extracted ion chromatograms (XIC) in HPLC-DAD analysis [66].
- Apply background subtraction to remove mobile phase contributions and normalize spectra by setting minimum absorbance to zero and maximum absorbance to 1.0 [66].
Quantification and RMSE Calculation:
- Develop calibration models using reference standards across expected concentration ranges.
- Predict unknown concentrations using established models.
- Calculate RMSE between predicted and known concentration values of validation samples [66] [63].
Quantitative NMR (qNMR) Protocol for Impurity Analysis
Sample Preparation:
- Dissolve approximately 10-50 mg of API sample in 0.6 mL of deuterated solvent [43].
- Add a precise amount of internal standard (e.g., 1,4-dinitrobenzene, maleic acid, or dimethyl terephthalate) with known purity for absolute quantification [43].
- For relative quantification of impurities, no internal standard is required [43].
Data Acquisition:
- Acquire ¹H NMR spectra at controlled temperature (typically 25-30°C) using a high-field spectrometer (≥400 MHz recommended) [43].
- Use sufficient relaxation delay (D1 ≥ 5 × T₁ of the slowest relaxing nucleus, typically 10-60 seconds) to ensure complete relaxation between pulses for accurate integration [43].
- Set acquisition time to approximately 4 seconds and collect enough transients (32-128) to achieve adequate signal-to-noise ratio for minor impurities [43].
Data Processing and RMSE Calculation:
- Apply Fourier transformation with 0.3-1.0 Hz line broadening and phase correction [43].
- Carefully integrate resolved resonance signals of both the API and impurities, ensuring flat baselines.
- Calculate impurity concentrations using the formula: ( C{imp} = (I{imp} / I{IS}) × (N{IS} / N{imp}) × (MW{imp} / MW{IS}) × W{IS} × P_{IS} ) where I = integral, N = number of nuclei, MW = molecular weight, W = weight, P = purity [43].
- Compare qNMR results with known reference values or results from orthogonal methods to calculate RMSE.
Essential Research Reagent Solutions
Table 1: Key Materials and Reagents for Impurity Profiling Studies
| Item | Function | Application Notes |
|---|---|---|
| Deuterated Solvents (DMSO-d₆, CDCl₃) | NMR solvent with minimal interference | Provides locking signal; choice affects solute solubility and chemical shifts [43] |
| qNMR Internal Standards (1,4-dinitrobenzene, maleic acid) | Absolute quantification reference | Must be highly pure, chemically stable, and have non-overlapping resonances [43] |
| HPLC-grade Solvents (methanol, acetonitrile) | Mobile phase and sample preparation | Low UV cutoff enables detection at lower wavelengths [66] |
| UV-Transparent Microplates | Low-volume sample holder | Enables high-throughput UV-Vis analysis with minimal sample consumption [66] |
| Reference Standards | Calibration and method validation | Certified reference materials with known purity are essential for accurate quantification |
Comparative Performance Data: RMSE and Other Metrics
Direct Comparison of Quantitative Accuracy
Table 2: Performance Comparison of UV-Vis and NMR for Impurity Profiling
| Parameter | UV-Vis Spectroscopy | NMR Spectroscopy |
|---|---|---|
| Typical RMSE Range | 0.064 (for normalized spectra) to higher values for concentration prediction [66] | Varies with application; generally lower for direct quantification due to universal response [43] |
| Sensitivity (LOD) | High (nanomolar range for strong chromophores) [66] | Moderate (nanomolar to micromolar range with modern probes) [43] |
| Linear Dynamic Range | ~3-4 orders of magnitude | 2-3 orders of magnitude [43] |
| Structural Information | Limited to chromophore characteristics | Comprehensive (connectivity, stereochemistry, dynamics) [43] |
| Isomer Differentiation | Limited unless chromophores differ | Excellent [43] |
| Sample Throughput | High (especially with automation) | Moderate to low |
| Key Advantages | High sensitivity for chromophores, suitable for automation, cost-effective | Universal detector for protons, absolute quantification without identical standards, rich structural data [43] |
| Major Limitations | Dependent on chromophore presence, limited structural information, potential interference | Lower sensitivity, higher equipment cost, requires specialized expertise [43] |
Case Study: Machine Learning-Enhanced UV-Vis Prediction
The UV-adVISor tool demonstrates the potential of machine learning in UV-Vis spectroscopy, approaching spectrum prediction as a sequence-to-sequence problem using Long-Short Term Memory (LSTM) and attention-based neural networks [66]. When trained on datasets of 949 and 2222 compounds, this approach achieved test set median RMSE values of 0.064 for normalized absorbance, with R² of 0.71 and dynamic time warping (DTW) of 0.194 for entire spectrum curves [66]. The model utilized various molecular representations including 1024-bit or 2048-bit ECFP6 fingerprints and tokenized SMILES strings to generate predictive models [66]. This demonstrates that advanced computational approaches can enhance the quantitative prediction capabilities of UV-Vis spectroscopy.
NMR for Impurity Profiling Without Reference Standards
A significant advantage of qNMR in impurity profiling is its ability to quantify components without requiring identical reference standards, unlike chromatographic methods that need a pure sample of each impurity for calibration [43]. This makes NMR particularly valuable during early drug development when impurity standards are unavailable [43]. The quantitative applications of NMR (qHNMR) are based on the nearly equal response of protons regardless of their chemical environment, enabling direct molar quantification through signal integration [43]. When properly validated, qNMR can serve as a primary analytical method with a fully defined uncertainty budget [43].
The comparison between UV-Vis and NMR spectroscopy for impurity profiling reveals complementary strengths that can be strategically leveraged throughout drug development. UV-Vis spectroscopy offers higher sensitivity and throughput for routine analysis of chromophore-containing compounds, particularly when enhanced with machine learning approaches [66]. NMR spectroscopy provides richer structural information and the unique capability for absolute quantification without identical reference standards, making it invaluable for structural elucidation of unknown impurities and method validation [43].
RMSE serves as a valuable metric for comparing the quantitative performance of these techniques, though its scale-dependent nature requires careful interpretation within the context of each application [63]. For pharmaceutical researchers, the technique selection should be guided by specific project needs: UV-Vis for high-throughput screening and routine quantification, and NMR for structural characterization and quantification of novel impurities. The integration of both techniques, potentially with RMSE used to validate consistency between methods, provides a comprehensive approach to impurity profiling that aligns with regulatory requirements and ensures drug product quality and safety.
Table 3: Technique Selection Guide for Specific Application Scenarios
| Application Scenario | Recommended Technique | Rationale |
|---|---|---|
| High-throughput screening | UV-Vis Spectroscopy | Superior speed and automation capability [66] |
| Structural elucidation of unknowns | NMR Spectroscopy | Comprehensive molecular structure information [43] |
| Early development (no standards) | qNMR | Absolute quantification without reference standards [43] |
| Isomeric impurity determination | NMR Spectroscopy | Excellent discrimination between isomers [43] |
| Routine quality control | UV-Vis Spectroscopy | Cost-effective with adequate accuracy for known impurities [66] |
| Method validation | Both (orthogonal confirmation) | Complementary techniques provide verification of results |
The identification and characterization of unknown impurities are critical steps in pharmaceutical development, essential for ensuring drug safety, efficacy, and regulatory compliance. Within the analytical scientist's toolkit, two powerful techniques often employed are Nuclear Magnetic Resonance (NMR) spectroscopy and Ultraviolet-Visible (UV-Vis) spectroscopy, particularly when coupled with separation techniques like High-Performance Liquid Chromatography (HPLC). While HPLC-UV is a mainstay for quantitative analysis in many laboratories, NMR provides unparalleled capabilities for structural elucidation that other techniques cannot match. This guide objectively compares these techniques within the context of impurity profiling, examining their fundamental principles, analytical performance, and practical applications to help researchers select the most appropriate methodology for their specific analytical challenges.
The core distinction lies in their informational output: UV-Vis detects the presence of chromophores based on light absorption, while NMR provides detailed information about the specific atomic environment, connectivity, and three-dimensional structure of molecules. For completely unknown impurities where structural information is absent, this difference becomes paramount. As this analysis will demonstrate, NMR's capacity for direct structural determination makes it an indispensable tool for comprehensive impurity profiling, despite UV-based methods maintaining advantages in certain quantitative applications.
Technical Comparison: NMR vs. HPLC-UV in Impurity Profiling
The following table summarizes the key technical characteristics of NMR and HPLC-UV in the context of impurity profiling:
Table 1: Technical Comparison of NMR and HPLC-UV for Impurity Profiling
| Parameter | NMR Spectroscopy | HPLC-UV |
|---|---|---|
| Primary Role in Impurity Profiling | Structural elucidation and identification of unknowns | Quantitative analysis and detection |
| Structural Specificity | High (Provides atomic connectivity, stereochemistry) | Low (Indirect, relies on retention time) |
| Quantitative Capability | Inherently quantitative (Area proportional to nuclei count) [4] | Requires calibration with pure standards |
| Sample Preparation | Minimal (Often direct dissolution) | Extensive (May require derivatization, extraction) |
| Detection Limits | ~0.01% at 400 MHz [15] | Can reach parts per billion (ppb) levels |
| Information Depth | Molecular structure, conformation, dynamics, interaction | Primarily concentration, limited structural hints |
| Multicomponent Analysis | Simultaneous identification and quantification of multiple components [4] | Possible, but requires separation and individual standards |
| Regulatory Status | SWGDRUG Category A technique [4] | Combination of Category B (HPLC) and C (UV) techniques [4] |
Analytical Performance: Experimental Data Comparison
Recent studies directly comparing these techniques reveal their complementary strengths. A 2025 study analyzing methamphetamine hydrochloride in complex mixtures demonstrated that benchtop NMR with Quantum Mechanical Modelling (QMM) achieved a root mean square error (RMSE) of 2.1 mg/100 mg, approaching the precision of HPLC-UV (RMSE of 1.1 mg/100 mg) [4]. This showcases NMR's robust quantitative capabilities while simultaneously identifying all mixture components—a key advantage over HPLC-UV.
For detection sensitivity, the performance gap narrows significantly with higher-field instruments. One investigation established that for impurity detection in pharmaceutical substances, a 400 MHz NMR instrument achieved a limit of detection (LOD) of 0.01%, while a 60 MHz benchtop NMR system had an LOD of 2% [15]. This confirms that high-field NMR easily meets International Conference on Harmonization (ICH) reporting thresholds for impurities (typically 0.05-0.10%).
Table 2: Experimental Performance Data from Comparative Studies
| Analysis Type | Technique | Performance Metric | Result | Reference |
|---|---|---|---|---|
| Methamphetamine HCl in mixtures | Benchtop NMR (QMM) | RMSE for quantification | 2.1 mg/100 mg | [4] |
| Methamphetamine HCl in mixtures | HPLC-UV | RMSE for quantification | 1.1 mg/100 mg | [4] |
| Impurity Detection | 400 MHz NMR | Limit of Detection (LOD) | 0.01% | [15] |
| Impurity Detection | 60 MHz Benchtop NMR | Limit of Detection (LOD) | 2% | [15] |
| Choline impurity analysis | 400 MHz NMR | Detectability of O-(2-hydroxyethyl)choline | Readily detected at ICH thresholds | [15] |
Structural Elucidation Capabilities: The NMR Advantage
NMR spectroscopy provides a comprehensive toolkit for structural elucidation that is particularly valuable for unknown impurities. Through a combination of one-dimensional and two-dimensional experiments, researchers can determine complete molecular structures without prior knowledge of the impurity.
Key NMR Experiments for Impurity Characterization
The following experiments form the core of NMR-based structural elucidation strategies:
- ¹H NMR: Provides information about the number, type, and environment of hydrogen atoms in a molecule, with chemical shifts indicating functional groups and integration values revealing relative proton counts [68].
- ¹³C NMR: Reveals the carbon skeleton of organic molecules, with chemical shifts sensitive to hybridization and substituent effects, though sensitivity is lower due to ¹³C's low natural abundance [69].
- COSY/TOCSY: Identifies protons that are coupled to each other through chemical bonds, establishing connectivity within molecular fragments [70] [68].
- HSQC/HMQC: Correlates protons directly bonded to carbon atoms, defining ¹H-¹³C pairs throughout the molecule [70] [68].
- HMBC: Detects long-range ¹H-¹³C couplings (typically 2-3 bonds), connecting molecular fragments through quaternary centers and establishing complete carbon frameworks [70] [68].
- NOESY/ROESY: Provides information about spatial proximity between protons (through-space interactions), critical for determining stereochemistry and conformation [68].
Diagram 1: NMR Structural Elucidation Workflow
Advanced NMR Applications in Impurity Profiling
¹⁹F NMR for Enhanced Specificity
For fluorinated pharmaceuticals, ¹⁹F NMR offers exceptional utility in impurity profiling due to its wide chemical shift range (±300 ppm compared to 0-10 ppm for ¹H NMR) and high sensitivity for fluorine-containing compounds [71]. This extensive dispersion means that even structurally similar fluorinated impurities are resolved, making ¹⁹F NMR ideal for detecting and quantifying process-related impurities and degradation products in fluorinated drugs. Advanced pulse sequences like CHORUS have been developed to overcome technical challenges in ¹⁹F NMR, enabling uniform excitation across wide bandwidths and accurate quantification better than 0.1% [71].
Solid-State NMR for Formulation Analysis
Quantitative Solid-State NMR (qSSNMR) has emerged as a powerful technique for analyzing solid drug formulations directly without dissolution, preserving critical physical form information that may be lost in solution-based analyses [72]. This capability is particularly valuable for characterizing polymorphism, crystalline-amorphous transitions, and detecting low-level components in intact dosage forms—aspects collectively known as Q3 quality attributes in pharmaceutical development [72]. Recent advancements including ultrafast magic-angle spinning (UF-MAS) at 60 kHz or higher and cryogenically cooled probes have dramatically improved resolution and sensitivity, making qSSNMR increasingly viable for routine impurity analysis in solid formulations [72].
Experimental Protocols for Impurity Analysis
NMR Method for Impurity Identification and Quantification
The standard workflow for comprehensive impurity characterization using NMR involves several key steps:
Sample Preparation: Dissolve approximately 10-50 mg of sample in 0.6-0.7 mL of deuterated solvent (e.g., DMSO-d₆, CDCl₃). For quantitative studies, add a known amount of internal standard such as maleic acid or 1,3,5-trimethoxybenzene [4] [70]. For trace analysis, use high-field instruments (≥400 MHz) with cryoprobes to enhance sensitivity [73] [15].
Data Acquisition: Acquire ¹H NMR spectrum with sufficient scans to achieve adequate signal-to-noise ratio (typically 16-128 scans). Use relaxation delays of at least 5 times the longitudinal relaxation time (T₁) of the nuclei of interest for quantitative accuracy [4]. For structural elucidation, acquire 2D spectra (COSY, HSQC, HMBC) as needed. For fluorinated compounds, implement ¹⁹F NMR with broadband excitation sequences like CHORUS for uniform excitation across wide chemical shift ranges [71].
Data Processing and Analysis: Apply Fourier transformation, phase correction, and baseline correction to 1D spectra. For quantitative analysis, use integration or advanced processing methods like Quantum Mechanical Modelling (QMM) or global spectral deconvolution (GSD) to resolve overlapping signals [4]. For structural identification, analyze chemical shifts, coupling constants, and 2D correlation data to propose and verify molecular structures.
HPLC-UV Method for Impurity Quantification
Chromatographic Conditions: Utilize a C18 reverse-phase column (250 × 4.6 mm, 5 μm particle size) maintained at 25-40°C. Employ gradient elution with mobile phase A (0.1% formic acid in water) and B (0.1% formic acid in acetonitrile) at flow rates of 0.8-1.5 mL/min [4] [10].
Detection: Set UV detection at appropriate wavelengths (e.g., 210-254 nm) based on the chromophores of the analyte and expected impurities [10].
Quantification: Prepare calibration curves using certified reference standards of the main component and known impurities. For unknown impurities, use the relative response factor of the parent drug unless more specific information is available [10].
Essential Research Reagent Solutions
The following table details key reagents and materials essential for implementing the described impurity profiling techniques:
Table 3: Essential Research Reagents for Impurity Profiling
| Reagent/Material | Function | Application Notes |
|---|---|---|
| Deuterated Solvents (DMSO-d₆, CDCl₃, CD₃OD) | NMR solvent providing lock signal | Choice affects chemical shifts and solubility; must be >99.8% deuterated |
| Quantitative NMR Standards (Maleic acid, 1,3,5-trimethoxybenzene) | Internal standards for quantification | Must be chemically inert, pure, and have resolved signals |
| HPLC-grade Solvents (Acetonitrile, methanol) | Mobile phase components | Low UV cutoff, high purity to minimize background interference |
| Reference Standards | Calibration and identification | Certified reference materials for target analytes and known impurities |
| NMR Tubes (5 mm, 7 inch) | Sample containment for NMR analysis | High-quality Wilmad or equivalent for reproducible results |
| SPE Cartridges (C18, ion exchange) | Sample cleanup and impurity enrichment | Pre-concentrate trace impurities for enhanced detection |
| HPLC Columns (C18, 250 × 4.6 mm) | Chromatographic separation | 5 μm particle size for optimal resolution of complex mixtures |
NMR spectroscopy and HPLC-UV represent complementary but fundamentally different approaches to impurity profiling. While HPLC-UV remains the gold standard for sensitive quantification of known substances, NMR provides unparalleled capabilities for structural elucidation of complete unknowns—a critical advantage in pharmaceutical development where unidentified impurities may pose significant safety risks.
The choice between these techniques should be guided by the specific analytical question: HPLC-UV excels at answering "how much" of known substances are present, while NMR is uniquely capable of answering "what" the impurity is structurally. For comprehensive impurity profiling, the most effective strategy often incorporates both techniques, leveraging their complementary strengths to ensure both the identification and accurate quantification of impurities throughout the drug development process.
As NMR technology continues to advance with improvements in sensitivity, accessibility of benchtop systems, and development of specialized techniques like ¹⁹F NMR and qSSNMR, its role in impurity profiling is expanding beyond specialized laboratories into mainstream pharmaceutical analysis, offering researchers powerful tools to ensure drug safety and quality.
In the rigorous world of pharmaceutical analysis and impurity profiling, the selection of an appropriate analytical technique is fundamental to ensuring drug safety, efficacy, and quality. High-Performance Liquid Chromatography with Ultraviolet detection (HPLC-UV) is widely regarded as the gold standard for quantitative analysis, particularly in regulatory and quality control environments [74]. Its prominence stems from exceptional precision, reliability, and a well-established regulatory framework. However, techniques like Ultraviolet-Visible (UV-Vis) spectroscopy and Nuclear Magnetic Resonance (NMR) spectroscopy offer distinct advantages for specific applications. UV-Vis spectroscopy is celebrated for its simplicity and speed, making it ideal for high-throughput concentration assays, while NMR spectroscopy provides unparalleled structural elucidation capabilities, allowing for the identification of unknown impurities without the need for reference standards [23].
This guide provides an objective, data-driven comparison of these three pivotal techniques. For researchers in drug development, understanding the relative strengths, limitations, and performance metrics of HPLC-UV, UV-Vis, and NMR is critical for making informed decisions, whether for routine quality control or advanced impurity profiling of novel compounds.
Performance Comparison: Quantitative Data
The following tables summarize key performance characteristics and quantitative data from comparative studies, highlighting how UV-Vis and NMR measure against the HPLC-UV benchmark.
Table 1: Overall Comparison of Analytical Technique Characteristics
| Feature | HPLC-UV | UV-Vis Spectroscopy | NMR Spectroscopy |
|---|---|---|---|
| Primary Role in Pharma | Gold standard for quantification & impurity profiling [23] [74] | Routine concentration analysis & dissolution testing [23] | Structural elucidation & quantitative NMR (qNMR) [23] |
| Quantitative Precision | Very High (<0.2% RSD) [74] | High [23] | High (comparable to HPLC) [11] [75] |
| Sensitivity | Excellent (LOD in ppm range) [76] | Good (depends on molar absorptivity) [23] | Moderate (vs. HPLC-UV) [4] |
| Structural Specificity | Low (relies on retention time) [23] | Low (confirms chromophore presence) | Very High (identifies structures directly) [23] |
| Analysis Speed | Minutes to tens of minutes | Seconds to minutes | Minutes to tens of minutes |
| Sample Preparation | Can be complex | Simple | Requires deuterated solvents [23] |
| Key Advantage | High precision, universal response for chromophores [74] | Speed, cost-effectiveness, ease of use [23] | Simultaneous identification & quantification, no standards needed [4] |
Table 2: Summary of Comparative Quantitative Study Results
| Study Focus | HPLC-UV Performance | Benchtop NMR with QMM Performance | UV-Vis Performance | Conclusion |
|---|---|---|---|---|
| Methamphetamine Analysis [4] | RMSE: 1.1 mg/100 mg (across all samples) | RMSE: 2.1 mg/100 mg (across all samples) | Not Tested | HPLC-UV showed higher precision, but benchtop NMR with QMM is a robust, complementary tool. |
| Bakuchiol in Cosmetics [11] [75] | Quantified bakuchiol in commercial serums (e.g., 0.51% in Sample 1) | Results comparable to HPLC analysis; significantly shorter analysis time. | Could not properly quantify bakuchiol in emulsion-type samples (5 & 6) | ¹H NMR is a viable alternative to HPLC for quality control of bakuchiol, while UV-Vis failed for complex emulsions. |
Detailed Experimental Protocols
To contextualize the data in the tables above, the following sections detail the specific methodologies employed in the cited comparative studies.
Protocol 1: Quantification of Methamphetamine via Benchtop NMR and HPLC-UV
This study directly benchmarked a modern benchtop NMR approach against the established HPLC-UV method [4].
- Objective: To quantify methamphetamine hydrochloride (MA) in binary and ternary mixtures containing cutting agents and impurities.
- Sample Preparation: Mixtures containing 10-90 mg of MA per 100 mg of sample were prepared. Components included methylsulfonylmethane (MSM), N-isopropylbenzylamine hydrochloride, caffeine, phenethylamine hydrochloride, and pseudoephedrine hydrochloride.
- HPLC-UV Method:
- Chromatographic Conditions: Specific column and mobile phase not detailed in the provided excerpt.
- Detection: UV detection.
- Quantification: RMSE of 1.1 mg/100 mg for MA purity across all samples.
- Benchtop NMR Method:
- Instrumentation: 60-MHz benchtop NMR spectrometer.
- Data Processing: Spectra were processed using integration, global spectral deconvolution (GSD), and a quantitative quantum mechanical model (QMM).
- Quantification: The QMM approach achieved an RMSE as low as 1.3 mg/100 mg for binary/ternary mixtures and 2.1 mg/100 mg across all samples, demonstrating its effectiveness despite lower resolution than high-field NMR.
- Conclusion: While HPLC-UV maintained superior precision, benchtop NMR with QMM proved to be a cost-effective and robust alternative capable of simultaneous quantification of multiple components.
Protocol 2: Quantification of Bakuchiol in Cosmetics via ¹H qNMR and HPLC-UV
This study evaluated methods for the quality control of a natural product in complex cosmetic matrices [11] [75].
- Objective: To quantify bakuchiol in six commercial cosmetic serums (oil solutions and emulsions).
- Sample Preparation: Samples were dissolved or extracted as appropriate for each technique. For NMR, an internal standard (nicotinamide) was used for quantification.
- UV-Vis Method:
- Analysis: Samples and standard were analyzed in ethanol at 262 nm.
- Limitation: Failed to fully dissolve and quantify bakuchiol in oil-in-water emulsion samples (5 and 6), though the compound's presence was inferred.
- HPLC-UV Method:
- Chromatographic Conditions: Reverse-phase C18 column with isocratic elution (acetonitrile with 1% formic acid).
- Detection: DAD at 260 nm.
- Quantification: Successfully quantified bakuchiol in all suitable samples, revealing one product contained only 50% of its declared content (0.51% vs. declared 1%).
- ¹H qNMR Method:
- Instrumentation: Not specified in excerpt, but standard high-field instrument implied.
- Quantification: Used characteristic signals in the aromatic and olefinic region (above 5.5 ppm) to minimize interference from excipient signals.
- Result: Achieved results comparable to HPLC with a significantly shorter total analysis time.
- Conclusion: ¹H qNMR is a reliable and efficient technique for the routine quality control of bakuchiol in cosmetic products, whereas UV-Vis was found unsuitable for complex emulsion formulations.
Experimental Workflow and Performance Relationship
The following diagram illustrates the logical relationship and comparative workflow between the three analytical techniques in a typical impurity profiling context.
Research Reagent Solutions
A successful analytical method relies on high-quality reagents and materials. The table below lists key items mentioned in the featured studies.
Table 3: Essential Research Reagents and Materials
| Item | Function in Analysis | Example from Studies |
|---|---|---|
| Deuterated Solvents | Provides the lock signal for NMR spectroscopy; dissolves sample without interfering proton signals. | CDCl₃ was used for bakuchiol standard and sample analysis [11] [75]. |
| Internal Standard (for qNMR) | A compound of known purity and concentration used as a reference for quantifying the target analyte. | Nicotinamide was selected for bakuchiol qNMR due to its stability and suitable solubility [11] [75]. |
| HPLC-Grade Solvents & Buffers | Serve as the mobile phase for HPLC; high purity is critical to minimize baseline noise and ghost peaks. | Acetonitrile with 1% formic acid was used for bakuchiol separation [11] [75]. A 1:1 mix of 0.1% H₃PO₄ and ACN was used for genotoxin analysis [76]. |
| Certified Reference Standards | Used for calibration, identification, and quantification in both HPLC-UV and UV-Vis methods. | A bakuchiol standard was essential for HPLC calibration and UV-Vis spectral comparison [11] [75]. |
| Reverse-Phase HPLC Column | The stationary phase where chemical separation occurs based on hydrophobicity. | Endcapped C18 columns were used for bakuchiol and genotoxin separations [11] [76]. |
HPLC-UV rightly maintains its status as the gold standard for quantitative analysis in pharmaceutical quality control, offering unmatched precision and sensitivity for impurity profiling, as evidenced by its lower RMSE in direct comparisons [4]. However, the landscape of analytical techniques is not one of replacement but of strategic complementarity.
UV-Vis spectroscopy remains a powerful tool for rapid, high-throughput concentration checks of pure compounds but shows significant limitations in complex mixtures where specificity is required [11] [75]. NMR spectroscopy, particularly with advances in quantitative methods (qNMR) and benchtop technology, has emerged as a formidable complementary technique. It provides definitive structural information and can achieve quantification comparable to HPLC, often with simpler sample preparation and without the absolute need for analyte-specific reference standards [4] [23]. The choice between these techniques is not a matter of which is universally better, but which is most fit-for-purpose based on the required balance of structural specificity, quantitative precision, analytical speed, and cost.
Impurity profiling is a fundamental component of pharmaceutical development and quality control, essential for ensuring drug safety, efficacy, and stability. Even trace amounts of impurities can pose significant toxicological risks, making their identification and quantification critical for regulatory compliance and public health protection [10]. The process involves the systematic identification, isolation, and structural elucidation of unknown substances that may arise from synthesis processes, excipients, residual solvents, or degradation products [10]. Within this framework, spectroscopic techniques play a pivotal role, with Ultraviolet-Visible (UV-Vis) spectroscopy and Nuclear Magnetic Resonance (NMR) spectroscopy representing two powerful but fundamentally different analytical approaches.
The strategic selection between UV-Vis and NMR spectroscopy depends on multiple factors, including the project's specific goals, required detection limits, structural information needs, and operational constraints. UV-Vis spectroscopy measures the absorbance of ultraviolet or visible light by compounds as they transition between electronic energy levels, making it particularly advantageous for routine quantification of known compounds that absorb in the 190–800 nm range [23]. In contrast, NMR spectroscopy investigates the magnetic properties of atomic nuclei (particularly hydrogen-1 and carbon-13) to reveal detailed information about molecular structure, dynamics, and environment [23] [77]. This article provides a comprehensive, data-driven comparison of these techniques, employing a decision matrix framework to guide researchers and drug development professionals in selecting the optimal methodology based on specific project requirements and analytical goals.
Technical Comparison: UV-Vis vs. NMR Spectroscopy
Fundamental Principles and Analytical Capabilities
UV-Vis and NMR spectroscopy operate on fundamentally different physical principles, which directly dictate their respective applications in impurity profiling. UV-Vis spectroscopy measures electronic transitions, where molecules absorb electromagnetic radiation in the ultraviolet or visible regions, promoting electrons from ground state to excited state molecular orbitals. The resulting absorption spectra provide information primarily about chromophores—functional groups that absorb specific wavelengths—making the technique highly effective for concentration determination but limited in structural elucidation capability [23].
NMR spectroscopy, conversely, exploits the magnetic properties of certain atomic nuclei when placed in a strong static magnetic field. nuclei with nonzero nuclear spin quantum numbers possess a nuclear magnetic moment that enables alignment in an external magnetic field and absorption of applied radiofrequency radiation [77]. The resulting NMR spectrum contains rich structural information through several parameters: chemical shift (δ), which reveals the nuclei's chemical environment; spin-spin scalar J coupling, which provides information about connectivity between atoms; and signal integration, where peak area is directly proportional to the number of nuclei, enabling inherent quantification [77]. This makes NMR a powerful tool for structural elucidation of unknown impurities and simultaneous quantification of multiple components without requiring specific standards for each analyte [4].
Table 1: Fundamental Characteristics of UV-Vis and NMR Spectroscopy
| Characteristic | UV-Vis Spectroscopy | NMR Spectroscopy |
|---|---|---|
| Physical Principle | Electronic transitions between molecular orbitals | Nuclear spin transitions in magnetic field |
| Structural Information | Limited to chromophore identification | Detailed atomic environment, connectivity, and stereochemistry |
| Quantitation Basis | Beer-Lambert Law (Absorbance vs. Concentration) | Direct signal integration (Area ∝ Number of Nuclei) |
| Primary Applications | Concentration determination, dissolution testing, impurity monitoring | Structural elucidation, impurity identification, simultaneous multi-component quantification |
| Sample Requirements | Optically clear solutions, minimal particulate matter | Deuterated solvents, filtered samples to maintain homogeneity |
Performance Metrics and Experimental Data
Direct comparative studies provide valuable insights into the relative performance of UV-Vis and NMR for specific pharmaceutical applications. A 2025 study investigating the quantification of methamphetamine hydrochloride in complex mixtures offers compelling experimental data for comparison. Researchers evaluated benchtop NMR with quantum mechanical modeling (QMM) against the established HPLC-UV methodology, revealing root mean square error (RMSE) values of 2.1 mg/100 mg for NMR and 1.1 mg/100 mg for HPLC-UV across all samples [4]. This demonstrates that while HPLC-UV maintains slightly greater precision, benchtop NMR with advanced processing provides comparable and pharmaceutically acceptable accuracy for purity quantification.
The same study comprehensively assessed multiple NMR processing approaches for determining methamphetamine hydrochloride purity in binary and ternary mixtures, with purity levels ranging from approximately 10 to 90 mg per 100 mg of sample. The root mean square error values spanned from 4.7 mg analyte per 100 mg sample for simple integration down to 1.3 mg analyte per 100 mg sample for the quantitative quantum mechanical model (QMM) [4]. This progression highlights how advanced processing methods significantly enhance NMR quantification capabilities, making it increasingly competitive with chromatographic techniques for impurity assessment.
Table 2: Quantitative Performance Comparison for Methamphetamine Hydrochloride Analysis
| Analytical Technique | RMSE (mg/100 mg) | Application Context | Key Advantages |
|---|---|---|---|
| HPLC-UV | 1.1 | Purity quantification across all samples | High precision, established methodology |
| Benchtop NMR with QMM | 1.3-2.1 | Purity quantification in binary/ternary mixtures | Simultaneous identification and quantification, reduced solvent use |
| NMR with Integration | 4.7 | Basic purity assessment | Simple implementation, inherent quantification |
| NMR with qGSD | Intermediate values | Mixture analysis | Improved handling of overlapping signals |
For impurity profiling specifically, UV-Vis plays a valuable role in detecting impurities through unexpected absorption peaks, though it may lack the specificity to identify them structurally [23]. NMR spectroscopy excels in impurity profiling because it can reveal the presence of structurally similar or trace-level components through detailed spectral interpretation, often without requiring pre-separation [23]. This capability is particularly valuable for identifying novel degradation products or process-related impurities where reference standards are unavailable.
Experimental Protocols and Methodologies
Standardized Workflow for Impurity Profiling
A systematic approach to impurity profiling ensures comprehensive detection and identification of potential impurities, regardless of the analytical techniques employed. The following workflow diagram illustrates the standardized protocol for impurity profiling using complementary analytical techniques:
Diagram 1: Comprehensive Impurity Profiling Workflow - This standardized protocol integrates UV-Vis and NMR techniques within a systematic framework for impurity identification and quantification.
Detailed UV-Vis Spectroscopy Protocol for Impurity Assessment
Methodology: Following established pharmaceutical QA/QC protocols [23] with enhancements for impurity detection.
Sample Preparation:
- Prepare optically clear solutions using appropriate solvents (methanol, water, or buffer solutions) compatible with the analyte and selected wavelength range.
- Ensure absorbance readings fall within the optimal linear range (0.1-1.0 AU) through appropriate dilution.
- Use matched quartz cuvettes and clean glassware to minimize measurement errors.
- Filter samples through 0.45μm or 0.22μm membranes to eliminate particulate matter causing light scattering.
Instrumental Parameters:
- Wavelength range: 190-800 nm
- Scan speed: Moderate (approximately 240 nm/min for high-resolution spectra)
- Slit width: 1-2 nm for balanced resolution and sensitivity
- Data interval: 0.5-1 nm
- Temperature control: 25°C unless studying temperature effects
Data Analysis:
- Record absorption spectra of sample and standard solutions.
- Identify unknown impurities through unexpected absorption peaks or shoulder peaks.
- Apply second-derivative spectroscopy to resolve overlapping absorption bands.
- Calculate impurity levels using validated calibration curves or by applying the Beer-Lambert law with established molar absorptivity values.
Comprehensive NMR Spectroscopy Protocol for Impurity Identification
Methodology: Adapted from protocols used in pharmaceutical NMR analysis [4] [77] with specific applications for impurity profiling.
Sample Preparation:
- Dissolve approximately 2-10 mg of sample in 600 μL of high-purity deuterated solvent (CDCl₃, DMSO-d₆, or D₂O).
- Filter or centrifuge samples to eliminate undissolved solids that broaden spectral lines.
- Add 0.01-0.1% tetramethylsilane (TMS) or trimethylsilylpropanoic acid (TSP) as internal chemical shift reference.
- Use high-quality NMR tubes that are clean and free of scratches to maintain magnetic field homogeneity.
Data Acquisition (1D ¹H NMR):
- Temperature: 298 K unless otherwise required
- Spectral width: 12-16 ppm (covering entire ¹H chemical shift range)
- Pulse sequence: Standard single-pulse or water suppression sequences as needed
- Relaxation delay: 5×T1 (typically 3-5 seconds for small molecules)
- Number of scans: 16-128 depending on concentration and sensitivity requirements
- Acquisition time: 2-4 seconds
Advanced 2D NMR Experiments for Structural Elucidation:
- ¹H-¹H COSY (Correlation Spectroscopy): Through-bond correlations between coupled protons
- ¹H-¹³C HSQC (Heteronuclear Single Quantum Coherence): Direct ¹H-¹³C connectivity
- ¹H-¹³C HMBC (Heteronuclear Multiple Bond Correlation): Long-range ¹H-¹³C connectivity (2-3 bonds)
- NOESY/ROESY: Through-space interactions for stereochemical assignment
Quantitative Analysis:
- Use relaxation delays of至少 5×T1 for accurate integration
- Process with exponential line broadening (0.3-1.0 Hz) before Fourier transformation
- Apply phase and baseline correction for accurate integration
- For complex mixtures, employ quantum mechanical modeling (QMM) or global spectral deconvolution (GSD) to resolve overlapping signals [4]
Decision Matrix for Technique Selection
Strategic Framework for Method Selection
The choice between UV-Vis and NMR spectroscopy for impurity profiling depends on multiple project-specific factors. The following decision matrix provides a systematic approach for selecting the most appropriate technique based on project goals, sample characteristics, and operational constraints:
Diagram 2: Technique Selection Decision Matrix - A systematic framework for selecting between UV-Vis and NMR spectroscopy based on specific project requirements and constraints.
Application-Based Selection Guidelines
UV-Vis Spectroscopy is Recommended When:
- The primary requirement is routine quantification of known impurities with available reference standards
- High-throughput analysis is needed for quality control in manufacturing environments
- Project resources are limited in terms of instrumentation budget and technical expertise
- Sample compounds contain characteristic chromophores with sufficient molar absorptivity
- Impurity levels are relatively high (>1%) and structural identity is already established
- Rapid analysis time is critical for process monitoring or stability testing
NMR Spectroscopy is Preferred When:
- Structural elucidation of unknown impurities is required
- Reference standards for suspected impurities are unavailable or difficult to obtain
- Simultaneous identification and quantification of multiple components is needed [4]
- Sample is a complex mixture requiring minimal sample preparation [77]
- Stereochemical information or molecular dynamics data is relevant to impurity characterization
- Absolute quantification without reference standards is necessary through quantitative NMR (qNMR)
Hybrid Approaches are Advised When:
- Comprehensive impurity profiling requires both structural identification and precise quantification
- Novel impurities are detected during stability studies and require characterization
- Regulatory submissions demand orthogonal method verification
- Method validation requires confirmation of results across different analytical principles
Essential Research Reagents and Materials
Core Materials for Effective Impurity Profiling
Successful impurity profiling requires carefully selected reagents and materials optimized for each analytical technique. The following table details essential research solutions and their specific functions in pharmaceutical impurity analysis:
Table 3: Essential Research Reagents and Materials for Impurity Profiling
| Reagent/Material | Function | Technique | Critical Quality Parameters |
|---|---|---|---|
| High-Purity Deuterated Solvents (CDCl₃, DMSO-d₆, D₂O) | NMR solvent with minimal interference; provides lock signal | NMR | Isotopic purity >99.8%, water content <0.01%, chemical purity |
| Chemical Shift Reference Standards (TMS, TSP) | Internal chemical shift calibration (0 ppm) | NMR | Volatility (TMS) or non-volatility (TSP) depending on application |
| UV-Vis Grade Solvents (HPLC-grade methanol, acetonitrile, water) | Sample dissolution and dilution with minimal UV absorbance | UV-Vis | UV transmittance specifications, particulate-free, low fluorescence |
| Quartz Cuvettes | Contain samples for UV-Vis measurement without absorbing UV light | UV-Vis | Precise pathlength, matched pairs, scratch-free optical surfaces |
| NMR Tubes | Contain samples while maintaining magnetic field homogeneity | NMR | Concentricity, camber, wall thickness uniformity |
| Chromatography Reference Standards | Impurity identification and quantification | UV-Vis/HPLC | Certified purity, stability, proper storage conditions |
| Sample Filtration Units (0.45μm, 0.22μm membranes) | Remove particulate matter that causes light scattering | UV-Vis/NMR | Membrane compatibility with solvent, low extractables |
| pH Buffer Solutions | Control ionization state for consistent spectra | UV-Vis/NMR | Buffer capacity, UV transparency, temperature stability |
The strategic selection between UV-Vis and NMR spectroscopy for impurity profiling depends fundamentally on the specific analytical goals, project constraints, and information requirements. UV-Vis spectroscopy offers distinct advantages for high-throughput quantitative analysis of known impurities, particularly when reference standards are available and structural information is already established. Its simplicity, cost-effectiveness, and rapid analysis time make it ideal for routine quality control applications in pharmaceutical manufacturing and stability testing.
NMR spectroscopy provides unparalleled capabilities for structural elucidation of unknown impurities, simultaneous identification and quantification of multiple components, and analysis of complex mixtures with minimal sample preparation. The inherent quantitative nature of NMR, combined with its ability to characterize compounds without reference standards, makes it particularly valuable for investigating novel degradation products, process-related impurities, and complex mixture analysis.
For comprehensive impurity profiling programs, a hybrid approach leveraging the complementary strengths of both techniques often provides the most scientifically rigorous solution. UV-Vis can serve as an efficient screening tool to detect potential impurities, while NMR delivers definitive structural characterization of unknown compounds. As demonstrated by experimental data, advanced processing methods like quantum mechanical modeling continue to enhance NMR quantification capabilities, narrowing the performance gap with UV-based techniques while maintaining NMR's superior structural elucidation power. By applying the decision matrix and selection guidelines presented in this article, researchers and drug development professionals can make informed, strategic choices that optimize analytical outcomes while efficiently allocating resources throughout the pharmaceutical development lifecycle.
Conclusion
Both UV-Vis and NMR spectroscopy offer distinct and powerful pathways for impurity profiling. While UV-Vis remains a rapid, cost-effective tool for quantifying chromophores, NMR, particularly with advancements in benchtop technology and quantum mechanical modelling, provides unparalleled structural elucidation and the ability to simultaneously identify and quantify multiple components without extensive calibration. The choice between them is not a matter of superiority but of strategic application. Future directions will likely see increased integration of these techniques, leveraging their complementary strengths with chemometrics and hybrid methodologies to meet the growing demands of complex drug formulations and stringent global regulatory standards, ultimately ensuring greater drug safety and efficacy.
References
- 1. How NMR Spectroscopy is different from UV- Visible ... [https://lab-training.com/how-nmr-spectroscopy-is-different-from-uv-visible-spectroscopy/]
- 2. Electronic Spectra: Ultraviolet and Visible Spectroscopy [https://chem.libretexts.org/Bookshelves/Organic_Chemistry/Map%3A_Organic_Chemistry_(Vollhardt_and_Schore)/14%3A_Delocalized_Pi_Systems%3A_Investigation_by_Ultraviolet_and_Visible_Spectroscopy/14.11%3A_Electronic_Spectra%3A__Ultraviolet_and__Visible__Spectroscopy]
- 3. Nuclear magnetic resonance [https://en.wikipedia.org/wiki/Nuclear_magnetic_resonance]
- 4. Comparative Analysis of Benchtop NMR and HPLC‐UV for ... [https://pmc.ncbi.nlm.nih.gov/articles/PMC12500361/]
- 5. Introduction To UV-Vis Spectroscopy [https://www.masterorganicchemistry.com/2016/09/16/introduction-to-uv-vis-spectroscopy/]
- 6. Applications of UV-Vis, IR, and NMR in Modern Research [https://imgroupofresearchers.com/spectroscopy-in-action-applications-of-uv-vis-ir-and-nmr-in-modern-research/]
- 7. NMR - Theory [https://chem.libretexts.org/Bookshelves/Physical_and_Theoretical_Chemistry_Textbook_Maps/Supplemental_Modules_(Physical_and_Theoretical_Chemistry)/Spectroscopy/Magnetic_Resonance_Spectroscopies/Nuclear_Magnetic_Resonance/NMR_-_Theory]
- 8. NMR Spectroscopy [https://www2.chemistry.msu.edu/faculty/reusch/virttxtjml/spectrpy/nmr/nmr2.htm]
- 9. Difference Between UV, IR, and NMR Spectroscopy [https://www.creative-biostructure.com/difference-between-uv-ir-and-nmr-spectroscopy.htm?srsltid=AfmBOoqggT12y0zwpVFOjhPiqTlacv9gAT1bqIMpUuHLqpBO1xKyKOYF]
- 10. Advances in Impurity Profiling of Pharmaceutical ... [https://biomedres.us/fulltexts/BJSTR.MS.ID.009393.php]
- 11. Comparison of Quantification Using UV-Vis, NMR, and ... [https://www.mdpi.com/1422-0067/26/14/6638]
- 12. Analytical challenges in the mavacamten impurity analysis [https://www.sciencedirect.com/science/article/abs/pii/S0019452225005175]
- 13. Unlocking Catalytic Insights with UV–vis–NIR Absorption ... [https://www.spectroscopyonline.com/view/unlocking-catalytic-insights-with-uv-vis-nir-absorption-spectroscopy]
- 14. Uv–Vis molecular spectral resolution of multi-level mixture ... [https://www.sciencedirect.com/science/article/abs/pii/S0026265X24001334]
- 15. Pharmaceutical analysis by NMR can accommodate strict ... [https://www.sciencedirect.com/science/article/pii/S0731708522001303]
- 16. Study on the Impurity Profile and its Correlation with ... [https://pubmed.ncbi.nlm.nih.gov/40257428/]
- 17. UV/VIS Spectroscopy Applications in Chemistry [https://www.avantes.com/applications/cases/uv-vis-spectroscopy-applications-in-chemistry/]
- 18. Absolute Quantitative 1H NMR Spectroscopy for ... [https://pmc.ncbi.nlm.nih.gov/articles/PMC4255678/]
- 19. Impurity profiling and stability-indicating method ... [https://pubmed.ncbi.nlm.nih.gov/34331472/]
- 20. Fully Integrated Analysis of Metabolites, Impurities, and ... [https://www.spectroscopyonline.com/view/fully-integrated-analysis-metabolites-impurities-and-degradants-using-lc-nmr-ms]
- 21. Combined In Situ Illumination‐NMR‐UV/Vis Spectroscopy [https://pmc.ncbi.nlm.nih.gov/articles/PMC6033024/]
- 22. ICH M7 Control Option 4: How To Confidently Demonstrate ... [https://www.lhasalimited.org/blog/satisfy-ich-m7-control-option-4/]
- 23. Spectroscopic Methods in Pharma QA/QC: UV-Vis, IR, and ... [https://www.labmanager.com/spectroscopic-methods-in-pharma-qa-qc-uv-vis-ir-and-nmr-applications-34005]
- 24. Difference Between UV, IR, and NMR Spectroscopy [https://www.creative-biostructure.com/difference-between-uv-ir-and-nmr-spectroscopy.htm?srsltid=AfmBOoqrL-9CkkVq74Cb9pMiDeQllj8hy9pN-_w8nsg-prvJd7A5KSTS]
- 25. 4.12: UV-Visible Spectroscopy - Chemistry LibreTexts [https://chem.libretexts.org/Courses/University_of_Illinois_Springfield/Introduction_to_Organic_Spectroscopy/4:_Conjugated_Compounds_and_Ultraviolet_Spectroscopy/4.12:_UV-Visible_Spectroscopy]
- 26. Ultraviolet–visible spectroscopy - Wikipedia [https://en.wikipedia.org/wiki/Ultraviolet%E2%80%93visible_spectroscopy]
- 27. UV-Vis Spectroscopy: Principle, Strengths and Limitations and Applications | Technology Networks [https://www.technologynetworks.com/analysis/articles/uv-vis-spectroscopy-principle-strengths-and-limitations-and-applications-349865]
- 28. Complex Impurity Products: The Hidden Challenge in ... [https://www.simsonpharma.com/us/blog-details/complex-impurity-products-the-hidden-challenge-in-modern-chemistry]
- 29. What Is the Accuracy of Quantitative Analysis by Low-Field ... [https://link.springer.com/article/10.1007/s00723-025-01804-w]
- 30. High-Accuracy Quantitative Nuclear Magnetic Resonance ... [https://pmc.ncbi.nlm.nih.gov/articles/PMC12509184/]
- 31. Comparative Analysis of Benchtop NMR and HPLC-UV for ... [https://pubmed.ncbi.nlm.nih.gov/40820675/]
- 32. Quantifying Illicit Drugs: Benchtop NMR as a Cost-Effective ... [https://simplyforensic.com/quantifying-illicit-drugs-benchtop-nmr-as-a-cost-effective-forensic-solution/]
- 33. 1H and 31P benchtop NMR of liquids and solids used in ... [https://www.sciencedirect.com/science/article/abs/pii/S0379073817302335]
- 34. Forensic Drug Analysis [https://magritek.com/applications/forensic-drug-analysis/]
- 35. Quantification of mixtures of analogues of illicit substances ... [https://www.sciencedirect.com/science/article/abs/pii/S1090780721002275]
- 36. Quantification of mixtures of analogues of illicit substances ... [https://ui.adsabs.harvard.edu/abs/2022JMagR.33507138L/abstract]
- 37. Quantitative NMR as a tool for analysis of new ... [https://www.sciencedirect.com/science/article/abs/pii/S2468170920300709]
- 38. methylamine hydrochloride by Fourier-transform infrared ... [https://www.sciencedirect.com/science/article/abs/pii/S0731708521004489]
- 39. methylamine hydrochloride by Fourier-transform infrared ... [https://pubmed.ncbi.nlm.nih.gov/34474232/]
- 40. Recent Research in Chemometrics and AI for ... [https://www.spectroscopyonline.com/view/recent-research-in-chemometrics-and-ai-for-spectroscopy-part-i-foundations-definitions-and-the-integration-of-artificial-intelligence-in-chemometric-analysis]
- 41. 2025 Pharma Trends: Structure elucidation services by NMR [https://resolvemass.ca/structure-elucidation-services-by-nmr/]
- 42. Pharmaceutical impurities and degradation products [https://pubmed.ncbi.nlm.nih.gov/24853620/]
- 43. Pharmaceutical impurities and degradation products [https://www.sciencedirect.com/science/article/abs/pii/S0731708514002076]
- 44. Comprehensive review on impurity profiling, control ... [https://link.springer.com/article/10.1007/s44371-025-00329-2]
- 45. Pharmaceutical Analysis by NMR Can Accommodate Strict ... [https://pmc.ncbi.nlm.nih.gov/articles/PMC9038706/]
- 46. 4.7: NMR Spectroscopy [https://chem.libretexts.org/Bookshelves/Analytical_Chemistry/Physical_Methods_in_Chemistry_and_Nano_Science_(Barron)/04%3A_Chemical_Speciation/4.07%3A_NMR_Spectroscopy]
- 47. Deconvolution of Chemical Mixtures with High Complexity ... [https://pmc.ncbi.nlm.nih.gov/articles/PMC3244875/]
- 48. Operando UV/Vis spectra deconvolution for ... [https://www.sciencedirect.com/science/article/abs/pii/S1572665722009043]
- 49. Near UV-Vis and NMR Spectroscopic Methods for Rapid ... [https://pmc.ncbi.nlm.nih.gov/articles/PMC7764626/]
- 50. NMR Sample Preparation - Chemical Instrumentation Facility [https://www.cif.iastate.edu/nmr/nmr-tutorials/sample-preparation]
- 51. NMR Sample Preparation [https://cse.umn.edu/chem/nmr-sample-preparation]
- 52. Guide: Preparing a Sample for NMR analysis – Part I [https://www.nanalysis.com/nmready-blog/2024/2/28/guide-preparing-a-sample-for-nmr-analysis-part-i]
- 53. Why is NMR Low in Sensitivity? [https://www.azom.com/article.aspx?ArticleID=23801]
- 54. Active drug substance impurity profiling: Part I. LC/UV ... [https://www.sciencedirect.com/science/article/abs/pii/S0731708597001313]
- 55. How much does an NMR cost | 2021 guide [https://www.aiinmr.com/nmr-spectroscopy-q-a-blog/How-much-does-an-Eft-NMR-Cost/]
- 56. Spectrophotometer Pricing Guide: What to Expect [https://www.excedr.com/blog/spectrophotometer-pricing-guide-what-to-expect]
- 57. Ultra-High Field Nuclear Magnetic Resonance (NMR) ... [https://ijcsrr.org/ultra-high-field-nuclear-magnetic-resonance-nmr-spectroscopy-applications-at-1-ghz-and-beyond/]
- 58. Applications of high-field nuclear magnetic resonance ... [https://www.sciencedirect.com/science/article/pii/S2666441025000159]
- 59. Development and validation of a green UV–Vis ... [https://www.sciencedirect.com/science/article/abs/pii/S0308814625038294]
- 60. - UV spectroscopic vis of formaldehyde and its analogs... detection [https://pubmed.ncbi.nlm.nih.gov/35779400/]
- 61. Limit of detection studies for application to natural product ... [https://www.sciencedirect.com/science/article/abs/pii/S002196731401872X]
- 62. Comparison of LC detection methods in the investigation ... [https://www.sciencedirect.com/science/article/abs/pii/S0731708597002355]
- 63. Root Mean Square Error (RMSE) [https://statisticsbyjim.com/regression/root-mean-square-error-rmse/]
- 64. ML | Mathematical explanation of RMSE and R-squared error [https://www.geeksforgeeks.org/machine-learning/ml-mathematical-explanation-of-rmse-and-r-squared-error/]
- 65. Root mean square deviation [https://en.wikipedia.org/wiki/Root_mean_square_deviation]
- 66. UV-adVISor: Attention-Based Recurrent Neural Networks to ... [https://pmc.ncbi.nlm.nih.gov/articles/PMC9137254/]
- 67. - UV -NIR Spectrophotometers Vis : Shimadzu Scientific... Comparison [https://www.ssi.shimadzu.com/products/molecular-spectroscopy/uv-vis/comparison/index.html]
- 68. Use of NMR in Impurity Profiling for Pharmaceutical Products [https://veeprho.com/use-of-nmr-in-impurity-profiling-for-pharmaceutical-products/]
- 69. Applications of quantitative 13C NMR in pharmaceutical ... [https://www.sciencedirect.com/science/article/pii/S2095177925001637]
- 70. Unknown Impurities Isolation and Characterisation [https://alentris.org/services/unknown-impurities-isolation-and-characterisation/]
- 71. New NMR Tools for Impurity Analysis - Research Explorer [https://research.manchester.ac.uk/en/studentTheses/new-nmr-tools-for-impurity-analysis/]
- 72. Quantitative Solid-State NMR Spectroscopy (qSSNMR) in ... [https://pmc.ncbi.nlm.nih.gov/articles/PMC12379110/]
- 73. The changing role of NMR spectroscopy in off-line impurity ... [https://www.sciencedirect.com/science/article/abs/pii/S0165993606001294]
- 74. Ultraviolet Detectors: Perspectives, Principles, and Practices [https://www.chromatographyonline.com/view/ultraviolet-detectors-perspectives-principles-and-practices]
- 75. Comparison of Quantification Using UV-Vis, NMR, and ... [https://pmc.ncbi.nlm.nih.gov/articles/PMC12295351/]
- 76. A Sensitive and Simple HPLC-UV Method for Trace Level ... [https://pmc.ncbi.nlm.nih.gov/articles/PMC3221504/]
- 77. Applications of Solution NMR Spectroscopy in Quality ... [https://pmc.ncbi.nlm.nih.gov/articles/PMC10486658/]